Racine, OH Map & Demographics
Racine Map
Racine Overview
$26,897
PER CAPITA INCOME
$52,000
AVG FAMILY INCOME
$50,703
AVG HOUSEHOLD INCOME
60.6%
WAGE / INCOME GAP [ % ]
39.4¢/ $1
WAGE / INCOME GAP [ $ ]
0.43
INEQUALITY / GINI INDEX
1,061
TOTAL POPULATION
488
MALE POPULATION
573
FEMALE POPULATION
85.17
MALES / 100 FEMALES
117.42
FEMALES / 100 MALES
40.4
MEDIAN AGE
3.4
AVG FAMILY SIZE
2.5
AVG HOUSEHOLD SIZE
413
LABOR FORCE [ PEOPLE ]
50.7%
PERCENT IN LABOR FORCE
1.2%
UNEMPLOYMENT RATE
Racine Zip Codes
Racine Area Codes
Income in Racine
Income Overview in Racine
Per Capita Income in Racine is $26,897, while median incomes of families and households are $52,000 and $50,703 respectively.
| Characteristic | Number | Measure |
| Per Capita Income | 1,061 | $26,897 |
| Median Family Income | 258 | $52,000 |
| Mean Family Income | 258 | $65,805 |
| Median Household Income | 433 | $50,703 |
| Mean Household Income | 433 | $62,323 |
| Income Deficit | 258 | $0 |
| Wage / Income Gap (%) | 1,061 | 60.60% |
| Wage / Income Gap ($) | 1,061 | 39.40¢ per $1 |
| Gini / Inequality Index | 1,061 | 0.43 |
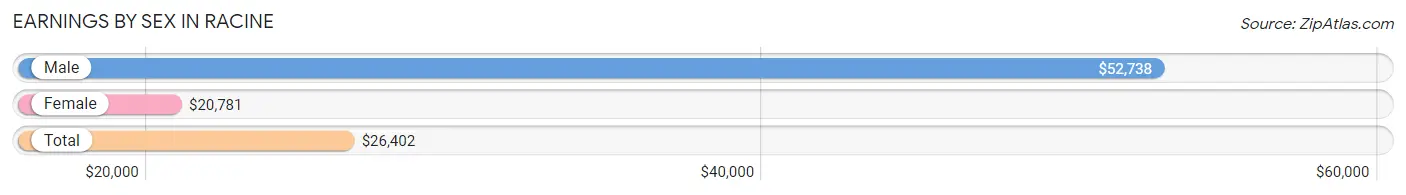
Earnings by Sex in Racine
Average Earnings in Racine are $26,402, $52,738 for men and $20,781 for women, a difference of 60.6%.
| Sex | Number | Average Earnings |
| Male | 230 (55.2%) | $52,738 |
| Female | 187 (44.8%) | $20,781 |
| Total | 417 (100.0%) | $26,402 |
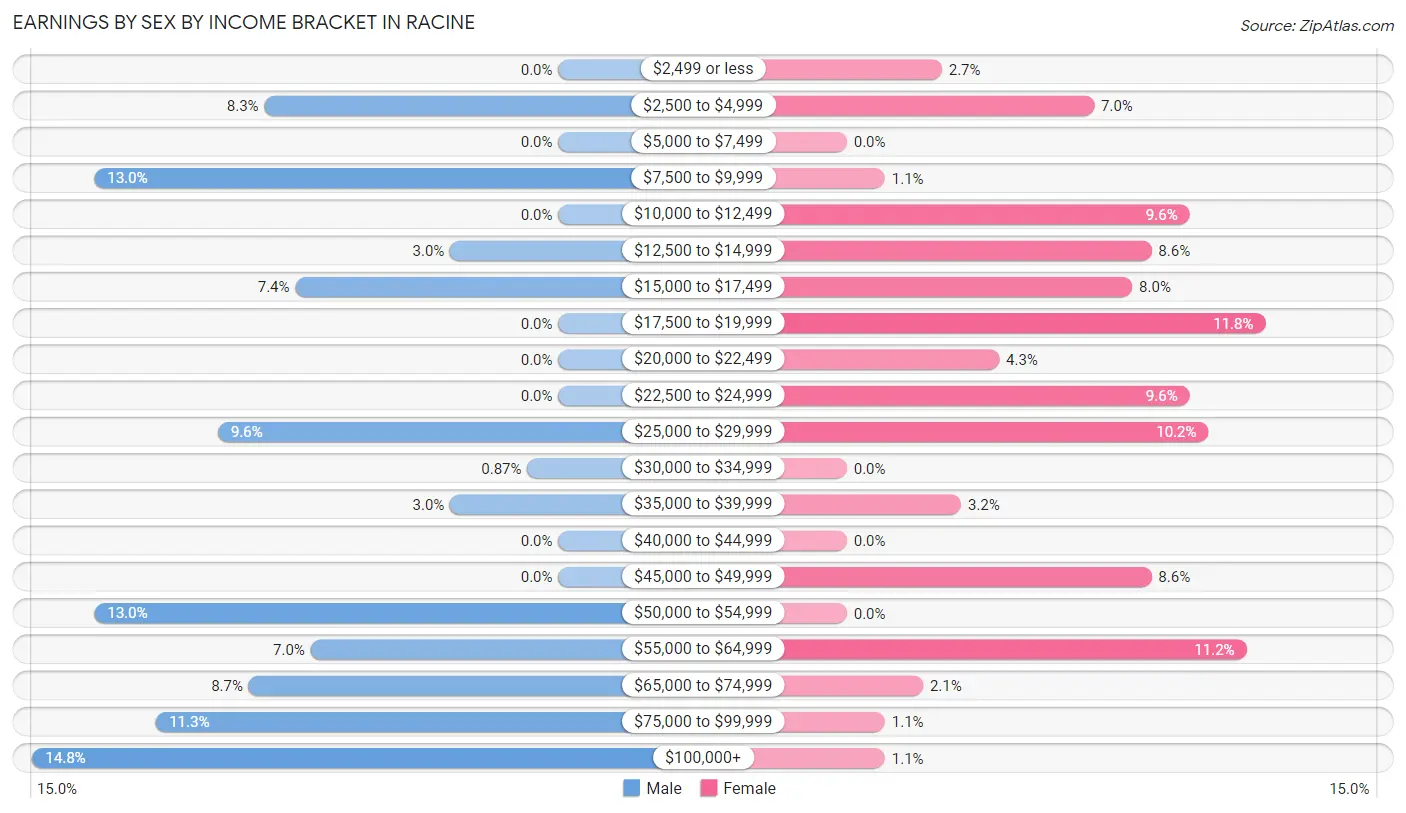
Earnings by Sex by Income Bracket in Racine
The most common earnings brackets in Racine are $100,000+ for men (34 | 14.8%) and $17,500 to $19,999 for women (22 | 11.8%).
| Income | Male | Female |
| $2,499 or less | 0 (0.0%) | 5 (2.7%) |
| $2,500 to $4,999 | 19 (8.3%) | 13 (7.0%) |
| $5,000 to $7,499 | 0 (0.0%) | 0 (0.0%) |
| $7,500 to $9,999 | 30 (13.0%) | 2 (1.1%) |
| $10,000 to $12,499 | 0 (0.0%) | 18 (9.6%) |
| $12,500 to $14,999 | 7 (3.0%) | 16 (8.6%) |
| $15,000 to $17,499 | 17 (7.4%) | 15 (8.0%) |
| $17,500 to $19,999 | 0 (0.0%) | 22 (11.8%) |
| $20,000 to $22,499 | 0 (0.0%) | 8 (4.3%) |
| $22,500 to $24,999 | 0 (0.0%) | 18 (9.6%) |
| $25,000 to $29,999 | 22 (9.6%) | 19 (10.2%) |
| $30,000 to $34,999 | 2 (0.9%) | 0 (0.0%) |
| $35,000 to $39,999 | 7 (3.0%) | 6 (3.2%) |
| $40,000 to $44,999 | 0 (0.0%) | 0 (0.0%) |
| $45,000 to $49,999 | 0 (0.0%) | 16 (8.6%) |
| $50,000 to $54,999 | 30 (13.0%) | 0 (0.0%) |
| $55,000 to $64,999 | 16 (7.0%) | 21 (11.2%) |
| $65,000 to $74,999 | 20 (8.7%) | 4 (2.1%) |
| $75,000 to $99,999 | 26 (11.3%) | 2 (1.1%) |
| $100,000+ | 34 (14.8%) | 2 (1.1%) |
| Total | 230 (100.0%) | 187 (100.0%) |
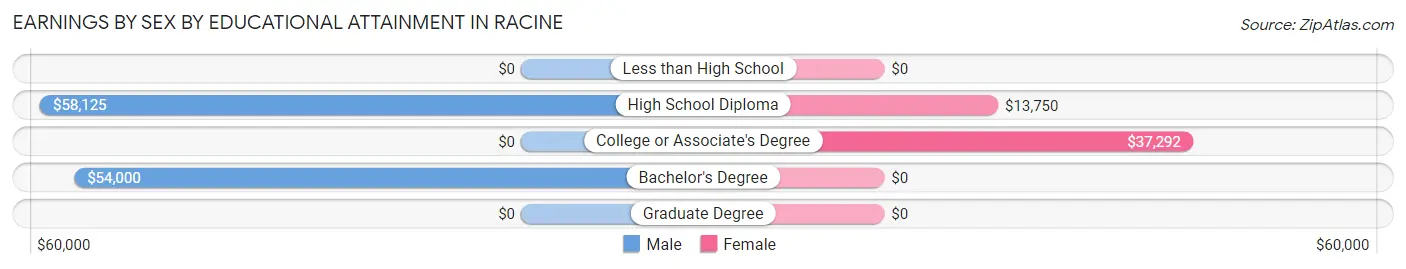
Earnings by Sex by Educational Attainment in Racine
Average earnings in Racine are $54,643 for men and $23,056 for women, a difference of 57.8%. Men with an educational attainment of high school diploma enjoy the highest average annual earnings of $58,125, while those with bachelor's degree education earn the least with $54,000. Women with an educational attainment of college or associate's degree earn the most with the average annual earnings of $37,292, while those with high school diploma education have the smallest earnings of $13,750.
| Educational Attainment | Male Income | Female Income |
| Less than High School | - | - |
| High School Diploma | $58,125 | $13,750 |
| College or Associate's Degree | - | - |
| Bachelor's Degree | $54,000 | $0 |
| Graduate Degree | - | - |
| Total | $54,643 | $23,056 |
Family Income in Racine
Family Income Brackets in Racine
According to the Racine family income data, there are 64 families falling into the $50,000 to $74,999 income range, which is the most common income bracket and makes up 24.8% of all families. Conversely, the $10,000 to $14,999 income bracket is the least frequent group with only 6 families (2.3%) belonging to this category.
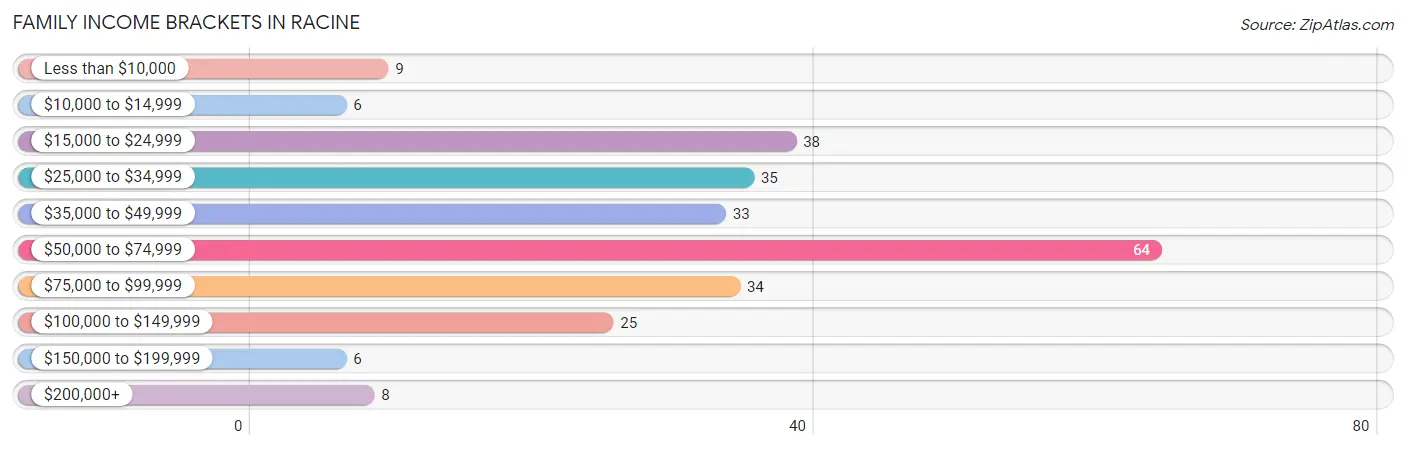
| Income Bracket | # Families | % Families |
| Less than $10,000 | 9 | 3.5% |
| $10,000 to $14,999 | 6 | 2.3% |
| $15,000 to $24,999 | 38 | 14.7% |
| $25,000 to $34,999 | 35 | 13.6% |
| $35,000 to $49,999 | 33 | 12.8% |
| $50,000 to $74,999 | 64 | 24.8% |
| $75,000 to $99,999 | 34 | 13.2% |
| $100,000 to $149,999 | 25 | 9.7% |
| $150,000 to $199,999 | 6 | 2.3% |
| $200,000+ | 8 | 3.1% |
Family Income by Famaliy Size in Racine
2-person families (120 | 46.5%) account for the highest median family income in Racine with $51,000 per family, while 2-person families (120 | 46.5%) have the highest median income of $25,500 per family member.
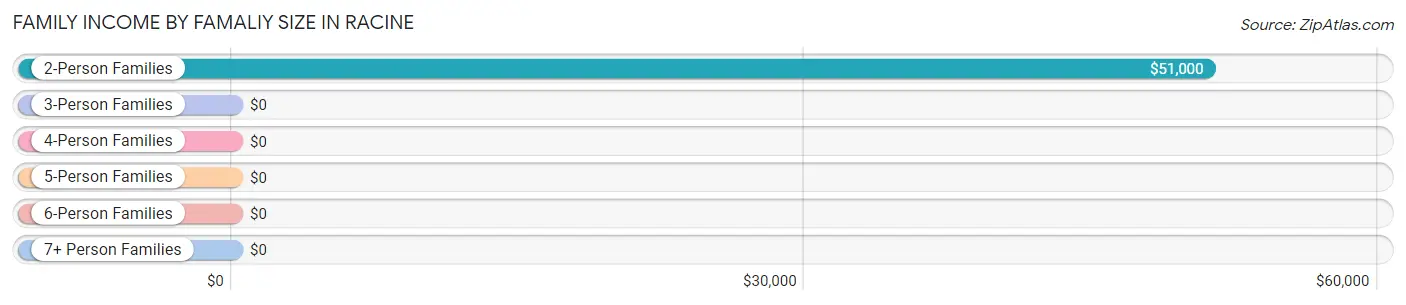
| Income Bracket | # Families | Median Income |
| 2-Person Families | 120 (46.5%) | $51,000 |
| 3-Person Families | 67 (26.0%) | $0 |
| 4-Person Families | 56 (21.7%) | $0 |
| 5-Person Families | 13 (5.0%) | $0 |
| 6-Person Families | 2 (0.8%) | $0 |
| 7+ Person Families | 0 (0.0%) | $0 |
| Total | 258 (100.0%) | $52,000 |
Family Income by Number of Earners in Racine
The median family income in Racine is $52,000, with families comprising 3+ earners (27) having the highest median family income of $138,295, while families with no earners (57) have the lowest median family income of $24,107, accounting for 10.5% and 22.1% of families, respectively.
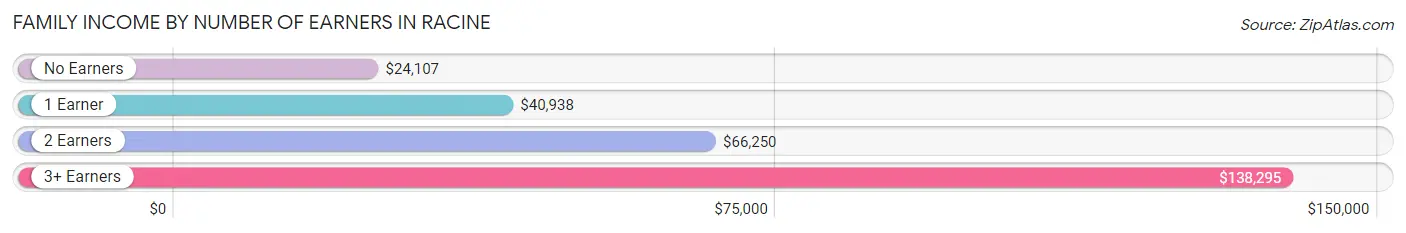
| Number of Earners | # Families | Median Income |
| No Earners | 57 (22.1%) | $24,107 |
| 1 Earner | 113 (43.8%) | $40,938 |
| 2 Earners | 61 (23.6%) | $66,250 |
| 3+ Earners | 27 (10.5%) | $138,295 |
| Total | 258 (100.0%) | $52,000 |
Household Income in Racine
Household Income Brackets in Racine
With 88 households falling in the category, the $75,000 to $99,999 income range is the most frequent in Racine, accounting for 20.3% of all households. In contrast, only 6 households (1.4%) fall into the $150,000 to $199,999 income bracket, making it the least populous group.
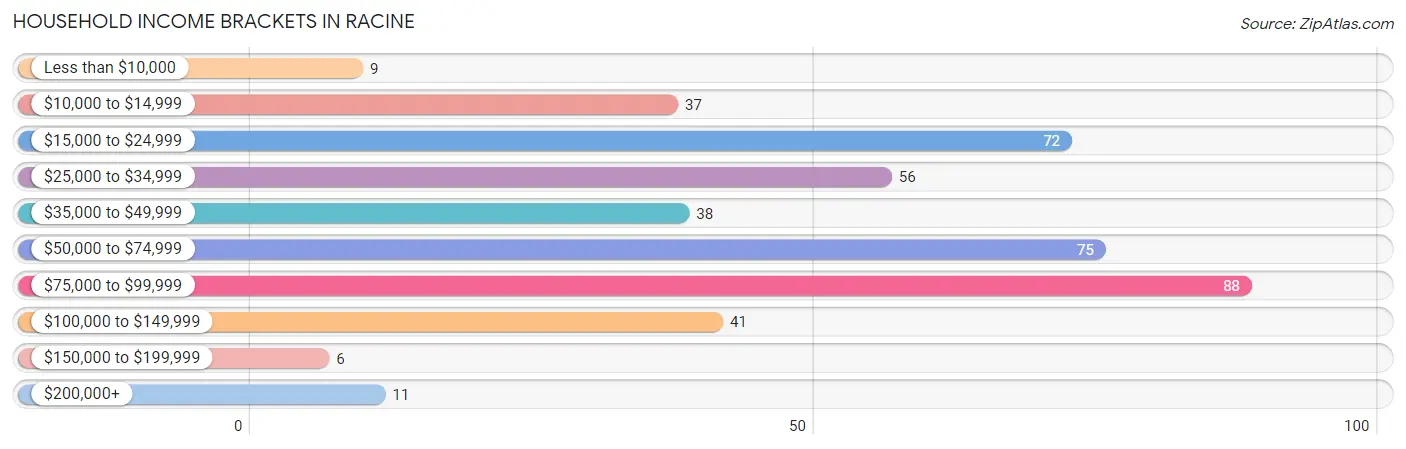
| Income Bracket | # Households | % Households |
| Less than $10,000 | 9 | 2.1% |
| $10,000 to $14,999 | 37 | 8.5% |
| $15,000 to $24,999 | 72 | 16.6% |
| $25,000 to $34,999 | 56 | 12.9% |
| $35,000 to $49,999 | 38 | 8.8% |
| $50,000 to $74,999 | 75 | 17.3% |
| $75,000 to $99,999 | 88 | 20.3% |
| $100,000 to $149,999 | 41 | 9.5% |
| $150,000 to $199,999 | 6 | 1.4% |
| $200,000+ | 11 | 2.5% |
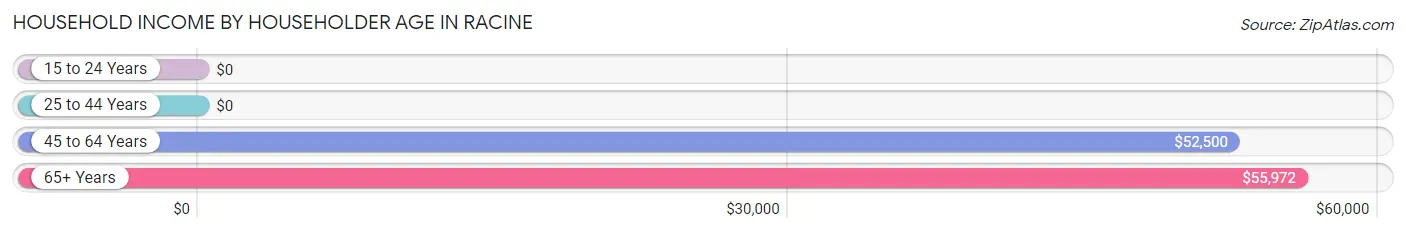
Household Income by Householder Age in Racine
The median household income in Racine is $50,703, with the highest median household income of $55,972 found in the 65+ years age bracket for the primary householder. A total of 119 households (27.5%) fall into this category. Meanwhile, the 15 to 24 years age bracket for the primary householder has the lowest median household income of $0, with 4 households (0.9%) in this group.
| Income Bracket | # Households | Median Income |
| 15 to 24 Years | 4 (0.9%) | $0 |
| 25 to 44 Years | 164 (37.9%) | $0 |
| 45 to 64 Years | 146 (33.7%) | $52,500 |
| 65+ Years | 119 (27.5%) | $55,972 |
| Total | 433 (100.0%) | $50,703 |
Poverty in Racine
Income Below Poverty by Sex and Age in Racine
With 16.8% poverty level for males and 24.6% for females among the residents of Racine, 15 year old males and under 5 year old females are the most vulnerable to poverty, with 2 males (100.0%) and 29 females (80.6%) in their respective age groups living below the poverty level.
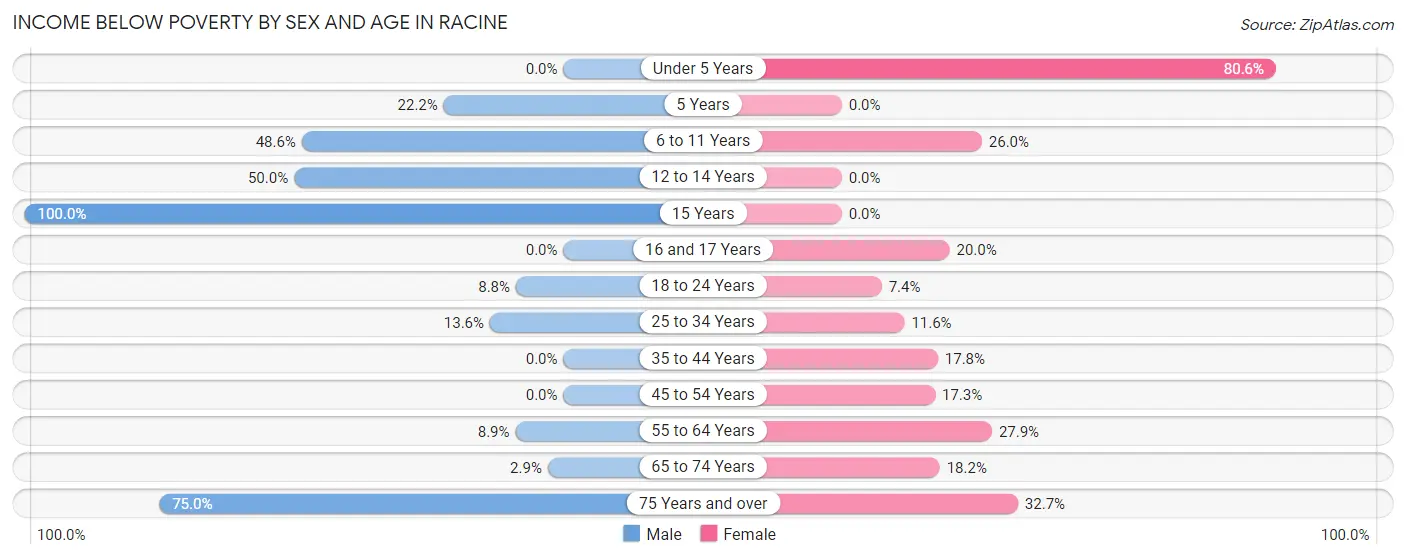
| Age Bracket | Male | Female |
| Under 5 Years | 0 (0.0%) | 29 (80.6%) |
| 5 Years | 6 (22.2%) | 0 (0.0%) |
| 6 to 11 Years | 17 (48.6%) | 26 (26.0%) |
| 12 to 14 Years | 13 (50.0%) | 0 (0.0%) |
| 15 Years | 2 (100.0%) | 0 (0.0%) |
| 16 and 17 Years | 0 (0.0%) | 2 (20.0%) |
| 18 to 24 Years | 3 (8.8%) | 2 (7.4%) |
| 25 to 34 Years | 9 (13.6%) | 5 (11.6%) |
| 35 to 44 Years | 0 (0.0%) | 28 (17.8%) |
| 45 to 54 Years | 0 (0.0%) | 9 (17.3%) |
| 55 to 64 Years | 9 (8.9%) | 17 (27.9%) |
| 65 to 74 Years | 2 (2.9%) | 6 (18.2%) |
| 75 Years and over | 21 (75.0%) | 17 (32.7%) |
| Total | 82 (16.8%) | 141 (24.6%) |
Income Above Poverty by Sex and Age in Racine
According to the poverty statistics in Racine, males aged under 5 years and females aged 12 to 14 years are the age groups that are most secure financially, with 100.0% of males and 100.0% of females in these age groups living above the poverty line.
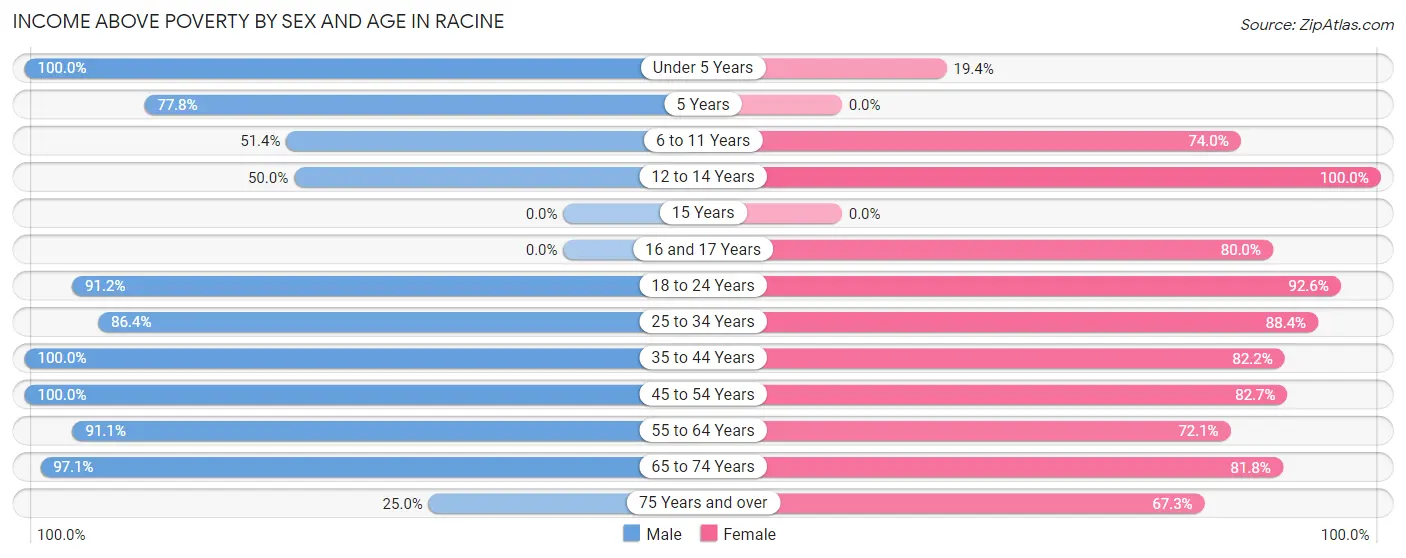
| Age Bracket | Male | Female |
| Under 5 Years | 18 (100.0%) | 7 (19.4%) |
| 5 Years | 21 (77.8%) | 0 (0.0%) |
| 6 to 11 Years | 18 (51.4%) | 74 (74.0%) |
| 12 to 14 Years | 13 (50.0%) | 2 (100.0%) |
| 15 Years | 0 (0.0%) | 0 (0.0%) |
| 16 and 17 Years | 0 (0.0%) | 8 (80.0%) |
| 18 to 24 Years | 31 (91.2%) | 25 (92.6%) |
| 25 to 34 Years | 57 (86.4%) | 38 (88.4%) |
| 35 to 44 Years | 50 (100.0%) | 129 (82.2%) |
| 45 to 54 Years | 32 (100.0%) | 43 (82.7%) |
| 55 to 64 Years | 92 (91.1%) | 44 (72.1%) |
| 65 to 74 Years | 67 (97.1%) | 27 (81.8%) |
| 75 Years and over | 7 (25.0%) | 35 (67.3%) |
| Total | 406 (83.2%) | 432 (75.4%) |
Income Below Poverty Among Married-Couple Families in Racine
The poverty statistics for married-couple families in Racine show that 3.2% or 5 of the total 156 families live below the poverty line. Families with 3 or 4 children have the highest poverty rate of 50.0%, comprising of 2 families. On the other hand, families with 1 or 2 children have the lowest poverty rate of 0.0%, which includes 0 families.
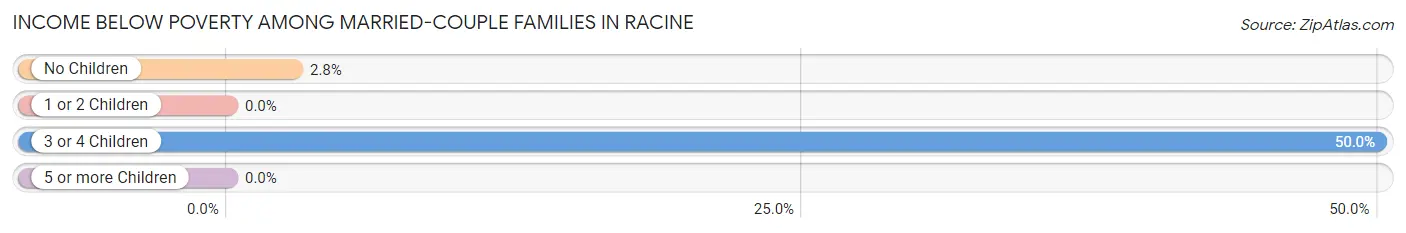
| Children | Above Poverty | Below Poverty |
| No Children | 103 (97.2%) | 3 (2.8%) |
| 1 or 2 Children | 46 (100.0%) | 0 (0.0%) |
| 3 or 4 Children | 2 (50.0%) | 2 (50.0%) |
| 5 or more Children | 0 (0.0%) | 0 (0.0%) |
| Total | 151 (96.8%) | 5 (3.2%) |
Income Below Poverty Among Single-Parent Households in Racine
According to the poverty data in Racine, 11.5% or 3 single-father households and 61.8% or 47 single-mother households are living below the poverty line. Among single-father households, those with 1 or 2 children have the highest poverty rate, with 3 households (11.5%) experiencing poverty. Likewise, among single-mother households, those with 3 or 4 children have the highest poverty rate, with 5 households (100.0%) falling below the poverty line.
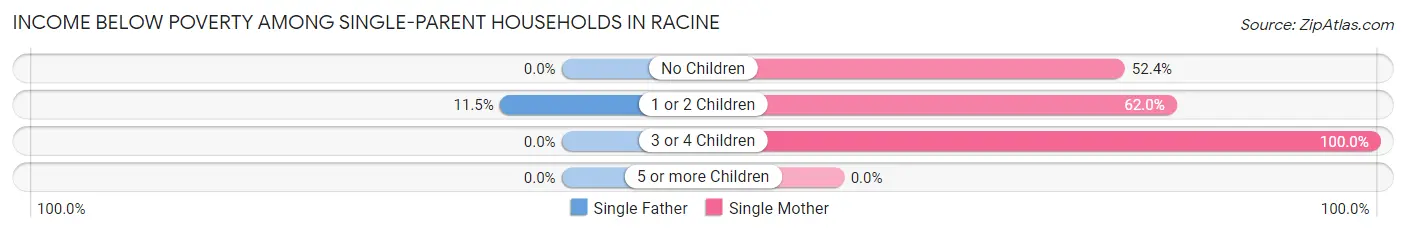
| Children | Single Father | Single Mother |
| No Children | 0 (0.0%) | 11 (52.4%) |
| 1 or 2 Children | 3 (11.5%) | 31 (62.0%) |
| 3 or 4 Children | 0 (0.0%) | 5 (100.0%) |
| 5 or more Children | 0 (0.0%) | 0 (0.0%) |
| Total | 3 (11.5%) | 47 (61.8%) |
Income Below Poverty Among Married-Couple vs Single-Parent Households in Racine
The poverty data for Racine shows that 5 of the married-couple family households (3.2%) and 50 of the single-parent households (49.0%) are living below the poverty level. Within the married-couple family households, those with 3 or 4 children have the highest poverty rate, with 2 households (50.0%) falling below the poverty line. Among the single-parent households, those with 3 or 4 children have the highest poverty rate, with 5 household (100.0%) living below poverty.
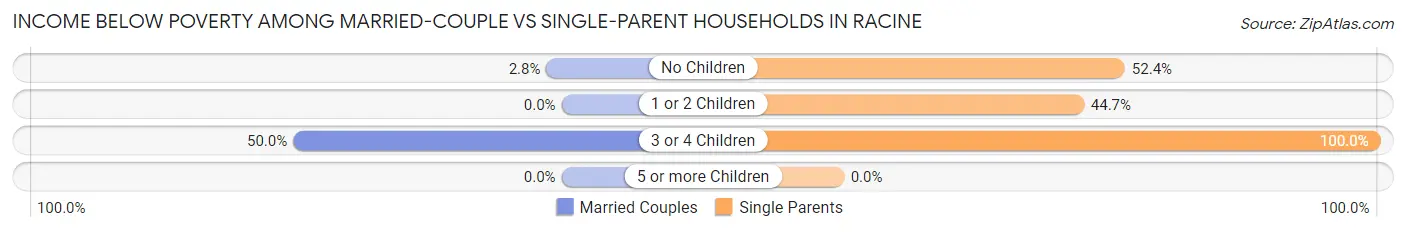
| Children | Married-Couple Families | Single-Parent Households |
| No Children | 3 (2.8%) | 11 (52.4%) |
| 1 or 2 Children | 0 (0.0%) | 34 (44.7%) |
| 3 or 4 Children | 2 (50.0%) | 5 (100.0%) |
| 5 or more Children | 0 (0.0%) | 0 (0.0%) |
| Total | 5 (3.2%) | 50 (49.0%) |
Race in Racine
The most populous races in Racine are White / Caucasian (1,057 | 99.6%), Hispanic or Latino (14 | 1.3%), and Black / African American (4 | 0.4%).
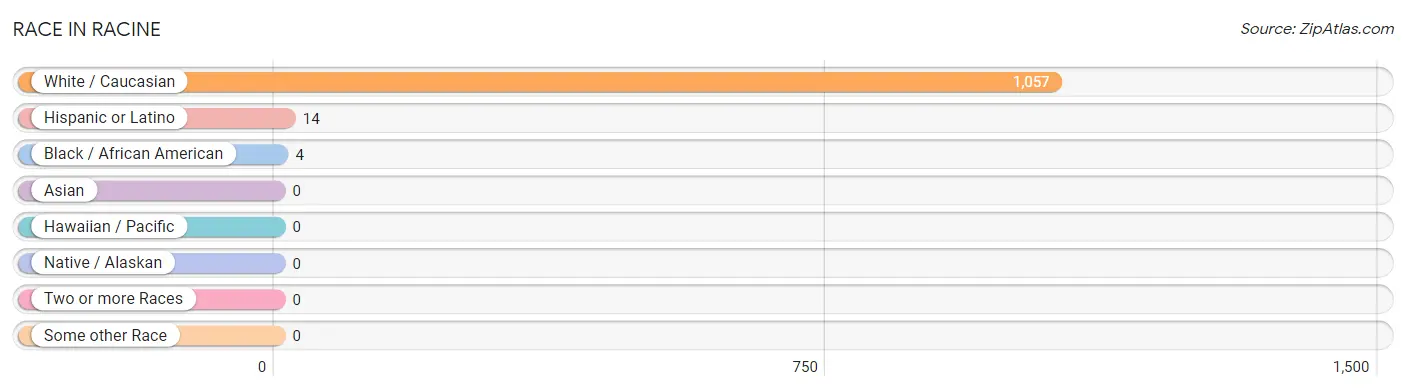
| Race | # Population | % Population |
| Asian | 0 | 0.0% |
| Black / African American | 4 | 0.4% |
| Hawaiian / Pacific | 0 | 0.0% |
| Hispanic or Latino | 14 | 1.3% |
| Native / Alaskan | 0 | 0.0% |
| White / Caucasian | 1,057 | 99.6% |
| Two or more Races | 0 | 0.0% |
| Some other Race | 0 | 0.0% |
| Total | 1,061 | 100.0% |
Ancestry in Racine
The most populous ancestries reported in Racine are German (231 | 21.8%), Irish (65 | 6.1%), European (62 | 5.8%), American (53 | 5.0%), and English (52 | 4.9%), together accounting for 43.6% of all Racine residents.
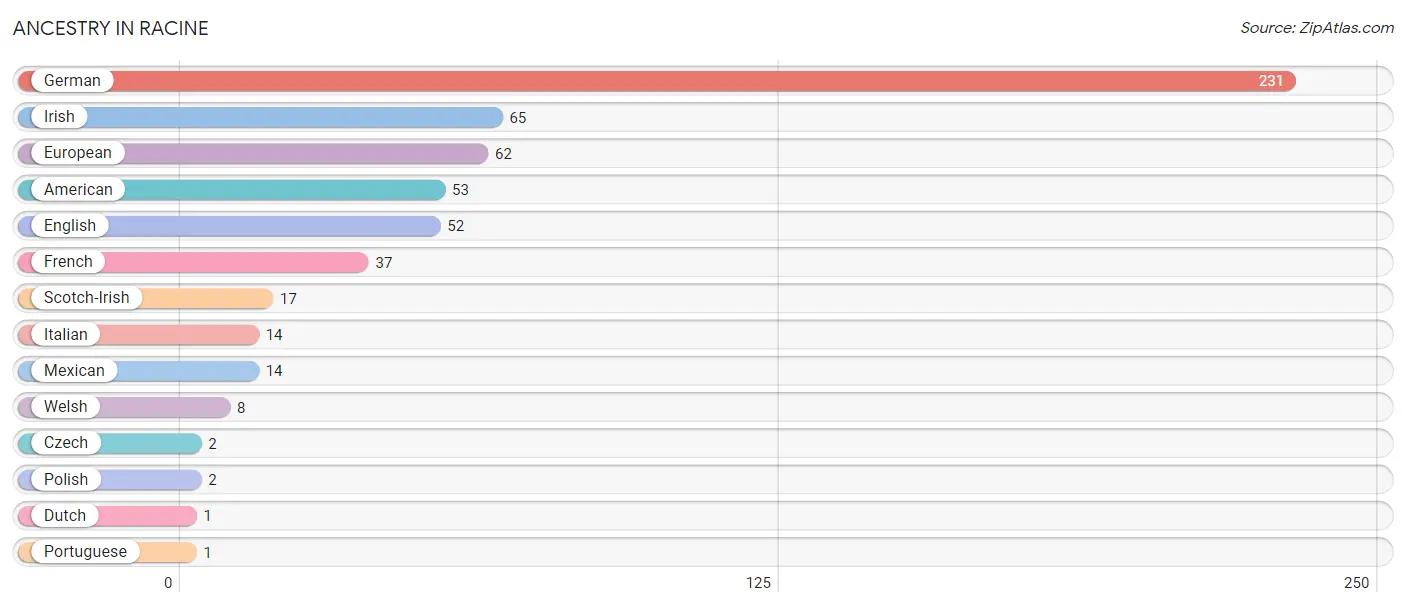
| Ancestry | # Population | % Population |
| American | 53 | 5.0% |
| Czech | 2 | 0.2% |
| Dutch | 1 | 0.1% |
| English | 52 | 4.9% |
| European | 62 | 5.8% |
| French | 37 | 3.5% |
| German | 231 | 21.8% |
| Irish | 65 | 6.1% |
| Italian | 14 | 1.3% |
| Mexican | 14 | 1.3% |
| Polish | 2 | 0.2% |
| Portuguese | 1 | 0.1% |
| Scotch-Irish | 17 | 1.6% |
| Welsh | 8 | 0.7% | View All 14 Rows |
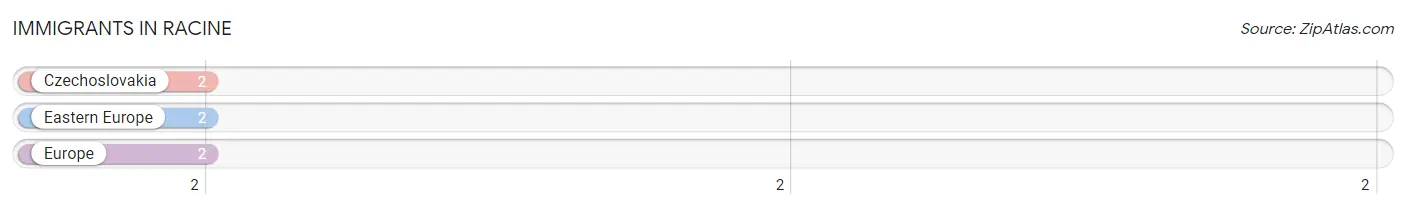
Immigrants in Racine
The most numerous immigrant groups reported in Racine came from Czechoslovakia (2 | 0.2%), Eastern Europe (2 | 0.2%), and Europe (2 | 0.2%), together accounting for 0.6% of all Racine residents.
| Immigration Origin | # Population | % Population |
| Czechoslovakia | 2 | 0.2% |
| Eastern Europe | 2 | 0.2% |
| Europe | 2 | 0.2% | View All 3 Rows |
Sex and Age in Racine
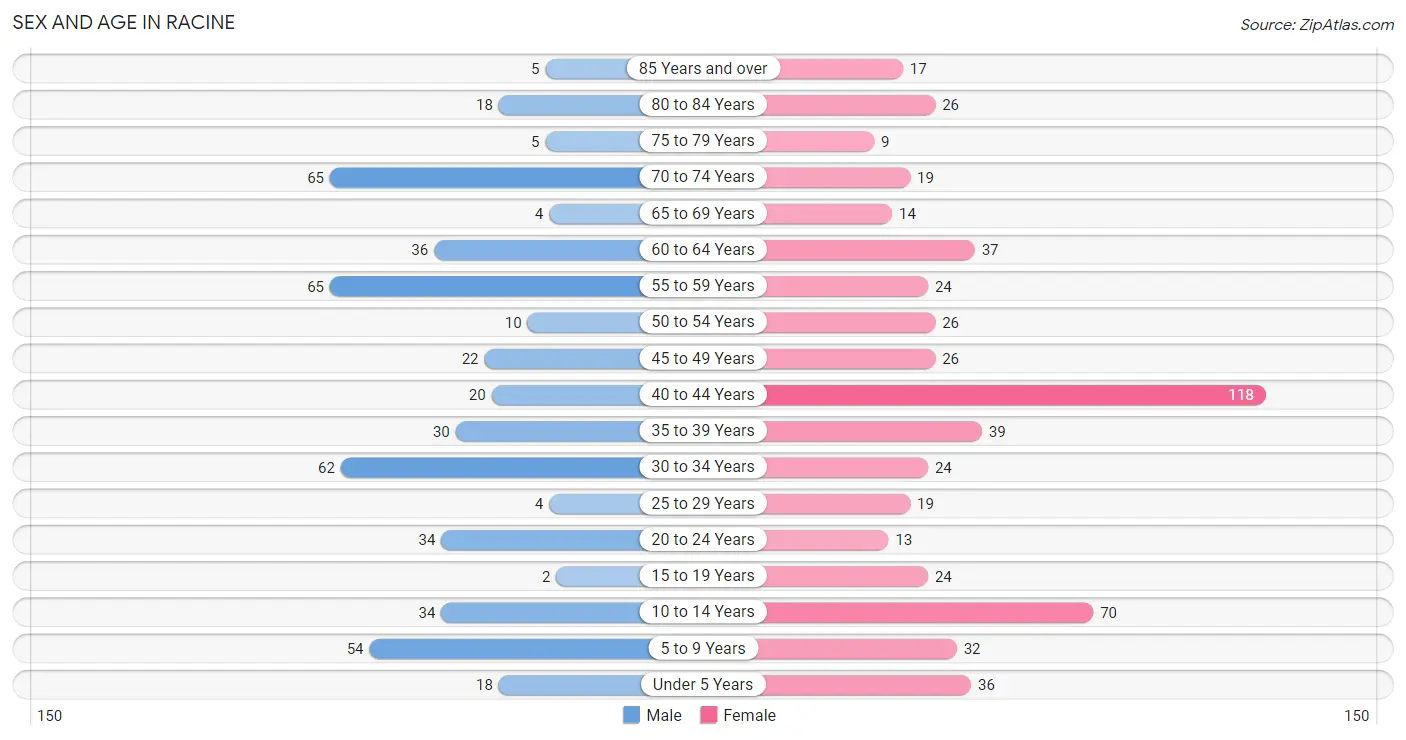
Sex and Age in Racine
The most populous age groups in Racine are 55 to 59 Years (65 | 13.3%) for men and 40 to 44 Years (118 | 20.6%) for women.
| Age Bracket | Male | Female |
| Under 5 Years | 18 (3.7%) | 36 (6.3%) |
| 5 to 9 Years | 54 (11.1%) | 32 (5.6%) |
| 10 to 14 Years | 34 (7.0%) | 70 (12.2%) |
| 15 to 19 Years | 2 (0.4%) | 24 (4.2%) |
| 20 to 24 Years | 34 (7.0%) | 13 (2.3%) |
| 25 to 29 Years | 4 (0.8%) | 19 (3.3%) |
| 30 to 34 Years | 62 (12.7%) | 24 (4.2%) |
| 35 to 39 Years | 30 (6.1%) | 39 (6.8%) |
| 40 to 44 Years | 20 (4.1%) | 118 (20.6%) |
| 45 to 49 Years | 22 (4.5%) | 26 (4.5%) |
| 50 to 54 Years | 10 (2.1%) | 26 (4.5%) |
| 55 to 59 Years | 65 (13.3%) | 24 (4.2%) |
| 60 to 64 Years | 36 (7.4%) | 37 (6.5%) |
| 65 to 69 Years | 4 (0.8%) | 14 (2.4%) |
| 70 to 74 Years | 65 (13.3%) | 19 (3.3%) |
| 75 to 79 Years | 5 (1.0%) | 9 (1.6%) |
| 80 to 84 Years | 18 (3.7%) | 26 (4.5%) |
| 85 Years and over | 5 (1.0%) | 17 (3.0%) |
| Total | 488 (100.0%) | 573 (100.0%) |
Families and Households in Racine
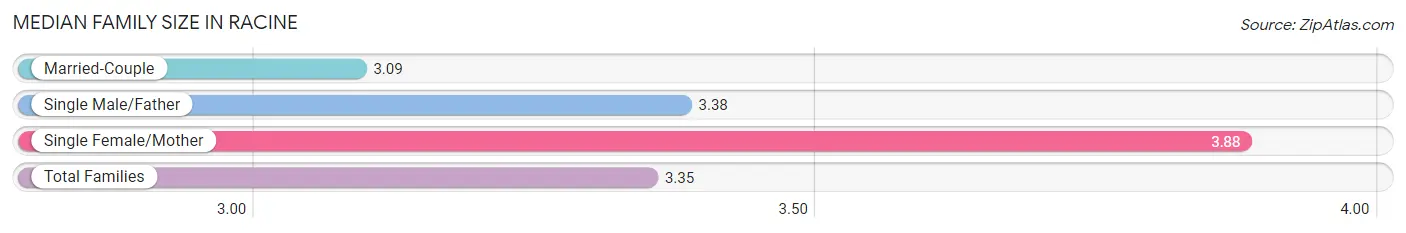
Median Family Size in Racine
The median family size in Racine is 3.35 persons per family, with single female/mother families (76 | 29.5%) accounting for the largest median family size of 3.88 persons per family. On the other hand, married-couple families (156 | 60.5%) represent the smallest median family size with 3.09 persons per family.
| Family Type | # Families | Family Size |
| Married-Couple | 156 (60.5%) | 3.09 |
| Single Male/Father | 26 (10.1%) | 3.38 |
| Single Female/Mother | 76 (29.5%) | 3.88 |
| Total Families | 258 (100.0%) | 3.35 |
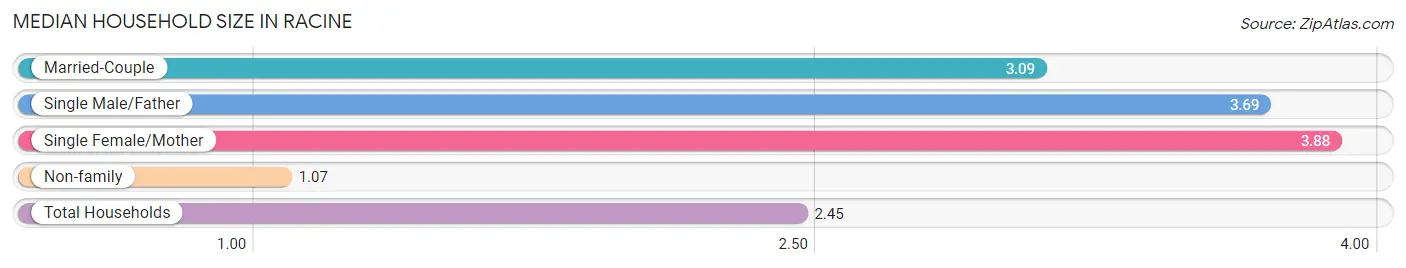
Median Household Size in Racine
The median household size in Racine is 2.45 persons per household, with single female/mother households (76 | 17.5%) accounting for the largest median household size of 3.88 persons per household. non-family households (175 | 40.4%) represent the smallest median household size with 1.07 persons per household.
| Household Type | # Households | Household Size |
| Married-Couple | 156 (36.0%) | 3.09 |
| Single Male/Father | 26 (6.0%) | 3.69 |
| Single Female/Mother | 76 (17.5%) | 3.88 |
| Non-family | 175 (40.4%) | 1.07 |
| Total Households | 433 (100.0%) | 2.45 |
Household Size by Marriage Status in Racine
Out of a total of 433 households in Racine, 258 (59.6%) are family households, while 175 (40.4%) are nonfamily households. The most numerous type of family households are 2-person households, comprising 112, and the most common type of nonfamily households are 1-person households, comprising 165.
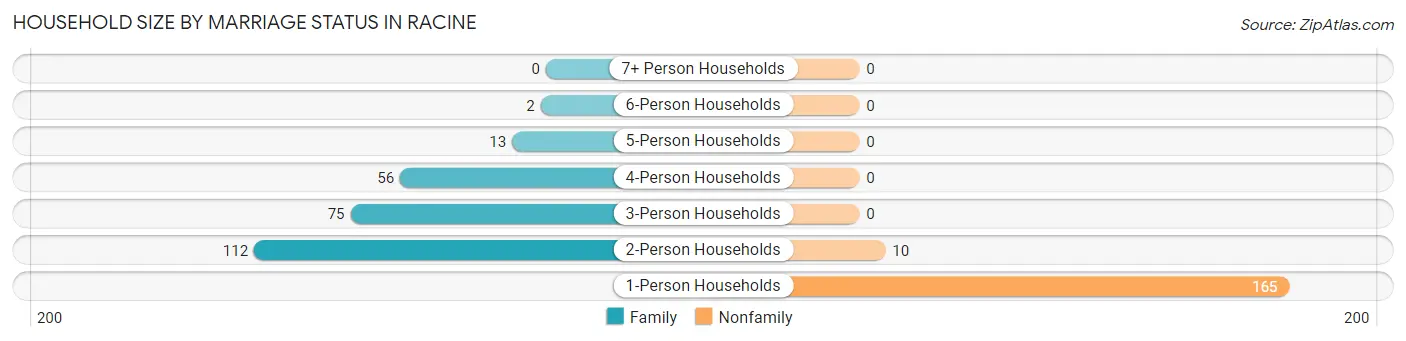
| Household Size | Family Households | Nonfamily Households |
| 1-Person Households | - | 165 (38.1%) |
| 2-Person Households | 112 (25.9%) | 10 (2.3%) |
| 3-Person Households | 75 (17.3%) | 0 (0.0%) |
| 4-Person Households | 56 (12.9%) | 0 (0.0%) |
| 5-Person Households | 13 (3.0%) | 0 (0.0%) |
| 6-Person Households | 2 (0.5%) | 0 (0.0%) |
| 7+ Person Households | 0 (0.0%) | 0 (0.0%) |
| Total | 258 (59.6%) | 175 (40.4%) |
Female Fertility in Racine
Fertility by Age in Racine
Average fertility rate in Racine is 15.0 births per 1,000 women. Women in the age bracket of 20 to 34 years have the highest fertility rate with 71.0 births per 1,000 women. Women in the age bracket of 20 to 34 years acount for 100.0% of all women with births.
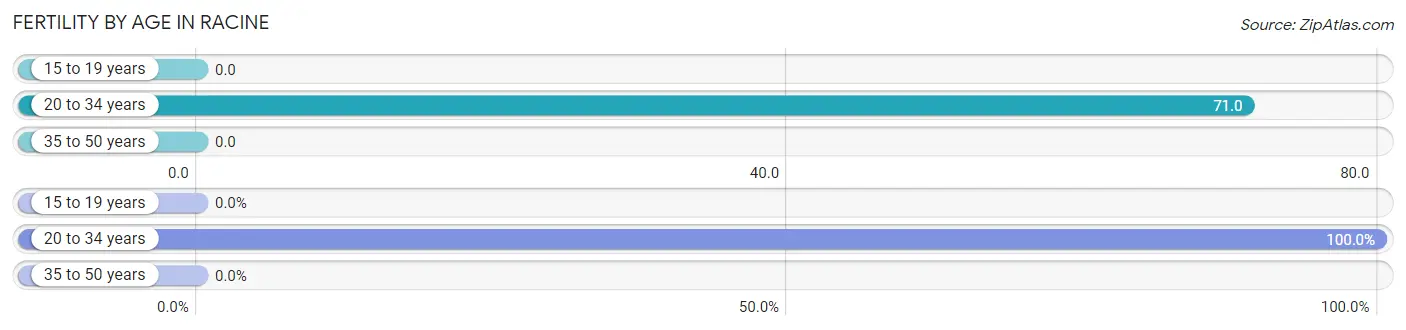
| Age Bracket | Women with Births | Births / 1,000 Women |
| 15 to 19 years | 0 (0.0%) | 0.0 |
| 20 to 34 years | 4 (100.0%) | 71.0 |
| 35 to 50 years | 0 (0.0%) | 0.0 |
| Total | 4 (100.0%) | 15.0 |
Fertility by Age by Marriage Status in Racine
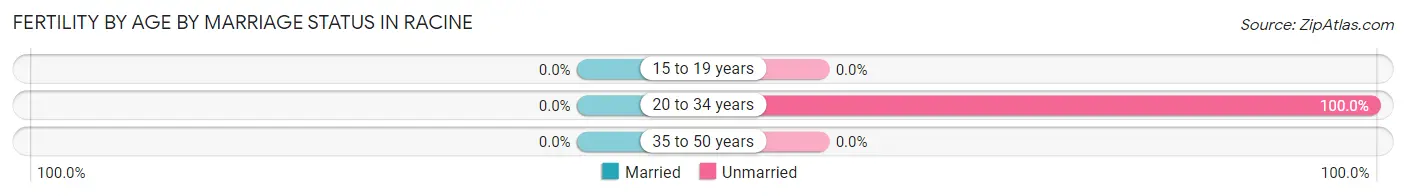
| Age Bracket | Married | Unmarried |
| 15 to 19 years | 0 (0.0%) | 0 (0.0%) |
| 20 to 34 years | 0 (0.0%) | 4 (100.0%) |
| 35 to 50 years | 0 (0.0%) | 0 (0.0%) |
| Total | 0 (0.0%) | 4 (100.0%) |
Fertility by Education in Racine
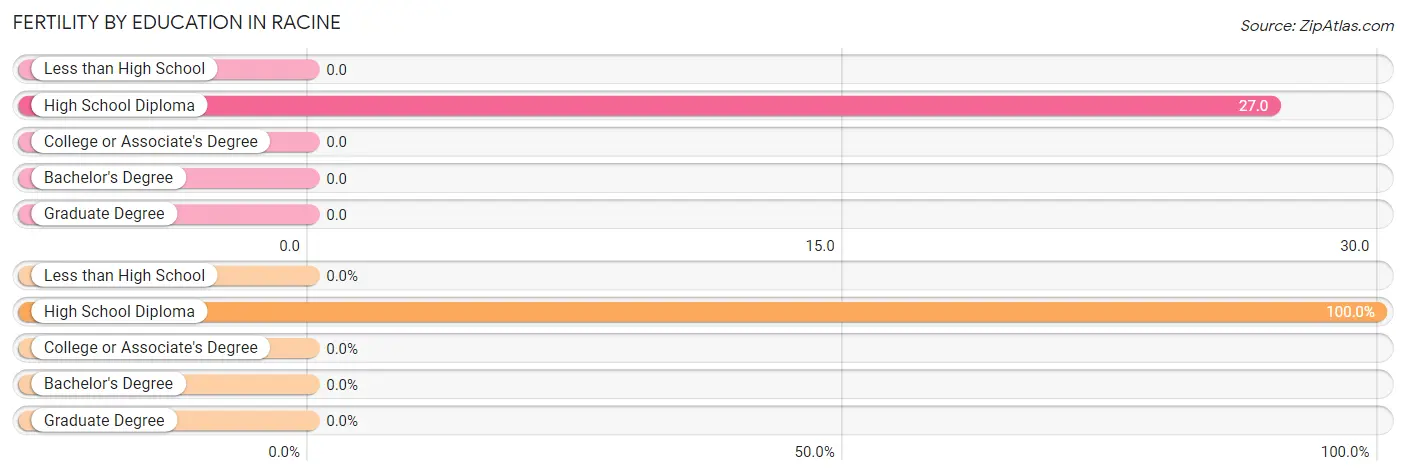
| Educational Attainment | Women with Births | Births / 1,000 Women |
| Less than High School | 0 (0.0%) | 0.0 |
| High School Diploma | 4 (100.0%) | 27.0 |
| College or Associate's Degree | 0 (0.0%) | 0.0 |
| Bachelor's Degree | 0 (0.0%) | 0.0 |
| Graduate Degree | 0 (0.0%) | 0.0 |
| Total | 4 (100.0%) | 15.0 |
Fertility by Education by Marriage Status in Racine
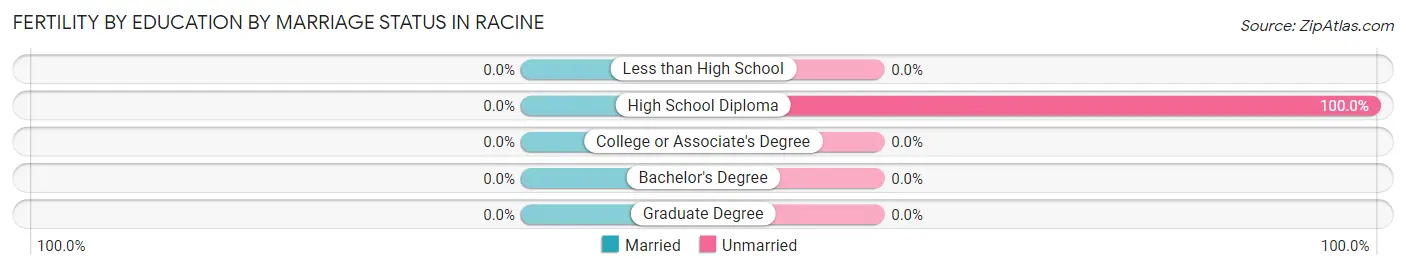
| Educational Attainment | Married | Unmarried |
| Less than High School | 0 (0.0%) | 0 (0.0%) |
| High School Diploma | 0 (0.0%) | 4 (100.0%) |
| College or Associate's Degree | 0 (0.0%) | 0 (0.0%) |
| Bachelor's Degree | 0 (0.0%) | 0 (0.0%) |
| Graduate Degree | 0 (0.0%) | 0 (0.0%) |
| Total | 0 (0.0%) | 4 (100.0%) |
Employment Characteristics in Racine
Employment by Class of Employer in Racine
Among the 396 employed individuals in Racine, private company employees (268 | 67.7%), local government employees (41 | 10.3%), and not-for-profit organizations (39 | 9.9%) make up the most common classes of employment.
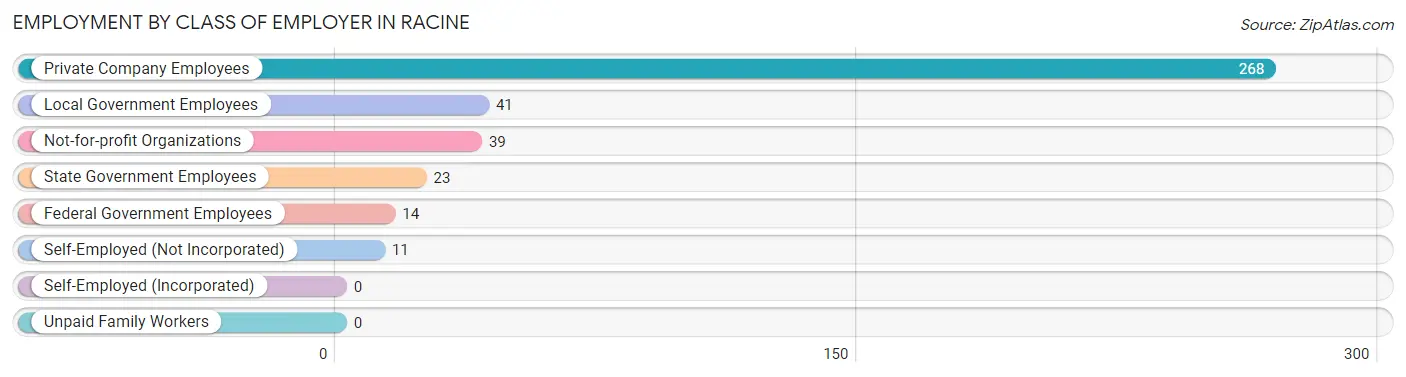
| Employer Class | # Employees | % Employees |
| Private Company Employees | 268 | 67.7% |
| Self-Employed (Incorporated) | 0 | 0.0% |
| Self-Employed (Not Incorporated) | 11 | 2.8% |
| Not-for-profit Organizations | 39 | 9.9% |
| Local Government Employees | 41 | 10.3% |
| State Government Employees | 23 | 5.8% |
| Federal Government Employees | 14 | 3.5% |
| Unpaid Family Workers | 0 | 0.0% |
| Total | 396 | 100.0% |
Employment Status by Age in Racine
According to the labor force statistics for Racine, out of the total population over 16 years of age (815), 50.7% or 413 individuals are in the labor force, with 1.2% or 5 of them unemployed. The age group with the highest labor force participation rate is 20 to 24 years, with 100.0% or 47 individuals in the labor force. Within the labor force, the 45 to 54 years age range has the highest percentage of unemployed individuals, with 2.9% or 2 of them being unemployed.
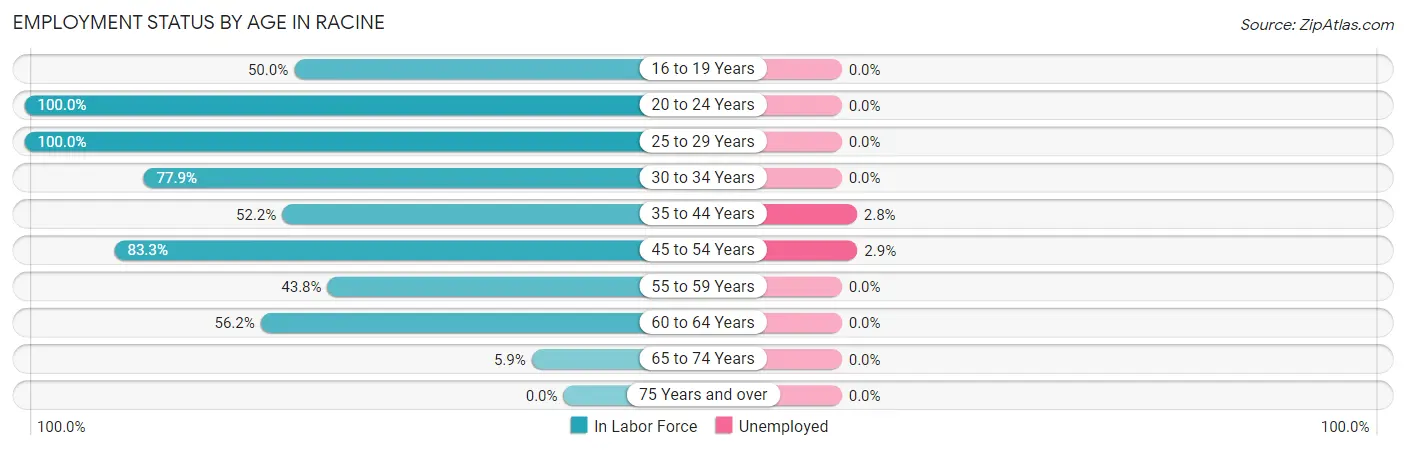
| Age Bracket | In Labor Force | Unemployed |
| 16 to 19 Years | 12 (50.0%) | 0 (0.0%) |
| 20 to 24 Years | 47 (100.0%) | 0 (0.0%) |
| 25 to 29 Years | 23 (100.0%) | 0 (0.0%) |
| 30 to 34 Years | 67 (77.9%) | 0 (0.0%) |
| 35 to 44 Years | 108 (52.2%) | 3 (2.8%) |
| 45 to 54 Years | 70 (83.3%) | 2 (2.9%) |
| 55 to 59 Years | 39 (43.8%) | 0 (0.0%) |
| 60 to 64 Years | 41 (56.2%) | 0 (0.0%) |
| 65 to 74 Years | 6 (5.9%) | 0 (0.0%) |
| 75 Years and over | 0 (0.0%) | 0 (0.0%) |
| Total | 413 (50.7%) | 5 (1.2%) |
Employment Status by Educational Attainment in Racine
According to labor force statistics for Racine, 61.9% of individuals (348) out of the total population between 25 and 64 years of age (562) are in the labor force, with 1.4% or 5 of them being unemployed. The group with the highest labor force participation rate are those with the educational attainment of college / associate degree, with 95.7% or 134 individuals in the labor force. Within the labor force, individuals with college / associate degree education have the highest percentage of unemployment, with 2.2% or 3 of them being unemployed.
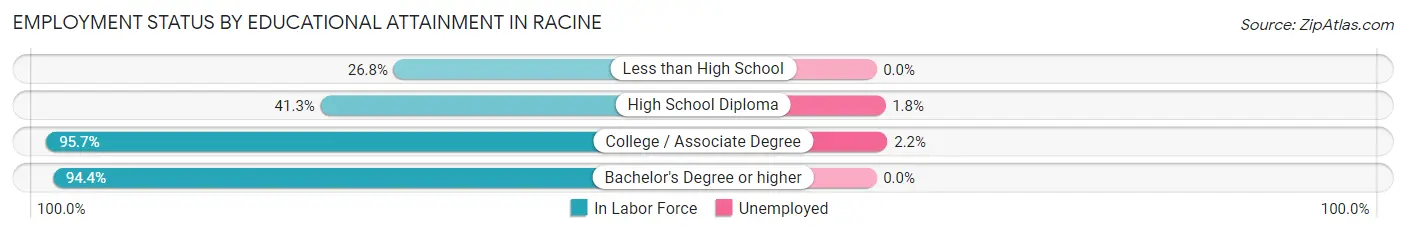
| Educational Attainment | In Labor Force | Unemployed |
| Less than High School | 15 (26.8%) | 0 (0.0%) |
| High School Diploma | 114 (41.3%) | 5 (1.8%) |
| College / Associate Degree | 134 (95.7%) | 3 (2.2%) |
| Bachelor's Degree or higher | 85 (94.4%) | 0 (0.0%) |
| Total | 348 (61.9%) | 8 (1.4%) |
Employment Occupations by Sex in Racine
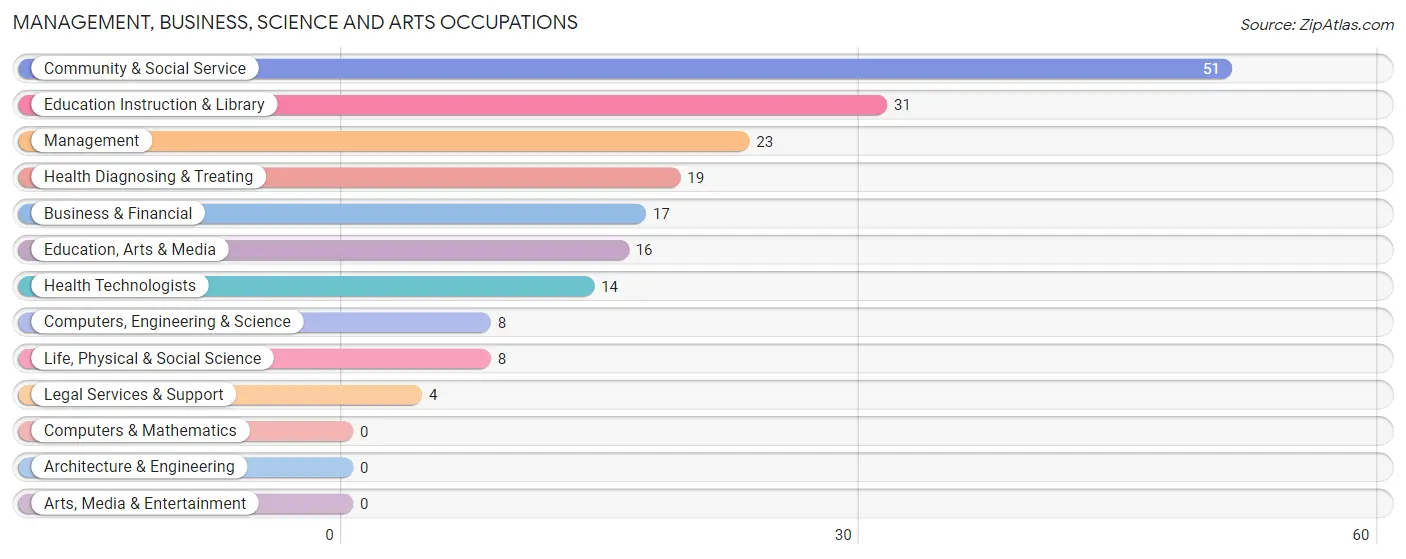
Management, Business, Science and Arts Occupations
The most common Management, Business, Science and Arts occupations in Racine are Community & Social Service (51 | 12.5%), Education Instruction & Library (31 | 7.6%), Management (23 | 5.6%), Health Diagnosing & Treating (19 | 4.7%), and Business & Financial (17 | 4.2%).
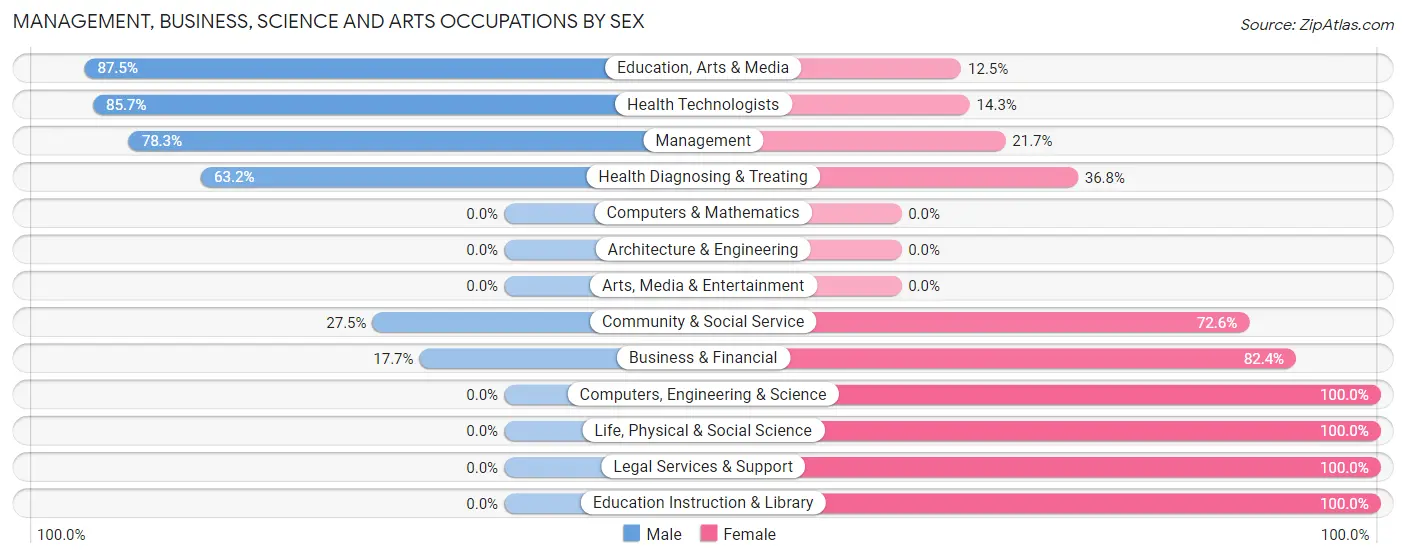
Management, Business, Science and Arts Occupations by Sex
Within the Management, Business, Science and Arts occupations in Racine, the most male-oriented occupations are Education, Arts & Media (87.5%), Health Technologists (85.7%), and Management (78.3%), while the most female-oriented occupations are Computers, Engineering & Science (100.0%), Life, Physical & Social Science (100.0%), and Legal Services & Support (100.0%).
| Occupation | Male | Female |
| Management | 18 (78.3%) | 5 (21.7%) |
| Business & Financial | 3 (17.6%) | 14 (82.4%) |
| Computers, Engineering & Science | 0 (0.0%) | 8 (100.0%) |
| Computers & Mathematics | 0 (0.0%) | 0 (0.0%) |
| Architecture & Engineering | 0 (0.0%) | 0 (0.0%) |
| Life, Physical & Social Science | 0 (0.0%) | 8 (100.0%) |
| Community & Social Service | 14 (27.5%) | 37 (72.6%) |
| Education, Arts & Media | 14 (87.5%) | 2 (12.5%) |
| Legal Services & Support | 0 (0.0%) | 4 (100.0%) |
| Education Instruction & Library | 0 (0.0%) | 31 (100.0%) |
| Arts, Media & Entertainment | 0 (0.0%) | 0 (0.0%) |
| Health Diagnosing & Treating | 12 (63.2%) | 7 (36.8%) |
| Health Technologists | 12 (85.7%) | 2 (14.3%) |
| Total (Category) | 47 (39.8%) | 71 (60.2%) |
| Total (Overall) | 226 (55.4%) | 182 (44.6%) |
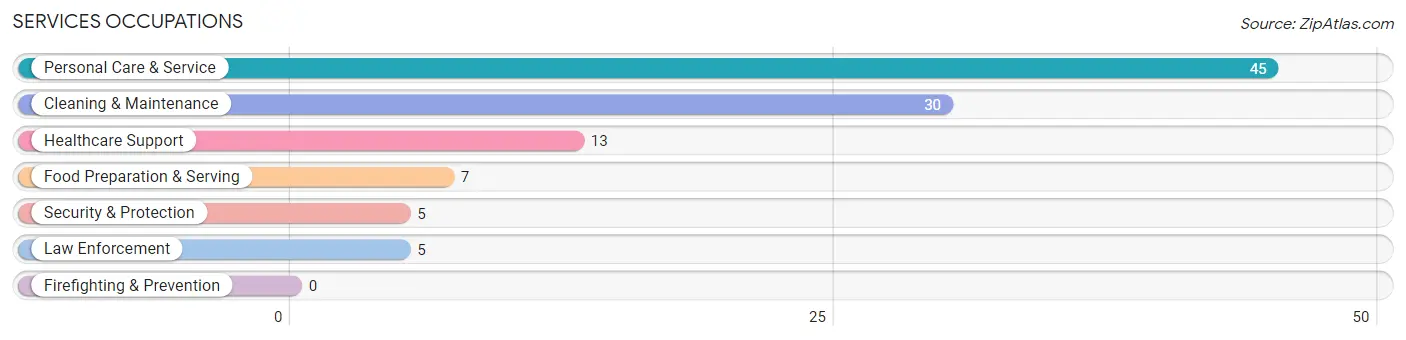
Services Occupations
The most common Services occupations in Racine are Personal Care & Service (45 | 11.0%), Cleaning & Maintenance (30 | 7.3%), Healthcare Support (13 | 3.2%), Food Preparation & Serving (7 | 1.7%), and Security & Protection (5 | 1.2%).
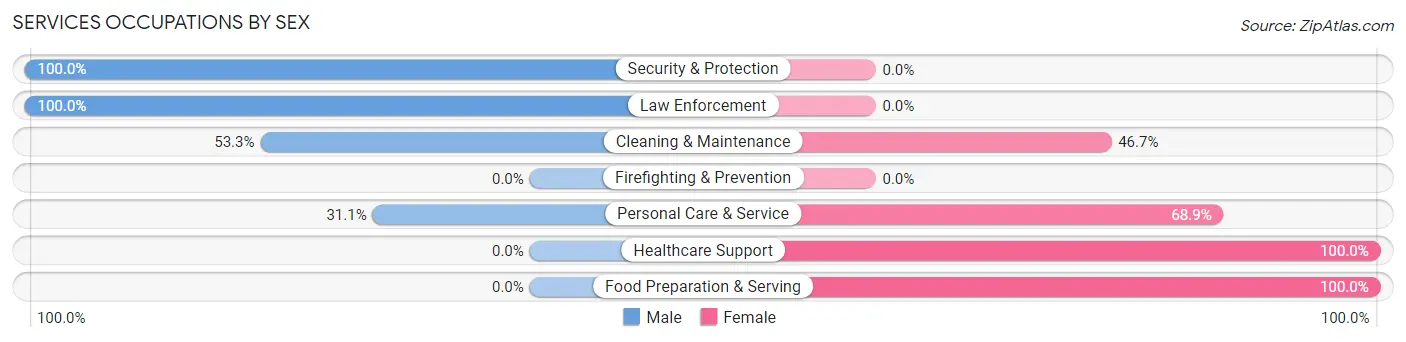
Services Occupations by Sex
Within the Services occupations in Racine, the most male-oriented occupations are Security & Protection (100.0%), Law Enforcement (100.0%), and Cleaning & Maintenance (53.3%), while the most female-oriented occupations are Healthcare Support (100.0%), Food Preparation & Serving (100.0%), and Personal Care & Service (68.9%).
| Occupation | Male | Female |
| Healthcare Support | 0 (0.0%) | 13 (100.0%) |
| Security & Protection | 5 (100.0%) | 0 (0.0%) |
| Firefighting & Prevention | 0 (0.0%) | 0 (0.0%) |
| Law Enforcement | 5 (100.0%) | 0 (0.0%) |
| Food Preparation & Serving | 0 (0.0%) | 7 (100.0%) |
| Cleaning & Maintenance | 16 (53.3%) | 14 (46.7%) |
| Personal Care & Service | 14 (31.1%) | 31 (68.9%) |
| Total (Category) | 35 (35.0%) | 65 (65.0%) |
| Total (Overall) | 226 (55.4%) | 182 (44.6%) |
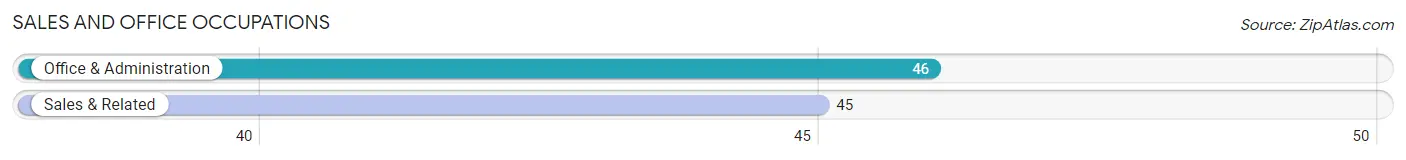
Sales and Office Occupations
The most common Sales and Office occupations in Racine are Office & Administration (46 | 11.3%), and Sales & Related (45 | 11.0%).
Sales and Office Occupations by Sex
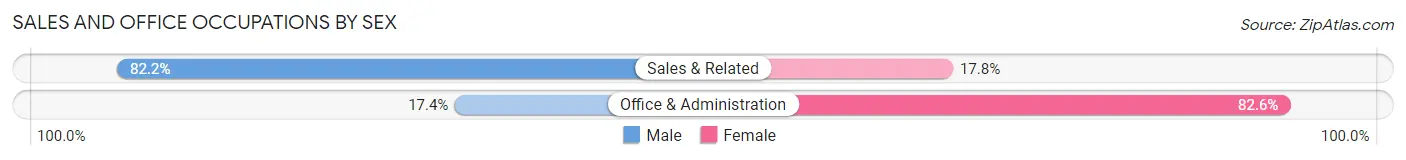
| Occupation | Male | Female |
| Sales & Related | 37 (82.2%) | 8 (17.8%) |
| Office & Administration | 8 (17.4%) | 38 (82.6%) |
| Total (Category) | 45 (49.4%) | 46 (50.5%) |
| Total (Overall) | 226 (55.4%) | 182 (44.6%) |
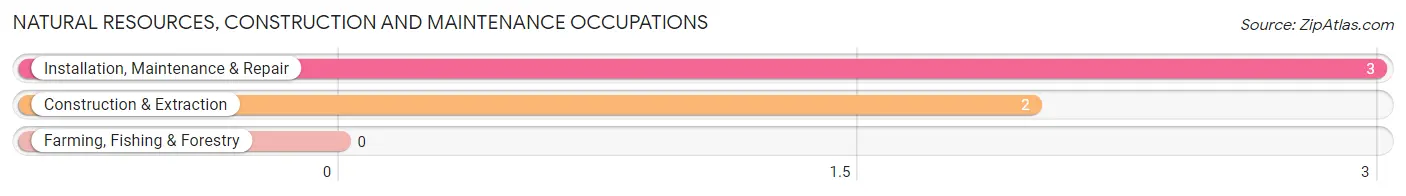
Natural Resources, Construction and Maintenance Occupations
The most common Natural Resources, Construction and Maintenance occupations in Racine are Installation, Maintenance & Repair (3 | 0.7%), and Construction & Extraction (2 | 0.5%).
Natural Resources, Construction and Maintenance Occupations by Sex
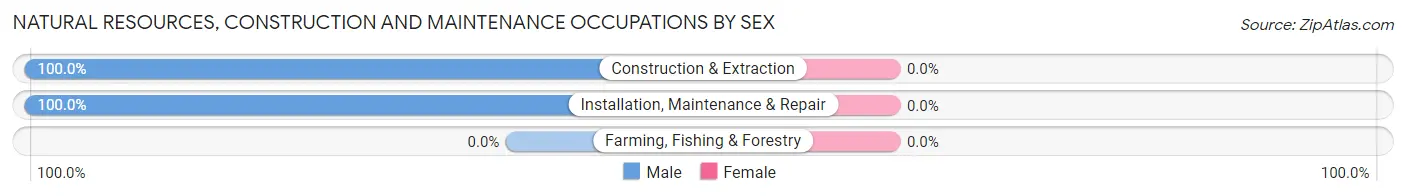
| Occupation | Male | Female |
| Farming, Fishing & Forestry | 0 (0.0%) | 0 (0.0%) |
| Construction & Extraction | 2 (100.0%) | 0 (0.0%) |
| Installation, Maintenance & Repair | 3 (100.0%) | 0 (0.0%) |
| Total (Category) | 5 (100.0%) | 0 (0.0%) |
| Total (Overall) | 226 (55.4%) | 182 (44.6%) |
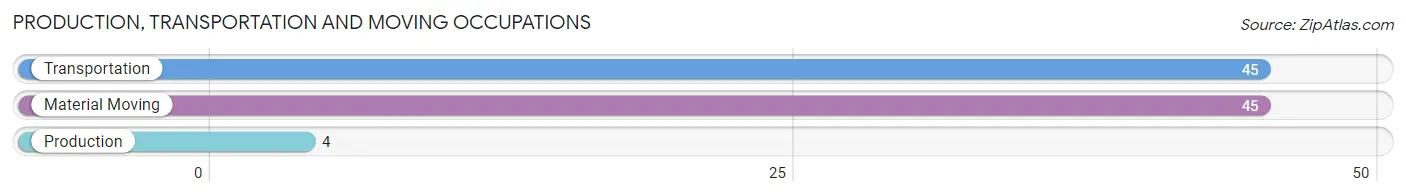
Production, Transportation and Moving Occupations
The most common Production, Transportation and Moving occupations in Racine are Transportation (45 | 11.0%), Material Moving (45 | 11.0%), and Production (4 | 1.0%).
Production, Transportation and Moving Occupations by Sex
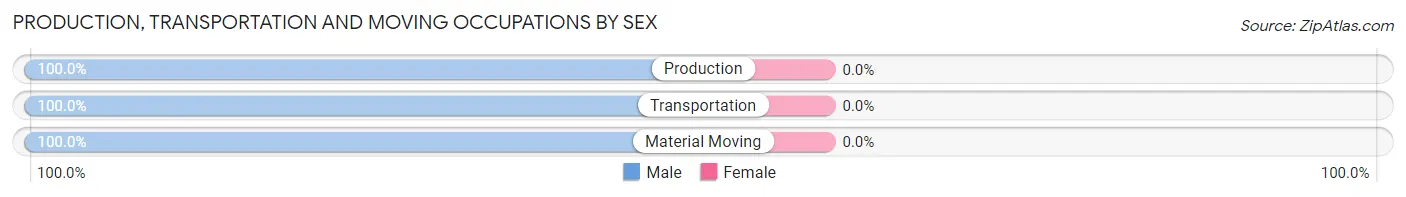
| Occupation | Male | Female |
| Production | 4 (100.0%) | 0 (0.0%) |
| Transportation | 45 (100.0%) | 0 (0.0%) |
| Material Moving | 45 (100.0%) | 0 (0.0%) |
| Total (Category) | 94 (100.0%) | 0 (0.0%) |
| Total (Overall) | 226 (55.4%) | 182 (44.6%) |
Employment Industries by Sex in Racine
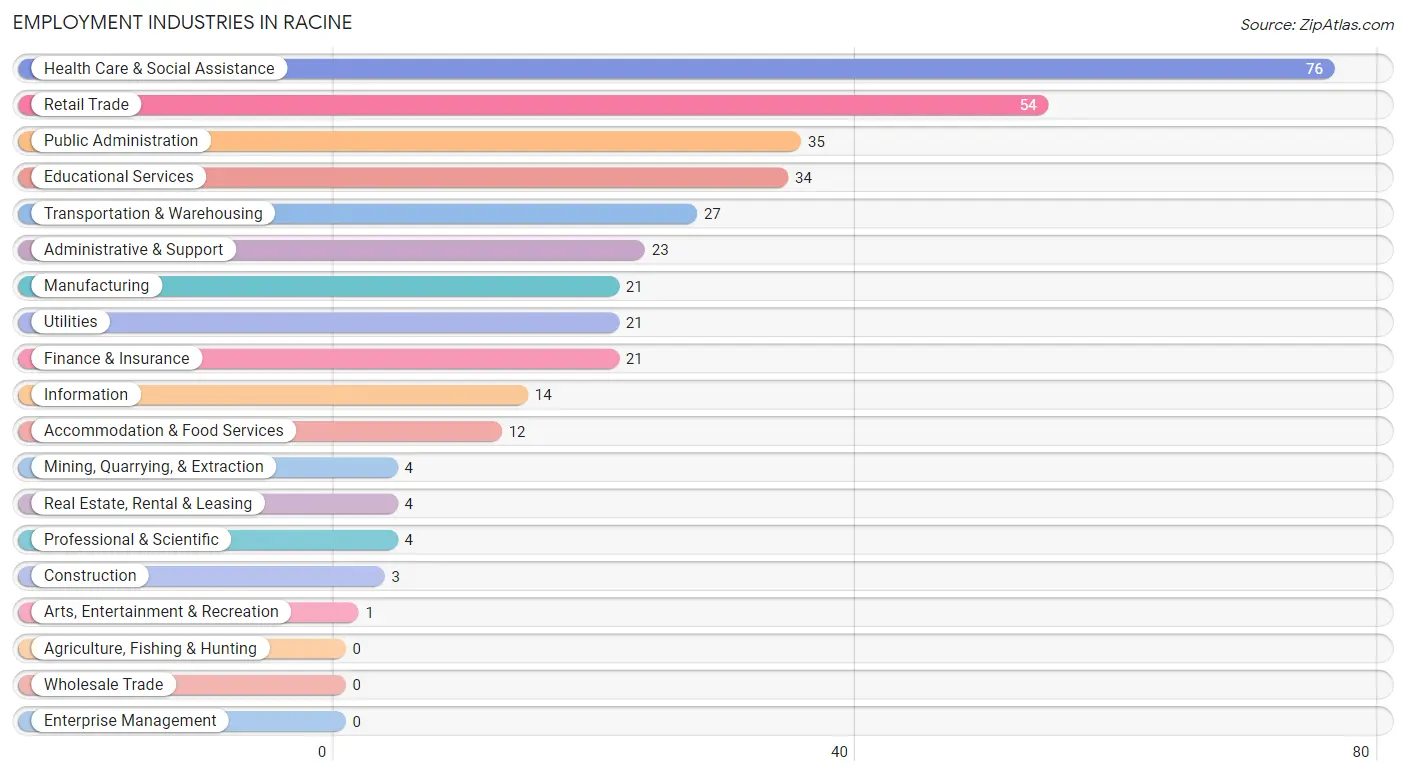
Employment Industries in Racine
The major employment industries in Racine include Health Care & Social Assistance (76 | 18.6%), Retail Trade (54 | 13.2%), Public Administration (35 | 8.6%), Educational Services (34 | 8.3%), and Transportation & Warehousing (27 | 6.6%).
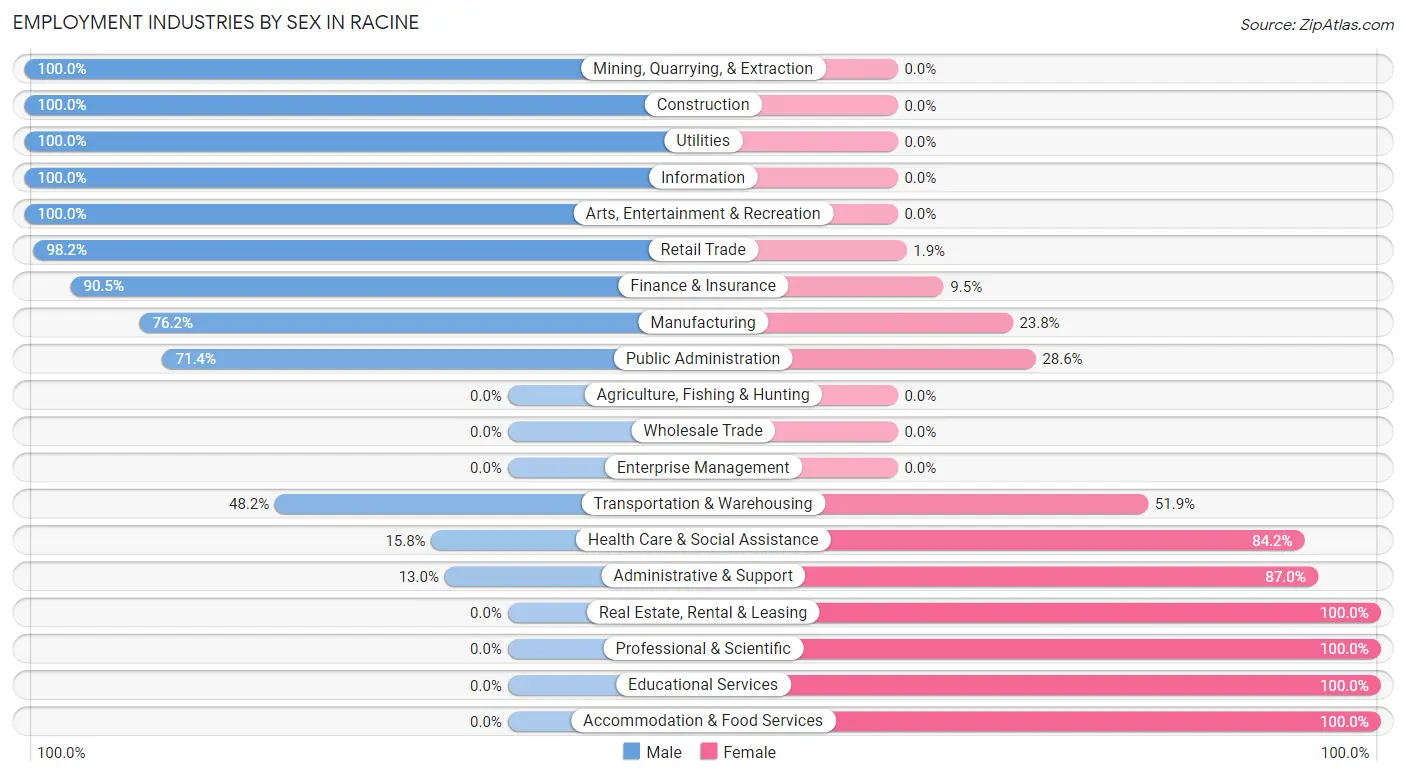
Employment Industries by Sex in Racine
The Racine industries that see more men than women are Mining, Quarrying, & Extraction (100.0%), Construction (100.0%), and Utilities (100.0%), whereas the industries that tend to have a higher number of women are Real Estate, Rental & Leasing (100.0%), Professional & Scientific (100.0%), and Educational Services (100.0%).
| Industry | Male | Female |
| Agriculture, Fishing & Hunting | 0 (0.0%) | 0 (0.0%) |
| Mining, Quarrying, & Extraction | 4 (100.0%) | 0 (0.0%) |
| Construction | 3 (100.0%) | 0 (0.0%) |
| Manufacturing | 16 (76.2%) | 5 (23.8%) |
| Wholesale Trade | 0 (0.0%) | 0 (0.0%) |
| Retail Trade | 53 (98.2%) | 1 (1.8%) |
| Transportation & Warehousing | 13 (48.1%) | 14 (51.8%) |
| Utilities | 21 (100.0%) | 0 (0.0%) |
| Information | 14 (100.0%) | 0 (0.0%) |
| Finance & Insurance | 19 (90.5%) | 2 (9.5%) |
| Real Estate, Rental & Leasing | 0 (0.0%) | 4 (100.0%) |
| Professional & Scientific | 0 (0.0%) | 4 (100.0%) |
| Enterprise Management | 0 (0.0%) | 0 (0.0%) |
| Administrative & Support | 3 (13.0%) | 20 (87.0%) |
| Educational Services | 0 (0.0%) | 34 (100.0%) |
| Health Care & Social Assistance | 12 (15.8%) | 64 (84.2%) |
| Arts, Entertainment & Recreation | 1 (100.0%) | 0 (0.0%) |
| Accommodation & Food Services | 0 (0.0%) | 12 (100.0%) |
| Public Administration | 25 (71.4%) | 10 (28.6%) |
| Total | 226 (55.4%) | 182 (44.6%) |
Education in Racine
School Enrollment in Racine
The most common levels of schooling among the 256 students in Racine are elementary school (96 | 37.5%), middle school (65 | 25.4%), and college / undergraduate (54 | 21.1%).
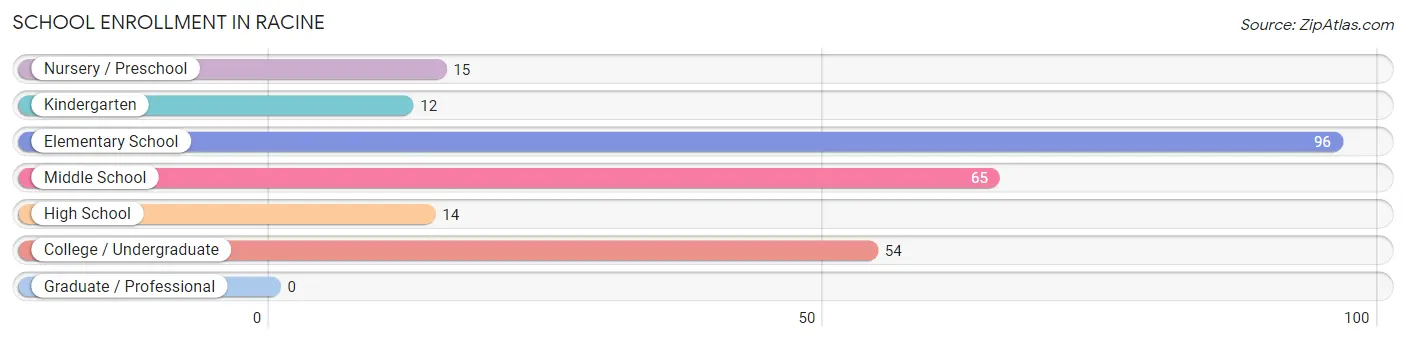
| School Level | # Students | % Students |
| Nursery / Preschool | 15 | 5.9% |
| Kindergarten | 12 | 4.7% |
| Elementary School | 96 | 37.5% |
| Middle School | 65 | 25.4% |
| High School | 14 | 5.5% |
| College / Undergraduate | 54 | 21.1% |
| Graduate / Professional | 0 | 0.0% |
| Total | 256 | 100.0% |
School Enrollment by Age by Funding Source in Racine
Out of a total of 256 students who are enrolled in schools in Racine, 18 (7.0%) attend a private institution, while the remaining 238 (93.0%) are enrolled in public schools. The age group of 10 to 14 year olds has the highest likelihood of being enrolled in private schools, with 18 (17.3% in the age bracket) enrolled. Conversely, the age group of 5 to 9 year old has the lowest likelihood of being enrolled in a private school, with 86 (100.0% in the age bracket) attending a public institution.
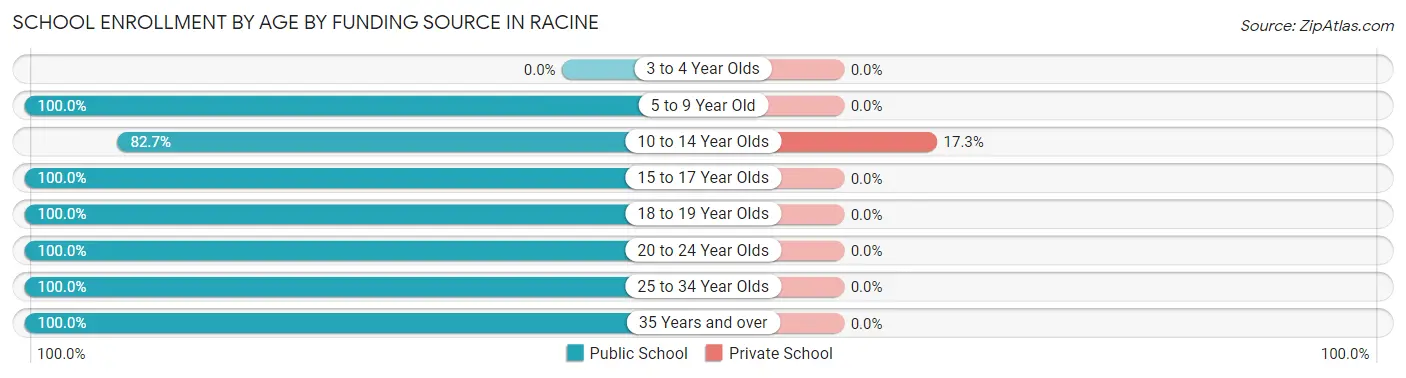
| Age Bracket | Public School | Private School |
| 3 to 4 Year Olds | 0 (0.0%) | 0 (0.0%) |
| 5 to 9 Year Old | 86 (100.0%) | 0 (0.0%) |
| 10 to 14 Year Olds | 86 (82.7%) | 18 (17.3%) |
| 15 to 17 Year Olds | 12 (100.0%) | 0 (0.0%) |
| 18 to 19 Year Olds | 14 (100.0%) | 0 (0.0%) |
| 20 to 24 Year Olds | 30 (100.0%) | 0 (0.0%) |
| 25 to 34 Year Olds | 4 (100.0%) | 0 (0.0%) |
| 35 Years and over | 6 (100.0%) | 0 (0.0%) |
| Total | 238 (93.0%) | 18 (7.0%) |
Educational Attainment by Field of Study in Racine
Science & technology (37 | 39.8%), communications (19 | 20.4%), business (13 | 14.0%), arts & humanities (12 | 12.9%), and education (8 | 8.6%) are the most common fields of study among 93 individuals in Racine who have obtained a bachelor's degree or higher.
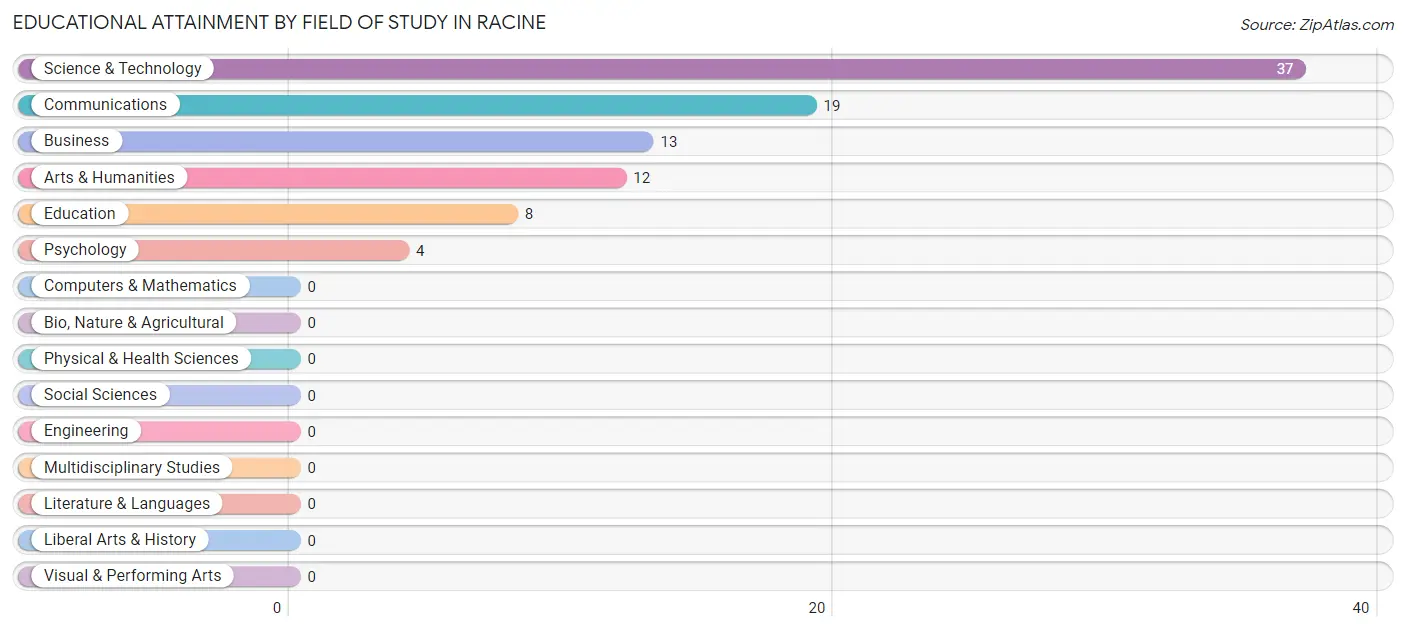
| Field of Study | # Graduates | % Graduates |
| Computers & Mathematics | 0 | 0.0% |
| Bio, Nature & Agricultural | 0 | 0.0% |
| Physical & Health Sciences | 0 | 0.0% |
| Psychology | 4 | 4.3% |
| Social Sciences | 0 | 0.0% |
| Engineering | 0 | 0.0% |
| Multidisciplinary Studies | 0 | 0.0% |
| Science & Technology | 37 | 39.8% |
| Business | 13 | 14.0% |
| Education | 8 | 8.6% |
| Literature & Languages | 0 | 0.0% |
| Liberal Arts & History | 0 | 0.0% |
| Visual & Performing Arts | 0 | 0.0% |
| Communications | 19 | 20.4% |
| Arts & Humanities | 12 | 12.9% |
| Total | 93 | 100.0% |
Transportation & Commute in Racine
Vehicle Availability by Sex in Racine
The most prevalent vehicle ownership categories in Racine are males with 2 vehicles (105, accounting for 46.9%) and females with 2 vehicles (94, making up 61.1%).
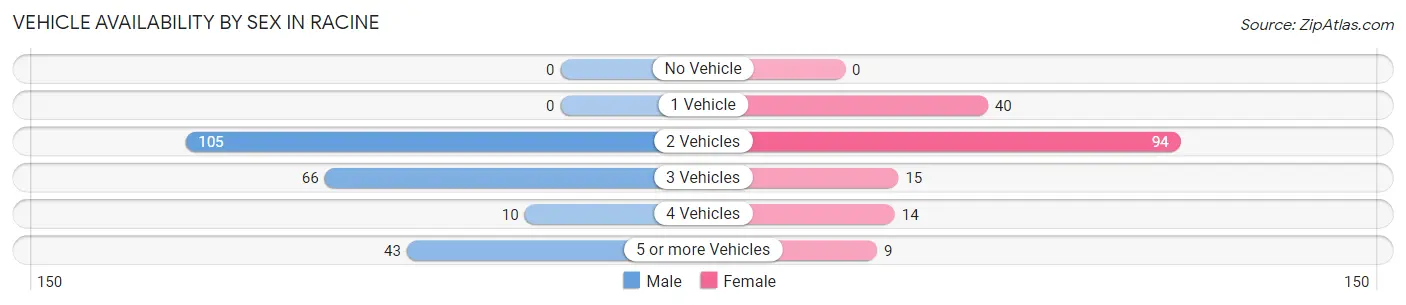
| Vehicles Available | Male | Female |
| No Vehicle | 0 (0.0%) | 0 (0.0%) |
| 1 Vehicle | 0 (0.0%) | 40 (23.3%) |
| 2 Vehicles | 105 (46.9%) | 94 (54.6%) |
| 3 Vehicles | 66 (29.5%) | 15 (8.7%) |
| 4 Vehicles | 10 (4.5%) | 14 (8.1%) |
| 5 or more Vehicles | 43 (19.2%) | 9 (5.2%) |
| Total | 224 (100.0%) | 172 (100.0%) |
Commute Time in Racine
The most frequently occuring commute durations in Racine are 30 to 34 minutes (57 commuters, 15.2%), 20 to 24 minutes (52 commuters, 13.8%), and 45 to 59 minutes (44 commuters, 11.7%).
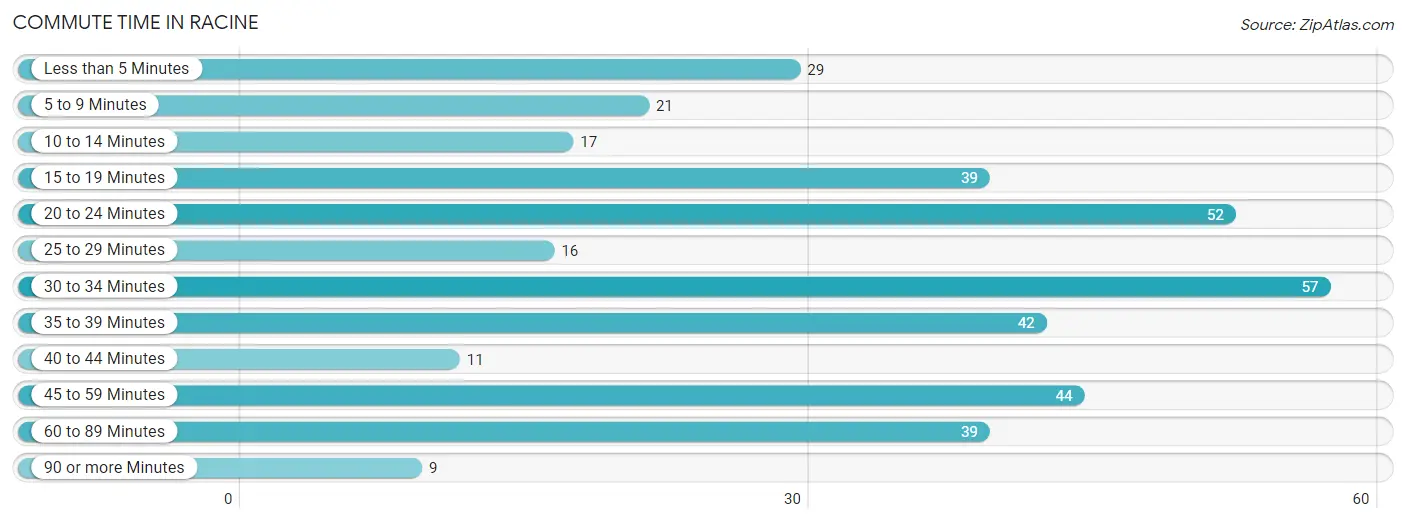
| Commute Time | # Commuters | % Commuters |
| Less than 5 Minutes | 29 | 7.7% |
| 5 to 9 Minutes | 21 | 5.6% |
| 10 to 14 Minutes | 17 | 4.5% |
| 15 to 19 Minutes | 39 | 10.4% |
| 20 to 24 Minutes | 52 | 13.8% |
| 25 to 29 Minutes | 16 | 4.3% |
| 30 to 34 Minutes | 57 | 15.2% |
| 35 to 39 Minutes | 42 | 11.2% |
| 40 to 44 Minutes | 11 | 2.9% |
| 45 to 59 Minutes | 44 | 11.7% |
| 60 to 89 Minutes | 39 | 10.4% |
| 90 or more Minutes | 9 | 2.4% |
Commute Time by Sex in Racine
The most common commute times in Racine are 45 to 59 minutes (36 commuters, 17.2%) for males and 15 to 19 minutes (33 commuters, 19.8%) for females.
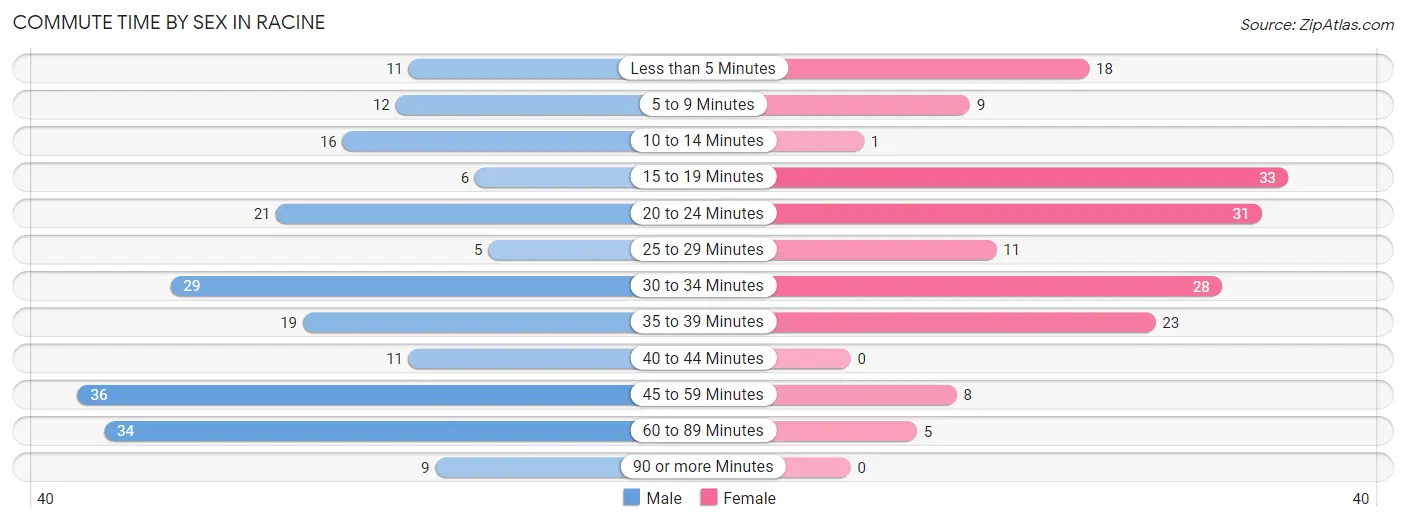
| Commute Time | Male | Female |
| Less than 5 Minutes | 11 (5.3%) | 18 (10.8%) |
| 5 to 9 Minutes | 12 (5.7%) | 9 (5.4%) |
| 10 to 14 Minutes | 16 (7.7%) | 1 (0.6%) |
| 15 to 19 Minutes | 6 (2.9%) | 33 (19.8%) |
| 20 to 24 Minutes | 21 (10.1%) | 31 (18.6%) |
| 25 to 29 Minutes | 5 (2.4%) | 11 (6.6%) |
| 30 to 34 Minutes | 29 (13.9%) | 28 (16.8%) |
| 35 to 39 Minutes | 19 (9.1%) | 23 (13.8%) |
| 40 to 44 Minutes | 11 (5.3%) | 0 (0.0%) |
| 45 to 59 Minutes | 36 (17.2%) | 8 (4.8%) |
| 60 to 89 Minutes | 34 (16.3%) | 5 (3.0%) |
| 90 or more Minutes | 9 (4.3%) | 0 (0.0%) |
Time of Departure to Work by Sex in Racine
The most frequent times of departure to work in Racine are 10:00 AM to 10:59 AM (36, 17.2%) for males and 8:00 AM to 8:29 AM (29, 17.4%) for females.
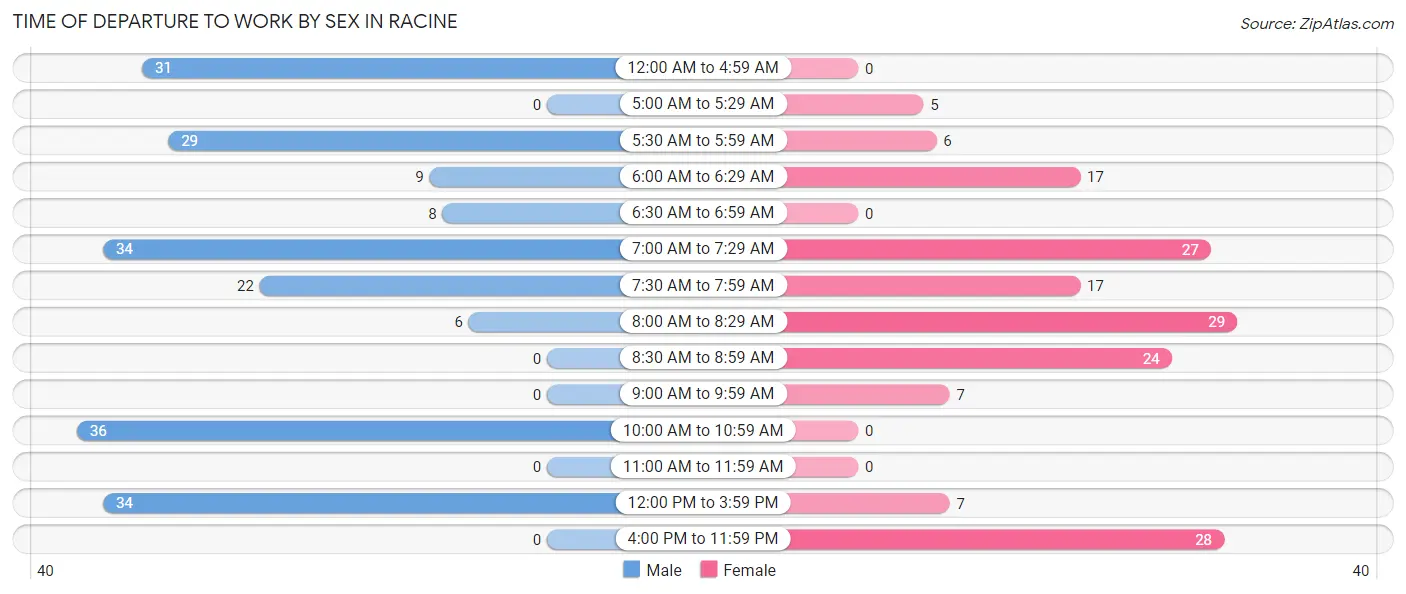
| Time of Departure | Male | Female |
| 12:00 AM to 4:59 AM | 31 (14.8%) | 0 (0.0%) |
| 5:00 AM to 5:29 AM | 0 (0.0%) | 5 (3.0%) |
| 5:30 AM to 5:59 AM | 29 (13.9%) | 6 (3.6%) |
| 6:00 AM to 6:29 AM | 9 (4.3%) | 17 (10.2%) |
| 6:30 AM to 6:59 AM | 8 (3.8%) | 0 (0.0%) |
| 7:00 AM to 7:29 AM | 34 (16.3%) | 27 (16.2%) |
| 7:30 AM to 7:59 AM | 22 (10.5%) | 17 (10.2%) |
| 8:00 AM to 8:29 AM | 6 (2.9%) | 29 (17.4%) |
| 8:30 AM to 8:59 AM | 0 (0.0%) | 24 (14.4%) |
| 9:00 AM to 9:59 AM | 0 (0.0%) | 7 (4.2%) |
| 10:00 AM to 10:59 AM | 36 (17.2%) | 0 (0.0%) |
| 11:00 AM to 11:59 AM | 0 (0.0%) | 0 (0.0%) |
| 12:00 PM to 3:59 PM | 34 (16.3%) | 7 (4.2%) |
| 4:00 PM to 11:59 PM | 0 (0.0%) | 28 (16.8%) |
| Total | 209 (100.0%) | 167 (100.0%) |
Housing Occupancy in Racine
Occupancy by Ownership in Racine
Of the total 433 dwellings in Racine, owner-occupied units account for 248 (57.3%), while renter-occupied units make up 185 (42.7%).
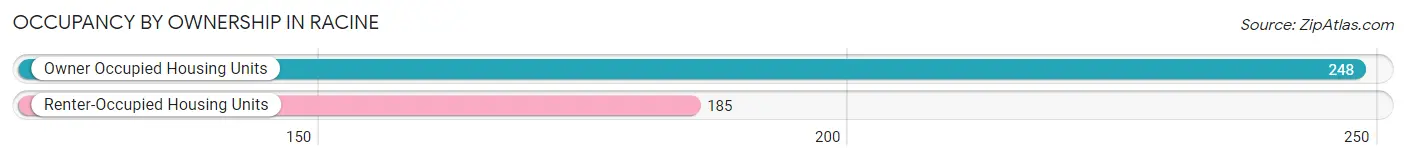
| Occupancy | # Housing Units | % Housing Units |
| Owner Occupied Housing Units | 248 | 57.3% |
| Renter-Occupied Housing Units | 185 | 42.7% |
| Total Occupied Housing Units | 433 | 100.0% |
Occupancy by Household Size in Racine
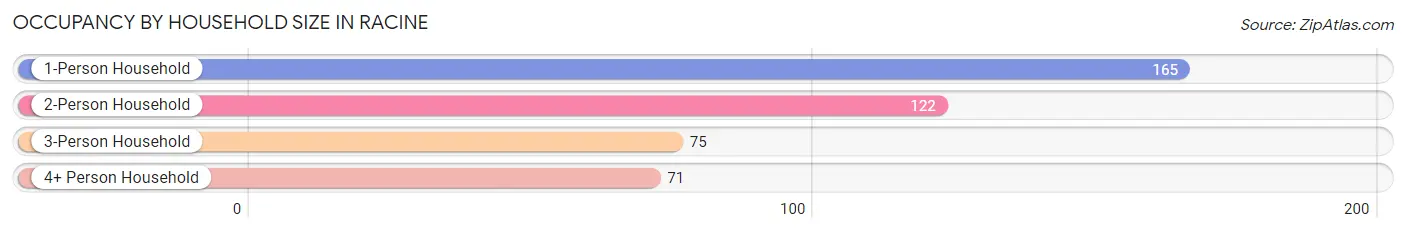
| Household Size | # Housing Units | % Housing Units |
| 1-Person Household | 165 | 38.1% |
| 2-Person Household | 122 | 28.2% |
| 3-Person Household | 75 | 17.3% |
| 4+ Person Household | 71 | 16.4% |
| Total Housing Units | 433 | 100.0% |
Occupancy by Ownership by Household Size in Racine
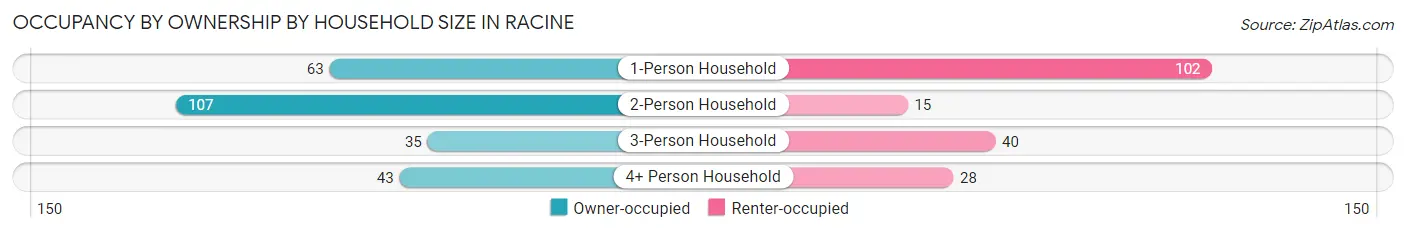
| Household Size | Owner-occupied | Renter-occupied |
| 1-Person Household | 63 (38.2%) | 102 (61.8%) |
| 2-Person Household | 107 (87.7%) | 15 (12.3%) |
| 3-Person Household | 35 (46.7%) | 40 (53.3%) |
| 4+ Person Household | 43 (60.6%) | 28 (39.4%) |
| Total Housing Units | 248 (57.3%) | 185 (42.7%) |
Occupancy by Educational Attainment in Racine
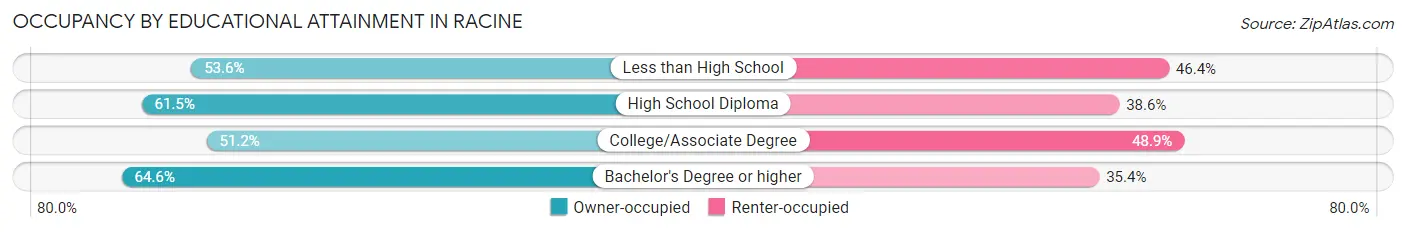
| Household Size | Owner-occupied | Renter-occupied |
| Less than High School | 15 (53.6%) | 13 (46.4%) |
| High School Diploma | 102 (61.5%) | 64 (38.6%) |
| College/Associate Degree | 89 (51.1%) | 85 (48.8%) |
| Bachelor's Degree or higher | 42 (64.6%) | 23 (35.4%) |
Occupancy by Age of Householder in Racine
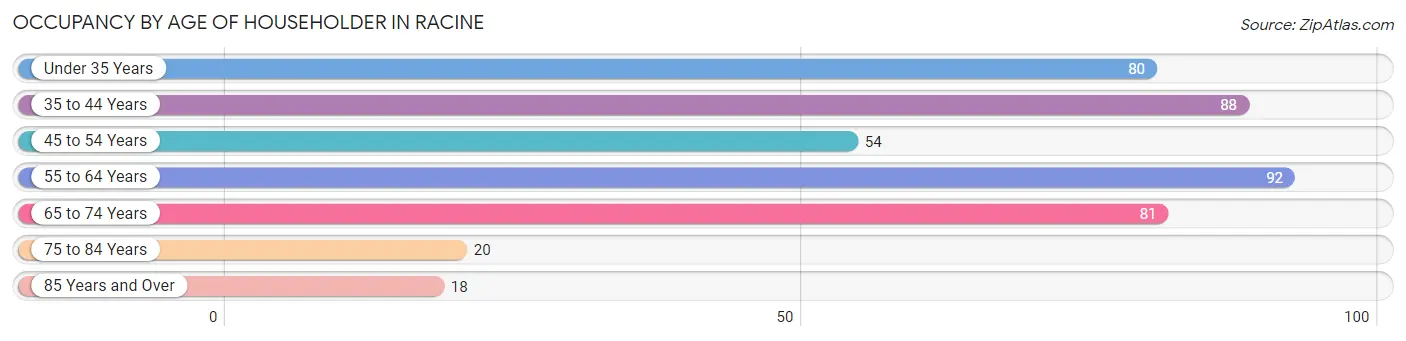
| Age Bracket | # Households | % Households |
| Under 35 Years | 80 | 18.5% |
| 35 to 44 Years | 88 | 20.3% |
| 45 to 54 Years | 54 | 12.5% |
| 55 to 64 Years | 92 | 21.2% |
| 65 to 74 Years | 81 | 18.7% |
| 75 to 84 Years | 20 | 4.6% |
| 85 Years and Over | 18 | 4.2% |
| Total | 433 | 100.0% |
Housing Finances in Racine
Median Income by Occupancy in Racine
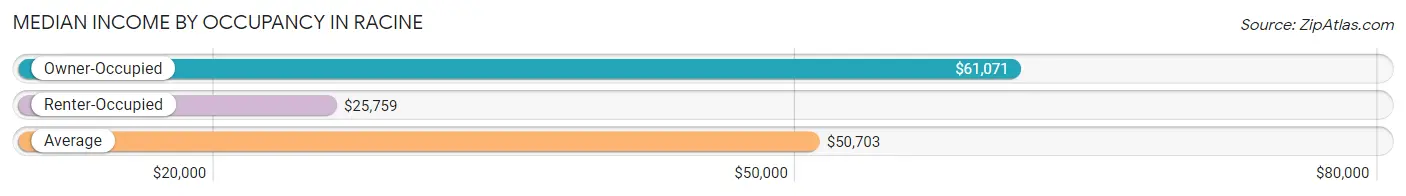
| Occupancy Type | # Households | Median Income |
| Owner-Occupied | 248 (57.3%) | $61,071 |
| Renter-Occupied | 185 (42.7%) | $25,759 |
| Average | 433 (100.0%) | $50,703 |
Occupancy by Householder Income Bracket in Racine
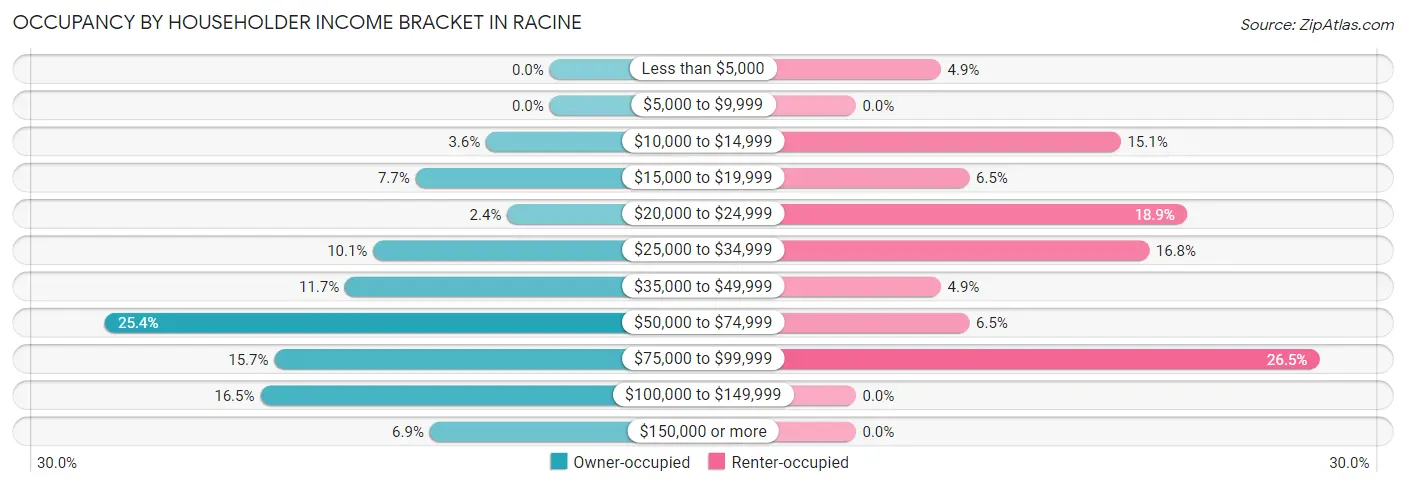
| Income Bracket | Owner-occupied | Renter-occupied |
| Less than $5,000 | 0 (0.0%) | 9 (4.9%) |
| $5,000 to $9,999 | 0 (0.0%) | 0 (0.0%) |
| $10,000 to $14,999 | 9 (3.6%) | 28 (15.1%) |
| $15,000 to $19,999 | 19 (7.7%) | 12 (6.5%) |
| $20,000 to $24,999 | 6 (2.4%) | 35 (18.9%) |
| $25,000 to $34,999 | 25 (10.1%) | 31 (16.8%) |
| $35,000 to $49,999 | 29 (11.7%) | 9 (4.9%) |
| $50,000 to $74,999 | 63 (25.4%) | 12 (6.5%) |
| $75,000 to $99,999 | 39 (15.7%) | 49 (26.5%) |
| $100,000 to $149,999 | 41 (16.5%) | 0 (0.0%) |
| $150,000 or more | 17 (6.9%) | 0 (0.0%) |
| Total | 248 (100.0%) | 185 (100.0%) |
Monthly Housing Cost Tiers in Racine
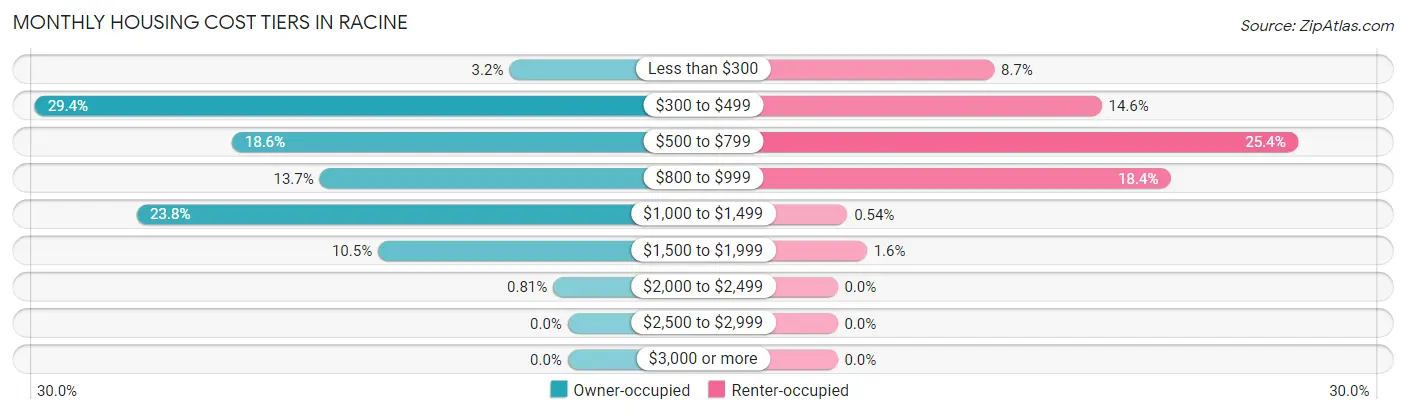
| Monthly Cost | Owner-occupied | Renter-occupied |
| Less than $300 | 8 (3.2%) | 16 (8.6%) |
| $300 to $499 | 73 (29.4%) | 27 (14.6%) |
| $500 to $799 | 46 (18.5%) | 47 (25.4%) |
| $800 to $999 | 34 (13.7%) | 34 (18.4%) |
| $1,000 to $1,499 | 59 (23.8%) | 1 (0.5%) |
| $1,500 to $1,999 | 26 (10.5%) | 3 (1.6%) |
| $2,000 to $2,499 | 2 (0.8%) | 0 (0.0%) |
| $2,500 to $2,999 | 0 (0.0%) | 0 (0.0%) |
| $3,000 or more | 0 (0.0%) | 0 (0.0%) |
| Total | 248 (100.0%) | 185 (100.0%) |
Physical Housing Characteristics in Racine
Housing Structures in Racine
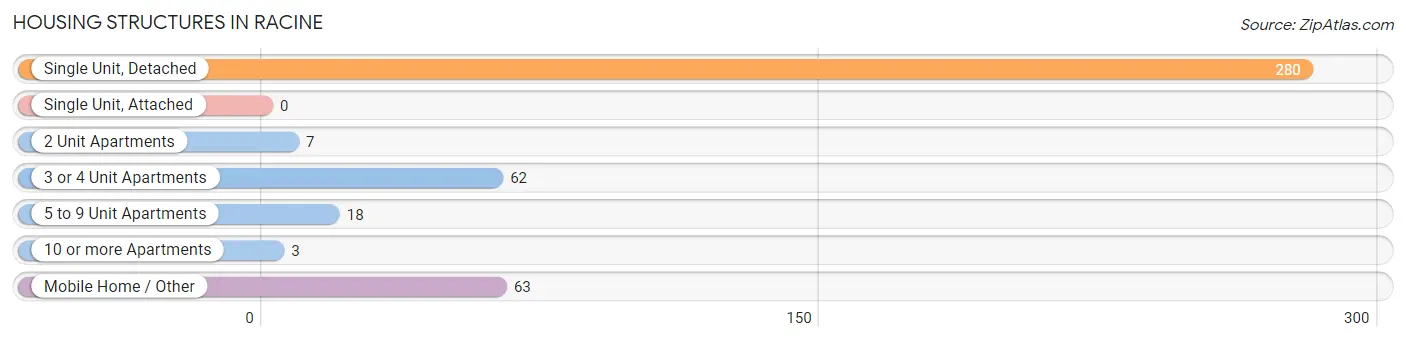
| Structure Type | # Housing Units | % Housing Units |
| Single Unit, Detached | 280 | 64.7% |
| Single Unit, Attached | 0 | 0.0% |
| 2 Unit Apartments | 7 | 1.6% |
| 3 or 4 Unit Apartments | 62 | 14.3% |
| 5 to 9 Unit Apartments | 18 | 4.2% |
| 10 or more Apartments | 3 | 0.7% |
| Mobile Home / Other | 63 | 14.5% |
| Total | 433 | 100.0% |
Housing Structures by Occupancy in Racine
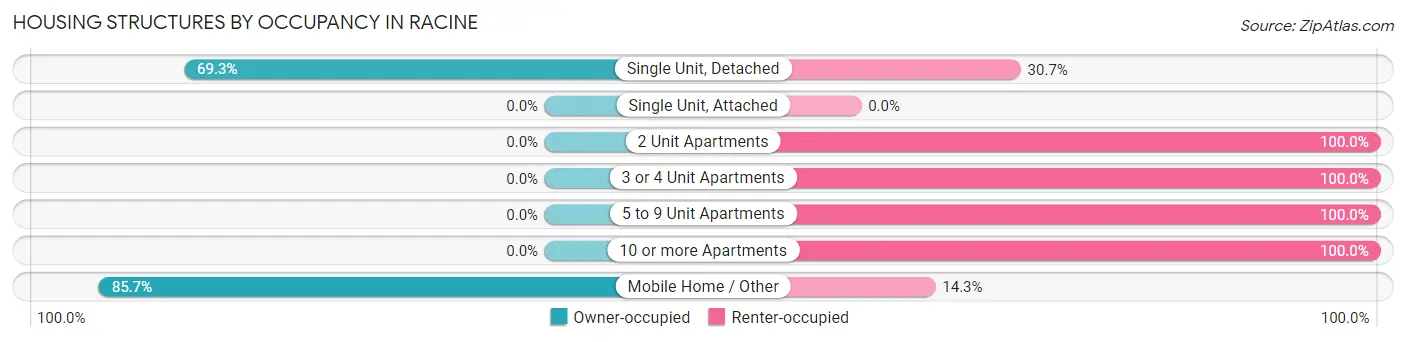
| Structure Type | Owner-occupied | Renter-occupied |
| Single Unit, Detached | 194 (69.3%) | 86 (30.7%) |
| Single Unit, Attached | 0 (0.0%) | 0 (0.0%) |
| 2 Unit Apartments | 0 (0.0%) | 7 (100.0%) |
| 3 or 4 Unit Apartments | 0 (0.0%) | 62 (100.0%) |
| 5 to 9 Unit Apartments | 0 (0.0%) | 18 (100.0%) |
| 10 or more Apartments | 0 (0.0%) | 3 (100.0%) |
| Mobile Home / Other | 54 (85.7%) | 9 (14.3%) |
| Total | 248 (57.3%) | 185 (42.7%) |
Housing Structures by Number of Rooms in Racine
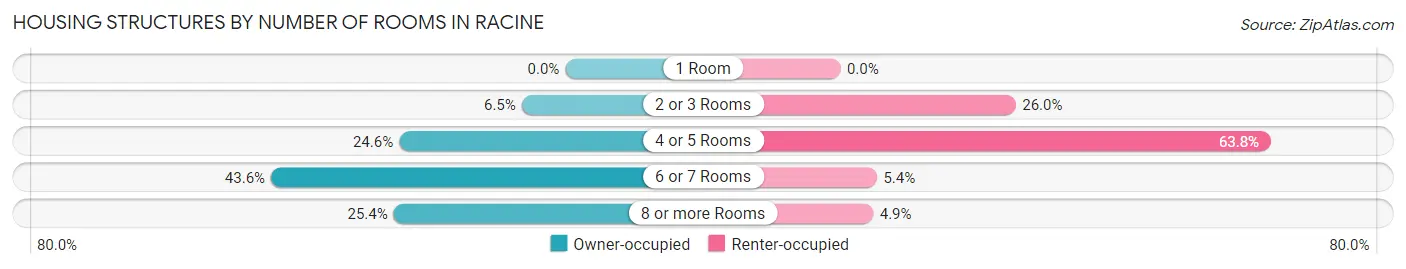
| Number of Rooms | Owner-occupied | Renter-occupied |
| 1 Room | 0 (0.0%) | 0 (0.0%) |
| 2 or 3 Rooms | 16 (6.5%) | 48 (26.0%) |
| 4 or 5 Rooms | 61 (24.6%) | 118 (63.8%) |
| 6 or 7 Rooms | 108 (43.5%) | 10 (5.4%) |
| 8 or more Rooms | 63 (25.4%) | 9 (4.9%) |
| Total | 248 (100.0%) | 185 (100.0%) |
Housing Structure by Heating Type in Racine
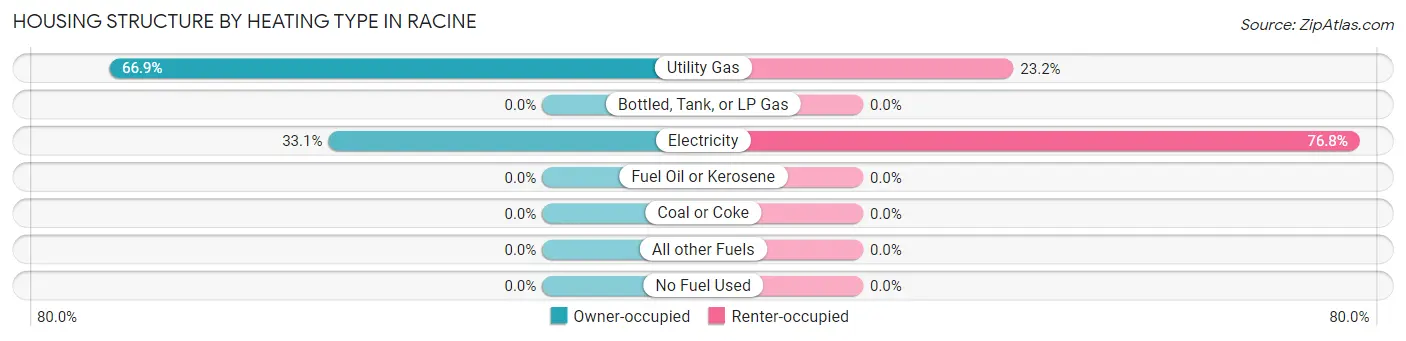
| Heating Type | Owner-occupied | Renter-occupied |
| Utility Gas | 166 (66.9%) | 43 (23.2%) |
| Bottled, Tank, or LP Gas | 0 (0.0%) | 0 (0.0%) |
| Electricity | 82 (33.1%) | 142 (76.8%) |
| Fuel Oil or Kerosene | 0 (0.0%) | 0 (0.0%) |
| Coal or Coke | 0 (0.0%) | 0 (0.0%) |
| All other Fuels | 0 (0.0%) | 0 (0.0%) |
| No Fuel Used | 0 (0.0%) | 0 (0.0%) |
| Total | 248 (100.0%) | 185 (100.0%) |
Household Vehicle Usage in Racine
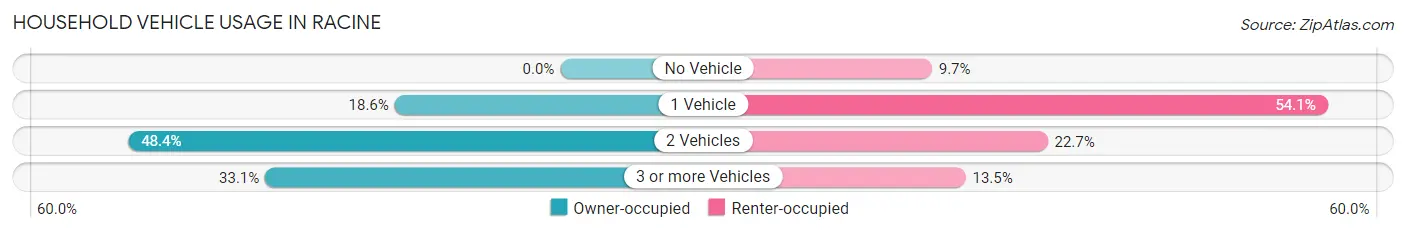
| Vehicles per Household | Owner-occupied | Renter-occupied |
| No Vehicle | 0 (0.0%) | 18 (9.7%) |
| 1 Vehicle | 46 (18.5%) | 100 (54.0%) |
| 2 Vehicles | 120 (48.4%) | 42 (22.7%) |
| 3 or more Vehicles | 82 (33.1%) | 25 (13.5%) |
| Total | 248 (100.0%) | 185 (100.0%) |
Real Estate & Mortgages in Racine
Real Estate and Mortgage Overview in Racine
| Characteristic | Without Mortgage | With Mortgage |
| Housing Units | 114 | 134 |
| Median Property Value | $88,900 | $115,000 |
| Median Household Income | $39,722 | $17 |
| Monthly Housing Costs | $435 | $0 |
| Real Estate Taxes | $879 | $2 |
Property Value by Mortgage Status in Racine
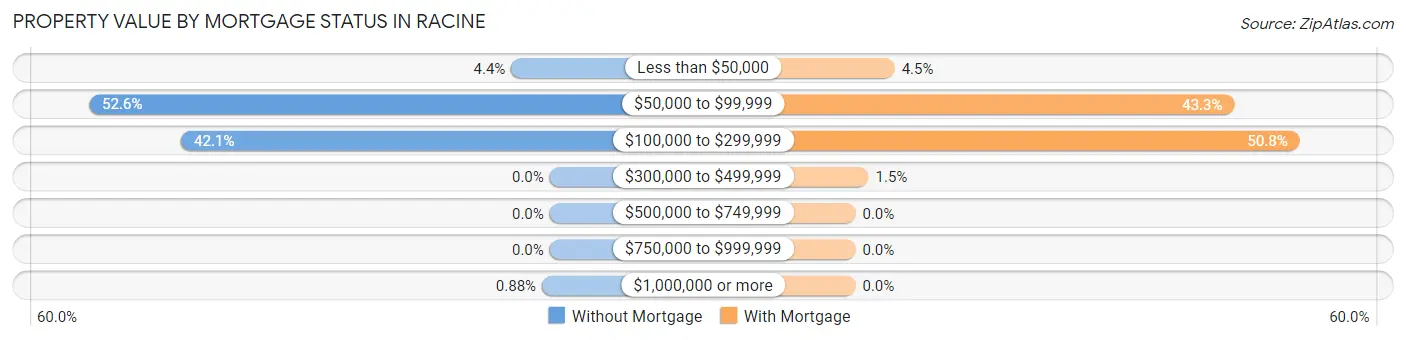
| Property Value | Without Mortgage | With Mortgage |
| Less than $50,000 | 5 (4.4%) | 6 (4.5%) |
| $50,000 to $99,999 | 60 (52.6%) | 58 (43.3%) |
| $100,000 to $299,999 | 48 (42.1%) | 68 (50.7%) |
| $300,000 to $499,999 | 0 (0.0%) | 2 (1.5%) |
| $500,000 to $749,999 | 0 (0.0%) | 0 (0.0%) |
| $750,000 to $999,999 | 0 (0.0%) | 0 (0.0%) |
| $1,000,000 or more | 1 (0.9%) | 0 (0.0%) |
| Total | 114 (100.0%) | 134 (100.0%) |
Household Income by Mortgage Status in Racine
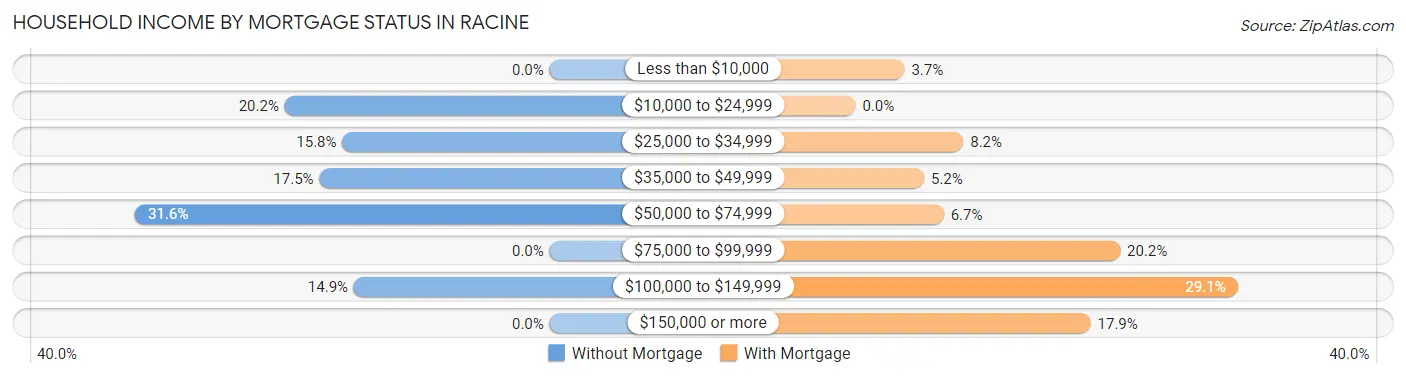
| Household Income | Without Mortgage | With Mortgage |
| Less than $10,000 | 0 (0.0%) | 5 (3.7%) |
| $10,000 to $24,999 | 23 (20.2%) | 0 (0.0%) |
| $25,000 to $34,999 | 18 (15.8%) | 11 (8.2%) |
| $35,000 to $49,999 | 20 (17.5%) | 7 (5.2%) |
| $50,000 to $74,999 | 36 (31.6%) | 9 (6.7%) |
| $75,000 to $99,999 | 0 (0.0%) | 27 (20.2%) |
| $100,000 to $149,999 | 17 (14.9%) | 39 (29.1%) |
| $150,000 or more | 0 (0.0%) | 24 (17.9%) |
| Total | 114 (100.0%) | 134 (100.0%) |
Property Value to Household Income Ratio in Racine
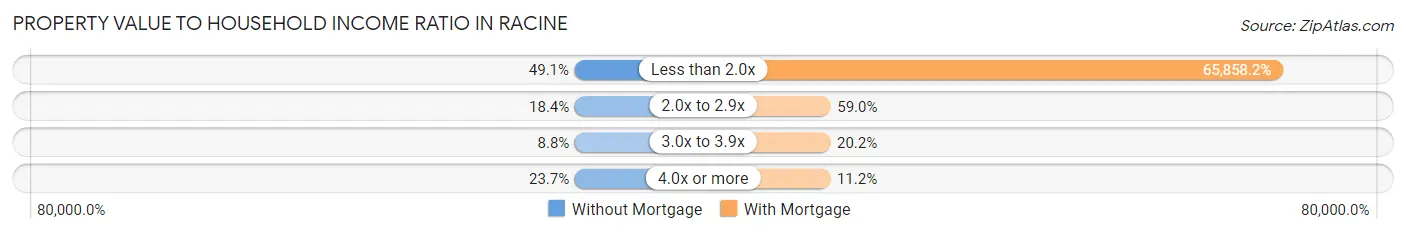
| Value-to-Income Ratio | Without Mortgage | With Mortgage |
| Less than 2.0x | 56 (49.1%) | 88,250 (65,858.2%) |
| 2.0x to 2.9x | 21 (18.4%) | 79 (59.0%) |
| 3.0x to 3.9x | 10 (8.8%) | 27 (20.2%) |
| 4.0x or more | 27 (23.7%) | 15 (11.2%) |
| Total | 114 (100.0%) | 134 (100.0%) |
Real Estate Taxes by Mortgage Status in Racine
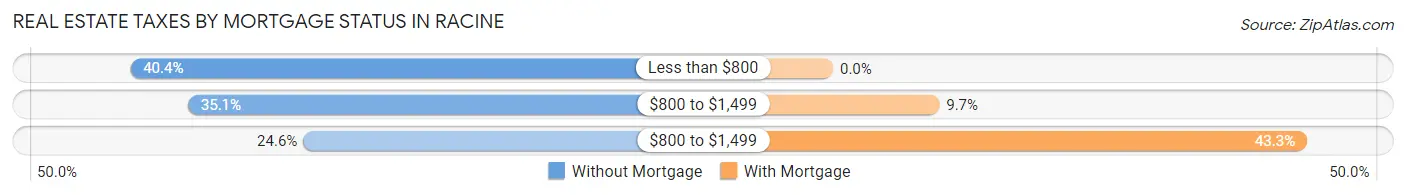
| Property Taxes | Without Mortgage | With Mortgage |
| Less than $800 | 46 (40.4%) | 0 (0.0%) |
| $800 to $1,499 | 40 (35.1%) | 13 (9.7%) |
| $800 to $1,499 | 28 (24.6%) | 58 (43.3%) |
| Total | 114 (100.0%) | 134 (100.0%) |
Health & Disability in Racine
Health Insurance Coverage by Age in Racine
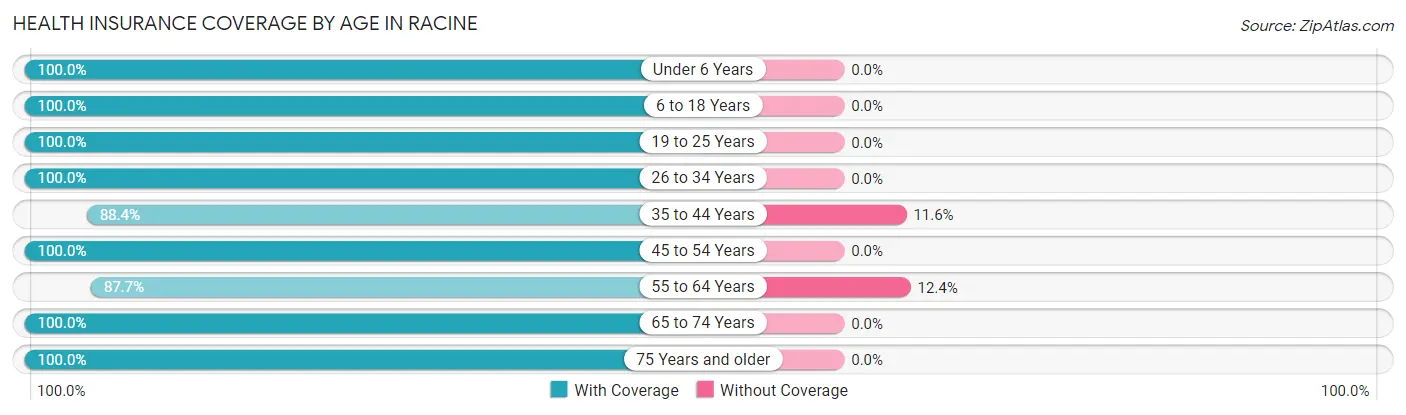
| Age Bracket | With Coverage | Without Coverage |
| Under 6 Years | 81 (100.0%) | 0 (0.0%) |
| 6 to 18 Years | 182 (100.0%) | 0 (0.0%) |
| 19 to 25 Years | 58 (100.0%) | 0 (0.0%) |
| 26 to 34 Years | 105 (100.0%) | 0 (0.0%) |
| 35 to 44 Years | 183 (88.4%) | 24 (11.6%) |
| 45 to 54 Years | 84 (100.0%) | 0 (0.0%) |
| 55 to 64 Years | 142 (87.6%) | 20 (12.3%) |
| 65 to 74 Years | 102 (100.0%) | 0 (0.0%) |
| 75 Years and older | 80 (100.0%) | 0 (0.0%) |
| Total | 1,017 (95.9%) | 44 (4.2%) |
Health Insurance Coverage by Citizenship Status in Racine
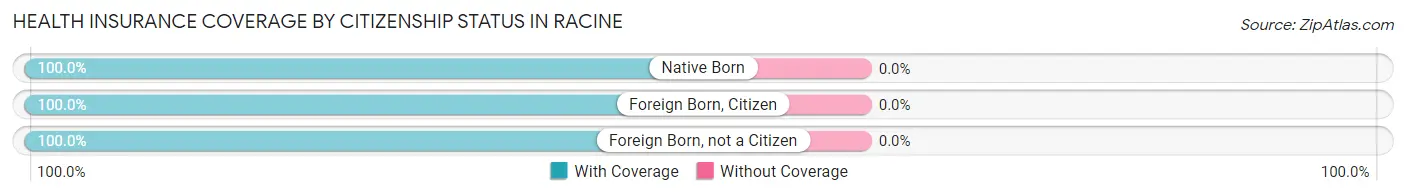
| Citizenship Status | With Coverage | Without Coverage |
| Native Born | 81 (100.0%) | 0 (0.0%) |
| Foreign Born, Citizen | 182 (100.0%) | 0 (0.0%) |
| Foreign Born, not a Citizen | 58 (100.0%) | 0 (0.0%) |
Health Insurance Coverage by Household Income in Racine
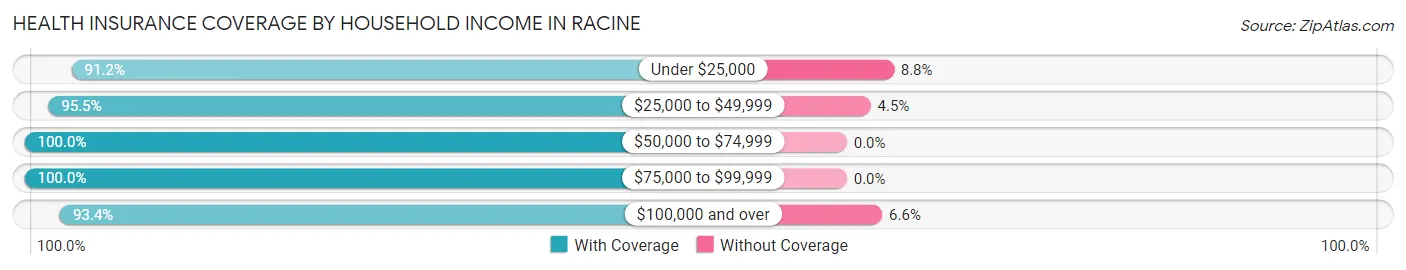
| Household Income | With Coverage | Without Coverage |
| Under $25,000 | 197 (91.2%) | 19 (8.8%) |
| $25,000 to $49,999 | 300 (95.5%) | 14 (4.5%) |
| $50,000 to $74,999 | 197 (100.0%) | 0 (0.0%) |
| $75,000 to $99,999 | 168 (100.0%) | 0 (0.0%) |
| $100,000 and over | 155 (93.4%) | 11 (6.6%) |
Public vs Private Health Insurance Coverage by Age in Racine
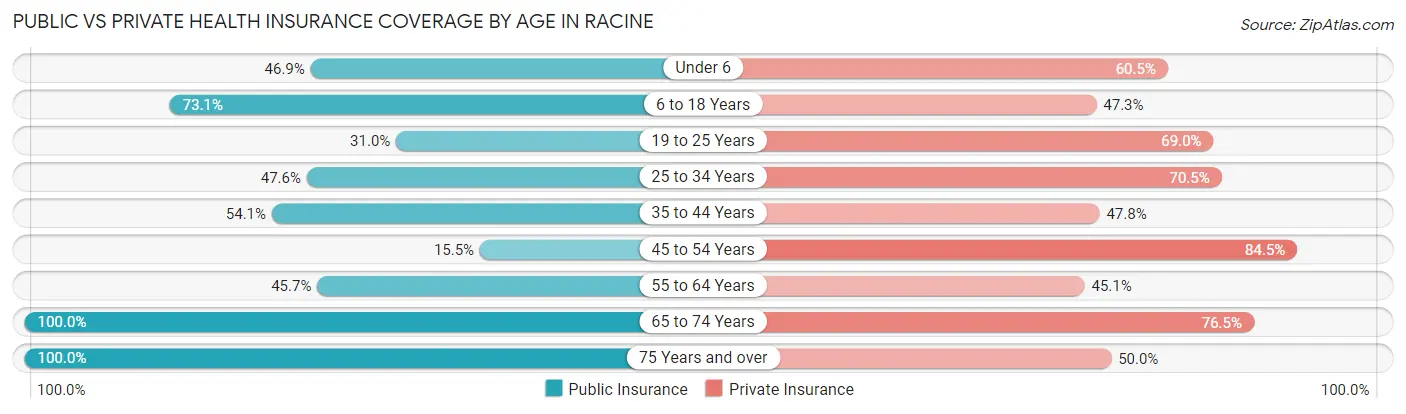
| Age Bracket | Public Insurance | Private Insurance |
| Under 6 | 38 (46.9%) | 49 (60.5%) |
| 6 to 18 Years | 133 (73.1%) | 86 (47.2%) |
| 19 to 25 Years | 18 (31.0%) | 40 (69.0%) |
| 25 to 34 Years | 50 (47.6%) | 74 (70.5%) |
| 35 to 44 Years | 112 (54.1%) | 99 (47.8%) |
| 45 to 54 Years | 13 (15.5%) | 71 (84.5%) |
| 55 to 64 Years | 74 (45.7%) | 73 (45.1%) |
| 65 to 74 Years | 102 (100.0%) | 78 (76.5%) |
| 75 Years and over | 80 (100.0%) | 40 (50.0%) |
| Total | 620 (58.4%) | 610 (57.5%) |
Disability Status by Sex by Age in Racine
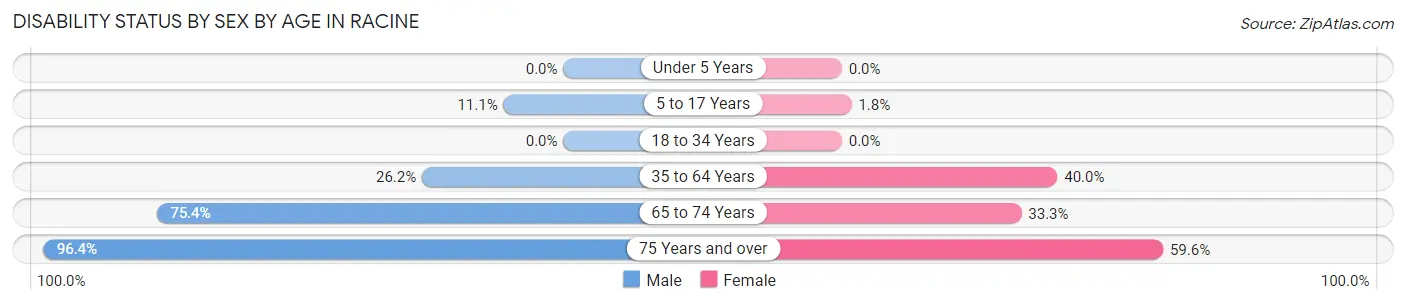
| Age Bracket | Male | Female |
| Under 5 Years | 0 (0.0%) | 0 (0.0%) |
| 5 to 17 Years | 10 (11.1%) | 2 (1.8%) |
| 18 to 34 Years | 0 (0.0%) | 0 (0.0%) |
| 35 to 64 Years | 48 (26.2%) | 108 (40.0%) |
| 65 to 74 Years | 52 (75.4%) | 11 (33.3%) |
| 75 Years and over | 27 (96.4%) | 31 (59.6%) |
Disability Class by Sex by Age in Racine
Disability Class: Hearing Difficulty
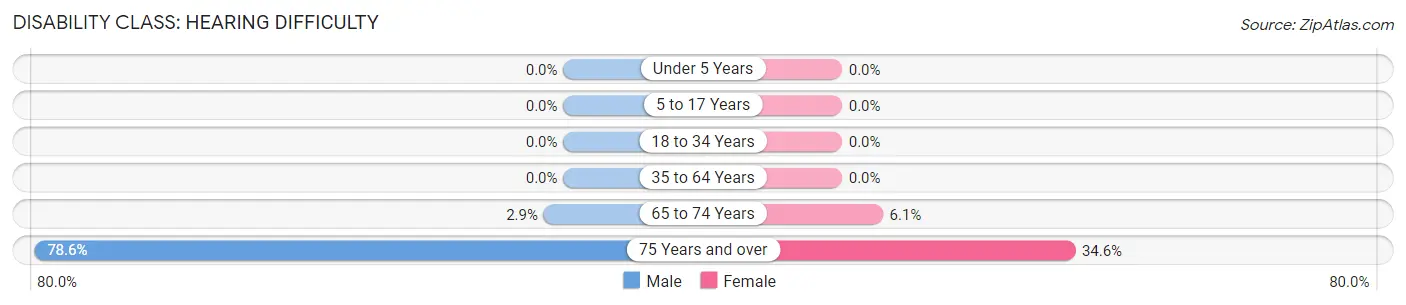
| Age Bracket | Male | Female |
| Under 5 Years | 0 (0.0%) | 0 (0.0%) |
| 5 to 17 Years | 0 (0.0%) | 0 (0.0%) |
| 18 to 34 Years | 0 (0.0%) | 0 (0.0%) |
| 35 to 64 Years | 0 (0.0%) | 0 (0.0%) |
| 65 to 74 Years | 2 (2.9%) | 2 (6.1%) |
| 75 Years and over | 22 (78.6%) | 18 (34.6%) |
Disability Class: Vision Difficulty
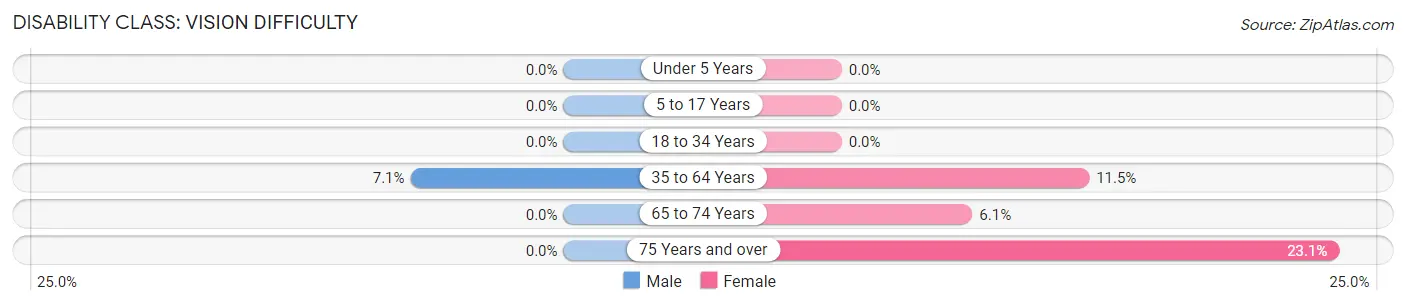
| Age Bracket | Male | Female |
| Under 5 Years | 0 (0.0%) | 0 (0.0%) |
| 5 to 17 Years | 0 (0.0%) | 0 (0.0%) |
| 18 to 34 Years | 0 (0.0%) | 0 (0.0%) |
| 35 to 64 Years | 13 (7.1%) | 31 (11.5%) |
| 65 to 74 Years | 0 (0.0%) | 2 (6.1%) |
| 75 Years and over | 0 (0.0%) | 12 (23.1%) |
Disability Class: Cognitive Difficulty
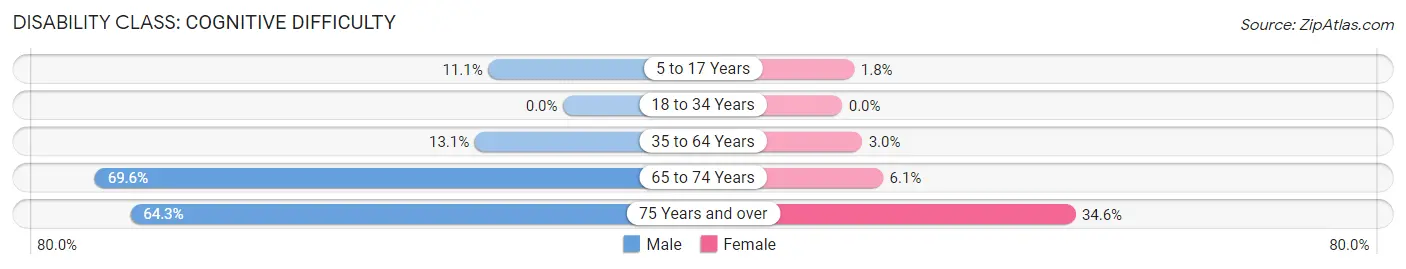
| Age Bracket | Male | Female |
| 5 to 17 Years | 10 (11.1%) | 2 (1.8%) |
| 18 to 34 Years | 0 (0.0%) | 0 (0.0%) |
| 35 to 64 Years | 24 (13.1%) | 8 (3.0%) |
| 65 to 74 Years | 48 (69.6%) | 2 (6.1%) |
| 75 Years and over | 18 (64.3%) | 18 (34.6%) |
Disability Class: Ambulatory Difficulty
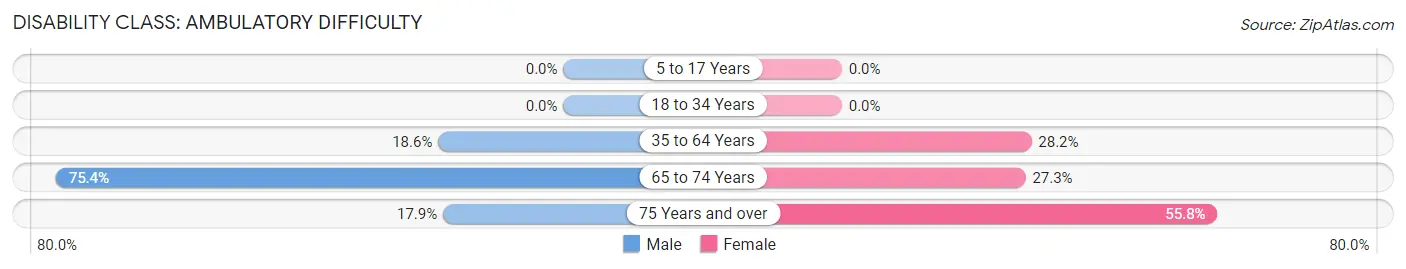
| Age Bracket | Male | Female |
| 5 to 17 Years | 0 (0.0%) | 0 (0.0%) |
| 18 to 34 Years | 0 (0.0%) | 0 (0.0%) |
| 35 to 64 Years | 34 (18.6%) | 76 (28.1%) |
| 65 to 74 Years | 52 (75.4%) | 9 (27.3%) |
| 75 Years and over | 5 (17.9%) | 29 (55.8%) |
Disability Class: Self-Care Difficulty
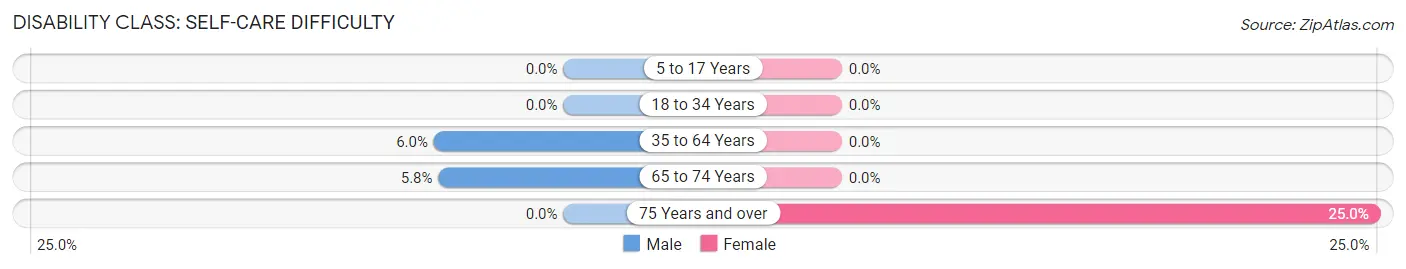
| Age Bracket | Male | Female |
| 5 to 17 Years | 0 (0.0%) | 0 (0.0%) |
| 18 to 34 Years | 0 (0.0%) | 0 (0.0%) |
| 35 to 64 Years | 11 (6.0%) | 0 (0.0%) |
| 65 to 74 Years | 4 (5.8%) | 0 (0.0%) |
| 75 Years and over | 0 (0.0%) | 13 (25.0%) |
Technology Access in Racine
Computing Device Access in Racine
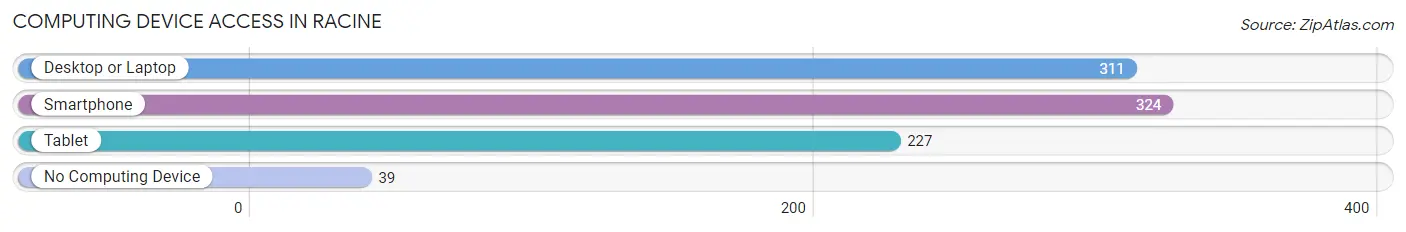
| Device Type | # Households | % Households |
| Desktop or Laptop | 311 | 71.8% |
| Smartphone | 324 | 74.8% |
| Tablet | 227 | 52.4% |
| No Computing Device | 39 | 9.0% |
| Total | 433 | 100.0% |
Internet Access in Racine
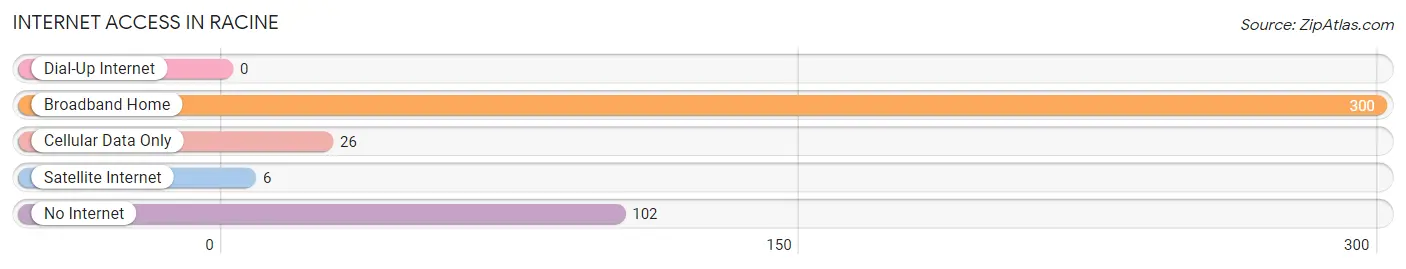
| Internet Type | # Households | % Households |
| Dial-Up Internet | 0 | 0.0% |
| Broadband Home | 300 | 69.3% |
| Cellular Data Only | 26 | 6.0% |
| Satellite Internet | 6 | 1.4% |
| No Internet | 102 | 23.6% |
| Total | 433 | 100.0% |
Racine Summary
Racine, Ohio is a small village located in Meigs County, Ohio. It is situated on the banks of the Ohio River, approximately 30 miles south of Athens. The village has a population of approximately 500 people and is part of the Point Pleasant Micropolitan Statistical Area.
History
Racine was founded in 1817 by a group of settlers from Pennsylvania. The village was named after the city of Racine, Wisconsin, which was named after the French word for “root”. The settlers were attracted to the area due to its fertile soil and abundant natural resources. The village was incorporated in 1837 and quickly became a thriving agricultural community.
In the late 19th century, Racine was a major stop on the Ohio and Erie Canal. The canal brought a great deal of commerce to the village, and it soon became a hub for trade and transportation. The village also became a popular destination for tourists, who were drawn to the area’s natural beauty.
In the early 20th century, Racine experienced a period of economic decline. The canal was abandoned in 1913, and the village’s population began to decline. However, the village was able to rebound in the mid-20th century, thanks to the development of the nearby oil and gas industry.
Geography
Racine is located in southeastern Ohio, approximately 30 miles south of Athens. The village is situated on the banks of the Ohio River, and is surrounded by rolling hills and lush forests. The village is located in the Appalachian Plateau region of Ohio, and is part of the Appalachian Mountains.
The climate in Racine is humid continental, with hot summers and cold winters. The average annual temperature is around 50 degrees Fahrenheit, and the average annual precipitation is around 40 inches.
Economy
Racine’s economy is largely based on agriculture and tourism. The village is home to several farms, which produce a variety of crops, including corn, soybeans, and wheat. The village is also home to several wineries, which produce a variety of wines.
Tourism is also an important part of the local economy. The village is home to several historic sites, including the Racine Lock and Dam, the Racine Covered Bridge, and the Racine Historic District. The village also hosts several annual festivals, including the Racine Music Festival and the Racine Art Festival.
Demographics
As of the 2010 census, the population of Racine was 498 people. The racial makeup of the village was 97.2% White, 0.2% African American, 0.2% Native American, 0.2% Asian, 0.2% from other races, and 1.8% from two or more races. Hispanic or Latino of any race were 0.6% of the population.
The median income for a household in Racine was $31,250, and the median income for a family was $37,500. The per capita income for the village was $15,945. About 11.2% of families and 14.2% of the population were below the poverty line, including 18.2% of those under age 18 and 8.3% of those age 65 or over.
Common Questions
What is Per Capita Income in Racine?
Per Capita income in Racine is $26,897.
What is the Median Family Income in Racine?
Median Family Income in Racine is $52,000.
What is the Median Household income in Racine?
Median Household Income in Racine is $50,703.
What is Income or Wage Gap in Racine?
Income or Wage Gap in Racine is 60.6%.
Women in Racine earn 39.4 cents for every dollar earned by a man.
What is Inequality or Gini Index in Racine?
Inequality or Gini Index in Racine is 0.43.
What is the Total Population of Racine?
Total Population of Racine is 1,061.
What is the Total Male Population of Racine?
Total Male Population of Racine is 488.
What is the Total Female Population of Racine?
Total Female Population of Racine is 573.
What is the Ratio of Males per 100 Females in Racine?
There are 85.17 Males per 100 Females in Racine.
What is the Ratio of Females per 100 Males in Racine?
There are 117.42 Females per 100 Males in Racine.
What is the Median Population Age in Racine?
Median Population Age in Racine is 40.4 Years.
What is the Average Family Size in Racine
Average Family Size in Racine is 3.4 People.
What is the Average Household Size in Racine
Average Household Size in Racine is 2.5 People.
How Large is the Labor Force in Racine?
There are 413 People in the Labor Forcein in Racine.
What is the Percentage of People in the Labor Force in Racine?
50.7% of People are in the Labor Force in Racine.
What is the Unemployment Rate in Racine?
Unemployment Rate in Racine is 1.2%.