Put In Bay, OH Map & Demographics
Put In Bay Map
Put In Bay Overview
$32,769
PER CAPITA INCOME
$88,333
AVG FAMILY INCOME
$58,750
AVG HOUSEHOLD INCOME
94.9%
WAGE / INCOME GAP [ % ]
5.1¢/ $1
WAGE / INCOME GAP [ $ ]
0.39
INEQUALITY / GINI INDEX
89
TOTAL POPULATION
28
MALE POPULATION
61
FEMALE POPULATION
45.90
MALES / 100 FEMALES
217.86
FEMALES / 100 MALES
41.1
MEDIAN AGE
2.7
AVG FAMILY SIZE
1.8
AVG HOUSEHOLD SIZE
46
LABOR FORCE [ PEOPLE ]
54.1%
PERCENT IN LABOR FORCE
6.5%
UNEMPLOYMENT RATE
Put In Bay Zip Codes
Put In Bay Area Codes
Income in Put In Bay
Income Overview in Put In Bay
Per Capita Income in Put In Bay is $32,769, while median incomes of families and households are $88,333 and $58,750 respectively.
| Characteristic | Number | Measure |
| Per Capita Income | 89 | $32,769 |
| Median Family Income | 14 | $88,333 |
| Mean Family Income | 14 | $114,979 |
| Median Household Income | 32 | $58,750 |
| Mean Household Income | 32 | $75,281 |
| Income Deficit | 14 | $0 |
| Wage / Income Gap (%) | 89 | 94.92% |
| Wage / Income Gap ($) | 89 | 5.08¢ per $1 |
| Gini / Inequality Index | 89 | 0.39 |
Earnings by Sex in Put In Bay
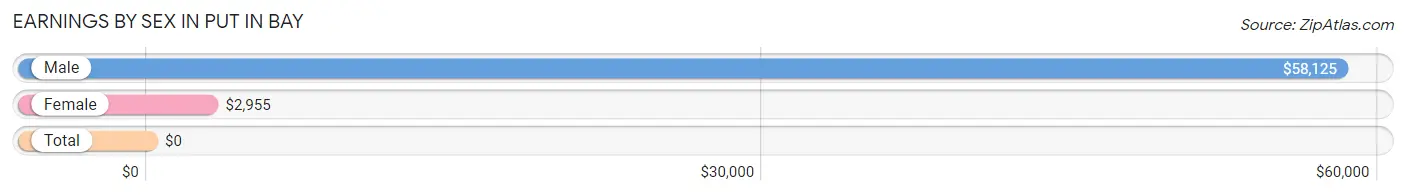
| Sex | Number | Average Earnings |
| Male | 21 (31.3%) | $58,125 |
| Female | 46 (68.7%) | $2,955 |
| Total | 67 (100.0%) | $0 |
Earnings by Sex by Income Bracket in Put In Bay
The most common earnings brackets in Put In Bay are $55,000 to $64,999 for men (6 | 28.6%) and $2,499 or less for women (21 | 45.7%).
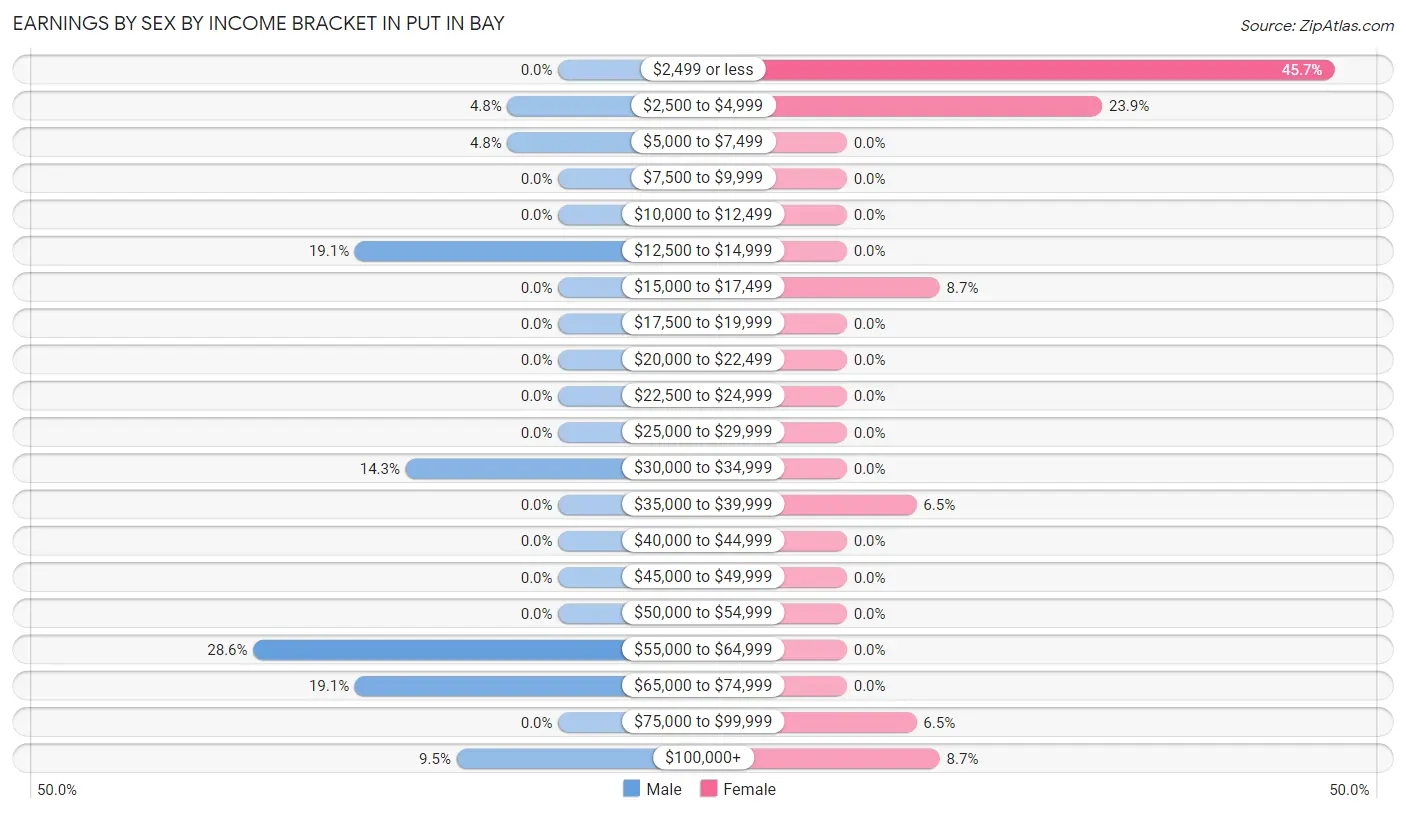
| Income | Male | Female |
| $2,499 or less | 0 (0.0%) | 21 (45.7%) |
| $2,500 to $4,999 | 1 (4.8%) | 11 (23.9%) |
| $5,000 to $7,499 | 1 (4.8%) | 0 (0.0%) |
| $7,500 to $9,999 | 0 (0.0%) | 0 (0.0%) |
| $10,000 to $12,499 | 0 (0.0%) | 0 (0.0%) |
| $12,500 to $14,999 | 4 (19.1%) | 0 (0.0%) |
| $15,000 to $17,499 | 0 (0.0%) | 4 (8.7%) |
| $17,500 to $19,999 | 0 (0.0%) | 0 (0.0%) |
| $20,000 to $22,499 | 0 (0.0%) | 0 (0.0%) |
| $22,500 to $24,999 | 0 (0.0%) | 0 (0.0%) |
| $25,000 to $29,999 | 0 (0.0%) | 0 (0.0%) |
| $30,000 to $34,999 | 3 (14.3%) | 0 (0.0%) |
| $35,000 to $39,999 | 0 (0.0%) | 3 (6.5%) |
| $40,000 to $44,999 | 0 (0.0%) | 0 (0.0%) |
| $45,000 to $49,999 | 0 (0.0%) | 0 (0.0%) |
| $50,000 to $54,999 | 0 (0.0%) | 0 (0.0%) |
| $55,000 to $64,999 | 6 (28.6%) | 0 (0.0%) |
| $65,000 to $74,999 | 4 (19.1%) | 0 (0.0%) |
| $75,000 to $99,999 | 0 (0.0%) | 3 (6.5%) |
| $100,000+ | 2 (9.5%) | 4 (8.7%) |
| Total | 21 (100.0%) | 46 (100.0%) |
Earnings by Sex by Educational Attainment in Put In Bay
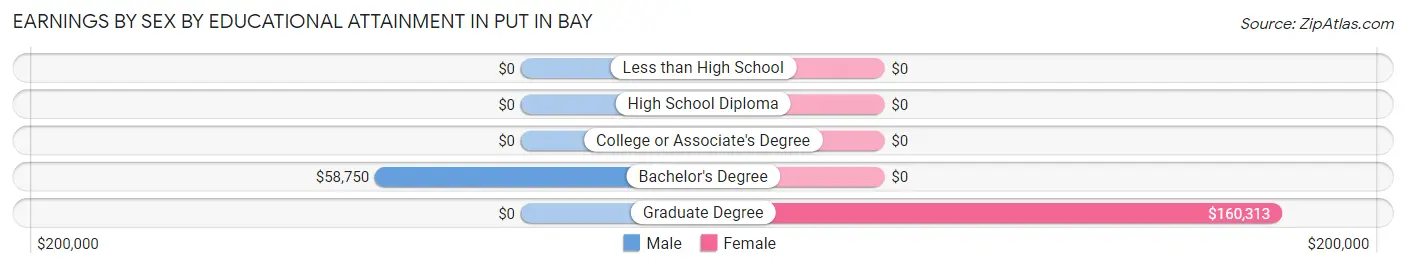
| Educational Attainment | Male Income | Female Income |
| Less than High School | - | - |
| High School Diploma | - | - |
| College or Associate's Degree | - | - |
| Bachelor's Degree | $58,750 | $0 |
| Graduate Degree | - | - |
| Total | $58,958 | $0 |
Family Income in Put In Bay
Family Income Brackets in Put In Bay
According to the Put In Bay family income data, there are 6 families falling into the $50,000 to $74,999 income range, which is the most common income bracket and makes up 42.9% of all families.
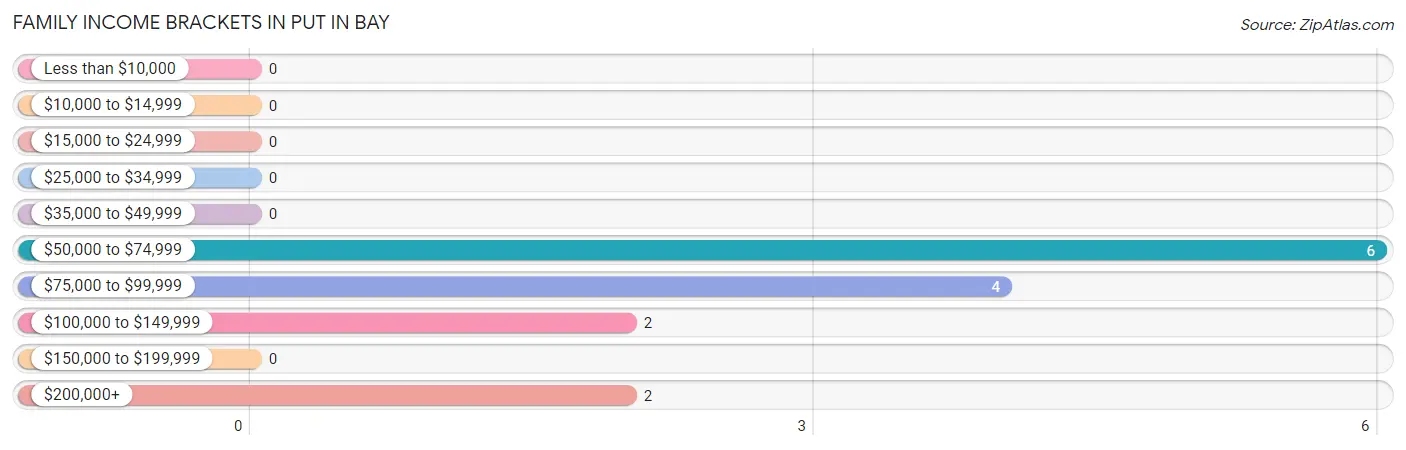
| Income Bracket | # Families | % Families |
| Less than $10,000 | 0 | 0.0% |
| $10,000 to $14,999 | 0 | 0.0% |
| $15,000 to $24,999 | 0 | 0.0% |
| $25,000 to $34,999 | 0 | 0.0% |
| $35,000 to $49,999 | 0 | 0.0% |
| $50,000 to $74,999 | 6 | 42.9% |
| $75,000 to $99,999 | 4 | 28.6% |
| $100,000 to $149,999 | 2 | 14.3% |
| $150,000 to $199,999 | 0 | 0.0% |
| $200,000+ | 2 | 14.3% |
Family Income by Famaliy Size in Put In Bay
2-person families (11 | 78.6%) account for the highest median family income in Put In Bay with $71,875 per family, while 2-person families (11 | 78.6%) have the highest median income of $35,938 per family member.
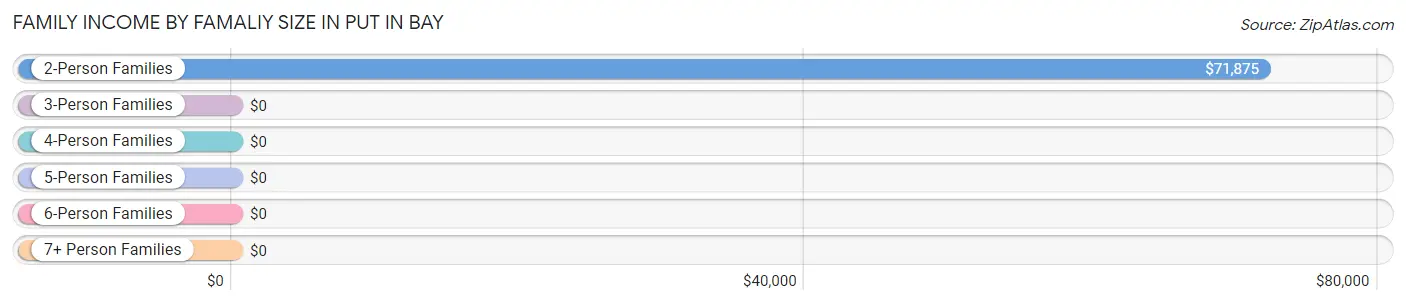
| Income Bracket | # Families | Median Income |
| 2-Person Families | 11 (78.6%) | $71,875 |
| 3-Person Families | 3 (21.4%) | $0 |
| 4-Person Families | 0 (0.0%) | $0 |
| 5-Person Families | 0 (0.0%) | $0 |
| 6-Person Families | 0 (0.0%) | $0 |
| 7+ Person Families | 0 (0.0%) | $0 |
| Total | 14 (100.0%) | $88,333 |
Family Income by Number of Earners in Put In Bay
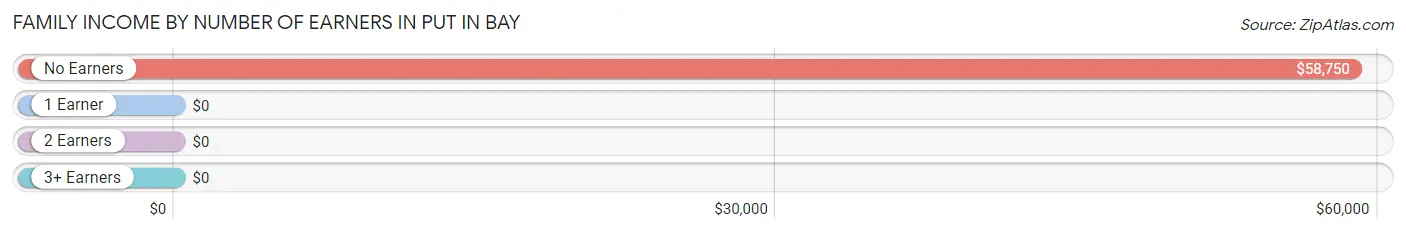
| Number of Earners | # Families | Median Income |
| No Earners | 6 (42.9%) | $58,750 |
| 1 Earner | 2 (14.3%) | $0 |
| 2 Earners | 6 (42.9%) | $0 |
| 3+ Earners | 0 (0.0%) | $0 |
| Total | 14 (100.0%) | $88,333 |
Household Income in Put In Bay
Household Income Brackets in Put In Bay
With 11 households falling in the category, the $50,000 to $74,999 income range is the most frequent in Put In Bay, accounting for 34.4% of all households.
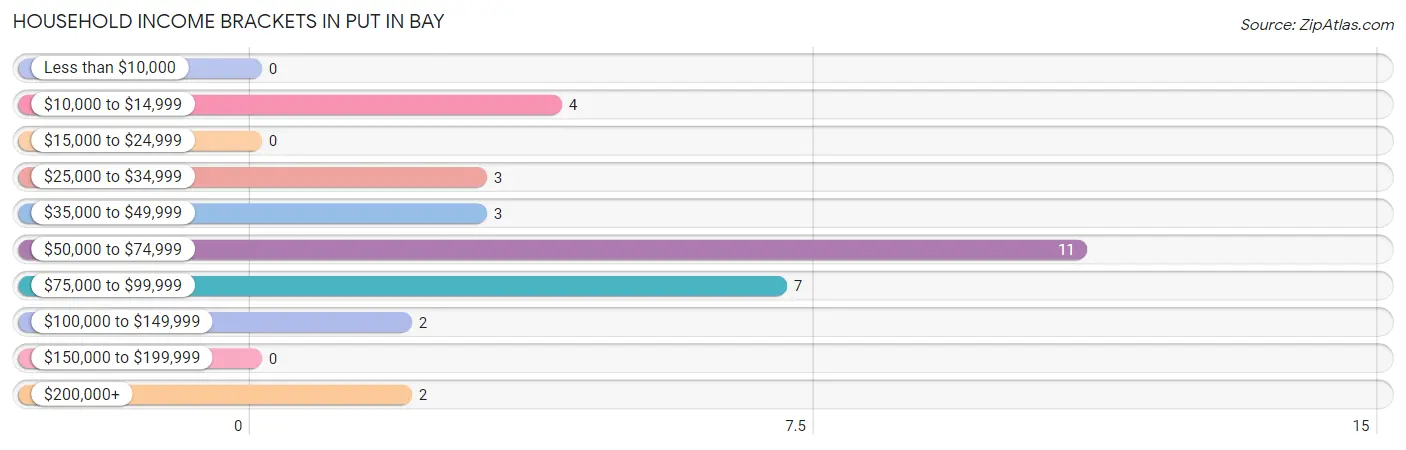
| Income Bracket | # Households | % Households |
| Less than $10,000 | 0 | 0.0% |
| $10,000 to $14,999 | 4 | 12.5% |
| $15,000 to $24,999 | 0 | 0.0% |
| $25,000 to $34,999 | 3 | 9.4% |
| $35,000 to $49,999 | 3 | 9.4% |
| $50,000 to $74,999 | 11 | 34.4% |
| $75,000 to $99,999 | 7 | 21.9% |
| $100,000 to $149,999 | 2 | 6.3% |
| $150,000 to $199,999 | 0 | 0.0% |
| $200,000+ | 2 | 6.3% |
Household Income by Householder Age in Put In Bay
The median household income in Put In Bay is $58,750, with the highest median household income of $59,375 found in the 65+ years age bracket for the primary householder. A total of 13 households (40.6%) fall into this category. Meanwhile, the 15 to 24 years age bracket for the primary householder has the lowest median household income of $0, with 4 households (12.5%) in this group.
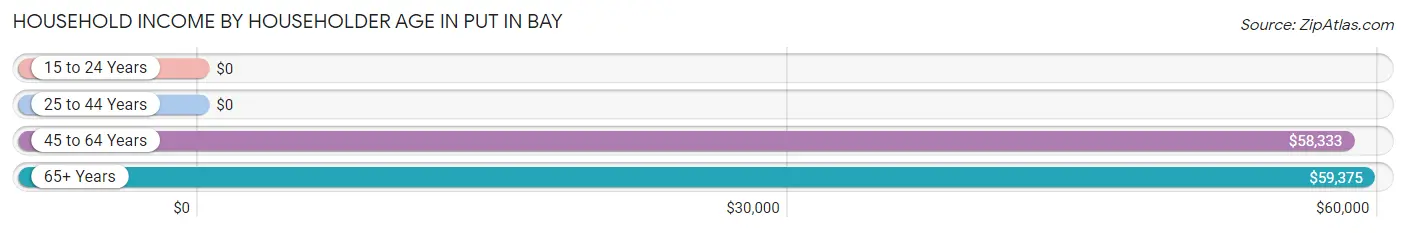
| Income Bracket | # Households | Median Income |
| 15 to 24 Years | 4 (12.5%) | $0 |
| 25 to 44 Years | 5 (15.6%) | $0 |
| 45 to 64 Years | 10 (31.2%) | $58,333 |
| 65+ Years | 13 (40.6%) | $59,375 |
| Total | 32 (100.0%) | $58,750 |
Poverty in Put In Bay
Income Below Poverty by Sex and Age in Put In Bay
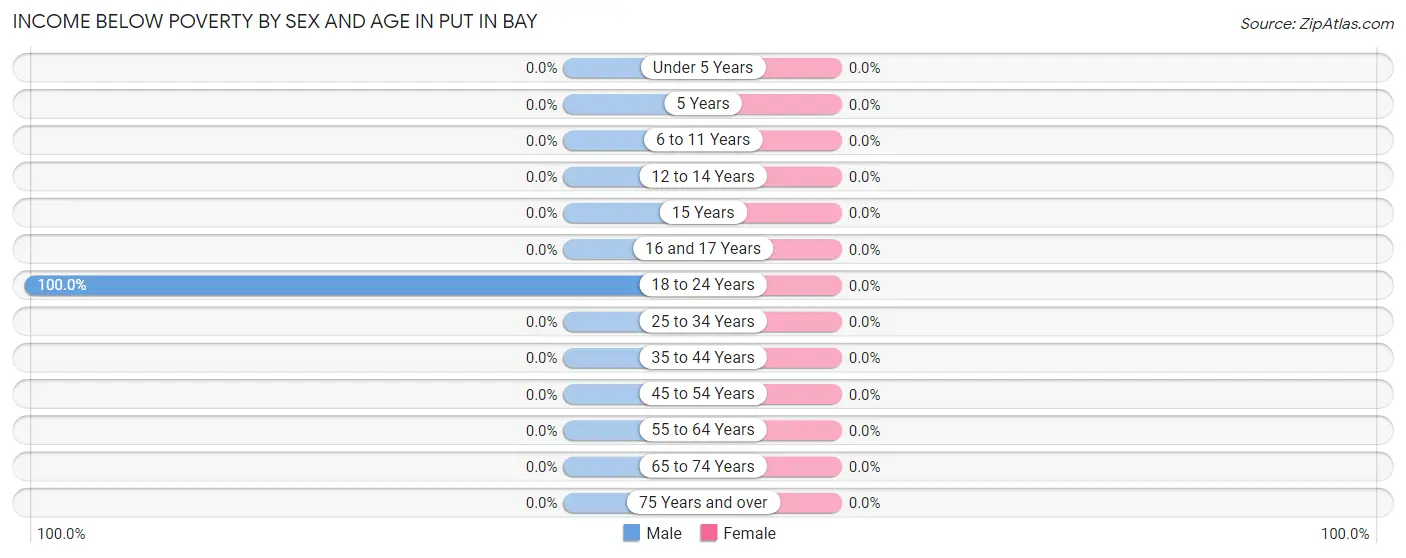
| Age Bracket | Male | Female |
| Under 5 Years | 0 (0.0%) | 0 (0.0%) |
| 5 Years | 0 (0.0%) | 0 (0.0%) |
| 6 to 11 Years | 0 (0.0%) | 0 (0.0%) |
| 12 to 14 Years | 0 (0.0%) | 0 (0.0%) |
| 15 Years | 0 (0.0%) | 0 (0.0%) |
| 16 and 17 Years | 0 (0.0%) | 0 (0.0%) |
| 18 to 24 Years | 4 (100.0%) | 0 (0.0%) |
| 25 to 34 Years | 0 (0.0%) | 0 (0.0%) |
| 35 to 44 Years | 0 (0.0%) | 0 (0.0%) |
| 45 to 54 Years | 0 (0.0%) | 0 (0.0%) |
| 55 to 64 Years | 0 (0.0%) | 0 (0.0%) |
| 65 to 74 Years | 0 (0.0%) | 0 (0.0%) |
| 75 Years and over | 0 (0.0%) | 0 (0.0%) |
| Total | 4 (14.3%) | 0 (0.0%) |
Income Above Poverty by Sex and Age in Put In Bay
According to the poverty statistics in Put In Bay, males aged 35 to 44 years and females aged under 5 years are the age groups that are most secure financially, with 100.0% of males and 100.0% of females in these age groups living above the poverty line.
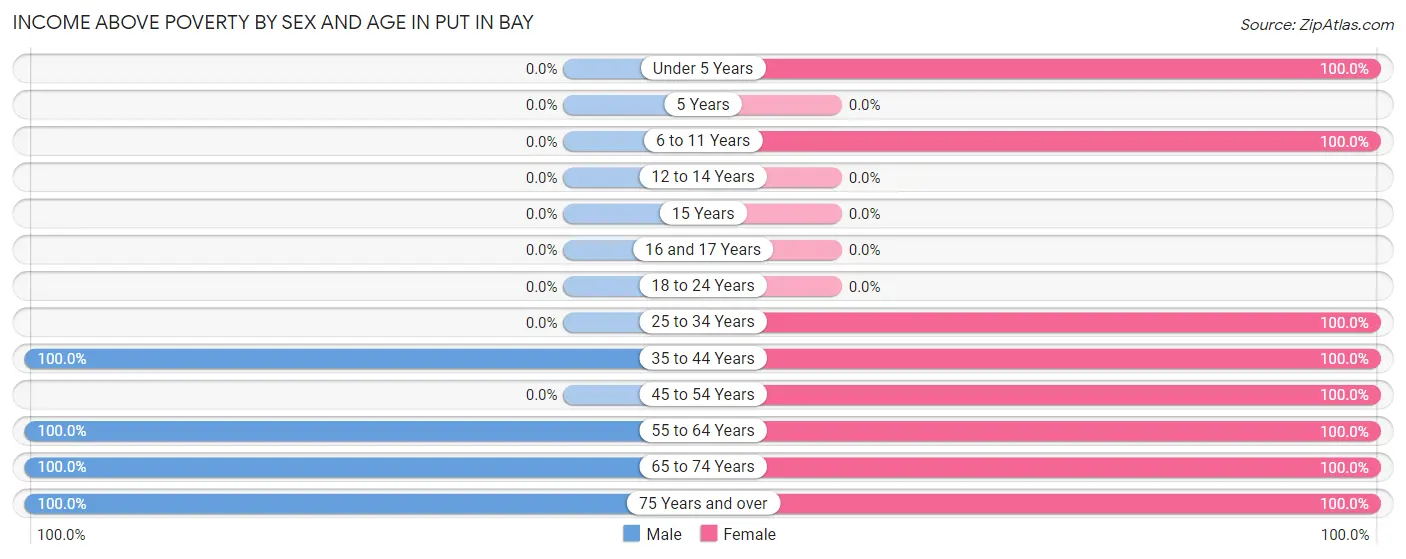
| Age Bracket | Male | Female |
| Under 5 Years | 0 (0.0%) | 3 (100.0%) |
| 5 Years | 0 (0.0%) | 0 (0.0%) |
| 6 to 11 Years | 0 (0.0%) | 1 (100.0%) |
| 12 to 14 Years | 0 (0.0%) | 0 (0.0%) |
| 15 Years | 0 (0.0%) | 0 (0.0%) |
| 16 and 17 Years | 0 (0.0%) | 0 (0.0%) |
| 18 to 24 Years | 0 (0.0%) | 0 (0.0%) |
| 25 to 34 Years | 0 (0.0%) | 4 (100.0%) |
| 35 to 44 Years | 5 (100.0%) | 3 (100.0%) |
| 45 to 54 Years | 0 (0.0%) | 4 (100.0%) |
| 55 to 64 Years | 7 (100.0%) | 4 (100.0%) |
| 65 to 74 Years | 4 (100.0%) | 3 (100.0%) |
| 75 Years and over | 8 (100.0%) | 7 (100.0%) |
| Total | 24 (85.7%) | 29 (100.0%) |
Income Below Poverty Among Married-Couple Families in Put In Bay
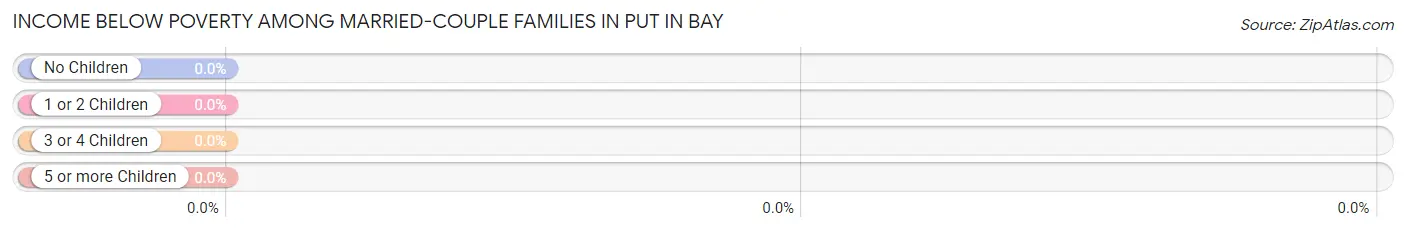
| Children | Above Poverty | Below Poverty |
| No Children | 11 (100.0%) | 0 (0.0%) |
| 1 or 2 Children | 2 (100.0%) | 0 (0.0%) |
| 3 or 4 Children | 0 (0.0%) | 0 (0.0%) |
| 5 or more Children | 0 (0.0%) | 0 (0.0%) |
| Total | 13 (100.0%) | 0 (0.0%) |
Income Below Poverty Among Single-Parent Households in Put In Bay
| Children | Single Father | Single Mother |
| No Children | 0 (0.0%) | 0 (0.0%) |
| 1 or 2 Children | 0 (0.0%) | 0 (0.0%) |
| 3 or 4 Children | 0 (0.0%) | 0 (0.0%) |
| 5 or more Children | 0 (0.0%) | 0 (0.0%) |
| Total | 0 (0.0%) | 0 (0.0%) |
Income Below Poverty Among Married-Couple vs Single-Parent Households in Put In Bay
| Children | Married-Couple Families | Single-Parent Households |
| No Children | 0 (0.0%) | 0 (0.0%) |
| 1 or 2 Children | 0 (0.0%) | 0 (0.0%) |
| 3 or 4 Children | 0 (0.0%) | 0 (0.0%) |
| 5 or more Children | 0 (0.0%) | 0 (0.0%) |
| Total | 0 (0.0%) | 0 (0.0%) |
Race in Put In Bay
The most populous races in Put In Bay are White / Caucasian (78 | 87.6%), and Asian (11 | 12.4%).
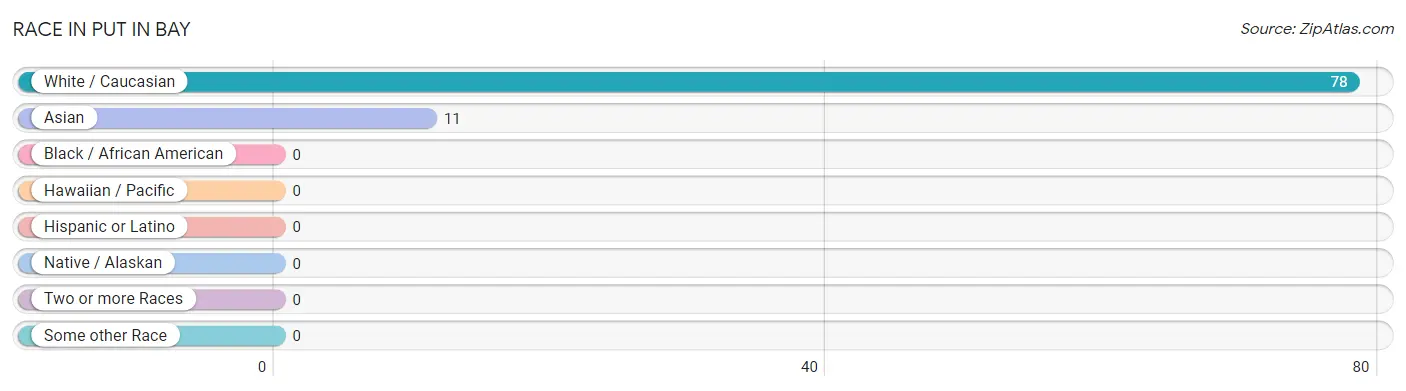
| Race | # Population | % Population |
| Asian | 11 | 12.4% |
| Black / African American | 0 | 0.0% |
| Hawaiian / Pacific | 0 | 0.0% |
| Hispanic or Latino | 0 | 0.0% |
| Native / Alaskan | 0 | 0.0% |
| White / Caucasian | 78 | 87.6% |
| Two or more Races | 0 | 0.0% |
| Some other Race | 0 | 0.0% |
| Total | 89 | 100.0% |
Ancestry in Put In Bay
The most populous ancestries reported in Put In Bay are German (30 | 33.7%), English (16 | 18.0%), Irish (16 | 18.0%), Hungarian (10 | 11.2%), and Indian (Asian) (10 | 11.2%), together accounting for 92.1% of all Put In Bay residents.
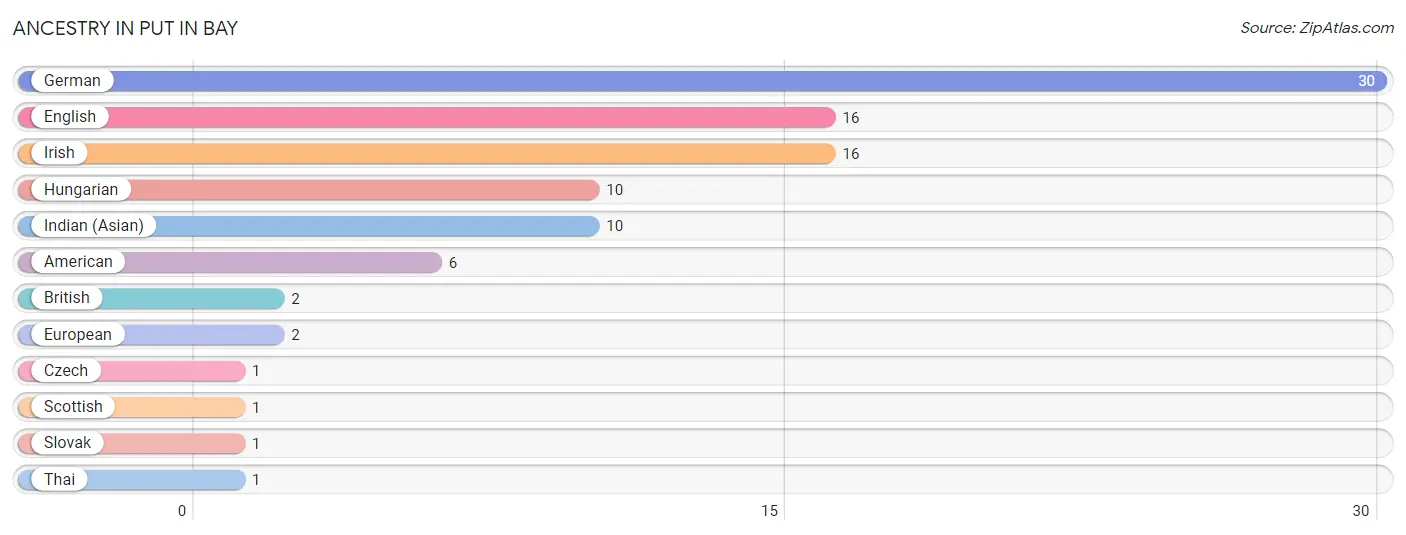
| Ancestry | # Population | % Population |
| American | 6 | 6.7% |
| British | 2 | 2.2% |
| Czech | 1 | 1.1% |
| English | 16 | 18.0% |
| European | 2 | 2.2% |
| German | 30 | 33.7% |
| Hungarian | 10 | 11.2% |
| Indian (Asian) | 10 | 11.2% |
| Irish | 16 | 18.0% |
| Scottish | 1 | 1.1% |
| Slovak | 1 | 1.1% |
| Thai | 1 | 1.1% | View All 12 Rows |
Immigrants in Put In Bay
The most numerous immigrant groups reported in Put In Bay came from Asia (10 | 11.2%), China (10 | 11.2%), Eastern Asia (10 | 11.2%), Europe (1 | 1.1%), and Germany (1 | 1.1%), together accounting for 36.0% of all Put In Bay residents.
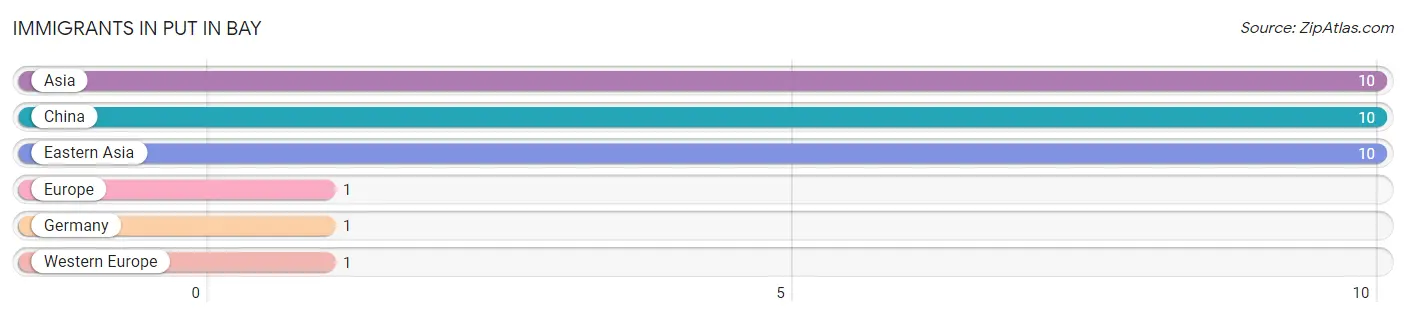
| Immigration Origin | # Population | % Population |
| Asia | 10 | 11.2% |
| China | 10 | 11.2% |
| Eastern Asia | 10 | 11.2% |
| Europe | 1 | 1.1% |
| Germany | 1 | 1.1% |
| Western Europe | 1 | 1.1% | View All 6 Rows |
Sex and Age in Put In Bay
Sex and Age in Put In Bay
The most populous age groups in Put In Bay are 55 to 59 Years (7 | 25.0%) for men and 15 to 19 Years (32 | 52.5%) for women.
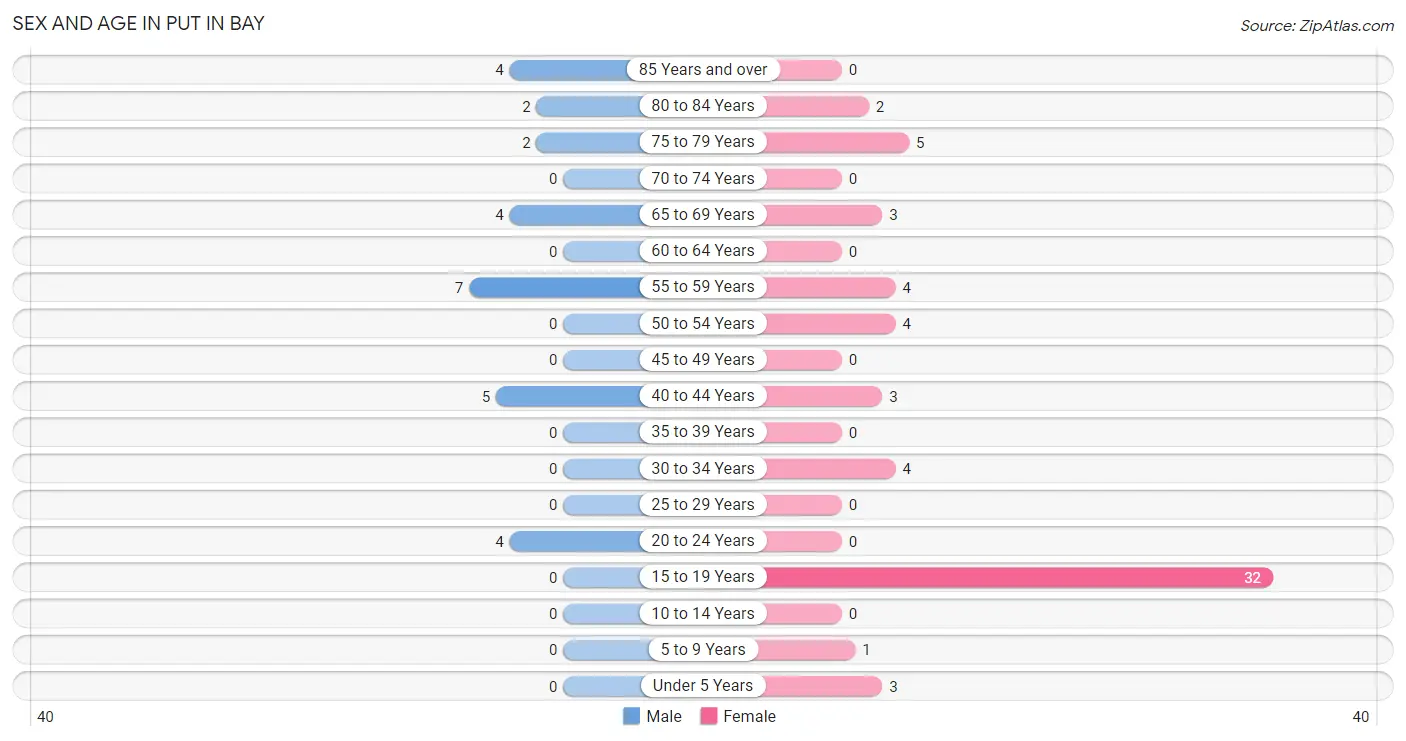
| Age Bracket | Male | Female |
| Under 5 Years | 0 (0.0%) | 3 (4.9%) |
| 5 to 9 Years | 0 (0.0%) | 1 (1.6%) |
| 10 to 14 Years | 0 (0.0%) | 0 (0.0%) |
| 15 to 19 Years | 0 (0.0%) | 32 (52.5%) |
| 20 to 24 Years | 4 (14.3%) | 0 (0.0%) |
| 25 to 29 Years | 0 (0.0%) | 0 (0.0%) |
| 30 to 34 Years | 0 (0.0%) | 4 (6.6%) |
| 35 to 39 Years | 0 (0.0%) | 0 (0.0%) |
| 40 to 44 Years | 5 (17.9%) | 3 (4.9%) |
| 45 to 49 Years | 0 (0.0%) | 0 (0.0%) |
| 50 to 54 Years | 0 (0.0%) | 4 (6.6%) |
| 55 to 59 Years | 7 (25.0%) | 4 (6.6%) |
| 60 to 64 Years | 0 (0.0%) | 0 (0.0%) |
| 65 to 69 Years | 4 (14.3%) | 3 (4.9%) |
| 70 to 74 Years | 0 (0.0%) | 0 (0.0%) |
| 75 to 79 Years | 2 (7.1%) | 5 (8.2%) |
| 80 to 84 Years | 2 (7.1%) | 2 (3.3%) |
| 85 Years and over | 4 (14.3%) | 0 (0.0%) |
| Total | 28 (100.0%) | 61 (100.0%) |
Families and Households in Put In Bay
Median Family Size in Put In Bay
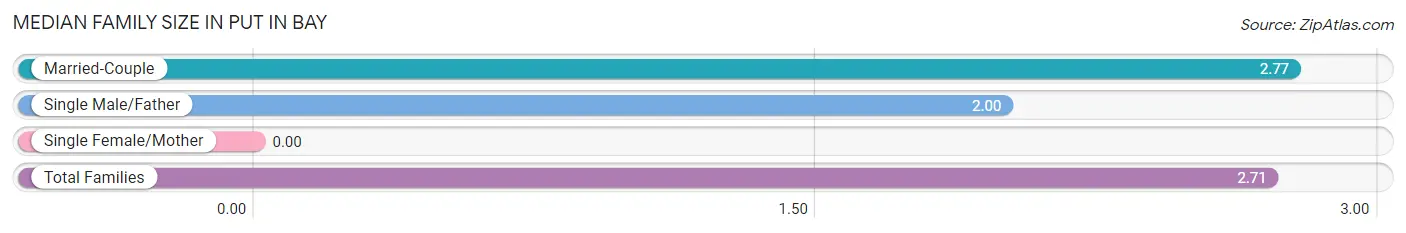
| Family Type | # Families | Family Size |
| Married-Couple | 13 (92.9%) | 2.77 |
| Single Male/Father | 1 (7.1%) | 2.00 |
| Single Female/Mother | 0 (0.0%) | - |
| Total Families | 14 (100.0%) | 2.71 |
Median Household Size in Put In Bay
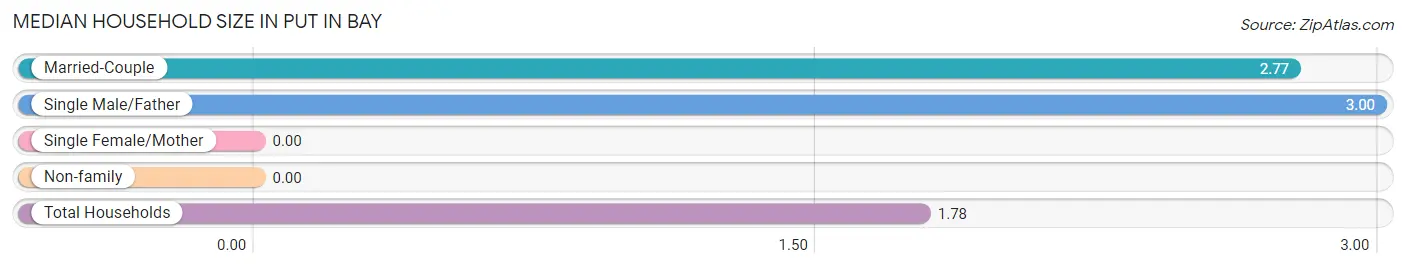
| Household Type | # Households | Household Size |
| Married-Couple | 13 (40.6%) | 2.77 |
| Single Male/Father | 1 (3.1%) | 3.00 |
| Single Female/Mother | 0 (0.0%) | - |
| Non-family | 18 (56.2%) | - |
| Total Households | 32 (100.0%) | 1.78 |
Household Size by Marriage Status in Put In Bay
Out of a total of 32 households in Put In Bay, 14 (43.8%) are family households, while 18 (56.2%) are nonfamily households. The most numerous type of family households are 2-person households, comprising 10, and the most common type of nonfamily households are 1-person households, comprising 18.
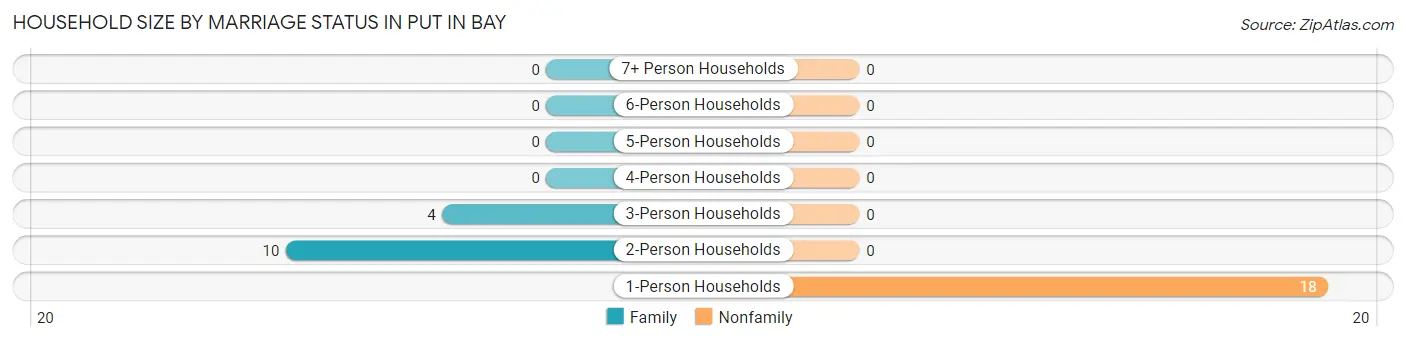
| Household Size | Family Households | Nonfamily Households |
| 1-Person Households | - | 18 (56.2%) |
| 2-Person Households | 10 (31.2%) | 0 (0.0%) |
| 3-Person Households | 4 (12.5%) | 0 (0.0%) |
| 4-Person Households | 0 (0.0%) | 0 (0.0%) |
| 5-Person Households | 0 (0.0%) | 0 (0.0%) |
| 6-Person Households | 0 (0.0%) | 0 (0.0%) |
| 7+ Person Households | 0 (0.0%) | 0 (0.0%) |
| Total | 14 (43.8%) | 18 (56.2%) |
Female Fertility in Put In Bay
Fertility by Age in Put In Bay
| Age Bracket | Women with Births | Births / 1,000 Women |
| 15 to 19 years | 0 (0.0%) | 0.0 |
| 20 to 34 years | 0 (0.0%) | 0.0 |
| 35 to 50 years | 0 (0.0%) | 0.0 |
| Total | 0 (0.0%) | 0.0 |
Fertility by Age by Marriage Status in Put In Bay
| Age Bracket | Married | Unmarried |
| 15 to 19 years | 0 (0.0%) | 0 (0.0%) |
| 20 to 34 years | 0 (0.0%) | 0 (0.0%) |
| 35 to 50 years | 0 (0.0%) | 0 (0.0%) |
| Total | 0 (0.0%) | 0 (0.0%) |
Fertility by Education in Put In Bay
| Educational Attainment | Women with Births | Births / 1,000 Women |
| Less than High School | 0 (0.0%) | 0.0 |
| High School Diploma | 0 (0.0%) | 0.0 |
| College or Associate's Degree | 0 (0.0%) | 0.0 |
| Bachelor's Degree | 0 (0.0%) | 0.0 |
| Graduate Degree | 0 (0.0%) | 0.0 |
| Total | 0 (0.0%) | 0.0 |
Fertility by Education by Marriage Status in Put In Bay
| Educational Attainment | Married | Unmarried |
| Less than High School | 0 (0.0%) | 0 (0.0%) |
| High School Diploma | 0 (0.0%) | 0 (0.0%) |
| College or Associate's Degree | 0 (0.0%) | 0 (0.0%) |
| Bachelor's Degree | 0 (0.0%) | 0 (0.0%) |
| Graduate Degree | 0 (0.0%) | 0 (0.0%) |
| Total | 0 (0.0%) | 0 (0.0%) |
Employment Characteristics in Put In Bay
Employment by Class of Employer in Put In Bay
Among the 32 employed individuals in Put In Bay, private company employees (14 | 43.8%), not-for-profit organizations (6 | 18.8%), and local government employees (5 | 15.6%) make up the most common classes of employment.
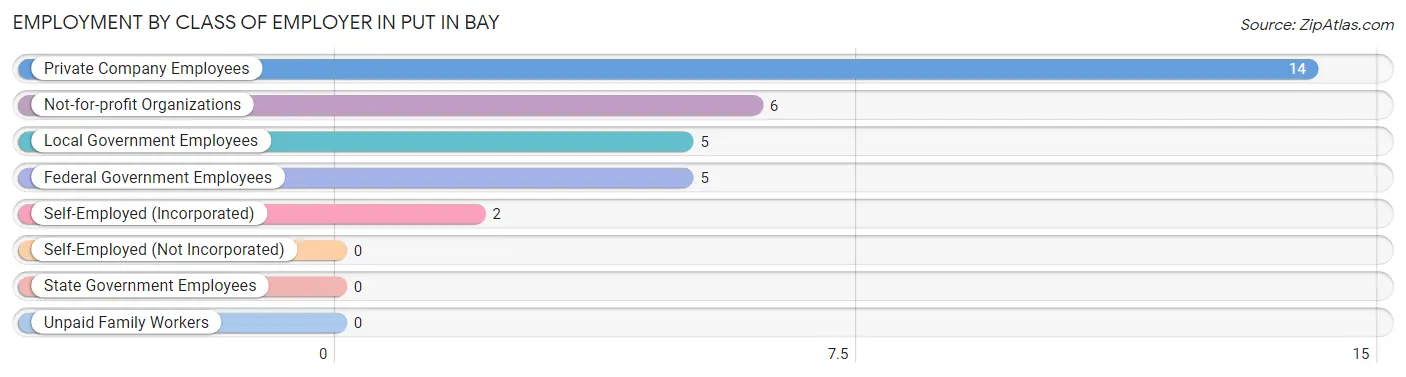
| Employer Class | # Employees | % Employees |
| Private Company Employees | 14 | 43.8% |
| Self-Employed (Incorporated) | 2 | 6.2% |
| Self-Employed (Not Incorporated) | 0 | 0.0% |
| Not-for-profit Organizations | 6 | 18.8% |
| Local Government Employees | 5 | 15.6% |
| State Government Employees | 0 | 0.0% |
| Federal Government Employees | 5 | 15.6% |
| Unpaid Family Workers | 0 | 0.0% |
| Total | 32 | 100.0% |
Employment Status by Age in Put In Bay
According to the labor force statistics for Put In Bay, out of the total population over 16 years of age (85), 54.1% or 46 individuals are in the labor force, with 6.5% or 3 of them unemployed. The age group with the highest labor force participation rate is 20 to 24 years, with 100.0% or 4 individuals in the labor force. Within the labor force, the 35 to 44 years age range has the highest percentage of unemployed individuals, with 37.5% or 3 of them being unemployed.
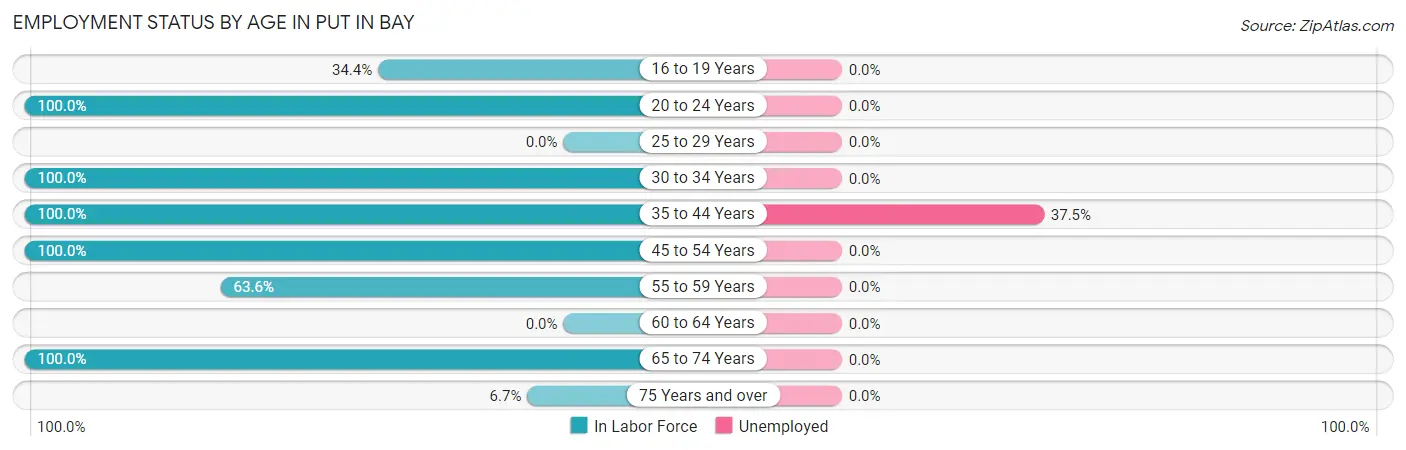
| Age Bracket | In Labor Force | Unemployed |
| 16 to 19 Years | 11 (34.4%) | 0 (0.0%) |
| 20 to 24 Years | 4 (100.0%) | 0 (0.0%) |
| 25 to 29 Years | 0 (0.0%) | 0 (0.0%) |
| 30 to 34 Years | 4 (100.0%) | 0 (0.0%) |
| 35 to 44 Years | 8 (100.0%) | 3 (37.5%) |
| 45 to 54 Years | 4 (100.0%) | 0 (0.0%) |
| 55 to 59 Years | 7 (63.6%) | 0 (0.0%) |
| 60 to 64 Years | 0 (0.0%) | 0 (0.0%) |
| 65 to 74 Years | 7 (100.0%) | 0 (0.0%) |
| 75 Years and over | 1 (6.7%) | 0 (0.0%) |
| Total | 46 (54.1%) | 3 (6.5%) |
Employment Status by Educational Attainment in Put In Bay
According to labor force statistics for Put In Bay, 85.2% of individuals (23) out of the total population between 25 and 64 years of age (27) are in the labor force, with 13.0% or 3 of them being unemployed. The group with the highest labor force participation rate are those with the educational attainment of high school diploma, with 100.0% or 5 individuals in the labor force. Within the labor force, individuals with college / associate degree education have the highest percentage of unemployment, with 50.0% or 3 of them being unemployed.
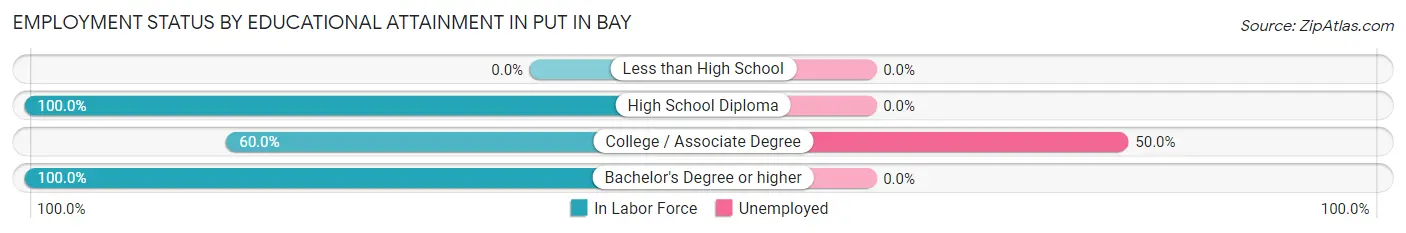
| Educational Attainment | In Labor Force | Unemployed |
| Less than High School | 0 (0.0%) | 0 (0.0%) |
| High School Diploma | 5 (100.0%) | 0 (0.0%) |
| College / Associate Degree | 6 (60.0%) | 5 (50.0%) |
| Bachelor's Degree or higher | 12 (100.0%) | 0 (0.0%) |
| Total | 23 (85.2%) | 4 (13.0%) |
Employment Occupations by Sex in Put In Bay
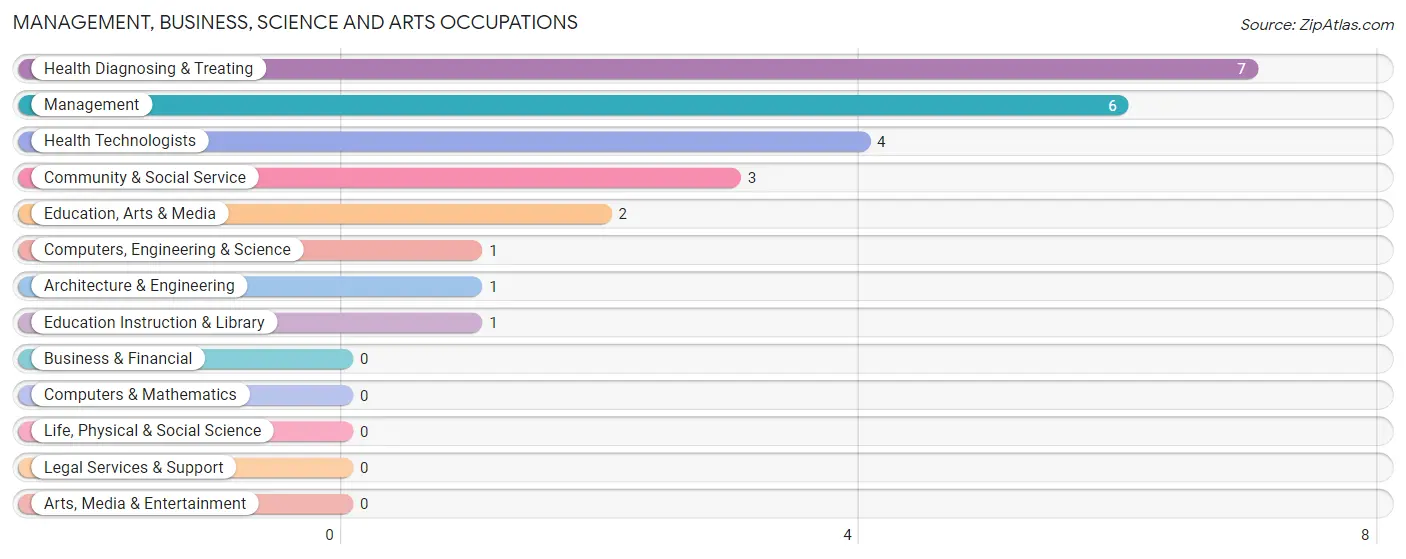
Management, Business, Science and Arts Occupations
The most common Management, Business, Science and Arts occupations in Put In Bay are Health Diagnosing & Treating (7 | 16.3%), Management (6 | 14.0%), Health Technologists (4 | 9.3%), Community & Social Service (3 | 7.0%), and Education, Arts & Media (2 | 4.6%).
Management, Business, Science and Arts Occupations by Sex
Within the Management, Business, Science and Arts occupations in Put In Bay, the most male-oriented occupations are Computers, Engineering & Science (100.0%), Architecture & Engineering (100.0%), and Management (50.0%), while the most female-oriented occupations are Community & Social Service (100.0%), Education, Arts & Media (100.0%), and Education Instruction & Library (100.0%).
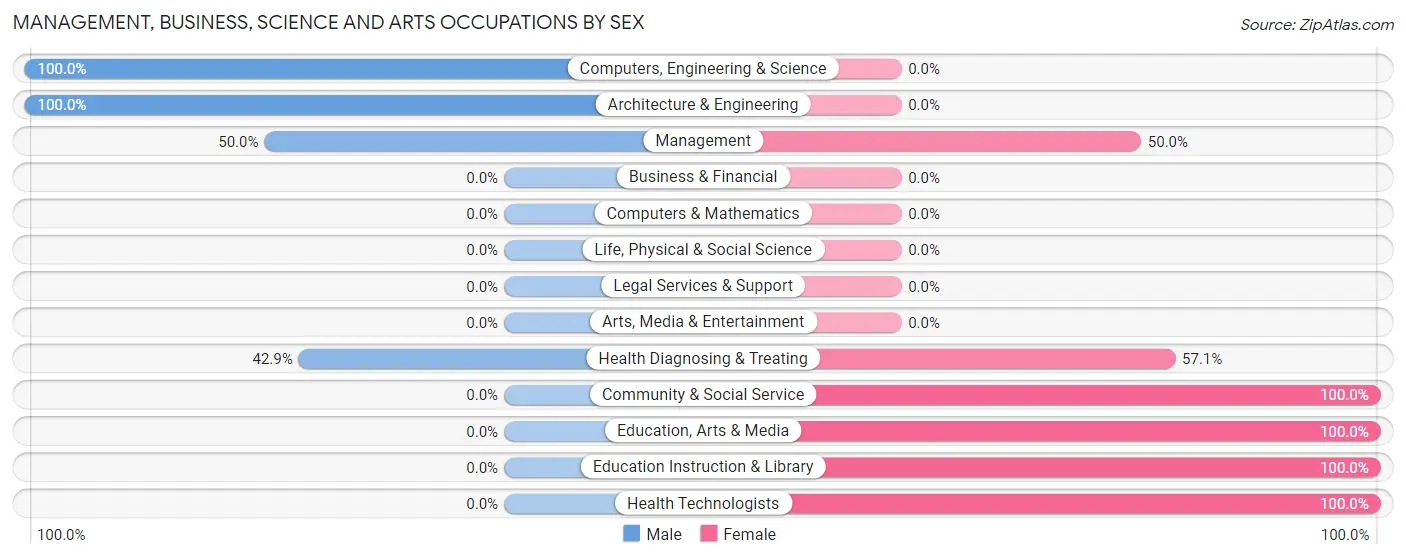
| Occupation | Male | Female |
| Management | 3 (50.0%) | 3 (50.0%) |
| Business & Financial | 0 (0.0%) | 0 (0.0%) |
| Computers, Engineering & Science | 1 (100.0%) | 0 (0.0%) |
| Computers & Mathematics | 0 (0.0%) | 0 (0.0%) |
| Architecture & Engineering | 1 (100.0%) | 0 (0.0%) |
| Life, Physical & Social Science | 0 (0.0%) | 0 (0.0%) |
| Community & Social Service | 0 (0.0%) | 3 (100.0%) |
| Education, Arts & Media | 0 (0.0%) | 2 (100.0%) |
| Legal Services & Support | 0 (0.0%) | 0 (0.0%) |
| Education Instruction & Library | 0 (0.0%) | 1 (100.0%) |
| Arts, Media & Entertainment | 0 (0.0%) | 0 (0.0%) |
| Health Diagnosing & Treating | 3 (42.9%) | 4 (57.1%) |
| Health Technologists | 0 (0.0%) | 4 (100.0%) |
| Total (Category) | 7 (41.2%) | 10 (58.8%) |
| Total (Overall) | 21 (48.8%) | 22 (51.2%) |
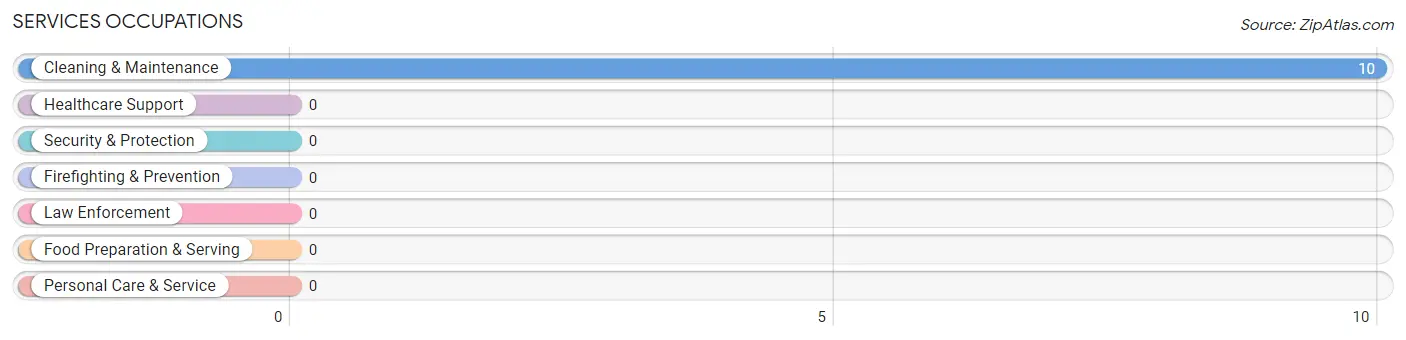
Services Occupations
The most common Services occupations in Put In Bay are , and Cleaning & Maintenance (10 | 23.3%).
Services Occupations by Sex
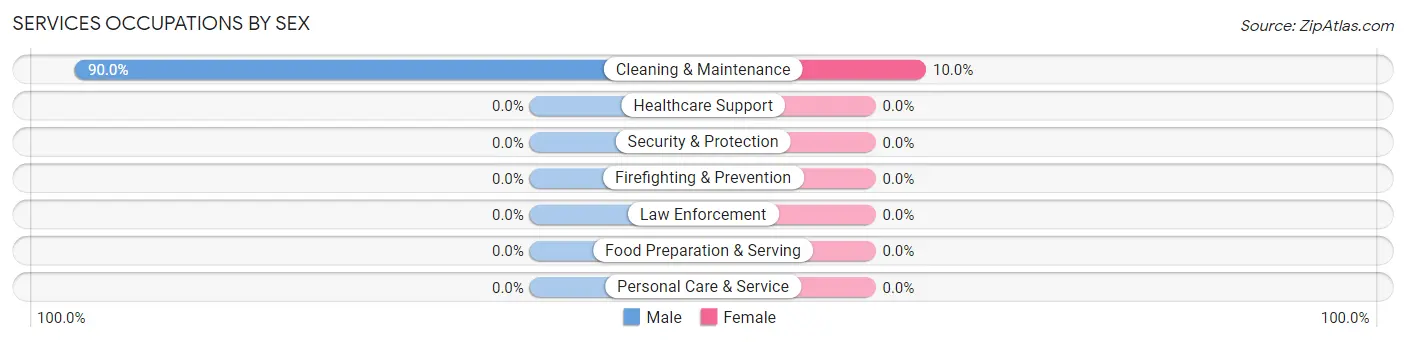
| Occupation | Male | Female |
| Healthcare Support | 0 (0.0%) | 0 (0.0%) |
| Security & Protection | 0 (0.0%) | 0 (0.0%) |
| Firefighting & Prevention | 0 (0.0%) | 0 (0.0%) |
| Law Enforcement | 0 (0.0%) | 0 (0.0%) |
| Food Preparation & Serving | 0 (0.0%) | 0 (0.0%) |
| Cleaning & Maintenance | 9 (90.0%) | 1 (10.0%) |
| Personal Care & Service | 0 (0.0%) | 0 (0.0%) |
| Total (Category) | 9 (90.0%) | 1 (10.0%) |
| Total (Overall) | 21 (48.8%) | 22 (51.2%) |
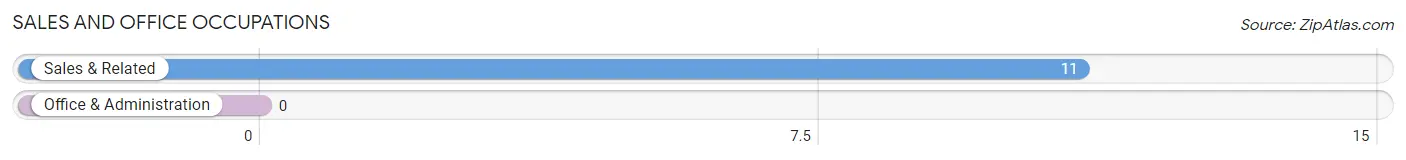
Sales and Office Occupations
The most common Sales and Office occupations in Put In Bay are , and Sales & Related (11 | 25.6%).
Sales and Office Occupations by Sex
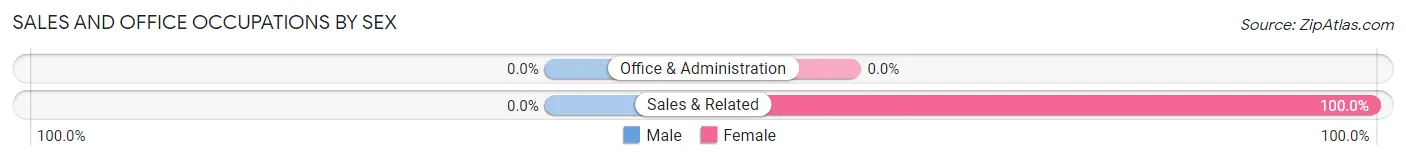
| Occupation | Male | Female |
| Sales & Related | 0 (0.0%) | 11 (100.0%) |
| Office & Administration | 0 (0.0%) | 0 (0.0%) |
| Total (Category) | 0 (0.0%) | 11 (100.0%) |
| Total (Overall) | 21 (48.8%) | 22 (51.2%) |
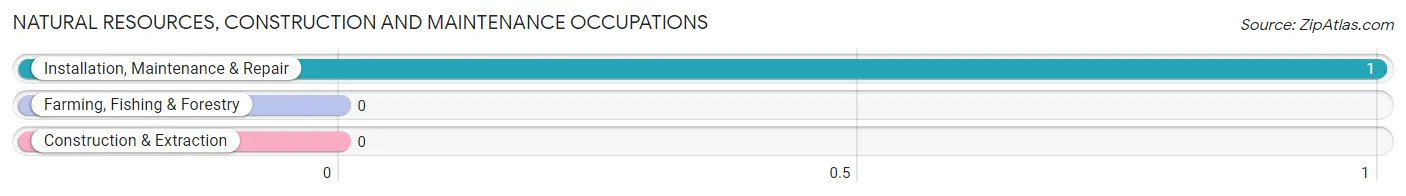
Natural Resources, Construction and Maintenance Occupations
The most common Natural Resources, Construction and Maintenance occupations in Put In Bay are , and Installation, Maintenance & Repair (1 | 2.3%).
Natural Resources, Construction and Maintenance Occupations by Sex
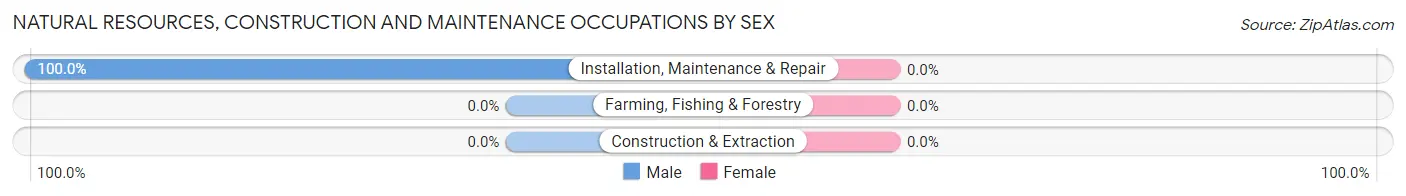
| Occupation | Male | Female |
| Farming, Fishing & Forestry | 0 (0.0%) | 0 (0.0%) |
| Construction & Extraction | 0 (0.0%) | 0 (0.0%) |
| Installation, Maintenance & Repair | 1 (100.0%) | 0 (0.0%) |
| Total (Category) | 1 (100.0%) | 0 (0.0%) |
| Total (Overall) | 21 (48.8%) | 22 (51.2%) |
Production, Transportation and Moving Occupations
The most common Production, Transportation and Moving occupations in Put In Bay are , and Transportation (4 | 9.3%).
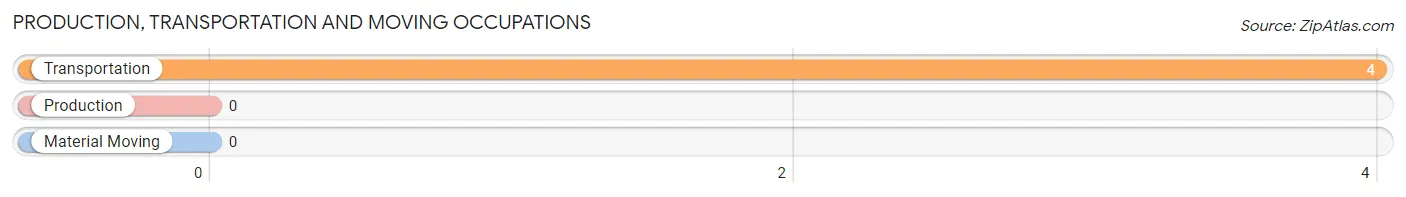
Production, Transportation and Moving Occupations by Sex
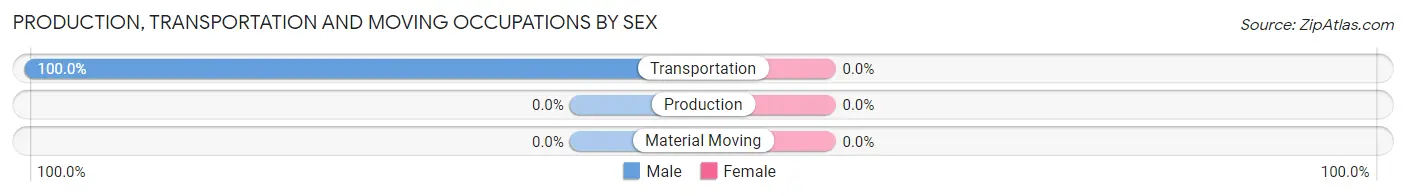
| Occupation | Male | Female |
| Production | 0 (0.0%) | 0 (0.0%) |
| Transportation | 4 (100.0%) | 0 (0.0%) |
| Material Moving | 0 (0.0%) | 0 (0.0%) |
| Total (Category) | 4 (100.0%) | 0 (0.0%) |
| Total (Overall) | 21 (48.8%) | 22 (51.2%) |
Employment Industries by Sex in Put In Bay
Employment Industries in Put In Bay
The major employment industries in Put In Bay include Accommodation & Food Services (23 | 53.5%), Public Administration (7 | 16.3%), Transportation & Warehousing (4 | 9.3%), Health Care & Social Assistance (3 | 7.0%), and Educational Services (2 | 4.6%).
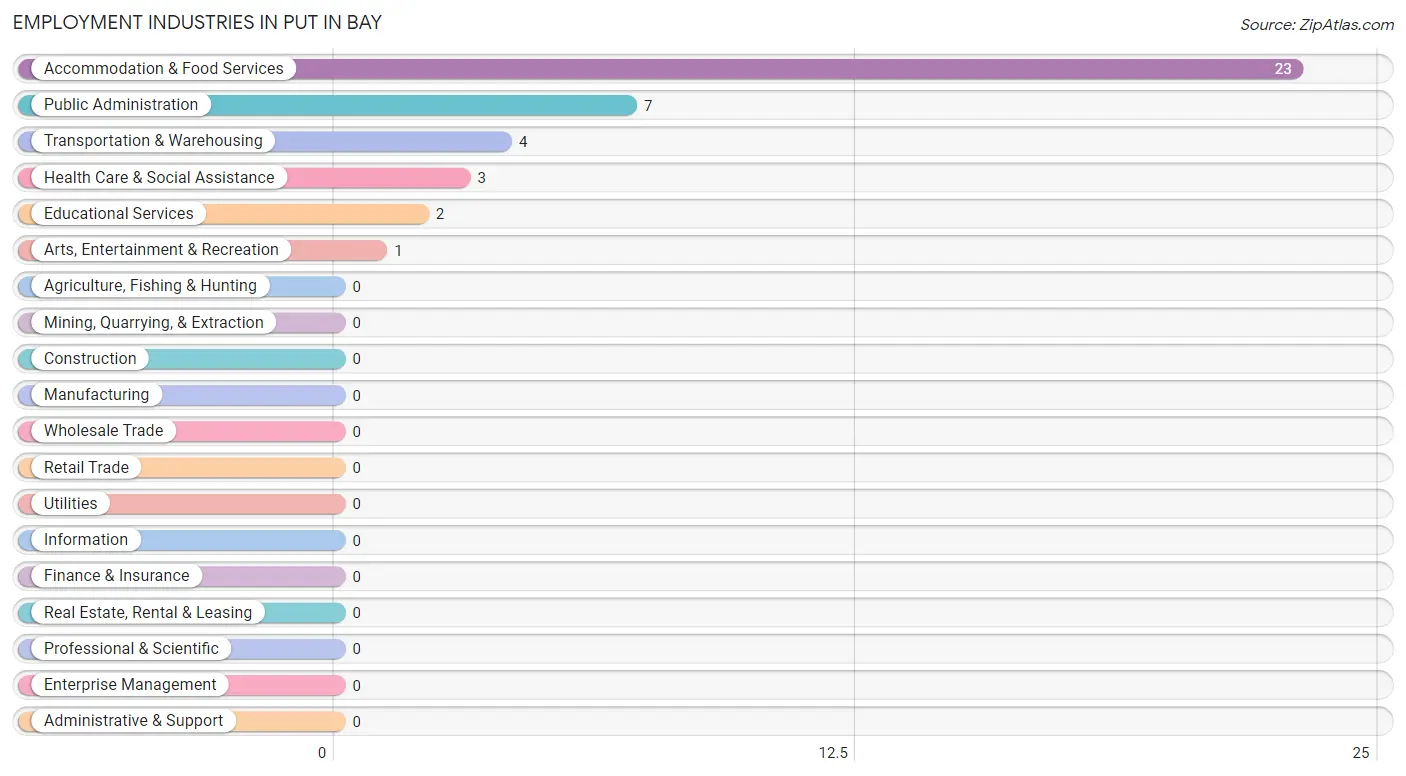
Employment Industries by Sex in Put In Bay
The Put In Bay industries that see more men than women are Transportation & Warehousing (100.0%), Health Care & Social Assistance (100.0%), and Arts, Entertainment & Recreation (100.0%), whereas the industries that tend to have a higher number of women are Accommodation & Food Services (65.2%), Public Administration (57.1%), and Educational Services (50.0%).
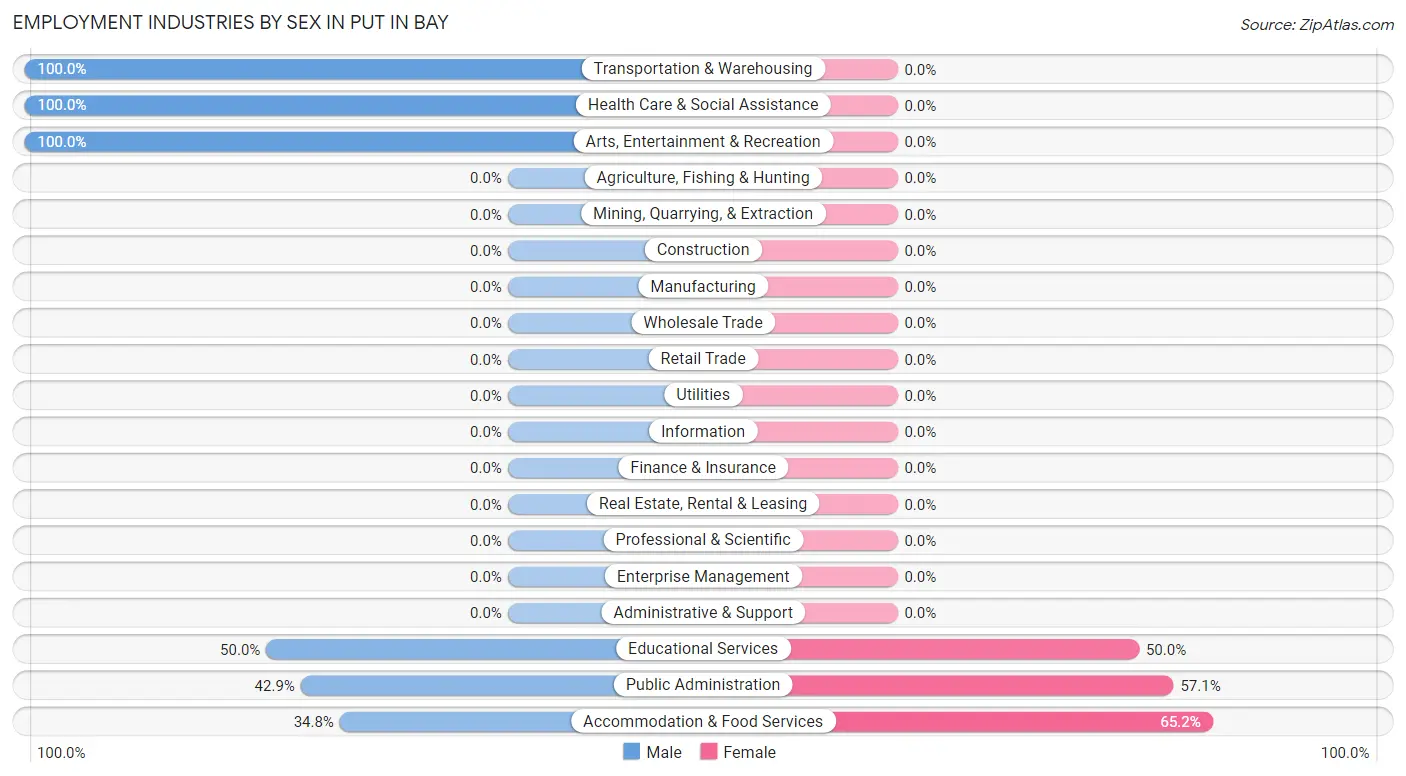
| Industry | Male | Female |
| Agriculture, Fishing & Hunting | 0 (0.0%) | 0 (0.0%) |
| Mining, Quarrying, & Extraction | 0 (0.0%) | 0 (0.0%) |
| Construction | 0 (0.0%) | 0 (0.0%) |
| Manufacturing | 0 (0.0%) | 0 (0.0%) |
| Wholesale Trade | 0 (0.0%) | 0 (0.0%) |
| Retail Trade | 0 (0.0%) | 0 (0.0%) |
| Transportation & Warehousing | 4 (100.0%) | 0 (0.0%) |
| Utilities | 0 (0.0%) | 0 (0.0%) |
| Information | 0 (0.0%) | 0 (0.0%) |
| Finance & Insurance | 0 (0.0%) | 0 (0.0%) |
| Real Estate, Rental & Leasing | 0 (0.0%) | 0 (0.0%) |
| Professional & Scientific | 0 (0.0%) | 0 (0.0%) |
| Enterprise Management | 0 (0.0%) | 0 (0.0%) |
| Administrative & Support | 0 (0.0%) | 0 (0.0%) |
| Educational Services | 1 (50.0%) | 1 (50.0%) |
| Health Care & Social Assistance | 3 (100.0%) | 0 (0.0%) |
| Arts, Entertainment & Recreation | 1 (100.0%) | 0 (0.0%) |
| Accommodation & Food Services | 8 (34.8%) | 15 (65.2%) |
| Public Administration | 3 (42.9%) | 4 (57.1%) |
| Total | 21 (48.8%) | 22 (51.2%) |
Education in Put In Bay
School Enrollment in Put In Bay
The most common levels of schooling among the 36 students in Put In Bay are college / undergraduate (35 | 97.2%), and elementary school (1 | 2.8%).
| School Level | # Students | % Students |
| Nursery / Preschool | 0 | 0.0% |
| Kindergarten | 0 | 0.0% |
| Elementary School | 1 | 2.8% |
| Middle School | 0 | 0.0% |
| High School | 0 | 0.0% |
| College / Undergraduate | 35 | 97.2% |
| Graduate / Professional | 0 | 0.0% |
| Total | 36 | 100.0% |
School Enrollment by Age by Funding Source in Put In Bay
Out of a total of 36 students who are enrolled in schools in Put In Bay, 4 (11.1%) attend a private institution, while the remaining 32 (88.9%) are enrolled in public schools. The age group of 35 years and over has the highest likelihood of being enrolled in private schools, with 3 (100.0% in the age bracket) enrolled. Conversely, the age group of 5 to 9 year old has the lowest likelihood of being enrolled in a private school, with 1 (100.0% in the age bracket) attending a public institution.
| Age Bracket | Public School | Private School |
| 3 to 4 Year Olds | 0 (0.0%) | 0 (0.0%) |
| 5 to 9 Year Old | 1 (100.0%) | 0 (0.0%) |
| 10 to 14 Year Olds | 0 (0.0%) | 0 (0.0%) |
| 15 to 17 Year Olds | 0 (0.0%) | 0 (0.0%) |
| 18 to 19 Year Olds | 31 (96.9%) | 1 (3.1%) |
| 20 to 24 Year Olds | 0 (0.0%) | 0 (0.0%) |
| 25 to 34 Year Olds | 0 (0.0%) | 0 (0.0%) |
| 35 Years and over | 0 (0.0%) | 3 (100.0%) |
| Total | 32 (88.9%) | 4 (11.1%) |
Educational Attainment by Field of Study in Put In Bay
Science & technology (6 | 18.8%), business (6 | 18.8%), social sciences (5 | 15.6%), education (4 | 12.5%), and liberal arts & history (4 | 12.5%) are the most common fields of study among 32 individuals in Put In Bay who have obtained a bachelor's degree or higher.
| Field of Study | # Graduates | % Graduates |
| Computers & Mathematics | 0 | 0.0% |
| Bio, Nature & Agricultural | 0 | 0.0% |
| Physical & Health Sciences | 0 | 0.0% |
| Psychology | 2 | 6.2% |
| Social Sciences | 5 | 15.6% |
| Engineering | 2 | 6.2% |
| Multidisciplinary Studies | 0 | 0.0% |
| Science & Technology | 6 | 18.8% |
| Business | 6 | 18.8% |
| Education | 4 | 12.5% |
| Literature & Languages | 1 | 3.1% |
| Liberal Arts & History | 4 | 12.5% |
| Visual & Performing Arts | 0 | 0.0% |
| Communications | 2 | 6.2% |
| Arts & Humanities | 0 | 0.0% |
| Total | 32 | 100.0% |
Transportation & Commute in Put In Bay
Vehicle Availability by Sex in Put In Bay
The most prevalent vehicle ownership categories in Put In Bay are males with 2 vehicles (7, accounting for 33.3%) and females with 2 vehicles (6, making up 63.6%).
| Vehicles Available | Male | Female |
| No Vehicle | 0 (0.0%) | 0 (0.0%) |
| 1 Vehicle | 3 (14.3%) | 0 (0.0%) |
| 2 Vehicles | 7 (33.3%) | 6 (54.5%) |
| 3 Vehicles | 7 (33.3%) | 5 (45.5%) |
| 4 Vehicles | 1 (4.8%) | 0 (0.0%) |
| 5 or more Vehicles | 3 (14.3%) | 0 (0.0%) |
| Total | 21 (100.0%) | 11 (100.0%) |
Commute Time in Put In Bay
The most frequently occuring commute durations in Put In Bay are 5 to 9 minutes (10 commuters, 34.5%), less than 5 minutes (6 commuters, 20.7%), and 15 to 19 minutes (6 commuters, 20.7%).
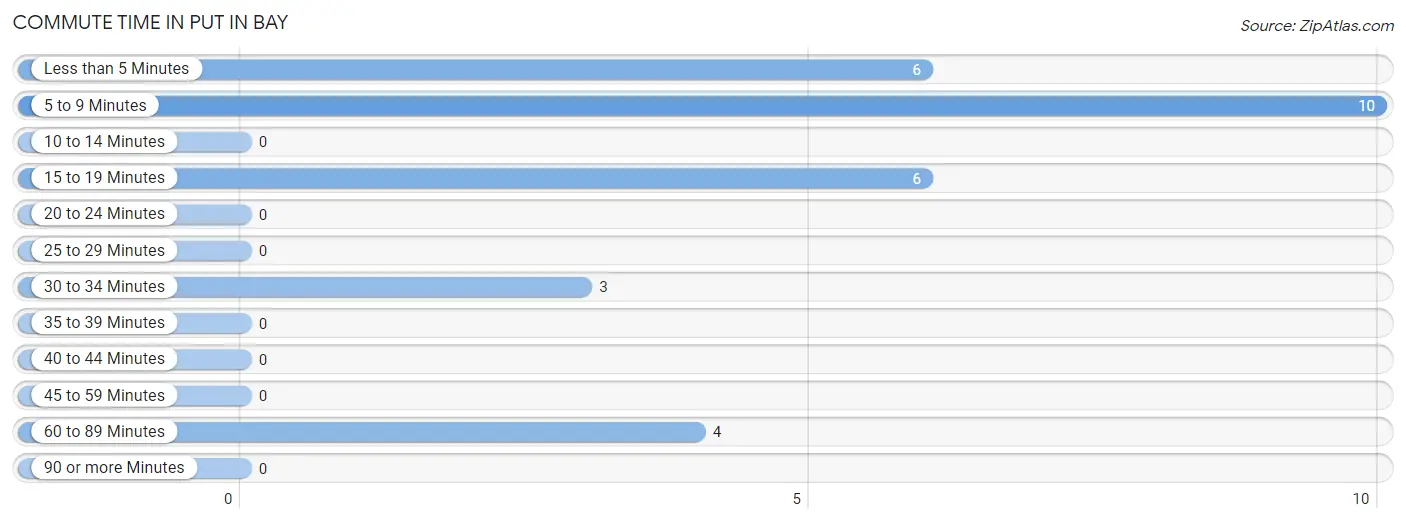
| Commute Time | # Commuters | % Commuters |
| Less than 5 Minutes | 6 | 20.7% |
| 5 to 9 Minutes | 10 | 34.5% |
| 10 to 14 Minutes | 0 | 0.0% |
| 15 to 19 Minutes | 6 | 20.7% |
| 20 to 24 Minutes | 0 | 0.0% |
| 25 to 29 Minutes | 0 | 0.0% |
| 30 to 34 Minutes | 3 | 10.3% |
| 35 to 39 Minutes | 0 | 0.0% |
| 40 to 44 Minutes | 0 | 0.0% |
| 45 to 59 Minutes | 0 | 0.0% |
| 60 to 89 Minutes | 4 | 13.8% |
| 90 or more Minutes | 0 | 0.0% |
Commute Time by Sex in Put In Bay
The most common commute times in Put In Bay are 5 to 9 minutes (6 commuters, 33.3%) for males and 5 to 9 minutes (4 commuters, 36.4%) for females.
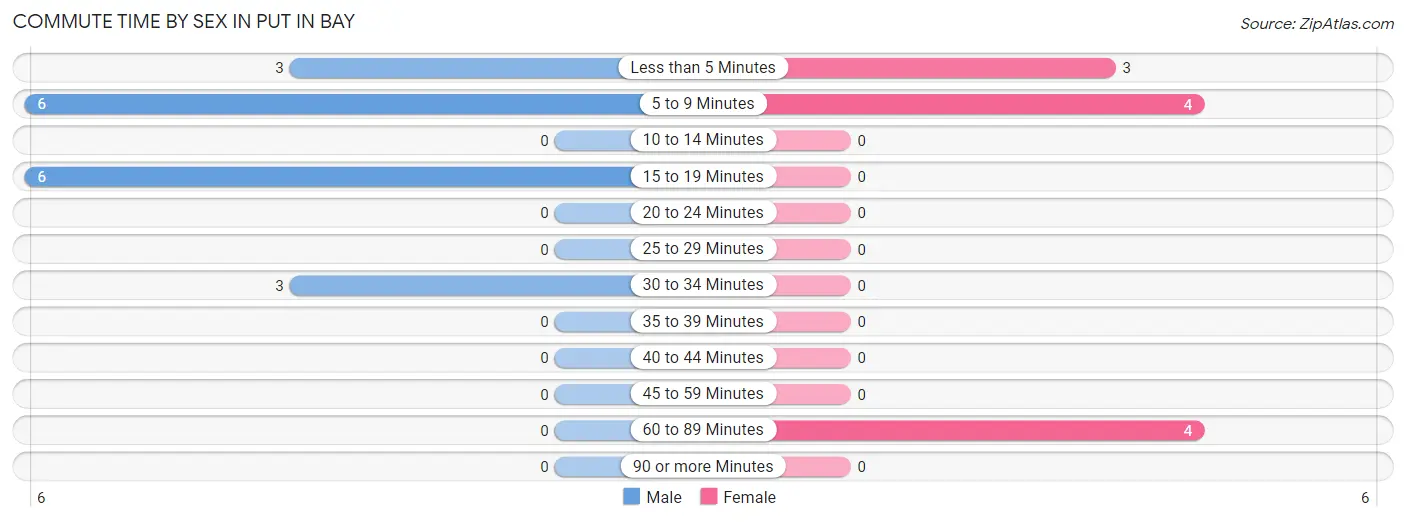
| Commute Time | Male | Female |
| Less than 5 Minutes | 3 (16.7%) | 3 (27.3%) |
| 5 to 9 Minutes | 6 (33.3%) | 4 (36.4%) |
| 10 to 14 Minutes | 0 (0.0%) | 0 (0.0%) |
| 15 to 19 Minutes | 6 (33.3%) | 0 (0.0%) |
| 20 to 24 Minutes | 0 (0.0%) | 0 (0.0%) |
| 25 to 29 Minutes | 0 (0.0%) | 0 (0.0%) |
| 30 to 34 Minutes | 3 (16.7%) | 0 (0.0%) |
| 35 to 39 Minutes | 0 (0.0%) | 0 (0.0%) |
| 40 to 44 Minutes | 0 (0.0%) | 0 (0.0%) |
| 45 to 59 Minutes | 0 (0.0%) | 0 (0.0%) |
| 60 to 89 Minutes | 0 (0.0%) | 4 (36.4%) |
| 90 or more Minutes | 0 (0.0%) | 0 (0.0%) |
Time of Departure to Work by Sex in Put In Bay
The most frequent times of departure to work in Put In Bay are 8:00 AM to 8:29 AM (6, 33.3%) for males and 9:00 AM to 9:59 AM (5, 45.5%) for females.
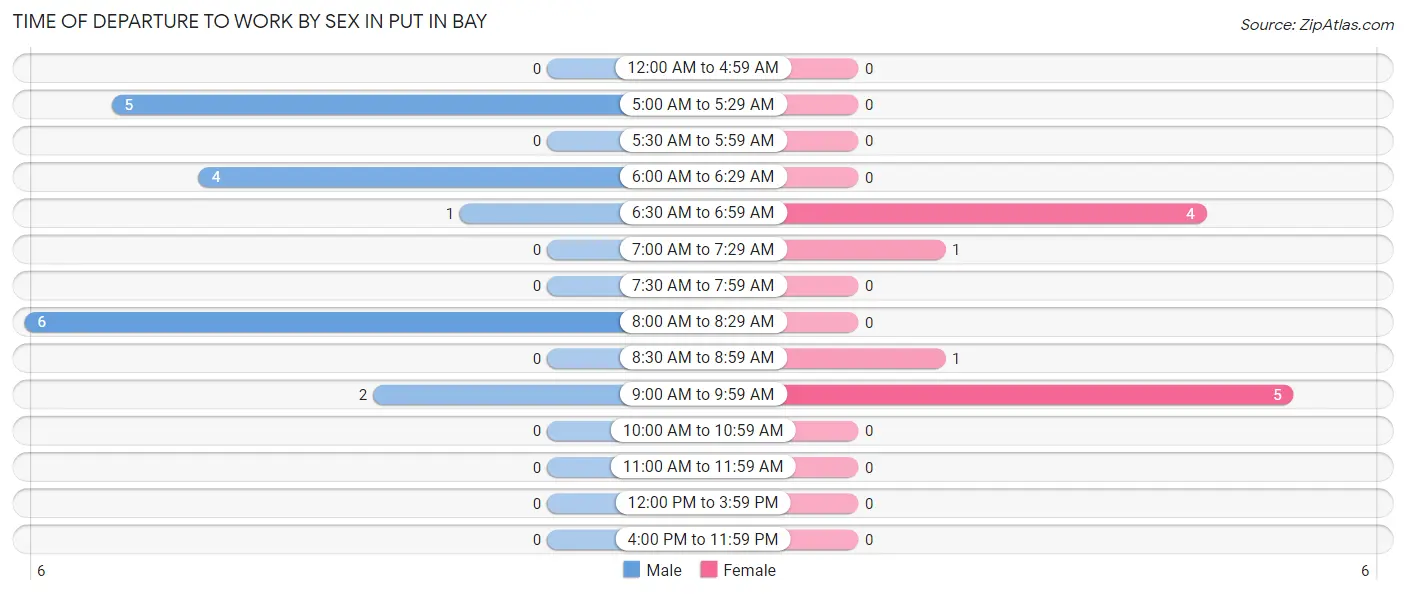
| Time of Departure | Male | Female |
| 12:00 AM to 4:59 AM | 0 (0.0%) | 0 (0.0%) |
| 5:00 AM to 5:29 AM | 5 (27.8%) | 0 (0.0%) |
| 5:30 AM to 5:59 AM | 0 (0.0%) | 0 (0.0%) |
| 6:00 AM to 6:29 AM | 4 (22.2%) | 0 (0.0%) |
| 6:30 AM to 6:59 AM | 1 (5.6%) | 4 (36.4%) |
| 7:00 AM to 7:29 AM | 0 (0.0%) | 1 (9.1%) |
| 7:30 AM to 7:59 AM | 0 (0.0%) | 0 (0.0%) |
| 8:00 AM to 8:29 AM | 6 (33.3%) | 0 (0.0%) |
| 8:30 AM to 8:59 AM | 0 (0.0%) | 1 (9.1%) |
| 9:00 AM to 9:59 AM | 2 (11.1%) | 5 (45.5%) |
| 10:00 AM to 10:59 AM | 0 (0.0%) | 0 (0.0%) |
| 11:00 AM to 11:59 AM | 0 (0.0%) | 0 (0.0%) |
| 12:00 PM to 3:59 PM | 0 (0.0%) | 0 (0.0%) |
| 4:00 PM to 11:59 PM | 0 (0.0%) | 0 (0.0%) |
| Total | 18 (100.0%) | 11 (100.0%) |
Housing Occupancy in Put In Bay
Occupancy by Ownership in Put In Bay
Of the total 32 dwellings in Put In Bay, owner-occupied units account for 23 (71.9%), while renter-occupied units make up 9 (28.1%).
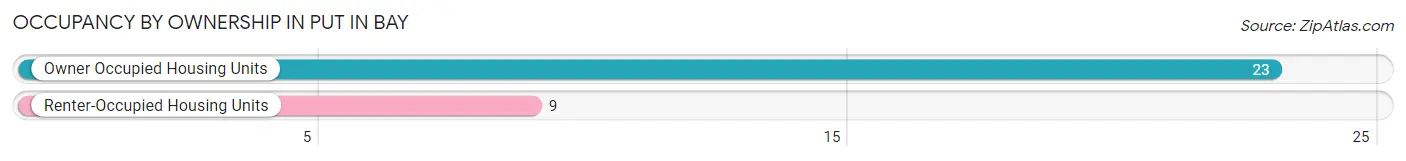
| Occupancy | # Housing Units | % Housing Units |
| Owner Occupied Housing Units | 23 | 71.9% |
| Renter-Occupied Housing Units | 9 | 28.1% |
| Total Occupied Housing Units | 32 | 100.0% |
Occupancy by Household Size in Put In Bay
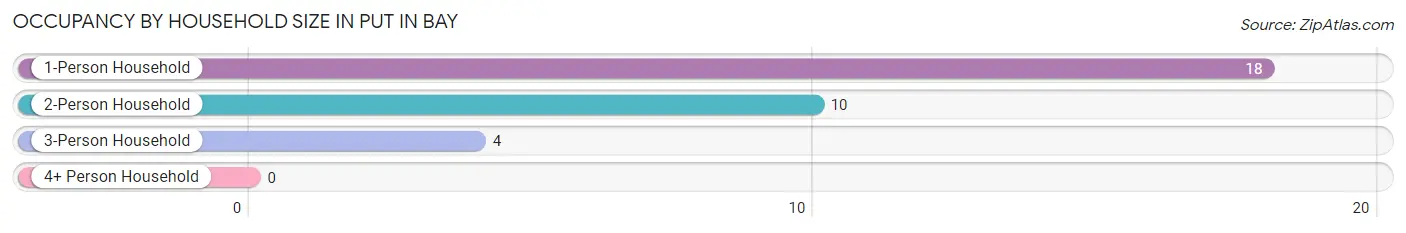
| Household Size | # Housing Units | % Housing Units |
| 1-Person Household | 18 | 56.2% |
| 2-Person Household | 10 | 31.2% |
| 3-Person Household | 4 | 12.5% |
| 4+ Person Household | 0 | 0.0% |
| Total Housing Units | 32 | 100.0% |
Occupancy by Ownership by Household Size in Put In Bay
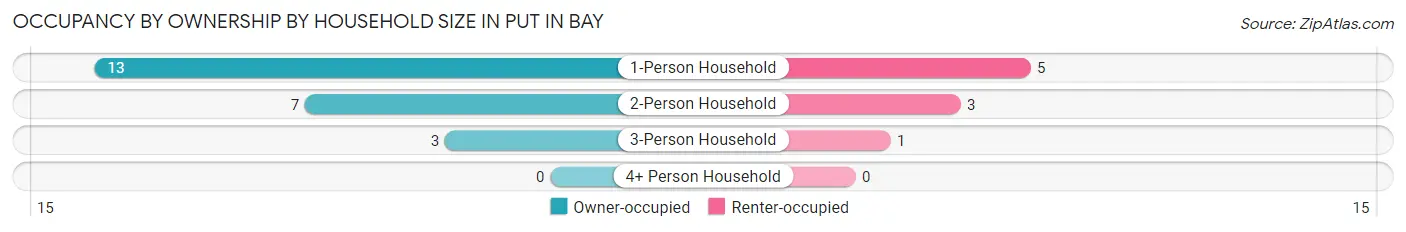
| Household Size | Owner-occupied | Renter-occupied |
| 1-Person Household | 13 (72.2%) | 5 (27.8%) |
| 2-Person Household | 7 (70.0%) | 3 (30.0%) |
| 3-Person Household | 3 (75.0%) | 1 (25.0%) |
| 4+ Person Household | 0 (0.0%) | 0 (0.0%) |
| Total Housing Units | 23 (71.9%) | 9 (28.1%) |
Occupancy by Educational Attainment in Put In Bay
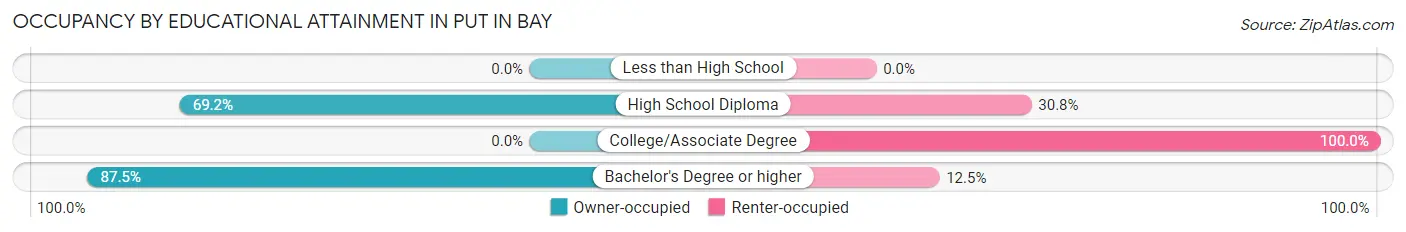
| Household Size | Owner-occupied | Renter-occupied |
| Less than High School | 0 (0.0%) | 0 (0.0%) |
| High School Diploma | 9 (69.2%) | 4 (30.8%) |
| College/Associate Degree | 0 (0.0%) | 3 (100.0%) |
| Bachelor's Degree or higher | 14 (87.5%) | 2 (12.5%) |
Occupancy by Age of Householder in Put In Bay
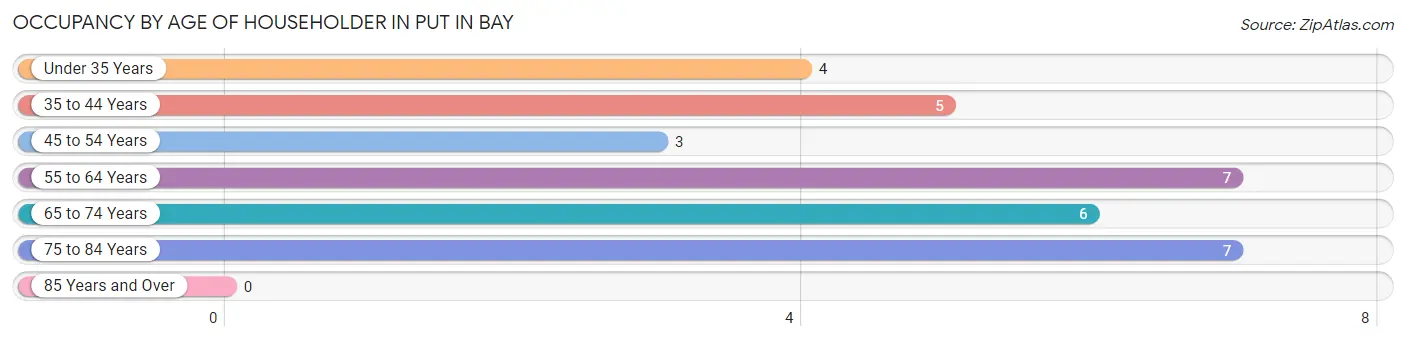
| Age Bracket | # Households | % Households |
| Under 35 Years | 4 | 12.5% |
| 35 to 44 Years | 5 | 15.6% |
| 45 to 54 Years | 3 | 9.4% |
| 55 to 64 Years | 7 | 21.9% |
| 65 to 74 Years | 6 | 18.8% |
| 75 to 84 Years | 7 | 21.9% |
| 85 Years and Over | 0 | 0.0% |
| Total | 32 | 100.0% |
Housing Finances in Put In Bay
Median Income by Occupancy in Put In Bay
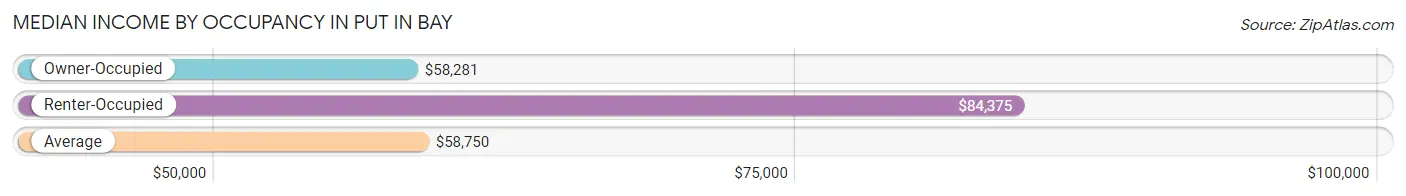
| Occupancy Type | # Households | Median Income |
| Owner-Occupied | 23 (71.9%) | $58,281 |
| Renter-Occupied | 9 (28.1%) | $84,375 |
| Average | 32 (100.0%) | $58,750 |
Occupancy by Householder Income Bracket in Put In Bay
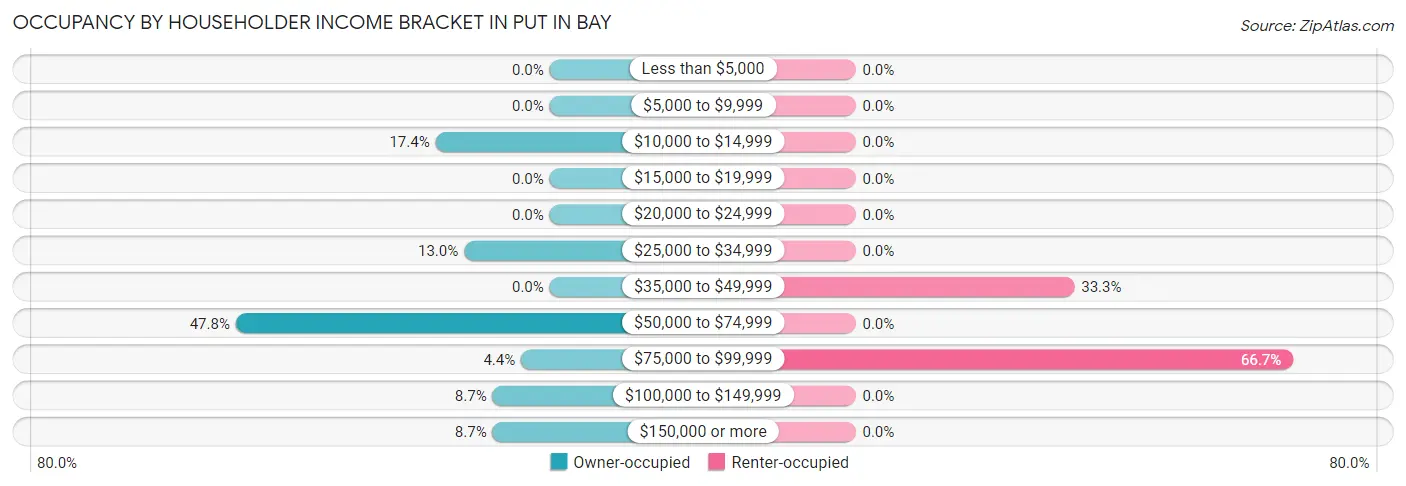
| Income Bracket | Owner-occupied | Renter-occupied |
| Less than $5,000 | 0 (0.0%) | 0 (0.0%) |
| $5,000 to $9,999 | 0 (0.0%) | 0 (0.0%) |
| $10,000 to $14,999 | 4 (17.4%) | 0 (0.0%) |
| $15,000 to $19,999 | 0 (0.0%) | 0 (0.0%) |
| $20,000 to $24,999 | 0 (0.0%) | 0 (0.0%) |
| $25,000 to $34,999 | 3 (13.0%) | 0 (0.0%) |
| $35,000 to $49,999 | 0 (0.0%) | 3 (33.3%) |
| $50,000 to $74,999 | 11 (47.8%) | 0 (0.0%) |
| $75,000 to $99,999 | 1 (4.3%) | 6 (66.7%) |
| $100,000 to $149,999 | 2 (8.7%) | 0 (0.0%) |
| $150,000 or more | 2 (8.7%) | 0 (0.0%) |
| Total | 23 (100.0%) | 9 (100.0%) |
Monthly Housing Cost Tiers in Put In Bay
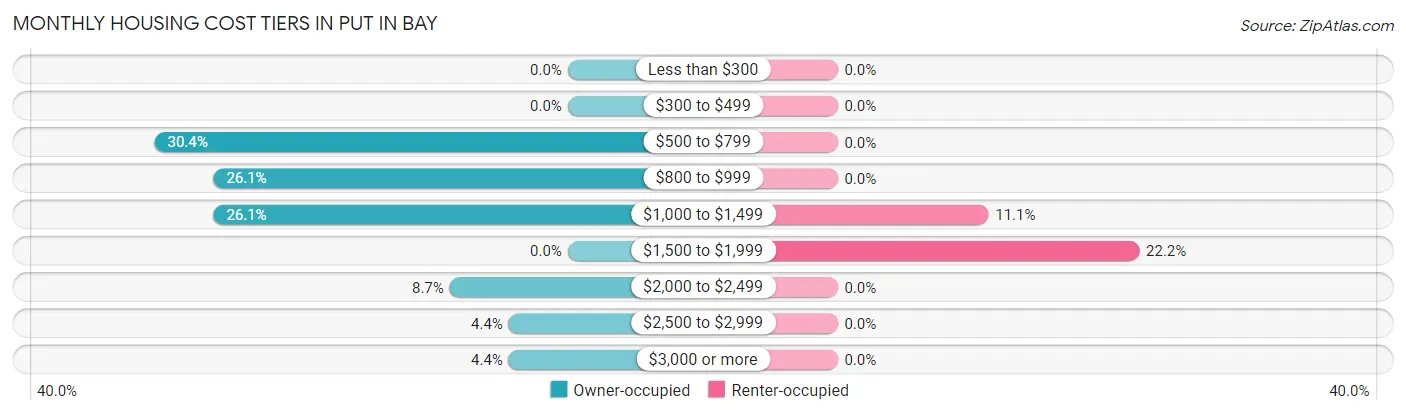
| Monthly Cost | Owner-occupied | Renter-occupied |
| Less than $300 | 0 (0.0%) | 0 (0.0%) |
| $300 to $499 | 0 (0.0%) | 0 (0.0%) |
| $500 to $799 | 7 (30.4%) | 0 (0.0%) |
| $800 to $999 | 6 (26.1%) | 0 (0.0%) |
| $1,000 to $1,499 | 6 (26.1%) | 1 (11.1%) |
| $1,500 to $1,999 | 0 (0.0%) | 2 (22.2%) |
| $2,000 to $2,499 | 2 (8.7%) | 0 (0.0%) |
| $2,500 to $2,999 | 1 (4.3%) | 0 (0.0%) |
| $3,000 or more | 1 (4.3%) | 0 (0.0%) |
| Total | 23 (100.0%) | 9 (100.0%) |
Physical Housing Characteristics in Put In Bay
Housing Structures in Put In Bay
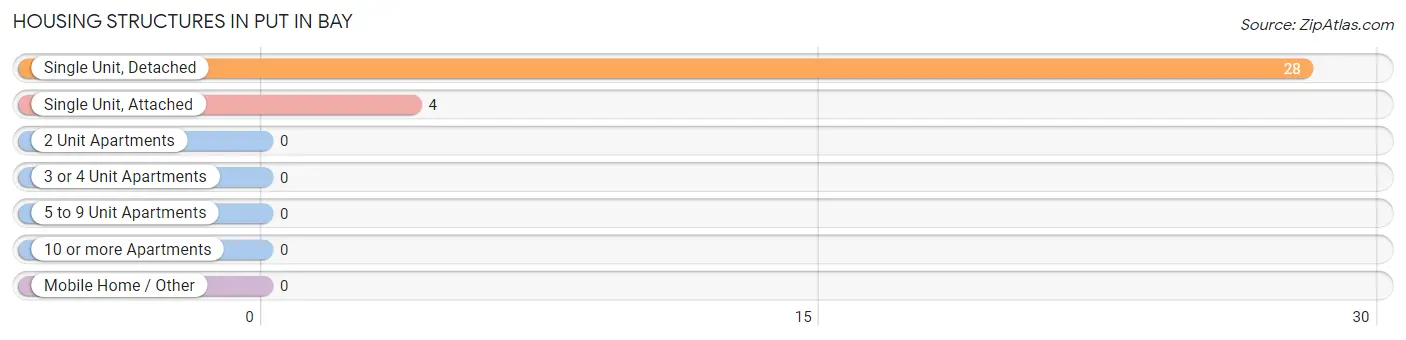
| Structure Type | # Housing Units | % Housing Units |
| Single Unit, Detached | 28 | 87.5% |
| Single Unit, Attached | 4 | 12.5% |
| 2 Unit Apartments | 0 | 0.0% |
| 3 or 4 Unit Apartments | 0 | 0.0% |
| 5 to 9 Unit Apartments | 0 | 0.0% |
| 10 or more Apartments | 0 | 0.0% |
| Mobile Home / Other | 0 | 0.0% |
| Total | 32 | 100.0% |
Housing Structures by Occupancy in Put In Bay
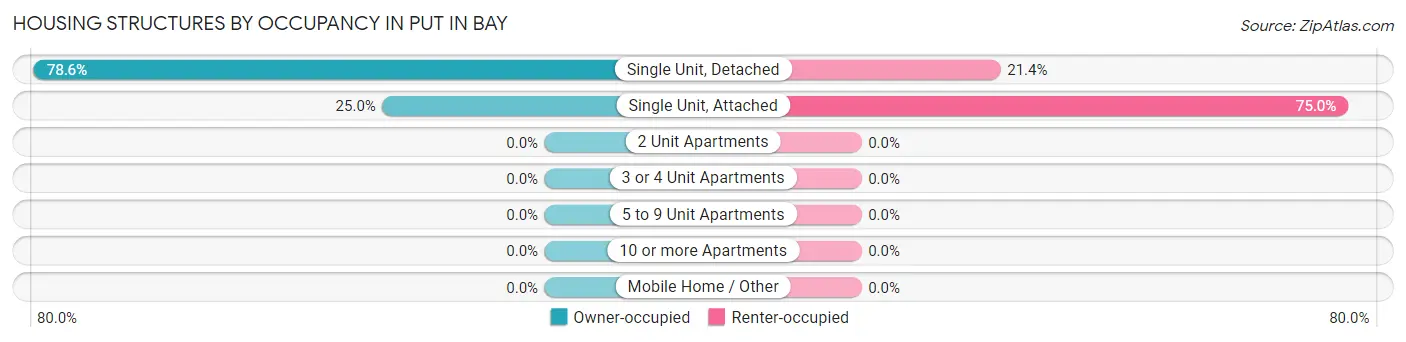
| Structure Type | Owner-occupied | Renter-occupied |
| Single Unit, Detached | 22 (78.6%) | 6 (21.4%) |
| Single Unit, Attached | 1 (25.0%) | 3 (75.0%) |
| 2 Unit Apartments | 0 (0.0%) | 0 (0.0%) |
| 3 or 4 Unit Apartments | 0 (0.0%) | 0 (0.0%) |
| 5 to 9 Unit Apartments | 0 (0.0%) | 0 (0.0%) |
| 10 or more Apartments | 0 (0.0%) | 0 (0.0%) |
| Mobile Home / Other | 0 (0.0%) | 0 (0.0%) |
| Total | 23 (71.9%) | 9 (28.1%) |
Housing Structures by Number of Rooms in Put In Bay
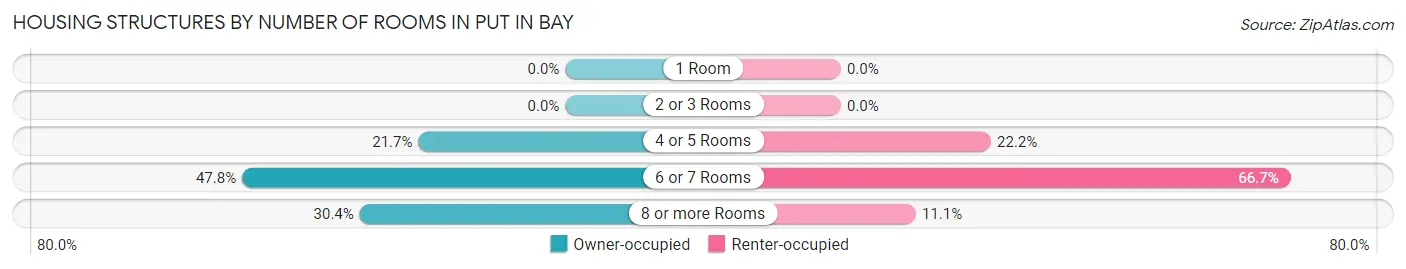
| Number of Rooms | Owner-occupied | Renter-occupied |
| 1 Room | 0 (0.0%) | 0 (0.0%) |
| 2 or 3 Rooms | 0 (0.0%) | 0 (0.0%) |
| 4 or 5 Rooms | 5 (21.7%) | 2 (22.2%) |
| 6 or 7 Rooms | 11 (47.8%) | 6 (66.7%) |
| 8 or more Rooms | 7 (30.4%) | 1 (11.1%) |
| Total | 23 (100.0%) | 9 (100.0%) |
Housing Structure by Heating Type in Put In Bay
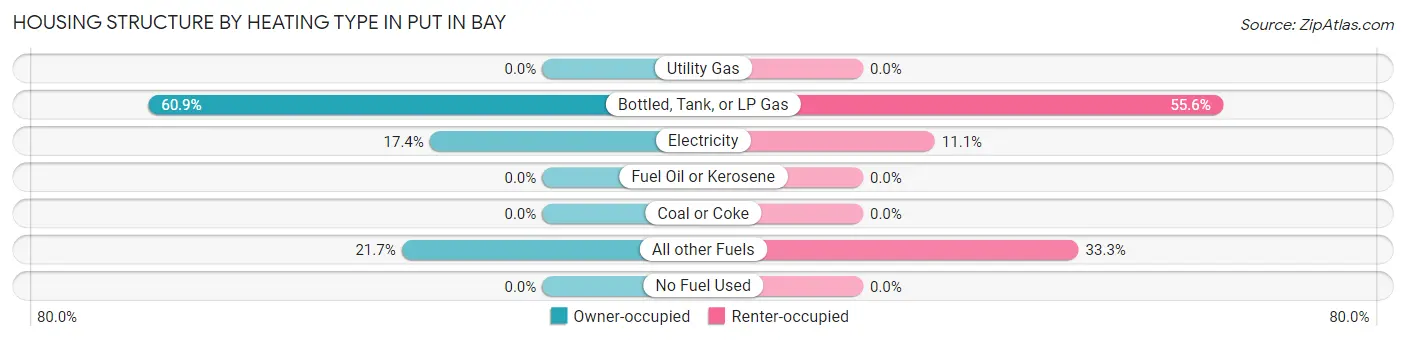
| Heating Type | Owner-occupied | Renter-occupied |
| Utility Gas | 0 (0.0%) | 0 (0.0%) |
| Bottled, Tank, or LP Gas | 14 (60.9%) | 5 (55.6%) |
| Electricity | 4 (17.4%) | 1 (11.1%) |
| Fuel Oil or Kerosene | 0 (0.0%) | 0 (0.0%) |
| Coal or Coke | 0 (0.0%) | 0 (0.0%) |
| All other Fuels | 5 (21.7%) | 3 (33.3%) |
| No Fuel Used | 0 (0.0%) | 0 (0.0%) |
| Total | 23 (100.0%) | 9 (100.0%) |
Household Vehicle Usage in Put In Bay
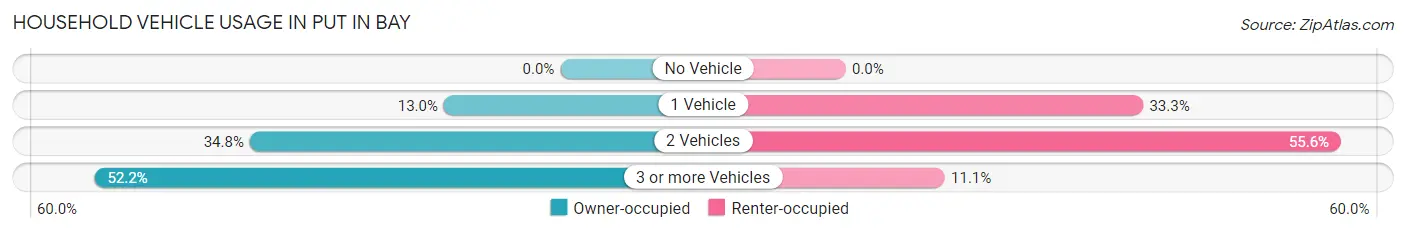
| Vehicles per Household | Owner-occupied | Renter-occupied |
| No Vehicle | 0 (0.0%) | 0 (0.0%) |
| 1 Vehicle | 3 (13.0%) | 3 (33.3%) |
| 2 Vehicles | 8 (34.8%) | 5 (55.6%) |
| 3 or more Vehicles | 12 (52.2%) | 1 (11.1%) |
| Total | 23 (100.0%) | 9 (100.0%) |
Real Estate & Mortgages in Put In Bay
Real Estate and Mortgage Overview in Put In Bay
| Characteristic | Without Mortgage | With Mortgage |
| Housing Units | 13 | 10 |
| Median Property Value | $437,500 | $362,500 |
| Median Household Income | - | - |
| Monthly Housing Costs | $775 | $1 |
| Real Estate Taxes | $3,500 | $0 |
Property Value by Mortgage Status in Put In Bay
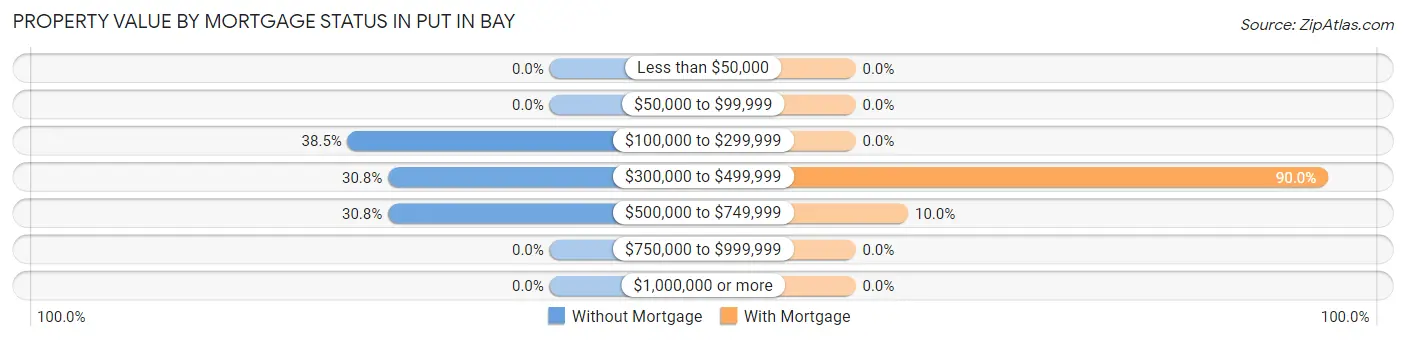
| Property Value | Without Mortgage | With Mortgage |
| Less than $50,000 | 0 (0.0%) | 0 (0.0%) |
| $50,000 to $99,999 | 0 (0.0%) | 0 (0.0%) |
| $100,000 to $299,999 | 5 (38.5%) | 0 (0.0%) |
| $300,000 to $499,999 | 4 (30.8%) | 9 (90.0%) |
| $500,000 to $749,999 | 4 (30.8%) | 1 (10.0%) |
| $750,000 to $999,999 | 0 (0.0%) | 0 (0.0%) |
| $1,000,000 or more | 0 (0.0%) | 0 (0.0%) |
| Total | 13 (100.0%) | 10 (100.0%) |
Household Income by Mortgage Status in Put In Bay
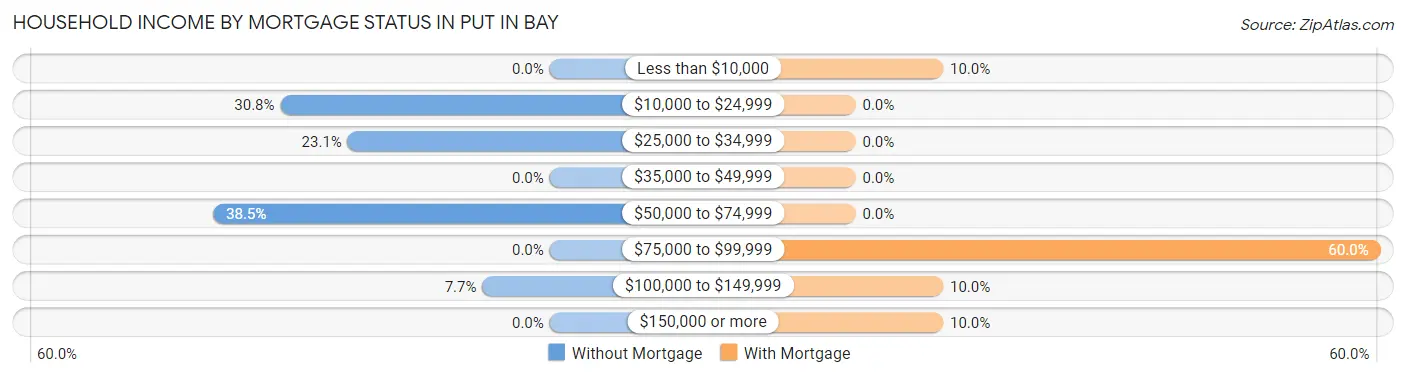
| Household Income | Without Mortgage | With Mortgage |
| Less than $10,000 | 0 (0.0%) | 1 (10.0%) |
| $10,000 to $24,999 | 4 (30.8%) | 0 (0.0%) |
| $25,000 to $34,999 | 3 (23.1%) | 0 (0.0%) |
| $35,000 to $49,999 | 0 (0.0%) | 0 (0.0%) |
| $50,000 to $74,999 | 5 (38.5%) | 0 (0.0%) |
| $75,000 to $99,999 | 0 (0.0%) | 6 (60.0%) |
| $100,000 to $149,999 | 1 (7.7%) | 1 (10.0%) |
| $150,000 or more | 0 (0.0%) | 1 (10.0%) |
| Total | 13 (100.0%) | 10 (100.0%) |
Property Value to Household Income Ratio in Put In Bay
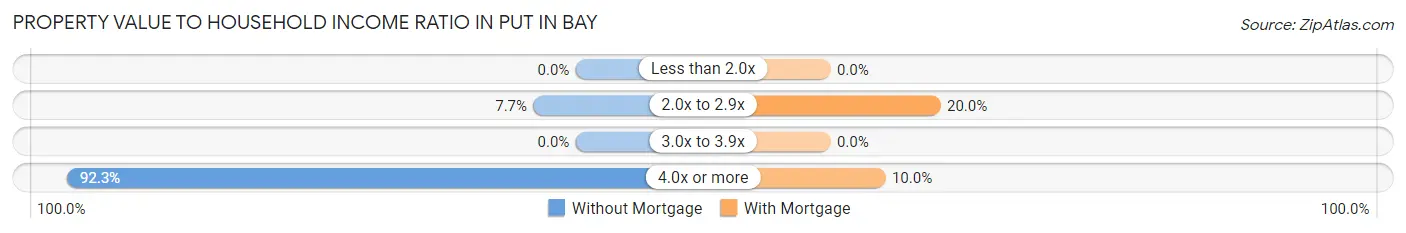
| Value-to-Income Ratio | Without Mortgage | With Mortgage |
| Less than 2.0x | 0 (0.0%) | 0 (0.0%) |
| 2.0x to 2.9x | 1 (7.7%) | 2 (20.0%) |
| 3.0x to 3.9x | 0 (0.0%) | 0 (0.0%) |
| 4.0x or more | 12 (92.3%) | 1 (10.0%) |
| Total | 13 (100.0%) | 10 (100.0%) |
Real Estate Taxes by Mortgage Status in Put In Bay
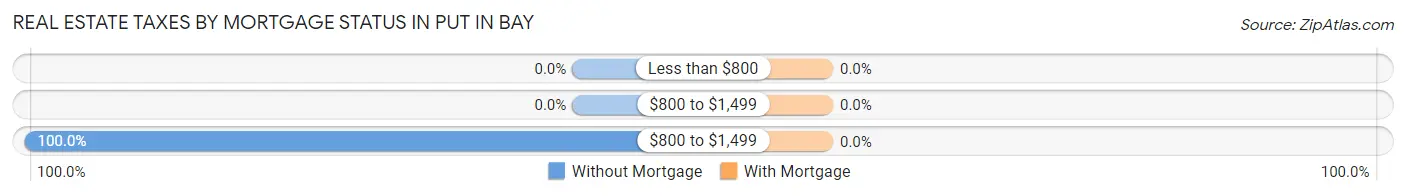
| Property Taxes | Without Mortgage | With Mortgage |
| Less than $800 | 0 (0.0%) | 0 (0.0%) |
| $800 to $1,499 | 0 (0.0%) | 0 (0.0%) |
| $800 to $1,499 | 13 (100.0%) | 0 (0.0%) |
| Total | 13 (100.0%) | 10 (100.0%) |
Health & Disability in Put In Bay
Health Insurance Coverage by Age in Put In Bay
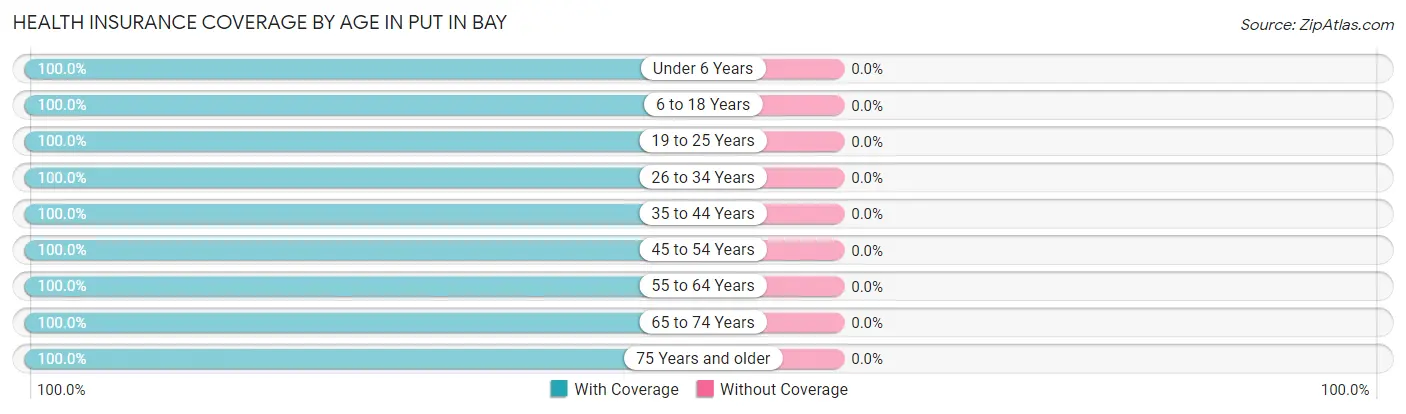
| Age Bracket | With Coverage | Without Coverage |
| Under 6 Years | 3 (100.0%) | 0 (0.0%) |
| 6 to 18 Years | 23 (100.0%) | 0 (0.0%) |
| 19 to 25 Years | 14 (100.0%) | 0 (0.0%) |
| 26 to 34 Years | 4 (100.0%) | 0 (0.0%) |
| 35 to 44 Years | 8 (100.0%) | 0 (0.0%) |
| 45 to 54 Years | 4 (100.0%) | 0 (0.0%) |
| 55 to 64 Years | 11 (100.0%) | 0 (0.0%) |
| 65 to 74 Years | 7 (100.0%) | 0 (0.0%) |
| 75 Years and older | 15 (100.0%) | 0 (0.0%) |
| Total | 89 (100.0%) | 0 (0.0%) |
Health Insurance Coverage by Citizenship Status in Put In Bay
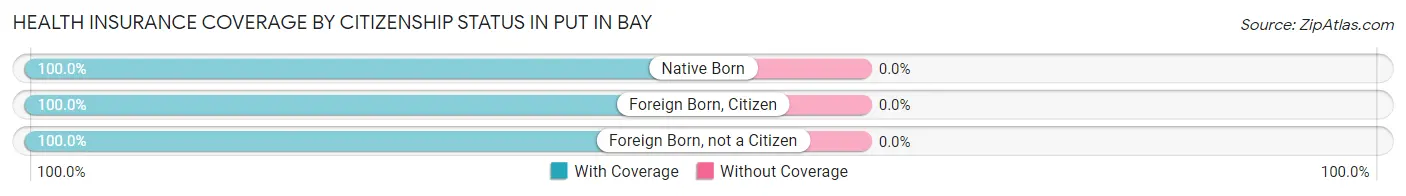
| Citizenship Status | With Coverage | Without Coverage |
| Native Born | 3 (100.0%) | 0 (0.0%) |
| Foreign Born, Citizen | 23 (100.0%) | 0 (0.0%) |
| Foreign Born, not a Citizen | 14 (100.0%) | 0 (0.0%) |
Health Insurance Coverage by Household Income in Put In Bay
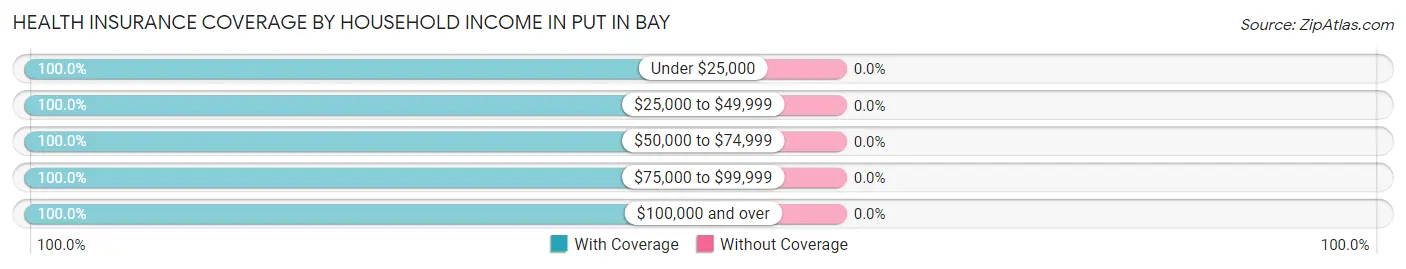
| Household Income | With Coverage | Without Coverage |
| Under $25,000 | 4 (100.0%) | 0 (0.0%) |
| $25,000 to $49,999 | 6 (100.0%) | 0 (0.0%) |
| $50,000 to $74,999 | 16 (100.0%) | 0 (0.0%) |
| $75,000 to $99,999 | 18 (100.0%) | 0 (0.0%) |
| $100,000 and over | 13 (100.0%) | 0 (0.0%) |
Public vs Private Health Insurance Coverage by Age in Put In Bay
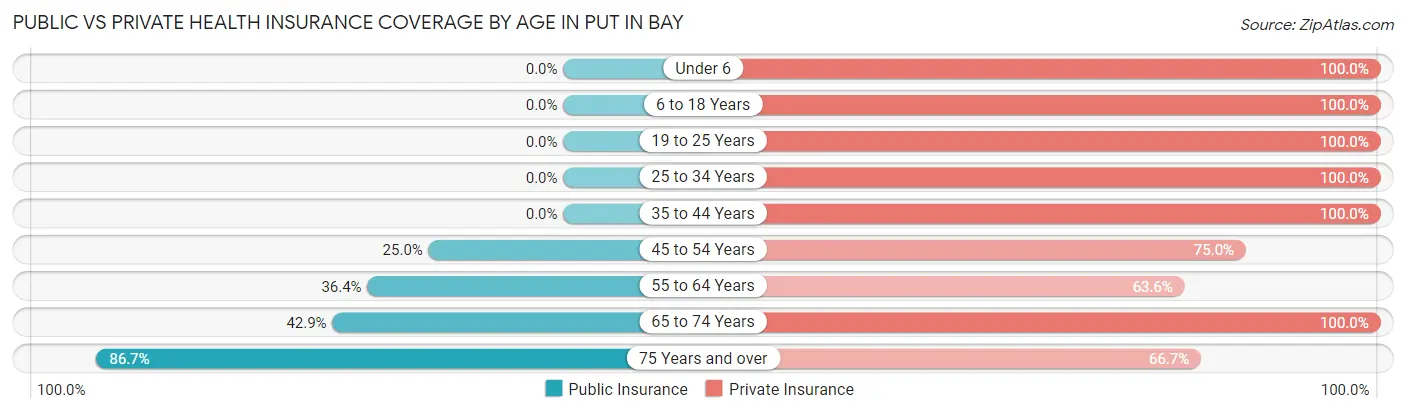
| Age Bracket | Public Insurance | Private Insurance |
| Under 6 | 0 (0.0%) | 3 (100.0%) |
| 6 to 18 Years | 0 (0.0%) | 23 (100.0%) |
| 19 to 25 Years | 0 (0.0%) | 14 (100.0%) |
| 25 to 34 Years | 0 (0.0%) | 4 (100.0%) |
| 35 to 44 Years | 0 (0.0%) | 8 (100.0%) |
| 45 to 54 Years | 1 (25.0%) | 3 (75.0%) |
| 55 to 64 Years | 4 (36.4%) | 7 (63.6%) |
| 65 to 74 Years | 3 (42.9%) | 7 (100.0%) |
| 75 Years and over | 13 (86.7%) | 10 (66.7%) |
| Total | 21 (23.6%) | 79 (88.8%) |
Disability Status by Sex by Age in Put In Bay
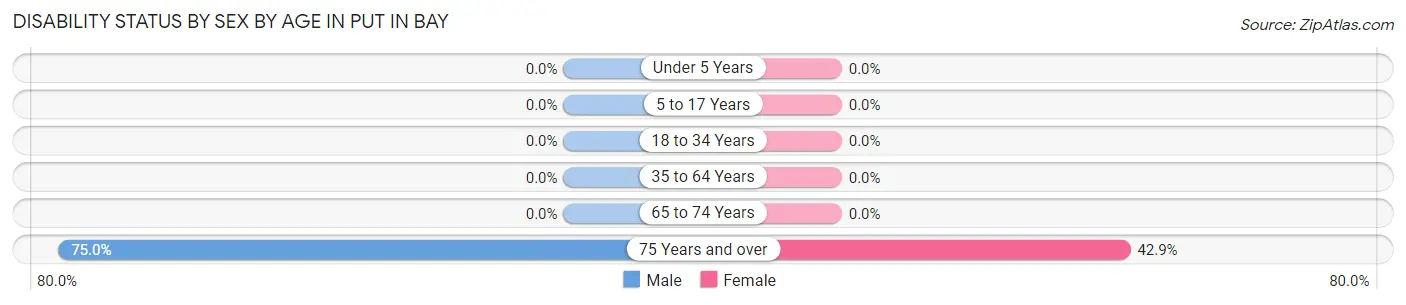
| Age Bracket | Male | Female |
| Under 5 Years | 0 (0.0%) | 0 (0.0%) |
| 5 to 17 Years | 0 (0.0%) | 0 (0.0%) |
| 18 to 34 Years | 0 (0.0%) | 0 (0.0%) |
| 35 to 64 Years | 0 (0.0%) | 0 (0.0%) |
| 65 to 74 Years | 0 (0.0%) | 0 (0.0%) |
| 75 Years and over | 6 (75.0%) | 3 (42.9%) |
Disability Class by Sex by Age in Put In Bay
Disability Class: Hearing Difficulty
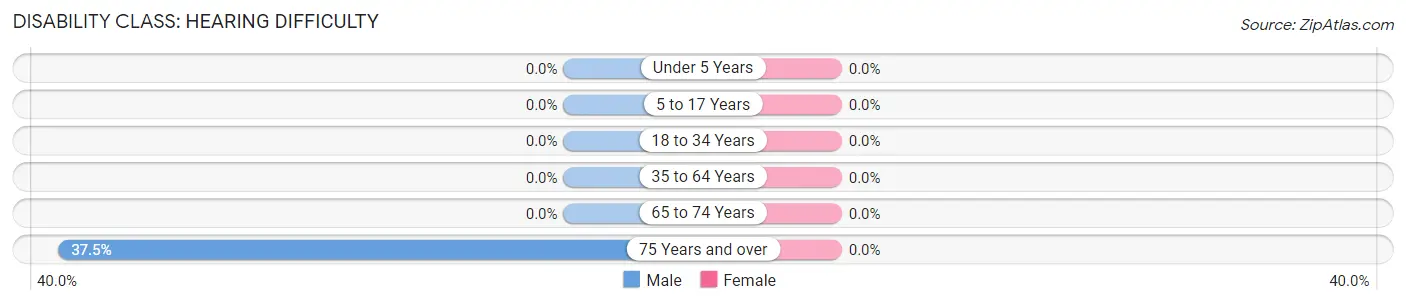
| Age Bracket | Male | Female |
| Under 5 Years | 0 (0.0%) | 0 (0.0%) |
| 5 to 17 Years | 0 (0.0%) | 0 (0.0%) |
| 18 to 34 Years | 0 (0.0%) | 0 (0.0%) |
| 35 to 64 Years | 0 (0.0%) | 0 (0.0%) |
| 65 to 74 Years | 0 (0.0%) | 0 (0.0%) |
| 75 Years and over | 3 (37.5%) | 0 (0.0%) |
Disability Class: Vision Difficulty
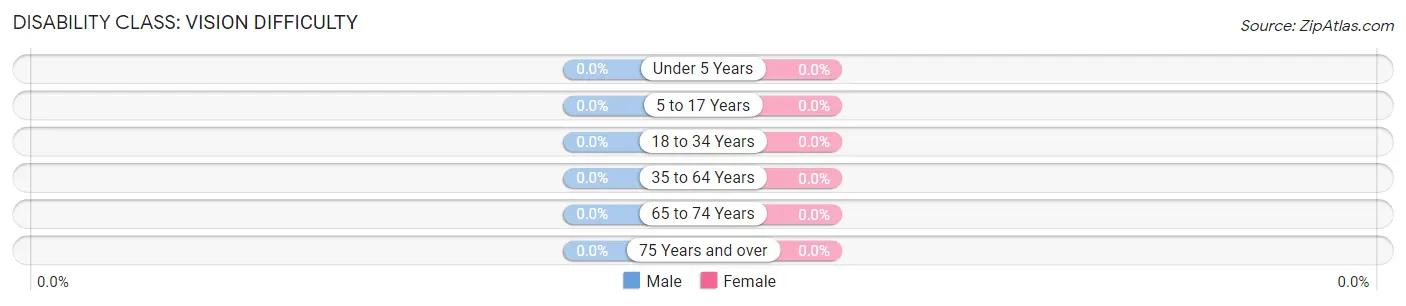
| Age Bracket | Male | Female |
| Under 5 Years | 0 (0.0%) | 0 (0.0%) |
| 5 to 17 Years | 0 (0.0%) | 0 (0.0%) |
| 18 to 34 Years | 0 (0.0%) | 0 (0.0%) |
| 35 to 64 Years | 0 (0.0%) | 0 (0.0%) |
| 65 to 74 Years | 0 (0.0%) | 0 (0.0%) |
| 75 Years and over | 0 (0.0%) | 0 (0.0%) |
Disability Class: Cognitive Difficulty
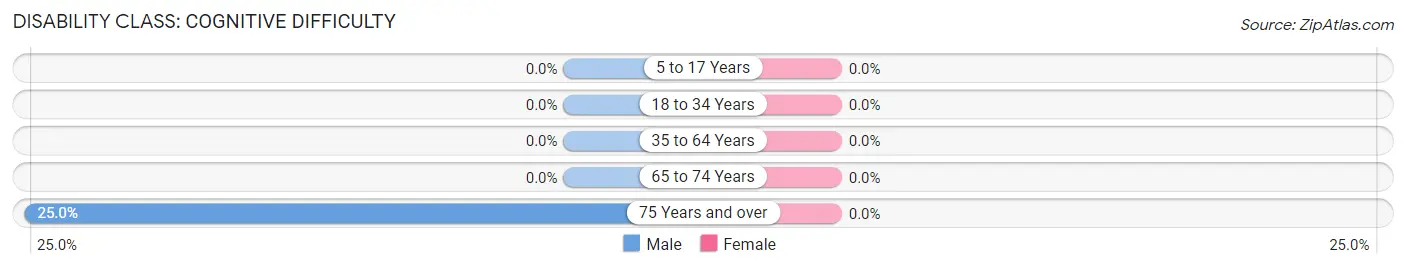
| Age Bracket | Male | Female |
| 5 to 17 Years | 0 (0.0%) | 0 (0.0%) |
| 18 to 34 Years | 0 (0.0%) | 0 (0.0%) |
| 35 to 64 Years | 0 (0.0%) | 0 (0.0%) |
| 65 to 74 Years | 0 (0.0%) | 0 (0.0%) |
| 75 Years and over | 2 (25.0%) | 0 (0.0%) |
Disability Class: Ambulatory Difficulty
| Age Bracket | Male | Female |
| 5 to 17 Years | 0 (0.0%) | 0 (0.0%) |
| 18 to 34 Years | 0 (0.0%) | 0 (0.0%) |
| 35 to 64 Years | 0 (0.0%) | 0 (0.0%) |
| 65 to 74 Years | 0 (0.0%) | 0 (0.0%) |
| 75 Years and over | 1 (12.5%) | 3 (42.9%) |
Disability Class: Self-Care Difficulty

| Age Bracket | Male | Female |
| 5 to 17 Years | 0 (0.0%) | 0 (0.0%) |
| 18 to 34 Years | 0 (0.0%) | 0 (0.0%) |
| 35 to 64 Years | 0 (0.0%) | 0 (0.0%) |
| 65 to 74 Years | 0 (0.0%) | 0 (0.0%) |
| 75 Years and over | 2 (25.0%) | 0 (0.0%) |
Technology Access in Put In Bay
Computing Device Access in Put In Bay
| Device Type | # Households | % Households |
| Desktop or Laptop | 21 | 65.6% |
| Smartphone | 32 | 100.0% |
| Tablet | 20 | 62.5% |
| No Computing Device | 0 | 0.0% |
| Total | 32 | 100.0% |
Internet Access in Put In Bay
| Internet Type | # Households | % Households |
| Dial-Up Internet | 0 | 0.0% |
| Broadband Home | 18 | 56.2% |
| Cellular Data Only | 2 | 6.2% |
| Satellite Internet | 1 | 3.1% |
| No Internet | 11 | 34.4% |
| Total | 32 | 100.0% |
Put In Bay Summary
Put-in-Bay, Ohio is a small village located on South Bass Island in Lake Erie. It is part of the Ottawa County, Ohio and is the county seat. The village is known for its vibrant nightlife, beautiful scenery, and its rich history.
Geography
Put-in-Bay is located on South Bass Island, which is part of the Lake Erie Islands. The island is approximately 2.5 miles long and 1.5 miles wide. It is connected to the mainland by ferry service and is accessible by air via the Put-in-Bay Airport. The island is surrounded by Lake Erie and is home to several small coves and bays. The highest point on the island is Monument Hill, which is approximately 400 feet above sea level.
History
The history of Put-in-Bay dates back to the early 1800s when the island was inhabited by Native Americans. The first permanent settlers arrived in 1810 and the island was officially incorporated as a village in 1853. During the War of 1812, the island was used as a base for the British Navy. In the late 1800s, the island became a popular tourist destination and was home to several resorts.
Economy
The economy of Put-in-Bay is largely based on tourism. The island is home to several hotels, restaurants, and bars, as well as a variety of shops and attractions. The island is also home to several marinas and boat docks, which provide access to the surrounding waters of Lake Erie. The island is also home to several wineries and vineyards, which produce a variety of wines.
Demographics
As of the 2010 census, the population of Put-in-Bay was 138. The racial makeup of the village was 97.1% White, 0.7% African American, 0.7% Native American, 0.7% Asian, and 0.7% from two or more races. The median household income was $45,833 and the median family income was $50,000.
Conclusion
Put-in-Bay, Ohio is a small village located on South Bass Island in Lake Erie. It is part of the Ottawa County, Ohio and is the county seat. The village is known for its vibrant nightlife, beautiful scenery, and its rich history. The economy of Put-in-Bay is largely based on tourism and the island is home to several hotels, restaurants, and bars, as well as a variety of shops and attractions. As of the 2010 census, the population of Put-in-Bay was 138. The racial makeup of the village was 97.1% White, 0.7% African American, 0.7% Native American, 0.7% Asian, and 0.7% from two or more races. The median household income was $45,833 and the median family income was $50,000.
Common Questions
What is Per Capita Income in Put In Bay?
Per Capita income in Put In Bay is $32,769.
What is the Median Family Income in Put In Bay?
Median Family Income in Put In Bay is $88,333.
What is the Median Household income in Put In Bay?
Median Household Income in Put In Bay is $58,750.
What is Income or Wage Gap in Put In Bay?
Income or Wage Gap in Put In Bay is 94.9%.
Women in Put In Bay earn 5.1 cents for every dollar earned by a man.
What is Inequality or Gini Index in Put In Bay?
Inequality or Gini Index in Put In Bay is 0.39.
What is the Total Population of Put In Bay?
Total Population of Put In Bay is 89.
What is the Total Male Population of Put In Bay?
Total Male Population of Put In Bay is 28.
What is the Total Female Population of Put In Bay?
Total Female Population of Put In Bay is 61.
What is the Ratio of Males per 100 Females in Put In Bay?
There are 45.90 Males per 100 Females in Put In Bay.
What is the Ratio of Females per 100 Males in Put In Bay?
There are 217.86 Females per 100 Males in Put In Bay.
What is the Median Population Age in Put In Bay?
Median Population Age in Put In Bay is 41.1 Years.
What is the Average Family Size in Put In Bay
Average Family Size in Put In Bay is 2.7 People.
What is the Average Household Size in Put In Bay
Average Household Size in Put In Bay is 1.8 People.
How Large is the Labor Force in Put In Bay?
There are 46 People in the Labor Forcein in Put In Bay.
What is the Percentage of People in the Labor Force in Put In Bay?
54.1% of People are in the Labor Force in Put In Bay.
What is the Unemployment Rate in Put In Bay?
Unemployment Rate in Put In Bay is 6.5%.