Plymouth, OH Map & Demographics
Plymouth Map
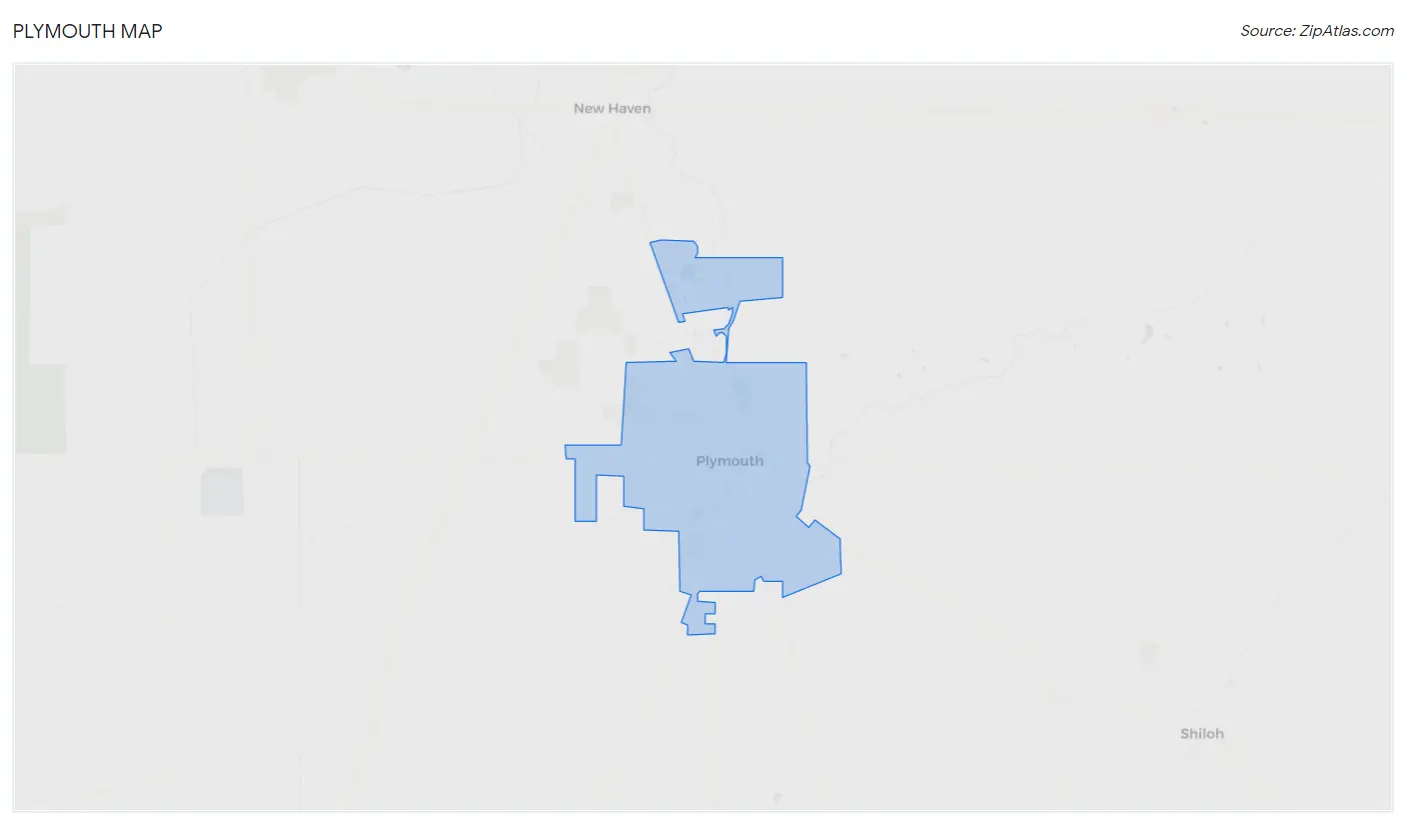
Plymouth Overview
$26,147
PER CAPITA INCOME
$75,847
AVG FAMILY INCOME
$63,594
AVG HOUSEHOLD INCOME
23.4%
WAGE / INCOME GAP [ % ]
76.6¢/ $1
WAGE / INCOME GAP [ $ ]
0.37
INEQUALITY / GINI INDEX
1,788
TOTAL POPULATION
880
MALE POPULATION
908
FEMALE POPULATION
96.92
MALES / 100 FEMALES
103.18
FEMALES / 100 MALES
33.9
MEDIAN AGE
3.1
AVG FAMILY SIZE
2.6
AVG HOUSEHOLD SIZE
870
LABOR FORCE [ PEOPLE ]
64.0%
PERCENT IN LABOR FORCE
7.6%
UNEMPLOYMENT RATE
Plymouth Zip Codes
Income in Plymouth
Income Overview in Plymouth
Per Capita Income in Plymouth is $26,147, while median incomes of families and households are $75,847 and $63,594 respectively.
| Characteristic | Number | Measure |
| Per Capita Income | 1,788 | $26,147 |
| Median Family Income | 489 | $75,847 |
| Mean Family Income | 489 | $81,890 |
| Median Household Income | 697 | $63,594 |
| Mean Household Income | 697 | $72,081 |
| Income Deficit | 489 | $0 |
| Wage / Income Gap (%) | 1,788 | 23.40% |
| Wage / Income Gap ($) | 1,788 | 76.60¢ per $1 |
| Gini / Inequality Index | 1,788 | 0.37 |
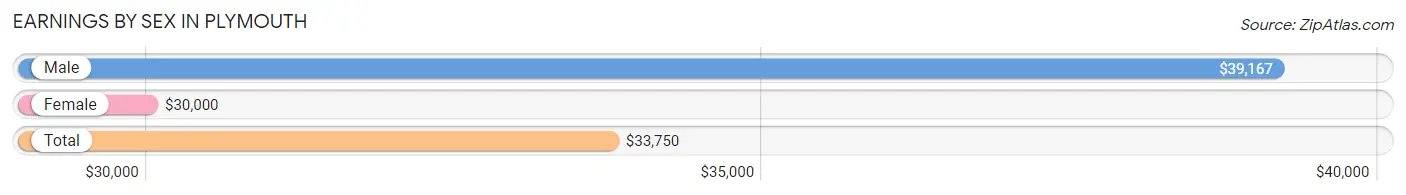
Earnings by Sex in Plymouth
Average Earnings in Plymouth are $33,750, $39,167 for men and $30,000 for women, a difference of 23.4%.
| Sex | Number | Average Earnings |
| Male | 526 (56.3%) | $39,167 |
| Female | 408 (43.7%) | $30,000 |
| Total | 934 (100.0%) | $33,750 |
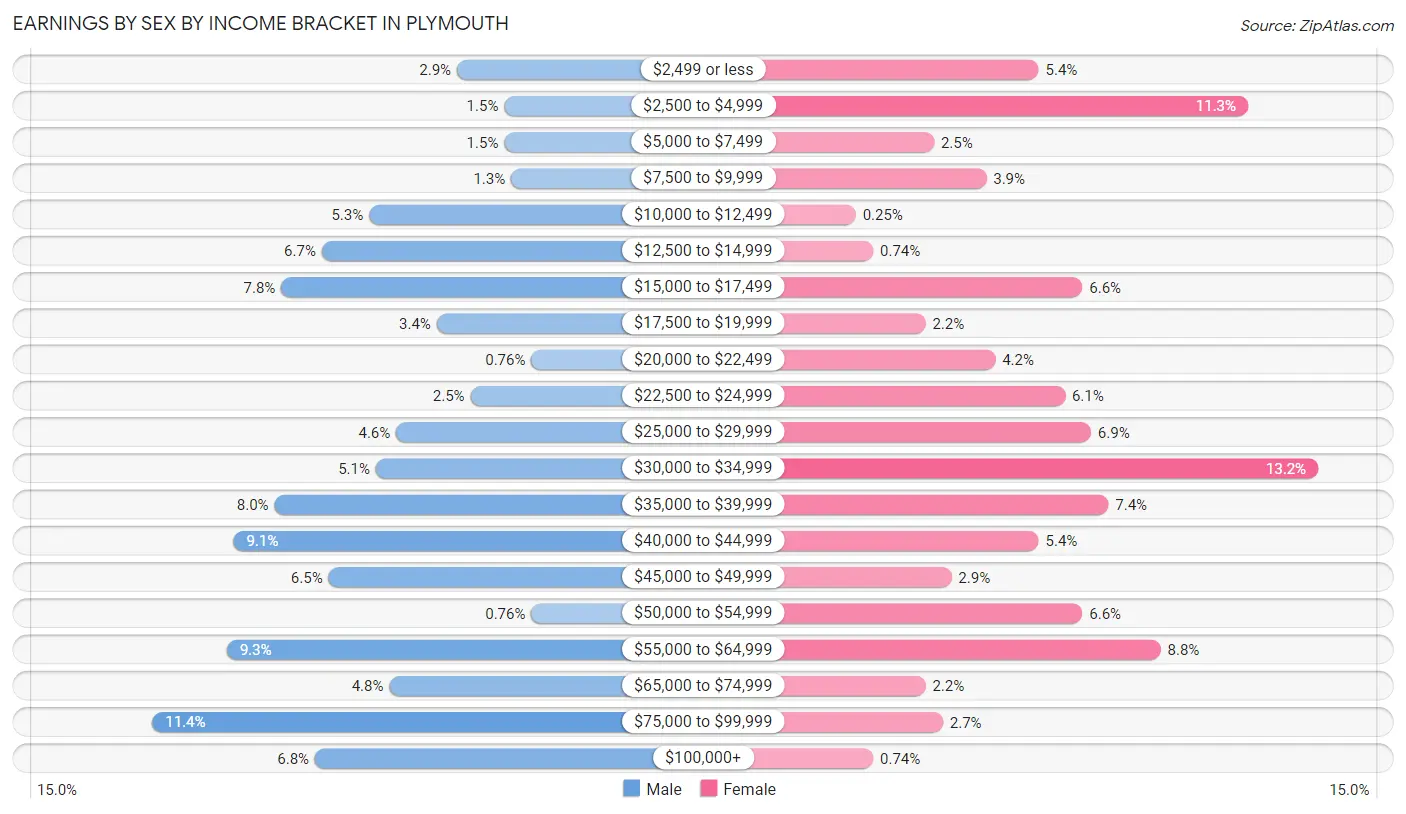
Earnings by Sex by Income Bracket in Plymouth
The most common earnings brackets in Plymouth are $75,000 to $99,999 for men (60 | 11.4%) and $30,000 to $34,999 for women (54 | 13.2%).
| Income | Male | Female |
| $2,499 or less | 15 (2.9%) | 22 (5.4%) |
| $2,500 to $4,999 | 8 (1.5%) | 46 (11.3%) |
| $5,000 to $7,499 | 8 (1.5%) | 10 (2.5%) |
| $7,500 to $9,999 | 7 (1.3%) | 16 (3.9%) |
| $10,000 to $12,499 | 28 (5.3%) | 1 (0.3%) |
| $12,500 to $14,999 | 35 (6.7%) | 3 (0.7%) |
| $15,000 to $17,499 | 41 (7.8%) | 27 (6.6%) |
| $17,500 to $19,999 | 18 (3.4%) | 9 (2.2%) |
| $20,000 to $22,499 | 4 (0.8%) | 17 (4.2%) |
| $22,500 to $24,999 | 13 (2.5%) | 25 (6.1%) |
| $25,000 to $29,999 | 24 (4.6%) | 28 (6.9%) |
| $30,000 to $34,999 | 27 (5.1%) | 54 (13.2%) |
| $35,000 to $39,999 | 42 (8.0%) | 30 (7.3%) |
| $40,000 to $44,999 | 48 (9.1%) | 22 (5.4%) |
| $45,000 to $49,999 | 34 (6.5%) | 12 (2.9%) |
| $50,000 to $54,999 | 4 (0.8%) | 27 (6.6%) |
| $55,000 to $64,999 | 49 (9.3%) | 36 (8.8%) |
| $65,000 to $74,999 | 25 (4.8%) | 9 (2.2%) |
| $75,000 to $99,999 | 60 (11.4%) | 11 (2.7%) |
| $100,000+ | 36 (6.8%) | 3 (0.7%) |
| Total | 526 (100.0%) | 408 (100.0%) |
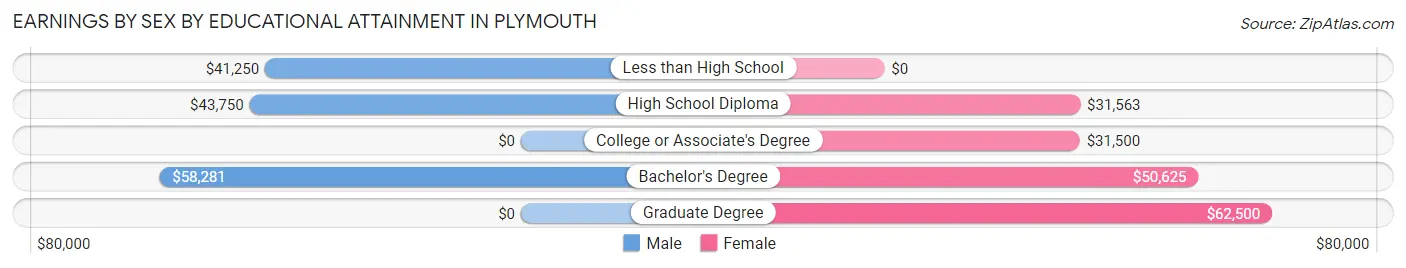
Earnings by Sex by Educational Attainment in Plymouth
Average earnings in Plymouth are $43,528 for men and $33,636 for women, a difference of 22.7%. Men with an educational attainment of bachelor's degree enjoy the highest average annual earnings of $58,281, while those with less than high school education earn the least with $41,250. Women with an educational attainment of graduate degree earn the most with the average annual earnings of $62,500, while those with college or associate's degree education have the smallest earnings of $31,500.
| Educational Attainment | Male Income | Female Income |
| Less than High School | $41,250 | $0 |
| High School Diploma | $43,750 | $31,563 |
| College or Associate's Degree | - | - |
| Bachelor's Degree | $58,281 | $50,625 |
| Graduate Degree | - | - |
| Total | $43,528 | $33,636 |
Family Income in Plymouth
Family Income Brackets in Plymouth
According to the Plymouth family income data, there are 128 families falling into the $75,000 to $99,999 income range, which is the most common income bracket and makes up 26.2% of all families. Conversely, the $200,000+ income bracket is the least frequent group with only 7 families (1.4%) belonging to this category.
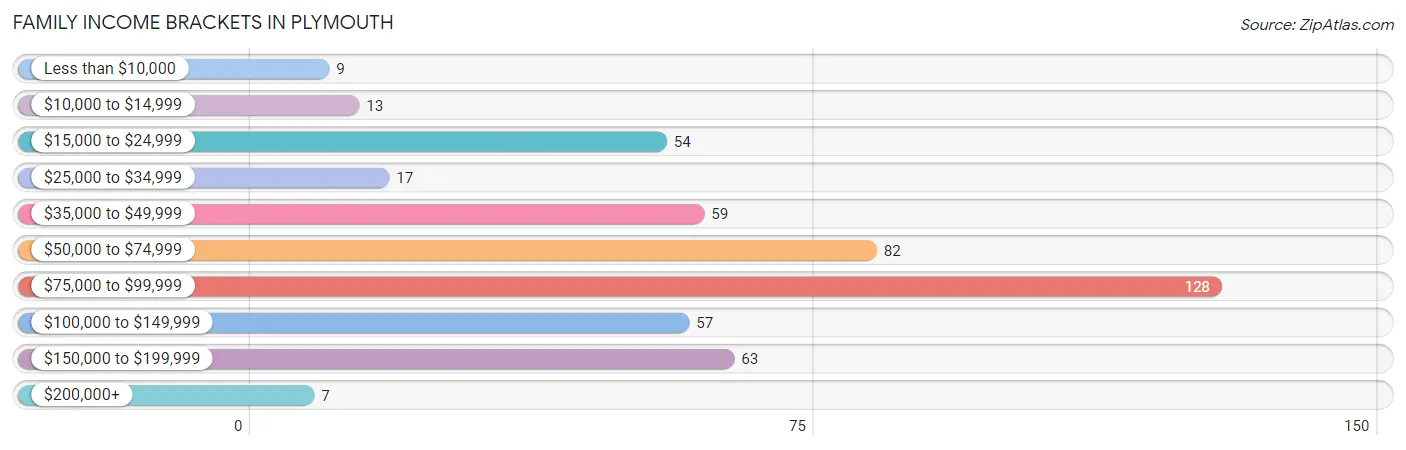
| Income Bracket | # Families | % Families |
| Less than $10,000 | 9 | 1.8% |
| $10,000 to $14,999 | 13 | 2.7% |
| $15,000 to $24,999 | 54 | 11.0% |
| $25,000 to $34,999 | 17 | 3.5% |
| $35,000 to $49,999 | 59 | 12.1% |
| $50,000 to $74,999 | 82 | 16.8% |
| $75,000 to $99,999 | 128 | 26.2% |
| $100,000 to $149,999 | 57 | 11.7% |
| $150,000 to $199,999 | 63 | 12.9% |
| $200,000+ | 7 | 1.4% |
Family Income by Famaliy Size in Plymouth
5-person families (81 | 16.6%) account for the highest median family income in Plymouth with $93,711 per family, while 2-person families (204 | 41.7%) have the highest median income of $36,964 per family member.
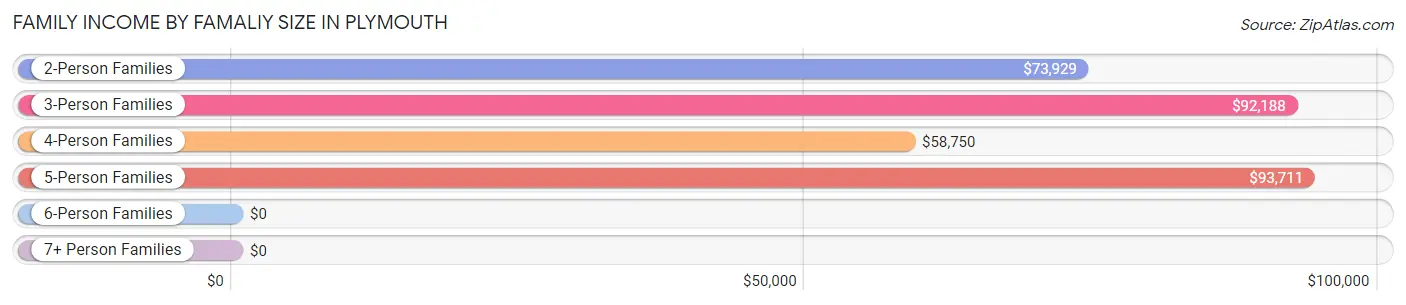
| Income Bracket | # Families | Median Income |
| 2-Person Families | 204 (41.7%) | $73,929 |
| 3-Person Families | 139 (28.4%) | $92,188 |
| 4-Person Families | 50 (10.2%) | $58,750 |
| 5-Person Families | 81 (16.6%) | $93,711 |
| 6-Person Families | 13 (2.7%) | $0 |
| 7+ Person Families | 2 (0.4%) | $0 |
| Total | 489 (100.0%) | $75,847 |
Family Income by Number of Earners in Plymouth
The median family income in Plymouth is $75,847, with families comprising 3+ earners (85) having the highest median family income of $140,938, while families with 1 earner (140) have the lowest median family income of $45,000, accounting for 17.4% and 28.6% of families, respectively.
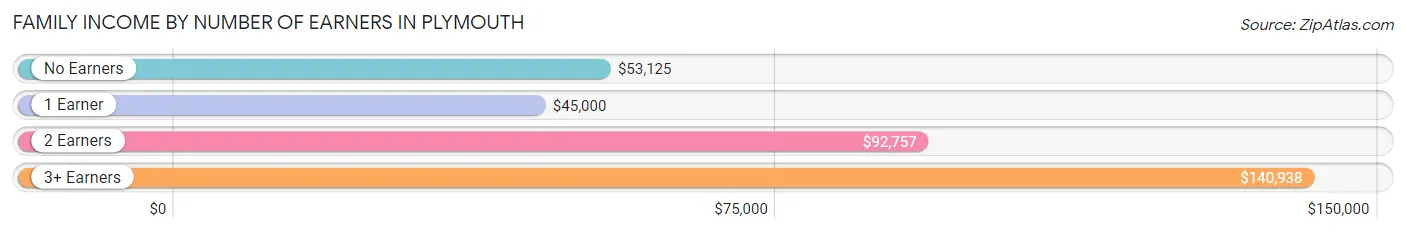
| Number of Earners | # Families | Median Income |
| No Earners | 77 (15.8%) | $53,125 |
| 1 Earner | 140 (28.6%) | $45,000 |
| 2 Earners | 187 (38.2%) | $92,757 |
| 3+ Earners | 85 (17.4%) | $140,938 |
| Total | 489 (100.0%) | $75,847 |
Household Income in Plymouth
Household Income Brackets in Plymouth
With 156 households falling in the category, the $75,000 to $99,999 income range is the most frequent in Plymouth, accounting for 22.4% of all households. In contrast, only 11 households (1.6%) fall into the less than $10,000 income bracket, making it the least populous group.
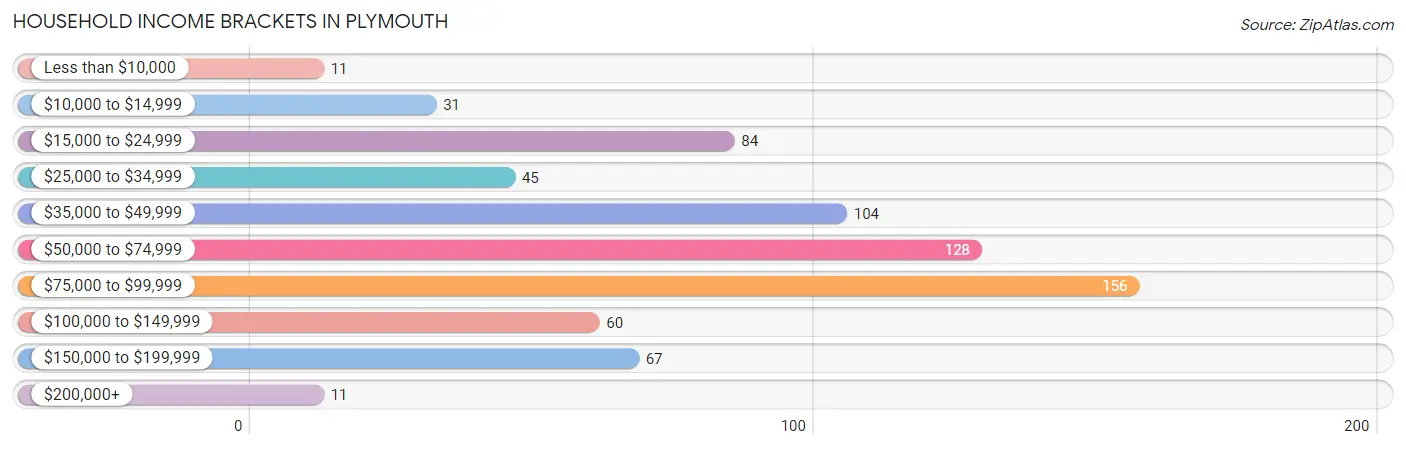
| Income Bracket | # Households | % Households |
| Less than $10,000 | 11 | 1.6% |
| $10,000 to $14,999 | 31 | 4.4% |
| $15,000 to $24,999 | 84 | 12.1% |
| $25,000 to $34,999 | 45 | 6.5% |
| $35,000 to $49,999 | 104 | 14.9% |
| $50,000 to $74,999 | 128 | 18.4% |
| $75,000 to $99,999 | 156 | 22.4% |
| $100,000 to $149,999 | 60 | 8.6% |
| $150,000 to $199,999 | 67 | 9.6% |
| $200,000+ | 11 | 1.6% |
Household Income by Householder Age in Plymouth
The median household income in Plymouth is $63,594, with the highest median household income of $76,051 found in the 45 to 64 years age bracket for the primary householder. A total of 273 households (39.2%) fall into this category. Meanwhile, the 15 to 24 years age bracket for the primary householder has the lowest median household income of $45,156, with 29 households (4.2%) in this group.
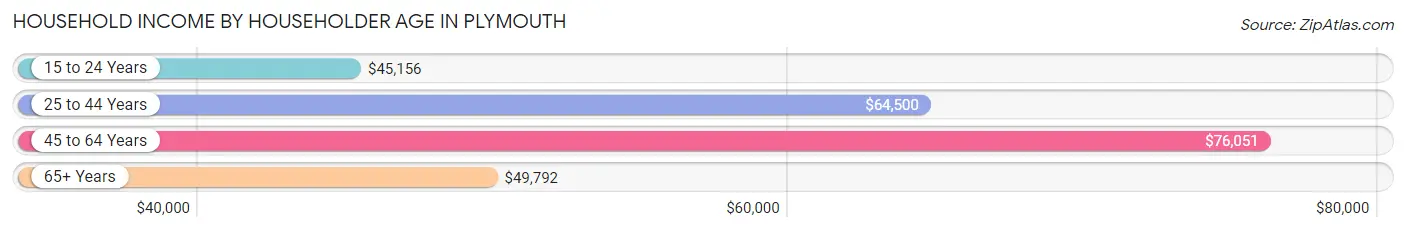
| Income Bracket | # Households | Median Income |
| 15 to 24 Years | 29 (4.2%) | $45,156 |
| 25 to 44 Years | 230 (33.0%) | $64,500 |
| 45 to 64 Years | 273 (39.2%) | $76,051 |
| 65+ Years | 165 (23.7%) | $49,792 |
| Total | 697 (100.0%) | $63,594 |
Poverty in Plymouth
Income Below Poverty by Sex and Age in Plymouth
With 9.6% poverty level for males and 9.7% for females among the residents of Plymouth, 12 to 14 year old males and 15 year old females are the most vulnerable to poverty, with 5 males (22.7%) and 3 females (50.0%) in their respective age groups living below the poverty level.
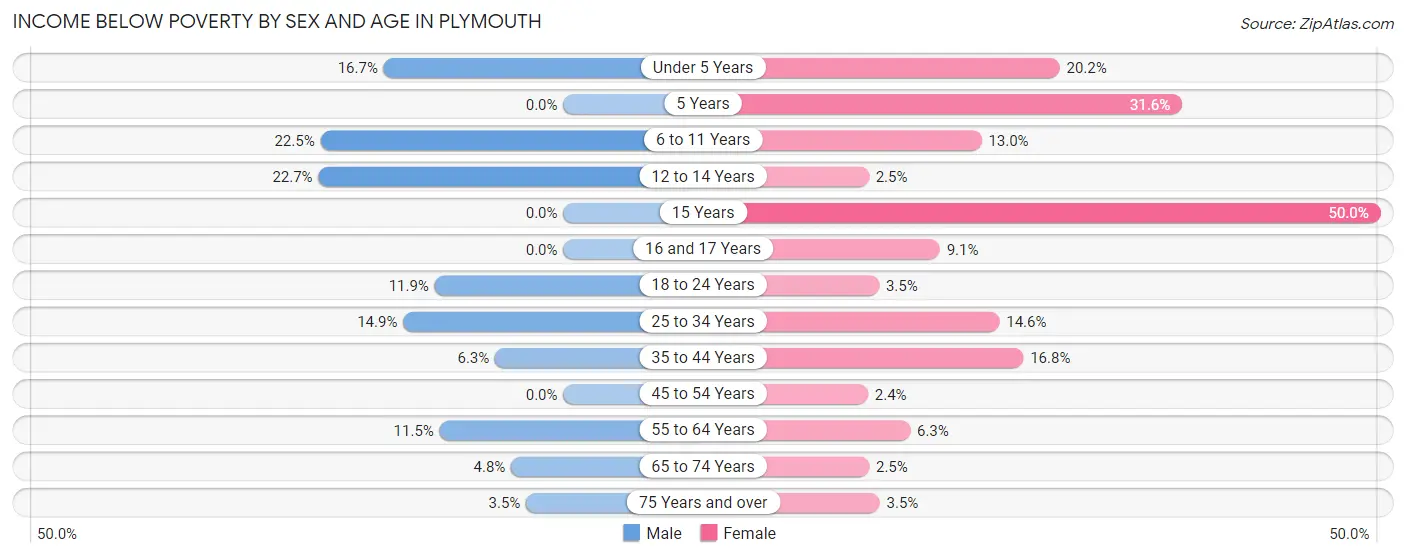
| Age Bracket | Male | Female |
| Under 5 Years | 16 (16.7%) | 19 (20.2%) |
| 5 Years | 0 (0.0%) | 6 (31.6%) |
| 6 to 11 Years | 16 (22.5%) | 7 (13.0%) |
| 12 to 14 Years | 5 (22.7%) | 1 (2.5%) |
| 15 Years | 0 (0.0%) | 3 (50.0%) |
| 16 and 17 Years | 0 (0.0%) | 1 (9.1%) |
| 18 to 24 Years | 8 (11.9%) | 4 (3.5%) |
| 25 to 34 Years | 22 (14.9%) | 19 (14.6%) |
| 35 to 44 Years | 5 (6.3%) | 16 (16.8%) |
| 45 to 54 Years | 0 (0.0%) | 3 (2.4%) |
| 55 to 64 Years | 7 (11.5%) | 5 (6.3%) |
| 65 to 74 Years | 3 (4.8%) | 2 (2.5%) |
| 75 Years and over | 2 (3.5%) | 2 (3.5%) |
| Total | 84 (9.6%) | 88 (9.7%) |
Income Above Poverty by Sex and Age in Plymouth
According to the poverty statistics in Plymouth, males aged 5 years and females aged 45 to 54 years are the age groups that are most secure financially, with 100.0% of males and 97.6% of females in these age groups living above the poverty line.
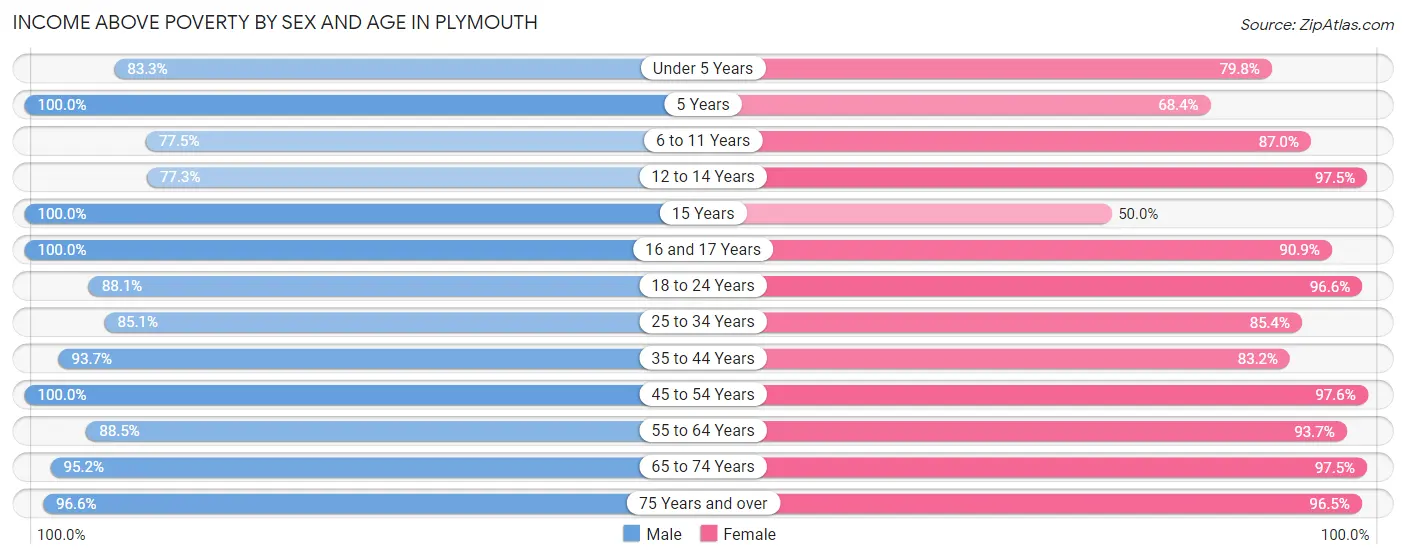
| Age Bracket | Male | Female |
| Under 5 Years | 80 (83.3%) | 75 (79.8%) |
| 5 Years | 8 (100.0%) | 13 (68.4%) |
| 6 to 11 Years | 55 (77.5%) | 47 (87.0%) |
| 12 to 14 Years | 17 (77.3%) | 39 (97.5%) |
| 15 Years | 5 (100.0%) | 3 (50.0%) |
| 16 and 17 Years | 21 (100.0%) | 10 (90.9%) |
| 18 to 24 Years | 59 (88.1%) | 112 (96.6%) |
| 25 to 34 Years | 126 (85.1%) | 111 (85.4%) |
| 35 to 44 Years | 74 (93.7%) | 79 (83.2%) |
| 45 to 54 Years | 173 (100.0%) | 121 (97.6%) |
| 55 to 64 Years | 54 (88.5%) | 74 (93.7%) |
| 65 to 74 Years | 59 (95.2%) | 77 (97.5%) |
| 75 Years and over | 56 (96.6%) | 55 (96.5%) |
| Total | 787 (90.4%) | 816 (90.3%) |
Income Below Poverty Among Married-Couple Families in Plymouth
The poverty statistics for married-couple families in Plymouth show that 3.9% or 13 of the total 336 families live below the poverty line. Families with 3 or 4 children have the highest poverty rate of 12.1%, comprising of 8 families. On the other hand, families with 1 or 2 children have the lowest poverty rate of 0.0%, which includes 0 families.
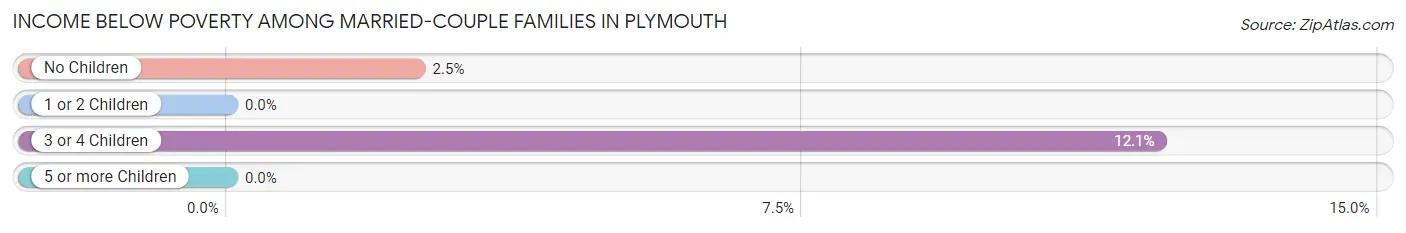
| Children | Above Poverty | Below Poverty |
| No Children | 199 (97.6%) | 5 (2.5%) |
| 1 or 2 Children | 65 (100.0%) | 0 (0.0%) |
| 3 or 4 Children | 58 (87.9%) | 8 (12.1%) |
| 5 or more Children | 1 (100.0%) | 0 (0.0%) |
| Total | 323 (96.1%) | 13 (3.9%) |
Income Below Poverty Among Single-Parent Households in Plymouth
According to the poverty data in Plymouth, 12.5% or 7 single-father households and 23.7% or 23 single-mother households are living below the poverty line. Among single-father households, those with no children have the highest poverty rate, with 7 households (20.6%) experiencing poverty. Likewise, among single-mother households, those with 3 or 4 children have the highest poverty rate, with 3 households (100.0%) falling below the poverty line.
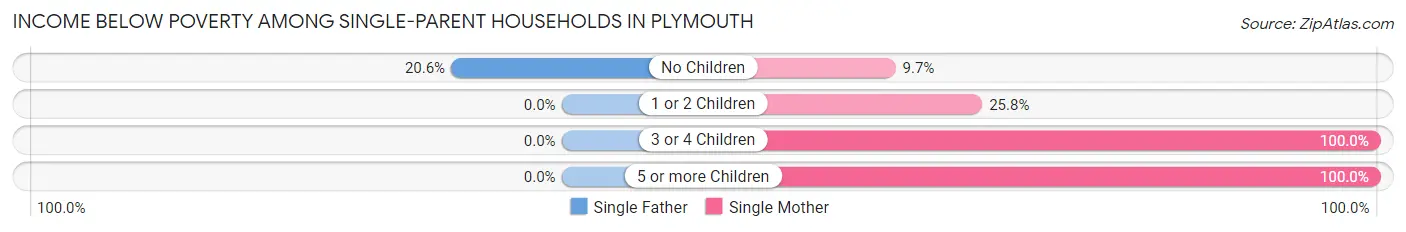
| Children | Single Father | Single Mother |
| No Children | 7 (20.6%) | 3 (9.7%) |
| 1 or 2 Children | 0 (0.0%) | 16 (25.8%) |
| 3 or 4 Children | 0 (0.0%) | 3 (100.0%) |
| 5 or more Children | 0 (0.0%) | 1 (100.0%) |
| Total | 7 (12.5%) | 23 (23.7%) |
Income Below Poverty Among Married-Couple vs Single-Parent Households in Plymouth
The poverty data for Plymouth shows that 13 of the married-couple family households (3.9%) and 30 of the single-parent households (19.6%) are living below the poverty level. Within the married-couple family households, those with 3 or 4 children have the highest poverty rate, with 8 households (12.1%) falling below the poverty line. Among the single-parent households, those with 3 or 4 children have the highest poverty rate, with 3 household (100.0%) living below poverty.
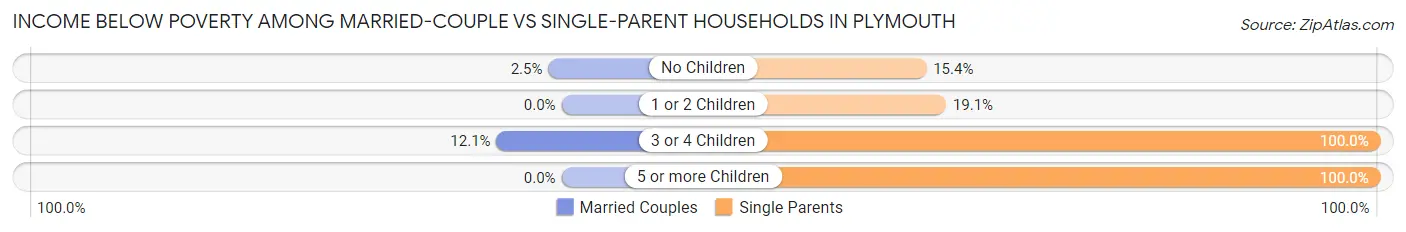
| Children | Married-Couple Families | Single-Parent Households |
| No Children | 5 (2.5%) | 10 (15.4%) |
| 1 or 2 Children | 0 (0.0%) | 16 (19.1%) |
| 3 or 4 Children | 8 (12.1%) | 3 (100.0%) |
| 5 or more Children | 0 (0.0%) | 1 (100.0%) |
| Total | 13 (3.9%) | 30 (19.6%) |
Race in Plymouth
The most populous races in Plymouth are White / Caucasian (1,679 | 93.9%), Hispanic or Latino (74 | 4.1%), and Two or more Races (57 | 3.2%).
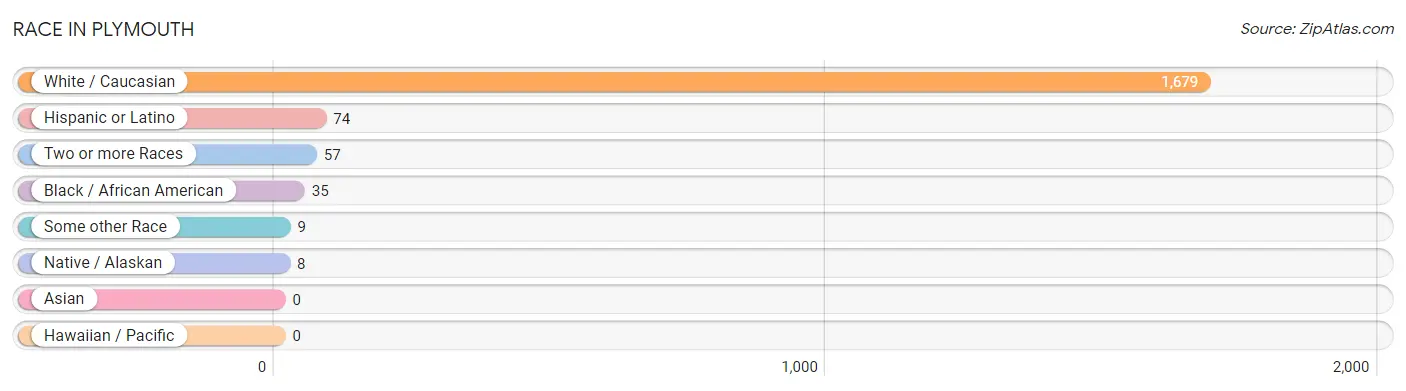
| Race | # Population | % Population |
| Asian | 0 | 0.0% |
| Black / African American | 35 | 2.0% |
| Hawaiian / Pacific | 0 | 0.0% |
| Hispanic or Latino | 74 | 4.1% |
| Native / Alaskan | 8 | 0.4% |
| White / Caucasian | 1,679 | 93.9% |
| Two or more Races | 57 | 3.2% |
| Some other Race | 9 | 0.5% |
| Total | 1,788 | 100.0% |
Ancestry in Plymouth
The most populous ancestries reported in Plymouth are American (253 | 14.1%), German (224 | 12.5%), English (216 | 12.1%), Irish (129 | 7.2%), and French (79 | 4.4%), together accounting for 50.4% of all Plymouth residents.
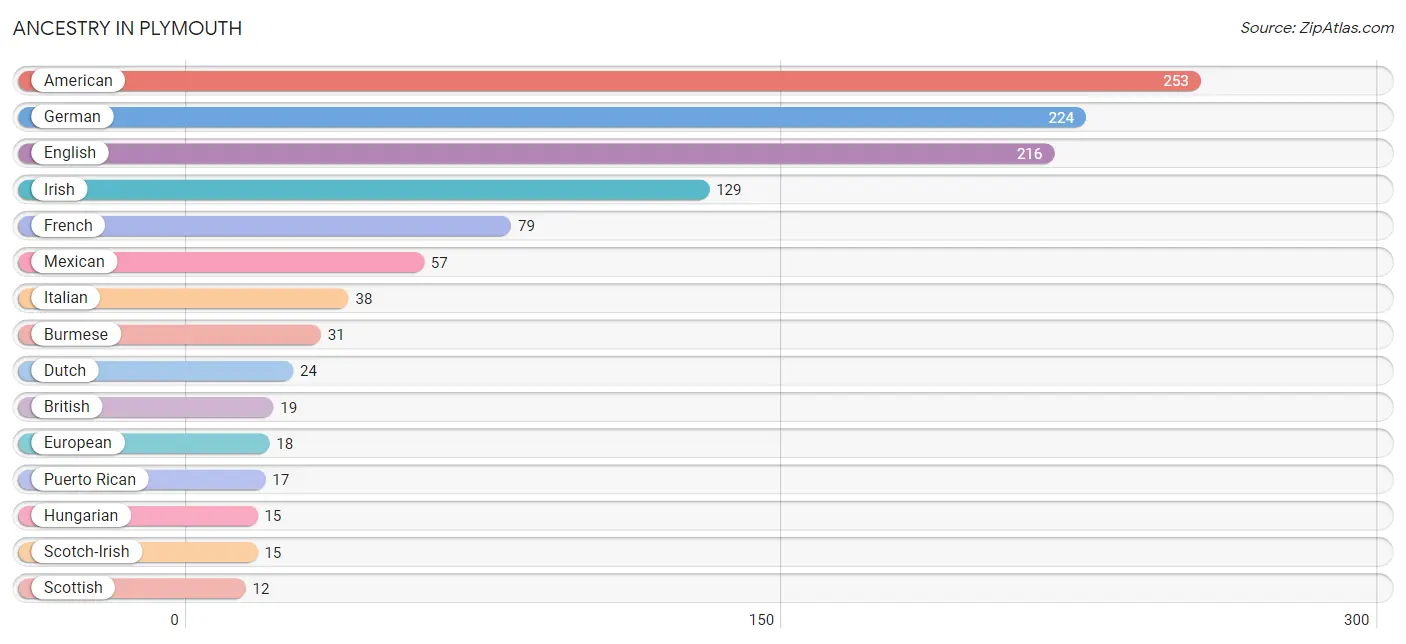
| Ancestry | # Population | % Population |
| American | 253 | 14.1% |
| Apache | 3 | 0.2% |
| British | 19 | 1.1% |
| Burmese | 31 | 1.7% |
| Dutch | 24 | 1.3% |
| English | 216 | 12.1% |
| European | 18 | 1.0% |
| French | 79 | 4.4% |
| French Canadian | 8 | 0.4% |
| German | 224 | 12.5% |
| Hungarian | 15 | 0.8% |
| Irish | 129 | 7.2% |
| Italian | 38 | 2.1% |
| Korean | 8 | 0.4% |
| Mexican | 57 | 3.2% |
| Pennsylvania German | 5 | 0.3% |
| Polish | 4 | 0.2% |
| Puerto Rican | 17 | 0.9% |
| Scotch-Irish | 15 | 0.8% |
| Scottish | 12 | 0.7% |
| Slovak | 2 | 0.1% |
| Swiss | 6 | 0.3% |
| Welsh | 12 | 0.7% | View All 23 Rows |
Immigrants in Plymouth
The most numerous immigrant groups reported in Plymouth came from Central America (32 | 1.8%), Latin America (32 | 1.8%), and Mexico (32 | 1.8%), together accounting for 5.4% of all Plymouth residents.
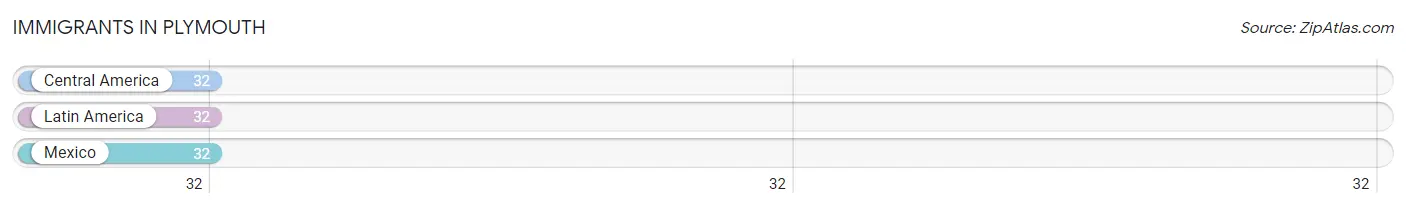
| Immigration Origin | # Population | % Population |
| Central America | 32 | 1.8% |
| Latin America | 32 | 1.8% |
| Mexico | 32 | 1.8% | View All 3 Rows |
Sex and Age in Plymouth
Sex and Age in Plymouth
The most populous age groups in Plymouth are 45 to 49 Years (109 | 12.4%) for men and Under 5 Years (94 | 10.3%) for women.
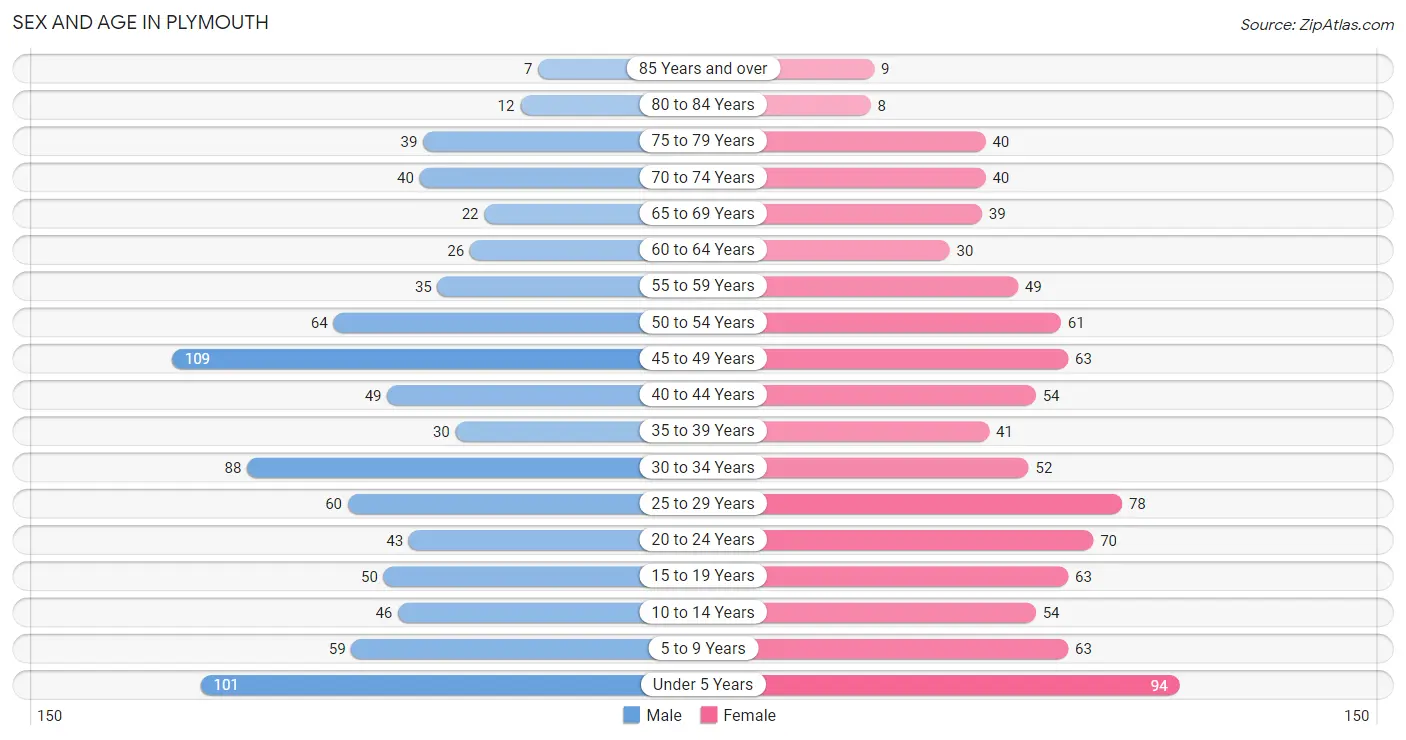
| Age Bracket | Male | Female |
| Under 5 Years | 101 (11.5%) | 94 (10.3%) |
| 5 to 9 Years | 59 (6.7%) | 63 (6.9%) |
| 10 to 14 Years | 46 (5.2%) | 54 (5.9%) |
| 15 to 19 Years | 50 (5.7%) | 63 (6.9%) |
| 20 to 24 Years | 43 (4.9%) | 70 (7.7%) |
| 25 to 29 Years | 60 (6.8%) | 78 (8.6%) |
| 30 to 34 Years | 88 (10.0%) | 52 (5.7%) |
| 35 to 39 Years | 30 (3.4%) | 41 (4.5%) |
| 40 to 44 Years | 49 (5.6%) | 54 (5.9%) |
| 45 to 49 Years | 109 (12.4%) | 63 (6.9%) |
| 50 to 54 Years | 64 (7.3%) | 61 (6.7%) |
| 55 to 59 Years | 35 (4.0%) | 49 (5.4%) |
| 60 to 64 Years | 26 (2.9%) | 30 (3.3%) |
| 65 to 69 Years | 22 (2.5%) | 39 (4.3%) |
| 70 to 74 Years | 40 (4.5%) | 40 (4.4%) |
| 75 to 79 Years | 39 (4.4%) | 40 (4.4%) |
| 80 to 84 Years | 12 (1.4%) | 8 (0.9%) |
| 85 Years and over | 7 (0.8%) | 9 (1.0%) |
| Total | 880 (100.0%) | 908 (100.0%) |
Families and Households in Plymouth
Median Family Size in Plymouth
The median family size in Plymouth is 3.09 persons per family, with married-couple families (336 | 68.7%) accounting for the largest median family size of 3.29 persons per family. On the other hand, single male/father families (56 | 11.5%) represent the smallest median family size with 2.57 persons per family.
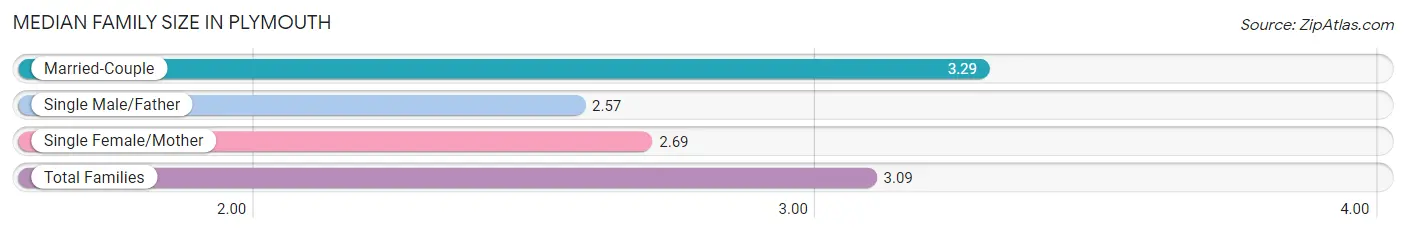
| Family Type | # Families | Family Size |
| Married-Couple | 336 (68.7%) | 3.29 |
| Single Male/Father | 56 (11.5%) | 2.57 |
| Single Female/Mother | 97 (19.8%) | 2.69 |
| Total Families | 489 (100.0%) | 3.09 |
Median Household Size in Plymouth
The median household size in Plymouth is 2.57 persons per household, with married-couple households (336 | 48.2%) accounting for the largest median household size of 3.34 persons per household. non-family households (208 | 29.8%) represent the smallest median household size with 1.09 persons per household.
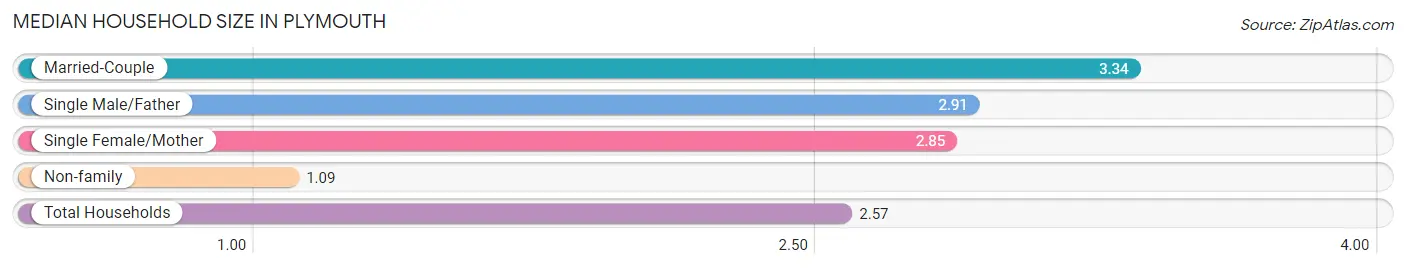
| Household Type | # Households | Household Size |
| Married-Couple | 336 (48.2%) | 3.34 |
| Single Male/Father | 56 (8.0%) | 2.91 |
| Single Female/Mother | 97 (13.9%) | 2.85 |
| Non-family | 208 (29.8%) | 1.09 |
| Total Households | 697 (100.0%) | 2.57 |
Household Size by Marriage Status in Plymouth
Out of a total of 697 households in Plymouth, 489 (70.2%) are family households, while 208 (29.8%) are nonfamily households. The most numerous type of family households are 2-person households, comprising 187, and the most common type of nonfamily households are 1-person households, comprising 189.
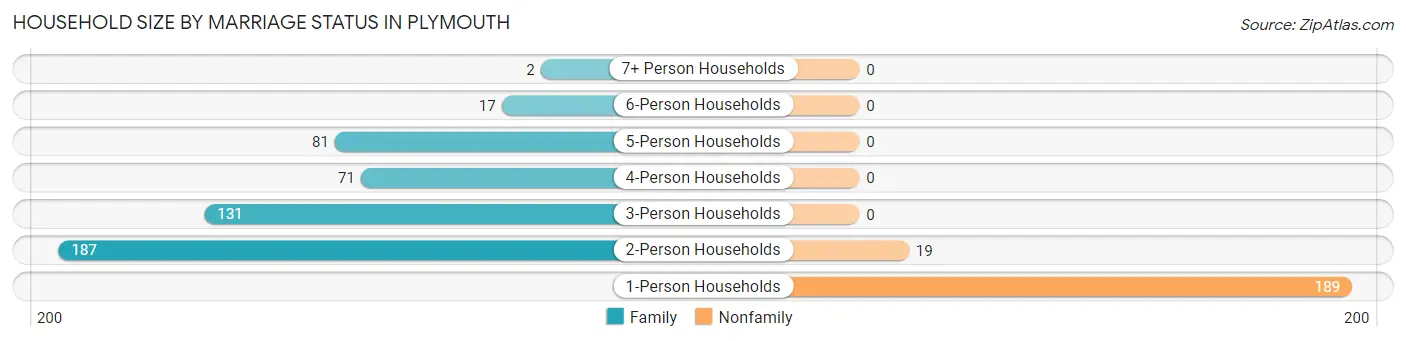
| Household Size | Family Households | Nonfamily Households |
| 1-Person Households | - | 189 (27.1%) |
| 2-Person Households | 187 (26.8%) | 19 (2.7%) |
| 3-Person Households | 131 (18.8%) | 0 (0.0%) |
| 4-Person Households | 71 (10.2%) | 0 (0.0%) |
| 5-Person Households | 81 (11.6%) | 0 (0.0%) |
| 6-Person Households | 17 (2.4%) | 0 (0.0%) |
| 7+ Person Households | 2 (0.3%) | 0 (0.0%) |
| Total | 489 (70.2%) | 208 (29.8%) |
Female Fertility in Plymouth
Fertility by Age in Plymouth
Average fertility rate in Plymouth is 53.0 births per 1,000 women. Women in the age bracket of 20 to 34 years have the highest fertility rate with 115.0 births per 1,000 women. Women in the age bracket of 20 to 34 years acount for 100.0% of all women with births.
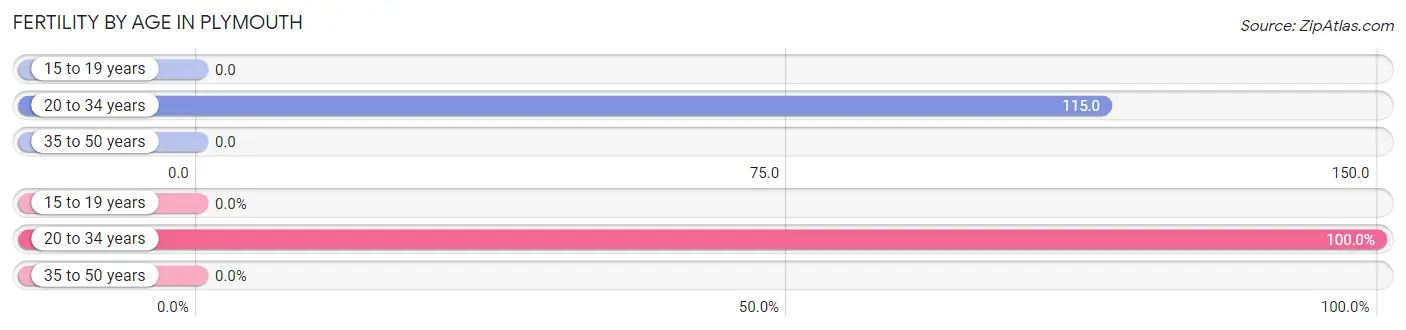
| Age Bracket | Women with Births | Births / 1,000 Women |
| 15 to 19 years | 0 (0.0%) | 0.0 |
| 20 to 34 years | 23 (100.0%) | 115.0 |
| 35 to 50 years | 0 (0.0%) | 0.0 |
| Total | 23 (100.0%) | 53.0 |
Fertility by Age by Marriage Status in Plymouth
69.6% of women with births (23) in Plymouth are married. The highest percentage of unmarried women with births falls into 20 to 34 years age bracket with 30.4% of them unmarried at the time of birth, while the lowest percentage of unmarried women with births belong to 20 to 34 years age bracket with 30.4% of them unmarried.
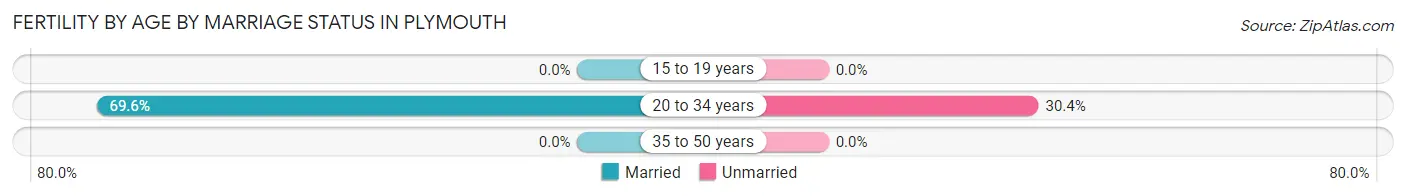
| Age Bracket | Married | Unmarried |
| 15 to 19 years | 0 (0.0%) | 0 (0.0%) |
| 20 to 34 years | 16 (69.6%) | 7 (30.4%) |
| 35 to 50 years | 0 (0.0%) | 0 (0.0%) |
| Total | 16 (69.6%) | 7 (30.4%) |
Fertility by Education in Plymouth
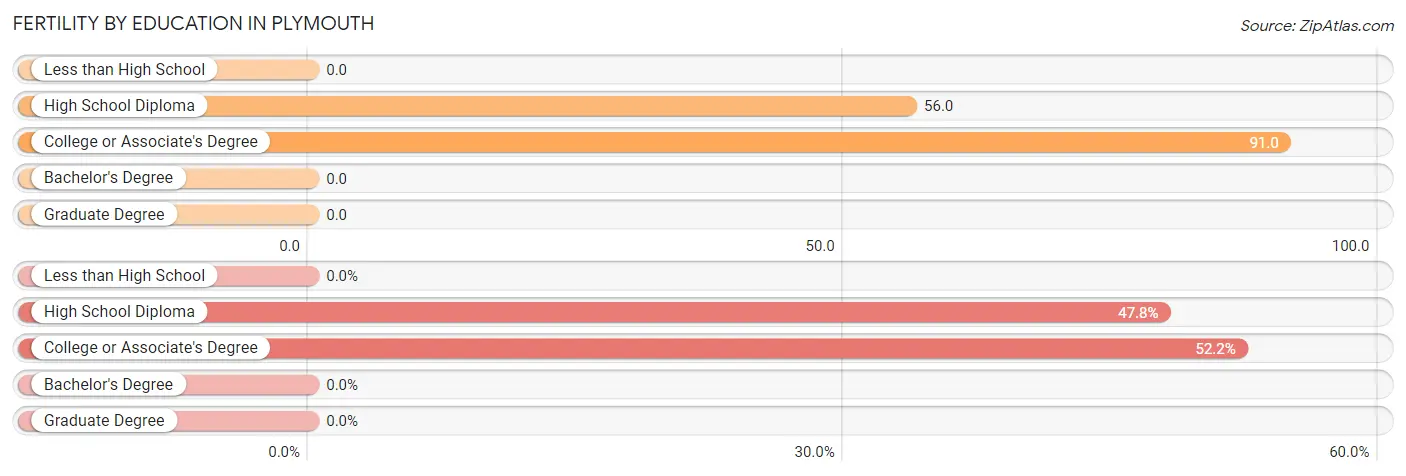
| Educational Attainment | Women with Births | Births / 1,000 Women |
| Less than High School | 0 (0.0%) | 0.0 |
| High School Diploma | 11 (47.8%) | 56.0 |
| College or Associate's Degree | 12 (52.2%) | 91.0 |
| Bachelor's Degree | 0 (0.0%) | 0.0 |
| Graduate Degree | 0 (0.0%) | 0.0 |
| Total | 23 (100.0%) | 53.0 |
Fertility by Education by Marriage Status in Plymouth
30.4% of women with births in Plymouth are unmarried. Women with the educational attainment of college or associate's degree are most likely to be married with 100.0% of them married at childbirth, while women with the educational attainment of high school diploma are least likely to be married with 63.6% of them unmarried at childbirth.
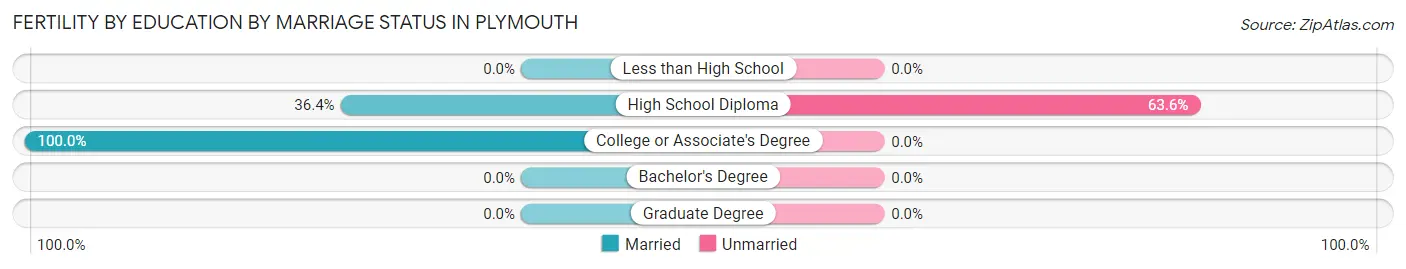
| Educational Attainment | Married | Unmarried |
| Less than High School | 0 (0.0%) | 0 (0.0%) |
| High School Diploma | 4 (36.4%) | 7 (63.6%) |
| College or Associate's Degree | 12 (100.0%) | 0 (0.0%) |
| Bachelor's Degree | 0 (0.0%) | 0 (0.0%) |
| Graduate Degree | 0 (0.0%) | 0 (0.0%) |
| Total | 16 (69.6%) | 7 (30.4%) |
Employment Characteristics in Plymouth
Employment by Class of Employer in Plymouth
Among the 794 employed individuals in Plymouth, private company employees (647 | 81.5%), local government employees (52 | 6.6%), and self-employed (not incorporated) (43 | 5.4%) make up the most common classes of employment.
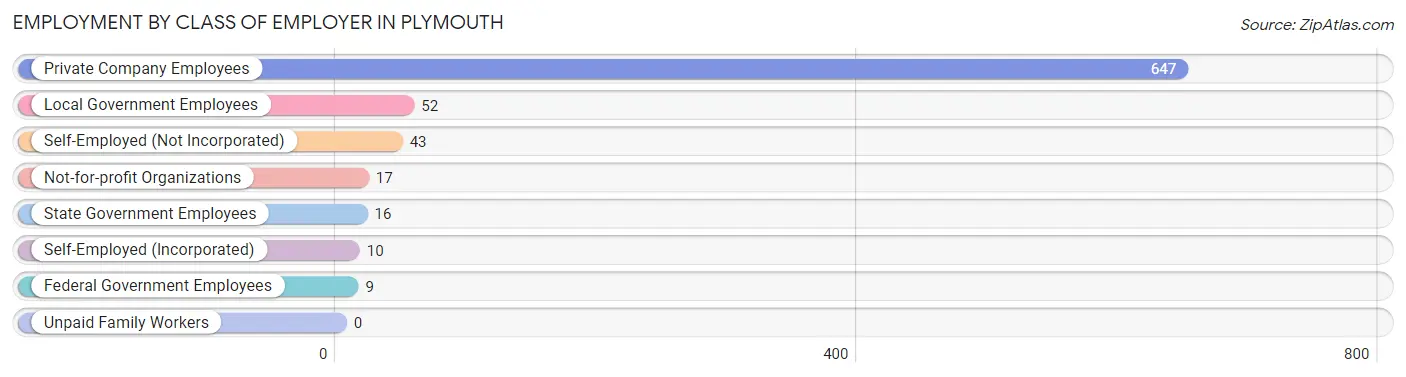
| Employer Class | # Employees | % Employees |
| Private Company Employees | 647 | 81.5% |
| Self-Employed (Incorporated) | 10 | 1.3% |
| Self-Employed (Not Incorporated) | 43 | 5.4% |
| Not-for-profit Organizations | 17 | 2.1% |
| Local Government Employees | 52 | 6.6% |
| State Government Employees | 16 | 2.0% |
| Federal Government Employees | 9 | 1.1% |
| Unpaid Family Workers | 0 | 0.0% |
| Total | 794 | 100.0% |
Employment Status by Age in Plymouth
According to the labor force statistics for Plymouth, out of the total population over 16 years of age (1,360), 64.0% or 870 individuals are in the labor force, with 7.6% or 66 of them unemployed. The age group with the highest labor force participation rate is 30 to 34 years, with 99.3% or 139 individuals in the labor force. Within the labor force, the 16 to 19 years age range has the highest percentage of unemployed individuals, with 38.5% or 10 of them being unemployed.
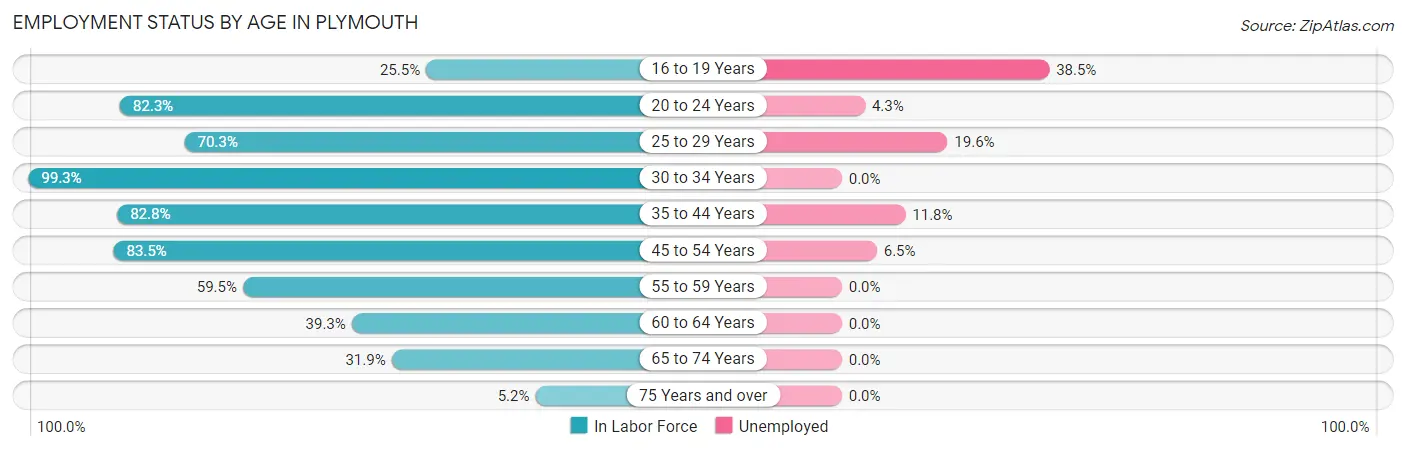
| Age Bracket | In Labor Force | Unemployed |
| 16 to 19 Years | 26 (25.5%) | 10 (38.5%) |
| 20 to 24 Years | 93 (82.3%) | 4 (4.3%) |
| 25 to 29 Years | 97 (70.3%) | 19 (19.6%) |
| 30 to 34 Years | 139 (99.3%) | 0 (0.0%) |
| 35 to 44 Years | 144 (82.8%) | 17 (11.8%) |
| 45 to 54 Years | 248 (83.5%) | 16 (6.5%) |
| 55 to 59 Years | 50 (59.5%) | 0 (0.0%) |
| 60 to 64 Years | 22 (39.3%) | 0 (0.0%) |
| 65 to 74 Years | 45 (31.9%) | 0 (0.0%) |
| 75 Years and over | 6 (5.2%) | 0 (0.0%) |
| Total | 870 (64.0%) | 66 (7.6%) |
Employment Status by Educational Attainment in Plymouth
According to labor force statistics for Plymouth, 78.7% of individuals (700) out of the total population between 25 and 64 years of age (889) are in the labor force, with 7.4% or 52 of them being unemployed. The group with the highest labor force participation rate are those with the educational attainment of bachelor's degree or higher, with 91.6% or 131 individuals in the labor force. Within the labor force, individuals with high school diploma education have the highest percentage of unemployment, with 11.5% or 40 of them being unemployed.
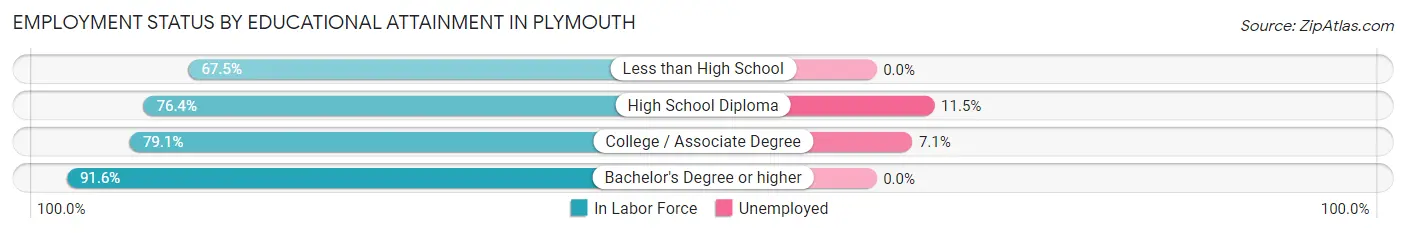
| Educational Attainment | In Labor Force | Unemployed |
| Less than High School | 52 (67.5%) | 0 (0.0%) |
| High School Diploma | 347 (76.4%) | 52 (11.5%) |
| College / Associate Degree | 170 (79.1%) | 15 (7.1%) |
| Bachelor's Degree or higher | 131 (91.6%) | 0 (0.0%) |
| Total | 700 (78.7%) | 66 (7.4%) |
Employment Occupations by Sex in Plymouth
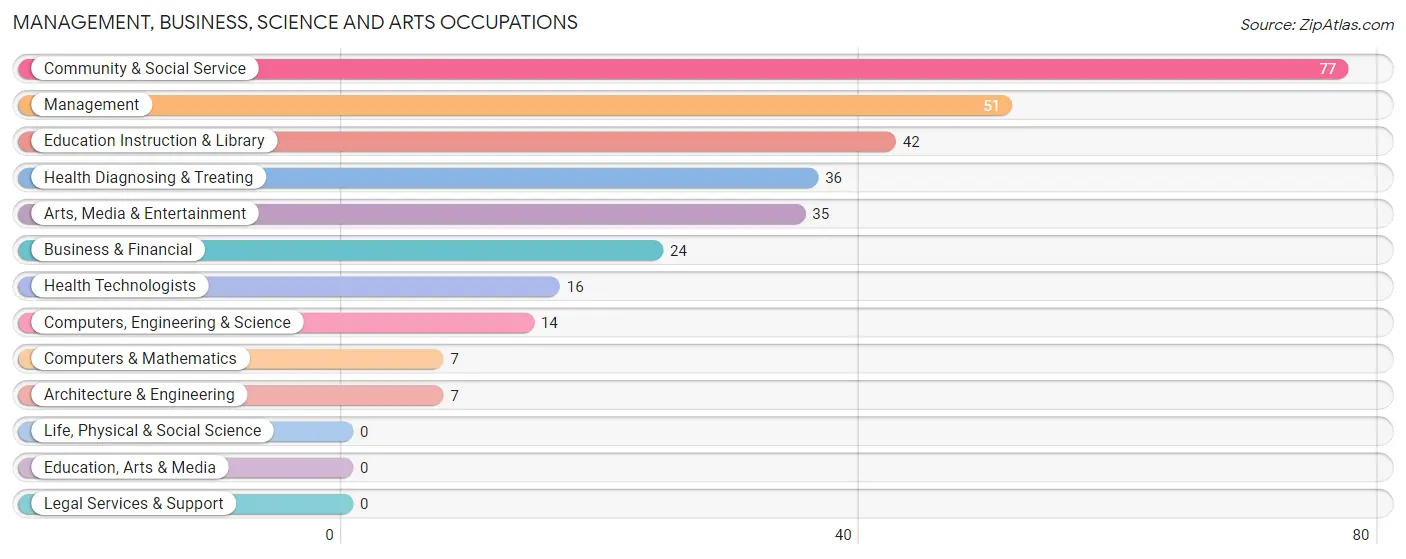
Management, Business, Science and Arts Occupations
The most common Management, Business, Science and Arts occupations in Plymouth are Community & Social Service (77 | 9.6%), Management (51 | 6.3%), Education Instruction & Library (42 | 5.2%), Health Diagnosing & Treating (36 | 4.5%), and Arts, Media & Entertainment (35 | 4.3%).
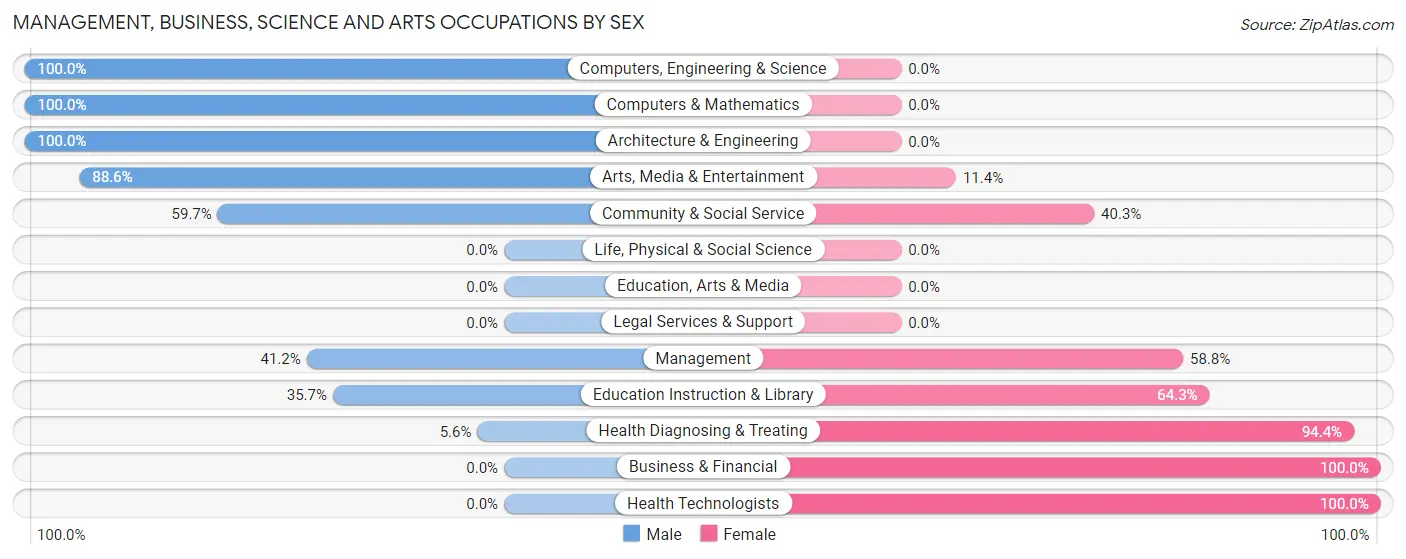
Management, Business, Science and Arts Occupations by Sex
Within the Management, Business, Science and Arts occupations in Plymouth, the most male-oriented occupations are Computers, Engineering & Science (100.0%), Computers & Mathematics (100.0%), and Architecture & Engineering (100.0%), while the most female-oriented occupations are Business & Financial (100.0%), Health Technologists (100.0%), and Health Diagnosing & Treating (94.4%).
| Occupation | Male | Female |
| Management | 21 (41.2%) | 30 (58.8%) |
| Business & Financial | 0 (0.0%) | 24 (100.0%) |
| Computers, Engineering & Science | 14 (100.0%) | 0 (0.0%) |
| Computers & Mathematics | 7 (100.0%) | 0 (0.0%) |
| Architecture & Engineering | 7 (100.0%) | 0 (0.0%) |
| Life, Physical & Social Science | 0 (0.0%) | 0 (0.0%) |
| Community & Social Service | 46 (59.7%) | 31 (40.3%) |
| Education, Arts & Media | 0 (0.0%) | 0 (0.0%) |
| Legal Services & Support | 0 (0.0%) | 0 (0.0%) |
| Education Instruction & Library | 15 (35.7%) | 27 (64.3%) |
| Arts, Media & Entertainment | 31 (88.6%) | 4 (11.4%) |
| Health Diagnosing & Treating | 2 (5.6%) | 34 (94.4%) |
| Health Technologists | 0 (0.0%) | 16 (100.0%) |
| Total (Category) | 83 (41.1%) | 119 (58.9%) |
| Total (Overall) | 475 (59.1%) | 329 (40.9%) |
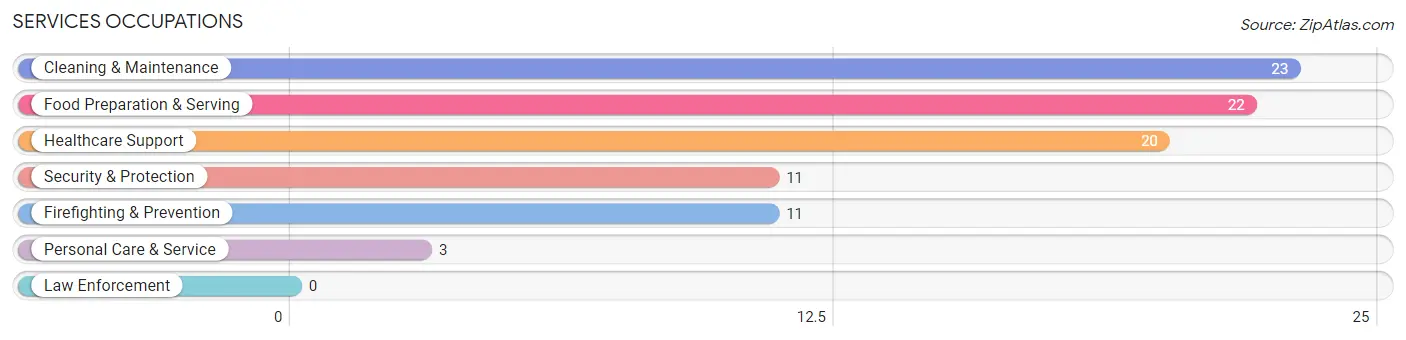
Services Occupations
The most common Services occupations in Plymouth are Cleaning & Maintenance (23 | 2.9%), Food Preparation & Serving (22 | 2.7%), Healthcare Support (20 | 2.5%), Security & Protection (11 | 1.4%), and Firefighting & Prevention (11 | 1.4%).
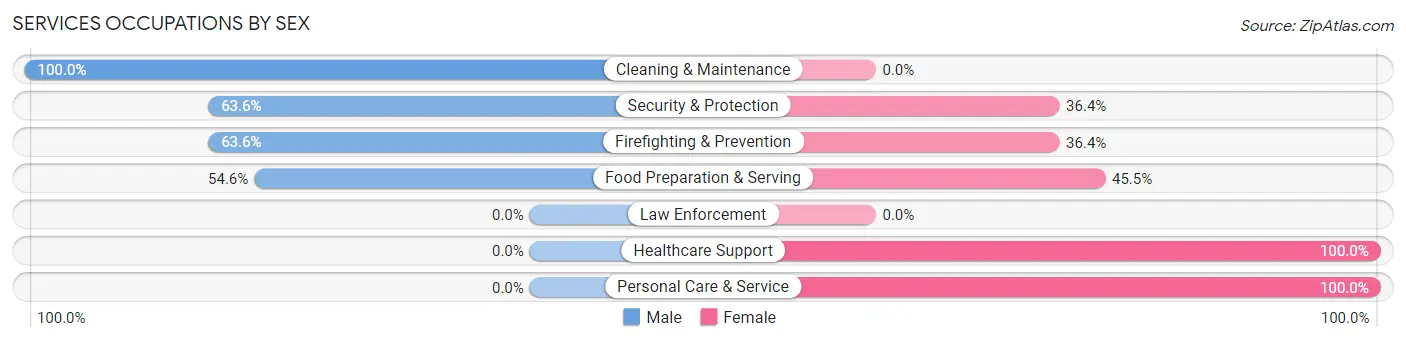
Services Occupations by Sex
Within the Services occupations in Plymouth, the most male-oriented occupations are Cleaning & Maintenance (100.0%), Security & Protection (63.6%), and Firefighting & Prevention (63.6%), while the most female-oriented occupations are Healthcare Support (100.0%), Personal Care & Service (100.0%), and Food Preparation & Serving (45.5%).
| Occupation | Male | Female |
| Healthcare Support | 0 (0.0%) | 20 (100.0%) |
| Security & Protection | 7 (63.6%) | 4 (36.4%) |
| Firefighting & Prevention | 7 (63.6%) | 4 (36.4%) |
| Law Enforcement | 0 (0.0%) | 0 (0.0%) |
| Food Preparation & Serving | 12 (54.5%) | 10 (45.5%) |
| Cleaning & Maintenance | 23 (100.0%) | 0 (0.0%) |
| Personal Care & Service | 0 (0.0%) | 3 (100.0%) |
| Total (Category) | 42 (53.2%) | 37 (46.8%) |
| Total (Overall) | 475 (59.1%) | 329 (40.9%) |
Sales and Office Occupations
The most common Sales and Office occupations in Plymouth are Office & Administration (111 | 13.8%), and Sales & Related (37 | 4.6%).
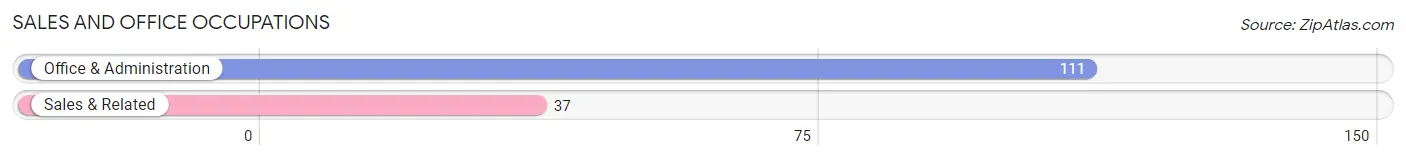
Sales and Office Occupations by Sex
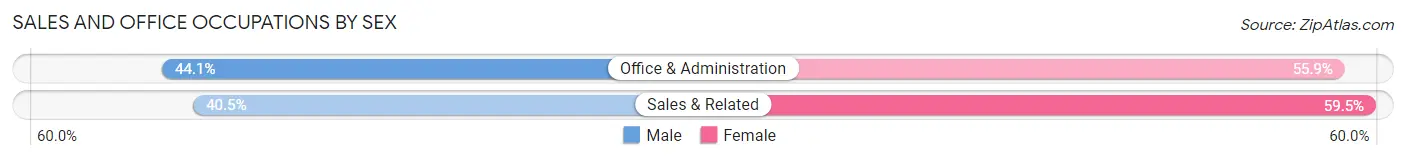
| Occupation | Male | Female |
| Sales & Related | 15 (40.5%) | 22 (59.5%) |
| Office & Administration | 49 (44.1%) | 62 (55.9%) |
| Total (Category) | 64 (43.2%) | 84 (56.8%) |
| Total (Overall) | 475 (59.1%) | 329 (40.9%) |
Natural Resources, Construction and Maintenance Occupations
The most common Natural Resources, Construction and Maintenance occupations in Plymouth are Construction & Extraction (28 | 3.5%), Farming, Fishing & Forestry (17 | 2.1%), and Installation, Maintenance & Repair (15 | 1.9%).
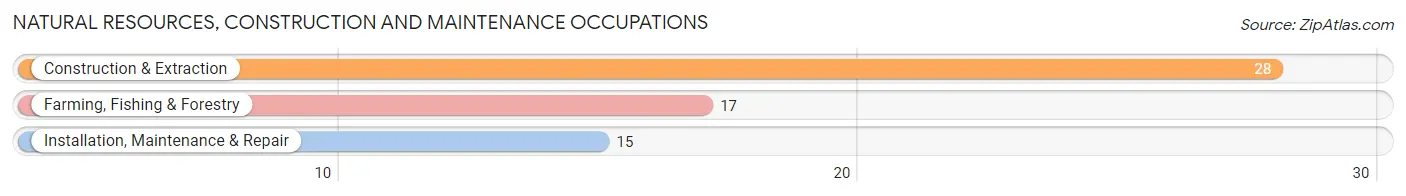
Natural Resources, Construction and Maintenance Occupations by Sex
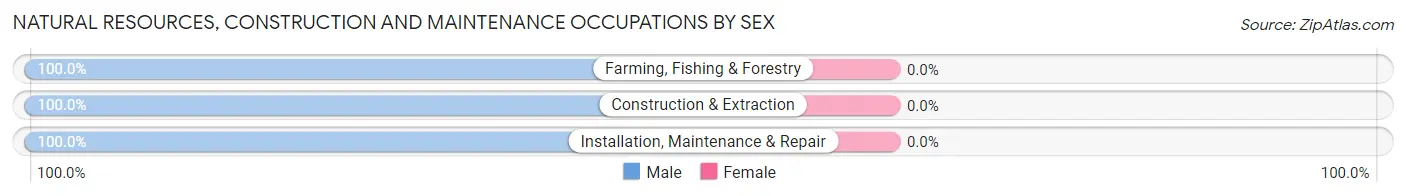
| Occupation | Male | Female |
| Farming, Fishing & Forestry | 17 (100.0%) | 0 (0.0%) |
| Construction & Extraction | 28 (100.0%) | 0 (0.0%) |
| Installation, Maintenance & Repair | 15 (100.0%) | 0 (0.0%) |
| Total (Category) | 60 (100.0%) | 0 (0.0%) |
| Total (Overall) | 475 (59.1%) | 329 (40.9%) |
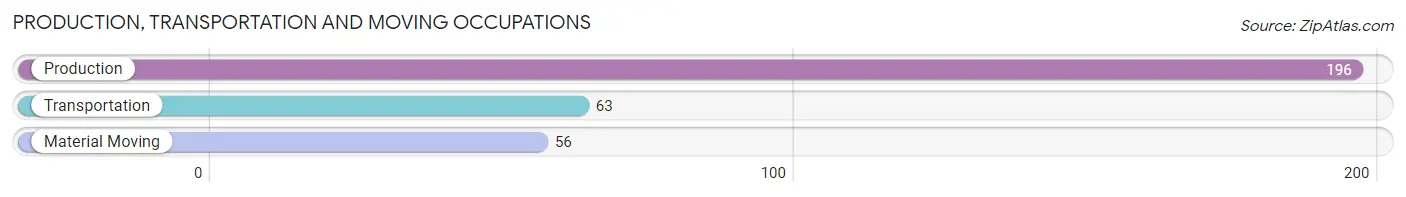
Production, Transportation and Moving Occupations
The most common Production, Transportation and Moving occupations in Plymouth are Production (196 | 24.4%), Transportation (63 | 7.8%), and Material Moving (56 | 7.0%).
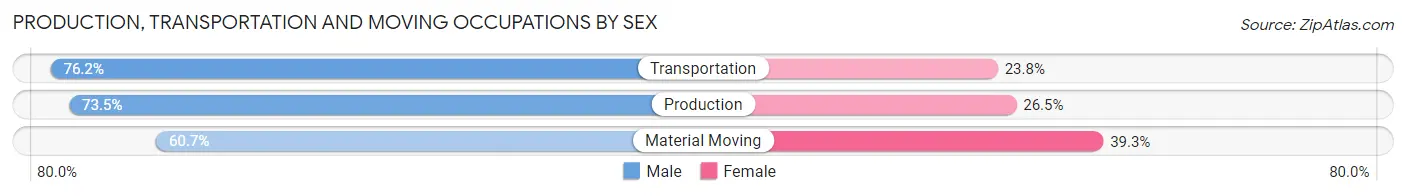
Production, Transportation and Moving Occupations by Sex
| Occupation | Male | Female |
| Production | 144 (73.5%) | 52 (26.5%) |
| Transportation | 48 (76.2%) | 15 (23.8%) |
| Material Moving | 34 (60.7%) | 22 (39.3%) |
| Total (Category) | 226 (71.8%) | 89 (28.2%) |
| Total (Overall) | 475 (59.1%) | 329 (40.9%) |
Employment Industries by Sex in Plymouth
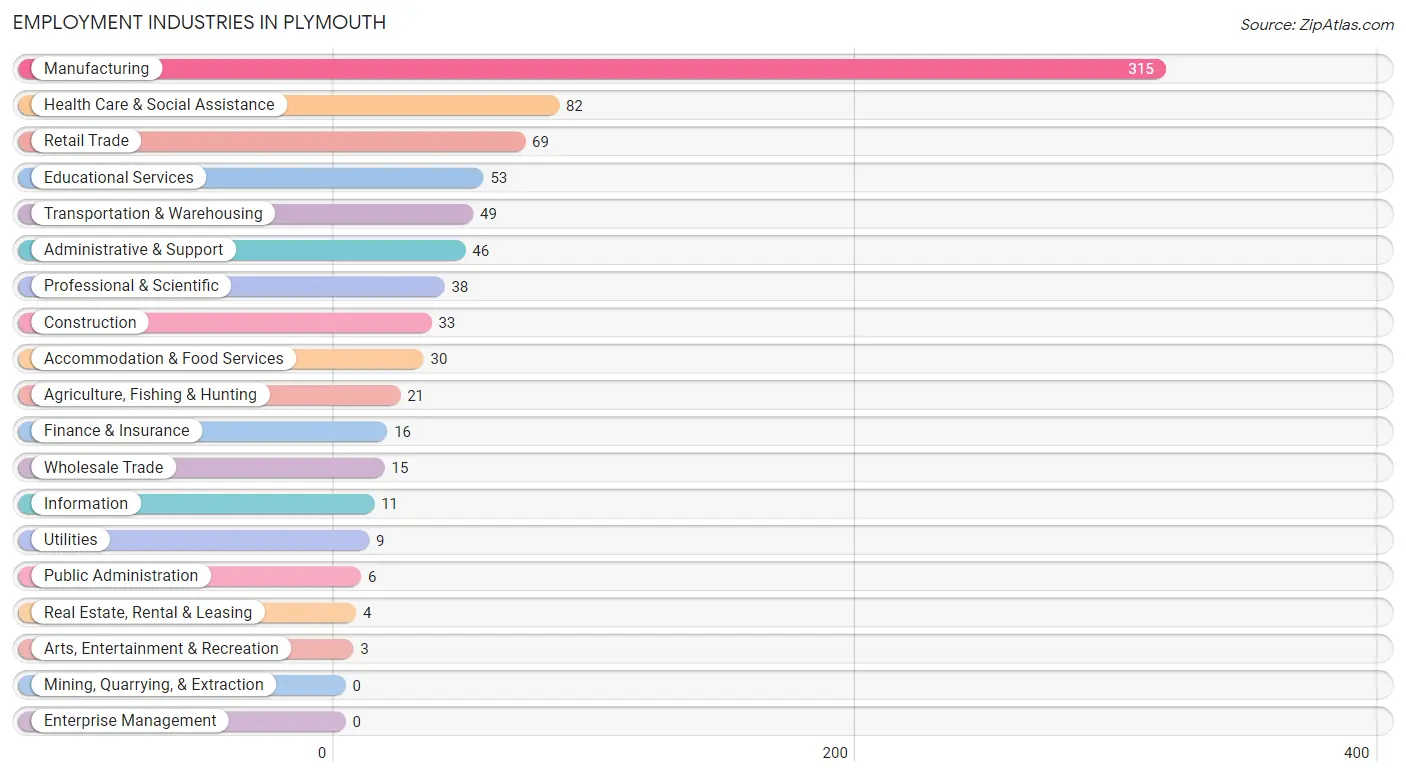
Employment Industries in Plymouth
The major employment industries in Plymouth include Manufacturing (315 | 39.2%), Health Care & Social Assistance (82 | 10.2%), Retail Trade (69 | 8.6%), Educational Services (53 | 6.6%), and Transportation & Warehousing (49 | 6.1%).
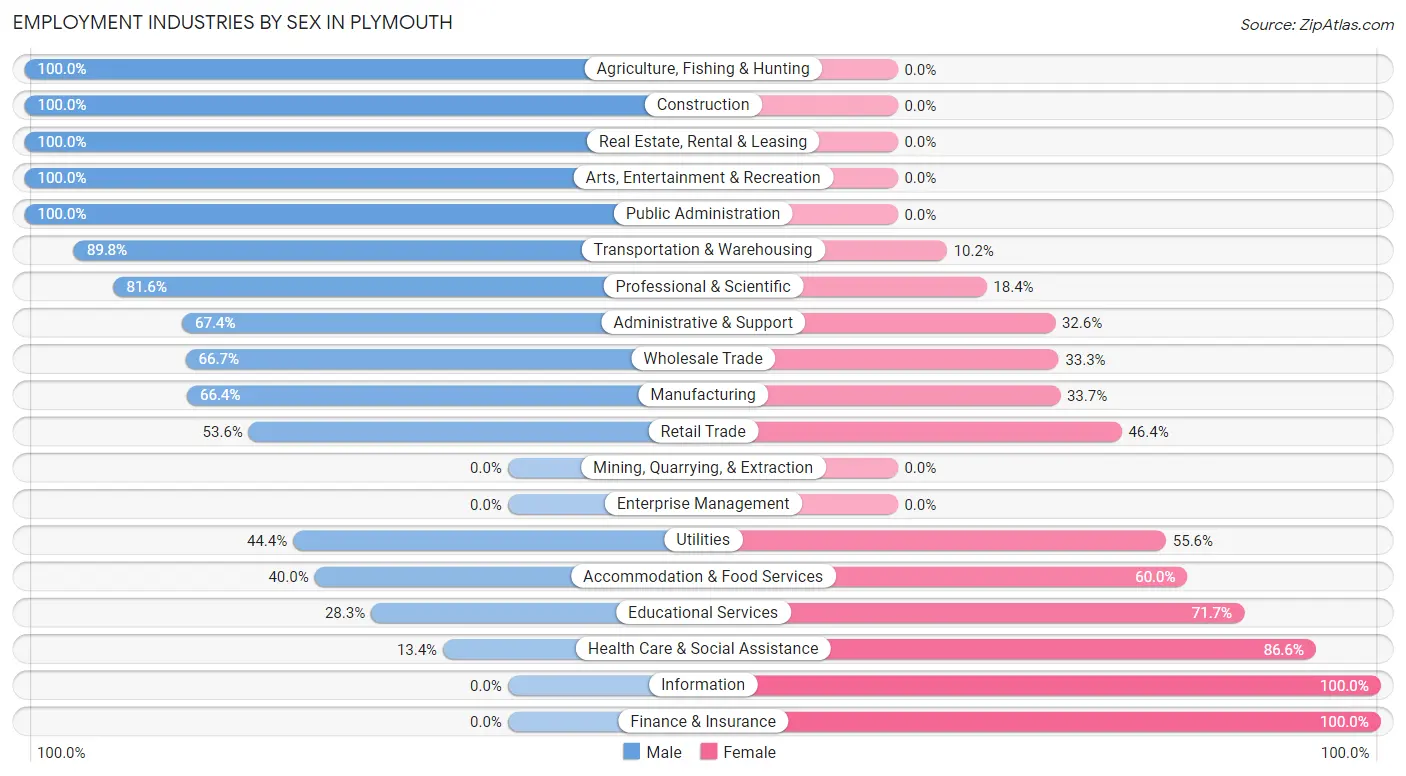
Employment Industries by Sex in Plymouth
The Plymouth industries that see more men than women are Agriculture, Fishing & Hunting (100.0%), Construction (100.0%), and Real Estate, Rental & Leasing (100.0%), whereas the industries that tend to have a higher number of women are Information (100.0%), Finance & Insurance (100.0%), and Health Care & Social Assistance (86.6%).
| Industry | Male | Female |
| Agriculture, Fishing & Hunting | 21 (100.0%) | 0 (0.0%) |
| Mining, Quarrying, & Extraction | 0 (0.0%) | 0 (0.0%) |
| Construction | 33 (100.0%) | 0 (0.0%) |
| Manufacturing | 209 (66.3%) | 106 (33.7%) |
| Wholesale Trade | 10 (66.7%) | 5 (33.3%) |
| Retail Trade | 37 (53.6%) | 32 (46.4%) |
| Transportation & Warehousing | 44 (89.8%) | 5 (10.2%) |
| Utilities | 4 (44.4%) | 5 (55.6%) |
| Information | 0 (0.0%) | 11 (100.0%) |
| Finance & Insurance | 0 (0.0%) | 16 (100.0%) |
| Real Estate, Rental & Leasing | 4 (100.0%) | 0 (0.0%) |
| Professional & Scientific | 31 (81.6%) | 7 (18.4%) |
| Enterprise Management | 0 (0.0%) | 0 (0.0%) |
| Administrative & Support | 31 (67.4%) | 15 (32.6%) |
| Educational Services | 15 (28.3%) | 38 (71.7%) |
| Health Care & Social Assistance | 11 (13.4%) | 71 (86.6%) |
| Arts, Entertainment & Recreation | 3 (100.0%) | 0 (0.0%) |
| Accommodation & Food Services | 12 (40.0%) | 18 (60.0%) |
| Public Administration | 6 (100.0%) | 0 (0.0%) |
| Total | 475 (59.1%) | 329 (40.9%) |
Education in Plymouth
School Enrollment in Plymouth
The most common levels of schooling among the 361 students in Plymouth are elementary school (89 | 24.6%), high school (88 | 24.4%), and middle school (55 | 15.2%).
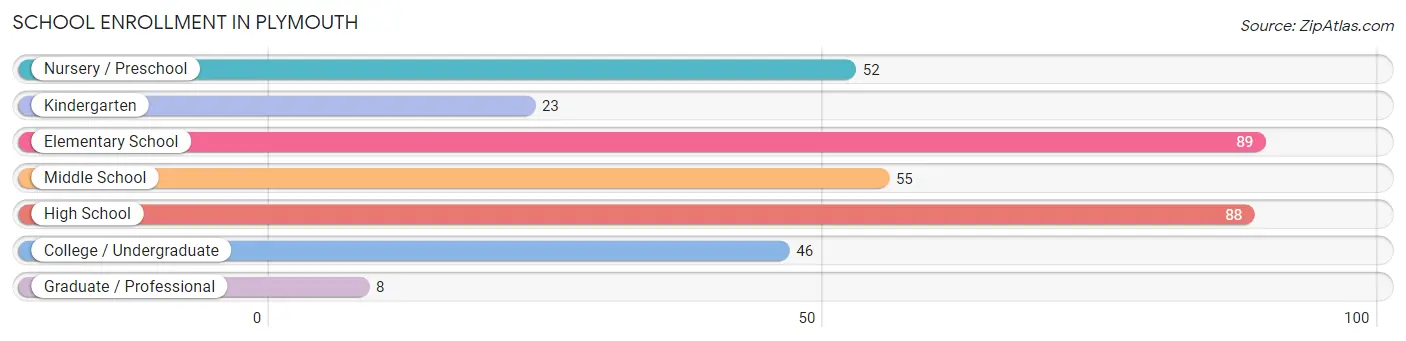
| School Level | # Students | % Students |
| Nursery / Preschool | 52 | 14.4% |
| Kindergarten | 23 | 6.4% |
| Elementary School | 89 | 24.6% |
| Middle School | 55 | 15.2% |
| High School | 88 | 24.4% |
| College / Undergraduate | 46 | 12.7% |
| Graduate / Professional | 8 | 2.2% |
| Total | 361 | 100.0% |
School Enrollment by Age by Funding Source in Plymouth
Out of a total of 361 students who are enrolled in schools in Plymouth, 17 (4.7%) attend a private institution, while the remaining 344 (95.3%) are enrolled in public schools. The age group of 35 years and over has the highest likelihood of being enrolled in private schools, with 4 (22.2% in the age bracket) enrolled. Conversely, the age group of 3 to 4 year olds has the lowest likelihood of being enrolled in a private school, with 32 (100.0% in the age bracket) attending a public institution.
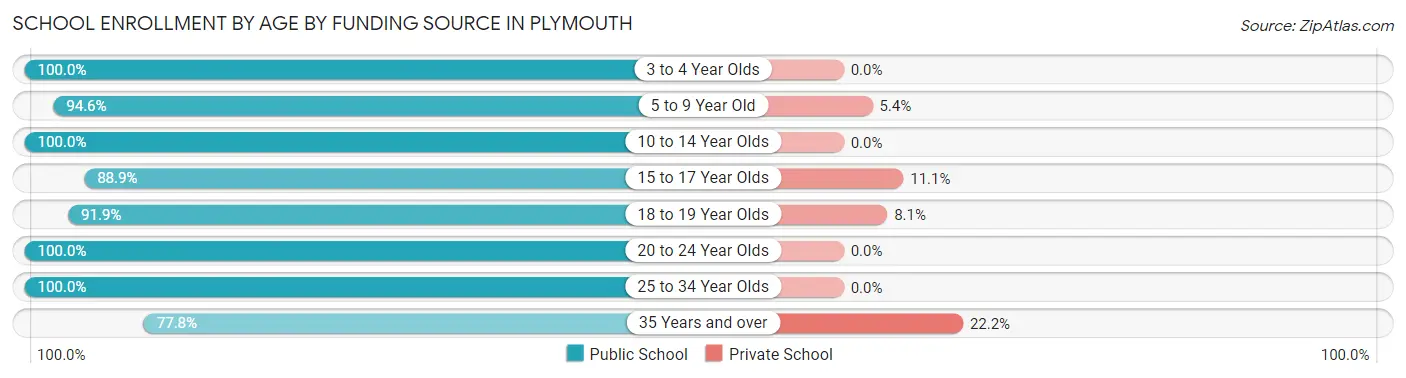
| Age Bracket | Public School | Private School |
| 3 to 4 Year Olds | 32 (100.0%) | 0 (0.0%) |
| 5 to 9 Year Old | 106 (94.6%) | 6 (5.4%) |
| 10 to 14 Year Olds | 97 (100.0%) | 0 (0.0%) |
| 15 to 17 Year Olds | 32 (88.9%) | 4 (11.1%) |
| 18 to 19 Year Olds | 34 (91.9%) | 3 (8.1%) |
| 20 to 24 Year Olds | 10 (100.0%) | 0 (0.0%) |
| 25 to 34 Year Olds | 19 (100.0%) | 0 (0.0%) |
| 35 Years and over | 14 (77.8%) | 4 (22.2%) |
| Total | 344 (95.3%) | 17 (4.7%) |
Educational Attainment by Field of Study in Plymouth
Education (94 | 45.4%), science & technology (47 | 22.7%), business (29 | 14.0%), liberal arts & history (14 | 6.8%), and visual & performing arts (7 | 3.4%) are the most common fields of study among 207 individuals in Plymouth who have obtained a bachelor's degree or higher.
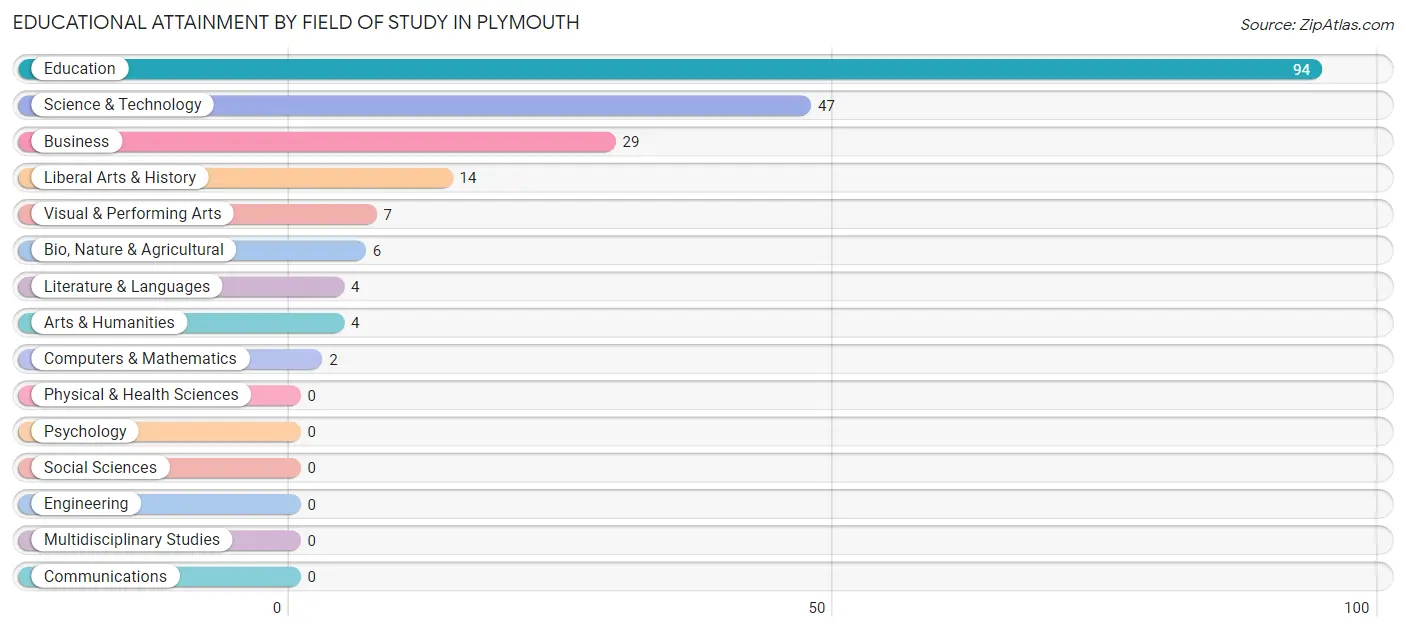
| Field of Study | # Graduates | % Graduates |
| Computers & Mathematics | 2 | 1.0% |
| Bio, Nature & Agricultural | 6 | 2.9% |
| Physical & Health Sciences | 0 | 0.0% |
| Psychology | 0 | 0.0% |
| Social Sciences | 0 | 0.0% |
| Engineering | 0 | 0.0% |
| Multidisciplinary Studies | 0 | 0.0% |
| Science & Technology | 47 | 22.7% |
| Business | 29 | 14.0% |
| Education | 94 | 45.4% |
| Literature & Languages | 4 | 1.9% |
| Liberal Arts & History | 14 | 6.8% |
| Visual & Performing Arts | 7 | 3.4% |
| Communications | 0 | 0.0% |
| Arts & Humanities | 4 | 1.9% |
| Total | 207 | 100.0% |
Transportation & Commute in Plymouth
Vehicle Availability by Sex in Plymouth
The most prevalent vehicle ownership categories in Plymouth are males with 2 vehicles (178, accounting for 38.3%) and females with 2 vehicles (121, making up 54.1%).
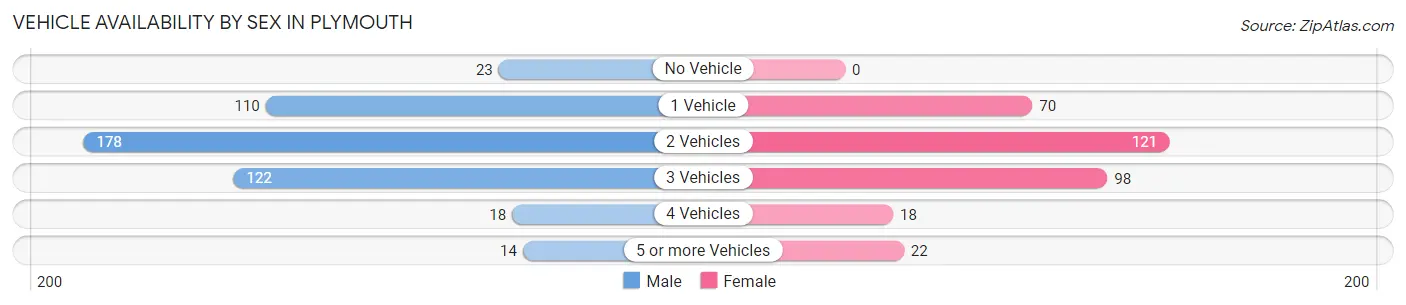
| Vehicles Available | Male | Female |
| No Vehicle | 23 (5.0%) | 0 (0.0%) |
| 1 Vehicle | 110 (23.7%) | 70 (21.3%) |
| 2 Vehicles | 178 (38.3%) | 121 (36.8%) |
| 3 Vehicles | 122 (26.2%) | 98 (29.8%) |
| 4 Vehicles | 18 (3.9%) | 18 (5.5%) |
| 5 or more Vehicles | 14 (3.0%) | 22 (6.7%) |
| Total | 465 (100.0%) | 329 (100.0%) |
Commute Time in Plymouth
The most frequently occuring commute durations in Plymouth are 10 to 14 minutes (229 commuters, 29.3%), 15 to 19 minutes (129 commuters, 16.5%), and 30 to 34 minutes (93 commuters, 11.9%).
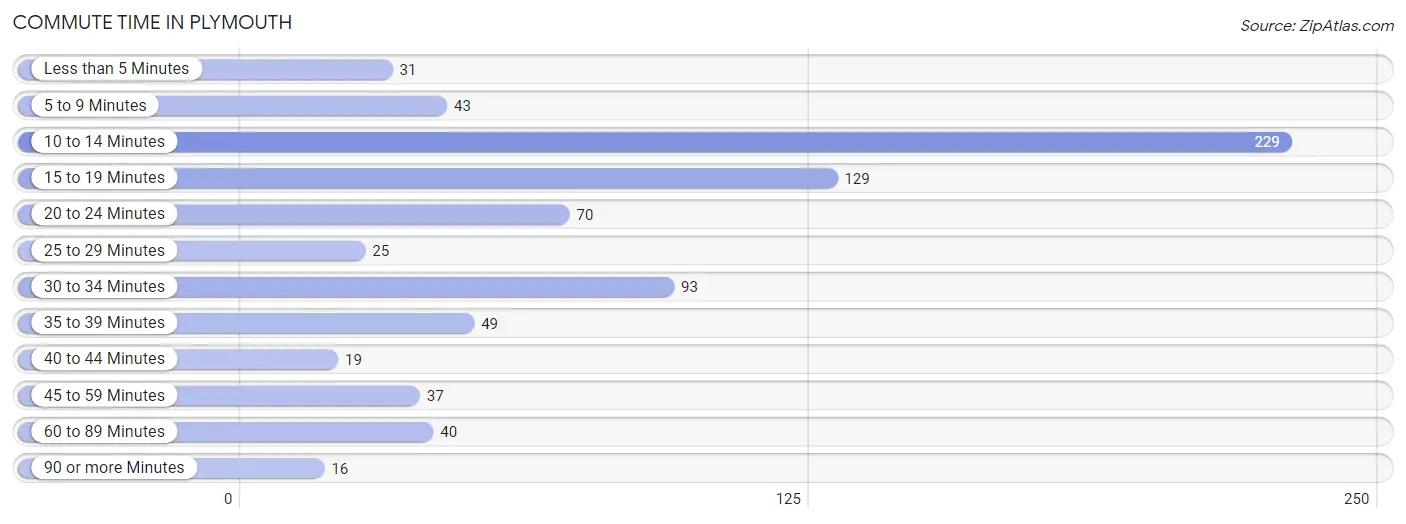
| Commute Time | # Commuters | % Commuters |
| Less than 5 Minutes | 31 | 4.0% |
| 5 to 9 Minutes | 43 | 5.5% |
| 10 to 14 Minutes | 229 | 29.3% |
| 15 to 19 Minutes | 129 | 16.5% |
| 20 to 24 Minutes | 70 | 9.0% |
| 25 to 29 Minutes | 25 | 3.2% |
| 30 to 34 Minutes | 93 | 11.9% |
| 35 to 39 Minutes | 49 | 6.3% |
| 40 to 44 Minutes | 19 | 2.4% |
| 45 to 59 Minutes | 37 | 4.7% |
| 60 to 89 Minutes | 40 | 5.1% |
| 90 or more Minutes | 16 | 2.1% |
Commute Time by Sex in Plymouth
The most common commute times in Plymouth are 10 to 14 minutes (163 commuters, 35.8%) for males and 10 to 14 minutes (66 commuters, 20.3%) for females.
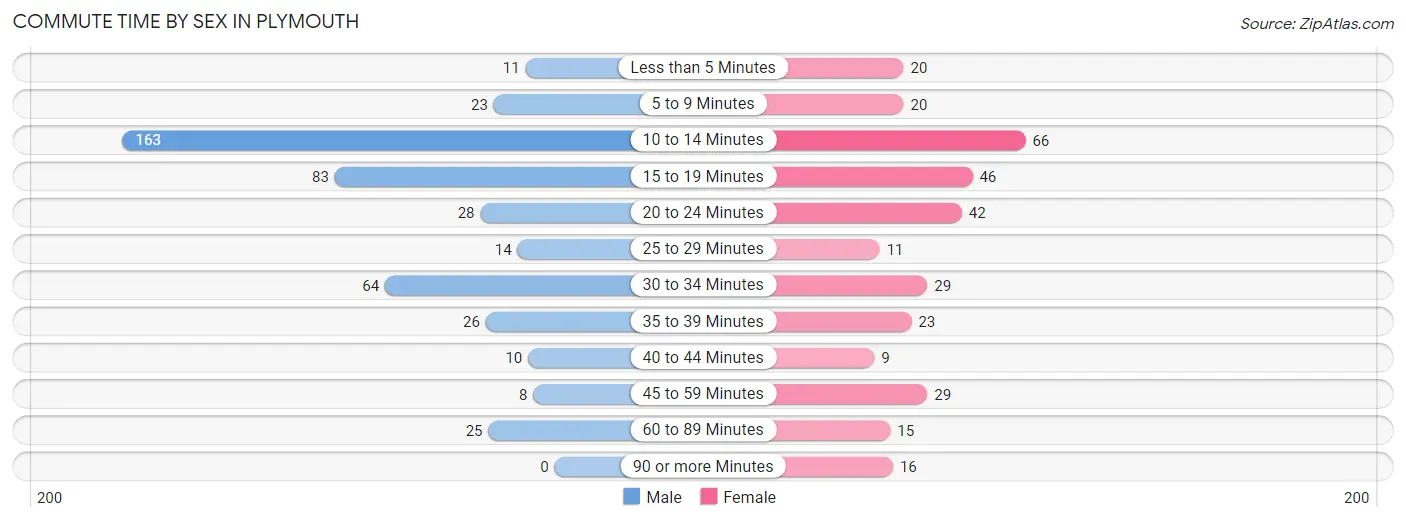
| Commute Time | Male | Female |
| Less than 5 Minutes | 11 (2.4%) | 20 (6.1%) |
| 5 to 9 Minutes | 23 (5.1%) | 20 (6.1%) |
| 10 to 14 Minutes | 163 (35.8%) | 66 (20.3%) |
| 15 to 19 Minutes | 83 (18.2%) | 46 (14.1%) |
| 20 to 24 Minutes | 28 (6.1%) | 42 (12.9%) |
| 25 to 29 Minutes | 14 (3.1%) | 11 (3.4%) |
| 30 to 34 Minutes | 64 (14.1%) | 29 (8.9%) |
| 35 to 39 Minutes | 26 (5.7%) | 23 (7.1%) |
| 40 to 44 Minutes | 10 (2.2%) | 9 (2.8%) |
| 45 to 59 Minutes | 8 (1.8%) | 29 (8.9%) |
| 60 to 89 Minutes | 25 (5.5%) | 15 (4.6%) |
| 90 or more Minutes | 0 (0.0%) | 16 (4.9%) |
Time of Departure to Work by Sex in Plymouth
The most frequent times of departure to work in Plymouth are 6:00 AM to 6:29 AM (62, 13.6%) for males and 12:00 PM to 3:59 PM (55, 16.9%) for females.
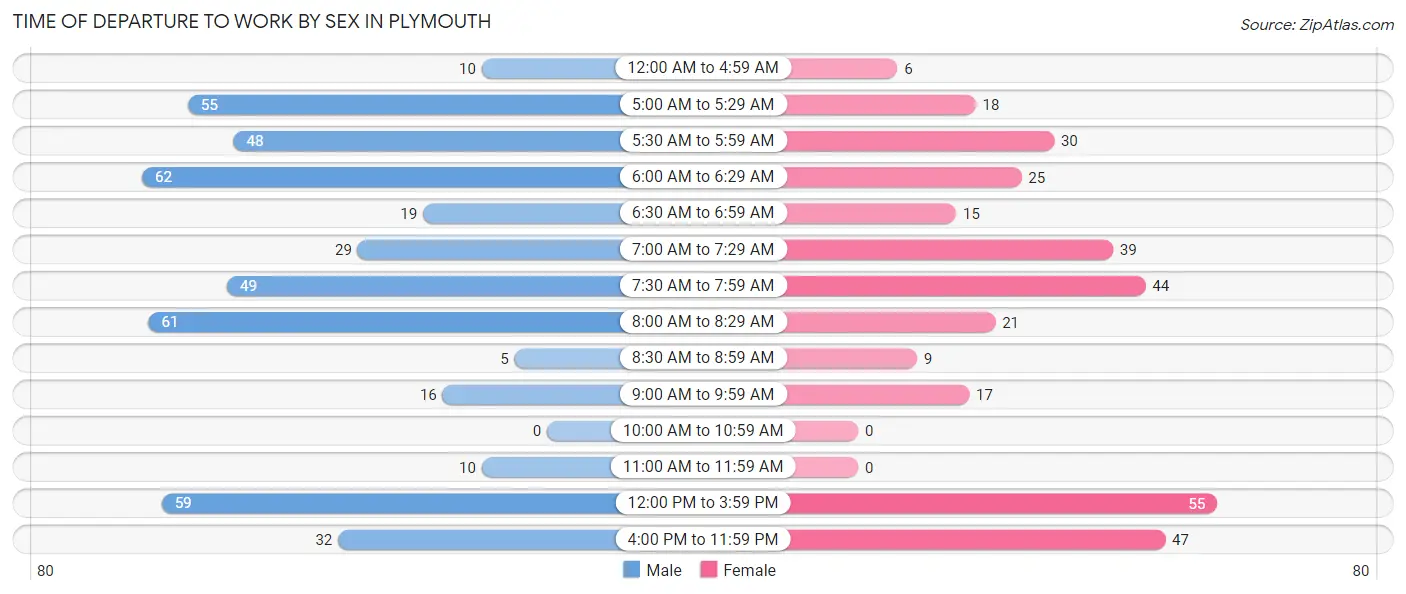
| Time of Departure | Male | Female |
| 12:00 AM to 4:59 AM | 10 (2.2%) | 6 (1.8%) |
| 5:00 AM to 5:29 AM | 55 (12.1%) | 18 (5.5%) |
| 5:30 AM to 5:59 AM | 48 (10.5%) | 30 (9.2%) |
| 6:00 AM to 6:29 AM | 62 (13.6%) | 25 (7.7%) |
| 6:30 AM to 6:59 AM | 19 (4.2%) | 15 (4.6%) |
| 7:00 AM to 7:29 AM | 29 (6.4%) | 39 (12.0%) |
| 7:30 AM to 7:59 AM | 49 (10.8%) | 44 (13.5%) |
| 8:00 AM to 8:29 AM | 61 (13.4%) | 21 (6.4%) |
| 8:30 AM to 8:59 AM | 5 (1.1%) | 9 (2.8%) |
| 9:00 AM to 9:59 AM | 16 (3.5%) | 17 (5.2%) |
| 10:00 AM to 10:59 AM | 0 (0.0%) | 0 (0.0%) |
| 11:00 AM to 11:59 AM | 10 (2.2%) | 0 (0.0%) |
| 12:00 PM to 3:59 PM | 59 (13.0%) | 55 (16.9%) |
| 4:00 PM to 11:59 PM | 32 (7.0%) | 47 (14.4%) |
| Total | 455 (100.0%) | 326 (100.0%) |
Housing Occupancy in Plymouth
Occupancy by Ownership in Plymouth
Of the total 697 dwellings in Plymouth, owner-occupied units account for 417 (59.8%), while renter-occupied units make up 280 (40.2%).
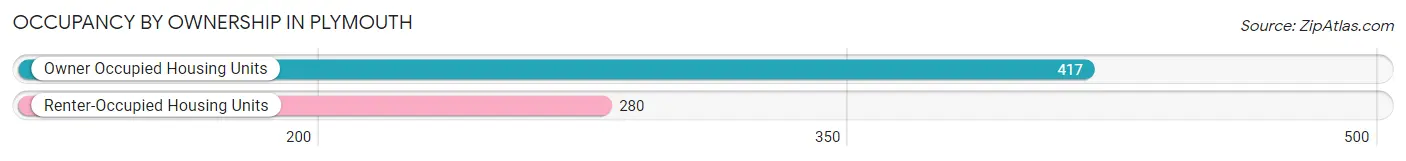
| Occupancy | # Housing Units | % Housing Units |
| Owner Occupied Housing Units | 417 | 59.8% |
| Renter-Occupied Housing Units | 280 | 40.2% |
| Total Occupied Housing Units | 697 | 100.0% |
Occupancy by Household Size in Plymouth
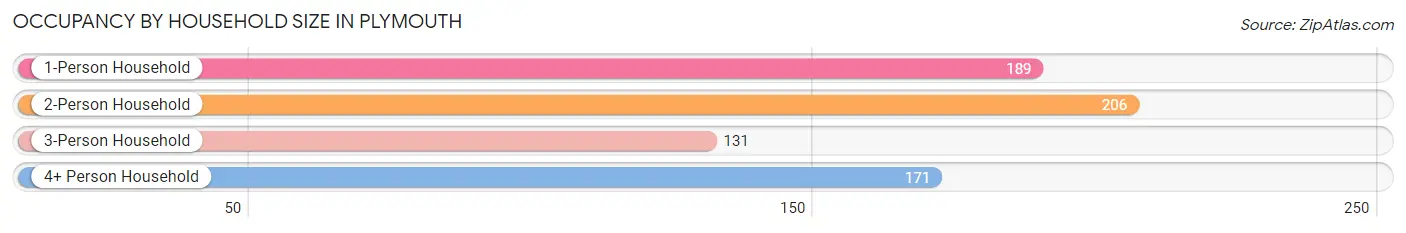
| Household Size | # Housing Units | % Housing Units |
| 1-Person Household | 189 | 27.1% |
| 2-Person Household | 206 | 29.6% |
| 3-Person Household | 131 | 18.8% |
| 4+ Person Household | 171 | 24.5% |
| Total Housing Units | 697 | 100.0% |
Occupancy by Ownership by Household Size in Plymouth
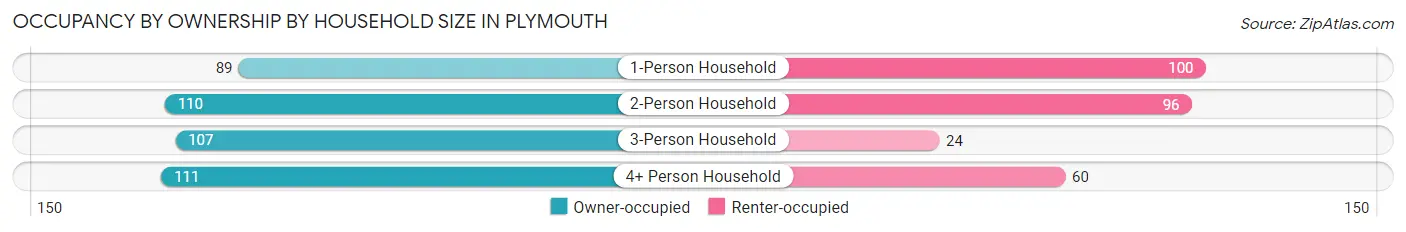
| Household Size | Owner-occupied | Renter-occupied |
| 1-Person Household | 89 (47.1%) | 100 (52.9%) |
| 2-Person Household | 110 (53.4%) | 96 (46.6%) |
| 3-Person Household | 107 (81.7%) | 24 (18.3%) |
| 4+ Person Household | 111 (64.9%) | 60 (35.1%) |
| Total Housing Units | 417 (59.8%) | 280 (40.2%) |
Occupancy by Educational Attainment in Plymouth
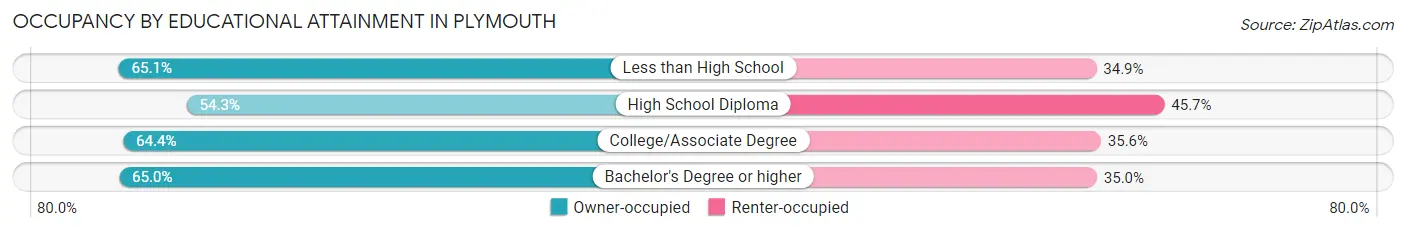
| Household Size | Owner-occupied | Renter-occupied |
| Less than High School | 41 (65.1%) | 22 (34.9%) |
| High School Diploma | 177 (54.3%) | 149 (45.7%) |
| College/Associate Degree | 121 (64.4%) | 67 (35.6%) |
| Bachelor's Degree or higher | 78 (65.0%) | 42 (35.0%) |
Occupancy by Age of Householder in Plymouth
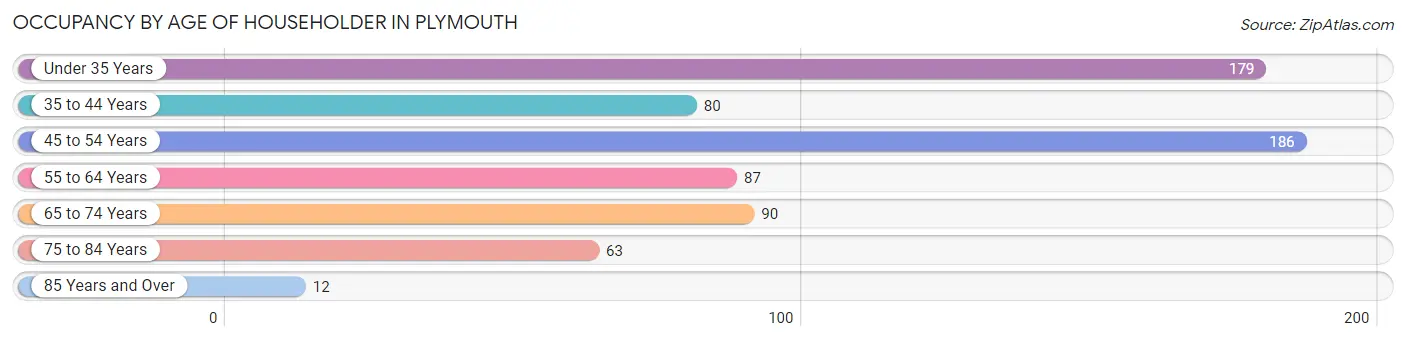
| Age Bracket | # Households | % Households |
| Under 35 Years | 179 | 25.7% |
| 35 to 44 Years | 80 | 11.5% |
| 45 to 54 Years | 186 | 26.7% |
| 55 to 64 Years | 87 | 12.5% |
| 65 to 74 Years | 90 | 12.9% |
| 75 to 84 Years | 63 | 9.0% |
| 85 Years and Over | 12 | 1.7% |
| Total | 697 | 100.0% |
Housing Finances in Plymouth
Median Income by Occupancy in Plymouth
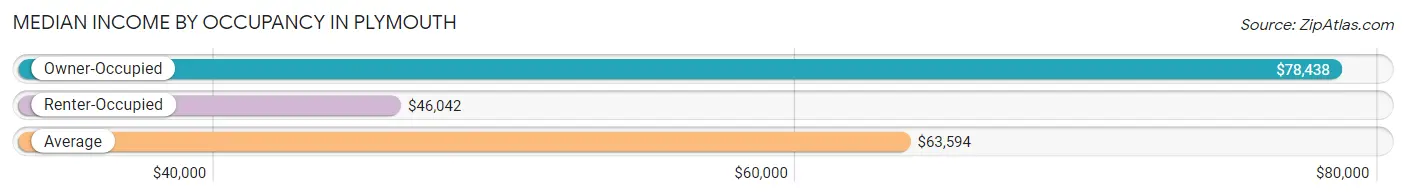
| Occupancy Type | # Households | Median Income |
| Owner-Occupied | 417 (59.8%) | $78,438 |
| Renter-Occupied | 280 (40.2%) | $46,042 |
| Average | 697 (100.0%) | $63,594 |
Occupancy by Householder Income Bracket in Plymouth
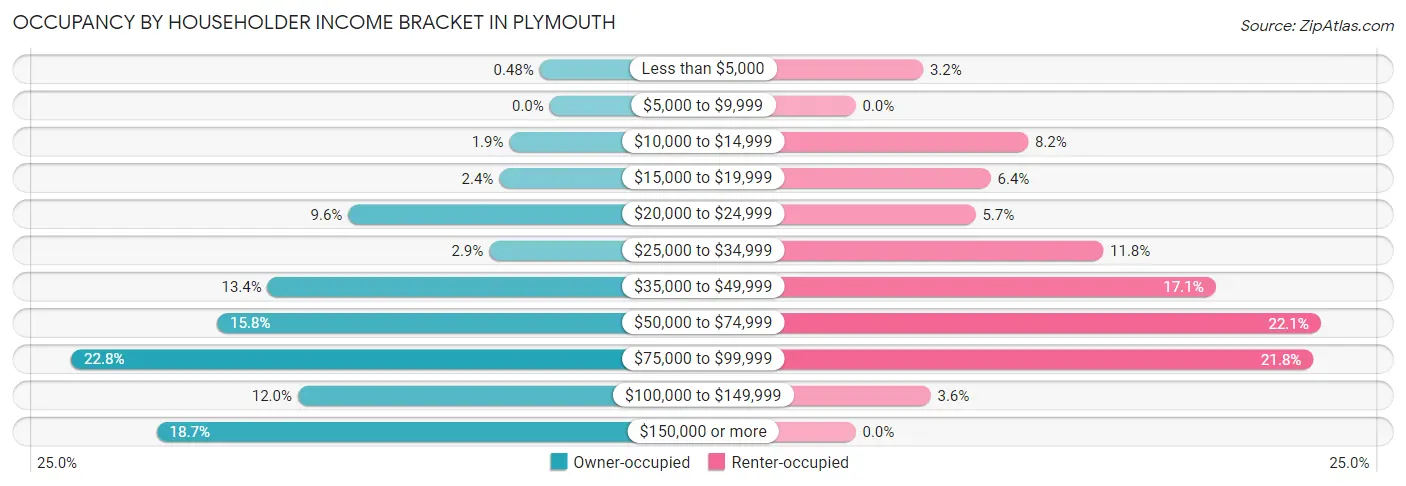
| Income Bracket | Owner-occupied | Renter-occupied |
| Less than $5,000 | 2 (0.5%) | 9 (3.2%) |
| $5,000 to $9,999 | 0 (0.0%) | 0 (0.0%) |
| $10,000 to $14,999 | 8 (1.9%) | 23 (8.2%) |
| $15,000 to $19,999 | 10 (2.4%) | 18 (6.4%) |
| $20,000 to $24,999 | 40 (9.6%) | 16 (5.7%) |
| $25,000 to $34,999 | 12 (2.9%) | 33 (11.8%) |
| $35,000 to $49,999 | 56 (13.4%) | 48 (17.1%) |
| $50,000 to $74,999 | 66 (15.8%) | 62 (22.1%) |
| $75,000 to $99,999 | 95 (22.8%) | 61 (21.8%) |
| $100,000 to $149,999 | 50 (12.0%) | 10 (3.6%) |
| $150,000 or more | 78 (18.7%) | 0 (0.0%) |
| Total | 417 (100.0%) | 280 (100.0%) |
Monthly Housing Cost Tiers in Plymouth
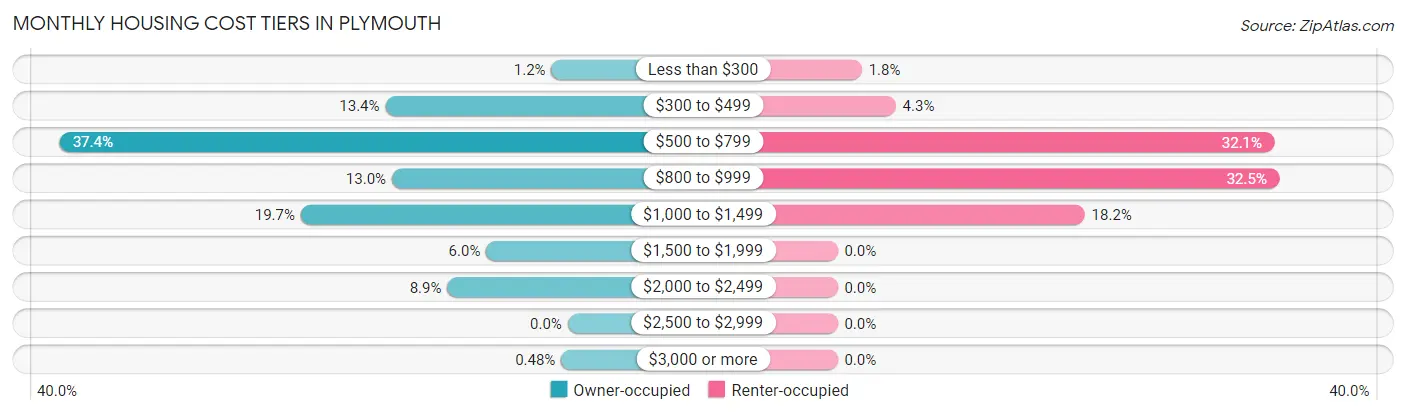
| Monthly Cost | Owner-occupied | Renter-occupied |
| Less than $300 | 5 (1.2%) | 5 (1.8%) |
| $300 to $499 | 56 (13.4%) | 12 (4.3%) |
| $500 to $799 | 156 (37.4%) | 90 (32.1%) |
| $800 to $999 | 54 (13.0%) | 91 (32.5%) |
| $1,000 to $1,499 | 82 (19.7%) | 51 (18.2%) |
| $1,500 to $1,999 | 25 (6.0%) | 0 (0.0%) |
| $2,000 to $2,499 | 37 (8.9%) | 0 (0.0%) |
| $2,500 to $2,999 | 0 (0.0%) | 0 (0.0%) |
| $3,000 or more | 2 (0.5%) | 0 (0.0%) |
| Total | 417 (100.0%) | 280 (100.0%) |
Physical Housing Characteristics in Plymouth
Housing Structures in Plymouth
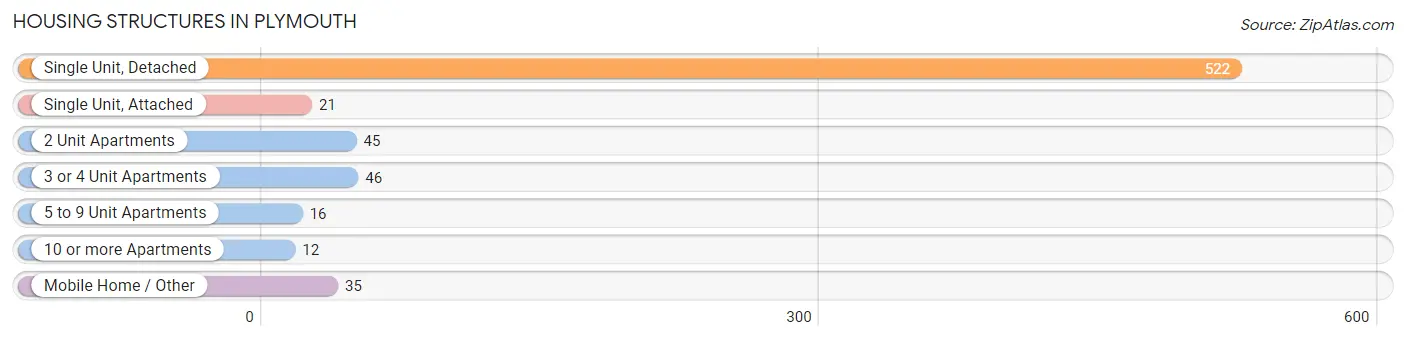
| Structure Type | # Housing Units | % Housing Units |
| Single Unit, Detached | 522 | 74.9% |
| Single Unit, Attached | 21 | 3.0% |
| 2 Unit Apartments | 45 | 6.5% |
| 3 or 4 Unit Apartments | 46 | 6.6% |
| 5 to 9 Unit Apartments | 16 | 2.3% |
| 10 or more Apartments | 12 | 1.7% |
| Mobile Home / Other | 35 | 5.0% |
| Total | 697 | 100.0% |
Housing Structures by Occupancy in Plymouth
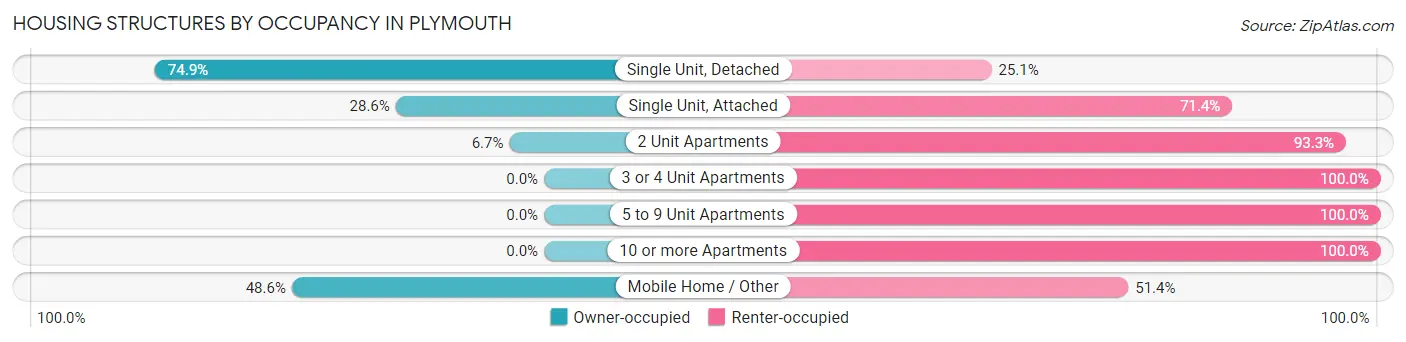
| Structure Type | Owner-occupied | Renter-occupied |
| Single Unit, Detached | 391 (74.9%) | 131 (25.1%) |
| Single Unit, Attached | 6 (28.6%) | 15 (71.4%) |
| 2 Unit Apartments | 3 (6.7%) | 42 (93.3%) |
| 3 or 4 Unit Apartments | 0 (0.0%) | 46 (100.0%) |
| 5 to 9 Unit Apartments | 0 (0.0%) | 16 (100.0%) |
| 10 or more Apartments | 0 (0.0%) | 12 (100.0%) |
| Mobile Home / Other | 17 (48.6%) | 18 (51.4%) |
| Total | 417 (59.8%) | 280 (40.2%) |
Housing Structures by Number of Rooms in Plymouth
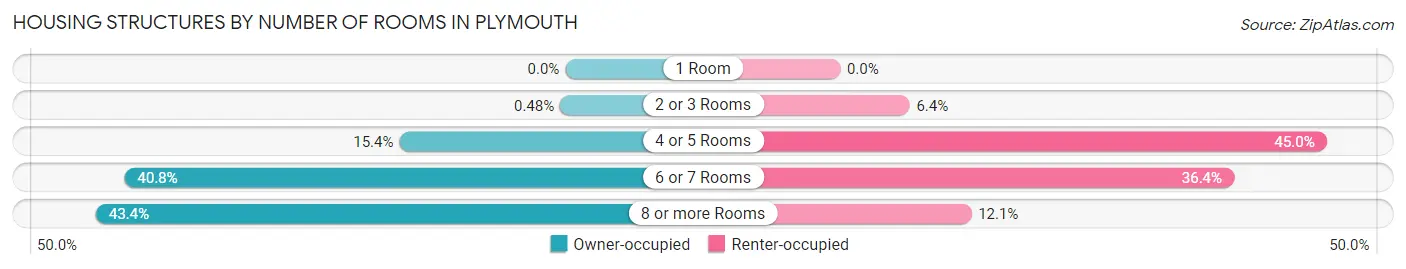
| Number of Rooms | Owner-occupied | Renter-occupied |
| 1 Room | 0 (0.0%) | 0 (0.0%) |
| 2 or 3 Rooms | 2 (0.5%) | 18 (6.4%) |
| 4 or 5 Rooms | 64 (15.3%) | 126 (45.0%) |
| 6 or 7 Rooms | 170 (40.8%) | 102 (36.4%) |
| 8 or more Rooms | 181 (43.4%) | 34 (12.1%) |
| Total | 417 (100.0%) | 280 (100.0%) |
Housing Structure by Heating Type in Plymouth
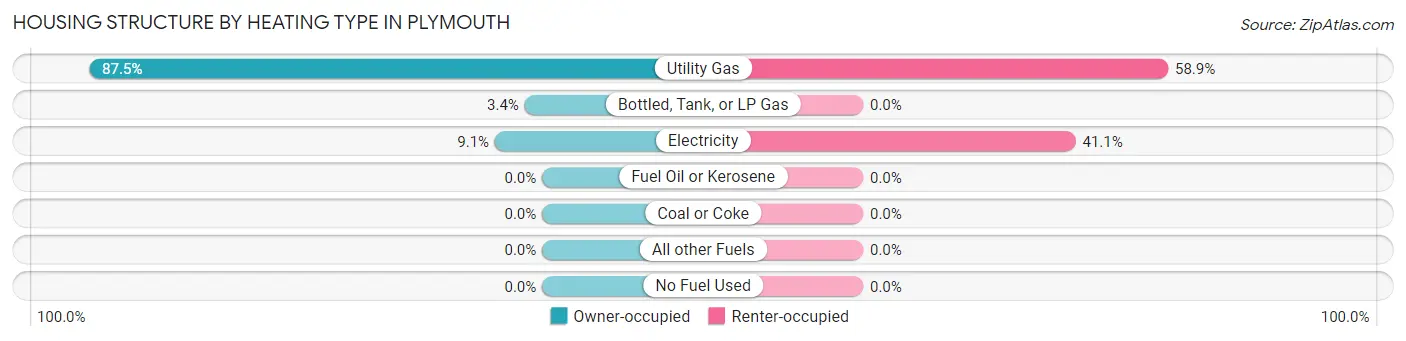
| Heating Type | Owner-occupied | Renter-occupied |
| Utility Gas | 365 (87.5%) | 165 (58.9%) |
| Bottled, Tank, or LP Gas | 14 (3.4%) | 0 (0.0%) |
| Electricity | 38 (9.1%) | 115 (41.1%) |
| Fuel Oil or Kerosene | 0 (0.0%) | 0 (0.0%) |
| Coal or Coke | 0 (0.0%) | 0 (0.0%) |
| All other Fuels | 0 (0.0%) | 0 (0.0%) |
| No Fuel Used | 0 (0.0%) | 0 (0.0%) |
| Total | 417 (100.0%) | 280 (100.0%) |
Household Vehicle Usage in Plymouth
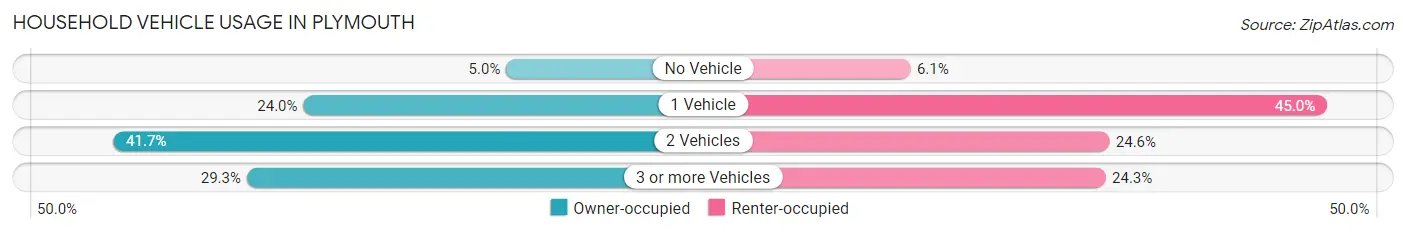
| Vehicles per Household | Owner-occupied | Renter-occupied |
| No Vehicle | 21 (5.0%) | 17 (6.1%) |
| 1 Vehicle | 100 (24.0%) | 126 (45.0%) |
| 2 Vehicles | 174 (41.7%) | 69 (24.6%) |
| 3 or more Vehicles | 122 (29.3%) | 68 (24.3%) |
| Total | 417 (100.0%) | 280 (100.0%) |
Real Estate & Mortgages in Plymouth
Real Estate and Mortgage Overview in Plymouth
| Characteristic | Without Mortgage | With Mortgage |
| Housing Units | 177 | 240 |
| Median Property Value | $77,000 | $114,100 |
| Median Household Income | $72,250 | $74 |
| Monthly Housing Costs | $571 | $2 |
| Real Estate Taxes | $1,408 | $0 |
Property Value by Mortgage Status in Plymouth
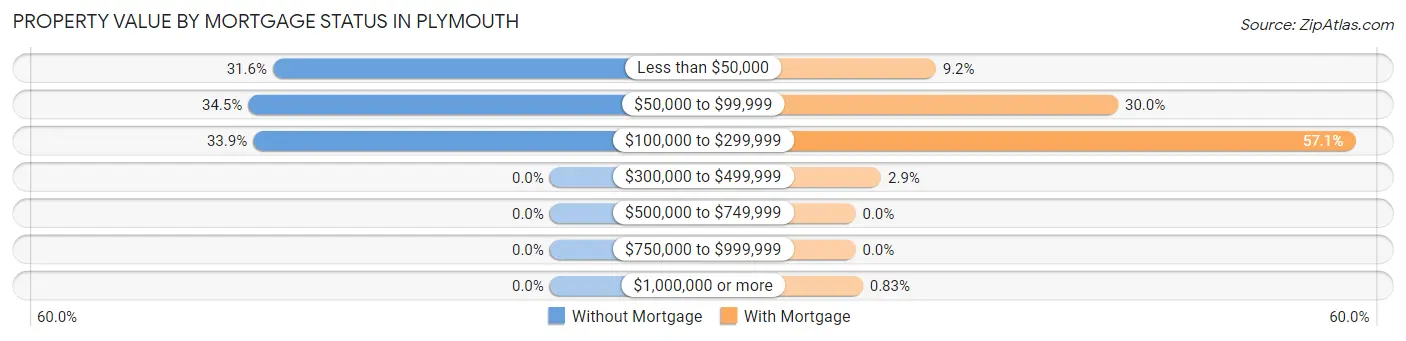
| Property Value | Without Mortgage | With Mortgage |
| Less than $50,000 | 56 (31.6%) | 22 (9.2%) |
| $50,000 to $99,999 | 61 (34.5%) | 72 (30.0%) |
| $100,000 to $299,999 | 60 (33.9%) | 137 (57.1%) |
| $300,000 to $499,999 | 0 (0.0%) | 7 (2.9%) |
| $500,000 to $749,999 | 0 (0.0%) | 0 (0.0%) |
| $750,000 to $999,999 | 0 (0.0%) | 0 (0.0%) |
| $1,000,000 or more | 0 (0.0%) | 2 (0.8%) |
| Total | 177 (100.0%) | 240 (100.0%) |
Household Income by Mortgage Status in Plymouth
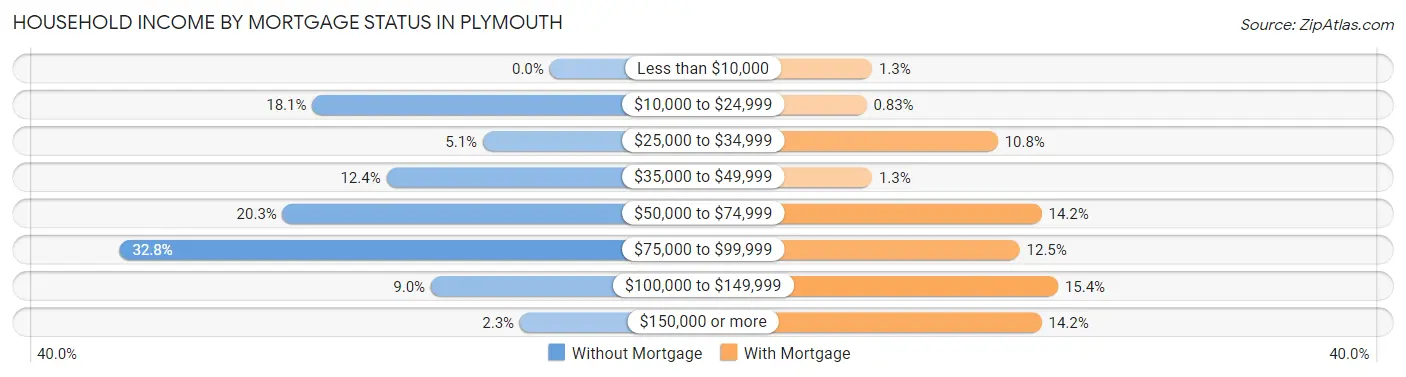
| Household Income | Without Mortgage | With Mortgage |
| Less than $10,000 | 0 (0.0%) | 3 (1.3%) |
| $10,000 to $24,999 | 32 (18.1%) | 2 (0.8%) |
| $25,000 to $34,999 | 9 (5.1%) | 26 (10.8%) |
| $35,000 to $49,999 | 22 (12.4%) | 3 (1.3%) |
| $50,000 to $74,999 | 36 (20.3%) | 34 (14.2%) |
| $75,000 to $99,999 | 58 (32.8%) | 30 (12.5%) |
| $100,000 to $149,999 | 16 (9.0%) | 37 (15.4%) |
| $150,000 or more | 4 (2.3%) | 34 (14.2%) |
| Total | 177 (100.0%) | 240 (100.0%) |
Property Value to Household Income Ratio in Plymouth
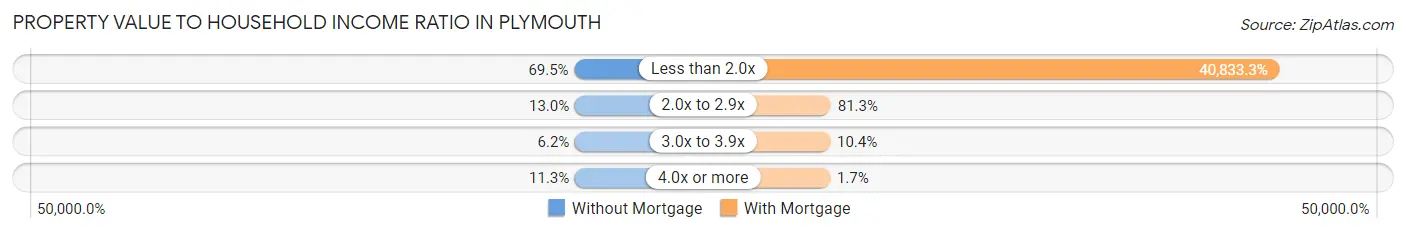
| Value-to-Income Ratio | Without Mortgage | With Mortgage |
| Less than 2.0x | 123 (69.5%) | 98,000 (40,833.3%) |
| 2.0x to 2.9x | 23 (13.0%) | 195 (81.2%) |
| 3.0x to 3.9x | 11 (6.2%) | 25 (10.4%) |
| 4.0x or more | 20 (11.3%) | 4 (1.7%) |
| Total | 177 (100.0%) | 240 (100.0%) |
Real Estate Taxes by Mortgage Status in Plymouth
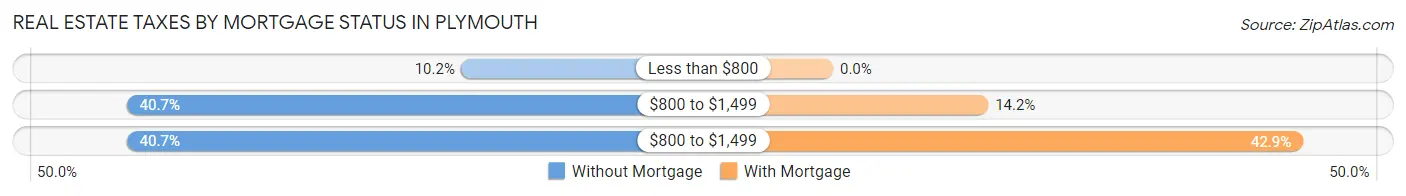
| Property Taxes | Without Mortgage | With Mortgage |
| Less than $800 | 18 (10.2%) | 0 (0.0%) |
| $800 to $1,499 | 72 (40.7%) | 34 (14.2%) |
| $800 to $1,499 | 72 (40.7%) | 103 (42.9%) |
| Total | 177 (100.0%) | 240 (100.0%) |
Health & Disability in Plymouth
Health Insurance Coverage by Age in Plymouth
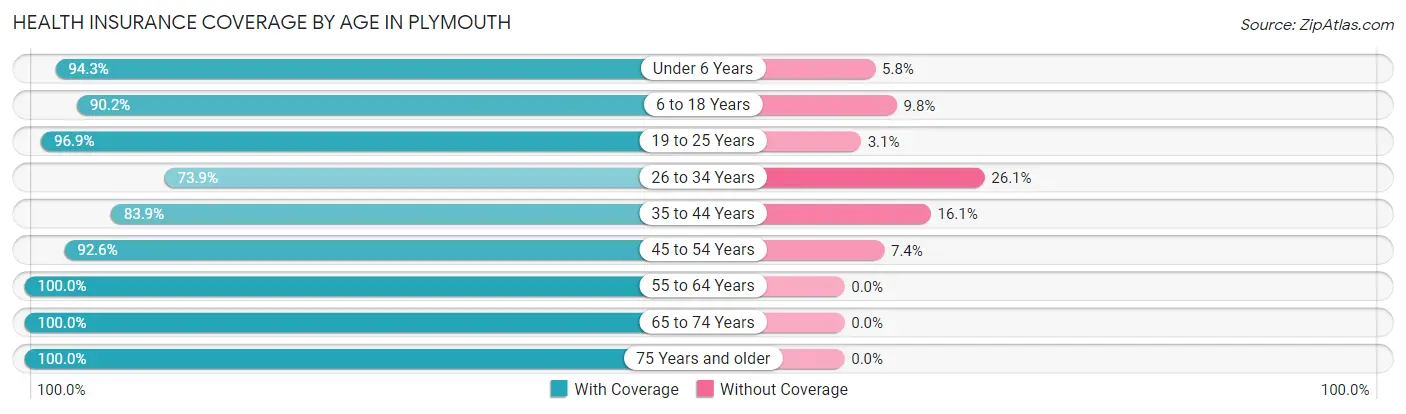
| Age Bracket | With Coverage | Without Coverage |
| Under 6 Years | 213 (94.3%) | 13 (5.8%) |
| 6 to 18 Years | 259 (90.2%) | 28 (9.8%) |
| 19 to 25 Years | 158 (96.9%) | 5 (3.1%) |
| 26 to 34 Years | 181 (73.9%) | 64 (26.1%) |
| 35 to 44 Years | 146 (83.9%) | 28 (16.1%) |
| 45 to 54 Years | 275 (92.6%) | 22 (7.4%) |
| 55 to 64 Years | 140 (100.0%) | 0 (0.0%) |
| 65 to 74 Years | 141 (100.0%) | 0 (0.0%) |
| 75 Years and older | 115 (100.0%) | 0 (0.0%) |
| Total | 1,628 (91.0%) | 160 (8.9%) |
Health Insurance Coverage by Citizenship Status in Plymouth
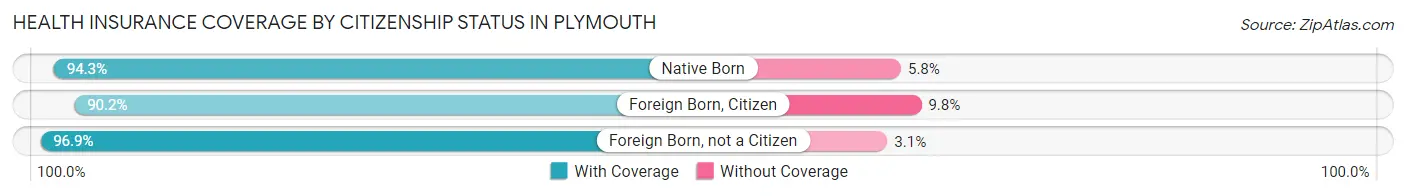
| Citizenship Status | With Coverage | Without Coverage |
| Native Born | 213 (94.3%) | 13 (5.8%) |
| Foreign Born, Citizen | 259 (90.2%) | 28 (9.8%) |
| Foreign Born, not a Citizen | 158 (96.9%) | 5 (3.1%) |
Health Insurance Coverage by Household Income in Plymouth
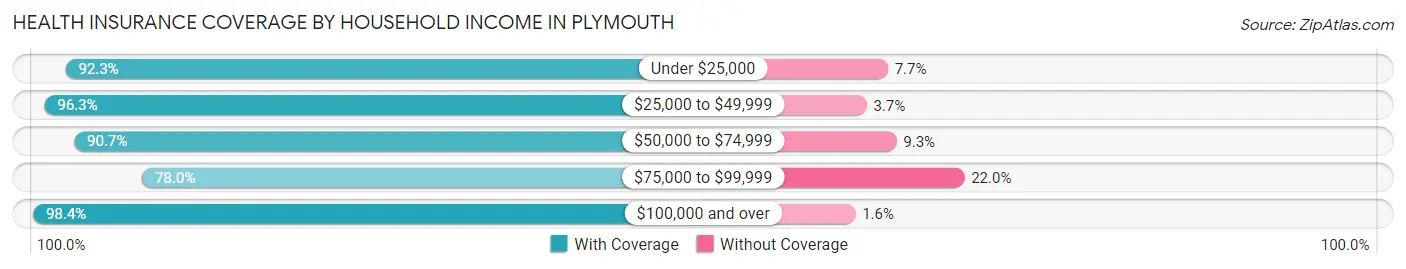
| Household Income | With Coverage | Without Coverage |
| Under $25,000 | 229 (92.3%) | 19 (7.7%) |
| $25,000 to $49,999 | 338 (96.3%) | 13 (3.7%) |
| $50,000 to $74,999 | 303 (90.7%) | 31 (9.3%) |
| $75,000 to $99,999 | 319 (78.0%) | 90 (22.0%) |
| $100,000 and over | 439 (98.4%) | 7 (1.6%) |
Public vs Private Health Insurance Coverage by Age in Plymouth
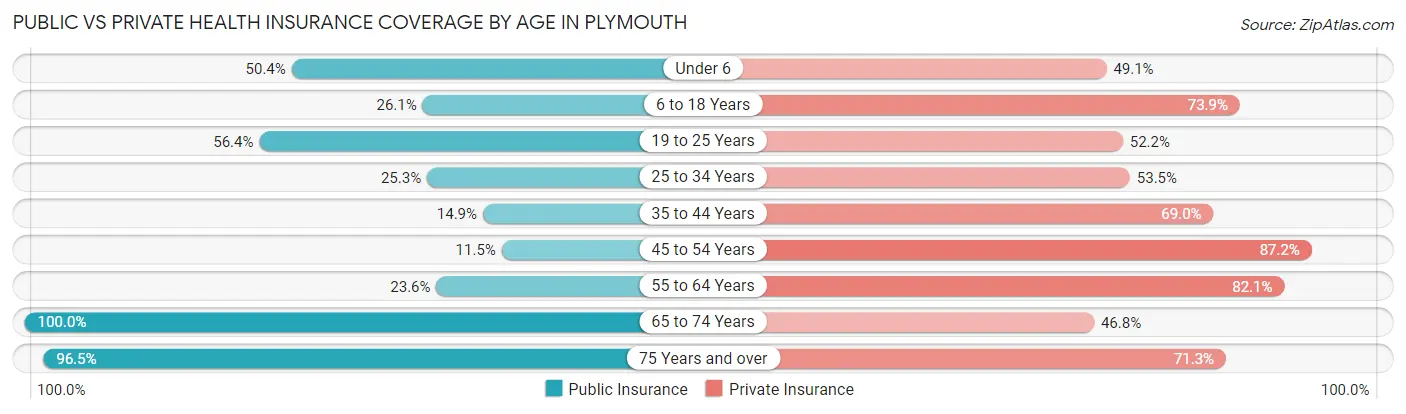
| Age Bracket | Public Insurance | Private Insurance |
| Under 6 | 114 (50.4%) | 111 (49.1%) |
| 6 to 18 Years | 75 (26.1%) | 212 (73.9%) |
| 19 to 25 Years | 92 (56.4%) | 85 (52.1%) |
| 25 to 34 Years | 62 (25.3%) | 131 (53.5%) |
| 35 to 44 Years | 26 (14.9%) | 120 (69.0%) |
| 45 to 54 Years | 34 (11.5%) | 259 (87.2%) |
| 55 to 64 Years | 33 (23.6%) | 115 (82.1%) |
| 65 to 74 Years | 141 (100.0%) | 66 (46.8%) |
| 75 Years and over | 111 (96.5%) | 82 (71.3%) |
| Total | 688 (38.5%) | 1,181 (66.0%) |
Disability Status by Sex by Age in Plymouth
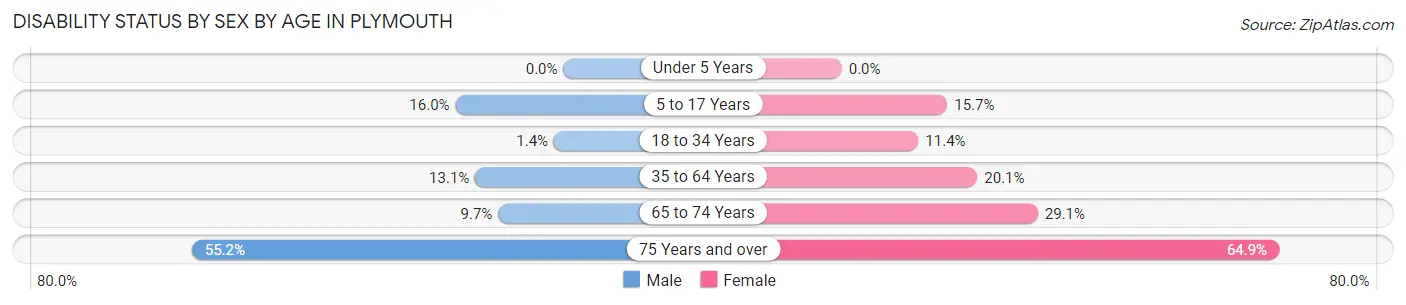
| Age Bracket | Male | Female |
| Under 5 Years | 0 (0.0%) | 0 (0.0%) |
| 5 to 17 Years | 21 (16.0%) | 21 (15.7%) |
| 18 to 34 Years | 3 (1.4%) | 28 (11.4%) |
| 35 to 64 Years | 41 (13.1%) | 60 (20.1%) |
| 65 to 74 Years | 6 (9.7%) | 23 (29.1%) |
| 75 Years and over | 32 (55.2%) | 37 (64.9%) |
Disability Class by Sex by Age in Plymouth
Disability Class: Hearing Difficulty
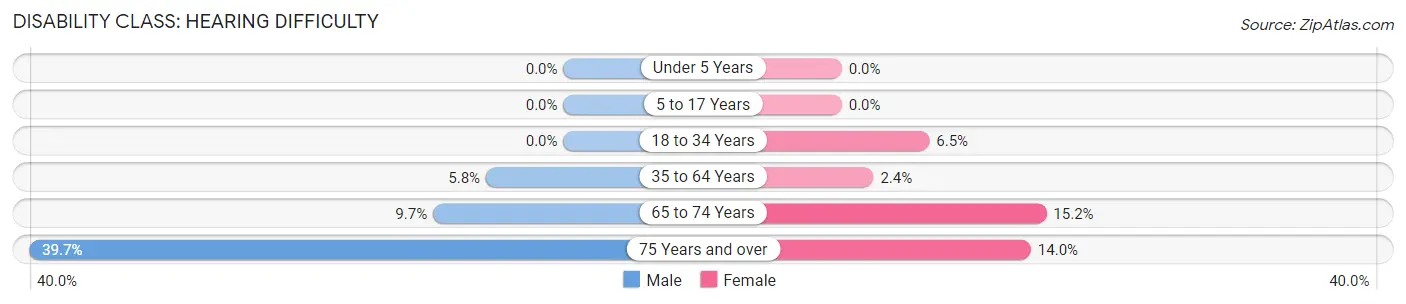
| Age Bracket | Male | Female |
| Under 5 Years | 0 (0.0%) | 0 (0.0%) |
| 5 to 17 Years | 0 (0.0%) | 0 (0.0%) |
| 18 to 34 Years | 0 (0.0%) | 16 (6.5%) |
| 35 to 64 Years | 18 (5.8%) | 7 (2.4%) |
| 65 to 74 Years | 6 (9.7%) | 12 (15.2%) |
| 75 Years and over | 23 (39.7%) | 8 (14.0%) |
Disability Class: Vision Difficulty
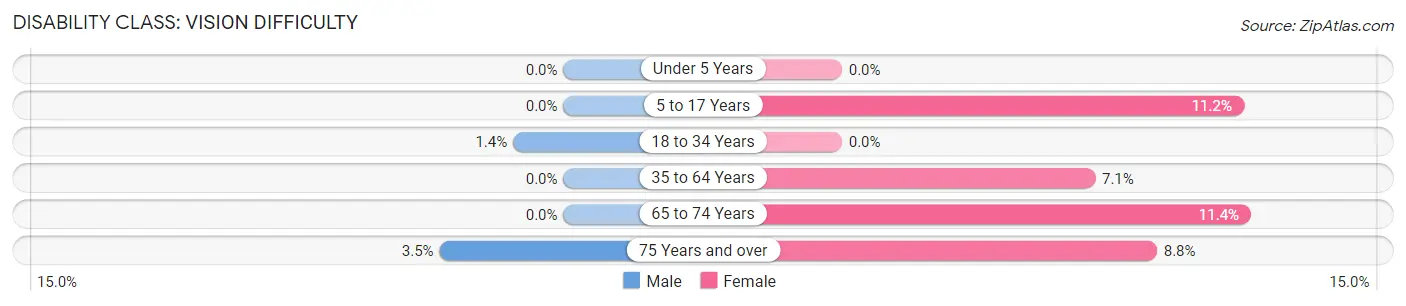
| Age Bracket | Male | Female |
| Under 5 Years | 0 (0.0%) | 0 (0.0%) |
| 5 to 17 Years | 0 (0.0%) | 15 (11.2%) |
| 18 to 34 Years | 3 (1.4%) | 0 (0.0%) |
| 35 to 64 Years | 0 (0.0%) | 21 (7.0%) |
| 65 to 74 Years | 0 (0.0%) | 9 (11.4%) |
| 75 Years and over | 2 (3.5%) | 5 (8.8%) |
Disability Class: Cognitive Difficulty
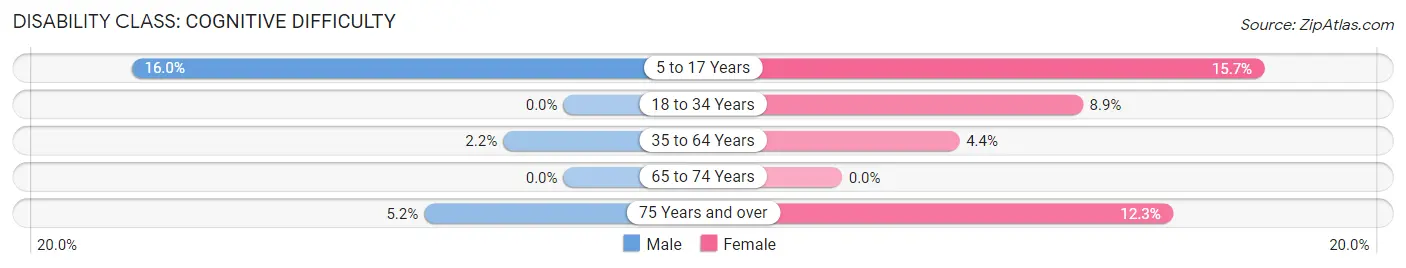
| Age Bracket | Male | Female |
| 5 to 17 Years | 21 (16.0%) | 21 (15.7%) |
| 18 to 34 Years | 0 (0.0%) | 22 (8.9%) |
| 35 to 64 Years | 7 (2.2%) | 13 (4.4%) |
| 65 to 74 Years | 0 (0.0%) | 0 (0.0%) |
| 75 Years and over | 3 (5.2%) | 7 (12.3%) |
Disability Class: Ambulatory Difficulty
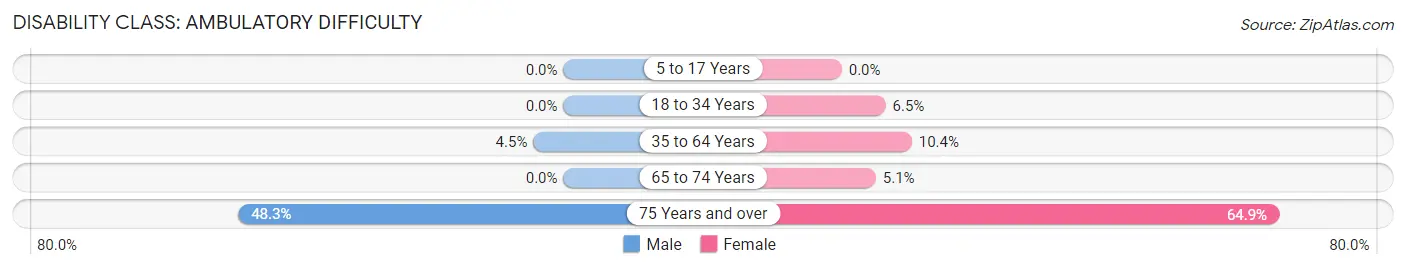
| Age Bracket | Male | Female |
| 5 to 17 Years | 0 (0.0%) | 0 (0.0%) |
| 18 to 34 Years | 0 (0.0%) | 16 (6.5%) |
| 35 to 64 Years | 14 (4.5%) | 31 (10.4%) |
| 65 to 74 Years | 0 (0.0%) | 4 (5.1%) |
| 75 Years and over | 28 (48.3%) | 37 (64.9%) |
Disability Class: Self-Care Difficulty
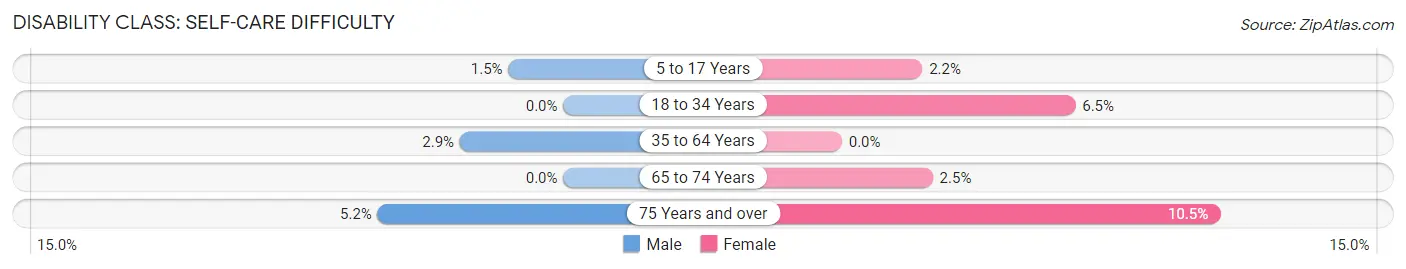
| Age Bracket | Male | Female |
| 5 to 17 Years | 2 (1.5%) | 3 (2.2%) |
| 18 to 34 Years | 0 (0.0%) | 16 (6.5%) |
| 35 to 64 Years | 9 (2.9%) | 0 (0.0%) |
| 65 to 74 Years | 0 (0.0%) | 2 (2.5%) |
| 75 Years and over | 3 (5.2%) | 6 (10.5%) |
Technology Access in Plymouth
Computing Device Access in Plymouth
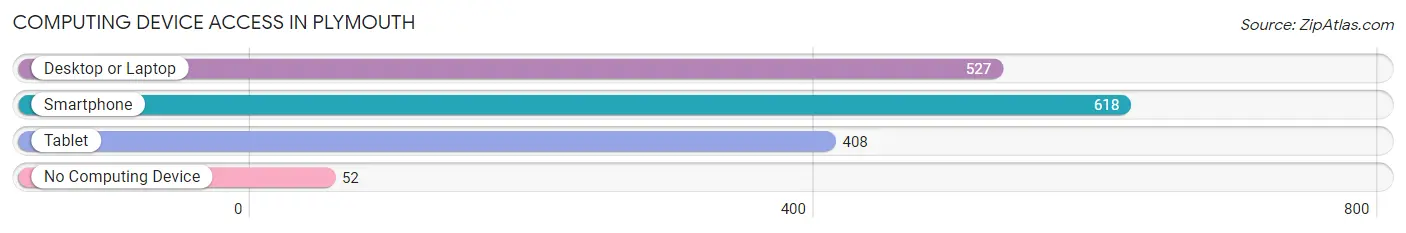
| Device Type | # Households | % Households |
| Desktop or Laptop | 527 | 75.6% |
| Smartphone | 618 | 88.7% |
| Tablet | 408 | 58.5% |
| No Computing Device | 52 | 7.5% |
| Total | 697 | 100.0% |
Internet Access in Plymouth
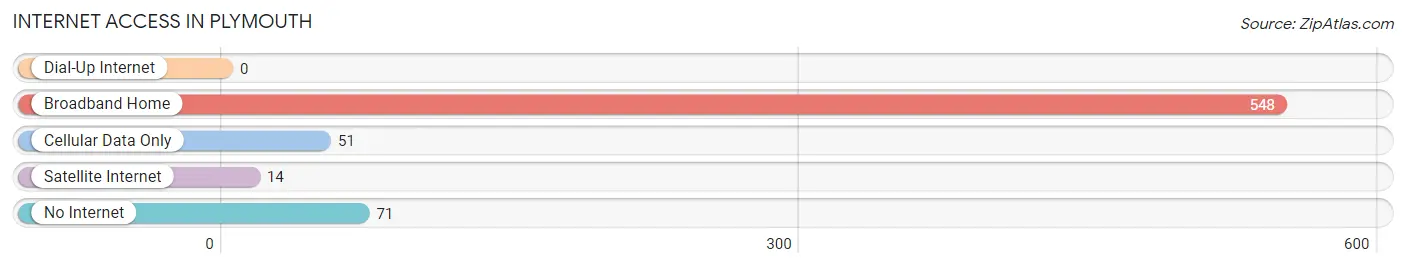
| Internet Type | # Households | % Households |
| Dial-Up Internet | 0 | 0.0% |
| Broadband Home | 548 | 78.6% |
| Cellular Data Only | 51 | 7.3% |
| Satellite Internet | 14 | 2.0% |
| No Internet | 71 | 10.2% |
| Total | 697 | 100.0% |
Plymouth Summary
Plymouth, Ohio is a small village located in Huron County, Ohio. It is situated on the banks of the Huron River, approximately 25 miles east of Sandusky. The village has a population of 1,845 people, according to the 2010 census.
History
Plymouth was founded in 1817 by a group of settlers from Connecticut. The village was named after the town of Plymouth, Connecticut. The settlers were attracted to the area due to its fertile soil and abundant natural resources. The village was incorporated in 1837.
In the early years, Plymouth was a farming community. The village was also home to several mills, including a grist mill, saw mill, and woolen mill. The village also had a blacksmith shop, a tannery, and a brickyard.
In the late 19th century, Plymouth began to experience a period of growth. The village was connected to the outside world by the Toledo, Norwalk, and Cleveland Railroad in 1882. This allowed for the shipment of goods and services to and from the village.
In the early 20th century, Plymouth experienced a period of decline. The railroad was abandoned in the 1920s, and the mills and other businesses began to close. The population of the village began to decline as well.
Geography
Plymouth is located in Huron County, Ohio. It is situated on the banks of the Huron River, approximately 25 miles east of Sandusky. The village has a total area of 0.9 square miles, all of which is land.
The village is located in a rural area, with the nearest major city being Sandusky. The village is surrounded by farmland and wooded areas. The Huron River runs through the village, providing a source of recreation for the residents.
Economy
The economy of Plymouth is largely based on agriculture. The village is home to several farms, which produce a variety of crops, including corn, soybeans, and wheat. The village also has several small businesses, including a grocery store, a hardware store, and a restaurant.
The village is also home to several manufacturing companies, including a plastics manufacturer and a metal fabrication company. The village is also home to a number of service-based businesses, including a bank, a post office, and a library.
Demographics
According to the 2010 census, the population of Plymouth was 1,845 people. The racial makeup of the village was 97.3% White, 0.7% African American, 0.2% Native American, 0.2% Asian, 0.1% Pacific Islander, 0.2% from other races, and 1.3% from two or more races.
The median household income in the village was $41,250, and the median family income was $48,750. The per capita income in the village was $19,945. About 8.3% of the population was below the poverty line.
Conclusion
Plymouth, Ohio is a small village located in Huron County, Ohio. It is situated on the banks of the Huron River, approximately 25 miles east of Sandusky. The village has a population of 1,845 people, according to the 2010 census. The economy of Plymouth is largely based on agriculture, with several small businesses and manufacturing companies located in the village. The racial makeup of the village is predominantly White, with a small percentage of African American, Native American, Asian, and Pacific Islander residents. The median household income in the village was $41,250, and the median family income was $48,750.
Common Questions
What is Per Capita Income in Plymouth?
Per Capita income in Plymouth is $26,147.
What is the Median Family Income in Plymouth?
Median Family Income in Plymouth is $75,847.
What is the Median Household income in Plymouth?
Median Household Income in Plymouth is $63,594.
What is Income or Wage Gap in Plymouth?
Income or Wage Gap in Plymouth is 23.4%.
Women in Plymouth earn 76.6 cents for every dollar earned by a man.
What is Inequality or Gini Index in Plymouth?
Inequality or Gini Index in Plymouth is 0.37.
What is the Total Population of Plymouth?
Total Population of Plymouth is 1,788.
What is the Total Male Population of Plymouth?
Total Male Population of Plymouth is 880.
What is the Total Female Population of Plymouth?
Total Female Population of Plymouth is 908.
What is the Ratio of Males per 100 Females in Plymouth?
There are 96.92 Males per 100 Females in Plymouth.
What is the Ratio of Females per 100 Males in Plymouth?
There are 103.18 Females per 100 Males in Plymouth.
What is the Median Population Age in Plymouth?
Median Population Age in Plymouth is 33.9 Years.
What is the Average Family Size in Plymouth
Average Family Size in Plymouth is 3.1 People.
What is the Average Household Size in Plymouth
Average Household Size in Plymouth is 2.6 People.
How Large is the Labor Force in Plymouth?
There are 870 People in the Labor Forcein in Plymouth.
What is the Percentage of People in the Labor Force in Plymouth?
64.0% of People are in the Labor Force in Plymouth.
What is the Unemployment Rate in Plymouth?
Unemployment Rate in Plymouth is 7.6%.