Perrysville, OH Map & Demographics
Perrysville Map
Perrysville Overview
$21,947
PER CAPITA INCOME
$58,456
AVG FAMILY INCOME
$45,000
AVG HOUSEHOLD INCOME
42.8%
WAGE / INCOME GAP [ % ]
57.2¢/ $1
WAGE / INCOME GAP [ $ ]
0.35
INEQUALITY / GINI INDEX
803
TOTAL POPULATION
368
MALE POPULATION
435
FEMALE POPULATION
84.60
MALES / 100 FEMALES
118.21
FEMALES / 100 MALES
34.8
MEDIAN AGE
3.1
AVG FAMILY SIZE
2.4
AVG HOUSEHOLD SIZE
384
LABOR FORCE [ PEOPLE ]
59.3%
PERCENT IN LABOR FORCE
4.7%
UNEMPLOYMENT RATE
Perrysville Zip Codes
Income in Perrysville
Income Overview in Perrysville
Per Capita Income in Perrysville is $21,947, while median incomes of families and households are $58,456 and $45,000 respectively.
| Characteristic | Number | Measure |
| Per Capita Income | 803 | $21,947 |
| Median Family Income | 179 | $58,456 |
| Mean Family Income | 179 | $65,493 |
| Median Household Income | 332 | $45,000 |
| Mean Household Income | 332 | $52,433 |
| Income Deficit | 179 | $0 |
| Wage / Income Gap (%) | 803 | 42.80% |
| Wage / Income Gap ($) | 803 | 57.20¢ per $1 |
| Gini / Inequality Index | 803 | 0.35 |
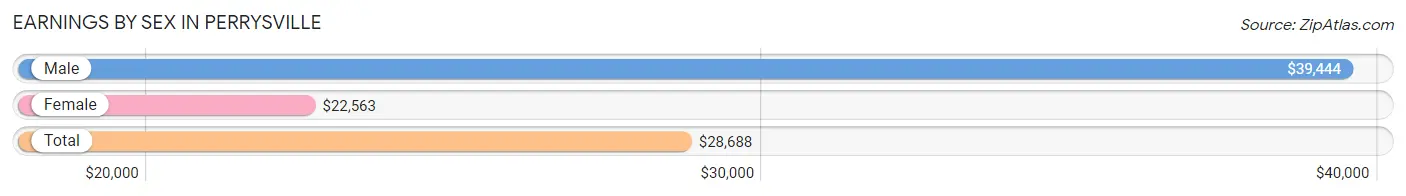
Earnings by Sex in Perrysville
Average Earnings in Perrysville are $28,688, $39,444 for men and $22,563 for women, a difference of 42.8%.
| Sex | Number | Average Earnings |
| Male | 214 (51.1%) | $39,444 |
| Female | 205 (48.9%) | $22,563 |
| Total | 419 (100.0%) | $28,688 |
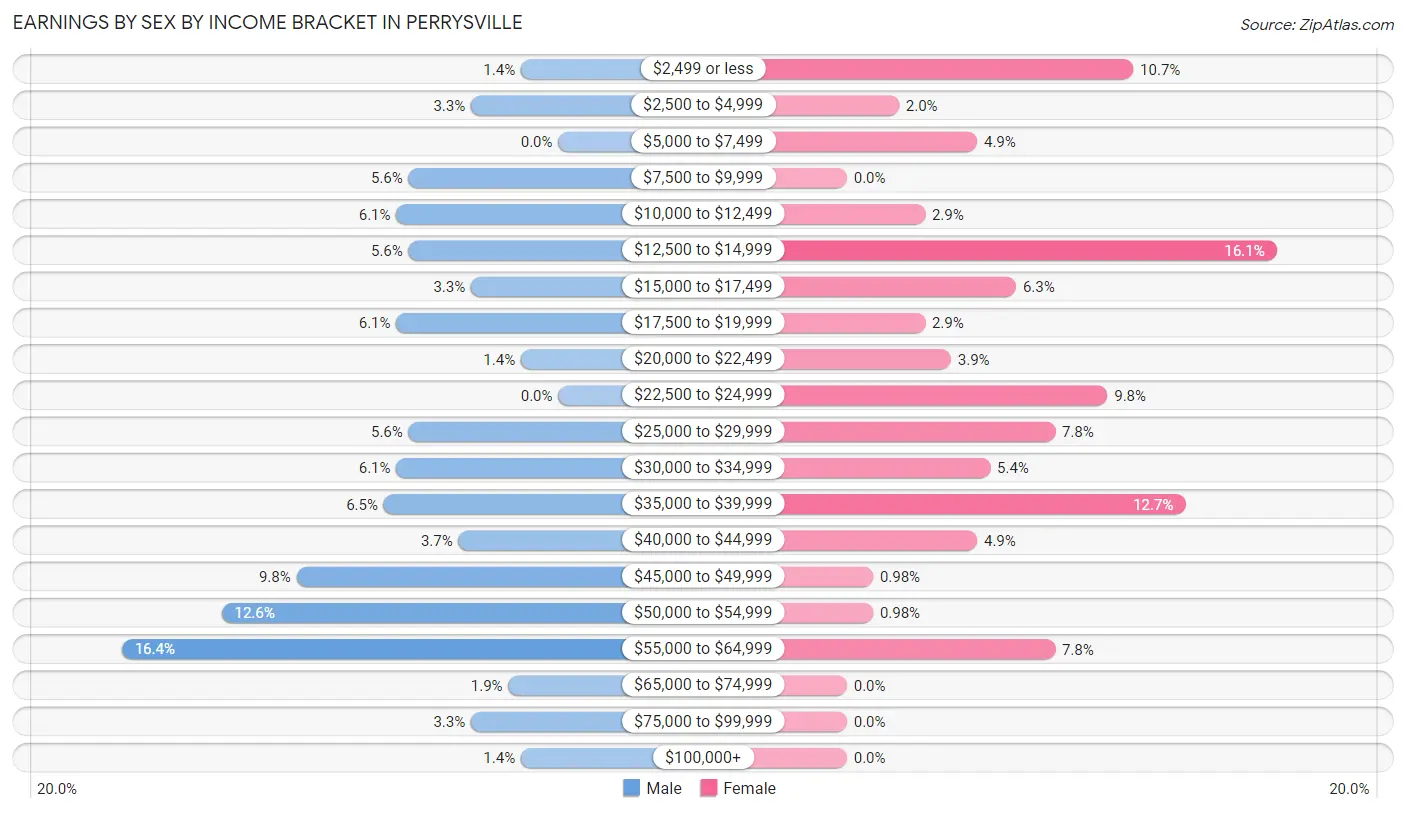
Earnings by Sex by Income Bracket in Perrysville
The most common earnings brackets in Perrysville are $55,000 to $64,999 for men (35 | 16.4%) and $12,500 to $14,999 for women (33 | 16.1%).
| Income | Male | Female |
| $2,499 or less | 3 (1.4%) | 22 (10.7%) |
| $2,500 to $4,999 | 7 (3.3%) | 4 (1.9%) |
| $5,000 to $7,499 | 0 (0.0%) | 10 (4.9%) |
| $7,500 to $9,999 | 12 (5.6%) | 0 (0.0%) |
| $10,000 to $12,499 | 13 (6.1%) | 6 (2.9%) |
| $12,500 to $14,999 | 12 (5.6%) | 33 (16.1%) |
| $15,000 to $17,499 | 7 (3.3%) | 13 (6.3%) |
| $17,500 to $19,999 | 13 (6.1%) | 6 (2.9%) |
| $20,000 to $22,499 | 3 (1.4%) | 8 (3.9%) |
| $22,500 to $24,999 | 0 (0.0%) | 20 (9.8%) |
| $25,000 to $29,999 | 12 (5.6%) | 16 (7.8%) |
| $30,000 to $34,999 | 13 (6.1%) | 11 (5.4%) |
| $35,000 to $39,999 | 14 (6.5%) | 26 (12.7%) |
| $40,000 to $44,999 | 8 (3.7%) | 10 (4.9%) |
| $45,000 to $49,999 | 21 (9.8%) | 2 (1.0%) |
| $50,000 to $54,999 | 27 (12.6%) | 2 (1.0%) |
| $55,000 to $64,999 | 35 (16.4%) | 16 (7.8%) |
| $65,000 to $74,999 | 4 (1.9%) | 0 (0.0%) |
| $75,000 to $99,999 | 7 (3.3%) | 0 (0.0%) |
| $100,000+ | 3 (1.4%) | 0 (0.0%) |
| Total | 214 (100.0%) | 205 (100.0%) |
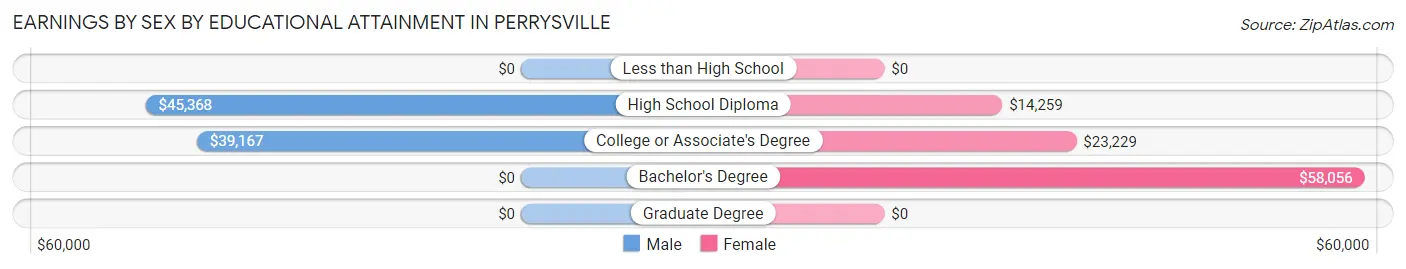
Earnings by Sex by Educational Attainment in Perrysville
Average earnings in Perrysville are $45,882 for men and $20,750 for women, a difference of 54.8%. Men with an educational attainment of high school diploma enjoy the highest average annual earnings of $45,368, while those with college or associate's degree education earn the least with $39,167. Women with an educational attainment of bachelor's degree earn the most with the average annual earnings of $58,056, while those with high school diploma education have the smallest earnings of $14,259.
| Educational Attainment | Male Income | Female Income |
| Less than High School | - | - |
| High School Diploma | $45,368 | $14,259 |
| College or Associate's Degree | $39,167 | $23,229 |
| Bachelor's Degree | - | - |
| Graduate Degree | - | - |
| Total | $45,882 | $20,750 |
Family Income in Perrysville
Family Income Brackets in Perrysville
According to the Perrysville family income data, there are 56 families falling into the $35,000 to $49,999 income range, which is the most common income bracket and makes up 31.3% of all families.
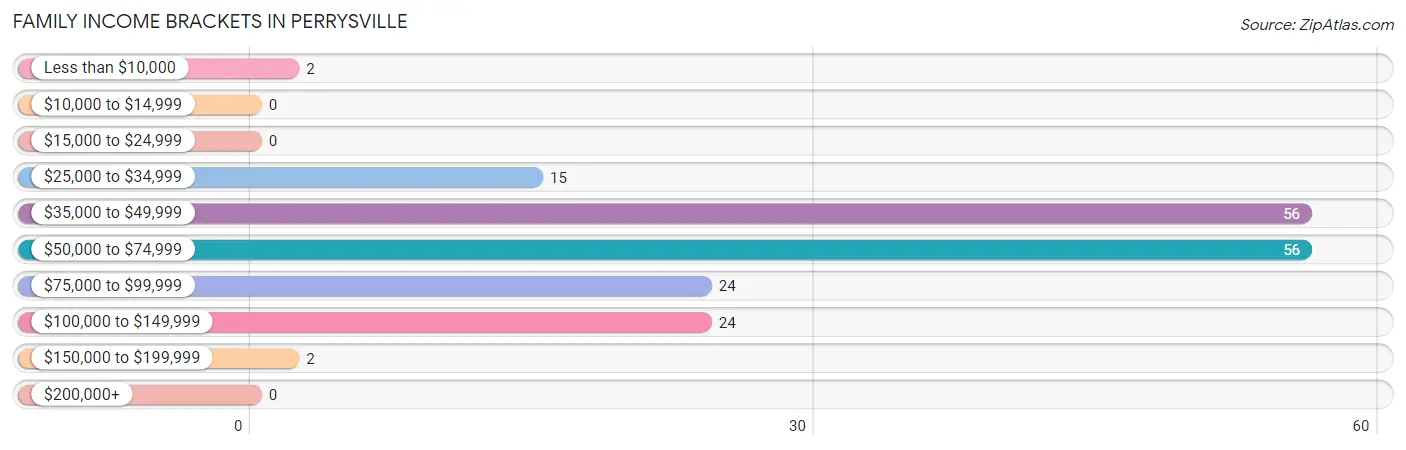
| Income Bracket | # Families | % Families |
| Less than $10,000 | 2 | 1.1% |
| $10,000 to $14,999 | 0 | 0.0% |
| $15,000 to $24,999 | 0 | 0.0% |
| $25,000 to $34,999 | 15 | 8.4% |
| $35,000 to $49,999 | 56 | 31.3% |
| $50,000 to $74,999 | 56 | 31.3% |
| $75,000 to $99,999 | 24 | 13.4% |
| $100,000 to $149,999 | 24 | 13.4% |
| $150,000 to $199,999 | 2 | 1.1% |
| $200,000+ | 0 | 0.0% |
Family Income by Famaliy Size in Perrysville
6-person families (9 | 5.0%) account for the highest median family income in Perrysville with $82,083 per family, while 2-person families (96 | 53.6%) have the highest median income of $27,143 per family member.
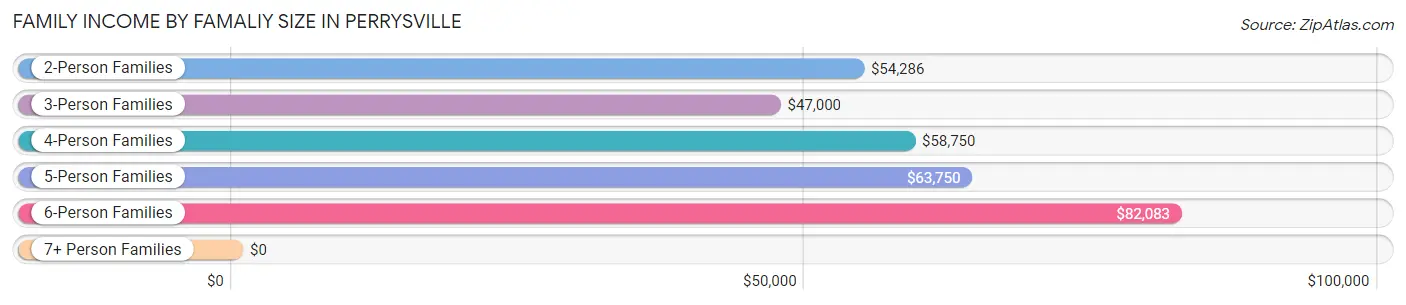
| Income Bracket | # Families | Median Income |
| 2-Person Families | 96 (53.6%) | $54,286 |
| 3-Person Families | 42 (23.5%) | $47,000 |
| 4-Person Families | 15 (8.4%) | $58,750 |
| 5-Person Families | 11 (6.1%) | $63,750 |
| 6-Person Families | 9 (5.0%) | $82,083 |
| 7+ Person Families | 6 (3.4%) | $0 |
| Total | 179 (100.0%) | $58,456 |
Family Income by Number of Earners in Perrysville
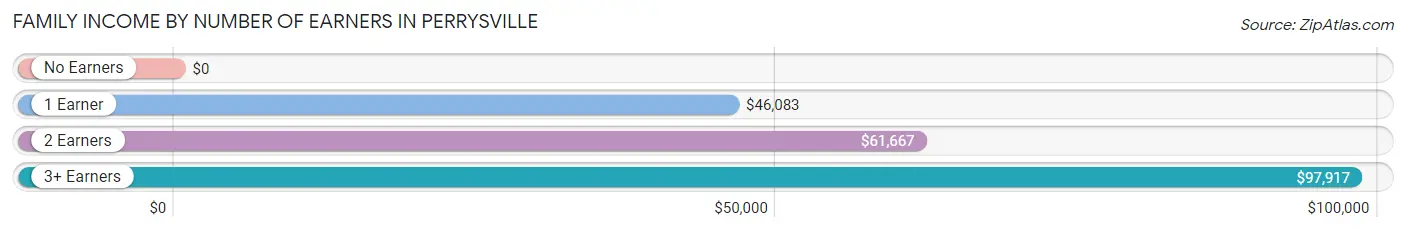
| Number of Earners | # Families | Median Income |
| No Earners | 24 (13.4%) | $0 |
| 1 Earner | 53 (29.6%) | $46,083 |
| 2 Earners | 76 (42.5%) | $61,667 |
| 3+ Earners | 26 (14.5%) | $97,917 |
| Total | 179 (100.0%) | $58,456 |
Household Income in Perrysville
Household Income Brackets in Perrysville
With 100 households falling in the category, the $50,000 to $74,999 income range is the most frequent in Perrysville, accounting for 30.1% of all households.
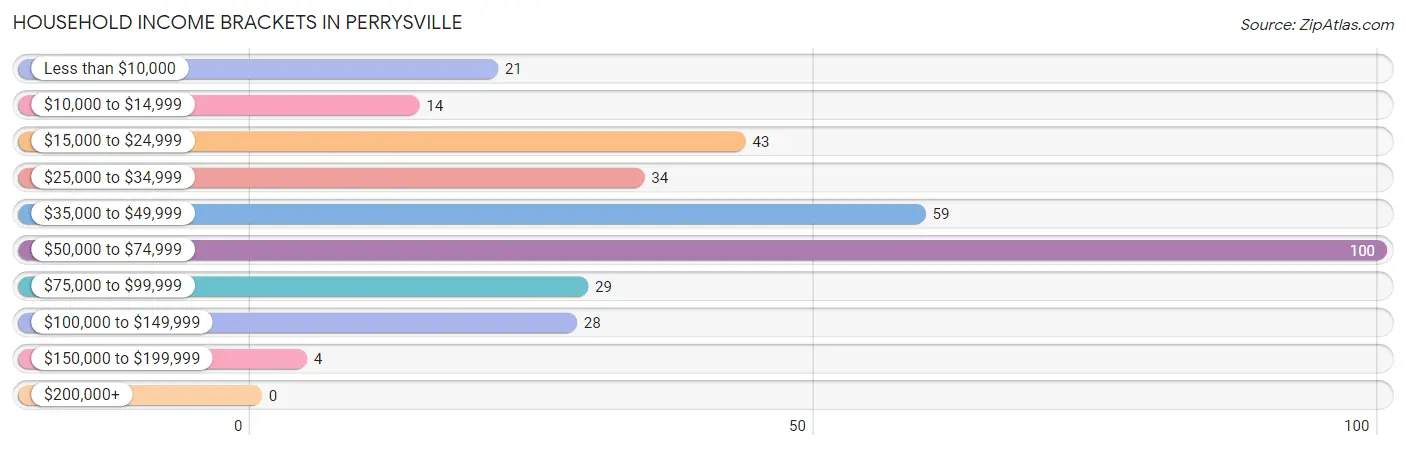
| Income Bracket | # Households | % Households |
| Less than $10,000 | 21 | 6.3% |
| $10,000 to $14,999 | 14 | 4.2% |
| $15,000 to $24,999 | 43 | 13.0% |
| $25,000 to $34,999 | 34 | 10.2% |
| $35,000 to $49,999 | 59 | 17.8% |
| $50,000 to $74,999 | 100 | 30.1% |
| $75,000 to $99,999 | 29 | 8.7% |
| $100,000 to $149,999 | 28 | 8.4% |
| $150,000 to $199,999 | 4 | 1.2% |
| $200,000+ | 0 | 0.0% |
Household Income by Householder Age in Perrysville
The median household income in Perrysville is $45,000, with the highest median household income of $58,164 found in the 25 to 44 years age bracket for the primary householder. A total of 129 households (38.9%) fall into this category. Meanwhile, the 15 to 24 years age bracket for the primary householder has the lowest median household income of $0, with 19 households (5.7%) in this group.
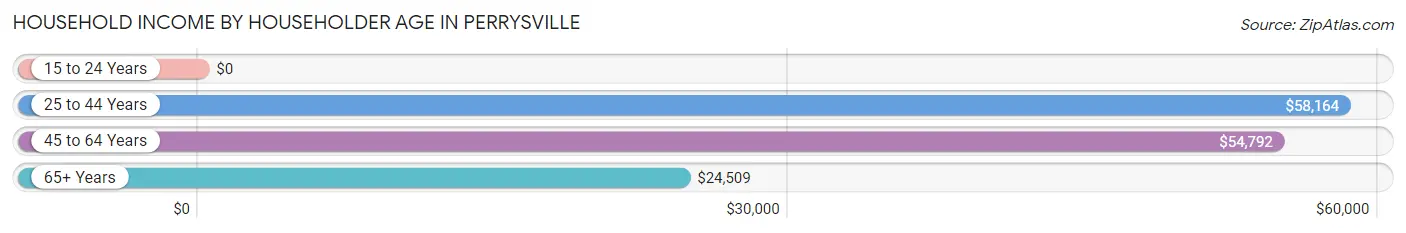
| Income Bracket | # Households | Median Income |
| 15 to 24 Years | 19 (5.7%) | $0 |
| 25 to 44 Years | 129 (38.9%) | $58,164 |
| 45 to 64 Years | 85 (25.6%) | $54,792 |
| 65+ Years | 99 (29.8%) | $24,509 |
| Total | 332 (100.0%) | $45,000 |
Poverty in Perrysville
Income Below Poverty by Sex and Age in Perrysville
With 9.0% poverty level for males and 20.5% for females among the residents of Perrysville, 16 and 17 year old males and 12 to 14 year old females are the most vulnerable to poverty, with 6 males (54.5%) and 9 females (52.9%) in their respective age groups living below the poverty level.
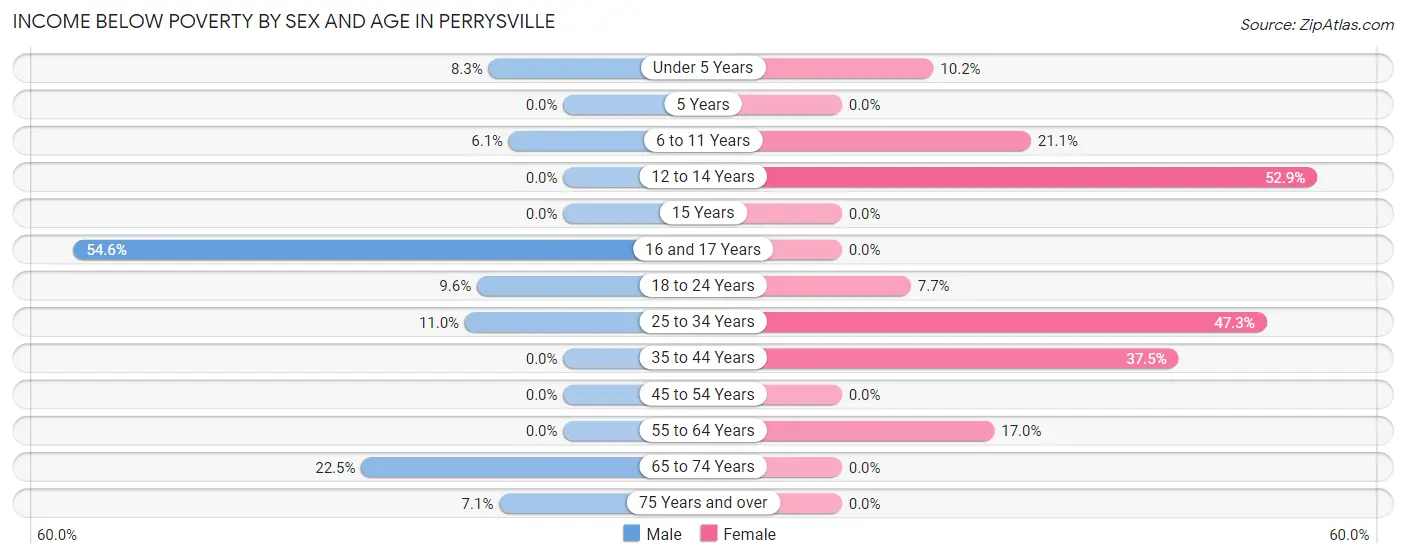
| Age Bracket | Male | Female |
| Under 5 Years | 2 (8.3%) | 5 (10.2%) |
| 5 Years | 0 (0.0%) | 0 (0.0%) |
| 6 to 11 Years | 2 (6.1%) | 4 (21.0%) |
| 12 to 14 Years | 0 (0.0%) | 9 (52.9%) |
| 15 Years | 0 (0.0%) | 0 (0.0%) |
| 16 and 17 Years | 6 (54.5%) | 0 (0.0%) |
| 18 to 24 Years | 5 (9.6%) | 3 (7.7%) |
| 25 to 34 Years | 8 (11.0%) | 35 (47.3%) |
| 35 to 44 Years | 0 (0.0%) | 24 (37.5%) |
| 45 to 54 Years | 0 (0.0%) | 0 (0.0%) |
| 55 to 64 Years | 0 (0.0%) | 9 (17.0%) |
| 65 to 74 Years | 9 (22.5%) | 0 (0.0%) |
| 75 Years and over | 1 (7.1%) | 0 (0.0%) |
| Total | 33 (9.0%) | 89 (20.5%) |
Income Above Poverty by Sex and Age in Perrysville
According to the poverty statistics in Perrysville, males aged 35 to 44 years and females aged 15 years are the age groups that are most secure financially, with 100.0% of males and 100.0% of females in these age groups living above the poverty line.
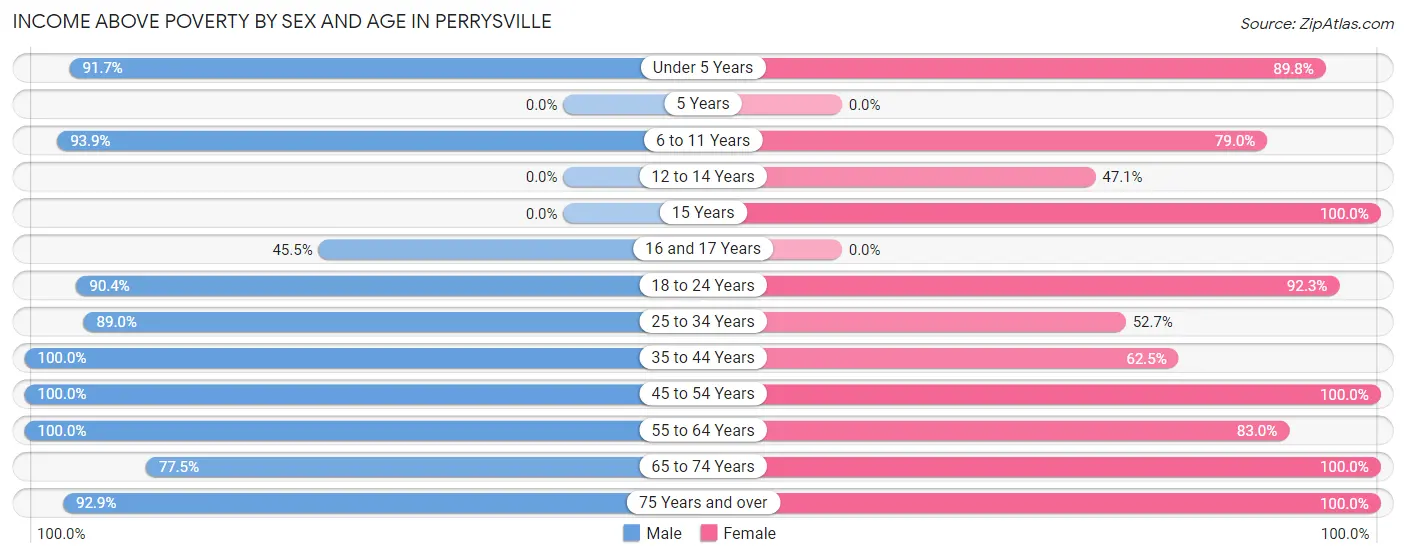
| Age Bracket | Male | Female |
| Under 5 Years | 22 (91.7%) | 44 (89.8%) |
| 5 Years | 0 (0.0%) | 0 (0.0%) |
| 6 to 11 Years | 31 (93.9%) | 15 (78.9%) |
| 12 to 14 Years | 0 (0.0%) | 8 (47.1%) |
| 15 Years | 0 (0.0%) | 11 (100.0%) |
| 16 and 17 Years | 5 (45.5%) | 0 (0.0%) |
| 18 to 24 Years | 47 (90.4%) | 36 (92.3%) |
| 25 to 34 Years | 65 (89.0%) | 39 (52.7%) |
| 35 to 44 Years | 52 (100.0%) | 40 (62.5%) |
| 45 to 54 Years | 28 (100.0%) | 35 (100.0%) |
| 55 to 64 Years | 39 (100.0%) | 44 (83.0%) |
| 65 to 74 Years | 31 (77.5%) | 21 (100.0%) |
| 75 Years and over | 13 (92.9%) | 53 (100.0%) |
| Total | 333 (91.0%) | 346 (79.5%) |
Income Below Poverty Among Married-Couple Families in Perrysville
The poverty statistics for married-couple families in Perrysville show that 3.0% or 4 of the total 131 families live below the poverty line. Families with 3 or 4 children have the highest poverty rate of 30.8%, comprising of 4 families. On the other hand, families with no children have the lowest poverty rate of 0.0%, which includes 0 families.
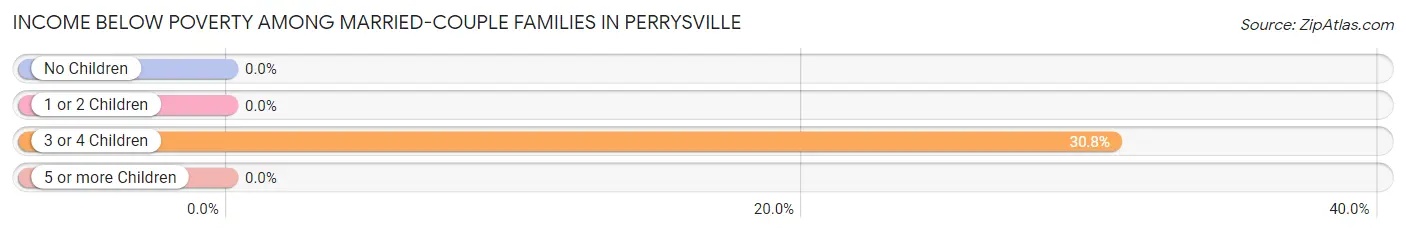
| Children | Above Poverty | Below Poverty |
| No Children | 92 (100.0%) | 0 (0.0%) |
| 1 or 2 Children | 26 (100.0%) | 0 (0.0%) |
| 3 or 4 Children | 9 (69.2%) | 4 (30.8%) |
| 5 or more Children | 0 (0.0%) | 0 (0.0%) |
| Total | 127 (97.0%) | 4 (3.0%) |
Income Below Poverty Among Single-Parent Households in Perrysville
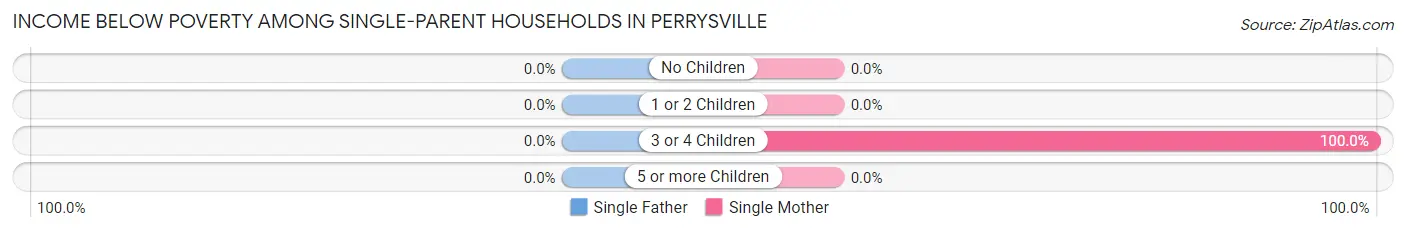
| Children | Single Father | Single Mother |
| No Children | 0 (0.0%) | 0 (0.0%) |
| 1 or 2 Children | 0 (0.0%) | 0 (0.0%) |
| 3 or 4 Children | 0 (0.0%) | 2 (100.0%) |
| 5 or more Children | 0 (0.0%) | 0 (0.0%) |
| Total | 0 (0.0%) | 2 (20.0%) |
Income Below Poverty Among Married-Couple vs Single-Parent Households in Perrysville
The poverty data for Perrysville shows that 4 of the married-couple family households (3.0%) and 2 of the single-parent households (4.2%) are living below the poverty level. Within the married-couple family households, those with 3 or 4 children have the highest poverty rate, with 4 households (30.8%) falling below the poverty line. Among the single-parent households, those with 3 or 4 children have the highest poverty rate, with 2 household (100.0%) living below poverty.
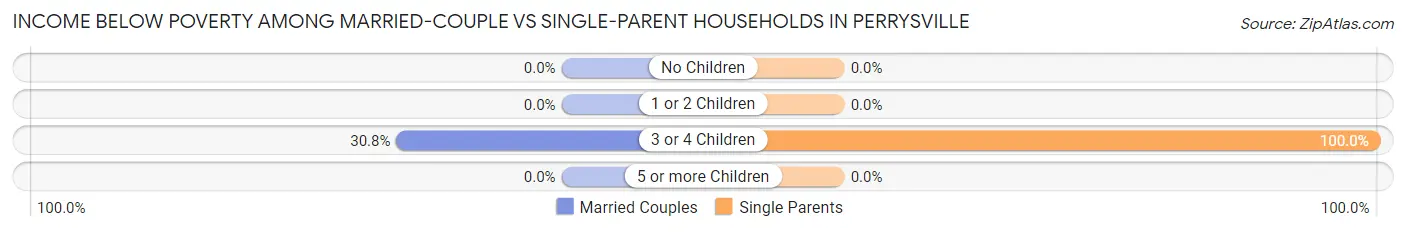
| Children | Married-Couple Families | Single-Parent Households |
| No Children | 0 (0.0%) | 0 (0.0%) |
| 1 or 2 Children | 0 (0.0%) | 0 (0.0%) |
| 3 or 4 Children | 4 (30.8%) | 2 (100.0%) |
| 5 or more Children | 0 (0.0%) | 0 (0.0%) |
| Total | 4 (3.0%) | 2 (4.2%) |
Race in Perrysville
The most populous races in Perrysville are White / Caucasian (715 | 89.0%), Two or more Races (68 | 8.5%), and Black / African American (13 | 1.6%).
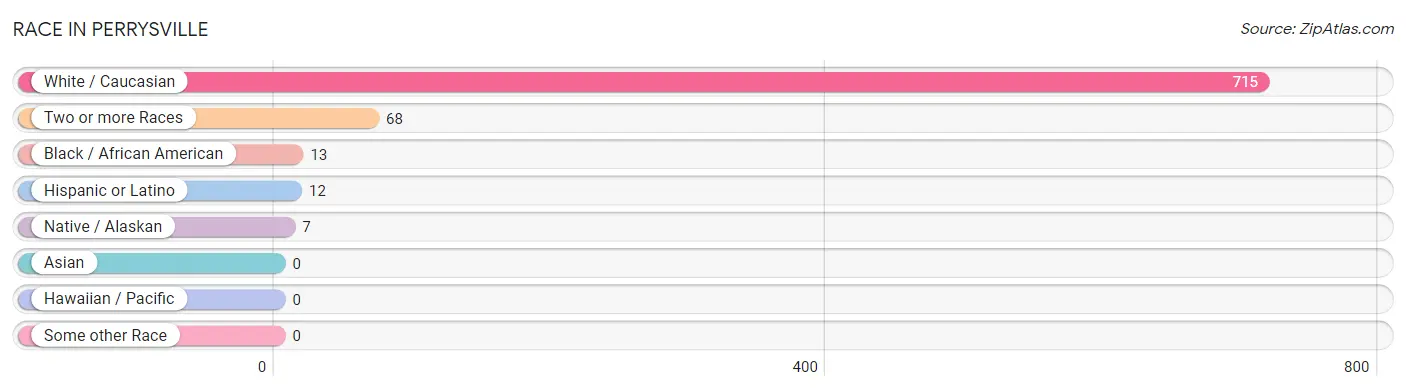
| Race | # Population | % Population |
| Asian | 0 | 0.0% |
| Black / African American | 13 | 1.6% |
| Hawaiian / Pacific | 0 | 0.0% |
| Hispanic or Latino | 12 | 1.5% |
| Native / Alaskan | 7 | 0.9% |
| White / Caucasian | 715 | 89.0% |
| Two or more Races | 68 | 8.5% |
| Some other Race | 0 | 0.0% |
| Total | 803 | 100.0% |
Ancestry in Perrysville
The most populous ancestries reported in Perrysville are German (171 | 21.3%), Irish (104 | 13.0%), English (103 | 12.8%), American (85 | 10.6%), and Welsh (44 | 5.5%), together accounting for 63.1% of all Perrysville residents.
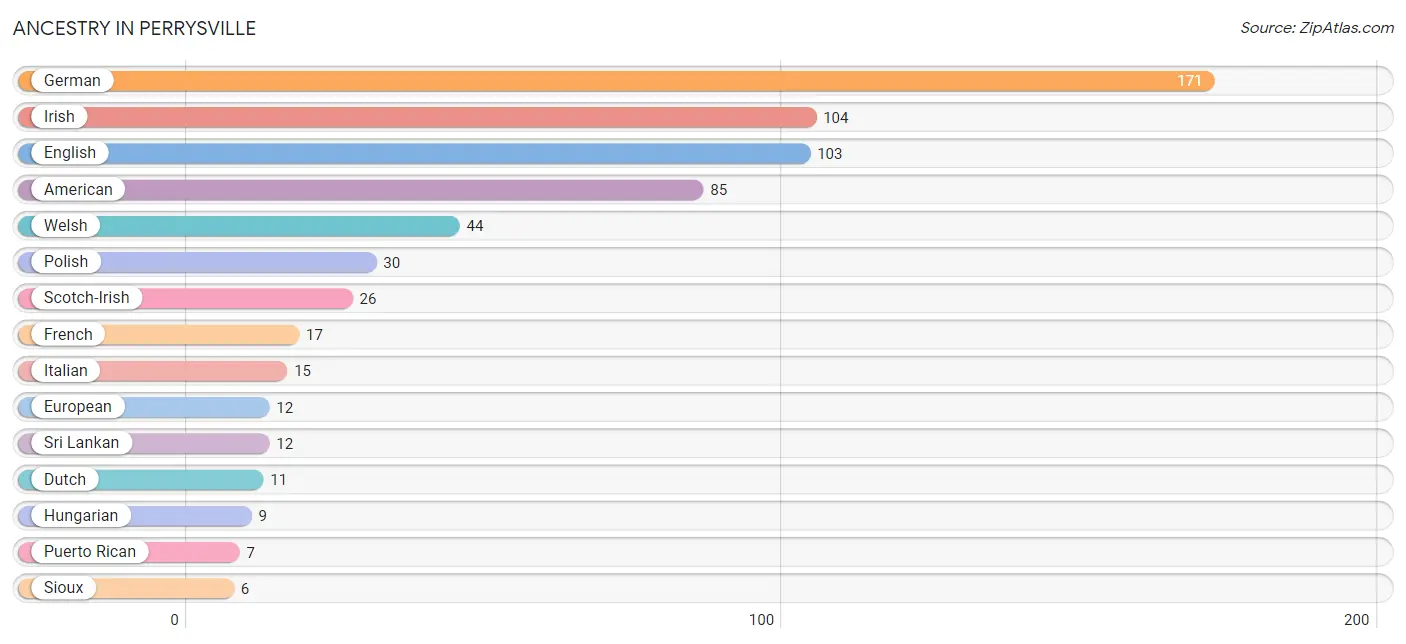
| Ancestry | # Population | % Population |
| American | 85 | 10.6% |
| British | 2 | 0.3% |
| Canadian | 3 | 0.4% |
| Dutch | 11 | 1.4% |
| English | 103 | 12.8% |
| European | 12 | 1.5% |
| French | 17 | 2.1% |
| German | 171 | 21.3% |
| Hungarian | 9 | 1.1% |
| Irish | 104 | 13.0% |
| Italian | 15 | 1.9% |
| Mexican | 5 | 0.6% |
| Pennsylvania German | 4 | 0.5% |
| Polish | 30 | 3.7% |
| Puerto Rican | 7 | 0.9% |
| Scandinavian | 2 | 0.3% |
| Scotch-Irish | 26 | 3.2% |
| Scottish | 3 | 0.4% |
| Sioux | 6 | 0.7% |
| Sri Lankan | 12 | 1.5% |
| Swiss | 3 | 0.4% |
| Welsh | 44 | 5.5% | View All 22 Rows |
Immigrants in Perrysville
The most numerous immigrant groups reported in Perrysville came from , and Canada (3 | 0.4%), together accounting for 0.4% of all Perrysville residents.

| Immigration Origin | # Population | % Population |
| Canada | 3 | 0.4% | View All 1 Rows |
Sex and Age in Perrysville
Sex and Age in Perrysville
The most populous age groups in Perrysville are 15 to 19 Years (40 | 10.9%) for men and 25 to 29 Years (64 | 14.7%) for women.
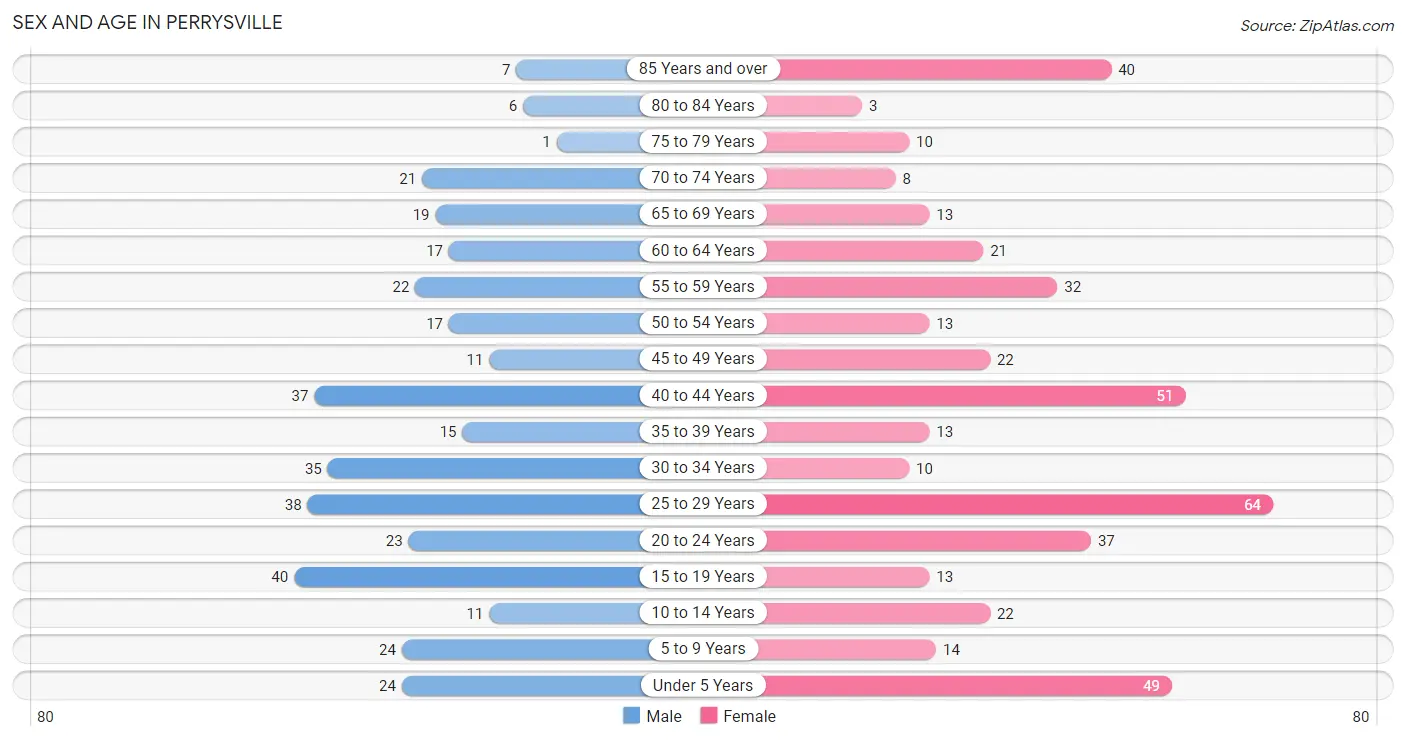
| Age Bracket | Male | Female |
| Under 5 Years | 24 (6.5%) | 49 (11.3%) |
| 5 to 9 Years | 24 (6.5%) | 14 (3.2%) |
| 10 to 14 Years | 11 (3.0%) | 22 (5.1%) |
| 15 to 19 Years | 40 (10.9%) | 13 (3.0%) |
| 20 to 24 Years | 23 (6.2%) | 37 (8.5%) |
| 25 to 29 Years | 38 (10.3%) | 64 (14.7%) |
| 30 to 34 Years | 35 (9.5%) | 10 (2.3%) |
| 35 to 39 Years | 15 (4.1%) | 13 (3.0%) |
| 40 to 44 Years | 37 (10.1%) | 51 (11.7%) |
| 45 to 49 Years | 11 (3.0%) | 22 (5.1%) |
| 50 to 54 Years | 17 (4.6%) | 13 (3.0%) |
| 55 to 59 Years | 22 (6.0%) | 32 (7.4%) |
| 60 to 64 Years | 17 (4.6%) | 21 (4.8%) |
| 65 to 69 Years | 19 (5.2%) | 13 (3.0%) |
| 70 to 74 Years | 21 (5.7%) | 8 (1.8%) |
| 75 to 79 Years | 1 (0.3%) | 10 (2.3%) |
| 80 to 84 Years | 6 (1.6%) | 3 (0.7%) |
| 85 Years and over | 7 (1.9%) | 40 (9.2%) |
| Total | 368 (100.0%) | 435 (100.0%) |
Families and Households in Perrysville
Median Family Size in Perrysville
The median family size in Perrysville is 3.12 persons per family, with single female/mother families (10 | 5.6%) accounting for the largest median family size of 4.9 persons per family. On the other hand, single male/father families (38 | 21.2%) represent the smallest median family size with 2.63 persons per family.
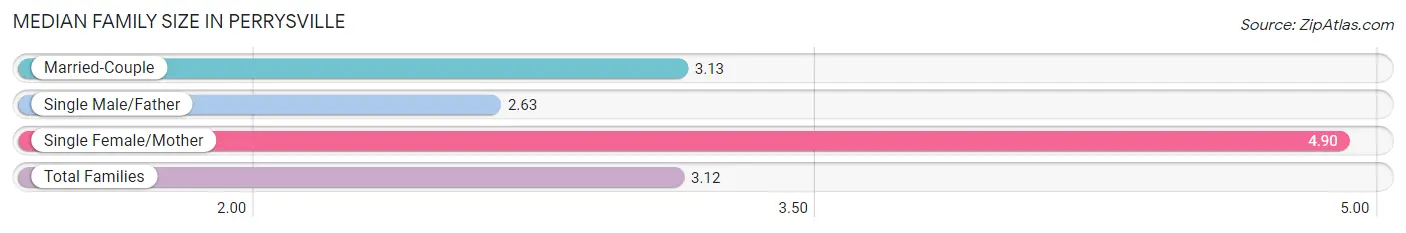
| Family Type | # Families | Family Size |
| Married-Couple | 131 (73.2%) | 3.13 |
| Single Male/Father | 38 (21.2%) | 2.63 |
| Single Female/Mother | 10 (5.6%) | 4.90 |
| Total Families | 179 (100.0%) | 3.12 |
Median Household Size in Perrysville
The median household size in Perrysville is 2.42 persons per household, with single female/mother households (10 | 3.0%) accounting for the largest median household size of 5.9 persons per household. non-family households (153 | 46.1%) represent the smallest median household size with 1.25 persons per household.
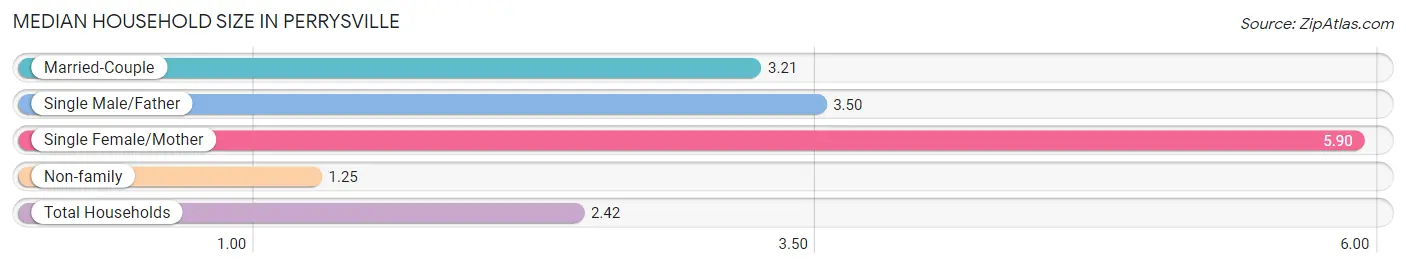
| Household Type | # Households | Household Size |
| Married-Couple | 131 (39.5%) | 3.21 |
| Single Male/Father | 38 (11.5%) | 3.50 |
| Single Female/Mother | 10 (3.0%) | 5.90 |
| Non-family | 153 (46.1%) | 1.25 |
| Total Households | 332 (100.0%) | 2.42 |
Household Size by Marriage Status in Perrysville
Out of a total of 332 households in Perrysville, 179 (53.9%) are family households, while 153 (46.1%) are nonfamily households. The most numerous type of family households are 2-person households, comprising 86, and the most common type of nonfamily households are 1-person households, comprising 120.
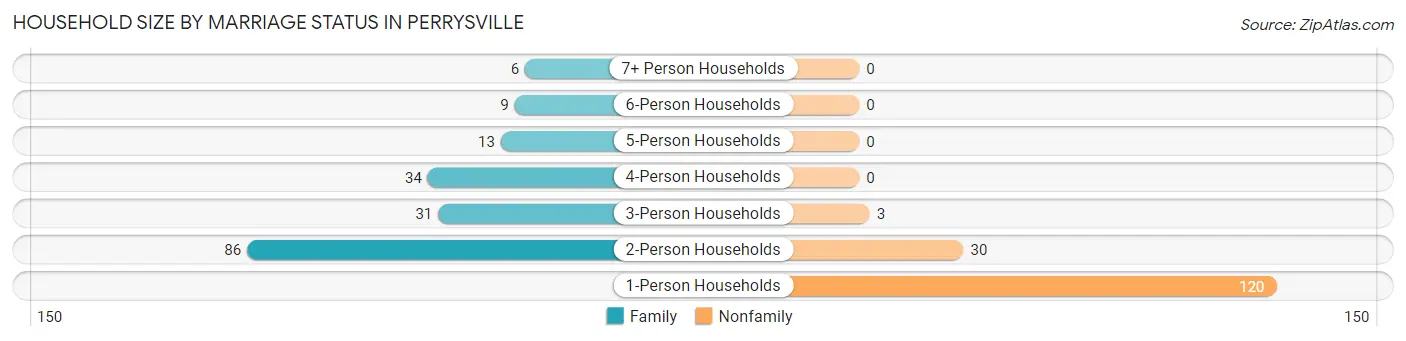
| Household Size | Family Households | Nonfamily Households |
| 1-Person Households | - | 120 (36.1%) |
| 2-Person Households | 86 (25.9%) | 30 (9.0%) |
| 3-Person Households | 31 (9.3%) | 3 (0.9%) |
| 4-Person Households | 34 (10.2%) | 0 (0.0%) |
| 5-Person Households | 13 (3.9%) | 0 (0.0%) |
| 6-Person Households | 9 (2.7%) | 0 (0.0%) |
| 7+ Person Households | 6 (1.8%) | 0 (0.0%) |
| Total | 179 (53.9%) | 153 (46.1%) |
Female Fertility in Perrysville
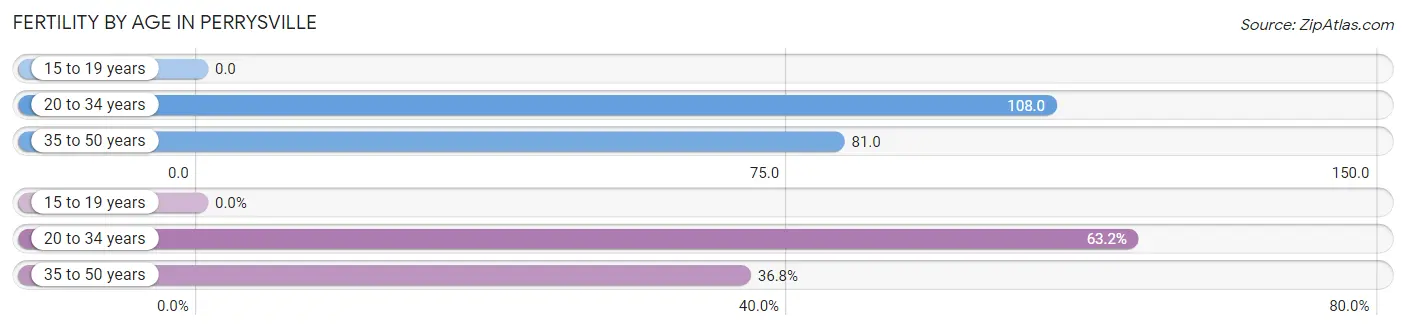
Fertility by Age in Perrysville
Average fertility rate in Perrysville is 90.0 births per 1,000 women. Women in the age bracket of 20 to 34 years have the highest fertility rate with 108.0 births per 1,000 women. Women in the age bracket of 20 to 34 years acount for 63.2% of all women with births.
| Age Bracket | Women with Births | Births / 1,000 Women |
| 15 to 19 years | 0 (0.0%) | 0.0 |
| 20 to 34 years | 12 (63.2%) | 108.0 |
| 35 to 50 years | 7 (36.8%) | 81.0 |
| Total | 19 (100.0%) | 90.0 |
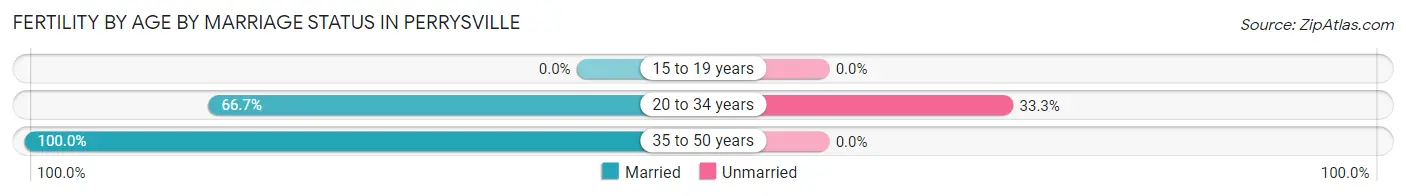
Fertility by Age by Marriage Status in Perrysville
78.9% of women with births (19) in Perrysville are married. The highest percentage of unmarried women with births falls into 20 to 34 years age bracket with 33.3% of them unmarried at the time of birth, while the lowest percentage of unmarried women with births belong to 35 to 50 years age bracket with 0.0% of them unmarried.
| Age Bracket | Married | Unmarried |
| 15 to 19 years | 0 (0.0%) | 0 (0.0%) |
| 20 to 34 years | 8 (66.7%) | 4 (33.3%) |
| 35 to 50 years | 7 (100.0%) | 0 (0.0%) |
| Total | 15 (78.9%) | 4 (21.0%) |
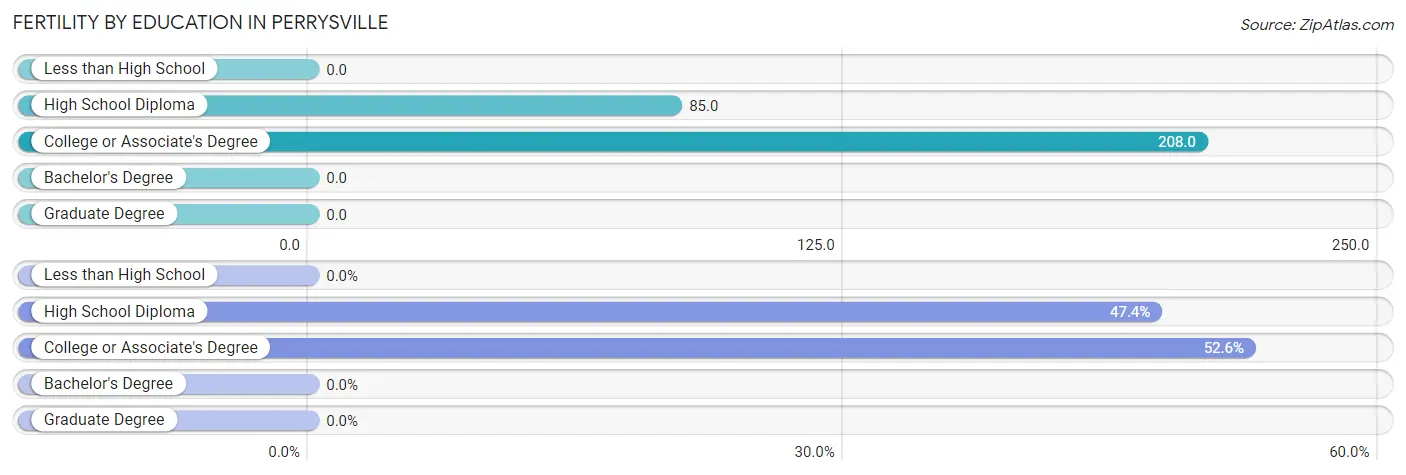
Fertility by Education in Perrysville
| Educational Attainment | Women with Births | Births / 1,000 Women |
| Less than High School | 0 (0.0%) | 0.0 |
| High School Diploma | 9 (47.4%) | 85.0 |
| College or Associate's Degree | 10 (52.6%) | 208.0 |
| Bachelor's Degree | 0 (0.0%) | 0.0 |
| Graduate Degree | 0 (0.0%) | 0.0 |
| Total | 19 (100.0%) | 90.0 |
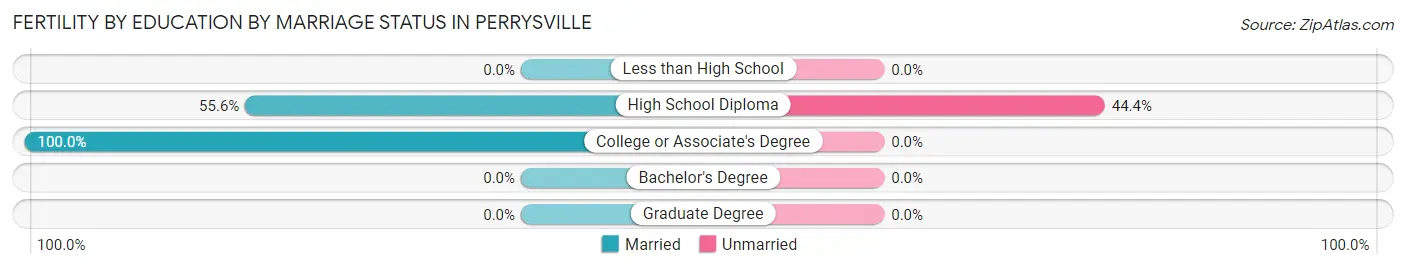
Fertility by Education by Marriage Status in Perrysville
21.0% of women with births in Perrysville are unmarried. Women with the educational attainment of college or associate's degree are most likely to be married with 100.0% of them married at childbirth, while women with the educational attainment of high school diploma are least likely to be married with 44.4% of them unmarried at childbirth.
| Educational Attainment | Married | Unmarried |
| Less than High School | 0 (0.0%) | 0 (0.0%) |
| High School Diploma | 5 (55.6%) | 4 (44.4%) |
| College or Associate's Degree | 10 (100.0%) | 0 (0.0%) |
| Bachelor's Degree | 0 (0.0%) | 0 (0.0%) |
| Graduate Degree | 0 (0.0%) | 0 (0.0%) |
| Total | 15 (78.9%) | 4 (21.0%) |
Employment Characteristics in Perrysville
Employment by Class of Employer in Perrysville
Among the 360 employed individuals in Perrysville, private company employees (280 | 77.8%), local government employees (34 | 9.4%), and self-employed (not incorporated) (24 | 6.7%) make up the most common classes of employment.
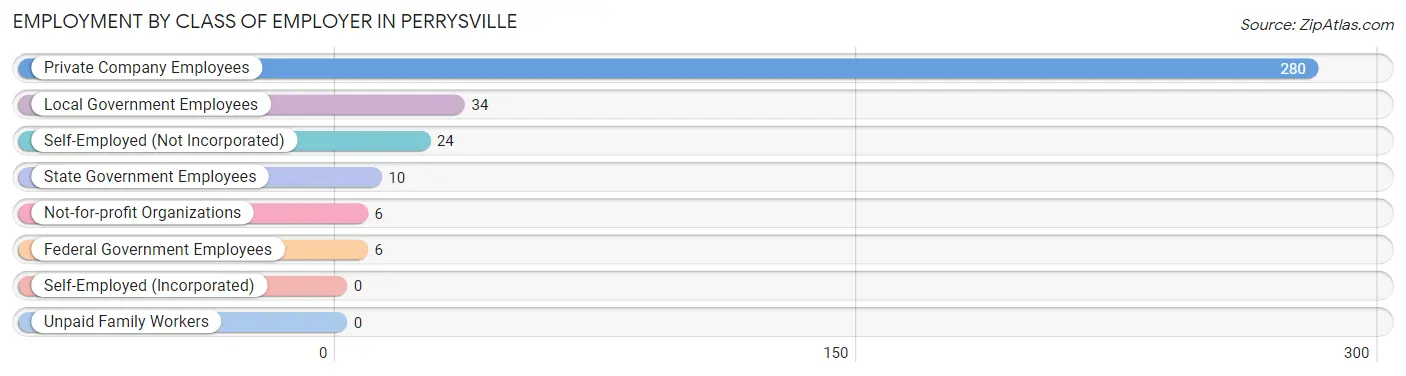
| Employer Class | # Employees | % Employees |
| Private Company Employees | 280 | 77.8% |
| Self-Employed (Incorporated) | 0 | 0.0% |
| Self-Employed (Not Incorporated) | 24 | 6.7% |
| Not-for-profit Organizations | 6 | 1.7% |
| Local Government Employees | 34 | 9.4% |
| State Government Employees | 10 | 2.8% |
| Federal Government Employees | 6 | 1.7% |
| Unpaid Family Workers | 0 | 0.0% |
| Total | 360 | 100.0% |
Employment Status by Age in Perrysville
According to the labor force statistics for Perrysville, out of the total population over 16 years of age (648), 59.3% or 384 individuals are in the labor force, with 4.7% or 18 of them unemployed. The age group with the highest labor force participation rate is 25 to 29 years, with 92.2% or 94 individuals in the labor force. Within the labor force, the 35 to 44 years age range has the highest percentage of unemployed individuals, with 7.6% or 7 of them being unemployed.
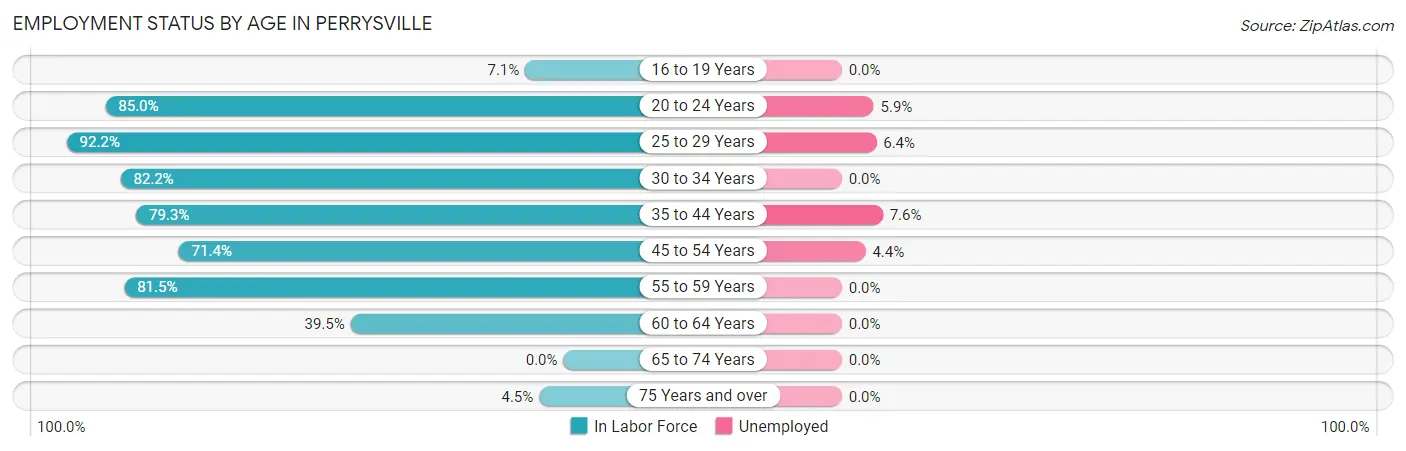
| Age Bracket | In Labor Force | Unemployed |
| 16 to 19 Years | 3 (7.1%) | 0 (0.0%) |
| 20 to 24 Years | 51 (85.0%) | 3 (5.9%) |
| 25 to 29 Years | 94 (92.2%) | 6 (6.4%) |
| 30 to 34 Years | 37 (82.2%) | 0 (0.0%) |
| 35 to 44 Years | 92 (79.3%) | 7 (7.6%) |
| 45 to 54 Years | 45 (71.4%) | 2 (4.4%) |
| 55 to 59 Years | 44 (81.5%) | 0 (0.0%) |
| 60 to 64 Years | 15 (39.5%) | 0 (0.0%) |
| 65 to 74 Years | 0 (0.0%) | 0 (0.0%) |
| 75 Years and over | 3 (4.5%) | 0 (0.0%) |
| Total | 384 (59.3%) | 18 (4.7%) |
Employment Status by Educational Attainment in Perrysville
According to labor force statistics for Perrysville, 78.2% of individuals (327) out of the total population between 25 and 64 years of age (418) are in the labor force, with 4.6% or 15 of them being unemployed. The group with the highest labor force participation rate are those with the educational attainment of bachelor's degree or higher, with 100.0% or 27 individuals in the labor force. Within the labor force, individuals with less than high school education have the highest percentage of unemployment, with 39.4% or 13 of them being unemployed.
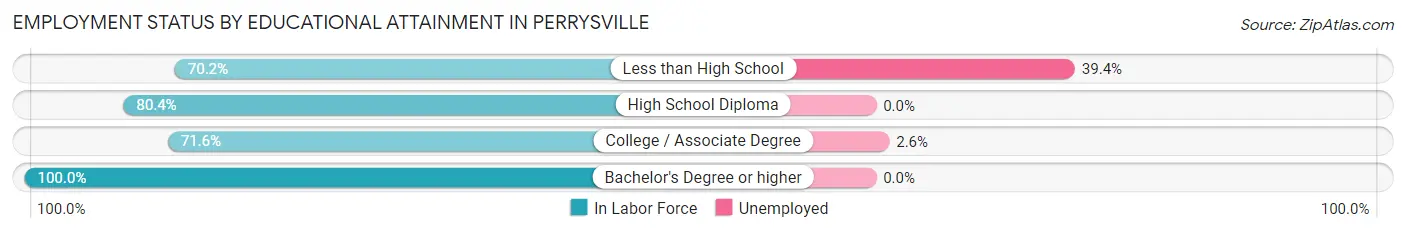
| Educational Attainment | In Labor Force | Unemployed |
| Less than High School | 33 (70.2%) | 19 (39.4%) |
| High School Diploma | 189 (80.4%) | 0 (0.0%) |
| College / Associate Degree | 78 (71.6%) | 3 (2.6%) |
| Bachelor's Degree or higher | 27 (100.0%) | 0 (0.0%) |
| Total | 327 (78.2%) | 19 (4.6%) |
Employment Occupations by Sex in Perrysville
Management, Business, Science and Arts Occupations
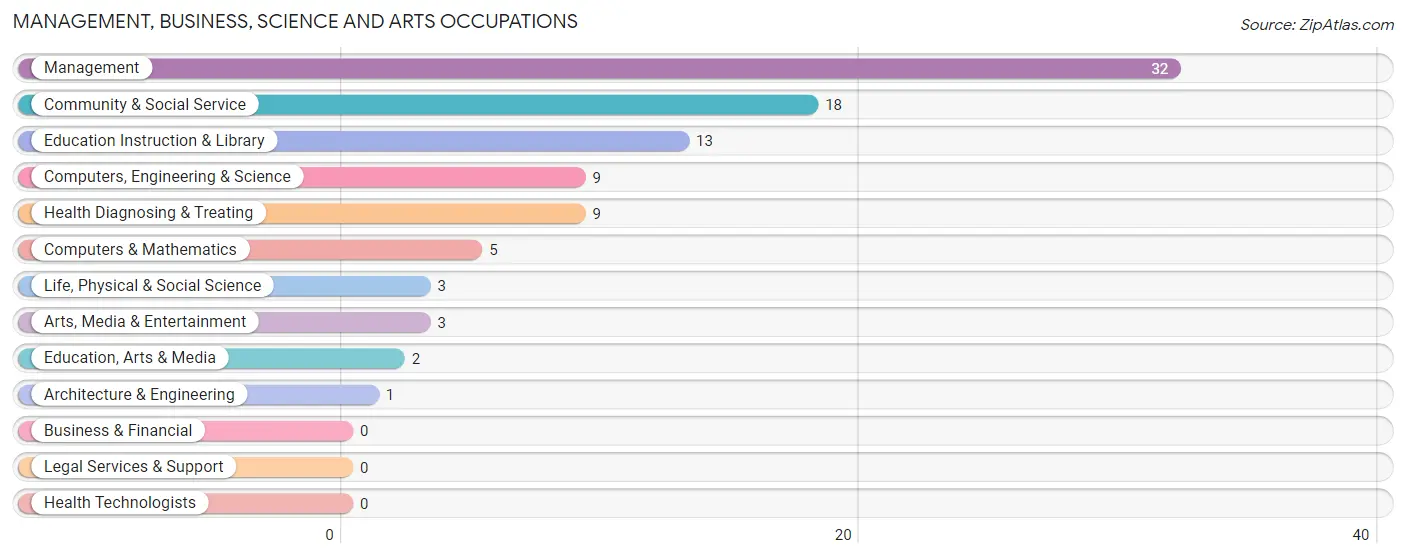
The most common Management, Business, Science and Arts occupations in Perrysville are Management (32 | 8.7%), Community & Social Service (18 | 4.9%), Education Instruction & Library (13 | 3.5%), Computers, Engineering & Science (9 | 2.5%), and Health Diagnosing & Treating (9 | 2.5%).
Management, Business, Science and Arts Occupations by Sex
Within the Management, Business, Science and Arts occupations in Perrysville, the most male-oriented occupations are Computers & Mathematics (100.0%), Architecture & Engineering (100.0%), and Arts, Media & Entertainment (100.0%), while the most female-oriented occupations are Life, Physical & Social Science (100.0%), Education, Arts & Media (100.0%), and Education Instruction & Library (100.0%).
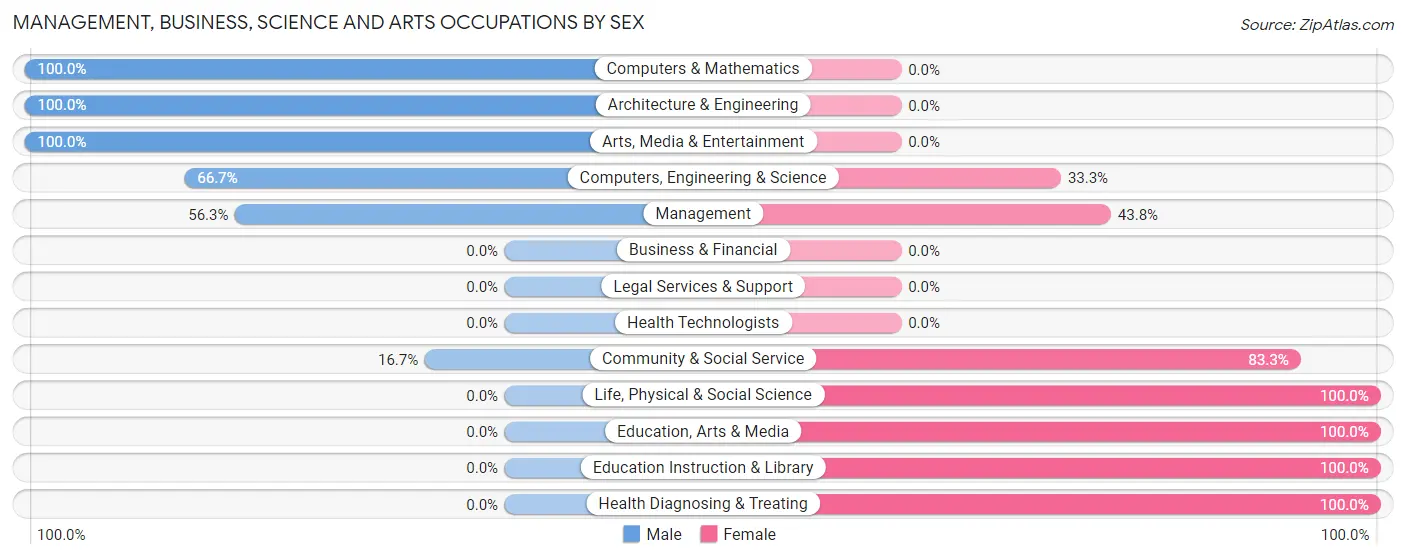
| Occupation | Male | Female |
| Management | 18 (56.2%) | 14 (43.8%) |
| Business & Financial | 0 (0.0%) | 0 (0.0%) |
| Computers, Engineering & Science | 6 (66.7%) | 3 (33.3%) |
| Computers & Mathematics | 5 (100.0%) | 0 (0.0%) |
| Architecture & Engineering | 1 (100.0%) | 0 (0.0%) |
| Life, Physical & Social Science | 0 (0.0%) | 3 (100.0%) |
| Community & Social Service | 3 (16.7%) | 15 (83.3%) |
| Education, Arts & Media | 0 (0.0%) | 2 (100.0%) |
| Legal Services & Support | 0 (0.0%) | 0 (0.0%) |
| Education Instruction & Library | 0 (0.0%) | 13 (100.0%) |
| Arts, Media & Entertainment | 3 (100.0%) | 0 (0.0%) |
| Health Diagnosing & Treating | 0 (0.0%) | 9 (100.0%) |
| Health Technologists | 0 (0.0%) | 0 (0.0%) |
| Total (Category) | 27 (39.7%) | 41 (60.3%) |
| Total (Overall) | 174 (47.5%) | 192 (52.5%) |
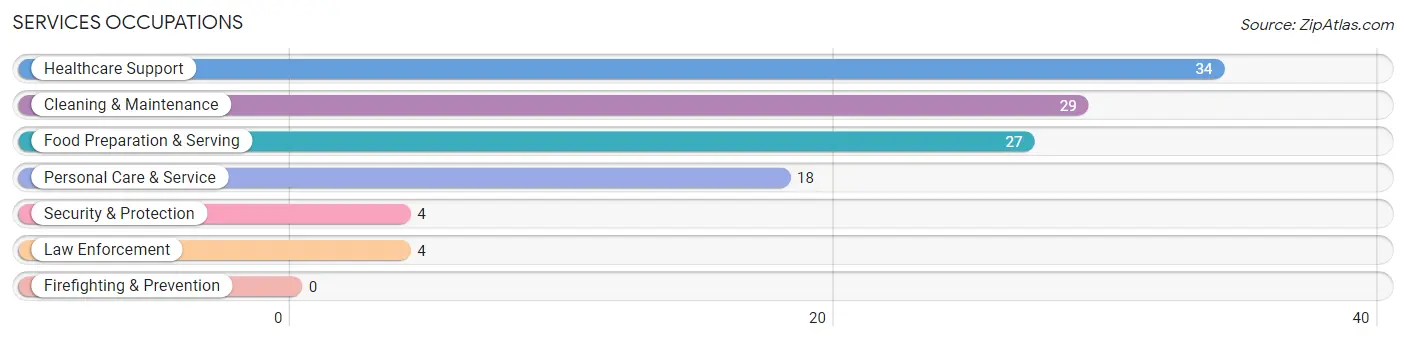
Services Occupations
The most common Services occupations in Perrysville are Healthcare Support (34 | 9.3%), Cleaning & Maintenance (29 | 7.9%), Food Preparation & Serving (27 | 7.4%), Personal Care & Service (18 | 4.9%), and Security & Protection (4 | 1.1%).
Services Occupations by Sex
Within the Services occupations in Perrysville, the most male-oriented occupations are Security & Protection (100.0%), Law Enforcement (100.0%), and Cleaning & Maintenance (58.6%), while the most female-oriented occupations are Healthcare Support (100.0%), Food Preparation & Serving (100.0%), and Personal Care & Service (88.9%).
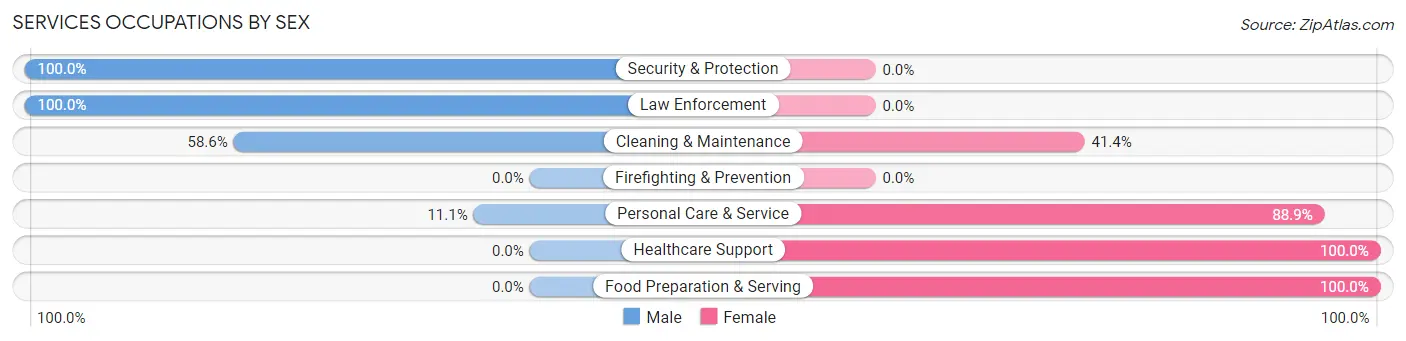
| Occupation | Male | Female |
| Healthcare Support | 0 (0.0%) | 34 (100.0%) |
| Security & Protection | 4 (100.0%) | 0 (0.0%) |
| Firefighting & Prevention | 0 (0.0%) | 0 (0.0%) |
| Law Enforcement | 4 (100.0%) | 0 (0.0%) |
| Food Preparation & Serving | 0 (0.0%) | 27 (100.0%) |
| Cleaning & Maintenance | 17 (58.6%) | 12 (41.4%) |
| Personal Care & Service | 2 (11.1%) | 16 (88.9%) |
| Total (Category) | 23 (20.5%) | 89 (79.5%) |
| Total (Overall) | 174 (47.5%) | 192 (52.5%) |
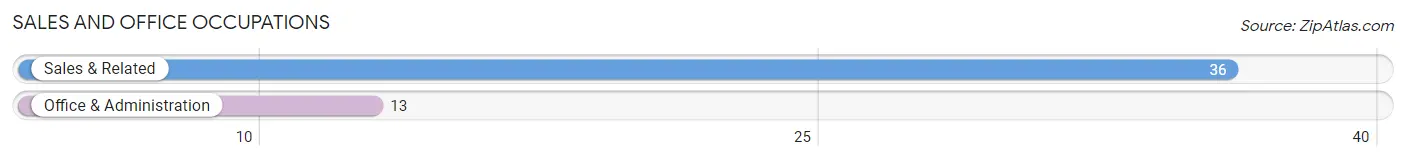
Sales and Office Occupations
The most common Sales and Office occupations in Perrysville are Sales & Related (36 | 9.8%), and Office & Administration (13 | 3.5%).
Sales and Office Occupations by Sex

| Occupation | Male | Female |
| Sales & Related | 10 (27.8%) | 26 (72.2%) |
| Office & Administration | 2 (15.4%) | 11 (84.6%) |
| Total (Category) | 12 (24.5%) | 37 (75.5%) |
| Total (Overall) | 174 (47.5%) | 192 (52.5%) |
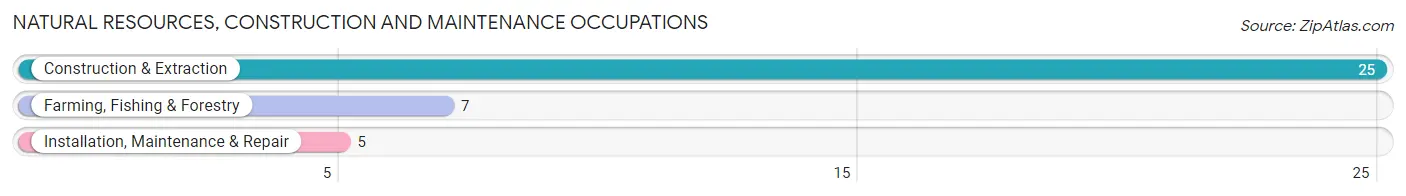
Natural Resources, Construction and Maintenance Occupations
The most common Natural Resources, Construction and Maintenance occupations in Perrysville are Construction & Extraction (25 | 6.8%), Farming, Fishing & Forestry (7 | 1.9%), and Installation, Maintenance & Repair (5 | 1.4%).
Natural Resources, Construction and Maintenance Occupations by Sex
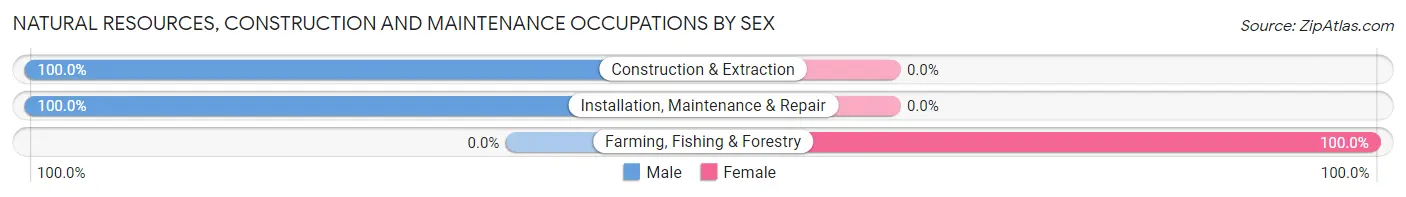
| Occupation | Male | Female |
| Farming, Fishing & Forestry | 0 (0.0%) | 7 (100.0%) |
| Construction & Extraction | 25 (100.0%) | 0 (0.0%) |
| Installation, Maintenance & Repair | 5 (100.0%) | 0 (0.0%) |
| Total (Category) | 30 (81.1%) | 7 (18.9%) |
| Total (Overall) | 174 (47.5%) | 192 (52.5%) |
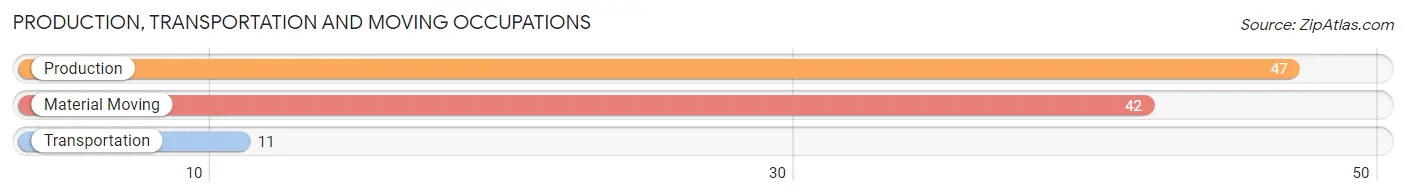
Production, Transportation and Moving Occupations
The most common Production, Transportation and Moving occupations in Perrysville are Production (47 | 12.8%), Material Moving (42 | 11.5%), and Transportation (11 | 3.0%).
Production, Transportation and Moving Occupations by Sex
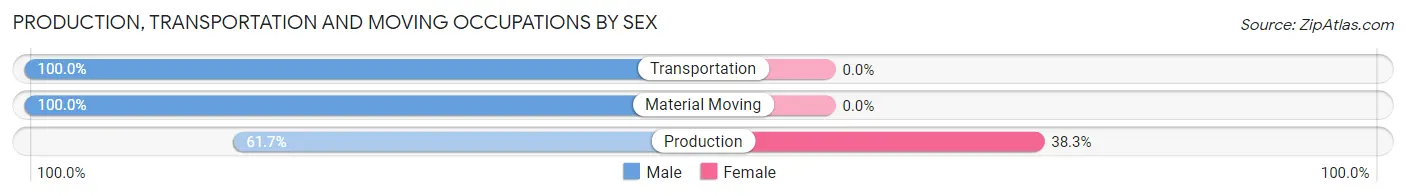
| Occupation | Male | Female |
| Production | 29 (61.7%) | 18 (38.3%) |
| Transportation | 11 (100.0%) | 0 (0.0%) |
| Material Moving | 42 (100.0%) | 0 (0.0%) |
| Total (Category) | 82 (82.0%) | 18 (18.0%) |
| Total (Overall) | 174 (47.5%) | 192 (52.5%) |
Employment Industries by Sex in Perrysville
Employment Industries in Perrysville
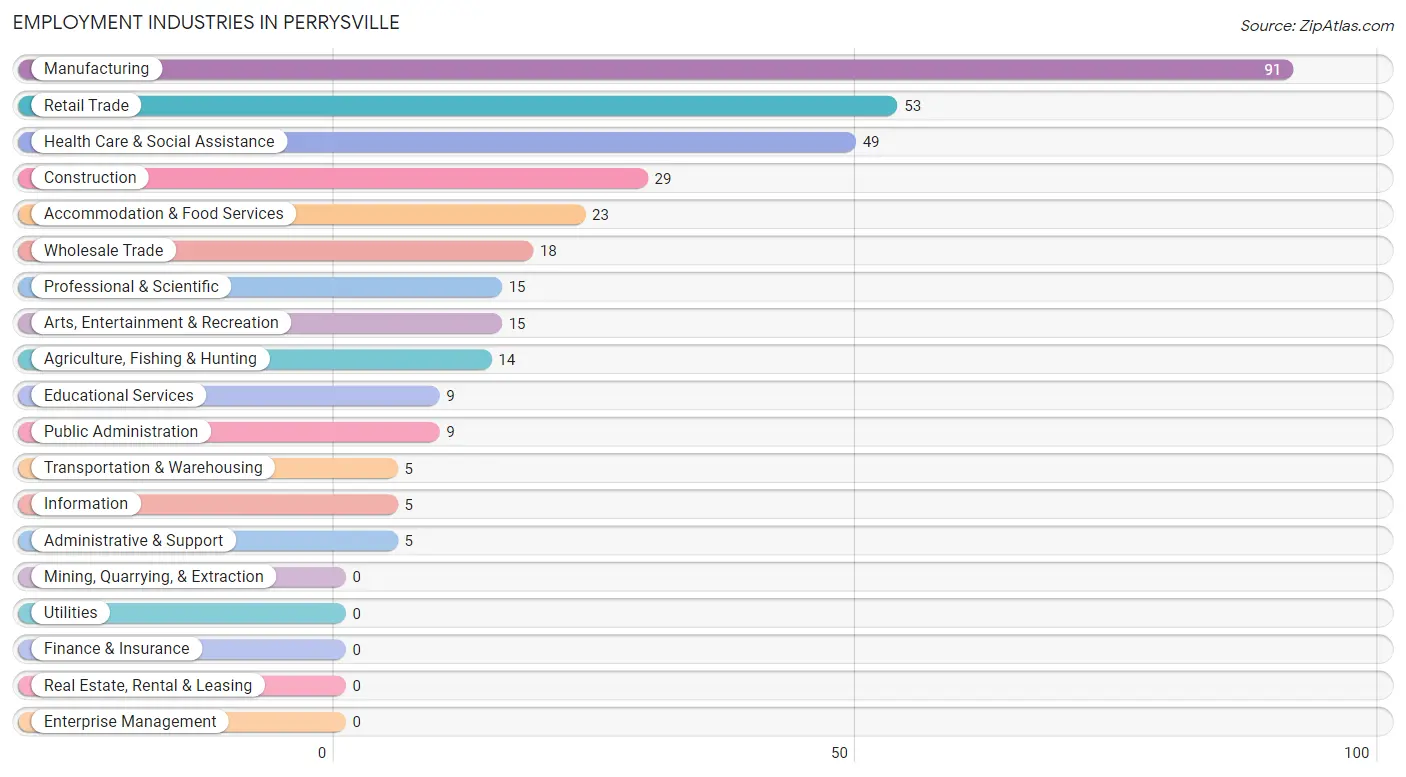
The major employment industries in Perrysville include Manufacturing (91 | 24.9%), Retail Trade (53 | 14.5%), Health Care & Social Assistance (49 | 13.4%), Construction (29 | 7.9%), and Accommodation & Food Services (23 | 6.3%).
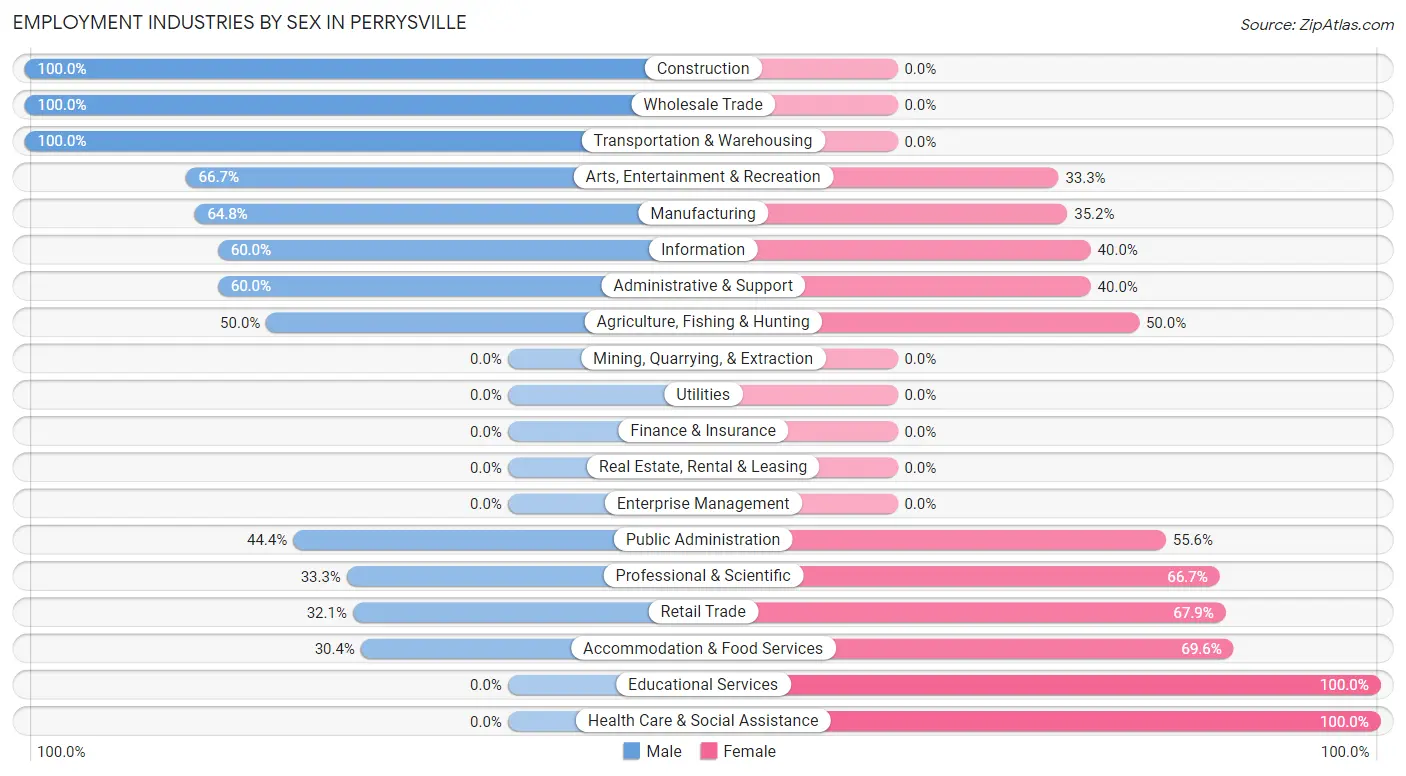
Employment Industries by Sex in Perrysville
The Perrysville industries that see more men than women are Construction (100.0%), Wholesale Trade (100.0%), and Transportation & Warehousing (100.0%), whereas the industries that tend to have a higher number of women are Educational Services (100.0%), Health Care & Social Assistance (100.0%), and Accommodation & Food Services (69.6%).
| Industry | Male | Female |
| Agriculture, Fishing & Hunting | 7 (50.0%) | 7 (50.0%) |
| Mining, Quarrying, & Extraction | 0 (0.0%) | 0 (0.0%) |
| Construction | 29 (100.0%) | 0 (0.0%) |
| Manufacturing | 59 (64.8%) | 32 (35.2%) |
| Wholesale Trade | 18 (100.0%) | 0 (0.0%) |
| Retail Trade | 17 (32.1%) | 36 (67.9%) |
| Transportation & Warehousing | 5 (100.0%) | 0 (0.0%) |
| Utilities | 0 (0.0%) | 0 (0.0%) |
| Information | 3 (60.0%) | 2 (40.0%) |
| Finance & Insurance | 0 (0.0%) | 0 (0.0%) |
| Real Estate, Rental & Leasing | 0 (0.0%) | 0 (0.0%) |
| Professional & Scientific | 5 (33.3%) | 10 (66.7%) |
| Enterprise Management | 0 (0.0%) | 0 (0.0%) |
| Administrative & Support | 3 (60.0%) | 2 (40.0%) |
| Educational Services | 0 (0.0%) | 9 (100.0%) |
| Health Care & Social Assistance | 0 (0.0%) | 49 (100.0%) |
| Arts, Entertainment & Recreation | 10 (66.7%) | 5 (33.3%) |
| Accommodation & Food Services | 7 (30.4%) | 16 (69.6%) |
| Public Administration | 4 (44.4%) | 5 (55.6%) |
| Total | 174 (47.5%) | 192 (52.5%) |
Education in Perrysville
School Enrollment in Perrysville
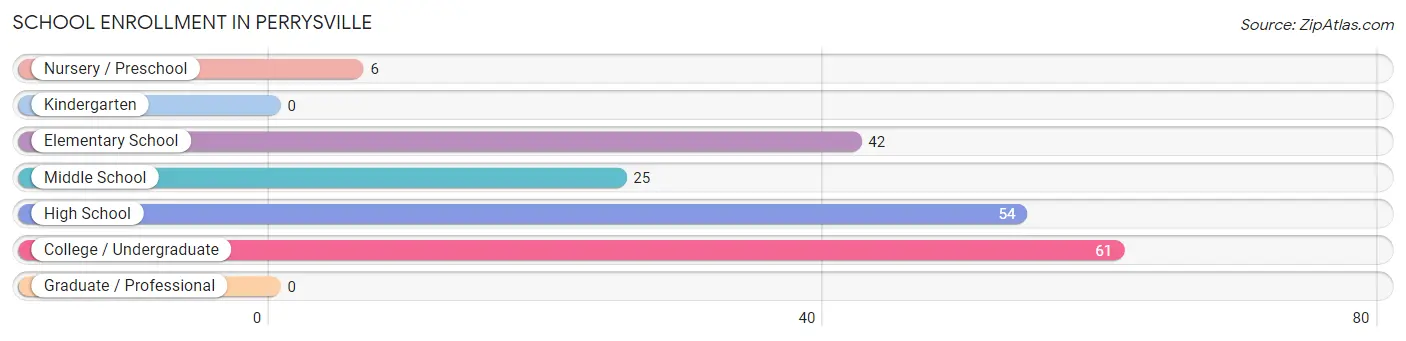
The most common levels of schooling among the 188 students in Perrysville are college / undergraduate (61 | 32.5%), high school (54 | 28.7%), and elementary school (42 | 22.3%).
| School Level | # Students | % Students |
| Nursery / Preschool | 6 | 3.2% |
| Kindergarten | 0 | 0.0% |
| Elementary School | 42 | 22.3% |
| Middle School | 25 | 13.3% |
| High School | 54 | 28.7% |
| College / Undergraduate | 61 | 32.5% |
| Graduate / Professional | 0 | 0.0% |
| Total | 188 | 100.0% |
School Enrollment by Age by Funding Source in Perrysville
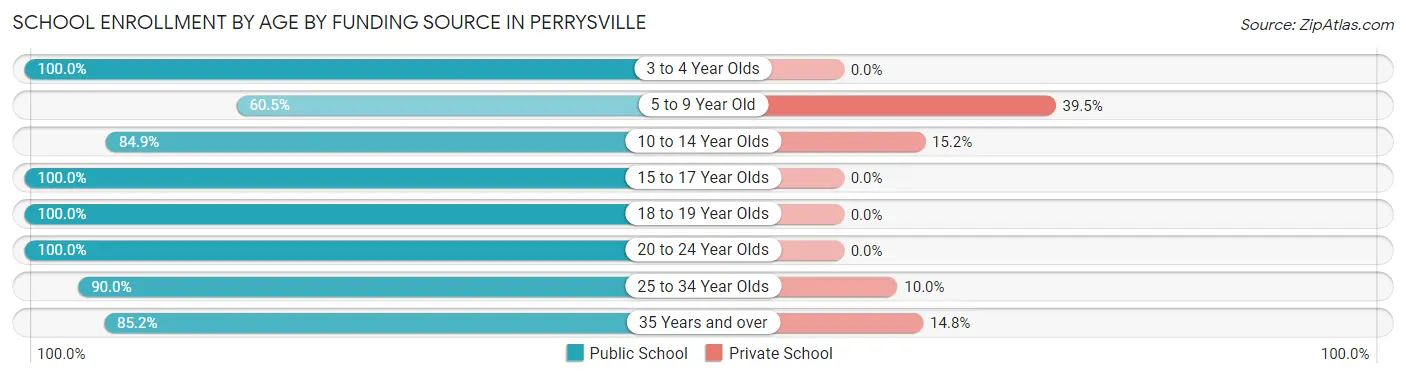
Out of a total of 188 students who are enrolled in schools in Perrysville, 27 (14.4%) attend a private institution, while the remaining 161 (85.6%) are enrolled in public schools. The age group of 5 to 9 year old has the highest likelihood of being enrolled in private schools, with 15 (39.5% in the age bracket) enrolled. Conversely, the age group of 3 to 4 year olds has the lowest likelihood of being enrolled in a private school, with 6 (100.0% in the age bracket) attending a public institution.
| Age Bracket | Public School | Private School |
| 3 to 4 Year Olds | 6 (100.0%) | 0 (0.0%) |
| 5 to 9 Year Old | 23 (60.5%) | 15 (39.5%) |
| 10 to 14 Year Olds | 28 (84.9%) | 5 (15.1%) |
| 15 to 17 Year Olds | 22 (100.0%) | 0 (0.0%) |
| 18 to 19 Year Olds | 26 (100.0%) | 0 (0.0%) |
| 20 to 24 Year Olds | 6 (100.0%) | 0 (0.0%) |
| 25 to 34 Year Olds | 27 (90.0%) | 3 (10.0%) |
| 35 Years and over | 23 (85.2%) | 4 (14.8%) |
| Total | 161 (85.6%) | 27 (14.4%) |
Educational Attainment by Field of Study in Perrysville
Education (19 | 59.4%), arts & humanities (5 | 15.6%), business (3 | 9.4%), liberal arts & history (3 | 9.4%), and literature & languages (2 | 6.2%) are the most common fields of study among 32 individuals in Perrysville who have obtained a bachelor's degree or higher.
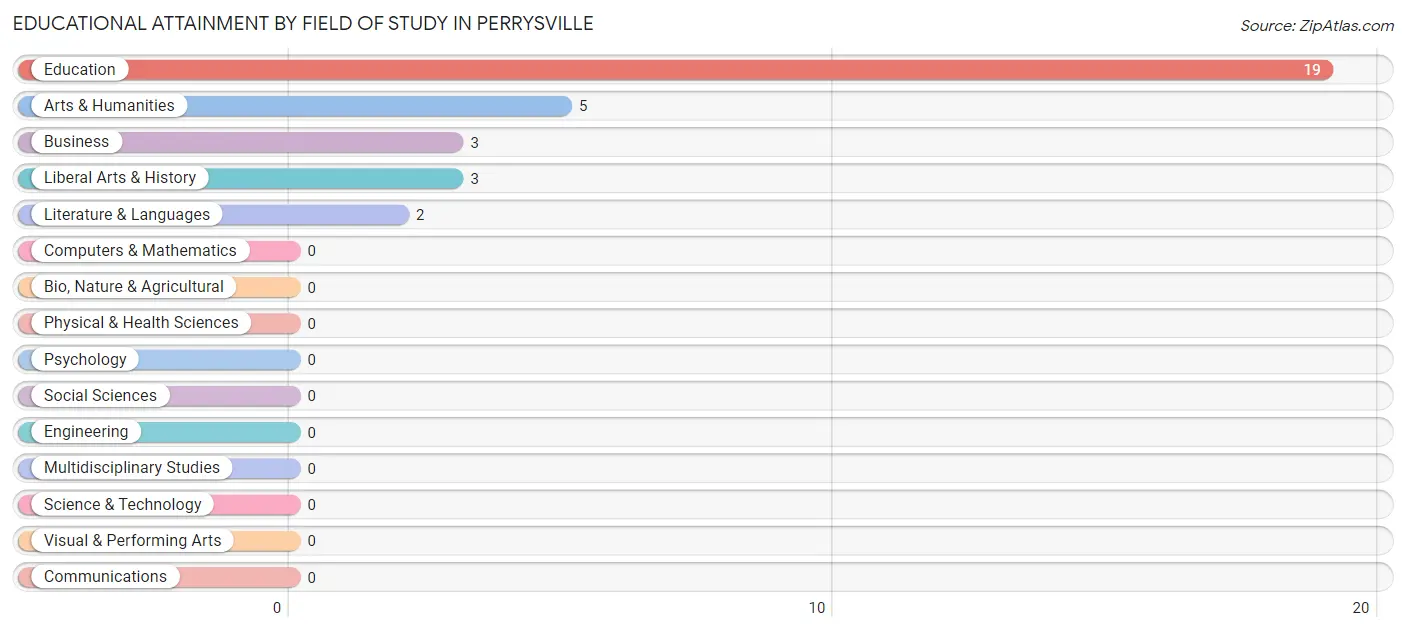
| Field of Study | # Graduates | % Graduates |
| Computers & Mathematics | 0 | 0.0% |
| Bio, Nature & Agricultural | 0 | 0.0% |
| Physical & Health Sciences | 0 | 0.0% |
| Psychology | 0 | 0.0% |
| Social Sciences | 0 | 0.0% |
| Engineering | 0 | 0.0% |
| Multidisciplinary Studies | 0 | 0.0% |
| Science & Technology | 0 | 0.0% |
| Business | 3 | 9.4% |
| Education | 19 | 59.4% |
| Literature & Languages | 2 | 6.2% |
| Liberal Arts & History | 3 | 9.4% |
| Visual & Performing Arts | 0 | 0.0% |
| Communications | 0 | 0.0% |
| Arts & Humanities | 5 | 15.6% |
| Total | 32 | 100.0% |
Transportation & Commute in Perrysville
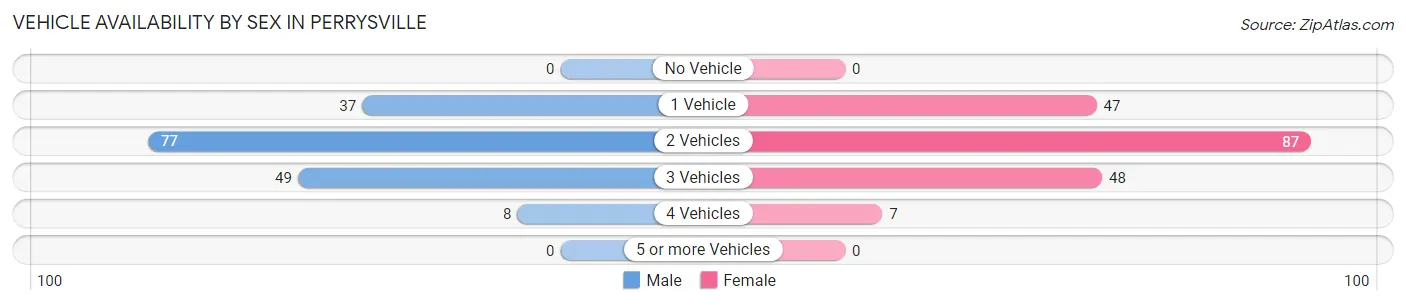
Vehicle Availability by Sex in Perrysville
The most prevalent vehicle ownership categories in Perrysville are males with 2 vehicles (77, accounting for 45.0%) and females with 2 vehicles (87, making up 40.7%).
| Vehicles Available | Male | Female |
| No Vehicle | 0 (0.0%) | 0 (0.0%) |
| 1 Vehicle | 37 (21.6%) | 47 (24.9%) |
| 2 Vehicles | 77 (45.0%) | 87 (46.0%) |
| 3 Vehicles | 49 (28.6%) | 48 (25.4%) |
| 4 Vehicles | 8 (4.7%) | 7 (3.7%) |
| 5 or more Vehicles | 0 (0.0%) | 0 (0.0%) |
| Total | 171 (100.0%) | 189 (100.0%) |
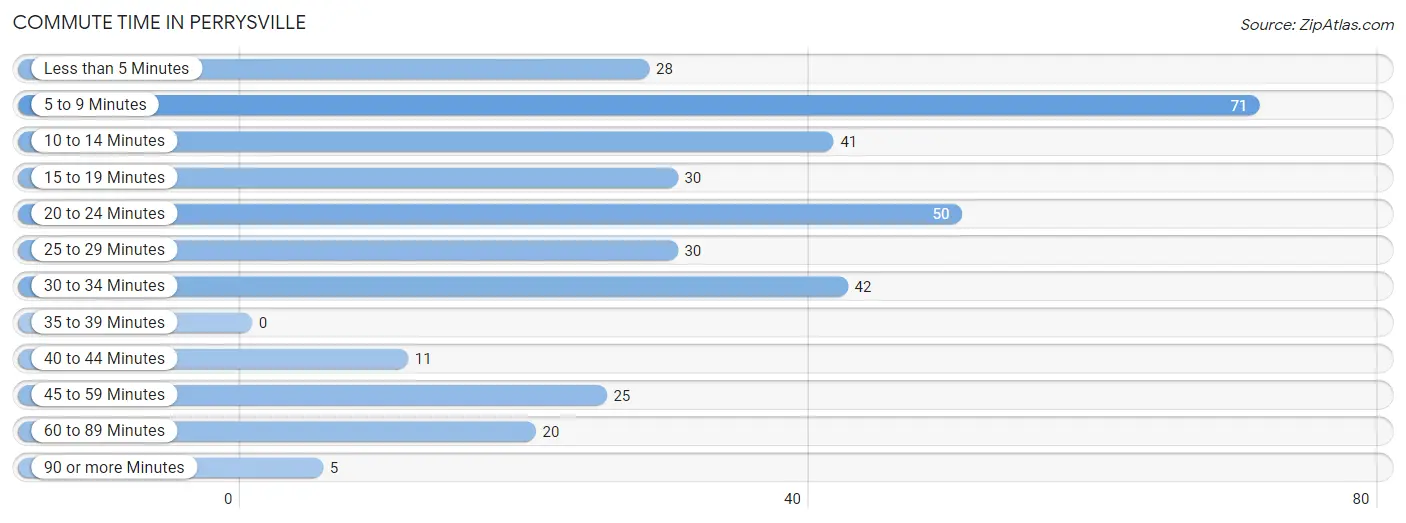
Commute Time in Perrysville
The most frequently occuring commute durations in Perrysville are 5 to 9 minutes (71 commuters, 20.1%), 20 to 24 minutes (50 commuters, 14.2%), and 30 to 34 minutes (42 commuters, 11.9%).
| Commute Time | # Commuters | % Commuters |
| Less than 5 Minutes | 28 | 7.9% |
| 5 to 9 Minutes | 71 | 20.1% |
| 10 to 14 Minutes | 41 | 11.6% |
| 15 to 19 Minutes | 30 | 8.5% |
| 20 to 24 Minutes | 50 | 14.2% |
| 25 to 29 Minutes | 30 | 8.5% |
| 30 to 34 Minutes | 42 | 11.9% |
| 35 to 39 Minutes | 0 | 0.0% |
| 40 to 44 Minutes | 11 | 3.1% |
| 45 to 59 Minutes | 25 | 7.1% |
| 60 to 89 Minutes | 20 | 5.7% |
| 90 or more Minutes | 5 | 1.4% |
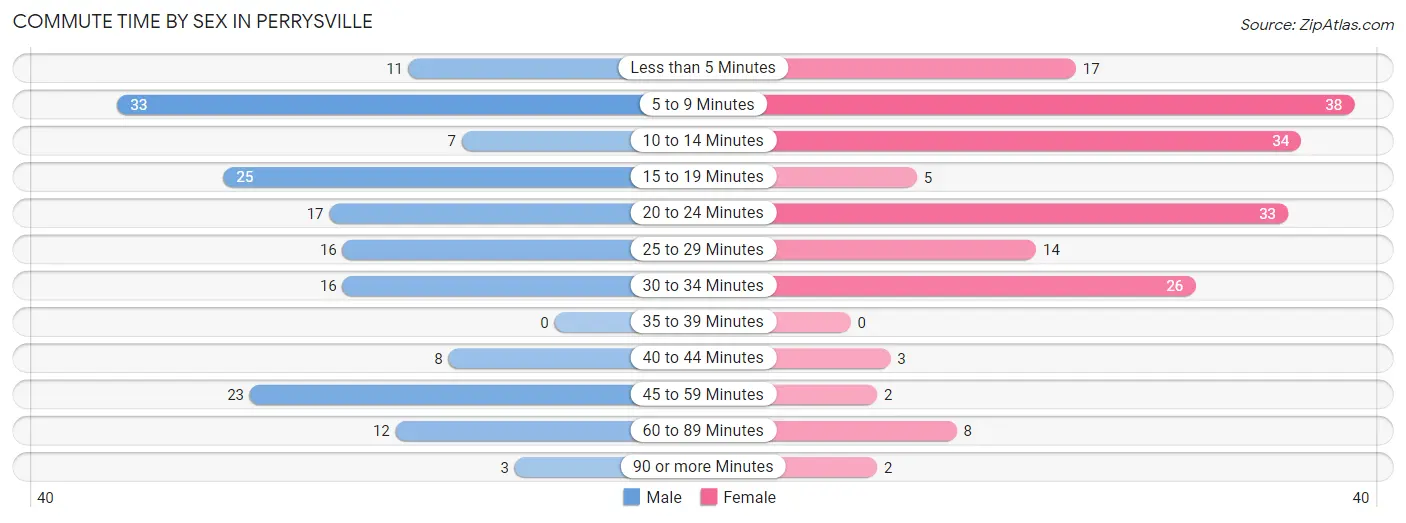
Commute Time by Sex in Perrysville
The most common commute times in Perrysville are 5 to 9 minutes (33 commuters, 19.3%) for males and 5 to 9 minutes (38 commuters, 20.9%) for females.
| Commute Time | Male | Female |
| Less than 5 Minutes | 11 (6.4%) | 17 (9.3%) |
| 5 to 9 Minutes | 33 (19.3%) | 38 (20.9%) |
| 10 to 14 Minutes | 7 (4.1%) | 34 (18.7%) |
| 15 to 19 Minutes | 25 (14.6%) | 5 (2.8%) |
| 20 to 24 Minutes | 17 (9.9%) | 33 (18.1%) |
| 25 to 29 Minutes | 16 (9.4%) | 14 (7.7%) |
| 30 to 34 Minutes | 16 (9.4%) | 26 (14.3%) |
| 35 to 39 Minutes | 0 (0.0%) | 0 (0.0%) |
| 40 to 44 Minutes | 8 (4.7%) | 3 (1.7%) |
| 45 to 59 Minutes | 23 (13.5%) | 2 (1.1%) |
| 60 to 89 Minutes | 12 (7.0%) | 8 (4.4%) |
| 90 or more Minutes | 3 (1.8%) | 2 (1.1%) |
Time of Departure to Work by Sex in Perrysville
The most frequent times of departure to work in Perrysville are 6:00 AM to 6:29 AM (29, 17.0%) for males and 5:30 AM to 5:59 AM (54, 29.7%) for females.
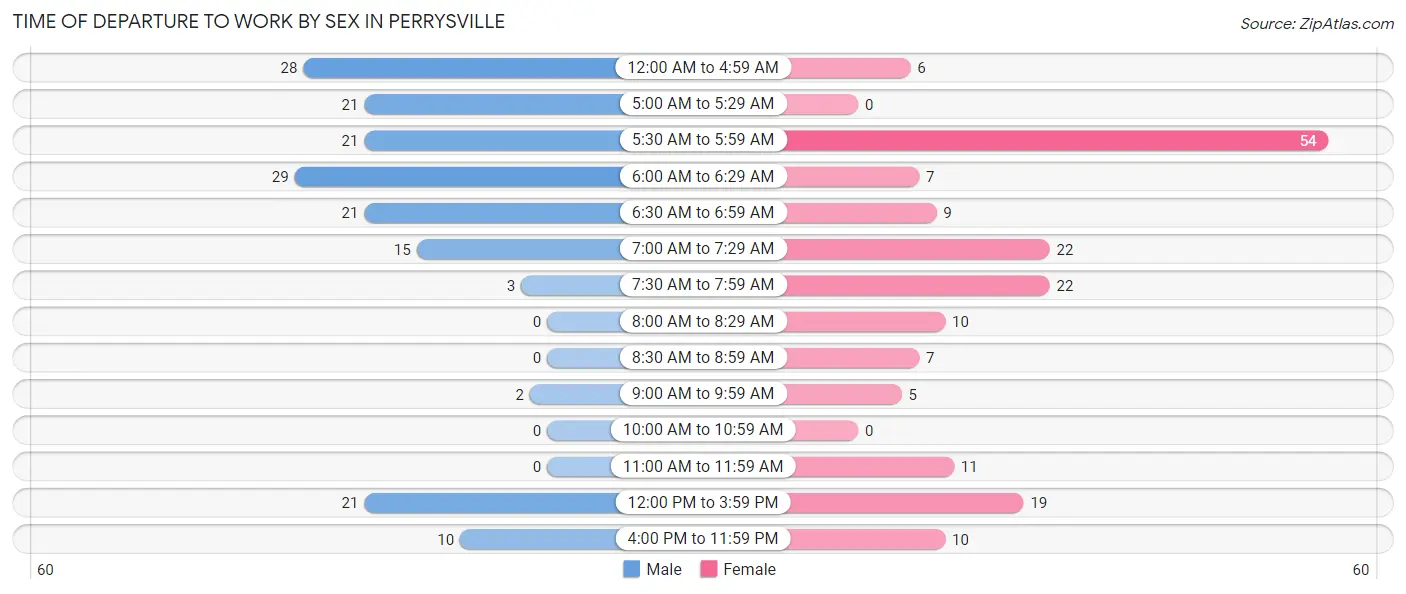
| Time of Departure | Male | Female |
| 12:00 AM to 4:59 AM | 28 (16.4%) | 6 (3.3%) |
| 5:00 AM to 5:29 AM | 21 (12.3%) | 0 (0.0%) |
| 5:30 AM to 5:59 AM | 21 (12.3%) | 54 (29.7%) |
| 6:00 AM to 6:29 AM | 29 (17.0%) | 7 (3.8%) |
| 6:30 AM to 6:59 AM | 21 (12.3%) | 9 (5.0%) |
| 7:00 AM to 7:29 AM | 15 (8.8%) | 22 (12.1%) |
| 7:30 AM to 7:59 AM | 3 (1.8%) | 22 (12.1%) |
| 8:00 AM to 8:29 AM | 0 (0.0%) | 10 (5.5%) |
| 8:30 AM to 8:59 AM | 0 (0.0%) | 7 (3.8%) |
| 9:00 AM to 9:59 AM | 2 (1.2%) | 5 (2.8%) |
| 10:00 AM to 10:59 AM | 0 (0.0%) | 0 (0.0%) |
| 11:00 AM to 11:59 AM | 0 (0.0%) | 11 (6.0%) |
| 12:00 PM to 3:59 PM | 21 (12.3%) | 19 (10.4%) |
| 4:00 PM to 11:59 PM | 10 (5.9%) | 10 (5.5%) |
| Total | 171 (100.0%) | 182 (100.0%) |
Housing Occupancy in Perrysville
Occupancy by Ownership in Perrysville
Of the total 332 dwellings in Perrysville, owner-occupied units account for 221 (66.6%), while renter-occupied units make up 111 (33.4%).
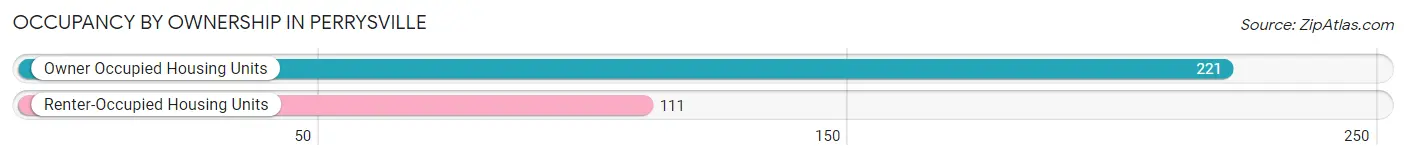
| Occupancy | # Housing Units | % Housing Units |
| Owner Occupied Housing Units | 221 | 66.6% |
| Renter-Occupied Housing Units | 111 | 33.4% |
| Total Occupied Housing Units | 332 | 100.0% |
Occupancy by Household Size in Perrysville
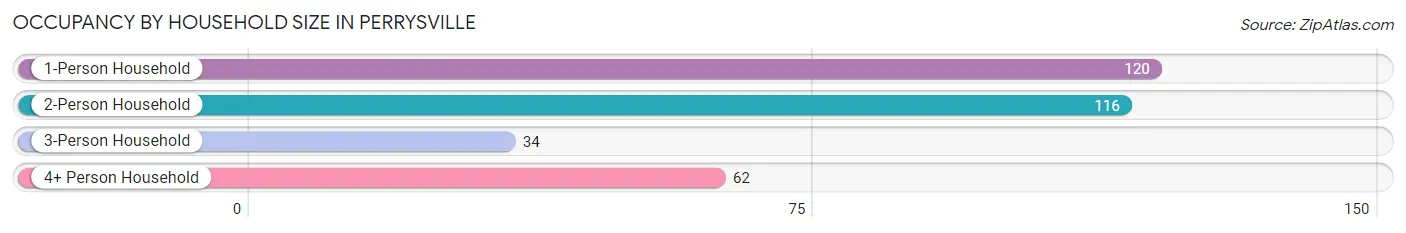
| Household Size | # Housing Units | % Housing Units |
| 1-Person Household | 120 | 36.1% |
| 2-Person Household | 116 | 34.9% |
| 3-Person Household | 34 | 10.2% |
| 4+ Person Household | 62 | 18.7% |
| Total Housing Units | 332 | 100.0% |
Occupancy by Ownership by Household Size in Perrysville
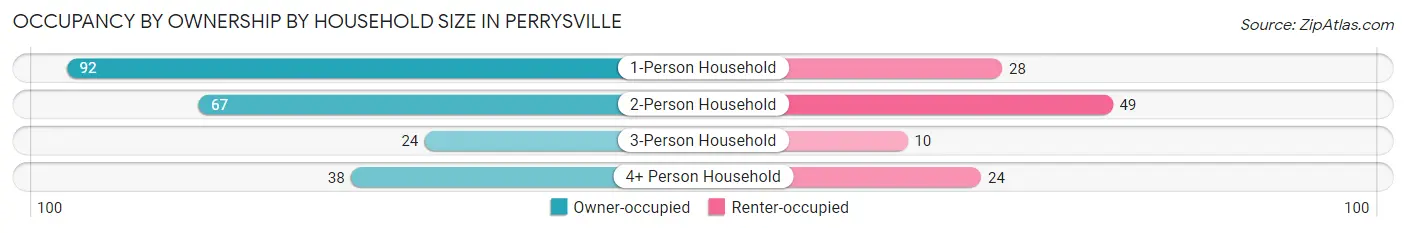
| Household Size | Owner-occupied | Renter-occupied |
| 1-Person Household | 92 (76.7%) | 28 (23.3%) |
| 2-Person Household | 67 (57.8%) | 49 (42.2%) |
| 3-Person Household | 24 (70.6%) | 10 (29.4%) |
| 4+ Person Household | 38 (61.3%) | 24 (38.7%) |
| Total Housing Units | 221 (66.6%) | 111 (33.4%) |
Occupancy by Educational Attainment in Perrysville
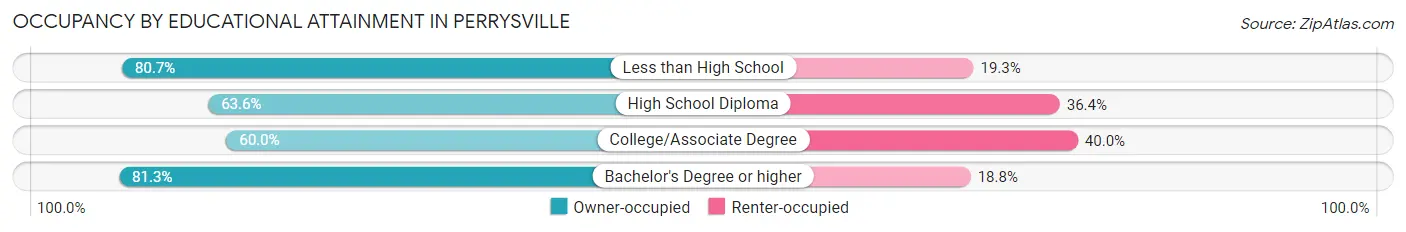
| Household Size | Owner-occupied | Renter-occupied |
| Less than High School | 46 (80.7%) | 11 (19.3%) |
| High School Diploma | 117 (63.6%) | 67 (36.4%) |
| College/Associate Degree | 45 (60.0%) | 30 (40.0%) |
| Bachelor's Degree or higher | 13 (81.2%) | 3 (18.8%) |
Occupancy by Age of Householder in Perrysville
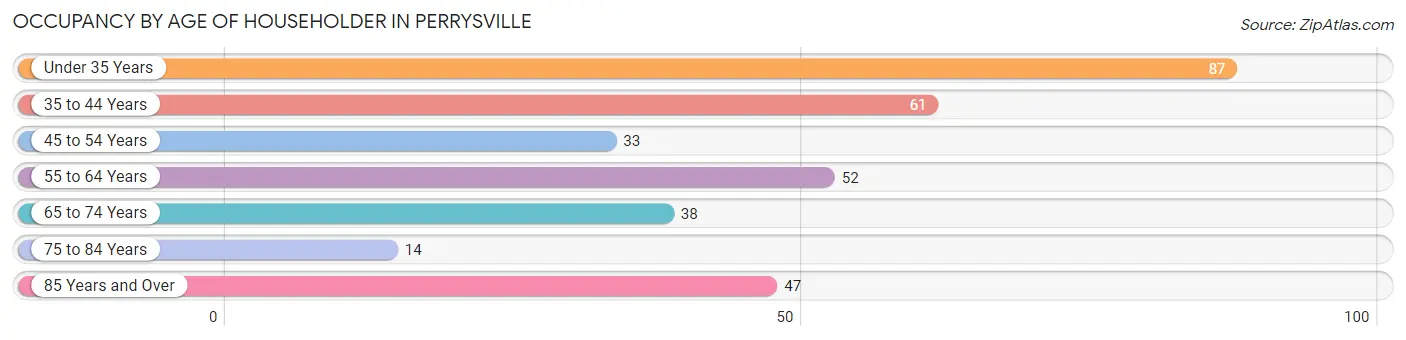
| Age Bracket | # Households | % Households |
| Under 35 Years | 87 | 26.2% |
| 35 to 44 Years | 61 | 18.4% |
| 45 to 54 Years | 33 | 9.9% |
| 55 to 64 Years | 52 | 15.7% |
| 65 to 74 Years | 38 | 11.5% |
| 75 to 84 Years | 14 | 4.2% |
| 85 Years and Over | 47 | 14.2% |
| Total | 332 | 100.0% |
Housing Finances in Perrysville
Median Income by Occupancy in Perrysville
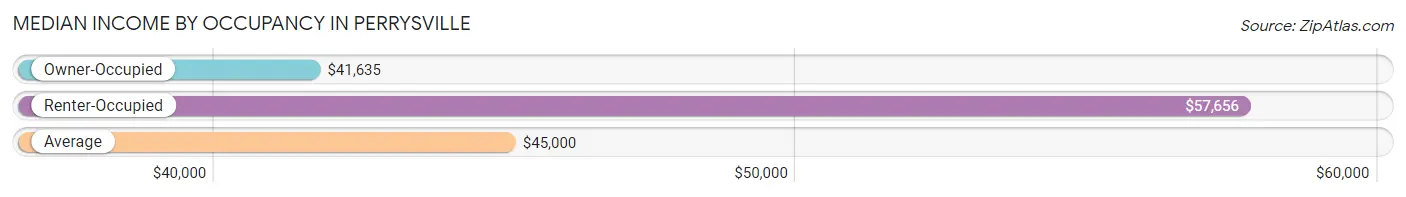
| Occupancy Type | # Households | Median Income |
| Owner-Occupied | 221 (66.6%) | $41,635 |
| Renter-Occupied | 111 (33.4%) | $57,656 |
| Average | 332 (100.0%) | $45,000 |
Occupancy by Householder Income Bracket in Perrysville
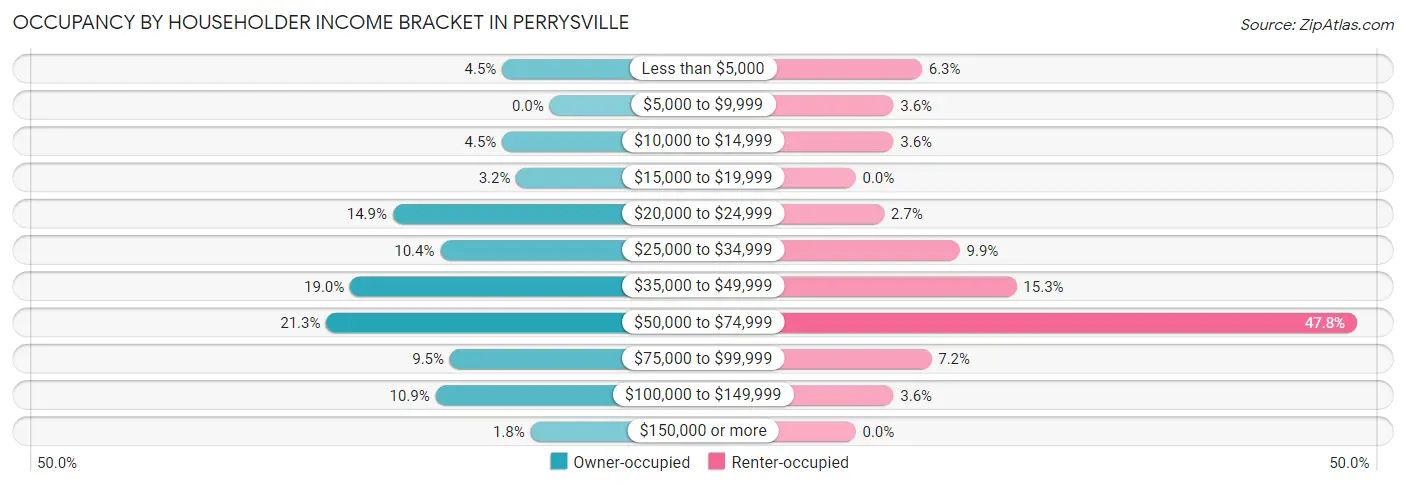
| Income Bracket | Owner-occupied | Renter-occupied |
| Less than $5,000 | 10 (4.5%) | 7 (6.3%) |
| $5,000 to $9,999 | 0 (0.0%) | 4 (3.6%) |
| $10,000 to $14,999 | 10 (4.5%) | 4 (3.6%) |
| $15,000 to $19,999 | 7 (3.2%) | 0 (0.0%) |
| $20,000 to $24,999 | 33 (14.9%) | 3 (2.7%) |
| $25,000 to $34,999 | 23 (10.4%) | 11 (9.9%) |
| $35,000 to $49,999 | 42 (19.0%) | 17 (15.3%) |
| $50,000 to $74,999 | 47 (21.3%) | 53 (47.7%) |
| $75,000 to $99,999 | 21 (9.5%) | 8 (7.2%) |
| $100,000 to $149,999 | 24 (10.9%) | 4 (3.6%) |
| $150,000 or more | 4 (1.8%) | 0 (0.0%) |
| Total | 221 (100.0%) | 111 (100.0%) |
Monthly Housing Cost Tiers in Perrysville
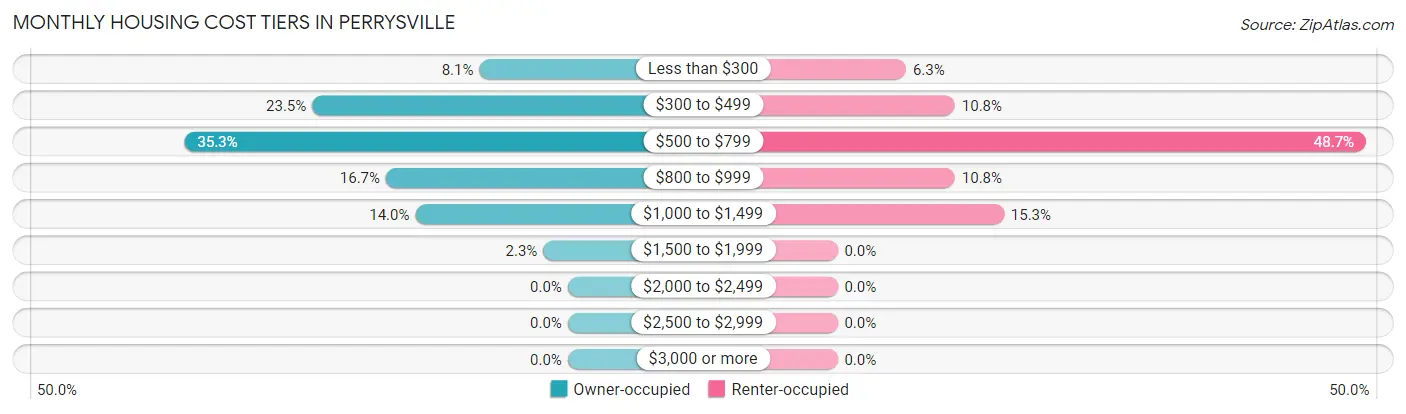
| Monthly Cost | Owner-occupied | Renter-occupied |
| Less than $300 | 18 (8.1%) | 7 (6.3%) |
| $300 to $499 | 52 (23.5%) | 12 (10.8%) |
| $500 to $799 | 78 (35.3%) | 54 (48.6%) |
| $800 to $999 | 37 (16.7%) | 12 (10.8%) |
| $1,000 to $1,499 | 31 (14.0%) | 17 (15.3%) |
| $1,500 to $1,999 | 5 (2.3%) | 0 (0.0%) |
| $2,000 to $2,499 | 0 (0.0%) | 0 (0.0%) |
| $2,500 to $2,999 | 0 (0.0%) | 0 (0.0%) |
| $3,000 or more | 0 (0.0%) | 0 (0.0%) |
| Total | 221 (100.0%) | 111 (100.0%) |
Physical Housing Characteristics in Perrysville
Housing Structures in Perrysville
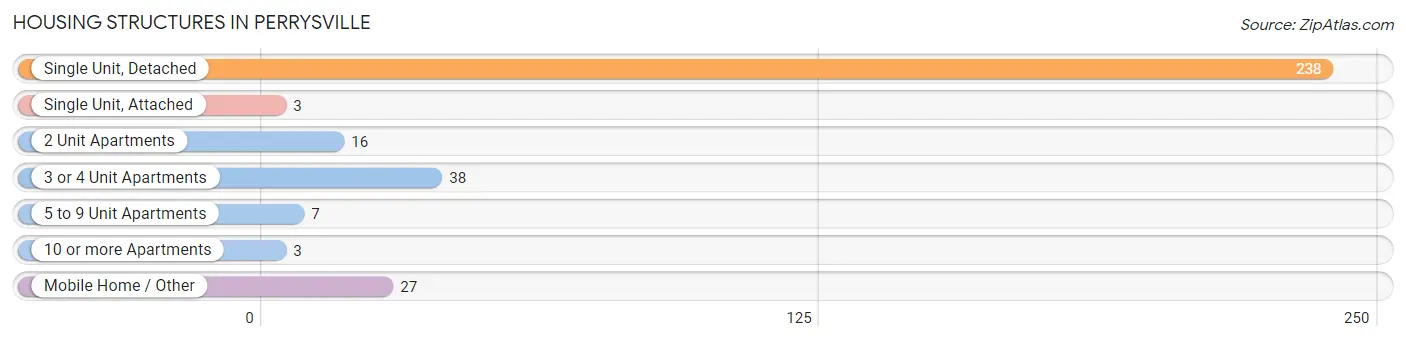
| Structure Type | # Housing Units | % Housing Units |
| Single Unit, Detached | 238 | 71.7% |
| Single Unit, Attached | 3 | 0.9% |
| 2 Unit Apartments | 16 | 4.8% |
| 3 or 4 Unit Apartments | 38 | 11.5% |
| 5 to 9 Unit Apartments | 7 | 2.1% |
| 10 or more Apartments | 3 | 0.9% |
| Mobile Home / Other | 27 | 8.1% |
| Total | 332 | 100.0% |
Housing Structures by Occupancy in Perrysville
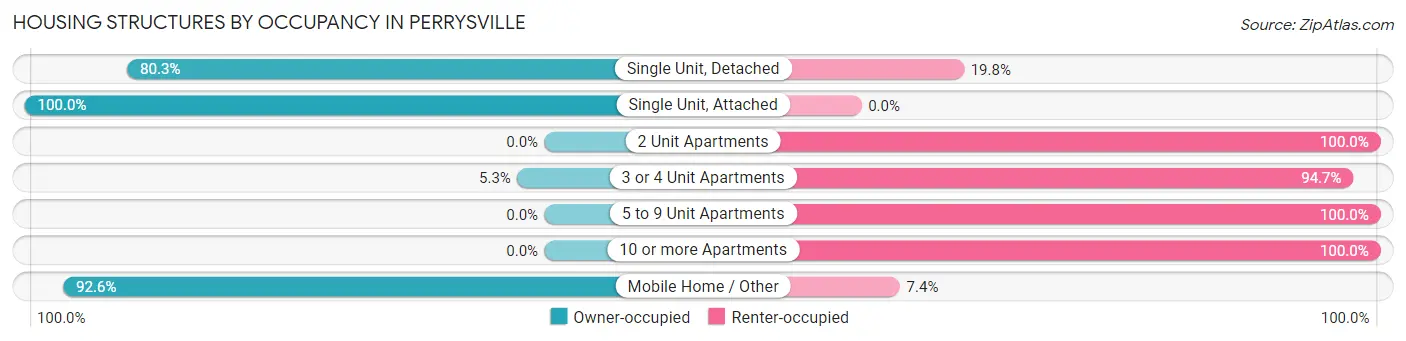
| Structure Type | Owner-occupied | Renter-occupied |
| Single Unit, Detached | 191 (80.2%) | 47 (19.8%) |
| Single Unit, Attached | 3 (100.0%) | 0 (0.0%) |
| 2 Unit Apartments | 0 (0.0%) | 16 (100.0%) |
| 3 or 4 Unit Apartments | 2 (5.3%) | 36 (94.7%) |
| 5 to 9 Unit Apartments | 0 (0.0%) | 7 (100.0%) |
| 10 or more Apartments | 0 (0.0%) | 3 (100.0%) |
| Mobile Home / Other | 25 (92.6%) | 2 (7.4%) |
| Total | 221 (66.6%) | 111 (33.4%) |
Housing Structures by Number of Rooms in Perrysville
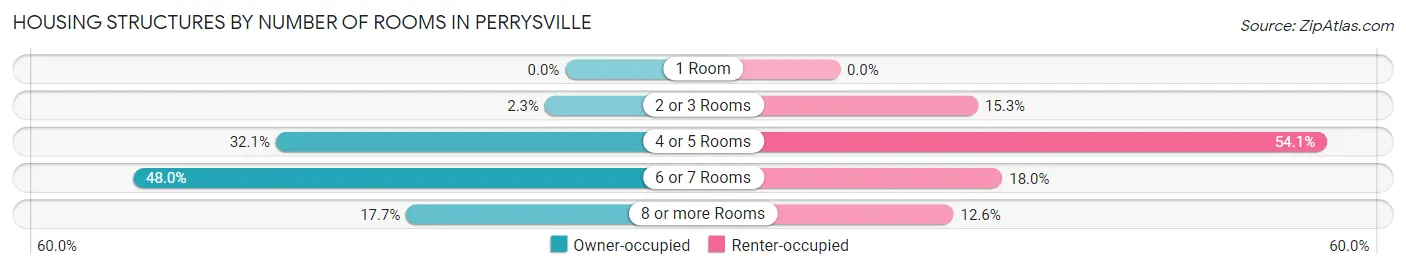
| Number of Rooms | Owner-occupied | Renter-occupied |
| 1 Room | 0 (0.0%) | 0 (0.0%) |
| 2 or 3 Rooms | 5 (2.3%) | 17 (15.3%) |
| 4 or 5 Rooms | 71 (32.1%) | 60 (54.0%) |
| 6 or 7 Rooms | 106 (48.0%) | 20 (18.0%) |
| 8 or more Rooms | 39 (17.6%) | 14 (12.6%) |
| Total | 221 (100.0%) | 111 (100.0%) |
Housing Structure by Heating Type in Perrysville
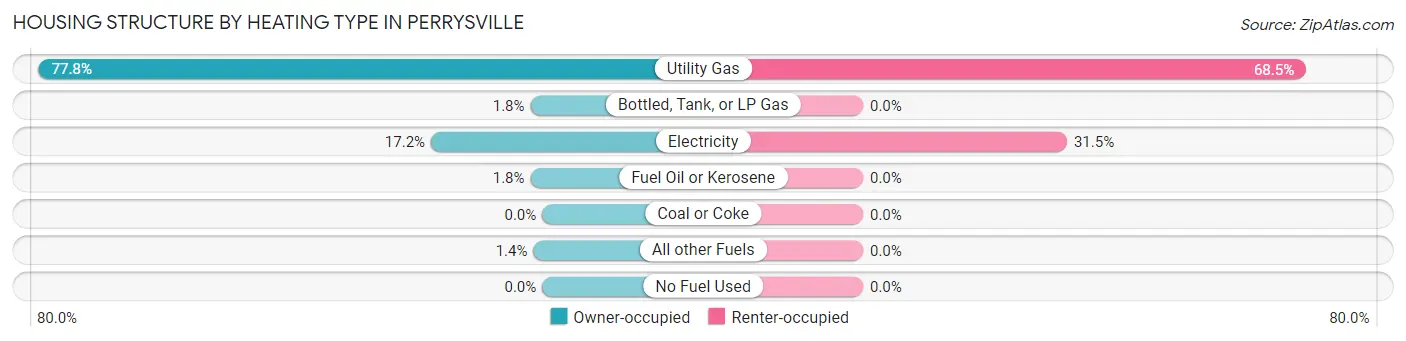
| Heating Type | Owner-occupied | Renter-occupied |
| Utility Gas | 172 (77.8%) | 76 (68.5%) |
| Bottled, Tank, or LP Gas | 4 (1.8%) | 0 (0.0%) |
| Electricity | 38 (17.2%) | 35 (31.5%) |
| Fuel Oil or Kerosene | 4 (1.8%) | 0 (0.0%) |
| Coal or Coke | 0 (0.0%) | 0 (0.0%) |
| All other Fuels | 3 (1.4%) | 0 (0.0%) |
| No Fuel Used | 0 (0.0%) | 0 (0.0%) |
| Total | 221 (100.0%) | 111 (100.0%) |
Household Vehicle Usage in Perrysville
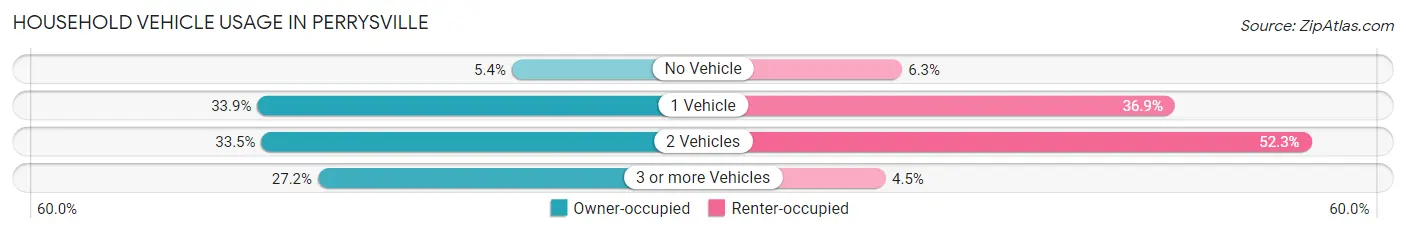
| Vehicles per Household | Owner-occupied | Renter-occupied |
| No Vehicle | 12 (5.4%) | 7 (6.3%) |
| 1 Vehicle | 75 (33.9%) | 41 (36.9%) |
| 2 Vehicles | 74 (33.5%) | 58 (52.2%) |
| 3 or more Vehicles | 60 (27.2%) | 5 (4.5%) |
| Total | 221 (100.0%) | 111 (100.0%) |
Real Estate & Mortgages in Perrysville
Real Estate and Mortgage Overview in Perrysville
| Characteristic | Without Mortgage | With Mortgage |
| Housing Units | 110 | 111 |
| Median Property Value | $102,800 | $98,800 |
| Median Household Income | $27,857 | $2 |
| Monthly Housing Costs | $391 | $0 |
| Real Estate Taxes | $768 | $2 |
Property Value by Mortgage Status in Perrysville
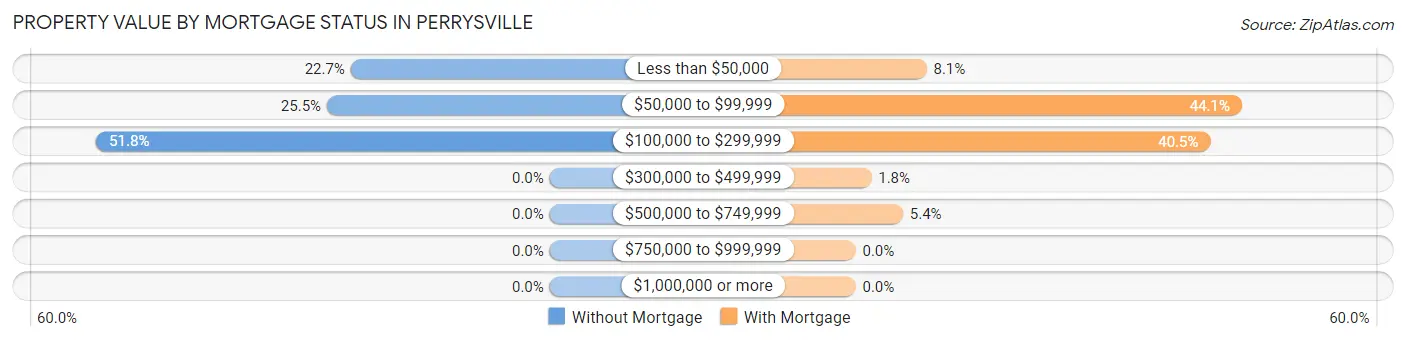
| Property Value | Without Mortgage | With Mortgage |
| Less than $50,000 | 25 (22.7%) | 9 (8.1%) |
| $50,000 to $99,999 | 28 (25.5%) | 49 (44.1%) |
| $100,000 to $299,999 | 57 (51.8%) | 45 (40.5%) |
| $300,000 to $499,999 | 0 (0.0%) | 2 (1.8%) |
| $500,000 to $749,999 | 0 (0.0%) | 6 (5.4%) |
| $750,000 to $999,999 | 0 (0.0%) | 0 (0.0%) |
| $1,000,000 or more | 0 (0.0%) | 0 (0.0%) |
| Total | 110 (100.0%) | 111 (100.0%) |
Household Income by Mortgage Status in Perrysville
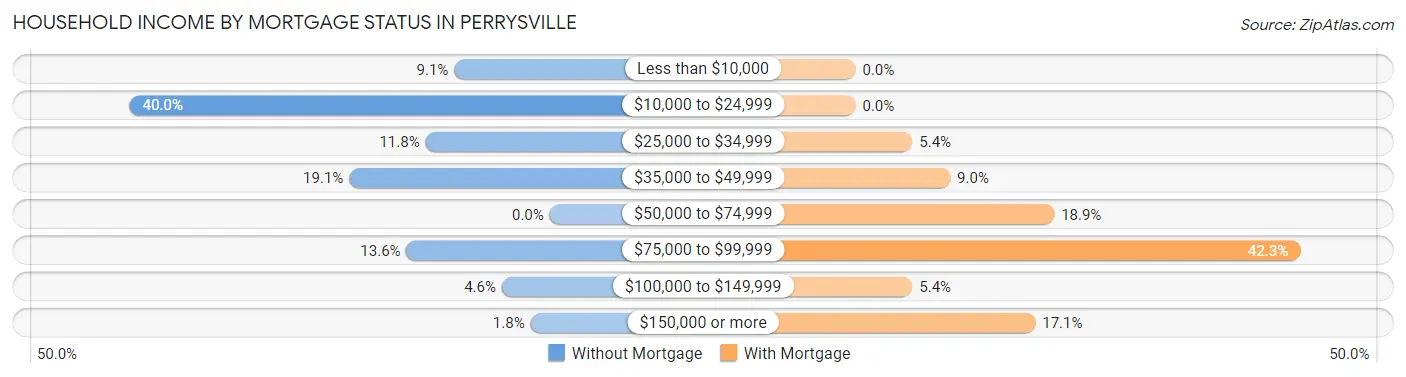
| Household Income | Without Mortgage | With Mortgage |
| Less than $10,000 | 10 (9.1%) | 0 (0.0%) |
| $10,000 to $24,999 | 44 (40.0%) | 0 (0.0%) |
| $25,000 to $34,999 | 13 (11.8%) | 6 (5.4%) |
| $35,000 to $49,999 | 21 (19.1%) | 10 (9.0%) |
| $50,000 to $74,999 | 0 (0.0%) | 21 (18.9%) |
| $75,000 to $99,999 | 15 (13.6%) | 47 (42.3%) |
| $100,000 to $149,999 | 5 (4.5%) | 6 (5.4%) |
| $150,000 or more | 2 (1.8%) | 19 (17.1%) |
| Total | 110 (100.0%) | 111 (100.0%) |
Property Value to Household Income Ratio in Perrysville
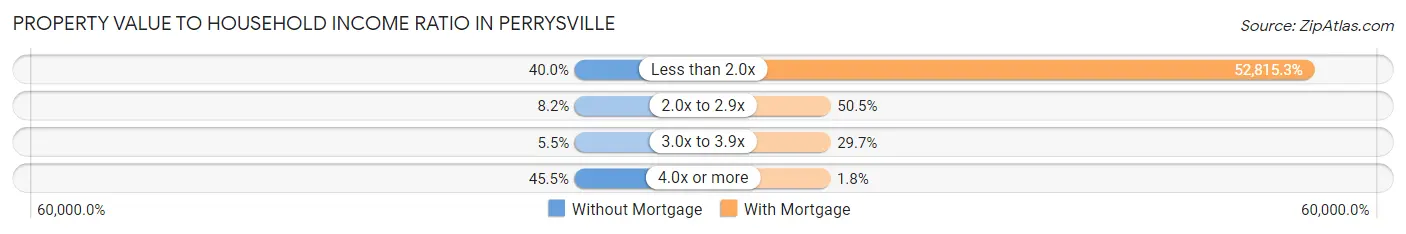
| Value-to-Income Ratio | Without Mortgage | With Mortgage |
| Less than 2.0x | 44 (40.0%) | 58,625 (52,815.3%) |
| 2.0x to 2.9x | 9 (8.2%) | 56 (50.4%) |
| 3.0x to 3.9x | 6 (5.4%) | 33 (29.7%) |
| 4.0x or more | 50 (45.5%) | 2 (1.8%) |
| Total | 110 (100.0%) | 111 (100.0%) |
Real Estate Taxes by Mortgage Status in Perrysville
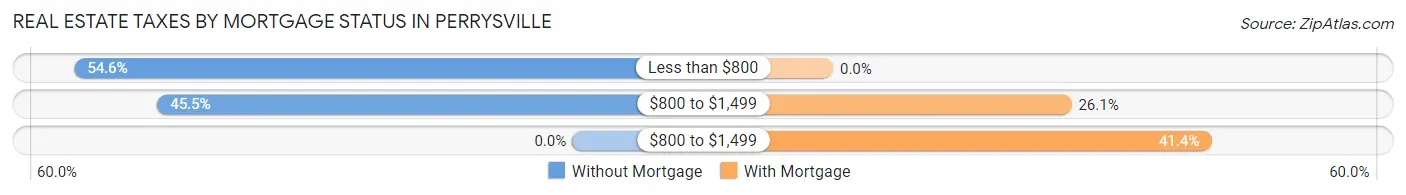
| Property Taxes | Without Mortgage | With Mortgage |
| Less than $800 | 60 (54.5%) | 0 (0.0%) |
| $800 to $1,499 | 50 (45.5%) | 29 (26.1%) |
| $800 to $1,499 | 0 (0.0%) | 46 (41.4%) |
| Total | 110 (100.0%) | 111 (100.0%) |
Health & Disability in Perrysville
Health Insurance Coverage by Age in Perrysville
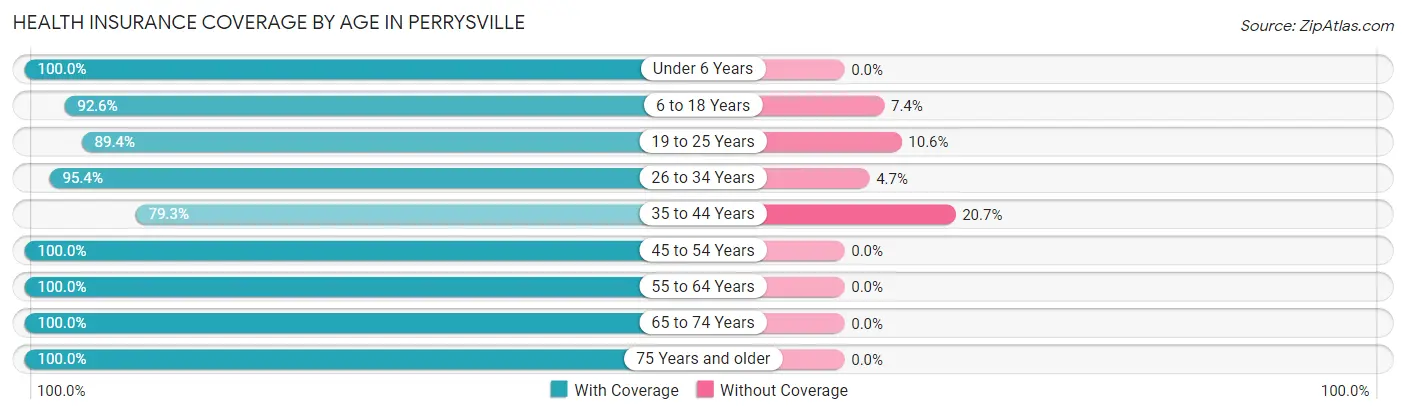
| Age Bracket | With Coverage | Without Coverage |
| Under 6 Years | 73 (100.0%) | 0 (0.0%) |
| 6 to 18 Years | 100 (92.6%) | 8 (7.4%) |
| 19 to 25 Years | 84 (89.4%) | 10 (10.6%) |
| 26 to 34 Years | 123 (95.4%) | 6 (4.6%) |
| 35 to 44 Years | 92 (79.3%) | 24 (20.7%) |
| 45 to 54 Years | 63 (100.0%) | 0 (0.0%) |
| 55 to 64 Years | 92 (100.0%) | 0 (0.0%) |
| 65 to 74 Years | 61 (100.0%) | 0 (0.0%) |
| 75 Years and older | 67 (100.0%) | 0 (0.0%) |
| Total | 755 (94.0%) | 48 (6.0%) |
Health Insurance Coverage by Citizenship Status in Perrysville
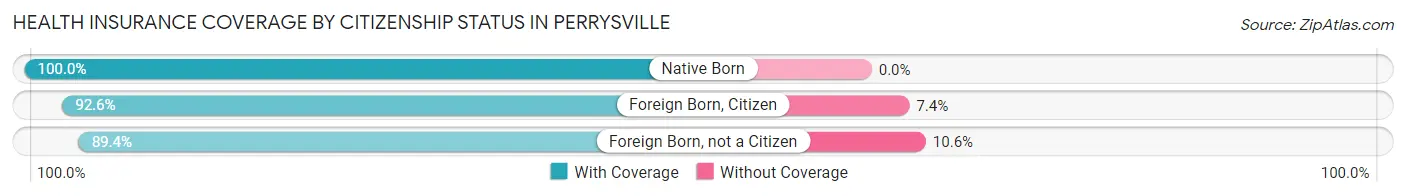
| Citizenship Status | With Coverage | Without Coverage |
| Native Born | 73 (100.0%) | 0 (0.0%) |
| Foreign Born, Citizen | 100 (92.6%) | 8 (7.4%) |
| Foreign Born, not a Citizen | 84 (89.4%) | 10 (10.6%) |
Health Insurance Coverage by Household Income in Perrysville
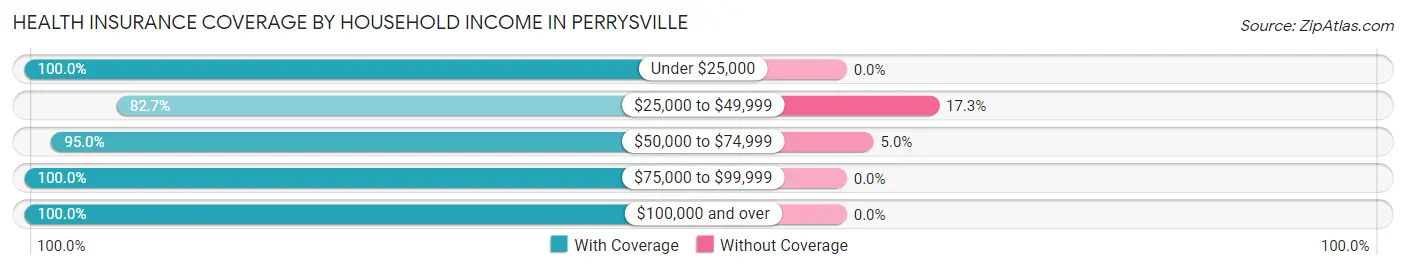
| Household Income | With Coverage | Without Coverage |
| Under $25,000 | 100 (100.0%) | 0 (0.0%) |
| $25,000 to $49,999 | 158 (82.7%) | 33 (17.3%) |
| $50,000 to $74,999 | 284 (95.0%) | 15 (5.0%) |
| $75,000 to $99,999 | 135 (100.0%) | 0 (0.0%) |
| $100,000 and over | 78 (100.0%) | 0 (0.0%) |
Public vs Private Health Insurance Coverage by Age in Perrysville
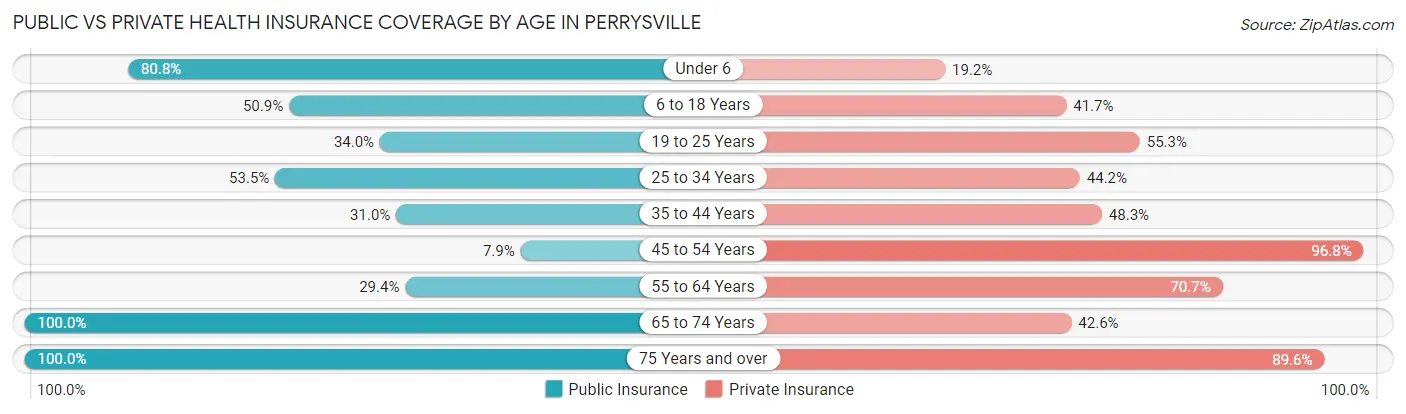
| Age Bracket | Public Insurance | Private Insurance |
| Under 6 | 59 (80.8%) | 14 (19.2%) |
| 6 to 18 Years | 55 (50.9%) | 45 (41.7%) |
| 19 to 25 Years | 32 (34.0%) | 52 (55.3%) |
| 25 to 34 Years | 69 (53.5%) | 57 (44.2%) |
| 35 to 44 Years | 36 (31.0%) | 56 (48.3%) |
| 45 to 54 Years | 5 (7.9%) | 61 (96.8%) |
| 55 to 64 Years | 27 (29.3%) | 65 (70.7%) |
| 65 to 74 Years | 61 (100.0%) | 26 (42.6%) |
| 75 Years and over | 67 (100.0%) | 60 (89.5%) |
| Total | 411 (51.2%) | 436 (54.3%) |
Disability Status by Sex by Age in Perrysville
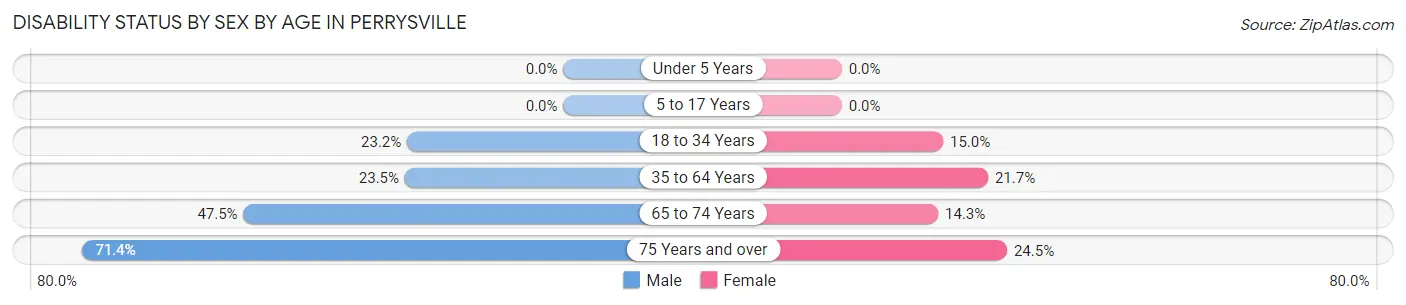
| Age Bracket | Male | Female |
| Under 5 Years | 0 (0.0%) | 0 (0.0%) |
| 5 to 17 Years | 0 (0.0%) | 0 (0.0%) |
| 18 to 34 Years | 29 (23.2%) | 17 (15.0%) |
| 35 to 64 Years | 28 (23.5%) | 33 (21.7%) |
| 65 to 74 Years | 19 (47.5%) | 3 (14.3%) |
| 75 Years and over | 10 (71.4%) | 13 (24.5%) |
Disability Class by Sex by Age in Perrysville
Disability Class: Hearing Difficulty
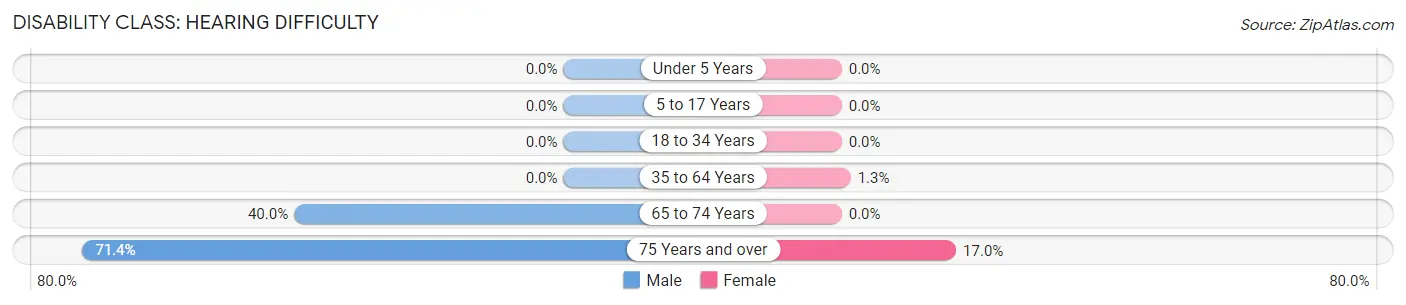
| Age Bracket | Male | Female |
| Under 5 Years | 0 (0.0%) | 0 (0.0%) |
| 5 to 17 Years | 0 (0.0%) | 0 (0.0%) |
| 18 to 34 Years | 0 (0.0%) | 0 (0.0%) |
| 35 to 64 Years | 0 (0.0%) | 2 (1.3%) |
| 65 to 74 Years | 16 (40.0%) | 0 (0.0%) |
| 75 Years and over | 10 (71.4%) | 9 (17.0%) |
Disability Class: Vision Difficulty
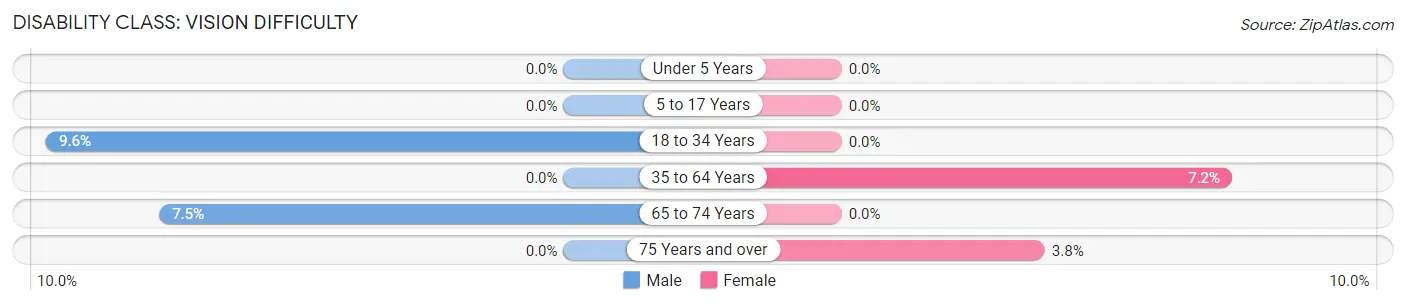
| Age Bracket | Male | Female |
| Under 5 Years | 0 (0.0%) | 0 (0.0%) |
| 5 to 17 Years | 0 (0.0%) | 0 (0.0%) |
| 18 to 34 Years | 12 (9.6%) | 0 (0.0%) |
| 35 to 64 Years | 0 (0.0%) | 11 (7.2%) |
| 65 to 74 Years | 3 (7.5%) | 0 (0.0%) |
| 75 Years and over | 0 (0.0%) | 2 (3.8%) |
Disability Class: Cognitive Difficulty
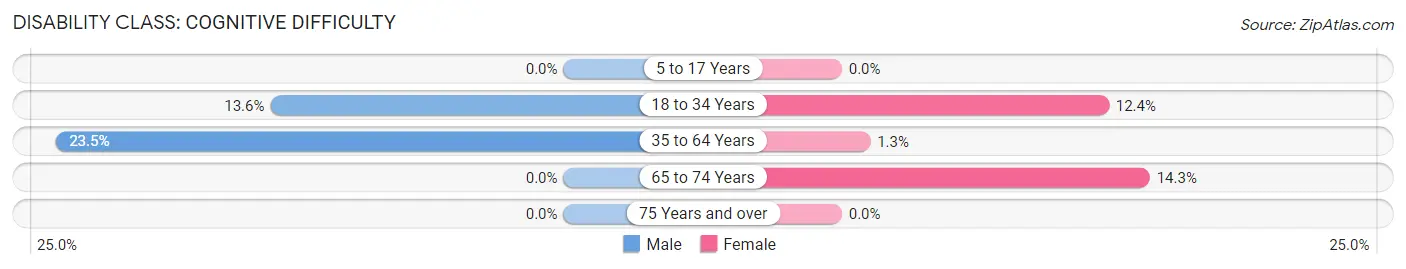
| Age Bracket | Male | Female |
| 5 to 17 Years | 0 (0.0%) | 0 (0.0%) |
| 18 to 34 Years | 17 (13.6%) | 14 (12.4%) |
| 35 to 64 Years | 28 (23.5%) | 2 (1.3%) |
| 65 to 74 Years | 0 (0.0%) | 3 (14.3%) |
| 75 Years and over | 0 (0.0%) | 0 (0.0%) |
Disability Class: Ambulatory Difficulty
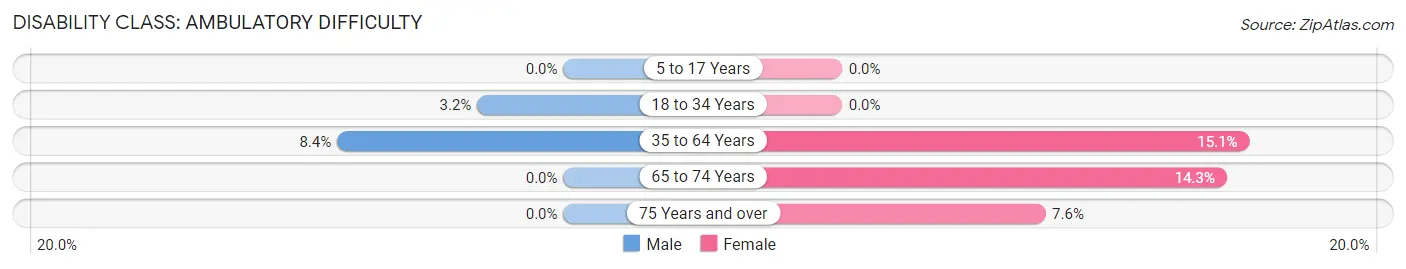
| Age Bracket | Male | Female |
| 5 to 17 Years | 0 (0.0%) | 0 (0.0%) |
| 18 to 34 Years | 4 (3.2%) | 0 (0.0%) |
| 35 to 64 Years | 10 (8.4%) | 23 (15.1%) |
| 65 to 74 Years | 0 (0.0%) | 3 (14.3%) |
| 75 Years and over | 0 (0.0%) | 4 (7.5%) |
Disability Class: Self-Care Difficulty
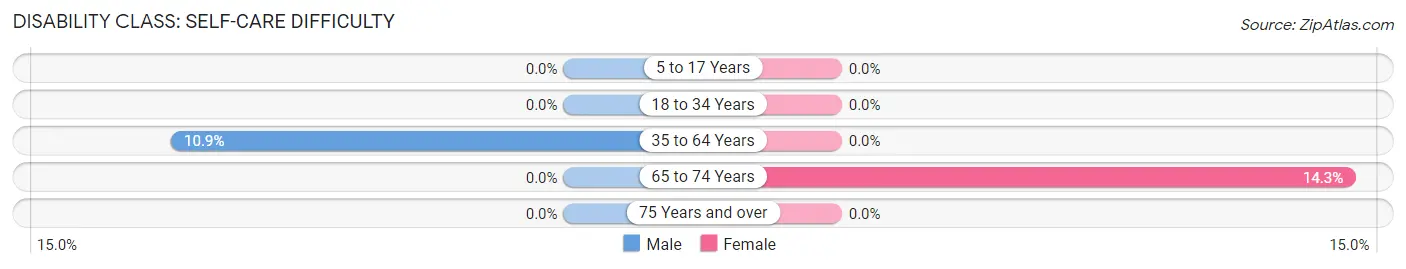
| Age Bracket | Male | Female |
| 5 to 17 Years | 0 (0.0%) | 0 (0.0%) |
| 18 to 34 Years | 0 (0.0%) | 0 (0.0%) |
| 35 to 64 Years | 13 (10.9%) | 0 (0.0%) |
| 65 to 74 Years | 0 (0.0%) | 3 (14.3%) |
| 75 Years and over | 0 (0.0%) | 0 (0.0%) |
Technology Access in Perrysville
Computing Device Access in Perrysville
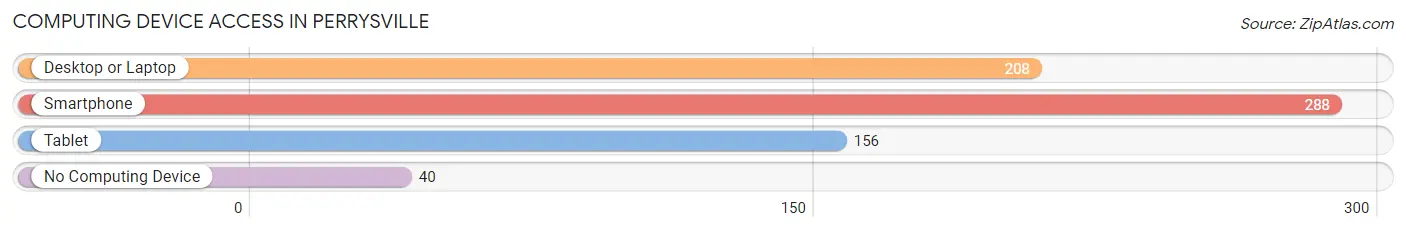
| Device Type | # Households | % Households |
| Desktop or Laptop | 208 | 62.6% |
| Smartphone | 288 | 86.8% |
| Tablet | 156 | 47.0% |
| No Computing Device | 40 | 12.0% |
| Total | 332 | 100.0% |
Internet Access in Perrysville
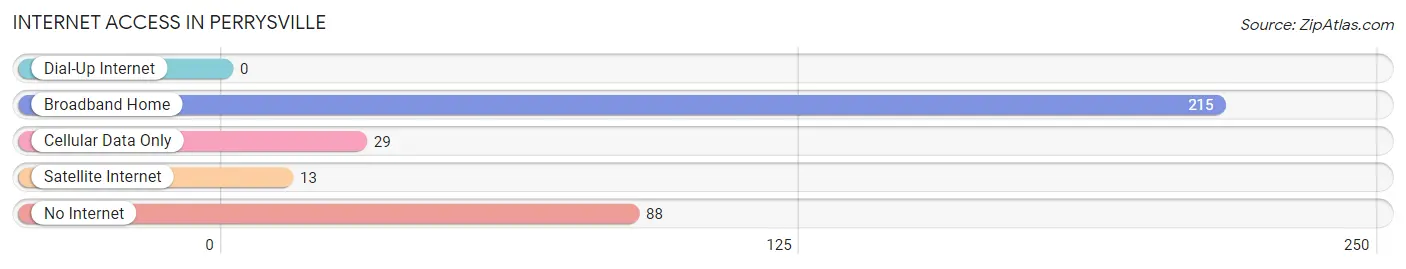
| Internet Type | # Households | % Households |
| Dial-Up Internet | 0 | 0.0% |
| Broadband Home | 215 | 64.8% |
| Cellular Data Only | 29 | 8.7% |
| Satellite Internet | 13 | 3.9% |
| No Internet | 88 | 26.5% |
| Total | 332 | 100.0% |
Perrysville Summary
Perrysville, Ohio is a small village located in the southeastern corner of Ashland County, Ohio. It is situated on the banks of the Black Fork of the Mohican River, and is surrounded by rolling hills and lush forests. The village has a population of approximately 1,000 people, and is home to a variety of businesses, including a grocery store, a hardware store, a restaurant, and a few other small businesses.
History
Perrysville was founded in 1817 by William Perry, a Revolutionary War veteran. Perry had purchased the land from the government in 1814, and he and his family moved to the area in 1817. The village was named after him, and the first post office was established in 1820.
The village grew slowly over the years, and by the late 1800s, it had become a thriving community. The village was home to several businesses, including a sawmill, a grist mill, a blacksmith shop, and a general store. The village also had a school, a church, and a cemetery.
In the early 1900s, the village began to decline. The sawmill and grist mill closed, and the population began to dwindle. However, the village was able to survive, and in the 1950s, it began to experience a resurgence. The population began to grow again, and new businesses opened up.
Geography
Perrysville is located in the southeastern corner of Ashland County, Ohio. It is situated on the banks of the Black Fork of the Mohican River, and is surrounded by rolling hills and lush forests. The village is located approximately 25 miles south of Mansfield, Ohio, and approximately 50 miles north of Columbus, Ohio.
The village is located in a rural area, and is surrounded by farmland. The nearest major city is Mansfield, which is approximately 25 miles away. The nearest interstate highway is Interstate 71, which is approximately 30 miles away.
Economy
The economy of Perrysville is largely based on agriculture and tourism. The village is home to several small businesses, including a grocery store, a hardware store, a restaurant, and a few other small businesses. The village also has a few small manufacturing companies, which produce a variety of products, including furniture and clothing.
The village is also home to several tourist attractions, including the Mohican State Park, which is located just outside of the village. The park offers a variety of activities, including camping, hiking, fishing, and boating. The village also has a few bed and breakfasts, which attract visitors from all over the country.
Demographics
As of the 2010 census, the population of Perrysville was 1,000 people. The village is predominantly white, with approximately 95% of the population being white. The median household income is approximately $45,000, and the median home value is approximately $125,000. The village has a low unemployment rate, and the majority of the population is employed in either agriculture or tourism.
Common Questions
What is Per Capita Income in Perrysville?
Per Capita income in Perrysville is $21,947.
What is the Median Family Income in Perrysville?
Median Family Income in Perrysville is $58,456.
What is the Median Household income in Perrysville?
Median Household Income in Perrysville is $45,000.
What is Income or Wage Gap in Perrysville?
Income or Wage Gap in Perrysville is 42.8%.
Women in Perrysville earn 57.2 cents for every dollar earned by a man.
What is Inequality or Gini Index in Perrysville?
Inequality or Gini Index in Perrysville is 0.35.
What is the Total Population of Perrysville?
Total Population of Perrysville is 803.
What is the Total Male Population of Perrysville?
Total Male Population of Perrysville is 368.
What is the Total Female Population of Perrysville?
Total Female Population of Perrysville is 435.
What is the Ratio of Males per 100 Females in Perrysville?
There are 84.60 Males per 100 Females in Perrysville.
What is the Ratio of Females per 100 Males in Perrysville?
There are 118.21 Females per 100 Males in Perrysville.
What is the Median Population Age in Perrysville?
Median Population Age in Perrysville is 34.8 Years.
What is the Average Family Size in Perrysville
Average Family Size in Perrysville is 3.1 People.
What is the Average Household Size in Perrysville
Average Household Size in Perrysville is 2.4 People.
How Large is the Labor Force in Perrysville?
There are 384 People in the Labor Forcein in Perrysville.
What is the Percentage of People in the Labor Force in Perrysville?
59.3% of People are in the Labor Force in Perrysville.
What is the Unemployment Rate in Perrysville?
Unemployment Rate in Perrysville is 4.7%.