Perry, OH Map & Demographics
Perry Map
Perry Overview
$34,683
PER CAPITA INCOME
$106,250
AVG FAMILY INCOME
$89,836
AVG HOUSEHOLD INCOME
19.9%
WAGE / INCOME GAP [ % ]
80.1¢/ $1
WAGE / INCOME GAP [ $ ]
$9,857
FAMILY INCOME DEFICIT
0.34
INEQUALITY / GINI INDEX
1,578
TOTAL POPULATION
801
MALE POPULATION
777
FEMALE POPULATION
103.09
MALES / 100 FEMALES
97.00
FEMALES / 100 MALES
38.1
MEDIAN AGE
3.2
AVG FAMILY SIZE
3.1
AVG HOUSEHOLD SIZE
795
LABOR FORCE [ PEOPLE ]
67.2%
PERCENT IN LABOR FORCE
2.5%
UNEMPLOYMENT RATE
Perry Zip Codes
Perry Area Codes
Income in Perry
Income Overview in Perry
Per Capita Income in Perry is $34,683, while median incomes of families and households are $106,250 and $89,836 respectively.
| Characteristic | Number | Measure |
| Per Capita Income | 1,578 | $34,683 |
| Median Family Income | 408 | $106,250 |
| Mean Family Income | 408 | $113,999 |
| Median Household Income | 507 | $89,836 |
| Mean Household Income | 507 | $105,227 |
| Income Deficit | 408 | $9,857 |
| Wage / Income Gap (%) | 1,578 | 19.91% |
| Wage / Income Gap ($) | 1,578 | 80.09¢ per $1 |
| Gini / Inequality Index | 1,578 | 0.34 |
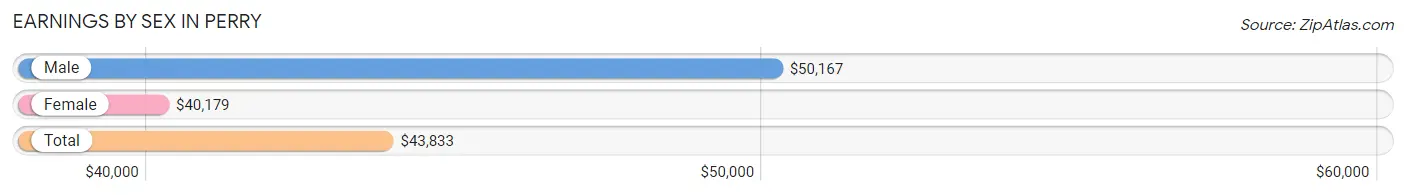
Earnings by Sex in Perry
Average Earnings in Perry are $43,833, $50,167 for men and $40,179 for women, a difference of 19.9%.
| Sex | Number | Average Earnings |
| Male | 428 (52.7%) | $50,167 |
| Female | 384 (47.3%) | $40,179 |
| Total | 812 (100.0%) | $43,833 |
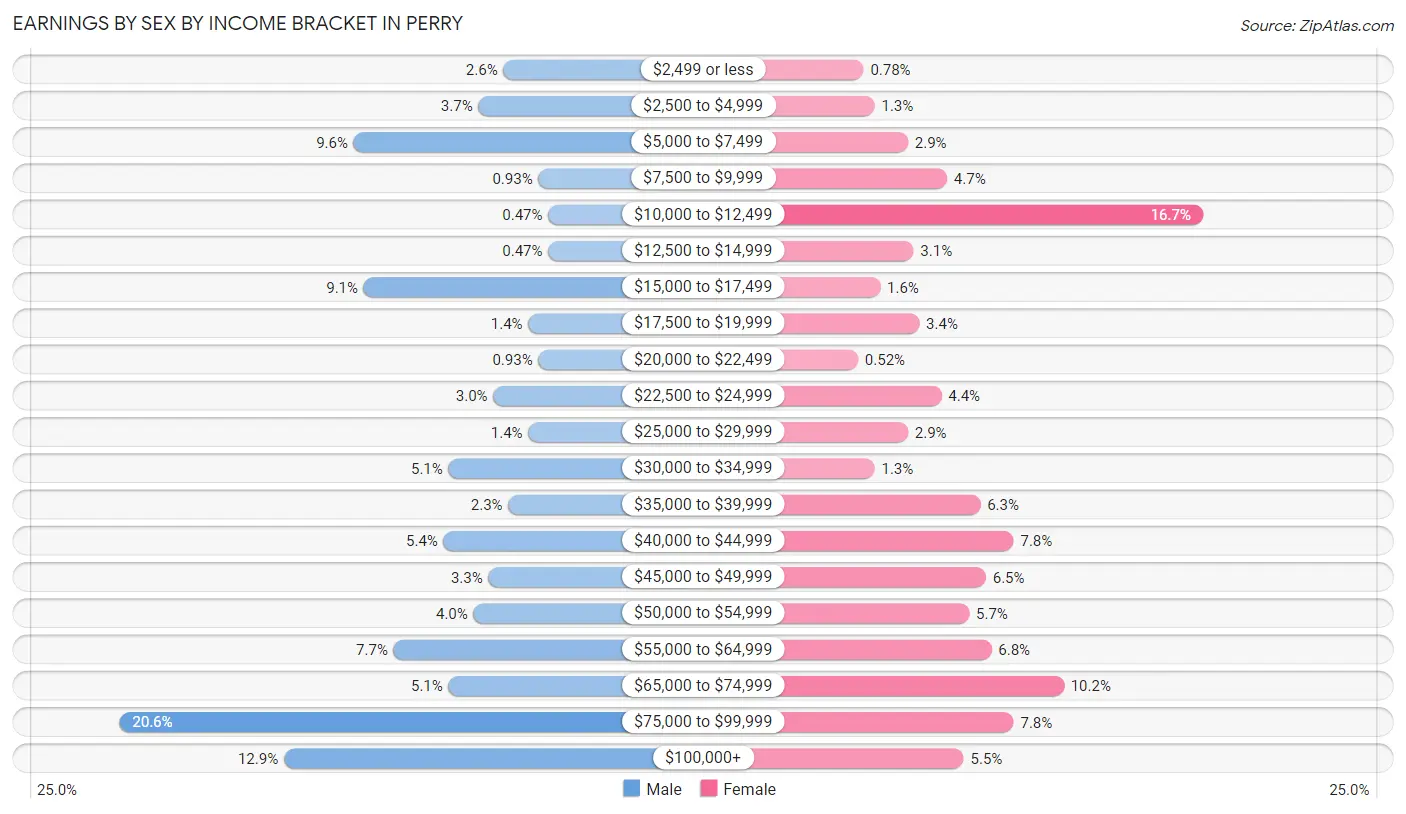
Earnings by Sex by Income Bracket in Perry
The most common earnings brackets in Perry are $75,000 to $99,999 for men (88 | 20.6%) and $10,000 to $12,499 for women (64 | 16.7%).
| Income | Male | Female |
| $2,499 or less | 11 (2.6%) | 3 (0.8%) |
| $2,500 to $4,999 | 16 (3.7%) | 5 (1.3%) |
| $5,000 to $7,499 | 41 (9.6%) | 11 (2.9%) |
| $7,500 to $9,999 | 4 (0.9%) | 18 (4.7%) |
| $10,000 to $12,499 | 2 (0.5%) | 64 (16.7%) |
| $12,500 to $14,999 | 2 (0.5%) | 12 (3.1%) |
| $15,000 to $17,499 | 39 (9.1%) | 6 (1.6%) |
| $17,500 to $19,999 | 6 (1.4%) | 13 (3.4%) |
| $20,000 to $22,499 | 4 (0.9%) | 2 (0.5%) |
| $22,500 to $24,999 | 13 (3.0%) | 17 (4.4%) |
| $25,000 to $29,999 | 6 (1.4%) | 11 (2.9%) |
| $30,000 to $34,999 | 22 (5.1%) | 5 (1.3%) |
| $35,000 to $39,999 | 10 (2.3%) | 24 (6.2%) |
| $40,000 to $44,999 | 23 (5.4%) | 30 (7.8%) |
| $45,000 to $49,999 | 14 (3.3%) | 25 (6.5%) |
| $50,000 to $54,999 | 17 (4.0%) | 22 (5.7%) |
| $55,000 to $64,999 | 33 (7.7%) | 26 (6.8%) |
| $65,000 to $74,999 | 22 (5.1%) | 39 (10.2%) |
| $75,000 to $99,999 | 88 (20.6%) | 30 (7.8%) |
| $100,000+ | 55 (12.9%) | 21 (5.5%) |
| Total | 428 (100.0%) | 384 (100.0%) |
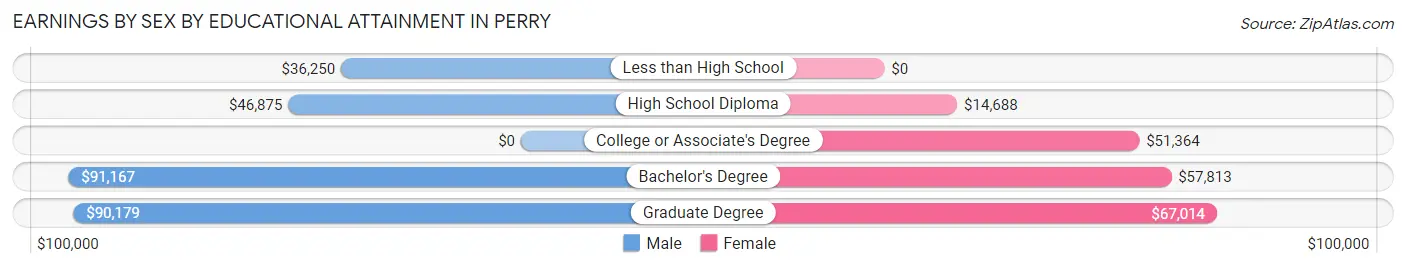
Earnings by Sex by Educational Attainment in Perry
Average earnings in Perry are $56,484 for men and $43,750 for women, a difference of 22.5%. Men with an educational attainment of bachelor's degree enjoy the highest average annual earnings of $91,167, while those with less than high school education earn the least with $36,250. Women with an educational attainment of graduate degree earn the most with the average annual earnings of $67,014, while those with high school diploma education have the smallest earnings of $14,688.
| Educational Attainment | Male Income | Female Income |
| Less than High School | $36,250 | $0 |
| High School Diploma | $46,875 | $14,688 |
| College or Associate's Degree | - | - |
| Bachelor's Degree | $91,167 | $57,813 |
| Graduate Degree | $90,179 | $67,014 |
| Total | $56,484 | $43,750 |
Family Income in Perry
Family Income Brackets in Perry
According to the Perry family income data, there are 115 families falling into the $100,000 to $149,999 income range, which is the most common income bracket and makes up 28.2% of all families.
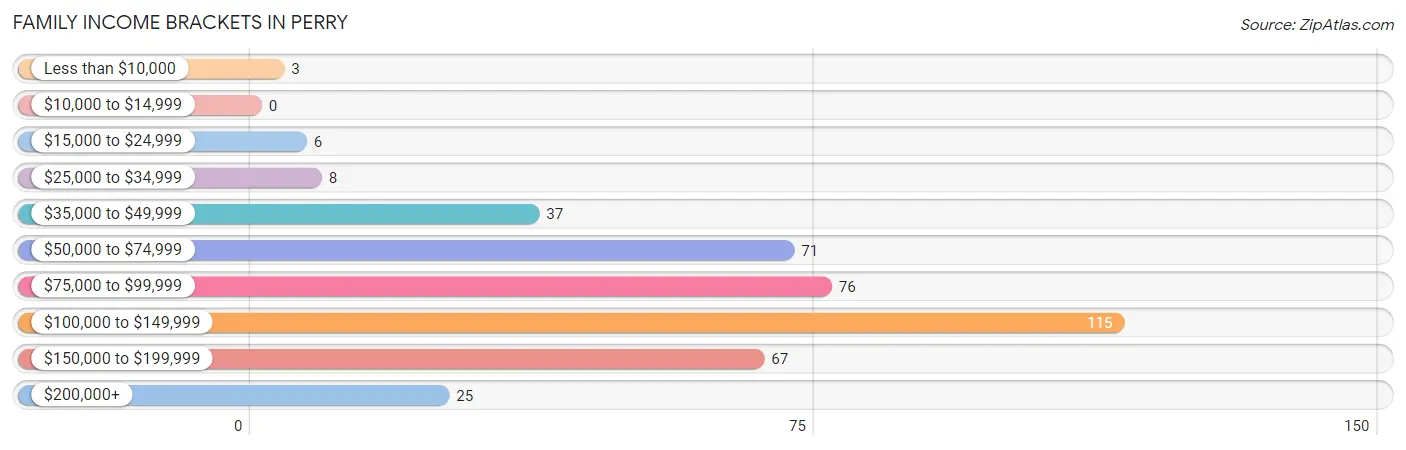
| Income Bracket | # Families | % Families |
| Less than $10,000 | 3 | 0.7% |
| $10,000 to $14,999 | 0 | 0.0% |
| $15,000 to $24,999 | 6 | 1.5% |
| $25,000 to $34,999 | 8 | 2.0% |
| $35,000 to $49,999 | 37 | 9.1% |
| $50,000 to $74,999 | 71 | 17.4% |
| $75,000 to $99,999 | 76 | 18.6% |
| $100,000 to $149,999 | 115 | 28.2% |
| $150,000 to $199,999 | 67 | 16.4% |
| $200,000+ | 25 | 6.1% |
Family Income by Famaliy Size in Perry
5-person families (37 | 9.1%) account for the highest median family income in Perry with $132,639 per family, while 2-person families (168 | 41.2%) have the highest median income of $36,666 per family member.
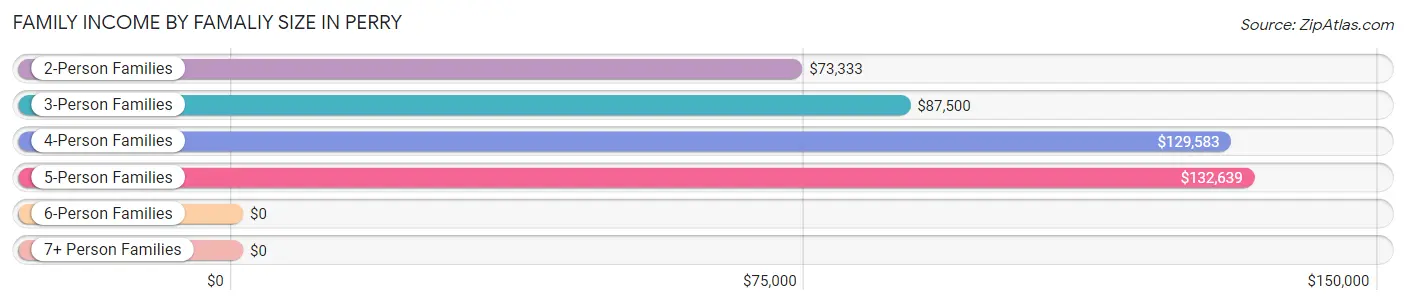
| Income Bracket | # Families | Median Income |
| 2-Person Families | 168 (41.2%) | $73,333 |
| 3-Person Families | 118 (28.9%) | $87,500 |
| 4-Person Families | 68 (16.7%) | $129,583 |
| 5-Person Families | 37 (9.1%) | $132,639 |
| 6-Person Families | 12 (2.9%) | $0 |
| 7+ Person Families | 5 (1.2%) | $0 |
| Total | 408 (100.0%) | $106,250 |
Family Income by Number of Earners in Perry
The median family income in Perry is $106,250, with families comprising 3+ earners (31) having the highest median family income of $121,875, while families with no earners (65) have the lowest median family income of $60,417, accounting for 7.6% and 15.9% of families, respectively.
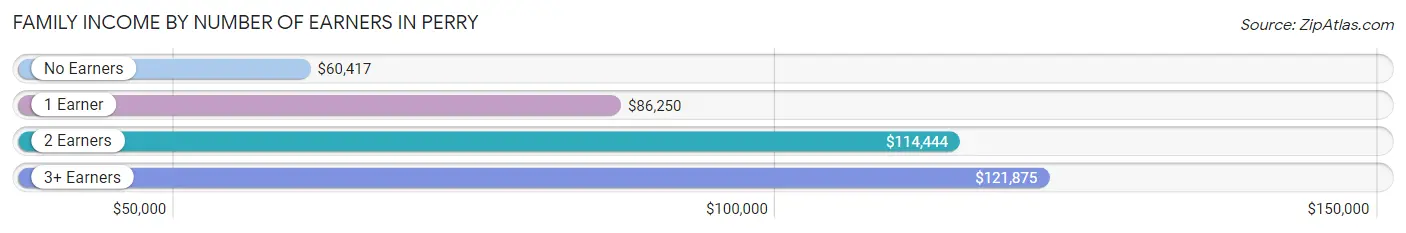
| Number of Earners | # Families | Median Income |
| No Earners | 65 (15.9%) | $60,417 |
| 1 Earner | 96 (23.5%) | $86,250 |
| 2 Earners | 216 (52.9%) | $114,444 |
| 3+ Earners | 31 (7.6%) | $121,875 |
| Total | 408 (100.0%) | $106,250 |
Household Income in Perry
Household Income Brackets in Perry
With 126 households falling in the category, the $100,000 to $149,999 income range is the most frequent in Perry, accounting for 24.8% of all households. In contrast, only 2 households (0.4%) fall into the $10,000 to $14,999 income bracket, making it the least populous group.
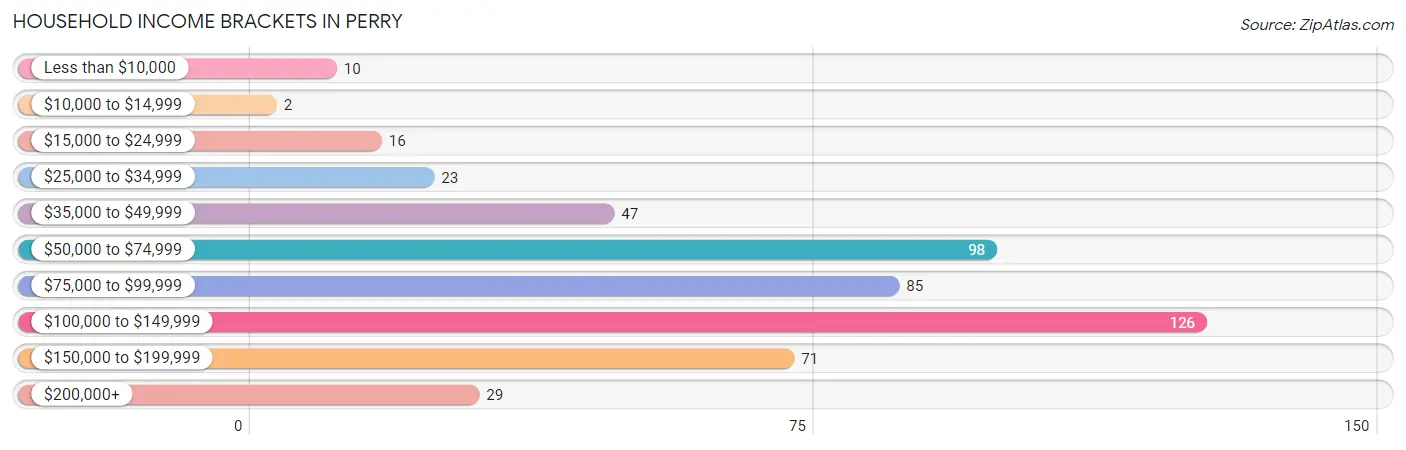
| Income Bracket | # Households | % Households |
| Less than $10,000 | 10 | 2.0% |
| $10,000 to $14,999 | 2 | 0.4% |
| $15,000 to $24,999 | 16 | 3.2% |
| $25,000 to $34,999 | 23 | 4.5% |
| $35,000 to $49,999 | 47 | 9.3% |
| $50,000 to $74,999 | 98 | 19.3% |
| $75,000 to $99,999 | 85 | 16.8% |
| $100,000 to $149,999 | 126 | 24.9% |
| $150,000 to $199,999 | 71 | 14.0% |
| $200,000+ | 29 | 5.7% |
Household Income by Householder Age in Perry
The median household income in Perry is $89,836, with the highest median household income of $131,250 found in the 25 to 44 years age bracket for the primary householder. A total of 148 households (29.2%) fall into this category. Meanwhile, the 15 to 24 years age bracket for the primary householder has the lowest median household income of $0, with 5 households (1.0%) in this group.
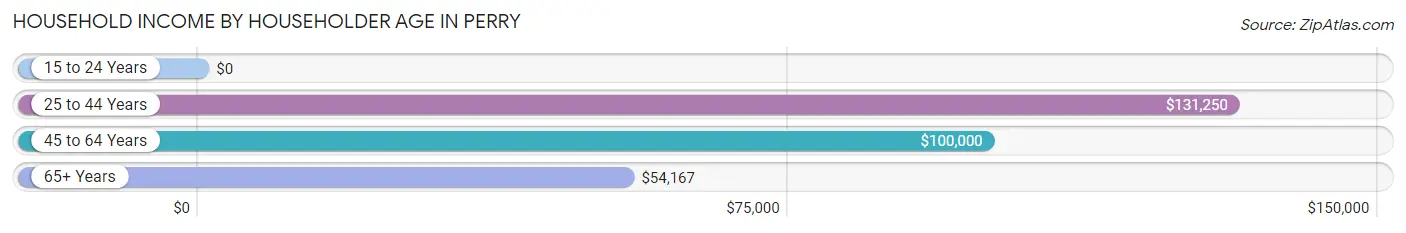
| Income Bracket | # Households | Median Income |
| 15 to 24 Years | 5 (1.0%) | $0 |
| 25 to 44 Years | 148 (29.2%) | $131,250 |
| 45 to 64 Years | 206 (40.6%) | $100,000 |
| 65+ Years | 148 (29.2%) | $54,167 |
| Total | 507 (100.0%) | $89,836 |
Poverty in Perry
Income Below Poverty by Sex and Age in Perry
With 3.6% poverty level for males and 9.7% for females among the residents of Perry, 12 to 14 year old males and 25 to 34 year old females are the most vulnerable to poverty, with 4 males (11.8%) and 50 females (49.0%) in their respective age groups living below the poverty level.
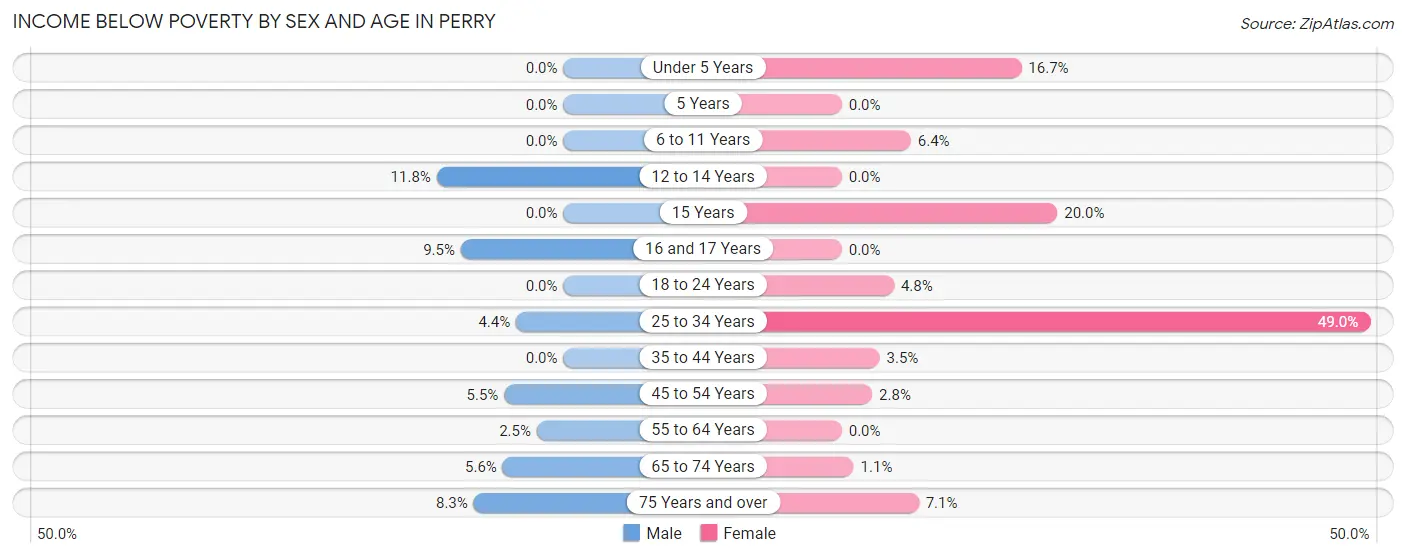
| Age Bracket | Male | Female |
| Under 5 Years | 0 (0.0%) | 4 (16.7%) |
| 5 Years | 0 (0.0%) | 0 (0.0%) |
| 6 to 11 Years | 0 (0.0%) | 5 (6.4%) |
| 12 to 14 Years | 4 (11.8%) | 0 (0.0%) |
| 15 Years | 0 (0.0%) | 3 (20.0%) |
| 16 and 17 Years | 2 (9.5%) | 0 (0.0%) |
| 18 to 24 Years | 0 (0.0%) | 3 (4.8%) |
| 25 to 34 Years | 5 (4.4%) | 50 (49.0%) |
| 35 to 44 Years | 0 (0.0%) | 4 (3.5%) |
| 45 to 54 Years | 5 (5.5%) | 2 (2.8%) |
| 55 to 64 Years | 3 (2.5%) | 0 (0.0%) |
| 65 to 74 Years | 4 (5.6%) | 1 (1.1%) |
| 75 Years and over | 4 (8.3%) | 3 (7.1%) |
| Total | 27 (3.6%) | 75 (9.7%) |
Income Above Poverty by Sex and Age in Perry
According to the poverty statistics in Perry, males aged under 5 years and females aged 5 years are the age groups that are most secure financially, with 100.0% of males and 100.0% of females in these age groups living above the poverty line.
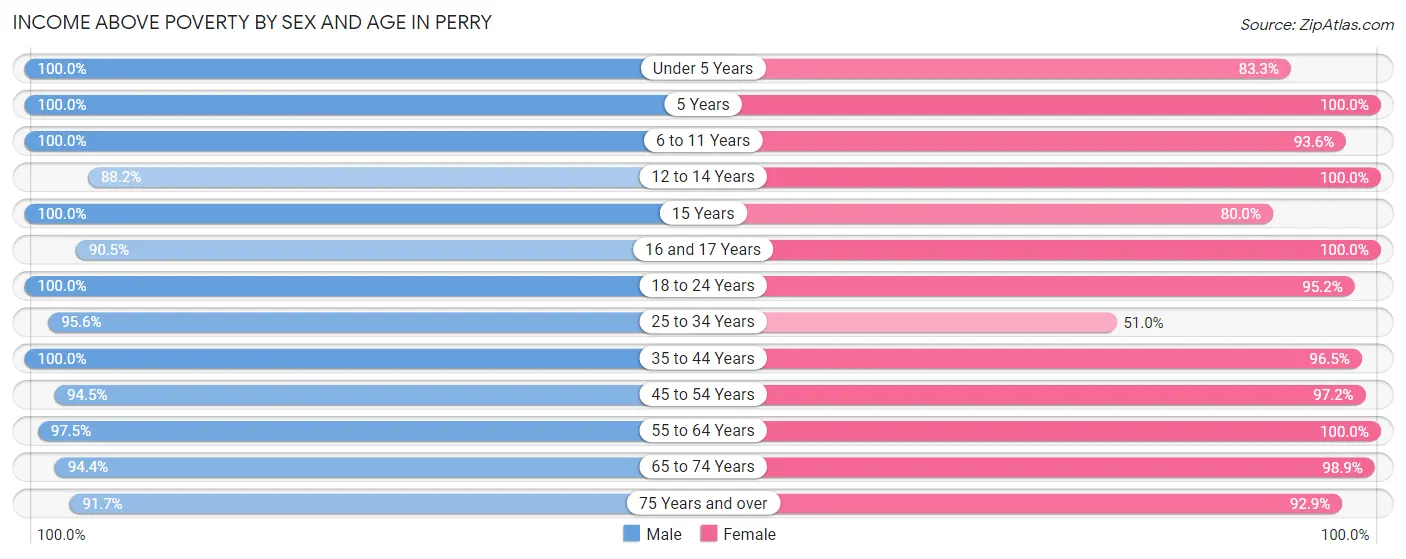
| Age Bracket | Male | Female |
| Under 5 Years | 84 (100.0%) | 20 (83.3%) |
| 5 Years | 6 (100.0%) | 26 (100.0%) |
| 6 to 11 Years | 37 (100.0%) | 73 (93.6%) |
| 12 to 14 Years | 30 (88.2%) | 36 (100.0%) |
| 15 Years | 7 (100.0%) | 12 (80.0%) |
| 16 and 17 Years | 19 (90.5%) | 12 (100.0%) |
| 18 to 24 Years | 48 (100.0%) | 59 (95.2%) |
| 25 to 34 Years | 109 (95.6%) | 52 (51.0%) |
| 35 to 44 Years | 70 (100.0%) | 110 (96.5%) |
| 45 to 54 Years | 86 (94.5%) | 69 (97.2%) |
| 55 to 64 Years | 119 (97.5%) | 104 (100.0%) |
| 65 to 74 Years | 67 (94.4%) | 90 (98.9%) |
| 75 Years and over | 44 (91.7%) | 39 (92.9%) |
| Total | 726 (96.4%) | 702 (90.3%) |
Income Below Poverty Among Married-Couple Families in Perry
The poverty statistics for married-couple families in Perry show that 2.0% or 7 of the total 358 families live below the poverty line. Families with 3 or 4 children have the highest poverty rate of 10.8%, comprising of 4 families. On the other hand, families with 1 or 2 children have the lowest poverty rate of 0.0%, which includes 0 families.
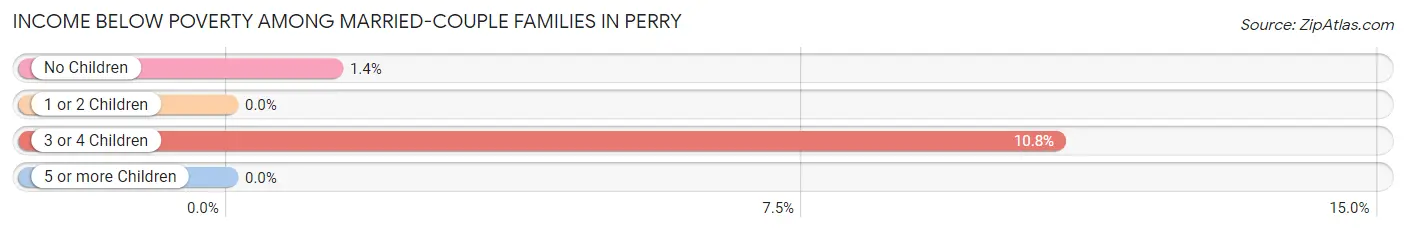
| Children | Above Poverty | Below Poverty |
| No Children | 216 (98.6%) | 3 (1.4%) |
| 1 or 2 Children | 97 (100.0%) | 0 (0.0%) |
| 3 or 4 Children | 33 (89.2%) | 4 (10.8%) |
| 5 or more Children | 5 (100.0%) | 0 (0.0%) |
| Total | 351 (98.0%) | 7 (2.0%) |
Income Below Poverty Among Single-Parent Households in Perry
| Children | Single Father | Single Mother |
| No Children | 0 (0.0%) | 0 (0.0%) |
| 1 or 2 Children | 0 (0.0%) | 0 (0.0%) |
| 3 or 4 Children | 0 (0.0%) | 0 (0.0%) |
| 5 or more Children | 0 (0.0%) | 0 (0.0%) |
| Total | 0 (0.0%) | 0 (0.0%) |
Income Below Poverty Among Married-Couple vs Single-Parent Households in Perry
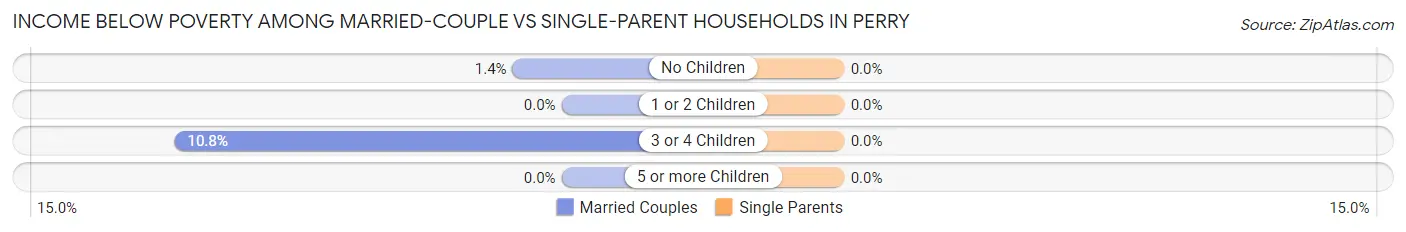
| Children | Married-Couple Families | Single-Parent Households |
| No Children | 3 (1.4%) | 0 (0.0%) |
| 1 or 2 Children | 0 (0.0%) | 0 (0.0%) |
| 3 or 4 Children | 4 (10.8%) | 0 (0.0%) |
| 5 or more Children | 0 (0.0%) | 0 (0.0%) |
| Total | 7 (2.0%) | 0 (0.0%) |
Race in Perry
The most populous races in Perry are White / Caucasian (1,491 | 94.5%), Hispanic or Latino (96 | 6.1%), and Two or more Races (64 | 4.1%).
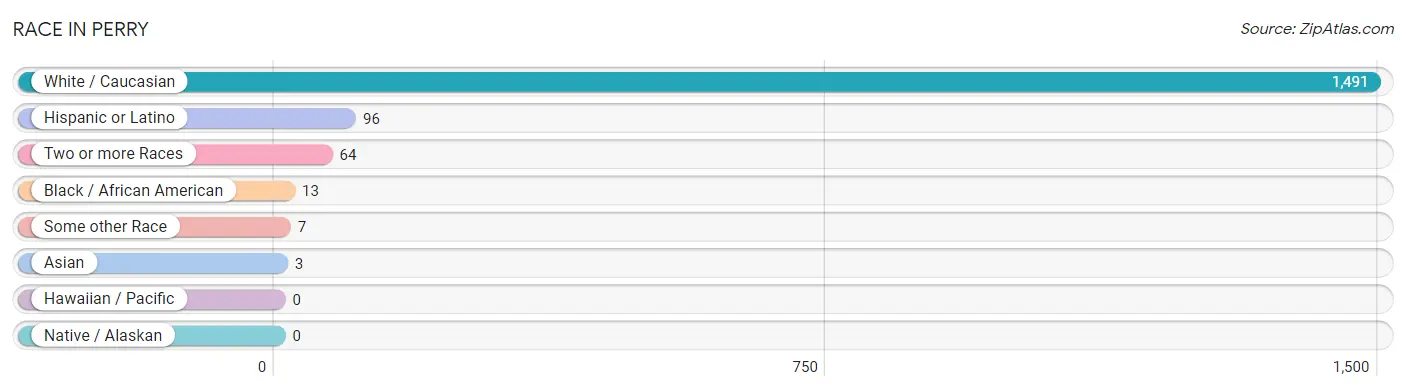
| Race | # Population | % Population |
| Asian | 3 | 0.2% |
| Black / African American | 13 | 0.8% |
| Hawaiian / Pacific | 0 | 0.0% |
| Hispanic or Latino | 96 | 6.1% |
| Native / Alaskan | 0 | 0.0% |
| White / Caucasian | 1,491 | 94.5% |
| Two or more Races | 64 | 4.1% |
| Some other Race | 7 | 0.4% |
| Total | 1,578 | 100.0% |
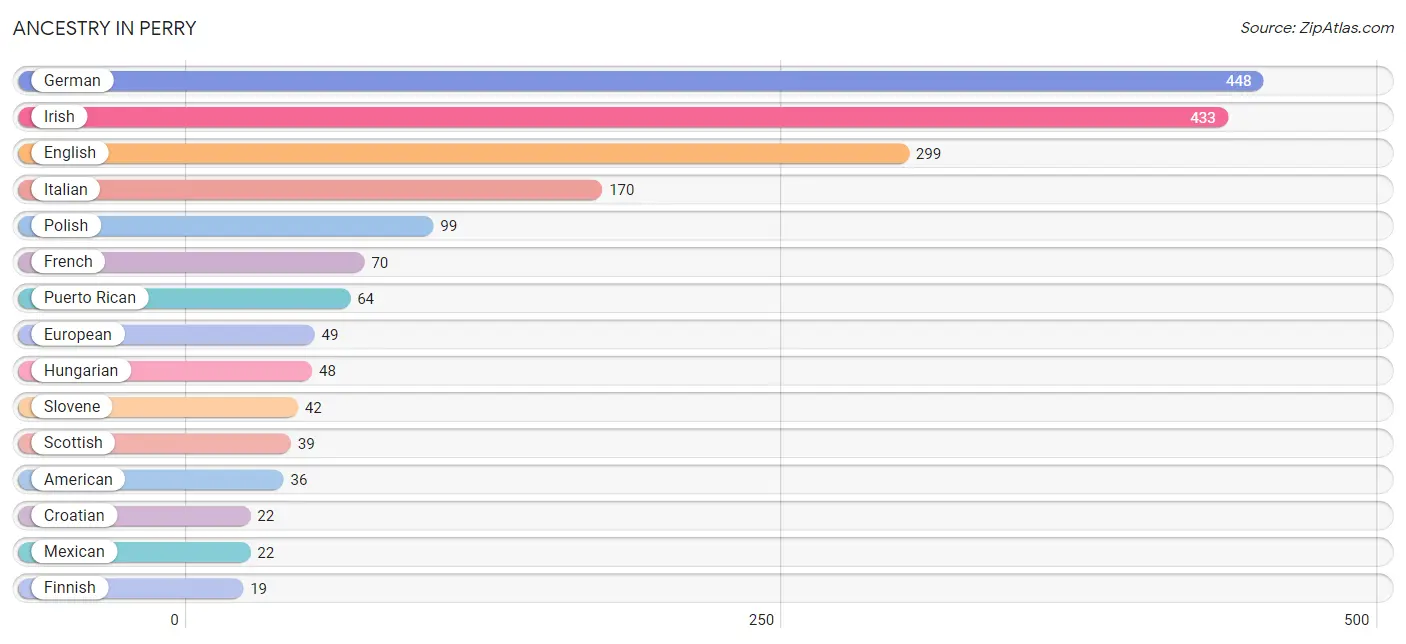
Ancestry in Perry
The most populous ancestries reported in Perry are German (448 | 28.4%), Irish (433 | 27.4%), English (299 | 19.0%), Italian (170 | 10.8%), and Polish (99 | 6.3%), together accounting for 91.8% of all Perry residents.
| Ancestry | # Population | % Population |
| American | 36 | 2.3% |
| Arab | 1 | 0.1% |
| Blackfeet | 8 | 0.5% |
| British | 3 | 0.2% |
| Canadian | 3 | 0.2% |
| Cherokee | 2 | 0.1% |
| Croatian | 22 | 1.4% |
| Cuban | 10 | 0.6% |
| Czech | 11 | 0.7% |
| Czechoslovakian | 3 | 0.2% |
| Dutch | 18 | 1.1% |
| Eastern European | 3 | 0.2% |
| English | 299 | 19.0% |
| European | 49 | 3.1% |
| Finnish | 19 | 1.2% |
| French | 70 | 4.4% |
| French Canadian | 4 | 0.3% |
| German | 448 | 28.4% |
| Greek | 11 | 0.7% |
| Hungarian | 48 | 3.0% |
| Irish | 433 | 27.4% |
| Italian | 170 | 10.8% |
| Korean | 3 | 0.2% |
| Lithuanian | 6 | 0.4% |
| Macedonian | 3 | 0.2% |
| Mexican | 22 | 1.4% |
| Norwegian | 3 | 0.2% |
| Polish | 99 | 6.3% |
| Puerto Rican | 64 | 4.1% |
| Romanian | 13 | 0.8% |
| Russian | 17 | 1.1% |
| Scandinavian | 2 | 0.1% |
| Scotch-Irish | 3 | 0.2% |
| Scottish | 39 | 2.5% |
| Sioux | 8 | 0.5% |
| Slovak | 19 | 1.2% |
| Slovene | 42 | 2.7% |
| Swedish | 11 | 0.7% |
| Swiss | 2 | 0.1% |
| Syrian | 1 | 0.1% |
| Welsh | 5 | 0.3% | View All 41 Rows |
Immigrants in Perry
The most numerous immigrant groups reported in Perry came from Central America (7 | 0.4%), Latin America (7 | 0.4%), Mexico (7 | 0.4%), Europe (4 | 0.3%), and Asia (3 | 0.2%), together accounting for 1.8% of all Perry residents.
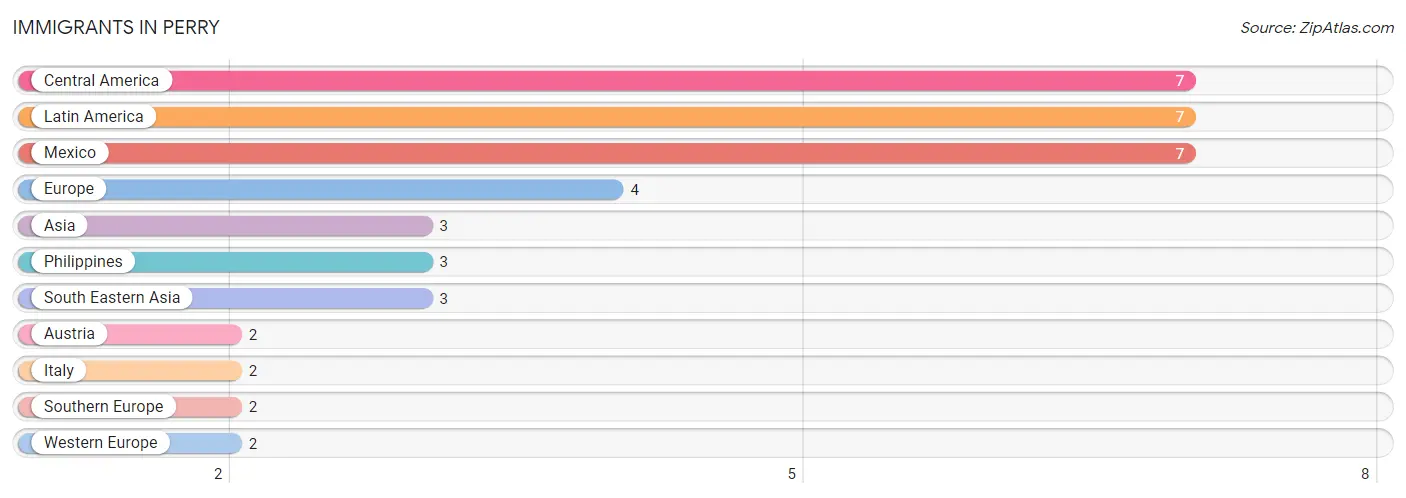
| Immigration Origin | # Population | % Population |
| Asia | 3 | 0.2% |
| Austria | 2 | 0.1% |
| Central America | 7 | 0.4% |
| Europe | 4 | 0.3% |
| Italy | 2 | 0.1% |
| Latin America | 7 | 0.4% |
| Mexico | 7 | 0.4% |
| Philippines | 3 | 0.2% |
| South Eastern Asia | 3 | 0.2% |
| Southern Europe | 2 | 0.1% |
| Western Europe | 2 | 0.1% | View All 11 Rows |
Sex and Age in Perry
Sex and Age in Perry
The most populous age groups in Perry are 10 to 14 Years (91 | 11.4%) for men and 25 to 29 Years (78 | 10.0%) for women.
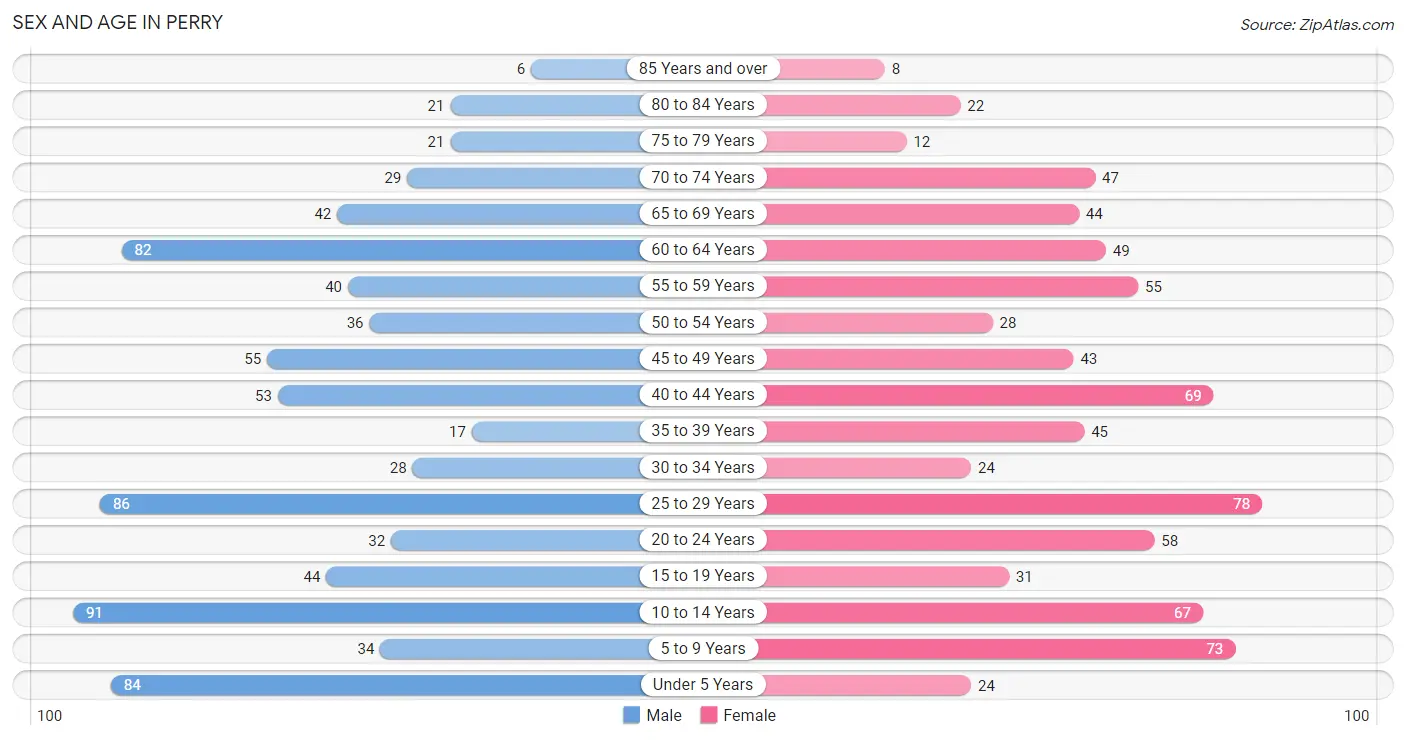
| Age Bracket | Male | Female |
| Under 5 Years | 84 (10.5%) | 24 (3.1%) |
| 5 to 9 Years | 34 (4.2%) | 73 (9.4%) |
| 10 to 14 Years | 91 (11.4%) | 67 (8.6%) |
| 15 to 19 Years | 44 (5.5%) | 31 (4.0%) |
| 20 to 24 Years | 32 (4.0%) | 58 (7.5%) |
| 25 to 29 Years | 86 (10.7%) | 78 (10.0%) |
| 30 to 34 Years | 28 (3.5%) | 24 (3.1%) |
| 35 to 39 Years | 17 (2.1%) | 45 (5.8%) |
| 40 to 44 Years | 53 (6.6%) | 69 (8.9%) |
| 45 to 49 Years | 55 (6.9%) | 43 (5.5%) |
| 50 to 54 Years | 36 (4.5%) | 28 (3.6%) |
| 55 to 59 Years | 40 (5.0%) | 55 (7.1%) |
| 60 to 64 Years | 82 (10.2%) | 49 (6.3%) |
| 65 to 69 Years | 42 (5.2%) | 44 (5.7%) |
| 70 to 74 Years | 29 (3.6%) | 47 (6.0%) |
| 75 to 79 Years | 21 (2.6%) | 12 (1.5%) |
| 80 to 84 Years | 21 (2.6%) | 22 (2.8%) |
| 85 Years and over | 6 (0.7%) | 8 (1.0%) |
| Total | 801 (100.0%) | 777 (100.0%) |
Families and Households in Perry
Median Family Size in Perry
The median family size in Perry is 3.25 persons per family, with single male/father families (15 | 3.7%) accounting for the largest median family size of 3.53 persons per family. On the other hand, married-couple families (358 | 87.7%) represent the smallest median family size with 3.24 persons per family.
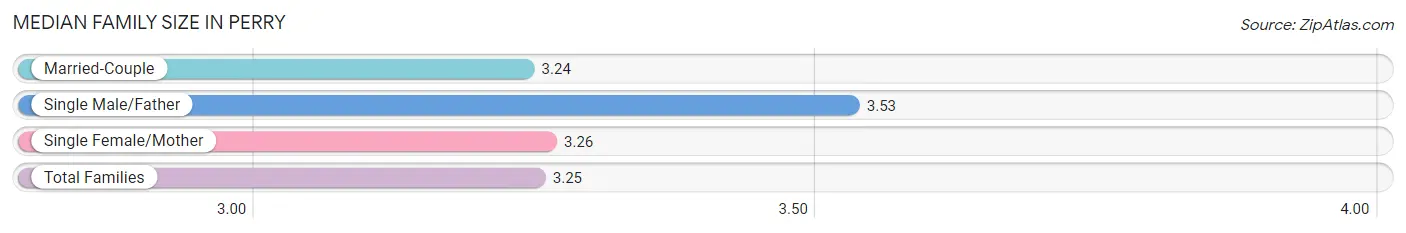
| Family Type | # Families | Family Size |
| Married-Couple | 358 (87.7%) | 3.24 |
| Single Male/Father | 15 (3.7%) | 3.53 |
| Single Female/Mother | 35 (8.6%) | 3.26 |
| Total Families | 408 (100.0%) | 3.25 |
Median Household Size in Perry
The median household size in Perry is 3.08 persons per household, with single female/mother households (35 | 6.9%) accounting for the largest median household size of 4.11 persons per household. non-family households (99 | 19.5%) represent the smallest median household size with 1.12 persons per household.
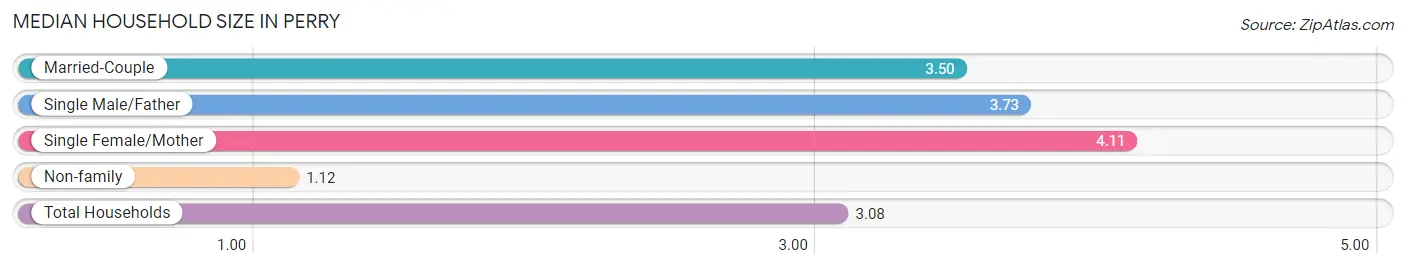
| Household Type | # Households | Household Size |
| Married-Couple | 358 (70.6%) | 3.50 |
| Single Male/Father | 15 (3.0%) | 3.73 |
| Single Female/Mother | 35 (6.9%) | 4.11 |
| Non-family | 99 (19.5%) | 1.12 |
| Total Households | 507 (100.0%) | 3.08 |
Household Size by Marriage Status in Perry
Out of a total of 507 households in Perry, 408 (80.5%) are family households, while 99 (19.5%) are nonfamily households. The most numerous type of family households are 2-person households, comprising 161, and the most common type of nonfamily households are 1-person households, comprising 88.
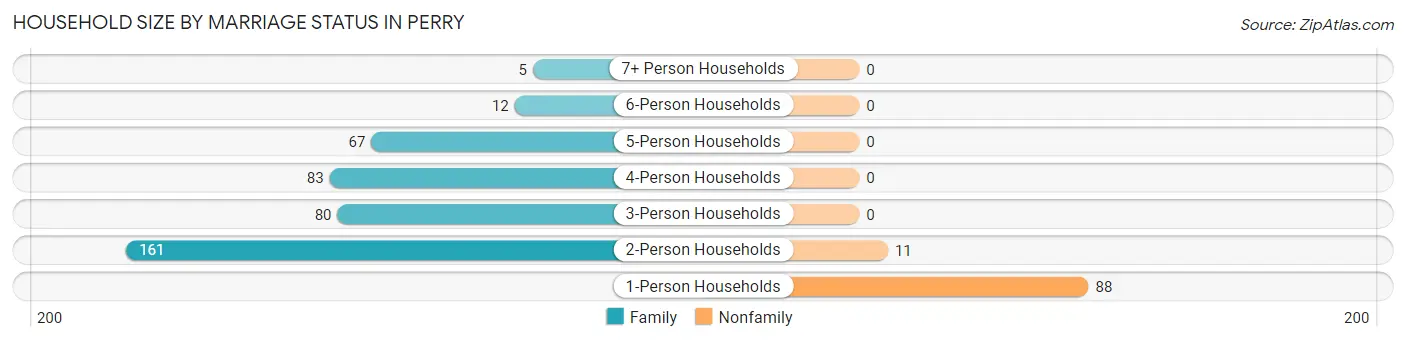
| Household Size | Family Households | Nonfamily Households |
| 1-Person Households | - | 88 (17.4%) |
| 2-Person Households | 161 (31.8%) | 11 (2.2%) |
| 3-Person Households | 80 (15.8%) | 0 (0.0%) |
| 4-Person Households | 83 (16.4%) | 0 (0.0%) |
| 5-Person Households | 67 (13.2%) | 0 (0.0%) |
| 6-Person Households | 12 (2.4%) | 0 (0.0%) |
| 7+ Person Households | 5 (1.0%) | 0 (0.0%) |
| Total | 408 (80.5%) | 99 (19.5%) |
Female Fertility in Perry
Fertility by Age in Perry
Average fertility rate in Perry is 113.0 births per 1,000 women. Women in the age bracket of 20 to 34 years have the highest fertility rate with 194.0 births per 1,000 women. Women in the age bracket of 20 to 34 years acount for 77.5% of all women with births.
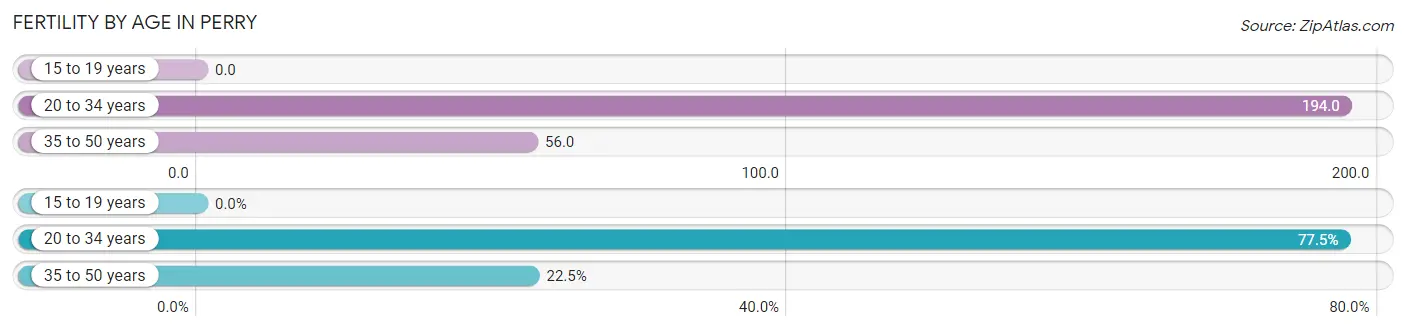
| Age Bracket | Women with Births | Births / 1,000 Women |
| 15 to 19 years | 0 (0.0%) | 0.0 |
| 20 to 34 years | 31 (77.5%) | 194.0 |
| 35 to 50 years | 9 (22.5%) | 56.0 |
| Total | 40 (100.0%) | 113.0 |
Fertility by Age by Marriage Status in Perry
85.0% of women with births (40) in Perry are married. The highest percentage of unmarried women with births falls into 20 to 34 years age bracket with 19.4% of them unmarried at the time of birth, while the lowest percentage of unmarried women with births belong to 35 to 50 years age bracket with 0.0% of them unmarried.
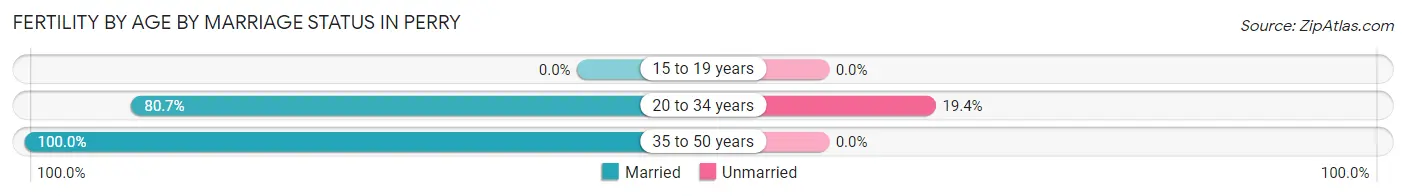
| Age Bracket | Married | Unmarried |
| 15 to 19 years | 0 (0.0%) | 0 (0.0%) |
| 20 to 34 years | 25 (80.6%) | 6 (19.4%) |
| 35 to 50 years | 9 (100.0%) | 0 (0.0%) |
| Total | 34 (85.0%) | 6 (15.0%) |
Fertility by Education in Perry
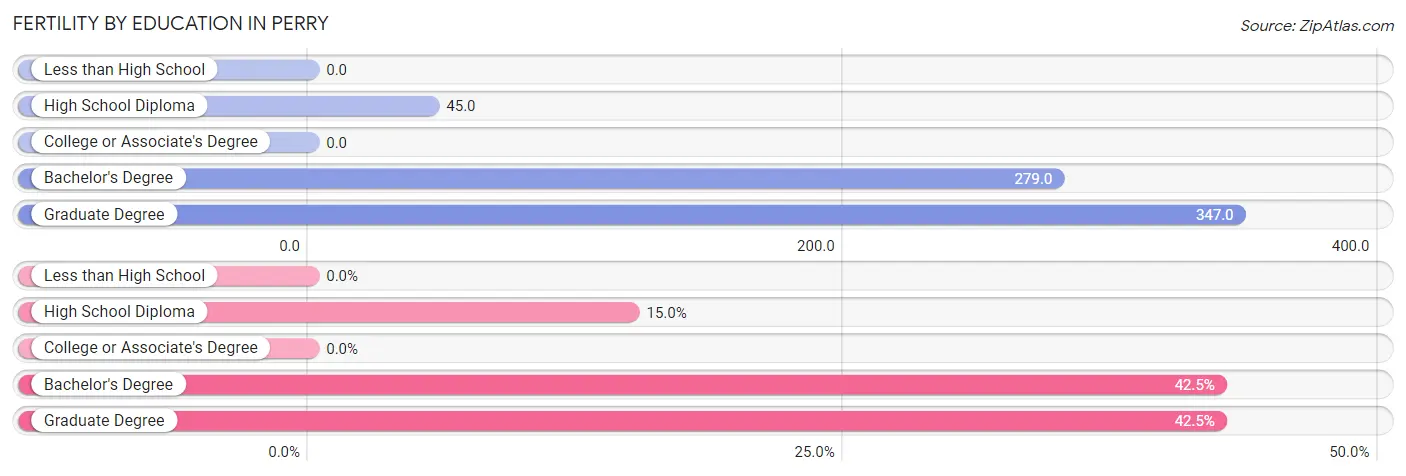
| Educational Attainment | Women with Births | Births / 1,000 Women |
| Less than High School | 0 (0.0%) | 0.0 |
| High School Diploma | 6 (15.0%) | 45.0 |
| College or Associate's Degree | 0 (0.0%) | 0.0 |
| Bachelor's Degree | 17 (42.5%) | 279.0 |
| Graduate Degree | 17 (42.5%) | 347.0 |
| Total | 40 (100.0%) | 113.0 |
Fertility by Education by Marriage Status in Perry
15.0% of women with births in Perry are unmarried. Women with the educational attainment of high school diploma are most likely to be married with 100.0% of them married at childbirth, while women with the educational attainment of bachelor's degree are least likely to be married with 35.3% of them unmarried at childbirth.
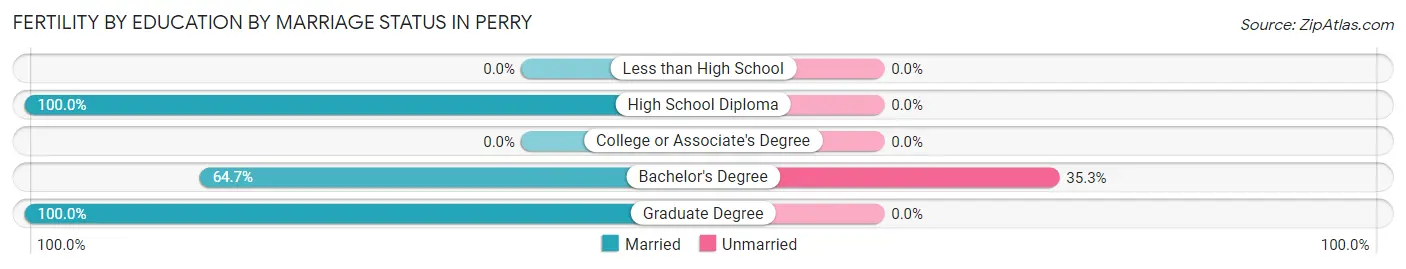
| Educational Attainment | Married | Unmarried |
| Less than High School | 0 (0.0%) | 0 (0.0%) |
| High School Diploma | 6 (100.0%) | 0 (0.0%) |
| College or Associate's Degree | 0 (0.0%) | 0 (0.0%) |
| Bachelor's Degree | 11 (64.7%) | 6 (35.3%) |
| Graduate Degree | 17 (100.0%) | 0 (0.0%) |
| Total | 34 (85.0%) | 6 (15.0%) |
Employment Characteristics in Perry
Employment by Class of Employer in Perry
Among the 760 employed individuals in Perry, private company employees (563 | 74.1%), local government employees (102 | 13.4%), and not-for-profit organizations (41 | 5.4%) make up the most common classes of employment.
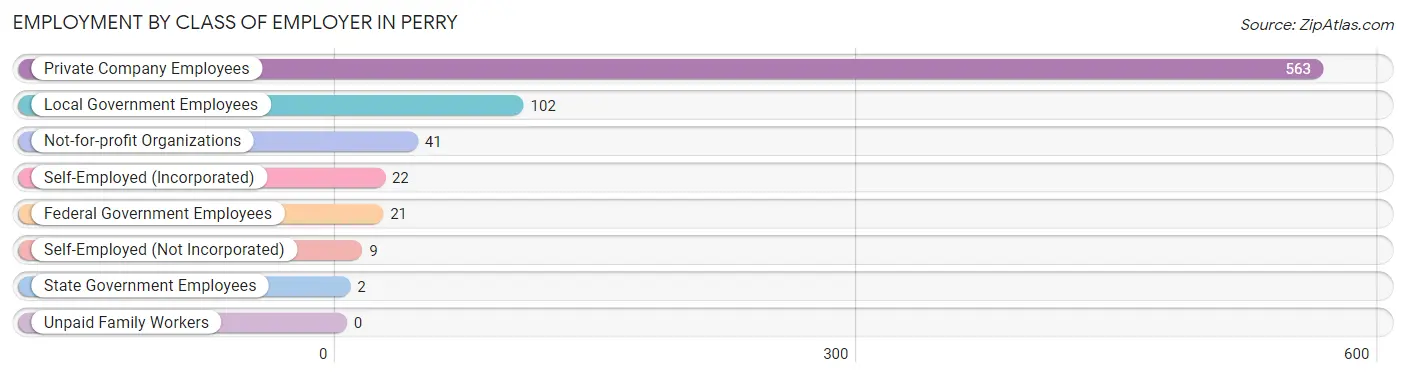
| Employer Class | # Employees | % Employees |
| Private Company Employees | 563 | 74.1% |
| Self-Employed (Incorporated) | 22 | 2.9% |
| Self-Employed (Not Incorporated) | 9 | 1.2% |
| Not-for-profit Organizations | 41 | 5.4% |
| Local Government Employees | 102 | 13.4% |
| State Government Employees | 2 | 0.3% |
| Federal Government Employees | 21 | 2.8% |
| Unpaid Family Workers | 0 | 0.0% |
| Total | 760 | 100.0% |
Employment Status by Age in Perry
According to the labor force statistics for Perry, out of the total population over 16 years of age (1,183), 67.2% or 795 individuals are in the labor force, with 2.5% or 20 of them unemployed. The age group with the highest labor force participation rate is 35 to 44 years, with 92.9% or 171 individuals in the labor force. Within the labor force, the 16 to 19 years age range has the highest percentage of unemployed individuals, with 22.7% or 5 of them being unemployed.
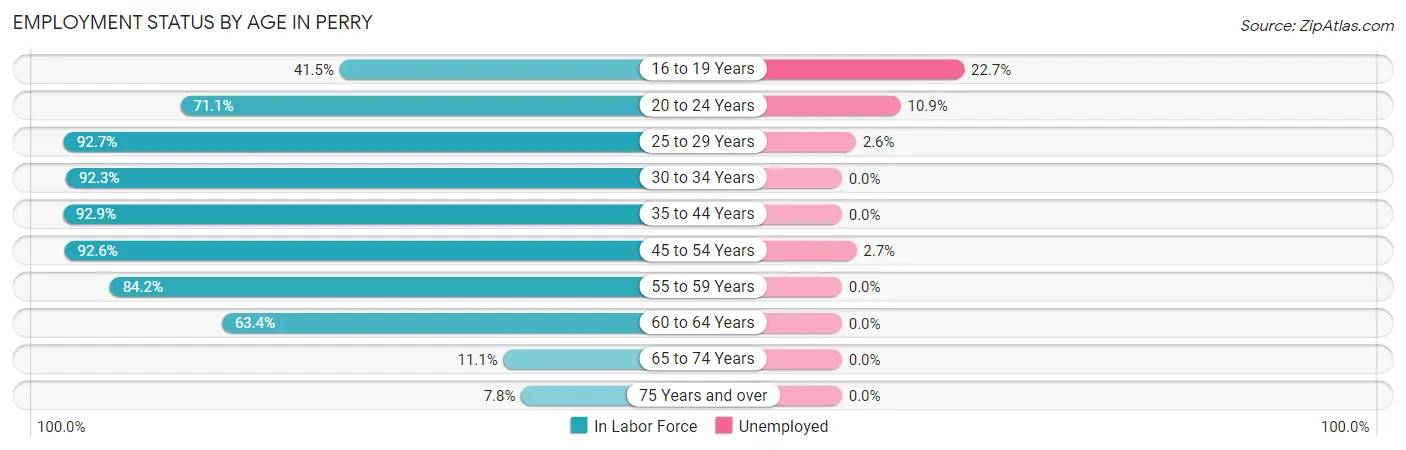
| Age Bracket | In Labor Force | Unemployed |
| 16 to 19 Years | 22 (41.5%) | 5 (22.7%) |
| 20 to 24 Years | 64 (71.1%) | 7 (10.9%) |
| 25 to 29 Years | 152 (92.7%) | 4 (2.6%) |
| 30 to 34 Years | 48 (92.3%) | 0 (0.0%) |
| 35 to 44 Years | 171 (92.9%) | 0 (0.0%) |
| 45 to 54 Years | 150 (92.6%) | 4 (2.7%) |
| 55 to 59 Years | 80 (84.2%) | 0 (0.0%) |
| 60 to 64 Years | 83 (63.4%) | 0 (0.0%) |
| 65 to 74 Years | 18 (11.1%) | 0 (0.0%) |
| 75 Years and over | 7 (7.8%) | 0 (0.0%) |
| Total | 795 (67.2%) | 20 (2.5%) |
Employment Status by Educational Attainment in Perry
According to labor force statistics for Perry, 86.8% of individuals (684) out of the total population between 25 and 64 years of age (788) are in the labor force, with 1.2% or 8 of them being unemployed. The group with the highest labor force participation rate are those with the educational attainment of bachelor's degree or higher, with 91.7% or 198 individuals in the labor force. Within the labor force, individuals with bachelor's degree or higher education have the highest percentage of unemployment, with 2.0% or 4 of them being unemployed.
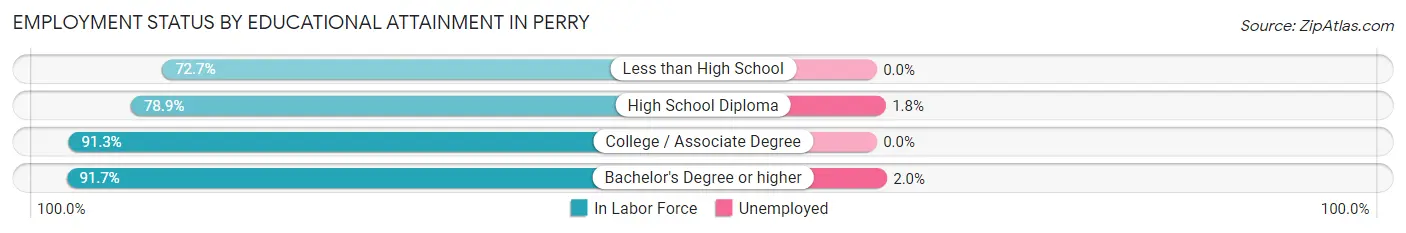
| Educational Attainment | In Labor Force | Unemployed |
| Less than High School | 8 (72.7%) | 0 (0.0%) |
| High School Diploma | 217 (78.9%) | 5 (1.8%) |
| College / Associate Degree | 261 (91.3%) | 0 (0.0%) |
| Bachelor's Degree or higher | 198 (91.7%) | 4 (2.0%) |
| Total | 684 (86.8%) | 9 (1.2%) |
Employment Occupations by Sex in Perry
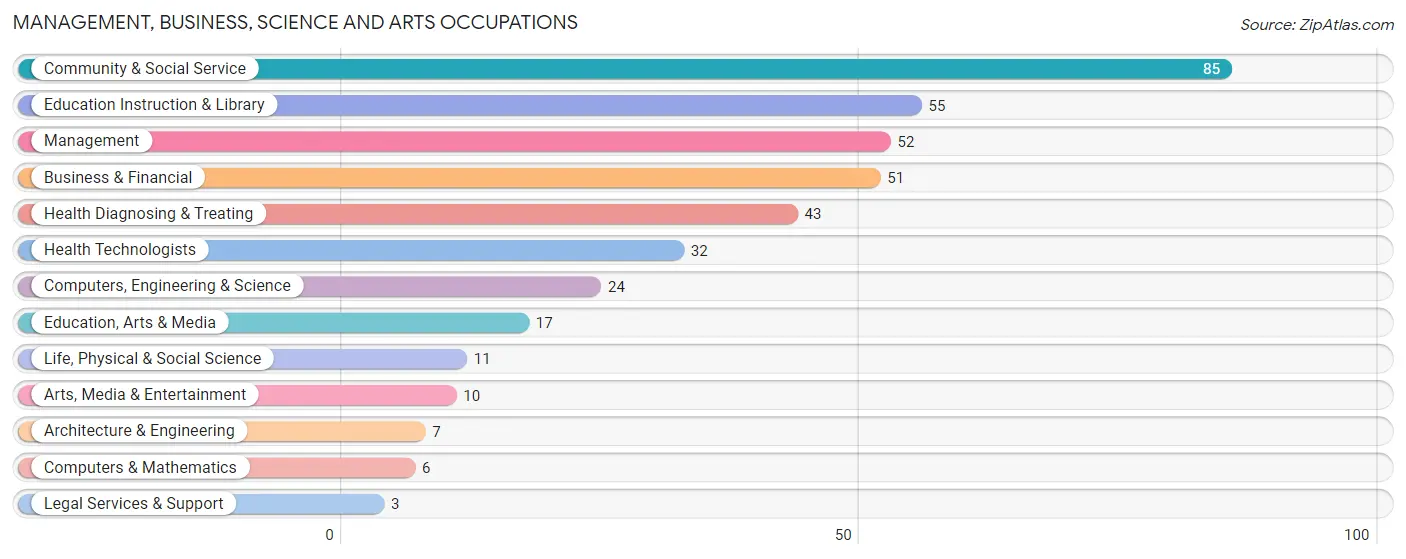
Management, Business, Science and Arts Occupations
The most common Management, Business, Science and Arts occupations in Perry are Community & Social Service (85 | 11.0%), Education Instruction & Library (55 | 7.1%), Management (52 | 6.7%), Business & Financial (51 | 6.6%), and Health Diagnosing & Treating (43 | 5.6%).
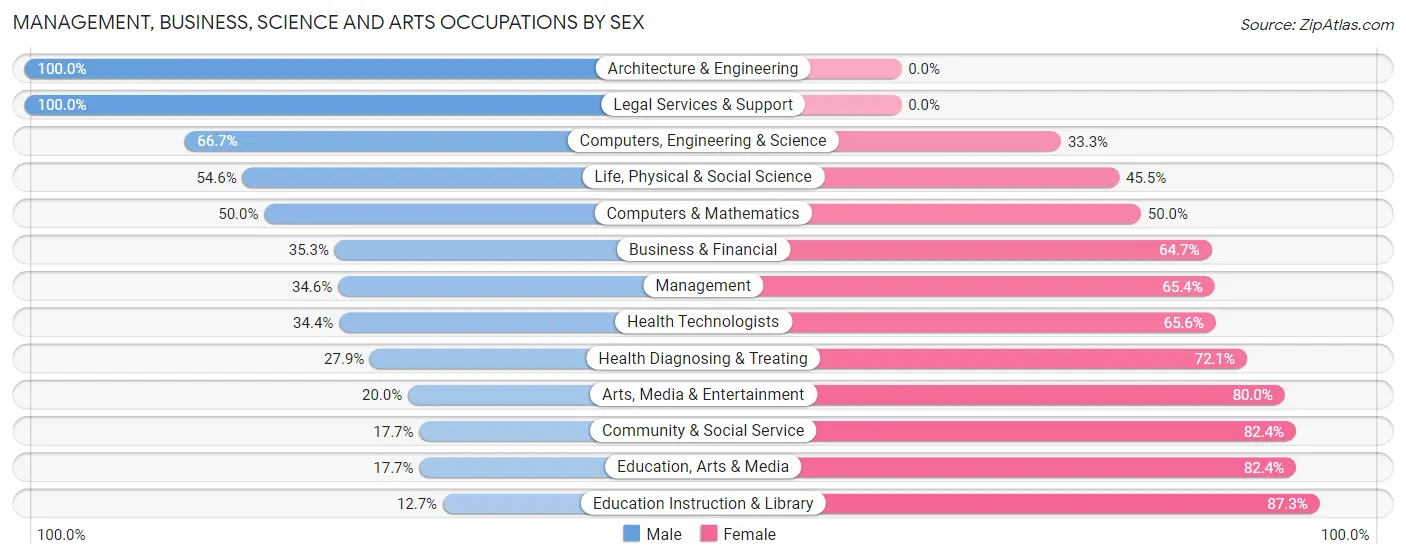
Management, Business, Science and Arts Occupations by Sex
Within the Management, Business, Science and Arts occupations in Perry, the most male-oriented occupations are Architecture & Engineering (100.0%), Legal Services & Support (100.0%), and Computers, Engineering & Science (66.7%), while the most female-oriented occupations are Education Instruction & Library (87.3%), Community & Social Service (82.4%), and Education, Arts & Media (82.4%).
| Occupation | Male | Female |
| Management | 18 (34.6%) | 34 (65.4%) |
| Business & Financial | 18 (35.3%) | 33 (64.7%) |
| Computers, Engineering & Science | 16 (66.7%) | 8 (33.3%) |
| Computers & Mathematics | 3 (50.0%) | 3 (50.0%) |
| Architecture & Engineering | 7 (100.0%) | 0 (0.0%) |
| Life, Physical & Social Science | 6 (54.5%) | 5 (45.5%) |
| Community & Social Service | 15 (17.6%) | 70 (82.4%) |
| Education, Arts & Media | 3 (17.6%) | 14 (82.4%) |
| Legal Services & Support | 3 (100.0%) | 0 (0.0%) |
| Education Instruction & Library | 7 (12.7%) | 48 (87.3%) |
| Arts, Media & Entertainment | 2 (20.0%) | 8 (80.0%) |
| Health Diagnosing & Treating | 12 (27.9%) | 31 (72.1%) |
| Health Technologists | 11 (34.4%) | 21 (65.6%) |
| Total (Category) | 79 (31.0%) | 176 (69.0%) |
| Total (Overall) | 406 (52.4%) | 369 (47.6%) |
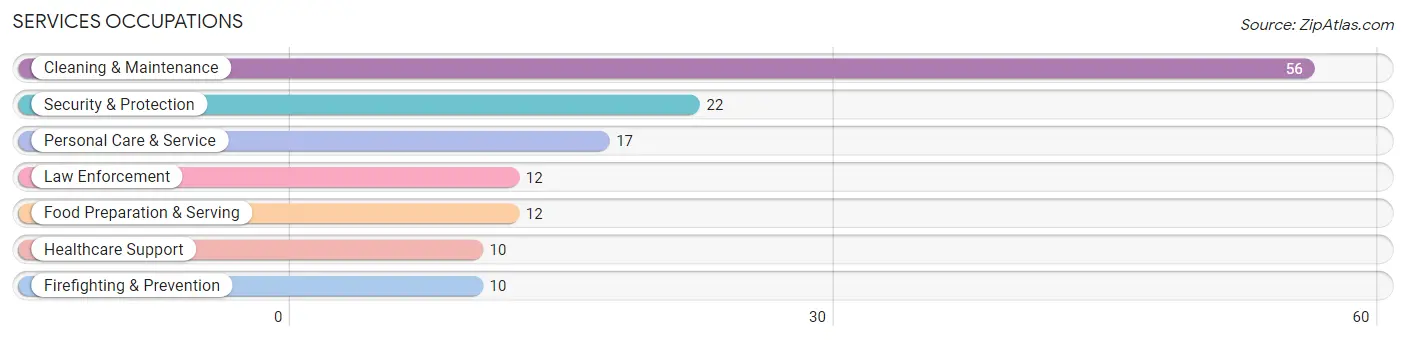
Services Occupations
The most common Services occupations in Perry are Cleaning & Maintenance (56 | 7.2%), Security & Protection (22 | 2.8%), Personal Care & Service (17 | 2.2%), Law Enforcement (12 | 1.5%), and Food Preparation & Serving (12 | 1.5%).
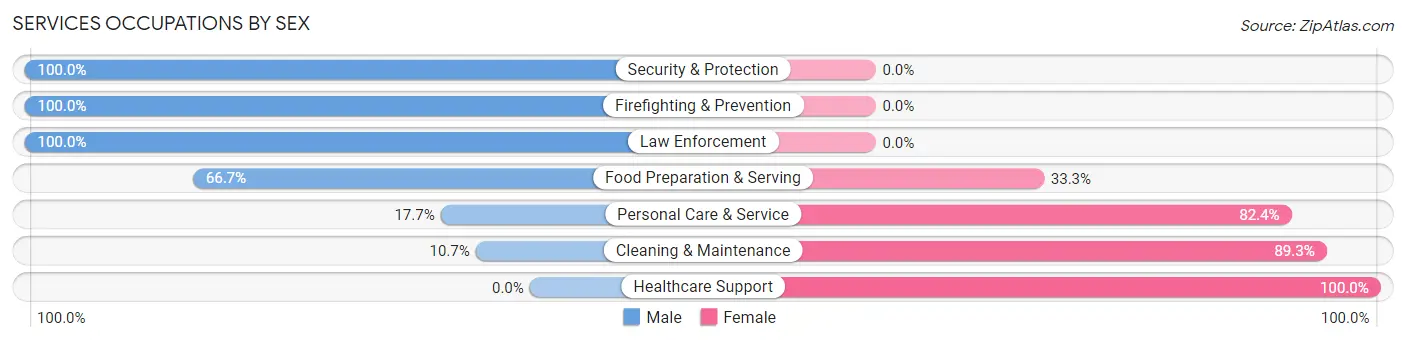
Services Occupations by Sex
Within the Services occupations in Perry, the most male-oriented occupations are Security & Protection (100.0%), Firefighting & Prevention (100.0%), and Law Enforcement (100.0%), while the most female-oriented occupations are Healthcare Support (100.0%), Cleaning & Maintenance (89.3%), and Personal Care & Service (82.4%).
| Occupation | Male | Female |
| Healthcare Support | 0 (0.0%) | 10 (100.0%) |
| Security & Protection | 22 (100.0%) | 0 (0.0%) |
| Firefighting & Prevention | 10 (100.0%) | 0 (0.0%) |
| Law Enforcement | 12 (100.0%) | 0 (0.0%) |
| Food Preparation & Serving | 8 (66.7%) | 4 (33.3%) |
| Cleaning & Maintenance | 6 (10.7%) | 50 (89.3%) |
| Personal Care & Service | 3 (17.6%) | 14 (82.4%) |
| Total (Category) | 39 (33.3%) | 78 (66.7%) |
| Total (Overall) | 406 (52.4%) | 369 (47.6%) |
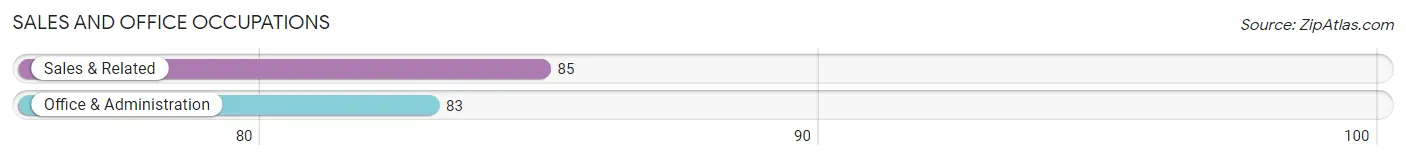
Sales and Office Occupations
The most common Sales and Office occupations in Perry are Sales & Related (85 | 11.0%), and Office & Administration (83 | 10.7%).
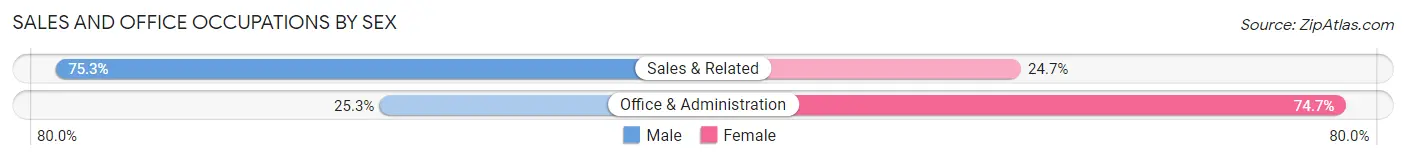
Sales and Office Occupations by Sex
| Occupation | Male | Female |
| Sales & Related | 64 (75.3%) | 21 (24.7%) |
| Office & Administration | 21 (25.3%) | 62 (74.7%) |
| Total (Category) | 85 (50.6%) | 83 (49.4%) |
| Total (Overall) | 406 (52.4%) | 369 (47.6%) |
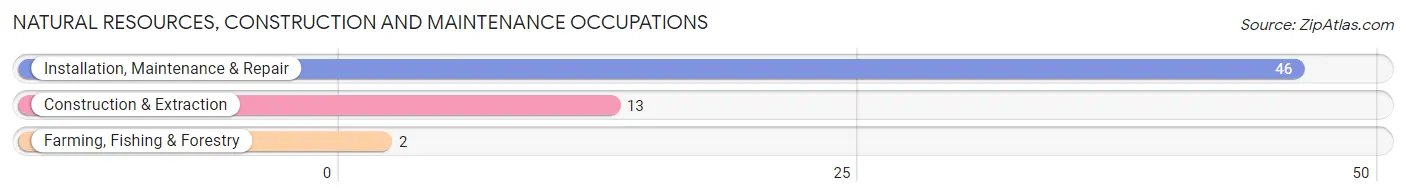
Natural Resources, Construction and Maintenance Occupations
The most common Natural Resources, Construction and Maintenance occupations in Perry are Installation, Maintenance & Repair (46 | 5.9%), Construction & Extraction (13 | 1.7%), and Farming, Fishing & Forestry (2 | 0.3%).
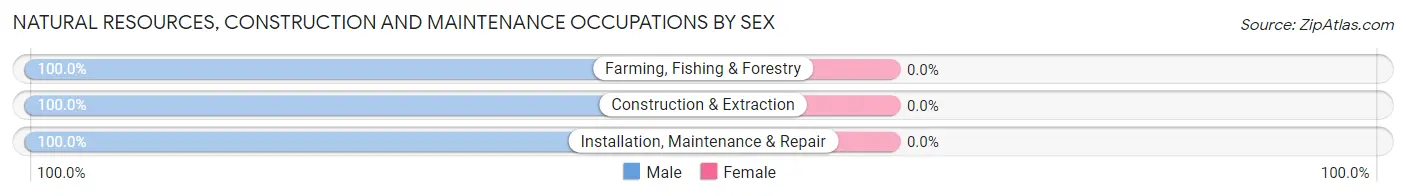
Natural Resources, Construction and Maintenance Occupations by Sex
| Occupation | Male | Female |
| Farming, Fishing & Forestry | 2 (100.0%) | 0 (0.0%) |
| Construction & Extraction | 13 (100.0%) | 0 (0.0%) |
| Installation, Maintenance & Repair | 46 (100.0%) | 0 (0.0%) |
| Total (Category) | 61 (100.0%) | 0 (0.0%) |
| Total (Overall) | 406 (52.4%) | 369 (47.6%) |
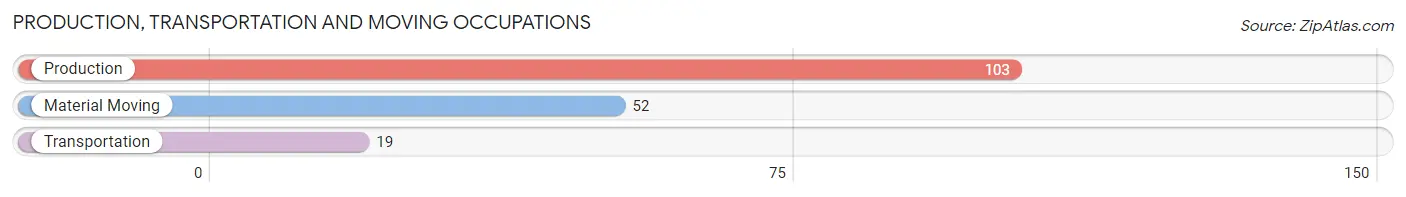
Production, Transportation and Moving Occupations
The most common Production, Transportation and Moving occupations in Perry are Production (103 | 13.3%), Material Moving (52 | 6.7%), and Transportation (19 | 2.5%).
Production, Transportation and Moving Occupations by Sex
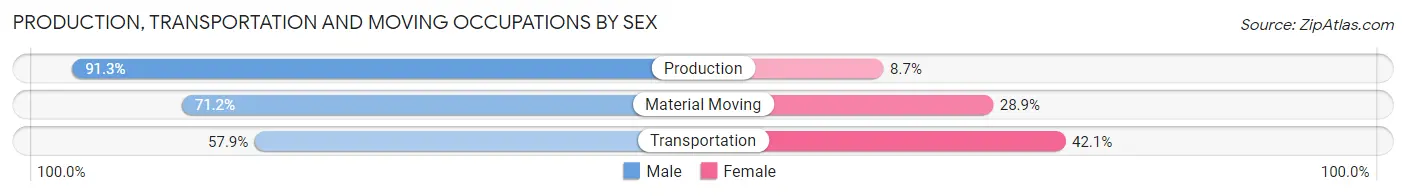
| Occupation | Male | Female |
| Production | 94 (91.3%) | 9 (8.7%) |
| Transportation | 11 (57.9%) | 8 (42.1%) |
| Material Moving | 37 (71.2%) | 15 (28.8%) |
| Total (Category) | 142 (81.6%) | 32 (18.4%) |
| Total (Overall) | 406 (52.4%) | 369 (47.6%) |
Employment Industries by Sex in Perry
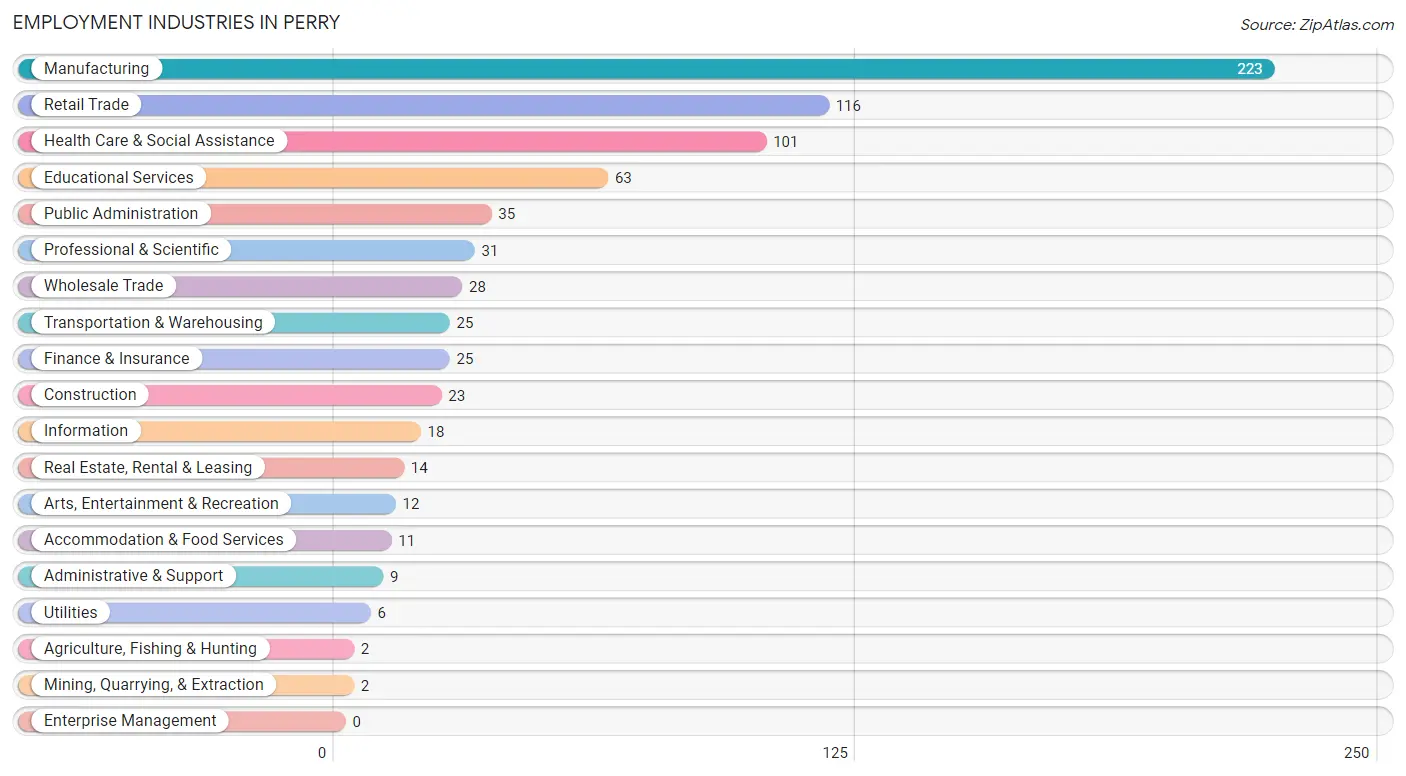
Employment Industries in Perry
The major employment industries in Perry include Manufacturing (223 | 28.8%), Retail Trade (116 | 15.0%), Health Care & Social Assistance (101 | 13.0%), Educational Services (63 | 8.1%), and Public Administration (35 | 4.5%).
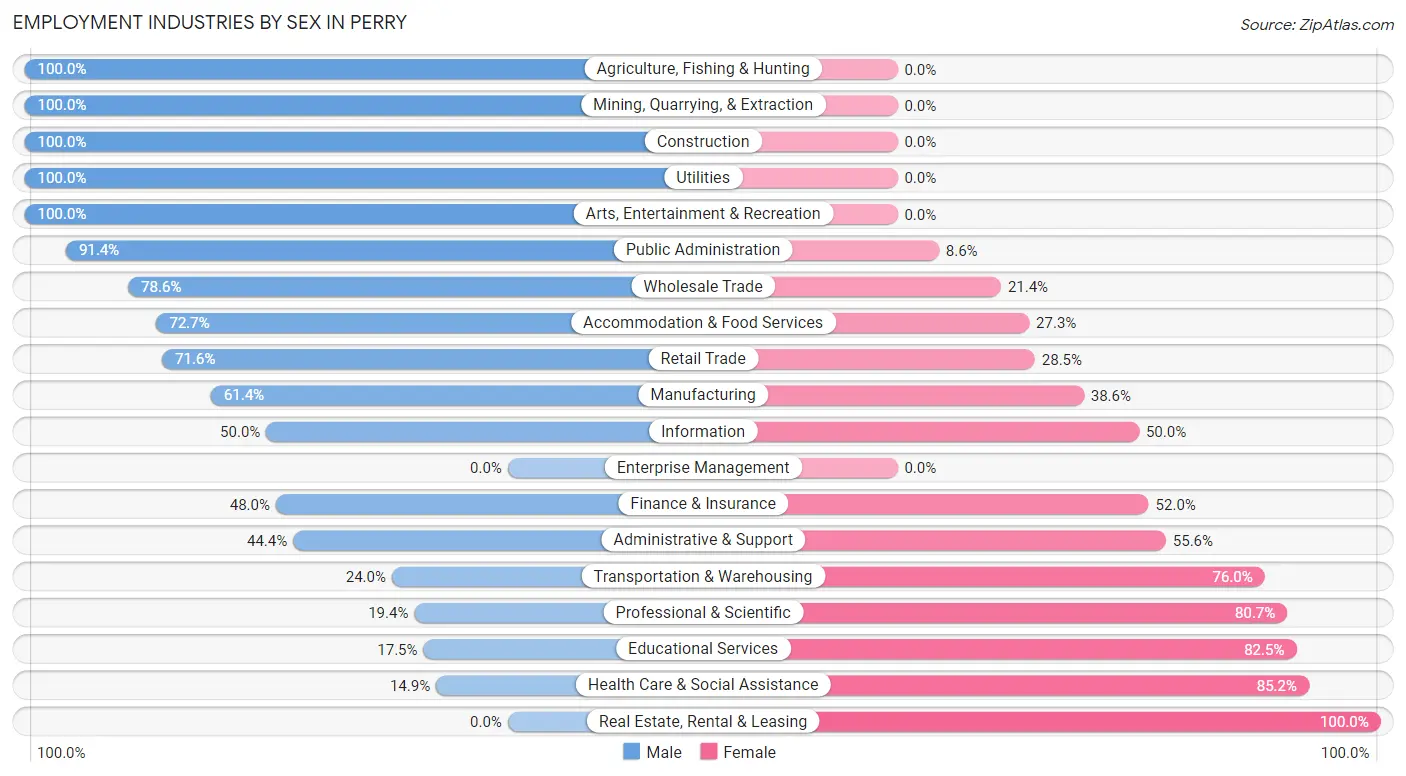
Employment Industries by Sex in Perry
The Perry industries that see more men than women are Agriculture, Fishing & Hunting (100.0%), Mining, Quarrying, & Extraction (100.0%), and Construction (100.0%), whereas the industries that tend to have a higher number of women are Real Estate, Rental & Leasing (100.0%), Health Care & Social Assistance (85.2%), and Educational Services (82.5%).
| Industry | Male | Female |
| Agriculture, Fishing & Hunting | 2 (100.0%) | 0 (0.0%) |
| Mining, Quarrying, & Extraction | 2 (100.0%) | 0 (0.0%) |
| Construction | 23 (100.0%) | 0 (0.0%) |
| Manufacturing | 137 (61.4%) | 86 (38.6%) |
| Wholesale Trade | 22 (78.6%) | 6 (21.4%) |
| Retail Trade | 83 (71.6%) | 33 (28.4%) |
| Transportation & Warehousing | 6 (24.0%) | 19 (76.0%) |
| Utilities | 6 (100.0%) | 0 (0.0%) |
| Information | 9 (50.0%) | 9 (50.0%) |
| Finance & Insurance | 12 (48.0%) | 13 (52.0%) |
| Real Estate, Rental & Leasing | 0 (0.0%) | 14 (100.0%) |
| Professional & Scientific | 6 (19.4%) | 25 (80.6%) |
| Enterprise Management | 0 (0.0%) | 0 (0.0%) |
| Administrative & Support | 4 (44.4%) | 5 (55.6%) |
| Educational Services | 11 (17.5%) | 52 (82.5%) |
| Health Care & Social Assistance | 15 (14.8%) | 86 (85.2%) |
| Arts, Entertainment & Recreation | 12 (100.0%) | 0 (0.0%) |
| Accommodation & Food Services | 8 (72.7%) | 3 (27.3%) |
| Public Administration | 32 (91.4%) | 3 (8.6%) |
| Total | 406 (52.4%) | 369 (47.6%) |
Education in Perry
School Enrollment in Perry
The most common levels of schooling among the 356 students in Perry are middle school (135 | 37.9%), high school (83 | 23.3%), and elementary school (64 | 18.0%).
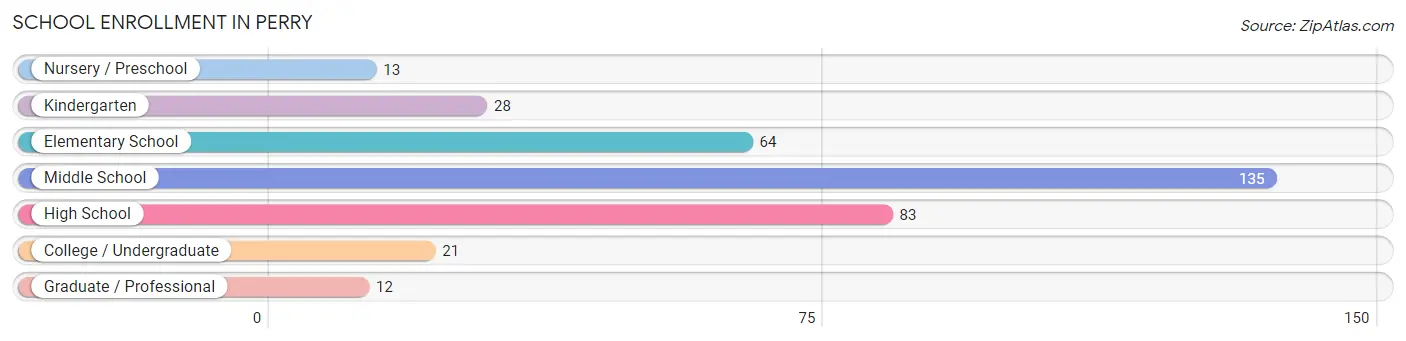
| School Level | # Students | % Students |
| Nursery / Preschool | 13 | 3.6% |
| Kindergarten | 28 | 7.9% |
| Elementary School | 64 | 18.0% |
| Middle School | 135 | 37.9% |
| High School | 83 | 23.3% |
| College / Undergraduate | 21 | 5.9% |
| Graduate / Professional | 12 | 3.4% |
| Total | 356 | 100.0% |
School Enrollment by Age by Funding Source in Perry
Out of a total of 356 students who are enrolled in schools in Perry, 32 (9.0%) attend a private institution, while the remaining 324 (91.0%) are enrolled in public schools. The age group of 35 years and over has the highest likelihood of being enrolled in private schools, with 8 (66.7% in the age bracket) enrolled. Conversely, the age group of 3 to 4 year olds has the lowest likelihood of being enrolled in a private school, with 13 (100.0% in the age bracket) attending a public institution.
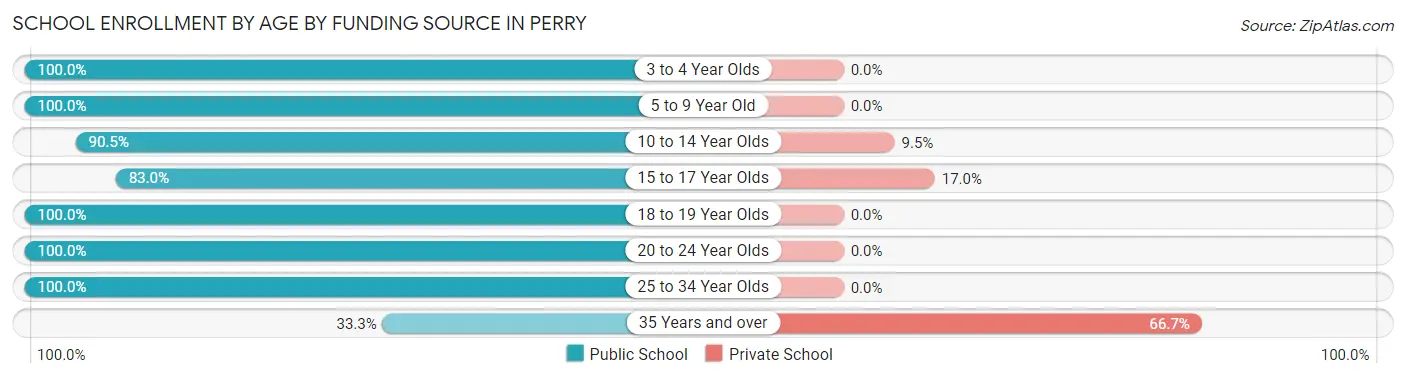
| Age Bracket | Public School | Private School |
| 3 to 4 Year Olds | 13 (100.0%) | 0 (0.0%) |
| 5 to 9 Year Old | 89 (100.0%) | 0 (0.0%) |
| 10 to 14 Year Olds | 143 (90.5%) | 15 (9.5%) |
| 15 to 17 Year Olds | 44 (83.0%) | 9 (17.0%) |
| 18 to 19 Year Olds | 9 (100.0%) | 0 (0.0%) |
| 20 to 24 Year Olds | 19 (100.0%) | 0 (0.0%) |
| 25 to 34 Year Olds | 3 (100.0%) | 0 (0.0%) |
| 35 Years and over | 4 (33.3%) | 8 (66.7%) |
| Total | 324 (91.0%) | 32 (9.0%) |
Educational Attainment by Field of Study in Perry
Education (56 | 21.0%), business (39 | 14.7%), science & technology (35 | 13.2%), social sciences (27 | 10.2%), and arts & humanities (25 | 9.4%) are the most common fields of study among 266 individuals in Perry who have obtained a bachelor's degree or higher.
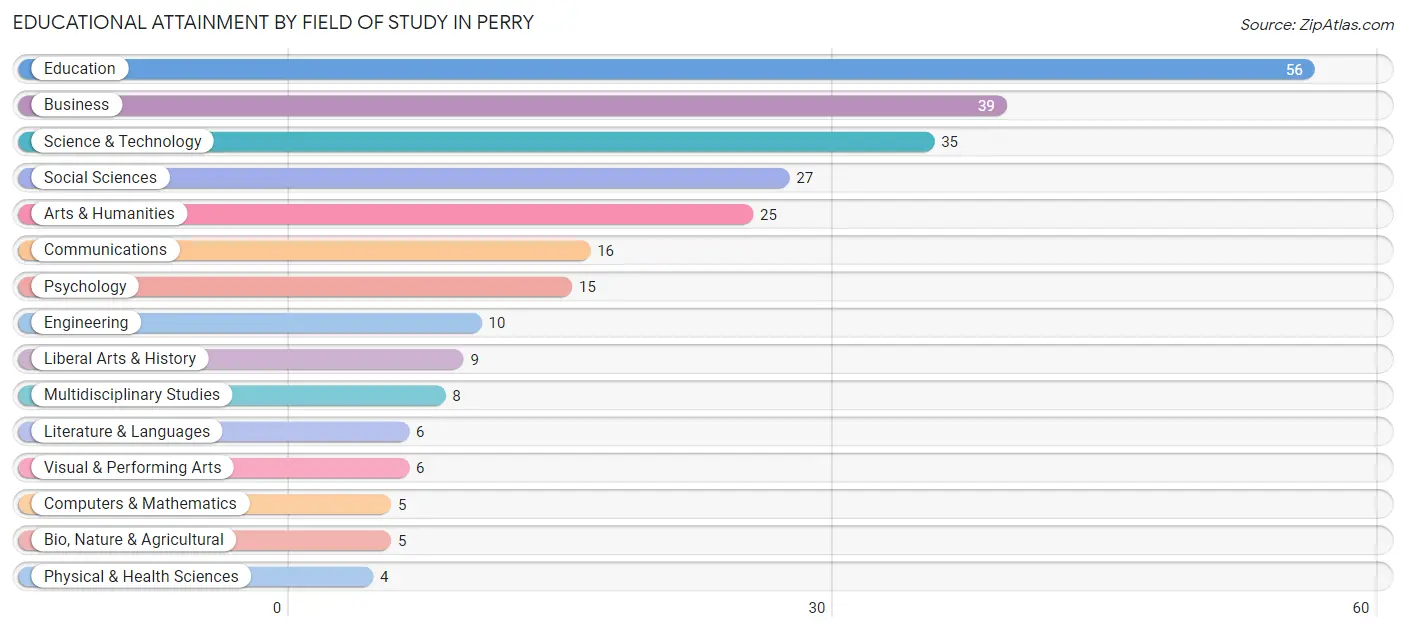
| Field of Study | # Graduates | % Graduates |
| Computers & Mathematics | 5 | 1.9% |
| Bio, Nature & Agricultural | 5 | 1.9% |
| Physical & Health Sciences | 4 | 1.5% |
| Psychology | 15 | 5.6% |
| Social Sciences | 27 | 10.2% |
| Engineering | 10 | 3.8% |
| Multidisciplinary Studies | 8 | 3.0% |
| Science & Technology | 35 | 13.2% |
| Business | 39 | 14.7% |
| Education | 56 | 21.0% |
| Literature & Languages | 6 | 2.3% |
| Liberal Arts & History | 9 | 3.4% |
| Visual & Performing Arts | 6 | 2.3% |
| Communications | 16 | 6.0% |
| Arts & Humanities | 25 | 9.4% |
| Total | 266 | 100.0% |
Transportation & Commute in Perry
Vehicle Availability by Sex in Perry
The most prevalent vehicle ownership categories in Perry are males with 2 vehicles (172, accounting for 44.0%) and females with 2 vehicles (177, making up 47.1%).
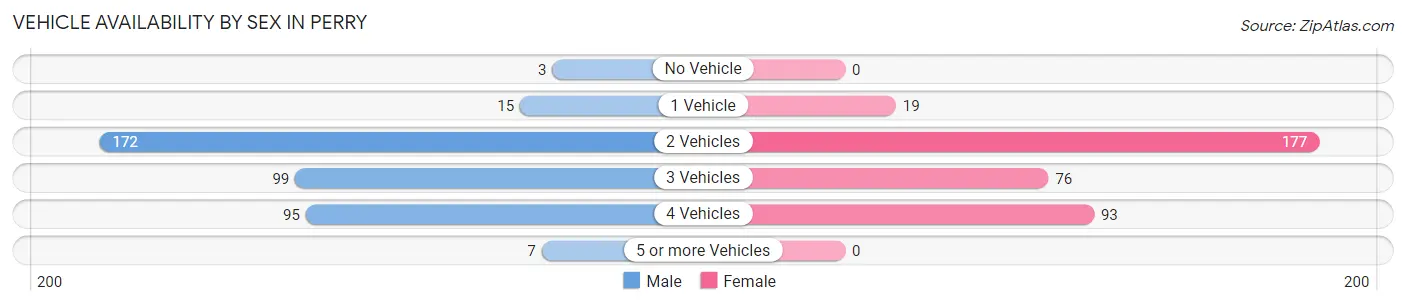
| Vehicles Available | Male | Female |
| No Vehicle | 3 (0.8%) | 0 (0.0%) |
| 1 Vehicle | 15 (3.8%) | 19 (5.2%) |
| 2 Vehicles | 172 (44.0%) | 177 (48.5%) |
| 3 Vehicles | 99 (25.3%) | 76 (20.8%) |
| 4 Vehicles | 95 (24.3%) | 93 (25.5%) |
| 5 or more Vehicles | 7 (1.8%) | 0 (0.0%) |
| Total | 391 (100.0%) | 365 (100.0%) |
Commute Time in Perry
The most frequently occuring commute durations in Perry are 20 to 24 minutes (164 commuters, 22.4%), 15 to 19 minutes (139 commuters, 19.0%), and 30 to 34 minutes (64 commuters, 8.7%).
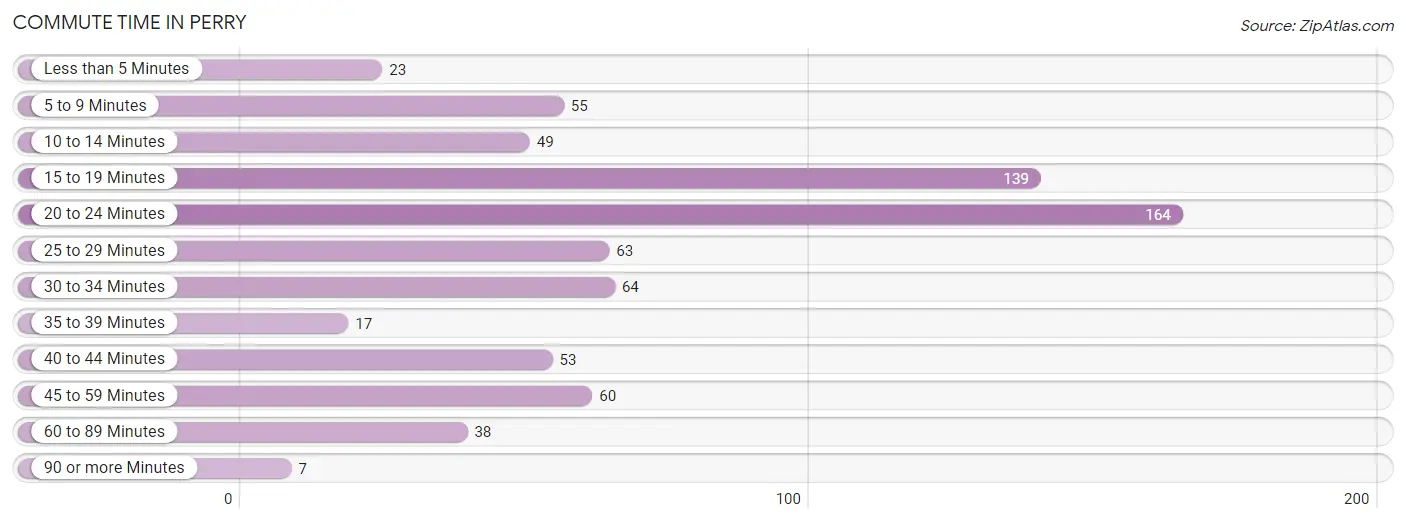
| Commute Time | # Commuters | % Commuters |
| Less than 5 Minutes | 23 | 3.1% |
| 5 to 9 Minutes | 55 | 7.5% |
| 10 to 14 Minutes | 49 | 6.7% |
| 15 to 19 Minutes | 139 | 19.0% |
| 20 to 24 Minutes | 164 | 22.4% |
| 25 to 29 Minutes | 63 | 8.6% |
| 30 to 34 Minutes | 64 | 8.7% |
| 35 to 39 Minutes | 17 | 2.3% |
| 40 to 44 Minutes | 53 | 7.2% |
| 45 to 59 Minutes | 60 | 8.2% |
| 60 to 89 Minutes | 38 | 5.2% |
| 90 or more Minutes | 7 | 1.0% |
Commute Time by Sex in Perry
The most common commute times in Perry are 20 to 24 minutes (111 commuters, 28.4%) for males and 15 to 19 minutes (85 commuters, 24.9%) for females.
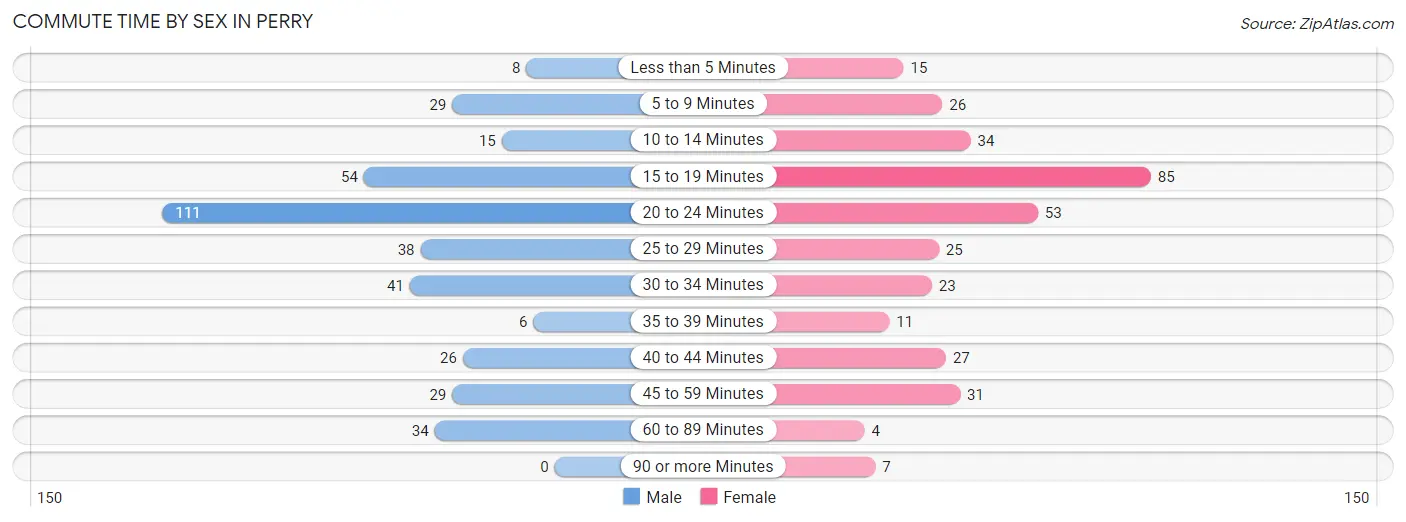
| Commute Time | Male | Female |
| Less than 5 Minutes | 8 (2.1%) | 15 (4.4%) |
| 5 to 9 Minutes | 29 (7.4%) | 26 (7.6%) |
| 10 to 14 Minutes | 15 (3.8%) | 34 (10.0%) |
| 15 to 19 Minutes | 54 (13.8%) | 85 (24.9%) |
| 20 to 24 Minutes | 111 (28.4%) | 53 (15.5%) |
| 25 to 29 Minutes | 38 (9.7%) | 25 (7.3%) |
| 30 to 34 Minutes | 41 (10.5%) | 23 (6.7%) |
| 35 to 39 Minutes | 6 (1.5%) | 11 (3.2%) |
| 40 to 44 Minutes | 26 (6.7%) | 27 (7.9%) |
| 45 to 59 Minutes | 29 (7.4%) | 31 (9.1%) |
| 60 to 89 Minutes | 34 (8.7%) | 4 (1.2%) |
| 90 or more Minutes | 0 (0.0%) | 7 (2.1%) |
Time of Departure to Work by Sex in Perry
The most frequent times of departure to work in Perry are 6:30 AM to 6:59 AM (95, 24.3%) for males and 7:30 AM to 7:59 AM (100, 29.3%) for females.
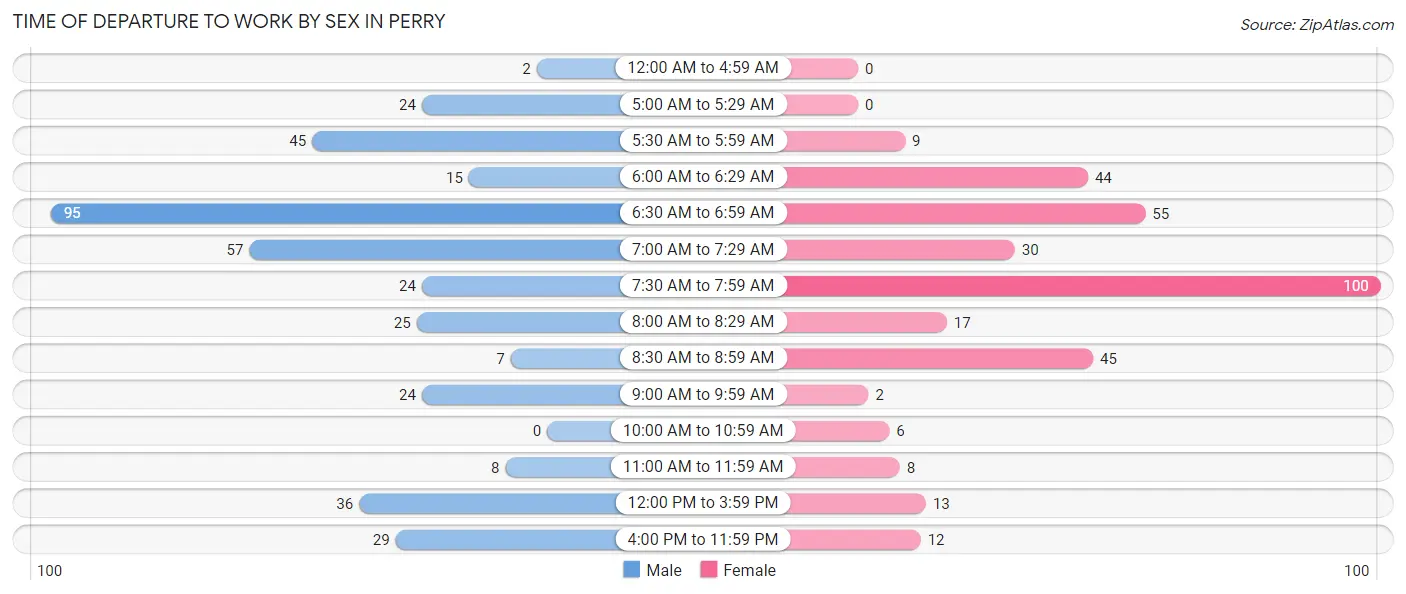
| Time of Departure | Male | Female |
| 12:00 AM to 4:59 AM | 2 (0.5%) | 0 (0.0%) |
| 5:00 AM to 5:29 AM | 24 (6.1%) | 0 (0.0%) |
| 5:30 AM to 5:59 AM | 45 (11.5%) | 9 (2.6%) |
| 6:00 AM to 6:29 AM | 15 (3.8%) | 44 (12.9%) |
| 6:30 AM to 6:59 AM | 95 (24.3%) | 55 (16.1%) |
| 7:00 AM to 7:29 AM | 57 (14.6%) | 30 (8.8%) |
| 7:30 AM to 7:59 AM | 24 (6.1%) | 100 (29.3%) |
| 8:00 AM to 8:29 AM | 25 (6.4%) | 17 (5.0%) |
| 8:30 AM to 8:59 AM | 7 (1.8%) | 45 (13.2%) |
| 9:00 AM to 9:59 AM | 24 (6.1%) | 2 (0.6%) |
| 10:00 AM to 10:59 AM | 0 (0.0%) | 6 (1.8%) |
| 11:00 AM to 11:59 AM | 8 (2.1%) | 8 (2.4%) |
| 12:00 PM to 3:59 PM | 36 (9.2%) | 13 (3.8%) |
| 4:00 PM to 11:59 PM | 29 (7.4%) | 12 (3.5%) |
| Total | 391 (100.0%) | 341 (100.0%) |
Housing Occupancy in Perry
Occupancy by Ownership in Perry
Of the total 507 dwellings in Perry, owner-occupied units account for 462 (91.1%), while renter-occupied units make up 45 (8.9%).
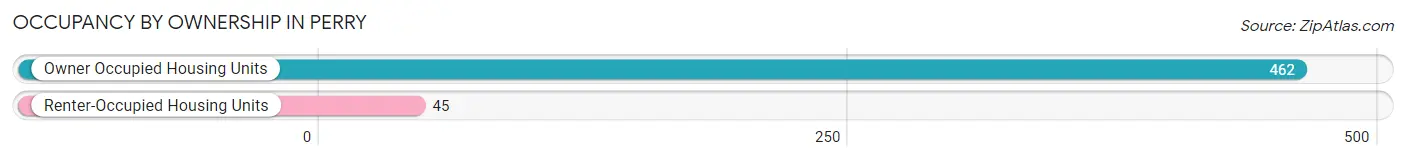
| Occupancy | # Housing Units | % Housing Units |
| Owner Occupied Housing Units | 462 | 91.1% |
| Renter-Occupied Housing Units | 45 | 8.9% |
| Total Occupied Housing Units | 507 | 100.0% |
Occupancy by Household Size in Perry
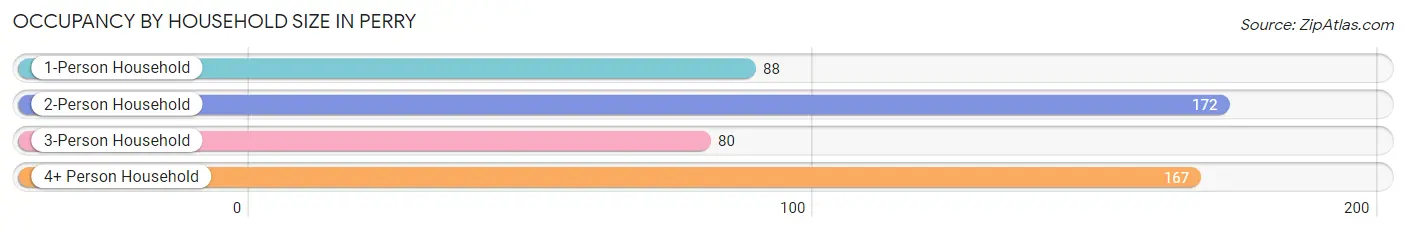
| Household Size | # Housing Units | % Housing Units |
| 1-Person Household | 88 | 17.4% |
| 2-Person Household | 172 | 33.9% |
| 3-Person Household | 80 | 15.8% |
| 4+ Person Household | 167 | 32.9% |
| Total Housing Units | 507 | 100.0% |
Occupancy by Ownership by Household Size in Perry
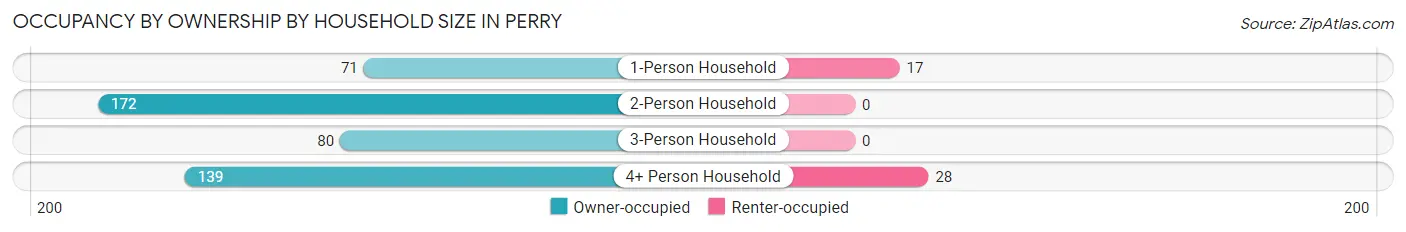
| Household Size | Owner-occupied | Renter-occupied |
| 1-Person Household | 71 (80.7%) | 17 (19.3%) |
| 2-Person Household | 172 (100.0%) | 0 (0.0%) |
| 3-Person Household | 80 (100.0%) | 0 (0.0%) |
| 4+ Person Household | 139 (83.2%) | 28 (16.8%) |
| Total Housing Units | 462 (91.1%) | 45 (8.9%) |
Occupancy by Educational Attainment in Perry
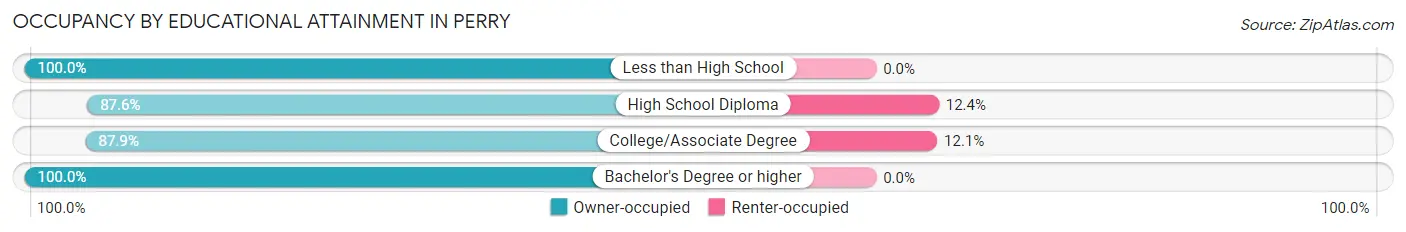
| Household Size | Owner-occupied | Renter-occupied |
| Less than High School | 4 (100.0%) | 0 (0.0%) |
| High School Diploma | 134 (87.6%) | 19 (12.4%) |
| College/Associate Degree | 189 (87.9%) | 26 (12.1%) |
| Bachelor's Degree or higher | 135 (100.0%) | 0 (0.0%) |
Occupancy by Age of Householder in Perry
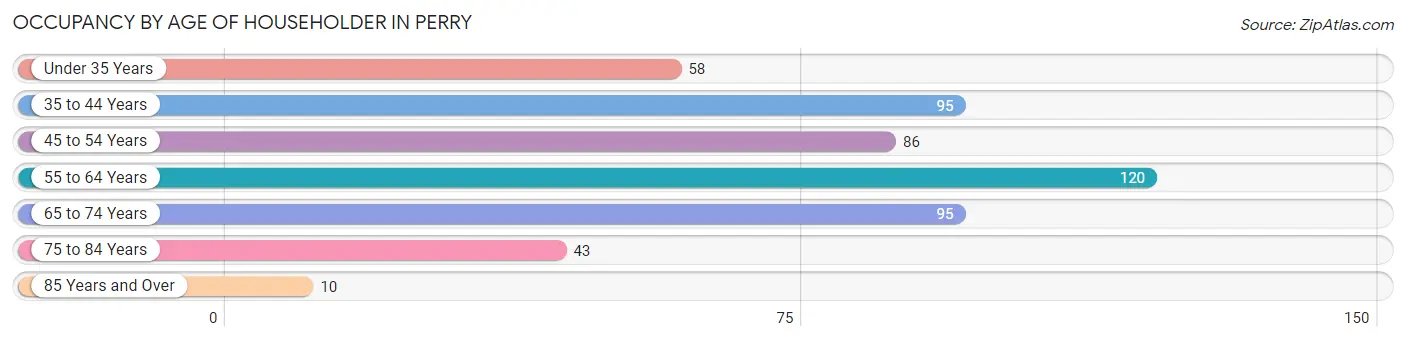
| Age Bracket | # Households | % Households |
| Under 35 Years | 58 | 11.4% |
| 35 to 44 Years | 95 | 18.7% |
| 45 to 54 Years | 86 | 17.0% |
| 55 to 64 Years | 120 | 23.7% |
| 65 to 74 Years | 95 | 18.7% |
| 75 to 84 Years | 43 | 8.5% |
| 85 Years and Over | 10 | 2.0% |
| Total | 507 | 100.0% |
Housing Finances in Perry
Median Income by Occupancy in Perry
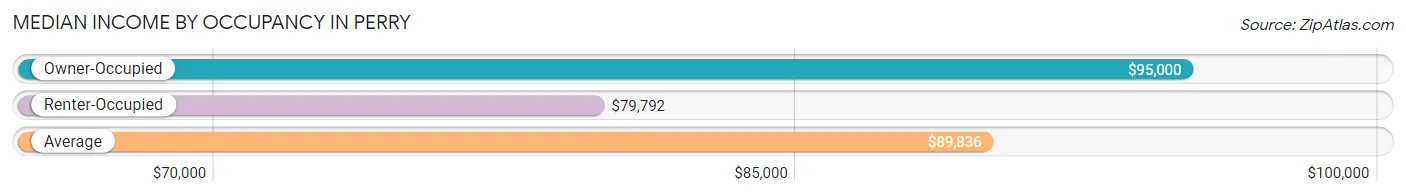
| Occupancy Type | # Households | Median Income |
| Owner-Occupied | 462 (91.1%) | $95,000 |
| Renter-Occupied | 45 (8.9%) | $79,792 |
| Average | 507 (100.0%) | $89,836 |
Occupancy by Householder Income Bracket in Perry
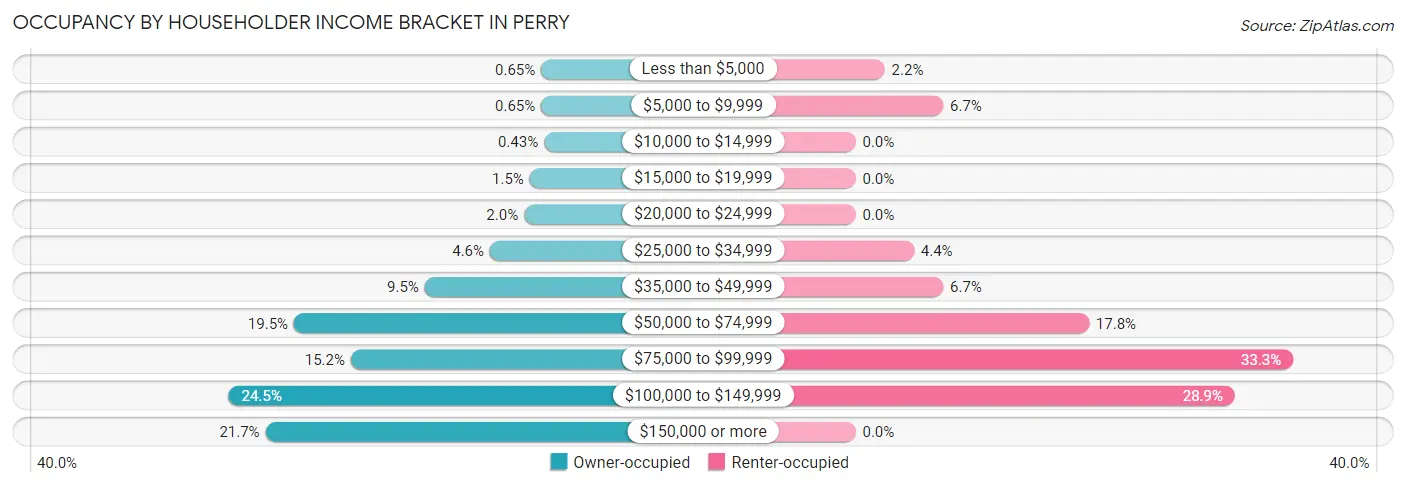
| Income Bracket | Owner-occupied | Renter-occupied |
| Less than $5,000 | 3 (0.6%) | 1 (2.2%) |
| $5,000 to $9,999 | 3 (0.6%) | 3 (6.7%) |
| $10,000 to $14,999 | 2 (0.4%) | 0 (0.0%) |
| $15,000 to $19,999 | 7 (1.5%) | 0 (0.0%) |
| $20,000 to $24,999 | 9 (1.9%) | 0 (0.0%) |
| $25,000 to $34,999 | 21 (4.5%) | 2 (4.4%) |
| $35,000 to $49,999 | 44 (9.5%) | 3 (6.7%) |
| $50,000 to $74,999 | 90 (19.5%) | 8 (17.8%) |
| $75,000 to $99,999 | 70 (15.1%) | 15 (33.3%) |
| $100,000 to $149,999 | 113 (24.5%) | 13 (28.9%) |
| $150,000 or more | 100 (21.6%) | 0 (0.0%) |
| Total | 462 (100.0%) | 45 (100.0%) |
Monthly Housing Cost Tiers in Perry
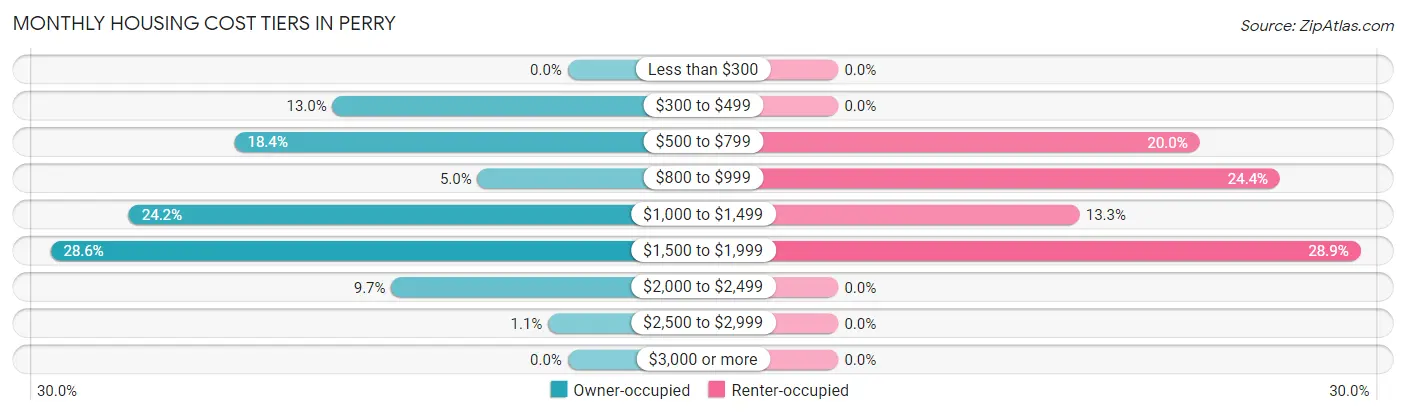
| Monthly Cost | Owner-occupied | Renter-occupied |
| Less than $300 | 0 (0.0%) | 0 (0.0%) |
| $300 to $499 | 60 (13.0%) | 0 (0.0%) |
| $500 to $799 | 85 (18.4%) | 9 (20.0%) |
| $800 to $999 | 23 (5.0%) | 11 (24.4%) |
| $1,000 to $1,499 | 112 (24.2%) | 6 (13.3%) |
| $1,500 to $1,999 | 132 (28.6%) | 13 (28.9%) |
| $2,000 to $2,499 | 45 (9.7%) | 0 (0.0%) |
| $2,500 to $2,999 | 5 (1.1%) | 0 (0.0%) |
| $3,000 or more | 0 (0.0%) | 0 (0.0%) |
| Total | 462 (100.0%) | 45 (100.0%) |
Physical Housing Characteristics in Perry
Housing Structures in Perry
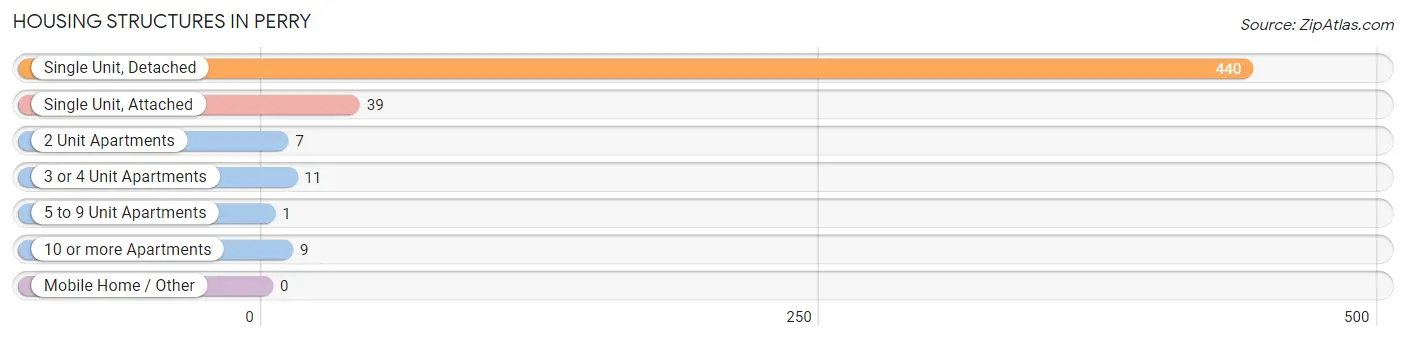
| Structure Type | # Housing Units | % Housing Units |
| Single Unit, Detached | 440 | 86.8% |
| Single Unit, Attached | 39 | 7.7% |
| 2 Unit Apartments | 7 | 1.4% |
| 3 or 4 Unit Apartments | 11 | 2.2% |
| 5 to 9 Unit Apartments | 1 | 0.2% |
| 10 or more Apartments | 9 | 1.8% |
| Mobile Home / Other | 0 | 0.0% |
| Total | 507 | 100.0% |
Housing Structures by Occupancy in Perry
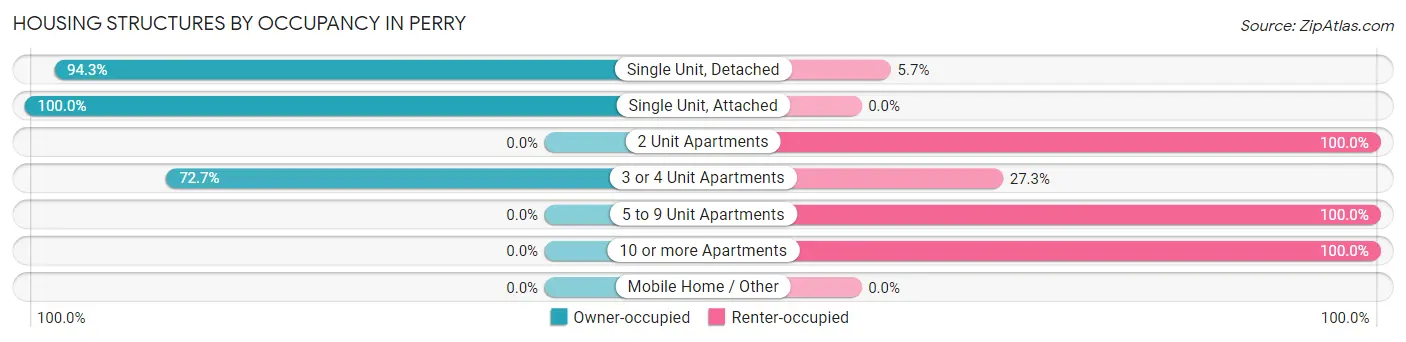
| Structure Type | Owner-occupied | Renter-occupied |
| Single Unit, Detached | 415 (94.3%) | 25 (5.7%) |
| Single Unit, Attached | 39 (100.0%) | 0 (0.0%) |
| 2 Unit Apartments | 0 (0.0%) | 7 (100.0%) |
| 3 or 4 Unit Apartments | 8 (72.7%) | 3 (27.3%) |
| 5 to 9 Unit Apartments | 0 (0.0%) | 1 (100.0%) |
| 10 or more Apartments | 0 (0.0%) | 9 (100.0%) |
| Mobile Home / Other | 0 (0.0%) | 0 (0.0%) |
| Total | 462 (91.1%) | 45 (8.9%) |
Housing Structures by Number of Rooms in Perry
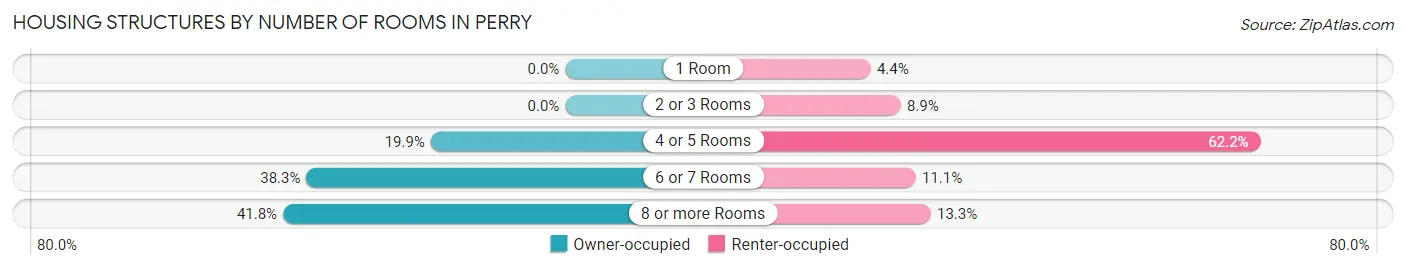
| Number of Rooms | Owner-occupied | Renter-occupied |
| 1 Room | 0 (0.0%) | 2 (4.4%) |
| 2 or 3 Rooms | 0 (0.0%) | 4 (8.9%) |
| 4 or 5 Rooms | 92 (19.9%) | 28 (62.2%) |
| 6 or 7 Rooms | 177 (38.3%) | 5 (11.1%) |
| 8 or more Rooms | 193 (41.8%) | 6 (13.3%) |
| Total | 462 (100.0%) | 45 (100.0%) |
Housing Structure by Heating Type in Perry
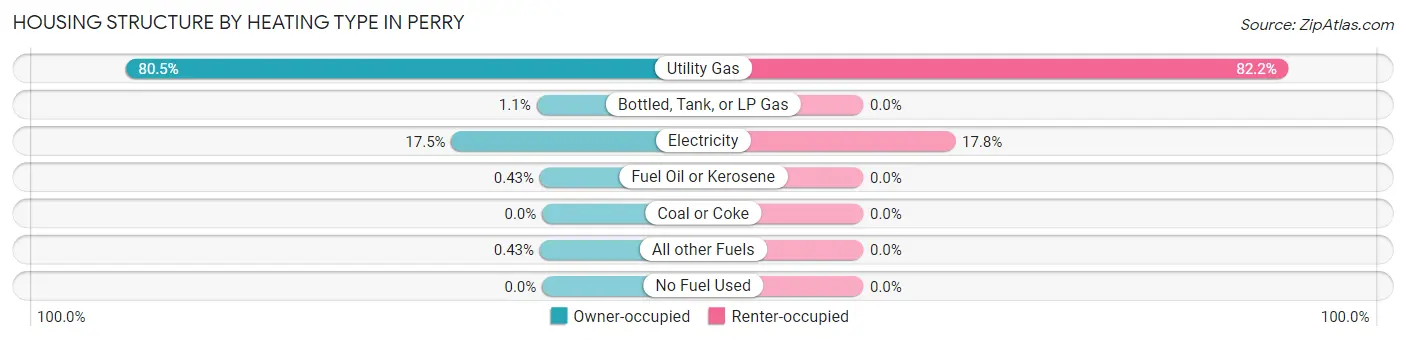
| Heating Type | Owner-occupied | Renter-occupied |
| Utility Gas | 372 (80.5%) | 37 (82.2%) |
| Bottled, Tank, or LP Gas | 5 (1.1%) | 0 (0.0%) |
| Electricity | 81 (17.5%) | 8 (17.8%) |
| Fuel Oil or Kerosene | 2 (0.4%) | 0 (0.0%) |
| Coal or Coke | 0 (0.0%) | 0 (0.0%) |
| All other Fuels | 2 (0.4%) | 0 (0.0%) |
| No Fuel Used | 0 (0.0%) | 0 (0.0%) |
| Total | 462 (100.0%) | 45 (100.0%) |
Household Vehicle Usage in Perry
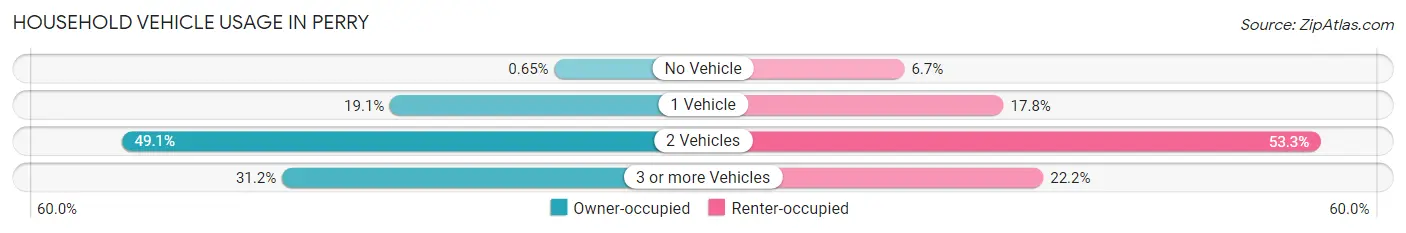
| Vehicles per Household | Owner-occupied | Renter-occupied |
| No Vehicle | 3 (0.6%) | 3 (6.7%) |
| 1 Vehicle | 88 (19.1%) | 8 (17.8%) |
| 2 Vehicles | 227 (49.1%) | 24 (53.3%) |
| 3 or more Vehicles | 144 (31.2%) | 10 (22.2%) |
| Total | 462 (100.0%) | 45 (100.0%) |
Real Estate & Mortgages in Perry
Real Estate and Mortgage Overview in Perry
| Characteristic | Without Mortgage | With Mortgage |
| Housing Units | 131 | 331 |
| Median Property Value | $189,900 | $223,600 |
| Median Household Income | $56,146 | $91 |
| Monthly Housing Costs | $531 | $0 |
| Real Estate Taxes | $2,492 | $0 |
Property Value by Mortgage Status in Perry
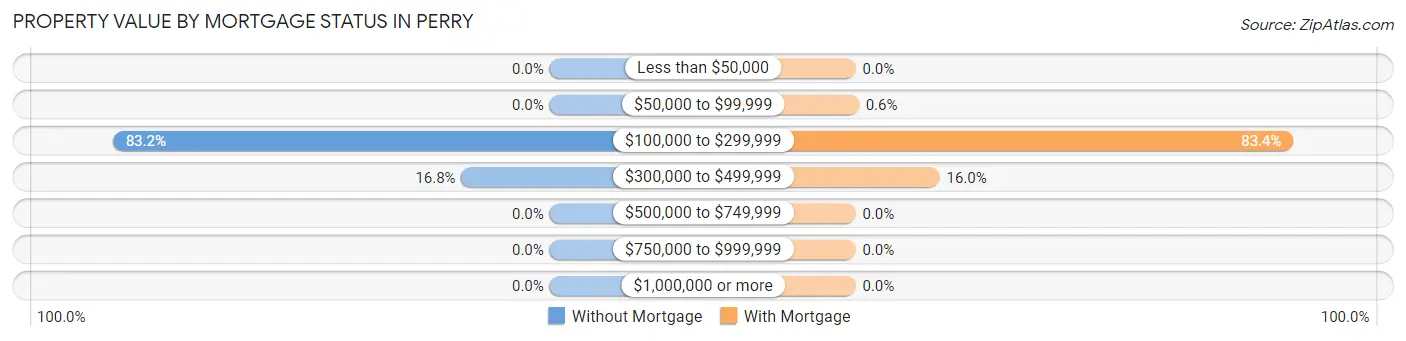
| Property Value | Without Mortgage | With Mortgage |
| Less than $50,000 | 0 (0.0%) | 0 (0.0%) |
| $50,000 to $99,999 | 0 (0.0%) | 2 (0.6%) |
| $100,000 to $299,999 | 109 (83.2%) | 276 (83.4%) |
| $300,000 to $499,999 | 22 (16.8%) | 53 (16.0%) |
| $500,000 to $749,999 | 0 (0.0%) | 0 (0.0%) |
| $750,000 to $999,999 | 0 (0.0%) | 0 (0.0%) |
| $1,000,000 or more | 0 (0.0%) | 0 (0.0%) |
| Total | 131 (100.0%) | 331 (100.0%) |
Household Income by Mortgage Status in Perry
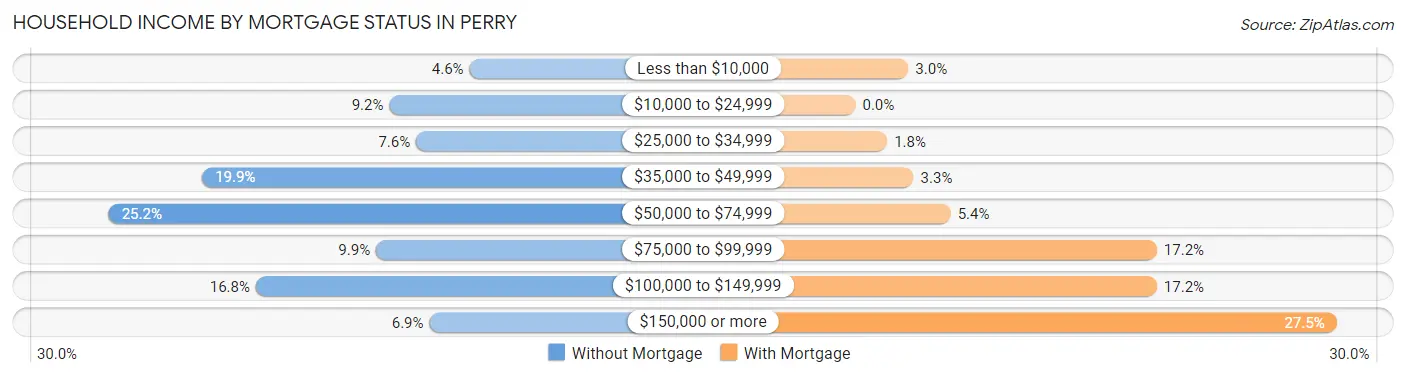
| Household Income | Without Mortgage | With Mortgage |
| Less than $10,000 | 6 (4.6%) | 10 (3.0%) |
| $10,000 to $24,999 | 12 (9.2%) | 0 (0.0%) |
| $25,000 to $34,999 | 10 (7.6%) | 6 (1.8%) |
| $35,000 to $49,999 | 26 (19.9%) | 11 (3.3%) |
| $50,000 to $74,999 | 33 (25.2%) | 18 (5.4%) |
| $75,000 to $99,999 | 13 (9.9%) | 57 (17.2%) |
| $100,000 to $149,999 | 22 (16.8%) | 57 (17.2%) |
| $150,000 or more | 9 (6.9%) | 91 (27.5%) |
| Total | 131 (100.0%) | 331 (100.0%) |
Property Value to Household Income Ratio in Perry
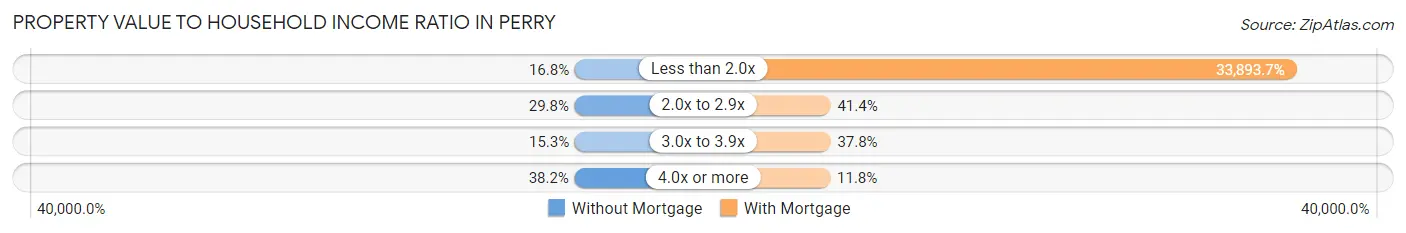
| Value-to-Income Ratio | Without Mortgage | With Mortgage |
| Less than 2.0x | 22 (16.8%) | 112,188 (33,893.7%) |
| 2.0x to 2.9x | 39 (29.8%) | 137 (41.4%) |
| 3.0x to 3.9x | 20 (15.3%) | 125 (37.8%) |
| 4.0x or more | 50 (38.2%) | 39 (11.8%) |
| Total | 131 (100.0%) | 331 (100.0%) |
Real Estate Taxes by Mortgage Status in Perry
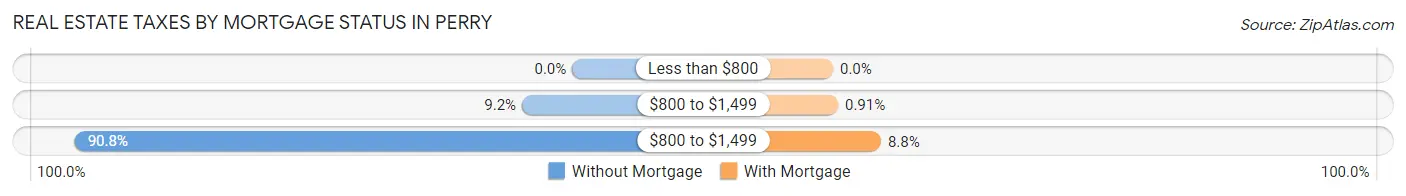
| Property Taxes | Without Mortgage | With Mortgage |
| Less than $800 | 0 (0.0%) | 0 (0.0%) |
| $800 to $1,499 | 12 (9.2%) | 3 (0.9%) |
| $800 to $1,499 | 119 (90.8%) | 29 (8.8%) |
| Total | 131 (100.0%) | 331 (100.0%) |
Health & Disability in Perry
Health Insurance Coverage by Age in Perry
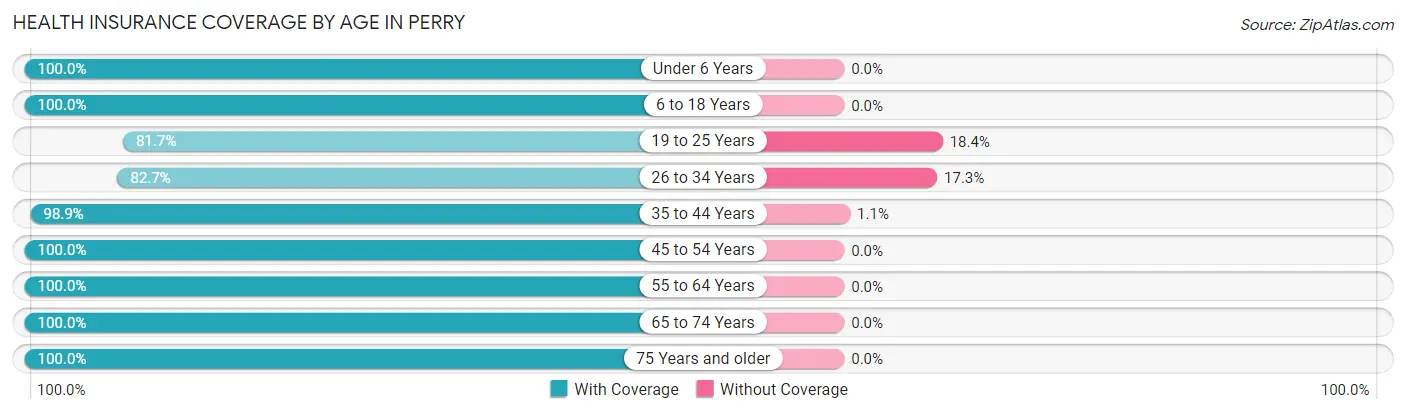
| Age Bracket | With Coverage | Without Coverage |
| Under 6 Years | 140 (100.0%) | 0 (0.0%) |
| 6 to 18 Years | 297 (100.0%) | 0 (0.0%) |
| 19 to 25 Years | 89 (81.7%) | 20 (18.3%) |
| 26 to 34 Years | 172 (82.7%) | 36 (17.3%) |
| 35 to 44 Years | 182 (98.9%) | 2 (1.1%) |
| 45 to 54 Years | 162 (100.0%) | 0 (0.0%) |
| 55 to 64 Years | 226 (100.0%) | 0 (0.0%) |
| 65 to 74 Years | 162 (100.0%) | 0 (0.0%) |
| 75 Years and older | 90 (100.0%) | 0 (0.0%) |
| Total | 1,520 (96.3%) | 58 (3.7%) |
Health Insurance Coverage by Citizenship Status in Perry
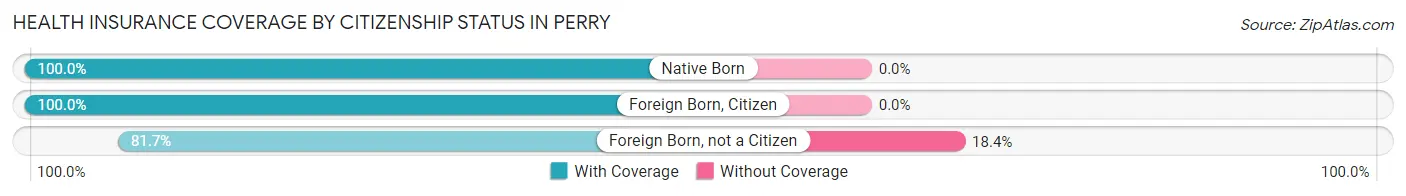
| Citizenship Status | With Coverage | Without Coverage |
| Native Born | 140 (100.0%) | 0 (0.0%) |
| Foreign Born, Citizen | 297 (100.0%) | 0 (0.0%) |
| Foreign Born, not a Citizen | 89 (81.7%) | 20 (18.3%) |
Health Insurance Coverage by Household Income in Perry
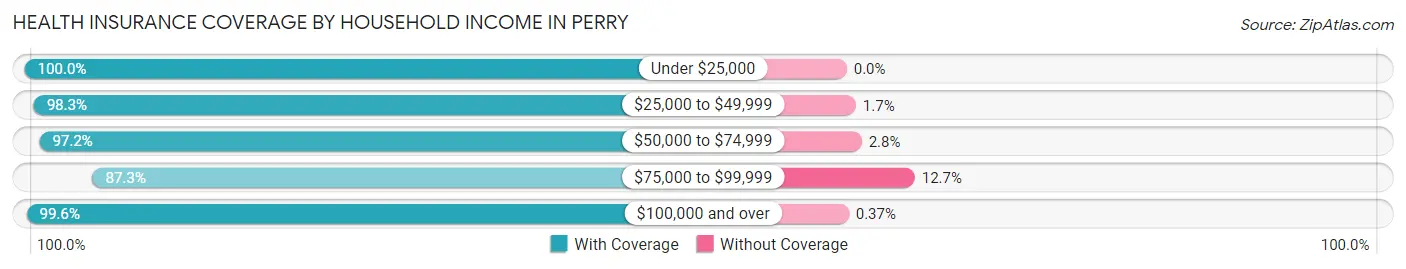
| Household Income | With Coverage | Without Coverage |
| Under $25,000 | 52 (100.0%) | 0 (0.0%) |
| $25,000 to $49,999 | 115 (98.3%) | 2 (1.7%) |
| $50,000 to $74,999 | 209 (97.2%) | 6 (2.8%) |
| $75,000 to $99,999 | 322 (87.3%) | 47 (12.7%) |
| $100,000 and over | 808 (99.6%) | 3 (0.4%) |
Public vs Private Health Insurance Coverage by Age in Perry
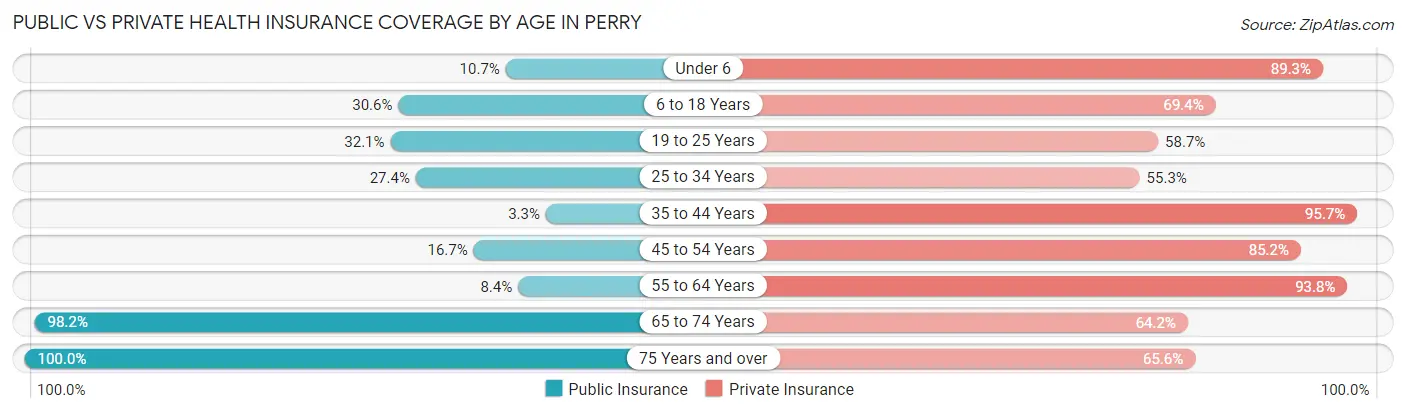
| Age Bracket | Public Insurance | Private Insurance |
| Under 6 | 15 (10.7%) | 125 (89.3%) |
| 6 to 18 Years | 91 (30.6%) | 206 (69.4%) |
| 19 to 25 Years | 35 (32.1%) | 64 (58.7%) |
| 25 to 34 Years | 57 (27.4%) | 115 (55.3%) |
| 35 to 44 Years | 6 (3.3%) | 176 (95.7%) |
| 45 to 54 Years | 27 (16.7%) | 138 (85.2%) |
| 55 to 64 Years | 19 (8.4%) | 212 (93.8%) |
| 65 to 74 Years | 159 (98.2%) | 104 (64.2%) |
| 75 Years and over | 90 (100.0%) | 59 (65.6%) |
| Total | 499 (31.6%) | 1,199 (76.0%) |
Disability Status by Sex by Age in Perry
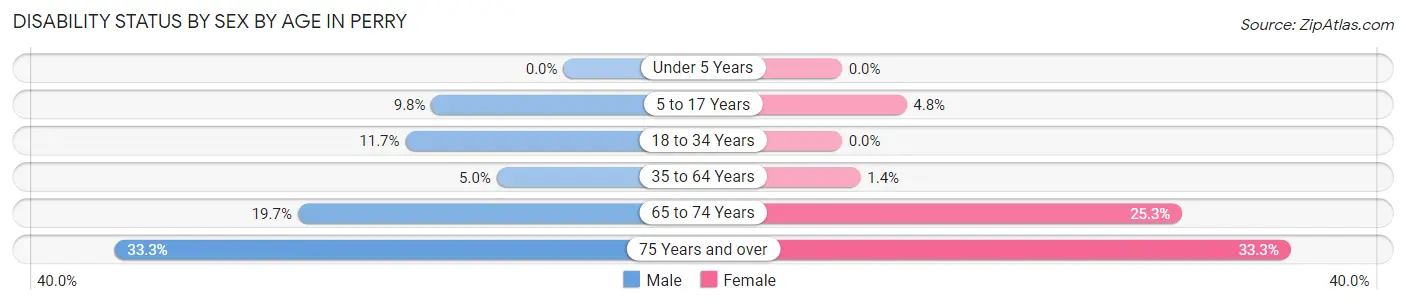
| Age Bracket | Male | Female |
| Under 5 Years | 0 (0.0%) | 0 (0.0%) |
| 5 to 17 Years | 15 (9.8%) | 8 (4.8%) |
| 18 to 34 Years | 19 (11.7%) | 0 (0.0%) |
| 35 to 64 Years | 14 (5.0%) | 4 (1.4%) |
| 65 to 74 Years | 14 (19.7%) | 23 (25.3%) |
| 75 Years and over | 16 (33.3%) | 14 (33.3%) |
Disability Class by Sex by Age in Perry
Disability Class: Hearing Difficulty
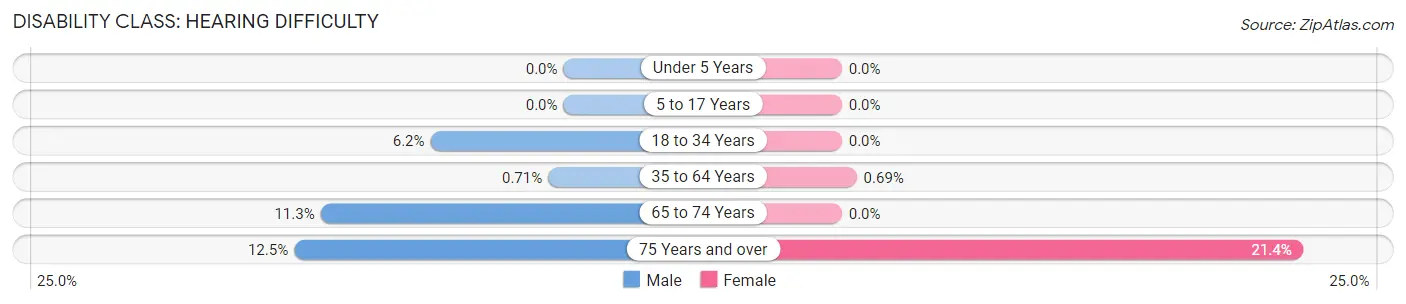
| Age Bracket | Male | Female |
| Under 5 Years | 0 (0.0%) | 0 (0.0%) |
| 5 to 17 Years | 0 (0.0%) | 0 (0.0%) |
| 18 to 34 Years | 10 (6.2%) | 0 (0.0%) |
| 35 to 64 Years | 2 (0.7%) | 2 (0.7%) |
| 65 to 74 Years | 8 (11.3%) | 0 (0.0%) |
| 75 Years and over | 6 (12.5%) | 9 (21.4%) |
Disability Class: Vision Difficulty
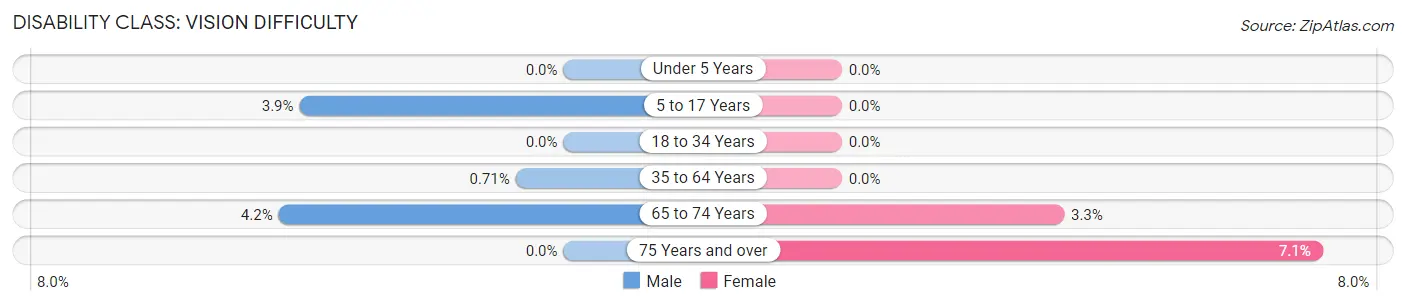
| Age Bracket | Male | Female |
| Under 5 Years | 0 (0.0%) | 0 (0.0%) |
| 5 to 17 Years | 6 (3.9%) | 0 (0.0%) |
| 18 to 34 Years | 0 (0.0%) | 0 (0.0%) |
| 35 to 64 Years | 2 (0.7%) | 0 (0.0%) |
| 65 to 74 Years | 3 (4.2%) | 3 (3.3%) |
| 75 Years and over | 0 (0.0%) | 3 (7.1%) |
Disability Class: Cognitive Difficulty
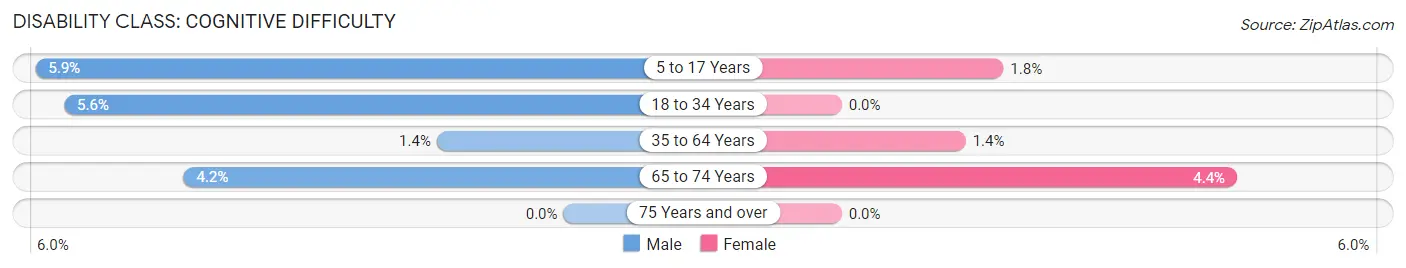
| Age Bracket | Male | Female |
| 5 to 17 Years | 9 (5.9%) | 3 (1.8%) |
| 18 to 34 Years | 9 (5.6%) | 0 (0.0%) |
| 35 to 64 Years | 4 (1.4%) | 4 (1.4%) |
| 65 to 74 Years | 3 (4.2%) | 4 (4.4%) |
| 75 Years and over | 0 (0.0%) | 0 (0.0%) |
Disability Class: Ambulatory Difficulty
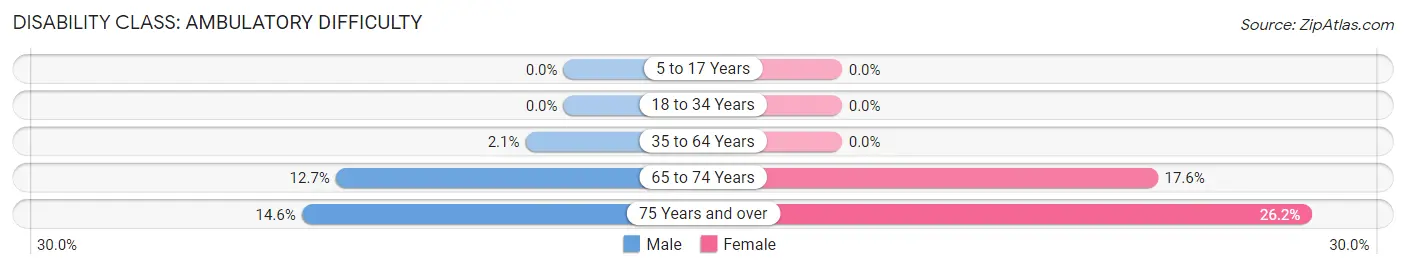
| Age Bracket | Male | Female |
| 5 to 17 Years | 0 (0.0%) | 0 (0.0%) |
| 18 to 34 Years | 0 (0.0%) | 0 (0.0%) |
| 35 to 64 Years | 6 (2.1%) | 0 (0.0%) |
| 65 to 74 Years | 9 (12.7%) | 16 (17.6%) |
| 75 Years and over | 7 (14.6%) | 11 (26.2%) |
Disability Class: Self-Care Difficulty
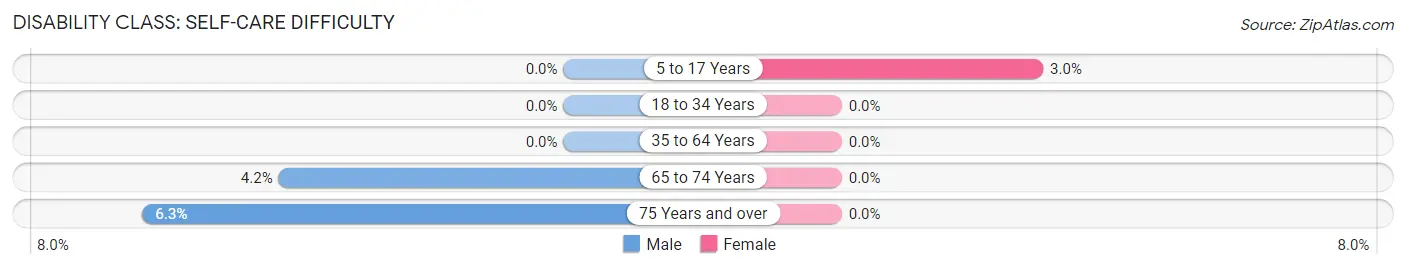
| Age Bracket | Male | Female |
| 5 to 17 Years | 0 (0.0%) | 5 (3.0%) |
| 18 to 34 Years | 0 (0.0%) | 0 (0.0%) |
| 35 to 64 Years | 0 (0.0%) | 0 (0.0%) |
| 65 to 74 Years | 3 (4.2%) | 0 (0.0%) |
| 75 Years and over | 3 (6.2%) | 0 (0.0%) |
Technology Access in Perry
Computing Device Access in Perry
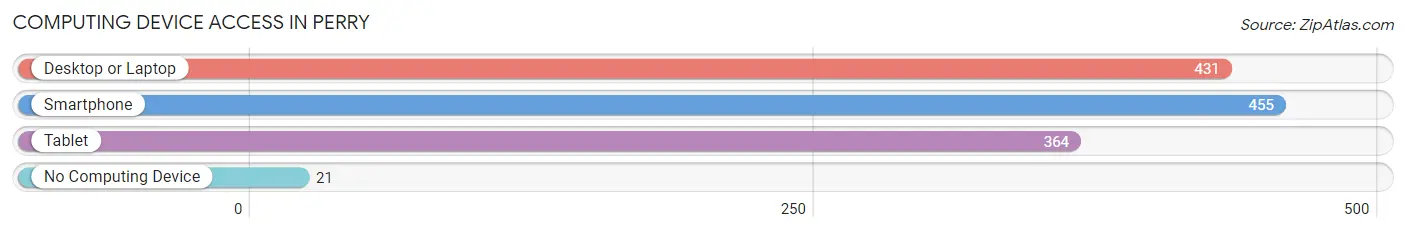
| Device Type | # Households | % Households |
| Desktop or Laptop | 431 | 85.0% |
| Smartphone | 455 | 89.7% |
| Tablet | 364 | 71.8% |
| No Computing Device | 21 | 4.1% |
| Total | 507 | 100.0% |
Internet Access in Perry
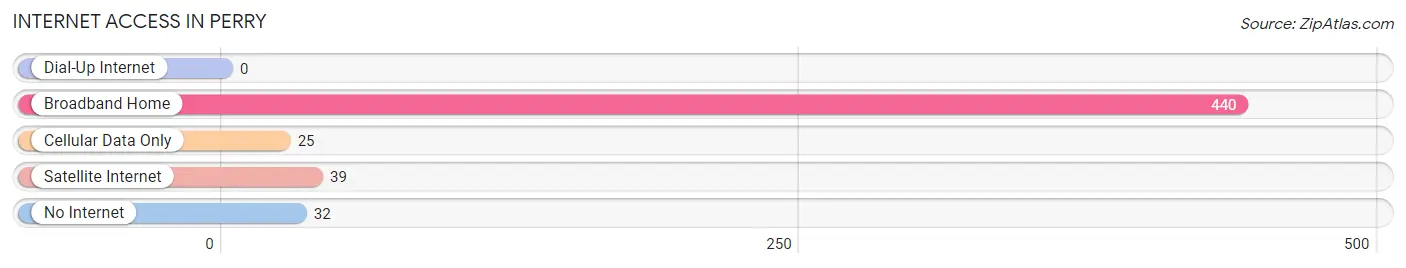
| Internet Type | # Households | % Households |
| Dial-Up Internet | 0 | 0.0% |
| Broadband Home | 440 | 86.8% |
| Cellular Data Only | 25 | 4.9% |
| Satellite Internet | 39 | 7.7% |
| No Internet | 32 | 6.3% |
| Total | 507 | 100.0% |
Perry Summary
Perry, Ohio is a small village located in Lake County, Ohio. It is situated on the western edge of the county, just south of the city of Mentor. The village has a population of approximately 2,500 people and is part of the Greater Cleveland metropolitan area.
History
Perry was founded in 1818 by a group of settlers from Connecticut. The village was named after Commodore Oliver Hazard Perry, a hero of the War of 1812. The village was incorporated in 1837 and has remained relatively unchanged since then.
Geography
Perry is located in the western part of Lake County, Ohio. It is situated on the western edge of the county, just south of the city of Mentor. The village is bordered by the Grand River to the north and the Chagrin River to the south. The village is located in a rural area and is surrounded by farmland.
Economy
The economy of Perry is largely based on agriculture. The village is home to several farms, including dairy farms, vegetable farms, and fruit farms. The village also has a few small businesses, including a grocery store, a hardware store, and a few restaurants.
Demographics
As of the 2010 census, the population of Perry was 2,500. The racial makeup of the village was 97.2% White, 0.8% African American, 0.4% Native American, 0.4% Asian, and 1.2% from other races. The median household income was $45,000, and the median family income was $50,000.
Conclusion
Perry, Ohio is a small village located in Lake County, Ohio. It is situated on the western edge of the county, just south of the city of Mentor. The village has a population of approximately 2,500 people and is part of the Greater Cleveland metropolitan area. The economy of Perry is largely based on agriculture, and the village is home to several farms. The racial makeup of the village is predominantly White, with a small percentage of African American, Native American, and Asian residents. The median household income is $45,000, and the median family income is $50,000.
Common Questions
What is Per Capita Income in Perry?
Per Capita income in Perry is $34,683.
What is the Median Family Income in Perry?
Median Family Income in Perry is $106,250.
What is the Median Household income in Perry?
Median Household Income in Perry is $89,836.
What is Income or Wage Gap in Perry?
Income or Wage Gap in Perry is 19.9%.
Women in Perry earn 80.1 cents for every dollar earned by a man.
What is Family Income Deficit in Perry?
Family Income Deficit in Perry is $9,857.
Families that are below poverty line in Perry earn $9,857 less on average than the poverty threshold level.
What is Inequality or Gini Index in Perry?
Inequality or Gini Index in Perry is 0.34.
What is the Total Population of Perry?
Total Population of Perry is 1,578.
What is the Total Male Population of Perry?
Total Male Population of Perry is 801.
What is the Total Female Population of Perry?
Total Female Population of Perry is 777.
What is the Ratio of Males per 100 Females in Perry?
There are 103.09 Males per 100 Females in Perry.
What is the Ratio of Females per 100 Males in Perry?
There are 97.00 Females per 100 Males in Perry.
What is the Median Population Age in Perry?
Median Population Age in Perry is 38.1 Years.
What is the Average Family Size in Perry
Average Family Size in Perry is 3.2 People.
What is the Average Household Size in Perry
Average Household Size in Perry is 3.1 People.
How Large is the Labor Force in Perry?
There are 795 People in the Labor Forcein in Perry.
What is the Percentage of People in the Labor Force in Perry?
67.2% of People are in the Labor Force in Perry.
What is the Unemployment Rate in Perry?
Unemployment Rate in Perry is 2.5%.