Painesville, OH Map & Demographics
Painesville Map
Painesville Overview
$26,362
PER CAPITA INCOME
$70,361
AVG FAMILY INCOME
$51,373
AVG HOUSEHOLD INCOME
31.7%
WAGE / INCOME GAP [ % ]
68.3¢/ $1
WAGE / INCOME GAP [ $ ]
$9,283
FAMILY INCOME DEFICIT
0.43
INEQUALITY / GINI INDEX
20,387
TOTAL POPULATION
10,656
MALE POPULATION
9,731
FEMALE POPULATION
109.51
MALES / 100 FEMALES
91.32
FEMALES / 100 MALES
33.4
MEDIAN AGE
3.4
AVG FAMILY SIZE
2.5
AVG HOUSEHOLD SIZE
9,706
LABOR FORCE [ PEOPLE ]
64.4%
PERCENT IN LABOR FORCE
4.8%
UNEMPLOYMENT RATE
Painesville Zip Codes
Painesville Area Codes
Income in Painesville
Income Overview in Painesville
Per Capita Income in Painesville is $26,362, while median incomes of families and households are $70,361 and $51,373 respectively.
| Characteristic | Number | Measure |
| Per Capita Income | 20,387 | $26,362 |
| Median Family Income | 4,356 | $70,361 |
| Mean Family Income | 4,356 | $82,638 |
| Median Household Income | 7,787 | $51,373 |
| Mean Household Income | 7,787 | $68,325 |
| Income Deficit | 4,356 | $9,283 |
| Wage / Income Gap (%) | 20,387 | 31.73% |
| Wage / Income Gap ($) | 20,387 | 68.27¢ per $1 |
| Gini / Inequality Index | 20,387 | 0.43 |
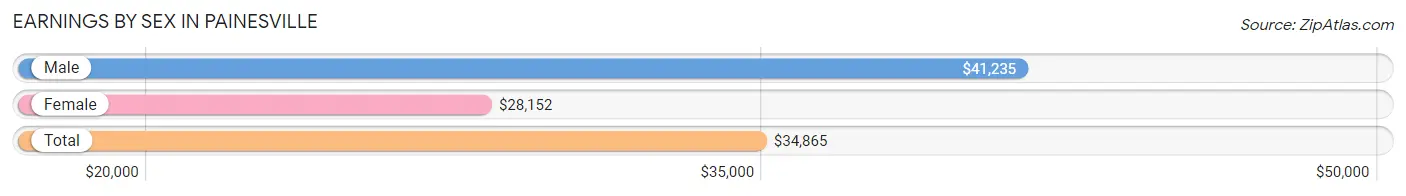
Earnings by Sex in Painesville
Average Earnings in Painesville are $34,865, $41,235 for men and $28,152 for women, a difference of 31.7%.
| Sex | Number | Average Earnings |
| Male | 5,737 (56.0%) | $41,235 |
| Female | 4,512 (44.0%) | $28,152 |
| Total | 10,249 (100.0%) | $34,865 |
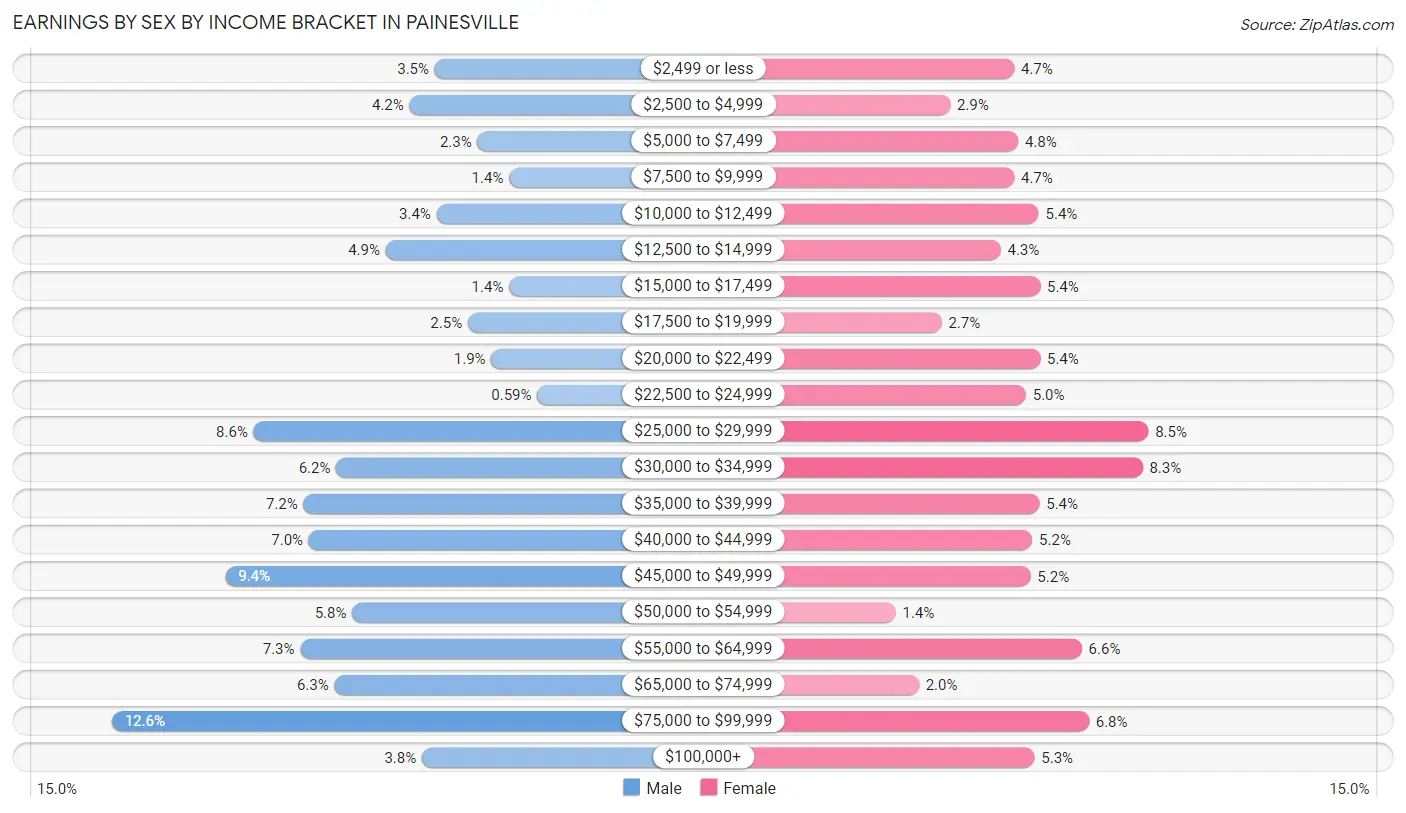
Earnings by Sex by Income Bracket in Painesville
The most common earnings brackets in Painesville are $75,000 to $99,999 for men (720 | 12.6%) and $25,000 to $29,999 for women (382 | 8.5%).
| Income | Male | Female |
| $2,499 or less | 199 (3.5%) | 212 (4.7%) |
| $2,500 to $4,999 | 240 (4.2%) | 131 (2.9%) |
| $5,000 to $7,499 | 130 (2.3%) | 217 (4.8%) |
| $7,500 to $9,999 | 79 (1.4%) | 212 (4.7%) |
| $10,000 to $12,499 | 196 (3.4%) | 243 (5.4%) |
| $12,500 to $14,999 | 278 (4.9%) | 195 (4.3%) |
| $15,000 to $17,499 | 79 (1.4%) | 245 (5.4%) |
| $17,500 to $19,999 | 146 (2.5%) | 120 (2.7%) |
| $20,000 to $22,499 | 108 (1.9%) | 245 (5.4%) |
| $22,500 to $24,999 | 34 (0.6%) | 227 (5.0%) |
| $25,000 to $29,999 | 491 (8.6%) | 382 (8.5%) |
| $30,000 to $34,999 | 358 (6.2%) | 375 (8.3%) |
| $35,000 to $39,999 | 411 (7.2%) | 244 (5.4%) |
| $40,000 to $44,999 | 402 (7.0%) | 235 (5.2%) |
| $45,000 to $49,999 | 537 (9.4%) | 233 (5.2%) |
| $50,000 to $54,999 | 332 (5.8%) | 62 (1.4%) |
| $55,000 to $64,999 | 416 (7.2%) | 298 (6.6%) |
| $65,000 to $74,999 | 361 (6.3%) | 91 (2.0%) |
| $75,000 to $99,999 | 720 (12.6%) | 307 (6.8%) |
| $100,000+ | 220 (3.8%) | 238 (5.3%) |
| Total | 5,737 (100.0%) | 4,512 (100.0%) |
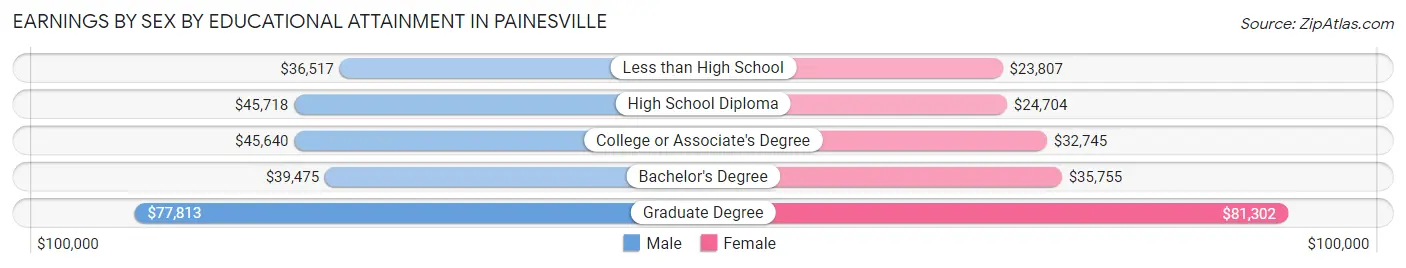
Earnings by Sex by Educational Attainment in Painesville
Average earnings in Painesville are $44,580 for men and $30,956 for women, a difference of 30.6%. Men with an educational attainment of graduate degree enjoy the highest average annual earnings of $77,813, while those with less than high school education earn the least with $36,517. Women with an educational attainment of graduate degree earn the most with the average annual earnings of $81,302, while those with less than high school education have the smallest earnings of $23,807.
| Educational Attainment | Male Income | Female Income |
| Less than High School | $36,517 | $23,807 |
| High School Diploma | $45,718 | $24,704 |
| College or Associate's Degree | $45,640 | $32,745 |
| Bachelor's Degree | $39,475 | $35,755 |
| Graduate Degree | $77,813 | $81,302 |
| Total | $44,580 | $30,956 |
Family Income in Painesville
Family Income Brackets in Painesville
According to the Painesville family income data, there are 784 families falling into the $75,000 to $99,999 income range, which is the most common income bracket and makes up 18.0% of all families. Conversely, the less than $10,000 income bracket is the least frequent group with only 109 families (2.5%) belonging to this category.
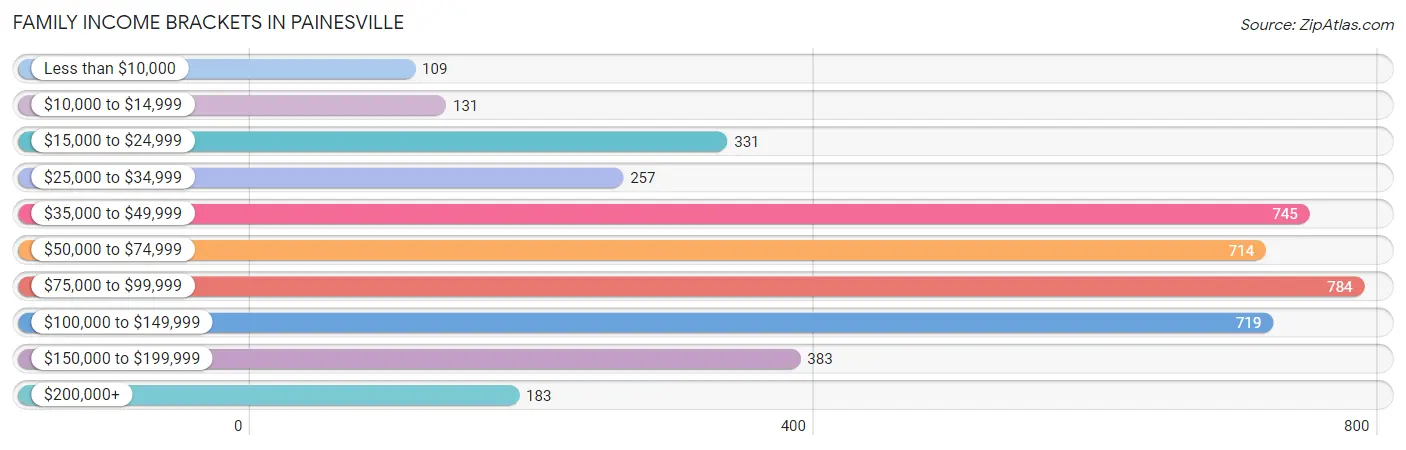
| Income Bracket | # Families | % Families |
| Less than $10,000 | 109 | 2.5% |
| $10,000 to $14,999 | 131 | 3.0% |
| $15,000 to $24,999 | 331 | 7.6% |
| $25,000 to $34,999 | 257 | 5.9% |
| $35,000 to $49,999 | 745 | 17.1% |
| $50,000 to $74,999 | 714 | 16.4% |
| $75,000 to $99,999 | 784 | 18.0% |
| $100,000 to $149,999 | 719 | 16.5% |
| $150,000 to $199,999 | 383 | 8.8% |
| $200,000+ | 183 | 4.2% |
Family Income by Famaliy Size in Painesville
7+ person families (263 | 6.0%) account for the highest median family income in Painesville with $130,987 per family, while 2-person families (1,700 | 39.0%) have the highest median income of $32,171 per family member.
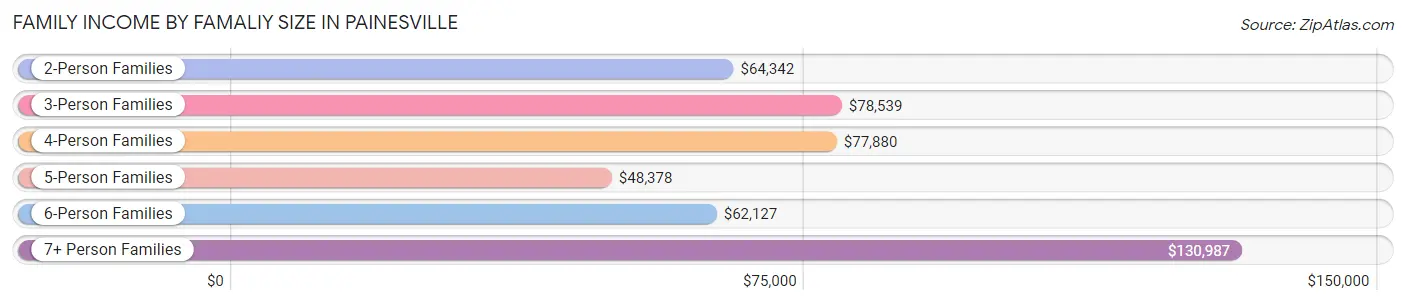
| Income Bracket | # Families | Median Income |
| 2-Person Families | 1,700 (39.0%) | $64,342 |
| 3-Person Families | 793 (18.2%) | $78,539 |
| 4-Person Families | 750 (17.2%) | $77,880 |
| 5-Person Families | 609 (14.0%) | $48,378 |
| 6-Person Families | 241 (5.5%) | $62,127 |
| 7+ Person Families | 263 (6.0%) | $130,987 |
| Total | 4,356 (100.0%) | $70,361 |
Family Income by Number of Earners in Painesville
The median family income in Painesville is $70,361, with families comprising 3+ earners (588) having the highest median family income of $128,958, while families with no earners (514) have the lowest median family income of $35,441, accounting for 13.5% and 11.8% of families, respectively.
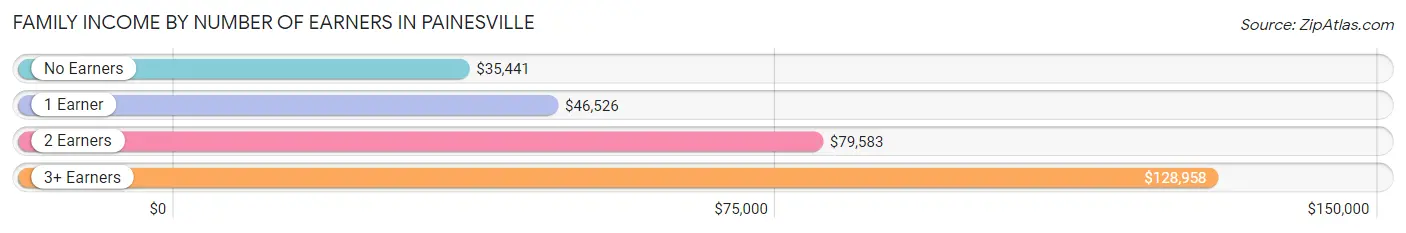
| Number of Earners | # Families | Median Income |
| No Earners | 514 (11.8%) | $35,441 |
| 1 Earner | 1,651 (37.9%) | $46,526 |
| 2 Earners | 1,603 (36.8%) | $79,583 |
| 3+ Earners | 588 (13.5%) | $128,958 |
| Total | 4,356 (100.0%) | $70,361 |
Household Income in Painesville
Household Income Brackets in Painesville
With 1,433 households falling in the category, the $35,000 to $49,999 income range is the most frequent in Painesville, accounting for 18.4% of all households. In contrast, only 218 households (2.8%) fall into the $200,000+ income bracket, making it the least populous group.
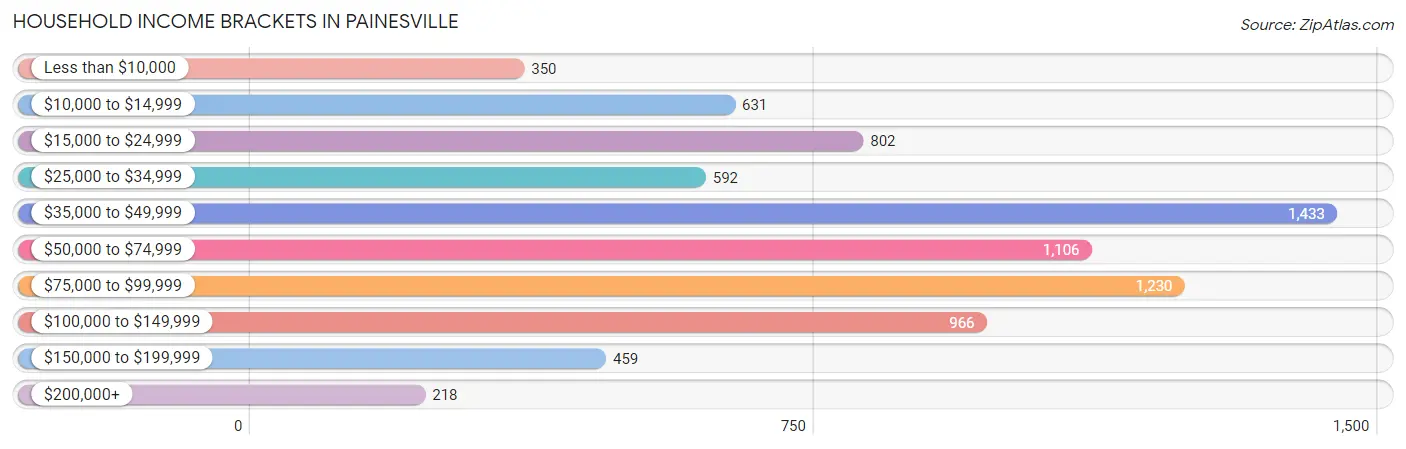
| Income Bracket | # Households | % Households |
| Less than $10,000 | 350 | 4.5% |
| $10,000 to $14,999 | 631 | 8.1% |
| $15,000 to $24,999 | 802 | 10.3% |
| $25,000 to $34,999 | 592 | 7.6% |
| $35,000 to $49,999 | 1,433 | 18.4% |
| $50,000 to $74,999 | 1,106 | 14.2% |
| $75,000 to $99,999 | 1,230 | 15.8% |
| $100,000 to $149,999 | 966 | 12.4% |
| $150,000 to $199,999 | 459 | 5.9% |
| $200,000+ | 218 | 2.8% |
Household Income by Householder Age in Painesville
The median household income in Painesville is $51,373, with the highest median household income of $60,899 found in the 25 to 44 years age bracket for the primary householder. A total of 3,134 households (40.3%) fall into this category. Meanwhile, the 65+ years age bracket for the primary householder has the lowest median household income of $39,609, with 1,565 households (20.1%) in this group.
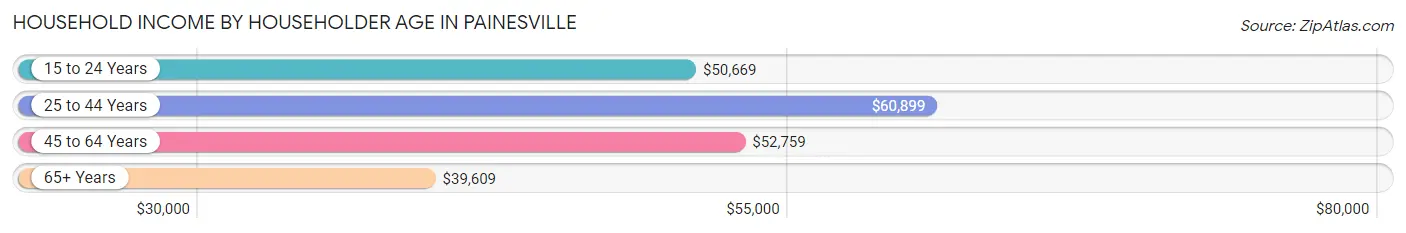
| Income Bracket | # Households | Median Income |
| 15 to 24 Years | 328 (4.2%) | $50,669 |
| 25 to 44 Years | 3,134 (40.3%) | $60,899 |
| 45 to 64 Years | 2,760 (35.4%) | $52,759 |
| 65+ Years | 1,565 (20.1%) | $39,609 |
| Total | 7,787 (100.0%) | $51,373 |
Poverty in Painesville
Income Below Poverty by Sex and Age in Painesville
With 16.3% poverty level for males and 24.0% for females among the residents of Painesville, 5 year old males and 16 and 17 year old females are the most vulnerable to poverty, with 81 males (34.2%) and 118 females (32.6%) in their respective age groups living below the poverty level.
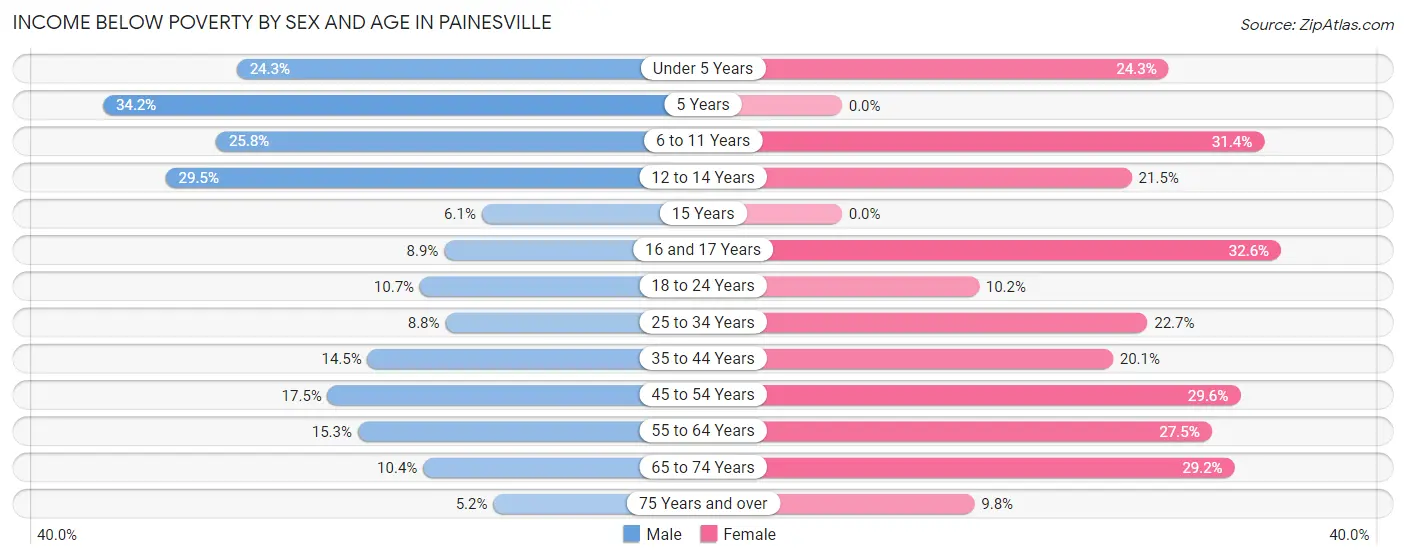
| Age Bracket | Male | Female |
| Under 5 Years | 153 (24.2%) | 198 (24.3%) |
| 5 Years | 81 (34.2%) | 0 (0.0%) |
| 6 to 11 Years | 327 (25.8%) | 274 (31.4%) |
| 12 to 14 Years | 194 (29.5%) | 99 (21.5%) |
| 15 Years | 16 (6.1%) | 0 (0.0%) |
| 16 and 17 Years | 20 (8.8%) | 118 (32.6%) |
| 18 to 24 Years | 90 (10.6%) | 54 (10.2%) |
| 25 to 34 Years | 135 (8.8%) | 284 (22.7%) |
| 35 to 44 Years | 242 (14.5%) | 265 (20.1%) |
| 45 to 54 Years | 203 (17.5%) | 335 (29.6%) |
| 55 to 64 Years | 127 (15.3%) | 350 (27.5%) |
| 65 to 74 Years | 63 (10.4%) | 239 (29.1%) |
| 75 Years and over | 14 (5.2%) | 49 (9.8%) |
| Total | 1,665 (16.3%) | 2,265 (24.0%) |
Income Above Poverty by Sex and Age in Painesville
According to the poverty statistics in Painesville, males aged 75 years and over and females aged 5 years are the age groups that are most secure financially, with 94.8% of males and 100.0% of females in these age groups living above the poverty line.
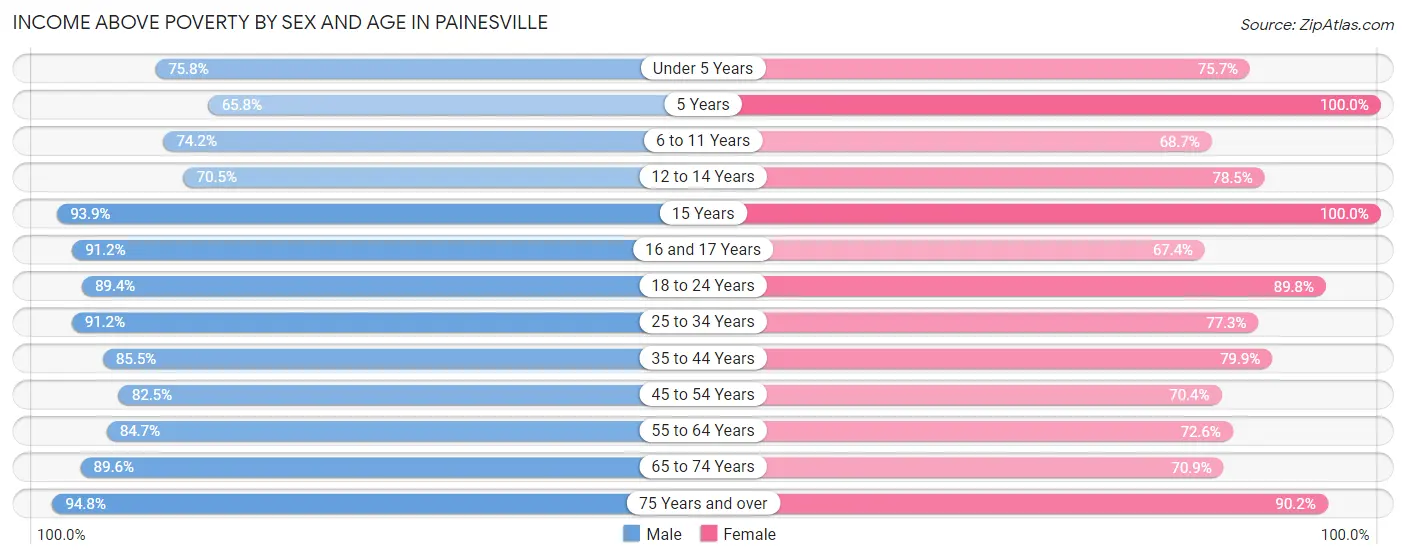
| Age Bracket | Male | Female |
| Under 5 Years | 478 (75.7%) | 618 (75.7%) |
| 5 Years | 156 (65.8%) | 73 (100.0%) |
| 6 to 11 Years | 941 (74.2%) | 600 (68.6%) |
| 12 to 14 Years | 463 (70.5%) | 361 (78.5%) |
| 15 Years | 248 (93.9%) | 9 (100.0%) |
| 16 and 17 Years | 206 (91.1%) | 244 (67.4%) |
| 18 to 24 Years | 755 (89.3%) | 477 (89.8%) |
| 25 to 34 Years | 1,406 (91.2%) | 968 (77.3%) |
| 35 to 44 Years | 1,422 (85.5%) | 1,052 (79.9%) |
| 45 to 54 Years | 957 (82.5%) | 798 (70.4%) |
| 55 to 64 Years | 705 (84.7%) | 925 (72.6%) |
| 65 to 74 Years | 542 (89.6%) | 581 (70.9%) |
| 75 Years and over | 255 (94.8%) | 449 (90.2%) |
| Total | 8,534 (83.7%) | 7,155 (76.0%) |
Income Below Poverty Among Married-Couple Families in Painesville
The poverty statistics for married-couple families in Painesville show that 7.9% or 215 of the total 2,739 families live below the poverty line. Families with 5 or more children have the highest poverty rate of 52.8%, comprising of 19 families. On the other hand, families with 1 or 2 children have the lowest poverty rate of 4.3%, which includes 44 families.
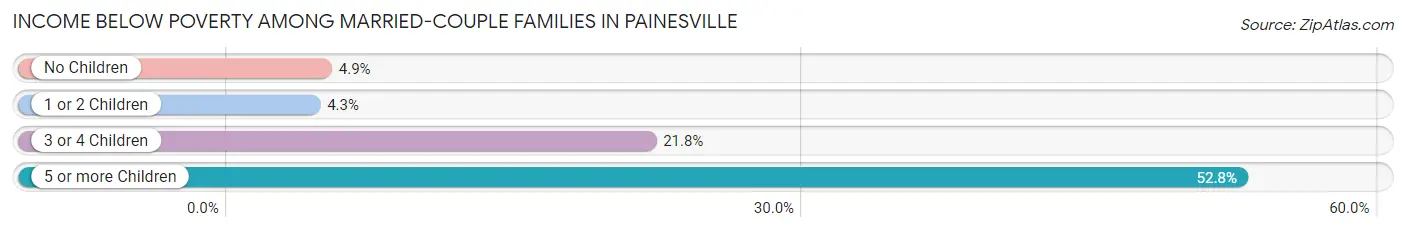
| Children | Above Poverty | Below Poverty |
| No Children | 1,204 (95.1%) | 62 (4.9%) |
| 1 or 2 Children | 981 (95.7%) | 44 (4.3%) |
| 3 or 4 Children | 322 (78.2%) | 90 (21.8%) |
| 5 or more Children | 17 (47.2%) | 19 (52.8%) |
| Total | 2,524 (92.1%) | 215 (7.9%) |
Income Below Poverty Among Single-Parent Households in Painesville
According to the poverty data in Painesville, 20.2% or 83 single-father households and 27.1% or 327 single-mother households are living below the poverty line. Among single-father households, those with 3 or 4 children have the highest poverty rate, with 27 households (100.0%) experiencing poverty. Likewise, among single-mother households, those with 1 or 2 children have the highest poverty rate, with 187 households (37.8%) falling below the poverty line.
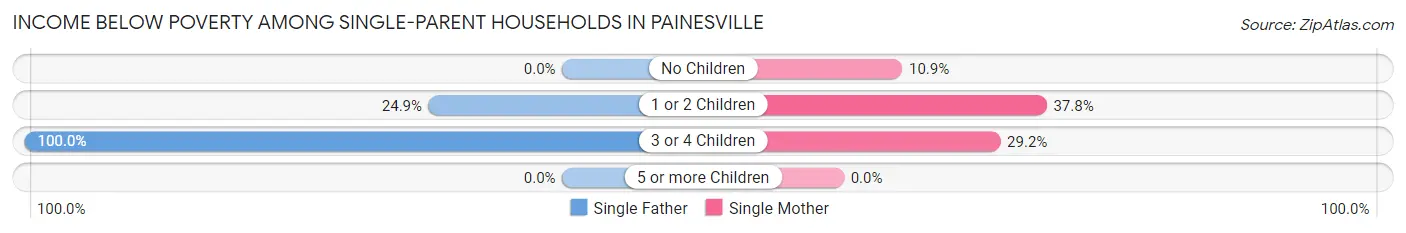
| Children | Single Father | Single Mother |
| No Children | 0 (0.0%) | 40 (10.9%) |
| 1 or 2 Children | 56 (24.9%) | 187 (37.8%) |
| 3 or 4 Children | 27 (100.0%) | 100 (29.1%) |
| 5 or more Children | 0 (0.0%) | 0 (0.0%) |
| Total | 83 (20.2%) | 327 (27.1%) |
Income Below Poverty Among Married-Couple vs Single-Parent Households in Painesville
The poverty data for Painesville shows that 215 of the married-couple family households (7.9%) and 410 of the single-parent households (25.4%) are living below the poverty level. Within the married-couple family households, those with 5 or more children have the highest poverty rate, with 19 households (52.8%) falling below the poverty line. Among the single-parent households, those with 3 or 4 children have the highest poverty rate, with 127 household (34.3%) living below poverty.
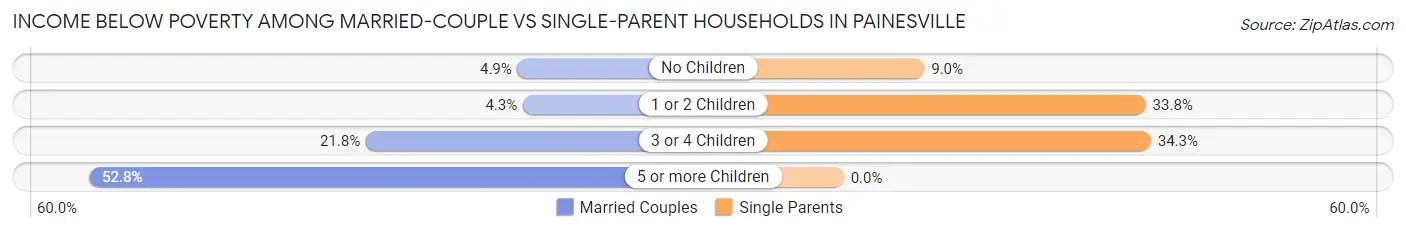
| Children | Married-Couple Families | Single-Parent Households |
| No Children | 62 (4.9%) | 40 (9.0%) |
| 1 or 2 Children | 44 (4.3%) | 243 (33.8%) |
| 3 or 4 Children | 90 (21.8%) | 127 (34.3%) |
| 5 or more Children | 19 (52.8%) | 0 (0.0%) |
| Total | 215 (7.9%) | 410 (25.4%) |
Race in Painesville
The most populous races in Painesville are White / Caucasian (13,442 | 65.9%), Hispanic or Latino (4,949 | 24.3%), and Black / African American (2,989 | 14.7%).
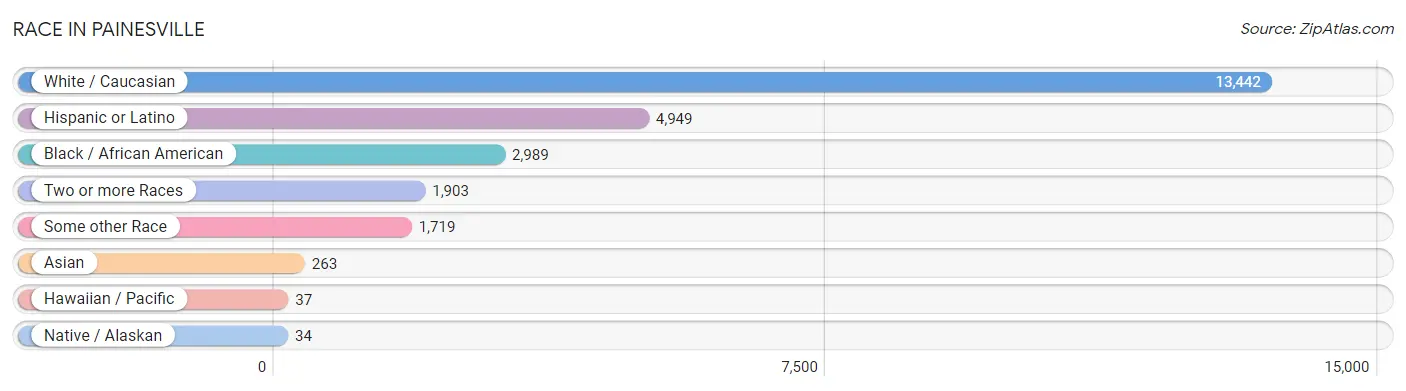
| Race | # Population | % Population |
| Asian | 263 | 1.3% |
| Black / African American | 2,989 | 14.7% |
| Hawaiian / Pacific | 37 | 0.2% |
| Hispanic or Latino | 4,949 | 24.3% |
| Native / Alaskan | 34 | 0.2% |
| White / Caucasian | 13,442 | 65.9% |
| Two or more Races | 1,903 | 9.3% |
| Some other Race | 1,719 | 8.4% |
| Total | 20,387 | 100.0% |
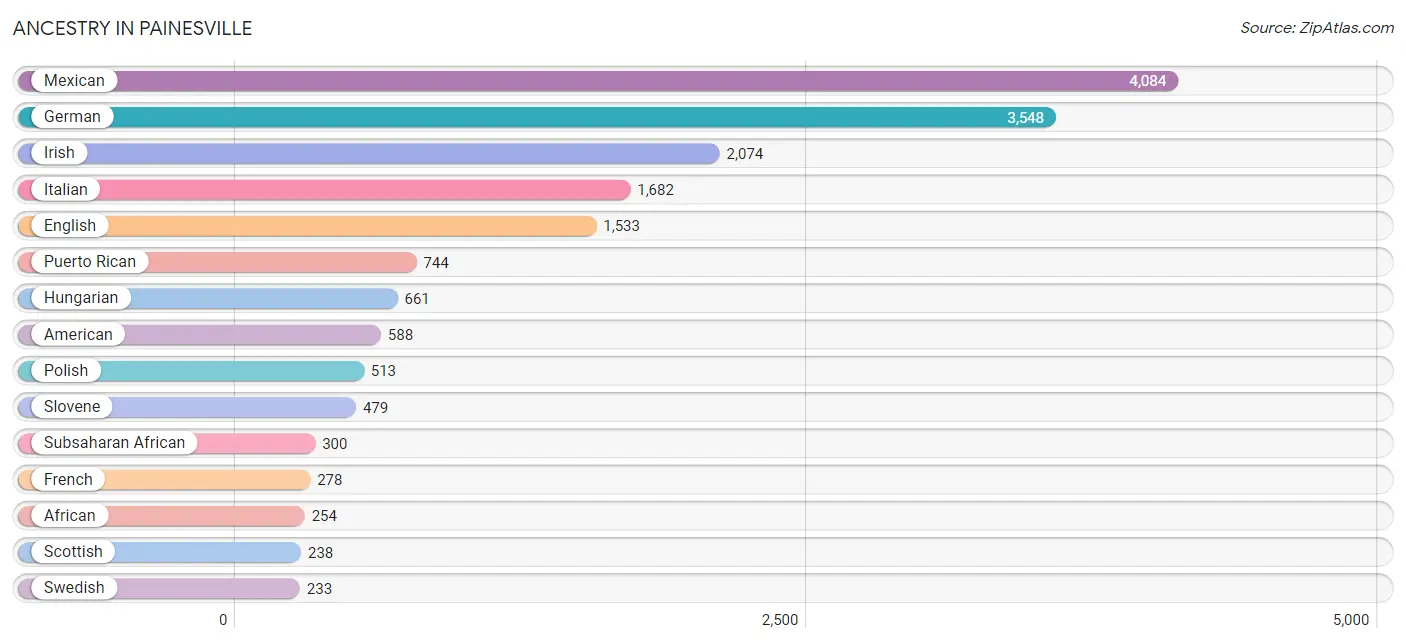
Ancestry in Painesville
The most populous ancestries reported in Painesville are Mexican (4,084 | 20.0%), German (3,548 | 17.4%), Irish (2,074 | 10.2%), Italian (1,682 | 8.3%), and English (1,533 | 7.5%), together accounting for 63.4% of all Painesville residents.
| Ancestry | # Population | % Population |
| African | 254 | 1.3% |
| American | 588 | 2.9% |
| Arab | 192 | 0.9% |
| Armenian | 197 | 1.0% |
| Austrian | 89 | 0.4% |
| Blackfeet | 3 | 0.0% |
| British | 169 | 0.8% |
| Burmese | 143 | 0.7% |
| Canadian | 17 | 0.1% |
| Central American | 22 | 0.1% |
| Central American Indian | 28 | 0.1% |
| Cherokee | 66 | 0.3% |
| Chickasaw | 8 | 0.0% |
| Choctaw | 2 | 0.0% |
| Creek | 8 | 0.0% |
| Croatian | 123 | 0.6% |
| Cuban | 6 | 0.0% |
| Czech | 136 | 0.7% |
| Czechoslovakian | 15 | 0.1% |
| Danish | 37 | 0.2% |
| Dutch | 94 | 0.5% |
| Eastern European | 27 | 0.1% |
| English | 1,533 | 7.5% |
| European | 191 | 0.9% |
| Finnish | 209 | 1.0% |
| French | 278 | 1.4% |
| French Canadian | 68 | 0.3% |
| German | 3,548 | 17.4% |
| Greek | 64 | 0.3% |
| Guamanian / Chamorro | 27 | 0.1% |
| Honduran | 22 | 0.1% |
| Hungarian | 661 | 3.2% |
| Indian (Asian) | 131 | 0.6% |
| Iranian | 3 | 0.0% |
| Irish | 2,074 | 10.2% |
| Iroquois | 83 | 0.4% |
| Israeli | 6 | 0.0% |
| Italian | 1,682 | 8.3% |
| Jamaican | 3 | 0.0% |
| Korean | 66 | 0.3% |
| Lebanese | 192 | 0.9% |
| Lithuanian | 13 | 0.1% |
| Mexican | 4,084 | 20.0% |
| Mexican American Indian | 23 | 0.1% |
| Native Hawaiian | 6 | 0.0% |
| Navajo | 8 | 0.0% |
| New Zealander | 12 | 0.1% |
| Nigerian | 16 | 0.1% |
| Northern European | 21 | 0.1% |
| Norwegian | 9 | 0.0% |
| Polish | 513 | 2.5% |
| Portuguese | 13 | 0.1% |
| Puerto Rican | 744 | 3.6% |
| Romanian | 44 | 0.2% |
| Russian | 43 | 0.2% |
| Scandinavian | 13 | 0.1% |
| Scotch-Irish | 90 | 0.4% |
| Scottish | 238 | 1.2% |
| Slovak | 124 | 0.6% |
| Slovene | 479 | 2.4% |
| Somali | 30 | 0.2% |
| South American | 30 | 0.2% |
| Subsaharan African | 300 | 1.5% |
| Swedish | 233 | 1.1% |
| Swiss | 85 | 0.4% |
| Thai | 50 | 0.3% |
| Ukrainian | 147 | 0.7% |
| Venezuelan | 30 | 0.2% |
| Welsh | 190 | 0.9% |
| West Indian | 5 | 0.0% | View All 70 Rows |
Immigrants in Painesville
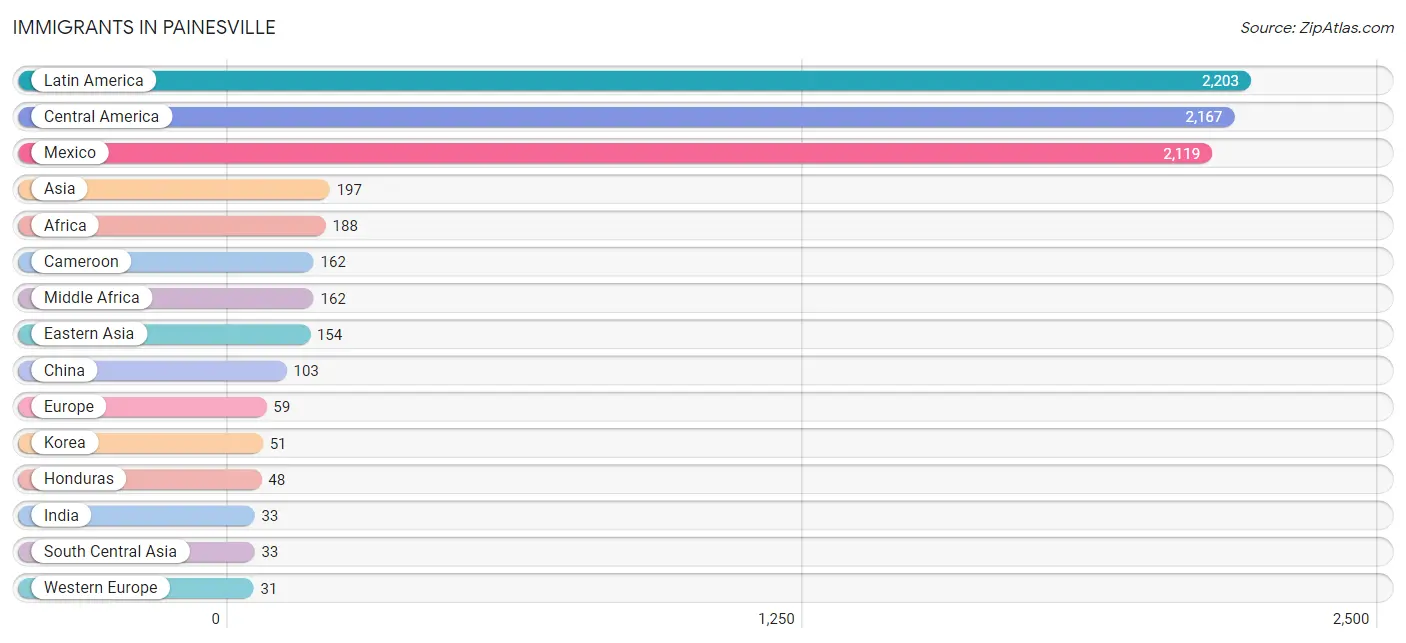
The most numerous immigrant groups reported in Painesville came from Latin America (2,203 | 10.8%), Central America (2,167 | 10.6%), Mexico (2,119 | 10.4%), Asia (197 | 1.0%), and Africa (188 | 0.9%), together accounting for 33.7% of all Painesville residents.
| Immigration Origin | # Population | % Population |
| Africa | 188 | 0.9% |
| Asia | 197 | 1.0% |
| Austria | 9 | 0.0% |
| Cameroon | 162 | 0.8% |
| Canada | 21 | 0.1% |
| Caribbean | 6 | 0.0% |
| Central America | 2,167 | 10.6% |
| China | 103 | 0.5% |
| Cuba | 6 | 0.0% |
| Eastern Asia | 154 | 0.8% |
| Eastern Europe | 15 | 0.1% |
| Europe | 59 | 0.3% |
| France | 8 | 0.0% |
| Germany | 14 | 0.1% |
| Honduras | 48 | 0.2% |
| Hong Kong | 10 | 0.1% |
| Hungary | 15 | 0.1% |
| India | 33 | 0.2% |
| Korea | 51 | 0.3% |
| Latin America | 2,203 | 10.8% |
| Mexico | 2,119 | 10.4% |
| Middle Africa | 162 | 0.8% |
| Northern Europe | 13 | 0.1% |
| Oceania | 16 | 0.1% |
| Philippines | 10 | 0.1% |
| South America | 30 | 0.2% |
| South Central Asia | 33 | 0.2% |
| South Eastern Asia | 10 | 0.1% |
| Venezuela | 30 | 0.2% |
| Western Europe | 31 | 0.2% | View All 30 Rows |
Sex and Age in Painesville
Sex and Age in Painesville
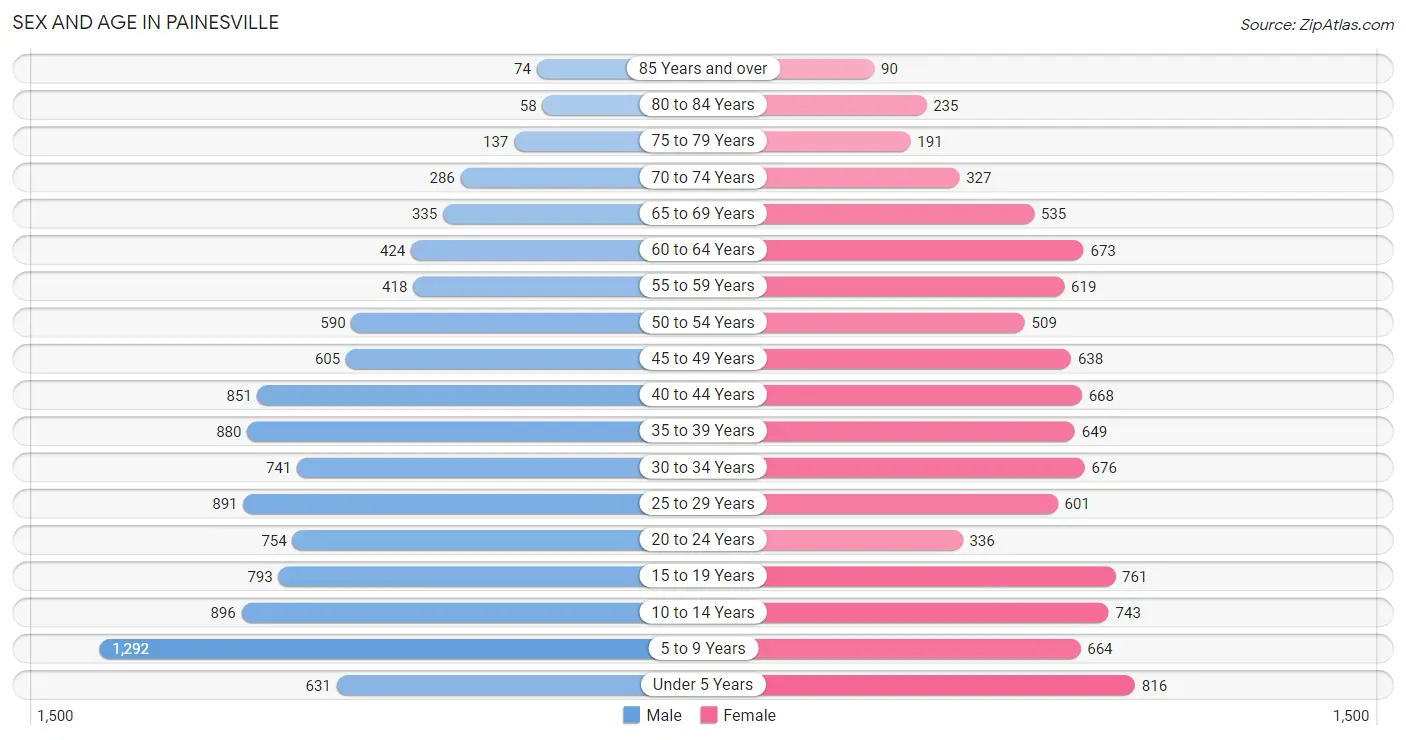
The most populous age groups in Painesville are 5 to 9 Years (1,292 | 12.1%) for men and Under 5 Years (816 | 8.4%) for women.
| Age Bracket | Male | Female |
| Under 5 Years | 631 (5.9%) | 816 (8.4%) |
| 5 to 9 Years | 1,292 (12.1%) | 664 (6.8%) |
| 10 to 14 Years | 896 (8.4%) | 743 (7.6%) |
| 15 to 19 Years | 793 (7.4%) | 761 (7.8%) |
| 20 to 24 Years | 754 (7.1%) | 336 (3.5%) |
| 25 to 29 Years | 891 (8.4%) | 601 (6.2%) |
| 30 to 34 Years | 741 (7.0%) | 676 (7.0%) |
| 35 to 39 Years | 880 (8.3%) | 649 (6.7%) |
| 40 to 44 Years | 851 (8.0%) | 668 (6.9%) |
| 45 to 49 Years | 605 (5.7%) | 638 (6.6%) |
| 50 to 54 Years | 590 (5.5%) | 509 (5.2%) |
| 55 to 59 Years | 418 (3.9%) | 619 (6.4%) |
| 60 to 64 Years | 424 (4.0%) | 673 (6.9%) |
| 65 to 69 Years | 335 (3.1%) | 535 (5.5%) |
| 70 to 74 Years | 286 (2.7%) | 327 (3.4%) |
| 75 to 79 Years | 137 (1.3%) | 191 (2.0%) |
| 80 to 84 Years | 58 (0.5%) | 235 (2.4%) |
| 85 Years and over | 74 (0.7%) | 90 (0.9%) |
| Total | 10,656 (100.0%) | 9,731 (100.0%) |
Families and Households in Painesville
Median Family Size in Painesville
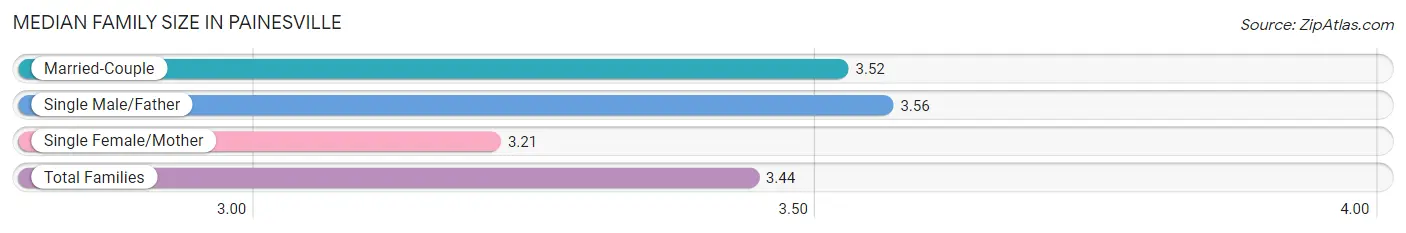
The median family size in Painesville is 3.44 persons per family, with single male/father families (411 | 9.4%) accounting for the largest median family size of 3.56 persons per family. On the other hand, single female/mother families (1,206 | 27.7%) represent the smallest median family size with 3.21 persons per family.
| Family Type | # Families | Family Size |
| Married-Couple | 2,739 (62.9%) | 3.52 |
| Single Male/Father | 411 (9.4%) | 3.56 |
| Single Female/Mother | 1,206 (27.7%) | 3.21 |
| Total Families | 4,356 (100.0%) | 3.44 |
Median Household Size in Painesville
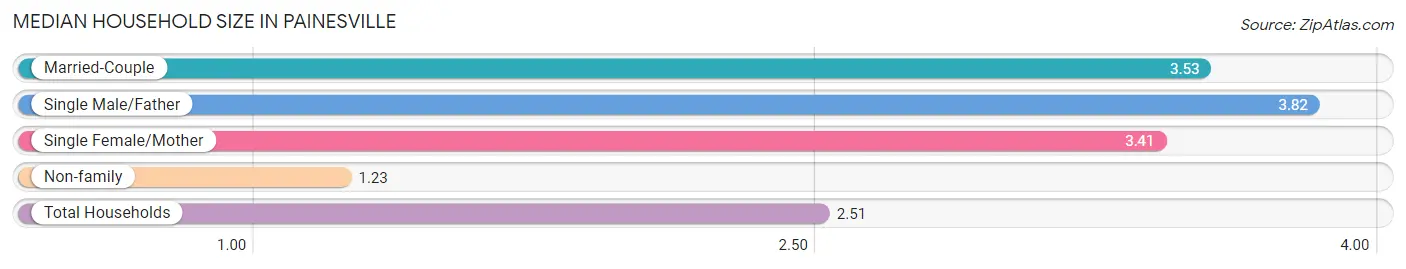
The median household size in Painesville is 2.51 persons per household, with single male/father households (411 | 5.3%) accounting for the largest median household size of 3.82 persons per household. non-family households (3,431 | 44.1%) represent the smallest median household size with 1.23 persons per household.
| Household Type | # Households | Household Size |
| Married-Couple | 2,739 (35.2%) | 3.53 |
| Single Male/Father | 411 (5.3%) | 3.82 |
| Single Female/Mother | 1,206 (15.5%) | 3.41 |
| Non-family | 3,431 (44.1%) | 1.23 |
| Total Households | 7,787 (100.0%) | 2.51 |
Household Size by Marriage Status in Painesville
Out of a total of 7,787 households in Painesville, 4,356 (55.9%) are family households, while 3,431 (44.1%) are nonfamily households. The most numerous type of family households are 2-person households, comprising 1,581, and the most common type of nonfamily households are 1-person households, comprising 2,693.
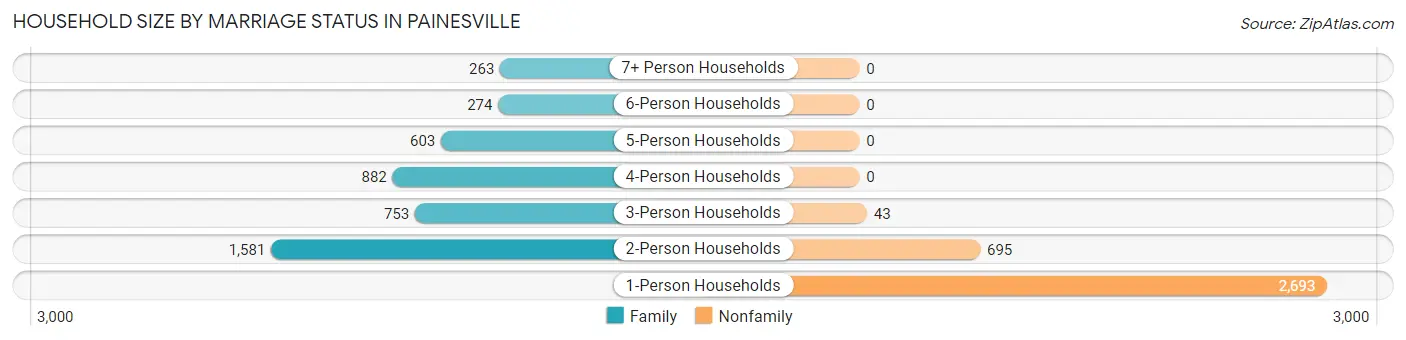
| Household Size | Family Households | Nonfamily Households |
| 1-Person Households | - | 2,693 (34.6%) |
| 2-Person Households | 1,581 (20.3%) | 695 (8.9%) |
| 3-Person Households | 753 (9.7%) | 43 (0.5%) |
| 4-Person Households | 882 (11.3%) | 0 (0.0%) |
| 5-Person Households | 603 (7.7%) | 0 (0.0%) |
| 6-Person Households | 274 (3.5%) | 0 (0.0%) |
| 7+ Person Households | 263 (3.4%) | 0 (0.0%) |
| Total | 4,356 (55.9%) | 3,431 (44.1%) |
Female Fertility in Painesville
Fertility by Age in Painesville
Average fertility rate in Painesville is 91.0 births per 1,000 women. Women in the age bracket of 20 to 34 years have the highest fertility rate with 191.0 births per 1,000 women. Women in the age bracket of 20 to 34 years acount for 75.7% of all women with births.
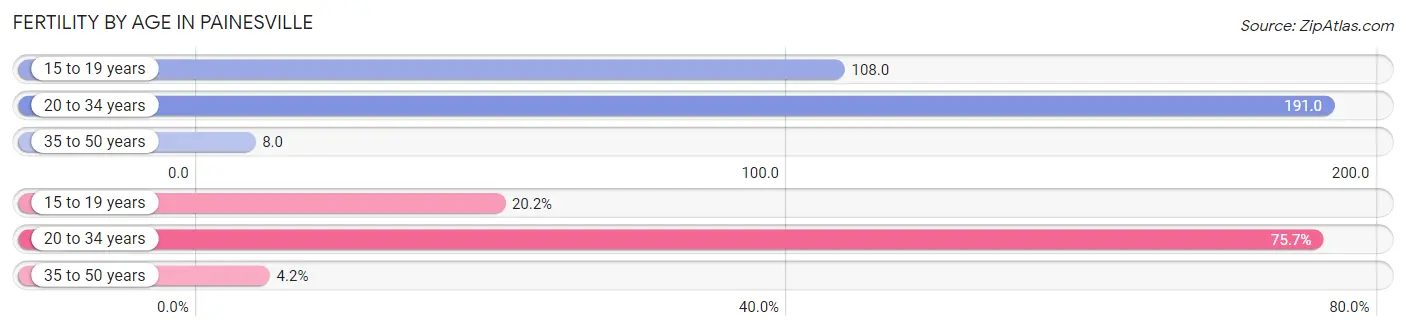
| Age Bracket | Women with Births | Births / 1,000 Women |
| 15 to 19 years | 82 (20.2%) | 108.0 |
| 20 to 34 years | 308 (75.7%) | 191.0 |
| 35 to 50 years | 17 (4.2%) | 8.0 |
| Total | 407 (100.0%) | 91.0 |
Fertility by Age by Marriage Status in Painesville
60.9% of women with births (407) in Painesville are married. The highest percentage of unmarried women with births falls into 15 to 19 years age bracket with 100.0% of them unmarried at the time of birth, while the lowest percentage of unmarried women with births belong to 20 to 34 years age bracket with 22.4% of them unmarried.
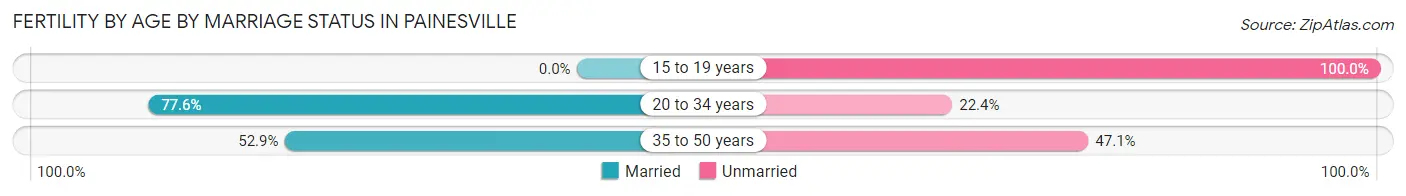
| Age Bracket | Married | Unmarried |
| 15 to 19 years | 0 (0.0%) | 82 (100.0%) |
| 20 to 34 years | 239 (77.6%) | 69 (22.4%) |
| 35 to 50 years | 9 (52.9%) | 8 (47.1%) |
| Total | 248 (60.9%) | 159 (39.1%) |
Fertility by Education in Painesville
Average fertility rate in Painesville is 91.0 births per 1,000 women. Women with the education attainment of high school diploma have the highest fertility rate of 166.0 births per 1,000 women, while women with the education attainment of graduate degree have the lowest fertility at 8.0 births per 1,000 women. Women with the education attainment of high school diploma represent 45.0% of all women with births.
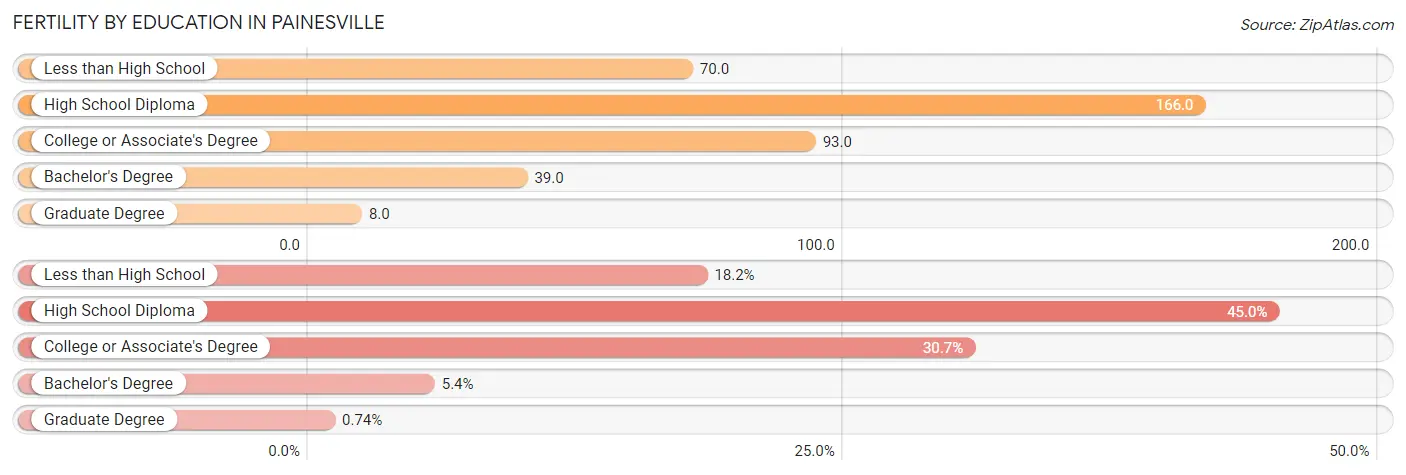
| Educational Attainment | Women with Births | Births / 1,000 Women |
| Less than High School | 74 (18.2%) | 70.0 |
| High School Diploma | 183 (45.0%) | 166.0 |
| College or Associate's Degree | 125 (30.7%) | 93.0 |
| Bachelor's Degree | 22 (5.4%) | 39.0 |
| Graduate Degree | 3 (0.7%) | 8.0 |
| Total | 407 (100.0%) | 91.0 |
Fertility by Education by Marriage Status in Painesville
39.1% of women with births in Painesville are unmarried. Women with the educational attainment of bachelor's degree are most likely to be married with 100.0% of them married at childbirth, while women with the educational attainment of less than high school are least likely to be married with 87.8% of them unmarried at childbirth.
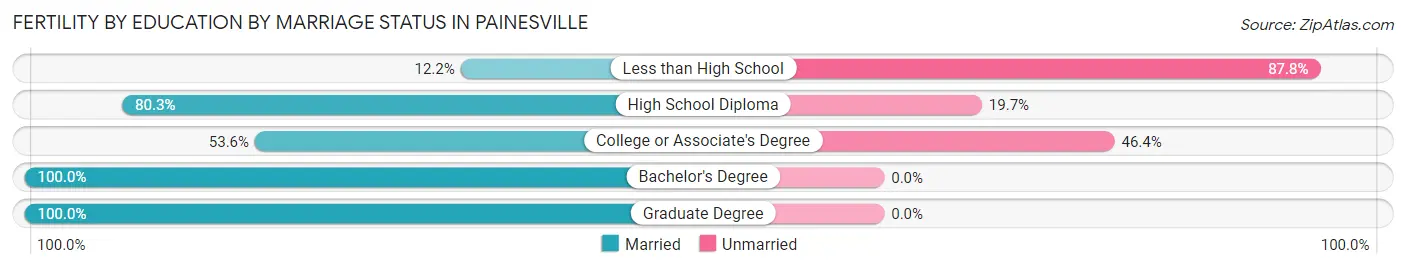
| Educational Attainment | Married | Unmarried |
| Less than High School | 9 (12.2%) | 65 (87.8%) |
| High School Diploma | 147 (80.3%) | 36 (19.7%) |
| College or Associate's Degree | 67 (53.6%) | 58 (46.4%) |
| Bachelor's Degree | 22 (100.0%) | 0 (0.0%) |
| Graduate Degree | 3 (100.0%) | 0 (0.0%) |
| Total | 248 (60.9%) | 159 (39.1%) |
Employment Characteristics in Painesville
Employment by Class of Employer in Painesville
Among the 9,051 employed individuals in Painesville, private company employees (7,034 | 77.7%), not-for-profit organizations (830 | 9.2%), and local government employees (484 | 5.3%) make up the most common classes of employment.
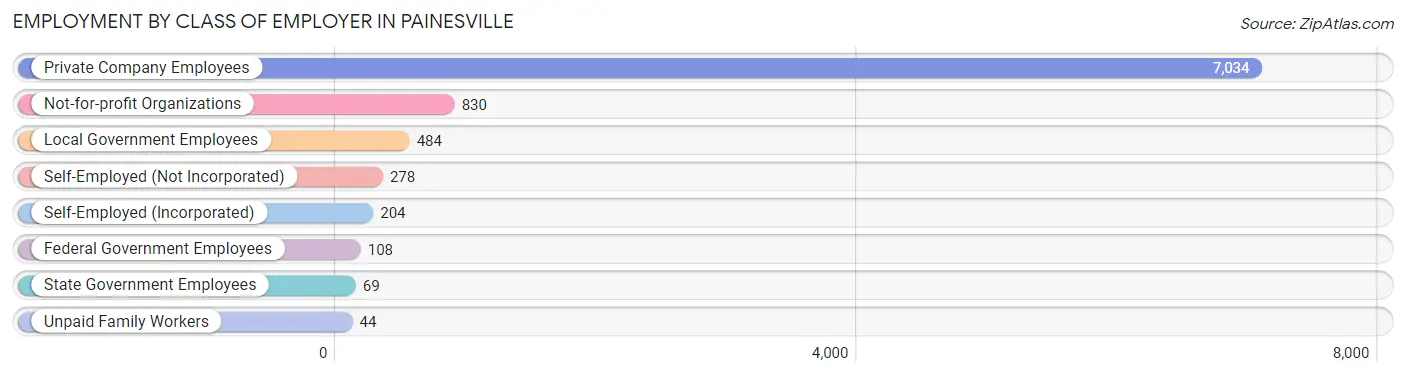
| Employer Class | # Employees | % Employees |
| Private Company Employees | 7,034 | 77.7% |
| Self-Employed (Incorporated) | 204 | 2.2% |
| Self-Employed (Not Incorporated) | 278 | 3.1% |
| Not-for-profit Organizations | 830 | 9.2% |
| Local Government Employees | 484 | 5.3% |
| State Government Employees | 69 | 0.8% |
| Federal Government Employees | 108 | 1.2% |
| Unpaid Family Workers | 44 | 0.5% |
| Total | 9,051 | 100.0% |
Employment Status by Age in Painesville
According to the labor force statistics for Painesville, out of the total population over 16 years of age (15,072), 64.4% or 9,706 individuals are in the labor force, with 4.8% or 466 of them unemployed. The age group with the highest labor force participation rate is 25 to 29 years, with 87.2% or 1,301 individuals in the labor force. Within the labor force, the 55 to 59 years age range has the highest percentage of unemployed individuals, with 8.3% or 49 of them being unemployed.
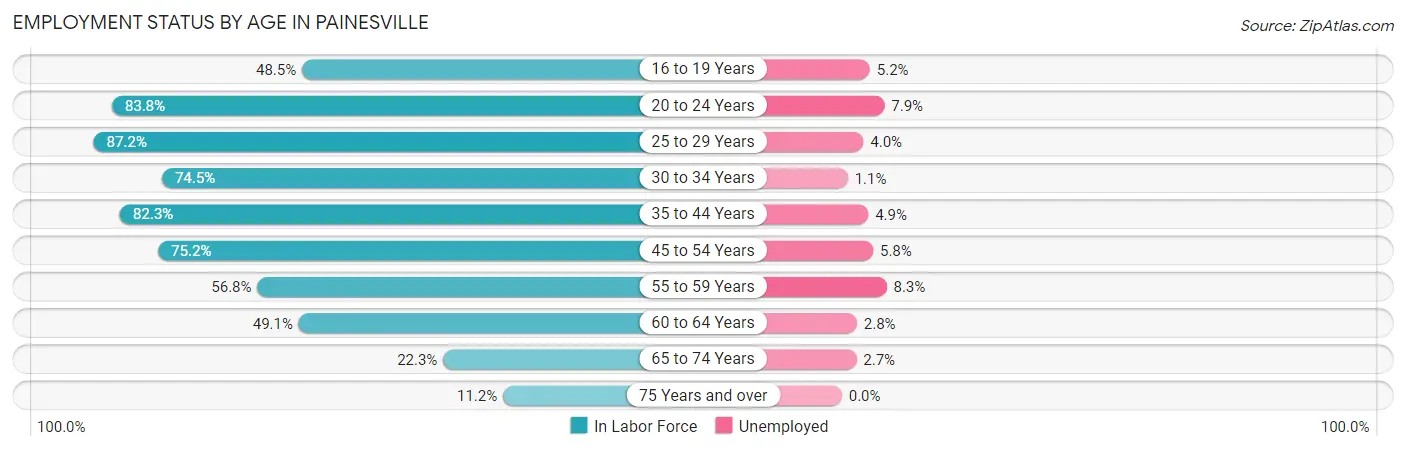
| Age Bracket | In Labor Force | Unemployed |
| 16 to 19 Years | 621 (48.5%) | 32 (5.2%) |
| 20 to 24 Years | 913 (83.8%) | 72 (7.9%) |
| 25 to 29 Years | 1,301 (87.2%) | 52 (4.0%) |
| 30 to 34 Years | 1,056 (74.5%) | 12 (1.1%) |
| 35 to 44 Years | 2,509 (82.3%) | 123 (4.9%) |
| 45 to 54 Years | 1,761 (75.2%) | 102 (5.8%) |
| 55 to 59 Years | 589 (56.8%) | 49 (8.3%) |
| 60 to 64 Years | 539 (49.1%) | 15 (2.8%) |
| 65 to 74 Years | 331 (22.3%) | 9 (2.7%) |
| 75 Years and over | 88 (11.2%) | 0 (0.0%) |
| Total | 9,706 (64.4%) | 466 (4.8%) |
Employment Status by Educational Attainment in Painesville
According to labor force statistics for Painesville, 74.3% of individuals (7,752) out of the total population between 25 and 64 years of age (10,433) are in the labor force, with 4.6% or 357 of them being unemployed. The group with the highest labor force participation rate are those with the educational attainment of bachelor's degree or higher, with 89.5% or 2,010 individuals in the labor force. Within the labor force, individuals with less than high school education have the highest percentage of unemployment, with 13.2% or 165 of them being unemployed.
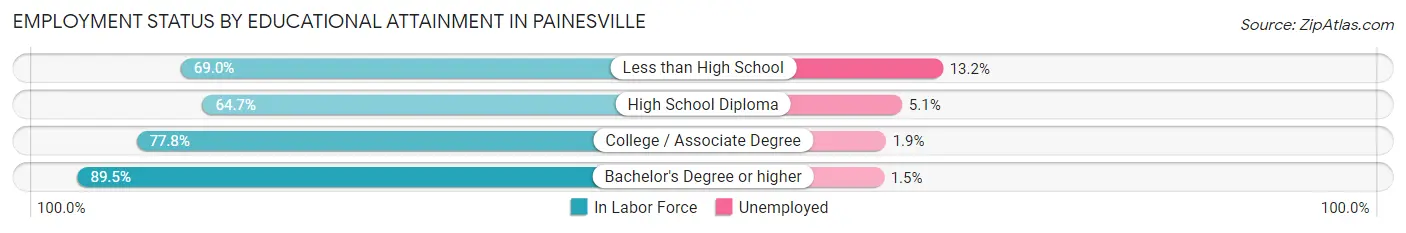
| Educational Attainment | In Labor Force | Unemployed |
| Less than High School | 1,247 (69.0%) | 239 (13.2%) |
| High School Diploma | 2,294 (64.7%) | 181 (5.1%) |
| College / Associate Degree | 2,206 (77.8%) | 54 (1.9%) |
| Bachelor's Degree or higher | 2,010 (89.5%) | 34 (1.5%) |
| Total | 7,752 (74.3%) | 480 (4.6%) |
Employment Occupations by Sex in Painesville
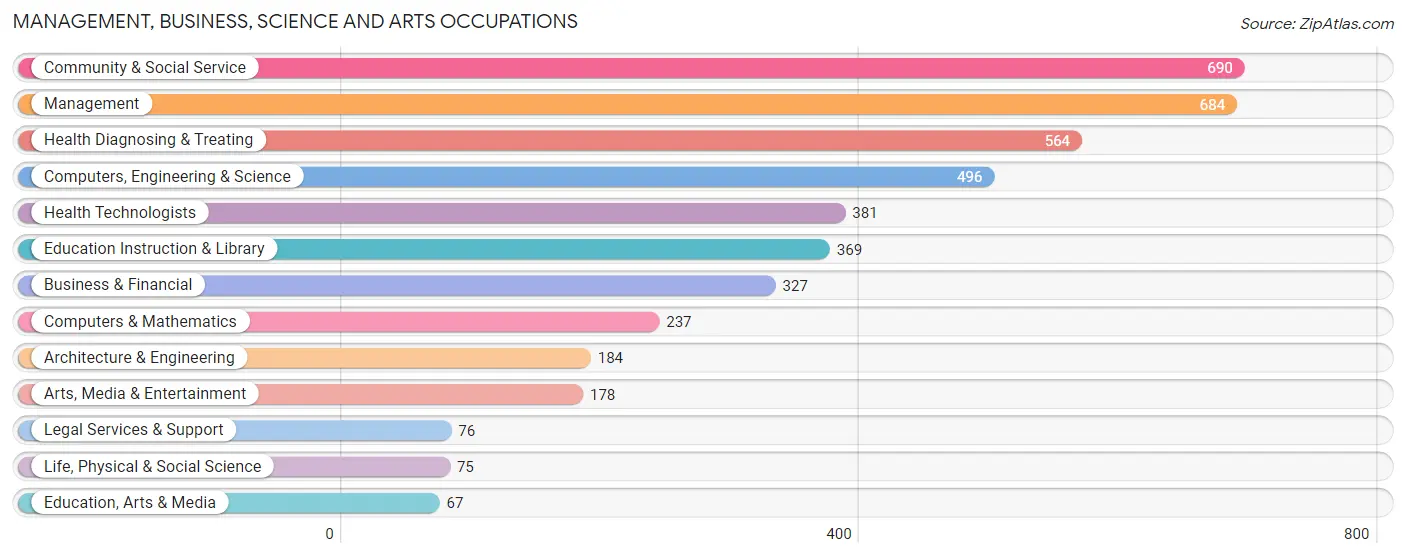
Management, Business, Science and Arts Occupations
The most common Management, Business, Science and Arts occupations in Painesville are Community & Social Service (690 | 7.5%), Management (684 | 7.4%), Health Diagnosing & Treating (564 | 6.1%), Computers, Engineering & Science (496 | 5.4%), and Health Technologists (381 | 4.1%).
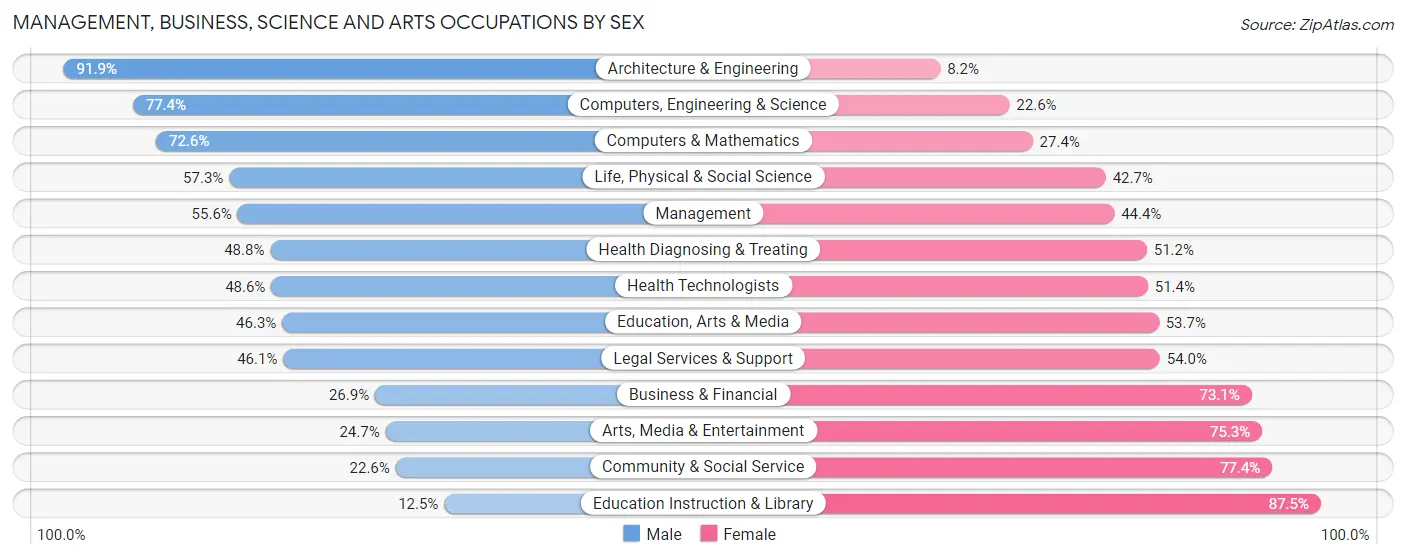
Management, Business, Science and Arts Occupations by Sex
Within the Management, Business, Science and Arts occupations in Painesville, the most male-oriented occupations are Architecture & Engineering (91.8%), Computers, Engineering & Science (77.4%), and Computers & Mathematics (72.6%), while the most female-oriented occupations are Education Instruction & Library (87.5%), Community & Social Service (77.4%), and Arts, Media & Entertainment (75.3%).
| Occupation | Male | Female |
| Management | 380 (55.6%) | 304 (44.4%) |
| Business & Financial | 88 (26.9%) | 239 (73.1%) |
| Computers, Engineering & Science | 384 (77.4%) | 112 (22.6%) |
| Computers & Mathematics | 172 (72.6%) | 65 (27.4%) |
| Architecture & Engineering | 169 (91.8%) | 15 (8.2%) |
| Life, Physical & Social Science | 43 (57.3%) | 32 (42.7%) |
| Community & Social Service | 156 (22.6%) | 534 (77.4%) |
| Education, Arts & Media | 31 (46.3%) | 36 (53.7%) |
| Legal Services & Support | 35 (46.1%) | 41 (53.9%) |
| Education Instruction & Library | 46 (12.5%) | 323 (87.5%) |
| Arts, Media & Entertainment | 44 (24.7%) | 134 (75.3%) |
| Health Diagnosing & Treating | 275 (48.8%) | 289 (51.2%) |
| Health Technologists | 185 (48.6%) | 196 (51.4%) |
| Total (Category) | 1,283 (46.5%) | 1,478 (53.5%) |
| Total (Overall) | 5,066 (54.8%) | 4,173 (45.2%) |
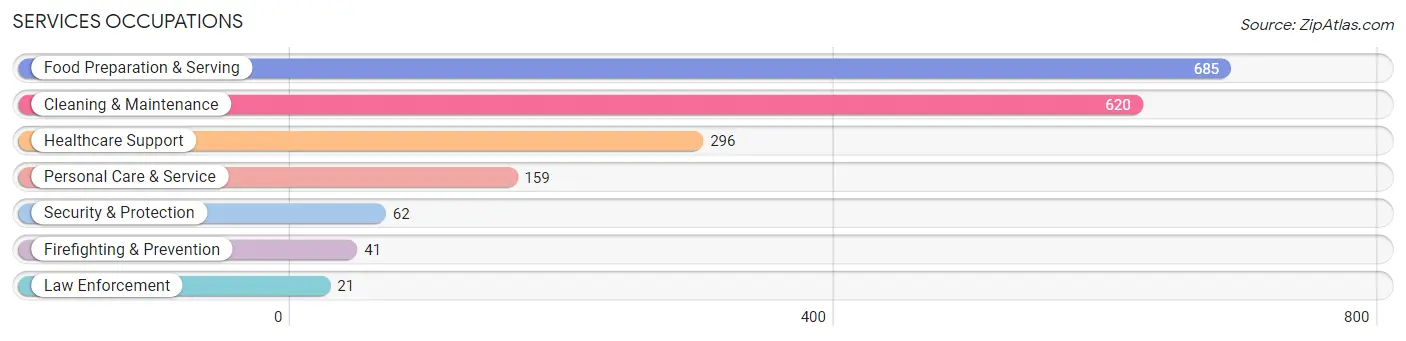
Services Occupations
The most common Services occupations in Painesville are Food Preparation & Serving (685 | 7.4%), Cleaning & Maintenance (620 | 6.7%), Healthcare Support (296 | 3.2%), Personal Care & Service (159 | 1.7%), and Security & Protection (62 | 0.7%).
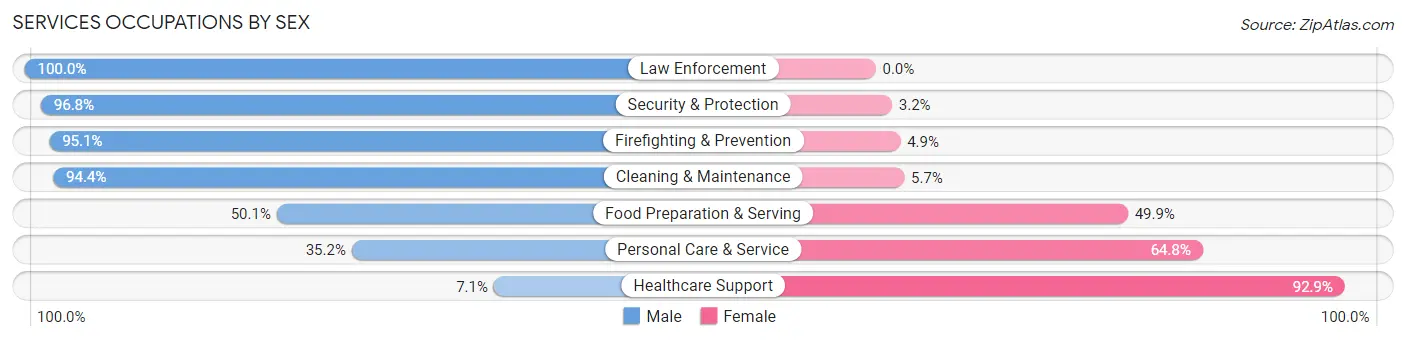
Services Occupations by Sex
Within the Services occupations in Painesville, the most male-oriented occupations are Law Enforcement (100.0%), Security & Protection (96.8%), and Firefighting & Prevention (95.1%), while the most female-oriented occupations are Healthcare Support (92.9%), Personal Care & Service (64.8%), and Food Preparation & Serving (49.9%).
| Occupation | Male | Female |
| Healthcare Support | 21 (7.1%) | 275 (92.9%) |
| Security & Protection | 60 (96.8%) | 2 (3.2%) |
| Firefighting & Prevention | 39 (95.1%) | 2 (4.9%) |
| Law Enforcement | 21 (100.0%) | 0 (0.0%) |
| Food Preparation & Serving | 343 (50.1%) | 342 (49.9%) |
| Cleaning & Maintenance | 585 (94.4%) | 35 (5.7%) |
| Personal Care & Service | 56 (35.2%) | 103 (64.8%) |
| Total (Category) | 1,065 (58.5%) | 757 (41.5%) |
| Total (Overall) | 5,066 (54.8%) | 4,173 (45.2%) |
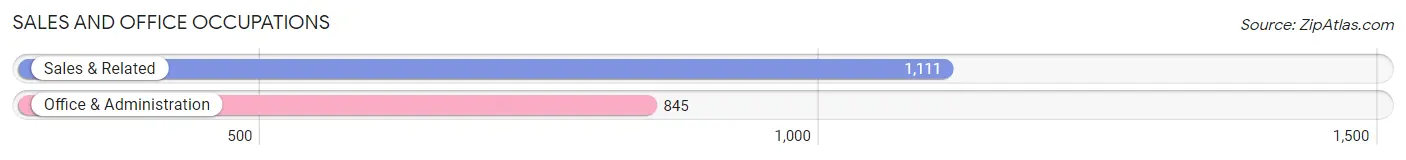
Sales and Office Occupations
The most common Sales and Office occupations in Painesville are Sales & Related (1,111 | 12.0%), and Office & Administration (845 | 9.1%).
Sales and Office Occupations by Sex
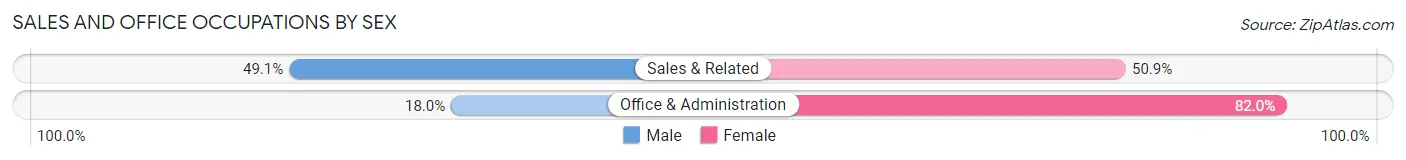
| Occupation | Male | Female |
| Sales & Related | 546 (49.1%) | 565 (50.9%) |
| Office & Administration | 152 (18.0%) | 693 (82.0%) |
| Total (Category) | 698 (35.7%) | 1,258 (64.3%) |
| Total (Overall) | 5,066 (54.8%) | 4,173 (45.2%) |
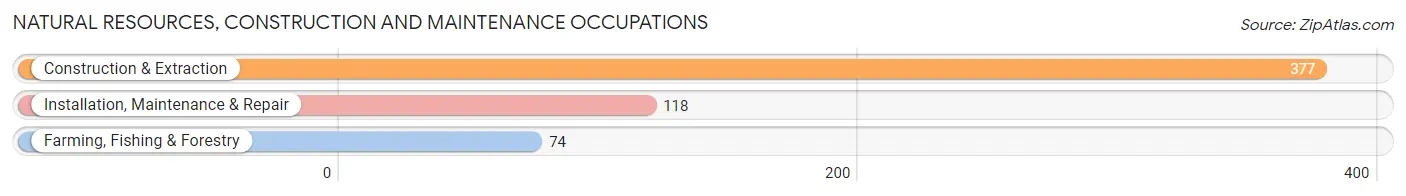
Natural Resources, Construction and Maintenance Occupations
The most common Natural Resources, Construction and Maintenance occupations in Painesville are Construction & Extraction (377 | 4.1%), Installation, Maintenance & Repair (118 | 1.3%), and Farming, Fishing & Forestry (74 | 0.8%).
Natural Resources, Construction and Maintenance Occupations by Sex
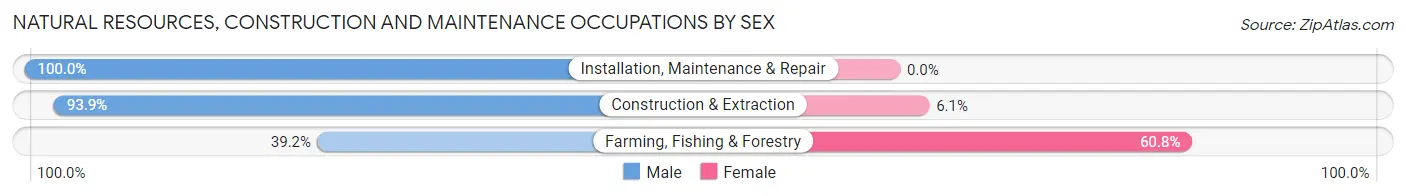
| Occupation | Male | Female |
| Farming, Fishing & Forestry | 29 (39.2%) | 45 (60.8%) |
| Construction & Extraction | 354 (93.9%) | 23 (6.1%) |
| Installation, Maintenance & Repair | 118 (100.0%) | 0 (0.0%) |
| Total (Category) | 501 (88.0%) | 68 (11.9%) |
| Total (Overall) | 5,066 (54.8%) | 4,173 (45.2%) |
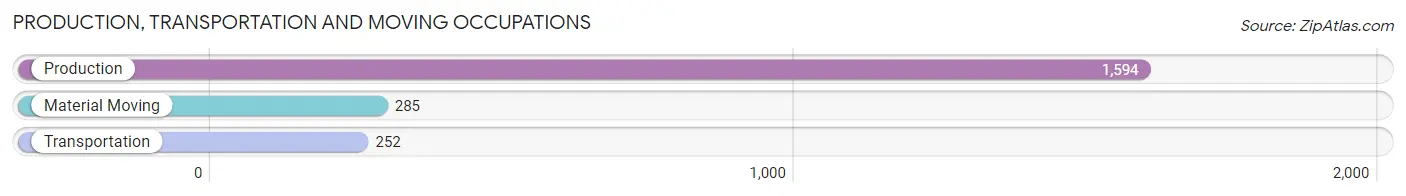
Production, Transportation and Moving Occupations
The most common Production, Transportation and Moving occupations in Painesville are Production (1,594 | 17.2%), Material Moving (285 | 3.1%), and Transportation (252 | 2.7%).
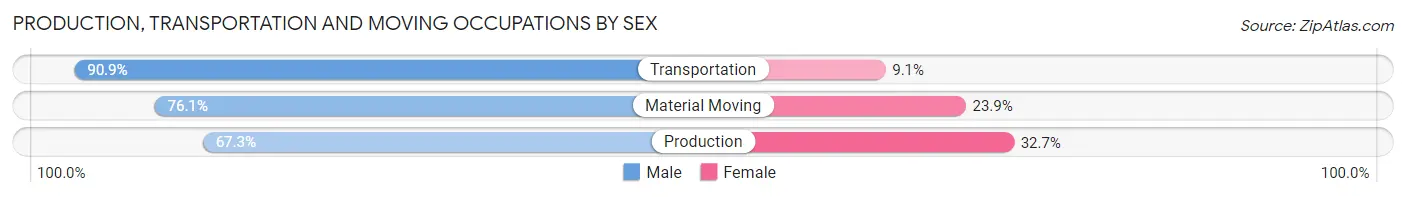
Production, Transportation and Moving Occupations by Sex
| Occupation | Male | Female |
| Production | 1,073 (67.3%) | 521 (32.7%) |
| Transportation | 229 (90.9%) | 23 (9.1%) |
| Material Moving | 217 (76.1%) | 68 (23.9%) |
| Total (Category) | 1,519 (71.3%) | 612 (28.7%) |
| Total (Overall) | 5,066 (54.8%) | 4,173 (45.2%) |
Employment Industries by Sex in Painesville
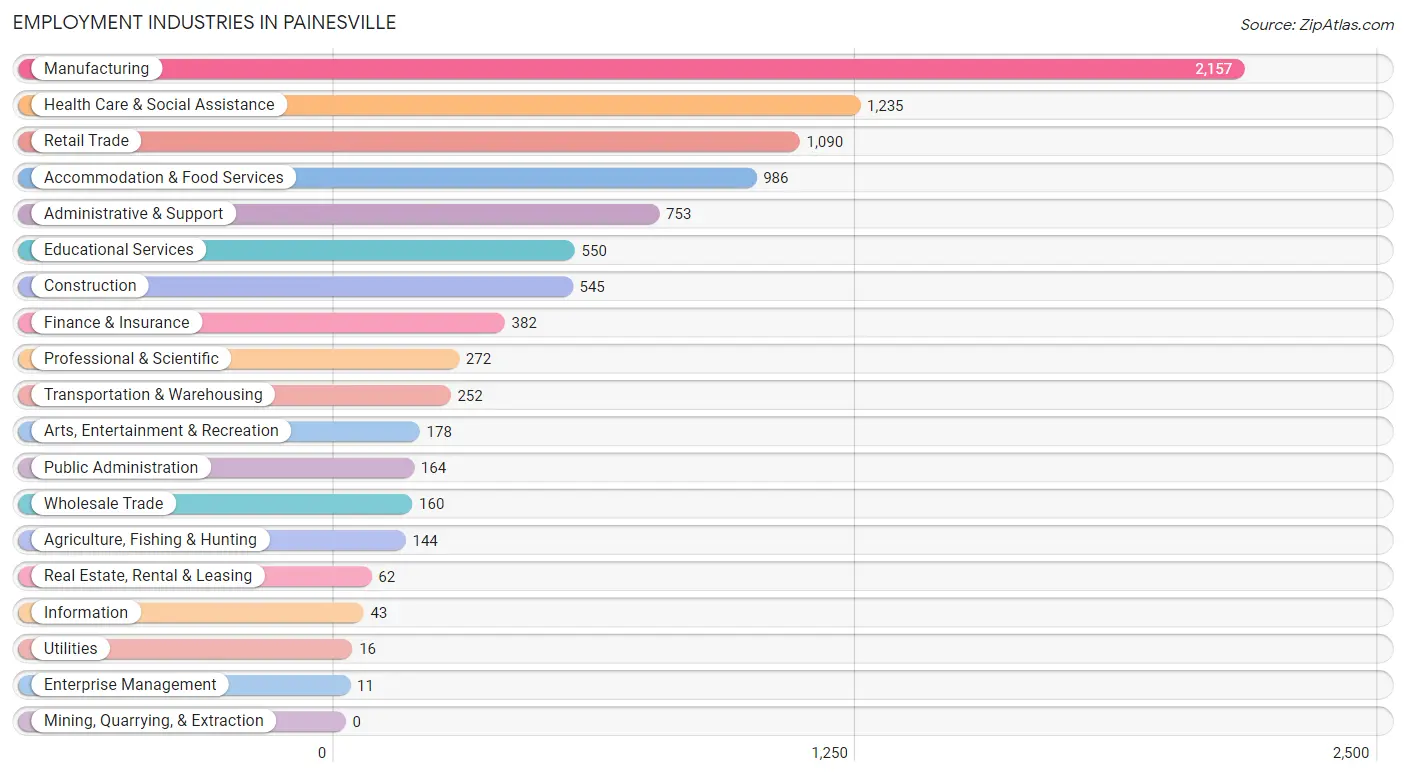
Employment Industries in Painesville
The major employment industries in Painesville include Manufacturing (2,157 | 23.4%), Health Care & Social Assistance (1,235 | 13.4%), Retail Trade (1,090 | 11.8%), Accommodation & Food Services (986 | 10.7%), and Administrative & Support (753 | 8.2%).
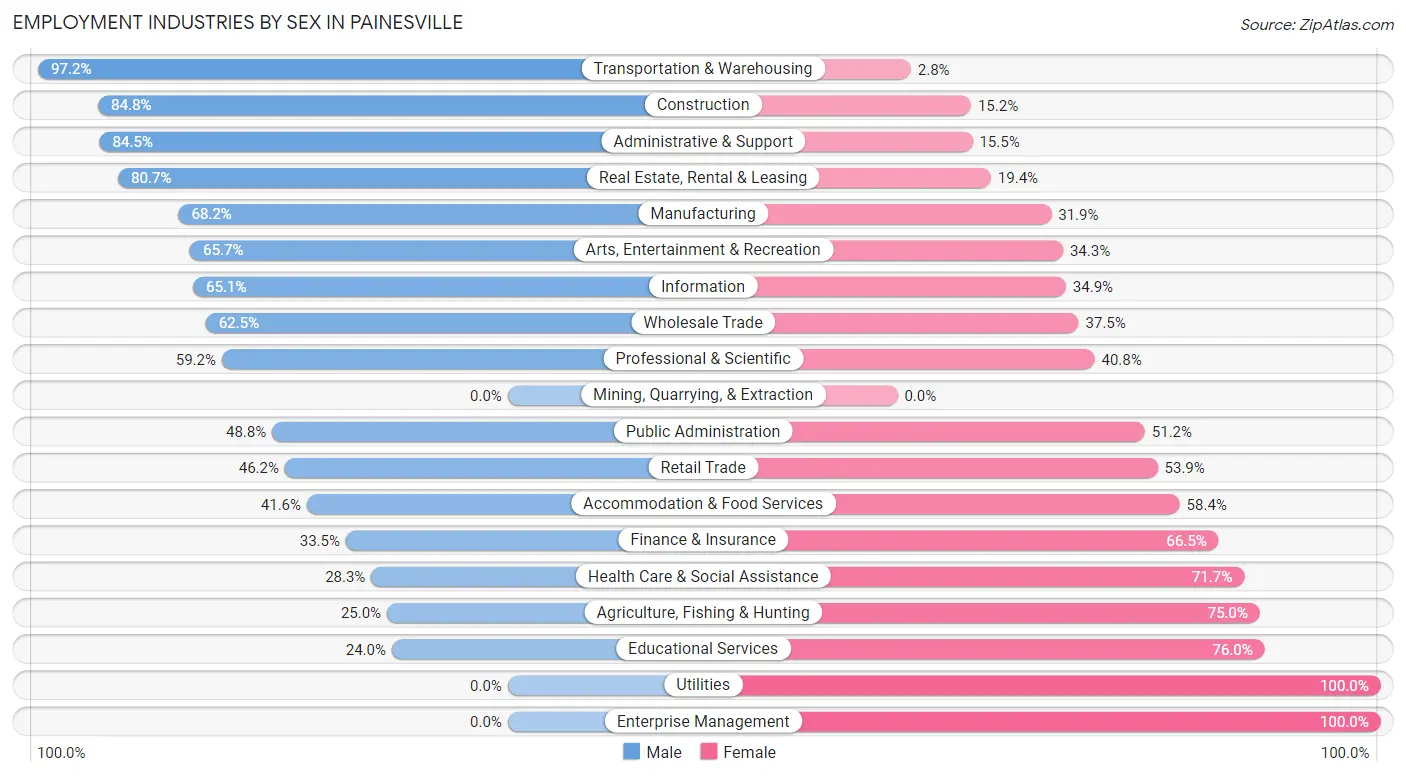
Employment Industries by Sex in Painesville
The Painesville industries that see more men than women are Transportation & Warehousing (97.2%), Construction (84.8%), and Administrative & Support (84.5%), whereas the industries that tend to have a higher number of women are Utilities (100.0%), Enterprise Management (100.0%), and Educational Services (76.0%).
| Industry | Male | Female |
| Agriculture, Fishing & Hunting | 36 (25.0%) | 108 (75.0%) |
| Mining, Quarrying, & Extraction | 0 (0.0%) | 0 (0.0%) |
| Construction | 462 (84.8%) | 83 (15.2%) |
| Manufacturing | 1,470 (68.1%) | 687 (31.9%) |
| Wholesale Trade | 100 (62.5%) | 60 (37.5%) |
| Retail Trade | 503 (46.2%) | 587 (53.8%) |
| Transportation & Warehousing | 245 (97.2%) | 7 (2.8%) |
| Utilities | 0 (0.0%) | 16 (100.0%) |
| Information | 28 (65.1%) | 15 (34.9%) |
| Finance & Insurance | 128 (33.5%) | 254 (66.5%) |
| Real Estate, Rental & Leasing | 50 (80.6%) | 12 (19.4%) |
| Professional & Scientific | 161 (59.2%) | 111 (40.8%) |
| Enterprise Management | 0 (0.0%) | 11 (100.0%) |
| Administrative & Support | 636 (84.5%) | 117 (15.5%) |
| Educational Services | 132 (24.0%) | 418 (76.0%) |
| Health Care & Social Assistance | 349 (28.3%) | 886 (71.7%) |
| Arts, Entertainment & Recreation | 117 (65.7%) | 61 (34.3%) |
| Accommodation & Food Services | 410 (41.6%) | 576 (58.4%) |
| Public Administration | 80 (48.8%) | 84 (51.2%) |
| Total | 5,066 (54.8%) | 4,173 (45.2%) |
Education in Painesville
School Enrollment in Painesville
The most common levels of schooling among the 5,948 students in Painesville are elementary school (1,524 | 25.6%), middle school (1,339 | 22.5%), and college / undergraduate (1,141 | 19.2%).
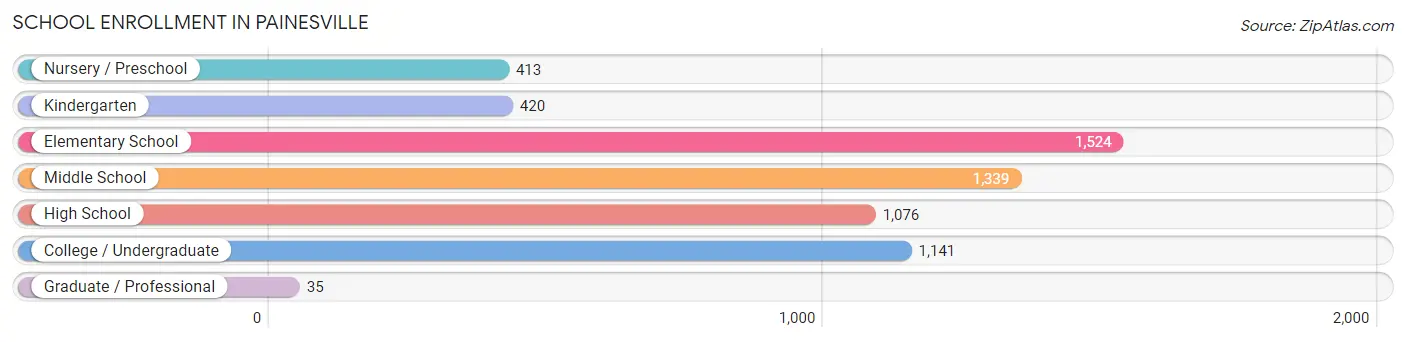
| School Level | # Students | % Students |
| Nursery / Preschool | 413 | 6.9% |
| Kindergarten | 420 | 7.1% |
| Elementary School | 1,524 | 25.6% |
| Middle School | 1,339 | 22.5% |
| High School | 1,076 | 18.1% |
| College / Undergraduate | 1,141 | 19.2% |
| Graduate / Professional | 35 | 0.6% |
| Total | 5,948 | 100.0% |
School Enrollment by Age by Funding Source in Painesville
Out of a total of 5,948 students who are enrolled in schools in Painesville, 922 (15.5%) attend a private institution, while the remaining 5,026 (84.5%) are enrolled in public schools. The age group of 18 to 19 year olds has the highest likelihood of being enrolled in private schools, with 236 (46.2% in the age bracket) enrolled. Conversely, the age group of 35 years and over has the lowest likelihood of being enrolled in a private school, with 191 (97.5% in the age bracket) attending a public institution.
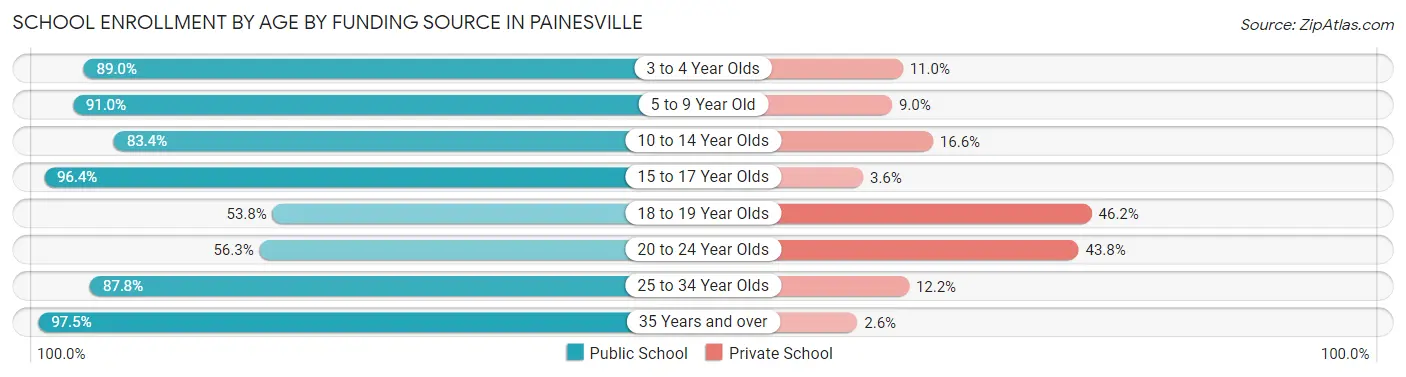
| Age Bracket | Public School | Private School |
| 3 to 4 Year Olds | 259 (89.0%) | 32 (11.0%) |
| 5 to 9 Year Old | 1,732 (91.0%) | 171 (9.0%) |
| 10 to 14 Year Olds | 1,360 (83.4%) | 271 (16.6%) |
| 15 to 17 Year Olds | 827 (96.4%) | 31 (3.6%) |
| 18 to 19 Year Olds | 275 (53.8%) | 236 (46.2%) |
| 20 to 24 Year Olds | 189 (56.2%) | 147 (43.8%) |
| 25 to 34 Year Olds | 195 (87.8%) | 27 (12.2%) |
| 35 Years and over | 191 (97.5%) | 5 (2.5%) |
| Total | 5,026 (84.5%) | 922 (15.5%) |
Educational Attainment by Field of Study in Painesville
Business (553 | 18.9%), education (345 | 11.8%), bio, nature & agricultural (255 | 8.7%), science & technology (239 | 8.2%), and social sciences (213 | 7.3%) are the most common fields of study among 2,928 individuals in Painesville who have obtained a bachelor's degree or higher.
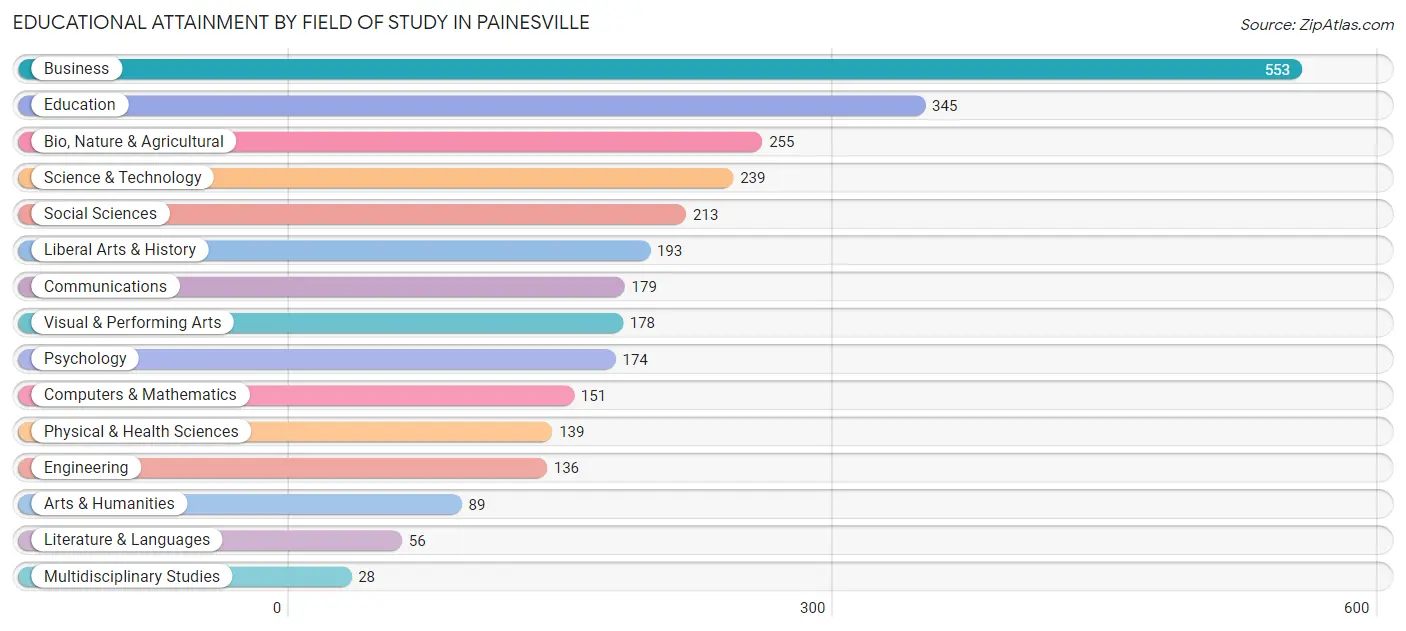
| Field of Study | # Graduates | % Graduates |
| Computers & Mathematics | 151 | 5.2% |
| Bio, Nature & Agricultural | 255 | 8.7% |
| Physical & Health Sciences | 139 | 4.8% |
| Psychology | 174 | 5.9% |
| Social Sciences | 213 | 7.3% |
| Engineering | 136 | 4.6% |
| Multidisciplinary Studies | 28 | 1.0% |
| Science & Technology | 239 | 8.2% |
| Business | 553 | 18.9% |
| Education | 345 | 11.8% |
| Literature & Languages | 56 | 1.9% |
| Liberal Arts & History | 193 | 6.6% |
| Visual & Performing Arts | 178 | 6.1% |
| Communications | 179 | 6.1% |
| Arts & Humanities | 89 | 3.0% |
| Total | 2,928 | 100.0% |
Transportation & Commute in Painesville
Vehicle Availability by Sex in Painesville
The most prevalent vehicle ownership categories in Painesville are males with 2 vehicles (2,363, accounting for 48.1%) and females with 2 vehicles (1,694, making up 59.6%).
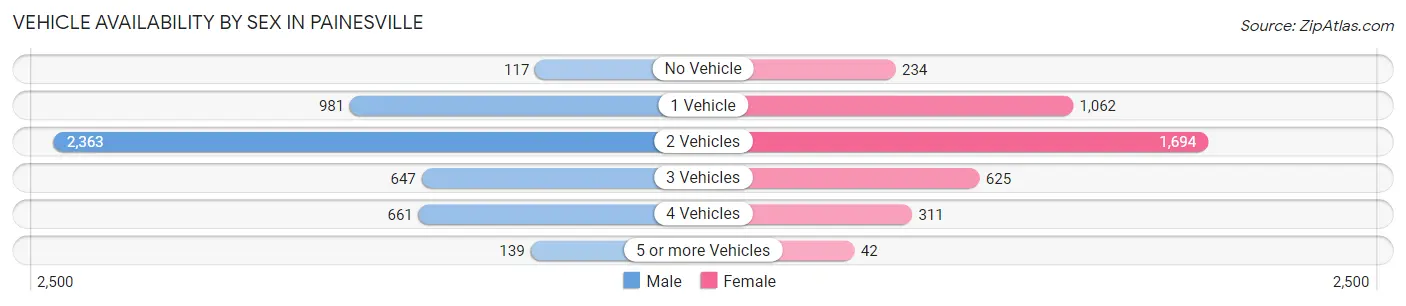
| Vehicles Available | Male | Female |
| No Vehicle | 117 (2.4%) | 234 (5.9%) |
| 1 Vehicle | 981 (20.0%) | 1,062 (26.8%) |
| 2 Vehicles | 2,363 (48.1%) | 1,694 (42.7%) |
| 3 Vehicles | 647 (13.2%) | 625 (15.8%) |
| 4 Vehicles | 661 (13.5%) | 311 (7.8%) |
| 5 or more Vehicles | 139 (2.8%) | 42 (1.1%) |
| Total | 4,908 (100.0%) | 3,968 (100.0%) |
Commute Time in Painesville
The most frequently occuring commute durations in Painesville are 15 to 19 minutes (1,522 commuters, 17.9%), 10 to 14 minutes (1,399 commuters, 16.5%), and 20 to 24 minutes (1,267 commuters, 14.9%).
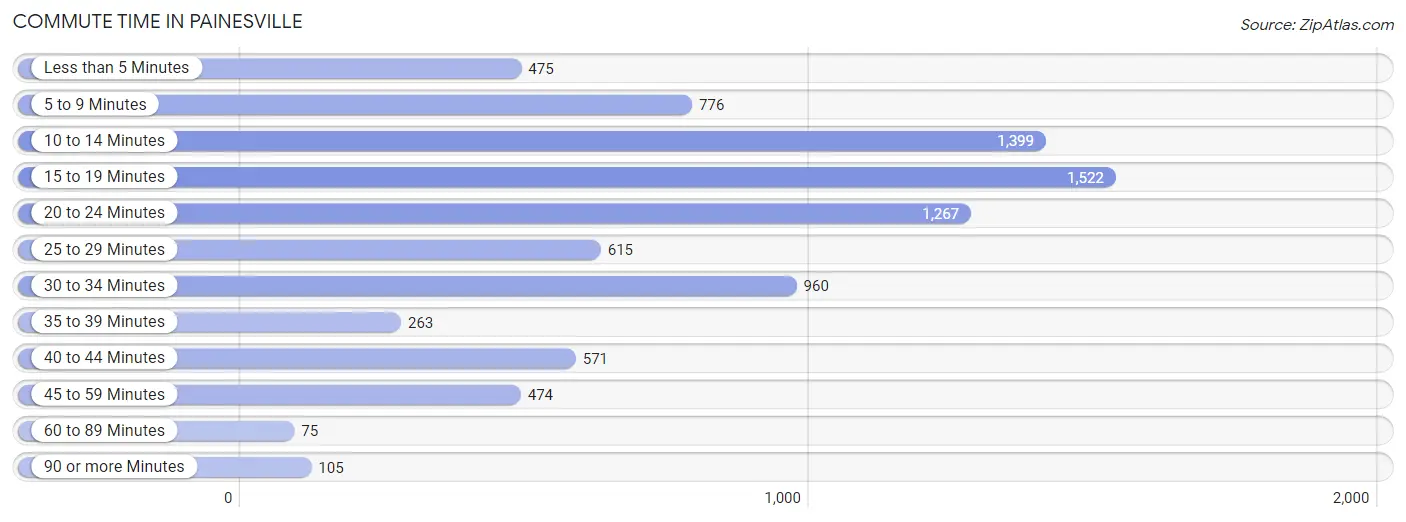
| Commute Time | # Commuters | % Commuters |
| Less than 5 Minutes | 475 | 5.6% |
| 5 to 9 Minutes | 776 | 9.1% |
| 10 to 14 Minutes | 1,399 | 16.5% |
| 15 to 19 Minutes | 1,522 | 17.9% |
| 20 to 24 Minutes | 1,267 | 14.9% |
| 25 to 29 Minutes | 615 | 7.2% |
| 30 to 34 Minutes | 960 | 11.3% |
| 35 to 39 Minutes | 263 | 3.1% |
| 40 to 44 Minutes | 571 | 6.7% |
| 45 to 59 Minutes | 474 | 5.6% |
| 60 to 89 Minutes | 75 | 0.9% |
| 90 or more Minutes | 105 | 1.2% |
Commute Time by Sex in Painesville
The most common commute times in Painesville are 30 to 34 minutes (777 commuters, 16.3%) for males and 15 to 19 minutes (828 commuters, 22.2%) for females.
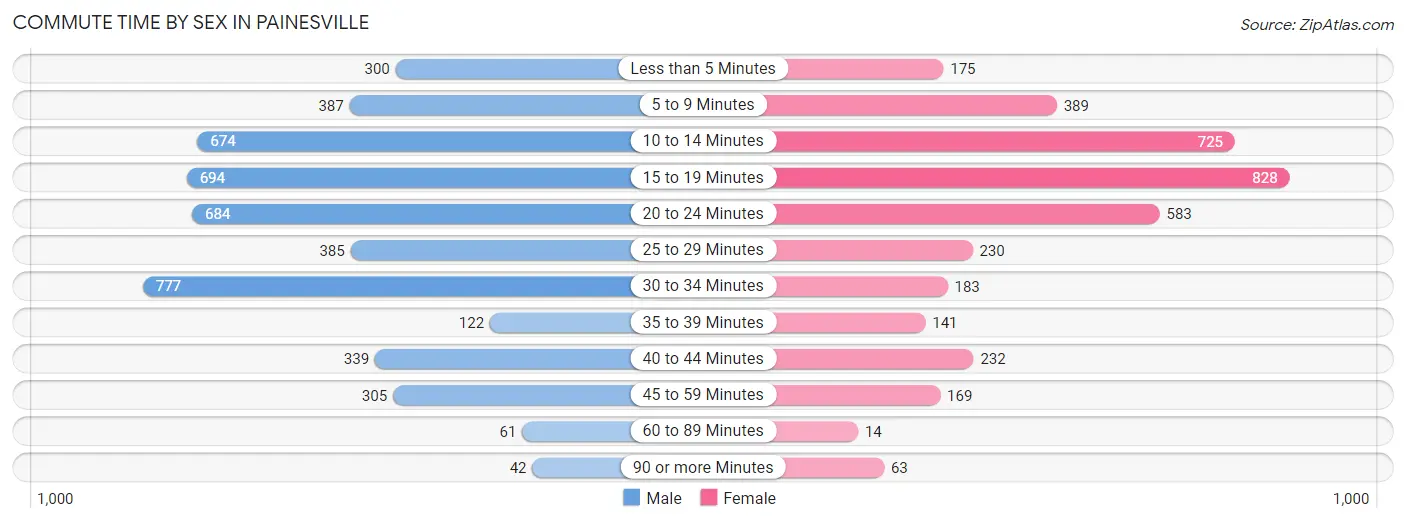
| Commute Time | Male | Female |
| Less than 5 Minutes | 300 (6.3%) | 175 (4.7%) |
| 5 to 9 Minutes | 387 (8.1%) | 389 (10.4%) |
| 10 to 14 Minutes | 674 (14.1%) | 725 (19.4%) |
| 15 to 19 Minutes | 694 (14.5%) | 828 (22.2%) |
| 20 to 24 Minutes | 684 (14.3%) | 583 (15.6%) |
| 25 to 29 Minutes | 385 (8.1%) | 230 (6.2%) |
| 30 to 34 Minutes | 777 (16.3%) | 183 (4.9%) |
| 35 to 39 Minutes | 122 (2.6%) | 141 (3.8%) |
| 40 to 44 Minutes | 339 (7.1%) | 232 (6.2%) |
| 45 to 59 Minutes | 305 (6.4%) | 169 (4.5%) |
| 60 to 89 Minutes | 61 (1.3%) | 14 (0.4%) |
| 90 or more Minutes | 42 (0.9%) | 63 (1.7%) |
Time of Departure to Work by Sex in Painesville
The most frequent times of departure to work in Painesville are 8:00 AM to 8:29 AM (721, 15.1%) for males and 4:00 PM to 11:59 PM (555, 14.9%) for females.
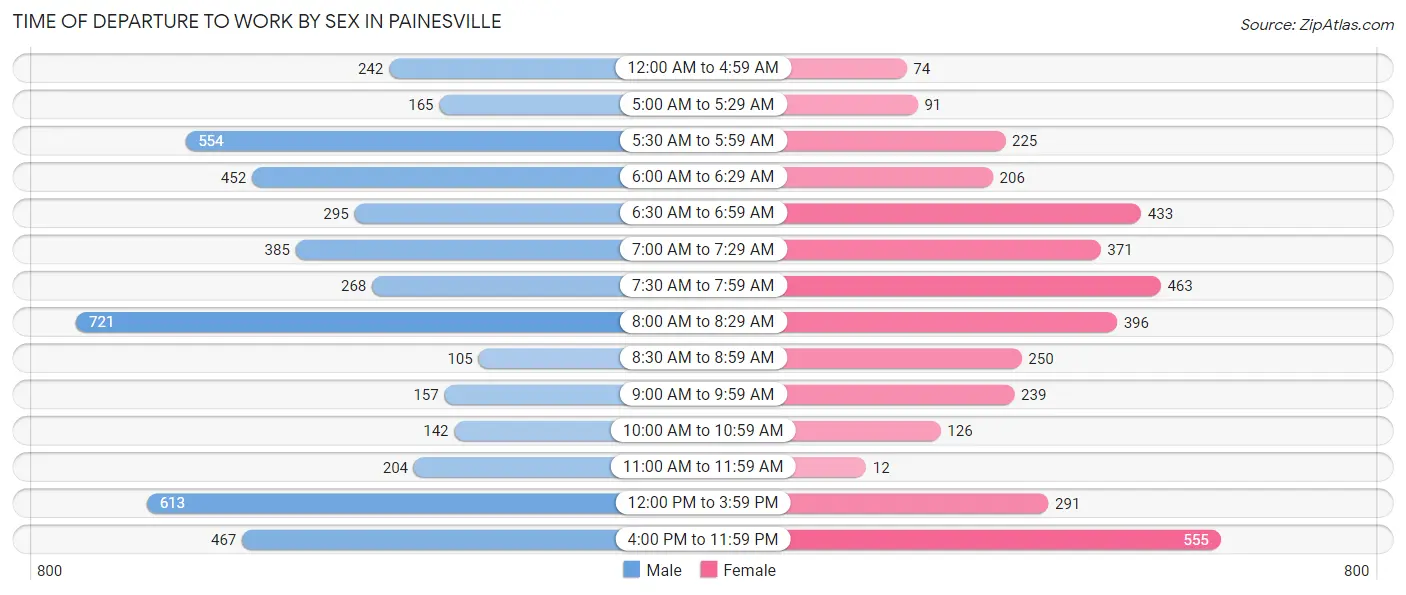
| Time of Departure | Male | Female |
| 12:00 AM to 4:59 AM | 242 (5.1%) | 74 (2.0%) |
| 5:00 AM to 5:29 AM | 165 (3.5%) | 91 (2.4%) |
| 5:30 AM to 5:59 AM | 554 (11.6%) | 225 (6.0%) |
| 6:00 AM to 6:29 AM | 452 (9.5%) | 206 (5.5%) |
| 6:30 AM to 6:59 AM | 295 (6.2%) | 433 (11.6%) |
| 7:00 AM to 7:29 AM | 385 (8.1%) | 371 (9.9%) |
| 7:30 AM to 7:59 AM | 268 (5.6%) | 463 (12.4%) |
| 8:00 AM to 8:29 AM | 721 (15.1%) | 396 (10.6%) |
| 8:30 AM to 8:59 AM | 105 (2.2%) | 250 (6.7%) |
| 9:00 AM to 9:59 AM | 157 (3.3%) | 239 (6.4%) |
| 10:00 AM to 10:59 AM | 142 (3.0%) | 126 (3.4%) |
| 11:00 AM to 11:59 AM | 204 (4.3%) | 12 (0.3%) |
| 12:00 PM to 3:59 PM | 613 (12.9%) | 291 (7.8%) |
| 4:00 PM to 11:59 PM | 467 (9.8%) | 555 (14.9%) |
| Total | 4,770 (100.0%) | 3,732 (100.0%) |
Housing Occupancy in Painesville
Occupancy by Ownership in Painesville
Of the total 7,787 dwellings in Painesville, owner-occupied units account for 3,755 (48.2%), while renter-occupied units make up 4,032 (51.8%).
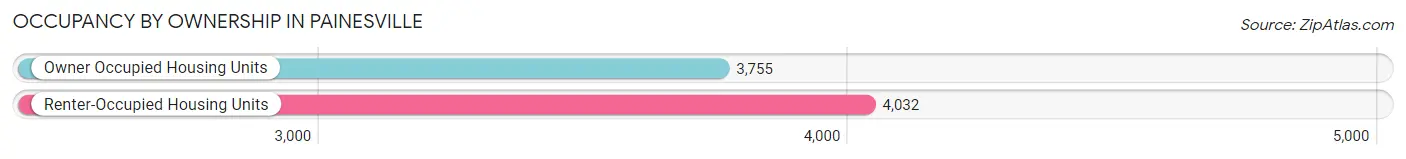
| Occupancy | # Housing Units | % Housing Units |
| Owner Occupied Housing Units | 3,755 | 48.2% |
| Renter-Occupied Housing Units | 4,032 | 51.8% |
| Total Occupied Housing Units | 7,787 | 100.0% |
Occupancy by Household Size in Painesville
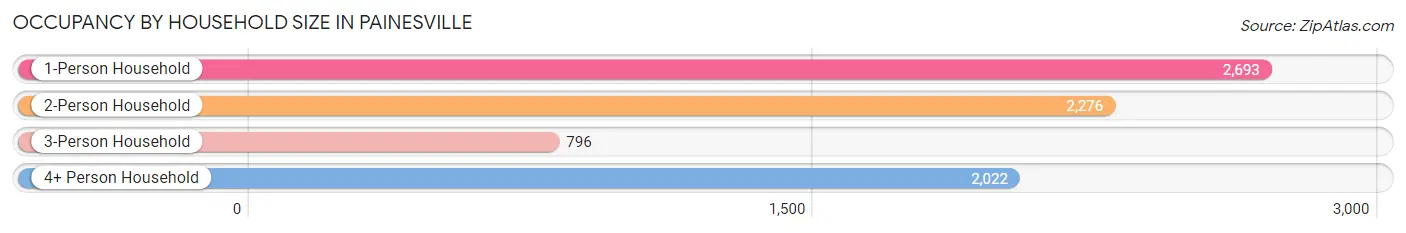
| Household Size | # Housing Units | % Housing Units |
| 1-Person Household | 2,693 | 34.6% |
| 2-Person Household | 2,276 | 29.2% |
| 3-Person Household | 796 | 10.2% |
| 4+ Person Household | 2,022 | 26.0% |
| Total Housing Units | 7,787 | 100.0% |
Occupancy by Ownership by Household Size in Painesville
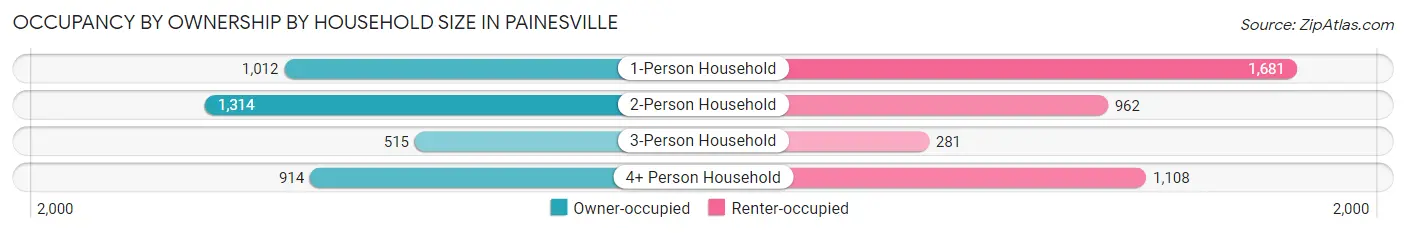
| Household Size | Owner-occupied | Renter-occupied |
| 1-Person Household | 1,012 (37.6%) | 1,681 (62.4%) |
| 2-Person Household | 1,314 (57.7%) | 962 (42.3%) |
| 3-Person Household | 515 (64.7%) | 281 (35.3%) |
| 4+ Person Household | 914 (45.2%) | 1,108 (54.8%) |
| Total Housing Units | 3,755 (48.2%) | 4,032 (51.8%) |
Occupancy by Educational Attainment in Painesville
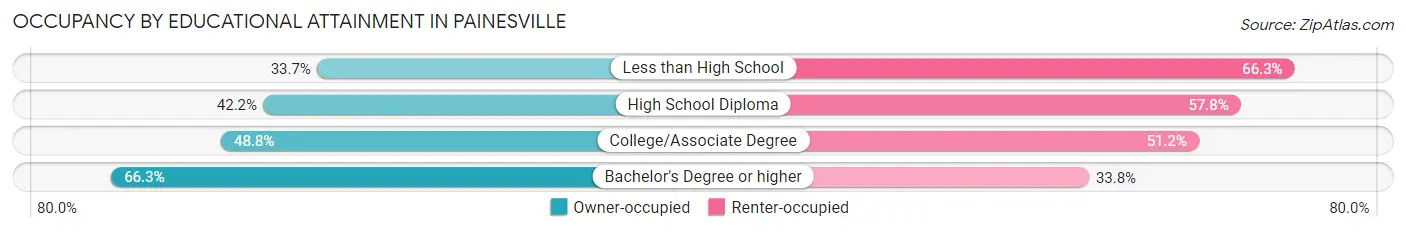
| Household Size | Owner-occupied | Renter-occupied |
| Less than High School | 403 (33.7%) | 794 (66.3%) |
| High School Diploma | 1,084 (42.2%) | 1,484 (57.8%) |
| College/Associate Degree | 1,112 (48.8%) | 1,165 (51.2%) |
| Bachelor's Degree or higher | 1,156 (66.2%) | 589 (33.8%) |
Occupancy by Age of Householder in Painesville
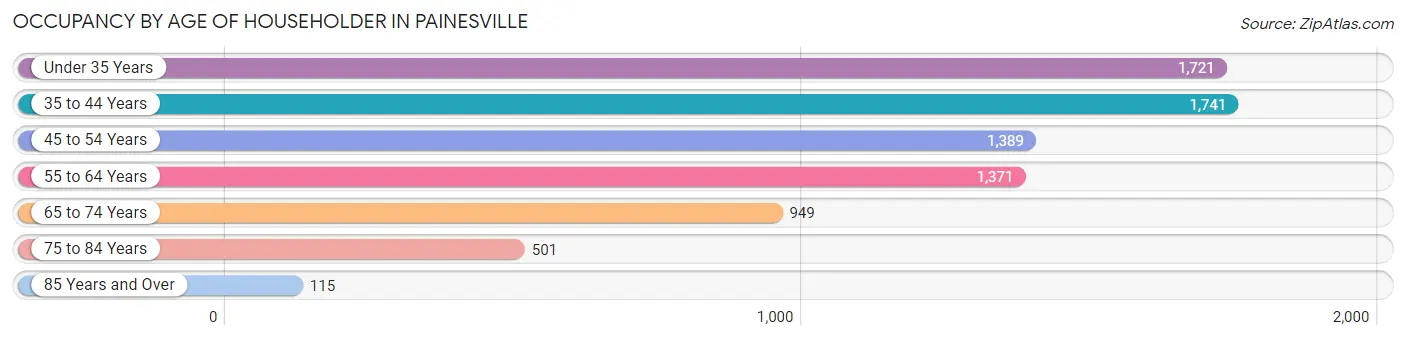
| Age Bracket | # Households | % Households |
| Under 35 Years | 1,721 | 22.1% |
| 35 to 44 Years | 1,741 | 22.4% |
| 45 to 54 Years | 1,389 | 17.8% |
| 55 to 64 Years | 1,371 | 17.6% |
| 65 to 74 Years | 949 | 12.2% |
| 75 to 84 Years | 501 | 6.4% |
| 85 Years and Over | 115 | 1.5% |
| Total | 7,787 | 100.0% |
Housing Finances in Painesville
Median Income by Occupancy in Painesville
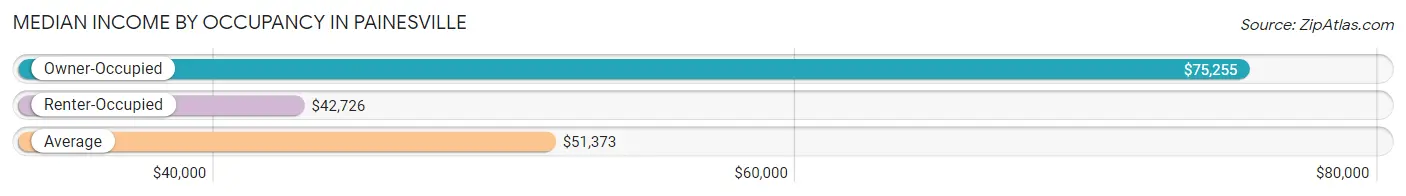
| Occupancy Type | # Households | Median Income |
| Owner-Occupied | 3,755 (48.2%) | $75,255 |
| Renter-Occupied | 4,032 (51.8%) | $42,726 |
| Average | 7,787 (100.0%) | $51,373 |
Occupancy by Householder Income Bracket in Painesville
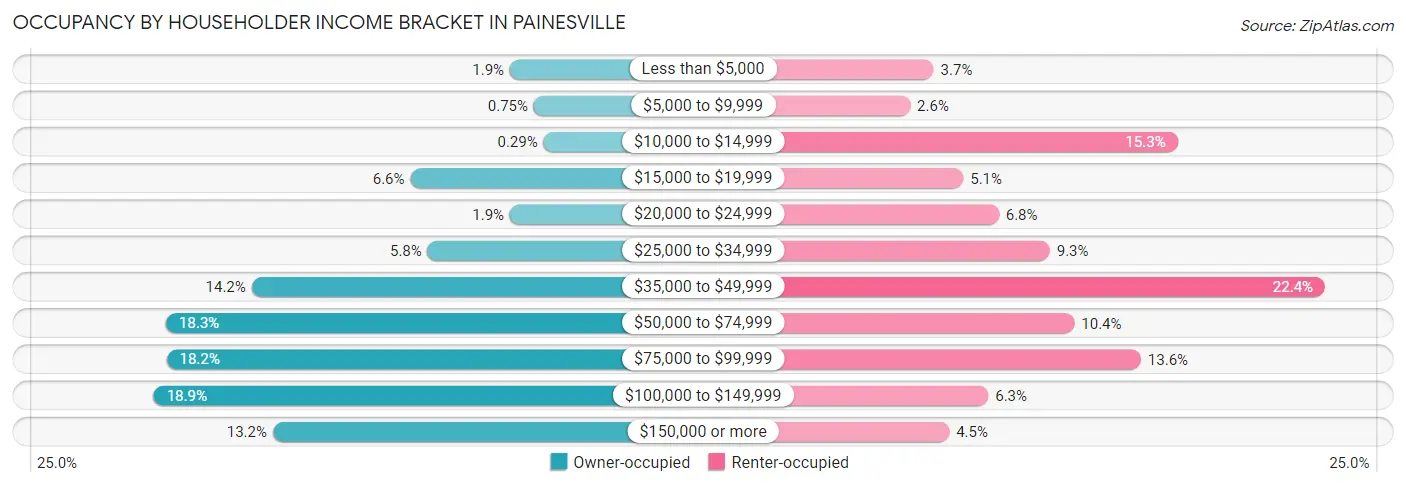
| Income Bracket | Owner-occupied | Renter-occupied |
| Less than $5,000 | 71 (1.9%) | 150 (3.7%) |
| $5,000 to $9,999 | 28 (0.7%) | 105 (2.6%) |
| $10,000 to $14,999 | 11 (0.3%) | 618 (15.3%) |
| $15,000 to $19,999 | 249 (6.6%) | 207 (5.1%) |
| $20,000 to $24,999 | 71 (1.9%) | 275 (6.8%) |
| $25,000 to $34,999 | 218 (5.8%) | 373 (9.2%) |
| $35,000 to $49,999 | 533 (14.2%) | 901 (22.4%) |
| $50,000 to $74,999 | 686 (18.3%) | 420 (10.4%) |
| $75,000 to $99,999 | 685 (18.2%) | 548 (13.6%) |
| $100,000 to $149,999 | 708 (18.9%) | 255 (6.3%) |
| $150,000 or more | 495 (13.2%) | 180 (4.5%) |
| Total | 3,755 (100.0%) | 4,032 (100.0%) |
Monthly Housing Cost Tiers in Painesville
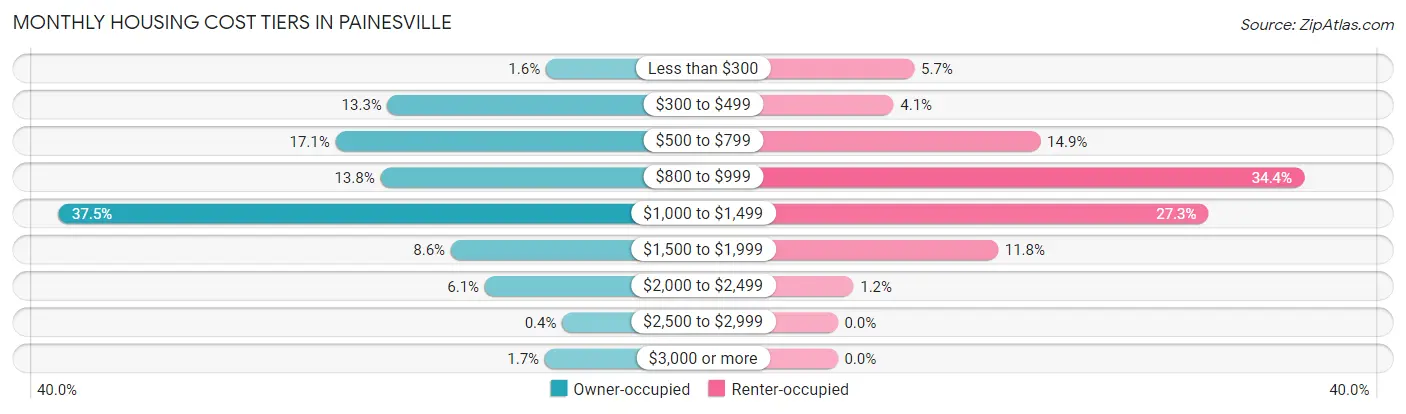
| Monthly Cost | Owner-occupied | Renter-occupied |
| Less than $300 | 60 (1.6%) | 228 (5.7%) |
| $300 to $499 | 498 (13.3%) | 166 (4.1%) |
| $500 to $799 | 642 (17.1%) | 602 (14.9%) |
| $800 to $999 | 518 (13.8%) | 1,385 (34.4%) |
| $1,000 to $1,499 | 1,407 (37.5%) | 1,101 (27.3%) |
| $1,500 to $1,999 | 323 (8.6%) | 476 (11.8%) |
| $2,000 to $2,499 | 229 (6.1%) | 47 (1.2%) |
| $2,500 to $2,999 | 15 (0.4%) | 0 (0.0%) |
| $3,000 or more | 63 (1.7%) | 0 (0.0%) |
| Total | 3,755 (100.0%) | 4,032 (100.0%) |
Physical Housing Characteristics in Painesville
Housing Structures in Painesville
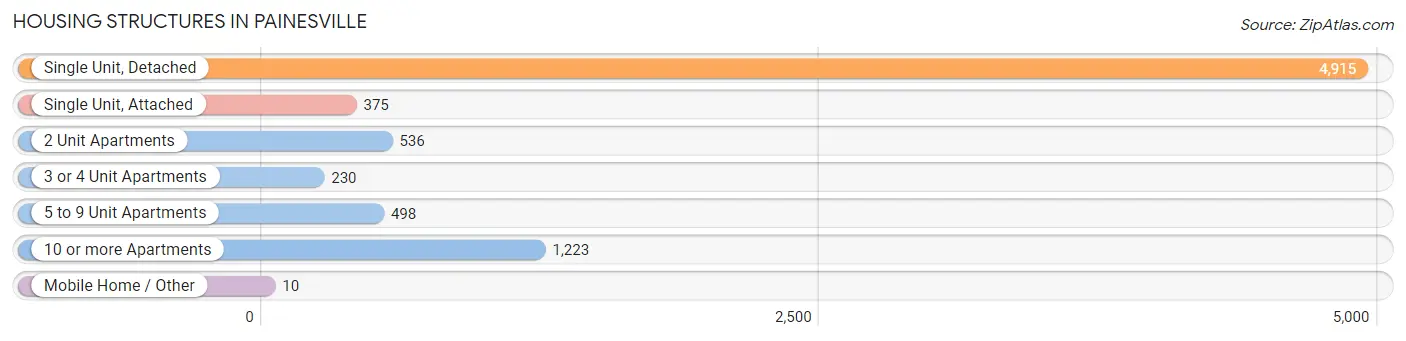
| Structure Type | # Housing Units | % Housing Units |
| Single Unit, Detached | 4,915 | 63.1% |
| Single Unit, Attached | 375 | 4.8% |
| 2 Unit Apartments | 536 | 6.9% |
| 3 or 4 Unit Apartments | 230 | 2.9% |
| 5 to 9 Unit Apartments | 498 | 6.4% |
| 10 or more Apartments | 1,223 | 15.7% |
| Mobile Home / Other | 10 | 0.1% |
| Total | 7,787 | 100.0% |
Housing Structures by Occupancy in Painesville
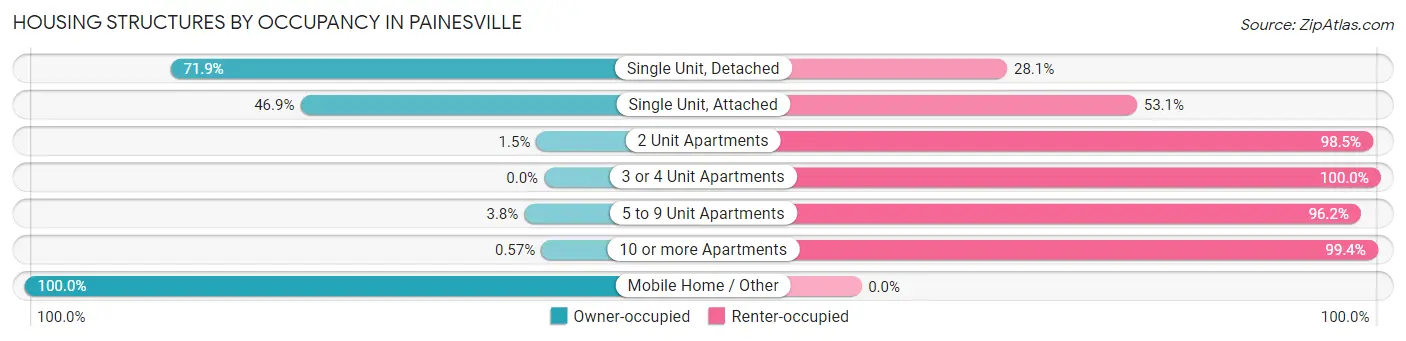
| Structure Type | Owner-occupied | Renter-occupied |
| Single Unit, Detached | 3,535 (71.9%) | 1,380 (28.1%) |
| Single Unit, Attached | 176 (46.9%) | 199 (53.1%) |
| 2 Unit Apartments | 8 (1.5%) | 528 (98.5%) |
| 3 or 4 Unit Apartments | 0 (0.0%) | 230 (100.0%) |
| 5 to 9 Unit Apartments | 19 (3.8%) | 479 (96.2%) |
| 10 or more Apartments | 7 (0.6%) | 1,216 (99.4%) |
| Mobile Home / Other | 10 (100.0%) | 0 (0.0%) |
| Total | 3,755 (48.2%) | 4,032 (51.8%) |
Housing Structures by Number of Rooms in Painesville
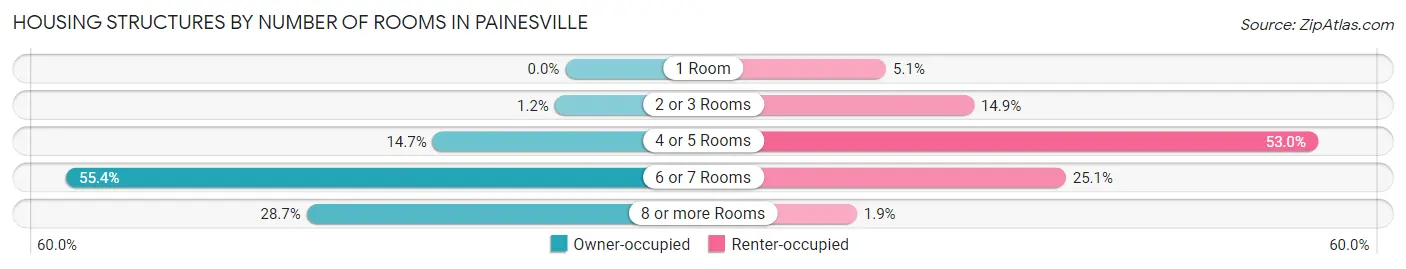
| Number of Rooms | Owner-occupied | Renter-occupied |
| 1 Room | 0 (0.0%) | 207 (5.1%) |
| 2 or 3 Rooms | 44 (1.2%) | 600 (14.9%) |
| 4 or 5 Rooms | 553 (14.7%) | 2,138 (53.0%) |
| 6 or 7 Rooms | 2,080 (55.4%) | 1,011 (25.1%) |
| 8 or more Rooms | 1,078 (28.7%) | 76 (1.9%) |
| Total | 3,755 (100.0%) | 4,032 (100.0%) |
Housing Structure by Heating Type in Painesville
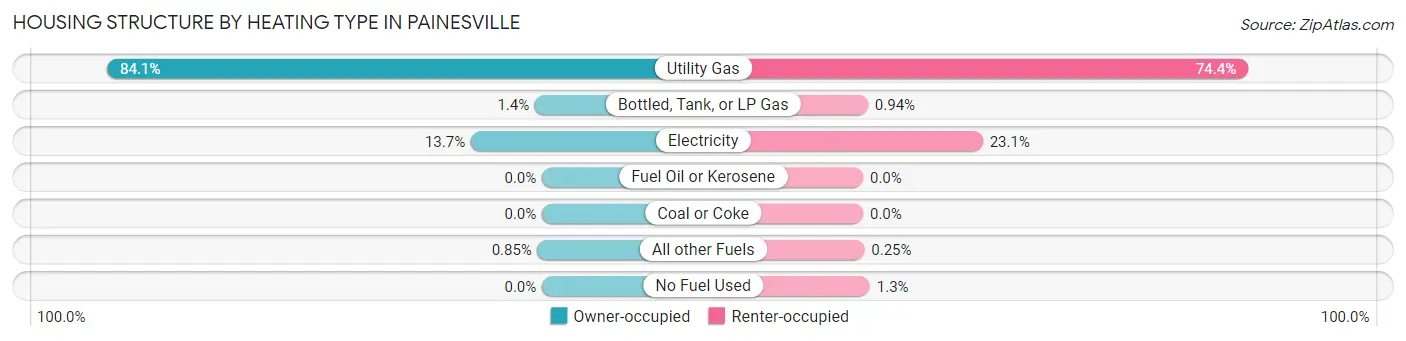
| Heating Type | Owner-occupied | Renter-occupied |
| Utility Gas | 3,156 (84.1%) | 2,999 (74.4%) |
| Bottled, Tank, or LP Gas | 51 (1.4%) | 38 (0.9%) |
| Electricity | 516 (13.7%) | 932 (23.1%) |
| Fuel Oil or Kerosene | 0 (0.0%) | 0 (0.0%) |
| Coal or Coke | 0 (0.0%) | 0 (0.0%) |
| All other Fuels | 32 (0.9%) | 10 (0.3%) |
| No Fuel Used | 0 (0.0%) | 53 (1.3%) |
| Total | 3,755 (100.0%) | 4,032 (100.0%) |
Household Vehicle Usage in Painesville
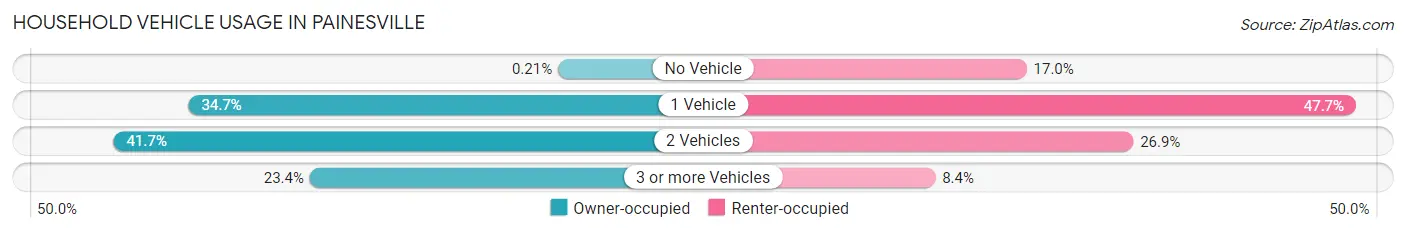
| Vehicles per Household | Owner-occupied | Renter-occupied |
| No Vehicle | 8 (0.2%) | 684 (17.0%) |
| 1 Vehicle | 1,303 (34.7%) | 1,923 (47.7%) |
| 2 Vehicles | 1,566 (41.7%) | 1,085 (26.9%) |
| 3 or more Vehicles | 878 (23.4%) | 340 (8.4%) |
| Total | 3,755 (100.0%) | 4,032 (100.0%) |
Real Estate & Mortgages in Painesville
Real Estate and Mortgage Overview in Painesville
| Characteristic | Without Mortgage | With Mortgage |
| Housing Units | 1,117 | 2,638 |
| Median Property Value | $125,700 | $149,000 |
| Median Household Income | $53,445 | $343 |
| Monthly Housing Costs | $504 | $63 |
| Real Estate Taxes | $2,290 | $90 |
Property Value by Mortgage Status in Painesville
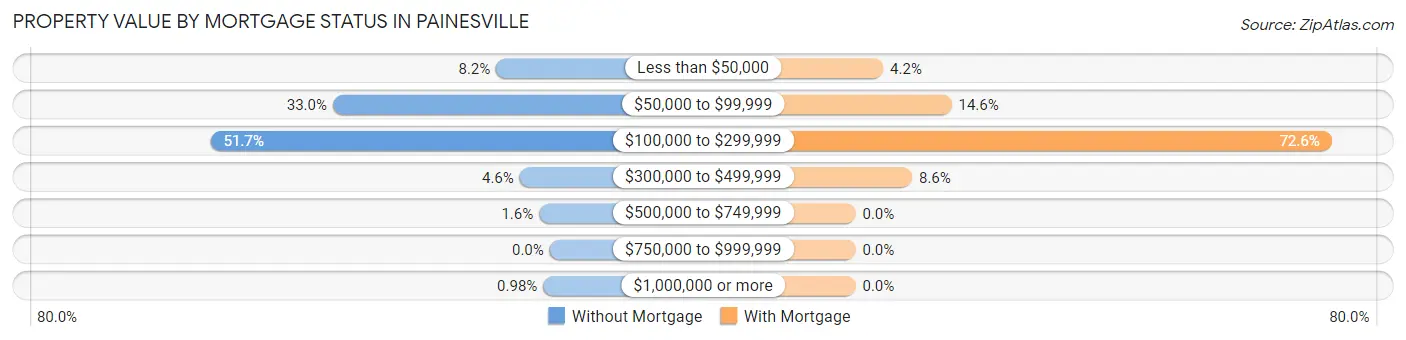
| Property Value | Without Mortgage | With Mortgage |
| Less than $50,000 | 91 (8.2%) | 111 (4.2%) |
| $50,000 to $99,999 | 369 (33.0%) | 386 (14.6%) |
| $100,000 to $299,999 | 577 (51.7%) | 1,914 (72.6%) |
| $300,000 to $499,999 | 51 (4.6%) | 227 (8.6%) |
| $500,000 to $749,999 | 18 (1.6%) | 0 (0.0%) |
| $750,000 to $999,999 | 0 (0.0%) | 0 (0.0%) |
| $1,000,000 or more | 11 (1.0%) | 0 (0.0%) |
| Total | 1,117 (100.0%) | 2,638 (100.0%) |
Household Income by Mortgage Status in Painesville
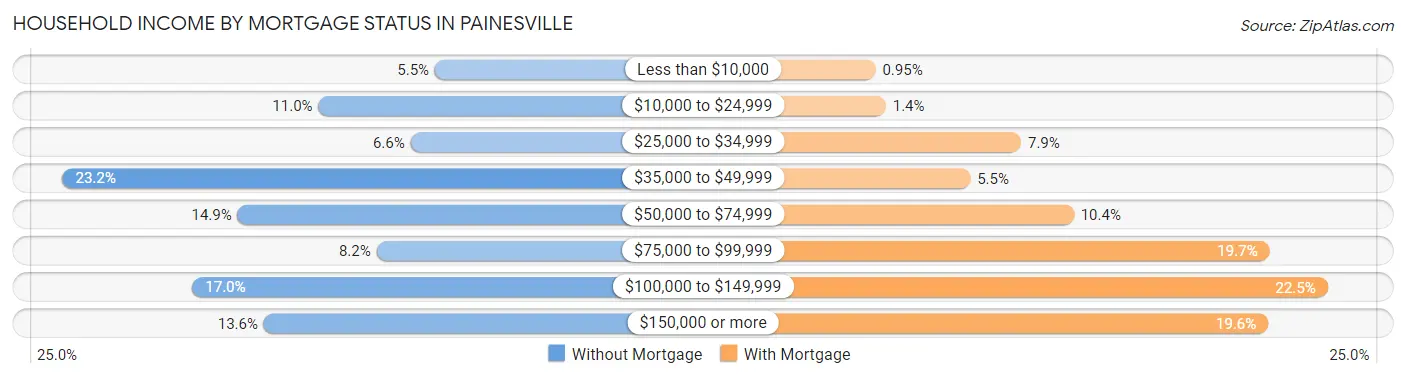
| Household Income | Without Mortgage | With Mortgage |
| Less than $10,000 | 61 (5.5%) | 25 (0.9%) |
| $10,000 to $24,999 | 123 (11.0%) | 38 (1.4%) |
| $25,000 to $34,999 | 74 (6.6%) | 208 (7.9%) |
| $35,000 to $49,999 | 259 (23.2%) | 144 (5.5%) |
| $50,000 to $74,999 | 166 (14.9%) | 274 (10.4%) |
| $75,000 to $99,999 | 92 (8.2%) | 520 (19.7%) |
| $100,000 to $149,999 | 190 (17.0%) | 593 (22.5%) |
| $150,000 or more | 152 (13.6%) | 518 (19.6%) |
| Total | 1,117 (100.0%) | 2,638 (100.0%) |
Property Value to Household Income Ratio in Painesville
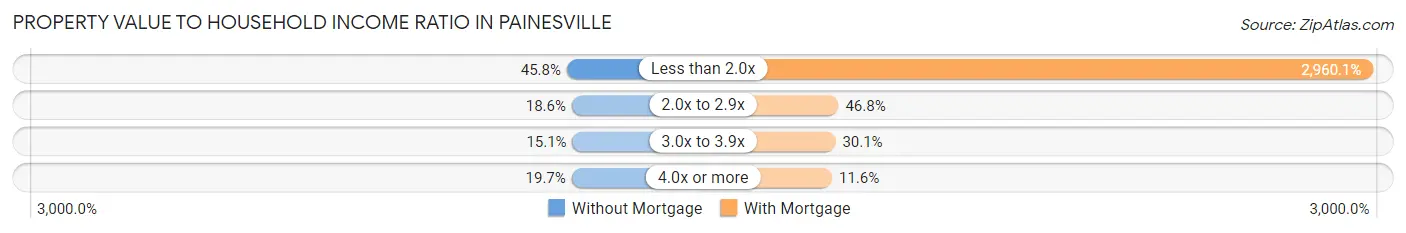
| Value-to-Income Ratio | Without Mortgage | With Mortgage |
| Less than 2.0x | 512 (45.8%) | 78,088 (2,960.1%) |
| 2.0x to 2.9x | 208 (18.6%) | 1,235 (46.8%) |
| 3.0x to 3.9x | 169 (15.1%) | 795 (30.1%) |
| 4.0x or more | 220 (19.7%) | 305 (11.6%) |
| Total | 1,117 (100.0%) | 2,638 (100.0%) |
Real Estate Taxes by Mortgage Status in Painesville
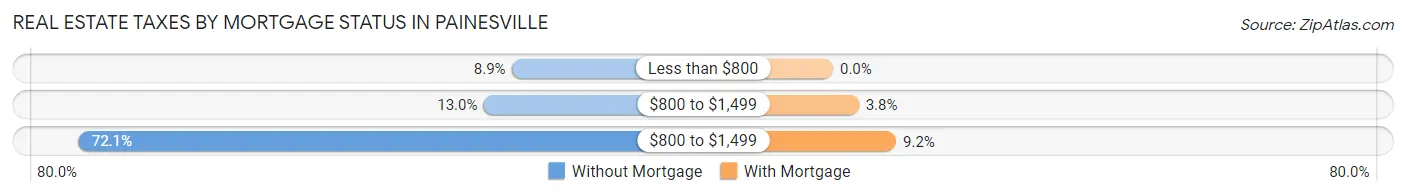
| Property Taxes | Without Mortgage | With Mortgage |
| Less than $800 | 99 (8.9%) | 0 (0.0%) |
| $800 to $1,499 | 145 (13.0%) | 99 (3.7%) |
| $800 to $1,499 | 805 (72.1%) | 243 (9.2%) |
| Total | 1,117 (100.0%) | 2,638 (100.0%) |
Health & Disability in Painesville
Health Insurance Coverage by Age in Painesville
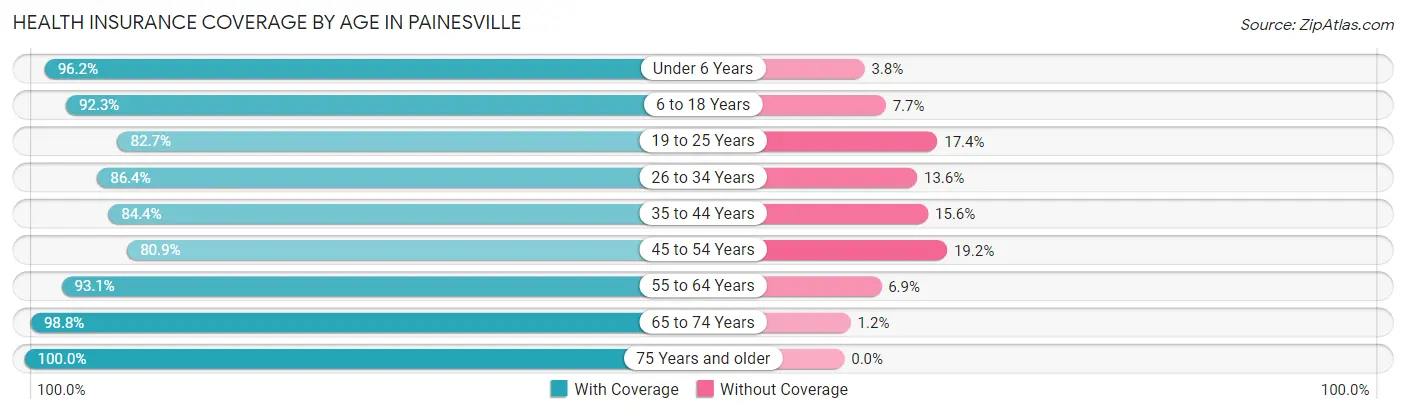
| Age Bracket | With Coverage | Without Coverage |
| Under 6 Years | 1,691 (96.2%) | 66 (3.8%) |
| 6 to 18 Years | 4,031 (92.3%) | 337 (7.7%) |
| 19 to 25 Years | 1,515 (82.7%) | 318 (17.3%) |
| 26 to 34 Years | 2,149 (86.4%) | 337 (13.6%) |
| 35 to 44 Years | 2,515 (84.4%) | 466 (15.6%) |
| 45 to 54 Years | 1,854 (80.8%) | 439 (19.2%) |
| 55 to 64 Years | 1,962 (93.1%) | 145 (6.9%) |
| 65 to 74 Years | 1,408 (98.8%) | 17 (1.2%) |
| 75 Years and older | 767 (100.0%) | 0 (0.0%) |
| Total | 17,892 (89.4%) | 2,125 (10.6%) |
Health Insurance Coverage by Citizenship Status in Painesville
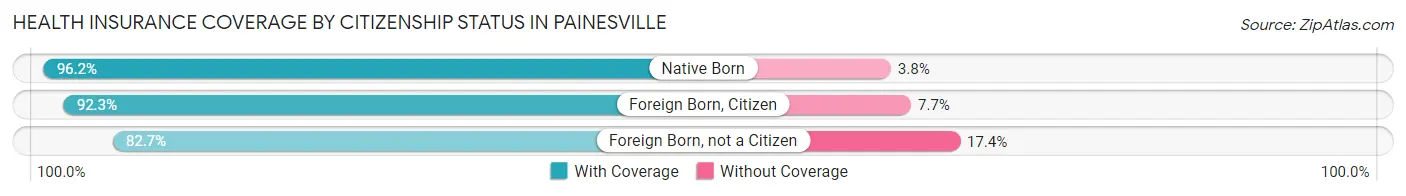
| Citizenship Status | With Coverage | Without Coverage |
| Native Born | 1,691 (96.2%) | 66 (3.8%) |
| Foreign Born, Citizen | 4,031 (92.3%) | 337 (7.7%) |
| Foreign Born, not a Citizen | 1,515 (82.7%) | 318 (17.3%) |
Health Insurance Coverage by Household Income in Painesville
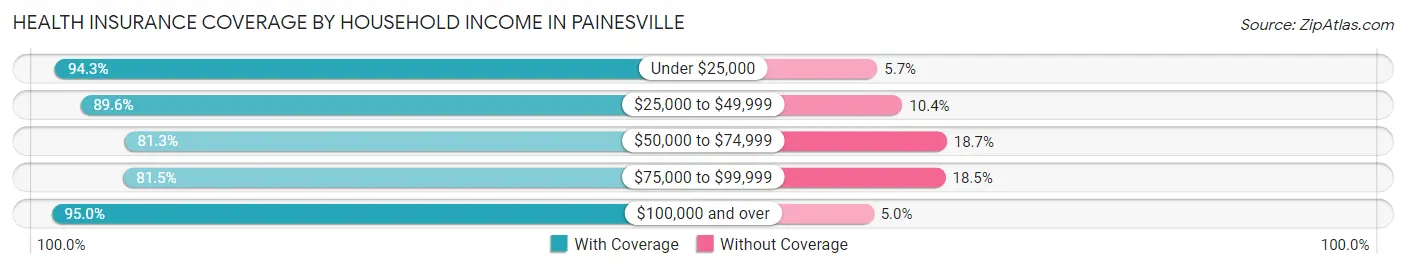
| Household Income | With Coverage | Without Coverage |
| Under $25,000 | 2,669 (94.3%) | 162 (5.7%) |
| $25,000 to $49,999 | 4,634 (89.6%) | 539 (10.4%) |
| $50,000 to $74,999 | 2,430 (81.3%) | 560 (18.7%) |
| $75,000 to $99,999 | 2,547 (81.5%) | 578 (18.5%) |
| $100,000 and over | 5,179 (95.0%) | 275 (5.0%) |
Public vs Private Health Insurance Coverage by Age in Painesville
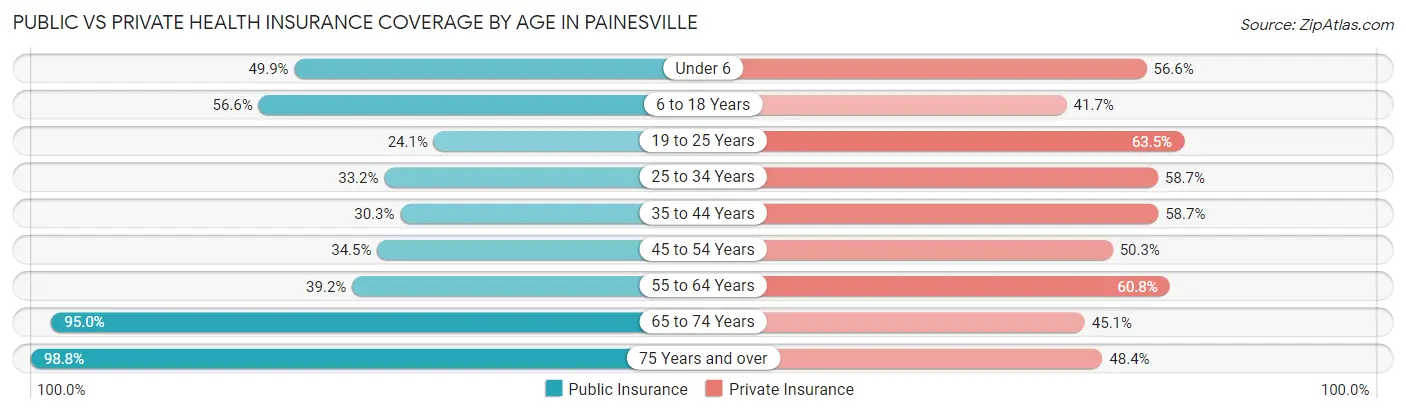
| Age Bracket | Public Insurance | Private Insurance |
| Under 6 | 877 (49.9%) | 994 (56.6%) |
| 6 to 18 Years | 2,471 (56.6%) | 1,823 (41.7%) |
| 19 to 25 Years | 441 (24.1%) | 1,164 (63.5%) |
| 25 to 34 Years | 826 (33.2%) | 1,458 (58.7%) |
| 35 to 44 Years | 902 (30.3%) | 1,751 (58.7%) |
| 45 to 54 Years | 792 (34.5%) | 1,153 (50.3%) |
| 55 to 64 Years | 826 (39.2%) | 1,282 (60.8%) |
| 65 to 74 Years | 1,354 (95.0%) | 643 (45.1%) |
| 75 Years and over | 758 (98.8%) | 371 (48.4%) |
| Total | 9,247 (46.2%) | 10,639 (53.1%) |
Disability Status by Sex by Age in Painesville
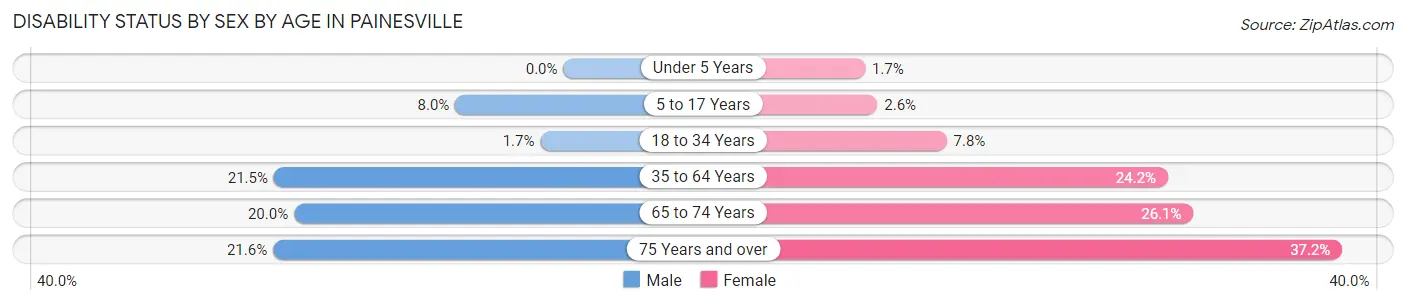
| Age Bracket | Male | Female |
| Under 5 Years | 0 (0.0%) | 14 (1.7%) |
| 5 to 17 Years | 215 (8.0%) | 47 (2.6%) |
| 18 to 34 Years | 44 (1.7%) | 153 (7.8%) |
| 35 to 64 Years | 786 (21.5%) | 902 (24.2%) |
| 65 to 74 Years | 121 (20.0%) | 214 (26.1%) |
| 75 Years and over | 58 (21.6%) | 185 (37.1%) |
Disability Class by Sex by Age in Painesville
Disability Class: Hearing Difficulty
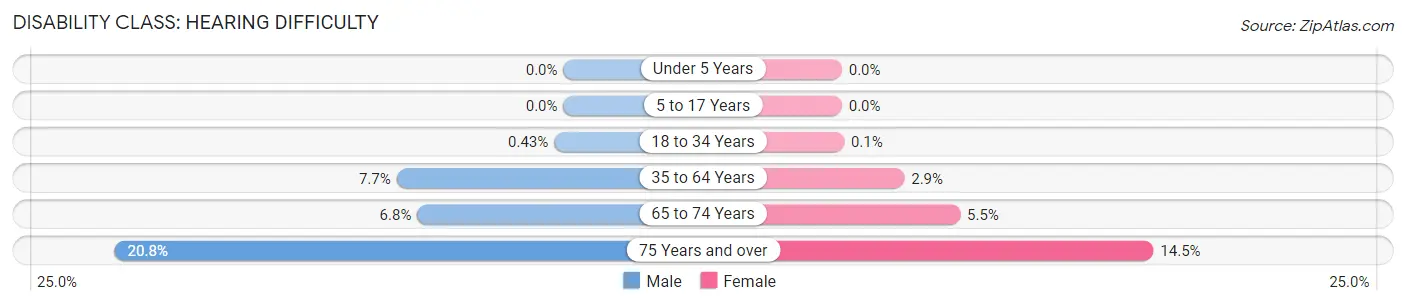
| Age Bracket | Male | Female |
| Under 5 Years | 0 (0.0%) | 0 (0.0%) |
| 5 to 17 Years | 0 (0.0%) | 0 (0.0%) |
| 18 to 34 Years | 11 (0.4%) | 2 (0.1%) |
| 35 to 64 Years | 283 (7.7%) | 108 (2.9%) |
| 65 to 74 Years | 41 (6.8%) | 45 (5.5%) |
| 75 Years and over | 56 (20.8%) | 72 (14.5%) |
Disability Class: Vision Difficulty
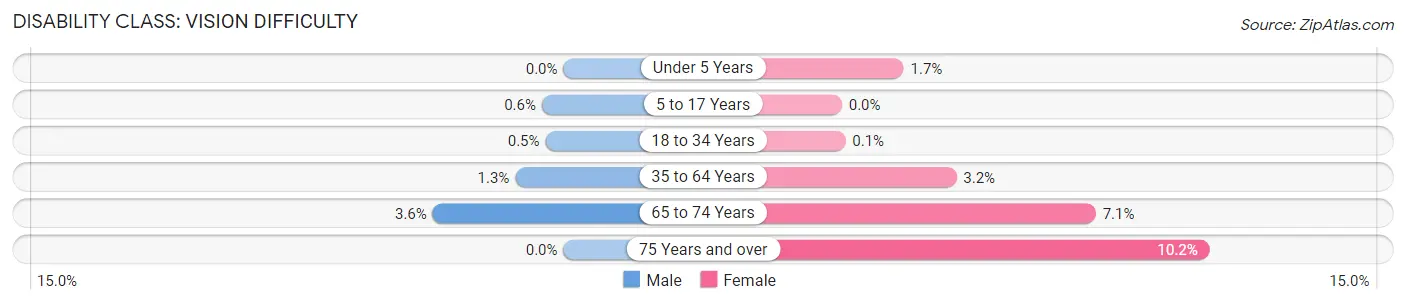
| Age Bracket | Male | Female |
| Under 5 Years | 0 (0.0%) | 14 (1.7%) |
| 5 to 17 Years | 16 (0.6%) | 0 (0.0%) |
| 18 to 34 Years | 13 (0.5%) | 2 (0.1%) |
| 35 to 64 Years | 49 (1.3%) | 119 (3.2%) |
| 65 to 74 Years | 22 (3.6%) | 58 (7.1%) |
| 75 Years and over | 0 (0.0%) | 51 (10.2%) |
Disability Class: Cognitive Difficulty
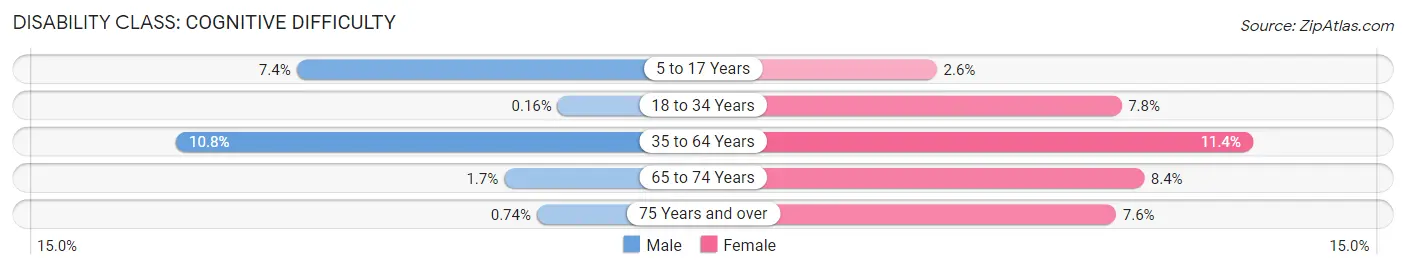
| Age Bracket | Male | Female |
| 5 to 17 Years | 199 (7.4%) | 47 (2.6%) |
| 18 to 34 Years | 4 (0.2%) | 153 (7.8%) |
| 35 to 64 Years | 394 (10.8%) | 426 (11.4%) |
| 65 to 74 Years | 10 (1.7%) | 69 (8.4%) |
| 75 Years and over | 2 (0.7%) | 38 (7.6%) |
Disability Class: Ambulatory Difficulty
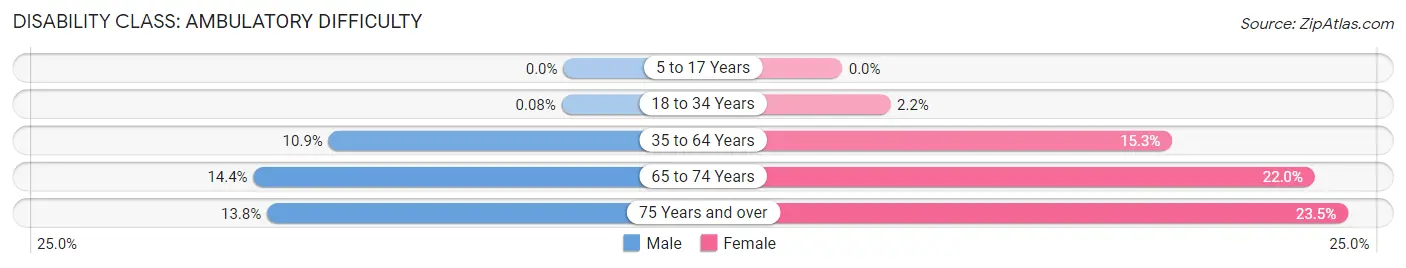
| Age Bracket | Male | Female |
| 5 to 17 Years | 0 (0.0%) | 0 (0.0%) |
| 18 to 34 Years | 2 (0.1%) | 44 (2.2%) |
| 35 to 64 Years | 398 (10.9%) | 571 (15.3%) |
| 65 to 74 Years | 87 (14.4%) | 180 (22.0%) |
| 75 Years and over | 37 (13.8%) | 117 (23.5%) |
Disability Class: Self-Care Difficulty
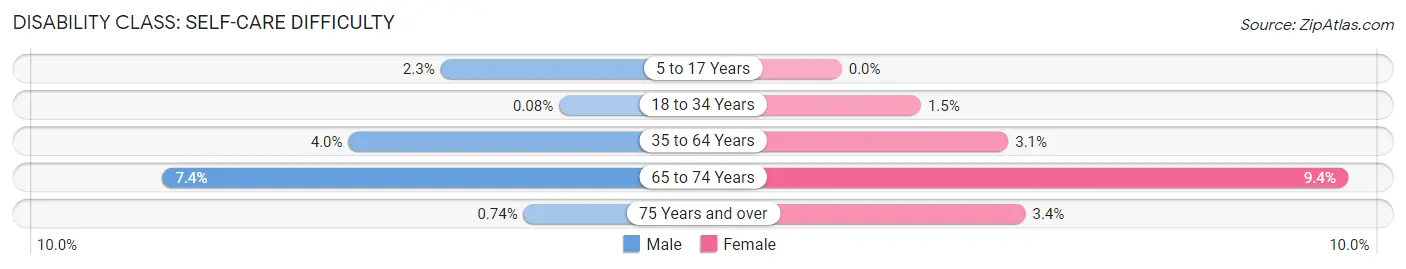
| Age Bracket | Male | Female |
| 5 to 17 Years | 61 (2.3%) | 0 (0.0%) |
| 18 to 34 Years | 2 (0.1%) | 29 (1.5%) |
| 35 to 64 Years | 146 (4.0%) | 115 (3.1%) |
| 65 to 74 Years | 45 (7.4%) | 77 (9.4%) |
| 75 Years and over | 2 (0.7%) | 17 (3.4%) |
Technology Access in Painesville
Computing Device Access in Painesville
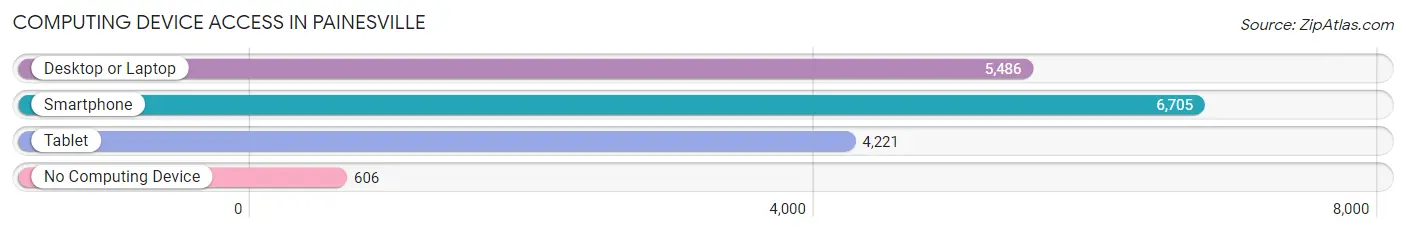
| Device Type | # Households | % Households |
| Desktop or Laptop | 5,486 | 70.5% |
| Smartphone | 6,705 | 86.1% |
| Tablet | 4,221 | 54.2% |
| No Computing Device | 606 | 7.8% |
| Total | 7,787 | 100.0% |
Internet Access in Painesville
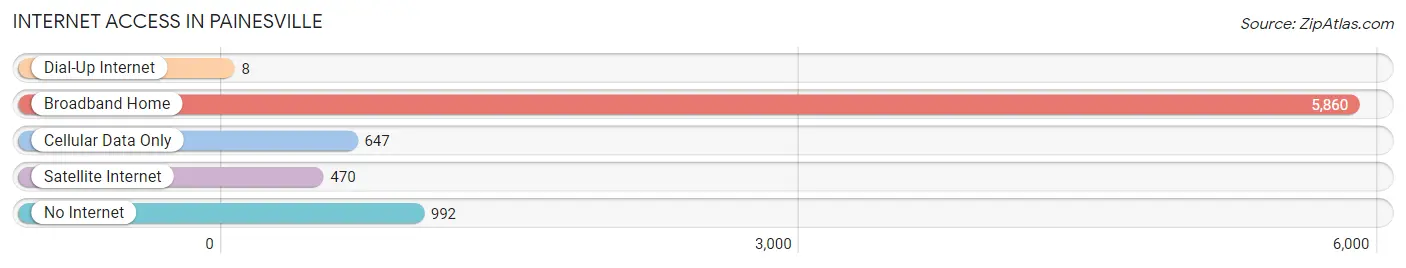
| Internet Type | # Households | % Households |
| Dial-Up Internet | 8 | 0.1% |
| Broadband Home | 5,860 | 75.2% |
| Cellular Data Only | 647 | 8.3% |
| Satellite Internet | 470 | 6.0% |
| No Internet | 992 | 12.7% |
| Total | 7,787 | 100.0% |
Painesville Summary
History
Painesville, Ohio is a city located in Lake County, Ohio, United States. It is the county seat of Lake County and is located on the Grand River. The city was founded in 1805 by General Edward Paine, a Revolutionary War veteran, and was originally known as Painsville. The city was incorporated in 1832 and has since grown to a population of 19,563 as of the 2010 census.
Painesville has a rich history that dates back to the early 1800s. The city was founded by General Edward Paine, a Revolutionary War veteran, in 1805. The city was originally known as Painsville, but was later changed to Painesville in 1832 when it was incorporated. The city was an important stop on the Underground Railroad, and was home to many abolitionists and anti-slavery activists.
Painesville was also an important industrial center in the 19th century. The city was home to several factories, including the Painesville Iron Works, which produced iron products for the Union Army during the Civil War. The city was also home to several glass factories, which produced glass products for the local market.
Geography
Painesville is located in Lake County, Ohio, United States. It is situated on the Grand River, approximately 30 miles northeast of Cleveland. The city has a total area of 8.3 square miles, of which 8.2 square miles is land and 0.1 square miles is water.
The city is located in the Great Lakes region of the United States and is part of the Cleveland-Akron-Canton metropolitan area. The city is located in the humid continental climate zone, with hot summers and cold winters. The average annual temperature is 50.2°F, with an average high of 68.2°F and an average low of 32.2°F.
Economy
Painesville’s economy is largely based on manufacturing and healthcare. The city is home to several manufacturing companies, including the Painesville Iron Works, which produces iron products for the Union Army during the Civil War. The city is also home to several healthcare facilities, including Lake Health, a regional healthcare provider.
The city is also home to several retail stores, restaurants, and other businesses. The city is home to several shopping centers, including the Painesville Towne Center, which is home to several national retailers. The city is also home to several restaurants, including the popular Painesville Diner.
Demographics
As of the 2010 census, the city of Painesville had a population of 19,563. The racial makeup of the city was 87.2% White, 8.2% African American, 0.4% Native American, 1.2% Asian, 0.1% Pacific Islander, 0.7% from other races, and 2.2% from two or more races. Hispanic or Latino of any race were 2.7% of the population.
The median income for a household in the city was $41,945, and the median income for a family was $50,945. The per capita income for the city was $20,945. About 11.2% of families and 14.2% of the population were below the poverty line, including 19.2% of those under age 18 and 8.2% of those age 65 or over.
Common Questions
What is Per Capita Income in Painesville?
Per Capita income in Painesville is $26,362.
What is the Median Family Income in Painesville?
Median Family Income in Painesville is $70,361.
What is the Median Household income in Painesville?
Median Household Income in Painesville is $51,373.
What is Income or Wage Gap in Painesville?
Income or Wage Gap in Painesville is 31.7%.
Women in Painesville earn 68.3 cents for every dollar earned by a man.
What is Family Income Deficit in Painesville?
Family Income Deficit in Painesville is $9,283.
Families that are below poverty line in Painesville earn $9,283 less on average than the poverty threshold level.
What is Inequality or Gini Index in Painesville?
Inequality or Gini Index in Painesville is 0.43.
What is the Total Population of Painesville?
Total Population of Painesville is 20,387.
What is the Total Male Population of Painesville?
Total Male Population of Painesville is 10,656.
What is the Total Female Population of Painesville?
Total Female Population of Painesville is 9,731.
What is the Ratio of Males per 100 Females in Painesville?
There are 109.51 Males per 100 Females in Painesville.
What is the Ratio of Females per 100 Males in Painesville?
There are 91.32 Females per 100 Males in Painesville.
What is the Median Population Age in Painesville?
Median Population Age in Painesville is 33.4 Years.
What is the Average Family Size in Painesville
Average Family Size in Painesville is 3.4 People.
What is the Average Household Size in Painesville
Average Household Size in Painesville is 2.5 People.
How Large is the Labor Force in Painesville?
There are 9,706 People in the Labor Forcein in Painesville.
What is the Percentage of People in the Labor Force in Painesville?
64.4% of People are in the Labor Force in Painesville.
What is the Unemployment Rate in Painesville?
Unemployment Rate in Painesville is 4.8%.