Old Washington, OH Map & Demographics
Old Washington Map
Old Washington Overview
$35,261
PER CAPITA INCOME
$98,000
AVG FAMILY INCOME
$12,802
FAMILY INCOME DEFICIT
0.41
INEQUALITY / GINI INDEX
481
TOTAL POPULATION
161
MALE POPULATION
320
FEMALE POPULATION
50.31
MALES / 100 FEMALES
198.76
FEMALES / 100 MALES
35.3
MEDIAN AGE
2.7
AVG FAMILY SIZE
2.6
AVG HOUSEHOLD SIZE
249
LABOR FORCE [ PEOPLE ]
62.4%
PERCENT IN LABOR FORCE
5.2%
UNEMPLOYMENT RATE
Old Washington Zip Codes
Old Washington Area Codes
Income in Old Washington
Income Overview in Old Washington
| Characteristic | Number | Measure |
| Per Capita Income | 481 | $35,261 |
| Median Family Income | 136 | $98,000 |
| Mean Family Income | 136 | $76,771 |
| Median Household Income | 180 | $0 |
| Mean Household Income | 180 | $79,883 |
| Income Deficit | 136 | $12,802 |
| Wage / Income Gap (%) | 481 | 0.00% |
| Wage / Income Gap ($) | 481 | 100.00¢ per $1 |
| Gini / Inequality Index | 481 | 0.41 |
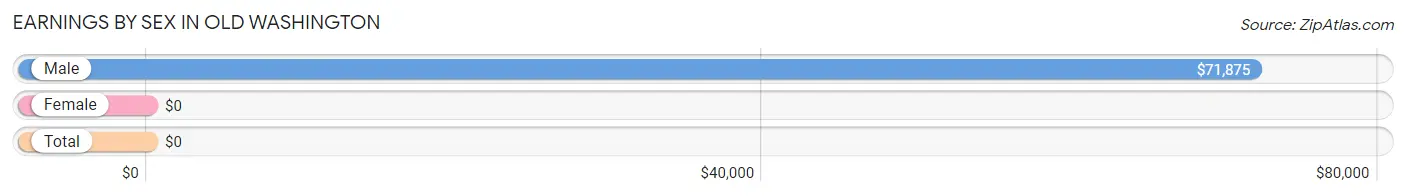
Earnings by Sex in Old Washington
| Sex | Number | Average Earnings |
| Male | 96 (39.5%) | $71,875 |
| Female | 147 (60.5%) | $0 |
| Total | 243 (100.0%) | $0 |
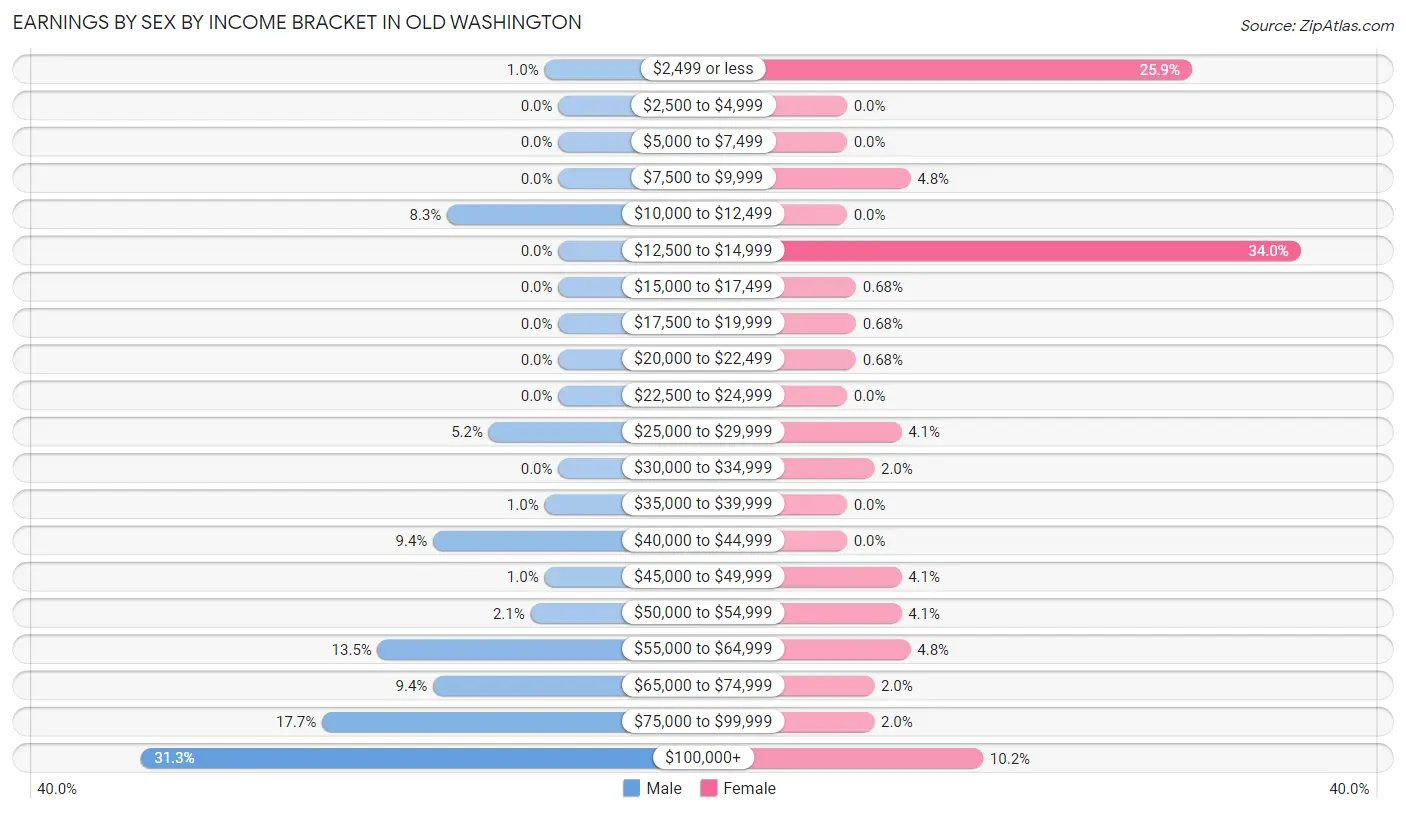
Earnings by Sex by Income Bracket in Old Washington
The most common earnings brackets in Old Washington are $100,000+ for men (30 | 31.2%) and $12,500 to $14,999 for women (50 | 34.0%).
| Income | Male | Female |
| $2,499 or less | 1 (1.0%) | 38 (25.9%) |
| $2,500 to $4,999 | 0 (0.0%) | 0 (0.0%) |
| $5,000 to $7,499 | 0 (0.0%) | 0 (0.0%) |
| $7,500 to $9,999 | 0 (0.0%) | 7 (4.8%) |
| $10,000 to $12,499 | 8 (8.3%) | 0 (0.0%) |
| $12,500 to $14,999 | 0 (0.0%) | 50 (34.0%) |
| $15,000 to $17,499 | 0 (0.0%) | 1 (0.7%) |
| $17,500 to $19,999 | 0 (0.0%) | 1 (0.7%) |
| $20,000 to $22,499 | 0 (0.0%) | 1 (0.7%) |
| $22,500 to $24,999 | 0 (0.0%) | 0 (0.0%) |
| $25,000 to $29,999 | 5 (5.2%) | 6 (4.1%) |
| $30,000 to $34,999 | 0 (0.0%) | 3 (2.0%) |
| $35,000 to $39,999 | 1 (1.0%) | 0 (0.0%) |
| $40,000 to $44,999 | 9 (9.4%) | 0 (0.0%) |
| $45,000 to $49,999 | 1 (1.0%) | 6 (4.1%) |
| $50,000 to $54,999 | 2 (2.1%) | 6 (4.1%) |
| $55,000 to $64,999 | 13 (13.5%) | 7 (4.8%) |
| $65,000 to $74,999 | 9 (9.4%) | 3 (2.0%) |
| $75,000 to $99,999 | 17 (17.7%) | 3 (2.0%) |
| $100,000+ | 30 (31.2%) | 15 (10.2%) |
| Total | 96 (100.0%) | 147 (100.0%) |
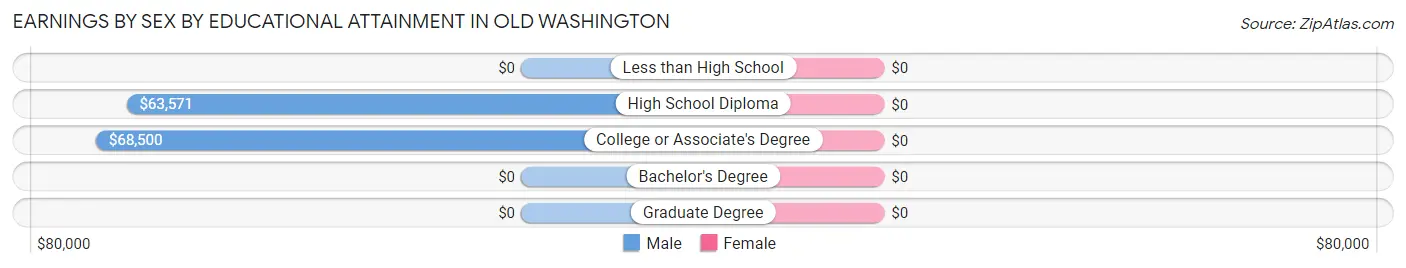
Earnings by Sex by Educational Attainment in Old Washington
| Educational Attainment | Male Income | Female Income |
| Less than High School | - | - |
| High School Diploma | $63,571 | $0 |
| College or Associate's Degree | $68,500 | $0 |
| Bachelor's Degree | - | - |
| Graduate Degree | - | - |
| Total | $63,750 | $0 |
Family Income in Old Washington
Family Income Brackets in Old Washington
According to the Old Washington family income data, there are 61 families falling into the $100,000 to $149,999 income range, which is the most common income bracket and makes up 44.9% of all families.
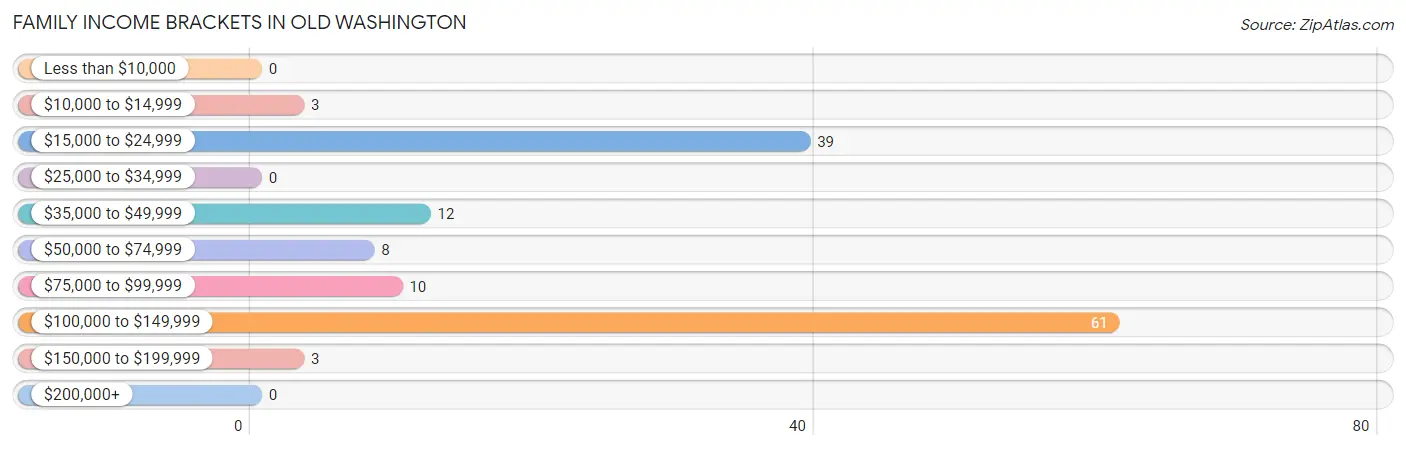
| Income Bracket | # Families | % Families |
| Less than $10,000 | 0 | 0.0% |
| $10,000 to $14,999 | 3 | 2.2% |
| $15,000 to $24,999 | 39 | 28.7% |
| $25,000 to $34,999 | 0 | 0.0% |
| $35,000 to $49,999 | 12 | 8.8% |
| $50,000 to $74,999 | 8 | 5.9% |
| $75,000 to $99,999 | 10 | 7.4% |
| $100,000 to $149,999 | 61 | 44.9% |
| $150,000 to $199,999 | 3 | 2.2% |
| $200,000+ | 0 | 0.0% |
Family Income by Famaliy Size in Old Washington
3-person families (27 | 19.9%) account for the highest median family income in Old Washington with $116,477 per family, while 2-person families (67 | 49.3%) have the highest median income of $55,938 per family member.
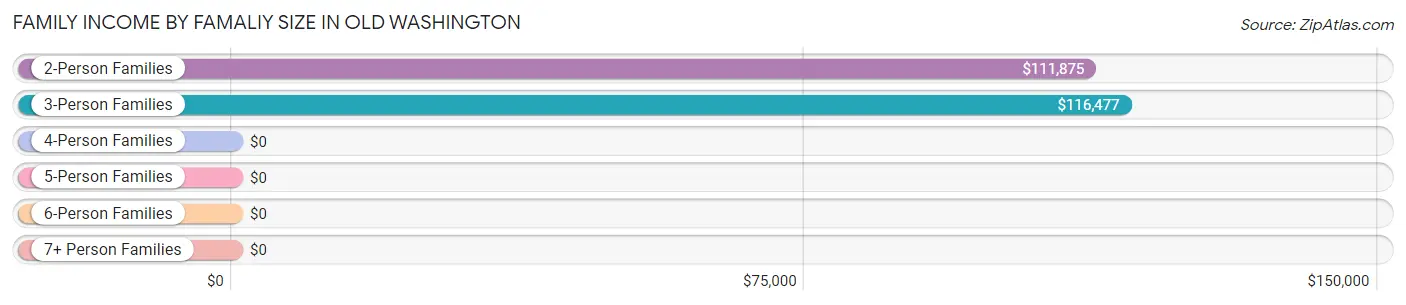
| Income Bracket | # Families | Median Income |
| 2-Person Families | 67 (49.3%) | $111,875 |
| 3-Person Families | 27 (19.9%) | $116,477 |
| 4-Person Families | 3 (2.2%) | $0 |
| 5-Person Families | 37 (27.2%) | $0 |
| 6-Person Families | 2 (1.5%) | $0 |
| 7+ Person Families | 0 (0.0%) | $0 |
| Total | 136 (100.0%) | $98,000 |
Family Income by Number of Earners in Old Washington
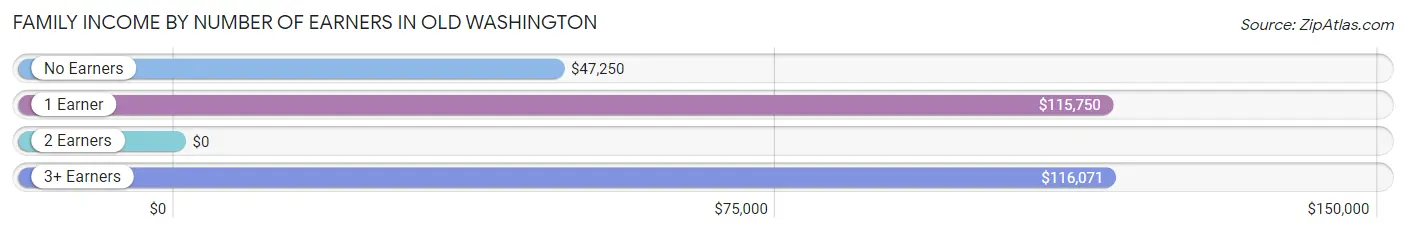
| Number of Earners | # Families | Median Income |
| No Earners | 13 (9.6%) | $47,250 |
| 1 Earner | 42 (30.9%) | $115,750 |
| 2 Earners | 63 (46.3%) | $0 |
| 3+ Earners | 18 (13.2%) | $116,071 |
| Total | 136 (100.0%) | $98,000 |
Household Income in Old Washington
Household Income Brackets in Old Washington
With 61 households falling in the category, the $100,000 to $149,999 income range is the most frequent in Old Washington, accounting for 33.9% of all households. In contrast, only 2 households (1.1%) fall into the less than $10,000 income bracket, making it the least populous group.
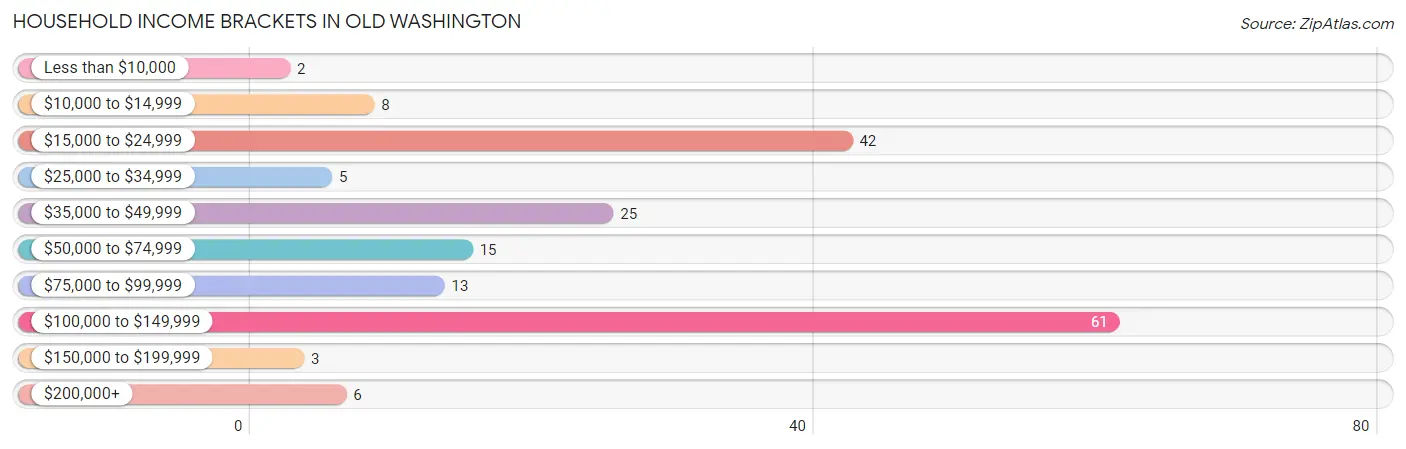
| Income Bracket | # Households | % Households |
| Less than $10,000 | 2 | 1.1% |
| $10,000 to $14,999 | 8 | 4.4% |
| $15,000 to $24,999 | 42 | 23.3% |
| $25,000 to $34,999 | 5 | 2.8% |
| $35,000 to $49,999 | 25 | 13.9% |
| $50,000 to $74,999 | 15 | 8.3% |
| $75,000 to $99,999 | 13 | 7.2% |
| $100,000 to $149,999 | 61 | 33.9% |
| $150,000 to $199,999 | 3 | 1.7% |
| $200,000+ | 6 | 3.3% |
Household Income by Householder Age in Old Washington
The median household income in Old Washington is $0, with the highest median household income of $133,250 found in the 45 to 64 years age bracket for the primary householder. A total of 25 households (13.9%) fall into this category. Meanwhile, the 15 to 24 years age bracket for the primary householder has the lowest median household income of $0, with 33 households (18.3%) in this group.
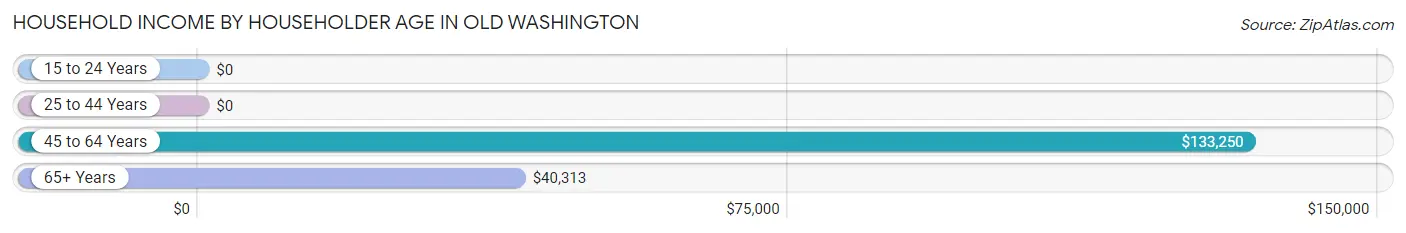
| Income Bracket | # Households | Median Income |
| 15 to 24 Years | 33 (18.3%) | $0 |
| 25 to 44 Years | 75 (41.7%) | $0 |
| 45 to 64 Years | 25 (13.9%) | $133,250 |
| 65+ Years | 47 (26.1%) | $40,313 |
| Total | 180 (100.0%) | $0 |
Poverty in Old Washington
Income Below Poverty by Sex and Age in Old Washington
With 31.1% poverty level for males and 58.1% for females among the residents of Old Washington, under 5 year old males and 6 to 11 year old females are the most vulnerable to poverty, with 2 males (100.0%) and 31 females (96.9%) in their respective age groups living below the poverty level.
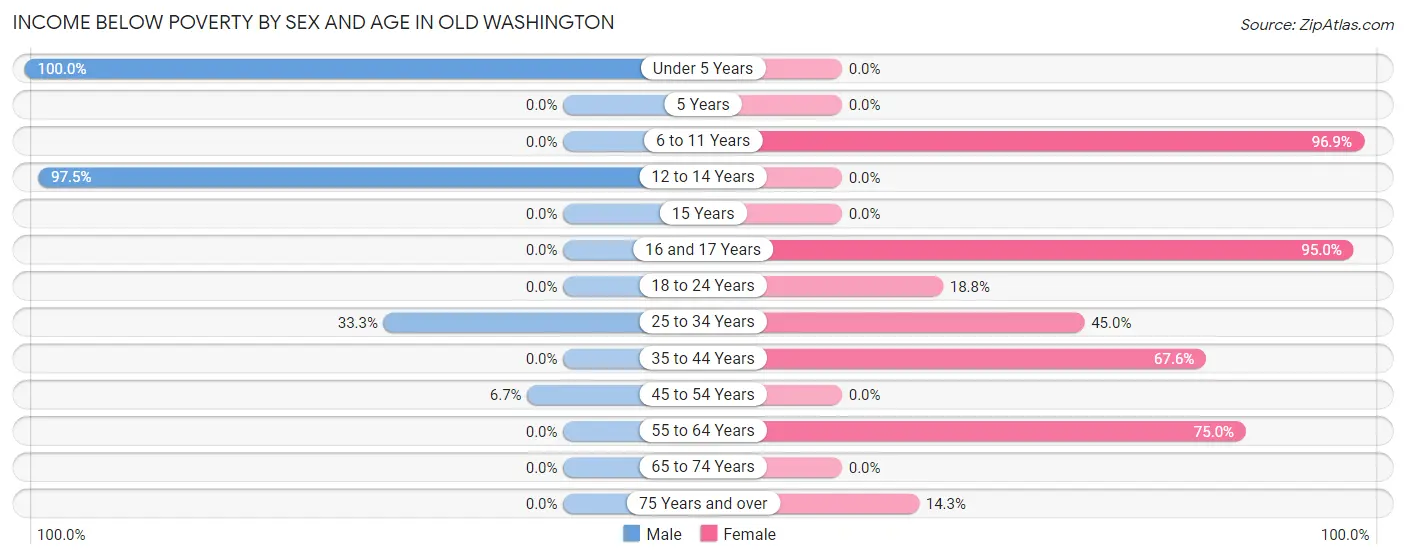
| Age Bracket | Male | Female |
| Under 5 Years | 2 (100.0%) | 0 (0.0%) |
| 5 Years | 0 (0.0%) | 0 (0.0%) |
| 6 to 11 Years | 0 (0.0%) | 31 (96.9%) |
| 12 to 14 Years | 39 (97.5%) | 0 (0.0%) |
| 15 Years | 0 (0.0%) | 0 (0.0%) |
| 16 and 17 Years | 0 (0.0%) | 38 (95.0%) |
| 18 to 24 Years | 0 (0.0%) | 3 (18.8%) |
| 25 to 34 Years | 8 (33.3%) | 9 (45.0%) |
| 35 to 44 Years | 0 (0.0%) | 71 (67.6%) |
| 45 to 54 Years | 1 (6.7%) | 0 (0.0%) |
| 55 to 64 Years | 0 (0.0%) | 30 (75.0%) |
| 65 to 74 Years | 0 (0.0%) | 0 (0.0%) |
| 75 Years and over | 0 (0.0%) | 4 (14.3%) |
| Total | 50 (31.1%) | 186 (58.1%) |
Income Above Poverty by Sex and Age in Old Washington
According to the poverty statistics in Old Washington, males aged 6 to 11 years and females aged under 5 years are the age groups that are most secure financially, with 100.0% of males and 100.0% of females in these age groups living above the poverty line.
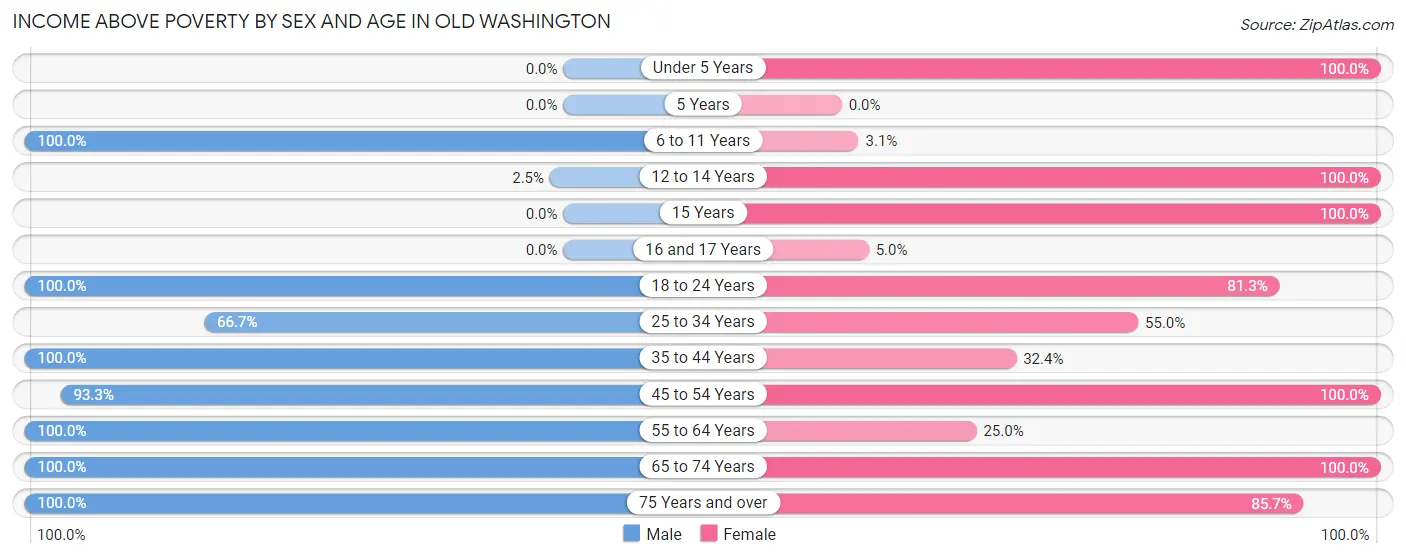
| Age Bracket | Male | Female |
| Under 5 Years | 0 (0.0%) | 4 (100.0%) |
| 5 Years | 0 (0.0%) | 0 (0.0%) |
| 6 to 11 Years | 1 (100.0%) | 1 (3.1%) |
| 12 to 14 Years | 1 (2.5%) | 2 (100.0%) |
| 15 Years | 0 (0.0%) | 1 (100.0%) |
| 16 and 17 Years | 0 (0.0%) | 2 (5.0%) |
| 18 to 24 Years | 37 (100.0%) | 13 (81.2%) |
| 25 to 34 Years | 16 (66.7%) | 11 (55.0%) |
| 35 to 44 Years | 23 (100.0%) | 34 (32.4%) |
| 45 to 54 Years | 14 (93.3%) | 13 (100.0%) |
| 55 to 64 Years | 8 (100.0%) | 10 (25.0%) |
| 65 to 74 Years | 9 (100.0%) | 19 (100.0%) |
| 75 Years and over | 2 (100.0%) | 24 (85.7%) |
| Total | 111 (68.9%) | 134 (41.9%) |
Income Below Poverty Among Married-Couple Families in Old Washington
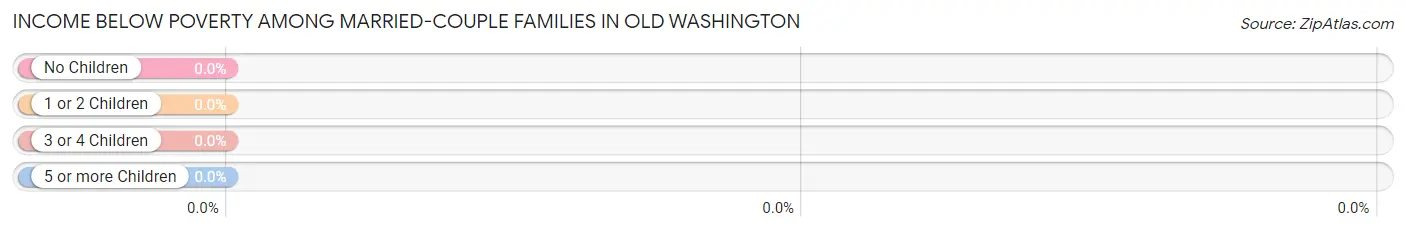
| Children | Above Poverty | Below Poverty |
| No Children | 79 (100.0%) | 0 (0.0%) |
| 1 or 2 Children | 12 (100.0%) | 0 (0.0%) |
| 3 or 4 Children | 2 (100.0%) | 0 (0.0%) |
| 5 or more Children | 0 (0.0%) | 0 (0.0%) |
| Total | 93 (100.0%) | 0 (0.0%) |
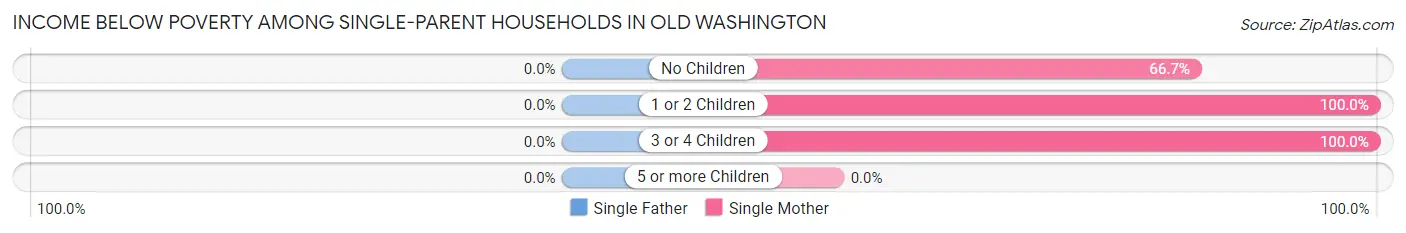
Income Below Poverty Among Single-Parent Households in Old Washington
| Children | Single Father | Single Mother |
| No Children | 0 (0.0%) | 2 (66.7%) |
| 1 or 2 Children | 0 (0.0%) | 3 (100.0%) |
| 3 or 4 Children | 0 (0.0%) | 37 (100.0%) |
| 5 or more Children | 0 (0.0%) | 0 (0.0%) |
| Total | 0 (0.0%) | 42 (97.7%) |
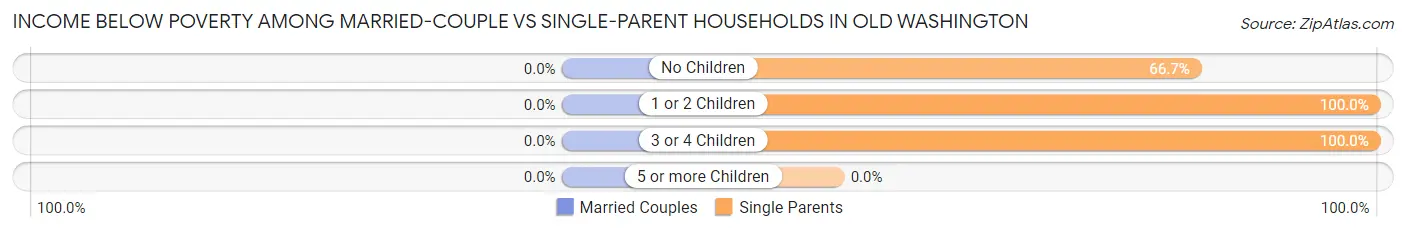
Income Below Poverty Among Married-Couple vs Single-Parent Households in Old Washington
| Children | Married-Couple Families | Single-Parent Households |
| No Children | 0 (0.0%) | 2 (66.7%) |
| 1 or 2 Children | 0 (0.0%) | 3 (100.0%) |
| 3 or 4 Children | 0 (0.0%) | 37 (100.0%) |
| 5 or more Children | 0 (0.0%) | 0 (0.0%) |
| Total | 0 (0.0%) | 42 (97.7%) |
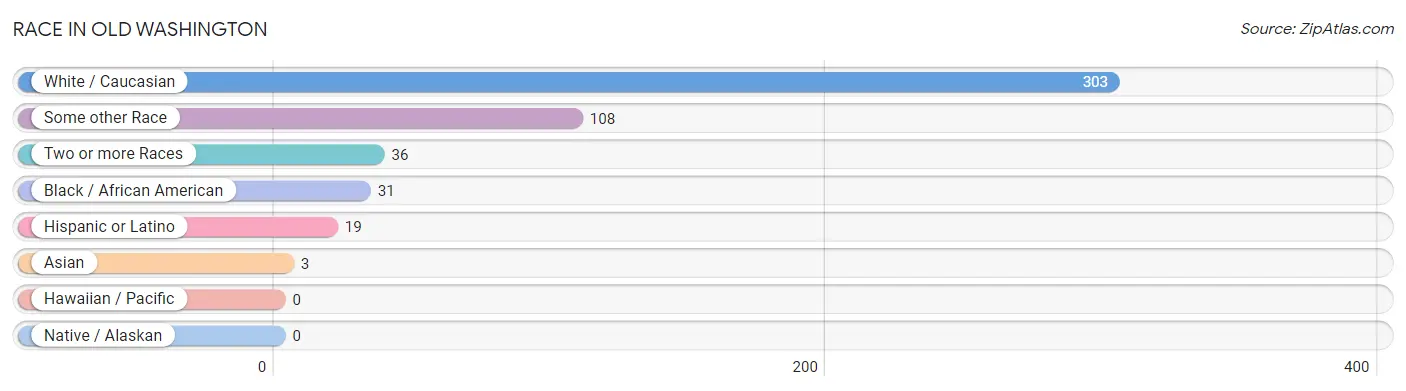
Race in Old Washington
The most populous races in Old Washington are White / Caucasian (303 | 63.0%), Some other Race (108 | 22.5%), and Two or more Races (36 | 7.5%).
| Race | # Population | % Population |
| Asian | 3 | 0.6% |
| Black / African American | 31 | 6.4% |
| Hawaiian / Pacific | 0 | 0.0% |
| Hispanic or Latino | 19 | 4.0% |
| Native / Alaskan | 0 | 0.0% |
| White / Caucasian | 303 | 63.0% |
| Two or more Races | 36 | 7.5% |
| Some other Race | 108 | 22.5% |
| Total | 481 | 100.0% |
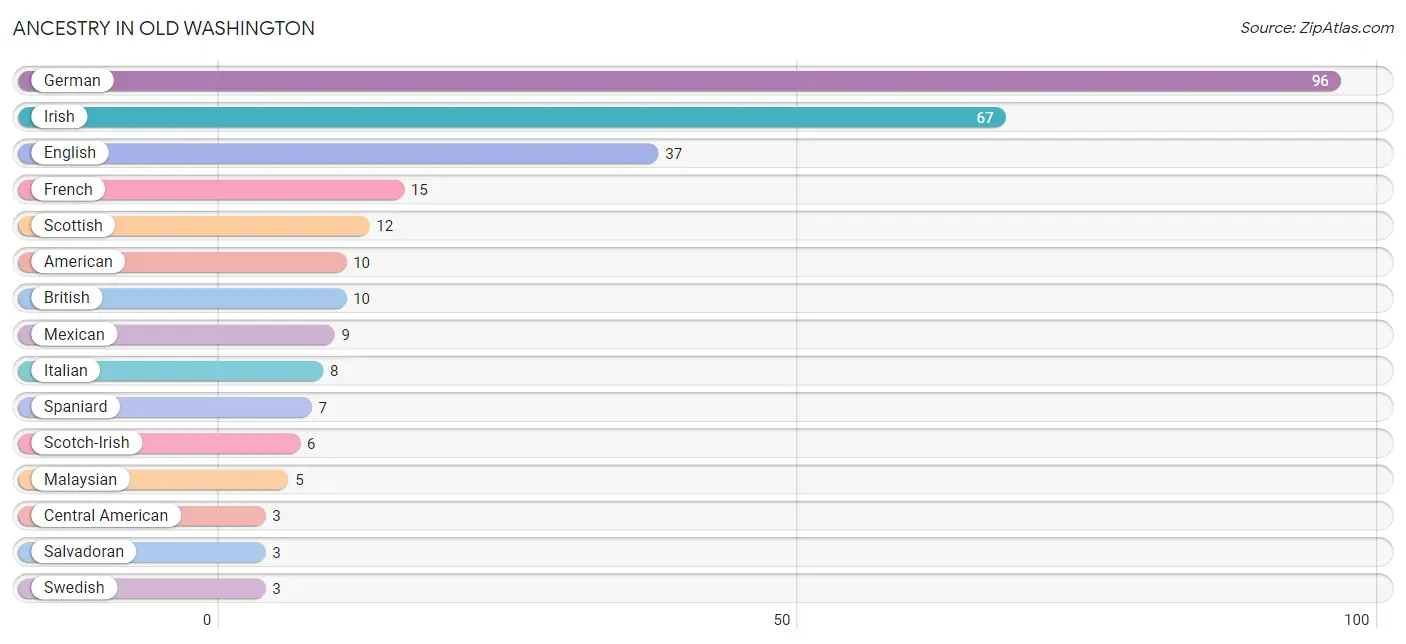
Ancestry in Old Washington
The most populous ancestries reported in Old Washington are German (96 | 20.0%), Irish (67 | 13.9%), English (37 | 7.7%), French (15 | 3.1%), and Scottish (12 | 2.5%), together accounting for 47.2% of all Old Washington residents.
| Ancestry | # Population | % Population |
| American | 10 | 2.1% |
| British | 10 | 2.1% |
| Central American | 3 | 0.6% |
| English | 37 | 7.7% |
| French | 15 | 3.1% |
| German | 96 | 20.0% |
| Irish | 67 | 13.9% |
| Italian | 8 | 1.7% |
| Malaysian | 5 | 1.0% |
| Mexican | 9 | 1.9% |
| Salvadoran | 3 | 0.6% |
| Scotch-Irish | 6 | 1.3% |
| Scottish | 12 | 2.5% |
| Spaniard | 7 | 1.5% |
| Swedish | 3 | 0.6% | View All 15 Rows |
Immigrants in Old Washington
The most numerous immigrant groups reported in Old Washington came from Europe (7 | 1.5%), Southern Europe (7 | 1.5%), Spain (7 | 1.5%), Asia (3 | 0.6%), and Pakistan (3 | 0.6%), together accounting for 5.6% of all Old Washington residents.
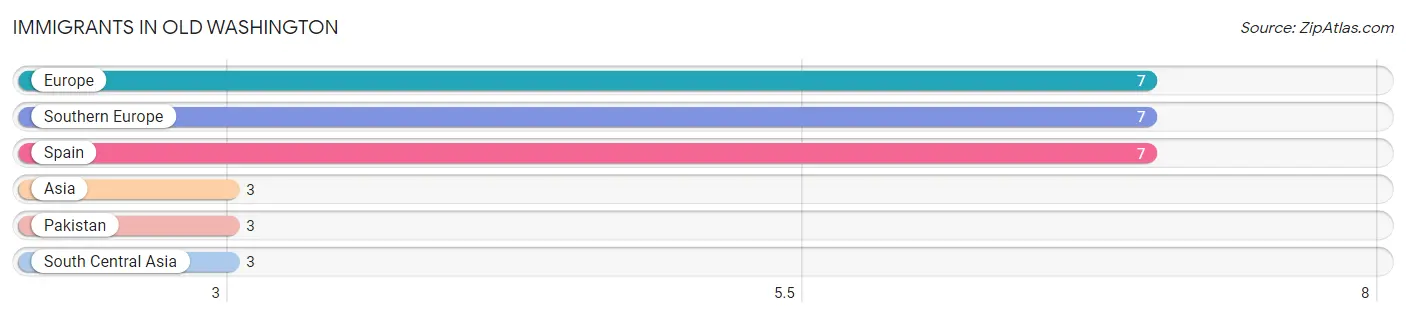
| Immigration Origin | # Population | % Population |
| Asia | 3 | 0.6% |
| Europe | 7 | 1.5% |
| Pakistan | 3 | 0.6% |
| South Central Asia | 3 | 0.6% |
| Southern Europe | 7 | 1.5% |
| Spain | 7 | 1.5% | View All 6 Rows |
Sex and Age in Old Washington
Sex and Age in Old Washington
The most populous age groups in Old Washington are 10 to 14 Years (40 | 24.8%) for men and 35 to 39 Years (83 | 25.9%) for women.
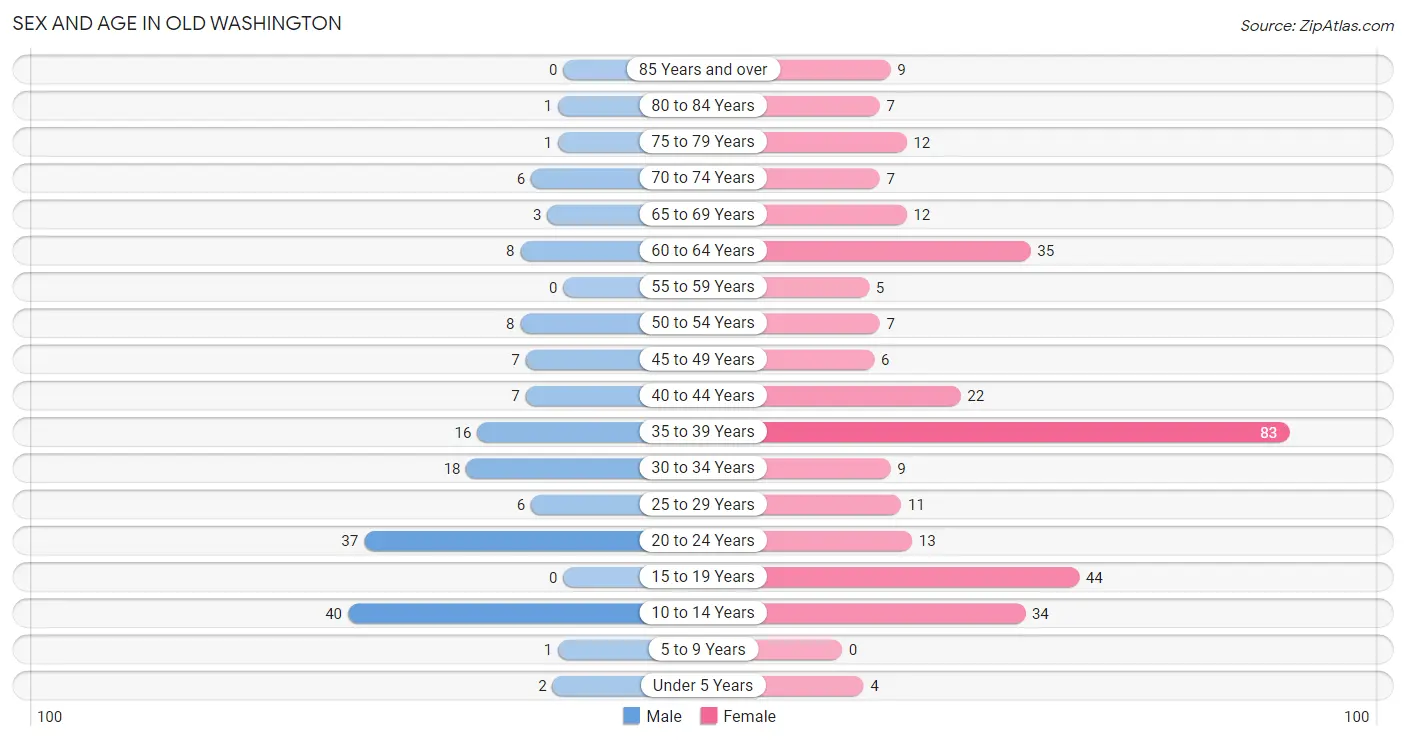
| Age Bracket | Male | Female |
| Under 5 Years | 2 (1.2%) | 4 (1.3%) |
| 5 to 9 Years | 1 (0.6%) | 0 (0.0%) |
| 10 to 14 Years | 40 (24.8%) | 34 (10.6%) |
| 15 to 19 Years | 0 (0.0%) | 44 (13.8%) |
| 20 to 24 Years | 37 (23.0%) | 13 (4.1%) |
| 25 to 29 Years | 6 (3.7%) | 11 (3.4%) |
| 30 to 34 Years | 18 (11.2%) | 9 (2.8%) |
| 35 to 39 Years | 16 (9.9%) | 83 (25.9%) |
| 40 to 44 Years | 7 (4.3%) | 22 (6.9%) |
| 45 to 49 Years | 7 (4.3%) | 6 (1.9%) |
| 50 to 54 Years | 8 (5.0%) | 7 (2.2%) |
| 55 to 59 Years | 0 (0.0%) | 5 (1.6%) |
| 60 to 64 Years | 8 (5.0%) | 35 (10.9%) |
| 65 to 69 Years | 3 (1.9%) | 12 (3.7%) |
| 70 to 74 Years | 6 (3.7%) | 7 (2.2%) |
| 75 to 79 Years | 1 (0.6%) | 12 (3.7%) |
| 80 to 84 Years | 1 (0.6%) | 7 (2.2%) |
| 85 Years and over | 0 (0.0%) | 9 (2.8%) |
| Total | 161 (100.0%) | 320 (100.0%) |
Families and Households in Old Washington
Median Family Size in Old Washington
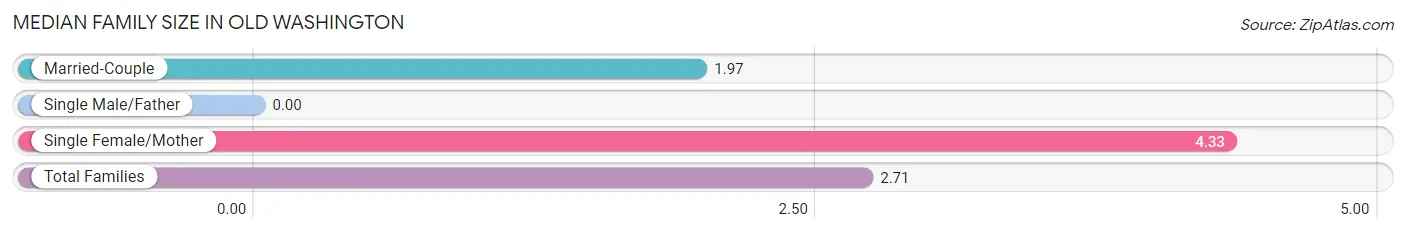
| Family Type | # Families | Family Size |
| Married-Couple | 93 (68.4%) | 1.97 |
| Single Male/Father | 0 (0.0%) | - |
| Single Female/Mother | 43 (31.6%) | 4.33 |
| Total Families | 136 (100.0%) | 2.71 |
Median Household Size in Old Washington
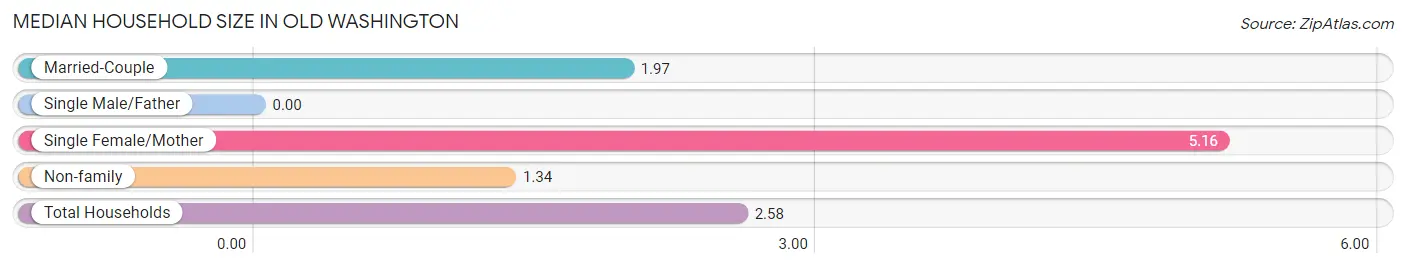
| Household Type | # Households | Household Size |
| Married-Couple | 93 (51.7%) | 1.97 |
| Single Male/Father | 0 (0.0%) | - |
| Single Female/Mother | 43 (23.9%) | 5.16 |
| Non-family | 44 (24.4%) | 1.34 |
| Total Households | 180 (100.0%) | 2.58 |
Household Size by Marriage Status in Old Washington
Out of a total of 180 households in Old Washington, 136 (75.6%) are family households, while 44 (24.4%) are nonfamily households. The most numerous type of family households are 2-person households, comprising 64, and the most common type of nonfamily households are 1-person households, comprising 38.
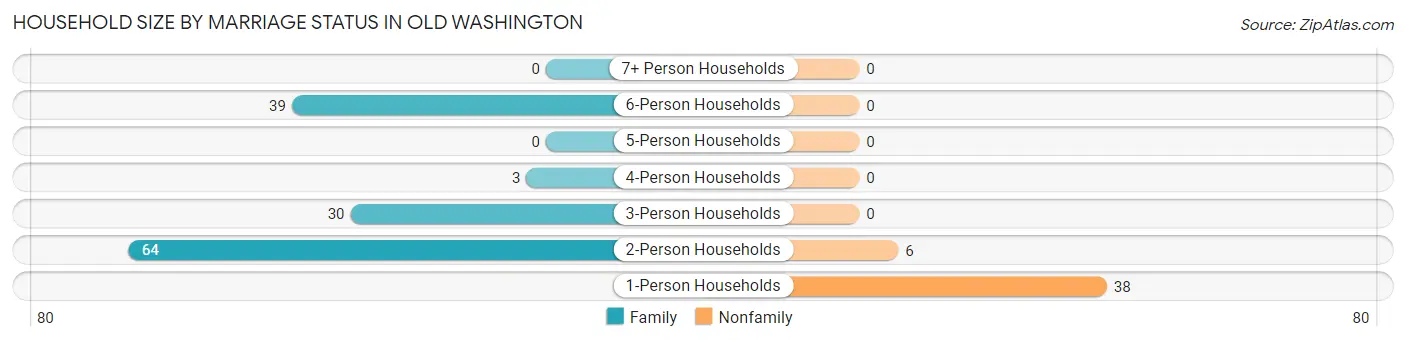
| Household Size | Family Households | Nonfamily Households |
| 1-Person Households | - | 38 (21.1%) |
| 2-Person Households | 64 (35.6%) | 6 (3.3%) |
| 3-Person Households | 30 (16.7%) | 0 (0.0%) |
| 4-Person Households | 3 (1.7%) | 0 (0.0%) |
| 5-Person Households | 0 (0.0%) | 0 (0.0%) |
| 6-Person Households | 39 (21.7%) | 0 (0.0%) |
| 7+ Person Households | 0 (0.0%) | 0 (0.0%) |
| Total | 136 (75.6%) | 44 (24.4%) |
Female Fertility in Old Washington
Fertility by Age in Old Washington
| Age Bracket | Women with Births | Births / 1,000 Women |
| 15 to 19 years | 0 (0.0%) | 0.0 |
| 20 to 34 years | 0 (0.0%) | 0.0 |
| 35 to 50 years | 0 (0.0%) | 0.0 |
| Total | 0 (0.0%) | 0.0 |
Fertility by Age by Marriage Status in Old Washington
| Age Bracket | Married | Unmarried |
| 15 to 19 years | 0 (0.0%) | 0 (0.0%) |
| 20 to 34 years | 0 (0.0%) | 0 (0.0%) |
| 35 to 50 years | 0 (0.0%) | 0 (0.0%) |
| Total | 0 (0.0%) | 0 (0.0%) |
Fertility by Education in Old Washington
| Educational Attainment | Women with Births | Births / 1,000 Women |
| Less than High School | 0 (0.0%) | 0.0 |
| High School Diploma | 0 (0.0%) | 0.0 |
| College or Associate's Degree | 0 (0.0%) | 0.0 |
| Bachelor's Degree | 0 (0.0%) | 0.0 |
| Graduate Degree | 0 (0.0%) | 0.0 |
| Total | 0 (0.0%) | 0.0 |
Fertility by Education by Marriage Status in Old Washington
| Educational Attainment | Married | Unmarried |
| Less than High School | 0 (0.0%) | 0 (0.0%) |
| High School Diploma | 0 (0.0%) | 0 (0.0%) |
| College or Associate's Degree | 0 (0.0%) | 0 (0.0%) |
| Bachelor's Degree | 0 (0.0%) | 0 (0.0%) |
| Graduate Degree | 0 (0.0%) | 0 (0.0%) |
| Total | 0 (0.0%) | 0 (0.0%) |
Employment Characteristics in Old Washington
Employment by Class of Employer in Old Washington
Among the 236 employed individuals in Old Washington, private company employees (185 | 78.4%), local government employees (24 | 10.2%), and self-employed (incorporated) (15 | 6.4%) make up the most common classes of employment.
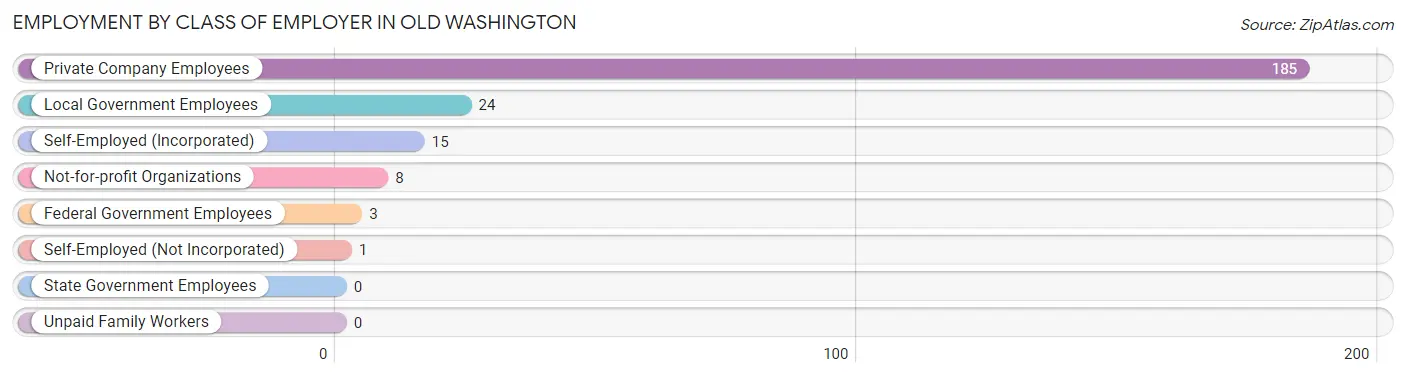
| Employer Class | # Employees | % Employees |
| Private Company Employees | 185 | 78.4% |
| Self-Employed (Incorporated) | 15 | 6.4% |
| Self-Employed (Not Incorporated) | 1 | 0.4% |
| Not-for-profit Organizations | 8 | 3.4% |
| Local Government Employees | 24 | 10.2% |
| State Government Employees | 0 | 0.0% |
| Federal Government Employees | 3 | 1.3% |
| Unpaid Family Workers | 0 | 0.0% |
| Total | 236 | 100.0% |
Employment Status by Age in Old Washington
According to the labor force statistics for Old Washington, out of the total population over 16 years of age (399), 62.4% or 249 individuals are in the labor force, with 5.2% or 13 of them unemployed. The age group with the highest labor force participation rate is 16 to 19 years, with 100.0% or 43 individuals in the labor force. Within the labor force, the 45 to 54 years age range has the highest percentage of unemployed individuals, with 18.5% or 5 of them being unemployed.
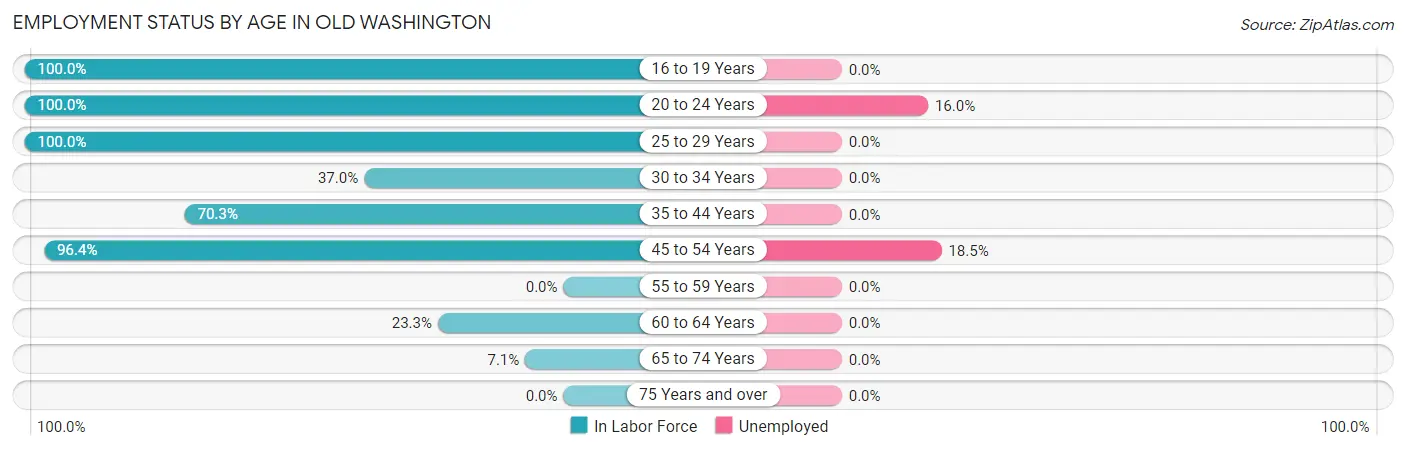
| Age Bracket | In Labor Force | Unemployed |
| 16 to 19 Years | 43 (100.0%) | 0 (0.0%) |
| 20 to 24 Years | 50 (100.0%) | 8 (16.0%) |
| 25 to 29 Years | 17 (100.0%) | 0 (0.0%) |
| 30 to 34 Years | 10 (37.0%) | 0 (0.0%) |
| 35 to 44 Years | 90 (70.3%) | 0 (0.0%) |
| 45 to 54 Years | 27 (96.4%) | 5 (18.5%) |
| 55 to 59 Years | 0 (0.0%) | 0 (0.0%) |
| 60 to 64 Years | 10 (23.3%) | 0 (0.0%) |
| 65 to 74 Years | 2 (7.1%) | 0 (0.0%) |
| 75 Years and over | 0 (0.0%) | 0 (0.0%) |
| Total | 249 (62.4%) | 13 (5.2%) |
Employment Status by Educational Attainment in Old Washington
According to labor force statistics for Old Washington, 62.1% of individuals (154) out of the total population between 25 and 64 years of age (248) are in the labor force, with 3.2% or 5 of them being unemployed. The group with the highest labor force participation rate are those with the educational attainment of bachelor's degree or higher, with 100.0% or 29 individuals in the labor force. Within the labor force, individuals with college / associate degree education have the highest percentage of unemployment, with 6.3% or 5 of them being unemployed.
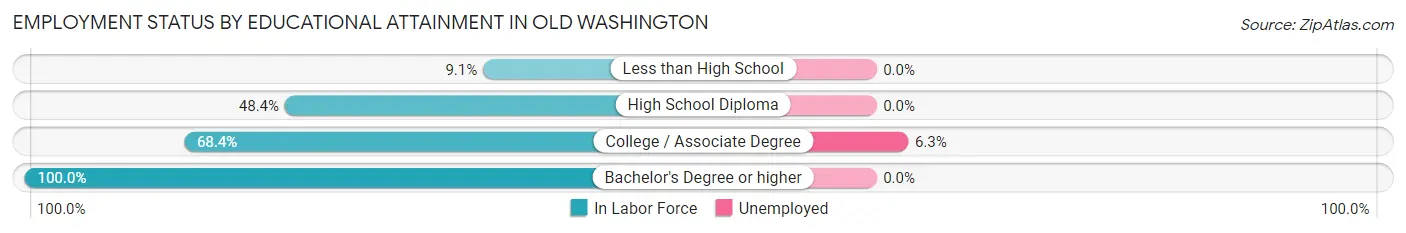
| Educational Attainment | In Labor Force | Unemployed |
| Less than High School | 1 (9.1%) | 0 (0.0%) |
| High School Diploma | 44 (48.4%) | 0 (0.0%) |
| College / Associate Degree | 80 (68.4%) | 7 (6.3%) |
| Bachelor's Degree or higher | 29 (100.0%) | 0 (0.0%) |
| Total | 154 (62.1%) | 8 (3.2%) |
Employment Occupations by Sex in Old Washington
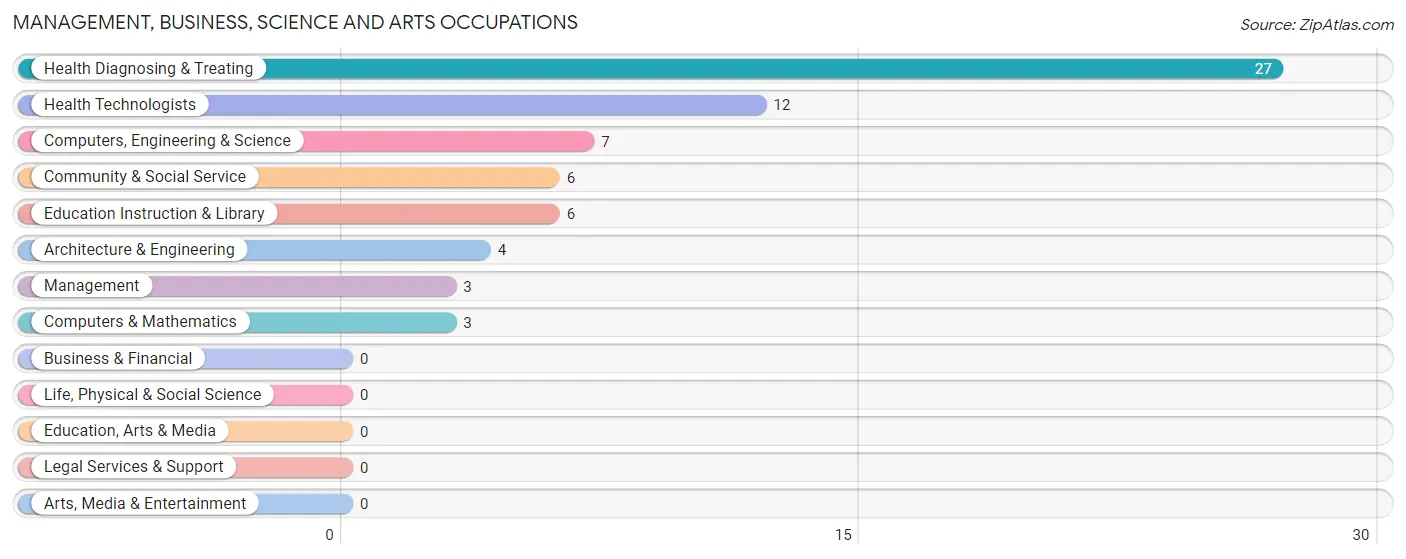
Management, Business, Science and Arts Occupations
The most common Management, Business, Science and Arts occupations in Old Washington are Health Diagnosing & Treating (27 | 11.4%), Health Technologists (12 | 5.1%), Computers, Engineering & Science (7 | 3.0%), Community & Social Service (6 | 2.5%), and Education Instruction & Library (6 | 2.5%).
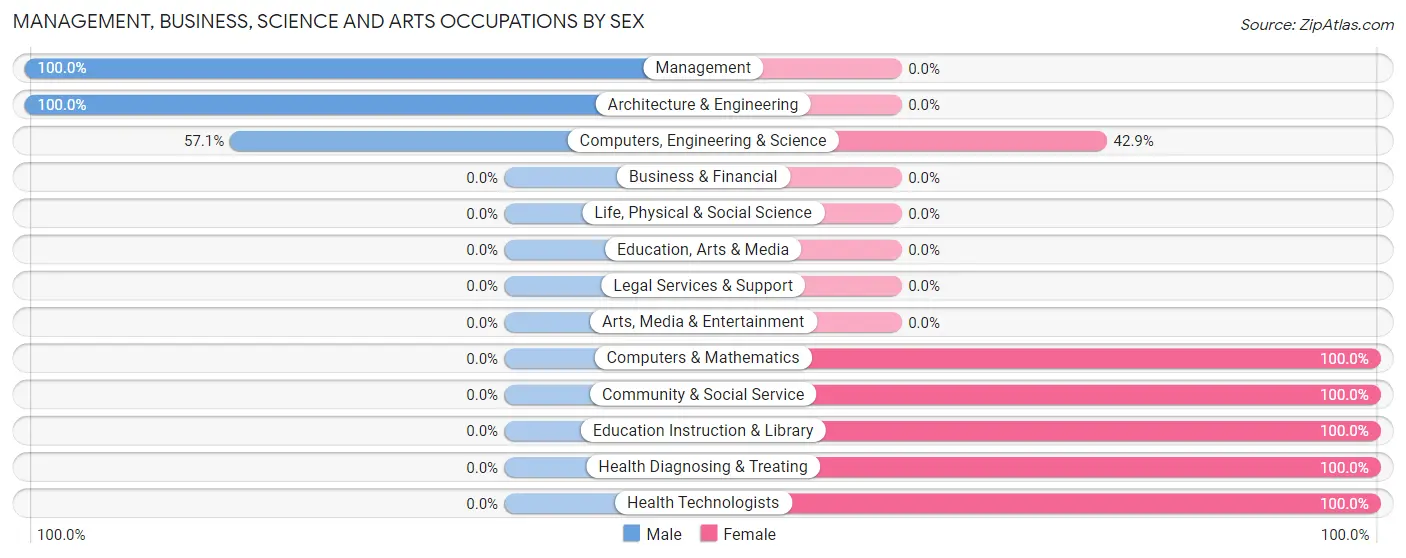
Management, Business, Science and Arts Occupations by Sex
Within the Management, Business, Science and Arts occupations in Old Washington, the most male-oriented occupations are Management (100.0%), Architecture & Engineering (100.0%), and Computers, Engineering & Science (57.1%), while the most female-oriented occupations are Computers & Mathematics (100.0%), Community & Social Service (100.0%), and Education Instruction & Library (100.0%).
| Occupation | Male | Female |
| Management | 3 (100.0%) | 0 (0.0%) |
| Business & Financial | 0 (0.0%) | 0 (0.0%) |
| Computers, Engineering & Science | 4 (57.1%) | 3 (42.9%) |
| Computers & Mathematics | 0 (0.0%) | 3 (100.0%) |
| Architecture & Engineering | 4 (100.0%) | 0 (0.0%) |
| Life, Physical & Social Science | 0 (0.0%) | 0 (0.0%) |
| Community & Social Service | 0 (0.0%) | 6 (100.0%) |
| Education, Arts & Media | 0 (0.0%) | 0 (0.0%) |
| Legal Services & Support | 0 (0.0%) | 0 (0.0%) |
| Education Instruction & Library | 0 (0.0%) | 6 (100.0%) |
| Arts, Media & Entertainment | 0 (0.0%) | 0 (0.0%) |
| Health Diagnosing & Treating | 0 (0.0%) | 27 (100.0%) |
| Health Technologists | 0 (0.0%) | 12 (100.0%) |
| Total (Category) | 7 (16.3%) | 36 (83.7%) |
| Total (Overall) | 89 (37.7%) | 147 (62.3%) |
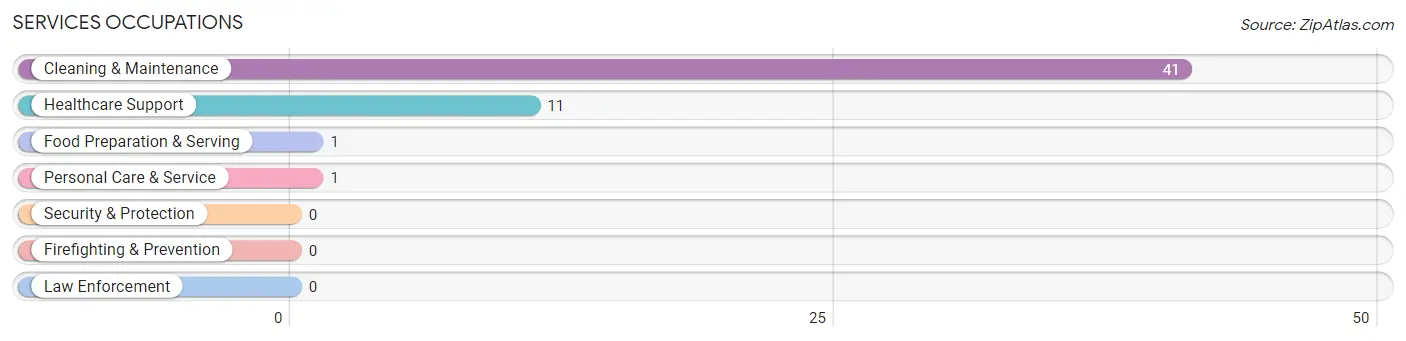
Services Occupations
The most common Services occupations in Old Washington are Cleaning & Maintenance (41 | 17.4%), Healthcare Support (11 | 4.7%), Food Preparation & Serving (1 | 0.4%), and Personal Care & Service (1 | 0.4%).
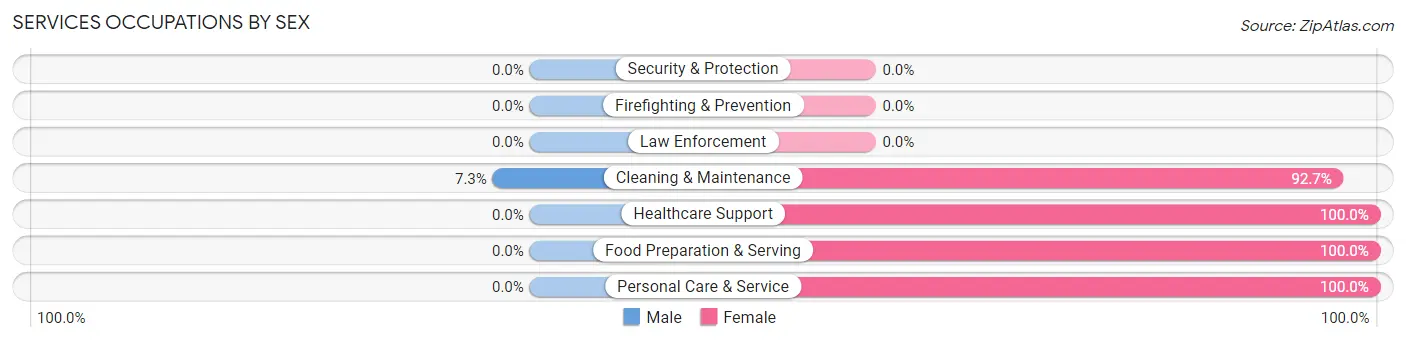
Services Occupations by Sex
| Occupation | Male | Female |
| Healthcare Support | 0 (0.0%) | 11 (100.0%) |
| Security & Protection | 0 (0.0%) | 0 (0.0%) |
| Firefighting & Prevention | 0 (0.0%) | 0 (0.0%) |
| Law Enforcement | 0 (0.0%) | 0 (0.0%) |
| Food Preparation & Serving | 0 (0.0%) | 1 (100.0%) |
| Cleaning & Maintenance | 3 (7.3%) | 38 (92.7%) |
| Personal Care & Service | 0 (0.0%) | 1 (100.0%) |
| Total (Category) | 3 (5.6%) | 51 (94.4%) |
| Total (Overall) | 89 (37.7%) | 147 (62.3%) |
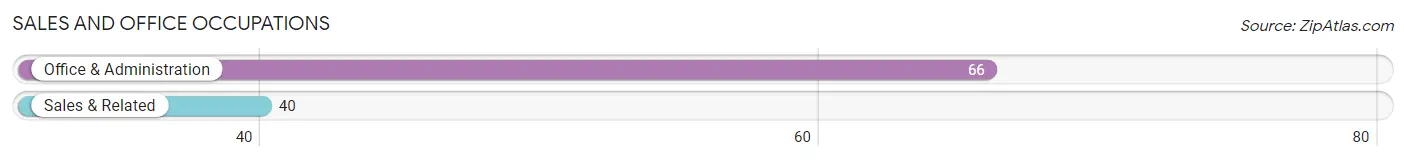
Sales and Office Occupations
The most common Sales and Office occupations in Old Washington are Office & Administration (66 | 28.0%), and Sales & Related (40 | 17.0%).
Sales and Office Occupations by Sex
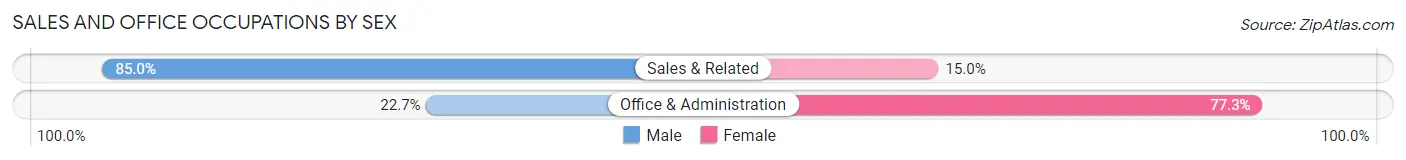
| Occupation | Male | Female |
| Sales & Related | 34 (85.0%) | 6 (15.0%) |
| Office & Administration | 15 (22.7%) | 51 (77.3%) |
| Total (Category) | 49 (46.2%) | 57 (53.8%) |
| Total (Overall) | 89 (37.7%) | 147 (62.3%) |
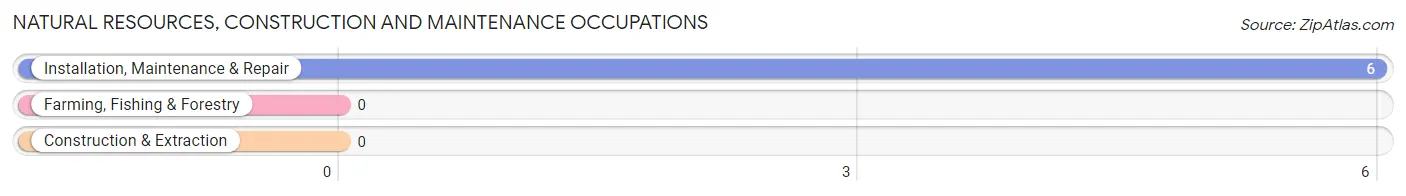
Natural Resources, Construction and Maintenance Occupations
The most common Natural Resources, Construction and Maintenance occupations in Old Washington are , and Installation, Maintenance & Repair (6 | 2.5%).
Natural Resources, Construction and Maintenance Occupations by Sex
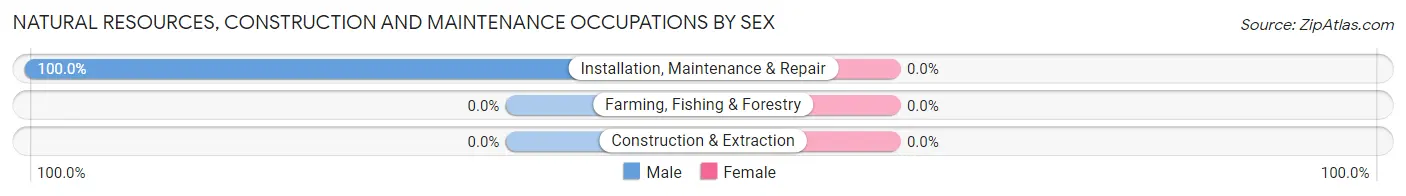
| Occupation | Male | Female |
| Farming, Fishing & Forestry | 0 (0.0%) | 0 (0.0%) |
| Construction & Extraction | 0 (0.0%) | 0 (0.0%) |
| Installation, Maintenance & Repair | 6 (100.0%) | 0 (0.0%) |
| Total (Category) | 6 (100.0%) | 0 (0.0%) |
| Total (Overall) | 89 (37.7%) | 147 (62.3%) |
Production, Transportation and Moving Occupations
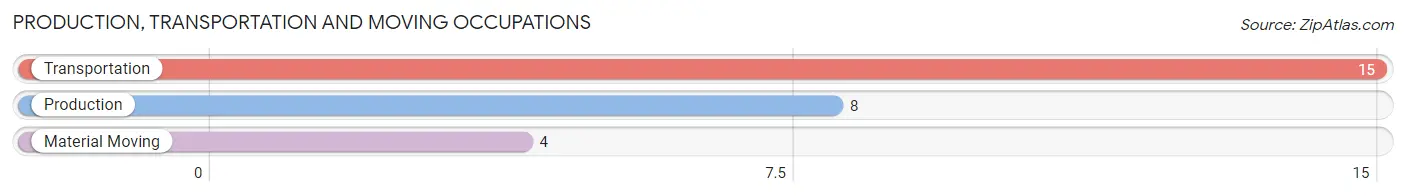
The most common Production, Transportation and Moving occupations in Old Washington are Transportation (15 | 6.4%), Production (8 | 3.4%), and Material Moving (4 | 1.7%).
Production, Transportation and Moving Occupations by Sex
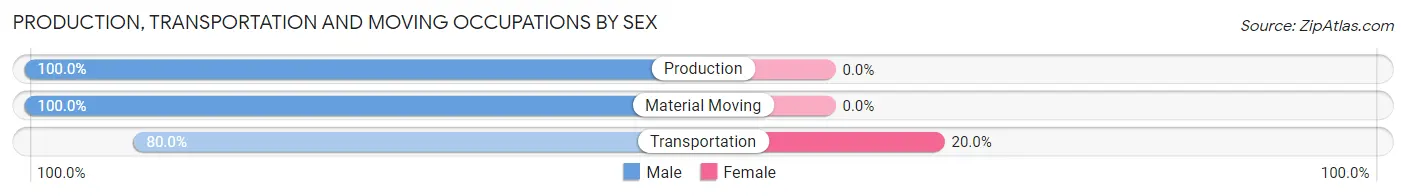
| Occupation | Male | Female |
| Production | 8 (100.0%) | 0 (0.0%) |
| Transportation | 12 (80.0%) | 3 (20.0%) |
| Material Moving | 4 (100.0%) | 0 (0.0%) |
| Total (Category) | 24 (88.9%) | 3 (11.1%) |
| Total (Overall) | 89 (37.7%) | 147 (62.3%) |
Employment Industries by Sex in Old Washington
Employment Industries in Old Washington
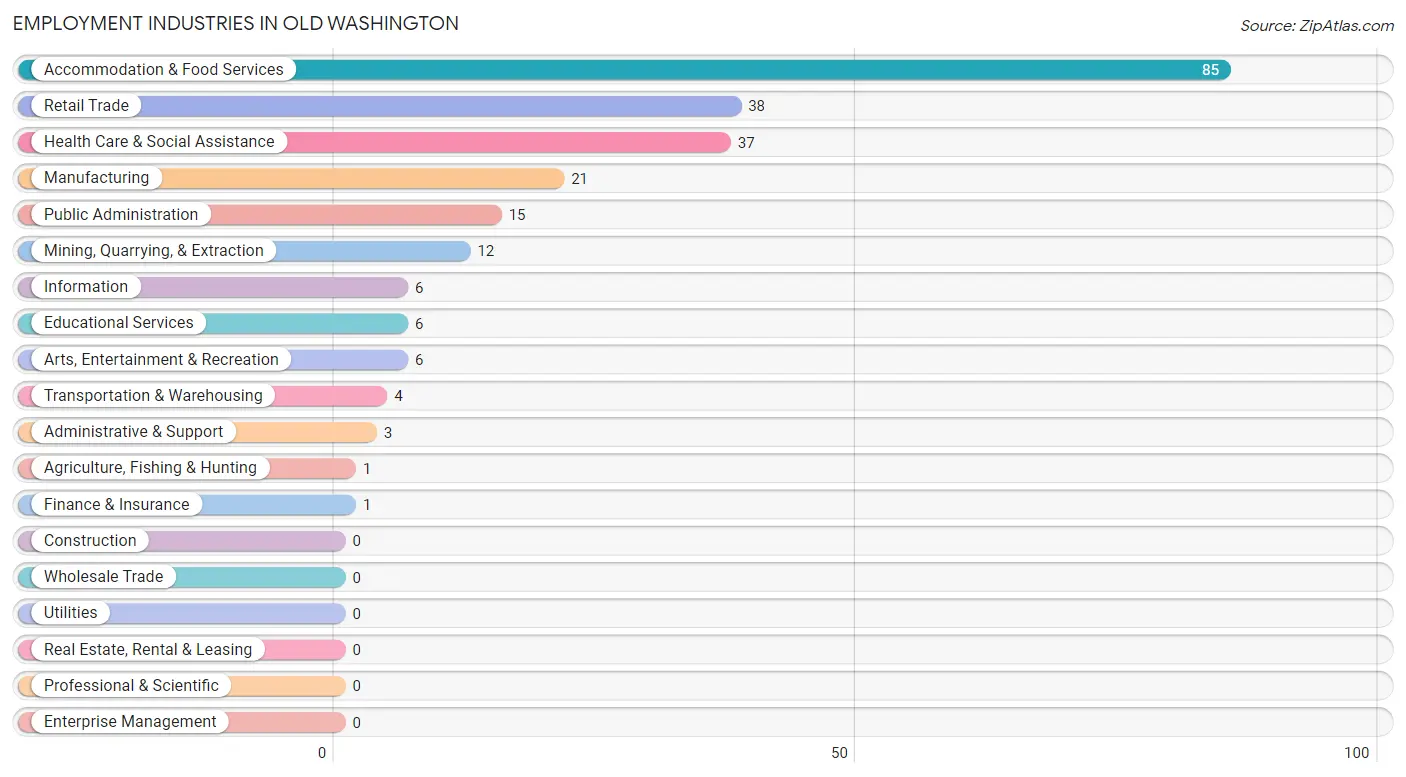
The major employment industries in Old Washington include Accommodation & Food Services (85 | 36.0%), Retail Trade (38 | 16.1%), Health Care & Social Assistance (37 | 15.7%), Manufacturing (21 | 8.9%), and Public Administration (15 | 6.4%).
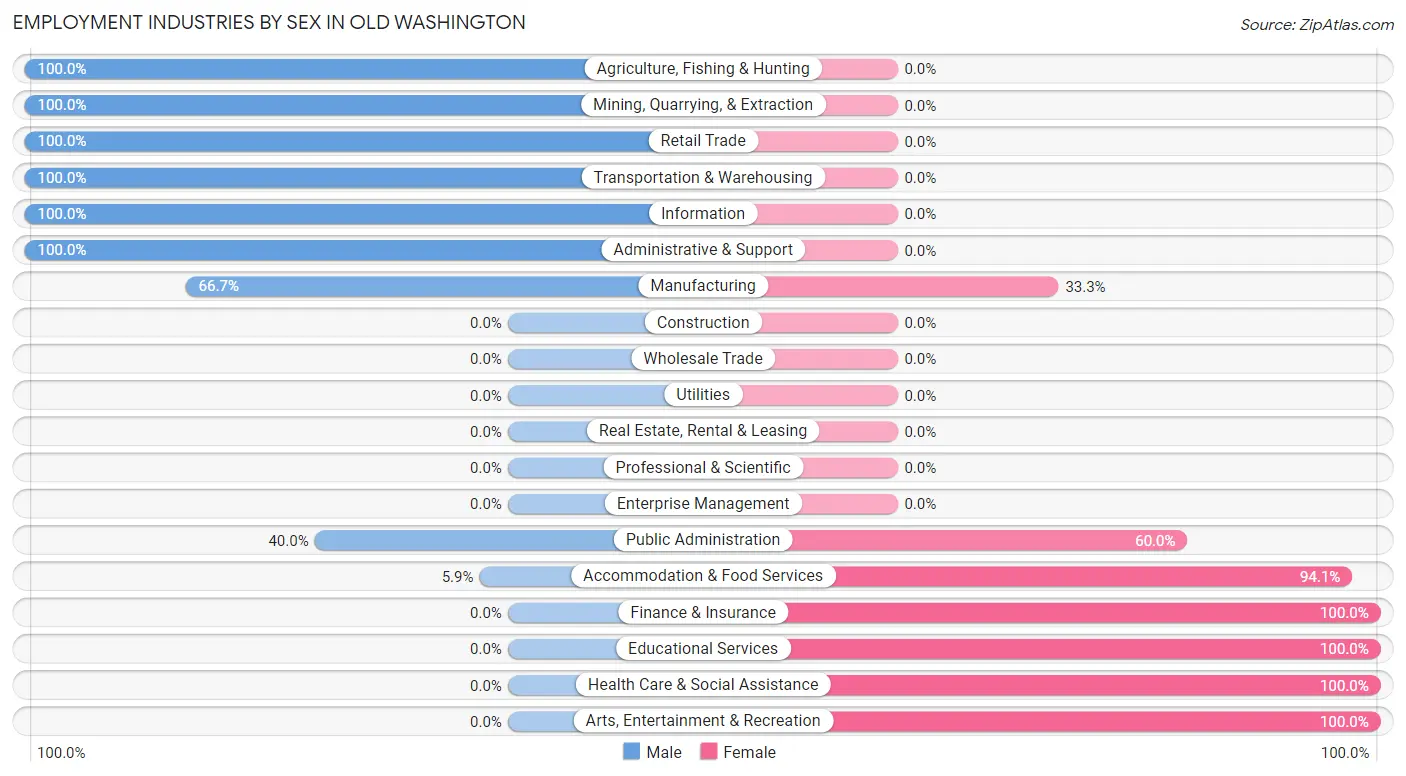
Employment Industries by Sex in Old Washington
The Old Washington industries that see more men than women are Agriculture, Fishing & Hunting (100.0%), Mining, Quarrying, & Extraction (100.0%), and Retail Trade (100.0%), whereas the industries that tend to have a higher number of women are Finance & Insurance (100.0%), Educational Services (100.0%), and Health Care & Social Assistance (100.0%).
| Industry | Male | Female |
| Agriculture, Fishing & Hunting | 1 (100.0%) | 0 (0.0%) |
| Mining, Quarrying, & Extraction | 12 (100.0%) | 0 (0.0%) |
| Construction | 0 (0.0%) | 0 (0.0%) |
| Manufacturing | 14 (66.7%) | 7 (33.3%) |
| Wholesale Trade | 0 (0.0%) | 0 (0.0%) |
| Retail Trade | 38 (100.0%) | 0 (0.0%) |
| Transportation & Warehousing | 4 (100.0%) | 0 (0.0%) |
| Utilities | 0 (0.0%) | 0 (0.0%) |
| Information | 6 (100.0%) | 0 (0.0%) |
| Finance & Insurance | 0 (0.0%) | 1 (100.0%) |
| Real Estate, Rental & Leasing | 0 (0.0%) | 0 (0.0%) |
| Professional & Scientific | 0 (0.0%) | 0 (0.0%) |
| Enterprise Management | 0 (0.0%) | 0 (0.0%) |
| Administrative & Support | 3 (100.0%) | 0 (0.0%) |
| Educational Services | 0 (0.0%) | 6 (100.0%) |
| Health Care & Social Assistance | 0 (0.0%) | 37 (100.0%) |
| Arts, Entertainment & Recreation | 0 (0.0%) | 6 (100.0%) |
| Accommodation & Food Services | 5 (5.9%) | 80 (94.1%) |
| Public Administration | 6 (40.0%) | 9 (60.0%) |
| Total | 89 (37.7%) | 147 (62.3%) |
Education in Old Washington
School Enrollment in Old Washington
The most common levels of schooling among the 130 students in Old Washington are middle school (43 | 33.1%), high school (41 | 31.5%), and elementary school (31 | 23.8%).
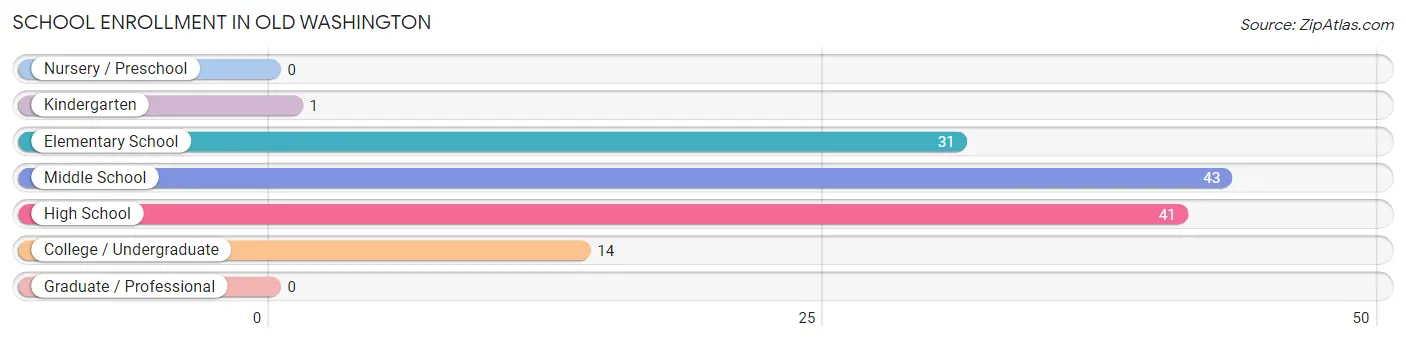
| School Level | # Students | % Students |
| Nursery / Preschool | 0 | 0.0% |
| Kindergarten | 1 | 0.8% |
| Elementary School | 31 | 23.8% |
| Middle School | 43 | 33.1% |
| High School | 41 | 31.5% |
| College / Undergraduate | 14 | 10.8% |
| Graduate / Professional | 0 | 0.0% |
| Total | 130 | 100.0% |
School Enrollment by Age by Funding Source in Old Washington
Out of a total of 130 students who are enrolled in schools in Old Washington, 1 (0.8%) attend a private institution, while the remaining 129 (99.2%) are enrolled in public schools. The age group of 15 to 17 year olds has the highest likelihood of being enrolled in private schools, with 1 (2.4% in the age bracket) enrolled. Conversely, the age group of 5 to 9 year old has the lowest likelihood of being enrolled in a private school, with 1 (100.0% in the age bracket) attending a public institution.
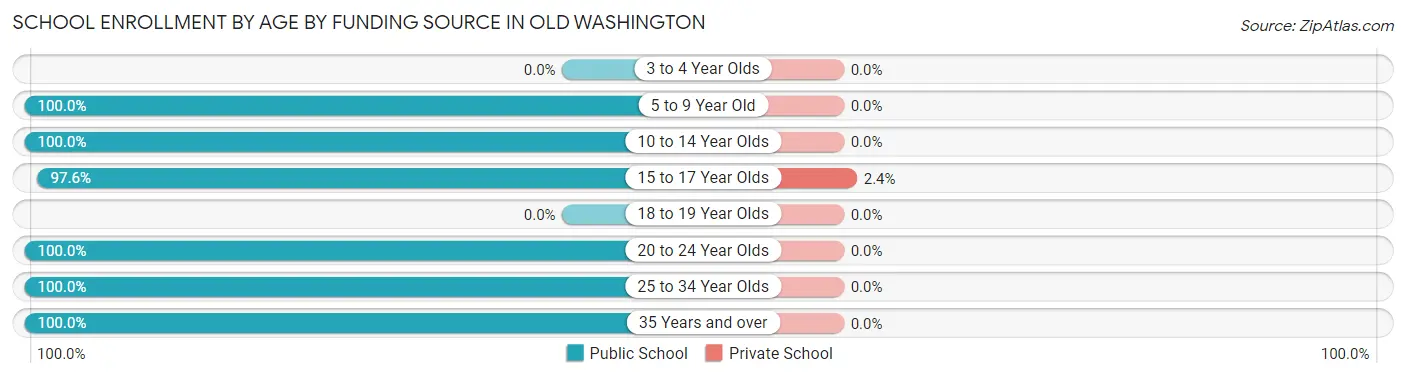
| Age Bracket | Public School | Private School |
| 3 to 4 Year Olds | 0 (0.0%) | 0 (0.0%) |
| 5 to 9 Year Old | 1 (100.0%) | 0 (0.0%) |
| 10 to 14 Year Olds | 74 (100.0%) | 0 (0.0%) |
| 15 to 17 Year Olds | 40 (97.6%) | 1 (2.4%) |
| 18 to 19 Year Olds | 0 (0.0%) | 0 (0.0%) |
| 20 to 24 Year Olds | 6 (100.0%) | 0 (0.0%) |
| 25 to 34 Year Olds | 3 (100.0%) | 0 (0.0%) |
| 35 Years and over | 5 (100.0%) | 0 (0.0%) |
| Total | 129 (99.2%) | 1 (0.8%) |
Educational Attainment by Field of Study in Old Washington
Education (24 | 68.6%), liberal arts & history (6 | 17.1%), arts & humanities (3 | 8.6%), bio, nature & agricultural (1 | 2.9%), and psychology (1 | 2.9%) are the most common fields of study among 35 individuals in Old Washington who have obtained a bachelor's degree or higher.
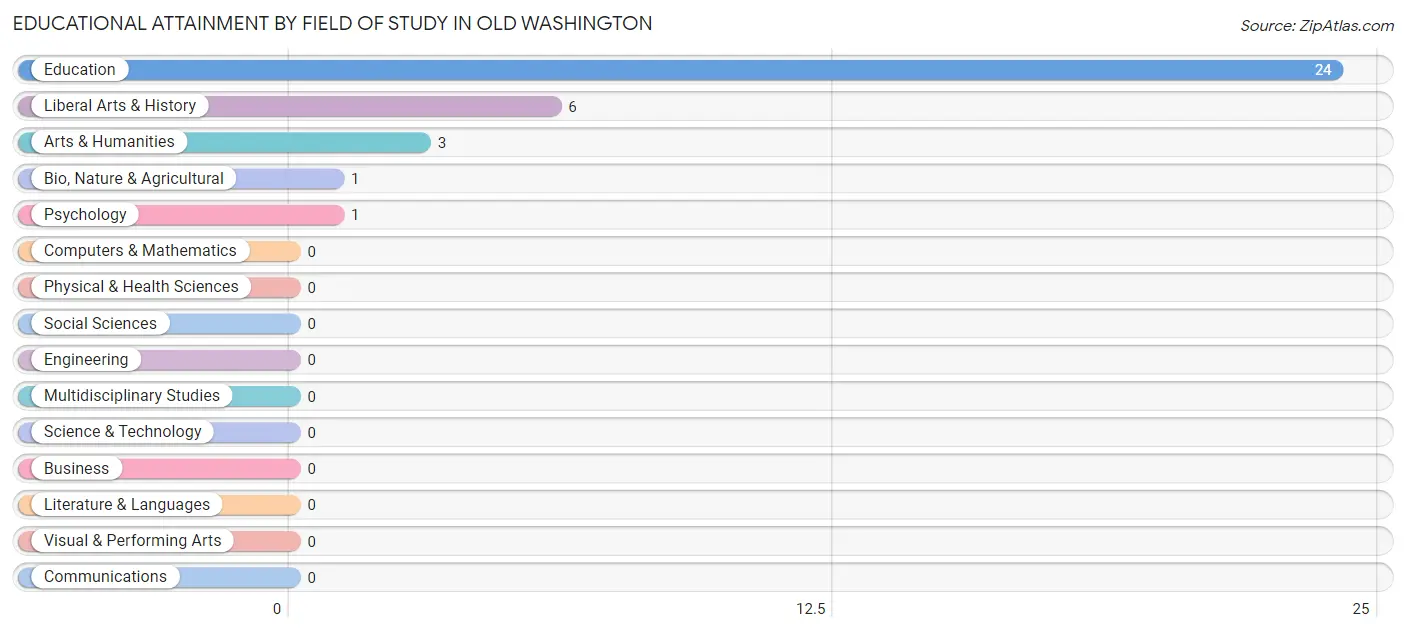
| Field of Study | # Graduates | % Graduates |
| Computers & Mathematics | 0 | 0.0% |
| Bio, Nature & Agricultural | 1 | 2.9% |
| Physical & Health Sciences | 0 | 0.0% |
| Psychology | 1 | 2.9% |
| Social Sciences | 0 | 0.0% |
| Engineering | 0 | 0.0% |
| Multidisciplinary Studies | 0 | 0.0% |
| Science & Technology | 0 | 0.0% |
| Business | 0 | 0.0% |
| Education | 24 | 68.6% |
| Literature & Languages | 0 | 0.0% |
| Liberal Arts & History | 6 | 17.1% |
| Visual & Performing Arts | 0 | 0.0% |
| Communications | 0 | 0.0% |
| Arts & Humanities | 3 | 8.6% |
| Total | 35 | 100.0% |
Transportation & Commute in Old Washington
Vehicle Availability by Sex in Old Washington
The most prevalent vehicle ownership categories in Old Washington are males with 2 vehicles (64, accounting for 71.9%) and females with 2 vehicles (23, making up 43.5%).
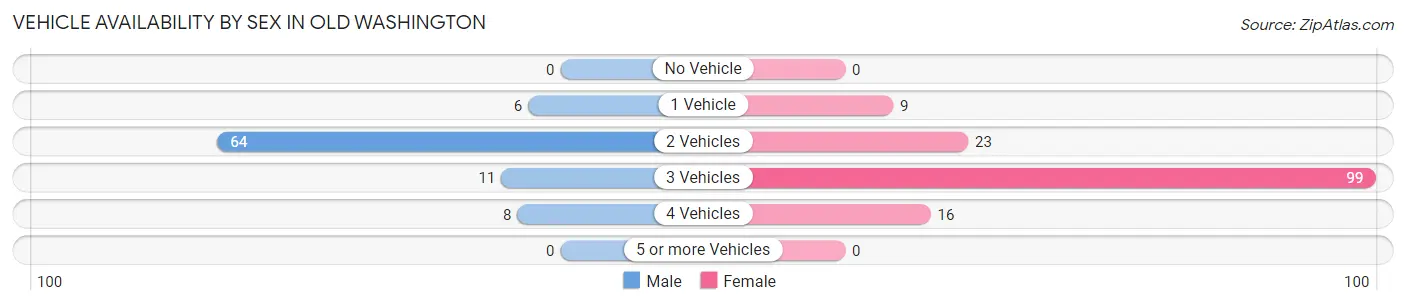
| Vehicles Available | Male | Female |
| No Vehicle | 0 (0.0%) | 0 (0.0%) |
| 1 Vehicle | 6 (6.7%) | 9 (6.1%) |
| 2 Vehicles | 64 (71.9%) | 23 (15.7%) |
| 3 Vehicles | 11 (12.4%) | 99 (67.3%) |
| 4 Vehicles | 8 (9.0%) | 16 (10.9%) |
| 5 or more Vehicles | 0 (0.0%) | 0 (0.0%) |
| Total | 89 (100.0%) | 147 (100.0%) |
Commute Time in Old Washington
The most frequently occuring commute durations in Old Washington are 15 to 19 minutes (119 commuters, 50.8%), 30 to 34 minutes (51 commuters, 21.8%), and 10 to 14 minutes (36 commuters, 15.4%).
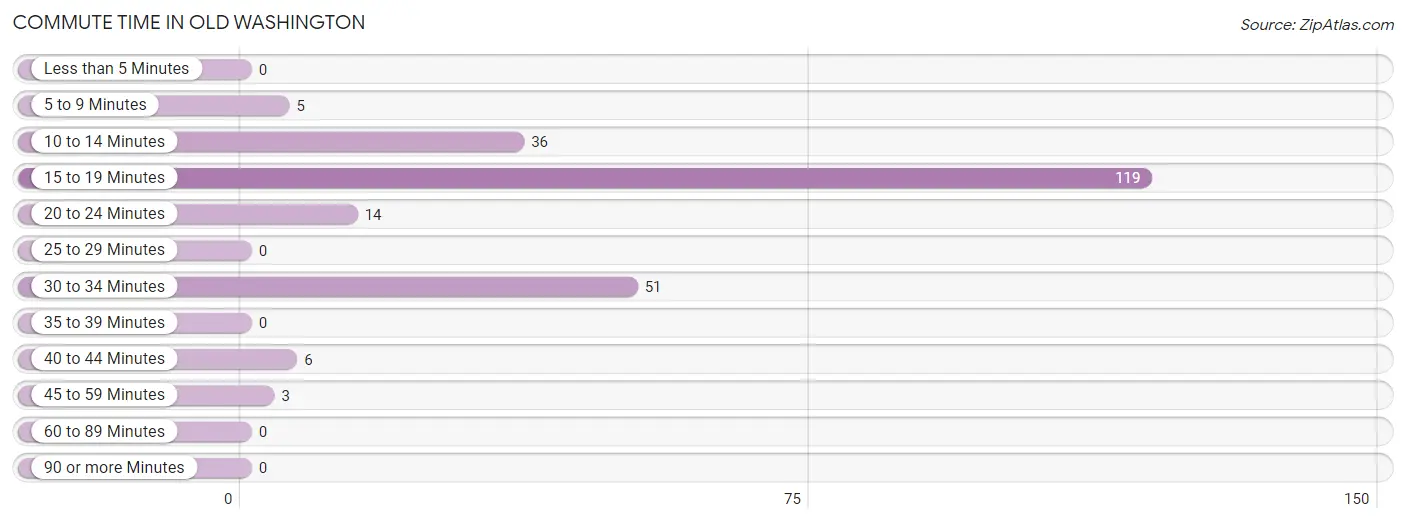
| Commute Time | # Commuters | % Commuters |
| Less than 5 Minutes | 0 | 0.0% |
| 5 to 9 Minutes | 5 | 2.1% |
| 10 to 14 Minutes | 36 | 15.4% |
| 15 to 19 Minutes | 119 | 50.8% |
| 20 to 24 Minutes | 14 | 6.0% |
| 25 to 29 Minutes | 0 | 0.0% |
| 30 to 34 Minutes | 51 | 21.8% |
| 35 to 39 Minutes | 0 | 0.0% |
| 40 to 44 Minutes | 6 | 2.6% |
| 45 to 59 Minutes | 3 | 1.3% |
| 60 to 89 Minutes | 0 | 0.0% |
| 90 or more Minutes | 0 | 0.0% |
Commute Time by Sex in Old Washington
The most common commute times in Old Washington are 30 to 34 minutes (36 commuters, 41.4%) for males and 15 to 19 minutes (102 commuters, 69.4%) for females.
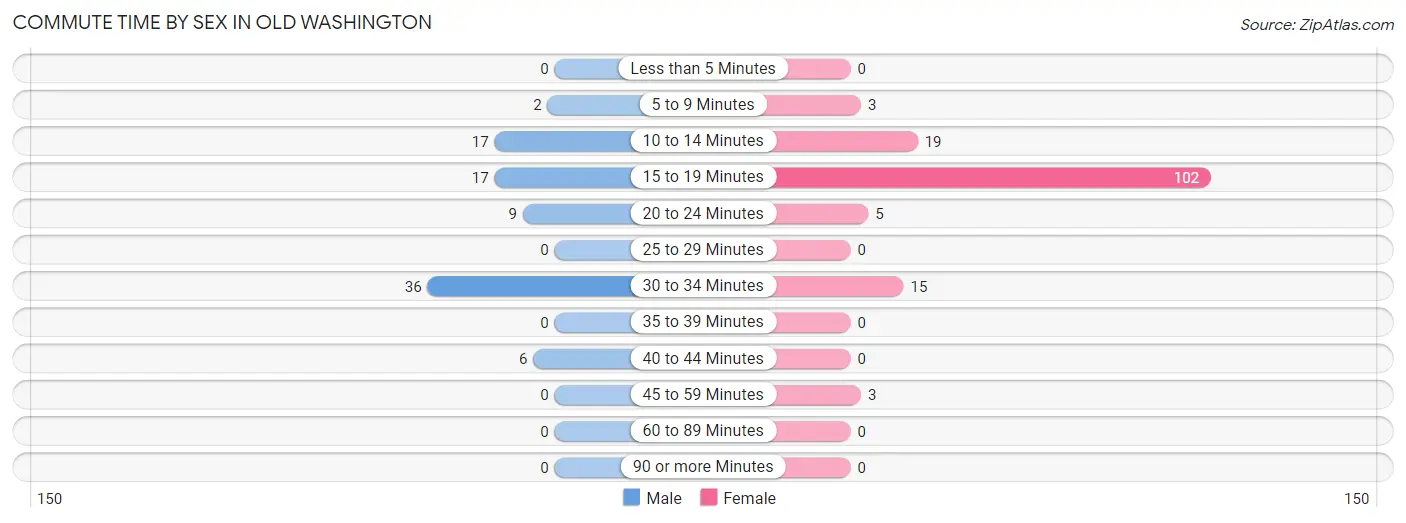
| Commute Time | Male | Female |
| Less than 5 Minutes | 0 (0.0%) | 0 (0.0%) |
| 5 to 9 Minutes | 2 (2.3%) | 3 (2.0%) |
| 10 to 14 Minutes | 17 (19.5%) | 19 (12.9%) |
| 15 to 19 Minutes | 17 (19.5%) | 102 (69.4%) |
| 20 to 24 Minutes | 9 (10.3%) | 5 (3.4%) |
| 25 to 29 Minutes | 0 (0.0%) | 0 (0.0%) |
| 30 to 34 Minutes | 36 (41.4%) | 15 (10.2%) |
| 35 to 39 Minutes | 0 (0.0%) | 0 (0.0%) |
| 40 to 44 Minutes | 6 (6.9%) | 0 (0.0%) |
| 45 to 59 Minutes | 0 (0.0%) | 3 (2.0%) |
| 60 to 89 Minutes | 0 (0.0%) | 0 (0.0%) |
| 90 or more Minutes | 0 (0.0%) | 0 (0.0%) |
Time of Departure to Work by Sex in Old Washington
The most frequent times of departure to work in Old Washington are 7:30 AM to 7:59 AM (30, 34.5%) for males and 4:00 PM to 11:59 PM (49, 33.3%) for females.
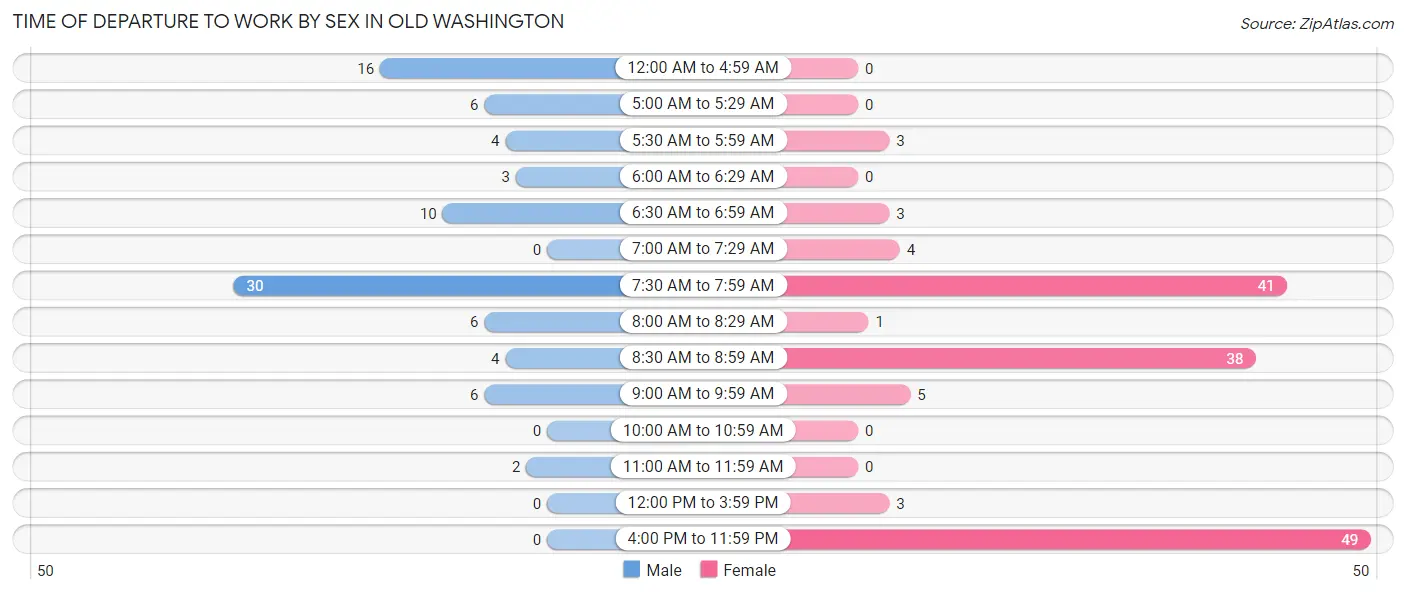
| Time of Departure | Male | Female |
| 12:00 AM to 4:59 AM | 16 (18.4%) | 0 (0.0%) |
| 5:00 AM to 5:29 AM | 6 (6.9%) | 0 (0.0%) |
| 5:30 AM to 5:59 AM | 4 (4.6%) | 3 (2.0%) |
| 6:00 AM to 6:29 AM | 3 (3.5%) | 0 (0.0%) |
| 6:30 AM to 6:59 AM | 10 (11.5%) | 3 (2.0%) |
| 7:00 AM to 7:29 AM | 0 (0.0%) | 4 (2.7%) |
| 7:30 AM to 7:59 AM | 30 (34.5%) | 41 (27.9%) |
| 8:00 AM to 8:29 AM | 6 (6.9%) | 1 (0.7%) |
| 8:30 AM to 8:59 AM | 4 (4.6%) | 38 (25.9%) |
| 9:00 AM to 9:59 AM | 6 (6.9%) | 5 (3.4%) |
| 10:00 AM to 10:59 AM | 0 (0.0%) | 0 (0.0%) |
| 11:00 AM to 11:59 AM | 2 (2.3%) | 0 (0.0%) |
| 12:00 PM to 3:59 PM | 0 (0.0%) | 3 (2.0%) |
| 4:00 PM to 11:59 PM | 0 (0.0%) | 49 (33.3%) |
| Total | 87 (100.0%) | 147 (100.0%) |
Housing Occupancy in Old Washington
Occupancy by Ownership in Old Washington
Of the total 180 dwellings in Old Washington, owner-occupied units account for 86 (47.8%), while renter-occupied units make up 94 (52.2%).
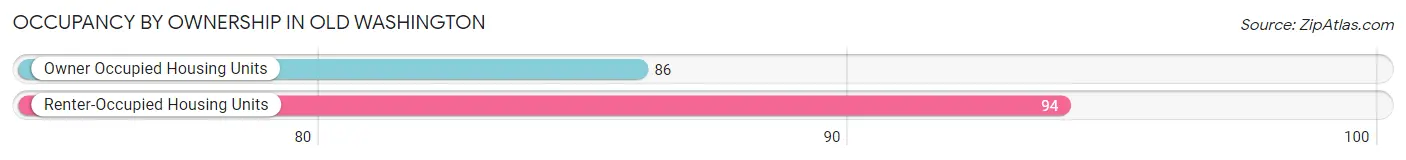
| Occupancy | # Housing Units | % Housing Units |
| Owner Occupied Housing Units | 86 | 47.8% |
| Renter-Occupied Housing Units | 94 | 52.2% |
| Total Occupied Housing Units | 180 | 100.0% |
Occupancy by Household Size in Old Washington
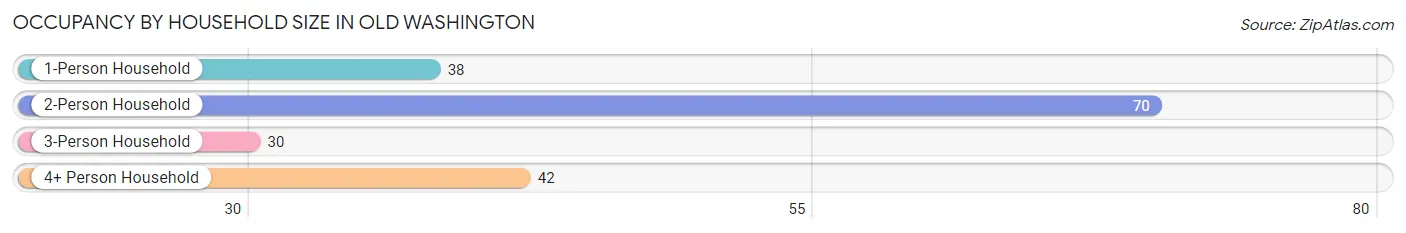
| Household Size | # Housing Units | % Housing Units |
| 1-Person Household | 38 | 21.1% |
| 2-Person Household | 70 | 38.9% |
| 3-Person Household | 30 | 16.7% |
| 4+ Person Household | 42 | 23.3% |
| Total Housing Units | 180 | 100.0% |
Occupancy by Ownership by Household Size in Old Washington
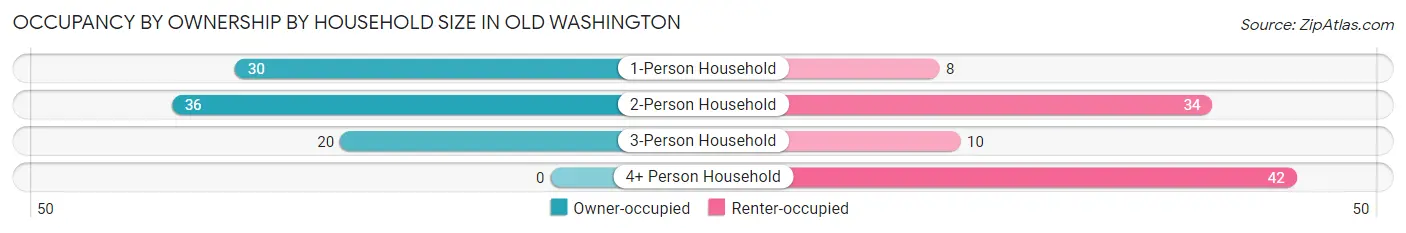
| Household Size | Owner-occupied | Renter-occupied |
| 1-Person Household | 30 (78.9%) | 8 (21.0%) |
| 2-Person Household | 36 (51.4%) | 34 (48.6%) |
| 3-Person Household | 20 (66.7%) | 10 (33.3%) |
| 4+ Person Household | 0 (0.0%) | 42 (100.0%) |
| Total Housing Units | 86 (47.8%) | 94 (52.2%) |
Occupancy by Educational Attainment in Old Washington
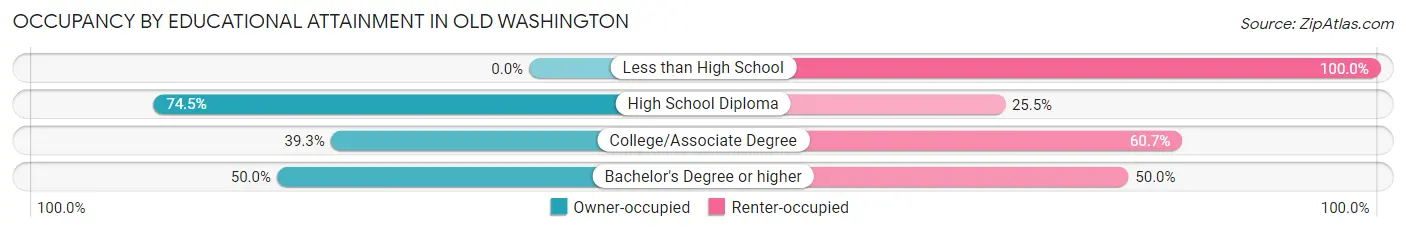
| Household Size | Owner-occupied | Renter-occupied |
| Less than High School | 0 (0.0%) | 5 (100.0%) |
| High School Diploma | 35 (74.5%) | 12 (25.5%) |
| College/Associate Degree | 48 (39.3%) | 74 (60.7%) |
| Bachelor's Degree or higher | 3 (50.0%) | 3 (50.0%) |
Occupancy by Age of Householder in Old Washington
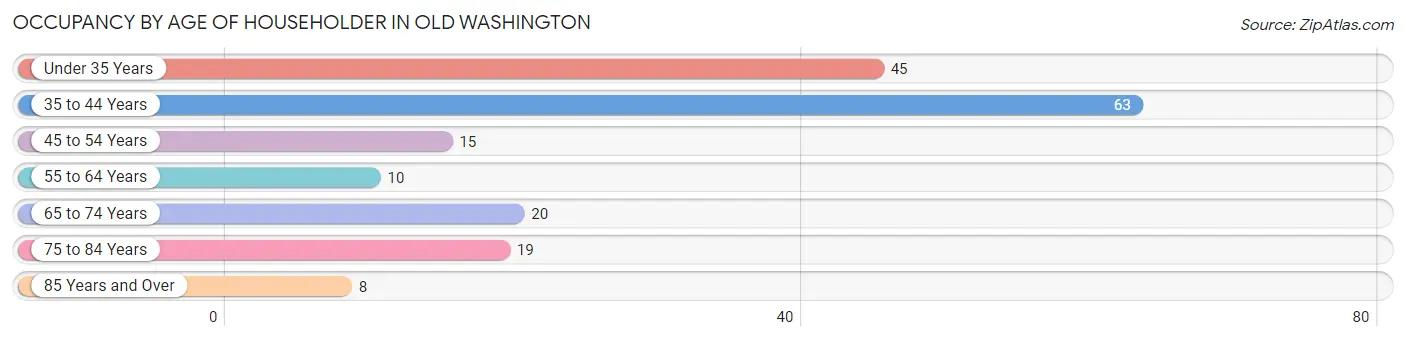
| Age Bracket | # Households | % Households |
| Under 35 Years | 45 | 25.0% |
| 35 to 44 Years | 63 | 35.0% |
| 45 to 54 Years | 15 | 8.3% |
| 55 to 64 Years | 10 | 5.6% |
| 65 to 74 Years | 20 | 11.1% |
| 75 to 84 Years | 19 | 10.6% |
| 85 Years and Over | 8 | 4.4% |
| Total | 180 | 100.0% |
Housing Finances in Old Washington
Median Income by Occupancy in Old Washington
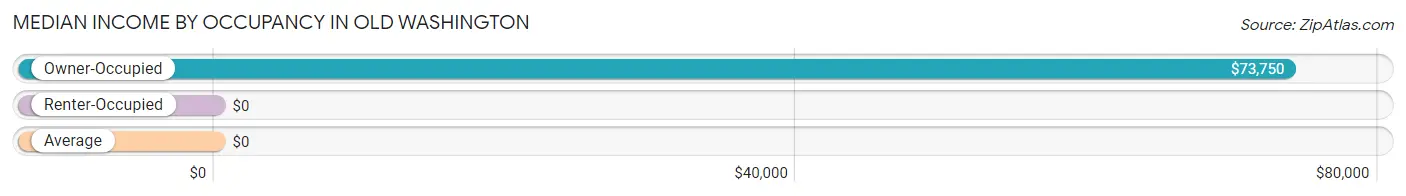
| Occupancy Type | # Households | Median Income |
| Owner-Occupied | 86 (47.8%) | $73,750 |
| Renter-Occupied | 94 (52.2%) | $0 |
| Average | 180 (100.0%) | $0 |
Occupancy by Householder Income Bracket in Old Washington
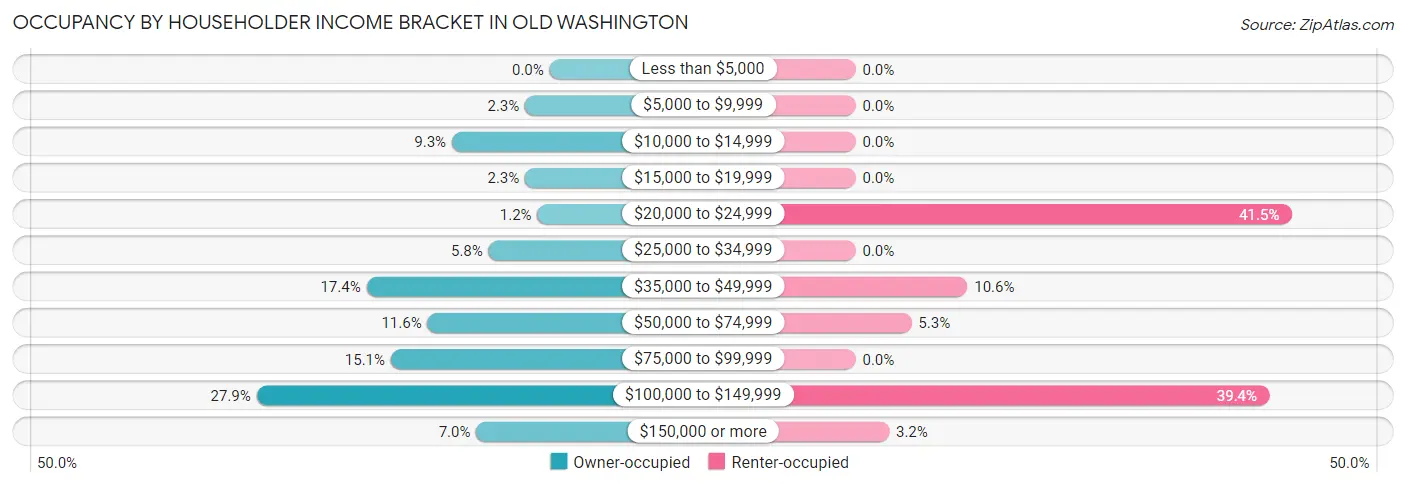
| Income Bracket | Owner-occupied | Renter-occupied |
| Less than $5,000 | 0 (0.0%) | 0 (0.0%) |
| $5,000 to $9,999 | 2 (2.3%) | 0 (0.0%) |
| $10,000 to $14,999 | 8 (9.3%) | 0 (0.0%) |
| $15,000 to $19,999 | 2 (2.3%) | 0 (0.0%) |
| $20,000 to $24,999 | 1 (1.2%) | 39 (41.5%) |
| $25,000 to $34,999 | 5 (5.8%) | 0 (0.0%) |
| $35,000 to $49,999 | 15 (17.4%) | 10 (10.6%) |
| $50,000 to $74,999 | 10 (11.6%) | 5 (5.3%) |
| $75,000 to $99,999 | 13 (15.1%) | 0 (0.0%) |
| $100,000 to $149,999 | 24 (27.9%) | 37 (39.4%) |
| $150,000 or more | 6 (7.0%) | 3 (3.2%) |
| Total | 86 (100.0%) | 94 (100.0%) |
Monthly Housing Cost Tiers in Old Washington
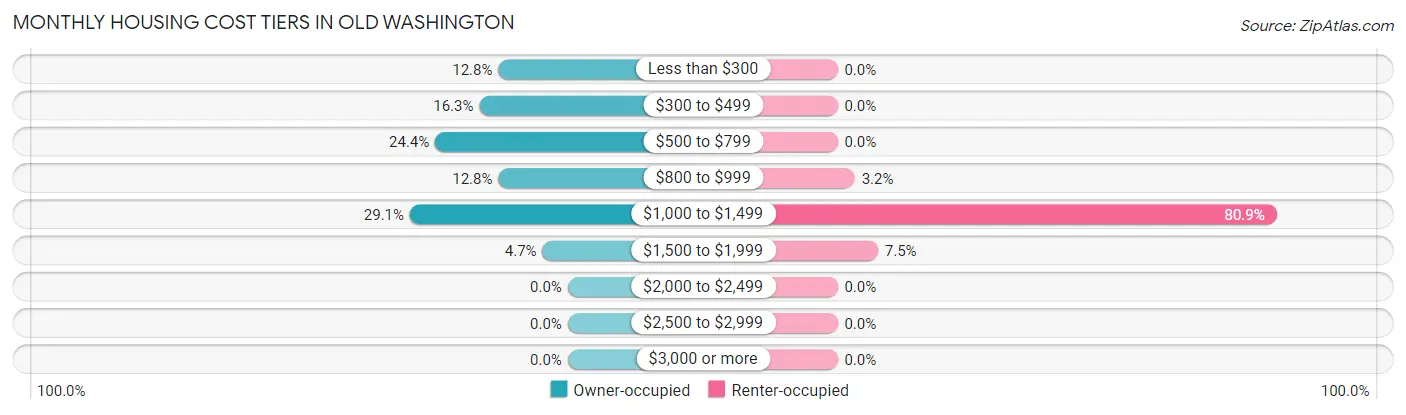
| Monthly Cost | Owner-occupied | Renter-occupied |
| Less than $300 | 11 (12.8%) | 0 (0.0%) |
| $300 to $499 | 14 (16.3%) | 0 (0.0%) |
| $500 to $799 | 21 (24.4%) | 0 (0.0%) |
| $800 to $999 | 11 (12.8%) | 3 (3.2%) |
| $1,000 to $1,499 | 25 (29.1%) | 76 (80.8%) |
| $1,500 to $1,999 | 4 (4.6%) | 7 (7.4%) |
| $2,000 to $2,499 | 0 (0.0%) | 0 (0.0%) |
| $2,500 to $2,999 | 0 (0.0%) | 0 (0.0%) |
| $3,000 or more | 0 (0.0%) | 0 (0.0%) |
| Total | 86 (100.0%) | 94 (100.0%) |
Physical Housing Characteristics in Old Washington
Housing Structures in Old Washington
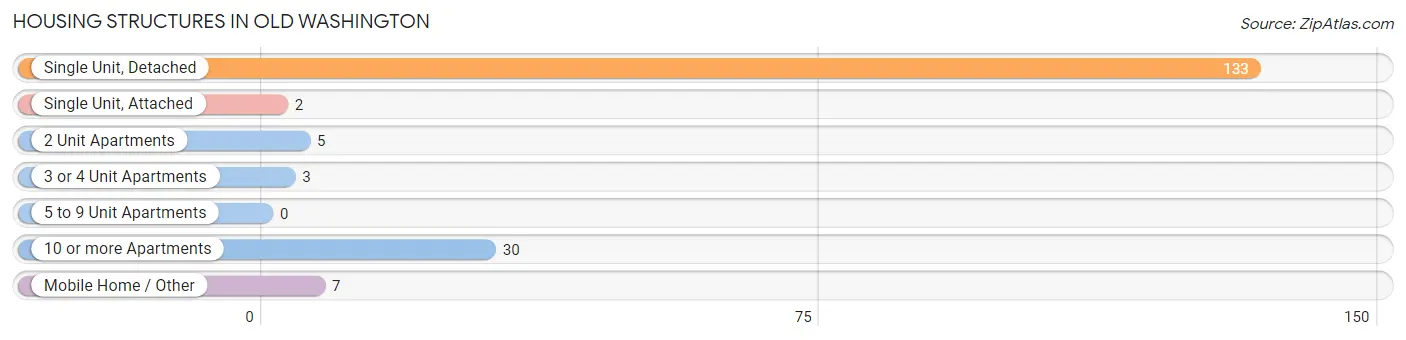
| Structure Type | # Housing Units | % Housing Units |
| Single Unit, Detached | 133 | 73.9% |
| Single Unit, Attached | 2 | 1.1% |
| 2 Unit Apartments | 5 | 2.8% |
| 3 or 4 Unit Apartments | 3 | 1.7% |
| 5 to 9 Unit Apartments | 0 | 0.0% |
| 10 or more Apartments | 30 | 16.7% |
| Mobile Home / Other | 7 | 3.9% |
| Total | 180 | 100.0% |
Housing Structures by Occupancy in Old Washington
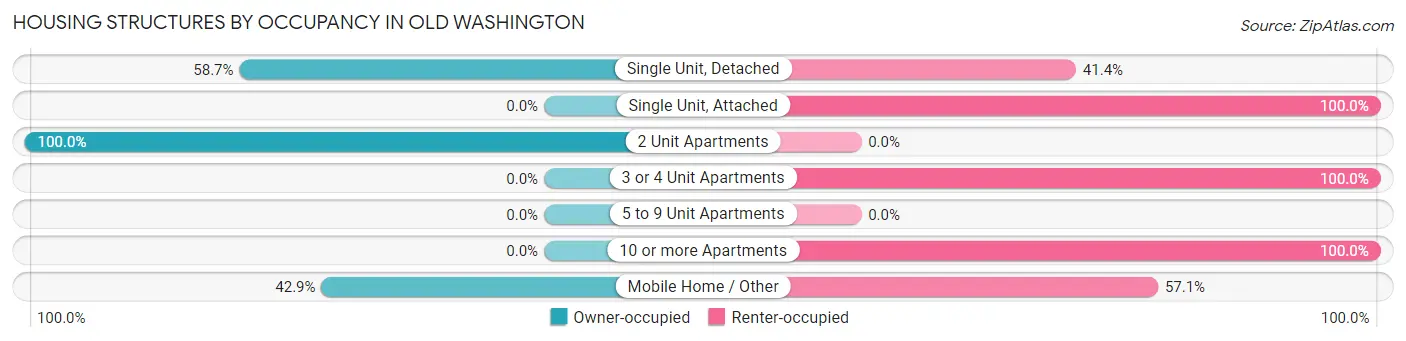
| Structure Type | Owner-occupied | Renter-occupied |
| Single Unit, Detached | 78 (58.7%) | 55 (41.3%) |
| Single Unit, Attached | 0 (0.0%) | 2 (100.0%) |
| 2 Unit Apartments | 5 (100.0%) | 0 (0.0%) |
| 3 or 4 Unit Apartments | 0 (0.0%) | 3 (100.0%) |
| 5 to 9 Unit Apartments | 0 (0.0%) | 0 (0.0%) |
| 10 or more Apartments | 0 (0.0%) | 30 (100.0%) |
| Mobile Home / Other | 3 (42.9%) | 4 (57.1%) |
| Total | 86 (47.8%) | 94 (52.2%) |
Housing Structures by Number of Rooms in Old Washington
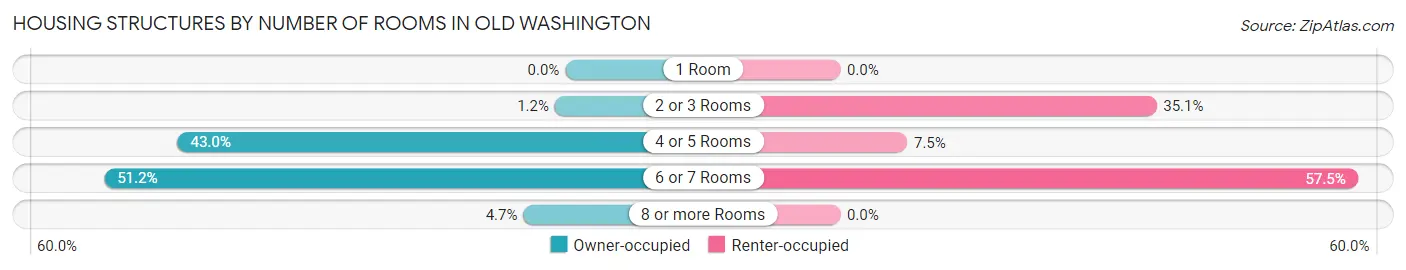
| Number of Rooms | Owner-occupied | Renter-occupied |
| 1 Room | 0 (0.0%) | 0 (0.0%) |
| 2 or 3 Rooms | 1 (1.2%) | 33 (35.1%) |
| 4 or 5 Rooms | 37 (43.0%) | 7 (7.4%) |
| 6 or 7 Rooms | 44 (51.2%) | 54 (57.5%) |
| 8 or more Rooms | 4 (4.6%) | 0 (0.0%) |
| Total | 86 (100.0%) | 94 (100.0%) |
Housing Structure by Heating Type in Old Washington
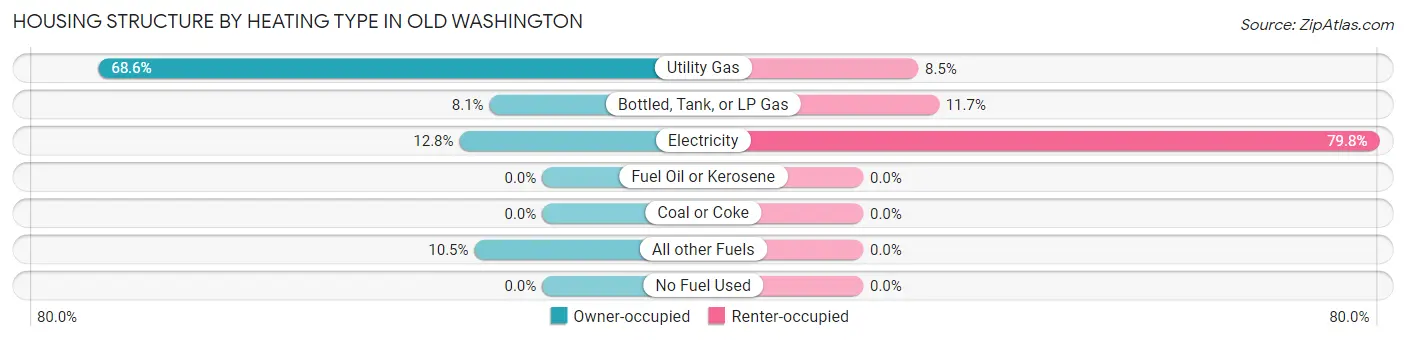
| Heating Type | Owner-occupied | Renter-occupied |
| Utility Gas | 59 (68.6%) | 8 (8.5%) |
| Bottled, Tank, or LP Gas | 7 (8.1%) | 11 (11.7%) |
| Electricity | 11 (12.8%) | 75 (79.8%) |
| Fuel Oil or Kerosene | 0 (0.0%) | 0 (0.0%) |
| Coal or Coke | 0 (0.0%) | 0 (0.0%) |
| All other Fuels | 9 (10.5%) | 0 (0.0%) |
| No Fuel Used | 0 (0.0%) | 0 (0.0%) |
| Total | 86 (100.0%) | 94 (100.0%) |
Household Vehicle Usage in Old Washington
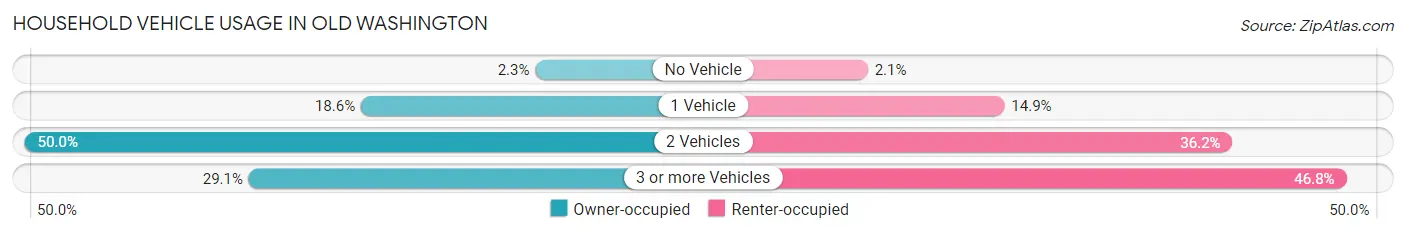
| Vehicles per Household | Owner-occupied | Renter-occupied |
| No Vehicle | 2 (2.3%) | 2 (2.1%) |
| 1 Vehicle | 16 (18.6%) | 14 (14.9%) |
| 2 Vehicles | 43 (50.0%) | 34 (36.2%) |
| 3 or more Vehicles | 25 (29.1%) | 44 (46.8%) |
| Total | 86 (100.0%) | 94 (100.0%) |
Real Estate & Mortgages in Old Washington
Real Estate and Mortgage Overview in Old Washington
| Characteristic | Without Mortgage | With Mortgage |
| Housing Units | 44 | 42 |
| Median Property Value | $146,400 | $98,600 |
| Median Household Income | $45,500 | $0 |
| Monthly Housing Costs | $457 | $0 |
| Real Estate Taxes | $1,125 | $0 |
Property Value by Mortgage Status in Old Washington
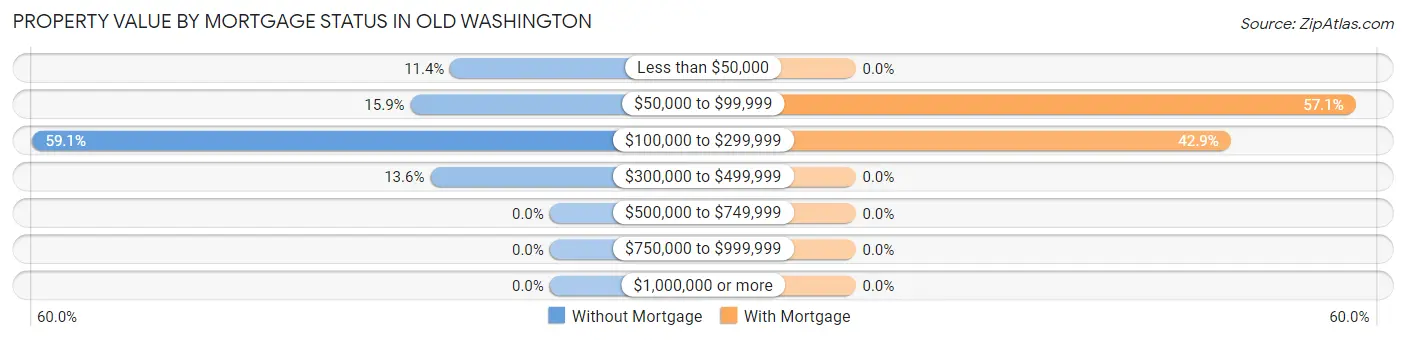
| Property Value | Without Mortgage | With Mortgage |
| Less than $50,000 | 5 (11.4%) | 0 (0.0%) |
| $50,000 to $99,999 | 7 (15.9%) | 24 (57.1%) |
| $100,000 to $299,999 | 26 (59.1%) | 18 (42.9%) |
| $300,000 to $499,999 | 6 (13.6%) | 0 (0.0%) |
| $500,000 to $749,999 | 0 (0.0%) | 0 (0.0%) |
| $750,000 to $999,999 | 0 (0.0%) | 0 (0.0%) |
| $1,000,000 or more | 0 (0.0%) | 0 (0.0%) |
| Total | 44 (100.0%) | 42 (100.0%) |
Household Income by Mortgage Status in Old Washington
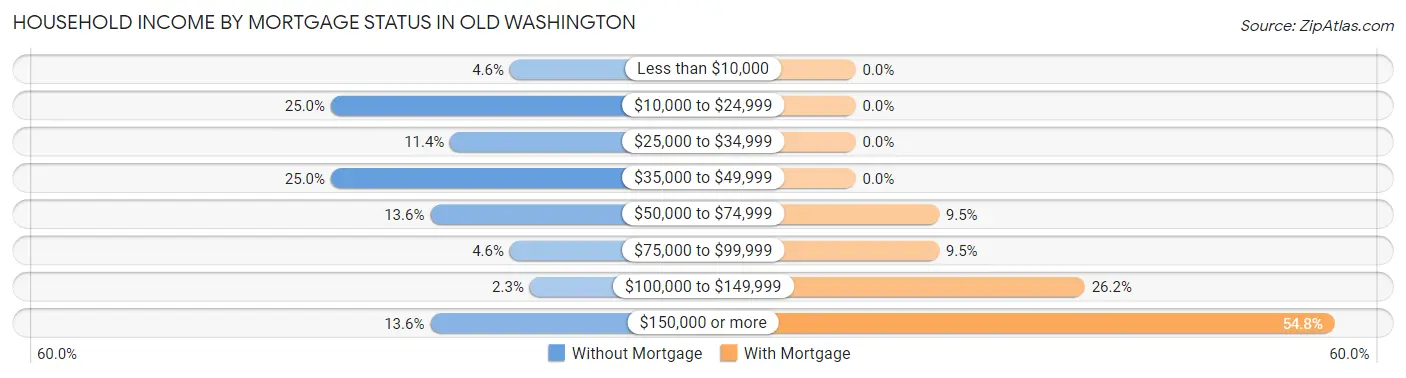
| Household Income | Without Mortgage | With Mortgage |
| Less than $10,000 | 2 (4.5%) | 0 (0.0%) |
| $10,000 to $24,999 | 11 (25.0%) | 0 (0.0%) |
| $25,000 to $34,999 | 5 (11.4%) | 0 (0.0%) |
| $35,000 to $49,999 | 11 (25.0%) | 0 (0.0%) |
| $50,000 to $74,999 | 6 (13.6%) | 4 (9.5%) |
| $75,000 to $99,999 | 2 (4.5%) | 4 (9.5%) |
| $100,000 to $149,999 | 1 (2.3%) | 11 (26.2%) |
| $150,000 or more | 6 (13.6%) | 23 (54.8%) |
| Total | 44 (100.0%) | 42 (100.0%) |
Property Value to Household Income Ratio in Old Washington
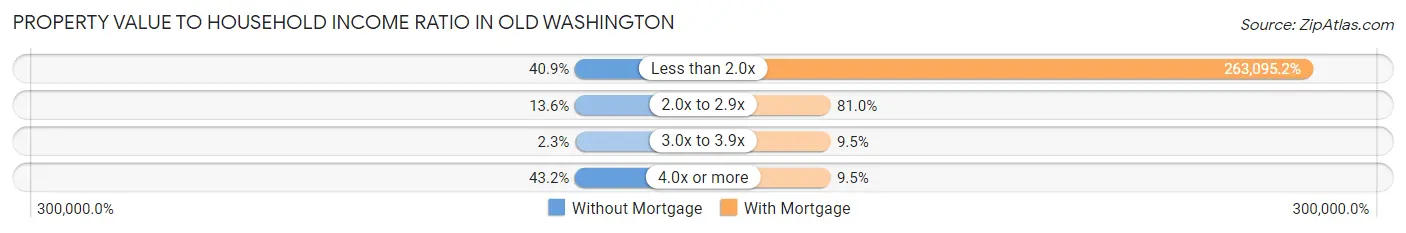
| Value-to-Income Ratio | Without Mortgage | With Mortgage |
| Less than 2.0x | 18 (40.9%) | 110,500 (263,095.2%) |
| 2.0x to 2.9x | 6 (13.6%) | 34 (80.9%) |
| 3.0x to 3.9x | 1 (2.3%) | 4 (9.5%) |
| 4.0x or more | 19 (43.2%) | 4 (9.5%) |
| Total | 44 (100.0%) | 42 (100.0%) |
Real Estate Taxes by Mortgage Status in Old Washington
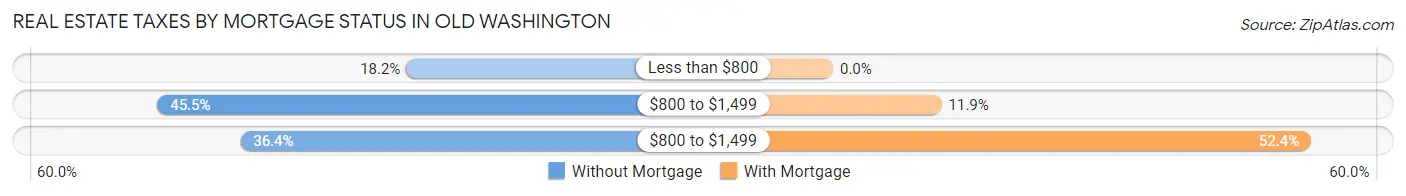
| Property Taxes | Without Mortgage | With Mortgage |
| Less than $800 | 8 (18.2%) | 0 (0.0%) |
| $800 to $1,499 | 20 (45.5%) | 5 (11.9%) |
| $800 to $1,499 | 16 (36.4%) | 22 (52.4%) |
| Total | 44 (100.0%) | 42 (100.0%) |
Health & Disability in Old Washington
Health Insurance Coverage by Age in Old Washington
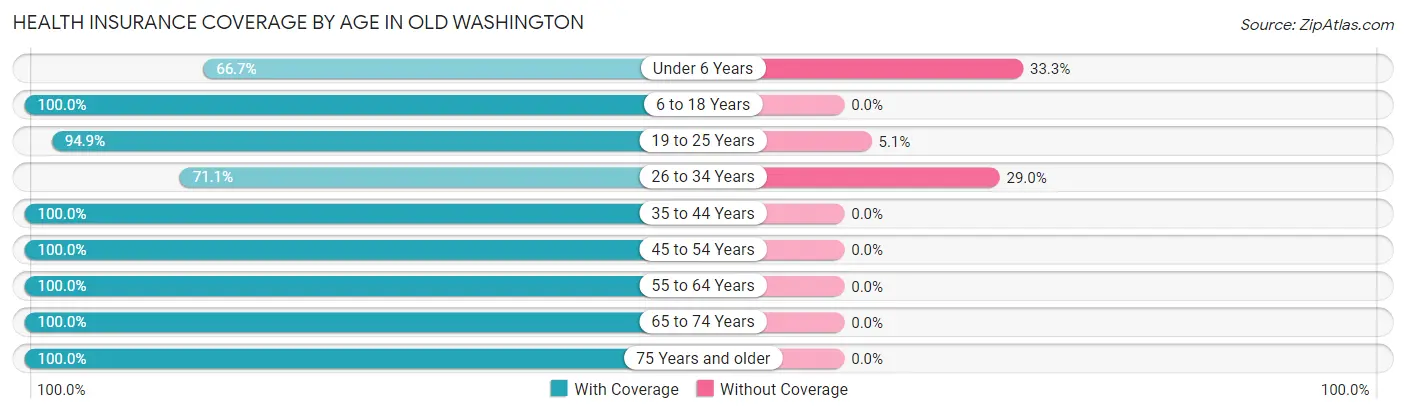
| Age Bracket | With Coverage | Without Coverage |
| Under 6 Years | 4 (66.7%) | 2 (33.3%) |
| 6 to 18 Years | 116 (100.0%) | 0 (0.0%) |
| 19 to 25 Years | 56 (94.9%) | 3 (5.1%) |
| 26 to 34 Years | 27 (71.1%) | 11 (28.9%) |
| 35 to 44 Years | 128 (100.0%) | 0 (0.0%) |
| 45 to 54 Years | 28 (100.0%) | 0 (0.0%) |
| 55 to 64 Years | 48 (100.0%) | 0 (0.0%) |
| 65 to 74 Years | 28 (100.0%) | 0 (0.0%) |
| 75 Years and older | 30 (100.0%) | 0 (0.0%) |
| Total | 465 (96.7%) | 16 (3.3%) |
Health Insurance Coverage by Citizenship Status in Old Washington
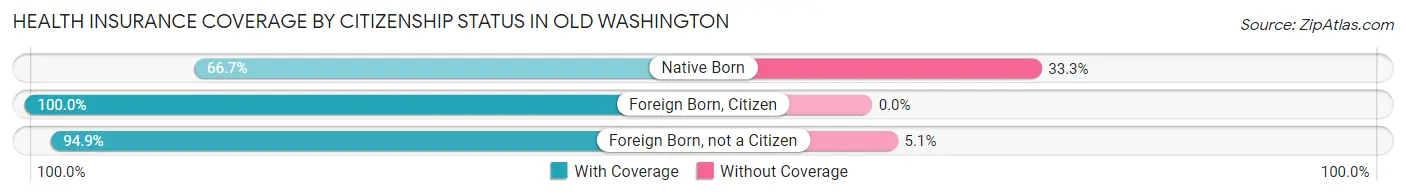
| Citizenship Status | With Coverage | Without Coverage |
| Native Born | 4 (66.7%) | 2 (33.3%) |
| Foreign Born, Citizen | 116 (100.0%) | 0 (0.0%) |
| Foreign Born, not a Citizen | 56 (94.9%) | 3 (5.1%) |
Health Insurance Coverage by Household Income in Old Washington
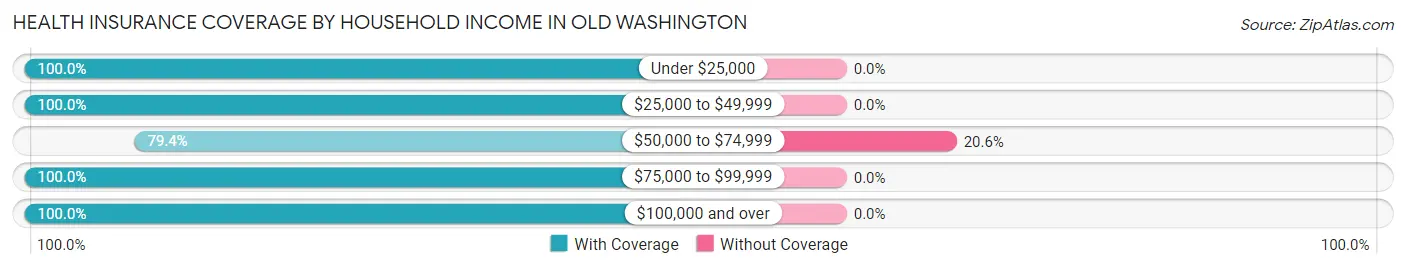
| Household Income | With Coverage | Without Coverage |
| Under $25,000 | 225 (100.0%) | 0 (0.0%) |
| $25,000 to $49,999 | 40 (100.0%) | 0 (0.0%) |
| $50,000 to $74,999 | 27 (79.4%) | 7 (20.6%) |
| $75,000 to $99,999 | 29 (100.0%) | 0 (0.0%) |
| $100,000 and over | 136 (100.0%) | 0 (0.0%) |
Public vs Private Health Insurance Coverage by Age in Old Washington
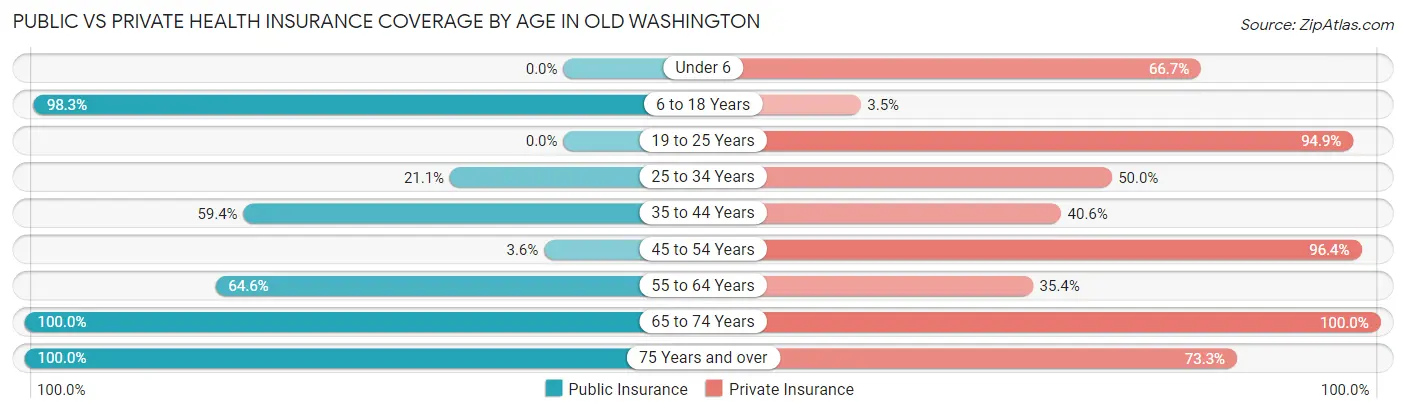
| Age Bracket | Public Insurance | Private Insurance |
| Under 6 | 0 (0.0%) | 4 (66.7%) |
| 6 to 18 Years | 114 (98.3%) | 4 (3.5%) |
| 19 to 25 Years | 0 (0.0%) | 56 (94.9%) |
| 25 to 34 Years | 8 (21.0%) | 19 (50.0%) |
| 35 to 44 Years | 76 (59.4%) | 52 (40.6%) |
| 45 to 54 Years | 1 (3.6%) | 27 (96.4%) |
| 55 to 64 Years | 31 (64.6%) | 17 (35.4%) |
| 65 to 74 Years | 28 (100.0%) | 28 (100.0%) |
| 75 Years and over | 30 (100.0%) | 22 (73.3%) |
| Total | 288 (59.9%) | 229 (47.6%) |
Disability Status by Sex by Age in Old Washington
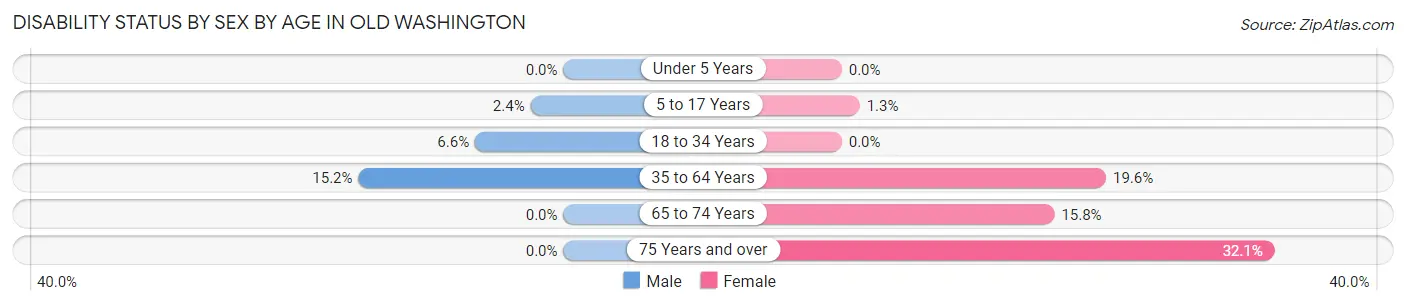
| Age Bracket | Male | Female |
| Under 5 Years | 0 (0.0%) | 0 (0.0%) |
| 5 to 17 Years | 1 (2.4%) | 1 (1.3%) |
| 18 to 34 Years | 4 (6.6%) | 0 (0.0%) |
| 35 to 64 Years | 7 (15.2%) | 31 (19.6%) |
| 65 to 74 Years | 0 (0.0%) | 3 (15.8%) |
| 75 Years and over | 0 (0.0%) | 9 (32.1%) |
Disability Class by Sex by Age in Old Washington
Disability Class: Hearing Difficulty
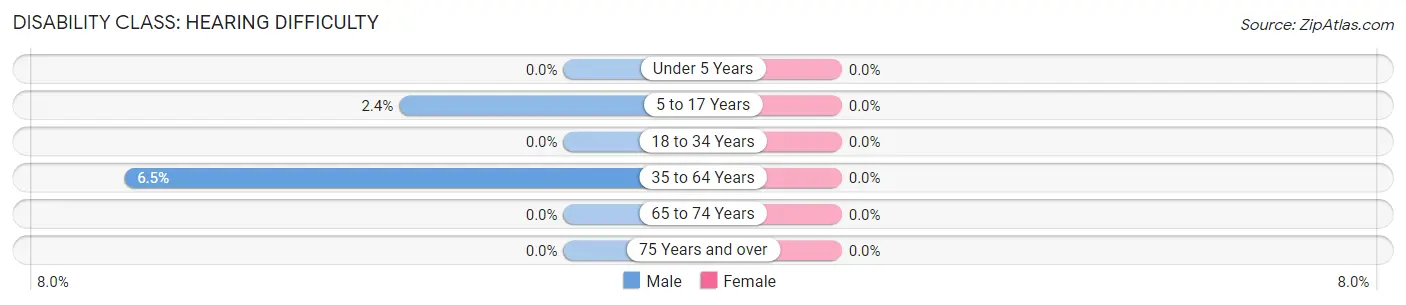
| Age Bracket | Male | Female |
| Under 5 Years | 0 (0.0%) | 0 (0.0%) |
| 5 to 17 Years | 1 (2.4%) | 0 (0.0%) |
| 18 to 34 Years | 0 (0.0%) | 0 (0.0%) |
| 35 to 64 Years | 3 (6.5%) | 0 (0.0%) |
| 65 to 74 Years | 0 (0.0%) | 0 (0.0%) |
| 75 Years and over | 0 (0.0%) | 0 (0.0%) |
Disability Class: Vision Difficulty
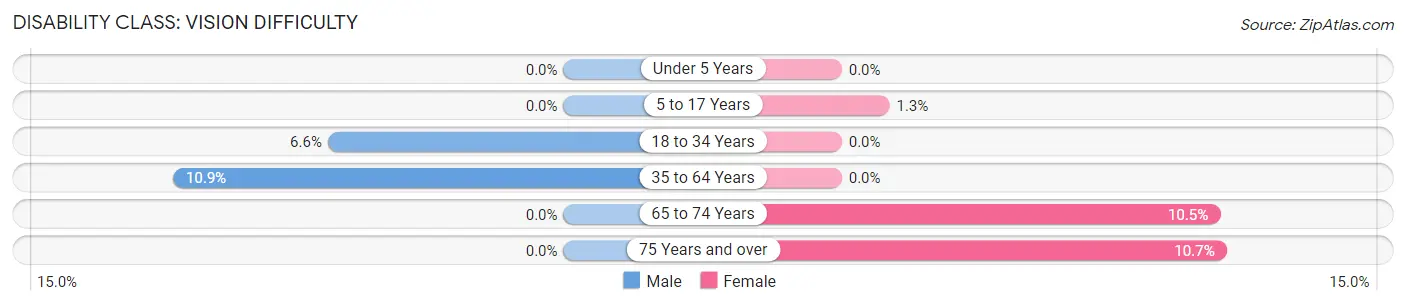
| Age Bracket | Male | Female |
| Under 5 Years | 0 (0.0%) | 0 (0.0%) |
| 5 to 17 Years | 0 (0.0%) | 1 (1.3%) |
| 18 to 34 Years | 4 (6.6%) | 0 (0.0%) |
| 35 to 64 Years | 5 (10.9%) | 0 (0.0%) |
| 65 to 74 Years | 0 (0.0%) | 2 (10.5%) |
| 75 Years and over | 0 (0.0%) | 3 (10.7%) |
Disability Class: Cognitive Difficulty
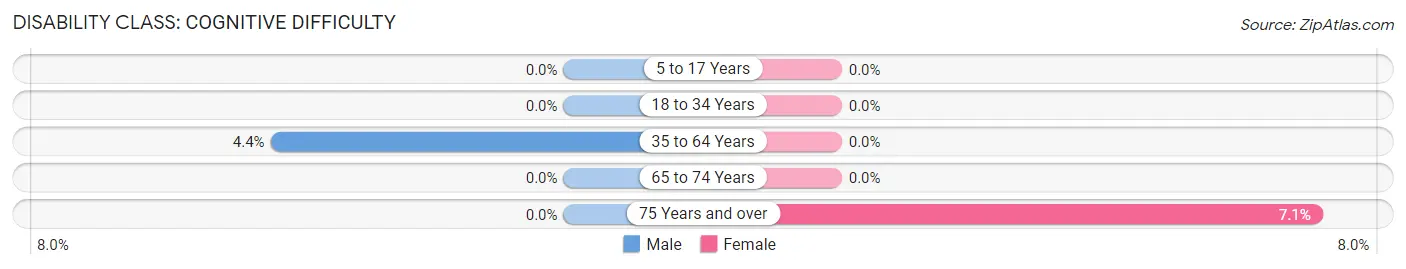
| Age Bracket | Male | Female |
| 5 to 17 Years | 0 (0.0%) | 0 (0.0%) |
| 18 to 34 Years | 0 (0.0%) | 0 (0.0%) |
| 35 to 64 Years | 2 (4.3%) | 0 (0.0%) |
| 65 to 74 Years | 0 (0.0%) | 0 (0.0%) |
| 75 Years and over | 0 (0.0%) | 2 (7.1%) |
Disability Class: Ambulatory Difficulty
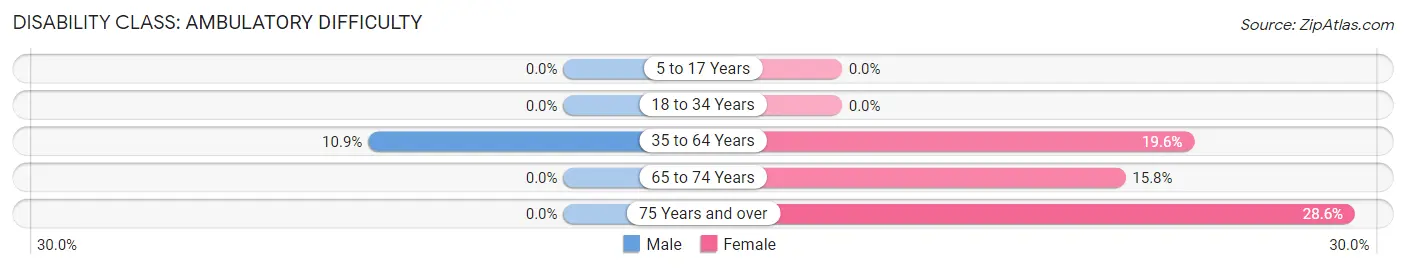
| Age Bracket | Male | Female |
| 5 to 17 Years | 0 (0.0%) | 0 (0.0%) |
| 18 to 34 Years | 0 (0.0%) | 0 (0.0%) |
| 35 to 64 Years | 5 (10.9%) | 31 (19.6%) |
| 65 to 74 Years | 0 (0.0%) | 3 (15.8%) |
| 75 Years and over | 0 (0.0%) | 8 (28.6%) |
Disability Class: Self-Care Difficulty
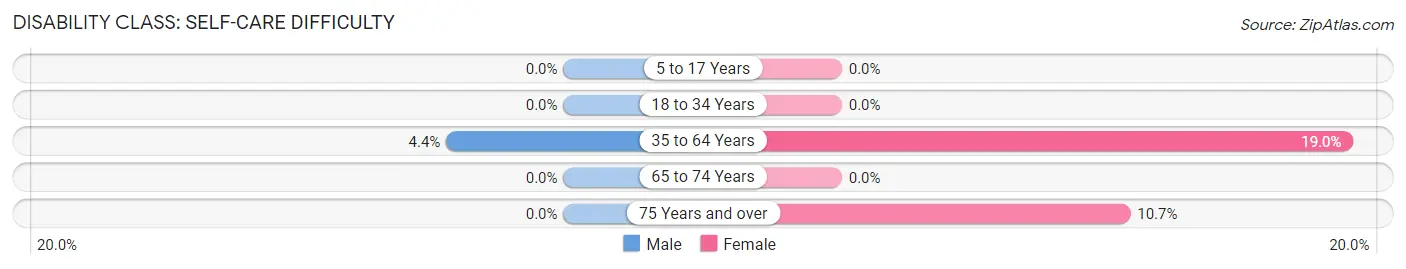
| Age Bracket | Male | Female |
| 5 to 17 Years | 0 (0.0%) | 0 (0.0%) |
| 18 to 34 Years | 0 (0.0%) | 0 (0.0%) |
| 35 to 64 Years | 2 (4.3%) | 30 (19.0%) |
| 65 to 74 Years | 0 (0.0%) | 0 (0.0%) |
| 75 Years and over | 0 (0.0%) | 3 (10.7%) |
Technology Access in Old Washington
Computing Device Access in Old Washington
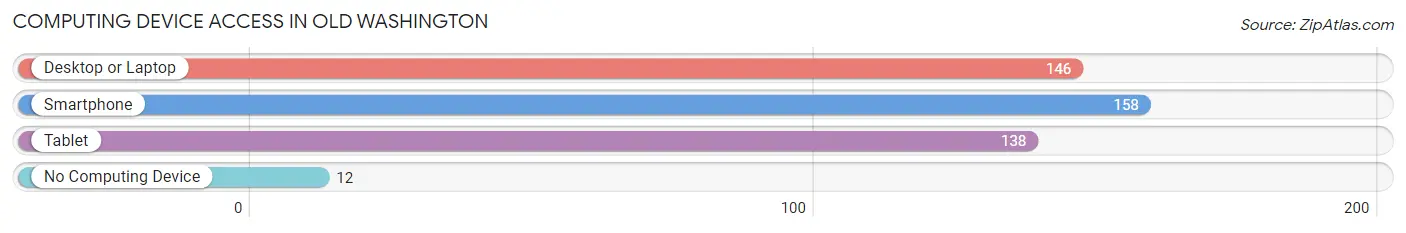
| Device Type | # Households | % Households |
| Desktop or Laptop | 146 | 81.1% |
| Smartphone | 158 | 87.8% |
| Tablet | 138 | 76.7% |
| No Computing Device | 12 | 6.7% |
| Total | 180 | 100.0% |
Internet Access in Old Washington
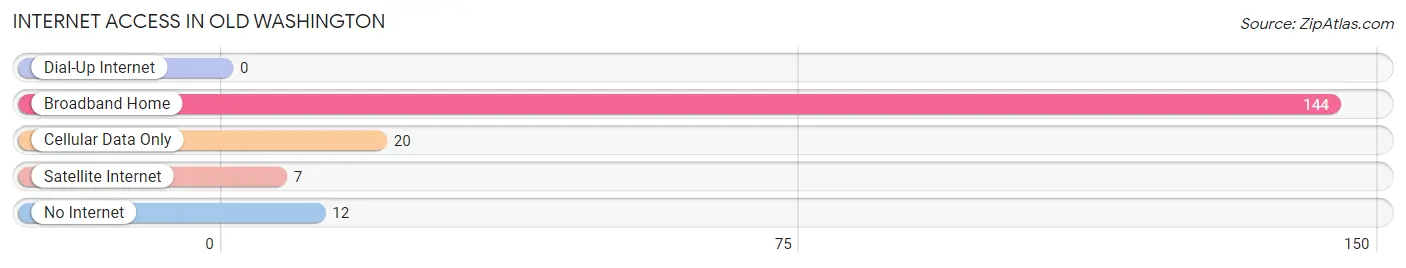
| Internet Type | # Households | % Households |
| Dial-Up Internet | 0 | 0.0% |
| Broadband Home | 144 | 80.0% |
| Cellular Data Only | 20 | 11.1% |
| Satellite Internet | 7 | 3.9% |
| No Internet | 12 | 6.7% |
| Total | 180 | 100.0% |
Old Washington Summary
Washington, Ohio is a small city located in Fayette County, Ohio. It is situated on the banks of the Muskingum River, approximately 40 miles east of Columbus. The city has a population of approximately 13,000 people and is the county seat of Fayette County.
History
Washington, Ohio was founded in 1810 by a group of settlers from Pennsylvania. The city was named after George Washington, the first president of the United States. The city was originally a small farming community, but it quickly grew into a bustling town. In 1812, the city was incorporated and the first mayor was elected.
In the early 19th century, Washington was a major stop on the Underground Railroad. The city was a safe haven for escaped slaves and many of them settled in the area. During the Civil War, Washington was a major supply center for the Union Army.
Geography
Washington is located in the Appalachian Plateau region of Ohio. The city is situated on the banks of the Muskingum River and is surrounded by rolling hills and forests. The city has a total area of 4.2 square miles and is located at an elevation of 890 feet.
The climate in Washington is humid continental, with hot summers and cold winters. The average annual temperature is around 50 degrees Fahrenheit. The average annual precipitation is around 40 inches.
Economy
Washington’s economy is largely based on manufacturing and agriculture. The city is home to several factories that produce a variety of products, including furniture, clothing, and automotive parts. The city is also home to several farms that produce corn, soybeans, and other crops.
The city is also home to several small businesses, including restaurants, retail stores, and professional services. The city is also home to several educational institutions, including Washington High School and Washington State Community College.
Demographics
As of the 2010 census, the population of Washington was 13,068. The racial makeup of the city was 95.3% White, 1.3% African American, 0.3% Native American, 0.7% Asian, 0.1% Pacific Islander, and 1.3% from other races. Hispanic or Latino of any race were 2.2% of the population.
The median household income in Washington was $37,945, and the median family income was $45,945. The per capita income was $19,945. About 16.3% of the population was below the poverty line.
Washington is a small city with a rich history and a diverse population. The city is home to several factories and farms, as well as small businesses and educational institutions. The city is also home to a variety of cultural attractions, including the Fayette County Historical Society and the Washington State Community College.
Common Questions
What is Per Capita Income in Old Washington?
Per Capita income in Old Washington is $35,261.
What is the Median Family Income in Old Washington?
Median Family Income in Old Washington is $98,000.
What is Family Income Deficit in Old Washington?
Family Income Deficit in Old Washington is $12,802.
Families that are below poverty line in Old Washington earn $12,802 less on average than the poverty threshold level.
What is Inequality or Gini Index in Old Washington?
Inequality or Gini Index in Old Washington is 0.41.
What is the Total Population of Old Washington?
Total Population of Old Washington is 481.
What is the Total Male Population of Old Washington?
Total Male Population of Old Washington is 161.
What is the Total Female Population of Old Washington?
Total Female Population of Old Washington is 320.
What is the Ratio of Males per 100 Females in Old Washington?
There are 50.31 Males per 100 Females in Old Washington.
What is the Ratio of Females per 100 Males in Old Washington?
There are 198.76 Females per 100 Males in Old Washington.
What is the Median Population Age in Old Washington?
Median Population Age in Old Washington is 35.3 Years.
What is the Average Family Size in Old Washington
Average Family Size in Old Washington is 2.7 People.
What is the Average Household Size in Old Washington
Average Household Size in Old Washington is 2.6 People.
How Large is the Labor Force in Old Washington?
There are 249 People in the Labor Forcein in Old Washington.
What is the Percentage of People in the Labor Force in Old Washington?
62.4% of People are in the Labor Force in Old Washington.
What is the Unemployment Rate in Old Washington?
Unemployment Rate in Old Washington is 5.2%.