Ohio City, OH Map & Demographics
Ohio City Map
Ohio City Overview
$24,870
PER CAPITA INCOME
$56,080
AVG FAMILY INCOME
$55,543
AVG HOUSEHOLD INCOME
64.3%
WAGE / INCOME GAP [ % ]
35.7¢/ $1
WAGE / INCOME GAP [ $ ]
$9,507
FAMILY INCOME DEFICIT
0.34
INEQUALITY / GINI INDEX
737
TOTAL POPULATION
359
MALE POPULATION
378
FEMALE POPULATION
94.97
MALES / 100 FEMALES
105.29
FEMALES / 100 MALES
39.2
MEDIAN AGE
3.0
AVG FAMILY SIZE
2.6
AVG HOUSEHOLD SIZE
367
LABOR FORCE [ PEOPLE ]
56.6%
PERCENT IN LABOR FORCE
1.1%
UNEMPLOYMENT RATE
Ohio City Zip Codes
Income in Ohio City
Income Overview in Ohio City
Per Capita Income in Ohio City is $24,870, while median incomes of families and households are $56,080 and $55,543 respectively.
| Characteristic | Number | Measure |
| Per Capita Income | 737 | $24,870 |
| Median Family Income | 189 | $56,080 |
| Mean Family Income | 189 | $62,342 |
| Median Household Income | 280 | $55,543 |
| Mean Household Income | 280 | $63,348 |
| Income Deficit | 189 | $9,507 |
| Wage / Income Gap (%) | 737 | 64.29% |
| Wage / Income Gap ($) | 737 | 35.71¢ per $1 |
| Gini / Inequality Index | 737 | 0.34 |
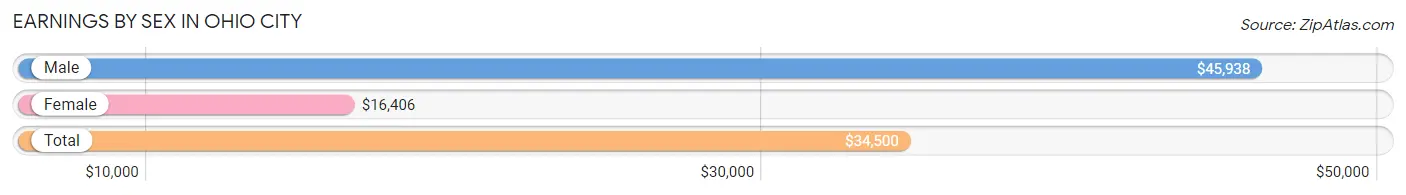
Earnings by Sex in Ohio City
Average Earnings in Ohio City are $34,500, $45,938 for men and $16,406 for women, a difference of 64.3%.
| Sex | Number | Average Earnings |
| Male | 173 (43.2%) | $45,938 |
| Female | 227 (56.8%) | $16,406 |
| Total | 400 (100.0%) | $34,500 |
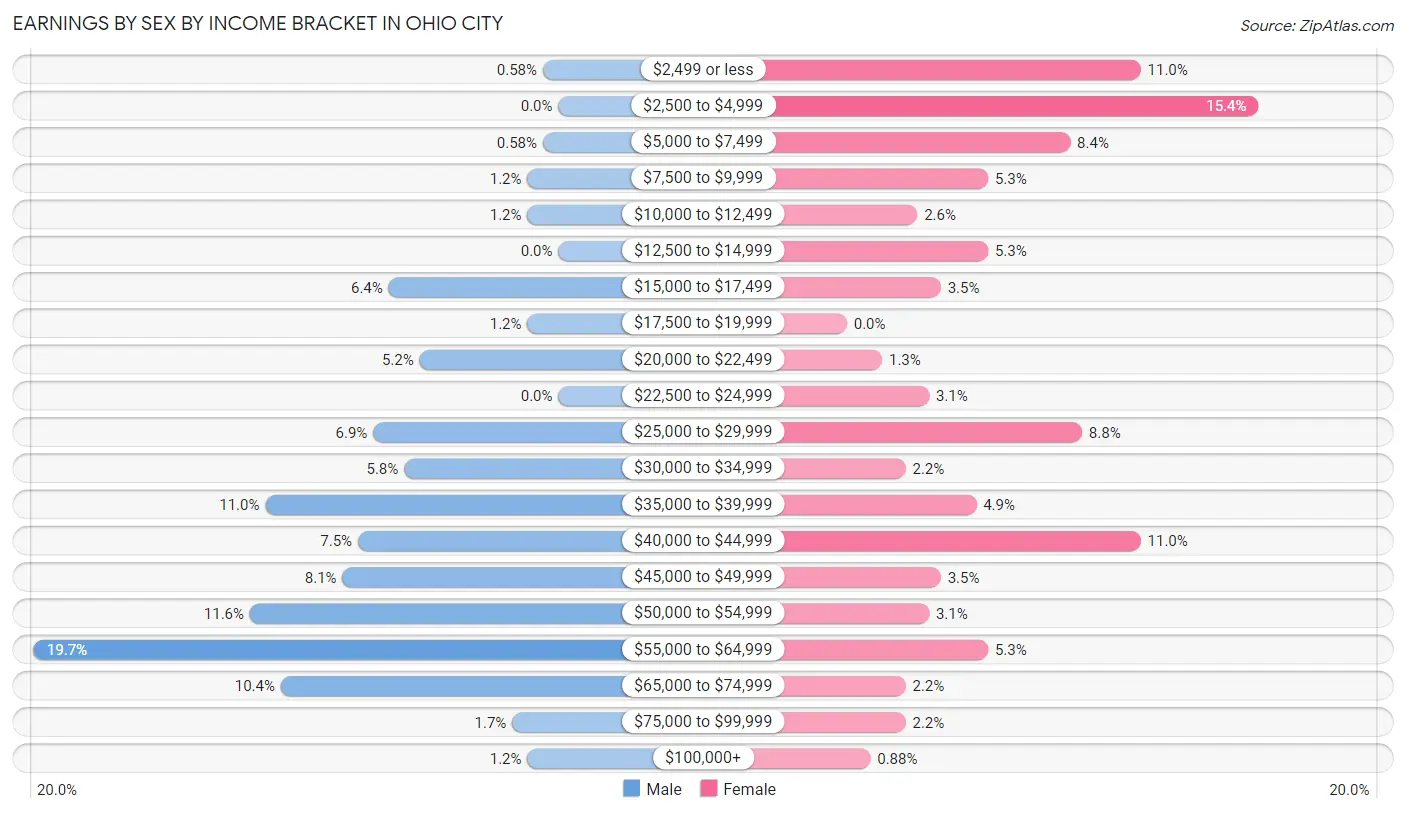
Earnings by Sex by Income Bracket in Ohio City
The most common earnings brackets in Ohio City are $55,000 to $64,999 for men (34 | 19.7%) and $2,500 to $4,999 for women (35 | 15.4%).
| Income | Male | Female |
| $2,499 or less | 1 (0.6%) | 25 (11.0%) |
| $2,500 to $4,999 | 0 (0.0%) | 35 (15.4%) |
| $5,000 to $7,499 | 1 (0.6%) | 19 (8.4%) |
| $7,500 to $9,999 | 2 (1.2%) | 12 (5.3%) |
| $10,000 to $12,499 | 2 (1.2%) | 6 (2.6%) |
| $12,500 to $14,999 | 0 (0.0%) | 12 (5.3%) |
| $15,000 to $17,499 | 11 (6.4%) | 8 (3.5%) |
| $17,500 to $19,999 | 2 (1.2%) | 0 (0.0%) |
| $20,000 to $22,499 | 9 (5.2%) | 3 (1.3%) |
| $22,500 to $24,999 | 0 (0.0%) | 7 (3.1%) |
| $25,000 to $29,999 | 12 (6.9%) | 20 (8.8%) |
| $30,000 to $34,999 | 10 (5.8%) | 5 (2.2%) |
| $35,000 to $39,999 | 19 (11.0%) | 11 (4.9%) |
| $40,000 to $44,999 | 13 (7.5%) | 25 (11.0%) |
| $45,000 to $49,999 | 14 (8.1%) | 8 (3.5%) |
| $50,000 to $54,999 | 20 (11.6%) | 7 (3.1%) |
| $55,000 to $64,999 | 34 (19.7%) | 12 (5.3%) |
| $65,000 to $74,999 | 18 (10.4%) | 5 (2.2%) |
| $75,000 to $99,999 | 3 (1.7%) | 5 (2.2%) |
| $100,000+ | 2 (1.2%) | 2 (0.9%) |
| Total | 173 (100.0%) | 227 (100.0%) |
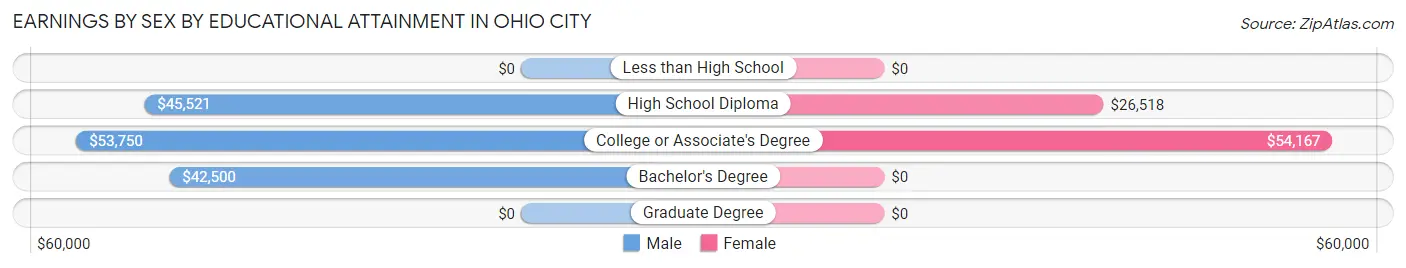
Earnings by Sex by Educational Attainment in Ohio City
Average earnings in Ohio City are $44,167 for men and $28,438 for women, a difference of 35.6%. Men with an educational attainment of college or associate's degree enjoy the highest average annual earnings of $53,750, while those with bachelor's degree education earn the least with $42,500. Women with an educational attainment of college or associate's degree earn the most with the average annual earnings of $54,167, while those with high school diploma education have the smallest earnings of $26,518.
| Educational Attainment | Male Income | Female Income |
| Less than High School | - | - |
| High School Diploma | $45,521 | $26,518 |
| College or Associate's Degree | $53,750 | $54,167 |
| Bachelor's Degree | $42,500 | $0 |
| Graduate Degree | - | - |
| Total | $44,167 | $28,438 |
Family Income in Ohio City
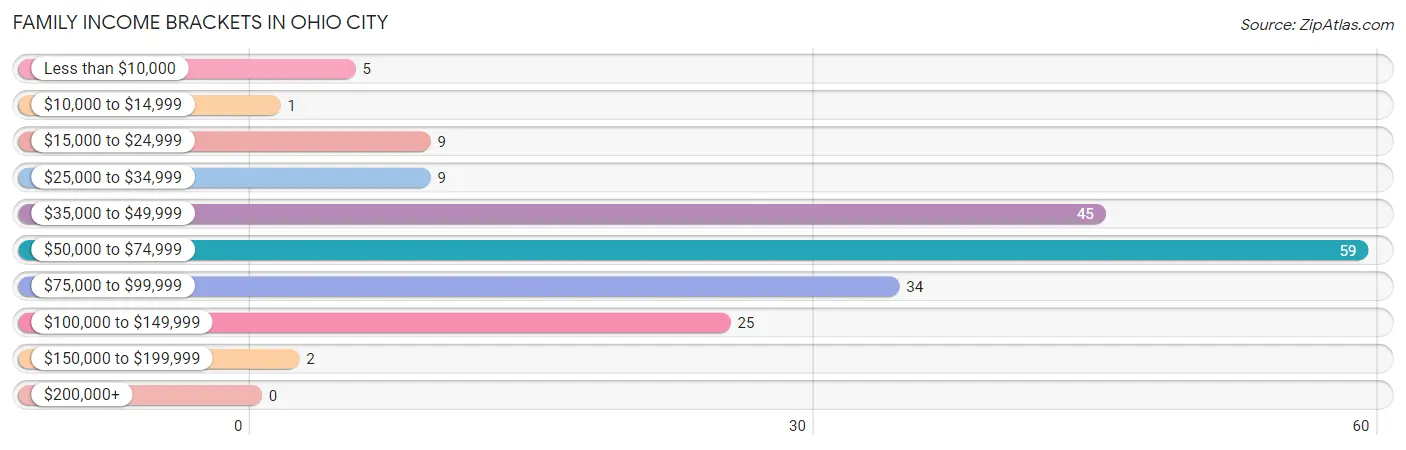
Family Income Brackets in Ohio City
According to the Ohio City family income data, there are 59 families falling into the $50,000 to $74,999 income range, which is the most common income bracket and makes up 31.2% of all families.
| Income Bracket | # Families | % Families |
| Less than $10,000 | 5 | 2.6% |
| $10,000 to $14,999 | 1 | 0.5% |
| $15,000 to $24,999 | 9 | 4.8% |
| $25,000 to $34,999 | 9 | 4.8% |
| $35,000 to $49,999 | 45 | 23.8% |
| $50,000 to $74,999 | 59 | 31.2% |
| $75,000 to $99,999 | 34 | 18.0% |
| $100,000 to $149,999 | 25 | 13.2% |
| $150,000 to $199,999 | 2 | 1.1% |
| $200,000+ | 0 | 0.0% |
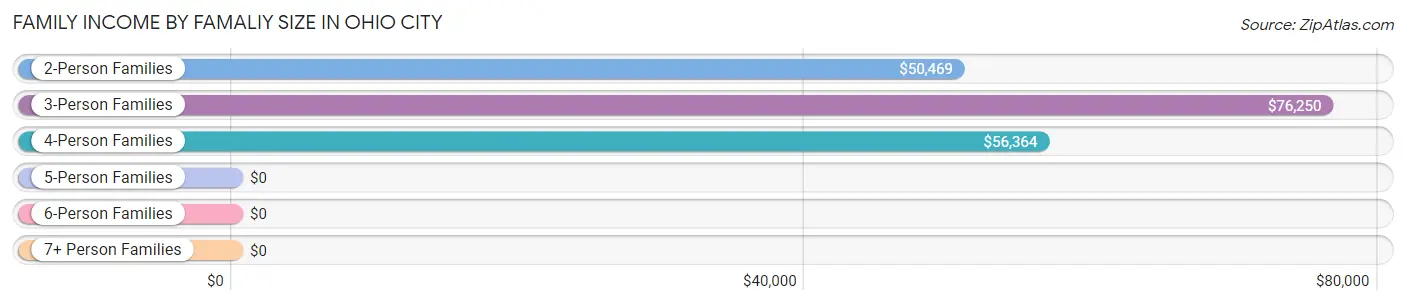
Family Income by Famaliy Size in Ohio City
3-person families (15 | 7.9%) account for the highest median family income in Ohio City with $76,250 per family, while 3-person families (15 | 7.9%) have the highest median income of $25,417 per family member.
| Income Bracket | # Families | Median Income |
| 2-Person Families | 125 (66.1%) | $50,469 |
| 3-Person Families | 15 (7.9%) | $76,250 |
| 4-Person Families | 36 (19.1%) | $56,364 |
| 5-Person Families | 3 (1.6%) | $0 |
| 6-Person Families | 0 (0.0%) | $0 |
| 7+ Person Families | 10 (5.3%) | $0 |
| Total | 189 (100.0%) | $56,080 |
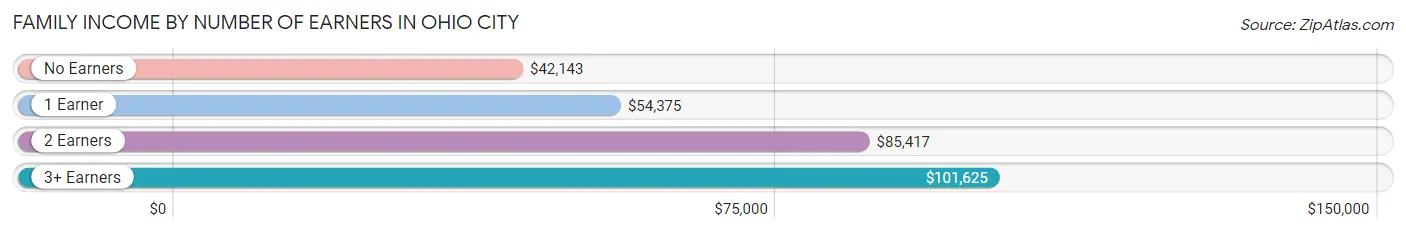
Family Income by Number of Earners in Ohio City
The median family income in Ohio City is $56,080, with families comprising 3+ earners (17) having the highest median family income of $101,625, while families with no earners (30) have the lowest median family income of $42,143, accounting for 9.0% and 15.9% of families, respectively.
| Number of Earners | # Families | Median Income |
| No Earners | 30 (15.9%) | $42,143 |
| 1 Earner | 92 (48.7%) | $54,375 |
| 2 Earners | 50 (26.5%) | $85,417 |
| 3+ Earners | 17 (9.0%) | $101,625 |
| Total | 189 (100.0%) | $56,080 |
Household Income in Ohio City
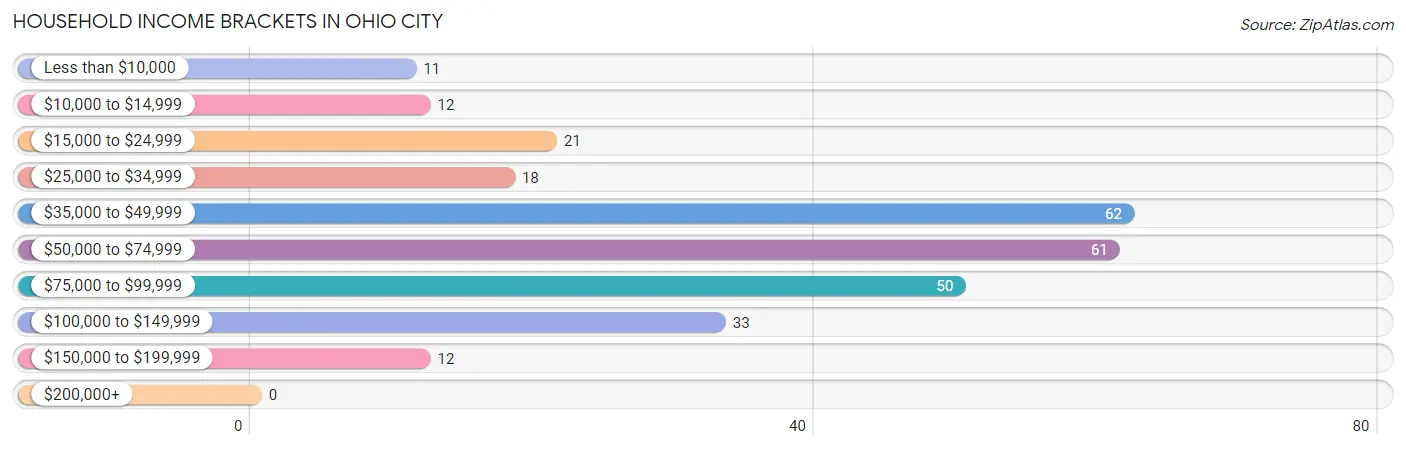
Household Income Brackets in Ohio City
With 62 households falling in the category, the $35,000 to $49,999 income range is the most frequent in Ohio City, accounting for 22.1% of all households.
| Income Bracket | # Households | % Households |
| Less than $10,000 | 11 | 3.9% |
| $10,000 to $14,999 | 12 | 4.3% |
| $15,000 to $24,999 | 21 | 7.5% |
| $25,000 to $34,999 | 18 | 6.4% |
| $35,000 to $49,999 | 62 | 22.1% |
| $50,000 to $74,999 | 61 | 21.8% |
| $75,000 to $99,999 | 50 | 17.9% |
| $100,000 to $149,999 | 33 | 11.8% |
| $150,000 to $199,999 | 12 | 4.3% |
| $200,000+ | 0 | 0.0% |
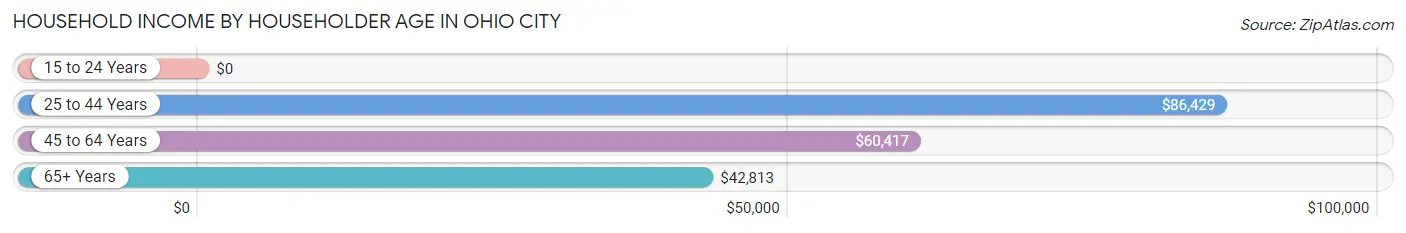
Household Income by Householder Age in Ohio City
The median household income in Ohio City is $55,543, with the highest median household income of $86,429 found in the 25 to 44 years age bracket for the primary householder. A total of 90 households (32.1%) fall into this category. Meanwhile, the 15 to 24 years age bracket for the primary householder has the lowest median household income of $0, with 8 households (2.9%) in this group.
| Income Bracket | # Households | Median Income |
| 15 to 24 Years | 8 (2.9%) | $0 |
| 25 to 44 Years | 90 (32.1%) | $86,429 |
| 45 to 64 Years | 96 (34.3%) | $60,417 |
| 65+ Years | 86 (30.7%) | $42,813 |
| Total | 280 (100.0%) | $55,543 |
Poverty in Ohio City
Income Below Poverty by Sex and Age in Ohio City
With 6.7% poverty level for males and 12.5% for females among the residents of Ohio City, 6 to 11 year old males and 25 to 34 year old females are the most vulnerable to poverty, with 15 males (68.2%) and 19 females (43.2%) in their respective age groups living below the poverty level.
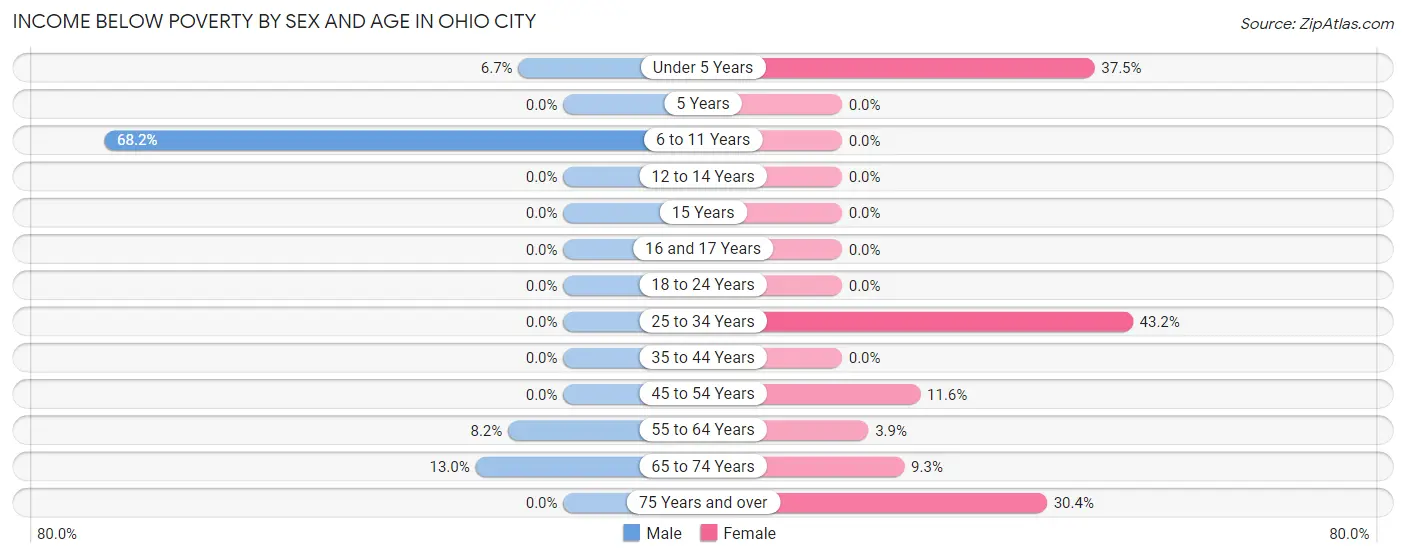
| Age Bracket | Male | Female |
| Under 5 Years | 1 (6.7%) | 9 (37.5%) |
| 5 Years | 0 (0.0%) | 0 (0.0%) |
| 6 to 11 Years | 15 (68.2%) | 0 (0.0%) |
| 12 to 14 Years | 0 (0.0%) | 0 (0.0%) |
| 15 Years | 0 (0.0%) | 0 (0.0%) |
| 16 and 17 Years | 0 (0.0%) | 0 (0.0%) |
| 18 to 24 Years | 0 (0.0%) | 0 (0.0%) |
| 25 to 34 Years | 0 (0.0%) | 19 (43.2%) |
| 35 to 44 Years | 0 (0.0%) | 0 (0.0%) |
| 45 to 54 Years | 0 (0.0%) | 5 (11.6%) |
| 55 to 64 Years | 5 (8.2%) | 2 (3.9%) |
| 65 to 74 Years | 3 (13.0%) | 5 (9.3%) |
| 75 Years and over | 0 (0.0%) | 7 (30.4%) |
| Total | 24 (6.7%) | 47 (12.5%) |
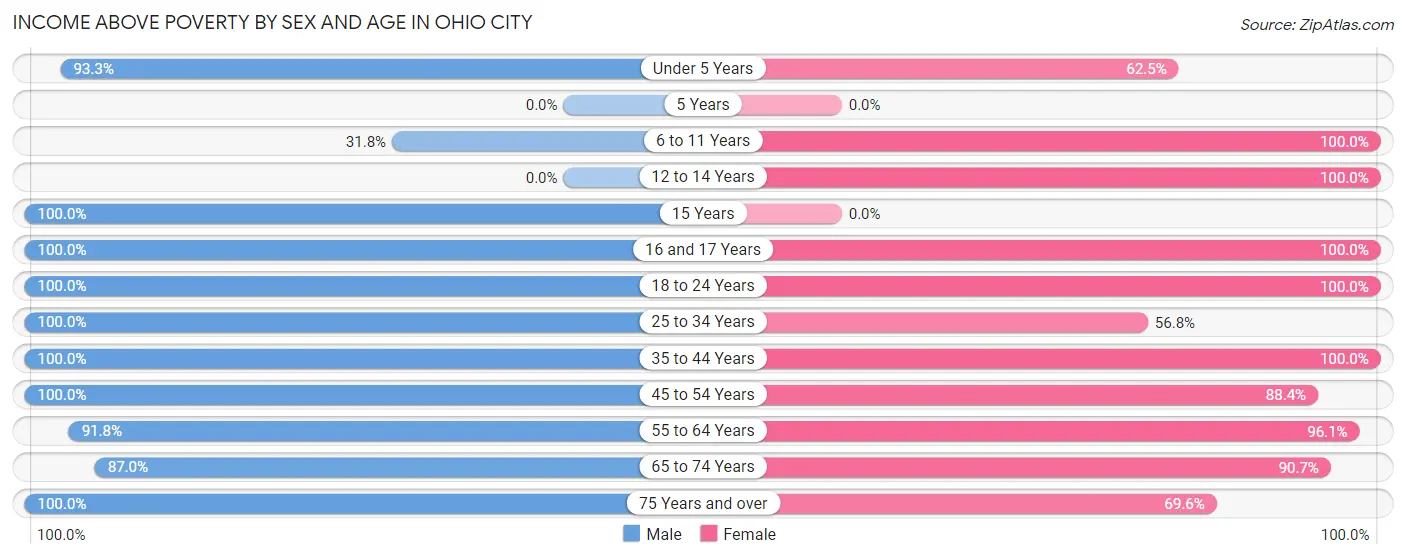
Income Above Poverty by Sex and Age in Ohio City
According to the poverty statistics in Ohio City, males aged 15 years and females aged 6 to 11 years are the age groups that are most secure financially, with 100.0% of males and 100.0% of females in these age groups living above the poverty line.
| Age Bracket | Male | Female |
| Under 5 Years | 14 (93.3%) | 15 (62.5%) |
| 5 Years | 0 (0.0%) | 0 (0.0%) |
| 6 to 11 Years | 7 (31.8%) | 4 (100.0%) |
| 12 to 14 Years | 0 (0.0%) | 1 (100.0%) |
| 15 Years | 17 (100.0%) | 0 (0.0%) |
| 16 and 17 Years | 32 (100.0%) | 27 (100.0%) |
| 18 to 24 Years | 34 (100.0%) | 59 (100.0%) |
| 25 to 34 Years | 41 (100.0%) | 25 (56.8%) |
| 35 to 44 Years | 62 (100.0%) | 45 (100.0%) |
| 45 to 54 Years | 26 (100.0%) | 38 (88.4%) |
| 55 to 64 Years | 56 (91.8%) | 49 (96.1%) |
| 65 to 74 Years | 20 (87.0%) | 49 (90.7%) |
| 75 Years and over | 23 (100.0%) | 16 (69.6%) |
| Total | 332 (93.3%) | 328 (87.5%) |
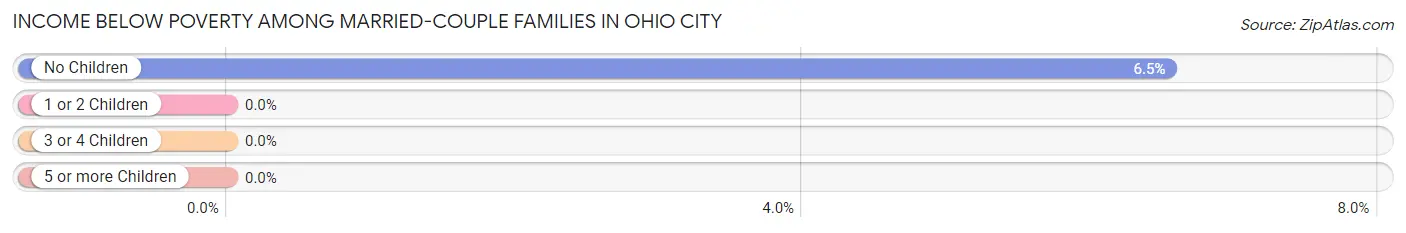
Income Below Poverty Among Married-Couple Families in Ohio City
The poverty statistics for married-couple families in Ohio City show that 4.8% or 7 of the total 147 families live below the poverty line. Families with no children have the highest poverty rate of 6.5%, comprising of 7 families. On the other hand, families with 1 or 2 children have the lowest poverty rate of 0.0%, which includes 0 families.
| Children | Above Poverty | Below Poverty |
| No Children | 100 (93.5%) | 7 (6.5%) |
| 1 or 2 Children | 27 (100.0%) | 0 (0.0%) |
| 3 or 4 Children | 13 (100.0%) | 0 (0.0%) |
| 5 or more Children | 0 (0.0%) | 0 (0.0%) |
| Total | 140 (95.2%) | 7 (4.8%) |
Income Below Poverty Among Single-Parent Households in Ohio City
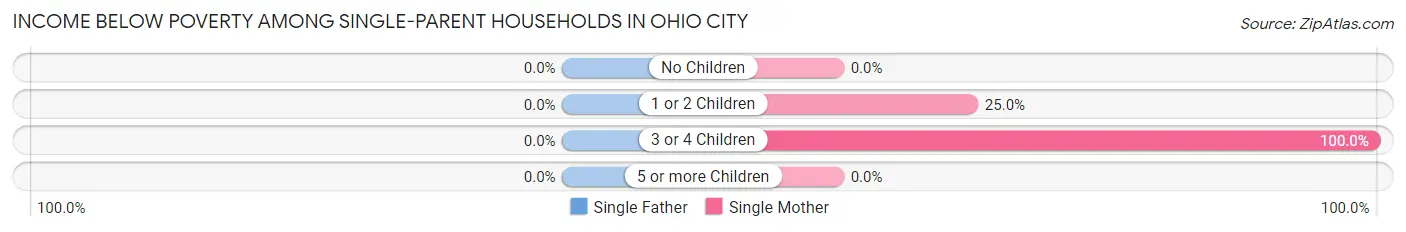
| Children | Single Father | Single Mother |
| No Children | 0 (0.0%) | 0 (0.0%) |
| 1 or 2 Children | 0 (0.0%) | 2 (25.0%) |
| 3 or 4 Children | 0 (0.0%) | 6 (100.0%) |
| 5 or more Children | 0 (0.0%) | 0 (0.0%) |
| Total | 0 (0.0%) | 8 (34.8%) |
Income Below Poverty Among Married-Couple vs Single-Parent Households in Ohio City
The poverty data for Ohio City shows that 7 of the married-couple family households (4.8%) and 8 of the single-parent households (19.1%) are living below the poverty level. Within the married-couple family households, those with no children have the highest poverty rate, with 7 households (6.5%) falling below the poverty line. Among the single-parent households, those with 3 or 4 children have the highest poverty rate, with 6 household (100.0%) living below poverty.
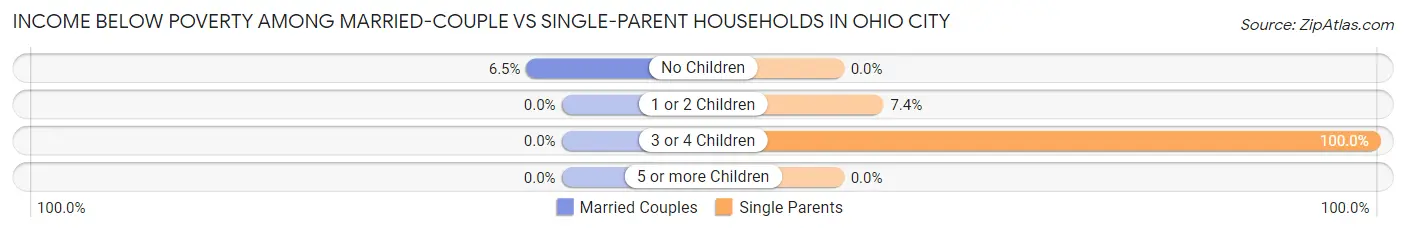
| Children | Married-Couple Families | Single-Parent Households |
| No Children | 7 (6.5%) | 0 (0.0%) |
| 1 or 2 Children | 0 (0.0%) | 2 (7.4%) |
| 3 or 4 Children | 0 (0.0%) | 6 (100.0%) |
| 5 or more Children | 0 (0.0%) | 0 (0.0%) |
| Total | 7 (4.8%) | 8 (19.1%) |
Race in Ohio City
The most populous races in Ohio City are White / Caucasian (682 | 92.5%), Hispanic or Latino (62 | 8.4%), and Two or more Races (33 | 4.5%).
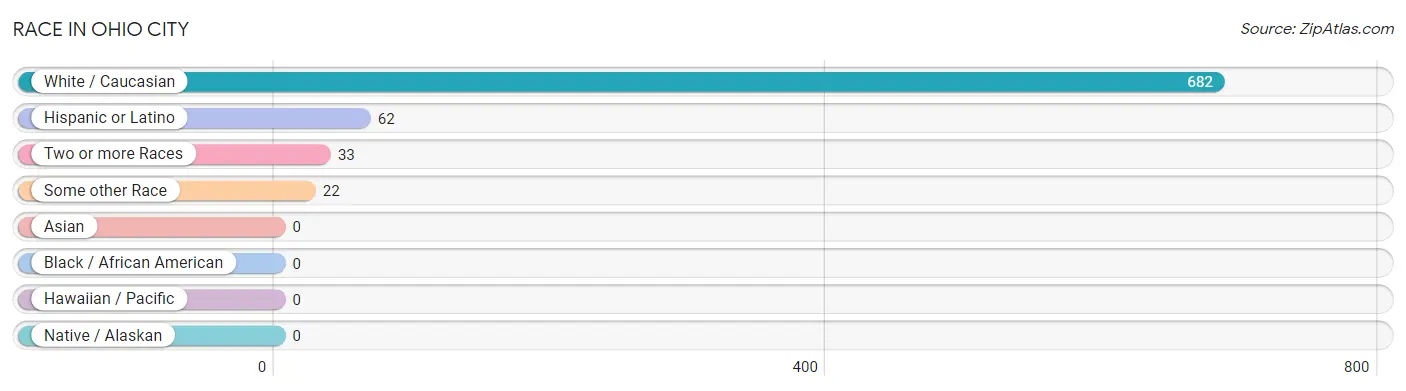
| Race | # Population | % Population |
| Asian | 0 | 0.0% |
| Black / African American | 0 | 0.0% |
| Hawaiian / Pacific | 0 | 0.0% |
| Hispanic or Latino | 62 | 8.4% |
| Native / Alaskan | 0 | 0.0% |
| White / Caucasian | 682 | 92.5% |
| Two or more Races | 33 | 4.5% |
| Some other Race | 22 | 3.0% |
| Total | 737 | 100.0% |
Ancestry in Ohio City
The most populous ancestries reported in Ohio City are German (173 | 23.5%), Mexican (62 | 8.4%), American (49 | 6.7%), Irish (32 | 4.3%), and English (25 | 3.4%), together accounting for 46.3% of all Ohio City residents.
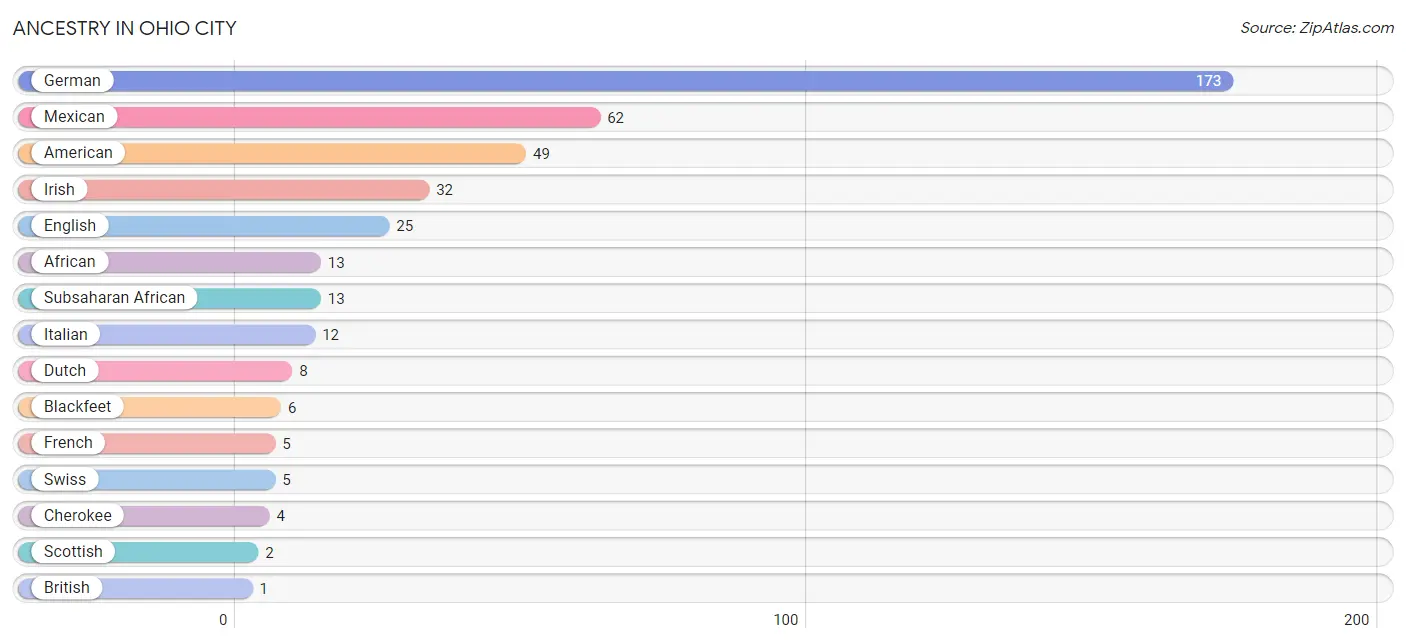
| Ancestry | # Population | % Population |
| African | 13 | 1.8% |
| American | 49 | 6.7% |
| Blackfeet | 6 | 0.8% |
| British | 1 | 0.1% |
| Cherokee | 4 | 0.5% |
| Dutch | 8 | 1.1% |
| English | 25 | 3.4% |
| French | 5 | 0.7% |
| German | 173 | 23.5% |
| Greek | 1 | 0.1% |
| Irish | 32 | 4.3% |
| Italian | 12 | 1.6% |
| Mexican | 62 | 8.4% |
| Scottish | 2 | 0.3% |
| Subsaharan African | 13 | 1.8% |
| Swiss | 5 | 0.7% | View All 16 Rows |
Immigrants in Ohio City
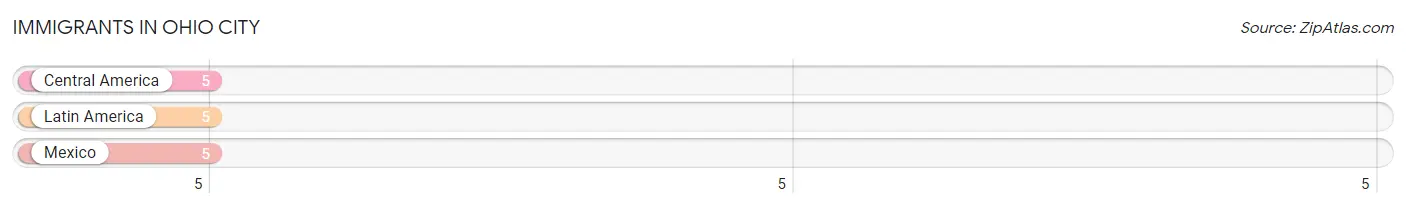
The most numerous immigrant groups reported in Ohio City came from Central America (5 | 0.7%), Latin America (5 | 0.7%), and Mexico (5 | 0.7%), together accounting for 2.0% of all Ohio City residents.
| Immigration Origin | # Population | % Population |
| Central America | 5 | 0.7% |
| Latin America | 5 | 0.7% |
| Mexico | 5 | 0.7% | View All 3 Rows |
Sex and Age in Ohio City
Sex and Age in Ohio City
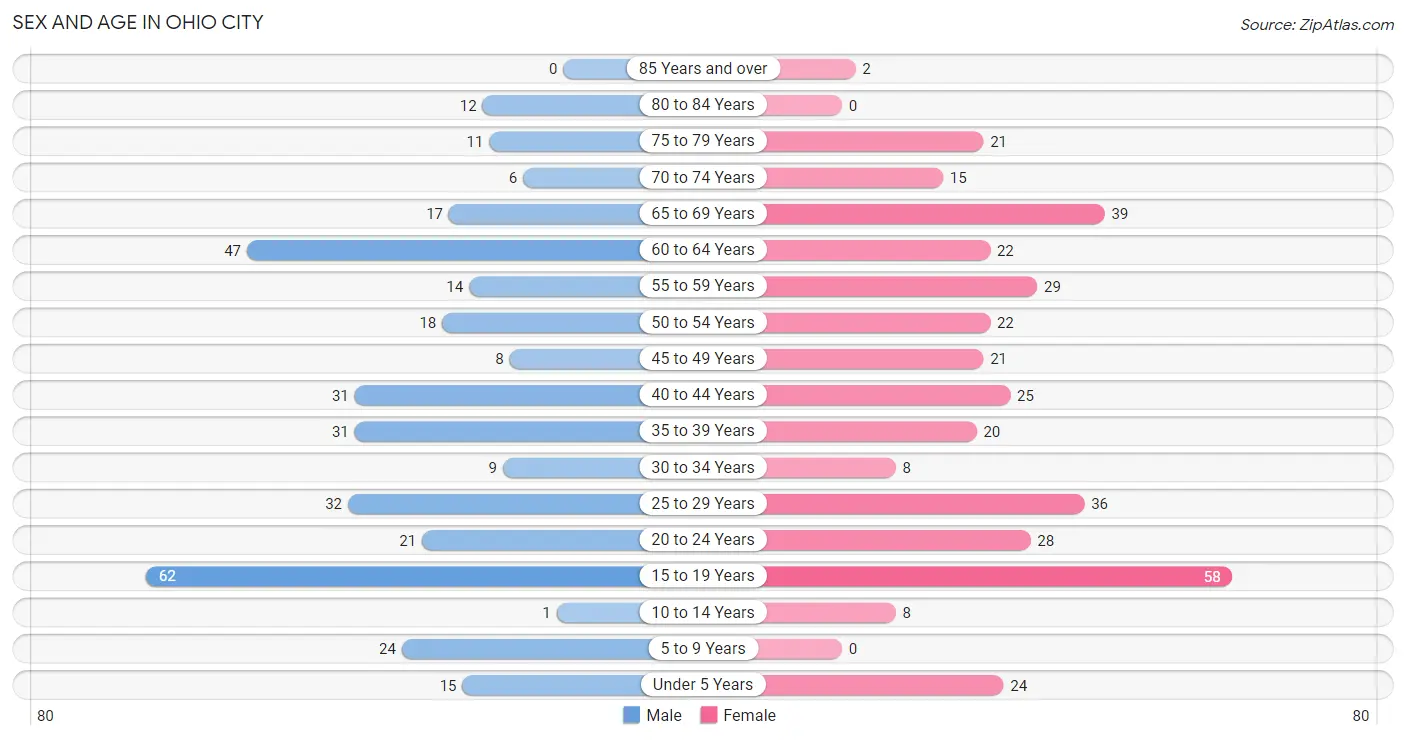
The most populous age groups in Ohio City are 15 to 19 Years (62 | 17.3%) for men and 15 to 19 Years (58 | 15.3%) for women.
| Age Bracket | Male | Female |
| Under 5 Years | 15 (4.2%) | 24 (6.4%) |
| 5 to 9 Years | 24 (6.7%) | 0 (0.0%) |
| 10 to 14 Years | 1 (0.3%) | 8 (2.1%) |
| 15 to 19 Years | 62 (17.3%) | 58 (15.3%) |
| 20 to 24 Years | 21 (5.9%) | 28 (7.4%) |
| 25 to 29 Years | 32 (8.9%) | 36 (9.5%) |
| 30 to 34 Years | 9 (2.5%) | 8 (2.1%) |
| 35 to 39 Years | 31 (8.6%) | 20 (5.3%) |
| 40 to 44 Years | 31 (8.6%) | 25 (6.6%) |
| 45 to 49 Years | 8 (2.2%) | 21 (5.6%) |
| 50 to 54 Years | 18 (5.0%) | 22 (5.8%) |
| 55 to 59 Years | 14 (3.9%) | 29 (7.7%) |
| 60 to 64 Years | 47 (13.1%) | 22 (5.8%) |
| 65 to 69 Years | 17 (4.7%) | 39 (10.3%) |
| 70 to 74 Years | 6 (1.7%) | 15 (4.0%) |
| 75 to 79 Years | 11 (3.1%) | 21 (5.6%) |
| 80 to 84 Years | 12 (3.3%) | 0 (0.0%) |
| 85 Years and over | 0 (0.0%) | 2 (0.5%) |
| Total | 359 (100.0%) | 378 (100.0%) |
Families and Households in Ohio City
Median Family Size in Ohio City
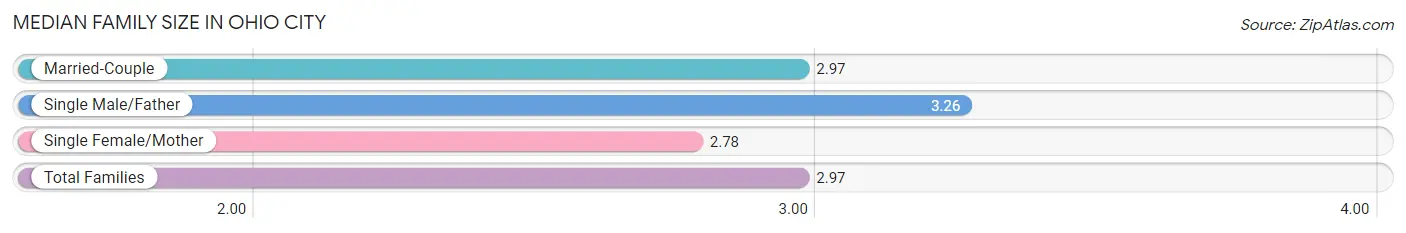
The median family size in Ohio City is 2.97 persons per family, with single male/father families (19 | 10.1%) accounting for the largest median family size of 3.26 persons per family. On the other hand, single female/mother families (23 | 12.2%) represent the smallest median family size with 2.78 persons per family.
| Family Type | # Families | Family Size |
| Married-Couple | 147 (77.8%) | 2.97 |
| Single Male/Father | 19 (10.1%) | 3.26 |
| Single Female/Mother | 23 (12.2%) | 2.78 |
| Total Families | 189 (100.0%) | 2.97 |
Median Household Size in Ohio City
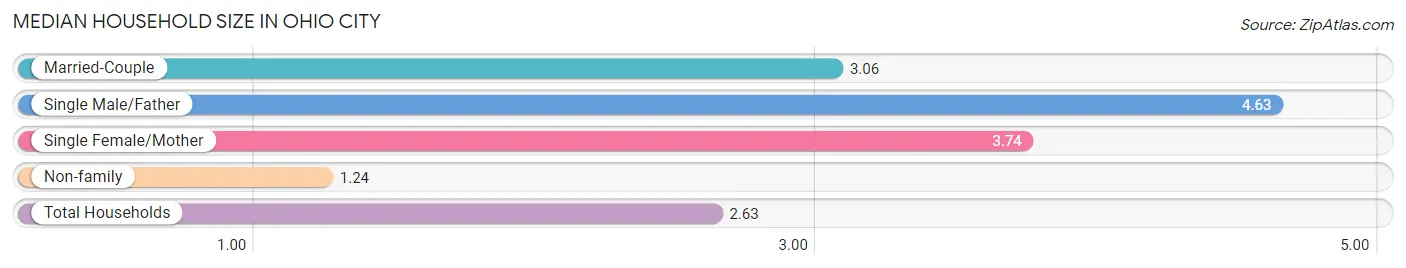
The median household size in Ohio City is 2.63 persons per household, with single male/father households (19 | 6.8%) accounting for the largest median household size of 4.63 persons per household. non-family households (91 | 32.5%) represent the smallest median household size with 1.24 persons per household.
| Household Type | # Households | Household Size |
| Married-Couple | 147 (52.5%) | 3.06 |
| Single Male/Father | 19 (6.8%) | 4.63 |
| Single Female/Mother | 23 (8.2%) | 3.74 |
| Non-family | 91 (32.5%) | 1.24 |
| Total Households | 280 (100.0%) | 2.63 |
Household Size by Marriage Status in Ohio City
Out of a total of 280 households in Ohio City, 189 (67.5%) are family households, while 91 (32.5%) are nonfamily households. The most numerous type of family households are 2-person households, comprising 106, and the most common type of nonfamily households are 1-person households, comprising 73.
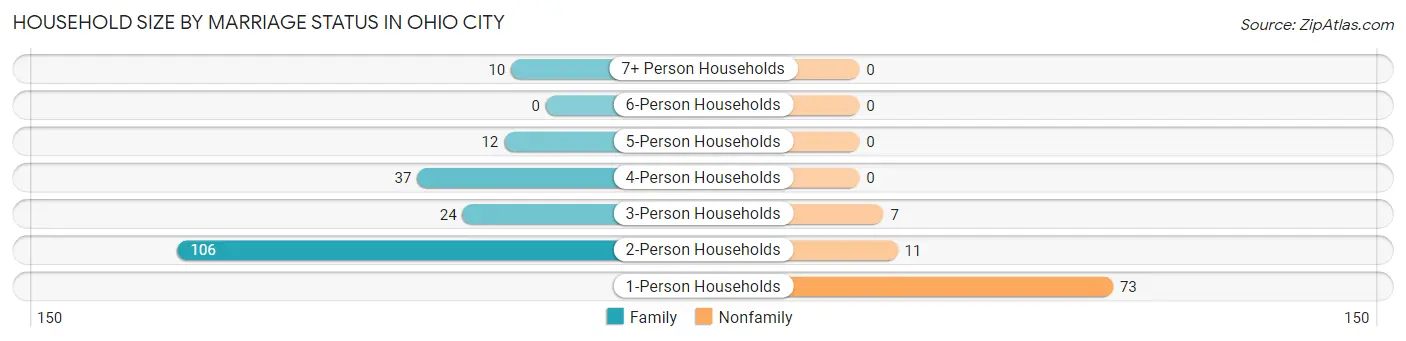
| Household Size | Family Households | Nonfamily Households |
| 1-Person Households | - | 73 (26.1%) |
| 2-Person Households | 106 (37.9%) | 11 (3.9%) |
| 3-Person Households | 24 (8.6%) | 7 (2.5%) |
| 4-Person Households | 37 (13.2%) | 0 (0.0%) |
| 5-Person Households | 12 (4.3%) | 0 (0.0%) |
| 6-Person Households | 0 (0.0%) | 0 (0.0%) |
| 7+ Person Households | 10 (3.6%) | 0 (0.0%) |
| Total | 189 (67.5%) | 91 (32.5%) |
Female Fertility in Ohio City
Fertility by Age in Ohio City
Average fertility rate in Ohio City is 111.0 births per 1,000 women. Women in the age bracket of 20 to 34 years have the highest fertility rate with 306.0 births per 1,000 women. Women in the age bracket of 20 to 34 years acount for 100.0% of all women with births.
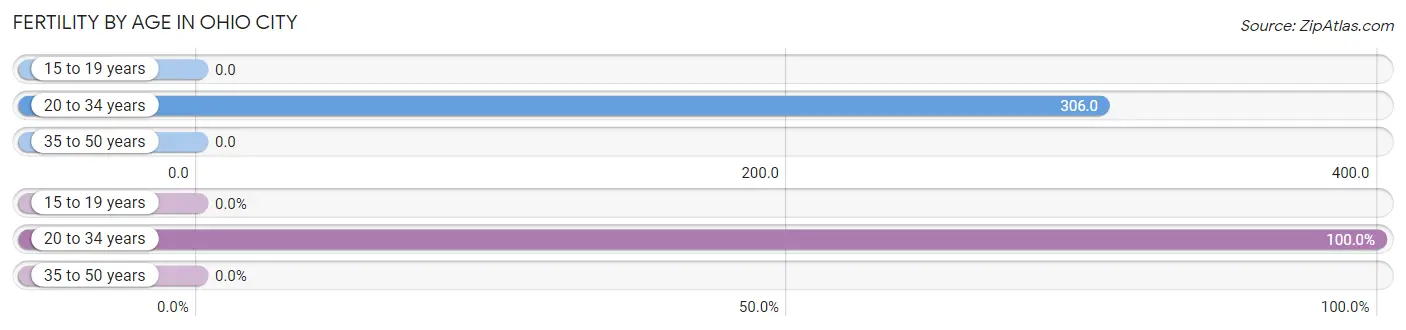
| Age Bracket | Women with Births | Births / 1,000 Women |
| 15 to 19 years | 0 (0.0%) | 0.0 |
| 20 to 34 years | 22 (100.0%) | 306.0 |
| 35 to 50 years | 0 (0.0%) | 0.0 |
| Total | 22 (100.0%) | 111.0 |
Fertility by Age by Marriage Status in Ohio City
9.1% of women with births (22) in Ohio City are married. The highest percentage of unmarried women with births falls into 20 to 34 years age bracket with 90.9% of them unmarried at the time of birth, while the lowest percentage of unmarried women with births belong to 20 to 34 years age bracket with 90.9% of them unmarried.
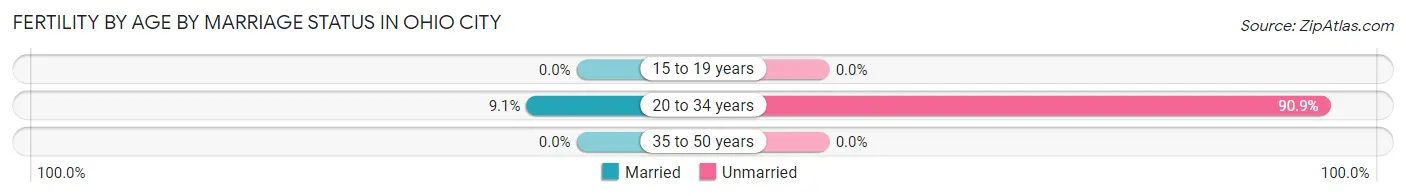
| Age Bracket | Married | Unmarried |
| 15 to 19 years | 0 (0.0%) | 0 (0.0%) |
| 20 to 34 years | 2 (9.1%) | 20 (90.9%) |
| 35 to 50 years | 0 (0.0%) | 0 (0.0%) |
| Total | 2 (9.1%) | 20 (90.9%) |
Fertility by Education in Ohio City
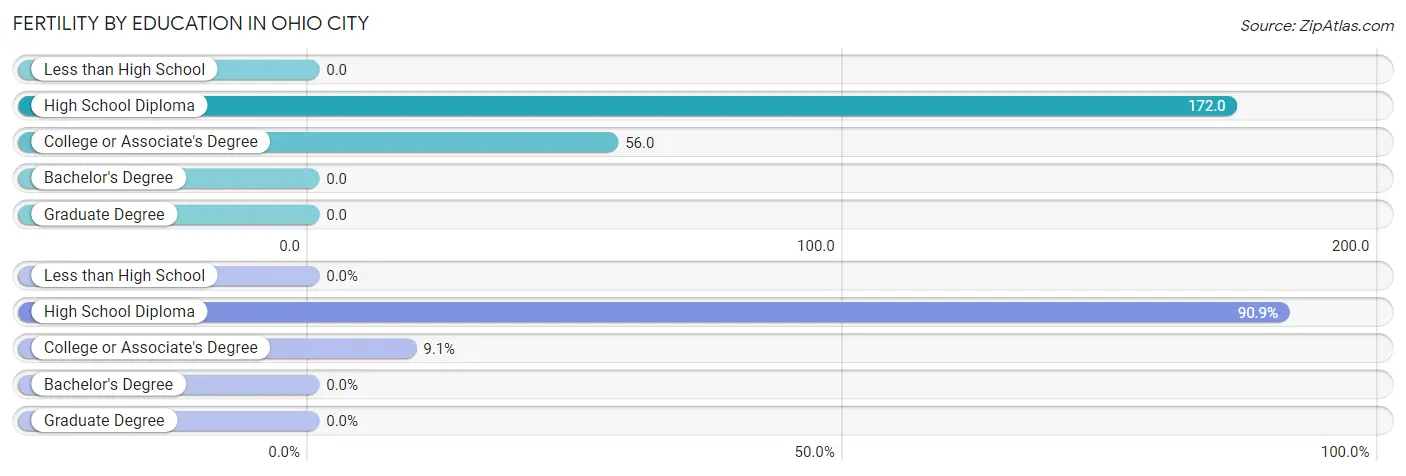
| Educational Attainment | Women with Births | Births / 1,000 Women |
| Less than High School | 0 (0.0%) | 0.0 |
| High School Diploma | 20 (90.9%) | 172.0 |
| College or Associate's Degree | 2 (9.1%) | 56.0 |
| Bachelor's Degree | 0 (0.0%) | 0.0 |
| Graduate Degree | 0 (0.0%) | 0.0 |
| Total | 22 (100.0%) | 111.0 |
Fertility by Education by Marriage Status in Ohio City
90.9% of women with births in Ohio City are unmarried. Women with the educational attainment of college or associate's degree are most likely to be married with 100.0% of them married at childbirth, while women with the educational attainment of high school diploma are least likely to be married with 100.0% of them unmarried at childbirth.
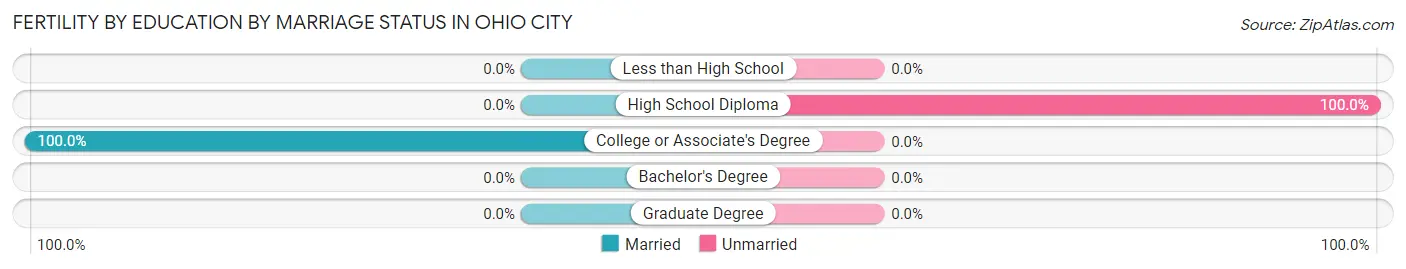
| Educational Attainment | Married | Unmarried |
| Less than High School | 0 (0.0%) | 0 (0.0%) |
| High School Diploma | 0 (0.0%) | 20 (100.0%) |
| College or Associate's Degree | 2 (100.0%) | 0 (0.0%) |
| Bachelor's Degree | 0 (0.0%) | 0 (0.0%) |
| Graduate Degree | 0 (0.0%) | 0 (0.0%) |
| Total | 2 (9.1%) | 20 (90.9%) |
Employment Characteristics in Ohio City
Employment by Class of Employer in Ohio City
Among the 360 employed individuals in Ohio City, private company employees (325 | 90.3%), not-for-profit organizations (13 | 3.6%), and local government employees (7 | 1.9%) make up the most common classes of employment.
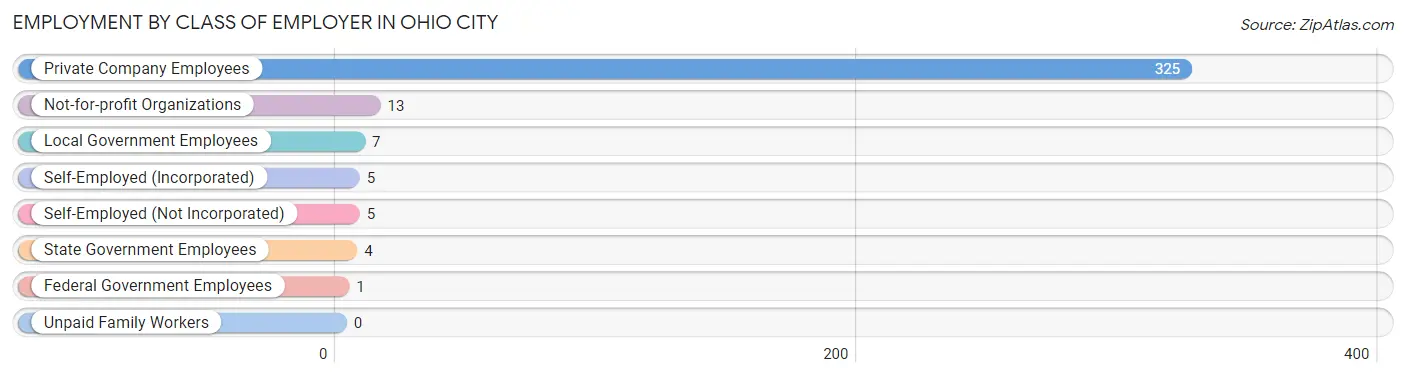
| Employer Class | # Employees | % Employees |
| Private Company Employees | 325 | 90.3% |
| Self-Employed (Incorporated) | 5 | 1.4% |
| Self-Employed (Not Incorporated) | 5 | 1.4% |
| Not-for-profit Organizations | 13 | 3.6% |
| Local Government Employees | 7 | 1.9% |
| State Government Employees | 4 | 1.1% |
| Federal Government Employees | 1 | 0.3% |
| Unpaid Family Workers | 0 | 0.0% |
| Total | 360 | 100.0% |
Employment Status by Age in Ohio City
According to the labor force statistics for Ohio City, out of the total population over 16 years of age (648), 56.6% or 367 individuals are in the labor force, with 1.1% or 4 of them unemployed. The age group with the highest labor force participation rate is 35 to 44 years, with 86.9% or 93 individuals in the labor force. Within the labor force, the 65 to 74 years age range has the highest percentage of unemployed individuals, with 13.3% or 2 of them being unemployed.
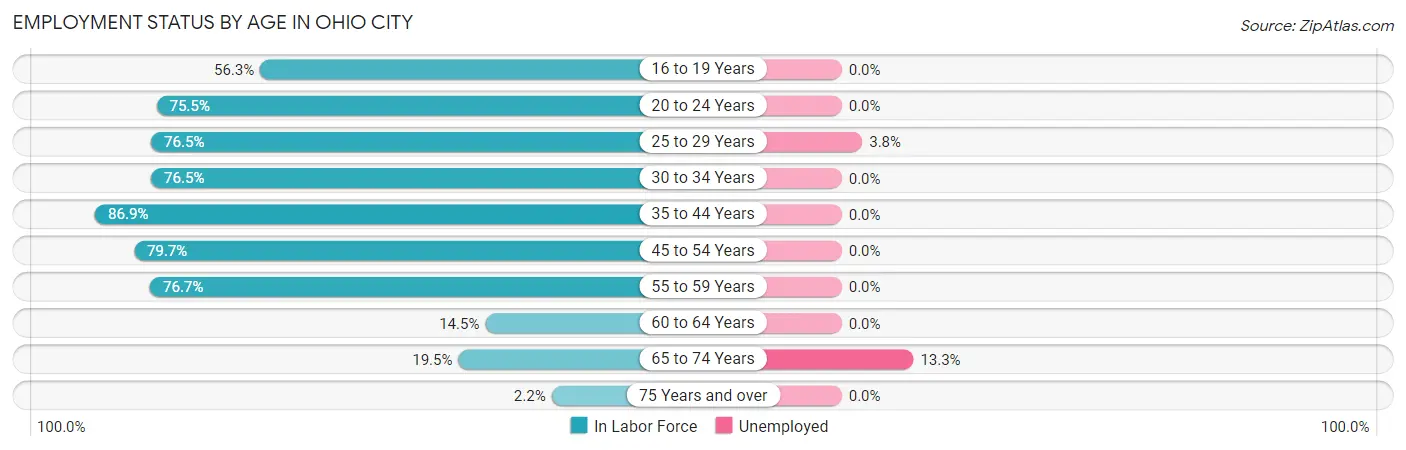
| Age Bracket | In Labor Force | Unemployed |
| 16 to 19 Years | 58 (56.3%) | 0 (0.0%) |
| 20 to 24 Years | 37 (75.5%) | 0 (0.0%) |
| 25 to 29 Years | 52 (76.5%) | 2 (3.8%) |
| 30 to 34 Years | 13 (76.5%) | 0 (0.0%) |
| 35 to 44 Years | 93 (86.9%) | 0 (0.0%) |
| 45 to 54 Years | 55 (79.7%) | 0 (0.0%) |
| 55 to 59 Years | 33 (76.7%) | 0 (0.0%) |
| 60 to 64 Years | 10 (14.5%) | 0 (0.0%) |
| 65 to 74 Years | 15 (19.5%) | 2 (13.3%) |
| 75 Years and over | 1 (2.2%) | 0 (0.0%) |
| Total | 367 (56.6%) | 4 (1.1%) |
Employment Status by Educational Attainment in Ohio City
According to labor force statistics for Ohio City, 68.6% of individuals (256) out of the total population between 25 and 64 years of age (373) are in the labor force, with 0.8% or 2 of them being unemployed. The group with the highest labor force participation rate are those with the educational attainment of bachelor's degree or higher, with 90.0% or 18 individuals in the labor force. Within the labor force, individuals with high school diploma education have the highest percentage of unemployment, with 1.2% or 2 of them being unemployed.
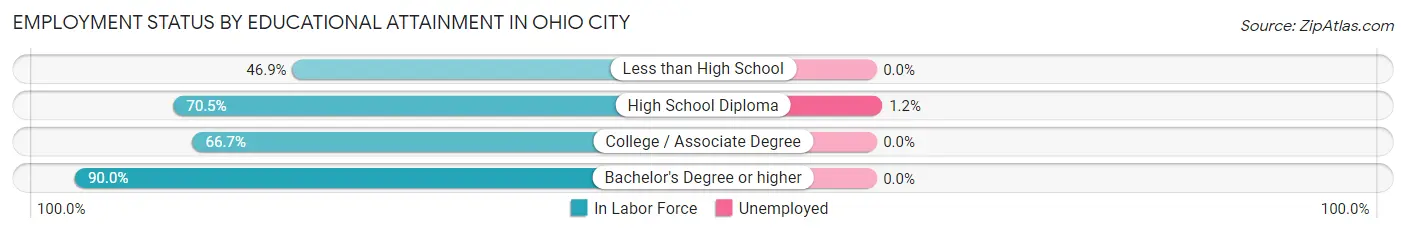
| Educational Attainment | In Labor Force | Unemployed |
| Less than High School | 15 (46.9%) | 0 (0.0%) |
| High School Diploma | 167 (70.5%) | 3 (1.2%) |
| College / Associate Degree | 56 (66.7%) | 0 (0.0%) |
| Bachelor's Degree or higher | 18 (90.0%) | 0 (0.0%) |
| Total | 256 (68.6%) | 3 (0.8%) |
Employment Occupations by Sex in Ohio City
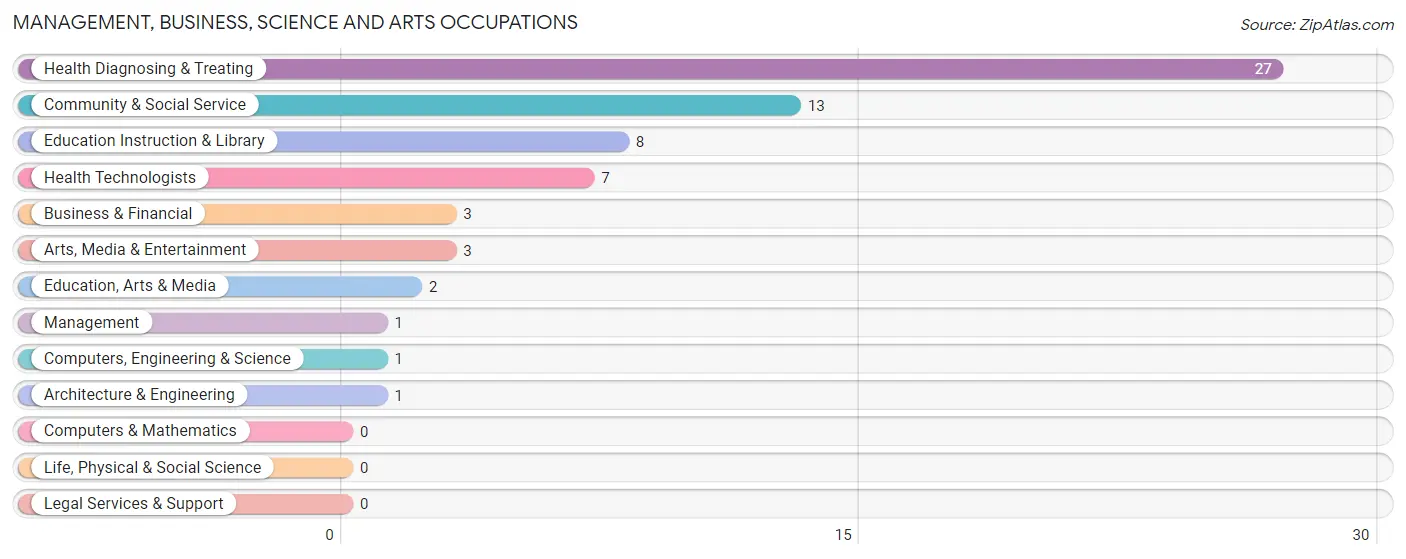
Management, Business, Science and Arts Occupations
The most common Management, Business, Science and Arts occupations in Ohio City are Health Diagnosing & Treating (27 | 7.4%), Community & Social Service (13 | 3.6%), Education Instruction & Library (8 | 2.2%), Health Technologists (7 | 1.9%), and Business & Financial (3 | 0.8%).
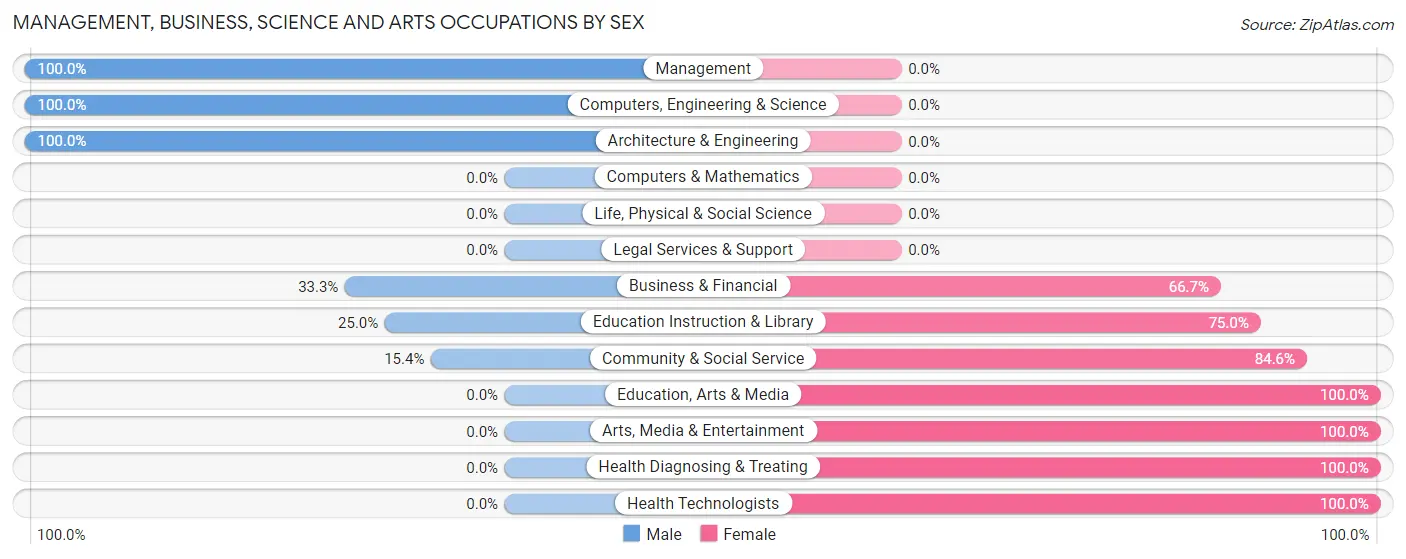
Management, Business, Science and Arts Occupations by Sex
Within the Management, Business, Science and Arts occupations in Ohio City, the most male-oriented occupations are Management (100.0%), Computers, Engineering & Science (100.0%), and Architecture & Engineering (100.0%), while the most female-oriented occupations are Education, Arts & Media (100.0%), Arts, Media & Entertainment (100.0%), and Health Diagnosing & Treating (100.0%).
| Occupation | Male | Female |
| Management | 1 (100.0%) | 0 (0.0%) |
| Business & Financial | 1 (33.3%) | 2 (66.7%) |
| Computers, Engineering & Science | 1 (100.0%) | 0 (0.0%) |
| Computers & Mathematics | 0 (0.0%) | 0 (0.0%) |
| Architecture & Engineering | 1 (100.0%) | 0 (0.0%) |
| Life, Physical & Social Science | 0 (0.0%) | 0 (0.0%) |
| Community & Social Service | 2 (15.4%) | 11 (84.6%) |
| Education, Arts & Media | 0 (0.0%) | 2 (100.0%) |
| Legal Services & Support | 0 (0.0%) | 0 (0.0%) |
| Education Instruction & Library | 2 (25.0%) | 6 (75.0%) |
| Arts, Media & Entertainment | 0 (0.0%) | 3 (100.0%) |
| Health Diagnosing & Treating | 0 (0.0%) | 27 (100.0%) |
| Health Technologists | 0 (0.0%) | 7 (100.0%) |
| Total (Category) | 5 (11.1%) | 40 (88.9%) |
| Total (Overall) | 159 (43.8%) | 204 (56.2%) |
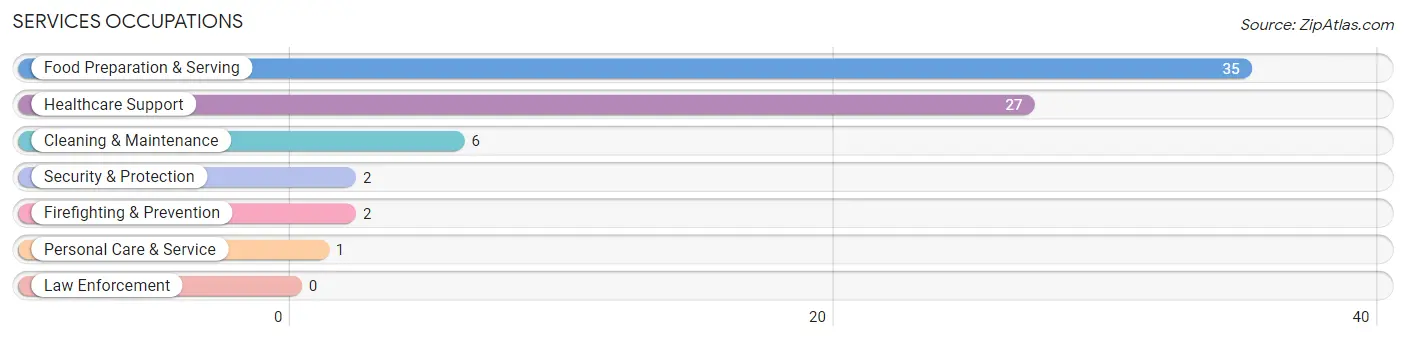
Services Occupations
The most common Services occupations in Ohio City are Food Preparation & Serving (35 | 9.6%), Healthcare Support (27 | 7.4%), Cleaning & Maintenance (6 | 1.7%), Security & Protection (2 | 0.5%), and Firefighting & Prevention (2 | 0.5%).
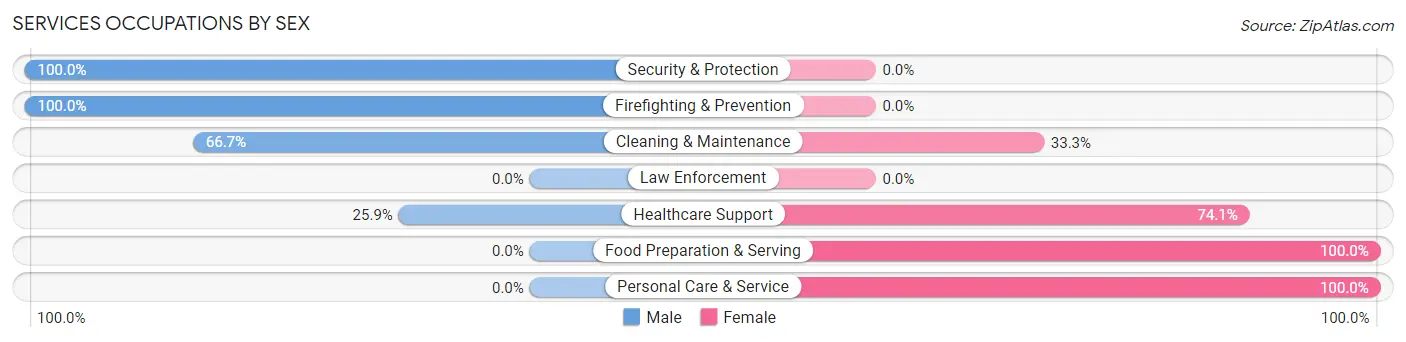
Services Occupations by Sex
Within the Services occupations in Ohio City, the most male-oriented occupations are Security & Protection (100.0%), Firefighting & Prevention (100.0%), and Cleaning & Maintenance (66.7%), while the most female-oriented occupations are Food Preparation & Serving (100.0%), Personal Care & Service (100.0%), and Healthcare Support (74.1%).
| Occupation | Male | Female |
| Healthcare Support | 7 (25.9%) | 20 (74.1%) |
| Security & Protection | 2 (100.0%) | 0 (0.0%) |
| Firefighting & Prevention | 2 (100.0%) | 0 (0.0%) |
| Law Enforcement | 0 (0.0%) | 0 (0.0%) |
| Food Preparation & Serving | 0 (0.0%) | 35 (100.0%) |
| Cleaning & Maintenance | 4 (66.7%) | 2 (33.3%) |
| Personal Care & Service | 0 (0.0%) | 1 (100.0%) |
| Total (Category) | 13 (18.3%) | 58 (81.7%) |
| Total (Overall) | 159 (43.8%) | 204 (56.2%) |
Sales and Office Occupations
The most common Sales and Office occupations in Ohio City are Office & Administration (27 | 7.4%), and Sales & Related (25 | 6.9%).

Sales and Office Occupations by Sex
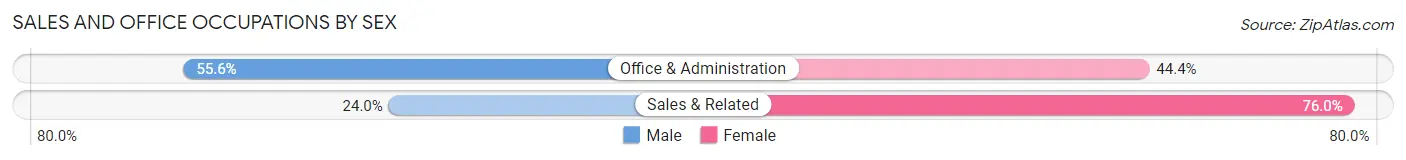
| Occupation | Male | Female |
| Sales & Related | 6 (24.0%) | 19 (76.0%) |
| Office & Administration | 15 (55.6%) | 12 (44.4%) |
| Total (Category) | 21 (40.4%) | 31 (59.6%) |
| Total (Overall) | 159 (43.8%) | 204 (56.2%) |
Natural Resources, Construction and Maintenance Occupations
The most common Natural Resources, Construction and Maintenance occupations in Ohio City are Installation, Maintenance & Repair (29 | 8.0%), and Farming, Fishing & Forestry (3 | 0.8%).
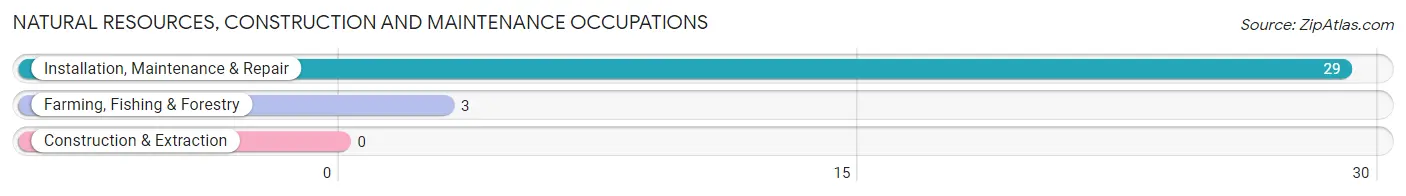
Natural Resources, Construction and Maintenance Occupations by Sex

| Occupation | Male | Female |
| Farming, Fishing & Forestry | 0 (0.0%) | 3 (100.0%) |
| Construction & Extraction | 0 (0.0%) | 0 (0.0%) |
| Installation, Maintenance & Repair | 29 (100.0%) | 0 (0.0%) |
| Total (Category) | 29 (90.6%) | 3 (9.4%) |
| Total (Overall) | 159 (43.8%) | 204 (56.2%) |
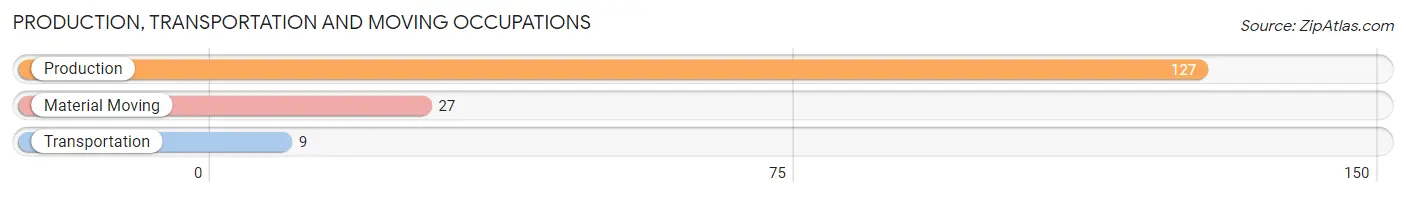
Production, Transportation and Moving Occupations
The most common Production, Transportation and Moving occupations in Ohio City are Production (127 | 35.0%), Material Moving (27 | 7.4%), and Transportation (9 | 2.5%).
Production, Transportation and Moving Occupations by Sex
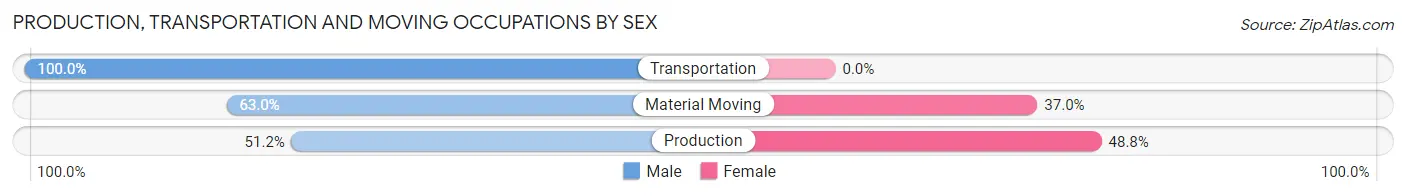
| Occupation | Male | Female |
| Production | 65 (51.2%) | 62 (48.8%) |
| Transportation | 9 (100.0%) | 0 (0.0%) |
| Material Moving | 17 (63.0%) | 10 (37.0%) |
| Total (Category) | 91 (55.8%) | 72 (44.2%) |
| Total (Overall) | 159 (43.8%) | 204 (56.2%) |
Employment Industries by Sex in Ohio City
Employment Industries in Ohio City
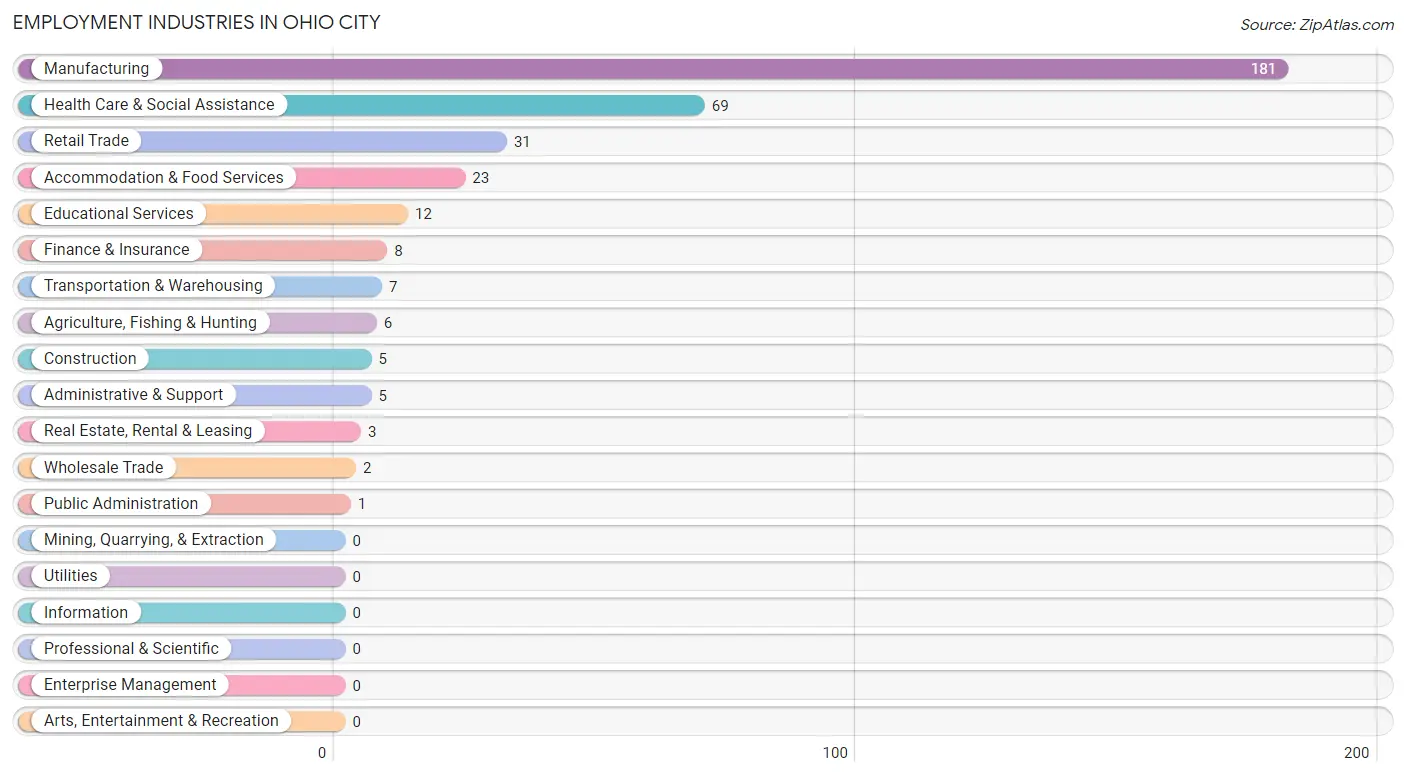
The major employment industries in Ohio City include Manufacturing (181 | 49.9%), Health Care & Social Assistance (69 | 19.0%), Retail Trade (31 | 8.5%), Accommodation & Food Services (23 | 6.3%), and Educational Services (12 | 3.3%).
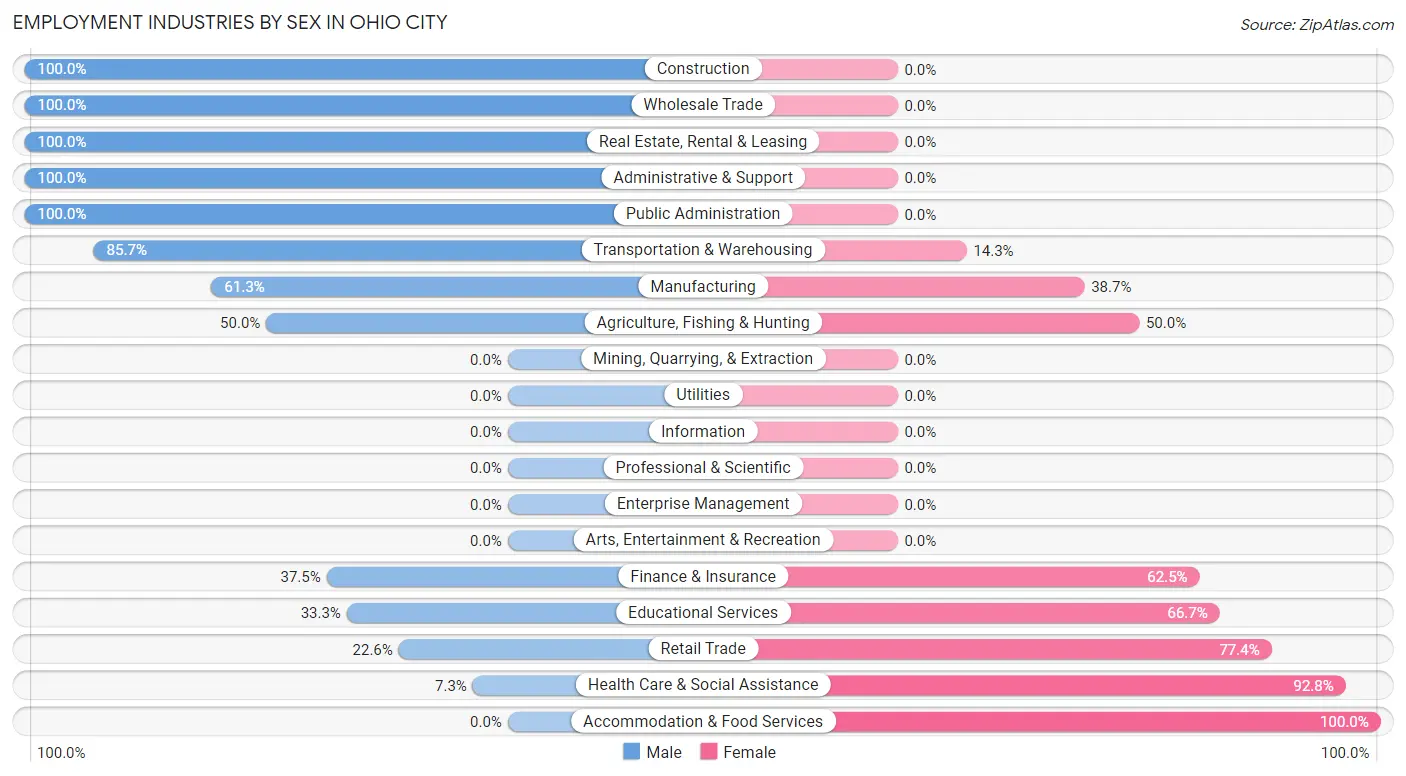
Employment Industries by Sex in Ohio City
The Ohio City industries that see more men than women are Construction (100.0%), Wholesale Trade (100.0%), and Real Estate, Rental & Leasing (100.0%), whereas the industries that tend to have a higher number of women are Accommodation & Food Services (100.0%), Health Care & Social Assistance (92.7%), and Retail Trade (77.4%).
| Industry | Male | Female |
| Agriculture, Fishing & Hunting | 3 (50.0%) | 3 (50.0%) |
| Mining, Quarrying, & Extraction | 0 (0.0%) | 0 (0.0%) |
| Construction | 5 (100.0%) | 0 (0.0%) |
| Manufacturing | 111 (61.3%) | 70 (38.7%) |
| Wholesale Trade | 2 (100.0%) | 0 (0.0%) |
| Retail Trade | 7 (22.6%) | 24 (77.4%) |
| Transportation & Warehousing | 6 (85.7%) | 1 (14.3%) |
| Utilities | 0 (0.0%) | 0 (0.0%) |
| Information | 0 (0.0%) | 0 (0.0%) |
| Finance & Insurance | 3 (37.5%) | 5 (62.5%) |
| Real Estate, Rental & Leasing | 3 (100.0%) | 0 (0.0%) |
| Professional & Scientific | 0 (0.0%) | 0 (0.0%) |
| Enterprise Management | 0 (0.0%) | 0 (0.0%) |
| Administrative & Support | 5 (100.0%) | 0 (0.0%) |
| Educational Services | 4 (33.3%) | 8 (66.7%) |
| Health Care & Social Assistance | 5 (7.2%) | 64 (92.7%) |
| Arts, Entertainment & Recreation | 0 (0.0%) | 0 (0.0%) |
| Accommodation & Food Services | 0 (0.0%) | 23 (100.0%) |
| Public Administration | 1 (100.0%) | 0 (0.0%) |
| Total | 159 (43.8%) | 204 (56.2%) |
Education in Ohio City
School Enrollment in Ohio City
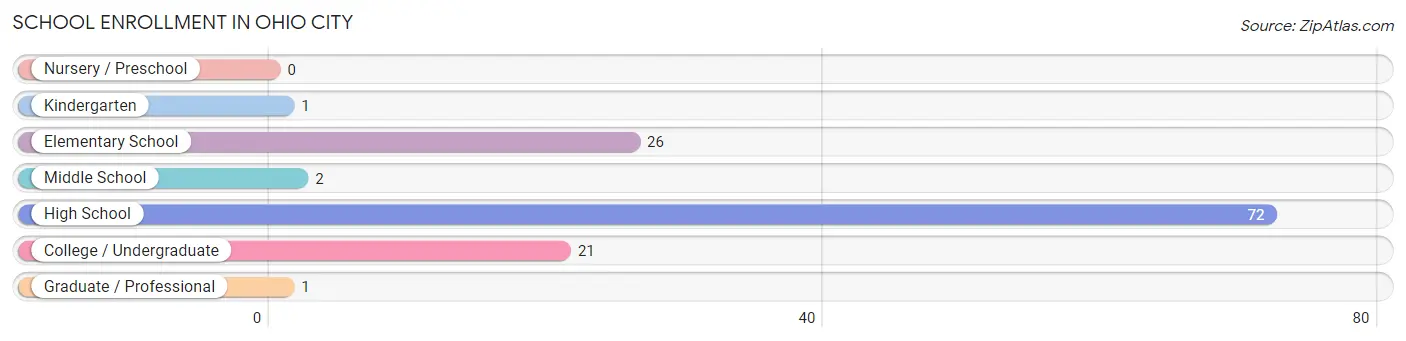
The most common levels of schooling among the 123 students in Ohio City are high school (72 | 58.5%), elementary school (26 | 21.1%), and college / undergraduate (21 | 17.1%).
| School Level | # Students | % Students |
| Nursery / Preschool | 0 | 0.0% |
| Kindergarten | 1 | 0.8% |
| Elementary School | 26 | 21.1% |
| Middle School | 2 | 1.6% |
| High School | 72 | 58.5% |
| College / Undergraduate | 21 | 17.1% |
| Graduate / Professional | 1 | 0.8% |
| Total | 123 | 100.0% |
School Enrollment by Age by Funding Source in Ohio City
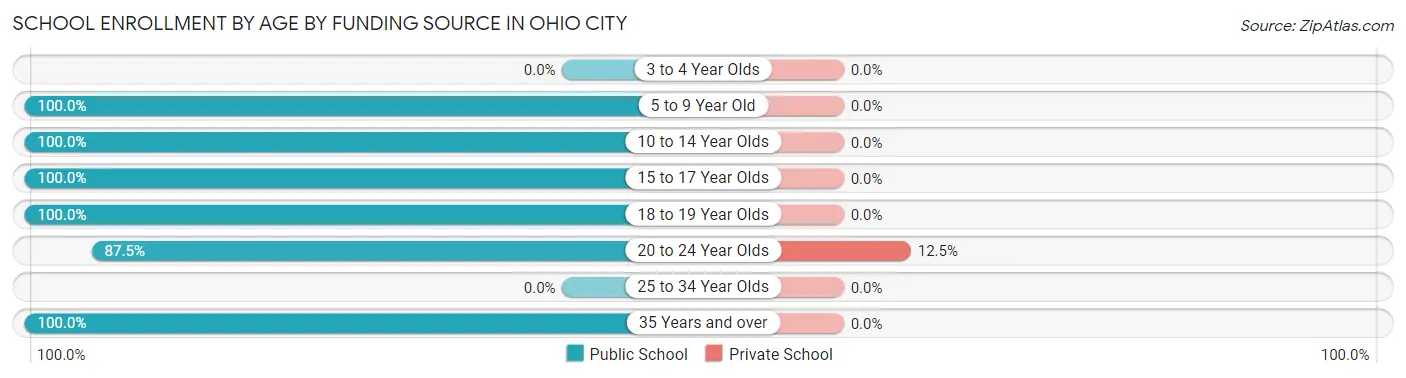
Out of a total of 123 students who are enrolled in schools in Ohio City, 2 (1.6%) attend a private institution, while the remaining 121 (98.4%) are enrolled in public schools. The age group of 20 to 24 year olds has the highest likelihood of being enrolled in private schools, with 2 (12.5% in the age bracket) enrolled. Conversely, the age group of 5 to 9 year old has the lowest likelihood of being enrolled in a private school, with 23 (100.0% in the age bracket) attending a public institution.
| Age Bracket | Public School | Private School |
| 3 to 4 Year Olds | 0 (0.0%) | 0 (0.0%) |
| 5 to 9 Year Old | 23 (100.0%) | 0 (0.0%) |
| 10 to 14 Year Olds | 6 (100.0%) | 0 (0.0%) |
| 15 to 17 Year Olds | 56 (100.0%) | 0 (0.0%) |
| 18 to 19 Year Olds | 16 (100.0%) | 0 (0.0%) |
| 20 to 24 Year Olds | 14 (87.5%) | 2 (12.5%) |
| 25 to 34 Year Olds | 0 (0.0%) | 0 (0.0%) |
| 35 Years and over | 6 (100.0%) | 0 (0.0%) |
| Total | 121 (98.4%) | 2 (1.6%) |
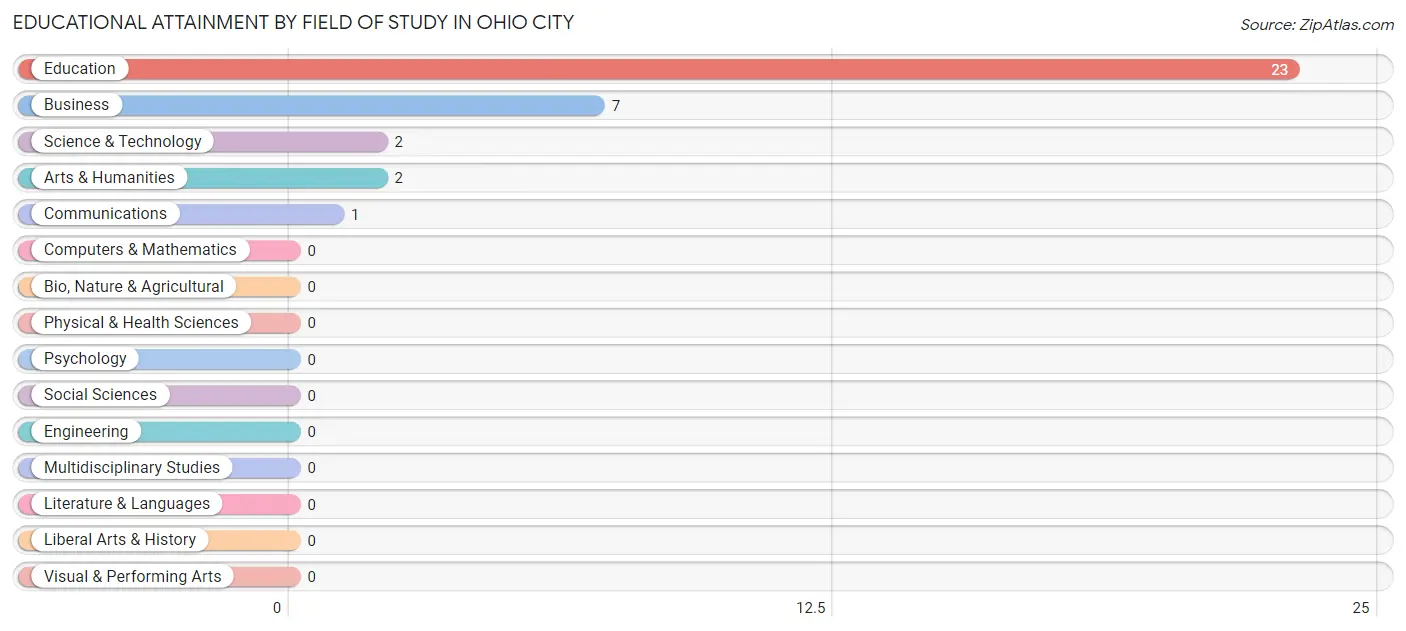
Educational Attainment by Field of Study in Ohio City
Education (23 | 65.7%), business (7 | 20.0%), science & technology (2 | 5.7%), arts & humanities (2 | 5.7%), and communications (1 | 2.9%) are the most common fields of study among 35 individuals in Ohio City who have obtained a bachelor's degree or higher.
| Field of Study | # Graduates | % Graduates |
| Computers & Mathematics | 0 | 0.0% |
| Bio, Nature & Agricultural | 0 | 0.0% |
| Physical & Health Sciences | 0 | 0.0% |
| Psychology | 0 | 0.0% |
| Social Sciences | 0 | 0.0% |
| Engineering | 0 | 0.0% |
| Multidisciplinary Studies | 0 | 0.0% |
| Science & Technology | 2 | 5.7% |
| Business | 7 | 20.0% |
| Education | 23 | 65.7% |
| Literature & Languages | 0 | 0.0% |
| Liberal Arts & History | 0 | 0.0% |
| Visual & Performing Arts | 0 | 0.0% |
| Communications | 1 | 2.9% |
| Arts & Humanities | 2 | 5.7% |
| Total | 35 | 100.0% |
Transportation & Commute in Ohio City
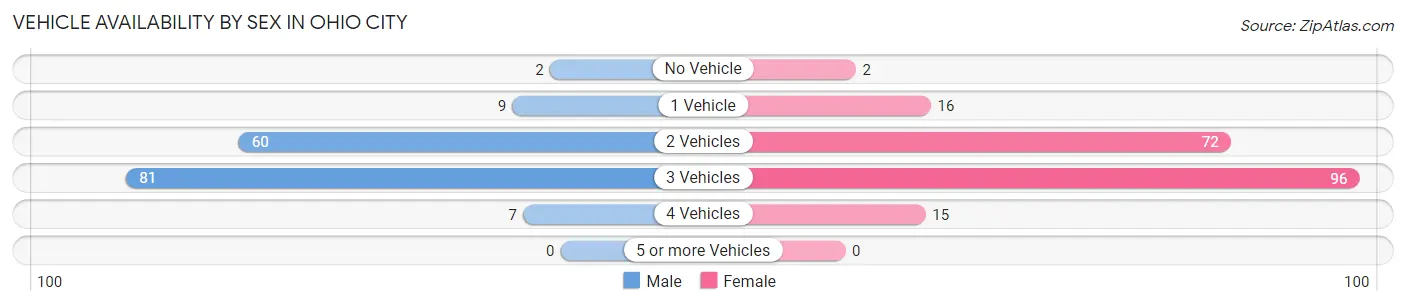
Vehicle Availability by Sex in Ohio City
The most prevalent vehicle ownership categories in Ohio City are males with 3 vehicles (81, accounting for 50.9%) and females with 3 vehicles (96, making up 40.3%).
| Vehicles Available | Male | Female |
| No Vehicle | 2 (1.3%) | 2 (1.0%) |
| 1 Vehicle | 9 (5.7%) | 16 (8.0%) |
| 2 Vehicles | 60 (37.7%) | 72 (35.8%) |
| 3 Vehicles | 81 (50.9%) | 96 (47.8%) |
| 4 Vehicles | 7 (4.4%) | 15 (7.5%) |
| 5 or more Vehicles | 0 (0.0%) | 0 (0.0%) |
| Total | 159 (100.0%) | 201 (100.0%) |
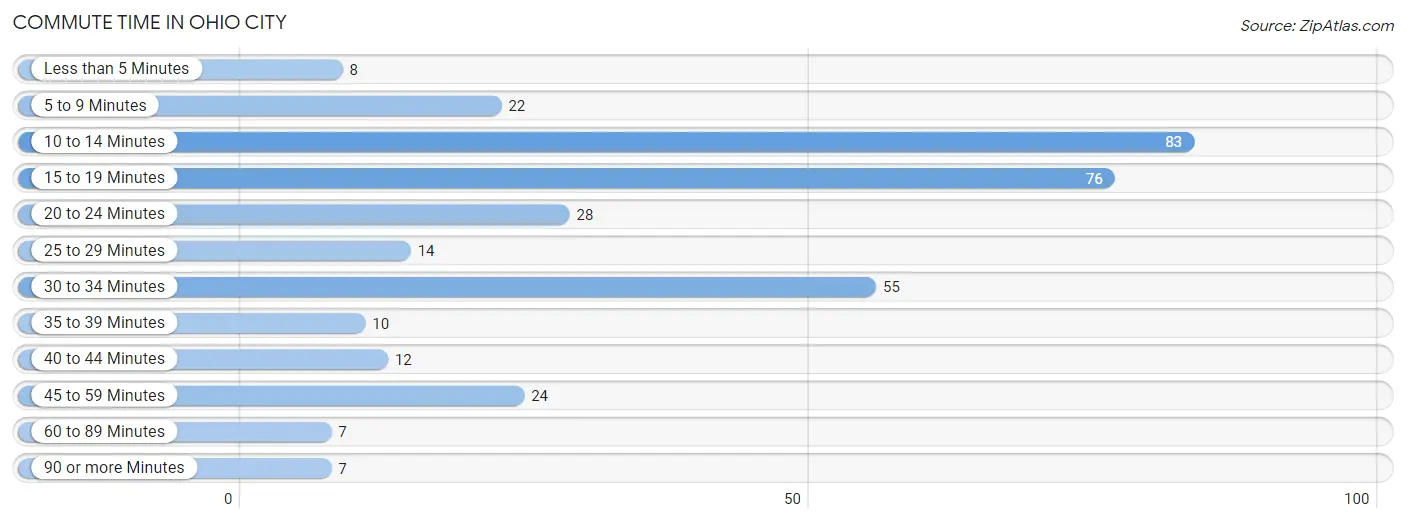
Commute Time in Ohio City
The most frequently occuring commute durations in Ohio City are 10 to 14 minutes (83 commuters, 24.0%), 15 to 19 minutes (76 commuters, 22.0%), and 30 to 34 minutes (55 commuters, 15.9%).
| Commute Time | # Commuters | % Commuters |
| Less than 5 Minutes | 8 | 2.3% |
| 5 to 9 Minutes | 22 | 6.4% |
| 10 to 14 Minutes | 83 | 24.0% |
| 15 to 19 Minutes | 76 | 22.0% |
| 20 to 24 Minutes | 28 | 8.1% |
| 25 to 29 Minutes | 14 | 4.1% |
| 30 to 34 Minutes | 55 | 15.9% |
| 35 to 39 Minutes | 10 | 2.9% |
| 40 to 44 Minutes | 12 | 3.5% |
| 45 to 59 Minutes | 24 | 6.9% |
| 60 to 89 Minutes | 7 | 2.0% |
| 90 or more Minutes | 7 | 2.0% |
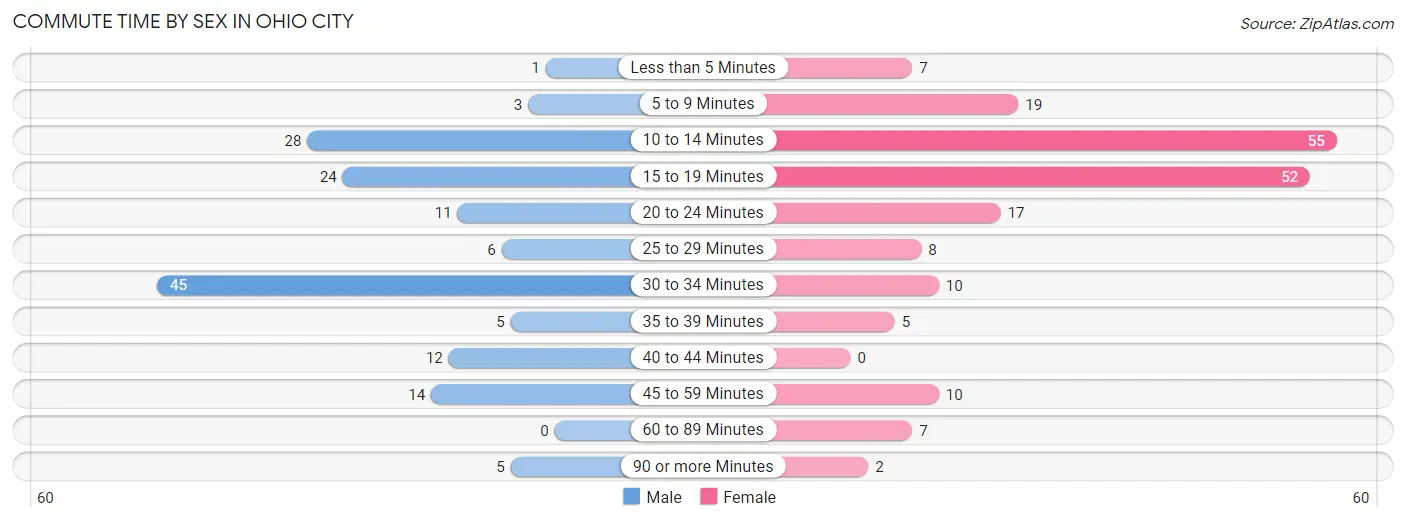
Commute Time by Sex in Ohio City
The most common commute times in Ohio City are 30 to 34 minutes (45 commuters, 29.2%) for males and 10 to 14 minutes (55 commuters, 28.6%) for females.
| Commute Time | Male | Female |
| Less than 5 Minutes | 1 (0.6%) | 7 (3.6%) |
| 5 to 9 Minutes | 3 (1.9%) | 19 (9.9%) |
| 10 to 14 Minutes | 28 (18.2%) | 55 (28.6%) |
| 15 to 19 Minutes | 24 (15.6%) | 52 (27.1%) |
| 20 to 24 Minutes | 11 (7.1%) | 17 (8.8%) |
| 25 to 29 Minutes | 6 (3.9%) | 8 (4.2%) |
| 30 to 34 Minutes | 45 (29.2%) | 10 (5.2%) |
| 35 to 39 Minutes | 5 (3.3%) | 5 (2.6%) |
| 40 to 44 Minutes | 12 (7.8%) | 0 (0.0%) |
| 45 to 59 Minutes | 14 (9.1%) | 10 (5.2%) |
| 60 to 89 Minutes | 0 (0.0%) | 7 (3.6%) |
| 90 or more Minutes | 5 (3.3%) | 2 (1.0%) |
Time of Departure to Work by Sex in Ohio City
The most frequent times of departure to work in Ohio City are 4:00 PM to 11:59 PM (41, 26.6%) for males and 12:00 PM to 3:59 PM (56, 29.2%) for females.
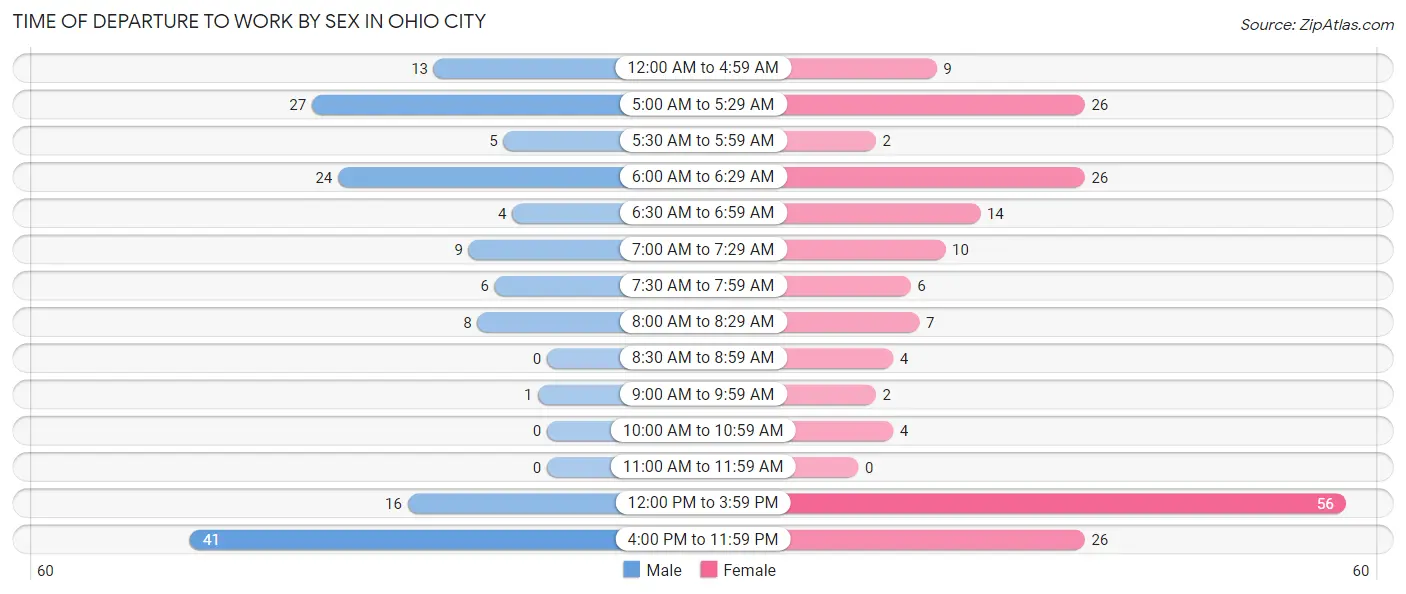
| Time of Departure | Male | Female |
| 12:00 AM to 4:59 AM | 13 (8.4%) | 9 (4.7%) |
| 5:00 AM to 5:29 AM | 27 (17.5%) | 26 (13.5%) |
| 5:30 AM to 5:59 AM | 5 (3.3%) | 2 (1.0%) |
| 6:00 AM to 6:29 AM | 24 (15.6%) | 26 (13.5%) |
| 6:30 AM to 6:59 AM | 4 (2.6%) | 14 (7.3%) |
| 7:00 AM to 7:29 AM | 9 (5.8%) | 10 (5.2%) |
| 7:30 AM to 7:59 AM | 6 (3.9%) | 6 (3.1%) |
| 8:00 AM to 8:29 AM | 8 (5.2%) | 7 (3.6%) |
| 8:30 AM to 8:59 AM | 0 (0.0%) | 4 (2.1%) |
| 9:00 AM to 9:59 AM | 1 (0.6%) | 2 (1.0%) |
| 10:00 AM to 10:59 AM | 0 (0.0%) | 4 (2.1%) |
| 11:00 AM to 11:59 AM | 0 (0.0%) | 0 (0.0%) |
| 12:00 PM to 3:59 PM | 16 (10.4%) | 56 (29.2%) |
| 4:00 PM to 11:59 PM | 41 (26.6%) | 26 (13.5%) |
| Total | 154 (100.0%) | 192 (100.0%) |
Housing Occupancy in Ohio City
Occupancy by Ownership in Ohio City
Of the total 280 dwellings in Ohio City, owner-occupied units account for 237 (84.6%), while renter-occupied units make up 43 (15.4%).
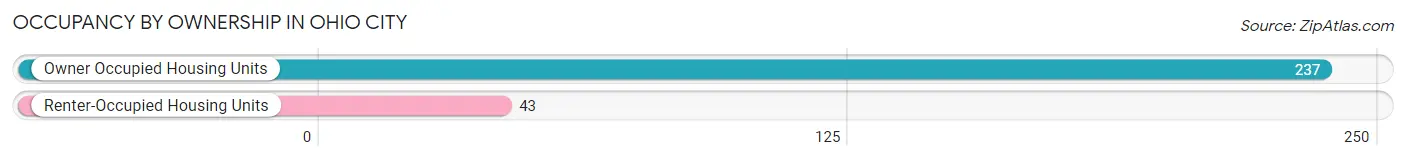
| Occupancy | # Housing Units | % Housing Units |
| Owner Occupied Housing Units | 237 | 84.6% |
| Renter-Occupied Housing Units | 43 | 15.4% |
| Total Occupied Housing Units | 280 | 100.0% |
Occupancy by Household Size in Ohio City
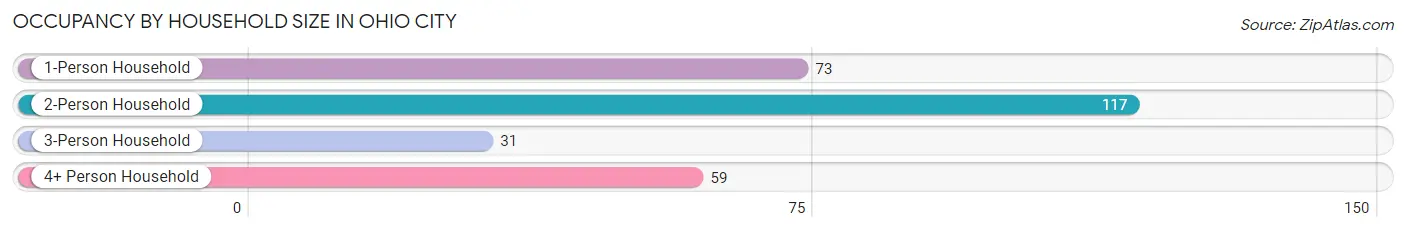
| Household Size | # Housing Units | % Housing Units |
| 1-Person Household | 73 | 26.1% |
| 2-Person Household | 117 | 41.8% |
| 3-Person Household | 31 | 11.1% |
| 4+ Person Household | 59 | 21.1% |
| Total Housing Units | 280 | 100.0% |
Occupancy by Ownership by Household Size in Ohio City
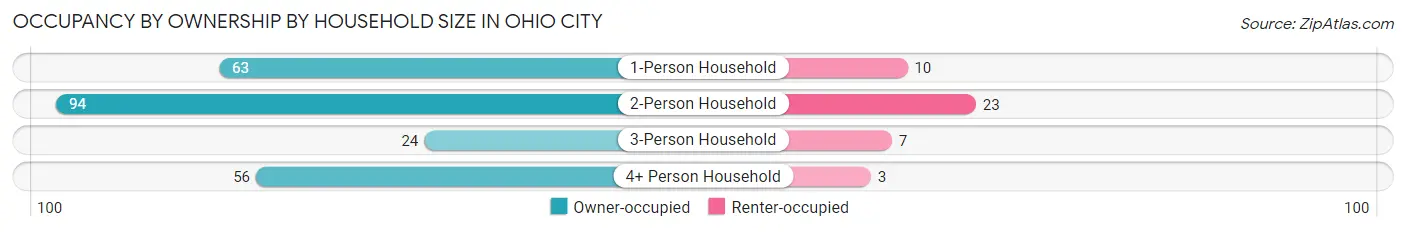
| Household Size | Owner-occupied | Renter-occupied |
| 1-Person Household | 63 (86.3%) | 10 (13.7%) |
| 2-Person Household | 94 (80.3%) | 23 (19.7%) |
| 3-Person Household | 24 (77.4%) | 7 (22.6%) |
| 4+ Person Household | 56 (94.9%) | 3 (5.1%) |
| Total Housing Units | 237 (84.6%) | 43 (15.4%) |
Occupancy by Educational Attainment in Ohio City
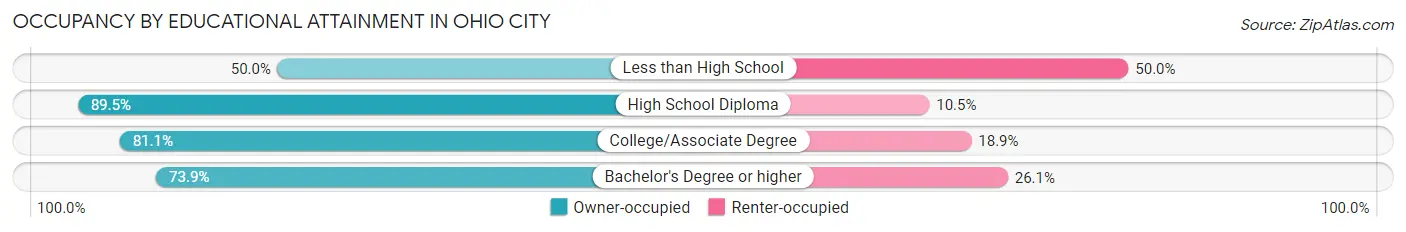
| Household Size | Owner-occupied | Renter-occupied |
| Less than High School | 7 (50.0%) | 7 (50.0%) |
| High School Diploma | 170 (89.5%) | 20 (10.5%) |
| College/Associate Degree | 43 (81.1%) | 10 (18.9%) |
| Bachelor's Degree or higher | 17 (73.9%) | 6 (26.1%) |
Occupancy by Age of Householder in Ohio City
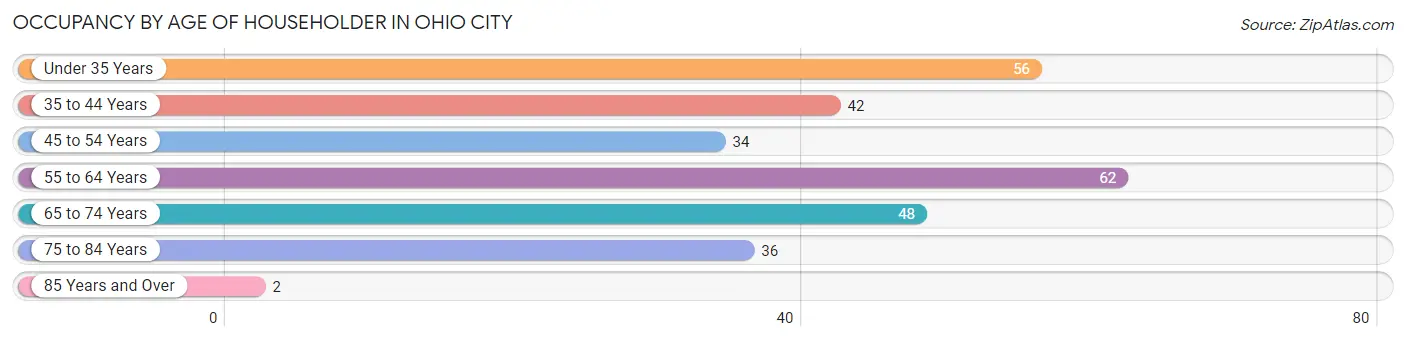
| Age Bracket | # Households | % Households |
| Under 35 Years | 56 | 20.0% |
| 35 to 44 Years | 42 | 15.0% |
| 45 to 54 Years | 34 | 12.1% |
| 55 to 64 Years | 62 | 22.1% |
| 65 to 74 Years | 48 | 17.1% |
| 75 to 84 Years | 36 | 12.9% |
| 85 Years and Over | 2 | 0.7% |
| Total | 280 | 100.0% |
Housing Finances in Ohio City
Median Income by Occupancy in Ohio City
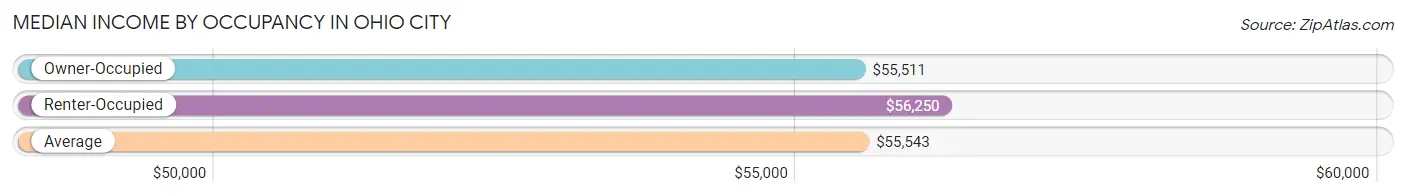
| Occupancy Type | # Households | Median Income |
| Owner-Occupied | 237 (84.6%) | $55,511 |
| Renter-Occupied | 43 (15.4%) | $56,250 |
| Average | 280 (100.0%) | $55,543 |
Occupancy by Householder Income Bracket in Ohio City
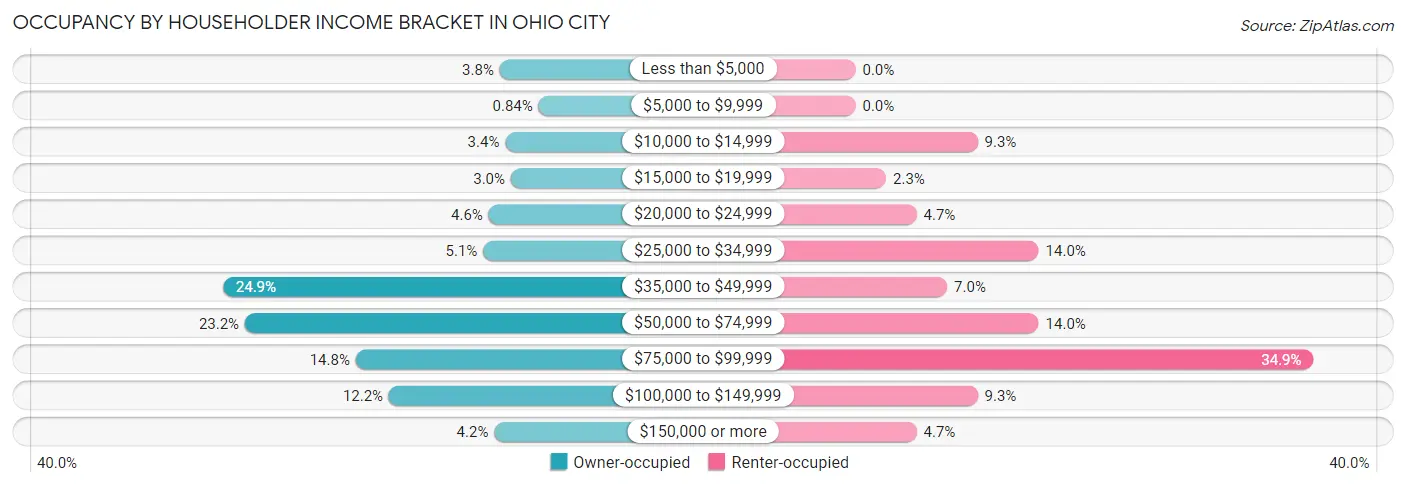
| Income Bracket | Owner-occupied | Renter-occupied |
| Less than $5,000 | 9 (3.8%) | 0 (0.0%) |
| $5,000 to $9,999 | 2 (0.8%) | 0 (0.0%) |
| $10,000 to $14,999 | 8 (3.4%) | 4 (9.3%) |
| $15,000 to $19,999 | 7 (2.9%) | 1 (2.3%) |
| $20,000 to $24,999 | 11 (4.6%) | 2 (4.6%) |
| $25,000 to $34,999 | 12 (5.1%) | 6 (14.0%) |
| $35,000 to $49,999 | 59 (24.9%) | 3 (7.0%) |
| $50,000 to $74,999 | 55 (23.2%) | 6 (14.0%) |
| $75,000 to $99,999 | 35 (14.8%) | 15 (34.9%) |
| $100,000 to $149,999 | 29 (12.2%) | 4 (9.3%) |
| $150,000 or more | 10 (4.2%) | 2 (4.6%) |
| Total | 237 (100.0%) | 43 (100.0%) |
Monthly Housing Cost Tiers in Ohio City
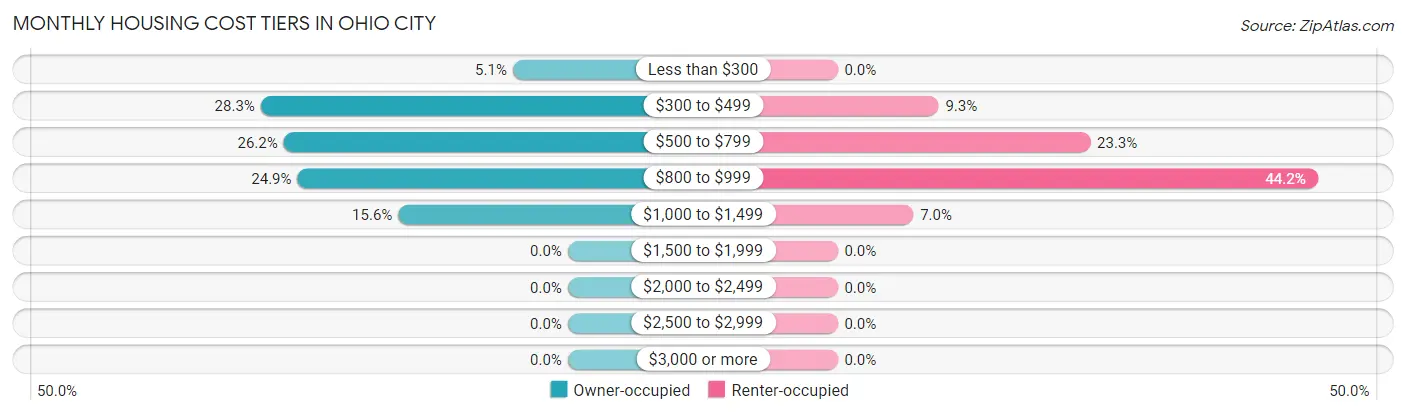
| Monthly Cost | Owner-occupied | Renter-occupied |
| Less than $300 | 12 (5.1%) | 0 (0.0%) |
| $300 to $499 | 67 (28.3%) | 4 (9.3%) |
| $500 to $799 | 62 (26.2%) | 10 (23.3%) |
| $800 to $999 | 59 (24.9%) | 19 (44.2%) |
| $1,000 to $1,499 | 37 (15.6%) | 3 (7.0%) |
| $1,500 to $1,999 | 0 (0.0%) | 0 (0.0%) |
| $2,000 to $2,499 | 0 (0.0%) | 0 (0.0%) |
| $2,500 to $2,999 | 0 (0.0%) | 0 (0.0%) |
| $3,000 or more | 0 (0.0%) | 0 (0.0%) |
| Total | 237 (100.0%) | 43 (100.0%) |
Physical Housing Characteristics in Ohio City
Housing Structures in Ohio City
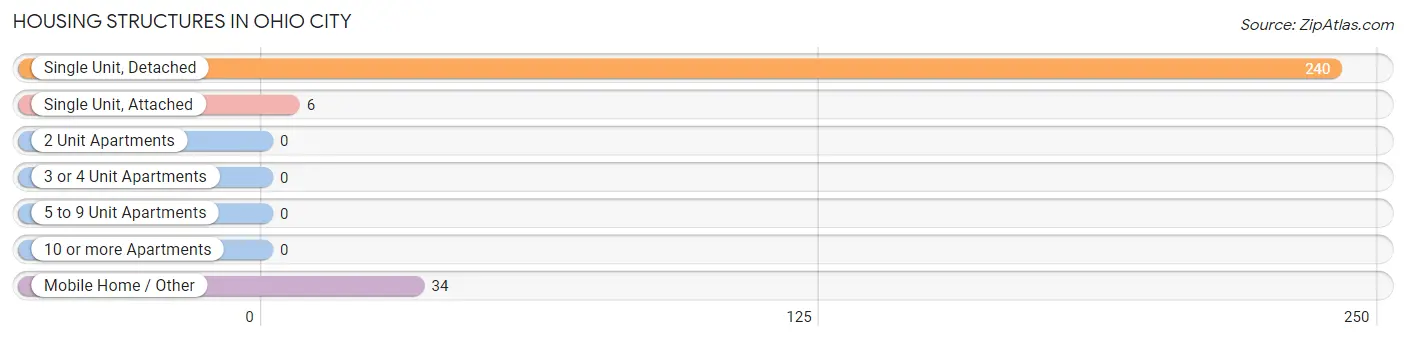
| Structure Type | # Housing Units | % Housing Units |
| Single Unit, Detached | 240 | 85.7% |
| Single Unit, Attached | 6 | 2.1% |
| 2 Unit Apartments | 0 | 0.0% |
| 3 or 4 Unit Apartments | 0 | 0.0% |
| 5 to 9 Unit Apartments | 0 | 0.0% |
| 10 or more Apartments | 0 | 0.0% |
| Mobile Home / Other | 34 | 12.1% |
| Total | 280 | 100.0% |
Housing Structures by Occupancy in Ohio City
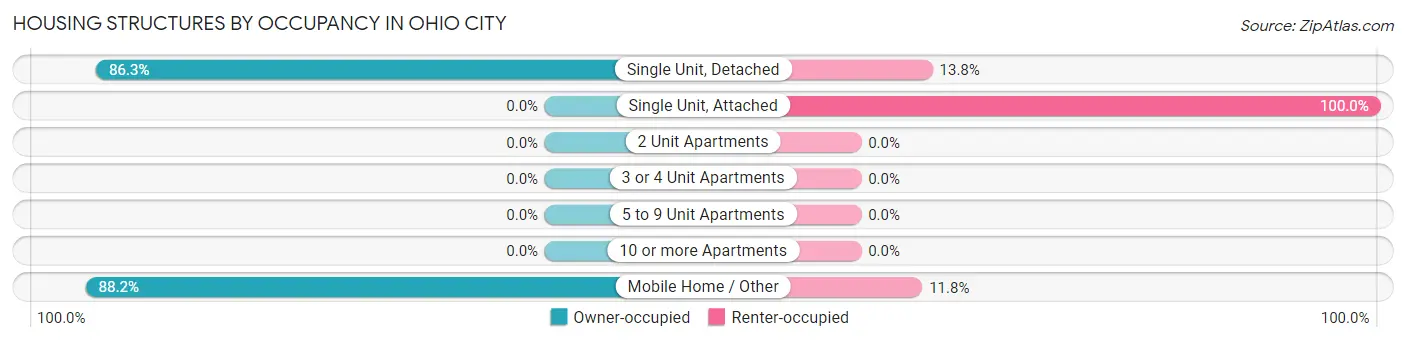
| Structure Type | Owner-occupied | Renter-occupied |
| Single Unit, Detached | 207 (86.3%) | 33 (13.8%) |
| Single Unit, Attached | 0 (0.0%) | 6 (100.0%) |
| 2 Unit Apartments | 0 (0.0%) | 0 (0.0%) |
| 3 or 4 Unit Apartments | 0 (0.0%) | 0 (0.0%) |
| 5 to 9 Unit Apartments | 0 (0.0%) | 0 (0.0%) |
| 10 or more Apartments | 0 (0.0%) | 0 (0.0%) |
| Mobile Home / Other | 30 (88.2%) | 4 (11.8%) |
| Total | 237 (84.6%) | 43 (15.4%) |
Housing Structures by Number of Rooms in Ohio City
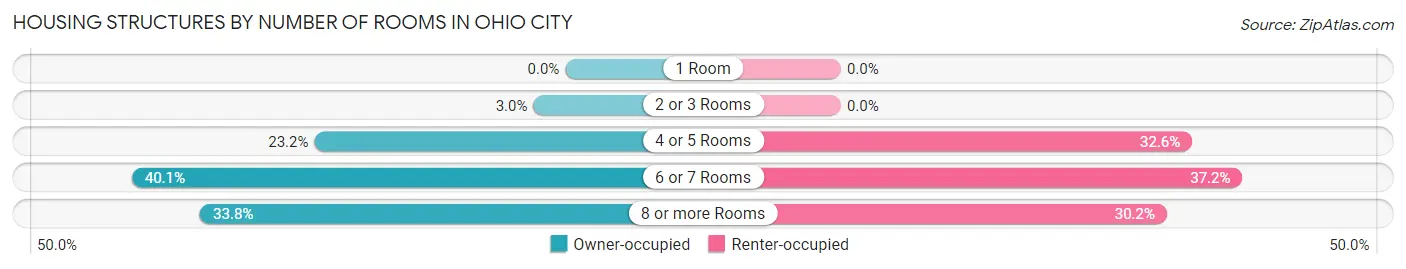
| Number of Rooms | Owner-occupied | Renter-occupied |
| 1 Room | 0 (0.0%) | 0 (0.0%) |
| 2 or 3 Rooms | 7 (2.9%) | 0 (0.0%) |
| 4 or 5 Rooms | 55 (23.2%) | 14 (32.6%) |
| 6 or 7 Rooms | 95 (40.1%) | 16 (37.2%) |
| 8 or more Rooms | 80 (33.8%) | 13 (30.2%) |
| Total | 237 (100.0%) | 43 (100.0%) |
Housing Structure by Heating Type in Ohio City
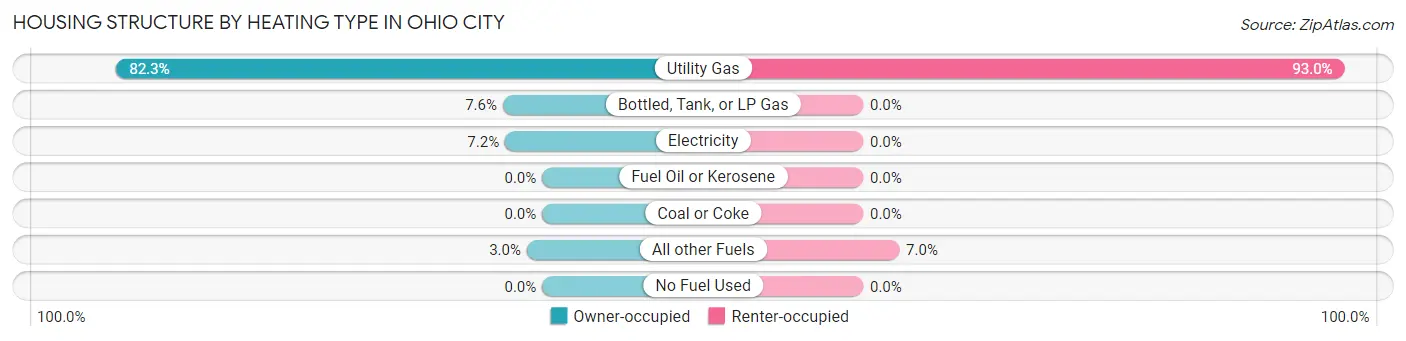
| Heating Type | Owner-occupied | Renter-occupied |
| Utility Gas | 195 (82.3%) | 40 (93.0%) |
| Bottled, Tank, or LP Gas | 18 (7.6%) | 0 (0.0%) |
| Electricity | 17 (7.2%) | 0 (0.0%) |
| Fuel Oil or Kerosene | 0 (0.0%) | 0 (0.0%) |
| Coal or Coke | 0 (0.0%) | 0 (0.0%) |
| All other Fuels | 7 (2.9%) | 3 (7.0%) |
| No Fuel Used | 0 (0.0%) | 0 (0.0%) |
| Total | 237 (100.0%) | 43 (100.0%) |
Household Vehicle Usage in Ohio City
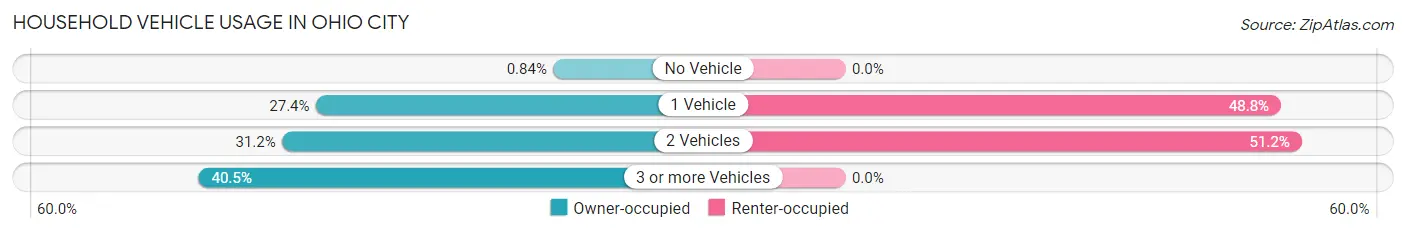
| Vehicles per Household | Owner-occupied | Renter-occupied |
| No Vehicle | 2 (0.8%) | 0 (0.0%) |
| 1 Vehicle | 65 (27.4%) | 21 (48.8%) |
| 2 Vehicles | 74 (31.2%) | 22 (51.2%) |
| 3 or more Vehicles | 96 (40.5%) | 0 (0.0%) |
| Total | 237 (100.0%) | 43 (100.0%) |
Real Estate & Mortgages in Ohio City
Real Estate and Mortgage Overview in Ohio City
| Characteristic | Without Mortgage | With Mortgage |
| Housing Units | 100 | 137 |
| Median Property Value | $67,000 | $101,700 |
| Median Household Income | $46,500 | $10 |
| Monthly Housing Costs | $431 | $0 |
| Real Estate Taxes | $872 | $15 |
Property Value by Mortgage Status in Ohio City
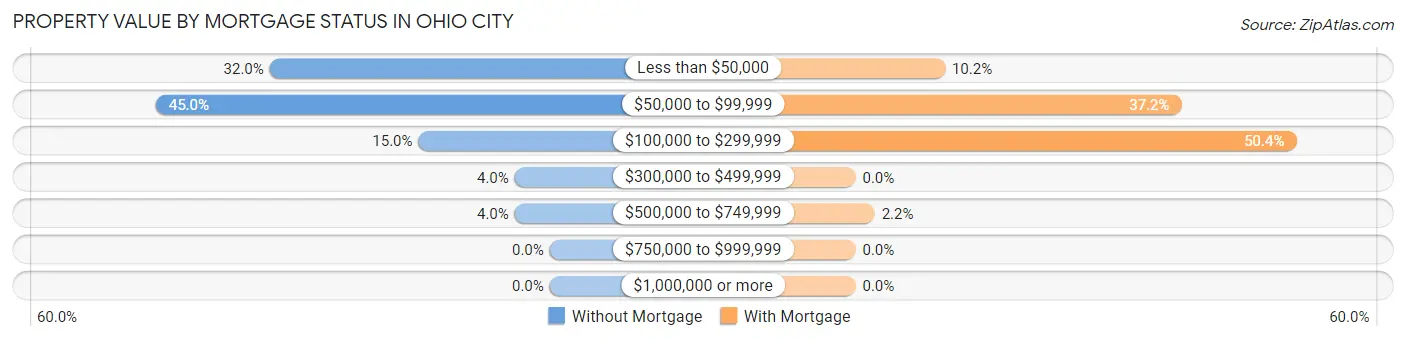
| Property Value | Without Mortgage | With Mortgage |
| Less than $50,000 | 32 (32.0%) | 14 (10.2%) |
| $50,000 to $99,999 | 45 (45.0%) | 51 (37.2%) |
| $100,000 to $299,999 | 15 (15.0%) | 69 (50.4%) |
| $300,000 to $499,999 | 4 (4.0%) | 0 (0.0%) |
| $500,000 to $749,999 | 4 (4.0%) | 3 (2.2%) |
| $750,000 to $999,999 | 0 (0.0%) | 0 (0.0%) |
| $1,000,000 or more | 0 (0.0%) | 0 (0.0%) |
| Total | 100 (100.0%) | 137 (100.0%) |
Household Income by Mortgage Status in Ohio City
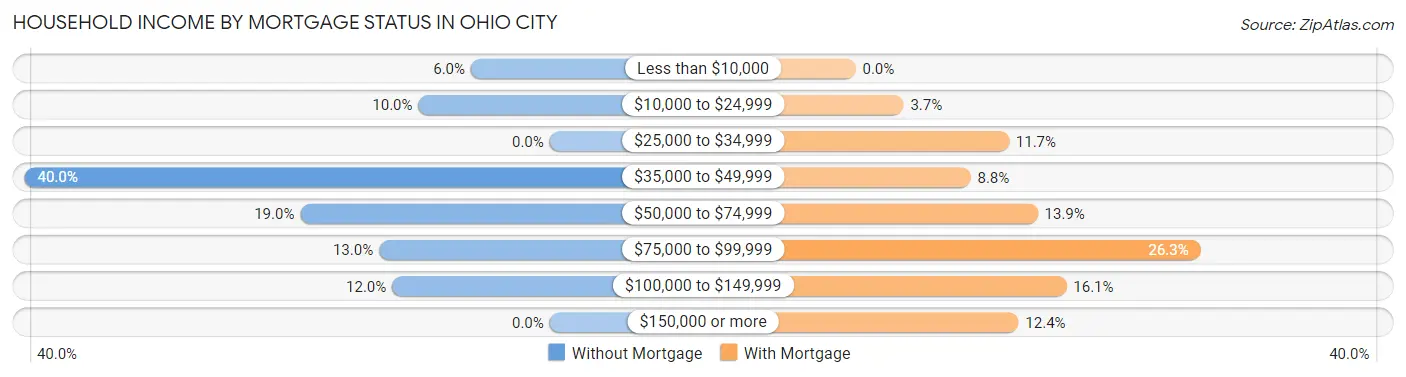
| Household Income | Without Mortgage | With Mortgage |
| Less than $10,000 | 6 (6.0%) | 0 (0.0%) |
| $10,000 to $24,999 | 10 (10.0%) | 5 (3.6%) |
| $25,000 to $34,999 | 0 (0.0%) | 16 (11.7%) |
| $35,000 to $49,999 | 40 (40.0%) | 12 (8.8%) |
| $50,000 to $74,999 | 19 (19.0%) | 19 (13.9%) |
| $75,000 to $99,999 | 13 (13.0%) | 36 (26.3%) |
| $100,000 to $149,999 | 12 (12.0%) | 22 (16.1%) |
| $150,000 or more | 0 (0.0%) | 17 (12.4%) |
| Total | 100 (100.0%) | 137 (100.0%) |
Property Value to Household Income Ratio in Ohio City
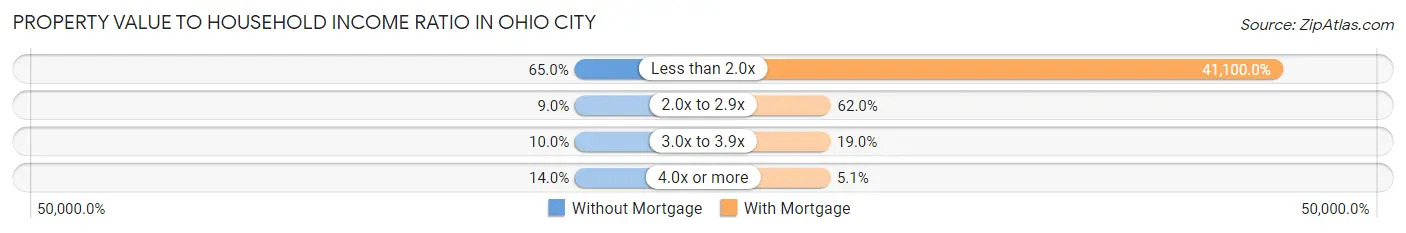
| Value-to-Income Ratio | Without Mortgage | With Mortgage |
| Less than 2.0x | 65 (65.0%) | 56,307 (41,100.0%) |
| 2.0x to 2.9x | 9 (9.0%) | 85 (62.0%) |
| 3.0x to 3.9x | 10 (10.0%) | 26 (19.0%) |
| 4.0x or more | 14 (14.0%) | 7 (5.1%) |
| Total | 100 (100.0%) | 137 (100.0%) |
Real Estate Taxes by Mortgage Status in Ohio City
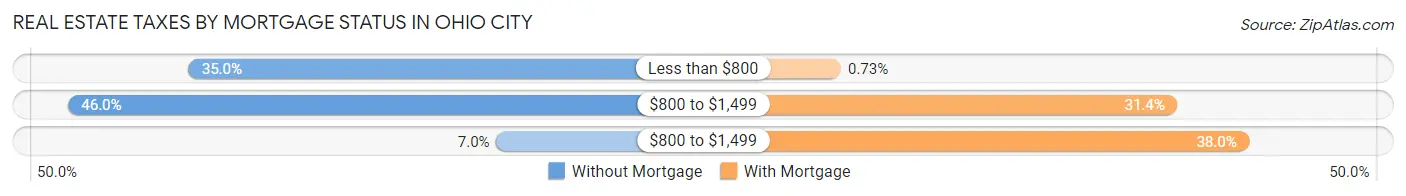
| Property Taxes | Without Mortgage | With Mortgage |
| Less than $800 | 35 (35.0%) | 1 (0.7%) |
| $800 to $1,499 | 46 (46.0%) | 43 (31.4%) |
| $800 to $1,499 | 7 (7.0%) | 52 (38.0%) |
| Total | 100 (100.0%) | 137 (100.0%) |
Health & Disability in Ohio City
Health Insurance Coverage by Age in Ohio City
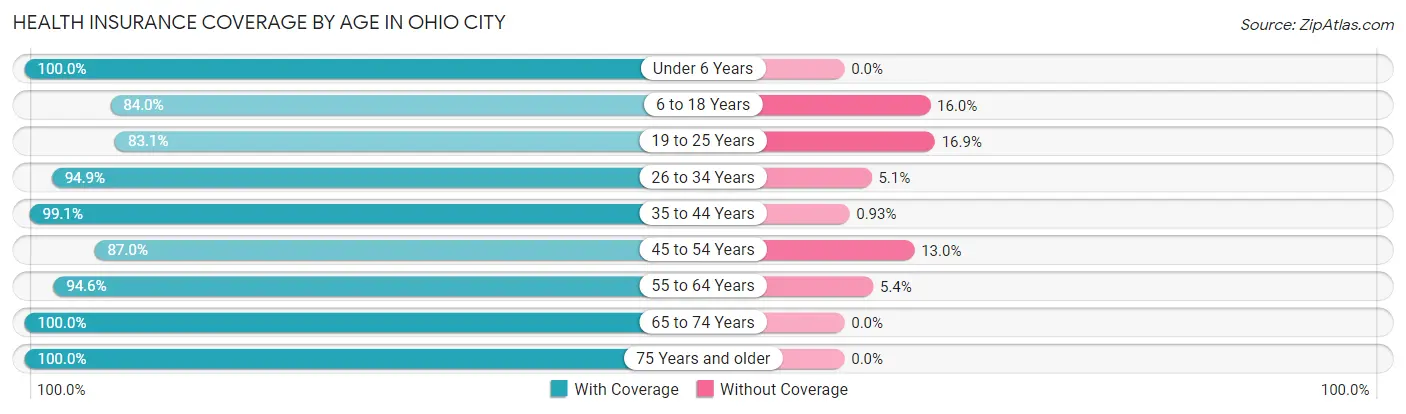
| Age Bracket | With Coverage | Without Coverage |
| Under 6 Years | 39 (100.0%) | 0 (0.0%) |
| 6 to 18 Years | 105 (84.0%) | 20 (16.0%) |
| 19 to 25 Years | 69 (83.1%) | 14 (16.9%) |
| 26 to 34 Years | 75 (94.9%) | 4 (5.1%) |
| 35 to 44 Years | 106 (99.1%) | 1 (0.9%) |
| 45 to 54 Years | 60 (87.0%) | 9 (13.0%) |
| 55 to 64 Years | 106 (94.6%) | 6 (5.4%) |
| 65 to 74 Years | 77 (100.0%) | 0 (0.0%) |
| 75 Years and older | 46 (100.0%) | 0 (0.0%) |
| Total | 683 (92.7%) | 54 (7.3%) |
Health Insurance Coverage by Citizenship Status in Ohio City
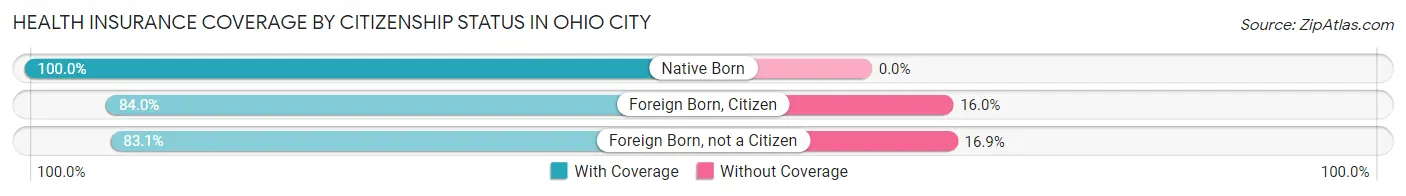
| Citizenship Status | With Coverage | Without Coverage |
| Native Born | 39 (100.0%) | 0 (0.0%) |
| Foreign Born, Citizen | 105 (84.0%) | 20 (16.0%) |
| Foreign Born, not a Citizen | 69 (83.1%) | 14 (16.9%) |
Health Insurance Coverage by Household Income in Ohio City
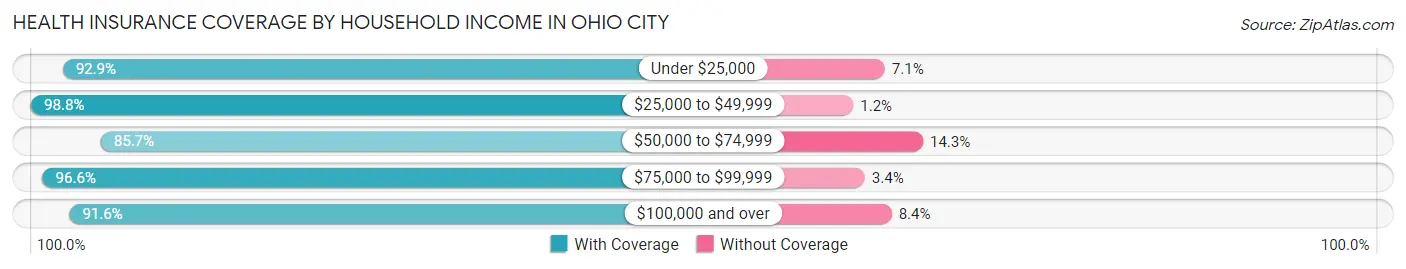
| Household Income | With Coverage | Without Coverage |
| Under $25,000 | 52 (92.9%) | 4 (7.1%) |
| $25,000 to $49,999 | 160 (98.8%) | 2 (1.2%) |
| $50,000 to $74,999 | 150 (85.7%) | 25 (14.3%) |
| $75,000 to $99,999 | 114 (96.6%) | 4 (3.4%) |
| $100,000 and over | 207 (91.6%) | 19 (8.4%) |
Public vs Private Health Insurance Coverage by Age in Ohio City
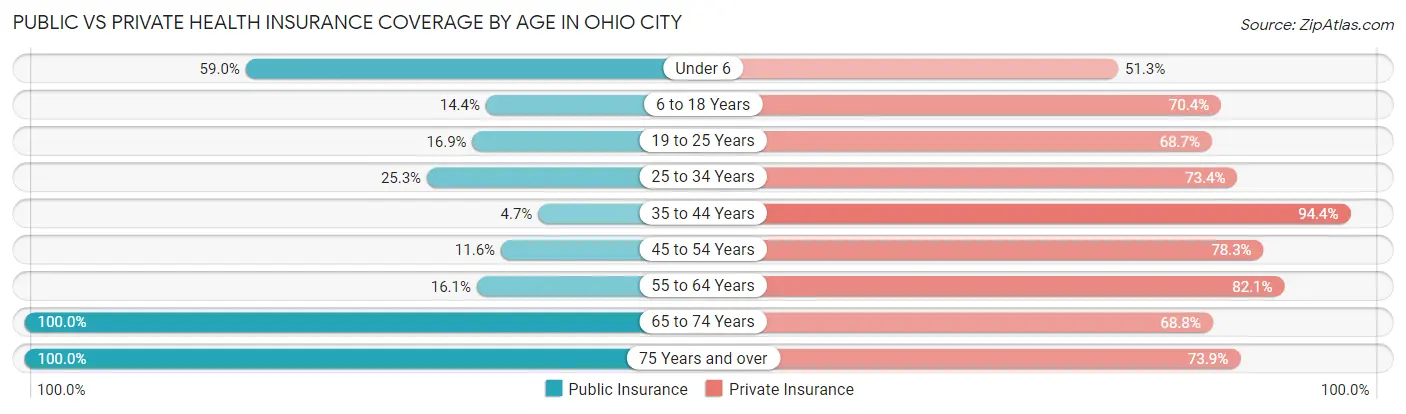
| Age Bracket | Public Insurance | Private Insurance |
| Under 6 | 23 (59.0%) | 20 (51.3%) |
| 6 to 18 Years | 18 (14.4%) | 88 (70.4%) |
| 19 to 25 Years | 14 (16.9%) | 57 (68.7%) |
| 25 to 34 Years | 20 (25.3%) | 58 (73.4%) |
| 35 to 44 Years | 5 (4.7%) | 101 (94.4%) |
| 45 to 54 Years | 8 (11.6%) | 54 (78.3%) |
| 55 to 64 Years | 18 (16.1%) | 92 (82.1%) |
| 65 to 74 Years | 77 (100.0%) | 53 (68.8%) |
| 75 Years and over | 46 (100.0%) | 34 (73.9%) |
| Total | 229 (31.1%) | 557 (75.6%) |
Disability Status by Sex by Age in Ohio City
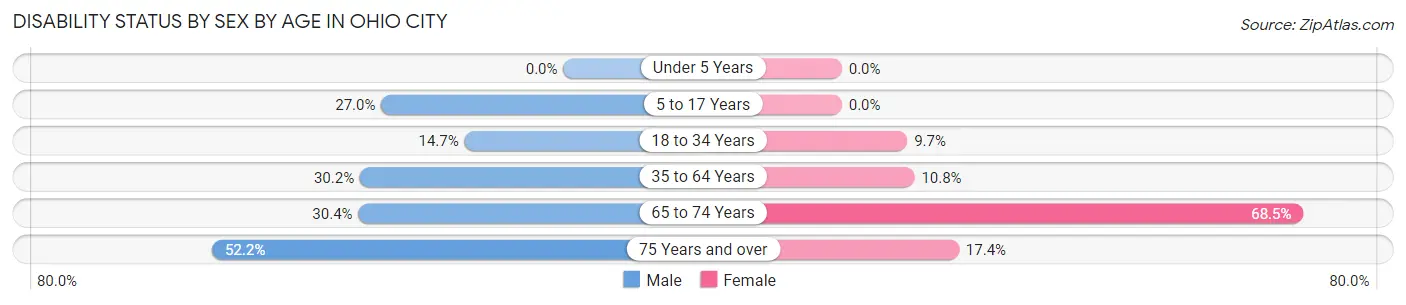
| Age Bracket | Male | Female |
| Under 5 Years | 0 (0.0%) | 0 (0.0%) |
| 5 to 17 Years | 20 (27.0%) | 0 (0.0%) |
| 18 to 34 Years | 11 (14.7%) | 10 (9.7%) |
| 35 to 64 Years | 45 (30.2%) | 15 (10.8%) |
| 65 to 74 Years | 7 (30.4%) | 37 (68.5%) |
| 75 Years and over | 12 (52.2%) | 4 (17.4%) |
Disability Class by Sex by Age in Ohio City
Disability Class: Hearing Difficulty
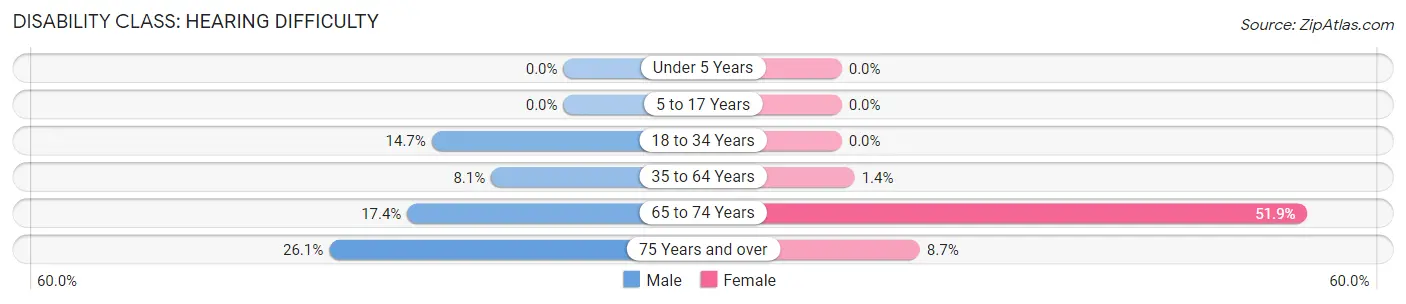
| Age Bracket | Male | Female |
| Under 5 Years | 0 (0.0%) | 0 (0.0%) |
| 5 to 17 Years | 0 (0.0%) | 0 (0.0%) |
| 18 to 34 Years | 11 (14.7%) | 0 (0.0%) |
| 35 to 64 Years | 12 (8.1%) | 2 (1.4%) |
| 65 to 74 Years | 4 (17.4%) | 28 (51.8%) |
| 75 Years and over | 6 (26.1%) | 2 (8.7%) |
Disability Class: Vision Difficulty
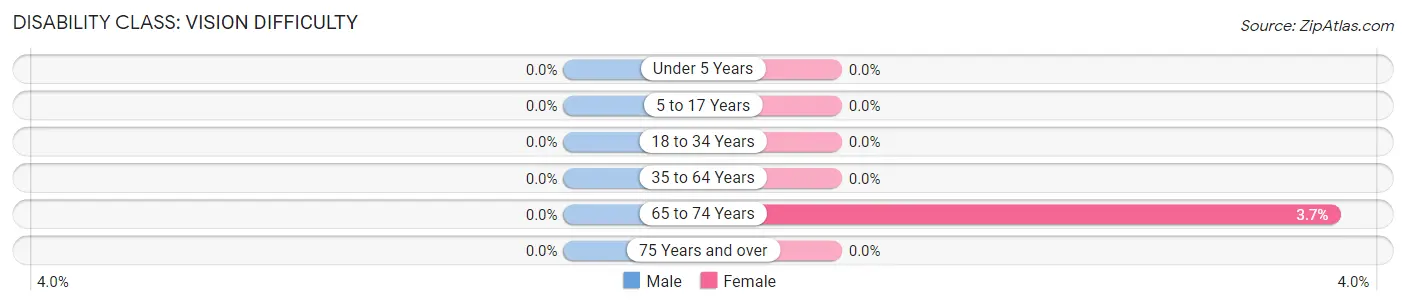
| Age Bracket | Male | Female |
| Under 5 Years | 0 (0.0%) | 0 (0.0%) |
| 5 to 17 Years | 0 (0.0%) | 0 (0.0%) |
| 18 to 34 Years | 0 (0.0%) | 0 (0.0%) |
| 35 to 64 Years | 0 (0.0%) | 0 (0.0%) |
| 65 to 74 Years | 0 (0.0%) | 2 (3.7%) |
| 75 Years and over | 0 (0.0%) | 0 (0.0%) |
Disability Class: Cognitive Difficulty
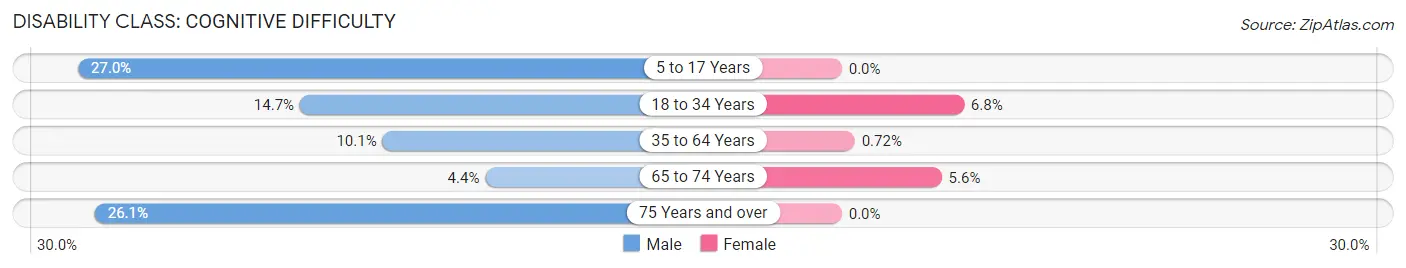
| Age Bracket | Male | Female |
| 5 to 17 Years | 20 (27.0%) | 0 (0.0%) |
| 18 to 34 Years | 11 (14.7%) | 7 (6.8%) |
| 35 to 64 Years | 15 (10.1%) | 1 (0.7%) |
| 65 to 74 Years | 1 (4.3%) | 3 (5.6%) |
| 75 Years and over | 6 (26.1%) | 0 (0.0%) |
Disability Class: Ambulatory Difficulty
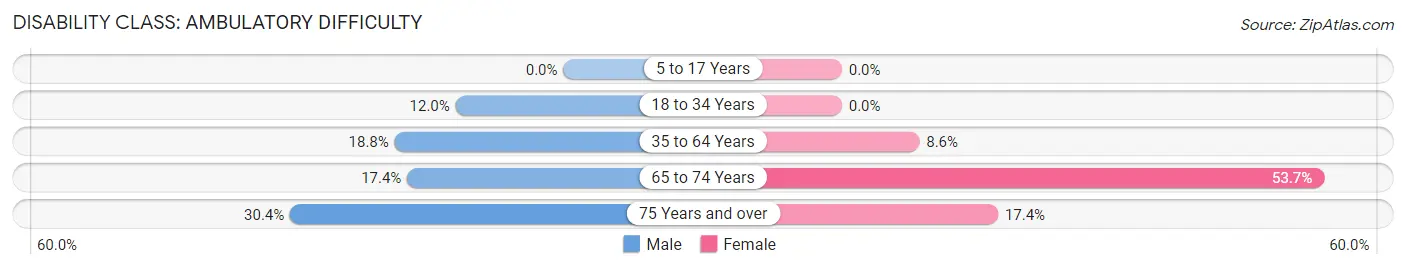
| Age Bracket | Male | Female |
| 5 to 17 Years | 0 (0.0%) | 0 (0.0%) |
| 18 to 34 Years | 9 (12.0%) | 0 (0.0%) |
| 35 to 64 Years | 28 (18.8%) | 12 (8.6%) |
| 65 to 74 Years | 4 (17.4%) | 29 (53.7%) |
| 75 Years and over | 7 (30.4%) | 4 (17.4%) |
Disability Class: Self-Care Difficulty
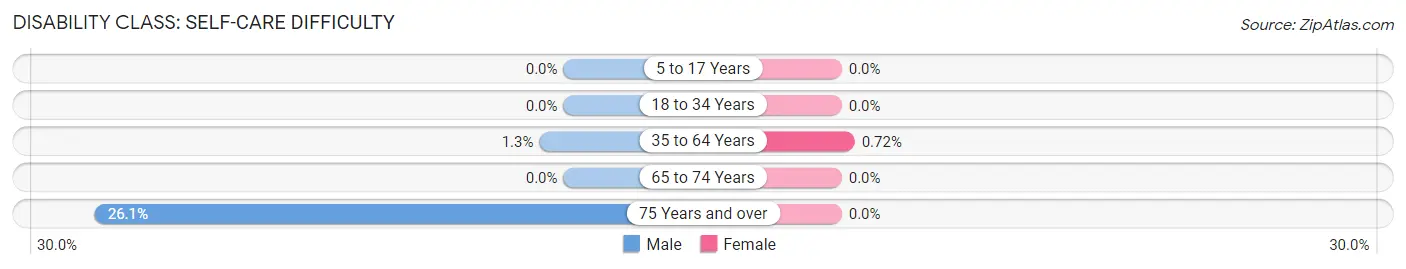
| Age Bracket | Male | Female |
| 5 to 17 Years | 0 (0.0%) | 0 (0.0%) |
| 18 to 34 Years | 0 (0.0%) | 0 (0.0%) |
| 35 to 64 Years | 2 (1.3%) | 1 (0.7%) |
| 65 to 74 Years | 0 (0.0%) | 0 (0.0%) |
| 75 Years and over | 6 (26.1%) | 0 (0.0%) |
Technology Access in Ohio City
Computing Device Access in Ohio City
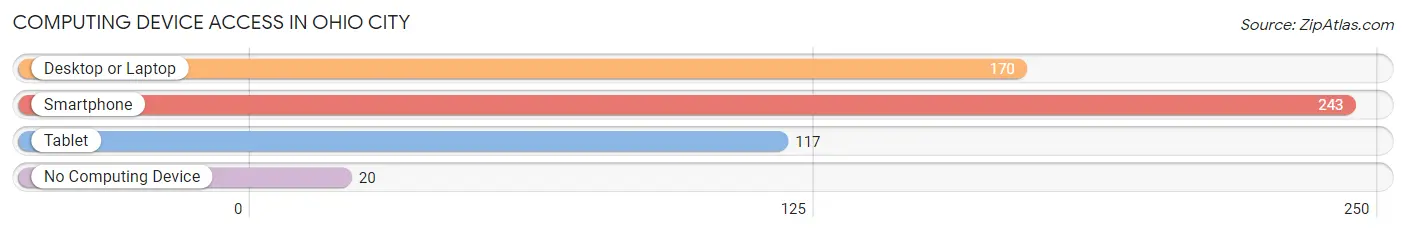
| Device Type | # Households | % Households |
| Desktop or Laptop | 170 | 60.7% |
| Smartphone | 243 | 86.8% |
| Tablet | 117 | 41.8% |
| No Computing Device | 20 | 7.1% |
| Total | 280 | 100.0% |
Internet Access in Ohio City
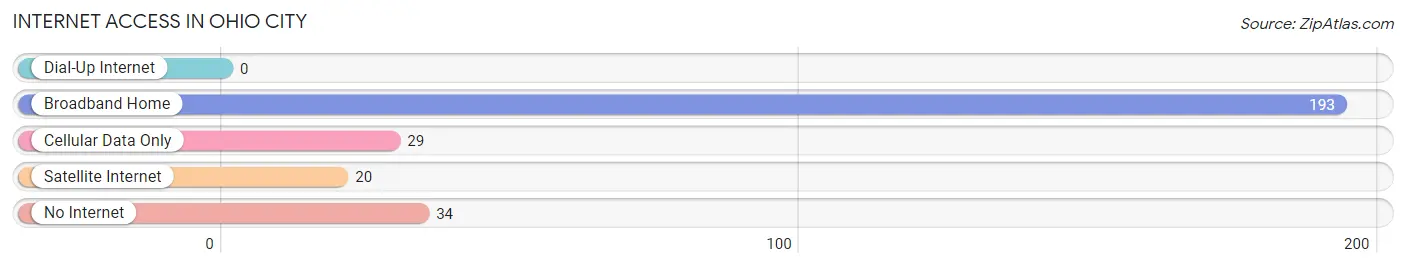
| Internet Type | # Households | % Households |
| Dial-Up Internet | 0 | 0.0% |
| Broadband Home | 193 | 68.9% |
| Cellular Data Only | 29 | 10.4% |
| Satellite Internet | 20 | 7.1% |
| No Internet | 34 | 12.1% |
| Total | 280 | 100.0% |
Ohio City Summary
Ohio City is a neighborhood located on the near west side of Cleveland, Ohio. It is bordered by the Cuyahoga River to the north, the Detroit-Superior Bridge to the east, and the Ohio and Erie Canal to the south. The neighborhood is home to a diverse population of approximately 8,000 people, and is known for its vibrant culture, unique architecture, and strong sense of community.
History
Ohio City was founded in 1836 by a group of settlers from Connecticut. The area was originally known as Bridgeport, and was part of the Connecticut Western Reserve. The settlers were attracted to the area due to its proximity to the Cuyahoga River, which provided access to the Great Lakes and the Ohio and Erie Canal. The canal was a major transportation route for goods and people, and helped to spur the growth of the area.
In the late 19th century, Ohio City became a major industrial center, with factories and warehouses lining the Cuyahoga River. The area was also home to a large number of immigrants, including Germans, Irish, and Poles. The influx of immigrants helped to shape the culture and character of the neighborhood.
In the early 20th century, Ohio City began to decline as industry moved away from the area. The neighborhood was further impacted by the construction of the Detroit-Superior Bridge in 1918, which cut off access to the Cuyahoga River. The area experienced a period of disinvestment and decline, and by the 1970s, the neighborhood was largely abandoned.
In the 1980s, Ohio City began to experience a resurgence. The area was designated as a historic district in 1983, and the Ohio City Near West Development Corporation was formed to help spur economic development. The organization was successful in attracting new businesses and residents to the area, and the neighborhood has since become a vibrant and diverse community.
Geography
Ohio City is located on the near west side of Cleveland, Ohio. It is bordered by the Cuyahoga River to the north, the Detroit-Superior Bridge to the east, and the Ohio and Erie Canal to the south. The neighborhood is located approximately 4 miles from downtown Cleveland, and is easily accessible via the Detroit-Superior Bridge.
The area is largely residential, with a mix of single-family homes, townhouses, and apartment buildings. The neighborhood is also home to a number of parks, including the Ohio City Farm, which is a community-run urban farm.
Economy
Ohio City is home to a diverse economy, with a mix of small businesses, restaurants, and retail stores. The neighborhood is also home to a number of cultural institutions, including the Cleveland Museum of Art, the Cleveland Public Library, and the Cleveland Institute of Art.
The area is also home to a number of breweries, including Great Lakes Brewing Company, Market Garden Brewery, and Platform Beer Co. The breweries have helped to spur economic development in the area, and have become popular destinations for locals and tourists alike.
Demographics
As of the 2010 census, Ohio City had a population of 8,000 people. The population is largely white (63%), with smaller percentages of African Americans (25%), Hispanics (7%), and Asians (3%). The median household income is $37,000, and the median home value is $150,000.
The area is home to a diverse population, with a mix of young professionals, families, and retirees. The neighborhood is known for its vibrant culture, unique architecture, and strong sense of community.
Common Questions
What is Per Capita Income in Ohio City?
Per Capita income in Ohio City is $24,870.
What is the Median Family Income in Ohio City?
Median Family Income in Ohio City is $56,080.
What is the Median Household income in Ohio City?
Median Household Income in Ohio City is $55,543.
What is Income or Wage Gap in Ohio City?
Income or Wage Gap in Ohio City is 64.3%.
Women in Ohio City earn 35.7 cents for every dollar earned by a man.
What is Family Income Deficit in Ohio City?
Family Income Deficit in Ohio City is $9,507.
Families that are below poverty line in Ohio City earn $9,507 less on average than the poverty threshold level.
What is Inequality or Gini Index in Ohio City?
Inequality or Gini Index in Ohio City is 0.34.
What is the Total Population of Ohio City?
Total Population of Ohio City is 737.
What is the Total Male Population of Ohio City?
Total Male Population of Ohio City is 359.
What is the Total Female Population of Ohio City?
Total Female Population of Ohio City is 378.
What is the Ratio of Males per 100 Females in Ohio City?
There are 94.97 Males per 100 Females in Ohio City.
What is the Ratio of Females per 100 Males in Ohio City?
There are 105.29 Females per 100 Males in Ohio City.
What is the Median Population Age in Ohio City?
Median Population Age in Ohio City is 39.2 Years.
What is the Average Family Size in Ohio City
Average Family Size in Ohio City is 3.0 People.
What is the Average Household Size in Ohio City
Average Household Size in Ohio City is 2.6 People.
How Large is the Labor Force in Ohio City?
There are 367 People in the Labor Forcein in Ohio City.
What is the Percentage of People in the Labor Force in Ohio City?
56.6% of People are in the Labor Force in Ohio City.
What is the Unemployment Rate in Ohio City?
Unemployment Rate in Ohio City is 1.1%.