Oak Harbor, OH Map & Demographics
Oak Harbor Map
Oak Harbor Overview
$33,911
PER CAPITA INCOME
$78,229
AVG FAMILY INCOME
$50,362
AVG HOUSEHOLD INCOME
27.2%
WAGE / INCOME GAP [ % ]
72.8¢/ $1
WAGE / INCOME GAP [ $ ]
0.42
INEQUALITY / GINI INDEX
2,521
TOTAL POPULATION
1,146
MALE POPULATION
1,375
FEMALE POPULATION
83.35
MALES / 100 FEMALES
119.98
FEMALES / 100 MALES
37.9
MEDIAN AGE
2.8
AVG FAMILY SIZE
2.0
AVG HOUSEHOLD SIZE
1,189
LABOR FORCE [ PEOPLE ]
57.2%
PERCENT IN LABOR FORCE
3.3%
UNEMPLOYMENT RATE
Oak Harbor Zip Codes
Income in Oak Harbor
Income Overview in Oak Harbor
Per Capita Income in Oak Harbor is $33,911, while median incomes of families and households are $78,229 and $50,362 respectively.
| Characteristic | Number | Measure |
| Per Capita Income | 2,521 | $33,911 |
| Median Family Income | 607 | $78,229 |
| Mean Family Income | 607 | $91,336 |
| Median Household Income | 1,239 | $50,362 |
| Mean Household Income | 1,239 | $68,624 |
| Income Deficit | 607 | $0 |
| Wage / Income Gap (%) | 2,521 | 27.23% |
| Wage / Income Gap ($) | 2,521 | 72.77¢ per $1 |
| Gini / Inequality Index | 2,521 | 0.42 |
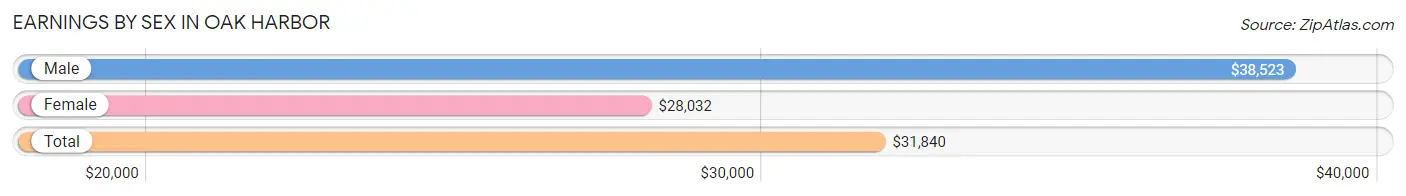
Earnings by Sex in Oak Harbor
Average Earnings in Oak Harbor are $31,840, $38,523 for men and $28,032 for women, a difference of 27.2%.
| Sex | Number | Average Earnings |
| Male | 643 (50.2%) | $38,523 |
| Female | 637 (49.8%) | $28,032 |
| Total | 1,280 (100.0%) | $31,840 |
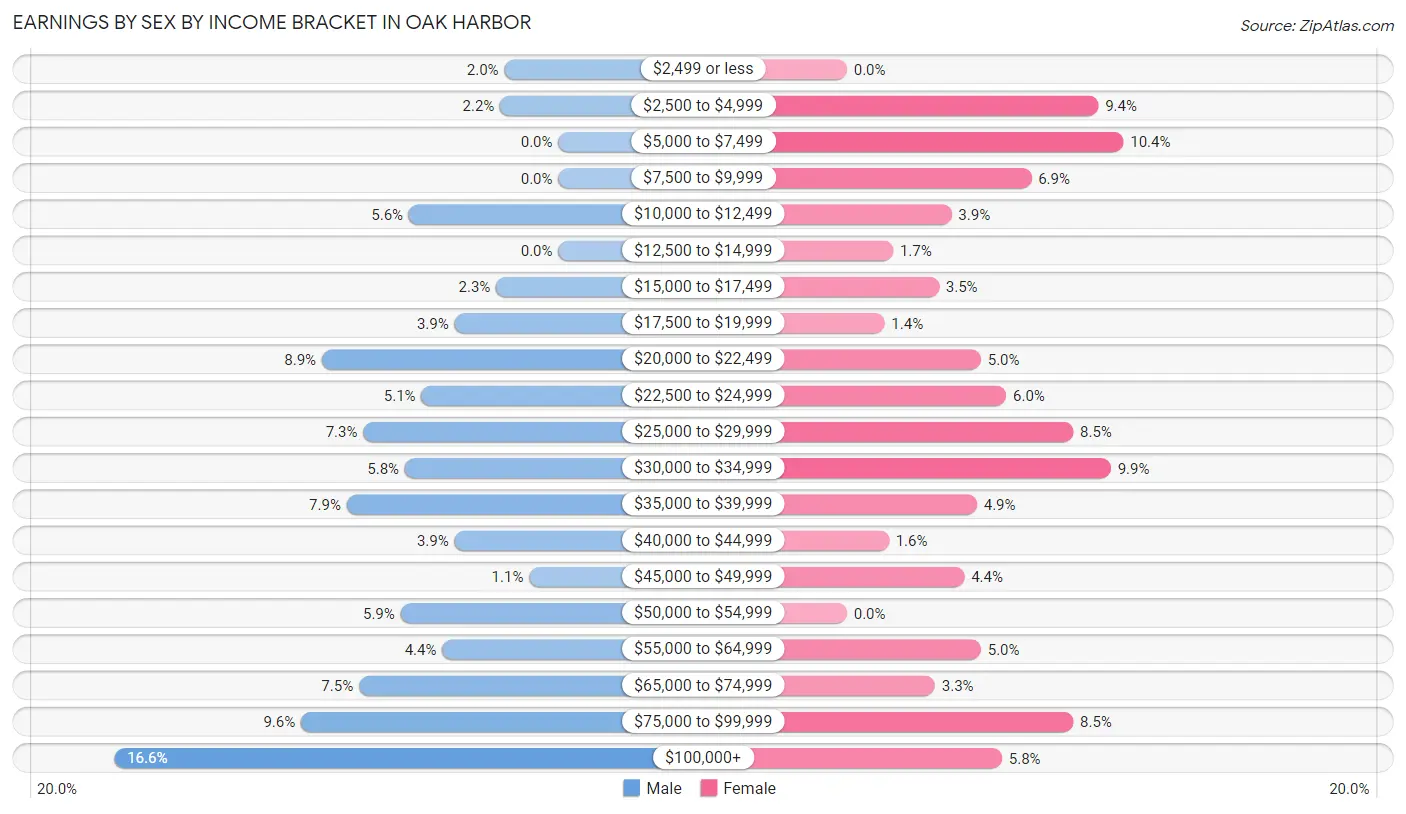
Earnings by Sex by Income Bracket in Oak Harbor
The most common earnings brackets in Oak Harbor are $100,000+ for men (107 | 16.6%) and $5,000 to $7,499 for women (66 | 10.4%).
| Income | Male | Female |
| $2,499 or less | 13 (2.0%) | 0 (0.0%) |
| $2,500 to $4,999 | 14 (2.2%) | 60 (9.4%) |
| $5,000 to $7,499 | 0 (0.0%) | 66 (10.4%) |
| $7,500 to $9,999 | 0 (0.0%) | 44 (6.9%) |
| $10,000 to $12,499 | 36 (5.6%) | 25 (3.9%) |
| $12,500 to $14,999 | 0 (0.0%) | 11 (1.7%) |
| $15,000 to $17,499 | 15 (2.3%) | 22 (3.5%) |
| $17,500 to $19,999 | 25 (3.9%) | 9 (1.4%) |
| $20,000 to $22,499 | 57 (8.9%) | 32 (5.0%) |
| $22,500 to $24,999 | 33 (5.1%) | 38 (6.0%) |
| $25,000 to $29,999 | 47 (7.3%) | 54 (8.5%) |
| $30,000 to $34,999 | 37 (5.8%) | 63 (9.9%) |
| $35,000 to $39,999 | 51 (7.9%) | 31 (4.9%) |
| $40,000 to $44,999 | 25 (3.9%) | 10 (1.6%) |
| $45,000 to $49,999 | 7 (1.1%) | 28 (4.4%) |
| $50,000 to $54,999 | 38 (5.9%) | 0 (0.0%) |
| $55,000 to $64,999 | 28 (4.3%) | 32 (5.0%) |
| $65,000 to $74,999 | 48 (7.5%) | 21 (3.3%) |
| $75,000 to $99,999 | 62 (9.6%) | 54 (8.5%) |
| $100,000+ | 107 (16.6%) | 37 (5.8%) |
| Total | 643 (100.0%) | 637 (100.0%) |
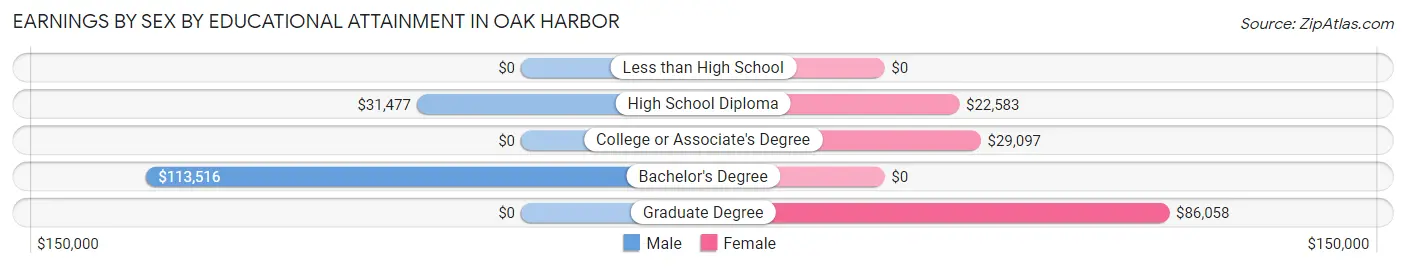
Earnings by Sex by Educational Attainment in Oak Harbor
Average earnings in Oak Harbor are $50,156 for men and $29,931 for women, a difference of 40.3%. Men with an educational attainment of bachelor's degree enjoy the highest average annual earnings of $113,516, while those with high school diploma education earn the least with $31,477. Women with an educational attainment of graduate degree earn the most with the average annual earnings of $86,058, while those with high school diploma education have the smallest earnings of $22,583.
| Educational Attainment | Male Income | Female Income |
| Less than High School | - | - |
| High School Diploma | $31,477 | $22,583 |
| College or Associate's Degree | - | - |
| Bachelor's Degree | $113,516 | $0 |
| Graduate Degree | - | - |
| Total | $50,156 | $29,931 |
Family Income in Oak Harbor
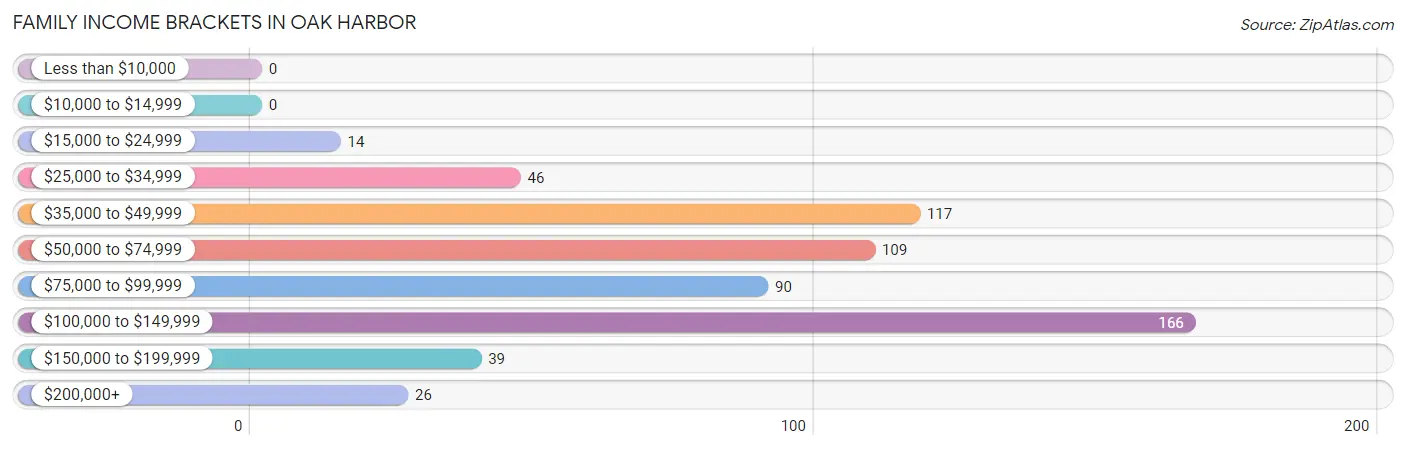
Family Income Brackets in Oak Harbor
According to the Oak Harbor family income data, there are 166 families falling into the $100,000 to $149,999 income range, which is the most common income bracket and makes up 27.4% of all families.
| Income Bracket | # Families | % Families |
| Less than $10,000 | 0 | 0.0% |
| $10,000 to $14,999 | 0 | 0.0% |
| $15,000 to $24,999 | 14 | 2.3% |
| $25,000 to $34,999 | 46 | 7.6% |
| $35,000 to $49,999 | 117 | 19.3% |
| $50,000 to $74,999 | 109 | 18.0% |
| $75,000 to $99,999 | 90 | 14.8% |
| $100,000 to $149,999 | 166 | 27.3% |
| $150,000 to $199,999 | 39 | 6.4% |
| $200,000+ | 26 | 4.3% |
Family Income by Famaliy Size in Oak Harbor
4-person families (50 | 8.2%) account for the highest median family income in Oak Harbor with $93,594 per family, while 2-person families (265 | 43.7%) have the highest median income of $44,262 per family member.
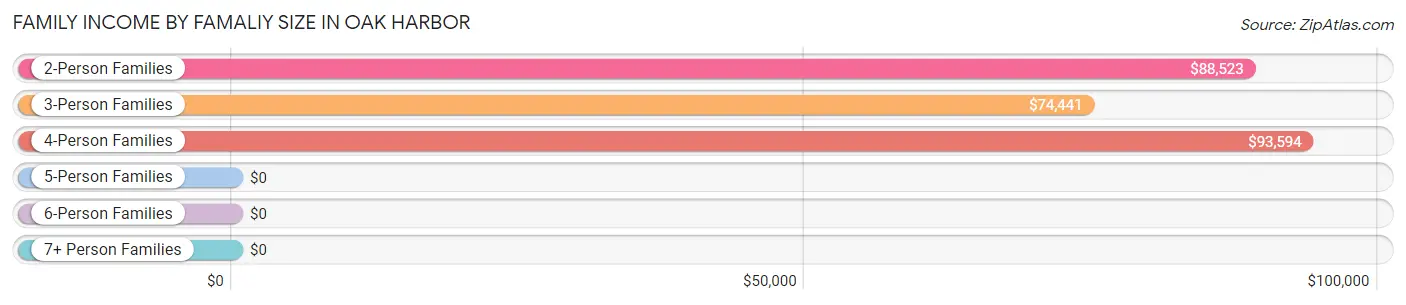
| Income Bracket | # Families | Median Income |
| 2-Person Families | 265 (43.7%) | $88,523 |
| 3-Person Families | 241 (39.7%) | $74,441 |
| 4-Person Families | 50 (8.2%) | $93,594 |
| 5-Person Families | 51 (8.4%) | $0 |
| 6-Person Families | 0 (0.0%) | $0 |
| 7+ Person Families | 0 (0.0%) | $0 |
| Total | 607 (100.0%) | $78,229 |
Family Income by Number of Earners in Oak Harbor
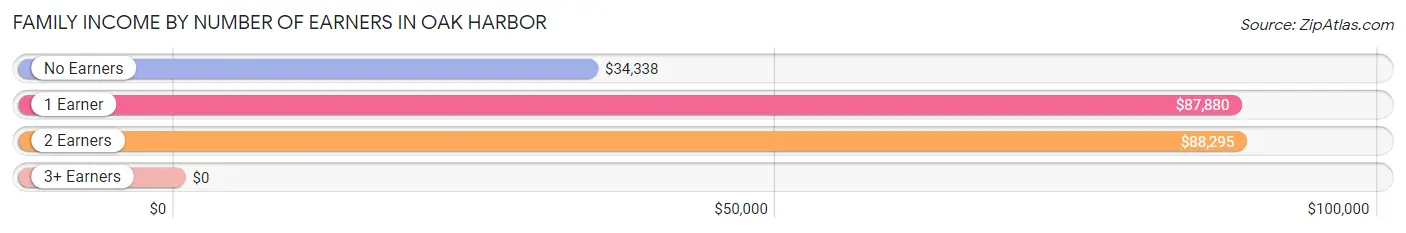
| Number of Earners | # Families | Median Income |
| No Earners | 63 (10.4%) | $34,338 |
| 1 Earner | 285 (46.9%) | $87,880 |
| 2 Earners | 213 (35.1%) | $88,295 |
| 3+ Earners | 46 (7.6%) | $0 |
| Total | 607 (100.0%) | $78,229 |
Household Income in Oak Harbor
Household Income Brackets in Oak Harbor
With 222 households falling in the category, the $100,000 to $149,999 income range is the most frequent in Oak Harbor, accounting for 17.9% of all households. In contrast, only 19 households (1.5%) fall into the less than $10,000 income bracket, making it the least populous group.

| Income Bracket | # Households | % Households |
| Less than $10,000 | 19 | 1.5% |
| $10,000 to $14,999 | 81 | 6.5% |
| $15,000 to $24,999 | 152 | 12.3% |
| $25,000 to $34,999 | 182 | 14.7% |
| $35,000 to $49,999 | 181 | 14.6% |
| $50,000 to $74,999 | 206 | 16.6% |
| $75,000 to $99,999 | 112 | 9.0% |
| $100,000 to $149,999 | 222 | 17.9% |
| $150,000 to $199,999 | 48 | 3.9% |
| $200,000+ | 38 | 3.1% |
Household Income by Householder Age in Oak Harbor
The median household income in Oak Harbor is $50,362, with the highest median household income of $73,618 found in the 25 to 44 years age bracket for the primary householder. A total of 376 households (30.3%) fall into this category. Meanwhile, the 15 to 24 years age bracket for the primary householder has the lowest median household income of $0, with 57 households (4.6%) in this group.
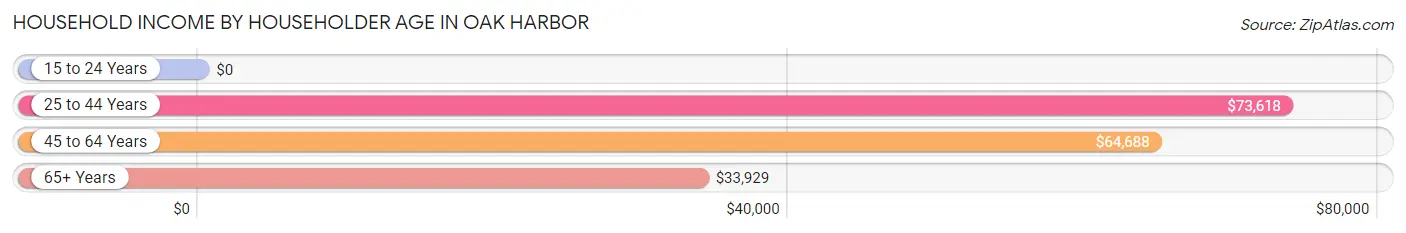
| Income Bracket | # Households | Median Income |
| 15 to 24 Years | 57 (4.6%) | $0 |
| 25 to 44 Years | 376 (30.3%) | $73,618 |
| 45 to 64 Years | 342 (27.6%) | $64,688 |
| 65+ Years | 464 (37.4%) | $33,929 |
| Total | 1,239 (100.0%) | $50,362 |
Poverty in Oak Harbor
Income Below Poverty by Sex and Age in Oak Harbor
With 3.4% poverty level for males and 9.5% for females among the residents of Oak Harbor, 12 to 14 year old males and 65 to 74 year old females are the most vulnerable to poverty, with 12 males (30.0%) and 59 females (24.0%) in their respective age groups living below the poverty level.
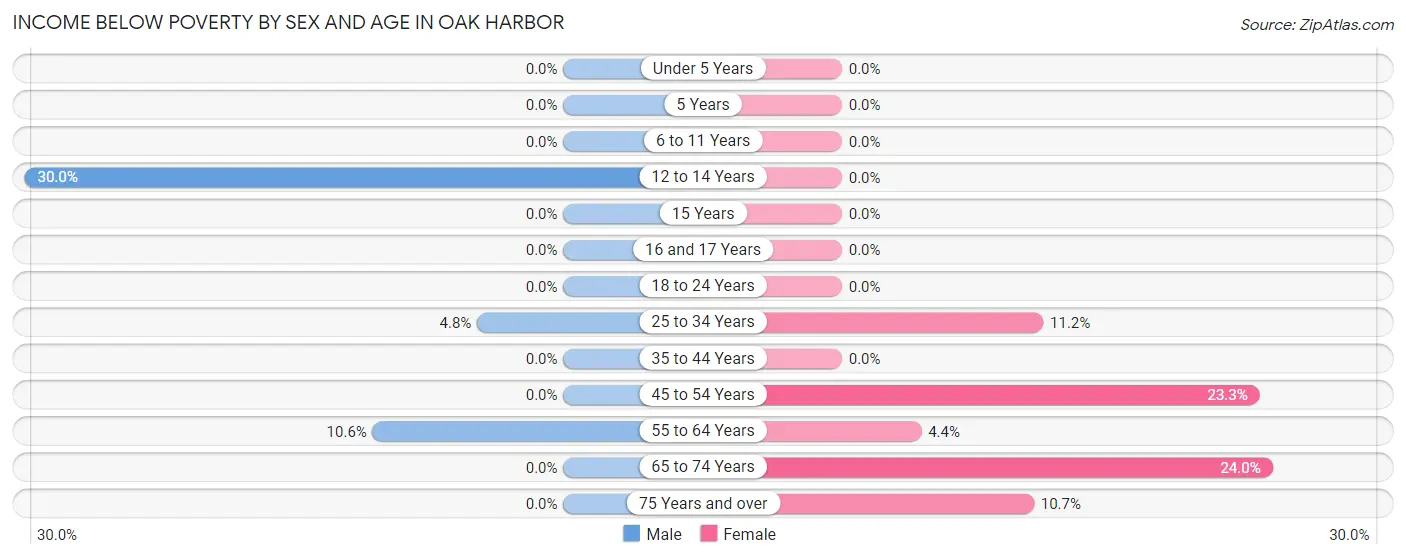
| Age Bracket | Male | Female |
| Under 5 Years | 0 (0.0%) | 0 (0.0%) |
| 5 Years | 0 (0.0%) | 0 (0.0%) |
| 6 to 11 Years | 0 (0.0%) | 0 (0.0%) |
| 12 to 14 Years | 12 (30.0%) | 0 (0.0%) |
| 15 Years | 0 (0.0%) | 0 (0.0%) |
| 16 and 17 Years | 0 (0.0%) | 0 (0.0%) |
| 18 to 24 Years | 0 (0.0%) | 0 (0.0%) |
| 25 to 34 Years | 13 (4.8%) | 24 (11.2%) |
| 35 to 44 Years | 0 (0.0%) | 0 (0.0%) |
| 45 to 54 Years | 0 (0.0%) | 20 (23.3%) |
| 55 to 64 Years | 12 (10.6%) | 11 (4.4%) |
| 65 to 74 Years | 0 (0.0%) | 59 (24.0%) |
| 75 Years and over | 0 (0.0%) | 17 (10.7%) |
| Total | 37 (3.4%) | 131 (9.5%) |
Income Above Poverty by Sex and Age in Oak Harbor
According to the poverty statistics in Oak Harbor, males aged under 5 years and females aged under 5 years are the age groups that are most secure financially, with 100.0% of males and 100.0% of females in these age groups living above the poverty line.
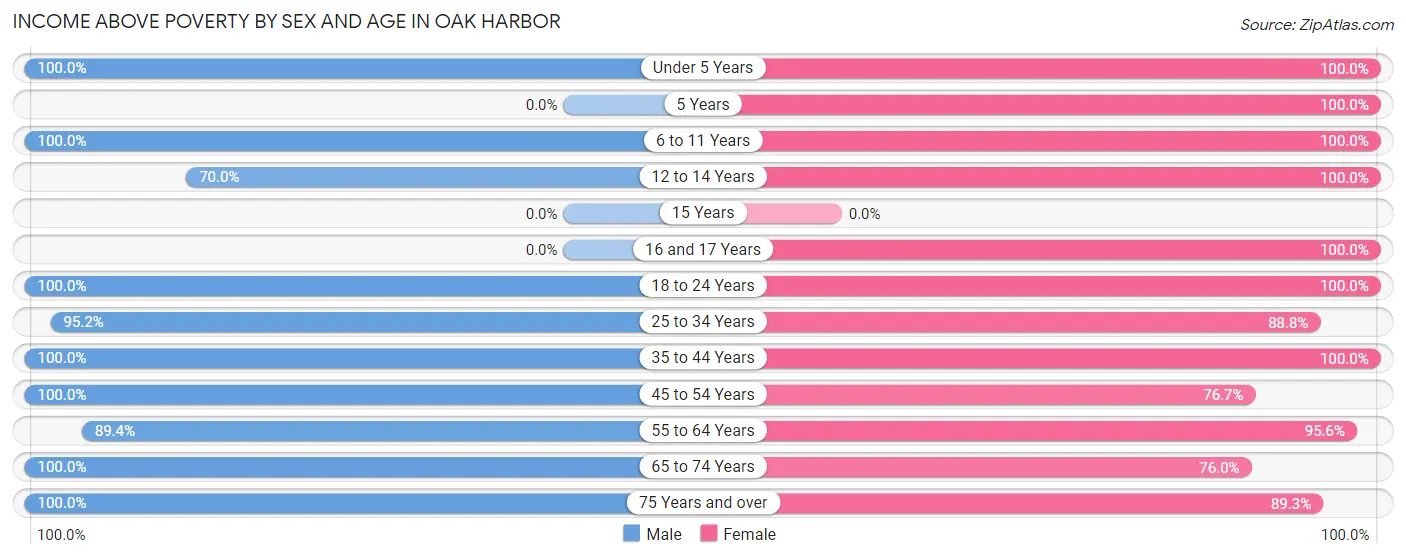
| Age Bracket | Male | Female |
| Under 5 Years | 102 (100.0%) | 41 (100.0%) |
| 5 Years | 0 (0.0%) | 26 (100.0%) |
| 6 to 11 Years | 61 (100.0%) | 85 (100.0%) |
| 12 to 14 Years | 28 (70.0%) | 42 (100.0%) |
| 15 Years | 0 (0.0%) | 0 (0.0%) |
| 16 and 17 Years | 0 (0.0%) | 28 (100.0%) |
| 18 to 24 Years | 79 (100.0%) | 121 (100.0%) |
| 25 to 34 Years | 258 (95.2%) | 190 (88.8%) |
| 35 to 44 Years | 147 (100.0%) | 78 (100.0%) |
| 45 to 54 Years | 90 (100.0%) | 66 (76.7%) |
| 55 to 64 Years | 101 (89.4%) | 238 (95.6%) |
| 65 to 74 Years | 82 (100.0%) | 187 (76.0%) |
| 75 Years and over | 116 (100.0%) | 142 (89.3%) |
| Total | 1,064 (96.6%) | 1,244 (90.5%) |
Income Below Poverty Among Married-Couple Families in Oak Harbor
| Children | Above Poverty | Below Poverty |
| No Children | 221 (100.0%) | 0 (0.0%) |
| 1 or 2 Children | 192 (100.0%) | 0 (0.0%) |
| 3 or 4 Children | 15 (100.0%) | 0 (0.0%) |
| 5 or more Children | 0 (0.0%) | 0 (0.0%) |
| Total | 428 (100.0%) | 0 (0.0%) |
Income Below Poverty Among Single-Parent Households in Oak Harbor
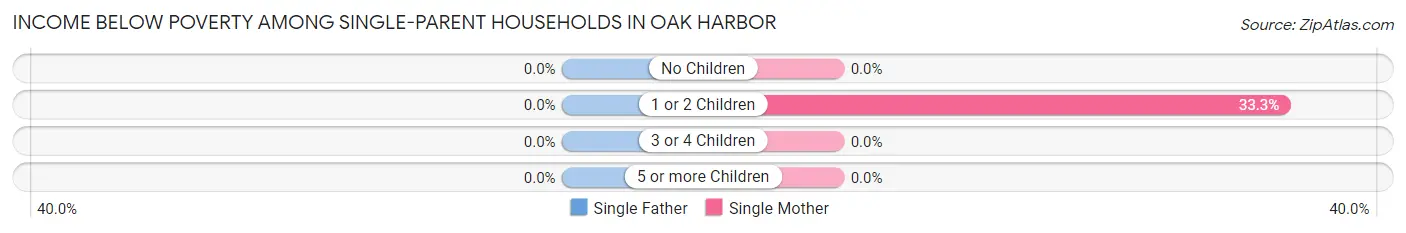
| Children | Single Father | Single Mother |
| No Children | 0 (0.0%) | 0 (0.0%) |
| 1 or 2 Children | 0 (0.0%) | 14 (33.3%) |
| 3 or 4 Children | 0 (0.0%) | 0 (0.0%) |
| 5 or more Children | 0 (0.0%) | 0 (0.0%) |
| Total | 0 (0.0%) | 14 (13.6%) |
Income Below Poverty Among Married-Couple vs Single-Parent Households in Oak Harbor
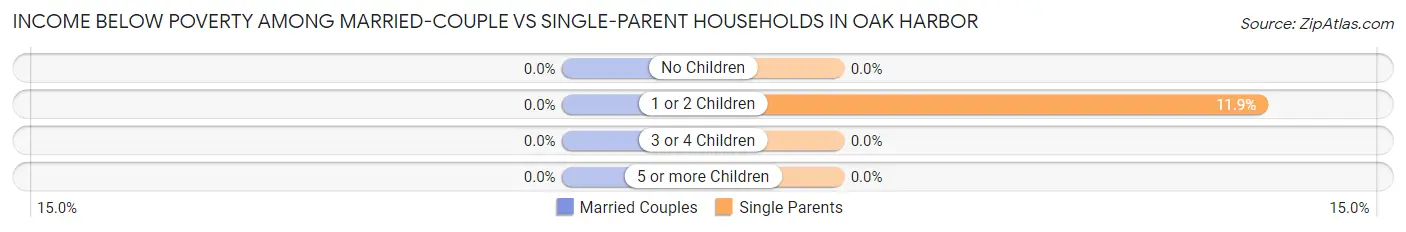
| Children | Married-Couple Families | Single-Parent Households |
| No Children | 0 (0.0%) | 0 (0.0%) |
| 1 or 2 Children | 0 (0.0%) | 14 (11.9%) |
| 3 or 4 Children | 0 (0.0%) | 0 (0.0%) |
| 5 or more Children | 0 (0.0%) | 0 (0.0%) |
| Total | 0 (0.0%) | 14 (7.8%) |
Race in Oak Harbor
The most populous races in Oak Harbor are White / Caucasian (2,457 | 97.5%), Hispanic or Latino (105 | 4.2%), and Asian (32 | 1.3%).
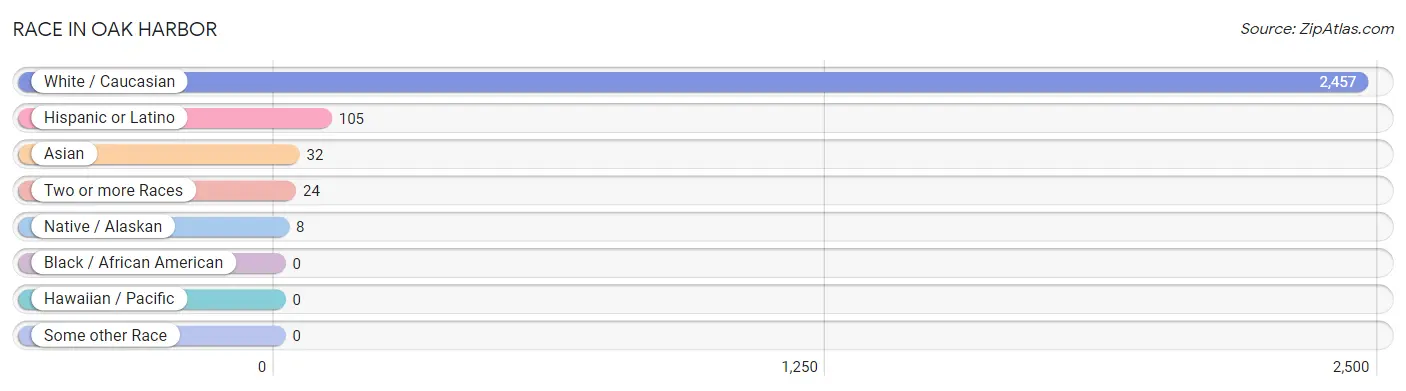
| Race | # Population | % Population |
| Asian | 32 | 1.3% |
| Black / African American | 0 | 0.0% |
| Hawaiian / Pacific | 0 | 0.0% |
| Hispanic or Latino | 105 | 4.2% |
| Native / Alaskan | 8 | 0.3% |
| White / Caucasian | 2,457 | 97.5% |
| Two or more Races | 24 | 0.9% |
| Some other Race | 0 | 0.0% |
| Total | 2,521 | 100.0% |
Ancestry in Oak Harbor
The most populous ancestries reported in Oak Harbor are German (865 | 34.3%), English (284 | 11.3%), American (201 | 8.0%), Irish (142 | 5.6%), and Mexican (105 | 4.2%), together accounting for 63.3% of all Oak Harbor residents.
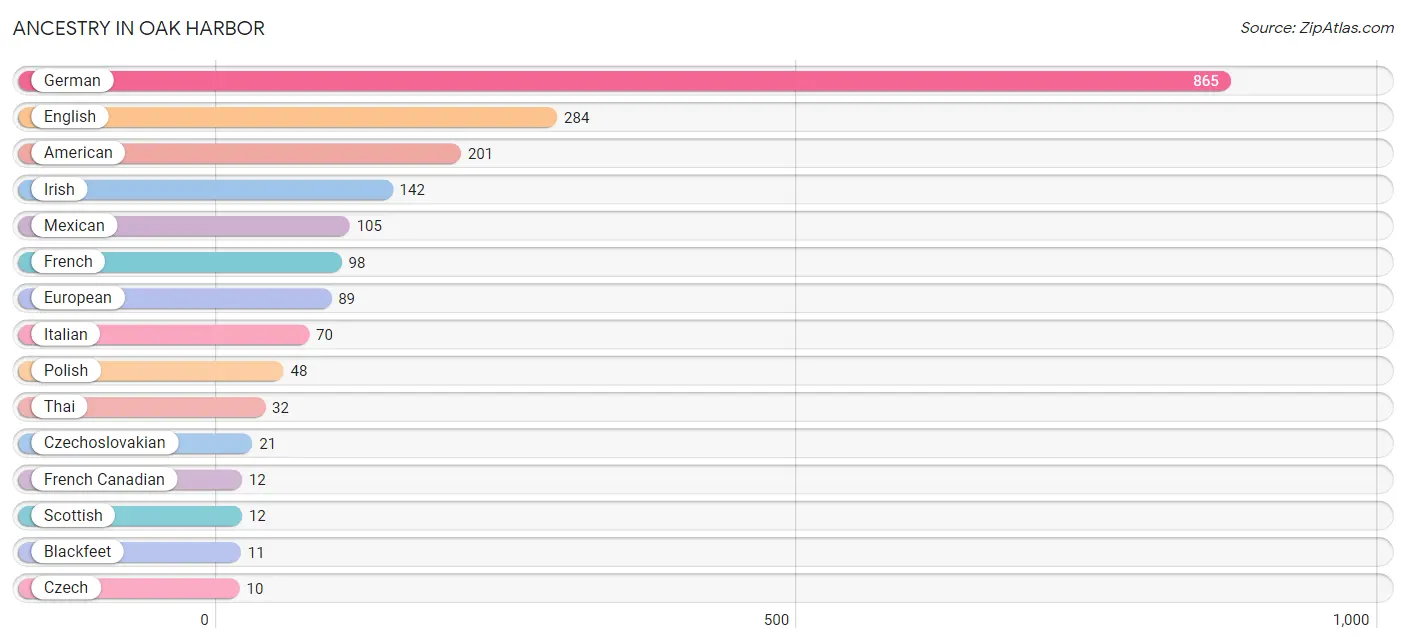
| Ancestry | # Population | % Population |
| American | 201 | 8.0% |
| Blackfeet | 11 | 0.4% |
| Czech | 10 | 0.4% |
| Czechoslovakian | 21 | 0.8% |
| Dutch | 10 | 0.4% |
| Eastern European | 9 | 0.4% |
| English | 284 | 11.3% |
| European | 89 | 3.5% |
| French | 98 | 3.9% |
| French Canadian | 12 | 0.5% |
| German | 865 | 34.3% |
| Hungarian | 8 | 0.3% |
| Irish | 142 | 5.6% |
| Italian | 70 | 2.8% |
| Mexican | 105 | 4.2% |
| Norwegian | 9 | 0.4% |
| Pennsylvania German | 9 | 0.4% |
| Polish | 48 | 1.9% |
| Scottish | 12 | 0.5% |
| Thai | 32 | 1.3% | View All 20 Rows |
Immigrants in Oak Harbor
The most numerous immigrant groups reported in Oak Harbor came from Asia (32 | 1.3%), India (32 | 1.3%), South Central Asia (32 | 1.3%), Europe (12 | 0.5%), and Germany (12 | 0.5%), together accounting for 4.8% of all Oak Harbor residents.
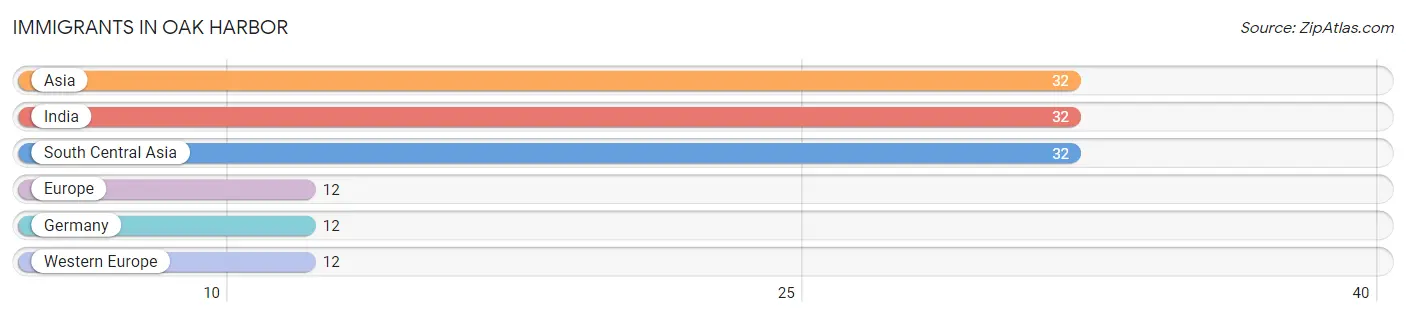
| Immigration Origin | # Population | % Population |
| Asia | 32 | 1.3% |
| Europe | 12 | 0.5% |
| Germany | 12 | 0.5% |
| India | 32 | 1.3% |
| South Central Asia | 32 | 1.3% |
| Western Europe | 12 | 0.5% | View All 6 Rows |
Sex and Age in Oak Harbor
Sex and Age in Oak Harbor
The most populous age groups in Oak Harbor are 30 to 34 Years (177 | 15.4%) for men and 60 to 64 Years (146 | 10.6%) for women.
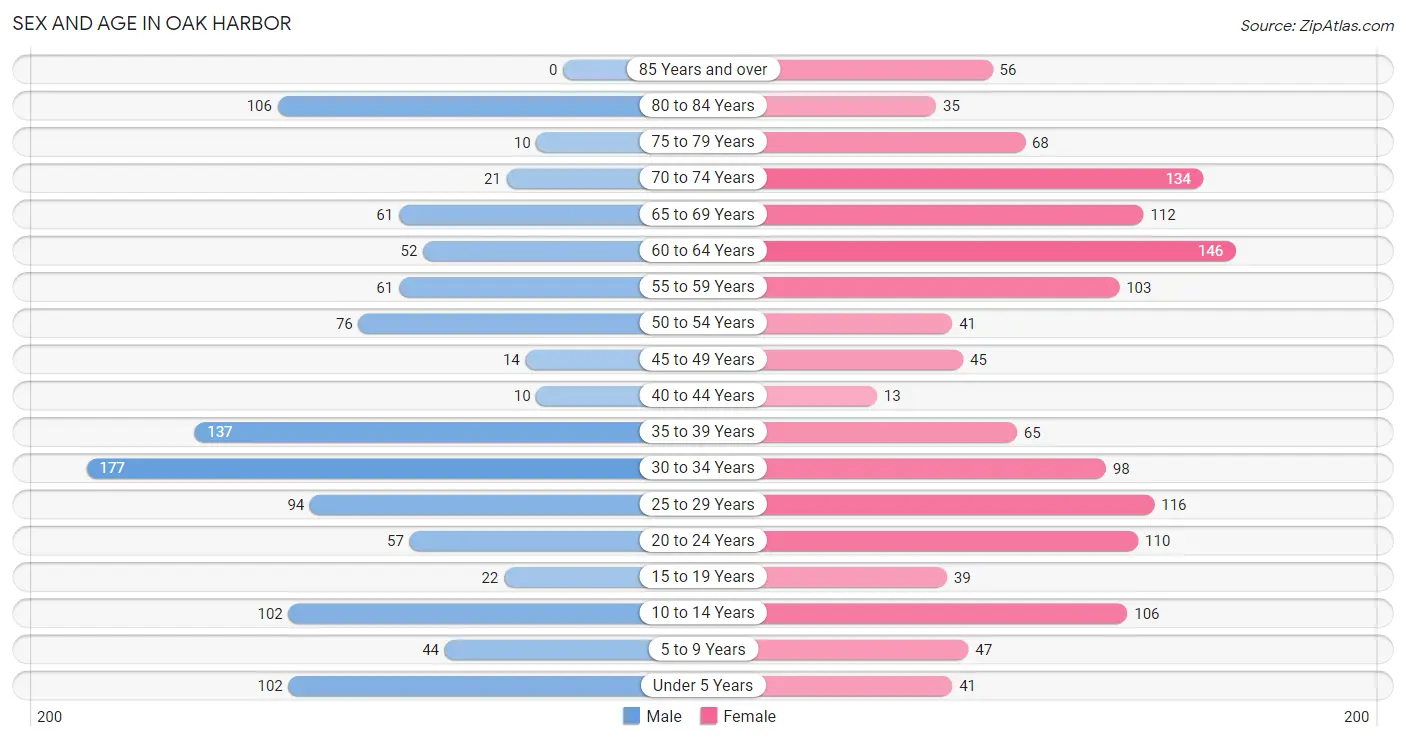
| Age Bracket | Male | Female |
| Under 5 Years | 102 (8.9%) | 41 (3.0%) |
| 5 to 9 Years | 44 (3.8%) | 47 (3.4%) |
| 10 to 14 Years | 102 (8.9%) | 106 (7.7%) |
| 15 to 19 Years | 22 (1.9%) | 39 (2.8%) |
| 20 to 24 Years | 57 (5.0%) | 110 (8.0%) |
| 25 to 29 Years | 94 (8.2%) | 116 (8.4%) |
| 30 to 34 Years | 177 (15.4%) | 98 (7.1%) |
| 35 to 39 Years | 137 (11.9%) | 65 (4.7%) |
| 40 to 44 Years | 10 (0.9%) | 13 (0.9%) |
| 45 to 49 Years | 14 (1.2%) | 45 (3.3%) |
| 50 to 54 Years | 76 (6.6%) | 41 (3.0%) |
| 55 to 59 Years | 61 (5.3%) | 103 (7.5%) |
| 60 to 64 Years | 52 (4.5%) | 146 (10.6%) |
| 65 to 69 Years | 61 (5.3%) | 112 (8.2%) |
| 70 to 74 Years | 21 (1.8%) | 134 (9.8%) |
| 75 to 79 Years | 10 (0.9%) | 68 (5.0%) |
| 80 to 84 Years | 106 (9.2%) | 35 (2.5%) |
| 85 Years and over | 0 (0.0%) | 56 (4.1%) |
| Total | 1,146 (100.0%) | 1,375 (100.0%) |
Families and Households in Oak Harbor
Median Family Size in Oak Harbor
The median family size in Oak Harbor is 2.84 persons per family, with married-couple families (428 | 70.5%) accounting for the largest median family size of 2.95 persons per family. On the other hand, single male/father families (76 | 12.5%) represent the smallest median family size with 2.58 persons per family.
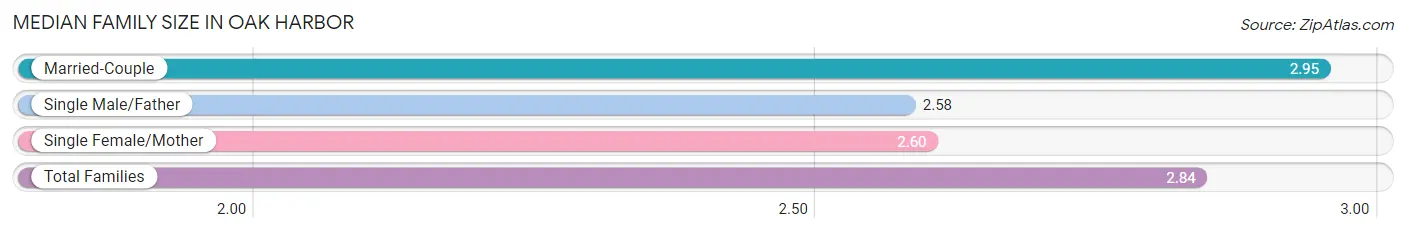
| Family Type | # Families | Family Size |
| Married-Couple | 428 (70.5%) | 2.95 |
| Single Male/Father | 76 (12.5%) | 2.58 |
| Single Female/Mother | 103 (17.0%) | 2.60 |
| Total Families | 607 (100.0%) | 2.84 |
Median Household Size in Oak Harbor
The median household size in Oak Harbor is 2.03 persons per household, with single male/father households (76 | 6.1%) accounting for the largest median household size of 3.17 persons per household. non-family households (632 | 51.0%) represent the smallest median household size with 1.17 persons per household.
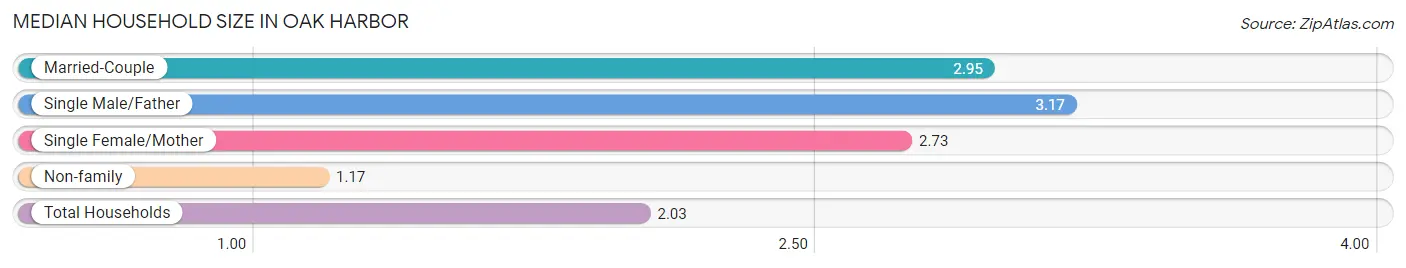
| Household Type | # Households | Household Size |
| Married-Couple | 428 (34.5%) | 2.95 |
| Single Male/Father | 76 (6.1%) | 3.17 |
| Single Female/Mother | 103 (8.3%) | 2.73 |
| Non-family | 632 (51.0%) | 1.17 |
| Total Households | 1,239 (100.0%) | 2.03 |
Household Size by Marriage Status in Oak Harbor
Out of a total of 1,239 households in Oak Harbor, 607 (49.0%) are family households, while 632 (51.0%) are nonfamily households. The most numerous type of family households are 3-person households, comprising 303, and the most common type of nonfamily households are 1-person households, comprising 530.
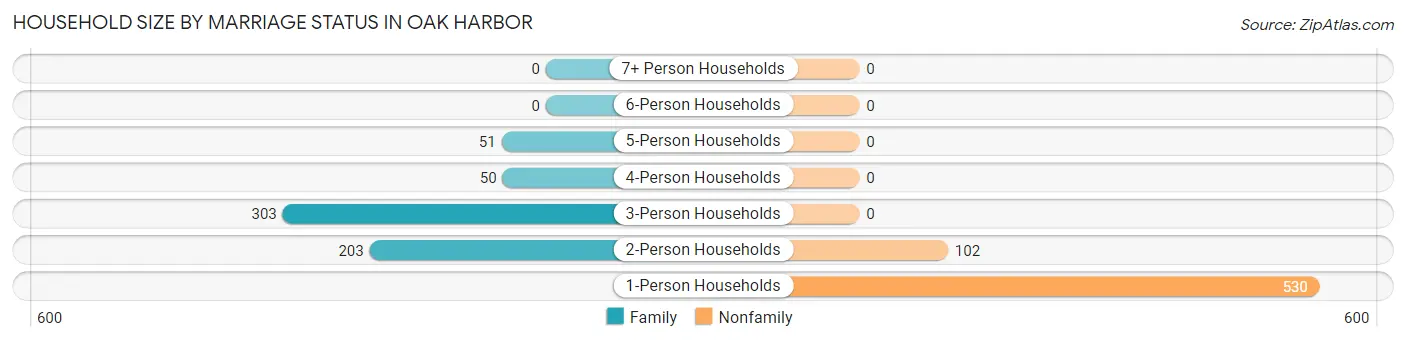
| Household Size | Family Households | Nonfamily Households |
| 1-Person Households | - | 530 (42.8%) |
| 2-Person Households | 203 (16.4%) | 102 (8.2%) |
| 3-Person Households | 303 (24.5%) | 0 (0.0%) |
| 4-Person Households | 50 (4.0%) | 0 (0.0%) |
| 5-Person Households | 51 (4.1%) | 0 (0.0%) |
| 6-Person Households | 0 (0.0%) | 0 (0.0%) |
| 7+ Person Households | 0 (0.0%) | 0 (0.0%) |
| Total | 607 (49.0%) | 632 (51.0%) |
Female Fertility in Oak Harbor
Fertility by Age in Oak Harbor
Average fertility rate in Oak Harbor is 165.0 births per 1,000 women. Women in the age bracket of 20 to 34 years have the highest fertility rate with 179.0 births per 1,000 women. Women in the age bracket of 20 to 34 years acount for 72.5% of all women with births.
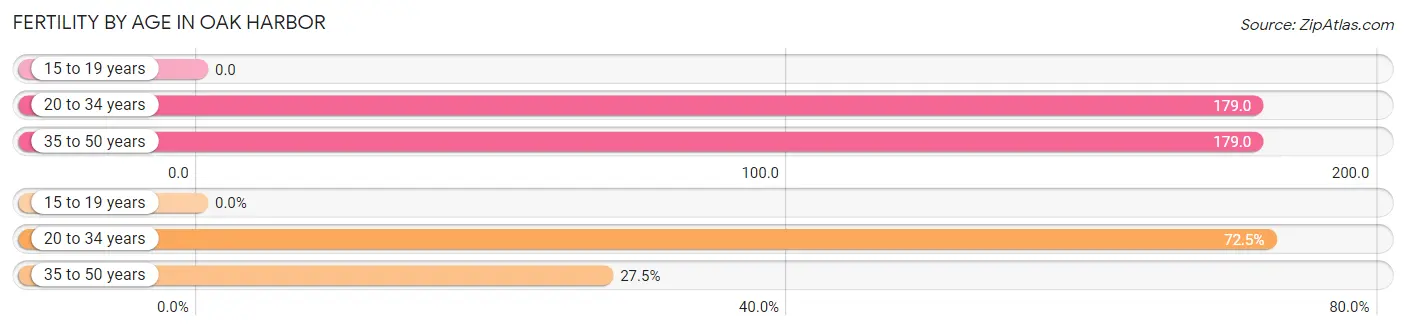
| Age Bracket | Women with Births | Births / 1,000 Women |
| 15 to 19 years | 0 (0.0%) | 0.0 |
| 20 to 34 years | 58 (72.5%) | 179.0 |
| 35 to 50 years | 22 (27.5%) | 179.0 |
| Total | 80 (100.0%) | 165.0 |
Fertility by Age by Marriage Status in Oak Harbor
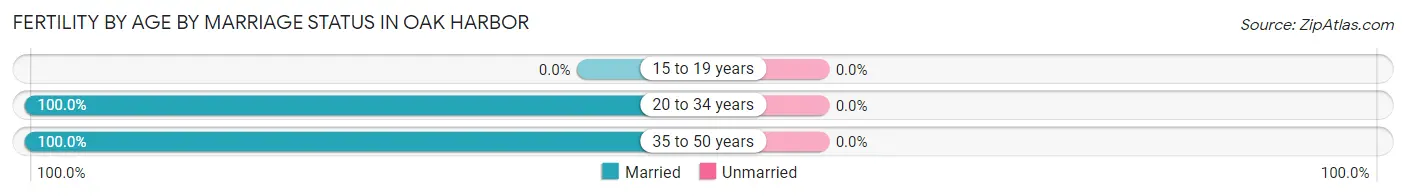
| Age Bracket | Married | Unmarried |
| 15 to 19 years | 0 (0.0%) | 0 (0.0%) |
| 20 to 34 years | 58 (100.0%) | 0 (0.0%) |
| 35 to 50 years | 22 (100.0%) | 0 (0.0%) |
| Total | 80 (100.0%) | 0 (0.0%) |
Fertility by Education in Oak Harbor
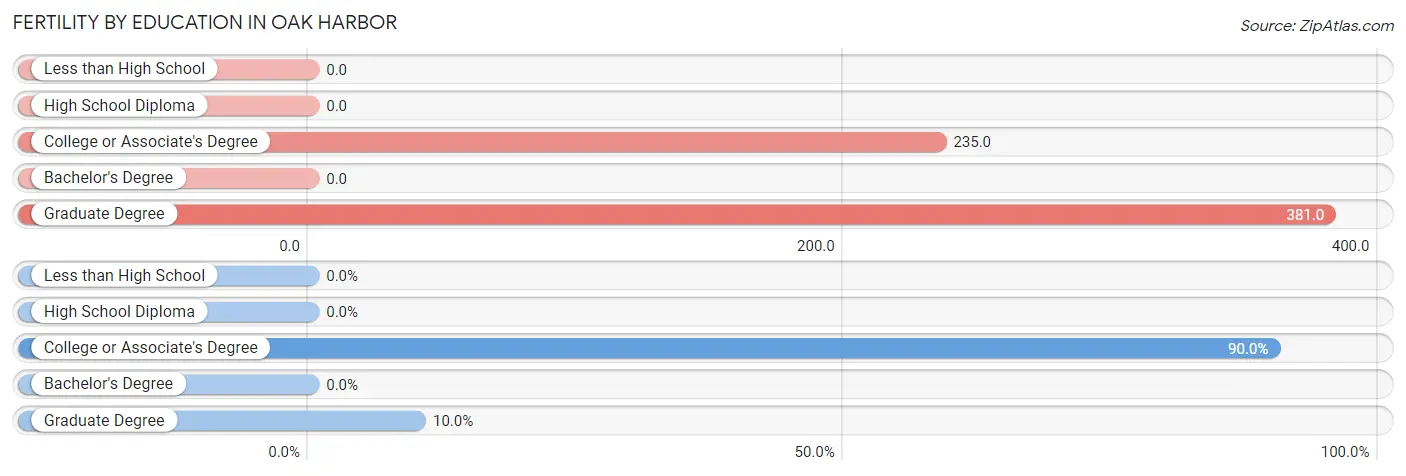
| Educational Attainment | Women with Births | Births / 1,000 Women |
| Less than High School | 0 (0.0%) | 0.0 |
| High School Diploma | 0 (0.0%) | 0.0 |
| College or Associate's Degree | 72 (90.0%) | 235.0 |
| Bachelor's Degree | 0 (0.0%) | 0.0 |
| Graduate Degree | 8 (10.0%) | 381.0 |
| Total | 80 (100.0%) | 165.0 |
Fertility by Education by Marriage Status in Oak Harbor
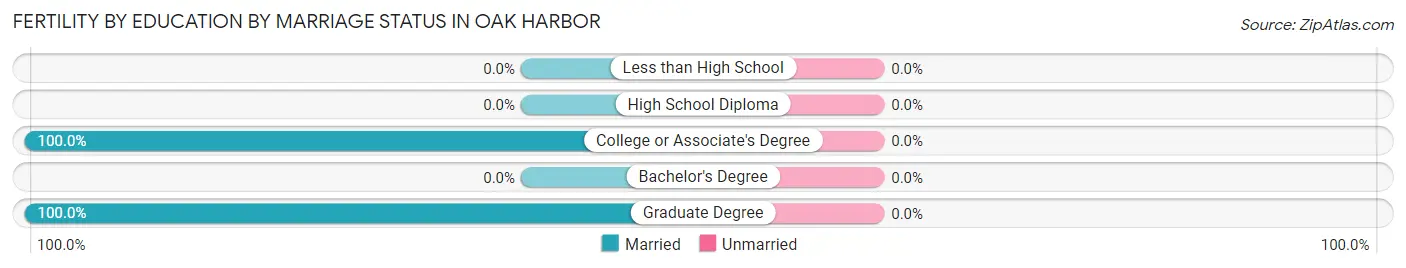
| Educational Attainment | Married | Unmarried |
| Less than High School | 0 (0.0%) | 0 (0.0%) |
| High School Diploma | 0 (0.0%) | 0 (0.0%) |
| College or Associate's Degree | 72 (100.0%) | 0 (0.0%) |
| Bachelor's Degree | 0 (0.0%) | 0 (0.0%) |
| Graduate Degree | 8 (100.0%) | 0 (0.0%) |
| Total | 80 (100.0%) | 0 (0.0%) |
Employment Characteristics in Oak Harbor
Employment by Class of Employer in Oak Harbor
Among the 1,057 employed individuals in Oak Harbor, private company employees (769 | 72.8%), not-for-profit organizations (107 | 10.1%), and local government employees (78 | 7.4%) make up the most common classes of employment.
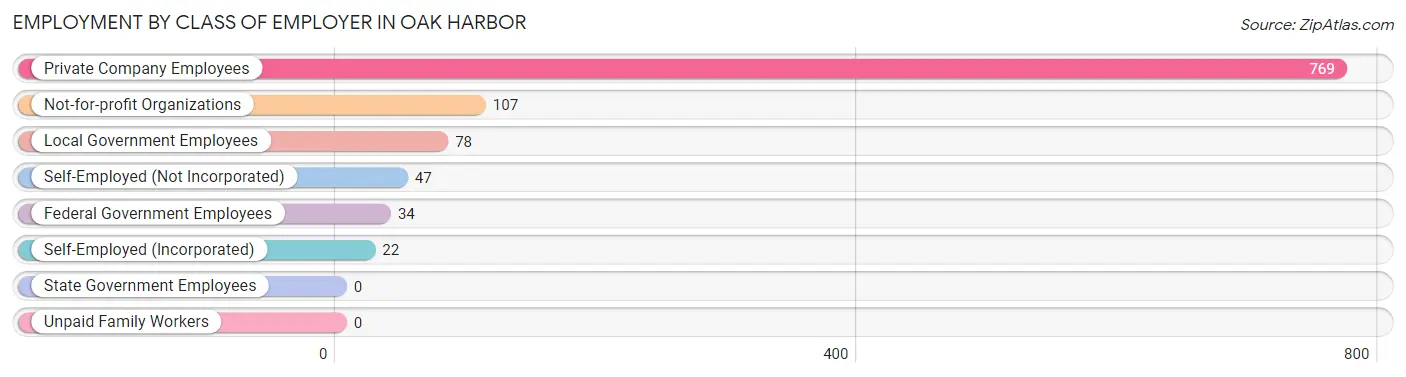
| Employer Class | # Employees | % Employees |
| Private Company Employees | 769 | 72.8% |
| Self-Employed (Incorporated) | 22 | 2.1% |
| Self-Employed (Not Incorporated) | 47 | 4.4% |
| Not-for-profit Organizations | 107 | 10.1% |
| Local Government Employees | 78 | 7.4% |
| State Government Employees | 0 | 0.0% |
| Federal Government Employees | 34 | 3.2% |
| Unpaid Family Workers | 0 | 0.0% |
| Total | 1,057 | 100.0% |
Employment Status by Age in Oak Harbor
According to the labor force statistics for Oak Harbor, out of the total population over 16 years of age (2,079), 57.2% or 1,189 individuals are in the labor force, with 3.3% or 39 of them unemployed. The age group with the highest labor force participation rate is 30 to 34 years, with 87.3% or 240 individuals in the labor force. Within the labor force, the 55 to 59 years age range has the highest percentage of unemployed individuals, with 10.1% or 11 of them being unemployed.
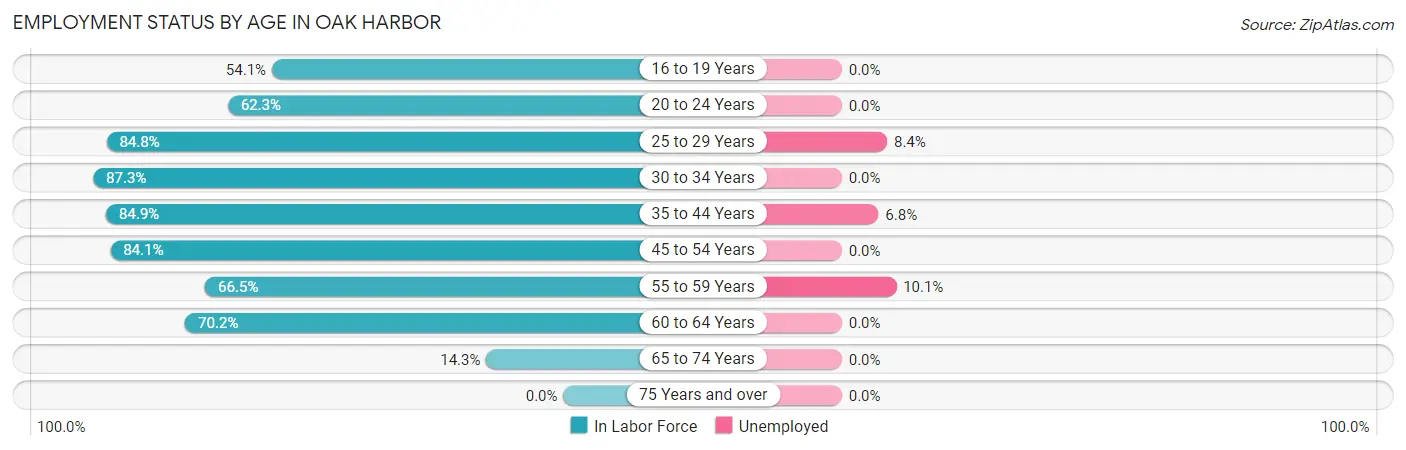
| Age Bracket | In Labor Force | Unemployed |
| 16 to 19 Years | 33 (54.1%) | 0 (0.0%) |
| 20 to 24 Years | 104 (62.3%) | 0 (0.0%) |
| 25 to 29 Years | 178 (84.8%) | 15 (8.4%) |
| 30 to 34 Years | 240 (87.3%) | 0 (0.0%) |
| 35 to 44 Years | 191 (84.9%) | 13 (6.8%) |
| 45 to 54 Years | 148 (84.1%) | 0 (0.0%) |
| 55 to 59 Years | 109 (66.5%) | 11 (10.1%) |
| 60 to 64 Years | 139 (70.2%) | 0 (0.0%) |
| 65 to 74 Years | 47 (14.3%) | 0 (0.0%) |
| 75 Years and over | 0 (0.0%) | 0 (0.0%) |
| Total | 1,189 (57.2%) | 39 (3.3%) |
Employment Status by Educational Attainment in Oak Harbor
According to labor force statistics for Oak Harbor, 80.5% of individuals (1,005) out of the total population between 25 and 64 years of age (1,248) are in the labor force, with 3.9% or 39 of them being unemployed. The group with the highest labor force participation rate are those with the educational attainment of less than high school, with 100.0% or 14 individuals in the labor force. Within the labor force, individuals with high school diploma education have the highest percentage of unemployment, with 5.6% or 11 of them being unemployed.
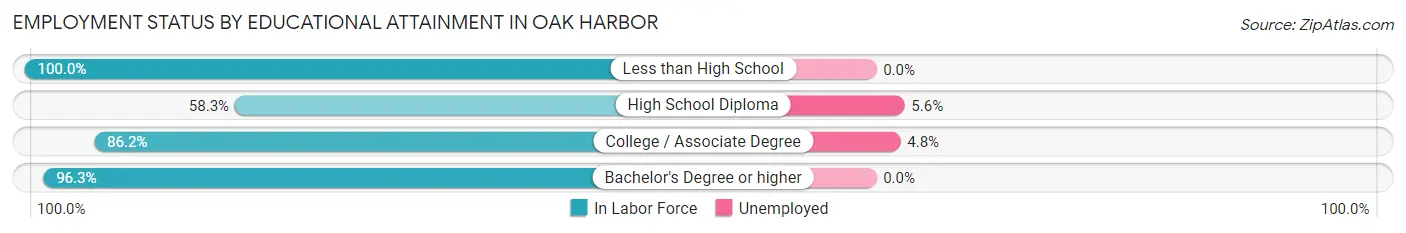
| Educational Attainment | In Labor Force | Unemployed |
| Less than High School | 14 (100.0%) | 0 (0.0%) |
| High School Diploma | 197 (58.3%) | 19 (5.6%) |
| College / Associate Degree | 588 (86.2%) | 33 (4.8%) |
| Bachelor's Degree or higher | 206 (96.3%) | 0 (0.0%) |
| Total | 1,005 (80.5%) | 49 (3.9%) |
Employment Occupations by Sex in Oak Harbor
Management, Business, Science and Arts Occupations
The most common Management, Business, Science and Arts occupations in Oak Harbor are Management (141 | 12.3%), Computers, Engineering & Science (95 | 8.3%), Health Diagnosing & Treating (95 | 8.3%), Business & Financial (70 | 6.1%), and Architecture & Engineering (57 | 5.0%).
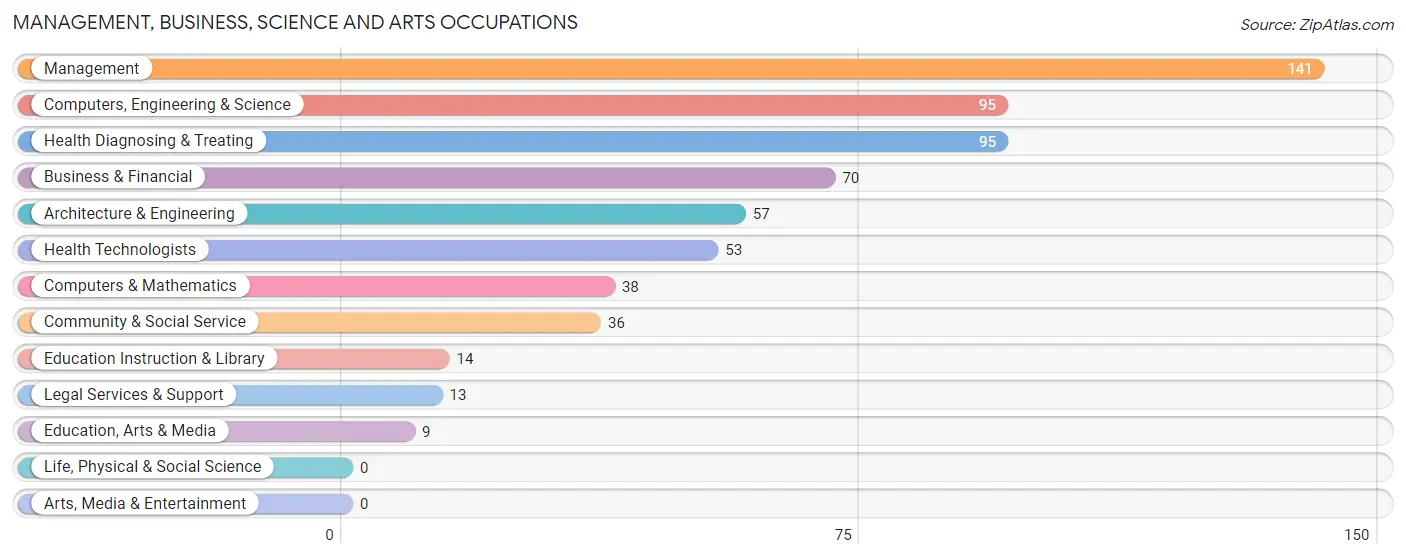
Management, Business, Science and Arts Occupations by Sex
Within the Management, Business, Science and Arts occupations in Oak Harbor, the most male-oriented occupations are Architecture & Engineering (100.0%), Computers, Engineering & Science (85.3%), and Business & Financial (68.6%), while the most female-oriented occupations are Community & Social Service (100.0%), Education, Arts & Media (100.0%), and Legal Services & Support (100.0%).
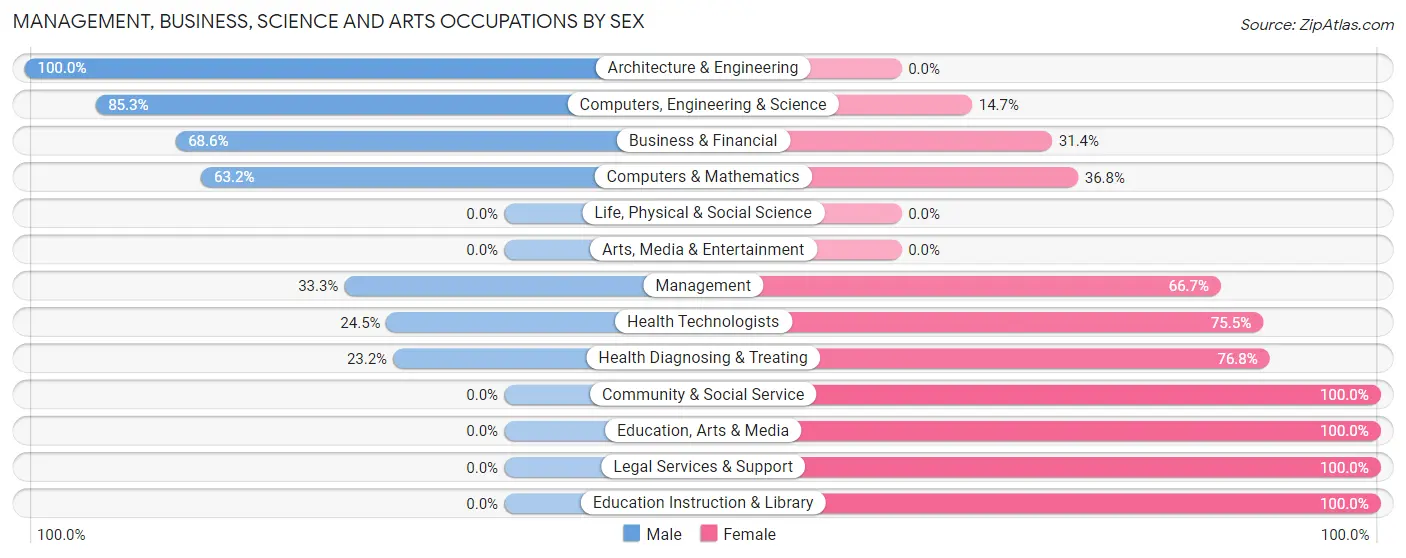
| Occupation | Male | Female |
| Management | 47 (33.3%) | 94 (66.7%) |
| Business & Financial | 48 (68.6%) | 22 (31.4%) |
| Computers, Engineering & Science | 81 (85.3%) | 14 (14.7%) |
| Computers & Mathematics | 24 (63.2%) | 14 (36.8%) |
| Architecture & Engineering | 57 (100.0%) | 0 (0.0%) |
| Life, Physical & Social Science | 0 (0.0%) | 0 (0.0%) |
| Community & Social Service | 0 (0.0%) | 36 (100.0%) |
| Education, Arts & Media | 0 (0.0%) | 9 (100.0%) |
| Legal Services & Support | 0 (0.0%) | 13 (100.0%) |
| Education Instruction & Library | 0 (0.0%) | 14 (100.0%) |
| Arts, Media & Entertainment | 0 (0.0%) | 0 (0.0%) |
| Health Diagnosing & Treating | 22 (23.2%) | 73 (76.8%) |
| Health Technologists | 13 (24.5%) | 40 (75.5%) |
| Total (Category) | 198 (45.3%) | 239 (54.7%) |
| Total (Overall) | 607 (52.8%) | 543 (47.2%) |
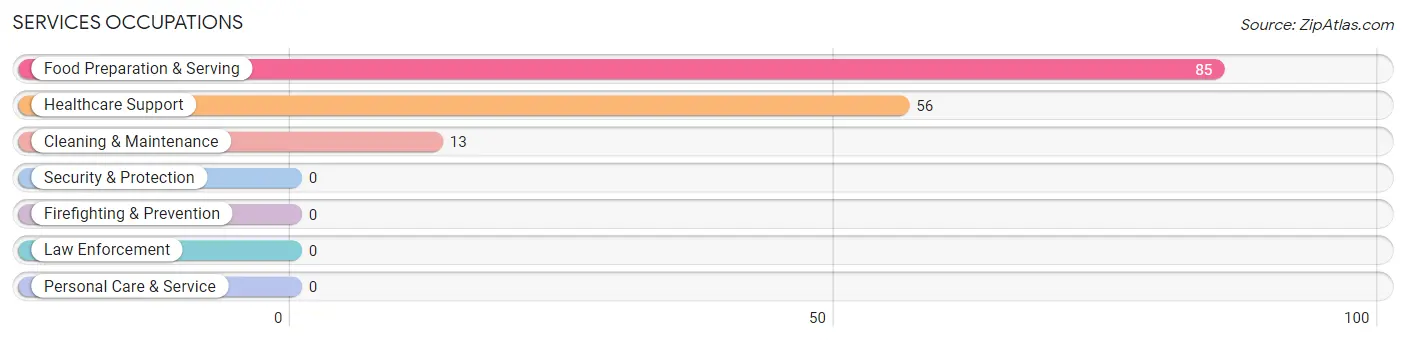
Services Occupations
The most common Services occupations in Oak Harbor are Food Preparation & Serving (85 | 7.4%), Healthcare Support (56 | 4.9%), and Cleaning & Maintenance (13 | 1.1%).
Services Occupations by Sex
Within the Services occupations in Oak Harbor, the most male-oriented occupations are Cleaning & Maintenance (100.0%), and Food Preparation & Serving (64.7%), while the most female-oriented occupations are Healthcare Support (100.0%), and Food Preparation & Serving (35.3%).
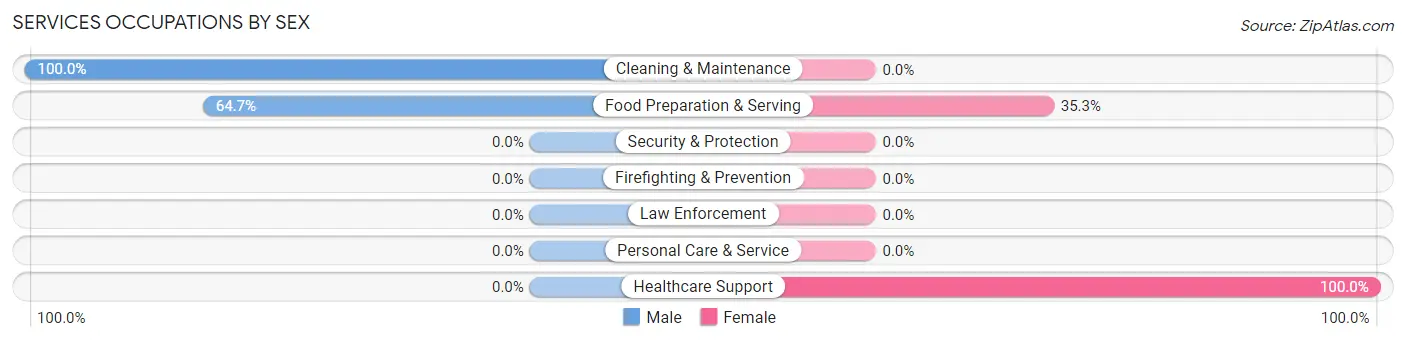
| Occupation | Male | Female |
| Healthcare Support | 0 (0.0%) | 56 (100.0%) |
| Security & Protection | 0 (0.0%) | 0 (0.0%) |
| Firefighting & Prevention | 0 (0.0%) | 0 (0.0%) |
| Law Enforcement | 0 (0.0%) | 0 (0.0%) |
| Food Preparation & Serving | 55 (64.7%) | 30 (35.3%) |
| Cleaning & Maintenance | 13 (100.0%) | 0 (0.0%) |
| Personal Care & Service | 0 (0.0%) | 0 (0.0%) |
| Total (Category) | 68 (44.2%) | 86 (55.8%) |
| Total (Overall) | 607 (52.8%) | 543 (47.2%) |
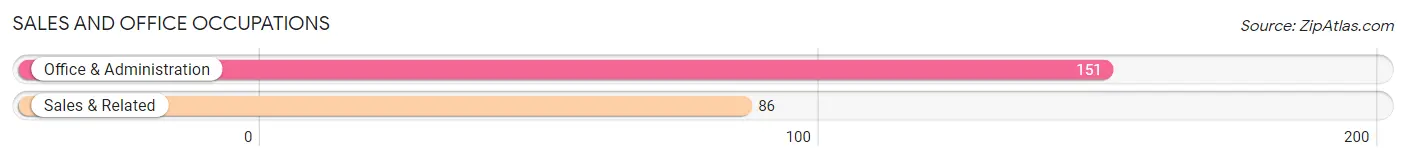
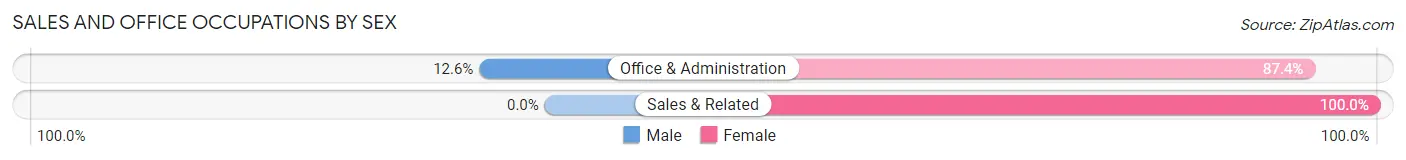
Sales and Office Occupations
The most common Sales and Office occupations in Oak Harbor are Office & Administration (151 | 13.1%), and Sales & Related (86 | 7.5%).
Sales and Office Occupations by Sex
| Occupation | Male | Female |
| Sales & Related | 0 (0.0%) | 86 (100.0%) |
| Office & Administration | 19 (12.6%) | 132 (87.4%) |
| Total (Category) | 19 (8.0%) | 218 (92.0%) |
| Total (Overall) | 607 (52.8%) | 543 (47.2%) |
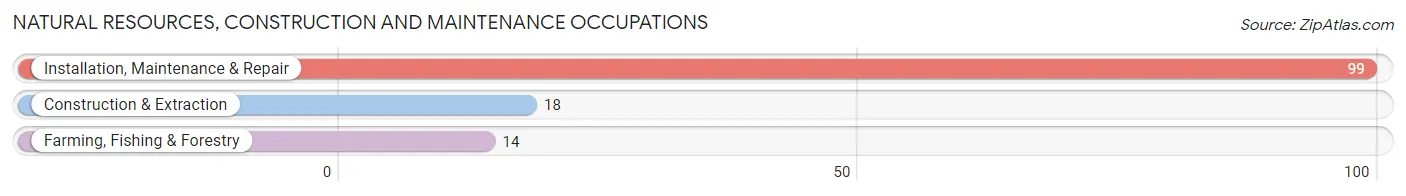
Natural Resources, Construction and Maintenance Occupations
The most common Natural Resources, Construction and Maintenance occupations in Oak Harbor are Installation, Maintenance & Repair (99 | 8.6%), Construction & Extraction (18 | 1.6%), and Farming, Fishing & Forestry (14 | 1.2%).
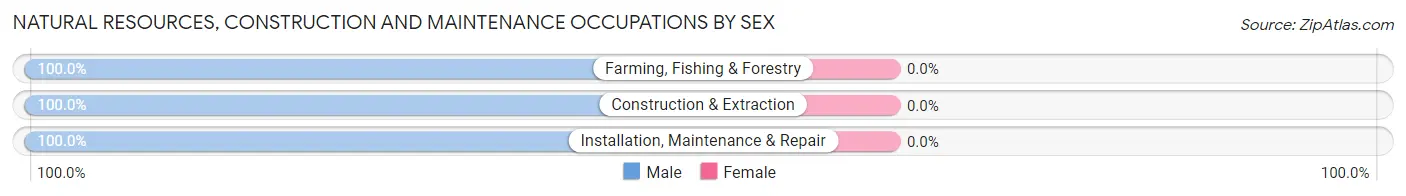
Natural Resources, Construction and Maintenance Occupations by Sex
| Occupation | Male | Female |
| Farming, Fishing & Forestry | 14 (100.0%) | 0 (0.0%) |
| Construction & Extraction | 18 (100.0%) | 0 (0.0%) |
| Installation, Maintenance & Repair | 99 (100.0%) | 0 (0.0%) |
| Total (Category) | 131 (100.0%) | 0 (0.0%) |
| Total (Overall) | 607 (52.8%) | 543 (47.2%) |
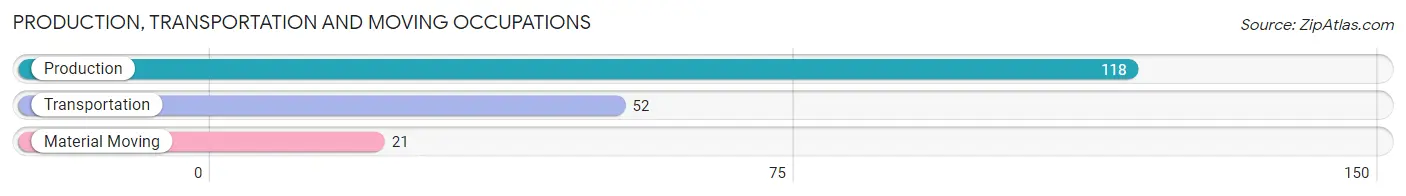
Production, Transportation and Moving Occupations
The most common Production, Transportation and Moving occupations in Oak Harbor are Production (118 | 10.3%), Transportation (52 | 4.5%), and Material Moving (21 | 1.8%).
Production, Transportation and Moving Occupations by Sex

| Occupation | Male | Female |
| Production | 118 (100.0%) | 0 (0.0%) |
| Transportation | 52 (100.0%) | 0 (0.0%) |
| Material Moving | 21 (100.0%) | 0 (0.0%) |
| Total (Category) | 191 (100.0%) | 0 (0.0%) |
| Total (Overall) | 607 (52.8%) | 543 (47.2%) |
Employment Industries by Sex in Oak Harbor
Employment Industries in Oak Harbor
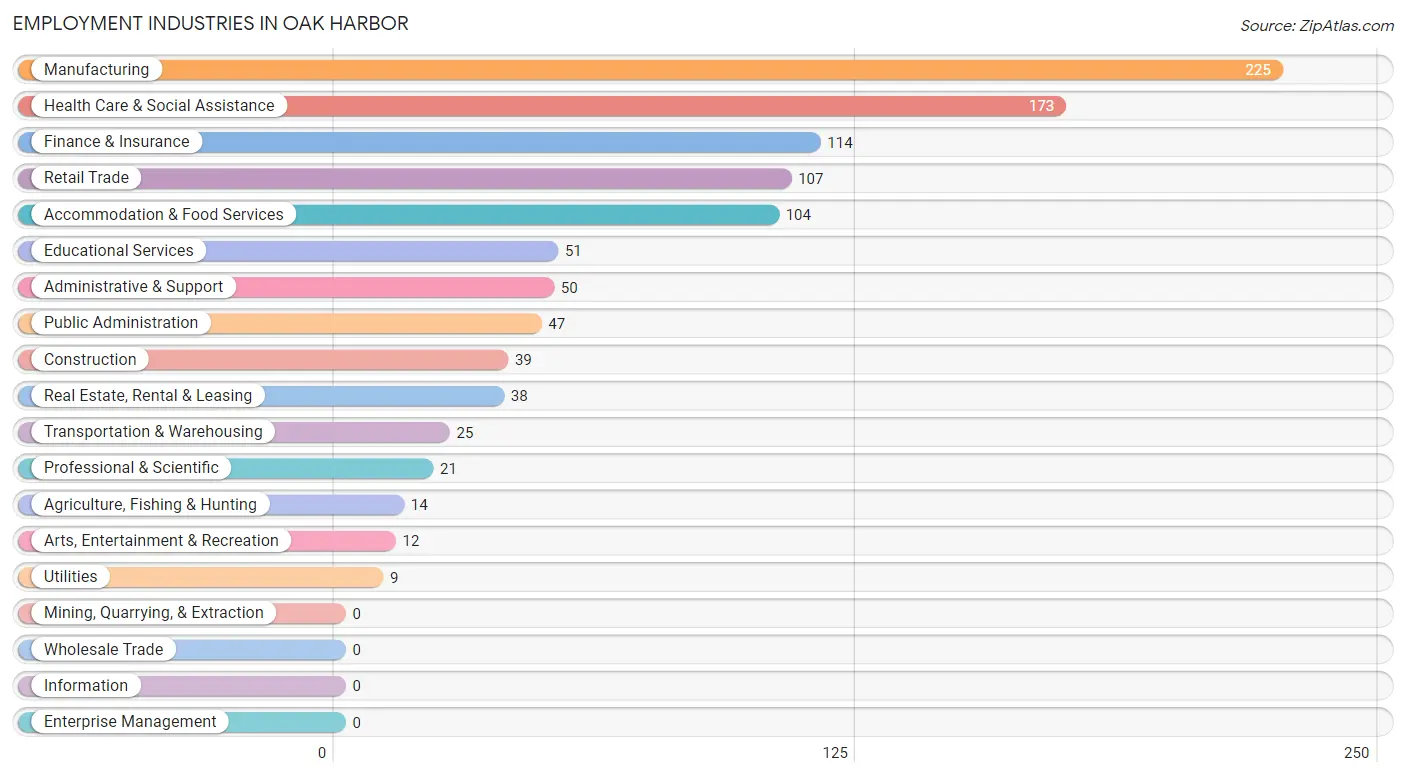
The major employment industries in Oak Harbor include Manufacturing (225 | 19.6%), Health Care & Social Assistance (173 | 15.0%), Finance & Insurance (114 | 9.9%), Retail Trade (107 | 9.3%), and Accommodation & Food Services (104 | 9.0%).
Employment Industries by Sex in Oak Harbor
The Oak Harbor industries that see more men than women are Agriculture, Fishing & Hunting (100.0%), Construction (100.0%), and Transportation & Warehousing (100.0%), whereas the industries that tend to have a higher number of women are Professional & Scientific (100.0%), Public Administration (100.0%), and Health Care & Social Assistance (79.8%).
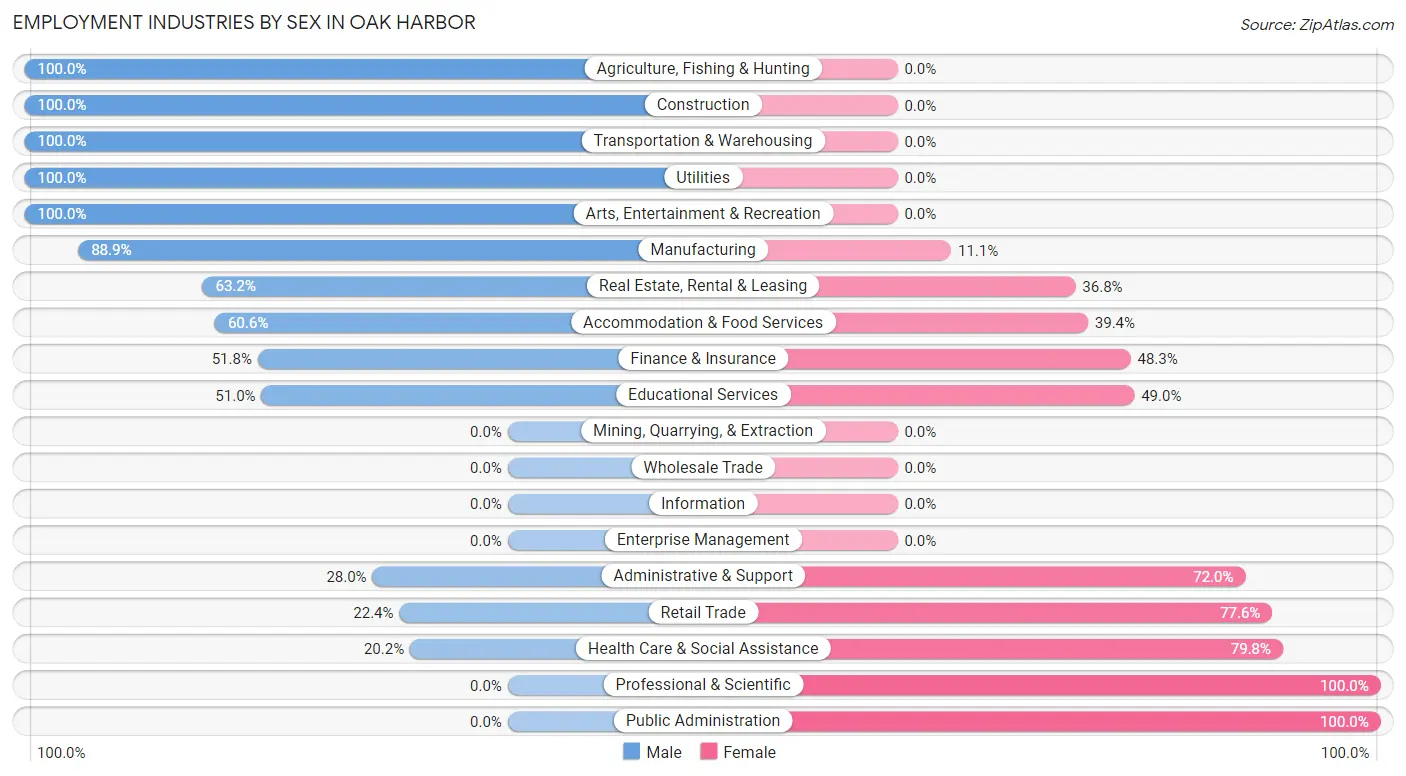
| Industry | Male | Female |
| Agriculture, Fishing & Hunting | 14 (100.0%) | 0 (0.0%) |
| Mining, Quarrying, & Extraction | 0 (0.0%) | 0 (0.0%) |
| Construction | 39 (100.0%) | 0 (0.0%) |
| Manufacturing | 200 (88.9%) | 25 (11.1%) |
| Wholesale Trade | 0 (0.0%) | 0 (0.0%) |
| Retail Trade | 24 (22.4%) | 83 (77.6%) |
| Transportation & Warehousing | 25 (100.0%) | 0 (0.0%) |
| Utilities | 9 (100.0%) | 0 (0.0%) |
| Information | 0 (0.0%) | 0 (0.0%) |
| Finance & Insurance | 59 (51.7%) | 55 (48.2%) |
| Real Estate, Rental & Leasing | 24 (63.2%) | 14 (36.8%) |
| Professional & Scientific | 0 (0.0%) | 21 (100.0%) |
| Enterprise Management | 0 (0.0%) | 0 (0.0%) |
| Administrative & Support | 14 (28.0%) | 36 (72.0%) |
| Educational Services | 26 (51.0%) | 25 (49.0%) |
| Health Care & Social Assistance | 35 (20.2%) | 138 (79.8%) |
| Arts, Entertainment & Recreation | 12 (100.0%) | 0 (0.0%) |
| Accommodation & Food Services | 63 (60.6%) | 41 (39.4%) |
| Public Administration | 0 (0.0%) | 47 (100.0%) |
| Total | 607 (52.8%) | 543 (47.2%) |
Education in Oak Harbor
School Enrollment in Oak Harbor
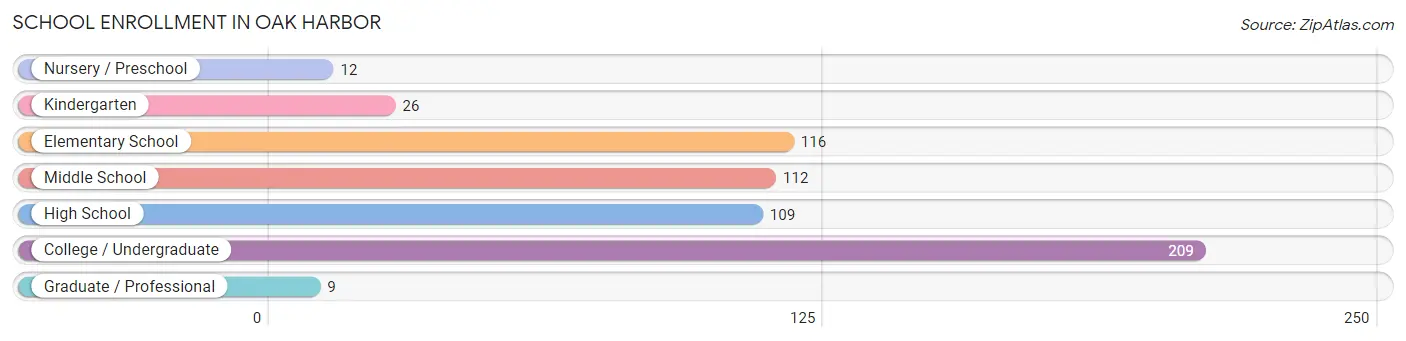
The most common levels of schooling among the 593 students in Oak Harbor are college / undergraduate (209 | 35.2%), elementary school (116 | 19.6%), and middle school (112 | 18.9%).
| School Level | # Students | % Students |
| Nursery / Preschool | 12 | 2.0% |
| Kindergarten | 26 | 4.4% |
| Elementary School | 116 | 19.6% |
| Middle School | 112 | 18.9% |
| High School | 109 | 18.4% |
| College / Undergraduate | 209 | 35.2% |
| Graduate / Professional | 9 | 1.5% |
| Total | 593 | 100.0% |
School Enrollment by Age by Funding Source in Oak Harbor
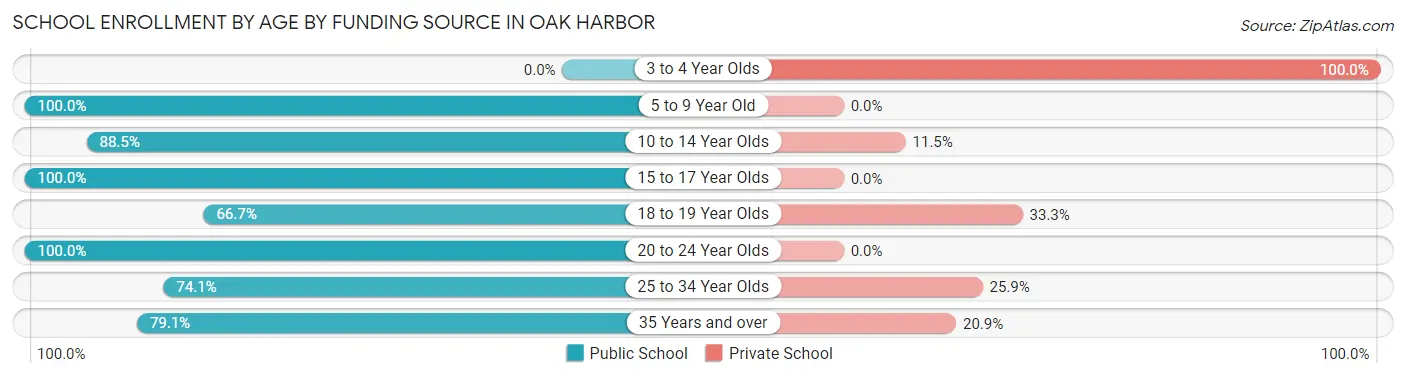
Out of a total of 593 students who are enrolled in schools in Oak Harbor, 71 (12.0%) attend a private institution, while the remaining 522 (88.0%) are enrolled in public schools. The age group of 3 to 4 year olds has the highest likelihood of being enrolled in private schools, with 12 (100.0% in the age bracket) enrolled. Conversely, the age group of 5 to 9 year old has the lowest likelihood of being enrolled in a private school, with 91 (100.0% in the age bracket) attending a public institution.
| Age Bracket | Public School | Private School |
| 3 to 4 Year Olds | 0 (0.0%) | 12 (100.0%) |
| 5 to 9 Year Old | 91 (100.0%) | 0 (0.0%) |
| 10 to 14 Year Olds | 184 (88.5%) | 24 (11.5%) |
| 15 to 17 Year Olds | 28 (100.0%) | 0 (0.0%) |
| 18 to 19 Year Olds | 22 (66.7%) | 11 (33.3%) |
| 20 to 24 Year Olds | 120 (100.0%) | 0 (0.0%) |
| 25 to 34 Year Olds | 43 (74.1%) | 15 (25.9%) |
| 35 Years and over | 34 (79.1%) | 9 (20.9%) |
| Total | 522 (88.0%) | 71 (12.0%) |
Educational Attainment by Field of Study in Oak Harbor
Education (118 | 29.2%), engineering (80 | 19.8%), psychology (70 | 17.3%), science & technology (35 | 8.7%), and computers & mathematics (32 | 7.9%) are the most common fields of study among 404 individuals in Oak Harbor who have obtained a bachelor's degree or higher.
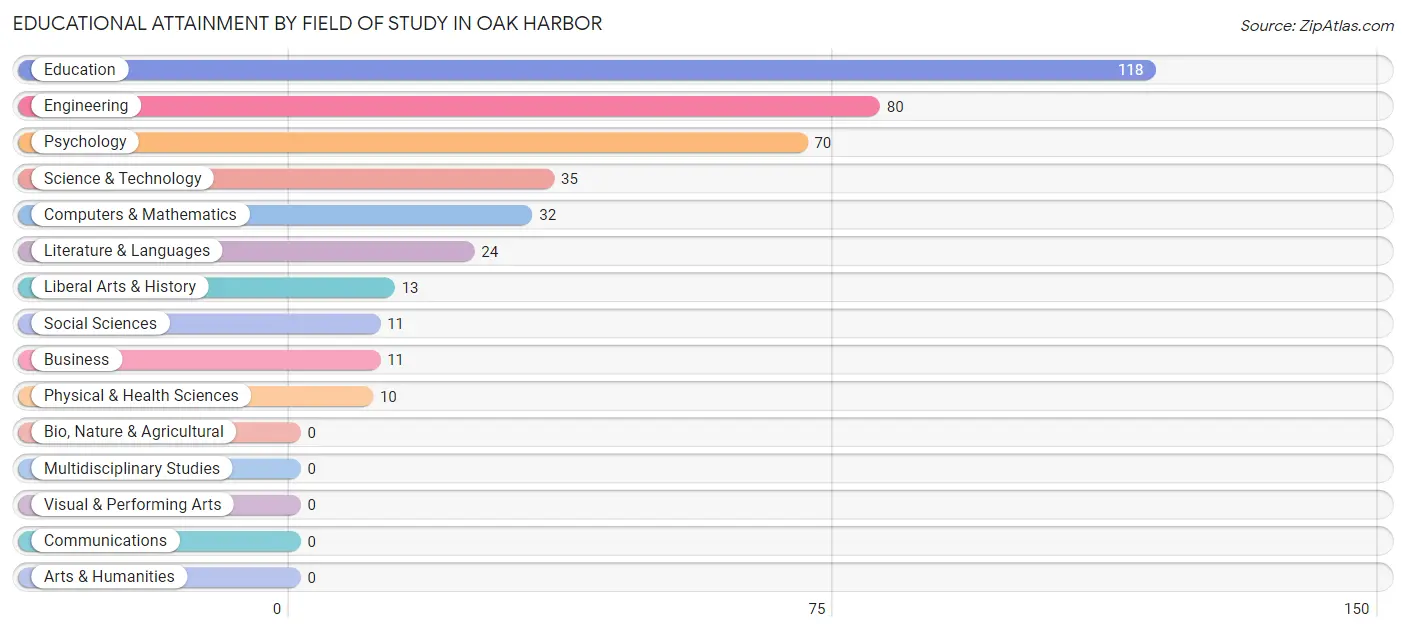
| Field of Study | # Graduates | % Graduates |
| Computers & Mathematics | 32 | 7.9% |
| Bio, Nature & Agricultural | 0 | 0.0% |
| Physical & Health Sciences | 10 | 2.5% |
| Psychology | 70 | 17.3% |
| Social Sciences | 11 | 2.7% |
| Engineering | 80 | 19.8% |
| Multidisciplinary Studies | 0 | 0.0% |
| Science & Technology | 35 | 8.7% |
| Business | 11 | 2.7% |
| Education | 118 | 29.2% |
| Literature & Languages | 24 | 5.9% |
| Liberal Arts & History | 13 | 3.2% |
| Visual & Performing Arts | 0 | 0.0% |
| Communications | 0 | 0.0% |
| Arts & Humanities | 0 | 0.0% |
| Total | 404 | 100.0% |
Transportation & Commute in Oak Harbor
Vehicle Availability by Sex in Oak Harbor
The most prevalent vehicle ownership categories in Oak Harbor are males with 2 vehicles (245, accounting for 46.9%) and females with 2 vehicles (170, making up 45.9%).
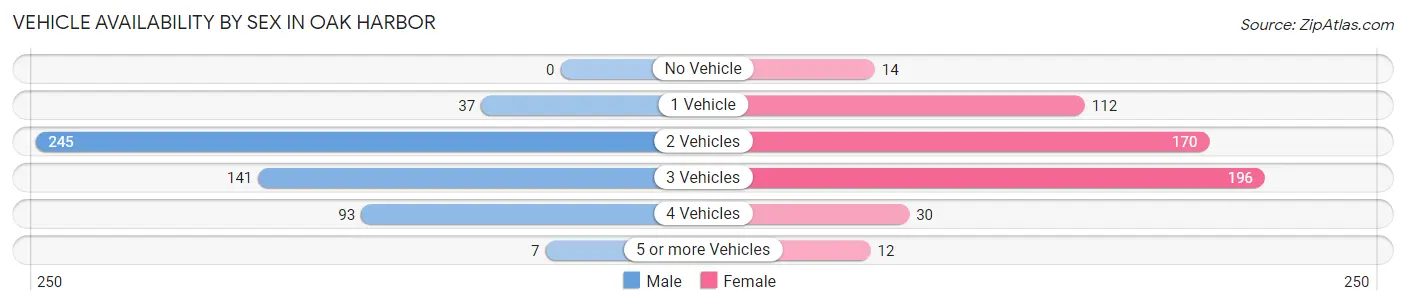
| Vehicles Available | Male | Female |
| No Vehicle | 0 (0.0%) | 14 (2.6%) |
| 1 Vehicle | 37 (7.1%) | 112 (21.0%) |
| 2 Vehicles | 245 (46.9%) | 170 (31.8%) |
| 3 Vehicles | 141 (27.0%) | 196 (36.7%) |
| 4 Vehicles | 93 (17.8%) | 30 (5.6%) |
| 5 or more Vehicles | 7 (1.3%) | 12 (2.2%) |
| Total | 523 (100.0%) | 534 (100.0%) |
Commute Time in Oak Harbor
The most frequently occuring commute durations in Oak Harbor are 15 to 19 minutes (210 commuters, 22.5%), 20 to 24 minutes (203 commuters, 21.7%), and 25 to 29 minutes (94 commuters, 10.1%).
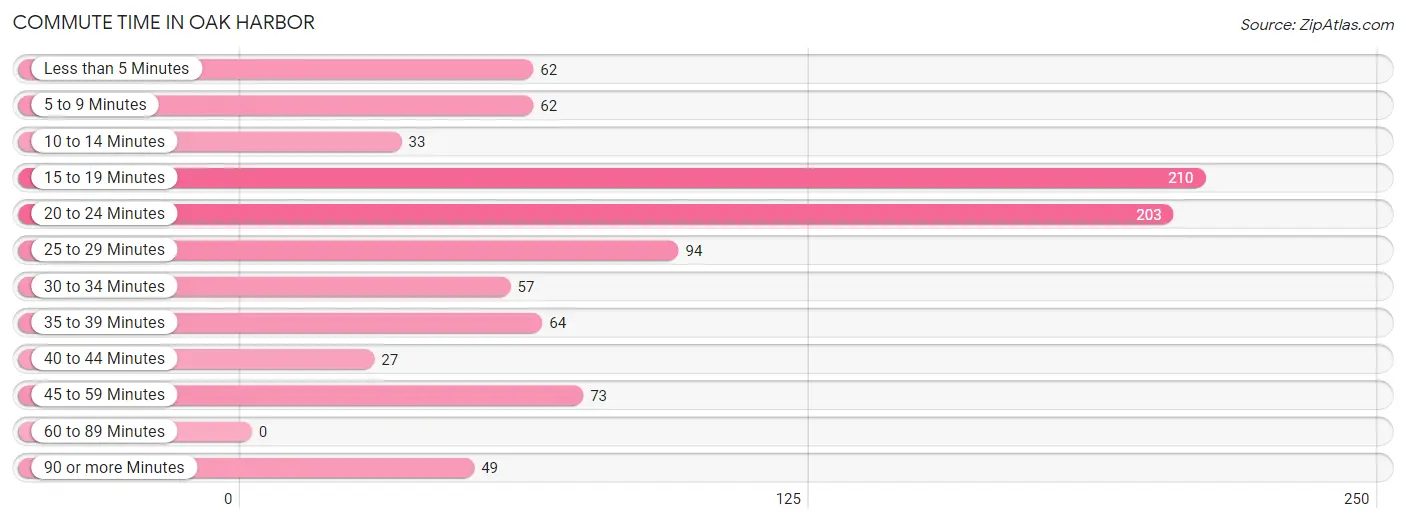
| Commute Time | # Commuters | % Commuters |
| Less than 5 Minutes | 62 | 6.6% |
| 5 to 9 Minutes | 62 | 6.6% |
| 10 to 14 Minutes | 33 | 3.5% |
| 15 to 19 Minutes | 210 | 22.5% |
| 20 to 24 Minutes | 203 | 21.7% |
| 25 to 29 Minutes | 94 | 10.1% |
| 30 to 34 Minutes | 57 | 6.1% |
| 35 to 39 Minutes | 64 | 6.9% |
| 40 to 44 Minutes | 27 | 2.9% |
| 45 to 59 Minutes | 73 | 7.8% |
| 60 to 89 Minutes | 0 | 0.0% |
| 90 or more Minutes | 49 | 5.2% |
Commute Time by Sex in Oak Harbor
The most common commute times in Oak Harbor are 15 to 19 minutes (138 commuters, 29.8%) for males and 20 to 24 minutes (146 commuters, 31.0%) for females.
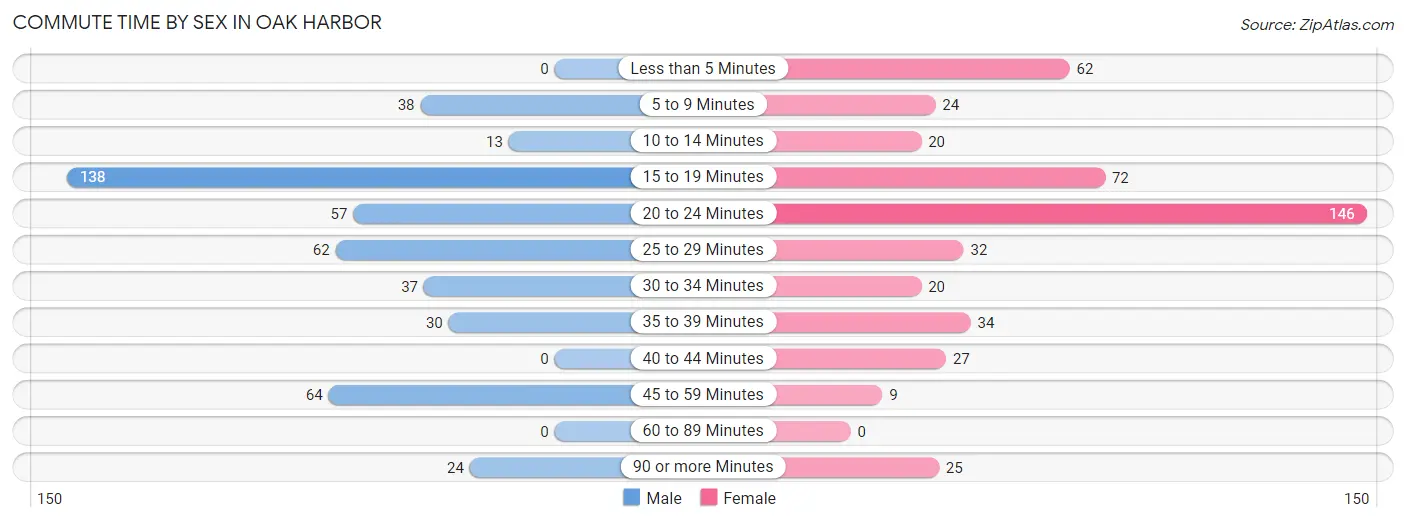
| Commute Time | Male | Female |
| Less than 5 Minutes | 0 (0.0%) | 62 (13.2%) |
| 5 to 9 Minutes | 38 (8.2%) | 24 (5.1%) |
| 10 to 14 Minutes | 13 (2.8%) | 20 (4.3%) |
| 15 to 19 Minutes | 138 (29.8%) | 72 (15.3%) |
| 20 to 24 Minutes | 57 (12.3%) | 146 (31.0%) |
| 25 to 29 Minutes | 62 (13.4%) | 32 (6.8%) |
| 30 to 34 Minutes | 37 (8.0%) | 20 (4.3%) |
| 35 to 39 Minutes | 30 (6.5%) | 34 (7.2%) |
| 40 to 44 Minutes | 0 (0.0%) | 27 (5.7%) |
| 45 to 59 Minutes | 64 (13.8%) | 9 (1.9%) |
| 60 to 89 Minutes | 0 (0.0%) | 0 (0.0%) |
| 90 or more Minutes | 24 (5.2%) | 25 (5.3%) |
Time of Departure to Work by Sex in Oak Harbor
The most frequent times of departure to work in Oak Harbor are 7:30 AM to 7:59 AM (86, 18.6%) for males and 7:00 AM to 7:29 AM (124, 26.3%) for females.
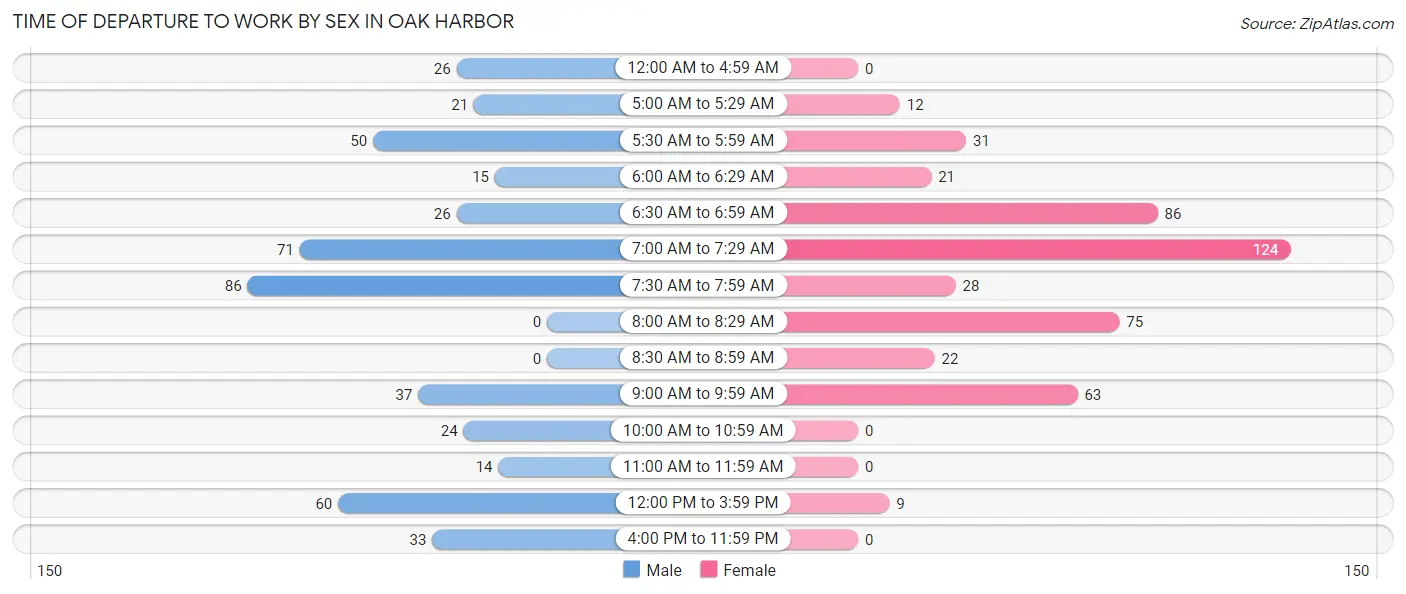
| Time of Departure | Male | Female |
| 12:00 AM to 4:59 AM | 26 (5.6%) | 0 (0.0%) |
| 5:00 AM to 5:29 AM | 21 (4.5%) | 12 (2.5%) |
| 5:30 AM to 5:59 AM | 50 (10.8%) | 31 (6.6%) |
| 6:00 AM to 6:29 AM | 15 (3.2%) | 21 (4.5%) |
| 6:30 AM to 6:59 AM | 26 (5.6%) | 86 (18.3%) |
| 7:00 AM to 7:29 AM | 71 (15.3%) | 124 (26.3%) |
| 7:30 AM to 7:59 AM | 86 (18.6%) | 28 (5.9%) |
| 8:00 AM to 8:29 AM | 0 (0.0%) | 75 (15.9%) |
| 8:30 AM to 8:59 AM | 0 (0.0%) | 22 (4.7%) |
| 9:00 AM to 9:59 AM | 37 (8.0%) | 63 (13.4%) |
| 10:00 AM to 10:59 AM | 24 (5.2%) | 0 (0.0%) |
| 11:00 AM to 11:59 AM | 14 (3.0%) | 0 (0.0%) |
| 12:00 PM to 3:59 PM | 60 (13.0%) | 9 (1.9%) |
| 4:00 PM to 11:59 PM | 33 (7.1%) | 0 (0.0%) |
| Total | 463 (100.0%) | 471 (100.0%) |
Housing Occupancy in Oak Harbor
Occupancy by Ownership in Oak Harbor
Of the total 1,239 dwellings in Oak Harbor, owner-occupied units account for 828 (66.8%), while renter-occupied units make up 411 (33.2%).
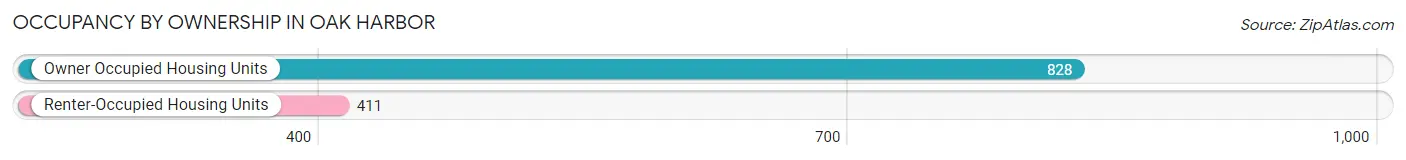
| Occupancy | # Housing Units | % Housing Units |
| Owner Occupied Housing Units | 828 | 66.8% |
| Renter-Occupied Housing Units | 411 | 33.2% |
| Total Occupied Housing Units | 1,239 | 100.0% |
Occupancy by Household Size in Oak Harbor
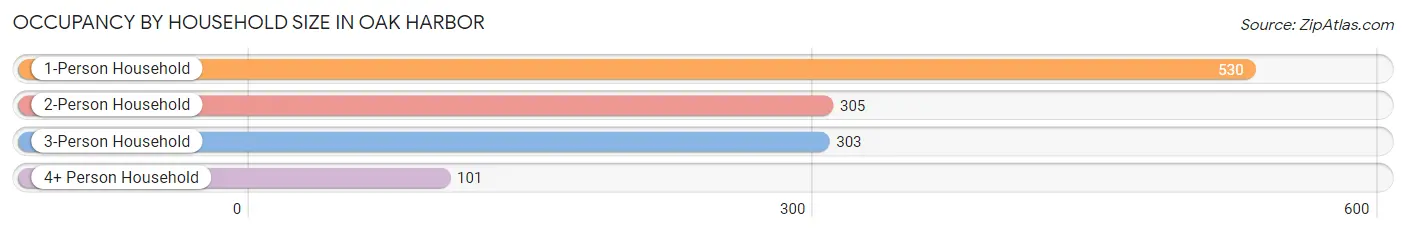
| Household Size | # Housing Units | % Housing Units |
| 1-Person Household | 530 | 42.8% |
| 2-Person Household | 305 | 24.6% |
| 3-Person Household | 303 | 24.5% |
| 4+ Person Household | 101 | 8.2% |
| Total Housing Units | 1,239 | 100.0% |
Occupancy by Ownership by Household Size in Oak Harbor
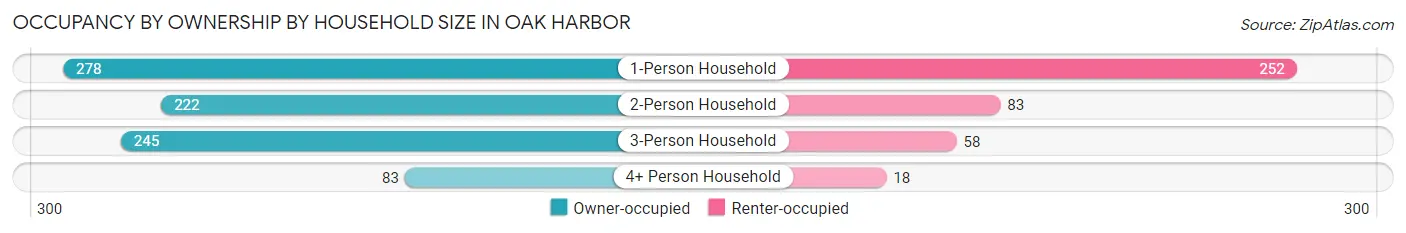
| Household Size | Owner-occupied | Renter-occupied |
| 1-Person Household | 278 (52.4%) | 252 (47.5%) |
| 2-Person Household | 222 (72.8%) | 83 (27.2%) |
| 3-Person Household | 245 (80.9%) | 58 (19.1%) |
| 4+ Person Household | 83 (82.2%) | 18 (17.8%) |
| Total Housing Units | 828 (66.8%) | 411 (33.2%) |
Occupancy by Educational Attainment in Oak Harbor
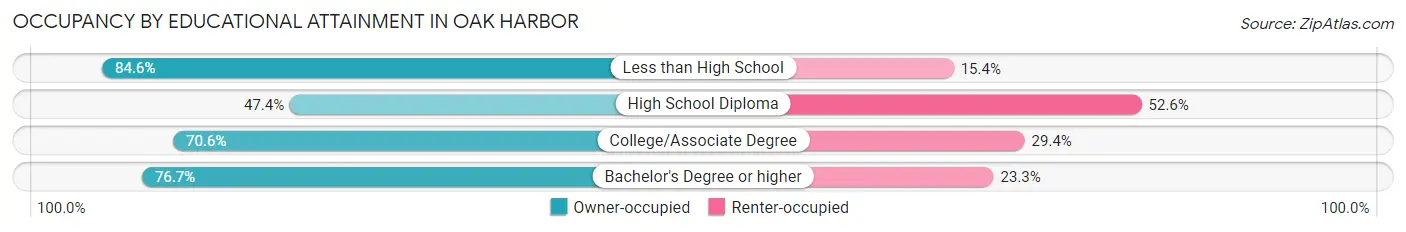
| Household Size | Owner-occupied | Renter-occupied |
| Less than High School | 55 (84.6%) | 10 (15.4%) |
| High School Diploma | 144 (47.4%) | 160 (52.6%) |
| College/Associate Degree | 441 (70.6%) | 184 (29.4%) |
| Bachelor's Degree or higher | 188 (76.7%) | 57 (23.3%) |
Occupancy by Age of Householder in Oak Harbor
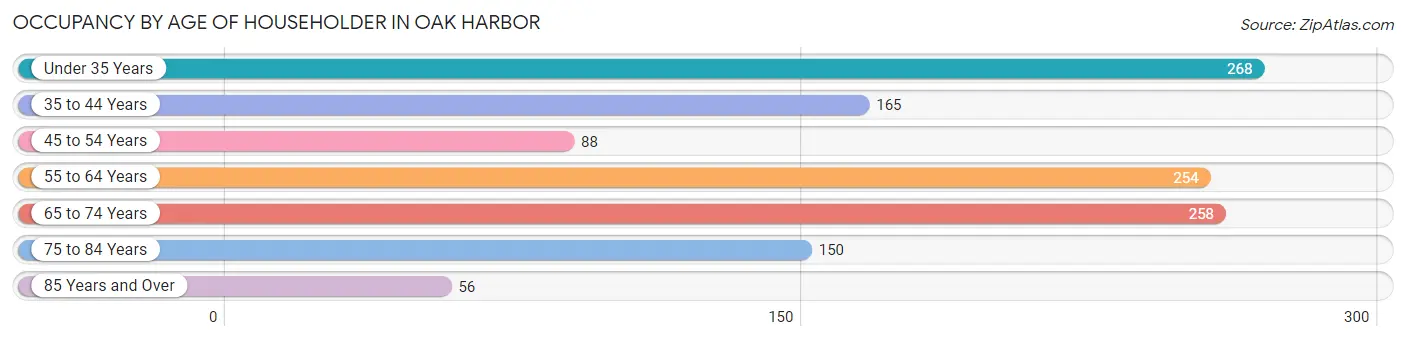
| Age Bracket | # Households | % Households |
| Under 35 Years | 268 | 21.6% |
| 35 to 44 Years | 165 | 13.3% |
| 45 to 54 Years | 88 | 7.1% |
| 55 to 64 Years | 254 | 20.5% |
| 65 to 74 Years | 258 | 20.8% |
| 75 to 84 Years | 150 | 12.1% |
| 85 Years and Over | 56 | 4.5% |
| Total | 1,239 | 100.0% |
Housing Finances in Oak Harbor
Median Income by Occupancy in Oak Harbor
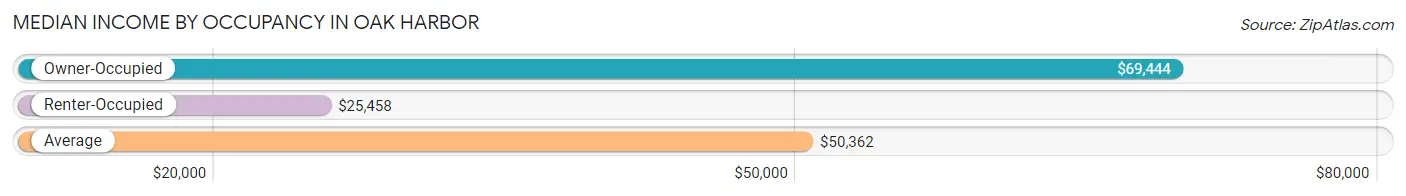
| Occupancy Type | # Households | Median Income |
| Owner-Occupied | 828 (66.8%) | $69,444 |
| Renter-Occupied | 411 (33.2%) | $25,458 |
| Average | 1,239 (100.0%) | $50,362 |
Occupancy by Householder Income Bracket in Oak Harbor
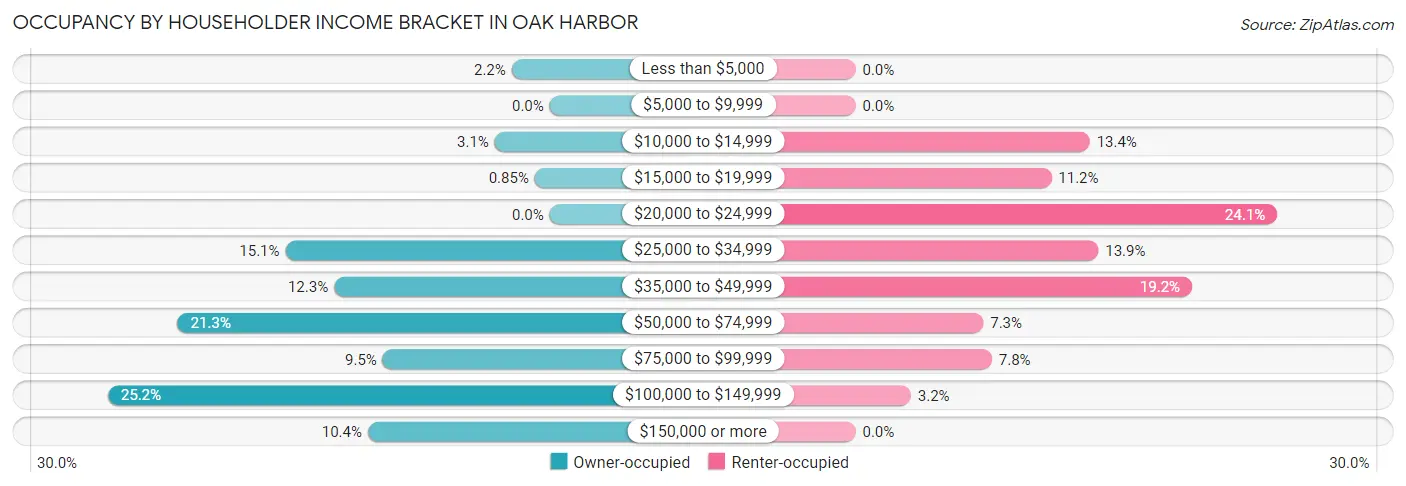
| Income Bracket | Owner-occupied | Renter-occupied |
| Less than $5,000 | 18 (2.2%) | 0 (0.0%) |
| $5,000 to $9,999 | 0 (0.0%) | 0 (0.0%) |
| $10,000 to $14,999 | 26 (3.1%) | 55 (13.4%) |
| $15,000 to $19,999 | 7 (0.9%) | 46 (11.2%) |
| $20,000 to $24,999 | 0 (0.0%) | 99 (24.1%) |
| $25,000 to $34,999 | 125 (15.1%) | 57 (13.9%) |
| $35,000 to $49,999 | 102 (12.3%) | 79 (19.2%) |
| $50,000 to $74,999 | 176 (21.3%) | 30 (7.3%) |
| $75,000 to $99,999 | 79 (9.5%) | 32 (7.8%) |
| $100,000 to $149,999 | 209 (25.2%) | 13 (3.2%) |
| $150,000 or more | 86 (10.4%) | 0 (0.0%) |
| Total | 828 (100.0%) | 411 (100.0%) |
Monthly Housing Cost Tiers in Oak Harbor
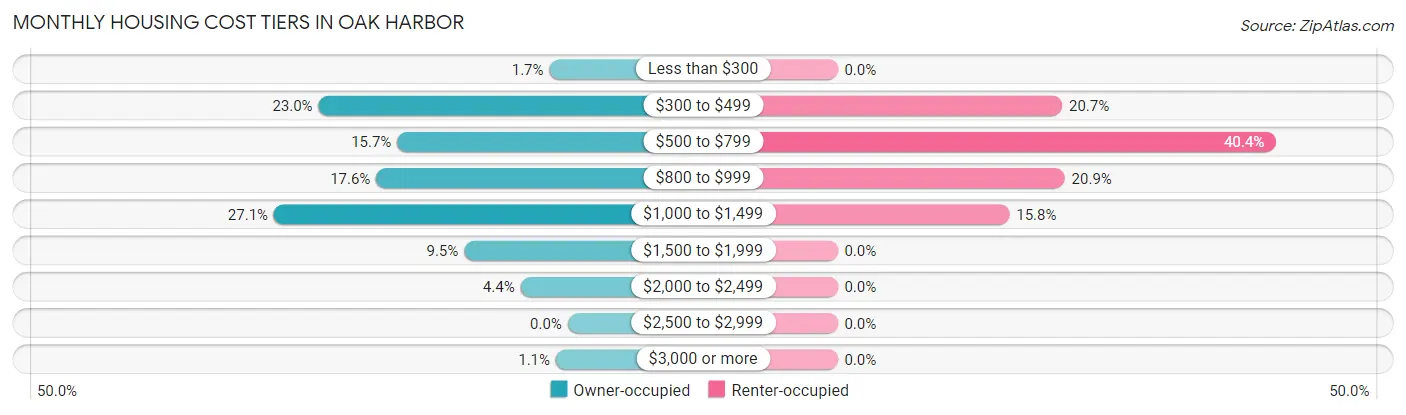
| Monthly Cost | Owner-occupied | Renter-occupied |
| Less than $300 | 14 (1.7%) | 0 (0.0%) |
| $300 to $499 | 190 (23.0%) | 85 (20.7%) |
| $500 to $799 | 130 (15.7%) | 166 (40.4%) |
| $800 to $999 | 146 (17.6%) | 86 (20.9%) |
| $1,000 to $1,499 | 224 (27.1%) | 65 (15.8%) |
| $1,500 to $1,999 | 79 (9.5%) | 0 (0.0%) |
| $2,000 to $2,499 | 36 (4.3%) | 0 (0.0%) |
| $2,500 to $2,999 | 0 (0.0%) | 0 (0.0%) |
| $3,000 or more | 9 (1.1%) | 0 (0.0%) |
| Total | 828 (100.0%) | 411 (100.0%) |
Physical Housing Characteristics in Oak Harbor
Housing Structures in Oak Harbor
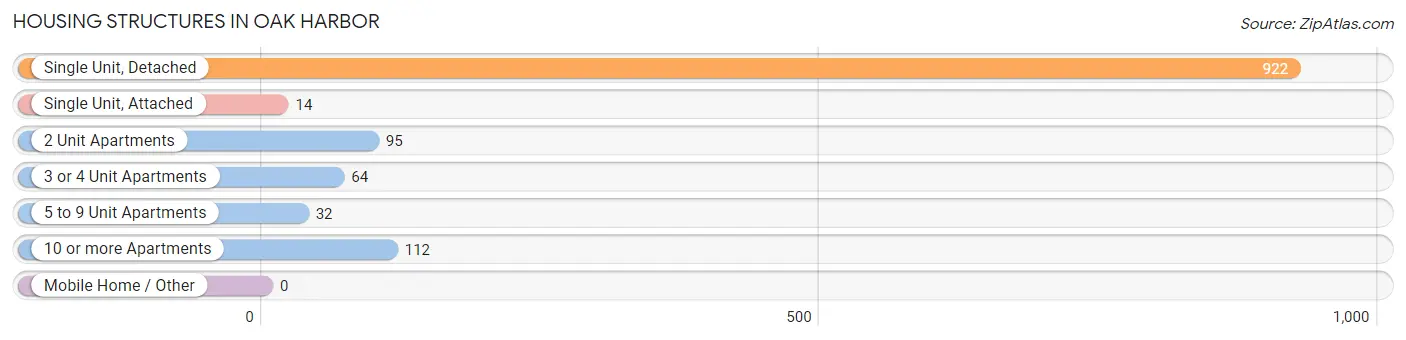
| Structure Type | # Housing Units | % Housing Units |
| Single Unit, Detached | 922 | 74.4% |
| Single Unit, Attached | 14 | 1.1% |
| 2 Unit Apartments | 95 | 7.7% |
| 3 or 4 Unit Apartments | 64 | 5.2% |
| 5 to 9 Unit Apartments | 32 | 2.6% |
| 10 or more Apartments | 112 | 9.0% |
| Mobile Home / Other | 0 | 0.0% |
| Total | 1,239 | 100.0% |
Housing Structures by Occupancy in Oak Harbor
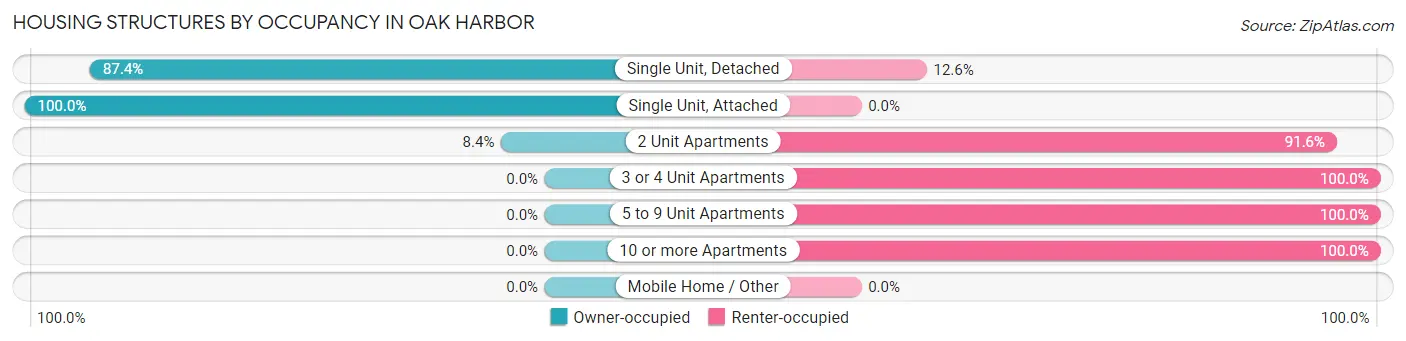
| Structure Type | Owner-occupied | Renter-occupied |
| Single Unit, Detached | 806 (87.4%) | 116 (12.6%) |
| Single Unit, Attached | 14 (100.0%) | 0 (0.0%) |
| 2 Unit Apartments | 8 (8.4%) | 87 (91.6%) |
| 3 or 4 Unit Apartments | 0 (0.0%) | 64 (100.0%) |
| 5 to 9 Unit Apartments | 0 (0.0%) | 32 (100.0%) |
| 10 or more Apartments | 0 (0.0%) | 112 (100.0%) |
| Mobile Home / Other | 0 (0.0%) | 0 (0.0%) |
| Total | 828 (66.8%) | 411 (33.2%) |
Housing Structures by Number of Rooms in Oak Harbor
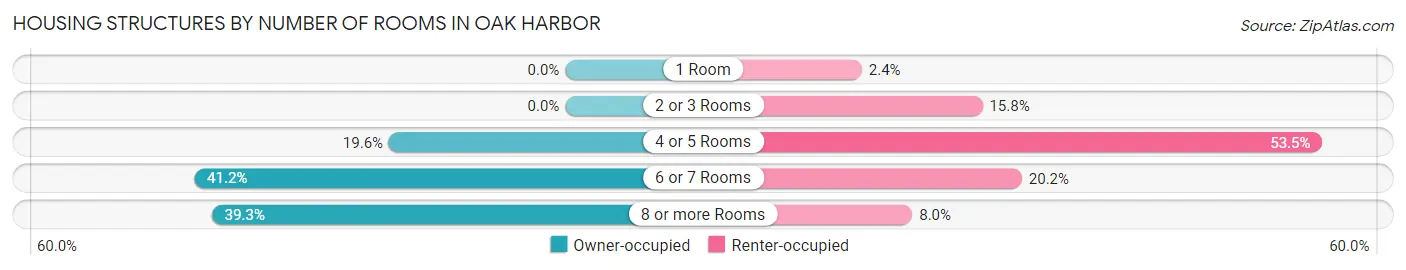
| Number of Rooms | Owner-occupied | Renter-occupied |
| 1 Room | 0 (0.0%) | 10 (2.4%) |
| 2 or 3 Rooms | 0 (0.0%) | 65 (15.8%) |
| 4 or 5 Rooms | 162 (19.6%) | 220 (53.5%) |
| 6 or 7 Rooms | 341 (41.2%) | 83 (20.2%) |
| 8 or more Rooms | 325 (39.3%) | 33 (8.0%) |
| Total | 828 (100.0%) | 411 (100.0%) |
Housing Structure by Heating Type in Oak Harbor
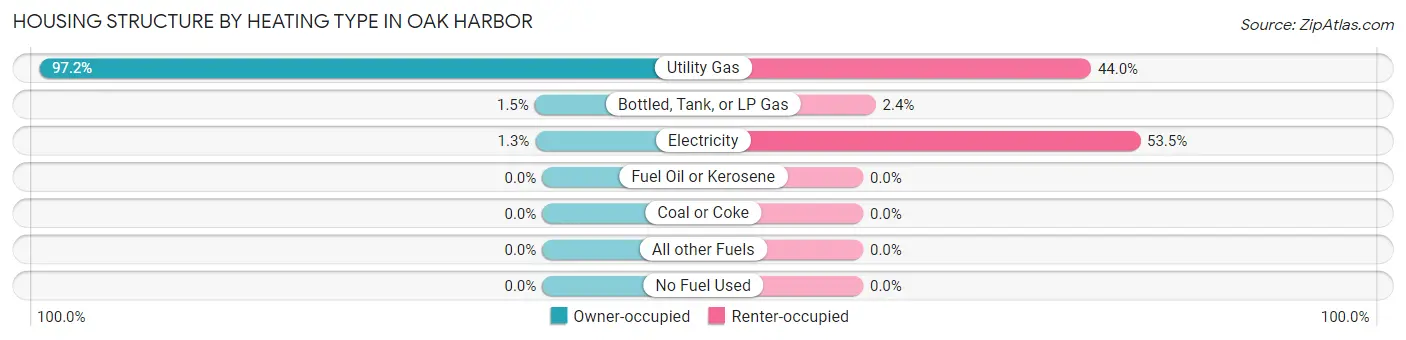
| Heating Type | Owner-occupied | Renter-occupied |
| Utility Gas | 805 (97.2%) | 181 (44.0%) |
| Bottled, Tank, or LP Gas | 12 (1.5%) | 10 (2.4%) |
| Electricity | 11 (1.3%) | 220 (53.5%) |
| Fuel Oil or Kerosene | 0 (0.0%) | 0 (0.0%) |
| Coal or Coke | 0 (0.0%) | 0 (0.0%) |
| All other Fuels | 0 (0.0%) | 0 (0.0%) |
| No Fuel Used | 0 (0.0%) | 0 (0.0%) |
| Total | 828 (100.0%) | 411 (100.0%) |
Household Vehicle Usage in Oak Harbor
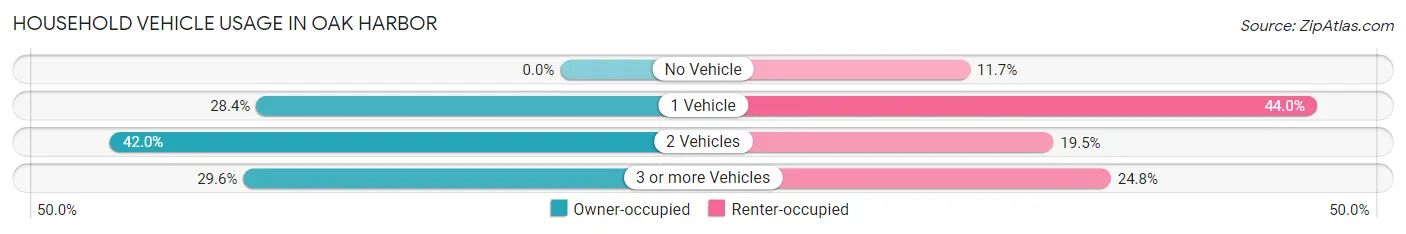
| Vehicles per Household | Owner-occupied | Renter-occupied |
| No Vehicle | 0 (0.0%) | 48 (11.7%) |
| 1 Vehicle | 235 (28.4%) | 181 (44.0%) |
| 2 Vehicles | 348 (42.0%) | 80 (19.5%) |
| 3 or more Vehicles | 245 (29.6%) | 102 (24.8%) |
| Total | 828 (100.0%) | 411 (100.0%) |
Real Estate & Mortgages in Oak Harbor
Real Estate and Mortgage Overview in Oak Harbor
| Characteristic | Without Mortgage | With Mortgage |
| Housing Units | 326 | 502 |
| Median Property Value | $172,100 | $148,600 |
| Median Household Income | $55,417 | $34 |
| Monthly Housing Costs | $456 | $9 |
| Real Estate Taxes | $2,177 | $0 |
Property Value by Mortgage Status in Oak Harbor
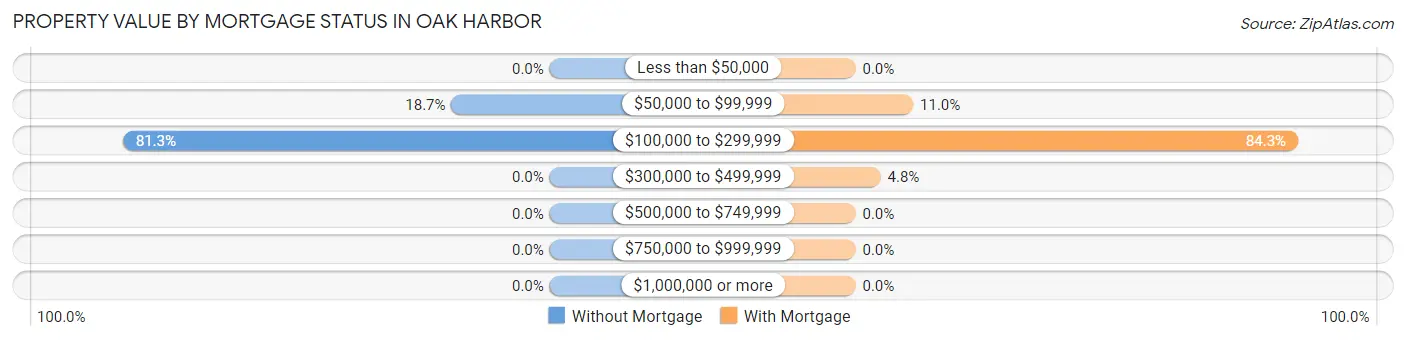
| Property Value | Without Mortgage | With Mortgage |
| Less than $50,000 | 0 (0.0%) | 0 (0.0%) |
| $50,000 to $99,999 | 61 (18.7%) | 55 (11.0%) |
| $100,000 to $299,999 | 265 (81.3%) | 423 (84.3%) |
| $300,000 to $499,999 | 0 (0.0%) | 24 (4.8%) |
| $500,000 to $749,999 | 0 (0.0%) | 0 (0.0%) |
| $750,000 to $999,999 | 0 (0.0%) | 0 (0.0%) |
| $1,000,000 or more | 0 (0.0%) | 0 (0.0%) |
| Total | 326 (100.0%) | 502 (100.0%) |
Household Income by Mortgage Status in Oak Harbor
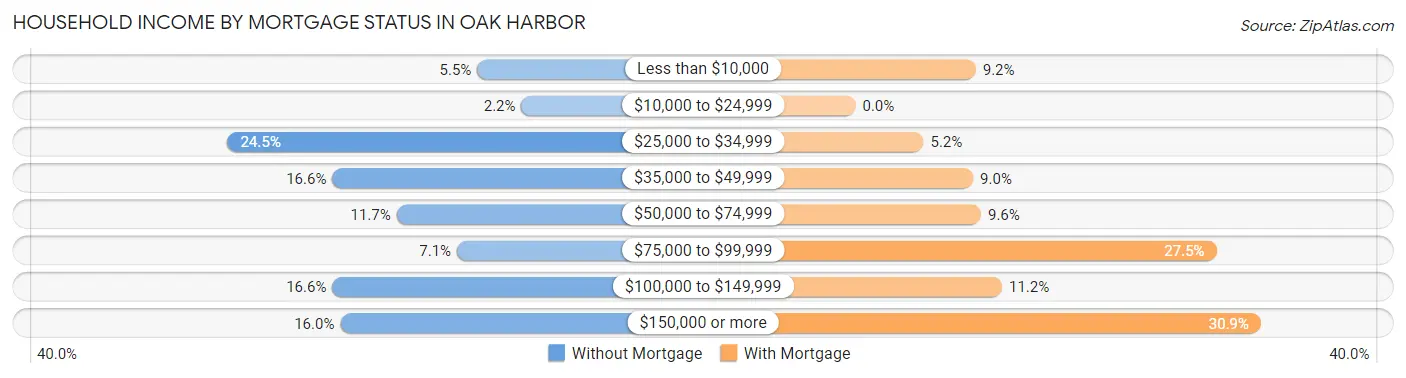
| Household Income | Without Mortgage | With Mortgage |
| Less than $10,000 | 18 (5.5%) | 46 (9.2%) |
| $10,000 to $24,999 | 7 (2.1%) | 0 (0.0%) |
| $25,000 to $34,999 | 80 (24.5%) | 26 (5.2%) |
| $35,000 to $49,999 | 54 (16.6%) | 45 (9.0%) |
| $50,000 to $74,999 | 38 (11.7%) | 48 (9.6%) |
| $75,000 to $99,999 | 23 (7.1%) | 138 (27.5%) |
| $100,000 to $149,999 | 54 (16.6%) | 56 (11.2%) |
| $150,000 or more | 52 (16.0%) | 155 (30.9%) |
| Total | 326 (100.0%) | 502 (100.0%) |
Property Value to Household Income Ratio in Oak Harbor
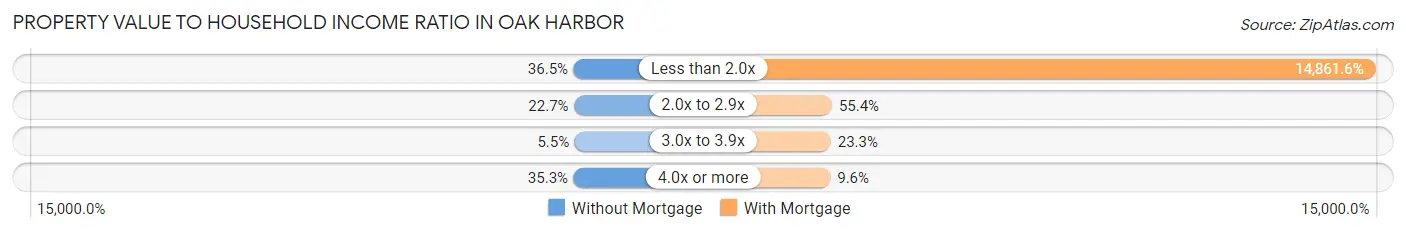
| Value-to-Income Ratio | Without Mortgage | With Mortgage |
| Less than 2.0x | 119 (36.5%) | 74,605 (14,861.5%) |
| 2.0x to 2.9x | 74 (22.7%) | 278 (55.4%) |
| 3.0x to 3.9x | 18 (5.5%) | 117 (23.3%) |
| 4.0x or more | 115 (35.3%) | 48 (9.6%) |
| Total | 326 (100.0%) | 502 (100.0%) |
Real Estate Taxes by Mortgage Status in Oak Harbor
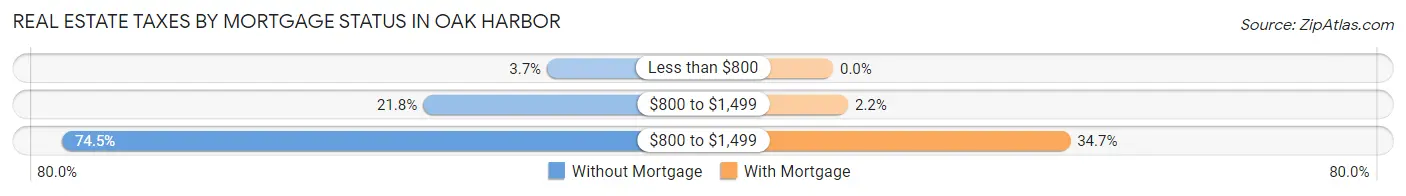
| Property Taxes | Without Mortgage | With Mortgage |
| Less than $800 | 12 (3.7%) | 0 (0.0%) |
| $800 to $1,499 | 71 (21.8%) | 11 (2.2%) |
| $800 to $1,499 | 243 (74.5%) | 174 (34.7%) |
| Total | 326 (100.0%) | 502 (100.0%) |
Health & Disability in Oak Harbor
Health Insurance Coverage by Age in Oak Harbor
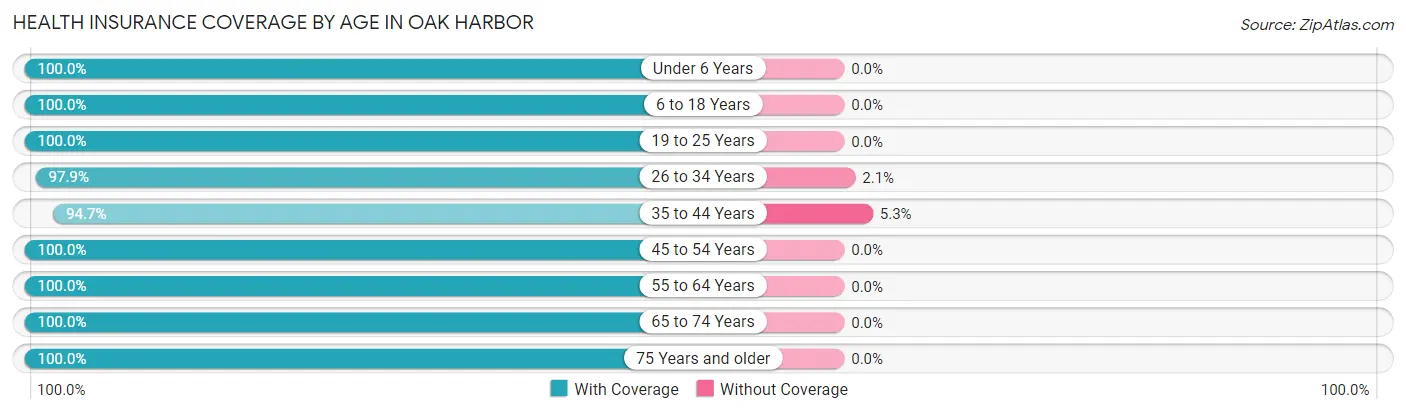
| Age Bracket | With Coverage | Without Coverage |
| Under 6 Years | 169 (100.0%) | 0 (0.0%) |
| 6 to 18 Years | 323 (100.0%) | 0 (0.0%) |
| 19 to 25 Years | 227 (100.0%) | 0 (0.0%) |
| 26 to 34 Years | 427 (97.9%) | 9 (2.1%) |
| 35 to 44 Years | 213 (94.7%) | 12 (5.3%) |
| 45 to 54 Years | 176 (100.0%) | 0 (0.0%) |
| 55 to 64 Years | 362 (100.0%) | 0 (0.0%) |
| 65 to 74 Years | 328 (100.0%) | 0 (0.0%) |
| 75 Years and older | 275 (100.0%) | 0 (0.0%) |
| Total | 2,500 (99.2%) | 21 (0.8%) |
Health Insurance Coverage by Citizenship Status in Oak Harbor
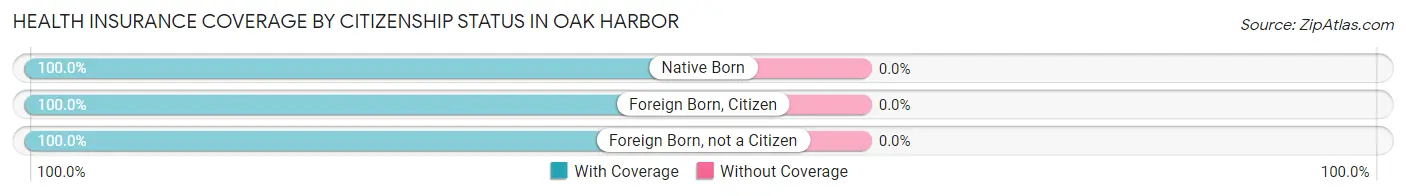
| Citizenship Status | With Coverage | Without Coverage |
| Native Born | 169 (100.0%) | 0 (0.0%) |
| Foreign Born, Citizen | 323 (100.0%) | 0 (0.0%) |
| Foreign Born, not a Citizen | 227 (100.0%) | 0 (0.0%) |
Health Insurance Coverage by Household Income in Oak Harbor
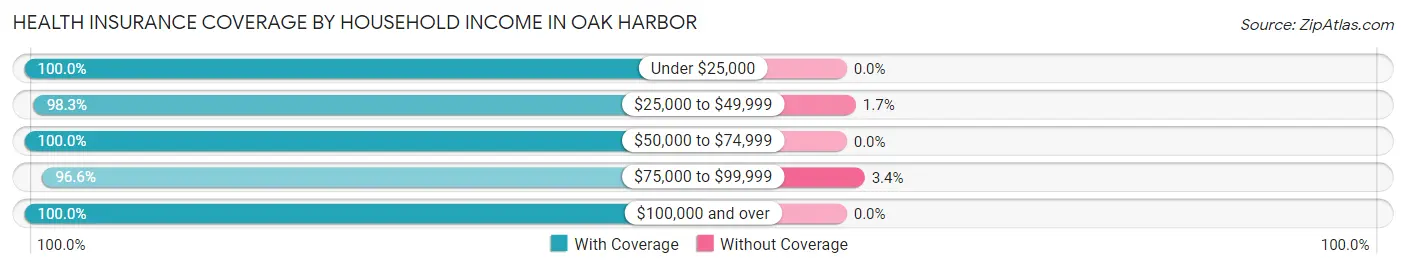
| Household Income | With Coverage | Without Coverage |
| Under $25,000 | 276 (100.0%) | 0 (0.0%) |
| $25,000 to $49,999 | 691 (98.3%) | 12 (1.7%) |
| $50,000 to $74,999 | 466 (100.0%) | 0 (0.0%) |
| $75,000 to $99,999 | 259 (96.6%) | 9 (3.4%) |
| $100,000 and over | 808 (100.0%) | 0 (0.0%) |
Public vs Private Health Insurance Coverage by Age in Oak Harbor
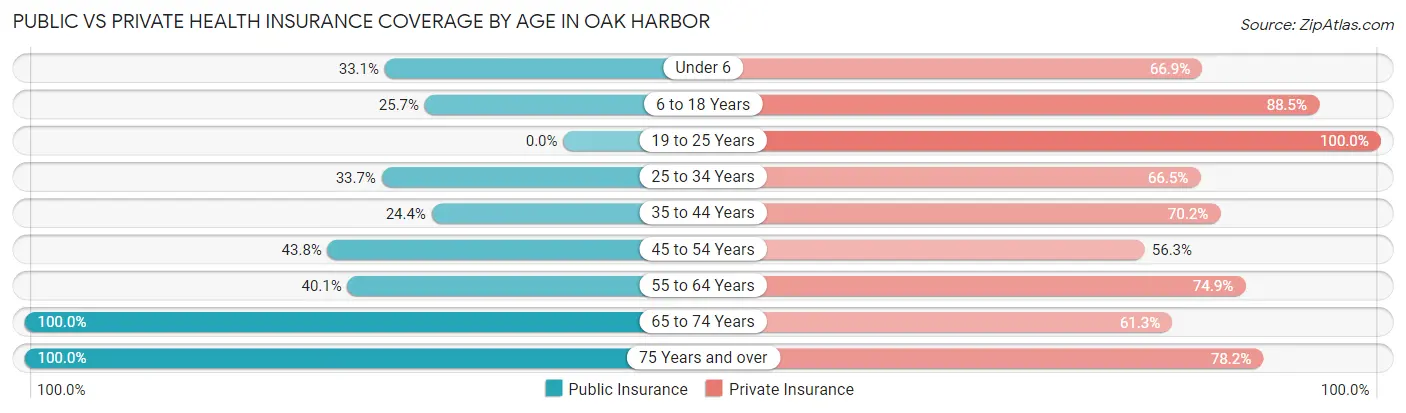
| Age Bracket | Public Insurance | Private Insurance |
| Under 6 | 56 (33.1%) | 113 (66.9%) |
| 6 to 18 Years | 83 (25.7%) | 286 (88.5%) |
| 19 to 25 Years | 0 (0.0%) | 227 (100.0%) |
| 25 to 34 Years | 147 (33.7%) | 290 (66.5%) |
| 35 to 44 Years | 55 (24.4%) | 158 (70.2%) |
| 45 to 54 Years | 77 (43.8%) | 99 (56.2%) |
| 55 to 64 Years | 145 (40.1%) | 271 (74.9%) |
| 65 to 74 Years | 328 (100.0%) | 201 (61.3%) |
| 75 Years and over | 275 (100.0%) | 215 (78.2%) |
| Total | 1,166 (46.3%) | 1,860 (73.8%) |
Disability Status by Sex by Age in Oak Harbor
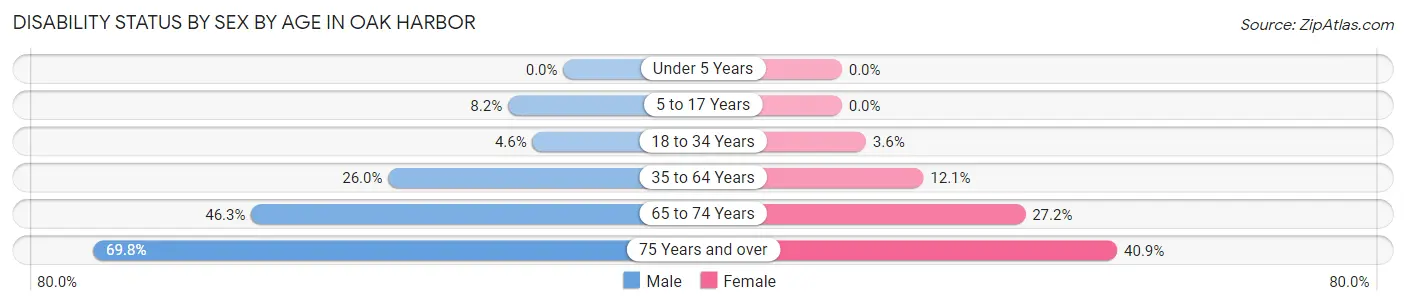
| Age Bracket | Male | Female |
| Under 5 Years | 0 (0.0%) | 0 (0.0%) |
| 5 to 17 Years | 12 (8.2%) | 0 (0.0%) |
| 18 to 34 Years | 16 (4.6%) | 12 (3.6%) |
| 35 to 64 Years | 91 (26.0%) | 50 (12.1%) |
| 65 to 74 Years | 38 (46.3%) | 67 (27.2%) |
| 75 Years and over | 81 (69.8%) | 65 (40.9%) |
Disability Class by Sex by Age in Oak Harbor
Disability Class: Hearing Difficulty
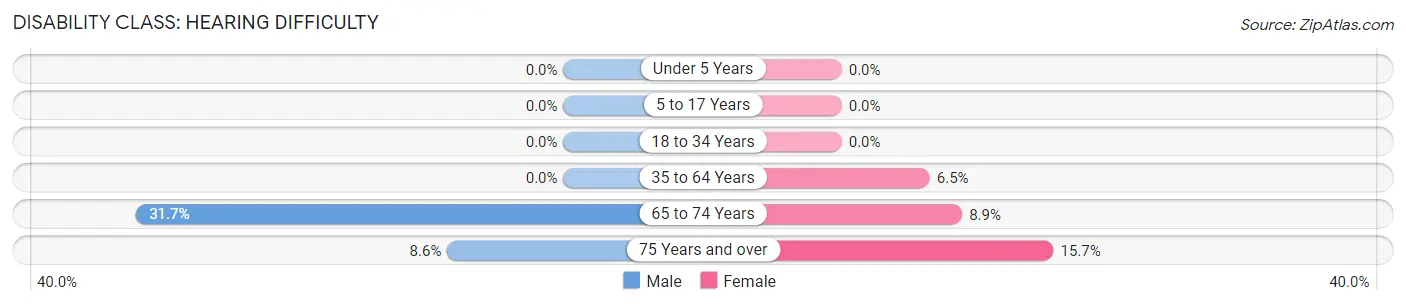
| Age Bracket | Male | Female |
| Under 5 Years | 0 (0.0%) | 0 (0.0%) |
| 5 to 17 Years | 0 (0.0%) | 0 (0.0%) |
| 18 to 34 Years | 0 (0.0%) | 0 (0.0%) |
| 35 to 64 Years | 0 (0.0%) | 27 (6.5%) |
| 65 to 74 Years | 26 (31.7%) | 22 (8.9%) |
| 75 Years and over | 10 (8.6%) | 25 (15.7%) |
Disability Class: Vision Difficulty
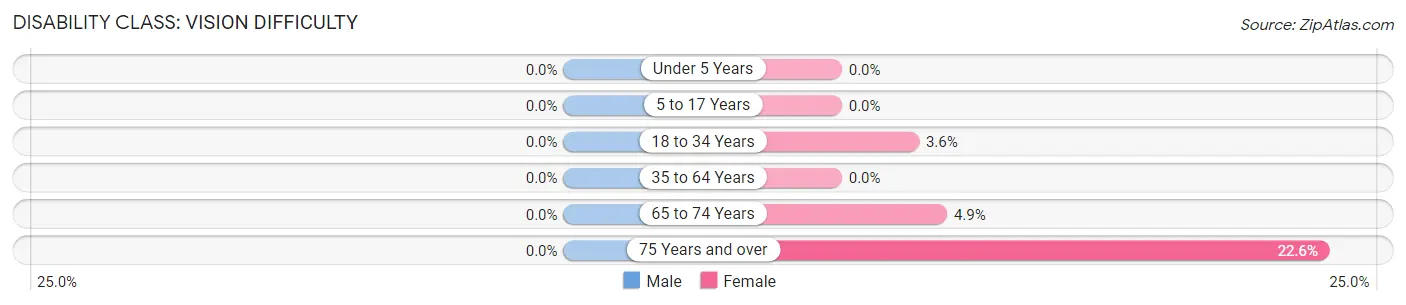
| Age Bracket | Male | Female |
| Under 5 Years | 0 (0.0%) | 0 (0.0%) |
| 5 to 17 Years | 0 (0.0%) | 0 (0.0%) |
| 18 to 34 Years | 0 (0.0%) | 12 (3.6%) |
| 35 to 64 Years | 0 (0.0%) | 0 (0.0%) |
| 65 to 74 Years | 0 (0.0%) | 12 (4.9%) |
| 75 Years and over | 0 (0.0%) | 36 (22.6%) |
Disability Class: Cognitive Difficulty
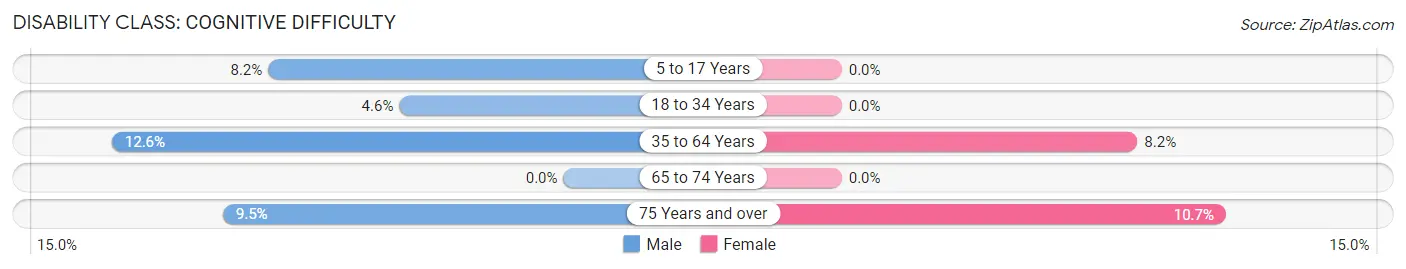
| Age Bracket | Male | Female |
| 5 to 17 Years | 12 (8.2%) | 0 (0.0%) |
| 18 to 34 Years | 16 (4.6%) | 0 (0.0%) |
| 35 to 64 Years | 44 (12.6%) | 34 (8.2%) |
| 65 to 74 Years | 0 (0.0%) | 0 (0.0%) |
| 75 Years and over | 11 (9.5%) | 17 (10.7%) |
Disability Class: Ambulatory Difficulty
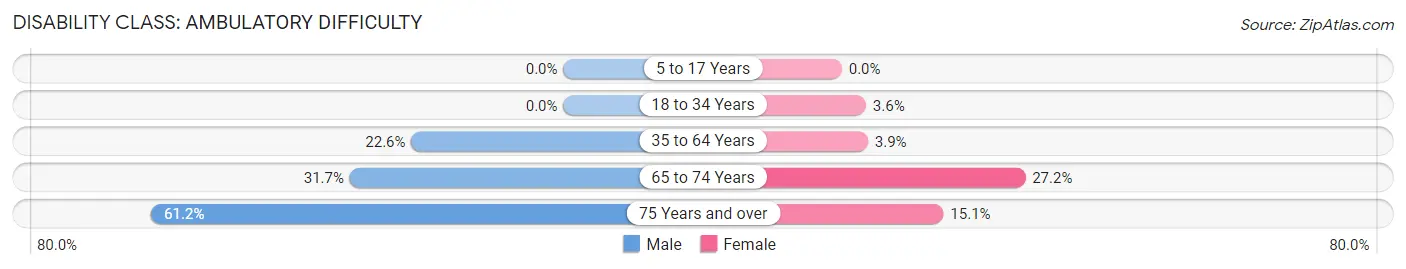
| Age Bracket | Male | Female |
| 5 to 17 Years | 0 (0.0%) | 0 (0.0%) |
| 18 to 34 Years | 0 (0.0%) | 12 (3.6%) |
| 35 to 64 Years | 79 (22.6%) | 16 (3.9%) |
| 65 to 74 Years | 26 (31.7%) | 67 (27.2%) |
| 75 Years and over | 71 (61.2%) | 24 (15.1%) |
Disability Class: Self-Care Difficulty
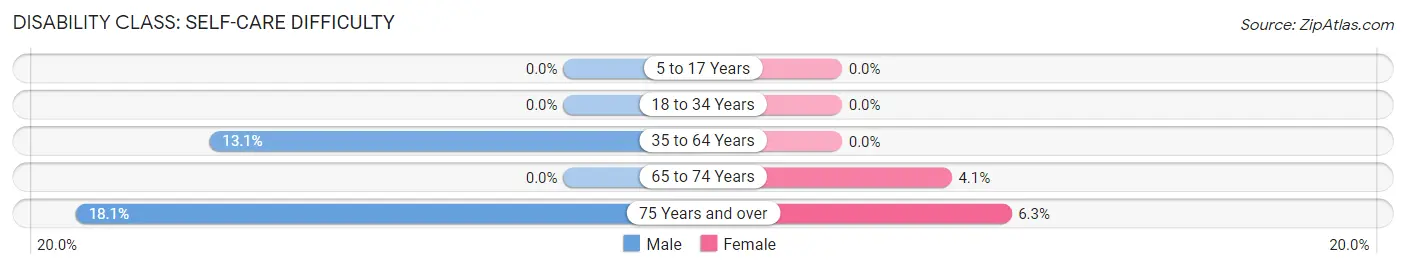
| Age Bracket | Male | Female |
| 5 to 17 Years | 0 (0.0%) | 0 (0.0%) |
| 18 to 34 Years | 0 (0.0%) | 0 (0.0%) |
| 35 to 64 Years | 46 (13.1%) | 0 (0.0%) |
| 65 to 74 Years | 0 (0.0%) | 10 (4.1%) |
| 75 Years and over | 21 (18.1%) | 10 (6.3%) |
Technology Access in Oak Harbor
Computing Device Access in Oak Harbor
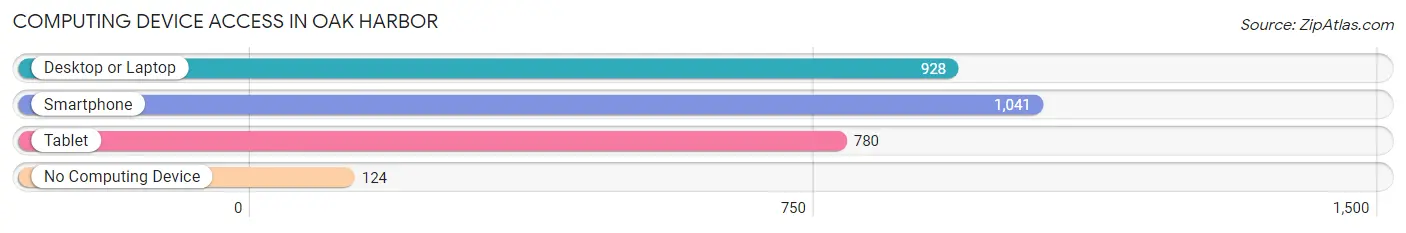
| Device Type | # Households | % Households |
| Desktop or Laptop | 928 | 74.9% |
| Smartphone | 1,041 | 84.0% |
| Tablet | 780 | 62.9% |
| No Computing Device | 124 | 10.0% |
| Total | 1,239 | 100.0% |
Internet Access in Oak Harbor
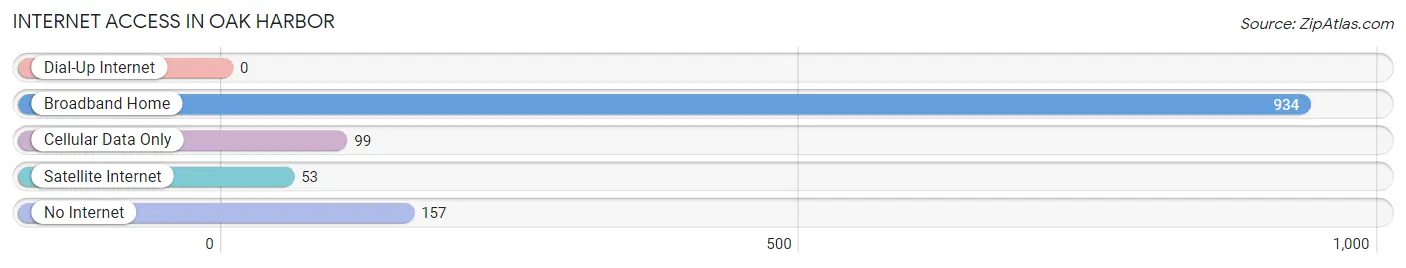
| Internet Type | # Households | % Households |
| Dial-Up Internet | 0 | 0.0% |
| Broadband Home | 934 | 75.4% |
| Cellular Data Only | 99 | 8.0% |
| Satellite Internet | 53 | 4.3% |
| No Internet | 157 | 12.7% |
| Total | 1,239 | 100.0% |
Oak Harbor Summary
History
The city of Oak Harbor, Ohio is located in Ottawa County in the northwest corner of the state. It is situated on the shores of Lake Erie and is part of the Toledo Metropolitan Area. The city was founded in 1835 by a group of settlers from New England who were looking for a place to settle and start a new life. The city was named after the large oak trees that grew in the area.
The city of Oak Harbor has a rich history that dates back to the early 1800s. The first settlers arrived in the area in 1835 and the city was officially incorporated in 1854. The city was a major port for the Great Lakes region and was a major hub for the shipping industry. The city was also home to a large number of factories and businesses, including a glass factory, a paper mill, and a foundry.
The city of Oak Harbor experienced a period of growth and prosperity in the late 19th and early 20th centuries. The city was home to a number of prominent businesses, including the Oak Harbor Glass Company, the Oak Harbor Paper Mill, and the Oak Harbor Foundry. The city also had a thriving agricultural industry, with a number of farms and orchards in the area.
The city of Oak Harbor experienced a period of decline in the mid-20th century, as the shipping industry moved away from the area and the factories and businesses closed. The city was hit hard by the Great Depression and the population declined significantly. The city was able to rebound in the late 20th century, as the city began to attract new businesses and industries.
Geography
Oak Harbor is located in the northwest corner of Ohio, on the shores of Lake Erie. The city is situated in Ottawa County and is part of the Toledo Metropolitan Area. The city is located approximately 40 miles east of Toledo and 60 miles west of Cleveland.
The city of Oak Harbor is situated on the western shore of Lake Erie. The city is surrounded by a number of small lakes and ponds, including Lake Erie, Lake St. Clair, and the Maumee River. The city is also home to a number of parks and recreational areas, including the Oak Harbor State Park and the Oak Harbor Wildlife Area.
The city of Oak Harbor has a total area of 4.3 square miles, of which 4.2 square miles is land and 0.1 square miles is water. The city has a humid continental climate, with hot summers and cold winters.
Economy
The economy of Oak Harbor is largely based on manufacturing and agriculture. The city is home to a number of factories and businesses, including the Oak Harbor Glass Company, the Oak Harbor Paper Mill, and the Oak Harbor Foundry. The city is also home to a number of agricultural businesses, including farms and orchards.
The city of Oak Harbor is also home to a number of retail businesses, including a number of restaurants, shops, and stores. The city is also home to a number of tourist attractions, including the Oak Harbor State Park and the Oak Harbor Wildlife Area.
Demographics
The population of Oak Harbor, Ohio was 5,717 as of the 2010 census. The city has a population density of 1,323 people per square mile. The median age of the population is 43.7 years, and the median household income is $45,945.
The racial makeup of the city is 95.3% White, 1.2% African American, 0.4% Native American, 0.7% Asian, 0.1% Pacific Islander, 0.7% from other races, and 1.6% from two or more races. The city is also home to a large number of Hispanic and Latino residents, making up 4.2% of the population.
Conclusion
Oak Harbor, Ohio is a city located in Ottawa County in the northwest corner of the state. The city was founded in 1835 and has a rich history that dates back to the early 1800s. The city is situated on the shores of Lake Erie and is part of the Toledo Metropolitan Area. The city has a population of 5,717 as of the 2010 census and has a humid continental climate, with hot summers and cold winters. The economy of Oak Harbor is largely based on manufacturing and agriculture, and the city is home to a number of factories and businesses, as well as a number of retail businesses and tourist attractions. The racial makeup of the city is 95.3% White, 1.2% African American, 0.4% Native American, 0.7% Asian, 0.1% Pacific Islander, 0.7% from other races, and 1.6% from two or more races. The city is also home to a large number of Hispanic and Latino residents, making up 4.2% of the population.
Common Questions
What is Per Capita Income in Oak Harbor?
Per Capita income in Oak Harbor is $33,911.
What is the Median Family Income in Oak Harbor?
Median Family Income in Oak Harbor is $78,229.
What is the Median Household income in Oak Harbor?
Median Household Income in Oak Harbor is $50,362.
What is Income or Wage Gap in Oak Harbor?
Income or Wage Gap in Oak Harbor is 27.2%.
Women in Oak Harbor earn 72.8 cents for every dollar earned by a man.
What is Inequality or Gini Index in Oak Harbor?
Inequality or Gini Index in Oak Harbor is 0.42.
What is the Total Population of Oak Harbor?
Total Population of Oak Harbor is 2,521.
What is the Total Male Population of Oak Harbor?
Total Male Population of Oak Harbor is 1,146.
What is the Total Female Population of Oak Harbor?
Total Female Population of Oak Harbor is 1,375.
What is the Ratio of Males per 100 Females in Oak Harbor?
There are 83.35 Males per 100 Females in Oak Harbor.
What is the Ratio of Females per 100 Males in Oak Harbor?
There are 119.98 Females per 100 Males in Oak Harbor.
What is the Median Population Age in Oak Harbor?
Median Population Age in Oak Harbor is 37.9 Years.
What is the Average Family Size in Oak Harbor
Average Family Size in Oak Harbor is 2.8 People.
What is the Average Household Size in Oak Harbor
Average Household Size in Oak Harbor is 2.0 People.
How Large is the Labor Force in Oak Harbor?
There are 1,189 People in the Labor Forcein in Oak Harbor.
What is the Percentage of People in the Labor Force in Oak Harbor?
57.2% of People are in the Labor Force in Oak Harbor.
What is the Unemployment Rate in Oak Harbor?
Unemployment Rate in Oak Harbor is 3.3%.