Norton, OH Map & Demographics
Norton Map
Norton Overview
$39,918
PER CAPITA INCOME
$91,976
AVG FAMILY INCOME
$81,034
AVG HOUSEHOLD INCOME
39.5%
WAGE / INCOME GAP [ % ]
60.5¢/ $1
WAGE / INCOME GAP [ $ ]
0.39
INEQUALITY / GINI INDEX
11,643
TOTAL POPULATION
5,924
MALE POPULATION
5,719
FEMALE POPULATION
103.58
MALES / 100 FEMALES
96.54
FEMALES / 100 MALES
45.5
MEDIAN AGE
2.9
AVG FAMILY SIZE
2.4
AVG HOUSEHOLD SIZE
6,129
LABOR FORCE [ PEOPLE ]
63.7%
PERCENT IN LABOR FORCE
4.0%
UNEMPLOYMENT RATE
Norton Area Codes
Income in Norton
Income Overview in Norton
Per Capita Income in Norton is $39,918, while median incomes of families and households are $91,976 and $81,034 respectively.
| Characteristic | Number | Measure |
| Per Capita Income | 11,643 | $39,918 |
| Median Family Income | 3,223 | $91,976 |
| Mean Family Income | 3,223 | $111,212 |
| Median Household Income | 4,786 | $81,034 |
| Mean Household Income | 4,786 | $95,312 |
| Income Deficit | 3,223 | $0 |
| Wage / Income Gap (%) | 11,643 | 39.45% |
| Wage / Income Gap ($) | 11,643 | 60.55¢ per $1 |
| Gini / Inequality Index | 11,643 | 0.39 |
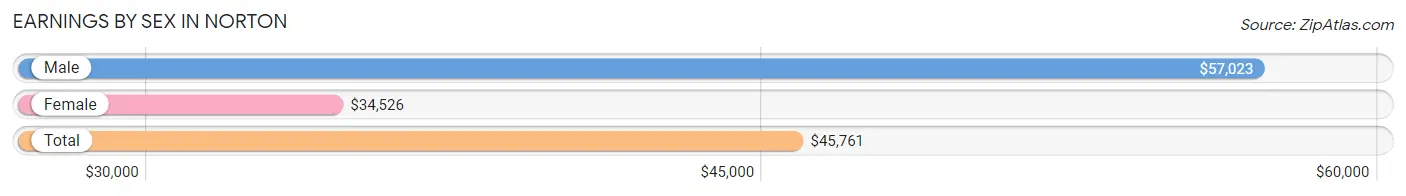
Earnings by Sex in Norton
Average Earnings in Norton are $45,761, $57,023 for men and $34,526 for women, a difference of 39.5%.
| Sex | Number | Average Earnings |
| Male | 3,361 (53.5%) | $57,023 |
| Female | 2,920 (46.5%) | $34,526 |
| Total | 6,281 (100.0%) | $45,761 |
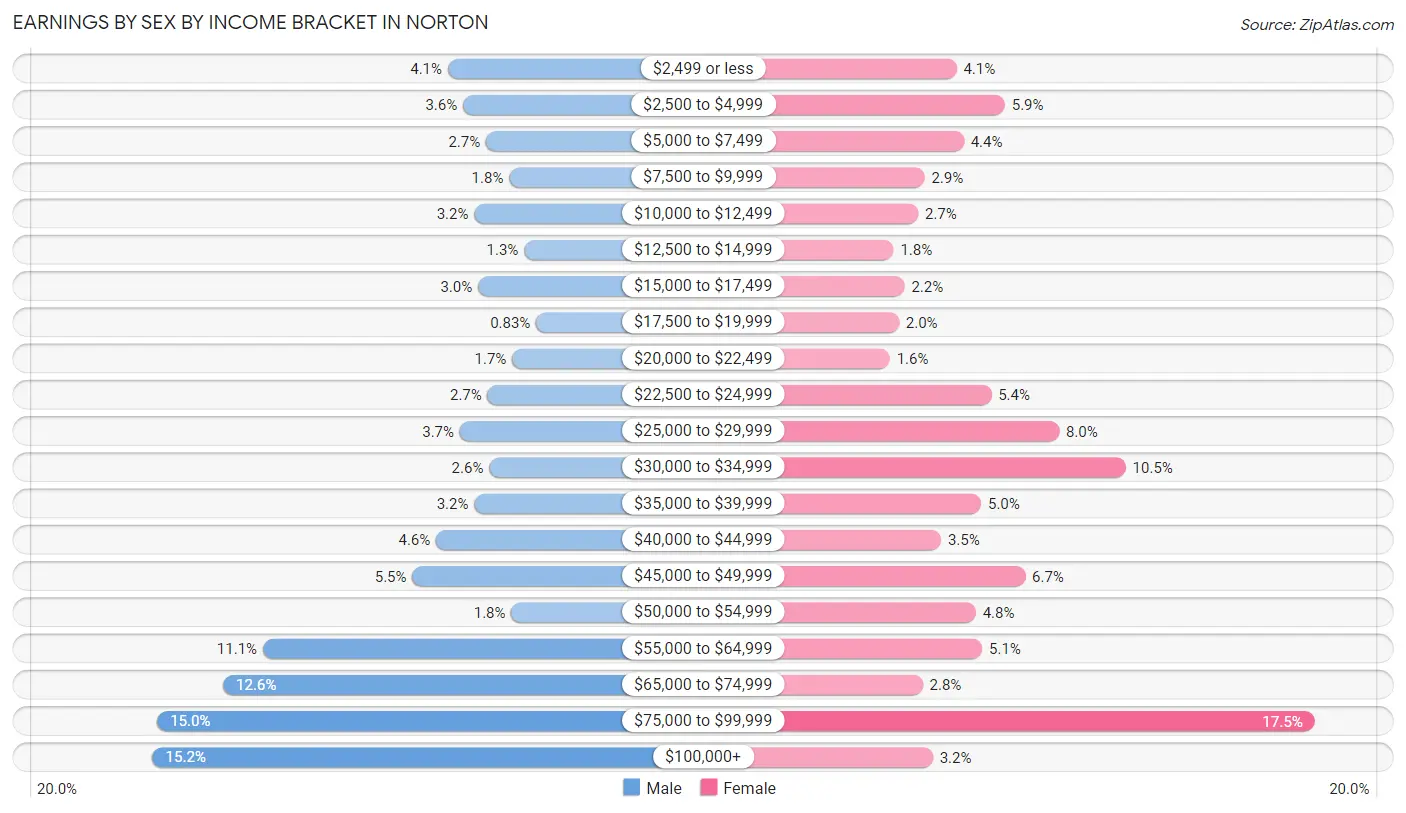
Earnings by Sex by Income Bracket in Norton
The most common earnings brackets in Norton are $100,000+ for men (511 | 15.2%) and $75,000 to $99,999 for women (512 | 17.5%).
| Income | Male | Female |
| $2,499 or less | 139 (4.1%) | 120 (4.1%) |
| $2,500 to $4,999 | 120 (3.6%) | 173 (5.9%) |
| $5,000 to $7,499 | 91 (2.7%) | 128 (4.4%) |
| $7,500 to $9,999 | 62 (1.8%) | 85 (2.9%) |
| $10,000 to $12,499 | 106 (3.2%) | 78 (2.7%) |
| $12,500 to $14,999 | 43 (1.3%) | 51 (1.8%) |
| $15,000 to $17,499 | 101 (3.0%) | 63 (2.2%) |
| $17,500 to $19,999 | 28 (0.8%) | 57 (1.9%) |
| $20,000 to $22,499 | 58 (1.7%) | 47 (1.6%) |
| $22,500 to $24,999 | 89 (2.6%) | 158 (5.4%) |
| $25,000 to $29,999 | 124 (3.7%) | 232 (8.0%) |
| $30,000 to $34,999 | 87 (2.6%) | 305 (10.4%) |
| $35,000 to $39,999 | 106 (3.2%) | 147 (5.0%) |
| $40,000 to $44,999 | 154 (4.6%) | 103 (3.5%) |
| $45,000 to $49,999 | 184 (5.5%) | 195 (6.7%) |
| $50,000 to $54,999 | 59 (1.8%) | 141 (4.8%) |
| $55,000 to $64,999 | 372 (11.1%) | 148 (5.1%) |
| $65,000 to $74,999 | 422 (12.6%) | 83 (2.8%) |
| $75,000 to $99,999 | 505 (15.0%) | 512 (17.5%) |
| $100,000+ | 511 (15.2%) | 94 (3.2%) |
| Total | 3,361 (100.0%) | 2,920 (100.0%) |
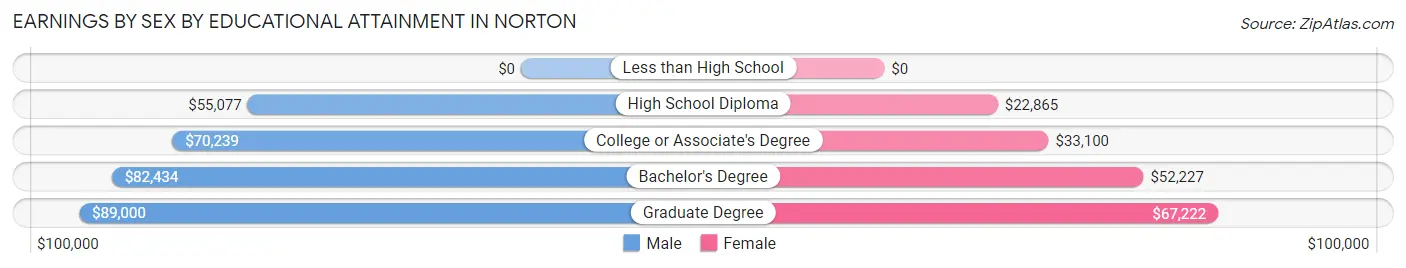
Earnings by Sex by Educational Attainment in Norton
Average earnings in Norton are $64,519 for men and $37,083 for women, a difference of 42.5%. Men with an educational attainment of graduate degree enjoy the highest average annual earnings of $89,000, while those with high school diploma education earn the least with $55,077. Women with an educational attainment of graduate degree earn the most with the average annual earnings of $67,222, while those with high school diploma education have the smallest earnings of $22,865.
| Educational Attainment | Male Income | Female Income |
| Less than High School | - | - |
| High School Diploma | $55,077 | $22,865 |
| College or Associate's Degree | $70,239 | $33,100 |
| Bachelor's Degree | $82,434 | $52,227 |
| Graduate Degree | $89,000 | $67,222 |
| Total | $64,519 | $37,083 |
Family Income in Norton
Family Income Brackets in Norton
According to the Norton family income data, there are 844 families falling into the $100,000 to $149,999 income range, which is the most common income bracket and makes up 26.2% of all families. Conversely, the $10,000 to $14,999 income bracket is the least frequent group with only 29 families (0.9%) belonging to this category.
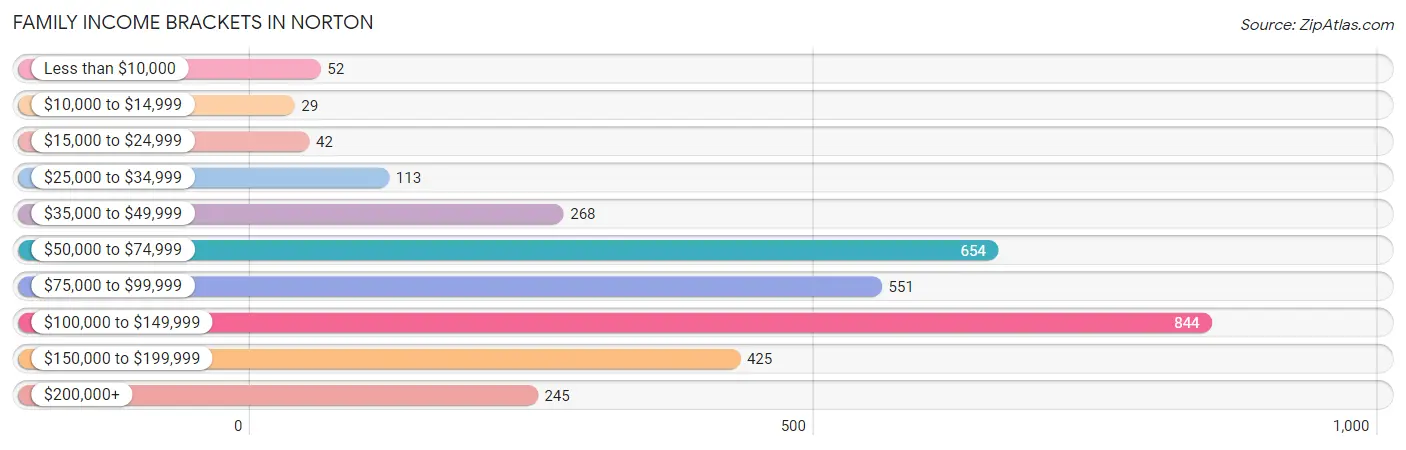
| Income Bracket | # Families | % Families |
| Less than $10,000 | 52 | 1.6% |
| $10,000 to $14,999 | 29 | 0.9% |
| $15,000 to $24,999 | 42 | 1.3% |
| $25,000 to $34,999 | 113 | 3.5% |
| $35,000 to $49,999 | 268 | 8.3% |
| $50,000 to $74,999 | 654 | 20.3% |
| $75,000 to $99,999 | 551 | 17.1% |
| $100,000 to $149,999 | 844 | 26.2% |
| $150,000 to $199,999 | 425 | 13.2% |
| $200,000+ | 245 | 7.6% |
Family Income by Famaliy Size in Norton
5-person families (116 | 3.6%) account for the highest median family income in Norton with $157,833 per family, while 2-person families (1,783 | 55.3%) have the highest median income of $40,162 per family member.
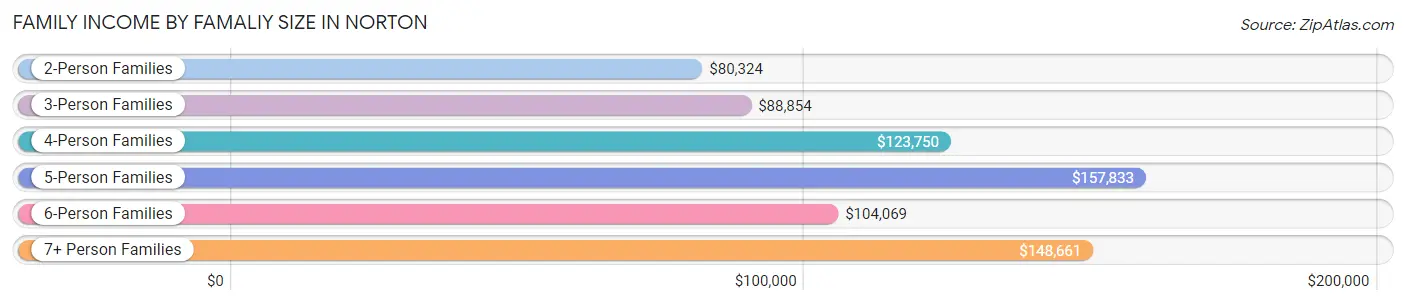
| Income Bracket | # Families | Median Income |
| 2-Person Families | 1,783 (55.3%) | $80,324 |
| 3-Person Families | 560 (17.4%) | $88,854 |
| 4-Person Families | 662 (20.5%) | $123,750 |
| 5-Person Families | 116 (3.6%) | $157,833 |
| 6-Person Families | 65 (2.0%) | $104,069 |
| 7+ Person Families | 37 (1.1%) | $148,661 |
| Total | 3,223 (100.0%) | $91,976 |
Family Income by Number of Earners in Norton
The median family income in Norton is $91,976, with families comprising 3+ earners (415) having the highest median family income of $140,950, while families with no earners (605) have the lowest median family income of $63,650, accounting for 12.9% and 18.8% of families, respectively.
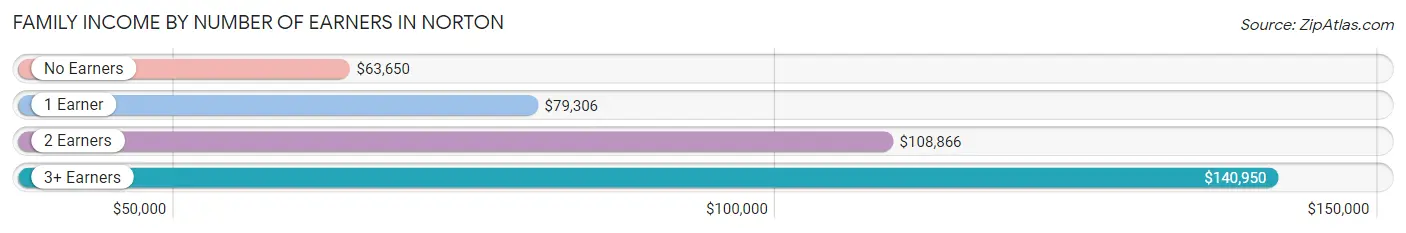
| Number of Earners | # Families | Median Income |
| No Earners | 605 (18.8%) | $63,650 |
| 1 Earner | 966 (30.0%) | $79,306 |
| 2 Earners | 1,237 (38.4%) | $108,866 |
| 3+ Earners | 415 (12.9%) | $140,950 |
| Total | 3,223 (100.0%) | $91,976 |
Household Income in Norton
Household Income Brackets in Norton
With 1,149 households falling in the category, the $100,000 to $149,999 income range is the most frequent in Norton, accounting for 24.0% of all households. In contrast, only 72 households (1.5%) fall into the $10,000 to $14,999 income bracket, making it the least populous group.
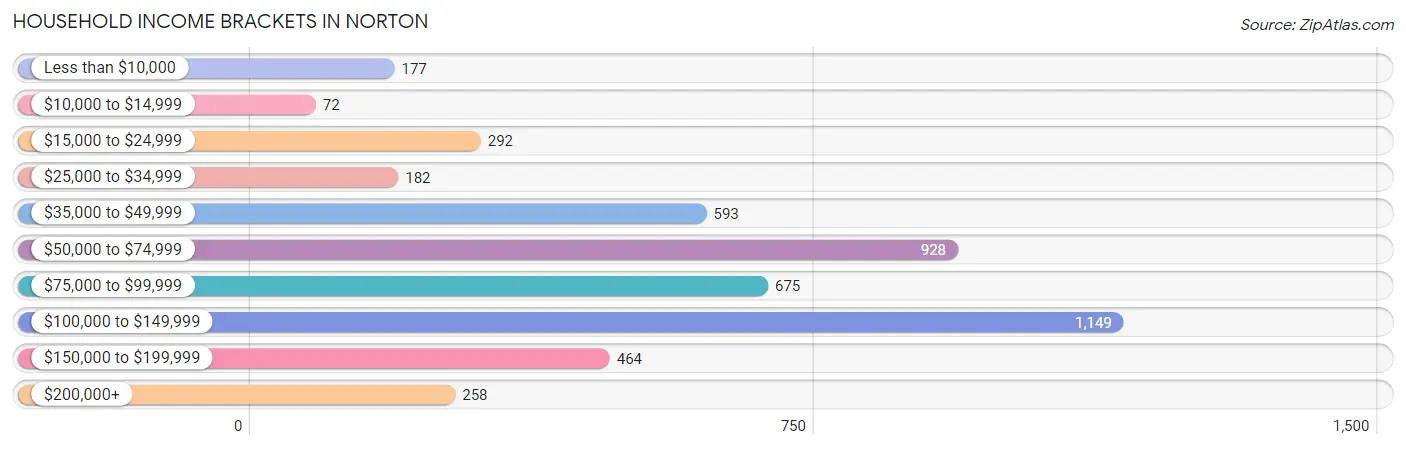
| Income Bracket | # Households | % Households |
| Less than $10,000 | 177 | 3.7% |
| $10,000 to $14,999 | 72 | 1.5% |
| $15,000 to $24,999 | 292 | 6.1% |
| $25,000 to $34,999 | 182 | 3.8% |
| $35,000 to $49,999 | 593 | 12.4% |
| $50,000 to $74,999 | 928 | 19.4% |
| $75,000 to $99,999 | 675 | 14.1% |
| $100,000 to $149,999 | 1,149 | 24.0% |
| $150,000 to $199,999 | 464 | 9.7% |
| $200,000+ | 258 | 5.4% |
Household Income by Householder Age in Norton
The median household income in Norton is $81,034, with the highest median household income of $96,111 found in the 45 to 64 years age bracket for the primary householder. A total of 1,976 households (41.3%) fall into this category. Meanwhile, the 15 to 24 years age bracket for the primary householder has the lowest median household income of $45,700, with 58 households (1.2%) in this group.
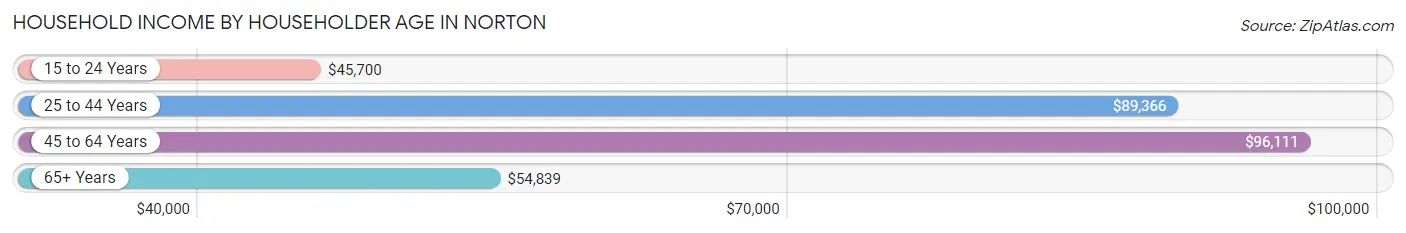
| Income Bracket | # Households | Median Income |
| 15 to 24 Years | 58 (1.2%) | $45,700 |
| 25 to 44 Years | 1,168 (24.4%) | $89,366 |
| 45 to 64 Years | 1,976 (41.3%) | $96,111 |
| 65+ Years | 1,584 (33.1%) | $54,839 |
| Total | 4,786 (100.0%) | $81,034 |
Poverty in Norton
Income Below Poverty by Sex and Age in Norton
With 6.6% poverty level for males and 7.2% for females among the residents of Norton, 5 year old males and 25 to 34 year old females are the most vulnerable to poverty, with 16 males (27.1%) and 144 females (27.4%) in their respective age groups living below the poverty level.
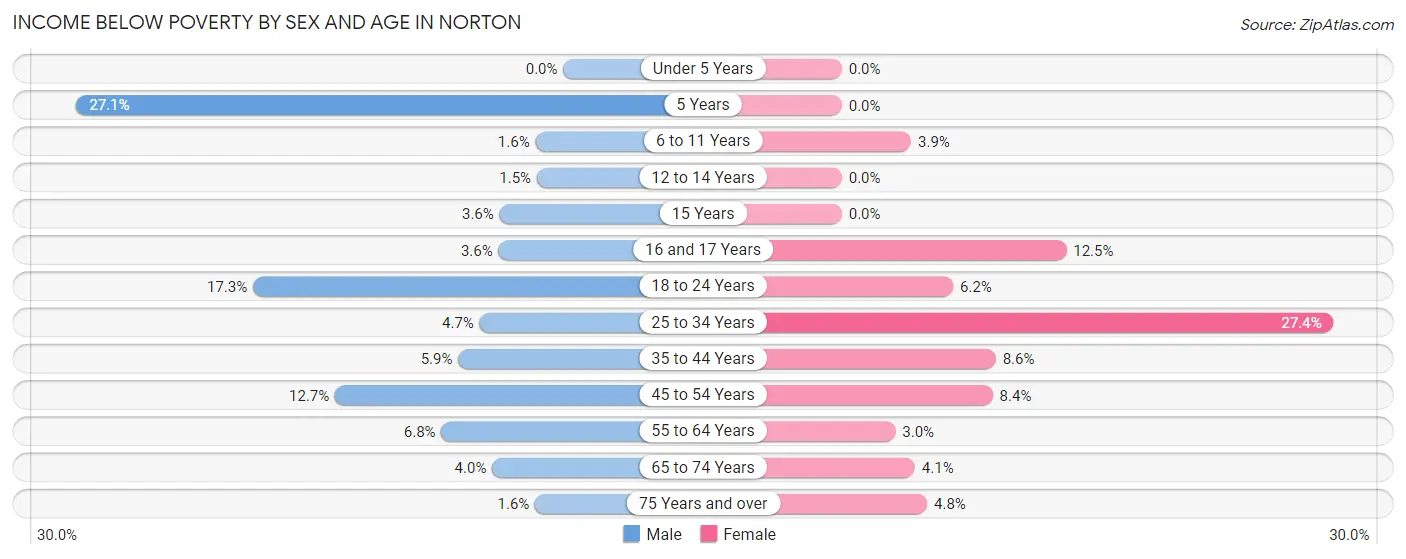
| Age Bracket | Male | Female |
| Under 5 Years | 0 (0.0%) | 0 (0.0%) |
| 5 Years | 16 (27.1%) | 0 (0.0%) |
| 6 to 11 Years | 7 (1.5%) | 16 (3.9%) |
| 12 to 14 Years | 2 (1.5%) | 0 (0.0%) |
| 15 Years | 6 (3.5%) | 0 (0.0%) |
| 16 and 17 Years | 6 (3.6%) | 14 (12.5%) |
| 18 to 24 Years | 75 (17.3%) | 22 (6.2%) |
| 25 to 34 Years | 32 (4.7%) | 144 (27.4%) |
| 35 to 44 Years | 44 (5.9%) | 60 (8.6%) |
| 45 to 54 Years | 115 (12.7%) | 63 (8.4%) |
| 55 to 64 Years | 47 (6.8%) | 27 (3.0%) |
| 65 to 74 Years | 29 (4.0%) | 36 (4.1%) |
| 75 Years and over | 7 (1.6%) | 27 (4.8%) |
| Total | 386 (6.6%) | 409 (7.2%) |
Income Above Poverty by Sex and Age in Norton
According to the poverty statistics in Norton, males aged under 5 years and females aged under 5 years are the age groups that are most secure financially, with 100.0% of males and 100.0% of females in these age groups living above the poverty line.
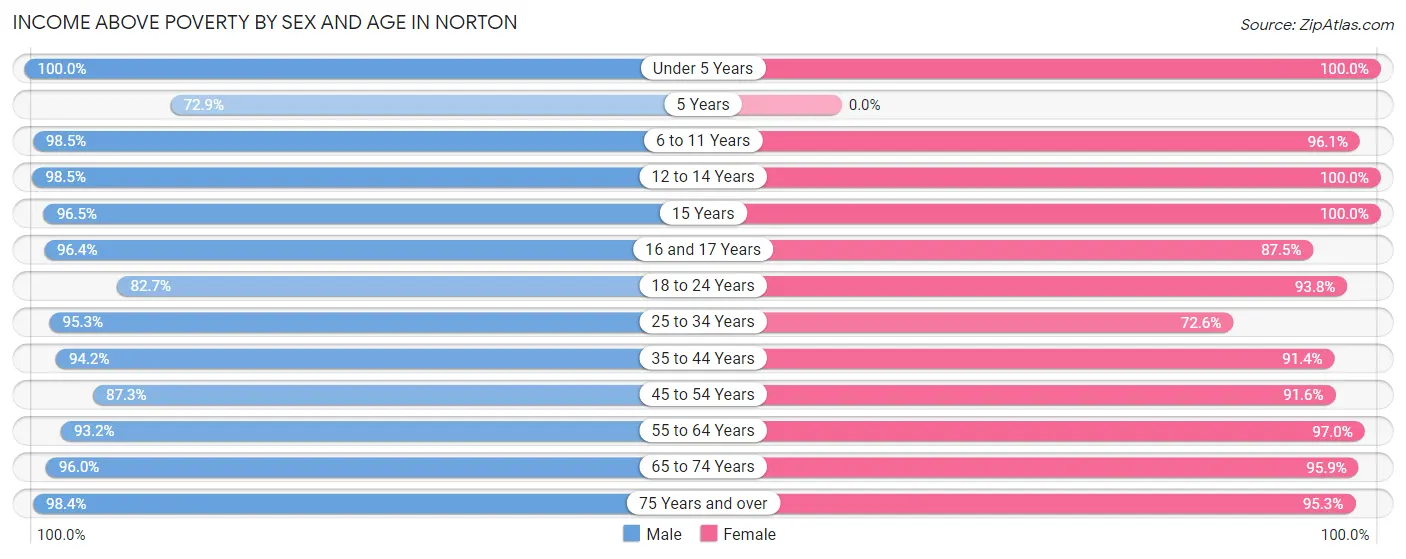
| Age Bracket | Male | Female |
| Under 5 Years | 230 (100.0%) | 184 (100.0%) |
| 5 Years | 43 (72.9%) | 0 (0.0%) |
| 6 to 11 Years | 446 (98.5%) | 398 (96.1%) |
| 12 to 14 Years | 134 (98.5%) | 203 (100.0%) |
| 15 Years | 163 (96.5%) | 65 (100.0%) |
| 16 and 17 Years | 160 (96.4%) | 98 (87.5%) |
| 18 to 24 Years | 359 (82.7%) | 333 (93.8%) |
| 25 to 34 Years | 655 (95.3%) | 382 (72.6%) |
| 35 to 44 Years | 708 (94.2%) | 640 (91.4%) |
| 45 to 54 Years | 790 (87.3%) | 687 (91.6%) |
| 55 to 64 Years | 645 (93.2%) | 879 (97.0%) |
| 65 to 74 Years | 704 (96.0%) | 849 (95.9%) |
| 75 Years and over | 440 (98.4%) | 542 (95.3%) |
| Total | 5,477 (93.4%) | 5,260 (92.8%) |
Income Below Poverty Among Married-Couple Families in Norton
The poverty statistics for married-couple families in Norton show that 0.8% or 20 of the total 2,580 families live below the poverty line. Families with no children have the highest poverty rate of 0.9%, comprising of 14 families. On the other hand, families with 3 or 4 children have the lowest poverty rate of 0.0%, which includes 0 families.
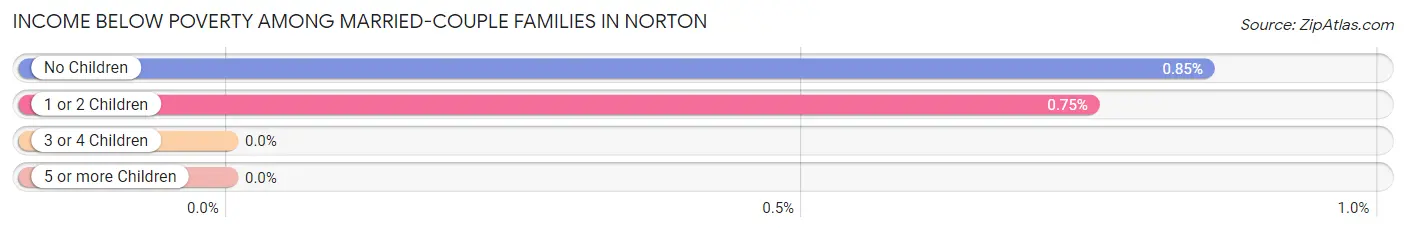
| Children | Above Poverty | Below Poverty |
| No Children | 1,629 (99.2%) | 14 (0.9%) |
| 1 or 2 Children | 791 (99.3%) | 6 (0.7%) |
| 3 or 4 Children | 140 (100.0%) | 0 (0.0%) |
| 5 or more Children | 0 (0.0%) | 0 (0.0%) |
| Total | 2,560 (99.2%) | 20 (0.8%) |
Income Below Poverty Among Single-Parent Households in Norton
According to the poverty data in Norton, 17.9% or 50 single-father households and 9.6% or 35 single-mother households are living below the poverty line. Among single-father households, those with no children have the highest poverty rate, with 50 households (25.6%) experiencing poverty. Likewise, among single-mother households, those with 1 or 2 children have the highest poverty rate, with 29 households (13.0%) falling below the poverty line.
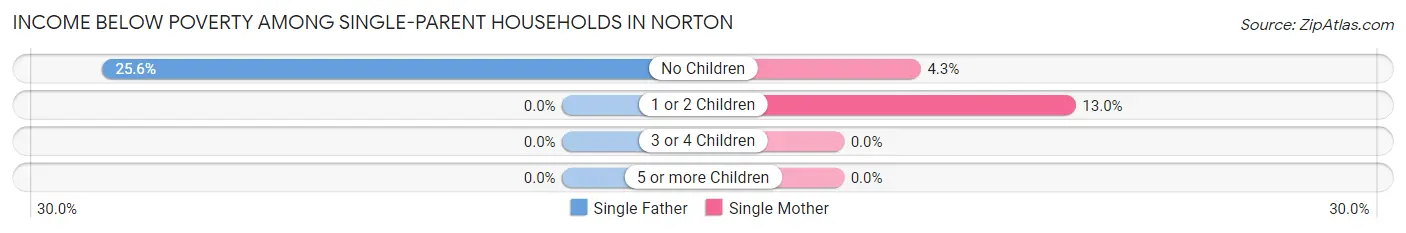
| Children | Single Father | Single Mother |
| No Children | 50 (25.6%) | 6 (4.3%) |
| 1 or 2 Children | 0 (0.0%) | 29 (13.0%) |
| 3 or 4 Children | 0 (0.0%) | 0 (0.0%) |
| 5 or more Children | 0 (0.0%) | 0 (0.0%) |
| Total | 50 (17.9%) | 35 (9.6%) |
Income Below Poverty Among Married-Couple vs Single-Parent Households in Norton
The poverty data for Norton shows that 20 of the married-couple family households (0.8%) and 85 of the single-parent households (13.2%) are living below the poverty level. Within the married-couple family households, those with no children have the highest poverty rate, with 14 households (0.9%) falling below the poverty line. Among the single-parent households, those with no children have the highest poverty rate, with 56 household (16.7%) living below poverty.
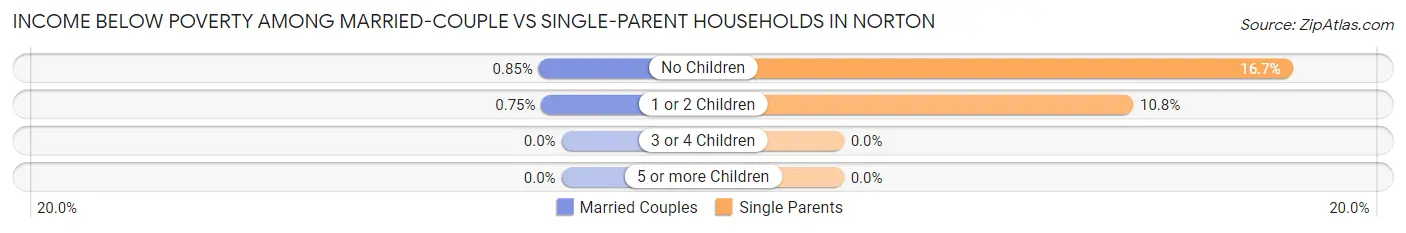
| Children | Married-Couple Families | Single-Parent Households |
| No Children | 14 (0.9%) | 56 (16.7%) |
| 1 or 2 Children | 6 (0.7%) | 29 (10.8%) |
| 3 or 4 Children | 0 (0.0%) | 0 (0.0%) |
| 5 or more Children | 0 (0.0%) | 0 (0.0%) |
| Total | 20 (0.8%) | 85 (13.2%) |
Race in Norton
The most populous races in Norton are White / Caucasian (10,709 | 92.0%), Two or more Races (409 | 3.5%), and Black / African American (314 | 2.7%).
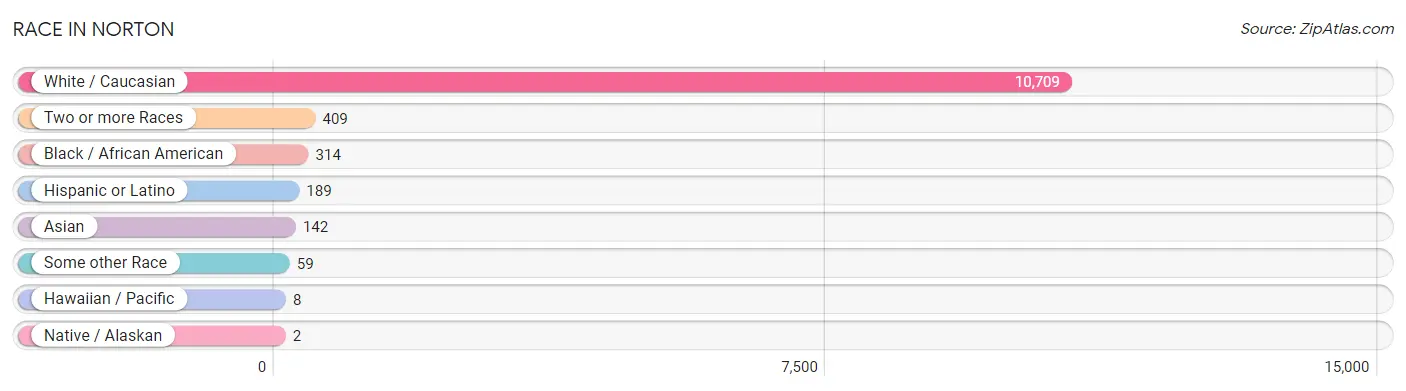
| Race | # Population | % Population |
| Asian | 142 | 1.2% |
| Black / African American | 314 | 2.7% |
| Hawaiian / Pacific | 8 | 0.1% |
| Hispanic or Latino | 189 | 1.6% |
| Native / Alaskan | 2 | 0.0% |
| White / Caucasian | 10,709 | 92.0% |
| Two or more Races | 409 | 3.5% |
| Some other Race | 59 | 0.5% |
| Total | 11,643 | 100.0% |
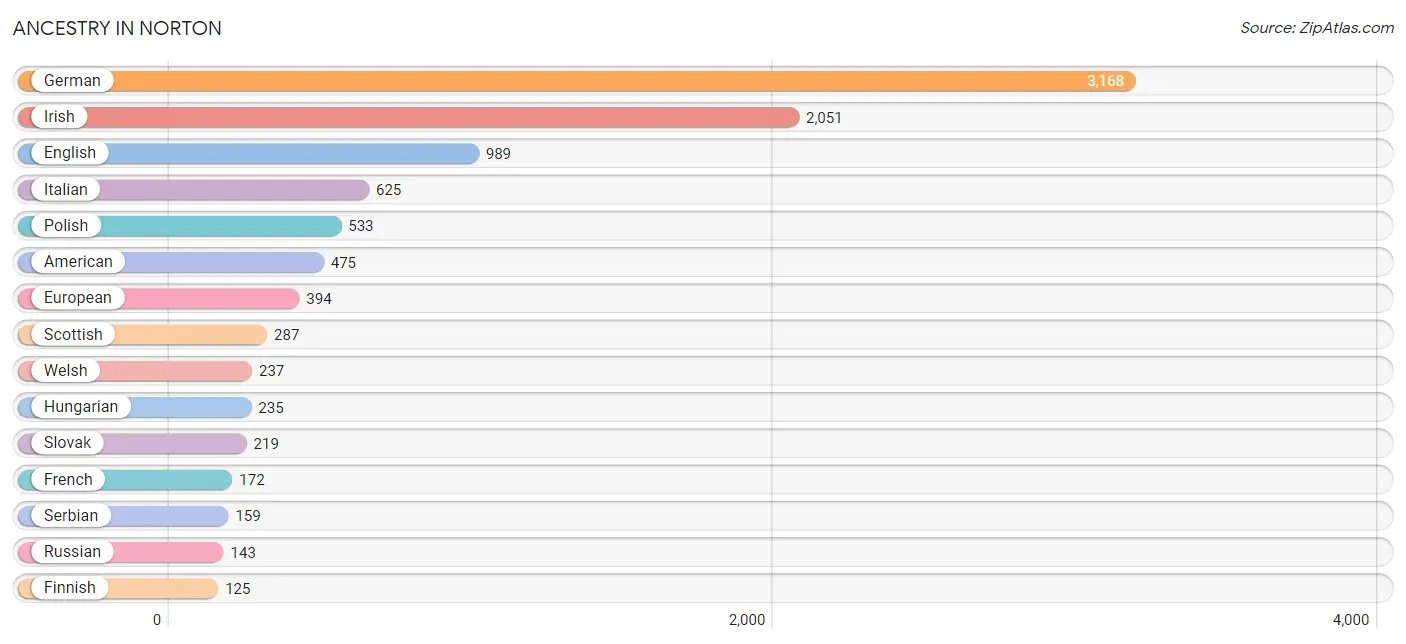
Ancestry in Norton
The most populous ancestries reported in Norton are German (3,168 | 27.2%), Irish (2,051 | 17.6%), English (989 | 8.5%), Italian (625 | 5.4%), and Polish (533 | 4.6%), together accounting for 63.3% of all Norton residents.
| Ancestry | # Population | % Population |
| African | 116 | 1.0% |
| American | 475 | 4.1% |
| Arab | 84 | 0.7% |
| Austrian | 45 | 0.4% |
| Brazilian | 9 | 0.1% |
| British | 42 | 0.4% |
| Canadian | 8 | 0.1% |
| Carpatho Rusyn | 26 | 0.2% |
| Cherokee | 15 | 0.1% |
| Chilean | 111 | 0.9% |
| Choctaw | 2 | 0.0% |
| Croatian | 62 | 0.5% |
| Czech | 32 | 0.3% |
| Danish | 7 | 0.1% |
| Dutch | 95 | 0.8% |
| Eastern European | 54 | 0.5% |
| English | 989 | 8.5% |
| European | 394 | 3.4% |
| Finnish | 125 | 1.1% |
| French | 172 | 1.5% |
| German | 3,168 | 27.2% |
| Greek | 10 | 0.1% |
| Hungarian | 235 | 2.0% |
| Indian (Asian) | 85 | 0.7% |
| Irish | 2,051 | 17.6% |
| Italian | 625 | 5.4% |
| Japanese | 12 | 0.1% |
| Lebanese | 84 | 0.7% |
| Lithuanian | 7 | 0.1% |
| Mexican | 55 | 0.5% |
| Northern European | 11 | 0.1% |
| Norwegian | 42 | 0.4% |
| Pennsylvania German | 18 | 0.2% |
| Polish | 533 | 4.6% |
| Portuguese | 25 | 0.2% |
| Puerto Rican | 16 | 0.1% |
| Romanian | 16 | 0.1% |
| Russian | 143 | 1.2% |
| Samoan | 8 | 0.1% |
| Scandinavian | 26 | 0.2% |
| Scotch-Irish | 79 | 0.7% |
| Scottish | 287 | 2.5% |
| Serbian | 159 | 1.4% |
| Slavic | 6 | 0.1% |
| Slovak | 219 | 1.9% |
| Slovene | 48 | 0.4% |
| South American | 118 | 1.0% |
| Sri Lankan | 7 | 0.1% |
| Subsaharan African | 116 | 1.0% |
| Swedish | 42 | 0.4% |
| Swiss | 31 | 0.3% |
| Ukrainian | 40 | 0.3% |
| Uruguayan | 7 | 0.1% |
| Welsh | 237 | 2.0% |
| West Indian | 91 | 0.8% |
| Yugoslavian | 11 | 0.1% | View All 56 Rows |
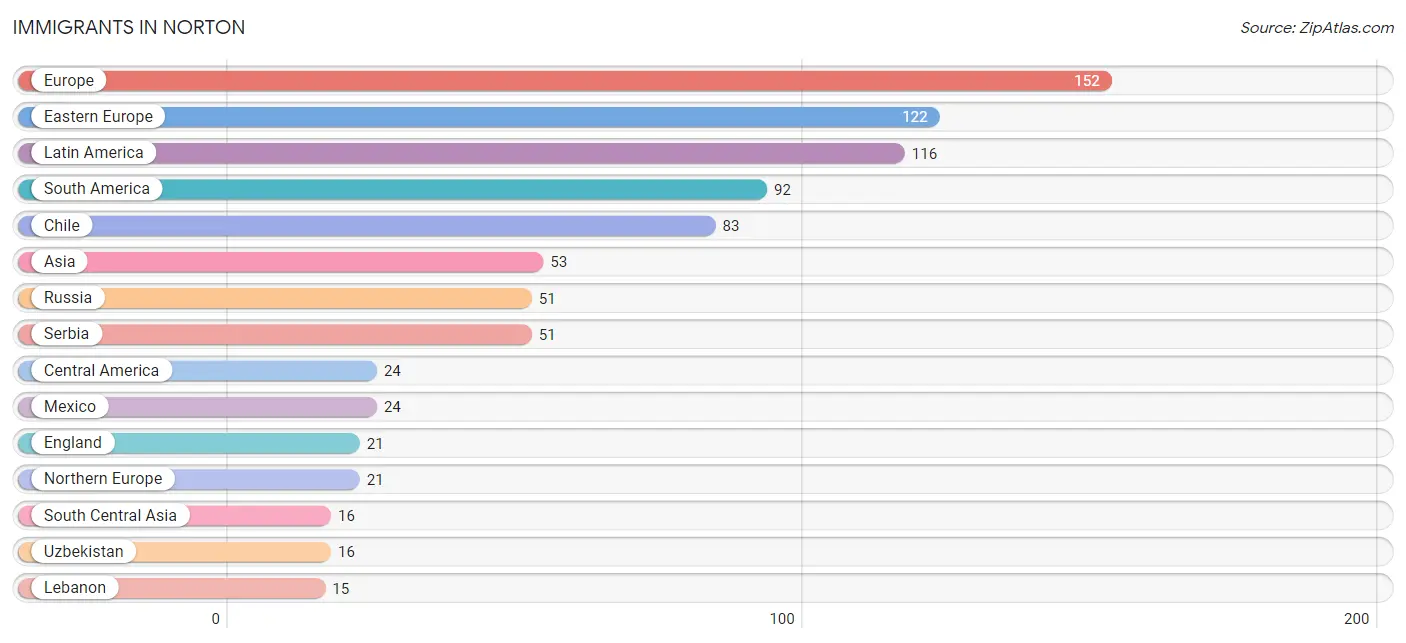
Immigrants in Norton
The most numerous immigrant groups reported in Norton came from Europe (152 | 1.3%), Eastern Europe (122 | 1.1%), Latin America (116 | 1.0%), South America (92 | 0.8%), and Chile (83 | 0.7%), together accounting for 4.9% of all Norton residents.
| Immigration Origin | # Population | % Population |
| Asia | 53 | 0.5% |
| Brazil | 9 | 0.1% |
| Cambodia | 12 | 0.1% |
| Canada | 9 | 0.1% |
| Central America | 24 | 0.2% |
| Chile | 83 | 0.7% |
| China | 10 | 0.1% |
| Czechoslovakia | 9 | 0.1% |
| Eastern Asia | 10 | 0.1% |
| Eastern Europe | 122 | 1.1% |
| England | 21 | 0.2% |
| Europe | 152 | 1.3% |
| Germany | 9 | 0.1% |
| Latin America | 116 | 1.0% |
| Lebanon | 15 | 0.1% |
| Mexico | 24 | 0.2% |
| Northern Europe | 21 | 0.2% |
| Russia | 51 | 0.4% |
| Serbia | 51 | 0.4% |
| South America | 92 | 0.8% |
| South Central Asia | 16 | 0.1% |
| South Eastern Asia | 12 | 0.1% |
| Uzbekistan | 16 | 0.1% |
| Western Asia | 15 | 0.1% |
| Western Europe | 9 | 0.1% | View All 25 Rows |
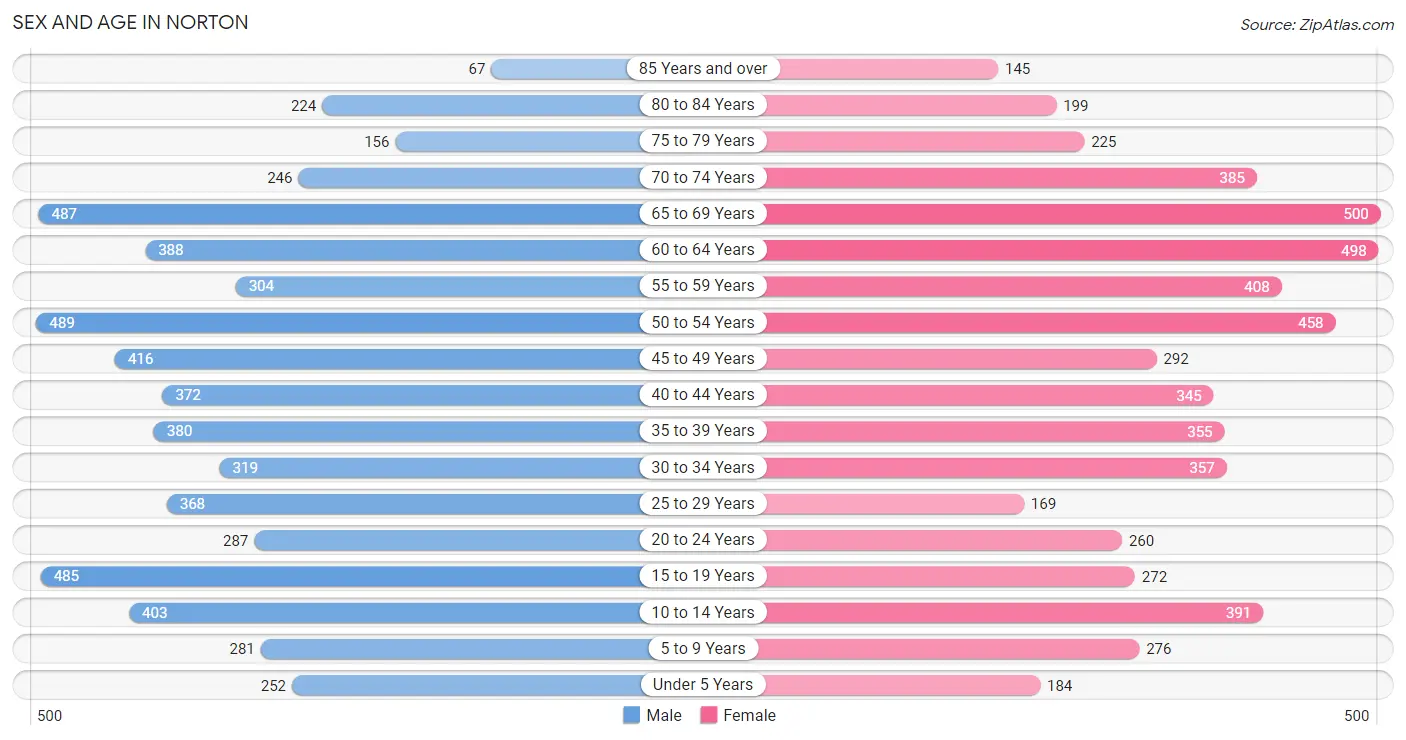
Sex and Age in Norton
Sex and Age in Norton
The most populous age groups in Norton are 50 to 54 Years (489 | 8.3%) for men and 65 to 69 Years (500 | 8.7%) for women.
| Age Bracket | Male | Female |
| Under 5 Years | 252 (4.3%) | 184 (3.2%) |
| 5 to 9 Years | 281 (4.7%) | 276 (4.8%) |
| 10 to 14 Years | 403 (6.8%) | 391 (6.8%) |
| 15 to 19 Years | 485 (8.2%) | 272 (4.8%) |
| 20 to 24 Years | 287 (4.8%) | 260 (4.5%) |
| 25 to 29 Years | 368 (6.2%) | 169 (3.0%) |
| 30 to 34 Years | 319 (5.4%) | 357 (6.2%) |
| 35 to 39 Years | 380 (6.4%) | 355 (6.2%) |
| 40 to 44 Years | 372 (6.3%) | 345 (6.0%) |
| 45 to 49 Years | 416 (7.0%) | 292 (5.1%) |
| 50 to 54 Years | 489 (8.3%) | 458 (8.0%) |
| 55 to 59 Years | 304 (5.1%) | 408 (7.1%) |
| 60 to 64 Years | 388 (6.6%) | 498 (8.7%) |
| 65 to 69 Years | 487 (8.2%) | 500 (8.7%) |
| 70 to 74 Years | 246 (4.2%) | 385 (6.7%) |
| 75 to 79 Years | 156 (2.6%) | 225 (3.9%) |
| 80 to 84 Years | 224 (3.8%) | 199 (3.5%) |
| 85 Years and over | 67 (1.1%) | 145 (2.5%) |
| Total | 5,924 (100.0%) | 5,719 (100.0%) |
Families and Households in Norton
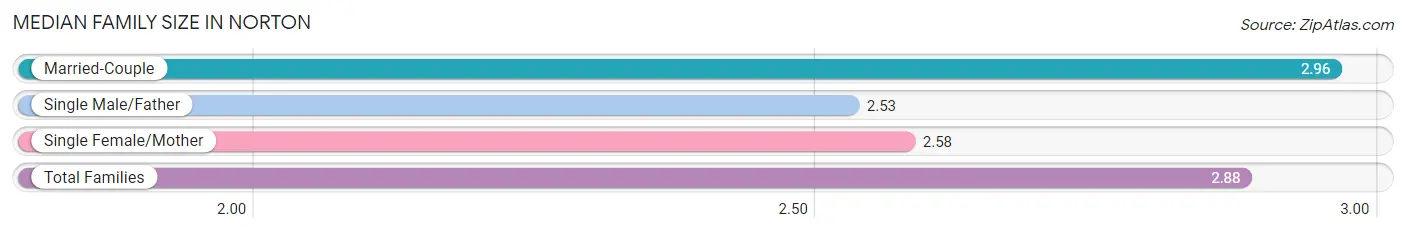
Median Family Size in Norton
The median family size in Norton is 2.88 persons per family, with married-couple families (2,580 | 80.0%) accounting for the largest median family size of 2.96 persons per family. On the other hand, single male/father families (279 | 8.7%) represent the smallest median family size with 2.53 persons per family.
| Family Type | # Families | Family Size |
| Married-Couple | 2,580 (80.0%) | 2.96 |
| Single Male/Father | 279 (8.7%) | 2.53 |
| Single Female/Mother | 364 (11.3%) | 2.58 |
| Total Families | 3,223 (100.0%) | 2.88 |
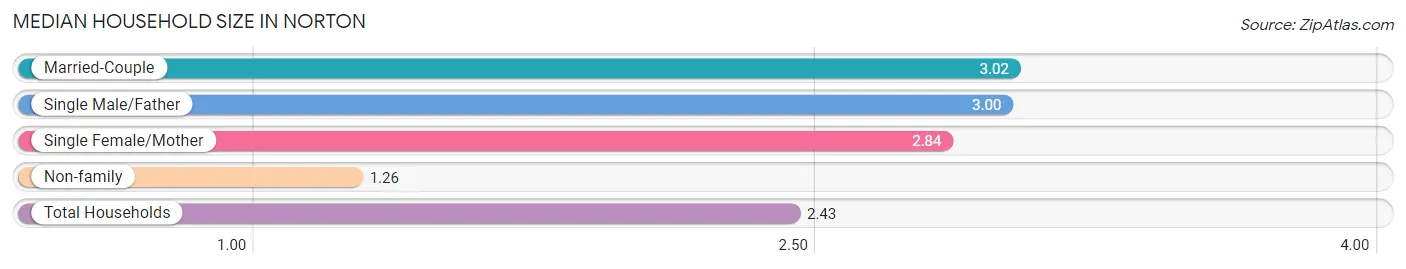
Median Household Size in Norton
The median household size in Norton is 2.43 persons per household, with married-couple households (2,580 | 53.9%) accounting for the largest median household size of 3.02 persons per household. non-family households (1,563 | 32.7%) represent the smallest median household size with 1.26 persons per household.
| Household Type | # Households | Household Size |
| Married-Couple | 2,580 (53.9%) | 3.02 |
| Single Male/Father | 279 (5.8%) | 3.00 |
| Single Female/Mother | 364 (7.6%) | 2.84 |
| Non-family | 1,563 (32.7%) | 1.26 |
| Total Households | 4,786 (100.0%) | 2.43 |
Household Size by Marriage Status in Norton
Out of a total of 4,786 households in Norton, 3,223 (67.3%) are family households, while 1,563 (32.7%) are nonfamily households. The most numerous type of family households are 2-person households, comprising 1,685, and the most common type of nonfamily households are 1-person households, comprising 1,223.
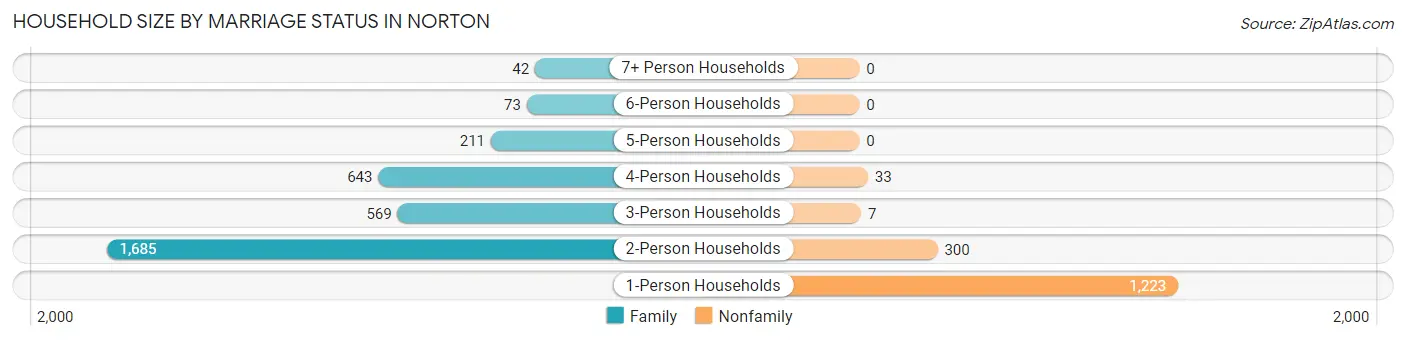
| Household Size | Family Households | Nonfamily Households |
| 1-Person Households | - | 1,223 (25.6%) |
| 2-Person Households | 1,685 (35.2%) | 300 (6.3%) |
| 3-Person Households | 569 (11.9%) | 7 (0.2%) |
| 4-Person Households | 643 (13.4%) | 33 (0.7%) |
| 5-Person Households | 211 (4.4%) | 0 (0.0%) |
| 6-Person Households | 73 (1.5%) | 0 (0.0%) |
| 7+ Person Households | 42 (0.9%) | 0 (0.0%) |
| Total | 3,223 (67.3%) | 1,563 (32.7%) |
Female Fertility in Norton
Fertility by Age in Norton
Average fertility rate in Norton is 16.0 births per 1,000 women. Women in the age bracket of 20 to 34 years have the highest fertility rate with 29.0 births per 1,000 women. Women in the age bracket of 20 to 34 years acount for 67.6% of all women with births.
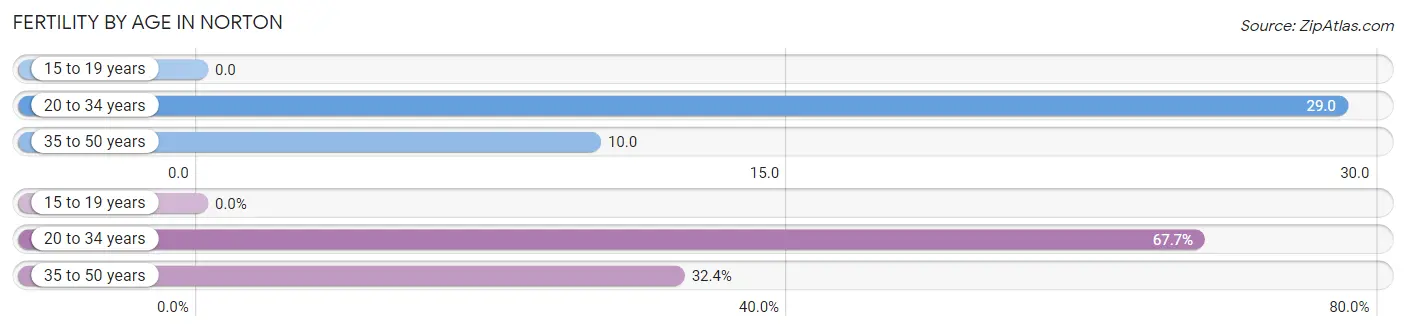
| Age Bracket | Women with Births | Births / 1,000 Women |
| 15 to 19 years | 0 (0.0%) | 0.0 |
| 20 to 34 years | 23 (67.6%) | 29.0 |
| 35 to 50 years | 11 (32.4%) | 10.0 |
| Total | 34 (100.0%) | 16.0 |
Fertility by Age by Marriage Status in Norton
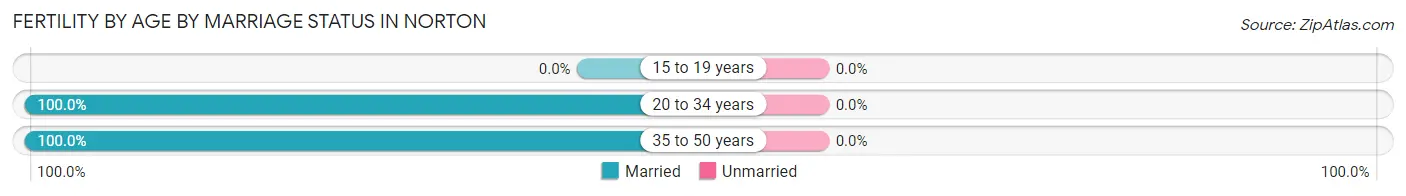
| Age Bracket | Married | Unmarried |
| 15 to 19 years | 0 (0.0%) | 0 (0.0%) |
| 20 to 34 years | 23 (100.0%) | 0 (0.0%) |
| 35 to 50 years | 11 (100.0%) | 0 (0.0%) |
| Total | 34 (100.0%) | 0 (0.0%) |
Fertility by Education in Norton
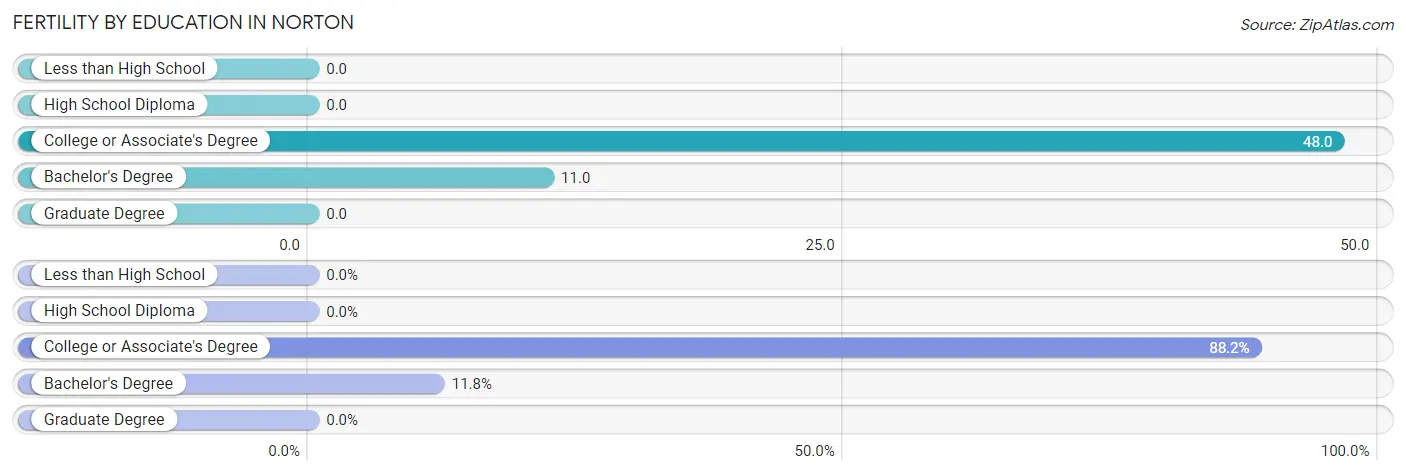
| Educational Attainment | Women with Births | Births / 1,000 Women |
| Less than High School | 0 (0.0%) | 0.0 |
| High School Diploma | 0 (0.0%) | 0.0 |
| College or Associate's Degree | 30 (88.2%) | 48.0 |
| Bachelor's Degree | 4 (11.8%) | 11.0 |
| Graduate Degree | 0 (0.0%) | 0.0 |
| Total | 34 (100.0%) | 16.0 |
Fertility by Education by Marriage Status in Norton
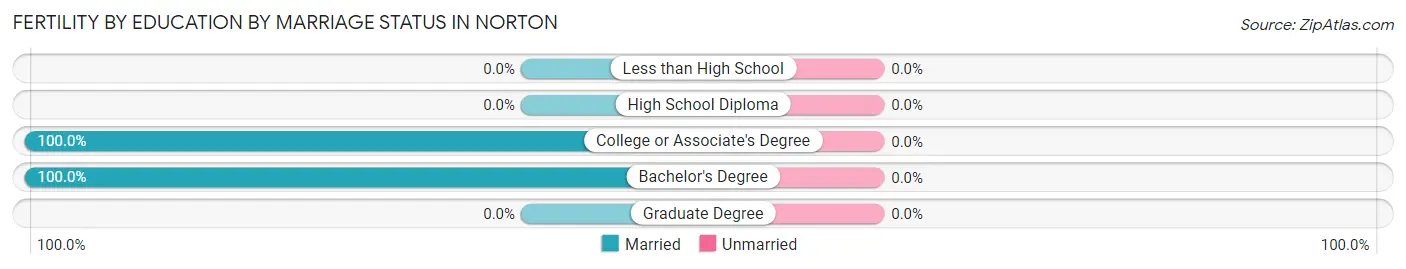
| Educational Attainment | Married | Unmarried |
| Less than High School | 0 (0.0%) | 0 (0.0%) |
| High School Diploma | 0 (0.0%) | 0 (0.0%) |
| College or Associate's Degree | 30 (100.0%) | 0 (0.0%) |
| Bachelor's Degree | 4 (100.0%) | 0 (0.0%) |
| Graduate Degree | 0 (0.0%) | 0 (0.0%) |
| Total | 34 (100.0%) | 0 (0.0%) |
Employment Characteristics in Norton
Employment by Class of Employer in Norton
Among the 5,860 employed individuals in Norton, private company employees (4,082 | 69.7%), not-for-profit organizations (673 | 11.5%), and local government employees (529 | 9.0%) make up the most common classes of employment.
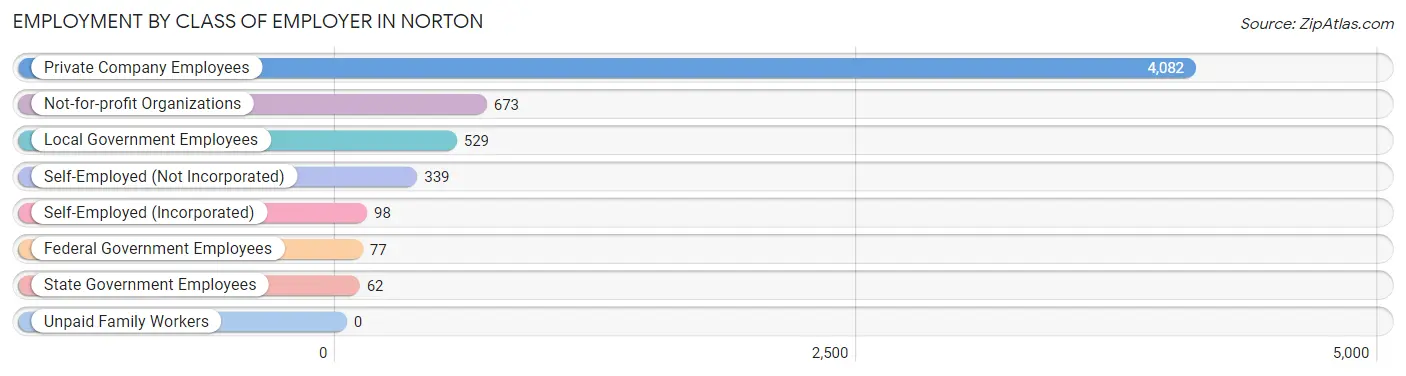
| Employer Class | # Employees | % Employees |
| Private Company Employees | 4,082 | 69.7% |
| Self-Employed (Incorporated) | 98 | 1.7% |
| Self-Employed (Not Incorporated) | 339 | 5.8% |
| Not-for-profit Organizations | 673 | 11.5% |
| Local Government Employees | 529 | 9.0% |
| State Government Employees | 62 | 1.1% |
| Federal Government Employees | 77 | 1.3% |
| Unpaid Family Workers | 0 | 0.0% |
| Total | 5,860 | 100.0% |
Employment Status by Age in Norton
According to the labor force statistics for Norton, out of the total population over 16 years of age (9,621), 63.7% or 6,129 individuals are in the labor force, with 4.0% or 245 of them unemployed. The age group with the highest labor force participation rate is 30 to 34 years, with 94.5% or 639 individuals in the labor force. Within the labor force, the 30 to 34 years age range has the highest percentage of unemployed individuals, with 16.9% or 108 of them being unemployed.
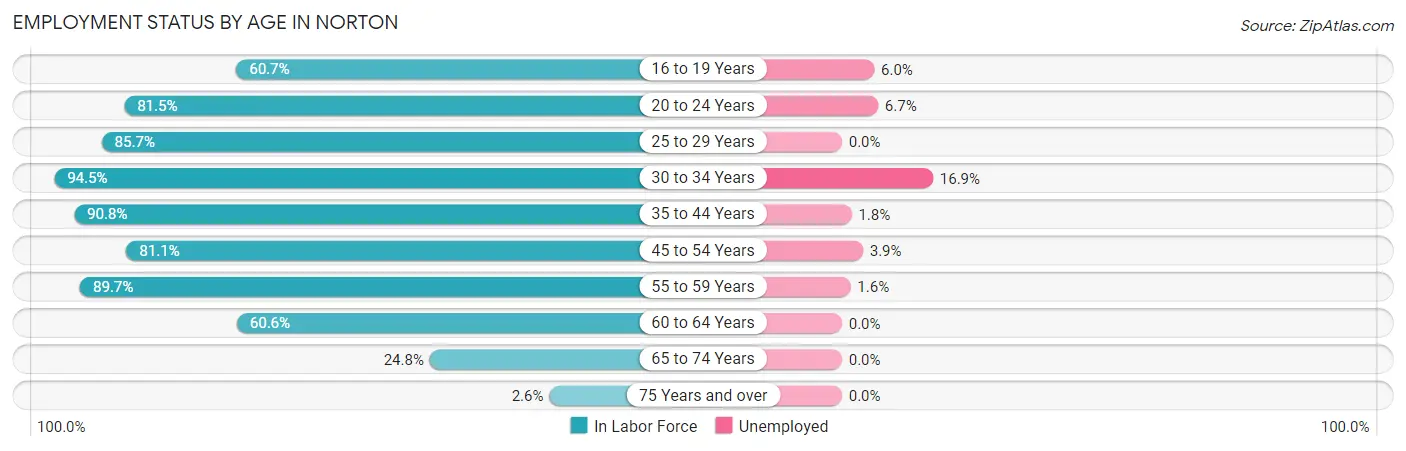
| Age Bracket | In Labor Force | Unemployed |
| 16 to 19 Years | 317 (60.7%) | 19 (6.0%) |
| 20 to 24 Years | 446 (81.5%) | 30 (6.7%) |
| 25 to 29 Years | 460 (85.7%) | 0 (0.0%) |
| 30 to 34 Years | 639 (94.5%) | 108 (16.9%) |
| 35 to 44 Years | 1,318 (90.8%) | 24 (1.8%) |
| 45 to 54 Years | 1,342 (81.1%) | 52 (3.9%) |
| 55 to 59 Years | 639 (89.7%) | 10 (1.6%) |
| 60 to 64 Years | 537 (60.6%) | 0 (0.0%) |
| 65 to 74 Years | 401 (24.8%) | 0 (0.0%) |
| 75 Years and over | 26 (2.6%) | 0 (0.0%) |
| Total | 6,129 (63.7%) | 245 (4.0%) |
Employment Status by Educational Attainment in Norton
According to labor force statistics for Norton, 83.4% of individuals (4,936) out of the total population between 25 and 64 years of age (5,918) are in the labor force, with 3.9% or 193 of them being unemployed. The group with the highest labor force participation rate are those with the educational attainment of bachelor's degree or higher, with 92.2% or 1,518 individuals in the labor force. Within the labor force, individuals with less than high school education have the highest percentage of unemployment, with 13.7% or 51 of them being unemployed.
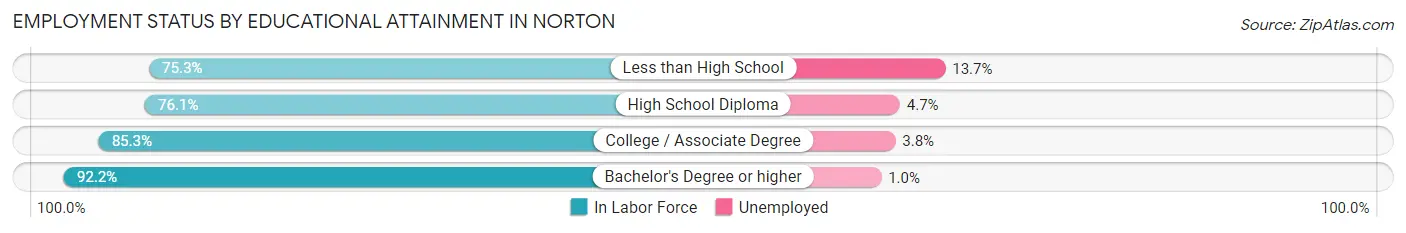
| Educational Attainment | In Labor Force | Unemployed |
| Less than High School | 371 (75.3%) | 68 (13.7%) |
| High School Diploma | 1,430 (76.1%) | 88 (4.7%) |
| College / Associate Degree | 1,621 (85.3%) | 72 (3.8%) |
| Bachelor's Degree or higher | 1,518 (92.2%) | 16 (1.0%) |
| Total | 4,936 (83.4%) | 231 (3.9%) |
Employment Occupations by Sex in Norton
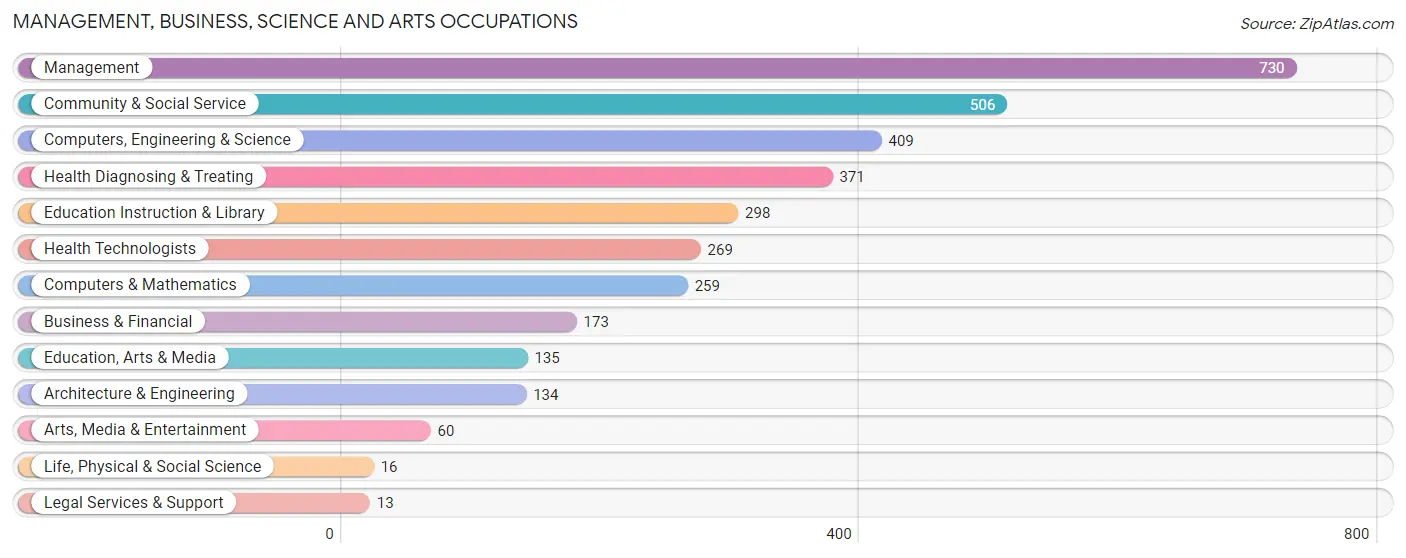
Management, Business, Science and Arts Occupations
The most common Management, Business, Science and Arts occupations in Norton are Management (730 | 12.4%), Community & Social Service (506 | 8.6%), Computers, Engineering & Science (409 | 7.0%), Health Diagnosing & Treating (371 | 6.3%), and Education Instruction & Library (298 | 5.1%).
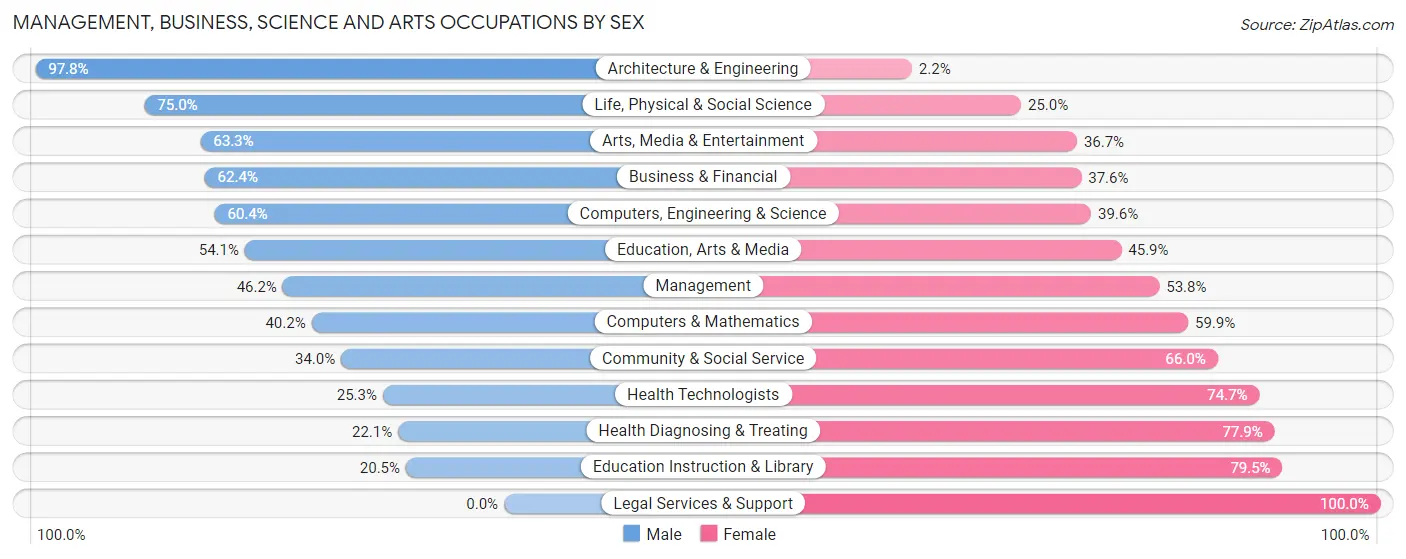
Management, Business, Science and Arts Occupations by Sex
Within the Management, Business, Science and Arts occupations in Norton, the most male-oriented occupations are Architecture & Engineering (97.8%), Life, Physical & Social Science (75.0%), and Arts, Media & Entertainment (63.3%), while the most female-oriented occupations are Legal Services & Support (100.0%), Education Instruction & Library (79.5%), and Health Diagnosing & Treating (77.9%).
| Occupation | Male | Female |
| Management | 337 (46.2%) | 393 (53.8%) |
| Business & Financial | 108 (62.4%) | 65 (37.6%) |
| Computers, Engineering & Science | 247 (60.4%) | 162 (39.6%) |
| Computers & Mathematics | 104 (40.2%) | 155 (59.9%) |
| Architecture & Engineering | 131 (97.8%) | 3 (2.2%) |
| Life, Physical & Social Science | 12 (75.0%) | 4 (25.0%) |
| Community & Social Service | 172 (34.0%) | 334 (66.0%) |
| Education, Arts & Media | 73 (54.1%) | 62 (45.9%) |
| Legal Services & Support | 0 (0.0%) | 13 (100.0%) |
| Education Instruction & Library | 61 (20.5%) | 237 (79.5%) |
| Arts, Media & Entertainment | 38 (63.3%) | 22 (36.7%) |
| Health Diagnosing & Treating | 82 (22.1%) | 289 (77.9%) |
| Health Technologists | 68 (25.3%) | 201 (74.7%) |
| Total (Category) | 946 (43.2%) | 1,243 (56.8%) |
| Total (Overall) | 3,147 (53.5%) | 2,736 (46.5%) |
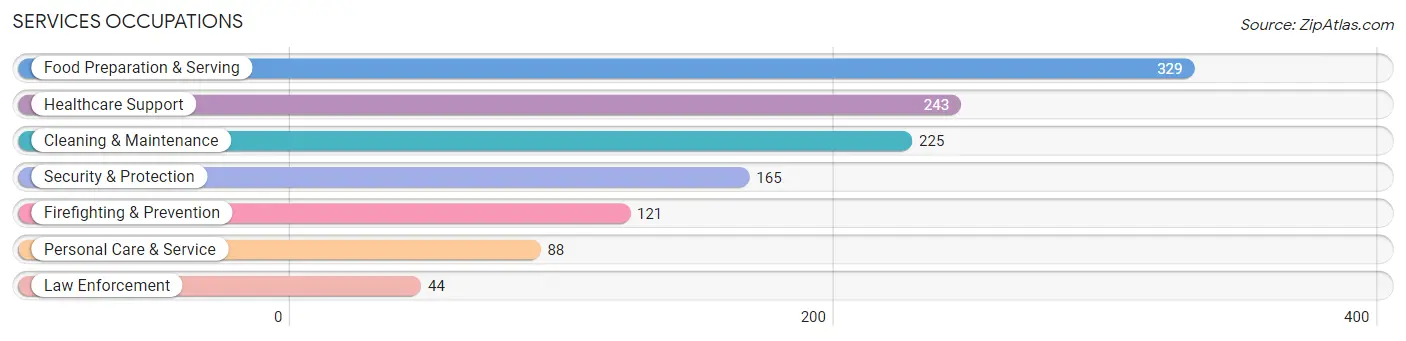
Services Occupations
The most common Services occupations in Norton are Food Preparation & Serving (329 | 5.6%), Healthcare Support (243 | 4.1%), Cleaning & Maintenance (225 | 3.8%), Security & Protection (165 | 2.8%), and Firefighting & Prevention (121 | 2.1%).
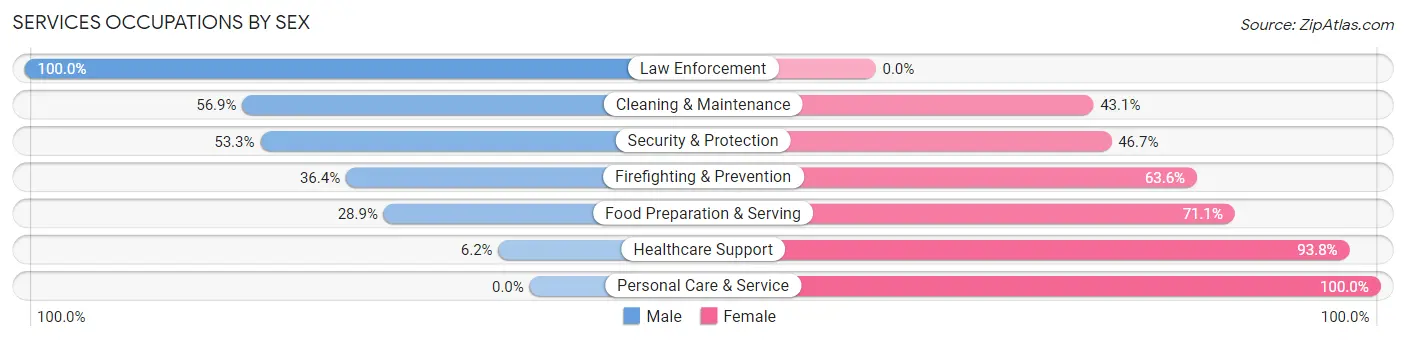
Services Occupations by Sex
Within the Services occupations in Norton, the most male-oriented occupations are Law Enforcement (100.0%), Cleaning & Maintenance (56.9%), and Security & Protection (53.3%), while the most female-oriented occupations are Personal Care & Service (100.0%), Healthcare Support (93.8%), and Food Preparation & Serving (71.1%).
| Occupation | Male | Female |
| Healthcare Support | 15 (6.2%) | 228 (93.8%) |
| Security & Protection | 88 (53.3%) | 77 (46.7%) |
| Firefighting & Prevention | 44 (36.4%) | 77 (63.6%) |
| Law Enforcement | 44 (100.0%) | 0 (0.0%) |
| Food Preparation & Serving | 95 (28.9%) | 234 (71.1%) |
| Cleaning & Maintenance | 128 (56.9%) | 97 (43.1%) |
| Personal Care & Service | 0 (0.0%) | 88 (100.0%) |
| Total (Category) | 326 (31.0%) | 724 (69.0%) |
| Total (Overall) | 3,147 (53.5%) | 2,736 (46.5%) |
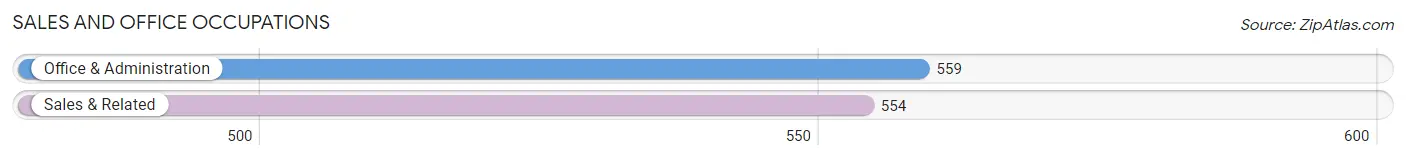
Sales and Office Occupations
The most common Sales and Office occupations in Norton are Office & Administration (559 | 9.5%), and Sales & Related (554 | 9.4%).
Sales and Office Occupations by Sex
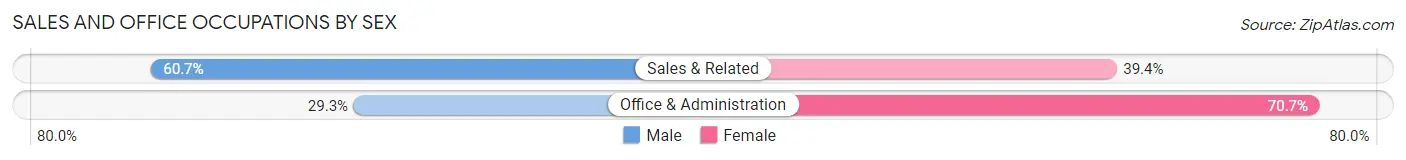
| Occupation | Male | Female |
| Sales & Related | 336 (60.7%) | 218 (39.4%) |
| Office & Administration | 164 (29.3%) | 395 (70.7%) |
| Total (Category) | 500 (44.9%) | 613 (55.1%) |
| Total (Overall) | 3,147 (53.5%) | 2,736 (46.5%) |
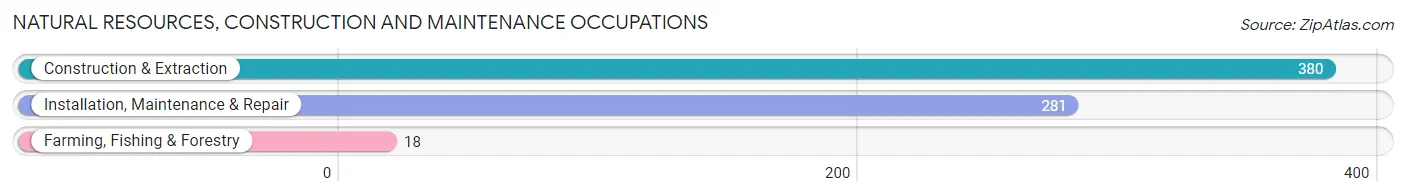
Natural Resources, Construction and Maintenance Occupations
The most common Natural Resources, Construction and Maintenance occupations in Norton are Construction & Extraction (380 | 6.5%), Installation, Maintenance & Repair (281 | 4.8%), and Farming, Fishing & Forestry (18 | 0.3%).
Natural Resources, Construction and Maintenance Occupations by Sex
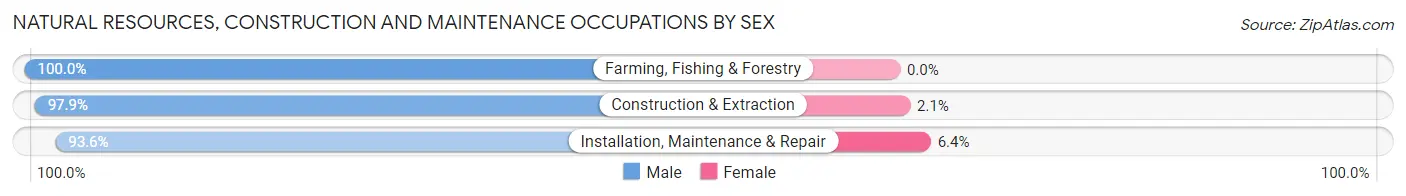
| Occupation | Male | Female |
| Farming, Fishing & Forestry | 18 (100.0%) | 0 (0.0%) |
| Construction & Extraction | 372 (97.9%) | 8 (2.1%) |
| Installation, Maintenance & Repair | 263 (93.6%) | 18 (6.4%) |
| Total (Category) | 653 (96.2%) | 26 (3.8%) |
| Total (Overall) | 3,147 (53.5%) | 2,736 (46.5%) |
Production, Transportation and Moving Occupations
The most common Production, Transportation and Moving occupations in Norton are Production (448 | 7.6%), Transportation (208 | 3.5%), and Material Moving (196 | 3.3%).
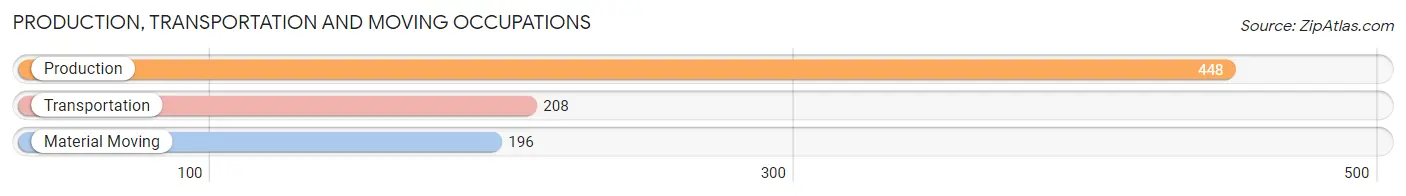
Production, Transportation and Moving Occupations by Sex
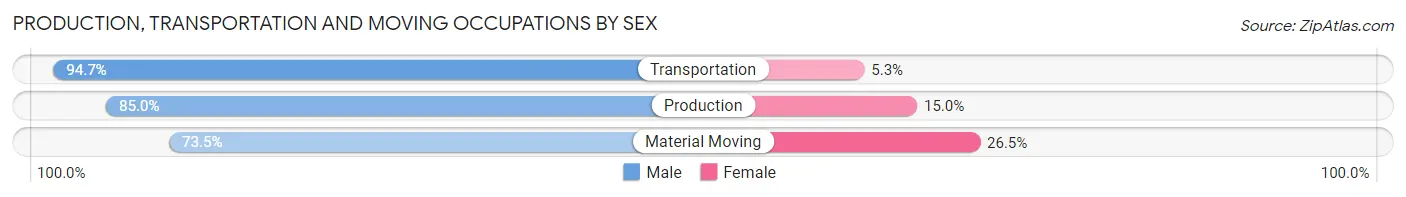
| Occupation | Male | Female |
| Production | 381 (85.0%) | 67 (15.0%) |
| Transportation | 197 (94.7%) | 11 (5.3%) |
| Material Moving | 144 (73.5%) | 52 (26.5%) |
| Total (Category) | 722 (84.7%) | 130 (15.3%) |
| Total (Overall) | 3,147 (53.5%) | 2,736 (46.5%) |
Employment Industries by Sex in Norton
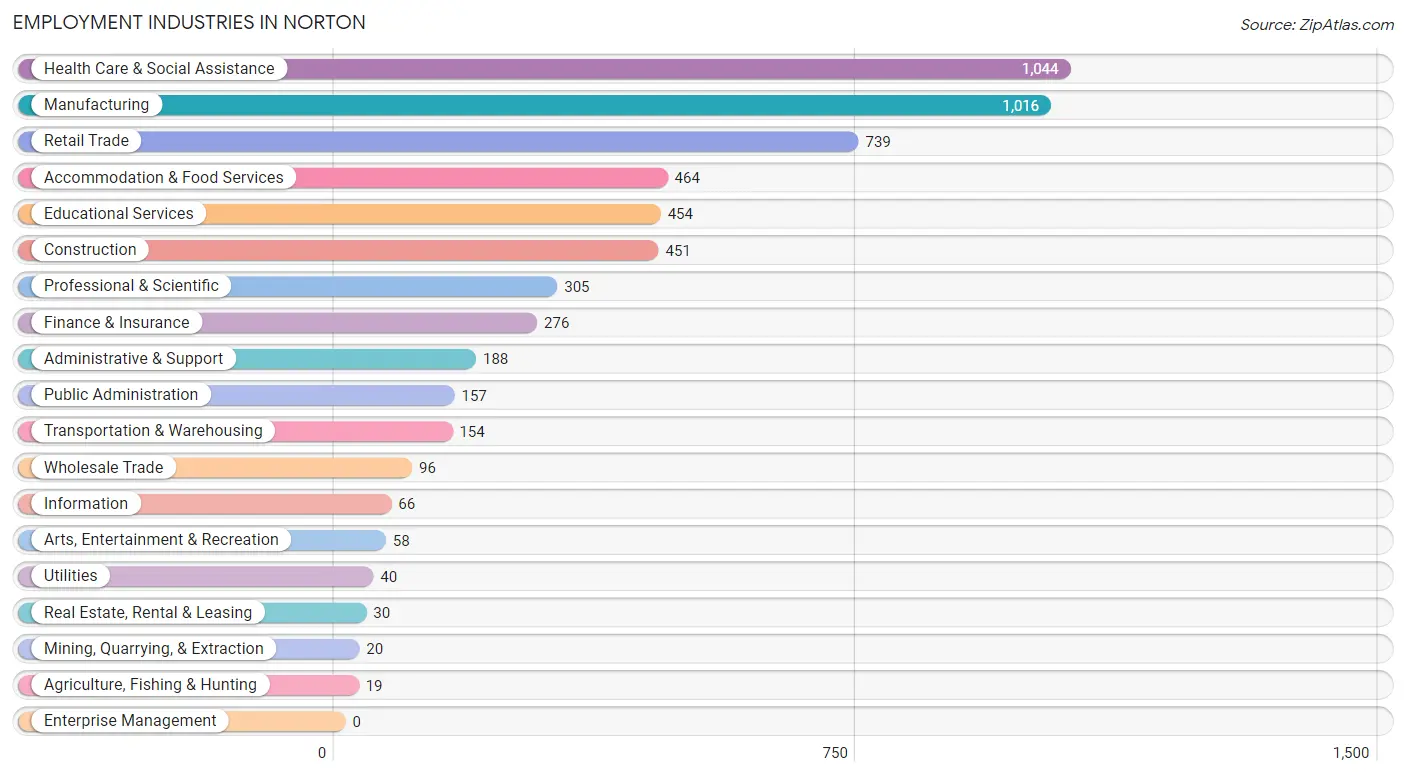
Employment Industries in Norton
The major employment industries in Norton include Health Care & Social Assistance (1,044 | 17.7%), Manufacturing (1,016 | 17.3%), Retail Trade (739 | 12.6%), Accommodation & Food Services (464 | 7.9%), and Educational Services (454 | 7.7%).
Employment Industries by Sex in Norton
The Norton industries that see more men than women are Agriculture, Fishing & Hunting (100.0%), Mining, Quarrying, & Extraction (100.0%), and Transportation & Warehousing (100.0%), whereas the industries that tend to have a higher number of women are Health Care & Social Assistance (79.2%), Educational Services (72.7%), and Arts, Entertainment & Recreation (67.2%).
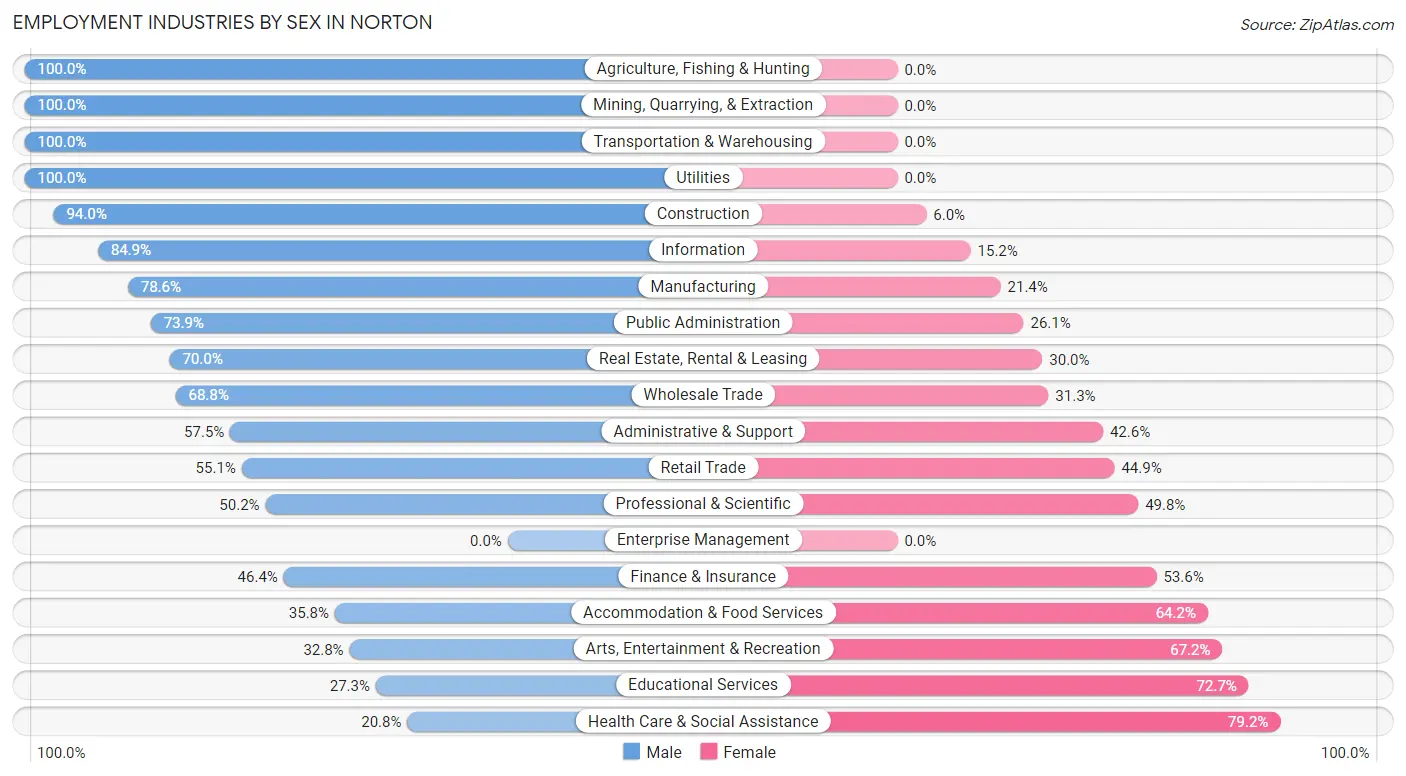
| Industry | Male | Female |
| Agriculture, Fishing & Hunting | 19 (100.0%) | 0 (0.0%) |
| Mining, Quarrying, & Extraction | 20 (100.0%) | 0 (0.0%) |
| Construction | 424 (94.0%) | 27 (6.0%) |
| Manufacturing | 799 (78.6%) | 217 (21.4%) |
| Wholesale Trade | 66 (68.8%) | 30 (31.2%) |
| Retail Trade | 407 (55.1%) | 332 (44.9%) |
| Transportation & Warehousing | 154 (100.0%) | 0 (0.0%) |
| Utilities | 40 (100.0%) | 0 (0.0%) |
| Information | 56 (84.9%) | 10 (15.1%) |
| Finance & Insurance | 128 (46.4%) | 148 (53.6%) |
| Real Estate, Rental & Leasing | 21 (70.0%) | 9 (30.0%) |
| Professional & Scientific | 153 (50.2%) | 152 (49.8%) |
| Enterprise Management | 0 (0.0%) | 0 (0.0%) |
| Administrative & Support | 108 (57.5%) | 80 (42.5%) |
| Educational Services | 124 (27.3%) | 330 (72.7%) |
| Health Care & Social Assistance | 217 (20.8%) | 827 (79.2%) |
| Arts, Entertainment & Recreation | 19 (32.8%) | 39 (67.2%) |
| Accommodation & Food Services | 166 (35.8%) | 298 (64.2%) |
| Public Administration | 116 (73.9%) | 41 (26.1%) |
| Total | 3,147 (53.5%) | 2,736 (46.5%) |
Education in Norton
School Enrollment in Norton
The most common levels of schooling among the 2,561 students in Norton are middle school (739 | 28.9%), high school (556 | 21.7%), and elementary school (450 | 17.6%).
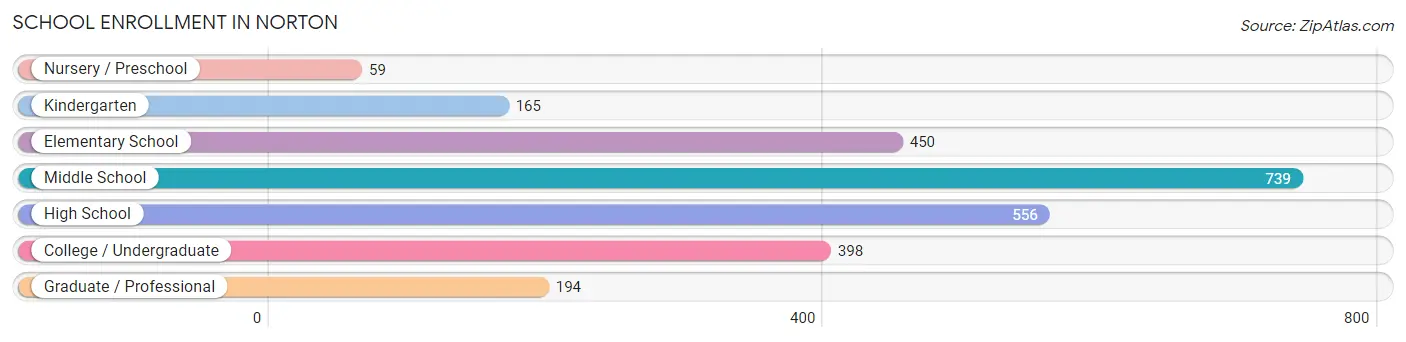
| School Level | # Students | % Students |
| Nursery / Preschool | 59 | 2.3% |
| Kindergarten | 165 | 6.4% |
| Elementary School | 450 | 17.6% |
| Middle School | 739 | 28.9% |
| High School | 556 | 21.7% |
| College / Undergraduate | 398 | 15.5% |
| Graduate / Professional | 194 | 7.6% |
| Total | 2,561 | 100.0% |
School Enrollment by Age by Funding Source in Norton
Out of a total of 2,561 students who are enrolled in schools in Norton, 384 (15.0%) attend a private institution, while the remaining 2,177 (85.0%) are enrolled in public schools. The age group of 25 to 34 year olds has the highest likelihood of being enrolled in private schools, with 61 (44.5% in the age bracket) enrolled. Conversely, the age group of 18 to 19 year olds has the lowest likelihood of being enrolled in a private school, with 134 (100.0% in the age bracket) attending a public institution.
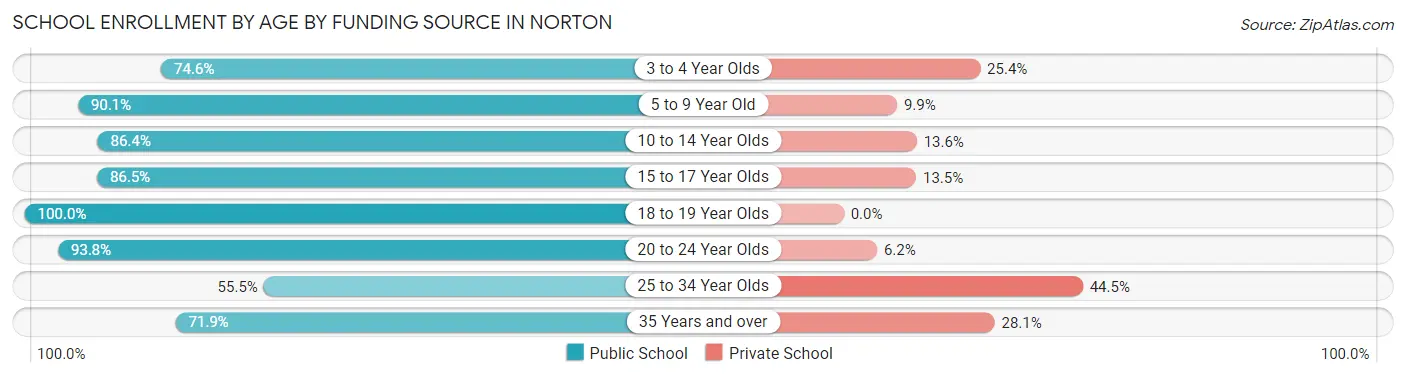
| Age Bracket | Public School | Private School |
| 3 to 4 Year Olds | 44 (74.6%) | 15 (25.4%) |
| 5 to 9 Year Old | 499 (90.1%) | 55 (9.9%) |
| 10 to 14 Year Olds | 686 (86.4%) | 108 (13.6%) |
| 15 to 17 Year Olds | 443 (86.5%) | 69 (13.5%) |
| 18 to 19 Year Olds | 134 (100.0%) | 0 (0.0%) |
| 20 to 24 Year Olds | 121 (93.8%) | 8 (6.2%) |
| 25 to 34 Year Olds | 76 (55.5%) | 61 (44.5%) |
| 35 Years and over | 174 (71.9%) | 68 (28.1%) |
| Total | 2,177 (85.0%) | 384 (15.0%) |
Educational Attainment by Field of Study in Norton
Education (502 | 21.3%), business (448 | 19.0%), science & technology (357 | 15.1%), psychology (134 | 5.7%), and engineering (130 | 5.5%) are the most common fields of study among 2,360 individuals in Norton who have obtained a bachelor's degree or higher.
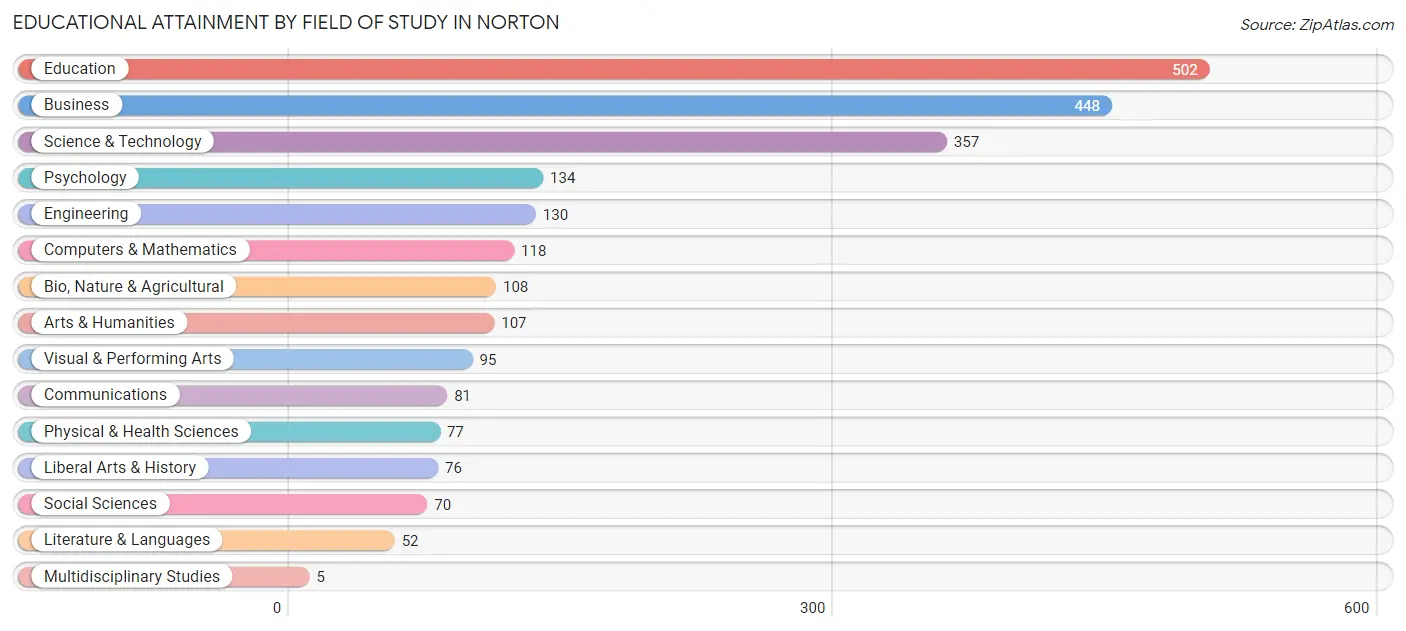
| Field of Study | # Graduates | % Graduates |
| Computers & Mathematics | 118 | 5.0% |
| Bio, Nature & Agricultural | 108 | 4.6% |
| Physical & Health Sciences | 77 | 3.3% |
| Psychology | 134 | 5.7% |
| Social Sciences | 70 | 3.0% |
| Engineering | 130 | 5.5% |
| Multidisciplinary Studies | 5 | 0.2% |
| Science & Technology | 357 | 15.1% |
| Business | 448 | 19.0% |
| Education | 502 | 21.3% |
| Literature & Languages | 52 | 2.2% |
| Liberal Arts & History | 76 | 3.2% |
| Visual & Performing Arts | 95 | 4.0% |
| Communications | 81 | 3.4% |
| Arts & Humanities | 107 | 4.5% |
| Total | 2,360 | 100.0% |
Transportation & Commute in Norton
Vehicle Availability by Sex in Norton
The most prevalent vehicle ownership categories in Norton are males with 2 vehicles (1,412, accounting for 45.2%) and females with 2 vehicles (1,133, making up 51.7%).
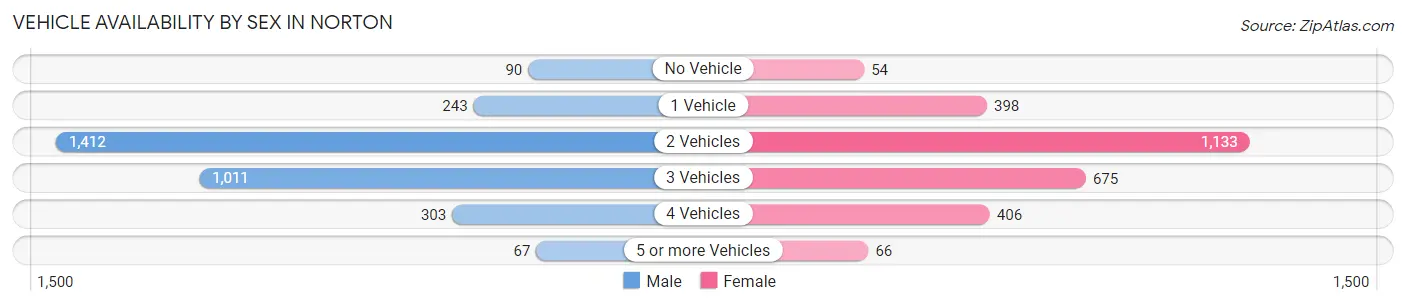
| Vehicles Available | Male | Female |
| No Vehicle | 90 (2.9%) | 54 (2.0%) |
| 1 Vehicle | 243 (7.8%) | 398 (14.6%) |
| 2 Vehicles | 1,412 (45.2%) | 1,133 (41.5%) |
| 3 Vehicles | 1,011 (32.3%) | 675 (24.7%) |
| 4 Vehicles | 303 (9.7%) | 406 (14.9%) |
| 5 or more Vehicles | 67 (2.1%) | 66 (2.4%) |
| Total | 3,126 (100.0%) | 2,732 (100.0%) |
Commute Time in Norton
The most frequently occuring commute durations in Norton are 20 to 24 minutes (1,163 commuters, 22.2%), 15 to 19 minutes (937 commuters, 17.9%), and 30 to 34 minutes (617 commuters, 11.8%).
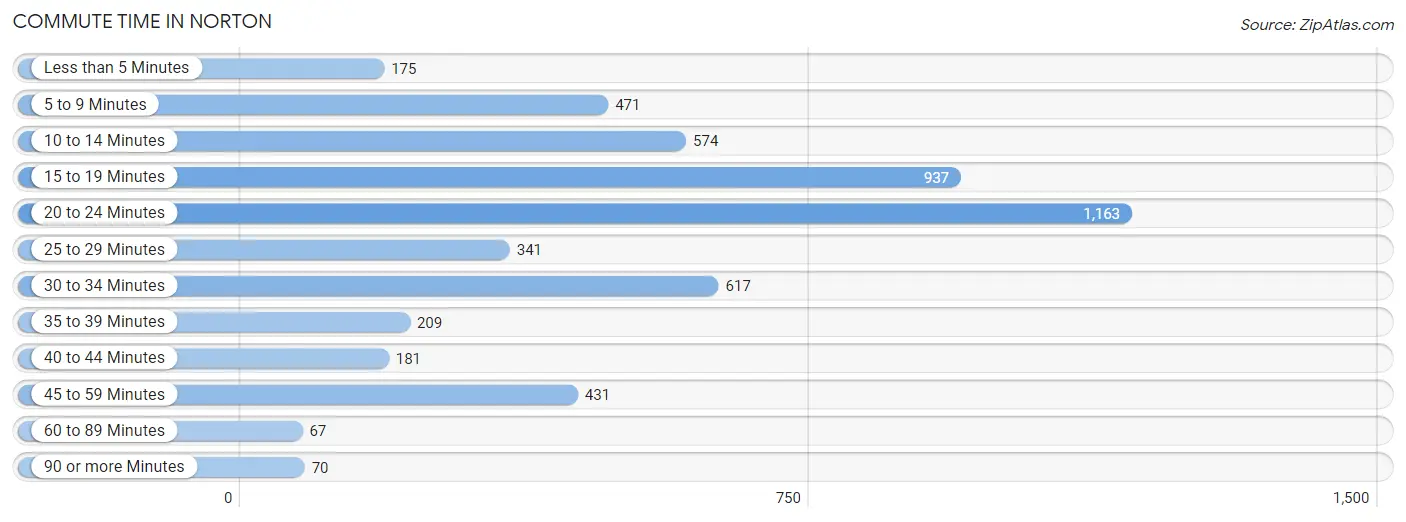
| Commute Time | # Commuters | % Commuters |
| Less than 5 Minutes | 175 | 3.3% |
| 5 to 9 Minutes | 471 | 9.0% |
| 10 to 14 Minutes | 574 | 11.0% |
| 15 to 19 Minutes | 937 | 17.9% |
| 20 to 24 Minutes | 1,163 | 22.2% |
| 25 to 29 Minutes | 341 | 6.5% |
| 30 to 34 Minutes | 617 | 11.8% |
| 35 to 39 Minutes | 209 | 4.0% |
| 40 to 44 Minutes | 181 | 3.5% |
| 45 to 59 Minutes | 431 | 8.2% |
| 60 to 89 Minutes | 67 | 1.3% |
| 90 or more Minutes | 70 | 1.3% |
Commute Time by Sex in Norton
The most common commute times in Norton are 20 to 24 minutes (568 commuters, 19.6%) for males and 20 to 24 minutes (595 commuters, 25.4%) for females.
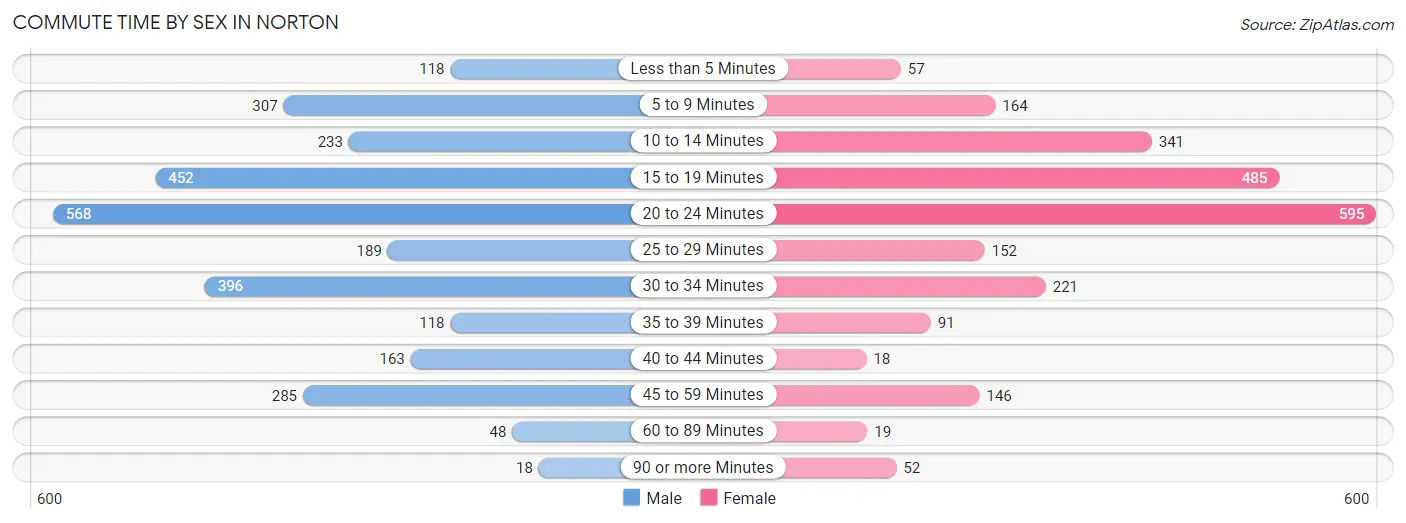
| Commute Time | Male | Female |
| Less than 5 Minutes | 118 (4.1%) | 57 (2.4%) |
| 5 to 9 Minutes | 307 (10.6%) | 164 (7.0%) |
| 10 to 14 Minutes | 233 (8.1%) | 341 (14.6%) |
| 15 to 19 Minutes | 452 (15.6%) | 485 (20.7%) |
| 20 to 24 Minutes | 568 (19.6%) | 595 (25.4%) |
| 25 to 29 Minutes | 189 (6.5%) | 152 (6.5%) |
| 30 to 34 Minutes | 396 (13.7%) | 221 (9.4%) |
| 35 to 39 Minutes | 118 (4.1%) | 91 (3.9%) |
| 40 to 44 Minutes | 163 (5.6%) | 18 (0.8%) |
| 45 to 59 Minutes | 285 (9.8%) | 146 (6.2%) |
| 60 to 89 Minutes | 48 (1.7%) | 19 (0.8%) |
| 90 or more Minutes | 18 (0.6%) | 52 (2.2%) |
Time of Departure to Work by Sex in Norton
The most frequent times of departure to work in Norton are 7:30 AM to 7:59 AM (380, 13.1%) for males and 7:00 AM to 7:29 AM (471, 20.1%) for females.
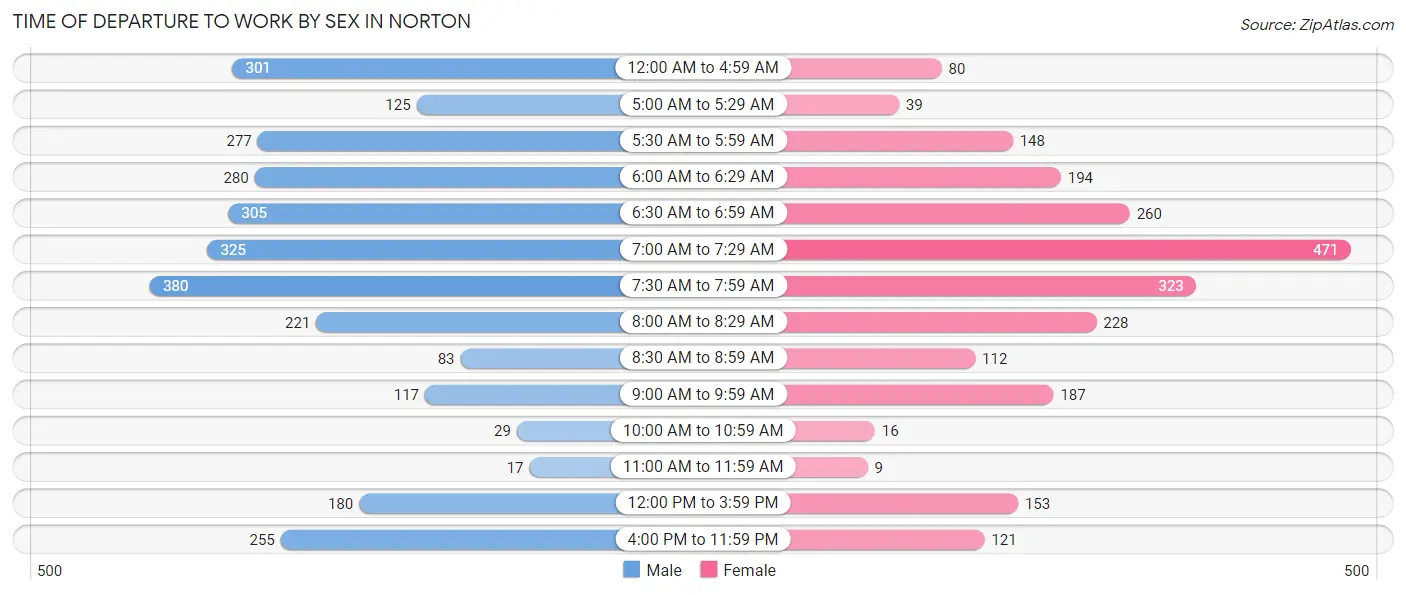
| Time of Departure | Male | Female |
| 12:00 AM to 4:59 AM | 301 (10.4%) | 80 (3.4%) |
| 5:00 AM to 5:29 AM | 125 (4.3%) | 39 (1.7%) |
| 5:30 AM to 5:59 AM | 277 (9.6%) | 148 (6.3%) |
| 6:00 AM to 6:29 AM | 280 (9.7%) | 194 (8.3%) |
| 6:30 AM to 6:59 AM | 305 (10.5%) | 260 (11.1%) |
| 7:00 AM to 7:29 AM | 325 (11.2%) | 471 (20.1%) |
| 7:30 AM to 7:59 AM | 380 (13.1%) | 323 (13.8%) |
| 8:00 AM to 8:29 AM | 221 (7.6%) | 228 (9.7%) |
| 8:30 AM to 8:59 AM | 83 (2.9%) | 112 (4.8%) |
| 9:00 AM to 9:59 AM | 117 (4.0%) | 187 (8.0%) |
| 10:00 AM to 10:59 AM | 29 (1.0%) | 16 (0.7%) |
| 11:00 AM to 11:59 AM | 17 (0.6%) | 9 (0.4%) |
| 12:00 PM to 3:59 PM | 180 (6.2%) | 153 (6.5%) |
| 4:00 PM to 11:59 PM | 255 (8.8%) | 121 (5.2%) |
| Total | 2,895 (100.0%) | 2,341 (100.0%) |
Housing Occupancy in Norton
Occupancy by Ownership in Norton
Of the total 4,786 dwellings in Norton, owner-occupied units account for 4,061 (84.9%), while renter-occupied units make up 725 (15.1%).
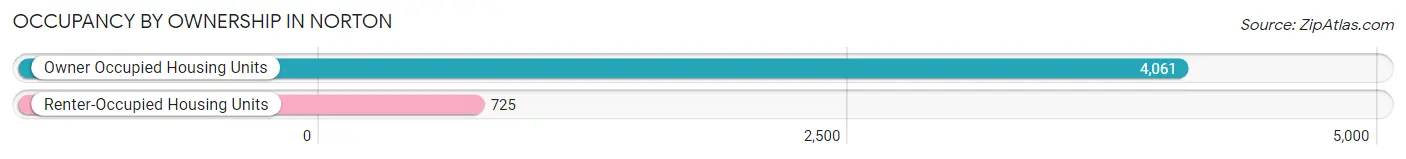
| Occupancy | # Housing Units | % Housing Units |
| Owner Occupied Housing Units | 4,061 | 84.9% |
| Renter-Occupied Housing Units | 725 | 15.1% |
| Total Occupied Housing Units | 4,786 | 100.0% |
Occupancy by Household Size in Norton
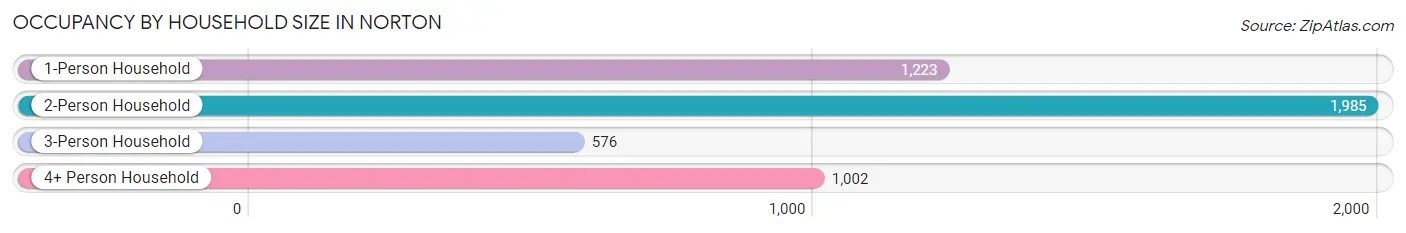
| Household Size | # Housing Units | % Housing Units |
| 1-Person Household | 1,223 | 25.6% |
| 2-Person Household | 1,985 | 41.5% |
| 3-Person Household | 576 | 12.0% |
| 4+ Person Household | 1,002 | 20.9% |
| Total Housing Units | 4,786 | 100.0% |
Occupancy by Ownership by Household Size in Norton
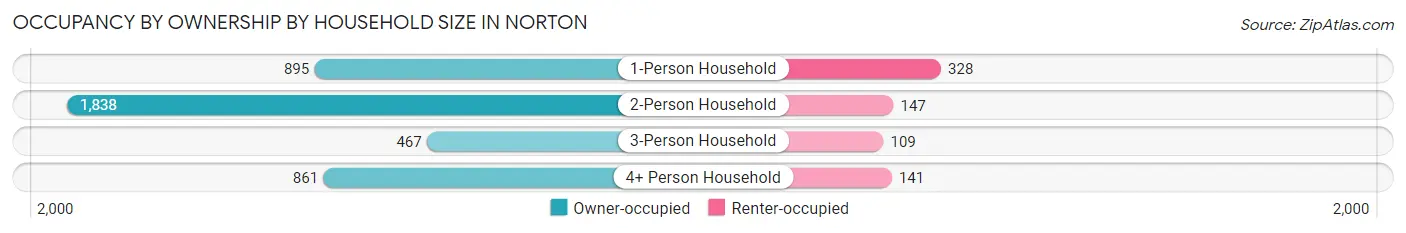
| Household Size | Owner-occupied | Renter-occupied |
| 1-Person Household | 895 (73.2%) | 328 (26.8%) |
| 2-Person Household | 1,838 (92.6%) | 147 (7.4%) |
| 3-Person Household | 467 (81.1%) | 109 (18.9%) |
| 4+ Person Household | 861 (85.9%) | 141 (14.1%) |
| Total Housing Units | 4,061 (84.9%) | 725 (15.1%) |
Occupancy by Educational Attainment in Norton
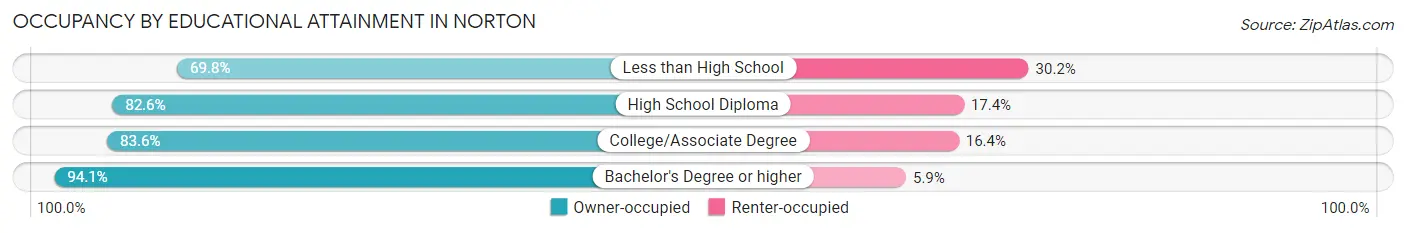
| Household Size | Owner-occupied | Renter-occupied |
| Less than High School | 270 (69.8%) | 117 (30.2%) |
| High School Diploma | 1,196 (82.6%) | 252 (17.4%) |
| College/Associate Degree | 1,450 (83.6%) | 284 (16.4%) |
| Bachelor's Degree or higher | 1,145 (94.1%) | 72 (5.9%) |
Occupancy by Age of Householder in Norton
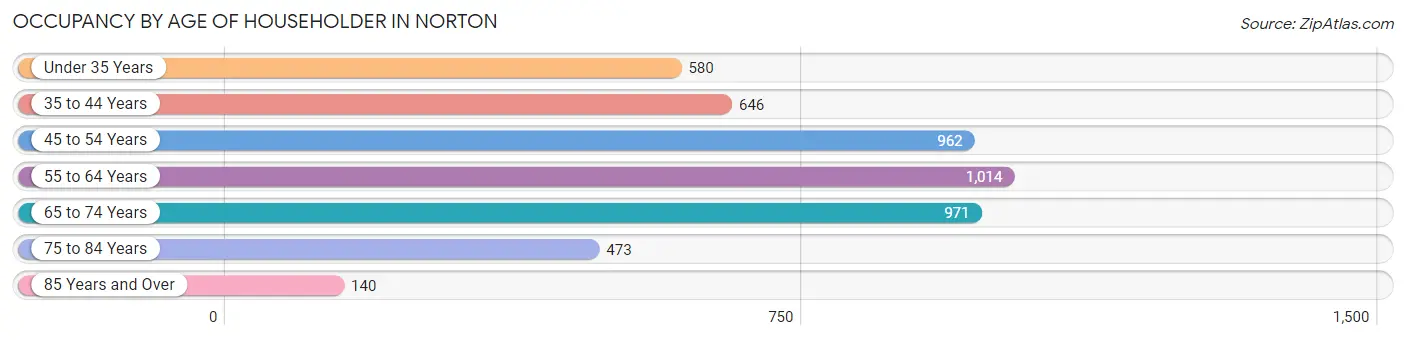
| Age Bracket | # Households | % Households |
| Under 35 Years | 580 | 12.1% |
| 35 to 44 Years | 646 | 13.5% |
| 45 to 54 Years | 962 | 20.1% |
| 55 to 64 Years | 1,014 | 21.2% |
| 65 to 74 Years | 971 | 20.3% |
| 75 to 84 Years | 473 | 9.9% |
| 85 Years and Over | 140 | 2.9% |
| Total | 4,786 | 100.0% |
Housing Finances in Norton
Median Income by Occupancy in Norton
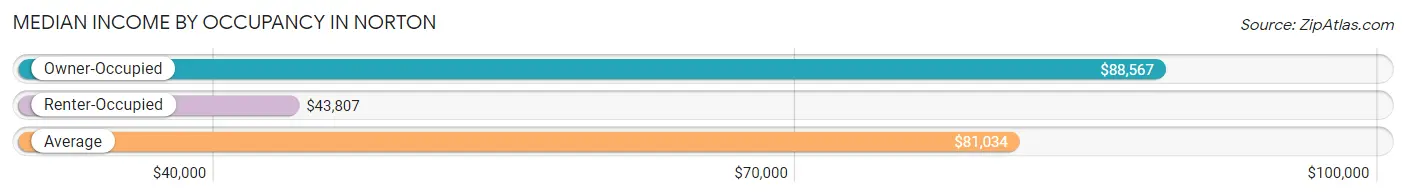
| Occupancy Type | # Households | Median Income |
| Owner-Occupied | 4,061 (84.9%) | $88,567 |
| Renter-Occupied | 725 (15.1%) | $43,807 |
| Average | 4,786 (100.0%) | $81,034 |
Occupancy by Householder Income Bracket in Norton
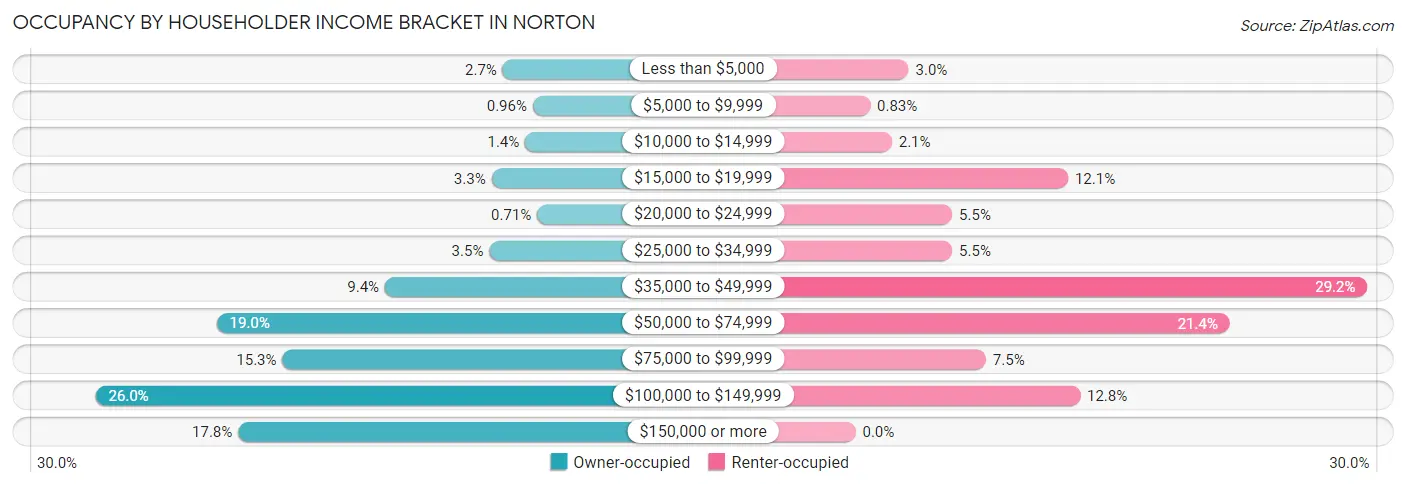
| Income Bracket | Owner-occupied | Renter-occupied |
| Less than $5,000 | 109 (2.7%) | 22 (3.0%) |
| $5,000 to $9,999 | 39 (1.0%) | 6 (0.8%) |
| $10,000 to $14,999 | 57 (1.4%) | 15 (2.1%) |
| $15,000 to $19,999 | 135 (3.3%) | 88 (12.1%) |
| $20,000 to $24,999 | 29 (0.7%) | 40 (5.5%) |
| $25,000 to $34,999 | 140 (3.5%) | 40 (5.5%) |
| $35,000 to $49,999 | 382 (9.4%) | 212 (29.2%) |
| $50,000 to $74,999 | 773 (19.0%) | 155 (21.4%) |
| $75,000 to $99,999 | 620 (15.3%) | 54 (7.4%) |
| $100,000 to $149,999 | 1,054 (26.0%) | 93 (12.8%) |
| $150,000 or more | 723 (17.8%) | 0 (0.0%) |
| Total | 4,061 (100.0%) | 725 (100.0%) |
Monthly Housing Cost Tiers in Norton
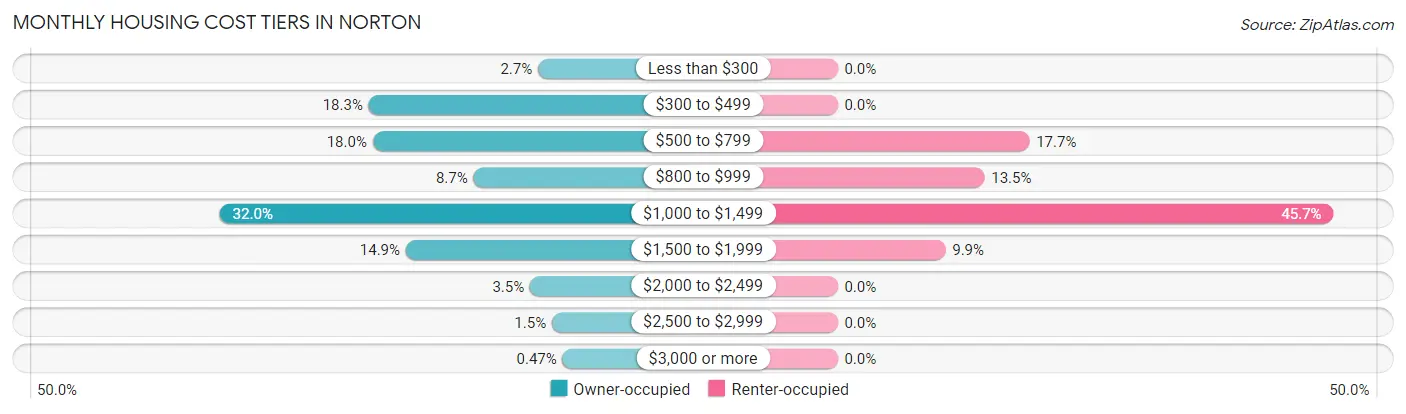
| Monthly Cost | Owner-occupied | Renter-occupied |
| Less than $300 | 111 (2.7%) | 0 (0.0%) |
| $300 to $499 | 744 (18.3%) | 0 (0.0%) |
| $500 to $799 | 729 (17.9%) | 128 (17.7%) |
| $800 to $999 | 352 (8.7%) | 98 (13.5%) |
| $1,000 to $1,499 | 1,301 (32.0%) | 331 (45.7%) |
| $1,500 to $1,999 | 605 (14.9%) | 72 (9.9%) |
| $2,000 to $2,499 | 141 (3.5%) | 0 (0.0%) |
| $2,500 to $2,999 | 59 (1.5%) | 0 (0.0%) |
| $3,000 or more | 19 (0.5%) | 0 (0.0%) |
| Total | 4,061 (100.0%) | 725 (100.0%) |
Physical Housing Characteristics in Norton
Housing Structures in Norton
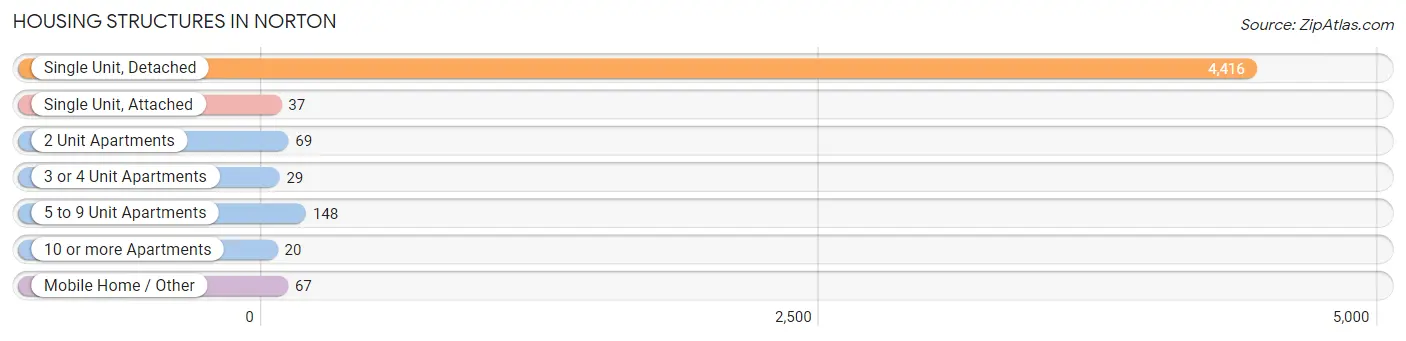
| Structure Type | # Housing Units | % Housing Units |
| Single Unit, Detached | 4,416 | 92.3% |
| Single Unit, Attached | 37 | 0.8% |
| 2 Unit Apartments | 69 | 1.4% |
| 3 or 4 Unit Apartments | 29 | 0.6% |
| 5 to 9 Unit Apartments | 148 | 3.1% |
| 10 or more Apartments | 20 | 0.4% |
| Mobile Home / Other | 67 | 1.4% |
| Total | 4,786 | 100.0% |
Housing Structures by Occupancy in Norton
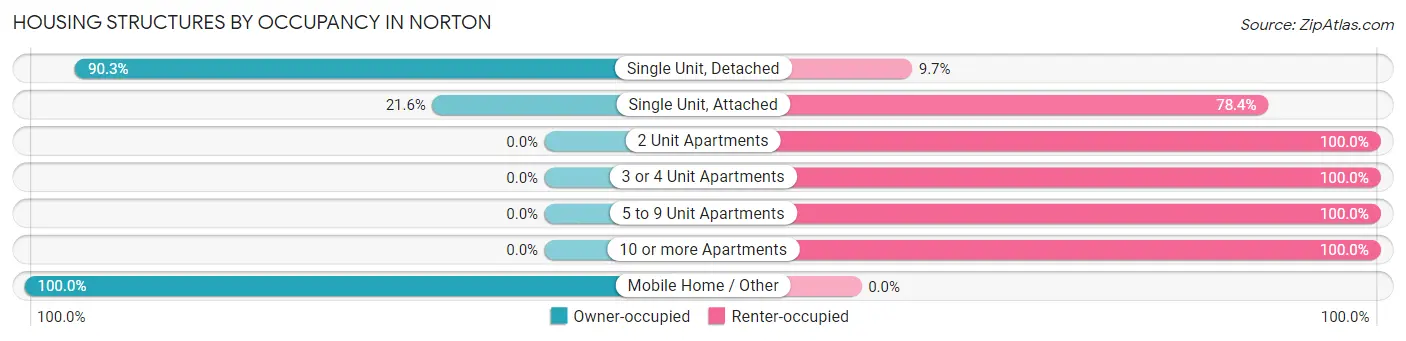
| Structure Type | Owner-occupied | Renter-occupied |
| Single Unit, Detached | 3,986 (90.3%) | 430 (9.7%) |
| Single Unit, Attached | 8 (21.6%) | 29 (78.4%) |
| 2 Unit Apartments | 0 (0.0%) | 69 (100.0%) |
| 3 or 4 Unit Apartments | 0 (0.0%) | 29 (100.0%) |
| 5 to 9 Unit Apartments | 0 (0.0%) | 148 (100.0%) |
| 10 or more Apartments | 0 (0.0%) | 20 (100.0%) |
| Mobile Home / Other | 67 (100.0%) | 0 (0.0%) |
| Total | 4,061 (84.9%) | 725 (15.1%) |
Housing Structures by Number of Rooms in Norton
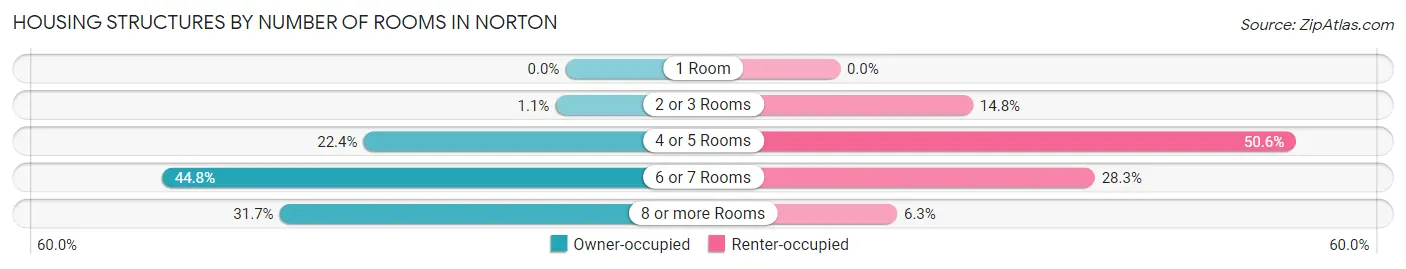
| Number of Rooms | Owner-occupied | Renter-occupied |
| 1 Room | 0 (0.0%) | 0 (0.0%) |
| 2 or 3 Rooms | 45 (1.1%) | 107 (14.8%) |
| 4 or 5 Rooms | 910 (22.4%) | 367 (50.6%) |
| 6 or 7 Rooms | 1,818 (44.8%) | 205 (28.3%) |
| 8 or more Rooms | 1,288 (31.7%) | 46 (6.3%) |
| Total | 4,061 (100.0%) | 725 (100.0%) |
Housing Structure by Heating Type in Norton
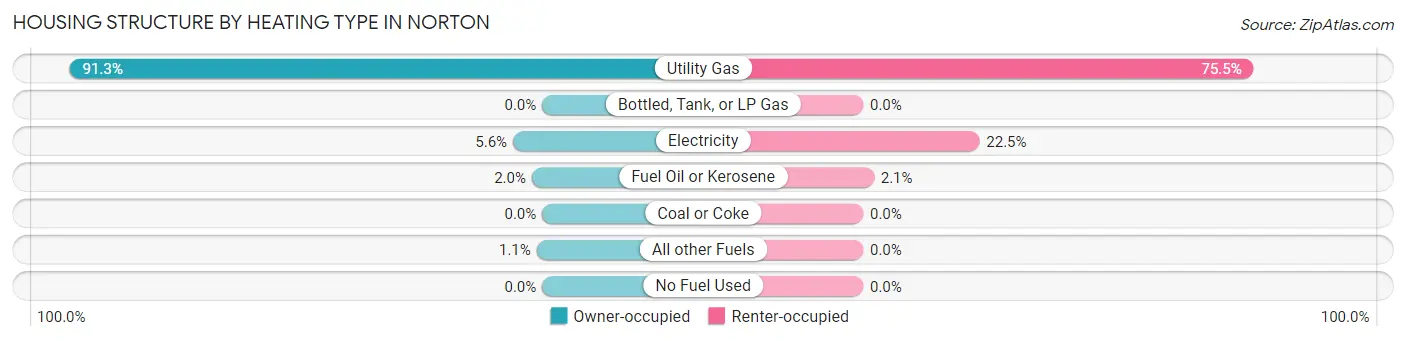
| Heating Type | Owner-occupied | Renter-occupied |
| Utility Gas | 3,708 (91.3%) | 547 (75.4%) |
| Bottled, Tank, or LP Gas | 0 (0.0%) | 0 (0.0%) |
| Electricity | 229 (5.6%) | 163 (22.5%) |
| Fuel Oil or Kerosene | 81 (2.0%) | 15 (2.1%) |
| Coal or Coke | 0 (0.0%) | 0 (0.0%) |
| All other Fuels | 43 (1.1%) | 0 (0.0%) |
| No Fuel Used | 0 (0.0%) | 0 (0.0%) |
| Total | 4,061 (100.0%) | 725 (100.0%) |
Household Vehicle Usage in Norton
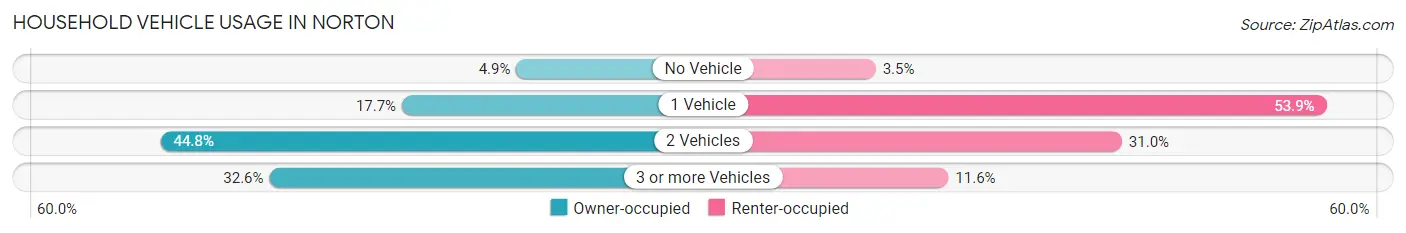
| Vehicles per Household | Owner-occupied | Renter-occupied |
| No Vehicle | 200 (4.9%) | 25 (3.5%) |
| 1 Vehicle | 720 (17.7%) | 391 (53.9%) |
| 2 Vehicles | 1,818 (44.8%) | 225 (31.0%) |
| 3 or more Vehicles | 1,323 (32.6%) | 84 (11.6%) |
| Total | 4,061 (100.0%) | 725 (100.0%) |
Real Estate & Mortgages in Norton
Real Estate and Mortgage Overview in Norton
| Characteristic | Without Mortgage | With Mortgage |
| Housing Units | 1,416 | 2,645 |
| Median Property Value | $169,700 | $172,000 |
| Median Household Income | $65,543 | $479 |
| Monthly Housing Costs | $474 | $19 |
| Real Estate Taxes | $2,362 | $56 |
Property Value by Mortgage Status in Norton
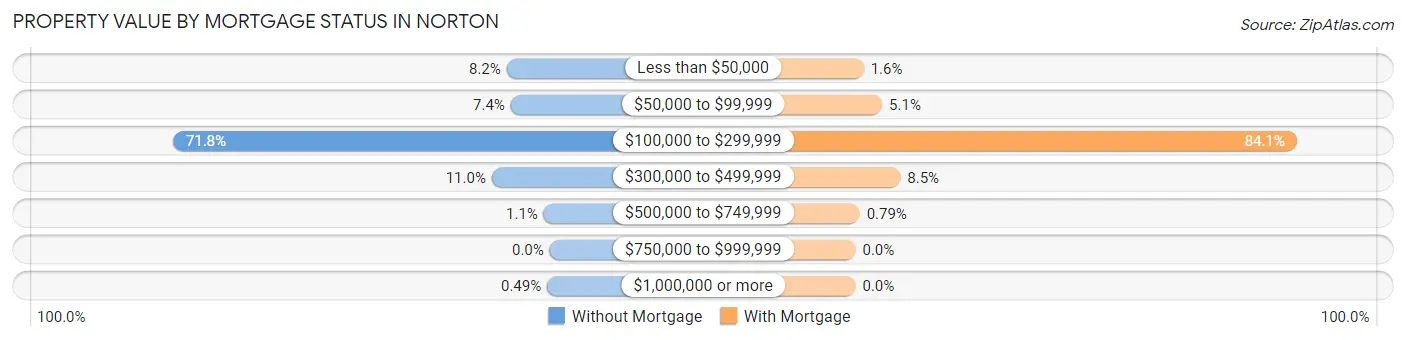
| Property Value | Without Mortgage | With Mortgage |
| Less than $50,000 | 116 (8.2%) | 41 (1.5%) |
| $50,000 to $99,999 | 105 (7.4%) | 134 (5.1%) |
| $100,000 to $299,999 | 1,016 (71.8%) | 2,223 (84.1%) |
| $300,000 to $499,999 | 156 (11.0%) | 226 (8.5%) |
| $500,000 to $749,999 | 16 (1.1%) | 21 (0.8%) |
| $750,000 to $999,999 | 0 (0.0%) | 0 (0.0%) |
| $1,000,000 or more | 7 (0.5%) | 0 (0.0%) |
| Total | 1,416 (100.0%) | 2,645 (100.0%) |
Household Income by Mortgage Status in Norton
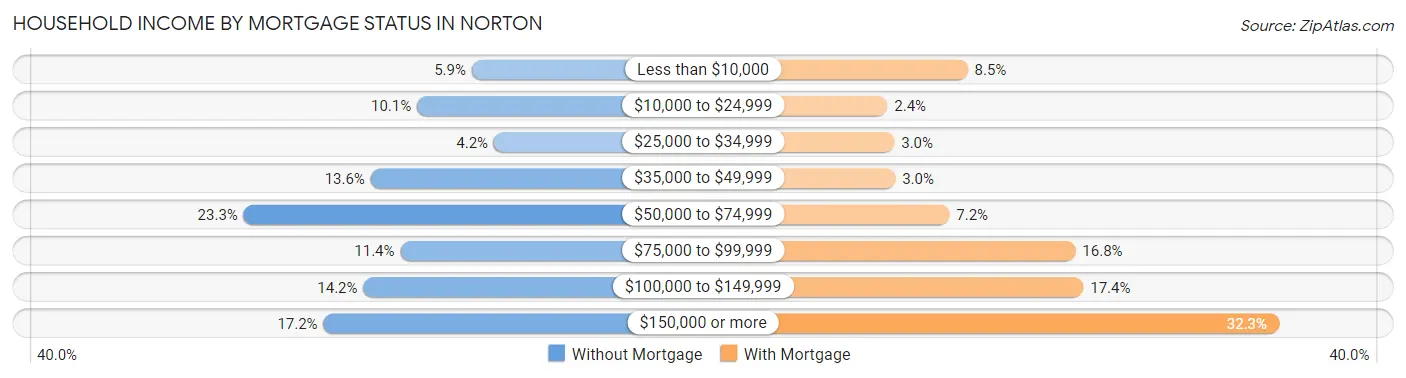
| Household Income | Without Mortgage | With Mortgage |
| Less than $10,000 | 84 (5.9%) | 226 (8.5%) |
| $10,000 to $24,999 | 143 (10.1%) | 64 (2.4%) |
| $25,000 to $34,999 | 60 (4.2%) | 78 (2.9%) |
| $35,000 to $49,999 | 193 (13.6%) | 80 (3.0%) |
| $50,000 to $74,999 | 330 (23.3%) | 189 (7.1%) |
| $75,000 to $99,999 | 161 (11.4%) | 443 (16.8%) |
| $100,000 to $149,999 | 201 (14.2%) | 459 (17.3%) |
| $150,000 or more | 244 (17.2%) | 853 (32.3%) |
| Total | 1,416 (100.0%) | 2,645 (100.0%) |
Property Value to Household Income Ratio in Norton
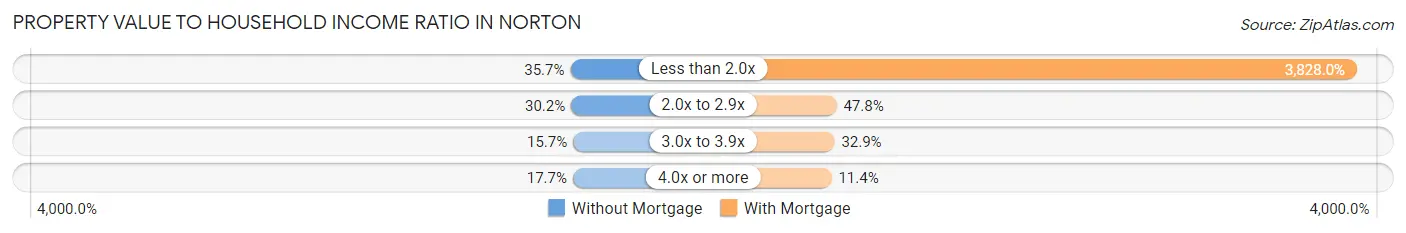
| Value-to-Income Ratio | Without Mortgage | With Mortgage |
| Less than 2.0x | 505 (35.7%) | 101,250 (3,828.0%) |
| 2.0x to 2.9x | 427 (30.2%) | 1,263 (47.7%) |
| 3.0x to 3.9x | 222 (15.7%) | 870 (32.9%) |
| 4.0x or more | 251 (17.7%) | 302 (11.4%) |
| Total | 1,416 (100.0%) | 2,645 (100.0%) |
Real Estate Taxes by Mortgage Status in Norton
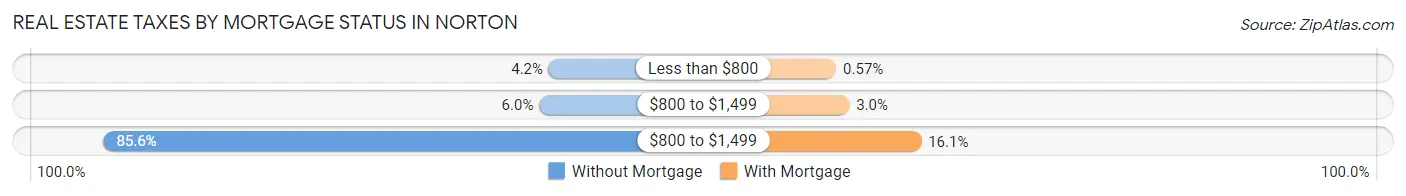
| Property Taxes | Without Mortgage | With Mortgage |
| Less than $800 | 60 (4.2%) | 15 (0.6%) |
| $800 to $1,499 | 85 (6.0%) | 78 (2.9%) |
| $800 to $1,499 | 1,212 (85.6%) | 426 (16.1%) |
| Total | 1,416 (100.0%) | 2,645 (100.0%) |
Health & Disability in Norton
Health Insurance Coverage by Age in Norton
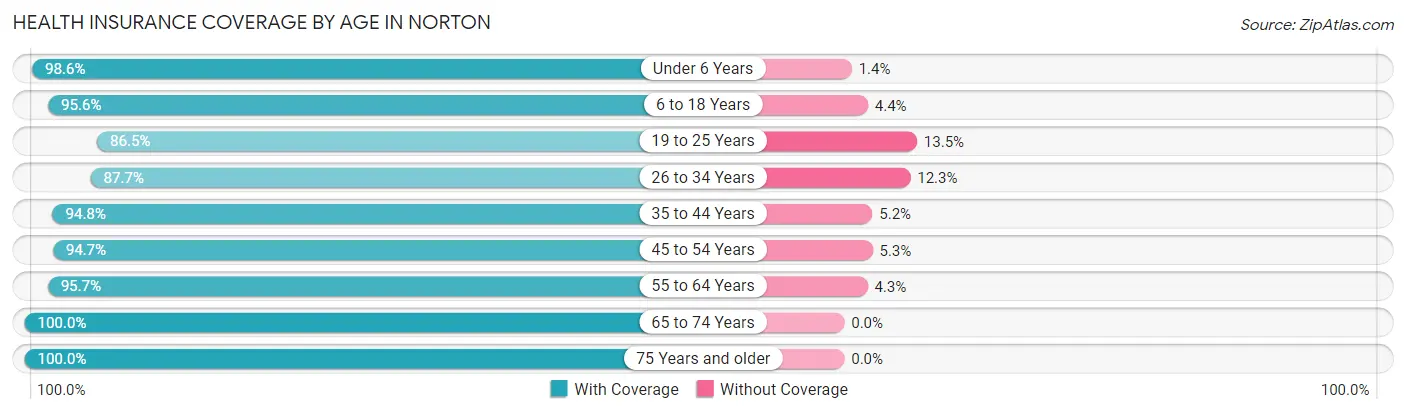
| Age Bracket | With Coverage | Without Coverage |
| Under 6 Years | 496 (98.6%) | 7 (1.4%) |
| 6 to 18 Years | 1,829 (95.6%) | 84 (4.4%) |
| 19 to 25 Years | 664 (86.5%) | 104 (13.5%) |
| 26 to 34 Years | 976 (87.7%) | 137 (12.3%) |
| 35 to 44 Years | 1,376 (94.8%) | 76 (5.2%) |
| 45 to 54 Years | 1,568 (94.7%) | 87 (5.3%) |
| 55 to 64 Years | 1,529 (95.7%) | 69 (4.3%) |
| 65 to 74 Years | 1,618 (100.0%) | 0 (0.0%) |
| 75 Years and older | 1,016 (100.0%) | 0 (0.0%) |
| Total | 11,072 (95.2%) | 564 (4.9%) |
Health Insurance Coverage by Citizenship Status in Norton
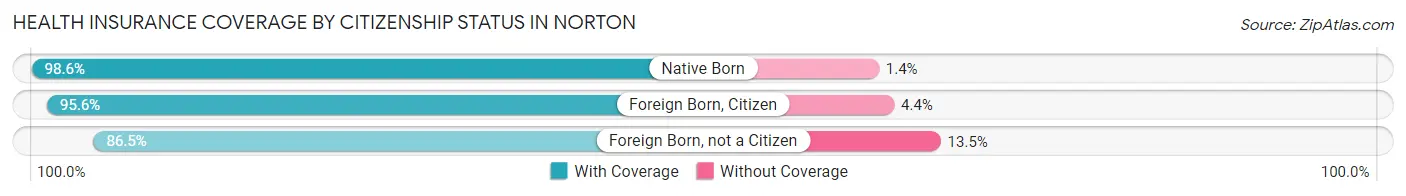
| Citizenship Status | With Coverage | Without Coverage |
| Native Born | 496 (98.6%) | 7 (1.4%) |
| Foreign Born, Citizen | 1,829 (95.6%) | 84 (4.4%) |
| Foreign Born, not a Citizen | 664 (86.5%) | 104 (13.5%) |
Health Insurance Coverage by Household Income in Norton
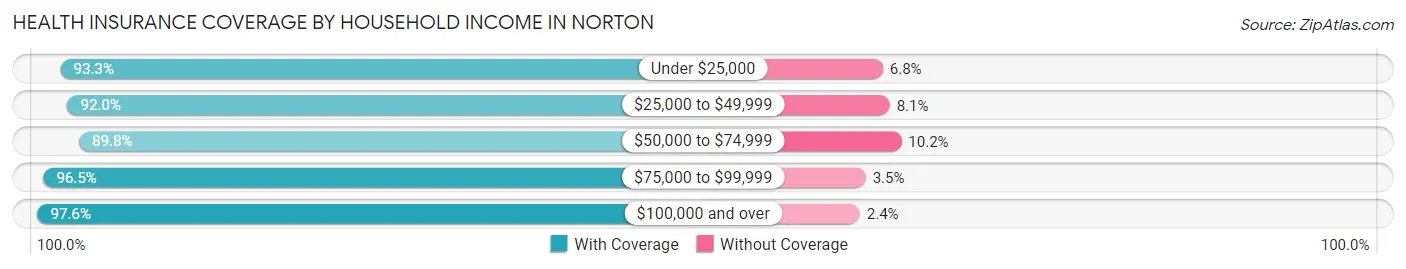
| Household Income | With Coverage | Without Coverage |
| Under $25,000 | 691 (93.2%) | 50 (6.8%) |
| $25,000 to $49,999 | 1,370 (91.9%) | 120 (8.1%) |
| $50,000 to $74,999 | 1,694 (89.8%) | 193 (10.2%) |
| $75,000 to $99,999 | 1,555 (96.5%) | 57 (3.5%) |
| $100,000 and over | 5,756 (97.6%) | 144 (2.4%) |
Public vs Private Health Insurance Coverage by Age in Norton
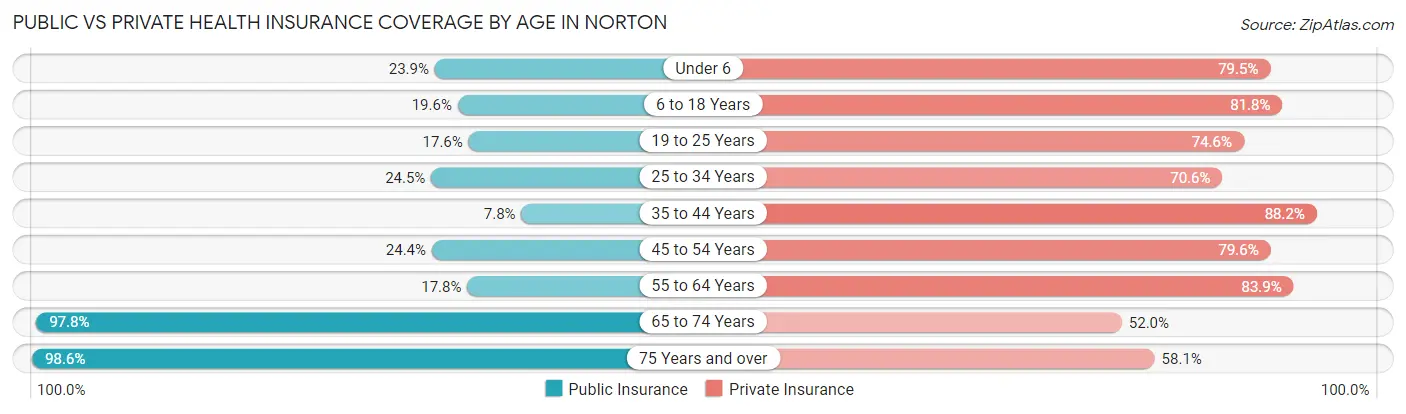
| Age Bracket | Public Insurance | Private Insurance |
| Under 6 | 120 (23.9%) | 400 (79.5%) |
| 6 to 18 Years | 375 (19.6%) | 1,564 (81.8%) |
| 19 to 25 Years | 135 (17.6%) | 573 (74.6%) |
| 25 to 34 Years | 273 (24.5%) | 786 (70.6%) |
| 35 to 44 Years | 113 (7.8%) | 1,280 (88.1%) |
| 45 to 54 Years | 404 (24.4%) | 1,317 (79.6%) |
| 55 to 64 Years | 285 (17.8%) | 1,340 (83.9%) |
| 65 to 74 Years | 1,583 (97.8%) | 841 (52.0%) |
| 75 Years and over | 1,002 (98.6%) | 590 (58.1%) |
| Total | 4,290 (36.9%) | 8,691 (74.7%) |
Disability Status by Sex by Age in Norton
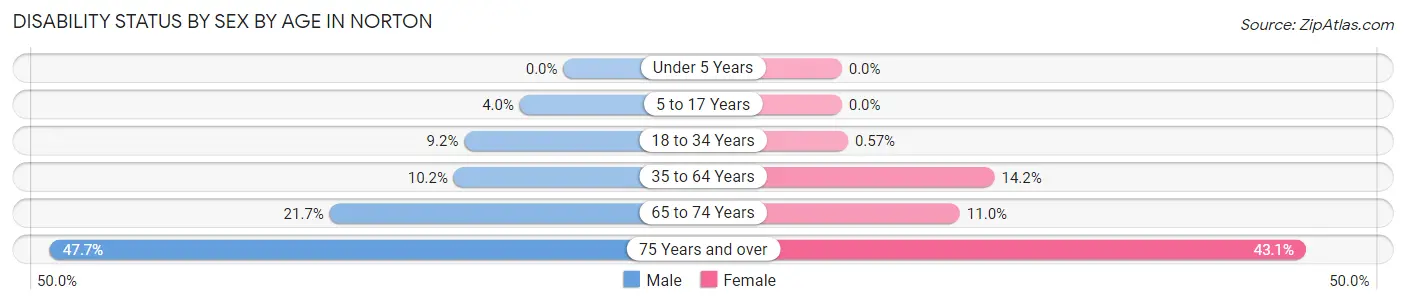
| Age Bracket | Male | Female |
| Under 5 Years | 0 (0.0%) | 0 (0.0%) |
| 5 to 17 Years | 41 (4.0%) | 0 (0.0%) |
| 18 to 34 Years | 103 (9.2%) | 5 (0.6%) |
| 35 to 64 Years | 239 (10.2%) | 334 (14.2%) |
| 65 to 74 Years | 159 (21.7%) | 97 (11.0%) |
| 75 Years and over | 213 (47.6%) | 245 (43.1%) |
Disability Class by Sex by Age in Norton
Disability Class: Hearing Difficulty
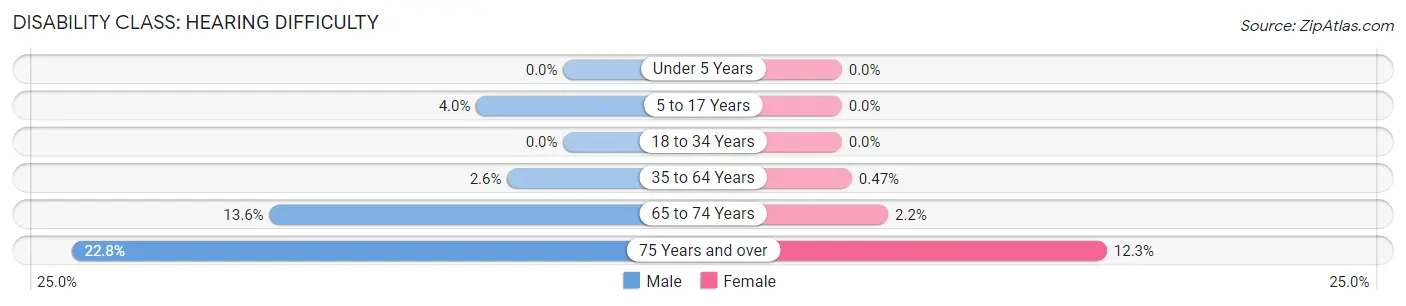
| Age Bracket | Male | Female |
| Under 5 Years | 0 (0.0%) | 0 (0.0%) |
| 5 to 17 Years | 41 (4.0%) | 0 (0.0%) |
| 18 to 34 Years | 0 (0.0%) | 0 (0.0%) |
| 35 to 64 Years | 61 (2.6%) | 11 (0.5%) |
| 65 to 74 Years | 100 (13.6%) | 19 (2.1%) |
| 75 Years and over | 102 (22.8%) | 70 (12.3%) |
Disability Class: Vision Difficulty
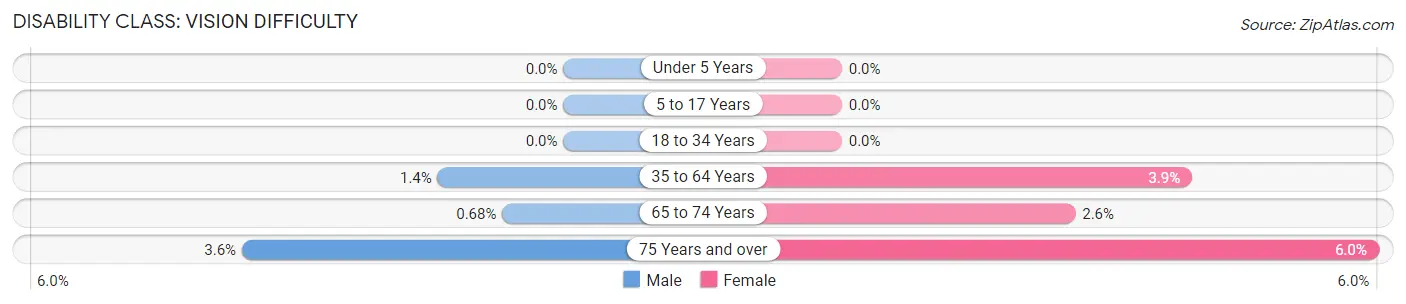
| Age Bracket | Male | Female |
| Under 5 Years | 0 (0.0%) | 0 (0.0%) |
| 5 to 17 Years | 0 (0.0%) | 0 (0.0%) |
| 18 to 34 Years | 0 (0.0%) | 0 (0.0%) |
| 35 to 64 Years | 33 (1.4%) | 92 (3.9%) |
| 65 to 74 Years | 5 (0.7%) | 23 (2.6%) |
| 75 Years and over | 16 (3.6%) | 34 (6.0%) |
Disability Class: Cognitive Difficulty
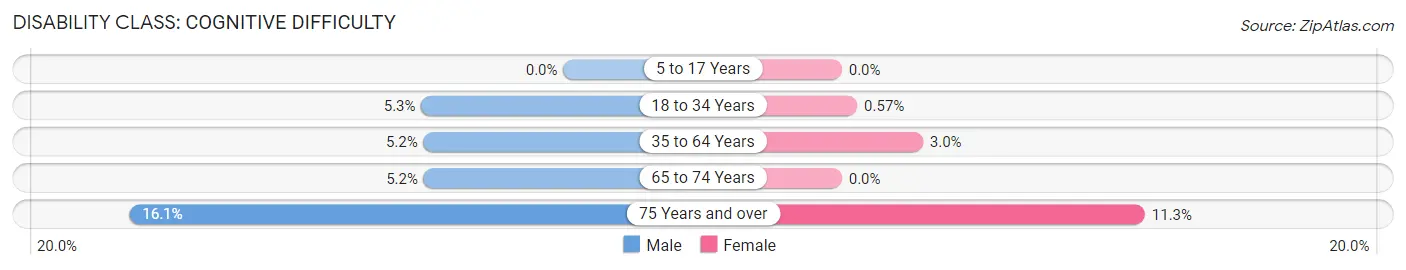
| Age Bracket | Male | Female |
| 5 to 17 Years | 0 (0.0%) | 0 (0.0%) |
| 18 to 34 Years | 59 (5.3%) | 5 (0.6%) |
| 35 to 64 Years | 122 (5.2%) | 71 (3.0%) |
| 65 to 74 Years | 38 (5.2%) | 0 (0.0%) |
| 75 Years and over | 72 (16.1%) | 64 (11.3%) |
Disability Class: Ambulatory Difficulty
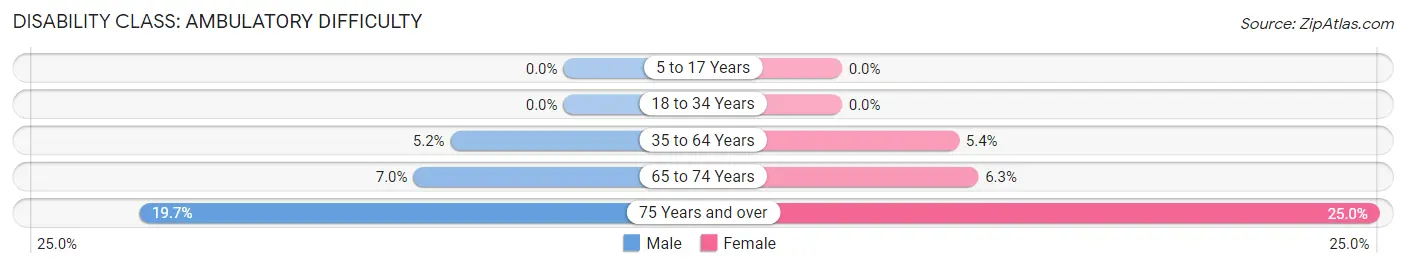
| Age Bracket | Male | Female |
| 5 to 17 Years | 0 (0.0%) | 0 (0.0%) |
| 18 to 34 Years | 0 (0.0%) | 0 (0.0%) |
| 35 to 64 Years | 123 (5.2%) | 128 (5.4%) |
| 65 to 74 Years | 51 (7.0%) | 56 (6.3%) |
| 75 Years and over | 88 (19.7%) | 142 (25.0%) |
Disability Class: Self-Care Difficulty
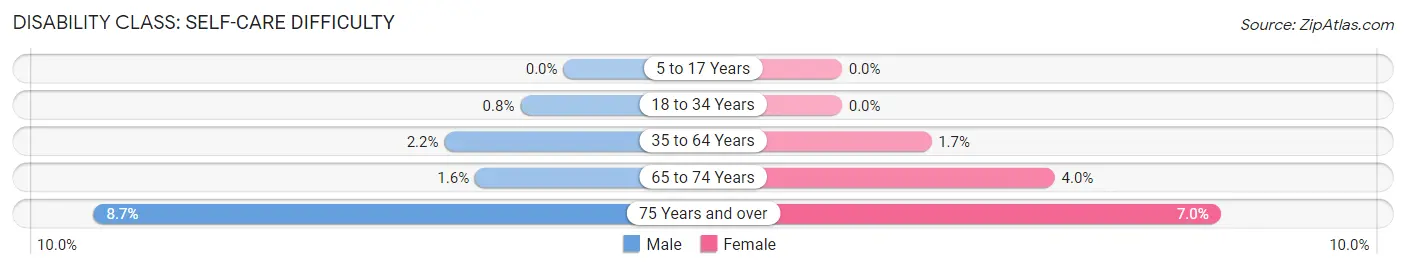
| Age Bracket | Male | Female |
| 5 to 17 Years | 0 (0.0%) | 0 (0.0%) |
| 18 to 34 Years | 9 (0.8%) | 0 (0.0%) |
| 35 to 64 Years | 52 (2.2%) | 39 (1.7%) |
| 65 to 74 Years | 12 (1.6%) | 35 (4.0%) |
| 75 Years and over | 39 (8.7%) | 40 (7.0%) |
Technology Access in Norton
Computing Device Access in Norton
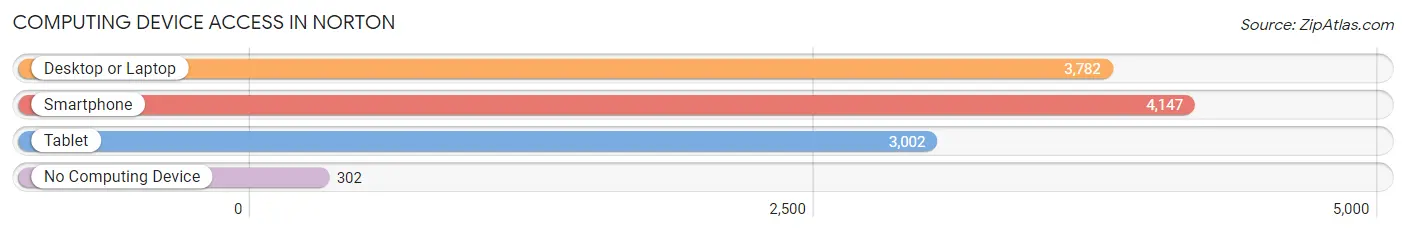
| Device Type | # Households | % Households |
| Desktop or Laptop | 3,782 | 79.0% |
| Smartphone | 4,147 | 86.7% |
| Tablet | 3,002 | 62.7% |
| No Computing Device | 302 | 6.3% |
| Total | 4,786 | 100.0% |
Internet Access in Norton
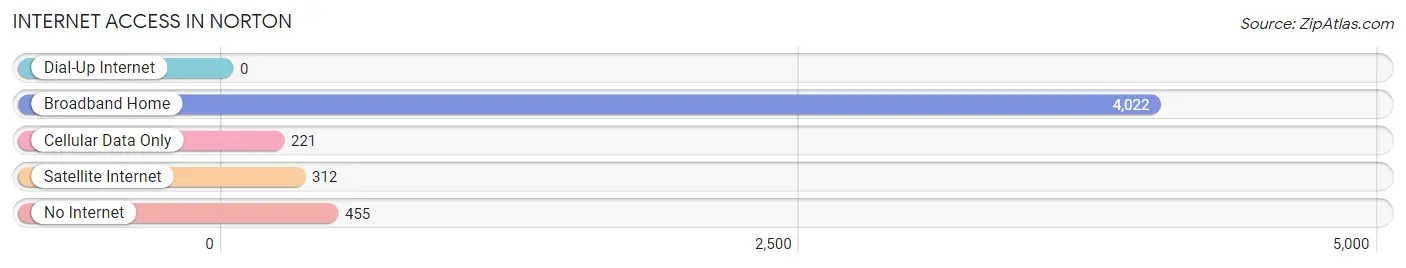
| Internet Type | # Households | % Households |
| Dial-Up Internet | 0 | 0.0% |
| Broadband Home | 4,022 | 84.0% |
| Cellular Data Only | 221 | 4.6% |
| Satellite Internet | 312 | 6.5% |
| No Internet | 455 | 9.5% |
| Total | 4,786 | 100.0% |
Norton Summary
Norton, Ohio is a small city located in Summit County, Ohio. It is part of the Akron Metropolitan Statistical Area and is located approximately 15 miles south of Akron. The city has a population of 12,085 as of the 2010 census.
History
Norton was founded in 1818 by settlers from Connecticut. The city was named after Norton, Connecticut, the hometown of the settlers. The city was incorporated in 1868.
In the late 19th century, Norton was a major center for the production of bricks. The city was also home to several coal mines, which provided employment for many of the city's residents.
Geography
Norton is located at 41°2'43"N 81°33'17"W (41.045278, -81.554722). The city has a total area of 8.2 square miles, all of which is land.
The city is located in the Cuyahoga River Valley, which is part of the Great Lakes region. The city is bordered by Barberton to the north, Wadsworth to the east, and Copley Township to the south and west.
Economy
Norton's economy is largely based on manufacturing and retail. The city is home to several manufacturing companies, including Norton Industries, which produces industrial and automotive parts, and Norton Tool and Die, which produces tools and dies.
The city is also home to several retail stores, including a Walmart Supercenter, a Lowe's Home Improvement store, and a Target store.
Demographics
As of the 2010 census, the population of Norton was 12,085. The racial makeup of the city was 94.2% White, 2.3% African American, 0.3% Native American, 0.9% Asian, 0.1% Pacific Islander, 0.7% from other races, and 1.5% from two or more races. Hispanic or Latino of any race were 2.2% of the population.
The median household income in Norton was $50,945, and the median family income was $60,945. The per capita income for the city was $25,845. About 6.2% of families and 8.2% of the population were below the poverty line, including 11.2% of those under age 18 and 6.2% of those age 65 or over.
Common Questions
What is Per Capita Income in Norton?
Per Capita income in Norton is $39,918.
What is the Median Family Income in Norton?
Median Family Income in Norton is $91,976.
What is the Median Household income in Norton?
Median Household Income in Norton is $81,034.
What is Income or Wage Gap in Norton?
Income or Wage Gap in Norton is 39.5%.
Women in Norton earn 60.5 cents for every dollar earned by a man.
What is Inequality or Gini Index in Norton?
Inequality or Gini Index in Norton is 0.39.
What is the Total Population of Norton?
Total Population of Norton is 11,643.
What is the Total Male Population of Norton?
Total Male Population of Norton is 5,924.
What is the Total Female Population of Norton?
Total Female Population of Norton is 5,719.
What is the Ratio of Males per 100 Females in Norton?
There are 103.58 Males per 100 Females in Norton.
What is the Ratio of Females per 100 Males in Norton?
There are 96.54 Females per 100 Males in Norton.
What is the Median Population Age in Norton?
Median Population Age in Norton is 45.5 Years.
What is the Average Family Size in Norton
Average Family Size in Norton is 2.9 People.
What is the Average Household Size in Norton
Average Household Size in Norton is 2.4 People.
How Large is the Labor Force in Norton?
There are 6,129 People in the Labor Forcein in Norton.
What is the Percentage of People in the Labor Force in Norton?
63.7% of People are in the Labor Force in Norton.
What is the Unemployment Rate in Norton?
Unemployment Rate in Norton is 4.0%.