Ney, OH Map & Demographics
Ney Map
Ney Overview
$25,435
PER CAPITA INCOME
$75,833
AVG FAMILY INCOME
$64,792
AVG HOUSEHOLD INCOME
8.1%
WAGE / INCOME GAP [ % ]
91.9¢/ $1
WAGE / INCOME GAP [ $ ]
0.34
INEQUALITY / GINI INDEX
301
TOTAL POPULATION
147
MALE POPULATION
154
FEMALE POPULATION
95.45
MALES / 100 FEMALES
104.76
FEMALES / 100 MALES
39.8
MEDIAN AGE
3.5
AVG FAMILY SIZE
2.7
AVG HOUSEHOLD SIZE
175
LABOR FORCE [ PEOPLE ]
74.8%
PERCENT IN LABOR FORCE
0.6%
UNEMPLOYMENT RATE
Ney Zip Codes
Income in Ney
Income Overview in Ney
Per Capita Income in Ney is $25,435, while median incomes of families and households are $75,833 and $64,792 respectively.
| Characteristic | Number | Measure |
| Per Capita Income | 301 | $25,435 |
| Median Family Income | 68 | $75,833 |
| Mean Family Income | 68 | $77,149 |
| Median Household Income | 111 | $64,792 |
| Mean Household Income | 111 | $66,919 |
| Income Deficit | 68 | $0 |
| Wage / Income Gap (%) | 301 | 8.07% |
| Wage / Income Gap ($) | 301 | 91.93¢ per $1 |
| Gini / Inequality Index | 301 | 0.34 |
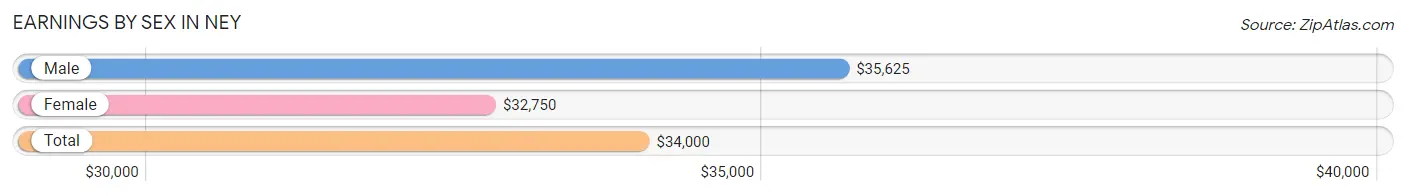
Earnings by Sex in Ney
Average Earnings in Ney are $34,000, $35,625 for men and $32,750 for women, a difference of 8.1%.
| Sex | Number | Average Earnings |
| Male | 93 (52.8%) | $35,625 |
| Female | 83 (47.2%) | $32,750 |
| Total | 176 (100.0%) | $34,000 |
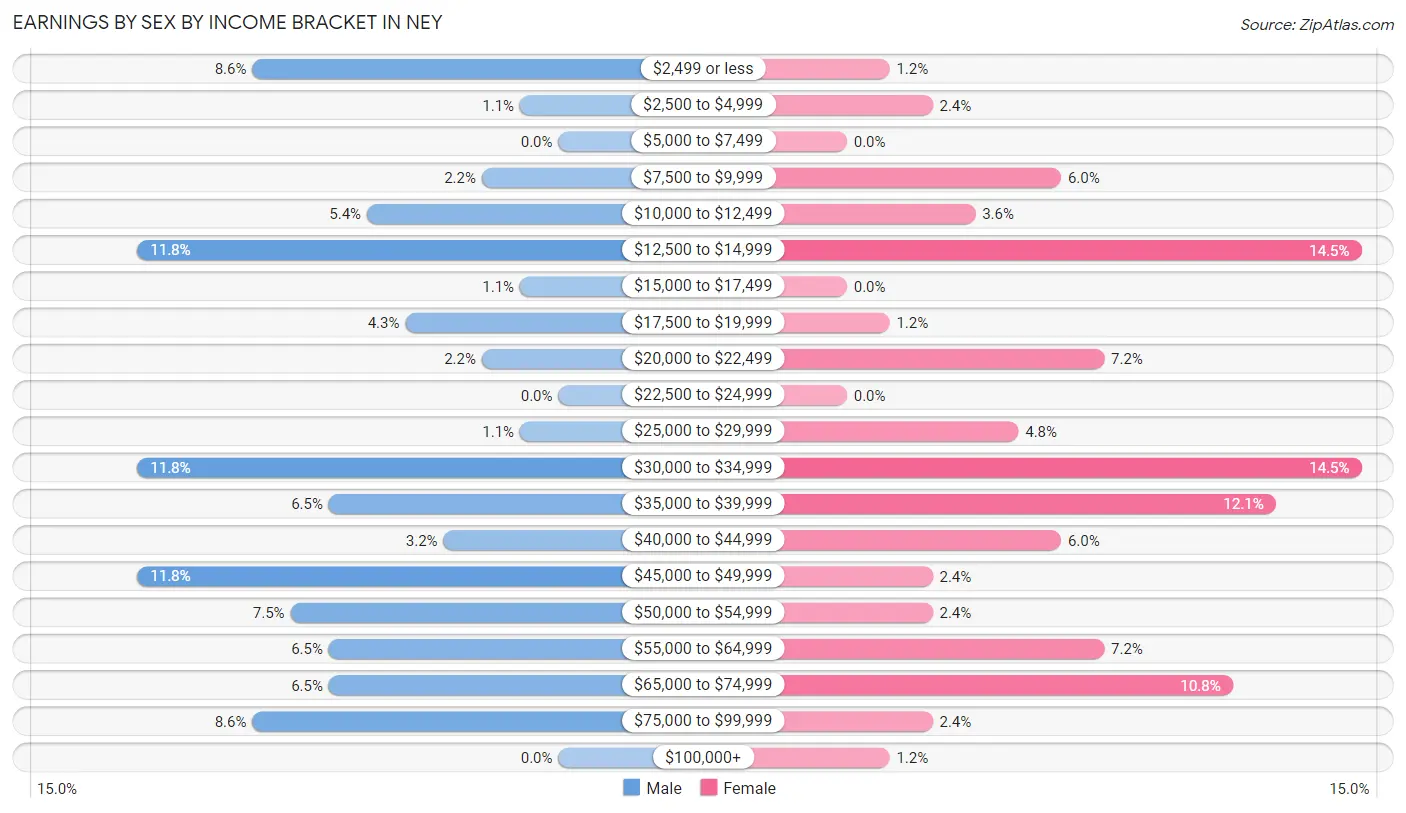
Earnings by Sex by Income Bracket in Ney
The most common earnings brackets in Ney are $12,500 to $14,999 for men (11 | 11.8%) and $12,500 to $14,999 for women (12 | 14.5%).
| Income | Male | Female |
| $2,499 or less | 8 (8.6%) | 1 (1.2%) |
| $2,500 to $4,999 | 1 (1.1%) | 2 (2.4%) |
| $5,000 to $7,499 | 0 (0.0%) | 0 (0.0%) |
| $7,500 to $9,999 | 2 (2.1%) | 5 (6.0%) |
| $10,000 to $12,499 | 5 (5.4%) | 3 (3.6%) |
| $12,500 to $14,999 | 11 (11.8%) | 12 (14.5%) |
| $15,000 to $17,499 | 1 (1.1%) | 0 (0.0%) |
| $17,500 to $19,999 | 4 (4.3%) | 1 (1.2%) |
| $20,000 to $22,499 | 2 (2.1%) | 6 (7.2%) |
| $22,500 to $24,999 | 0 (0.0%) | 0 (0.0%) |
| $25,000 to $29,999 | 1 (1.1%) | 4 (4.8%) |
| $30,000 to $34,999 | 11 (11.8%) | 12 (14.5%) |
| $35,000 to $39,999 | 6 (6.5%) | 10 (12.0%) |
| $40,000 to $44,999 | 3 (3.2%) | 5 (6.0%) |
| $45,000 to $49,999 | 11 (11.8%) | 2 (2.4%) |
| $50,000 to $54,999 | 7 (7.5%) | 2 (2.4%) |
| $55,000 to $64,999 | 6 (6.5%) | 6 (7.2%) |
| $65,000 to $74,999 | 6 (6.5%) | 9 (10.8%) |
| $75,000 to $99,999 | 8 (8.6%) | 2 (2.4%) |
| $100,000+ | 0 (0.0%) | 1 (1.2%) |
| Total | 93 (100.0%) | 83 (100.0%) |
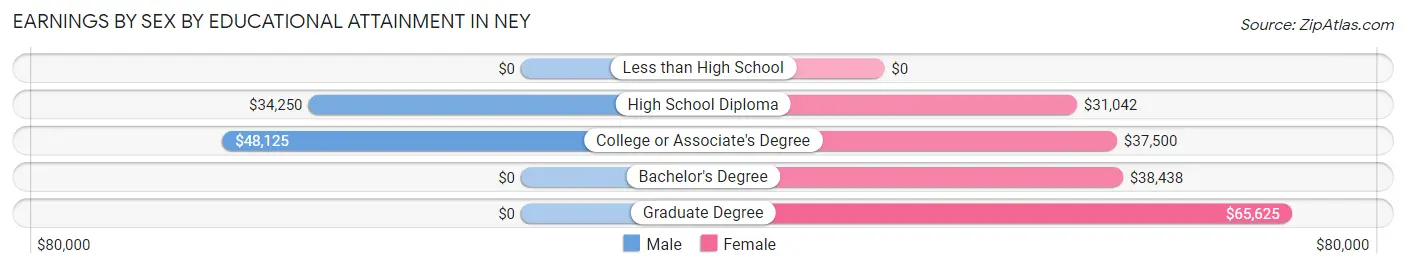
Earnings by Sex by Educational Attainment in Ney
Average earnings in Ney are $41,875 for men and $34,750 for women, a difference of 17.0%. Men with an educational attainment of college or associate's degree enjoy the highest average annual earnings of $48,125, while those with high school diploma education earn the least with $34,250. Women with an educational attainment of graduate degree earn the most with the average annual earnings of $65,625, while those with high school diploma education have the smallest earnings of $31,042.
| Educational Attainment | Male Income | Female Income |
| Less than High School | - | - |
| High School Diploma | $34,250 | $31,042 |
| College or Associate's Degree | $48,125 | $37,500 |
| Bachelor's Degree | - | - |
| Graduate Degree | - | - |
| Total | $41,875 | $34,750 |
Family Income in Ney
Family Income Brackets in Ney
According to the Ney family income data, there are 22 families falling into the $75,000 to $99,999 income range, which is the most common income bracket and makes up 32.4% of all families.
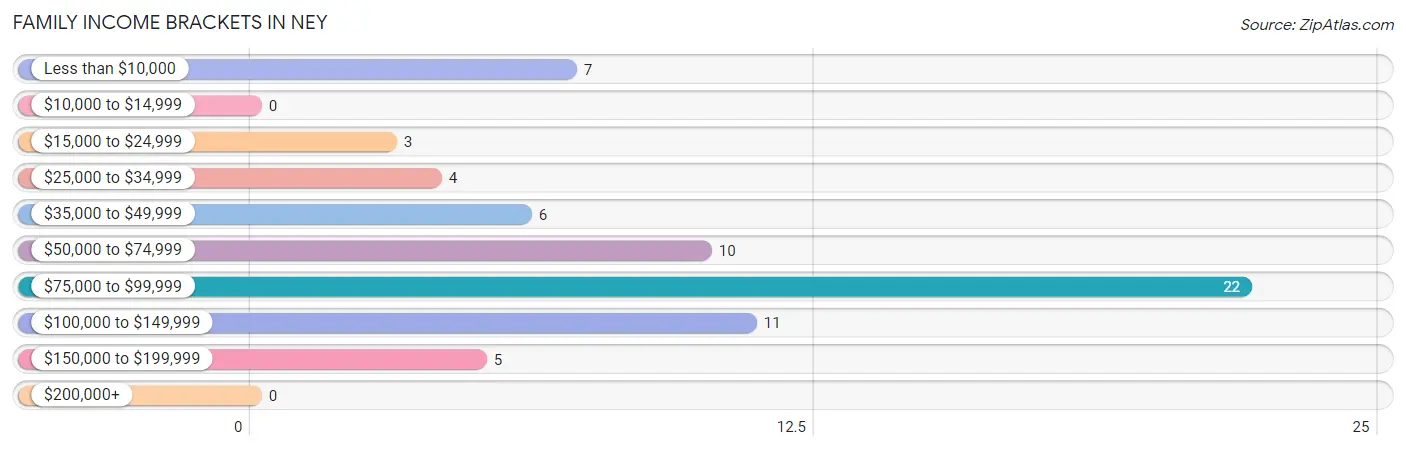
| Income Bracket | # Families | % Families |
| Less than $10,000 | 7 | 10.3% |
| $10,000 to $14,999 | 0 | 0.0% |
| $15,000 to $24,999 | 3 | 4.4% |
| $25,000 to $34,999 | 4 | 5.9% |
| $35,000 to $49,999 | 6 | 8.8% |
| $50,000 to $74,999 | 10 | 14.7% |
| $75,000 to $99,999 | 22 | 32.4% |
| $100,000 to $149,999 | 11 | 16.2% |
| $150,000 to $199,999 | 5 | 7.4% |
| $200,000+ | 0 | 0.0% |
Family Income by Famaliy Size in Ney
4-person families (12 | 17.6%) account for the highest median family income in Ney with $125,000 per family, while 2-person families (27 | 39.7%) have the highest median income of $34,688 per family member.
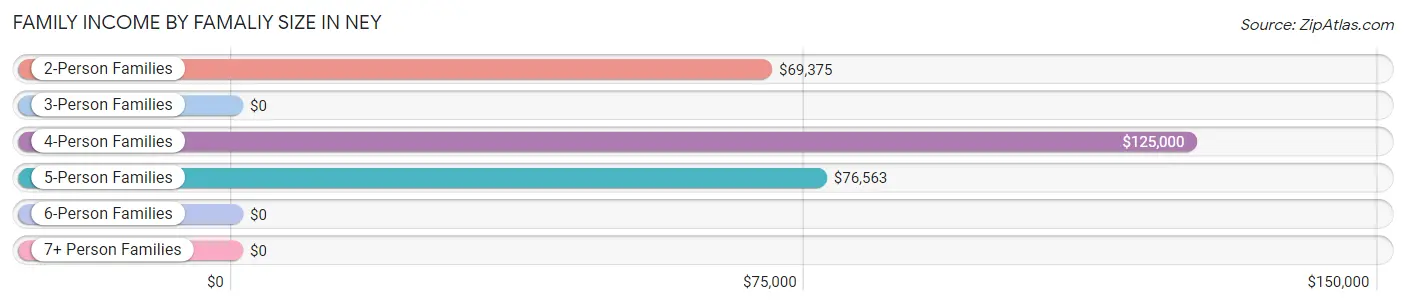
| Income Bracket | # Families | Median Income |
| 2-Person Families | 27 (39.7%) | $69,375 |
| 3-Person Families | 13 (19.1%) | $0 |
| 4-Person Families | 12 (17.6%) | $125,000 |
| 5-Person Families | 9 (13.2%) | $76,563 |
| 6-Person Families | 2 (2.9%) | $0 |
| 7+ Person Families | 5 (7.3%) | $0 |
| Total | 68 (100.0%) | $75,833 |
Family Income by Number of Earners in Ney
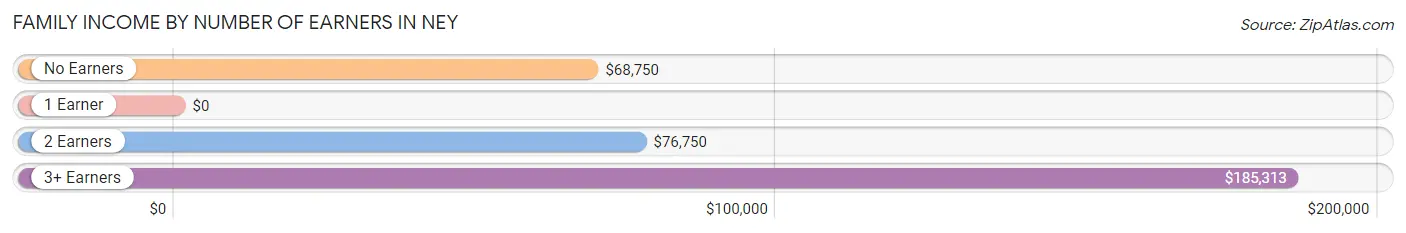
| Number of Earners | # Families | Median Income |
| No Earners | 10 (14.7%) | $68,750 |
| 1 Earner | 17 (25.0%) | $0 |
| 2 Earners | 34 (50.0%) | $76,750 |
| 3+ Earners | 7 (10.3%) | $185,313 |
| Total | 68 (100.0%) | $75,833 |
Household Income in Ney
Household Income Brackets in Ney
With 27 households falling in the category, the $75,000 to $99,999 income range is the most frequent in Ney, accounting for 24.3% of all households.
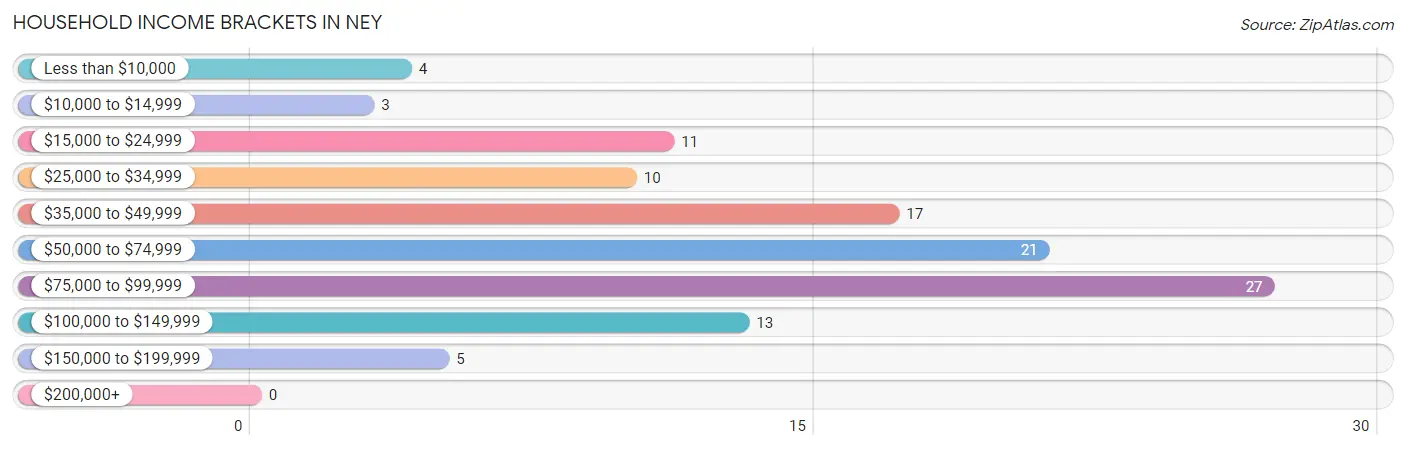
| Income Bracket | # Households | % Households |
| Less than $10,000 | 4 | 3.6% |
| $10,000 to $14,999 | 3 | 2.7% |
| $15,000 to $24,999 | 11 | 9.9% |
| $25,000 to $34,999 | 10 | 9.0% |
| $35,000 to $49,999 | 17 | 15.3% |
| $50,000 to $74,999 | 21 | 18.9% |
| $75,000 to $99,999 | 27 | 24.3% |
| $100,000 to $149,999 | 13 | 11.7% |
| $150,000 to $199,999 | 5 | 4.5% |
| $200,000+ | 0 | 0.0% |
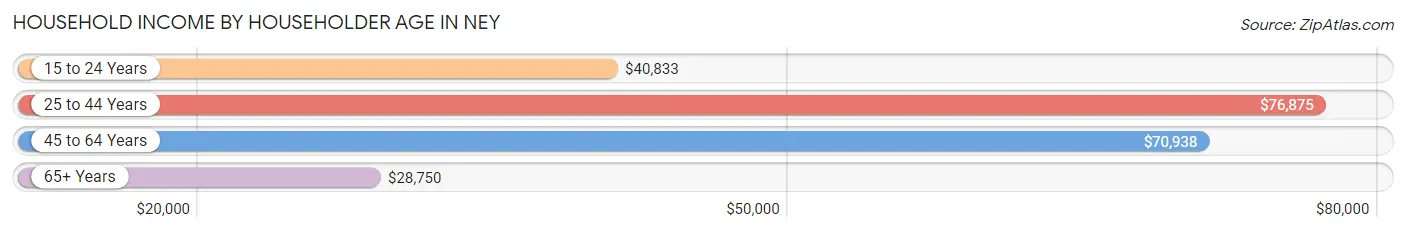
Household Income by Householder Age in Ney
The median household income in Ney is $64,792, with the highest median household income of $76,875 found in the 25 to 44 years age bracket for the primary householder. A total of 31 households (27.9%) fall into this category. Meanwhile, the 65+ years age bracket for the primary householder has the lowest median household income of $28,750, with 27 households (24.3%) in this group.
| Income Bracket | # Households | Median Income |
| 15 to 24 Years | 4 (3.6%) | $40,833 |
| 25 to 44 Years | 31 (27.9%) | $76,875 |
| 45 to 64 Years | 49 (44.1%) | $70,938 |
| 65+ Years | 27 (24.3%) | $28,750 |
| Total | 111 (100.0%) | $64,792 |
Poverty in Ney
Income Below Poverty by Sex and Age in Ney
With 15.2% poverty level for males and 17.5% for females among the residents of Ney, under 5 year old males and under 5 year old females are the most vulnerable to poverty, with 5 males (83.3%) and 5 females (83.3%) in their respective age groups living below the poverty level.
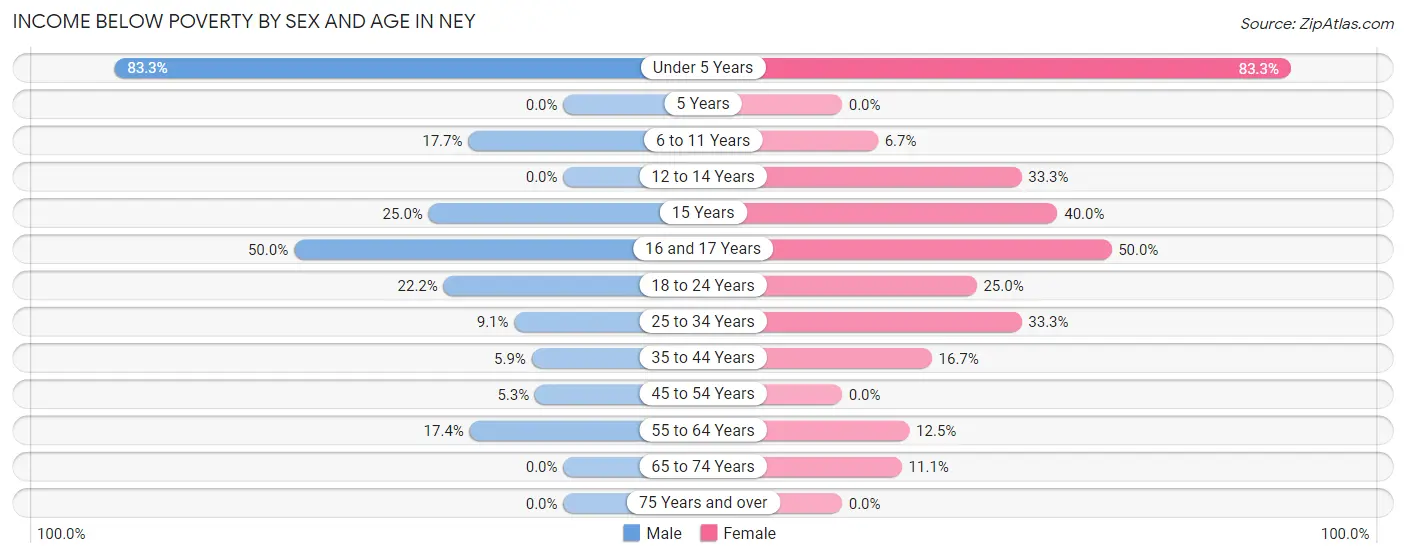
| Age Bracket | Male | Female |
| Under 5 Years | 5 (83.3%) | 5 (83.3%) |
| 5 Years | 0 (0.0%) | 0 (0.0%) |
| 6 to 11 Years | 3 (17.6%) | 1 (6.7%) |
| 12 to 14 Years | 0 (0.0%) | 1 (33.3%) |
| 15 Years | 1 (25.0%) | 2 (40.0%) |
| 16 and 17 Years | 1 (50.0%) | 2 (50.0%) |
| 18 to 24 Years | 4 (22.2%) | 2 (25.0%) |
| 25 to 34 Years | 2 (9.1%) | 5 (33.3%) |
| 35 to 44 Years | 1 (5.9%) | 5 (16.7%) |
| 45 to 54 Years | 1 (5.3%) | 0 (0.0%) |
| 55 to 64 Years | 4 (17.4%) | 3 (12.5%) |
| 65 to 74 Years | 0 (0.0%) | 1 (11.1%) |
| 75 Years and over | 0 (0.0%) | 0 (0.0%) |
| Total | 22 (15.2%) | 27 (17.5%) |
Income Above Poverty by Sex and Age in Ney
According to the poverty statistics in Ney, males aged 5 years and females aged 5 years are the age groups that are most secure financially, with 100.0% of males and 100.0% of females in these age groups living above the poverty line.
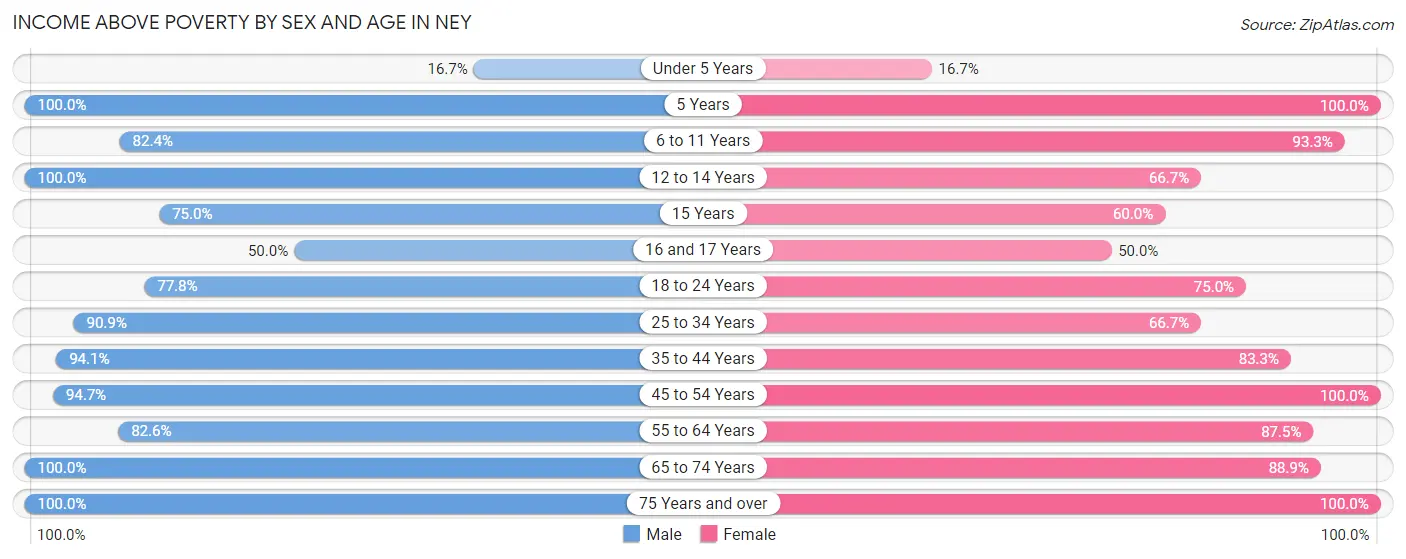
| Age Bracket | Male | Female |
| Under 5 Years | 1 (16.7%) | 1 (16.7%) |
| 5 Years | 2 (100.0%) | 3 (100.0%) |
| 6 to 11 Years | 14 (82.4%) | 14 (93.3%) |
| 12 to 14 Years | 4 (100.0%) | 2 (66.7%) |
| 15 Years | 3 (75.0%) | 3 (60.0%) |
| 16 and 17 Years | 1 (50.0%) | 2 (50.0%) |
| 18 to 24 Years | 14 (77.8%) | 6 (75.0%) |
| 25 to 34 Years | 20 (90.9%) | 10 (66.7%) |
| 35 to 44 Years | 16 (94.1%) | 25 (83.3%) |
| 45 to 54 Years | 18 (94.7%) | 17 (100.0%) |
| 55 to 64 Years | 19 (82.6%) | 21 (87.5%) |
| 65 to 74 Years | 8 (100.0%) | 8 (88.9%) |
| 75 Years and over | 3 (100.0%) | 15 (100.0%) |
| Total | 123 (84.8%) | 127 (82.5%) |
Income Below Poverty Among Married-Couple Families in Ney
The poverty statistics for married-couple families in Ney show that 5.4% or 3 of the total 55 families live below the poverty line. Families with 3 or 4 children have the highest poverty rate of 25.0%, comprising of 1 families. On the other hand, families with no children have the lowest poverty rate of 0.0%, which includes 0 families.
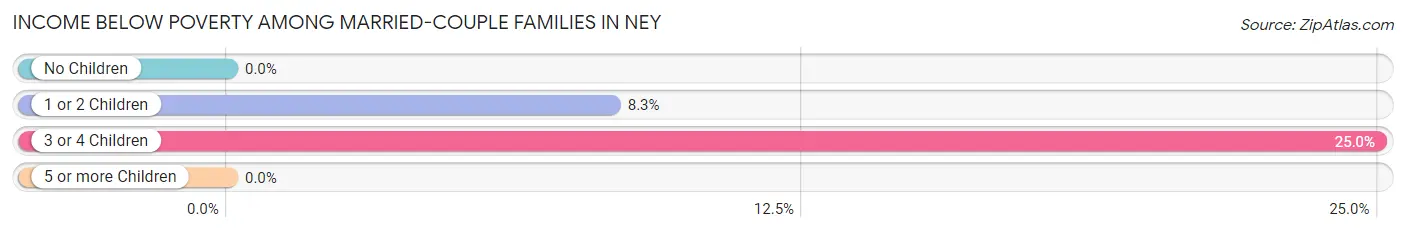
| Children | Above Poverty | Below Poverty |
| No Children | 27 (100.0%) | 0 (0.0%) |
| 1 or 2 Children | 22 (91.7%) | 2 (8.3%) |
| 3 or 4 Children | 3 (75.0%) | 1 (25.0%) |
| 5 or more Children | 0 (0.0%) | 0 (0.0%) |
| Total | 52 (94.6%) | 3 (5.4%) |
Income Below Poverty Among Single-Parent Households in Ney
According to the poverty data in Ney, 66.7% or 2 single-father households and 50.0% or 5 single-mother households are living below the poverty line. Among single-father households, those with 3 or 4 children have the highest poverty rate, with 2 households (100.0%) experiencing poverty. Likewise, among single-mother households, those with 1 or 2 children have the highest poverty rate, with 5 households (55.6%) falling below the poverty line.
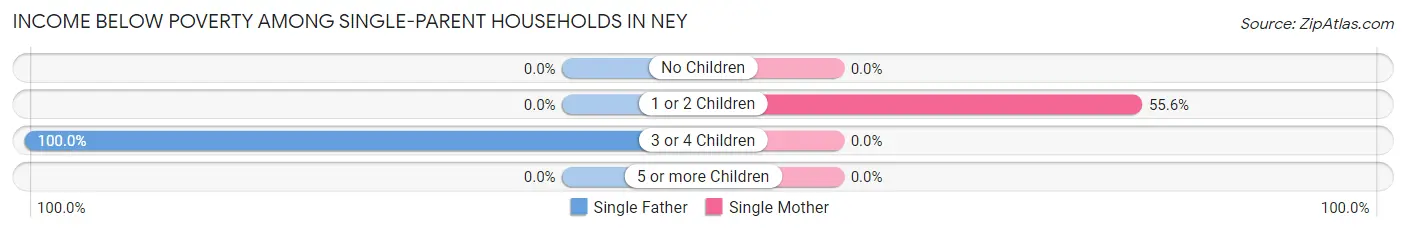
| Children | Single Father | Single Mother |
| No Children | 0 (0.0%) | 0 (0.0%) |
| 1 or 2 Children | 0 (0.0%) | 5 (55.6%) |
| 3 or 4 Children | 2 (100.0%) | 0 (0.0%) |
| 5 or more Children | 0 (0.0%) | 0 (0.0%) |
| Total | 2 (66.7%) | 5 (50.0%) |
Income Below Poverty Among Married-Couple vs Single-Parent Households in Ney
The poverty data for Ney shows that 3 of the married-couple family households (5.4%) and 7 of the single-parent households (53.8%) are living below the poverty level. Within the married-couple family households, those with 3 or 4 children have the highest poverty rate, with 1 households (25.0%) falling below the poverty line. Among the single-parent households, those with 3 or 4 children have the highest poverty rate, with 2 household (66.7%) living below poverty.
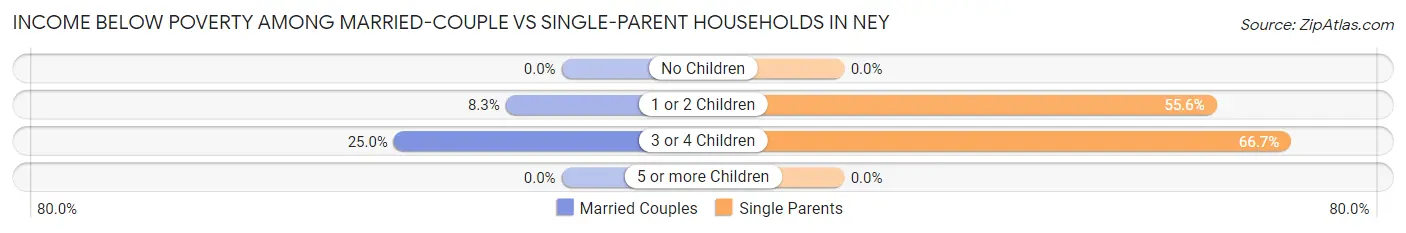
| Children | Married-Couple Families | Single-Parent Households |
| No Children | 0 (0.0%) | 0 (0.0%) |
| 1 or 2 Children | 2 (8.3%) | 5 (55.6%) |
| 3 or 4 Children | 1 (25.0%) | 2 (66.7%) |
| 5 or more Children | 0 (0.0%) | 0 (0.0%) |
| Total | 3 (5.4%) | 7 (53.8%) |
Race in Ney
The most populous races in Ney are White / Caucasian (290 | 96.4%), Two or more Races (10 | 3.3%), and Black / African American (1 | 0.3%).
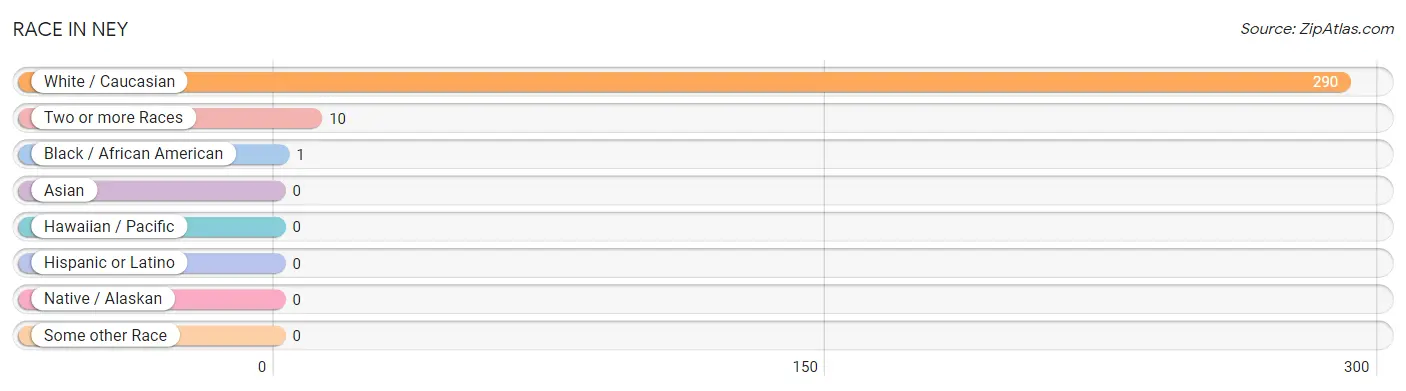
| Race | # Population | % Population |
| Asian | 0 | 0.0% |
| Black / African American | 1 | 0.3% |
| Hawaiian / Pacific | 0 | 0.0% |
| Hispanic or Latino | 0 | 0.0% |
| Native / Alaskan | 0 | 0.0% |
| White / Caucasian | 290 | 96.4% |
| Two or more Races | 10 | 3.3% |
| Some other Race | 0 | 0.0% |
| Total | 301 | 100.0% |
Ancestry in Ney
The most populous ancestries reported in Ney are German (136 | 45.2%), English (38 | 12.6%), Irish (19 | 6.3%), Swedish (11 | 3.6%), and American (7 | 2.3%), together accounting for 70.1% of all Ney residents.
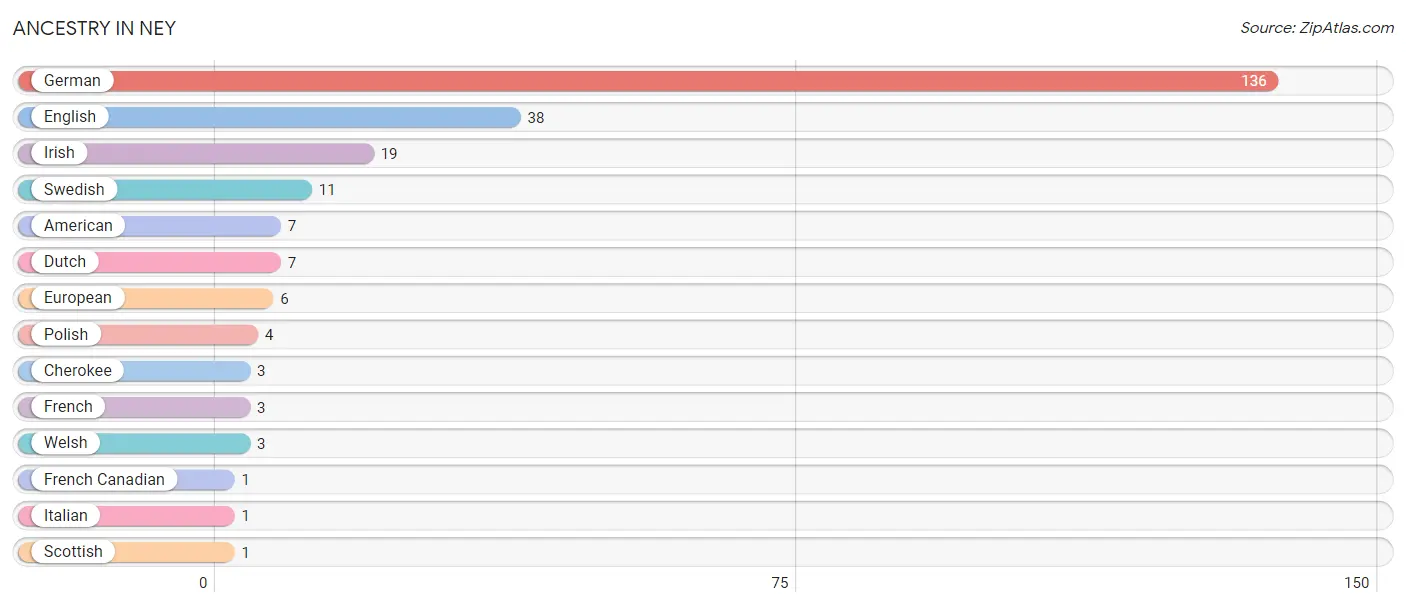
| Ancestry | # Population | % Population |
| American | 7 | 2.3% |
| Cherokee | 3 | 1.0% |
| Dutch | 7 | 2.3% |
| English | 38 | 12.6% |
| European | 6 | 2.0% |
| French | 3 | 1.0% |
| French Canadian | 1 | 0.3% |
| German | 136 | 45.2% |
| Irish | 19 | 6.3% |
| Italian | 1 | 0.3% |
| Polish | 4 | 1.3% |
| Scottish | 1 | 0.3% |
| Swedish | 11 | 3.6% |
| Welsh | 3 | 1.0% | View All 14 Rows |
Immigrants in Ney

| Immigration Origin | # Population | % Population | View All 0 Rows |
Sex and Age in Ney
Sex and Age in Ney
The most populous age groups in Ney are 60 to 64 Years (18 | 12.2%) for men and 40 to 44 Years (18 | 11.7%) for women.
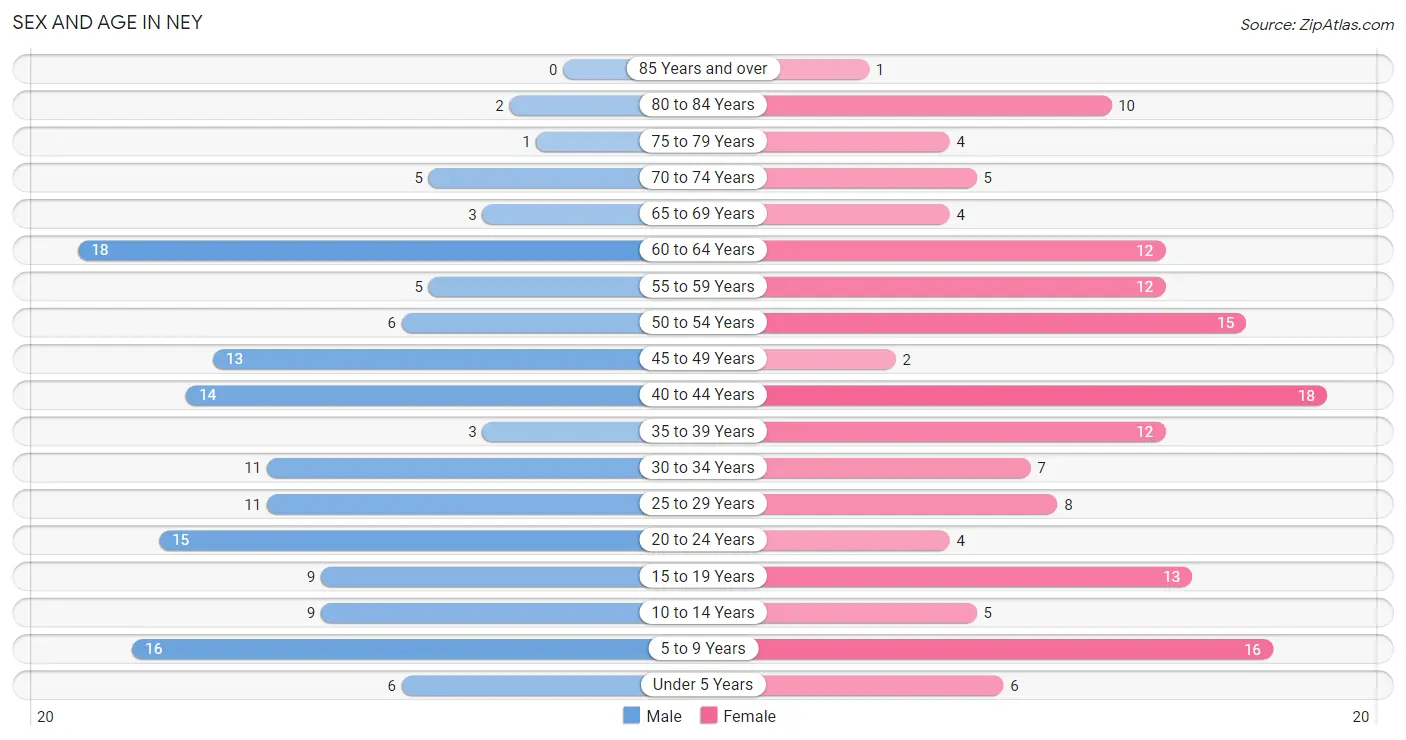
| Age Bracket | Male | Female |
| Under 5 Years | 6 (4.1%) | 6 (3.9%) |
| 5 to 9 Years | 16 (10.9%) | 16 (10.4%) |
| 10 to 14 Years | 9 (6.1%) | 5 (3.3%) |
| 15 to 19 Years | 9 (6.1%) | 13 (8.4%) |
| 20 to 24 Years | 15 (10.2%) | 4 (2.6%) |
| 25 to 29 Years | 11 (7.5%) | 8 (5.2%) |
| 30 to 34 Years | 11 (7.5%) | 7 (4.5%) |
| 35 to 39 Years | 3 (2.0%) | 12 (7.8%) |
| 40 to 44 Years | 14 (9.5%) | 18 (11.7%) |
| 45 to 49 Years | 13 (8.8%) | 2 (1.3%) |
| 50 to 54 Years | 6 (4.1%) | 15 (9.7%) |
| 55 to 59 Years | 5 (3.4%) | 12 (7.8%) |
| 60 to 64 Years | 18 (12.2%) | 12 (7.8%) |
| 65 to 69 Years | 3 (2.0%) | 4 (2.6%) |
| 70 to 74 Years | 5 (3.4%) | 5 (3.3%) |
| 75 to 79 Years | 1 (0.7%) | 4 (2.6%) |
| 80 to 84 Years | 2 (1.4%) | 10 (6.5%) |
| 85 Years and over | 0 (0.0%) | 1 (0.6%) |
| Total | 147 (100.0%) | 154 (100.0%) |
Families and Households in Ney
Median Family Size in Ney
The median family size in Ney is 3.51 persons per family, with married-couple families (55 | 80.9%) accounting for the largest median family size of 3.58 persons per family. On the other hand, single male/father families (3 | 4.4%) represent the smallest median family size with 3.00 persons per family.
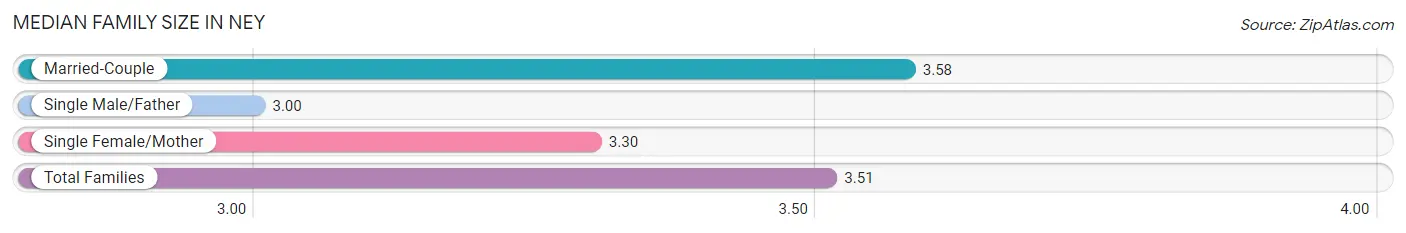
| Family Type | # Families | Family Size |
| Married-Couple | 55 (80.9%) | 3.58 |
| Single Male/Father | 3 (4.4%) | 3.00 |
| Single Female/Mother | 10 (14.7%) | 3.30 |
| Total Families | 68 (100.0%) | 3.51 |
Median Household Size in Ney
The median household size in Ney is 2.71 persons per household, with single male/father households (3 | 2.7%) accounting for the largest median household size of 3.67 persons per household. non-family households (43 | 38.7%) represent the smallest median household size with 1.28 persons per household.
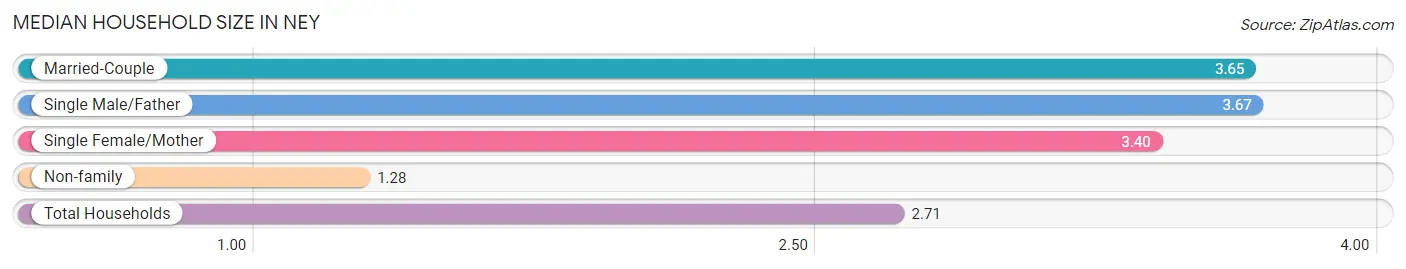
| Household Type | # Households | Household Size |
| Married-Couple | 55 (49.5%) | 3.65 |
| Single Male/Father | 3 (2.7%) | 3.67 |
| Single Female/Mother | 10 (9.0%) | 3.40 |
| Non-family | 43 (38.7%) | 1.28 |
| Total Households | 111 (100.0%) | 2.71 |
Household Size by Marriage Status in Ney
Out of a total of 111 households in Ney, 68 (61.3%) are family households, while 43 (38.7%) are nonfamily households. The most numerous type of family households are 2-person households, comprising 26, and the most common type of nonfamily households are 1-person households, comprising 31.
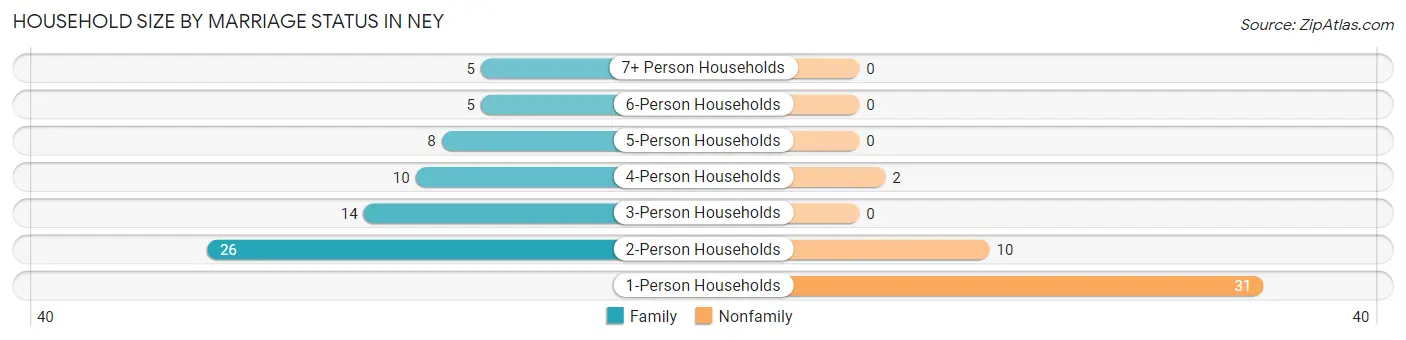
| Household Size | Family Households | Nonfamily Households |
| 1-Person Households | - | 31 (27.9%) |
| 2-Person Households | 26 (23.4%) | 10 (9.0%) |
| 3-Person Households | 14 (12.6%) | 0 (0.0%) |
| 4-Person Households | 10 (9.0%) | 2 (1.8%) |
| 5-Person Households | 8 (7.2%) | 0 (0.0%) |
| 6-Person Households | 5 (4.5%) | 0 (0.0%) |
| 7+ Person Households | 5 (4.5%) | 0 (0.0%) |
| Total | 68 (61.3%) | 43 (38.7%) |
Female Fertility in Ney
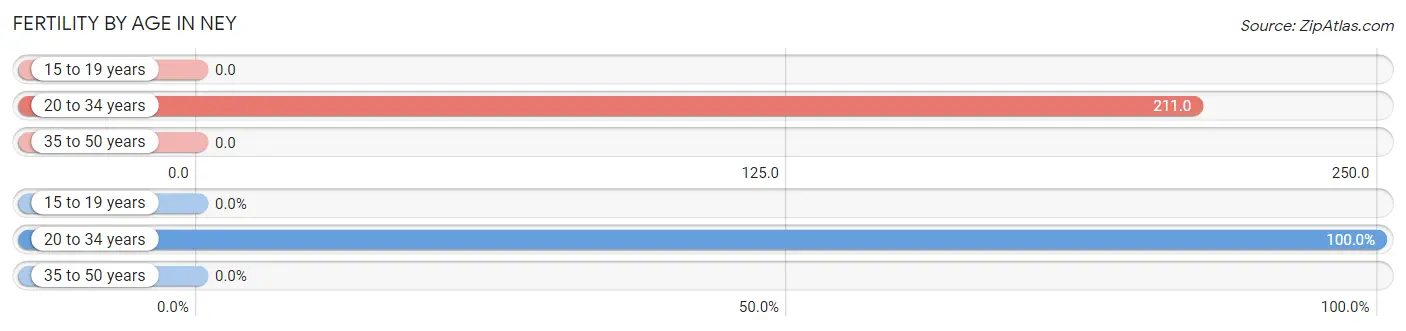
Fertility by Age in Ney
Average fertility rate in Ney is 63.0 births per 1,000 women. Women in the age bracket of 20 to 34 years have the highest fertility rate with 211.0 births per 1,000 women. Women in the age bracket of 20 to 34 years acount for 100.0% of all women with births.
| Age Bracket | Women with Births | Births / 1,000 Women |
| 15 to 19 years | 0 (0.0%) | 0.0 |
| 20 to 34 years | 4 (100.0%) | 211.0 |
| 35 to 50 years | 0 (0.0%) | 0.0 |
| Total | 4 (100.0%) | 63.0 |
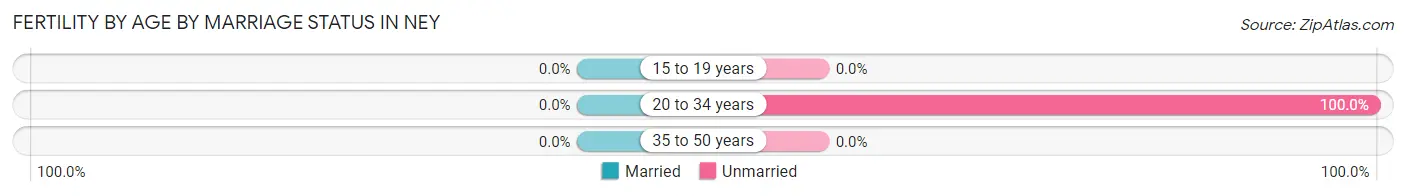
Fertility by Age by Marriage Status in Ney
| Age Bracket | Married | Unmarried |
| 15 to 19 years | 0 (0.0%) | 0 (0.0%) |
| 20 to 34 years | 0 (0.0%) | 4 (100.0%) |
| 35 to 50 years | 0 (0.0%) | 0 (0.0%) |
| Total | 0 (0.0%) | 4 (100.0%) |
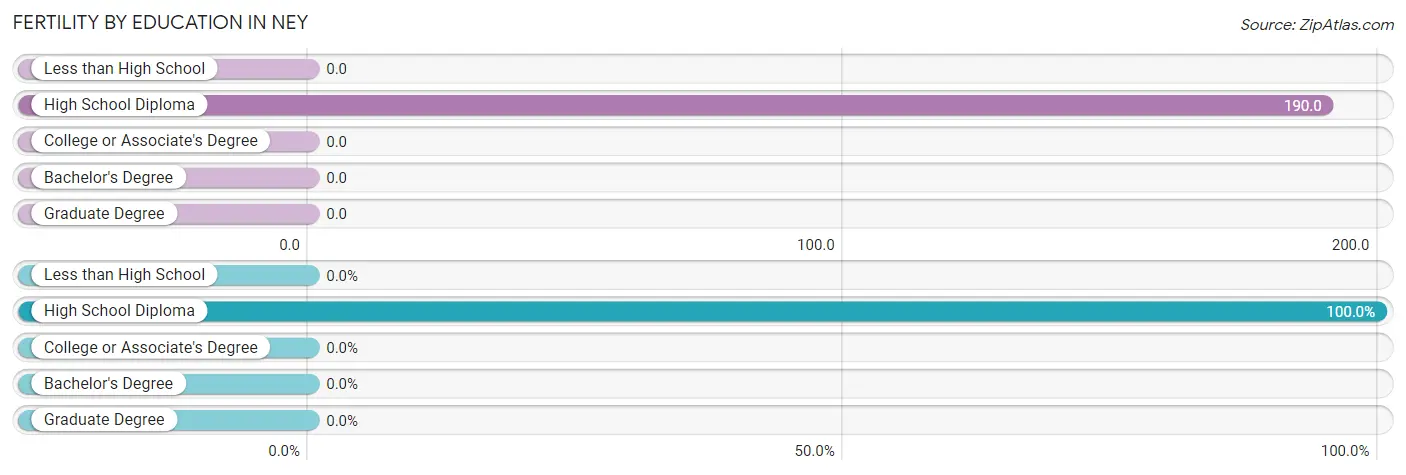
Fertility by Education in Ney
| Educational Attainment | Women with Births | Births / 1,000 Women |
| Less than High School | 0 (0.0%) | 0.0 |
| High School Diploma | 4 (100.0%) | 190.0 |
| College or Associate's Degree | 0 (0.0%) | 0.0 |
| Bachelor's Degree | 0 (0.0%) | 0.0 |
| Graduate Degree | 0 (0.0%) | 0.0 |
| Total | 4 (100.0%) | 63.0 |
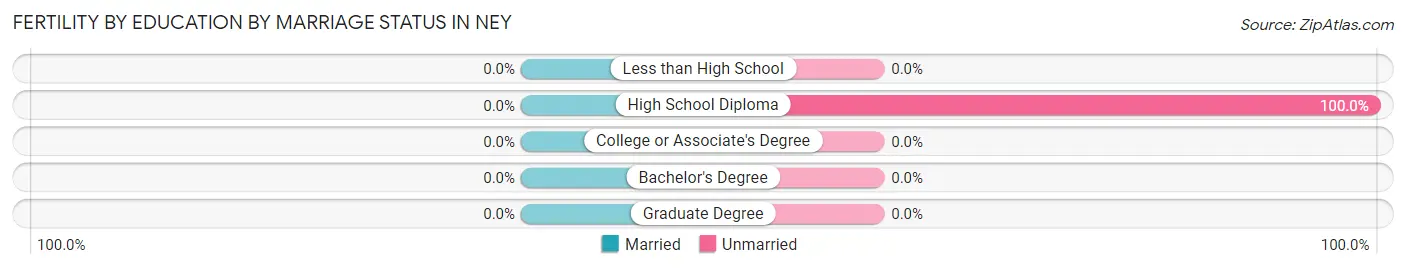
Fertility by Education by Marriage Status in Ney
| Educational Attainment | Married | Unmarried |
| Less than High School | 0 (0.0%) | 0 (0.0%) |
| High School Diploma | 0 (0.0%) | 4 (100.0%) |
| College or Associate's Degree | 0 (0.0%) | 0 (0.0%) |
| Bachelor's Degree | 0 (0.0%) | 0 (0.0%) |
| Graduate Degree | 0 (0.0%) | 0 (0.0%) |
| Total | 0 (0.0%) | 4 (100.0%) |
Employment Characteristics in Ney
Employment by Class of Employer in Ney
Among the 168 employed individuals in Ney, private company employees (120 | 71.4%), local government employees (20 | 11.9%), and self-employed (not incorporated) (12 | 7.1%) make up the most common classes of employment.
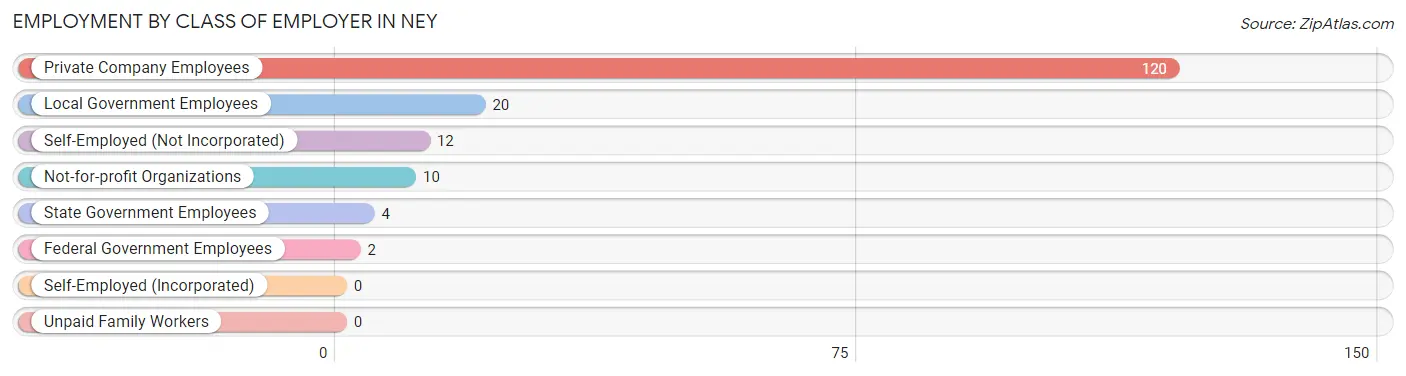
| Employer Class | # Employees | % Employees |
| Private Company Employees | 120 | 71.4% |
| Self-Employed (Incorporated) | 0 | 0.0% |
| Self-Employed (Not Incorporated) | 12 | 7.1% |
| Not-for-profit Organizations | 10 | 5.9% |
| Local Government Employees | 20 | 11.9% |
| State Government Employees | 4 | 2.4% |
| Federal Government Employees | 2 | 1.2% |
| Unpaid Family Workers | 0 | 0.0% |
| Total | 168 | 100.0% |
Employment Status by Age in Ney
According to the labor force statistics for Ney, out of the total population over 16 years of age (234), 74.8% or 175 individuals are in the labor force, with 0.6% or 1 of them unemployed. The age group with the highest labor force participation rate is 20 to 24 years, with 100.0% or 19 individuals in the labor force. Within the labor force, the 55 to 59 years age range has the highest percentage of unemployed individuals, with 7.1% or 1 of them being unemployed.
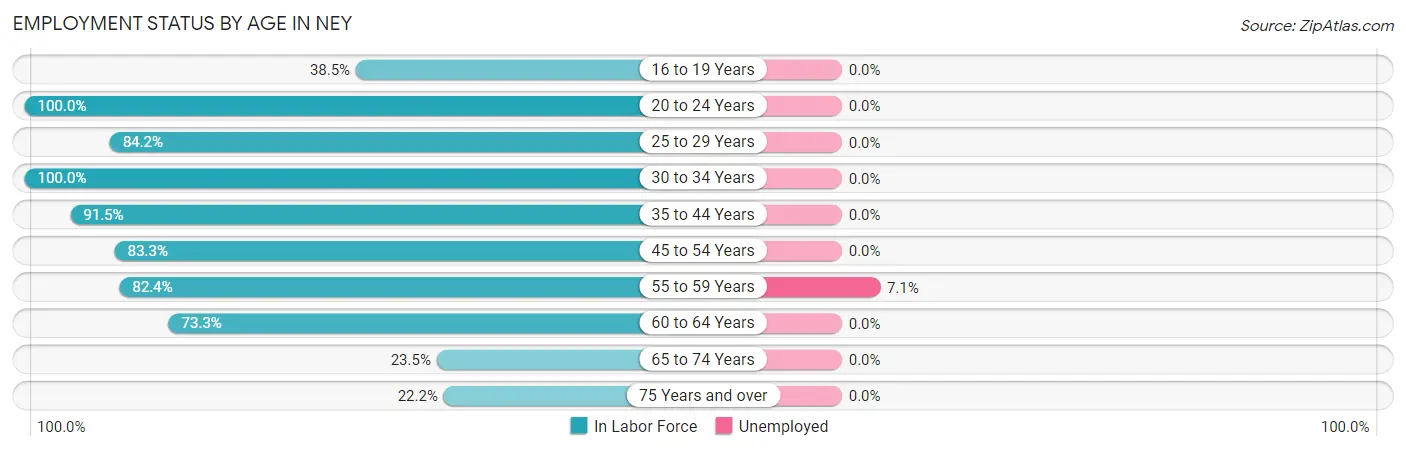
| Age Bracket | In Labor Force | Unemployed |
| 16 to 19 Years | 5 (38.5%) | 0 (0.0%) |
| 20 to 24 Years | 19 (100.0%) | 0 (0.0%) |
| 25 to 29 Years | 16 (84.2%) | 0 (0.0%) |
| 30 to 34 Years | 18 (100.0%) | 0 (0.0%) |
| 35 to 44 Years | 43 (91.5%) | 0 (0.0%) |
| 45 to 54 Years | 30 (83.3%) | 0 (0.0%) |
| 55 to 59 Years | 14 (82.4%) | 1 (7.1%) |
| 60 to 64 Years | 22 (73.3%) | 0 (0.0%) |
| 65 to 74 Years | 4 (23.5%) | 0 (0.0%) |
| 75 Years and over | 4 (22.2%) | 0 (0.0%) |
| Total | 175 (74.8%) | 1 (0.6%) |
Employment Status by Educational Attainment in Ney
According to labor force statistics for Ney, 85.6% of individuals (143) out of the total population between 25 and 64 years of age (167) are in the labor force, with 0.7% or 1 of them being unemployed. The group with the highest labor force participation rate are those with the educational attainment of bachelor's degree or higher, with 100.0% or 20 individuals in the labor force. Within the labor force, individuals with high school diploma education have the highest percentage of unemployment, with 1.6% or 1 of them being unemployed.
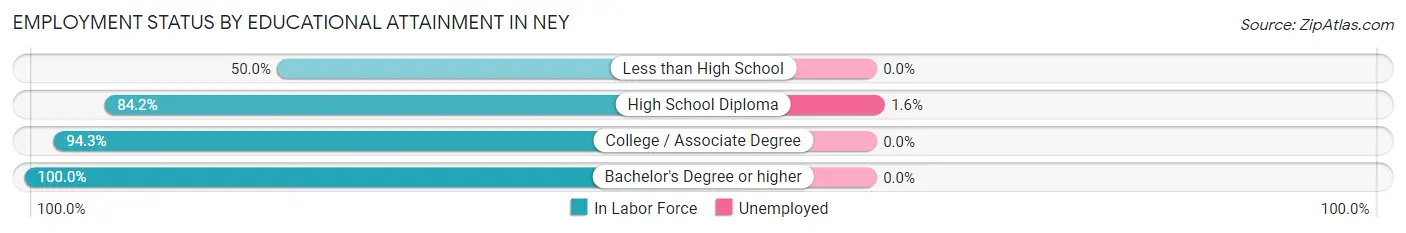
| Educational Attainment | In Labor Force | Unemployed |
| Less than High School | 9 (50.0%) | 0 (0.0%) |
| High School Diploma | 64 (84.2%) | 1 (1.6%) |
| College / Associate Degree | 50 (94.3%) | 0 (0.0%) |
| Bachelor's Degree or higher | 20 (100.0%) | 0 (0.0%) |
| Total | 143 (85.6%) | 1 (0.7%) |
Employment Occupations by Sex in Ney
Management, Business, Science and Arts Occupations
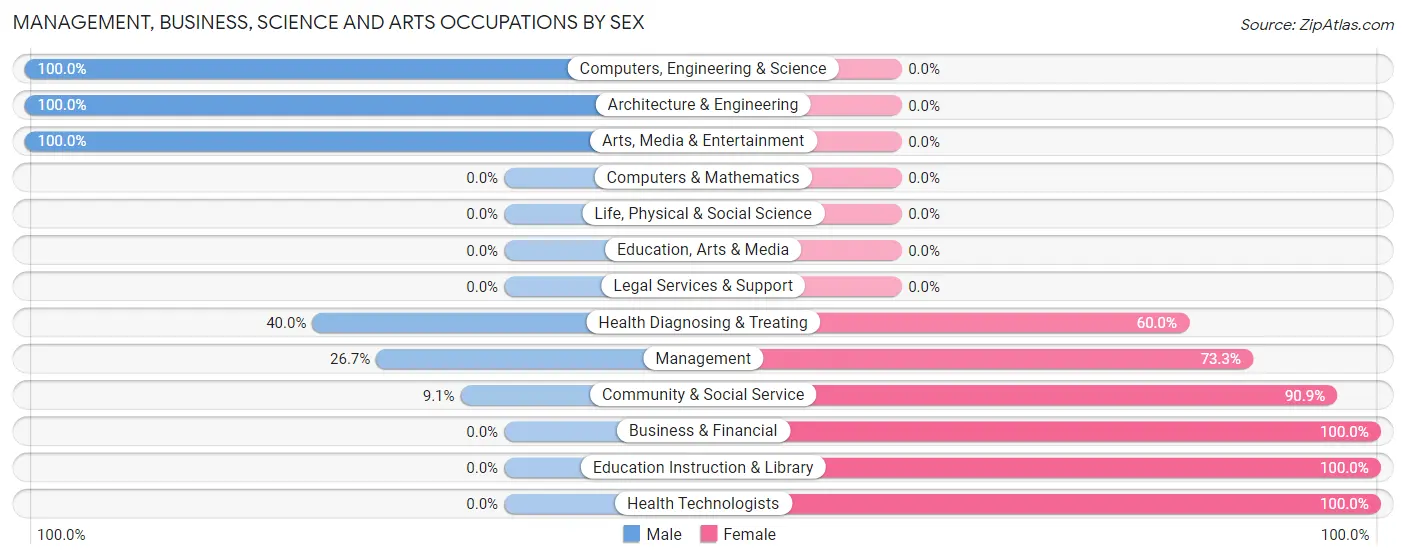
The most common Management, Business, Science and Arts occupations in Ney are Management (15 | 8.6%), Community & Social Service (11 | 6.3%), Education Instruction & Library (10 | 5.8%), Computers, Engineering & Science (5 | 2.9%), and Architecture & Engineering (5 | 2.9%).
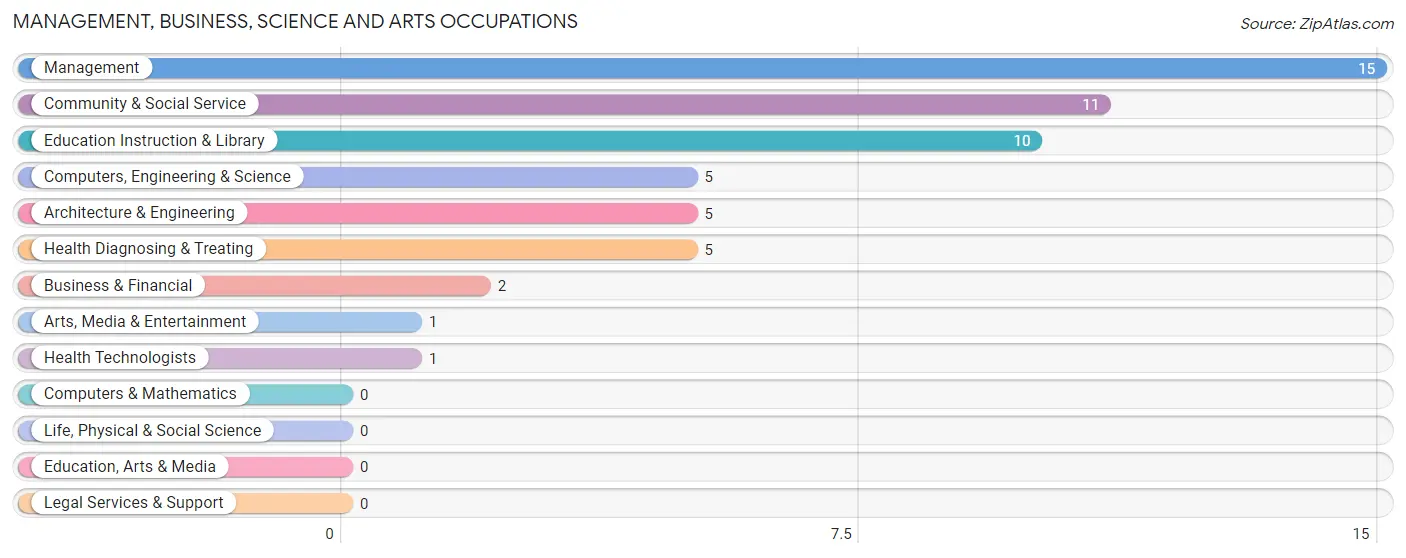
Management, Business, Science and Arts Occupations by Sex
Within the Management, Business, Science and Arts occupations in Ney, the most male-oriented occupations are Computers, Engineering & Science (100.0%), Architecture & Engineering (100.0%), and Arts, Media & Entertainment (100.0%), while the most female-oriented occupations are Business & Financial (100.0%), Education Instruction & Library (100.0%), and Health Technologists (100.0%).
| Occupation | Male | Female |
| Management | 4 (26.7%) | 11 (73.3%) |
| Business & Financial | 0 (0.0%) | 2 (100.0%) |
| Computers, Engineering & Science | 5 (100.0%) | 0 (0.0%) |
| Computers & Mathematics | 0 (0.0%) | 0 (0.0%) |
| Architecture & Engineering | 5 (100.0%) | 0 (0.0%) |
| Life, Physical & Social Science | 0 (0.0%) | 0 (0.0%) |
| Community & Social Service | 1 (9.1%) | 10 (90.9%) |
| Education, Arts & Media | 0 (0.0%) | 0 (0.0%) |
| Legal Services & Support | 0 (0.0%) | 0 (0.0%) |
| Education Instruction & Library | 0 (0.0%) | 10 (100.0%) |
| Arts, Media & Entertainment | 1 (100.0%) | 0 (0.0%) |
| Health Diagnosing & Treating | 2 (40.0%) | 3 (60.0%) |
| Health Technologists | 0 (0.0%) | 1 (100.0%) |
| Total (Category) | 12 (31.6%) | 26 (68.4%) |
| Total (Overall) | 92 (52.9%) | 82 (47.1%) |
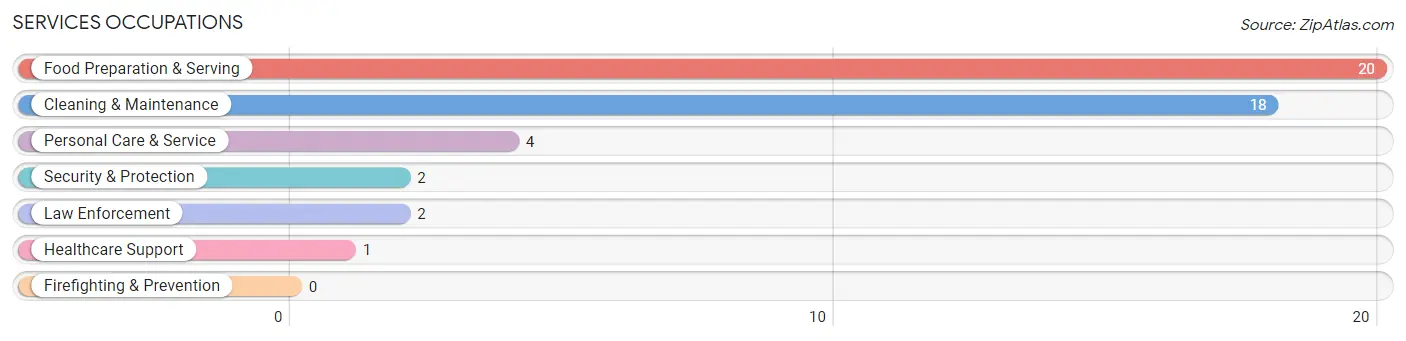
Services Occupations
The most common Services occupations in Ney are Food Preparation & Serving (20 | 11.5%), Cleaning & Maintenance (18 | 10.3%), Personal Care & Service (4 | 2.3%), Security & Protection (2 | 1.1%), and Law Enforcement (2 | 1.1%).
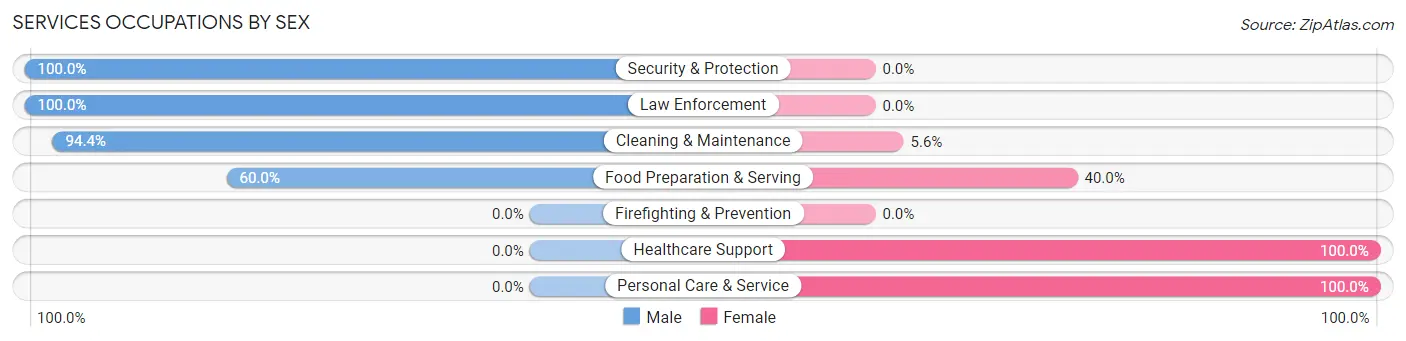
Services Occupations by Sex
Within the Services occupations in Ney, the most male-oriented occupations are Security & Protection (100.0%), Law Enforcement (100.0%), and Cleaning & Maintenance (94.4%), while the most female-oriented occupations are Healthcare Support (100.0%), Personal Care & Service (100.0%), and Food Preparation & Serving (40.0%).
| Occupation | Male | Female |
| Healthcare Support | 0 (0.0%) | 1 (100.0%) |
| Security & Protection | 2 (100.0%) | 0 (0.0%) |
| Firefighting & Prevention | 0 (0.0%) | 0 (0.0%) |
| Law Enforcement | 2 (100.0%) | 0 (0.0%) |
| Food Preparation & Serving | 12 (60.0%) | 8 (40.0%) |
| Cleaning & Maintenance | 17 (94.4%) | 1 (5.6%) |
| Personal Care & Service | 0 (0.0%) | 4 (100.0%) |
| Total (Category) | 31 (68.9%) | 14 (31.1%) |
| Total (Overall) | 92 (52.9%) | 82 (47.1%) |
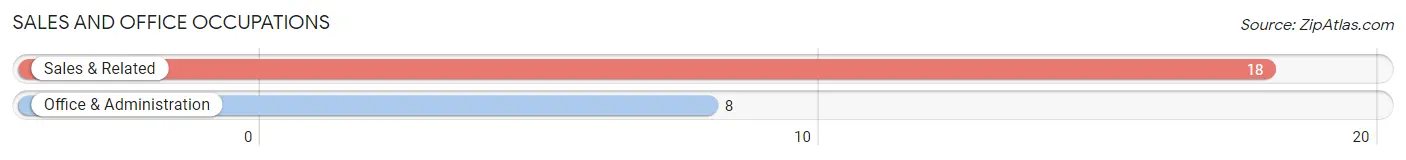
Sales and Office Occupations
The most common Sales and Office occupations in Ney are Sales & Related (18 | 10.3%), and Office & Administration (8 | 4.6%).
Sales and Office Occupations by Sex
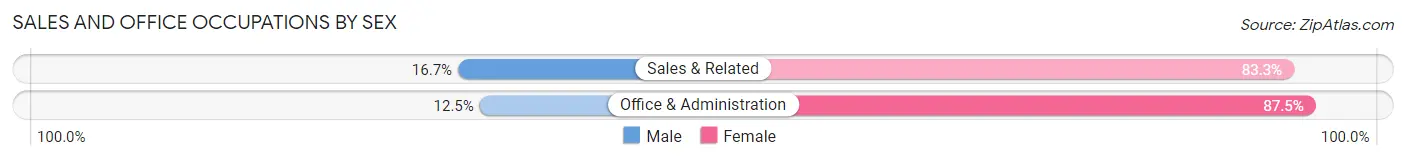
| Occupation | Male | Female |
| Sales & Related | 3 (16.7%) | 15 (83.3%) |
| Office & Administration | 1 (12.5%) | 7 (87.5%) |
| Total (Category) | 4 (15.4%) | 22 (84.6%) |
| Total (Overall) | 92 (52.9%) | 82 (47.1%) |
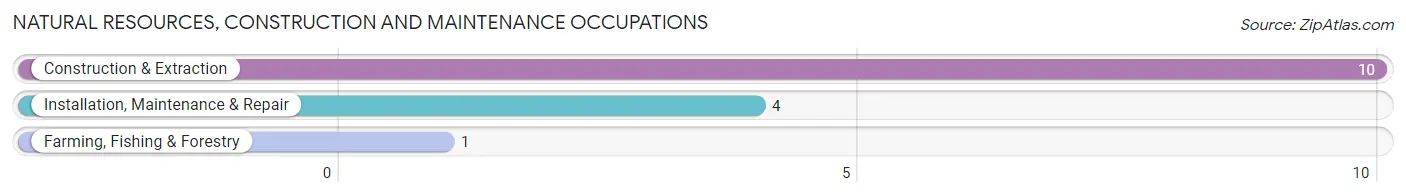
Natural Resources, Construction and Maintenance Occupations
The most common Natural Resources, Construction and Maintenance occupations in Ney are Construction & Extraction (10 | 5.8%), Installation, Maintenance & Repair (4 | 2.3%), and Farming, Fishing & Forestry (1 | 0.6%).
Natural Resources, Construction and Maintenance Occupations by Sex
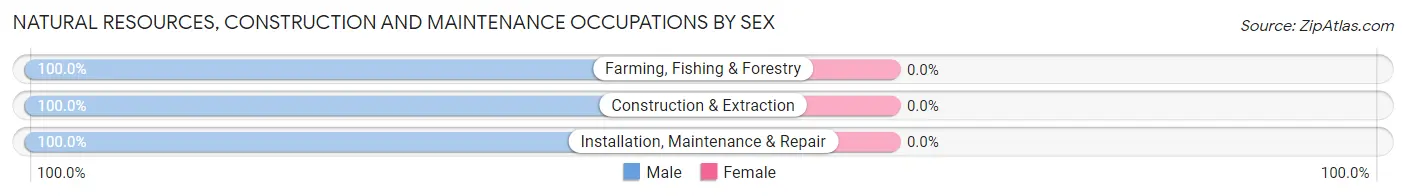
| Occupation | Male | Female |
| Farming, Fishing & Forestry | 1 (100.0%) | 0 (0.0%) |
| Construction & Extraction | 10 (100.0%) | 0 (0.0%) |
| Installation, Maintenance & Repair | 4 (100.0%) | 0 (0.0%) |
| Total (Category) | 15 (100.0%) | 0 (0.0%) |
| Total (Overall) | 92 (52.9%) | 82 (47.1%) |
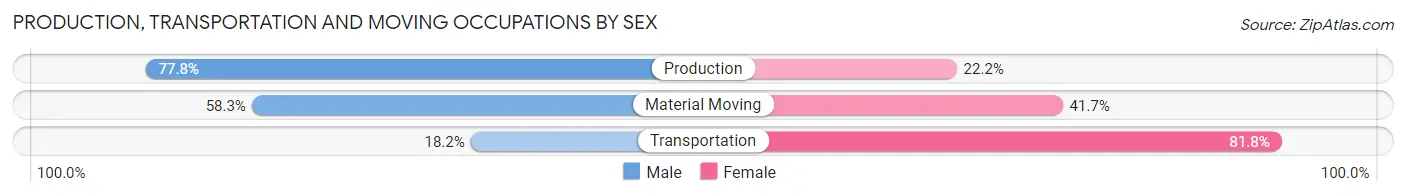
Production, Transportation and Moving Occupations
The most common Production, Transportation and Moving occupations in Ney are Production (27 | 15.5%), Material Moving (12 | 6.9%), and Transportation (11 | 6.3%).
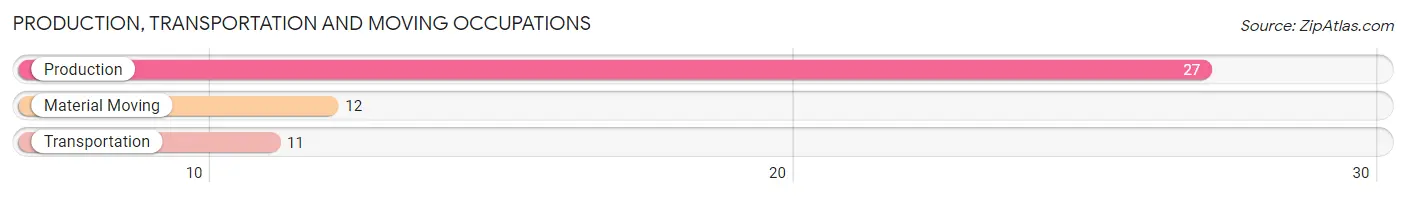
Production, Transportation and Moving Occupations by Sex
| Occupation | Male | Female |
| Production | 21 (77.8%) | 6 (22.2%) |
| Transportation | 2 (18.2%) | 9 (81.8%) |
| Material Moving | 7 (58.3%) | 5 (41.7%) |
| Total (Category) | 30 (60.0%) | 20 (40.0%) |
| Total (Overall) | 92 (52.9%) | 82 (47.1%) |
Employment Industries by Sex in Ney
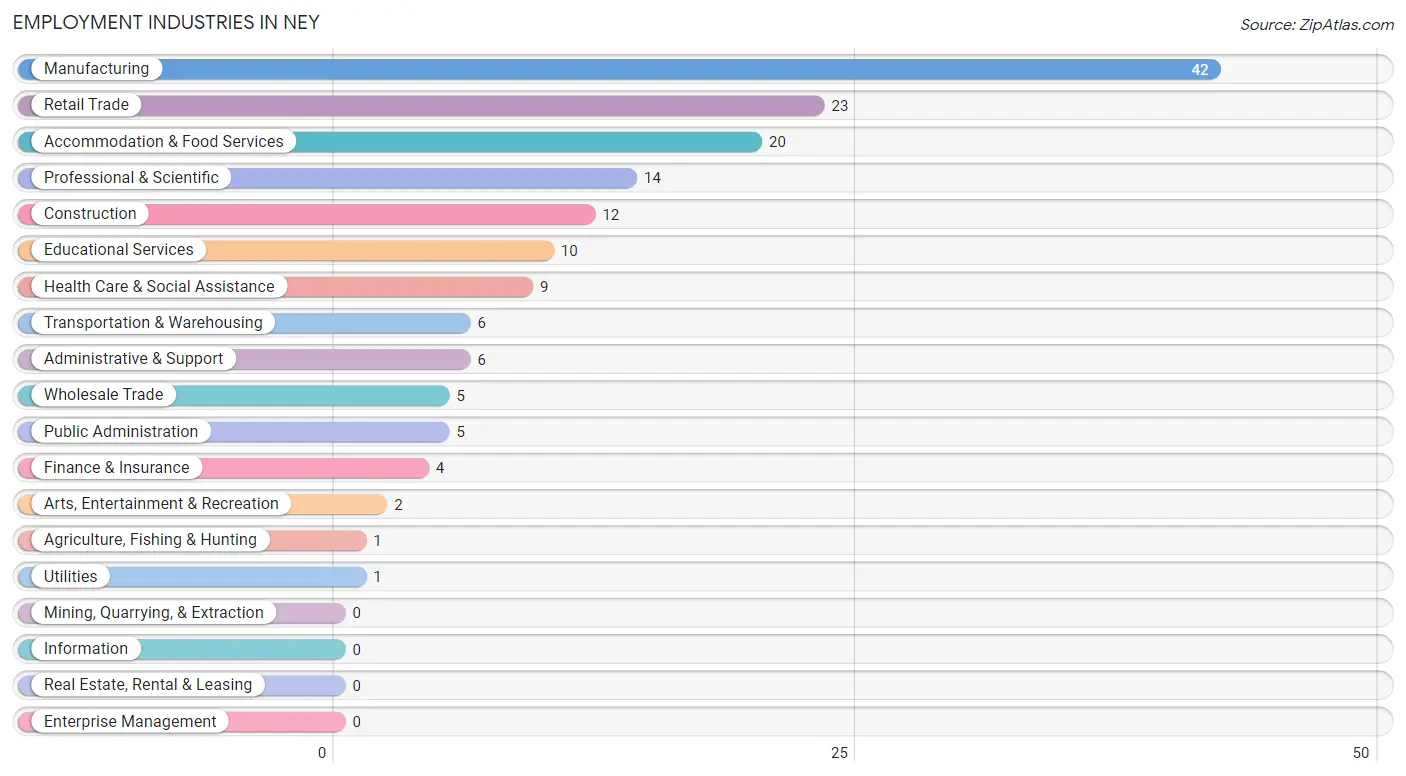
Employment Industries in Ney
The major employment industries in Ney include Manufacturing (42 | 24.1%), Retail Trade (23 | 13.2%), Accommodation & Food Services (20 | 11.5%), Professional & Scientific (14 | 8.1%), and Construction (12 | 6.9%).
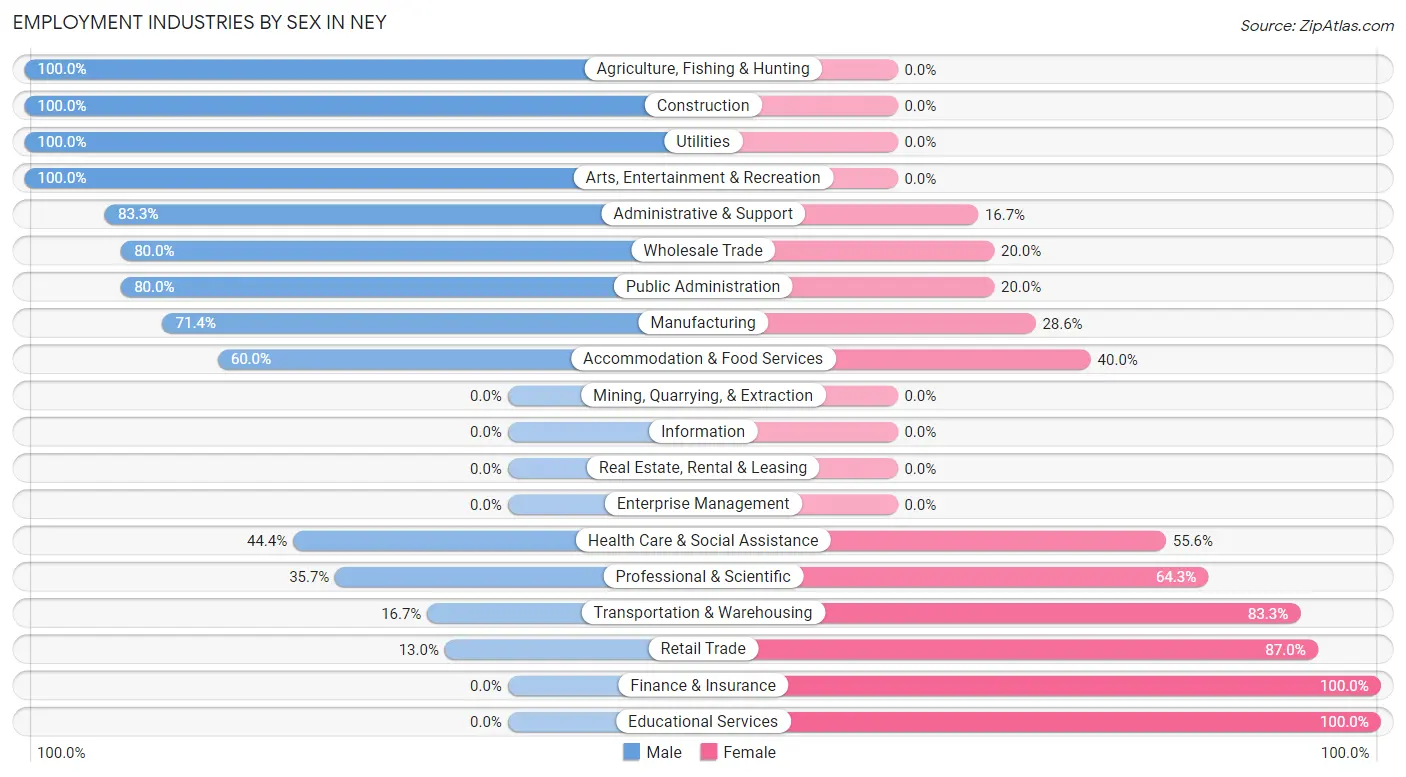
Employment Industries by Sex in Ney
The Ney industries that see more men than women are Agriculture, Fishing & Hunting (100.0%), Construction (100.0%), and Utilities (100.0%), whereas the industries that tend to have a higher number of women are Finance & Insurance (100.0%), Educational Services (100.0%), and Retail Trade (87.0%).
| Industry | Male | Female |
| Agriculture, Fishing & Hunting | 1 (100.0%) | 0 (0.0%) |
| Mining, Quarrying, & Extraction | 0 (0.0%) | 0 (0.0%) |
| Construction | 12 (100.0%) | 0 (0.0%) |
| Manufacturing | 30 (71.4%) | 12 (28.6%) |
| Wholesale Trade | 4 (80.0%) | 1 (20.0%) |
| Retail Trade | 3 (13.0%) | 20 (87.0%) |
| Transportation & Warehousing | 1 (16.7%) | 5 (83.3%) |
| Utilities | 1 (100.0%) | 0 (0.0%) |
| Information | 0 (0.0%) | 0 (0.0%) |
| Finance & Insurance | 0 (0.0%) | 4 (100.0%) |
| Real Estate, Rental & Leasing | 0 (0.0%) | 0 (0.0%) |
| Professional & Scientific | 5 (35.7%) | 9 (64.3%) |
| Enterprise Management | 0 (0.0%) | 0 (0.0%) |
| Administrative & Support | 5 (83.3%) | 1 (16.7%) |
| Educational Services | 0 (0.0%) | 10 (100.0%) |
| Health Care & Social Assistance | 4 (44.4%) | 5 (55.6%) |
| Arts, Entertainment & Recreation | 2 (100.0%) | 0 (0.0%) |
| Accommodation & Food Services | 12 (60.0%) | 8 (40.0%) |
| Public Administration | 4 (80.0%) | 1 (20.0%) |
| Total | 92 (52.9%) | 82 (47.1%) |
Education in Ney
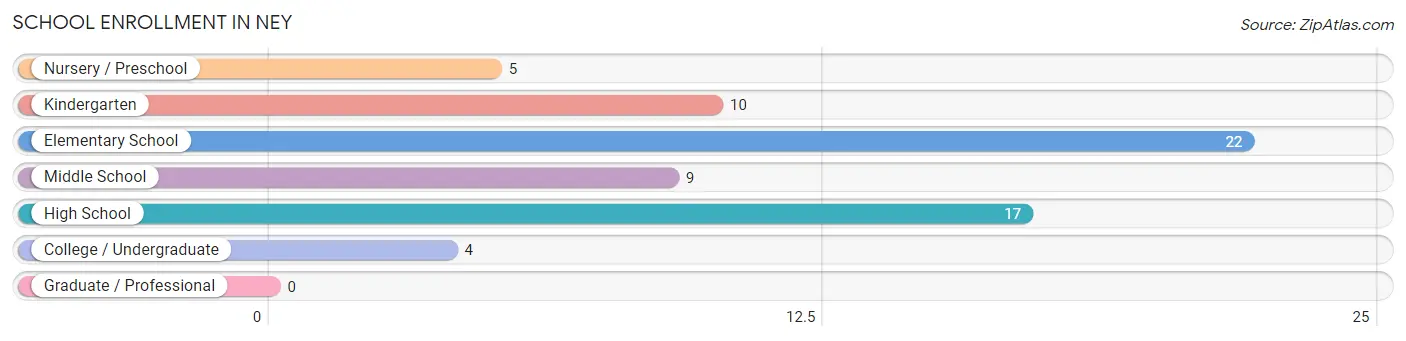
School Enrollment in Ney
The most common levels of schooling among the 67 students in Ney are elementary school (22 | 32.8%), high school (17 | 25.4%), and kindergarten (10 | 14.9%).
| School Level | # Students | % Students |
| Nursery / Preschool | 5 | 7.5% |
| Kindergarten | 10 | 14.9% |
| Elementary School | 22 | 32.8% |
| Middle School | 9 | 13.4% |
| High School | 17 | 25.4% |
| College / Undergraduate | 4 | 6.0% |
| Graduate / Professional | 0 | 0.0% |
| Total | 67 | 100.0% |
School Enrollment by Age by Funding Source in Ney
Out of a total of 67 students who are enrolled in schools in Ney, 6 (9.0%) attend a private institution, while the remaining 61 (91.0%) are enrolled in public schools. The age group of 18 to 19 year olds has the highest likelihood of being enrolled in private schools, with 2 (100.0% in the age bracket) enrolled. Conversely, the age group of 3 to 4 year olds has the lowest likelihood of being enrolled in a private school, with 2 (100.0% in the age bracket) attending a public institution.
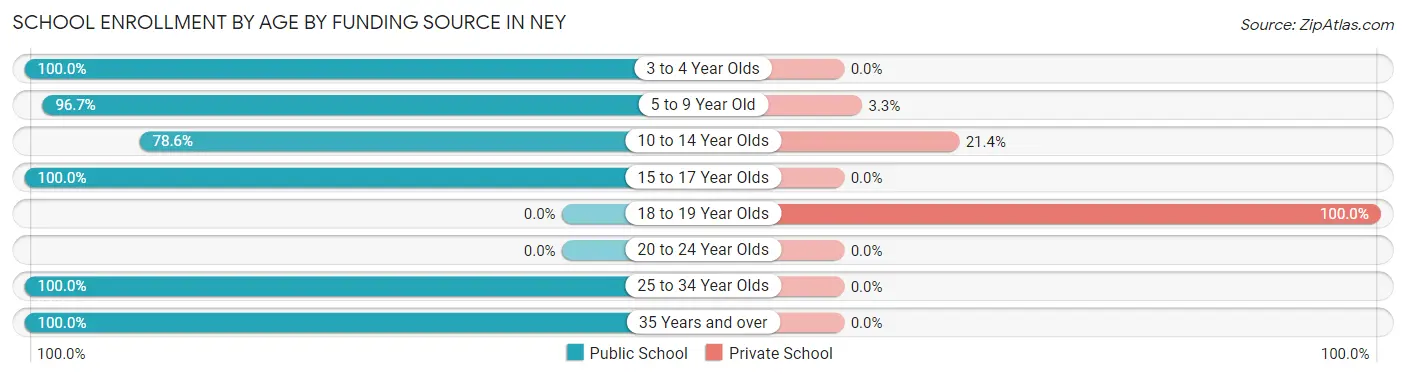
| Age Bracket | Public School | Private School |
| 3 to 4 Year Olds | 2 (100.0%) | 0 (0.0%) |
| 5 to 9 Year Old | 29 (96.7%) | 1 (3.3%) |
| 10 to 14 Year Olds | 11 (78.6%) | 3 (21.4%) |
| 15 to 17 Year Olds | 15 (100.0%) | 0 (0.0%) |
| 18 to 19 Year Olds | 0 (0.0%) | 2 (100.0%) |
| 20 to 24 Year Olds | 0 (0.0%) | 0 (0.0%) |
| 25 to 34 Year Olds | 2 (100.0%) | 0 (0.0%) |
| 35 Years and over | 2 (100.0%) | 0 (0.0%) |
| Total | 61 (91.0%) | 6 (9.0%) |
Educational Attainment by Field of Study in Ney
Education (10 | 47.6%), liberal arts & history (4 | 19.1%), science & technology (3 | 14.3%), business (2 | 9.5%), and communications (2 | 9.5%) are the most common fields of study among 21 individuals in Ney who have obtained a bachelor's degree or higher.
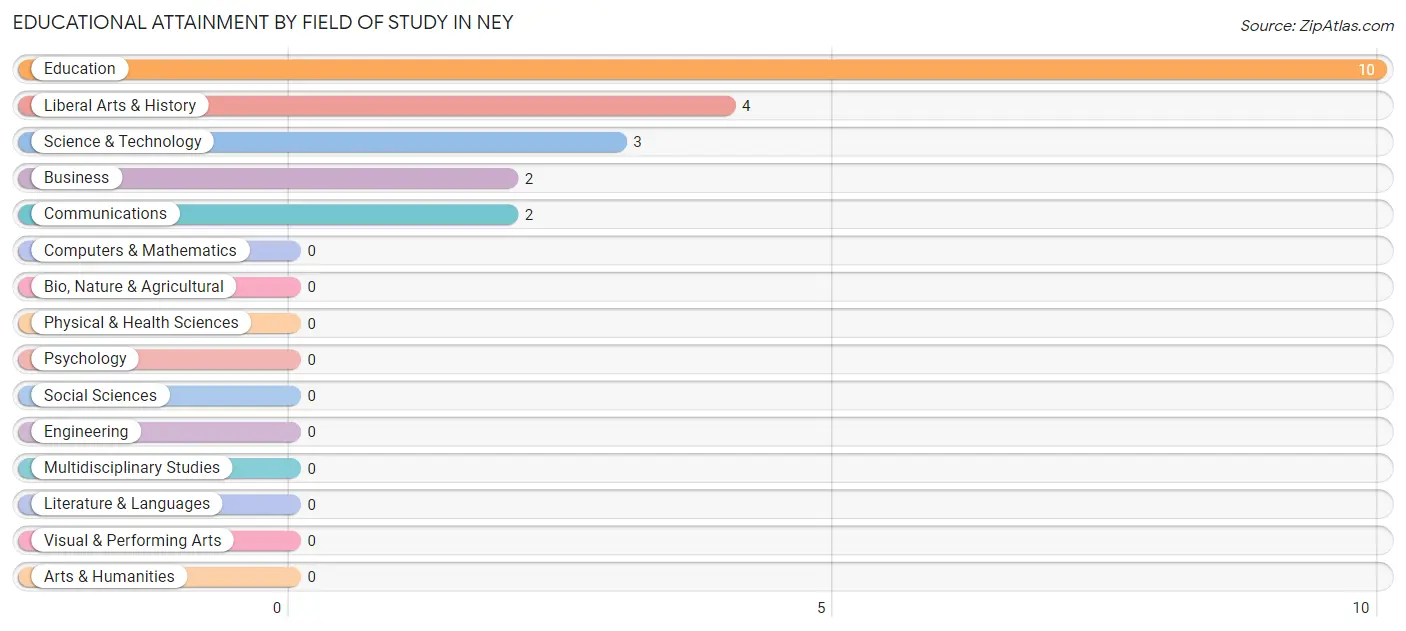
| Field of Study | # Graduates | % Graduates |
| Computers & Mathematics | 0 | 0.0% |
| Bio, Nature & Agricultural | 0 | 0.0% |
| Physical & Health Sciences | 0 | 0.0% |
| Psychology | 0 | 0.0% |
| Social Sciences | 0 | 0.0% |
| Engineering | 0 | 0.0% |
| Multidisciplinary Studies | 0 | 0.0% |
| Science & Technology | 3 | 14.3% |
| Business | 2 | 9.5% |
| Education | 10 | 47.6% |
| Literature & Languages | 0 | 0.0% |
| Liberal Arts & History | 4 | 19.1% |
| Visual & Performing Arts | 0 | 0.0% |
| Communications | 2 | 9.5% |
| Arts & Humanities | 0 | 0.0% |
| Total | 21 | 100.0% |
Transportation & Commute in Ney
Vehicle Availability by Sex in Ney
The most prevalent vehicle ownership categories in Ney are males with 2 vehicles (36, accounting for 40.0%) and females with 2 vehicles (34, making up 46.2%).
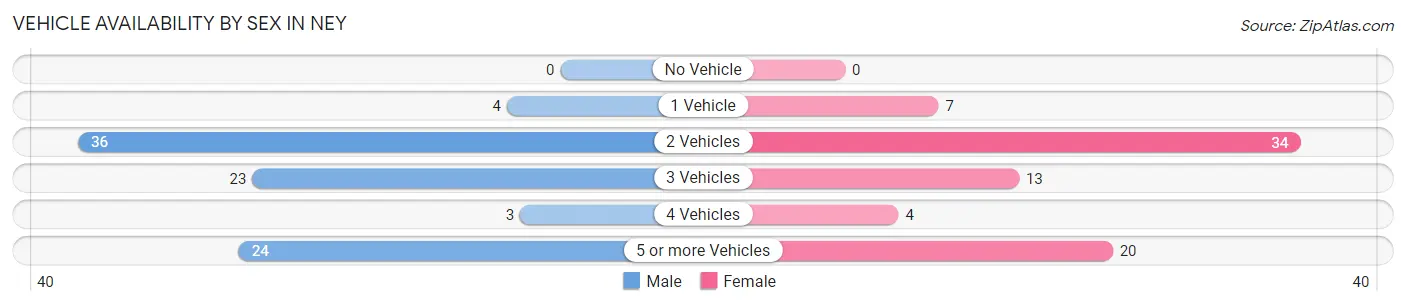
| Vehicles Available | Male | Female |
| No Vehicle | 0 (0.0%) | 0 (0.0%) |
| 1 Vehicle | 4 (4.4%) | 7 (9.0%) |
| 2 Vehicles | 36 (40.0%) | 34 (43.6%) |
| 3 Vehicles | 23 (25.6%) | 13 (16.7%) |
| 4 Vehicles | 3 (3.3%) | 4 (5.1%) |
| 5 or more Vehicles | 24 (26.7%) | 20 (25.6%) |
| Total | 90 (100.0%) | 78 (100.0%) |
Commute Time in Ney
The most frequently occuring commute durations in Ney are 10 to 14 minutes (33 commuters, 19.6%), 15 to 19 minutes (30 commuters, 17.9%), and 20 to 24 minutes (30 commuters, 17.9%).
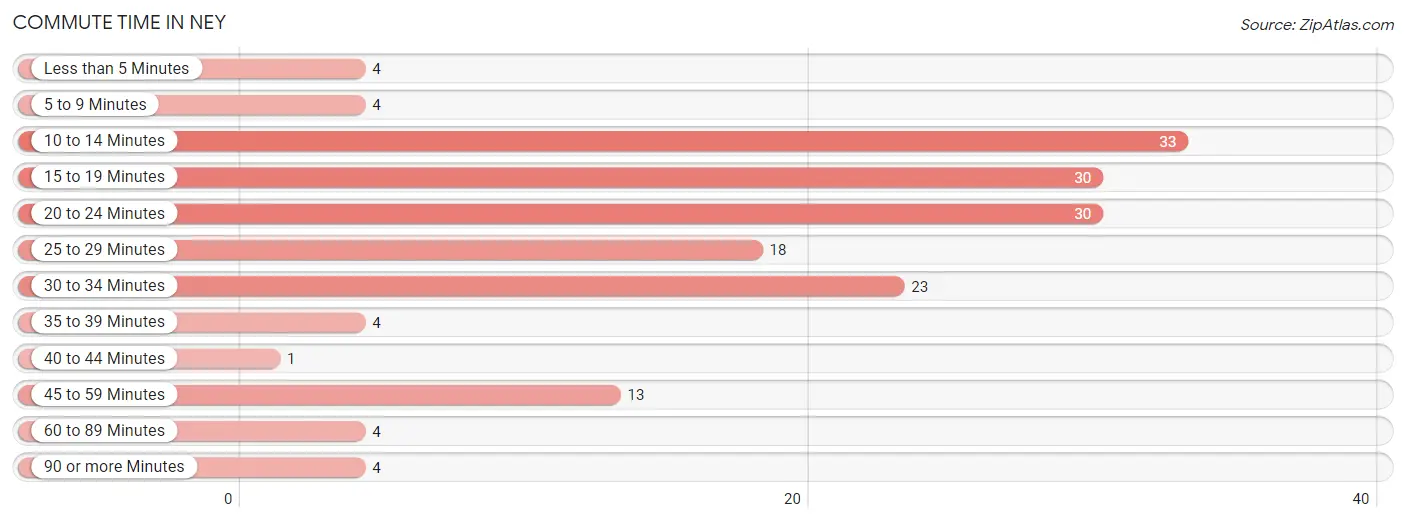
| Commute Time | # Commuters | % Commuters |
| Less than 5 Minutes | 4 | 2.4% |
| 5 to 9 Minutes | 4 | 2.4% |
| 10 to 14 Minutes | 33 | 19.6% |
| 15 to 19 Minutes | 30 | 17.9% |
| 20 to 24 Minutes | 30 | 17.9% |
| 25 to 29 Minutes | 18 | 10.7% |
| 30 to 34 Minutes | 23 | 13.7% |
| 35 to 39 Minutes | 4 | 2.4% |
| 40 to 44 Minutes | 1 | 0.6% |
| 45 to 59 Minutes | 13 | 7.7% |
| 60 to 89 Minutes | 4 | 2.4% |
| 90 or more Minutes | 4 | 2.4% |
Commute Time by Sex in Ney
The most common commute times in Ney are 15 to 19 minutes (21 commuters, 23.3%) for males and 10 to 14 minutes (24 commuters, 30.8%) for females.
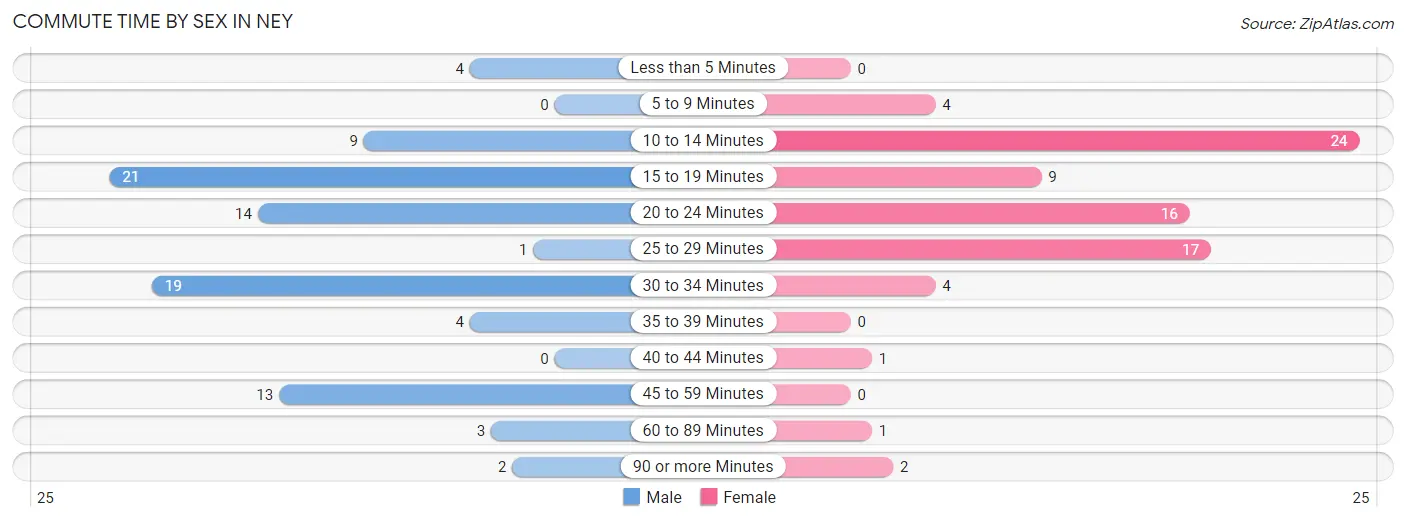
| Commute Time | Male | Female |
| Less than 5 Minutes | 4 (4.4%) | 0 (0.0%) |
| 5 to 9 Minutes | 0 (0.0%) | 4 (5.1%) |
| 10 to 14 Minutes | 9 (10.0%) | 24 (30.8%) |
| 15 to 19 Minutes | 21 (23.3%) | 9 (11.5%) |
| 20 to 24 Minutes | 14 (15.6%) | 16 (20.5%) |
| 25 to 29 Minutes | 1 (1.1%) | 17 (21.8%) |
| 30 to 34 Minutes | 19 (21.1%) | 4 (5.1%) |
| 35 to 39 Minutes | 4 (4.4%) | 0 (0.0%) |
| 40 to 44 Minutes | 0 (0.0%) | 1 (1.3%) |
| 45 to 59 Minutes | 13 (14.4%) | 0 (0.0%) |
| 60 to 89 Minutes | 3 (3.3%) | 1 (1.3%) |
| 90 or more Minutes | 2 (2.2%) | 2 (2.6%) |
Time of Departure to Work by Sex in Ney
The most frequent times of departure to work in Ney are 12:00 PM to 3:59 PM (20, 22.2%) for males and 7:00 AM to 7:29 AM (14, 17.9%) for females.
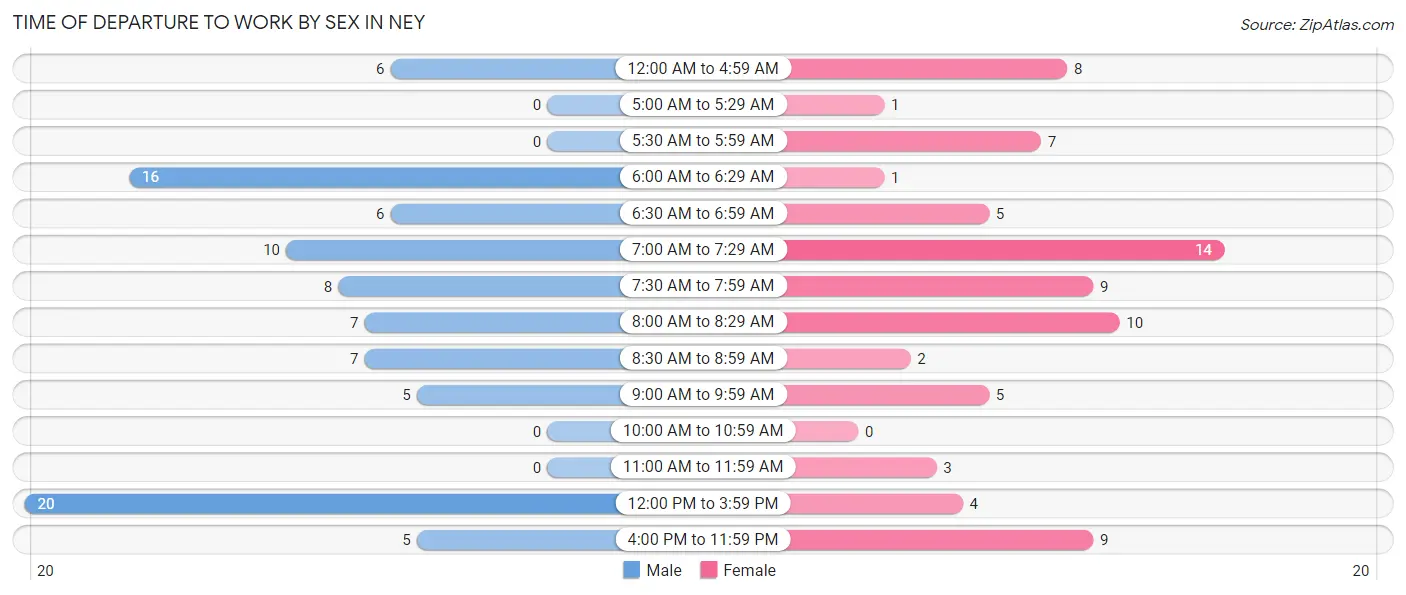
| Time of Departure | Male | Female |
| 12:00 AM to 4:59 AM | 6 (6.7%) | 8 (10.3%) |
| 5:00 AM to 5:29 AM | 0 (0.0%) | 1 (1.3%) |
| 5:30 AM to 5:59 AM | 0 (0.0%) | 7 (9.0%) |
| 6:00 AM to 6:29 AM | 16 (17.8%) | 1 (1.3%) |
| 6:30 AM to 6:59 AM | 6 (6.7%) | 5 (6.4%) |
| 7:00 AM to 7:29 AM | 10 (11.1%) | 14 (17.9%) |
| 7:30 AM to 7:59 AM | 8 (8.9%) | 9 (11.5%) |
| 8:00 AM to 8:29 AM | 7 (7.8%) | 10 (12.8%) |
| 8:30 AM to 8:59 AM | 7 (7.8%) | 2 (2.6%) |
| 9:00 AM to 9:59 AM | 5 (5.6%) | 5 (6.4%) |
| 10:00 AM to 10:59 AM | 0 (0.0%) | 0 (0.0%) |
| 11:00 AM to 11:59 AM | 0 (0.0%) | 3 (3.8%) |
| 12:00 PM to 3:59 PM | 20 (22.2%) | 4 (5.1%) |
| 4:00 PM to 11:59 PM | 5 (5.6%) | 9 (11.5%) |
| Total | 90 (100.0%) | 78 (100.0%) |
Housing Occupancy in Ney
Occupancy by Ownership in Ney
Of the total 111 dwellings in Ney, owner-occupied units account for 96 (86.5%), while renter-occupied units make up 15 (13.5%).
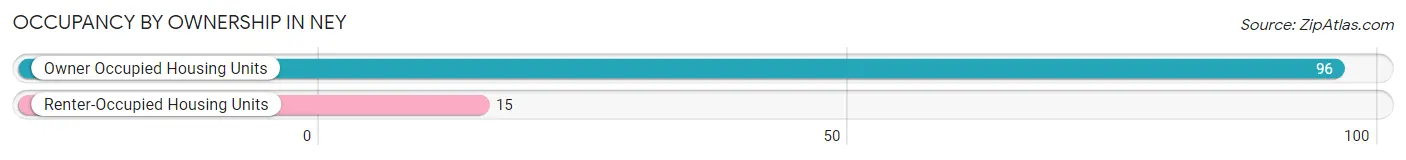
| Occupancy | # Housing Units | % Housing Units |
| Owner Occupied Housing Units | 96 | 86.5% |
| Renter-Occupied Housing Units | 15 | 13.5% |
| Total Occupied Housing Units | 111 | 100.0% |
Occupancy by Household Size in Ney
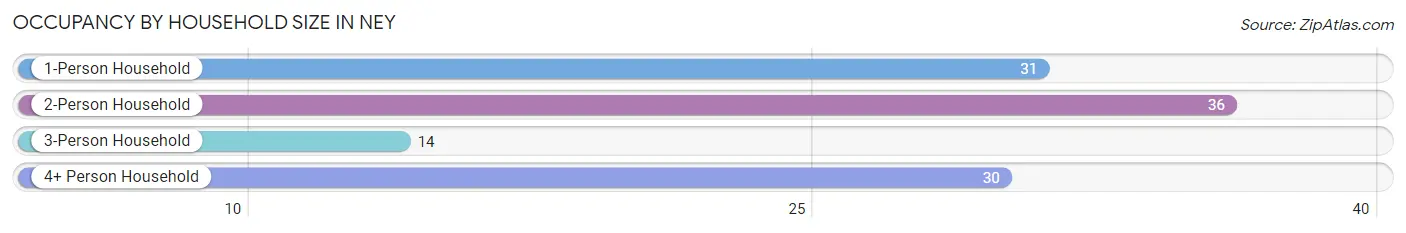
| Household Size | # Housing Units | % Housing Units |
| 1-Person Household | 31 | 27.9% |
| 2-Person Household | 36 | 32.4% |
| 3-Person Household | 14 | 12.6% |
| 4+ Person Household | 30 | 27.0% |
| Total Housing Units | 111 | 100.0% |
Occupancy by Ownership by Household Size in Ney
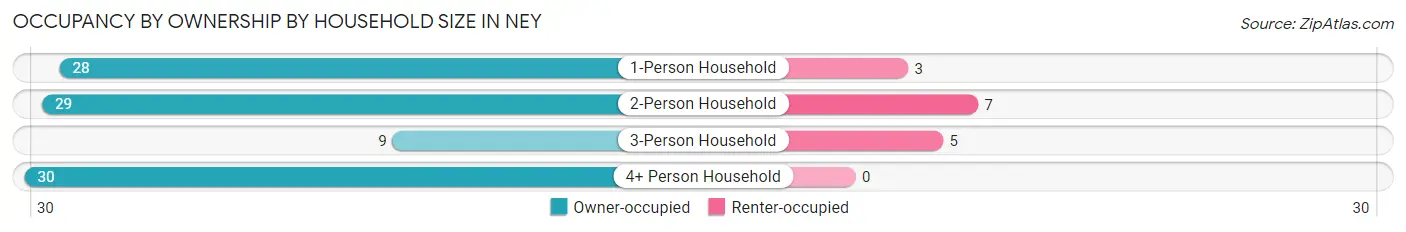
| Household Size | Owner-occupied | Renter-occupied |
| 1-Person Household | 28 (90.3%) | 3 (9.7%) |
| 2-Person Household | 29 (80.6%) | 7 (19.4%) |
| 3-Person Household | 9 (64.3%) | 5 (35.7%) |
| 4+ Person Household | 30 (100.0%) | 0 (0.0%) |
| Total Housing Units | 96 (86.5%) | 15 (13.5%) |
Occupancy by Educational Attainment in Ney
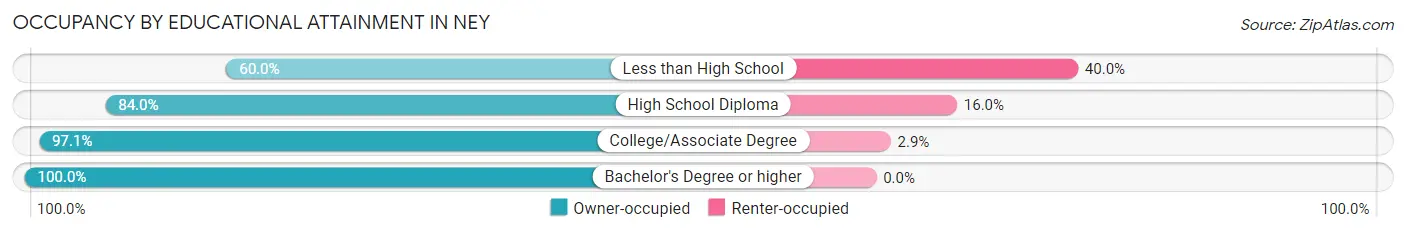
| Household Size | Owner-occupied | Renter-occupied |
| Less than High School | 9 (60.0%) | 6 (40.0%) |
| High School Diploma | 42 (84.0%) | 8 (16.0%) |
| College/Associate Degree | 34 (97.1%) | 1 (2.9%) |
| Bachelor's Degree or higher | 11 (100.0%) | 0 (0.0%) |
Occupancy by Age of Householder in Ney
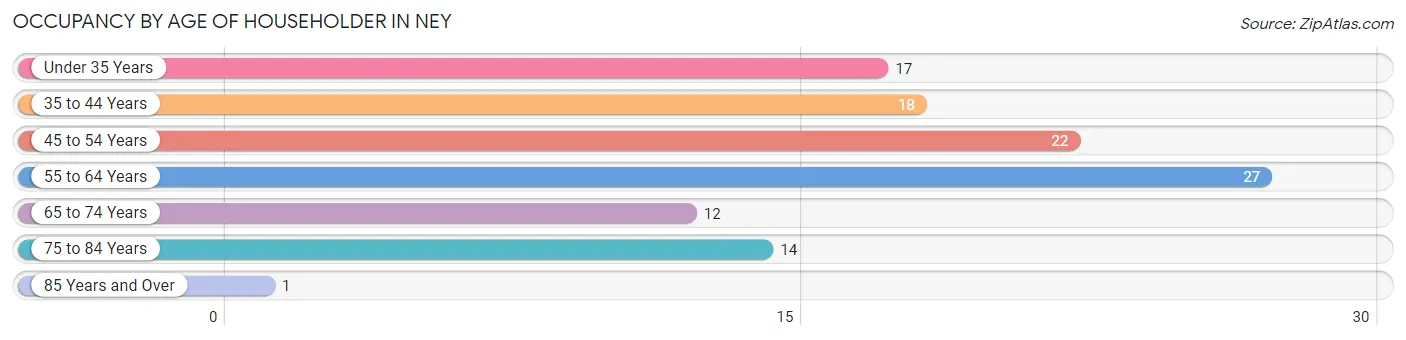
| Age Bracket | # Households | % Households |
| Under 35 Years | 17 | 15.3% |
| 35 to 44 Years | 18 | 16.2% |
| 45 to 54 Years | 22 | 19.8% |
| 55 to 64 Years | 27 | 24.3% |
| 65 to 74 Years | 12 | 10.8% |
| 75 to 84 Years | 14 | 12.6% |
| 85 Years and Over | 1 | 0.9% |
| Total | 111 | 100.0% |
Housing Finances in Ney
Median Income by Occupancy in Ney
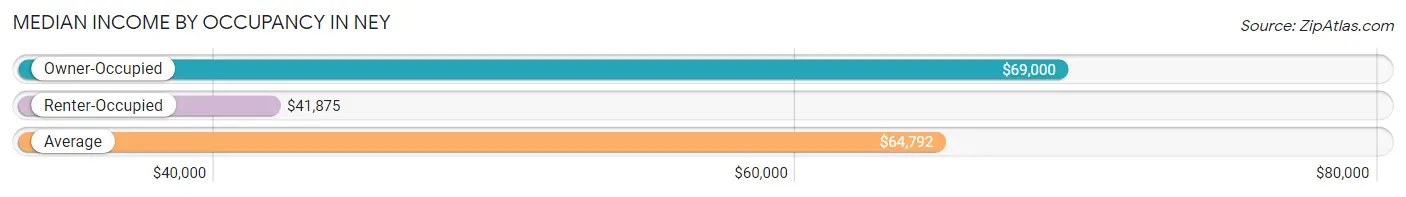
| Occupancy Type | # Households | Median Income |
| Owner-Occupied | 96 (86.5%) | $69,000 |
| Renter-Occupied | 15 (13.5%) | $41,875 |
| Average | 111 (100.0%) | $64,792 |
Occupancy by Householder Income Bracket in Ney
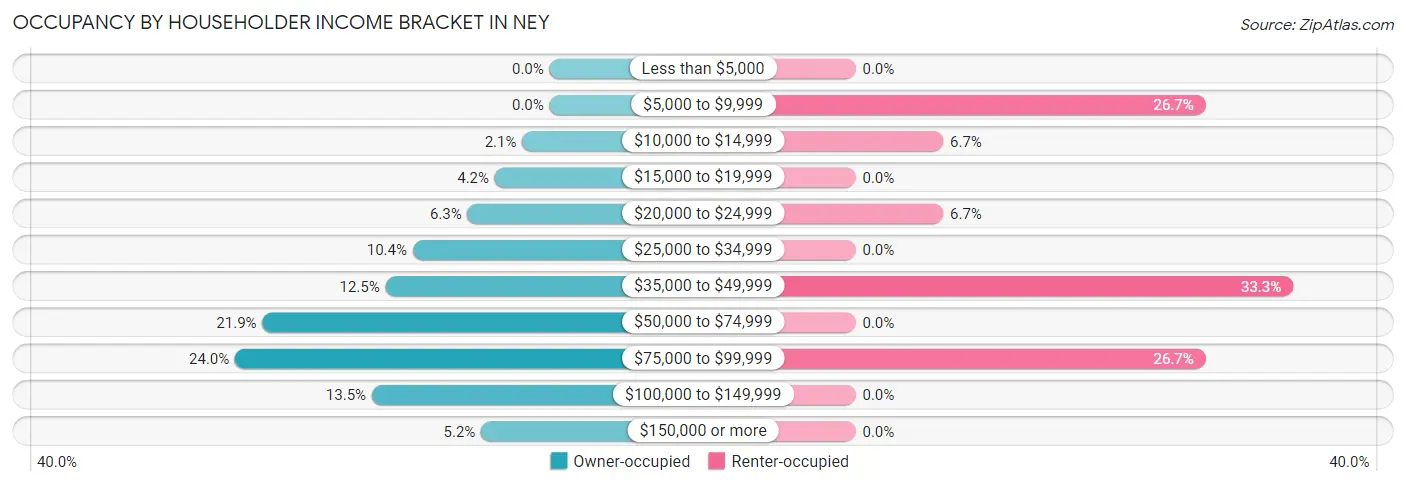
| Income Bracket | Owner-occupied | Renter-occupied |
| Less than $5,000 | 0 (0.0%) | 0 (0.0%) |
| $5,000 to $9,999 | 0 (0.0%) | 4 (26.7%) |
| $10,000 to $14,999 | 2 (2.1%) | 1 (6.7%) |
| $15,000 to $19,999 | 4 (4.2%) | 0 (0.0%) |
| $20,000 to $24,999 | 6 (6.2%) | 1 (6.7%) |
| $25,000 to $34,999 | 10 (10.4%) | 0 (0.0%) |
| $35,000 to $49,999 | 12 (12.5%) | 5 (33.3%) |
| $50,000 to $74,999 | 21 (21.9%) | 0 (0.0%) |
| $75,000 to $99,999 | 23 (24.0%) | 4 (26.7%) |
| $100,000 to $149,999 | 13 (13.5%) | 0 (0.0%) |
| $150,000 or more | 5 (5.2%) | 0 (0.0%) |
| Total | 96 (100.0%) | 15 (100.0%) |
Monthly Housing Cost Tiers in Ney
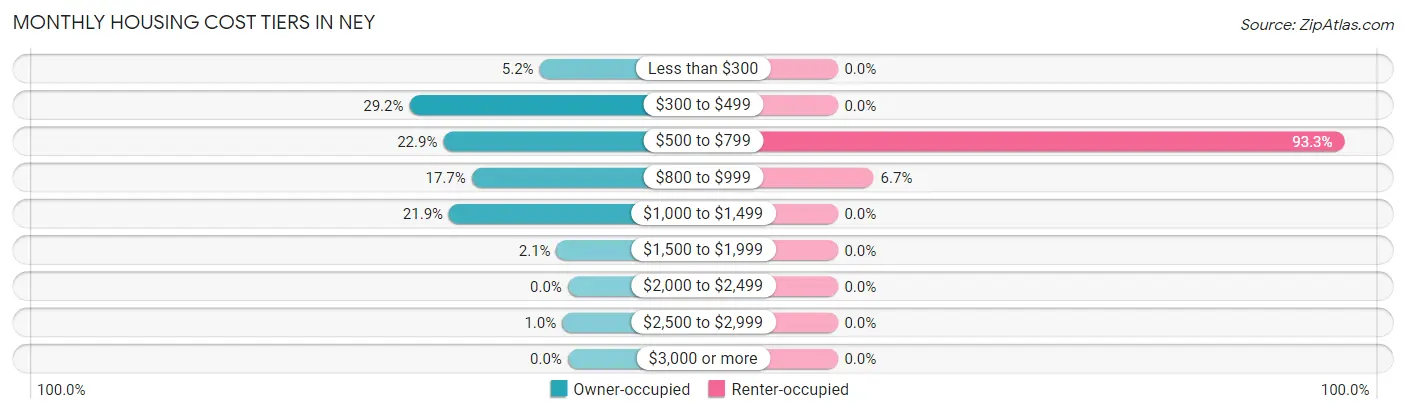
| Monthly Cost | Owner-occupied | Renter-occupied |
| Less than $300 | 5 (5.2%) | 0 (0.0%) |
| $300 to $499 | 28 (29.2%) | 0 (0.0%) |
| $500 to $799 | 22 (22.9%) | 14 (93.3%) |
| $800 to $999 | 17 (17.7%) | 1 (6.7%) |
| $1,000 to $1,499 | 21 (21.9%) | 0 (0.0%) |
| $1,500 to $1,999 | 2 (2.1%) | 0 (0.0%) |
| $2,000 to $2,499 | 0 (0.0%) | 0 (0.0%) |
| $2,500 to $2,999 | 1 (1.0%) | 0 (0.0%) |
| $3,000 or more | 0 (0.0%) | 0 (0.0%) |
| Total | 96 (100.0%) | 15 (100.0%) |
Physical Housing Characteristics in Ney
Housing Structures in Ney
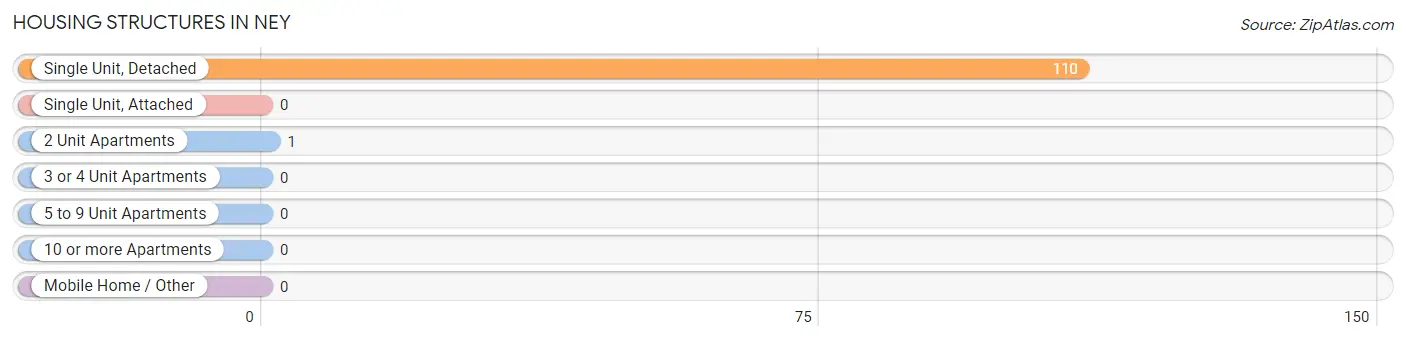
| Structure Type | # Housing Units | % Housing Units |
| Single Unit, Detached | 110 | 99.1% |
| Single Unit, Attached | 0 | 0.0% |
| 2 Unit Apartments | 1 | 0.9% |
| 3 or 4 Unit Apartments | 0 | 0.0% |
| 5 to 9 Unit Apartments | 0 | 0.0% |
| 10 or more Apartments | 0 | 0.0% |
| Mobile Home / Other | 0 | 0.0% |
| Total | 111 | 100.0% |
Housing Structures by Occupancy in Ney
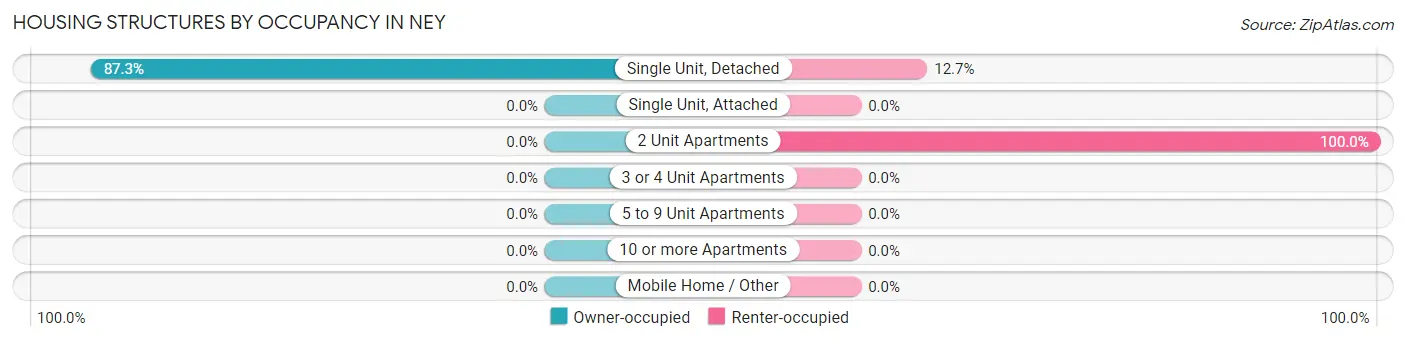
| Structure Type | Owner-occupied | Renter-occupied |
| Single Unit, Detached | 96 (87.3%) | 14 (12.7%) |
| Single Unit, Attached | 0 (0.0%) | 0 (0.0%) |
| 2 Unit Apartments | 0 (0.0%) | 1 (100.0%) |
| 3 or 4 Unit Apartments | 0 (0.0%) | 0 (0.0%) |
| 5 to 9 Unit Apartments | 0 (0.0%) | 0 (0.0%) |
| 10 or more Apartments | 0 (0.0%) | 0 (0.0%) |
| Mobile Home / Other | 0 (0.0%) | 0 (0.0%) |
| Total | 96 (86.5%) | 15 (13.5%) |
Housing Structures by Number of Rooms in Ney
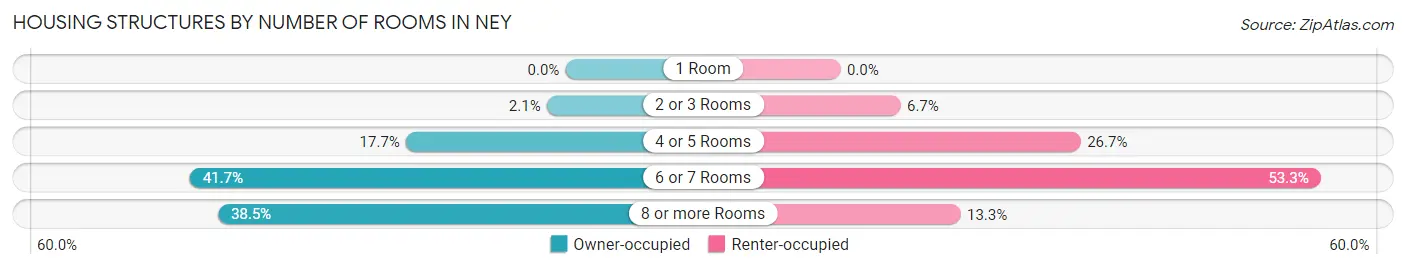
| Number of Rooms | Owner-occupied | Renter-occupied |
| 1 Room | 0 (0.0%) | 0 (0.0%) |
| 2 or 3 Rooms | 2 (2.1%) | 1 (6.7%) |
| 4 or 5 Rooms | 17 (17.7%) | 4 (26.7%) |
| 6 or 7 Rooms | 40 (41.7%) | 8 (53.3%) |
| 8 or more Rooms | 37 (38.5%) | 2 (13.3%) |
| Total | 96 (100.0%) | 15 (100.0%) |
Housing Structure by Heating Type in Ney
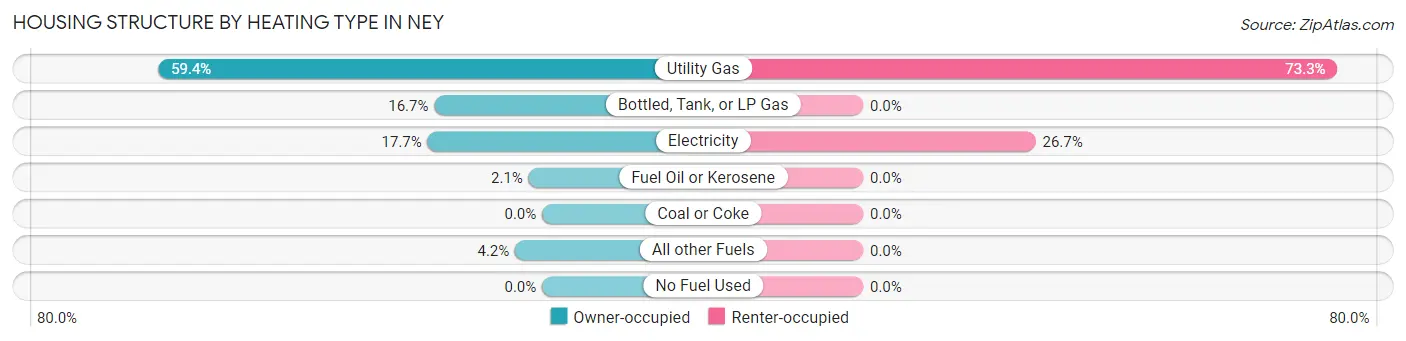
| Heating Type | Owner-occupied | Renter-occupied |
| Utility Gas | 57 (59.4%) | 11 (73.3%) |
| Bottled, Tank, or LP Gas | 16 (16.7%) | 0 (0.0%) |
| Electricity | 17 (17.7%) | 4 (26.7%) |
| Fuel Oil or Kerosene | 2 (2.1%) | 0 (0.0%) |
| Coal or Coke | 0 (0.0%) | 0 (0.0%) |
| All other Fuels | 4 (4.2%) | 0 (0.0%) |
| No Fuel Used | 0 (0.0%) | 0 (0.0%) |
| Total | 96 (100.0%) | 15 (100.0%) |
Household Vehicle Usage in Ney
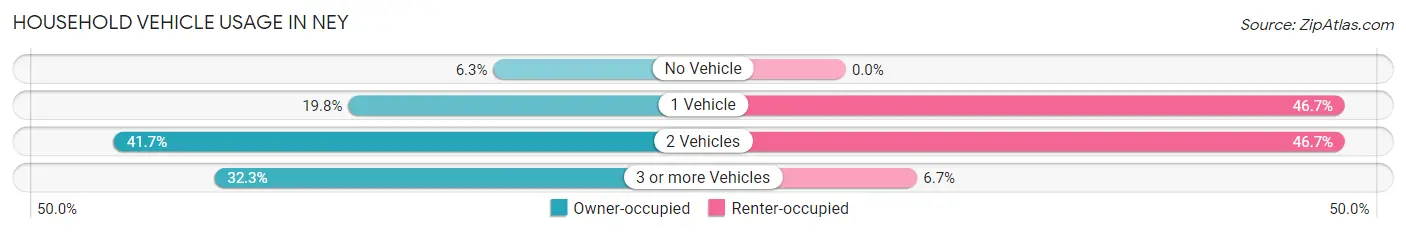
| Vehicles per Household | Owner-occupied | Renter-occupied |
| No Vehicle | 6 (6.2%) | 0 (0.0%) |
| 1 Vehicle | 19 (19.8%) | 7 (46.7%) |
| 2 Vehicles | 40 (41.7%) | 7 (46.7%) |
| 3 or more Vehicles | 31 (32.3%) | 1 (6.7%) |
| Total | 96 (100.0%) | 15 (100.0%) |
Real Estate & Mortgages in Ney
Real Estate and Mortgage Overview in Ney
| Characteristic | Without Mortgage | With Mortgage |
| Housing Units | 42 | 54 |
| Median Property Value | $98,600 | $118,800 |
| Median Household Income | $46,250 | $5 |
| Monthly Housing Costs | $420 | $0 |
| Real Estate Taxes | $1,279 | $2 |
Property Value by Mortgage Status in Ney
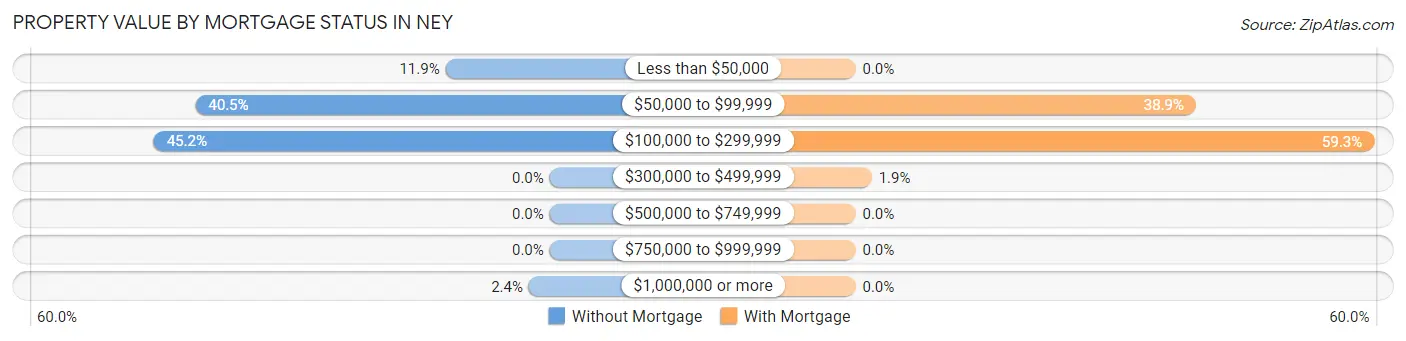
| Property Value | Without Mortgage | With Mortgage |
| Less than $50,000 | 5 (11.9%) | 0 (0.0%) |
| $50,000 to $99,999 | 17 (40.5%) | 21 (38.9%) |
| $100,000 to $299,999 | 19 (45.2%) | 32 (59.3%) |
| $300,000 to $499,999 | 0 (0.0%) | 1 (1.8%) |
| $500,000 to $749,999 | 0 (0.0%) | 0 (0.0%) |
| $750,000 to $999,999 | 0 (0.0%) | 0 (0.0%) |
| $1,000,000 or more | 1 (2.4%) | 0 (0.0%) |
| Total | 42 (100.0%) | 54 (100.0%) |
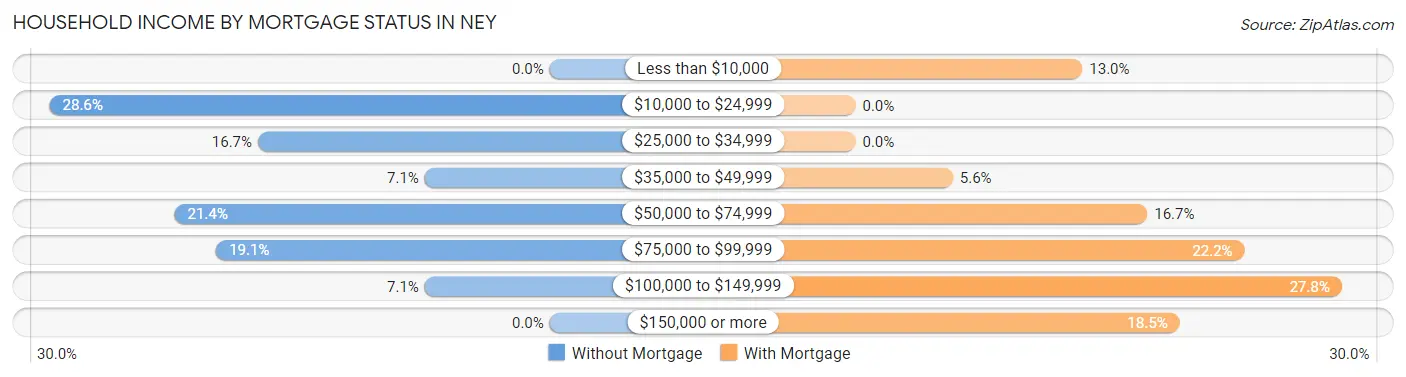
Household Income by Mortgage Status in Ney
| Household Income | Without Mortgage | With Mortgage |
| Less than $10,000 | 0 (0.0%) | 7 (13.0%) |
| $10,000 to $24,999 | 12 (28.6%) | 0 (0.0%) |
| $25,000 to $34,999 | 7 (16.7%) | 0 (0.0%) |
| $35,000 to $49,999 | 3 (7.1%) | 3 (5.6%) |
| $50,000 to $74,999 | 9 (21.4%) | 9 (16.7%) |
| $75,000 to $99,999 | 8 (19.1%) | 12 (22.2%) |
| $100,000 to $149,999 | 3 (7.1%) | 15 (27.8%) |
| $150,000 or more | 0 (0.0%) | 10 (18.5%) |
| Total | 42 (100.0%) | 54 (100.0%) |
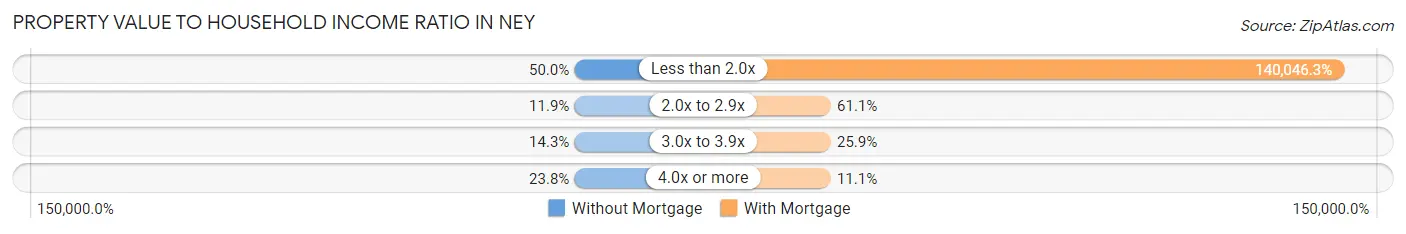
Property Value to Household Income Ratio in Ney
| Value-to-Income Ratio | Without Mortgage | With Mortgage |
| Less than 2.0x | 21 (50.0%) | 75,625 (140,046.3%) |
| 2.0x to 2.9x | 5 (11.9%) | 33 (61.1%) |
| 3.0x to 3.9x | 6 (14.3%) | 14 (25.9%) |
| 4.0x or more | 10 (23.8%) | 6 (11.1%) |
| Total | 42 (100.0%) | 54 (100.0%) |
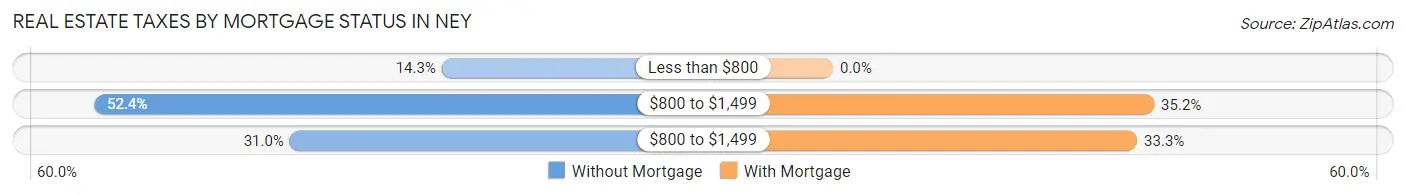
Real Estate Taxes by Mortgage Status in Ney
| Property Taxes | Without Mortgage | With Mortgage |
| Less than $800 | 6 (14.3%) | 0 (0.0%) |
| $800 to $1,499 | 22 (52.4%) | 19 (35.2%) |
| $800 to $1,499 | 13 (30.9%) | 18 (33.3%) |
| Total | 42 (100.0%) | 54 (100.0%) |
Health & Disability in Ney
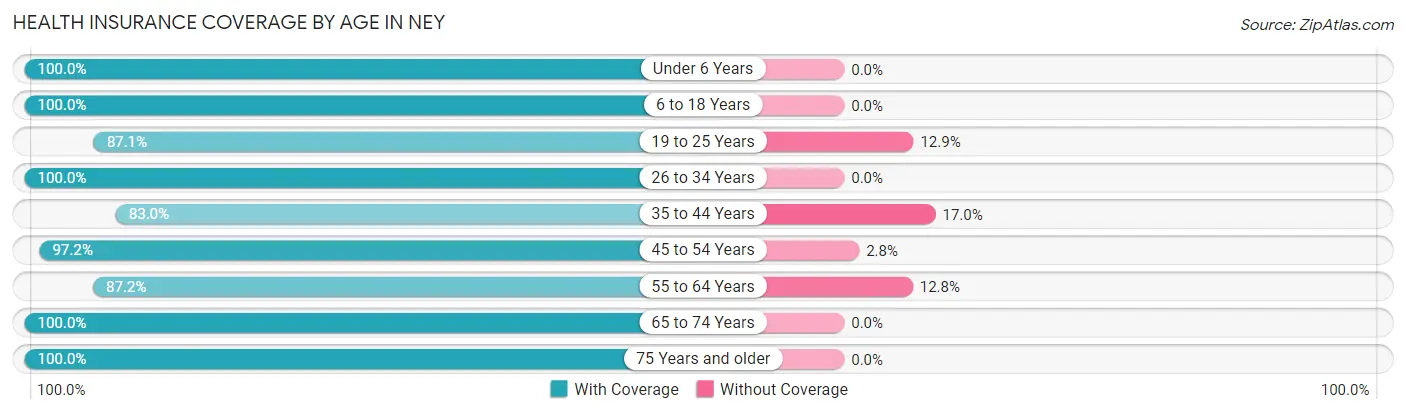
Health Insurance Coverage by Age in Ney
| Age Bracket | With Coverage | Without Coverage |
| Under 6 Years | 17 (100.0%) | 0 (0.0%) |
| 6 to 18 Years | 58 (100.0%) | 0 (0.0%) |
| 19 to 25 Years | 27 (87.1%) | 4 (12.9%) |
| 26 to 34 Years | 30 (100.0%) | 0 (0.0%) |
| 35 to 44 Years | 39 (83.0%) | 8 (17.0%) |
| 45 to 54 Years | 35 (97.2%) | 1 (2.8%) |
| 55 to 64 Years | 41 (87.2%) | 6 (12.8%) |
| 65 to 74 Years | 17 (100.0%) | 0 (0.0%) |
| 75 Years and older | 18 (100.0%) | 0 (0.0%) |
| Total | 282 (93.7%) | 19 (6.3%) |
Health Insurance Coverage by Citizenship Status in Ney
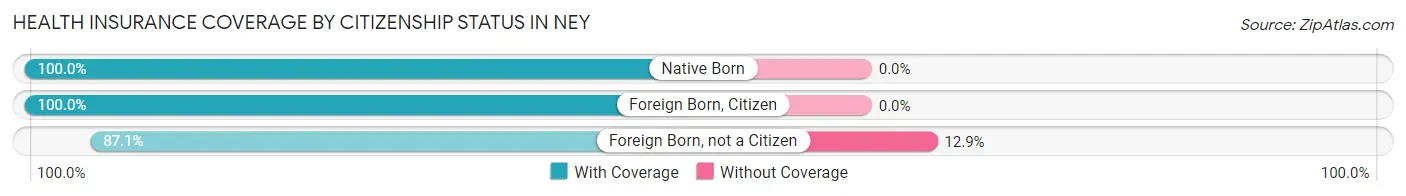
| Citizenship Status | With Coverage | Without Coverage |
| Native Born | 17 (100.0%) | 0 (0.0%) |
| Foreign Born, Citizen | 58 (100.0%) | 0 (0.0%) |
| Foreign Born, not a Citizen | 27 (87.1%) | 4 (12.9%) |
Health Insurance Coverage by Household Income in Ney
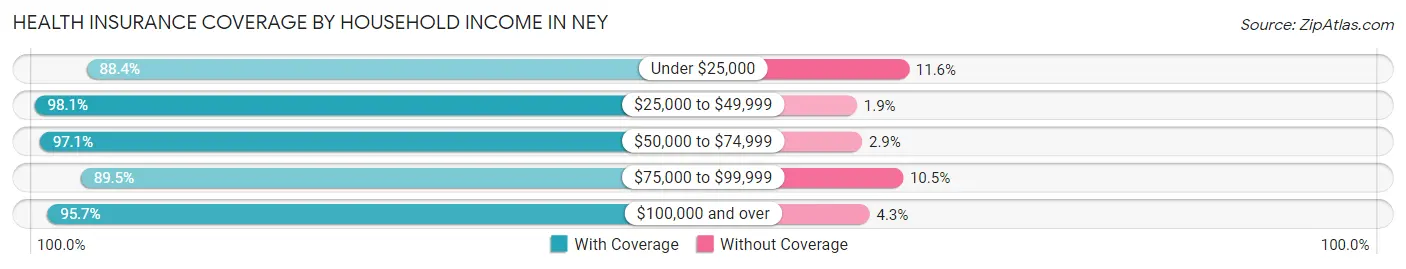
| Household Income | With Coverage | Without Coverage |
| Under $25,000 | 38 (88.4%) | 5 (11.6%) |
| $25,000 to $49,999 | 52 (98.1%) | 1 (1.9%) |
| $50,000 to $74,999 | 34 (97.1%) | 1 (2.9%) |
| $75,000 to $99,999 | 68 (89.5%) | 8 (10.5%) |
| $100,000 and over | 90 (95.7%) | 4 (4.3%) |
Public vs Private Health Insurance Coverage by Age in Ney
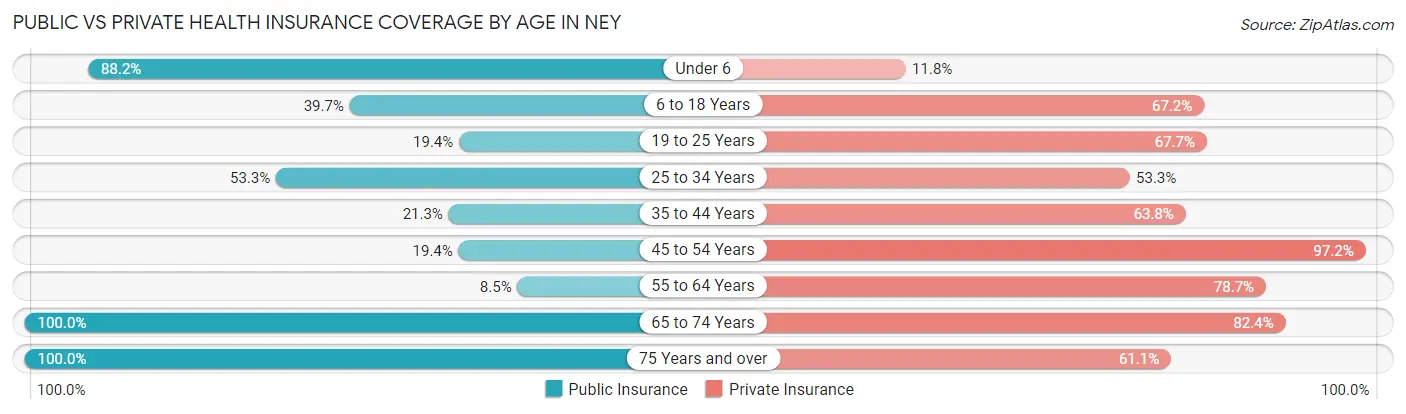
| Age Bracket | Public Insurance | Private Insurance |
| Under 6 | 15 (88.2%) | 2 (11.8%) |
| 6 to 18 Years | 23 (39.7%) | 39 (67.2%) |
| 19 to 25 Years | 6 (19.4%) | 21 (67.7%) |
| 25 to 34 Years | 16 (53.3%) | 16 (53.3%) |
| 35 to 44 Years | 10 (21.3%) | 30 (63.8%) |
| 45 to 54 Years | 7 (19.4%) | 35 (97.2%) |
| 55 to 64 Years | 4 (8.5%) | 37 (78.7%) |
| 65 to 74 Years | 17 (100.0%) | 14 (82.4%) |
| 75 Years and over | 18 (100.0%) | 11 (61.1%) |
| Total | 116 (38.5%) | 205 (68.1%) |
Disability Status by Sex by Age in Ney
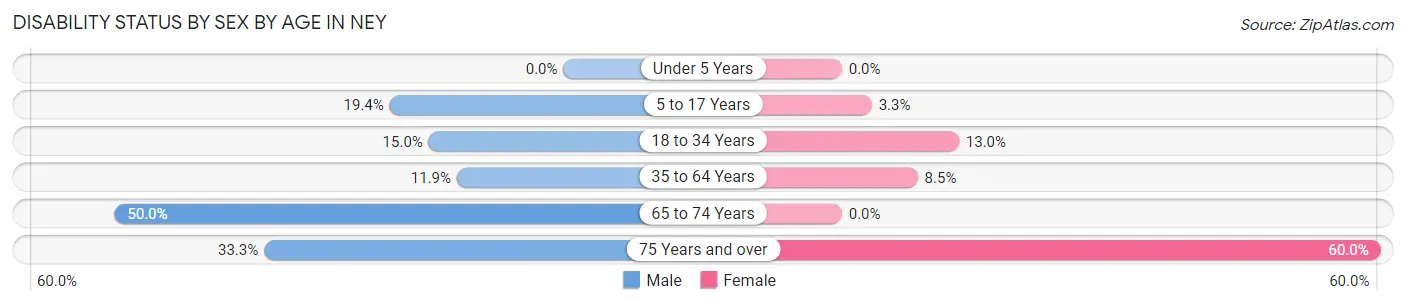
| Age Bracket | Male | Female |
| Under 5 Years | 0 (0.0%) | 0 (0.0%) |
| 5 to 17 Years | 6 (19.4%) | 1 (3.3%) |
| 18 to 34 Years | 6 (15.0%) | 3 (13.0%) |
| 35 to 64 Years | 7 (11.9%) | 6 (8.5%) |
| 65 to 74 Years | 4 (50.0%) | 0 (0.0%) |
| 75 Years and over | 1 (33.3%) | 9 (60.0%) |
Disability Class by Sex by Age in Ney
Disability Class: Hearing Difficulty
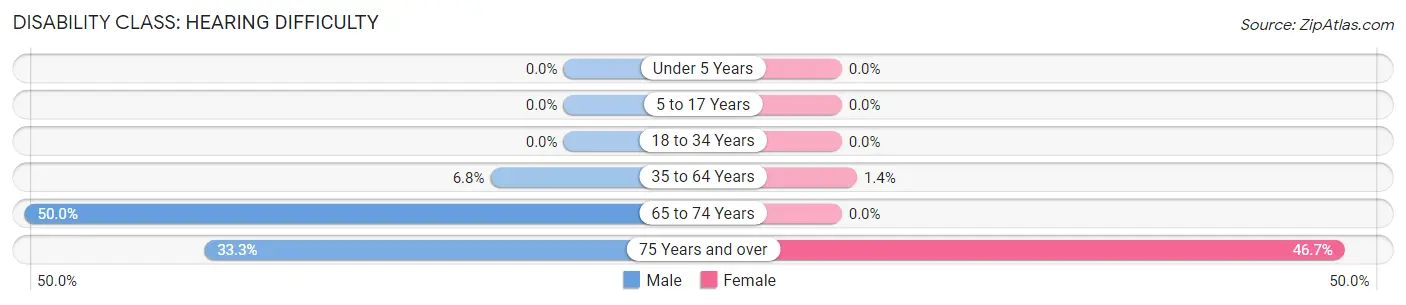
| Age Bracket | Male | Female |
| Under 5 Years | 0 (0.0%) | 0 (0.0%) |
| 5 to 17 Years | 0 (0.0%) | 0 (0.0%) |
| 18 to 34 Years | 0 (0.0%) | 0 (0.0%) |
| 35 to 64 Years | 4 (6.8%) | 1 (1.4%) |
| 65 to 74 Years | 4 (50.0%) | 0 (0.0%) |
| 75 Years and over | 1 (33.3%) | 7 (46.7%) |
Disability Class: Vision Difficulty
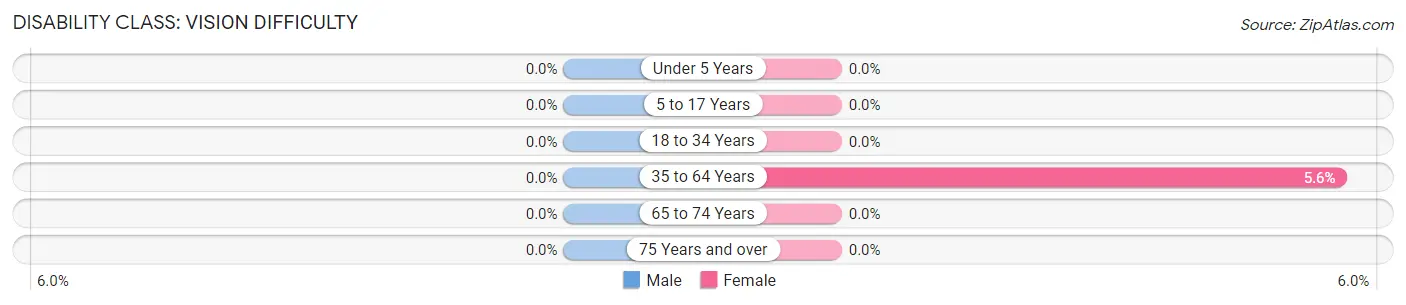
| Age Bracket | Male | Female |
| Under 5 Years | 0 (0.0%) | 0 (0.0%) |
| 5 to 17 Years | 0 (0.0%) | 0 (0.0%) |
| 18 to 34 Years | 0 (0.0%) | 0 (0.0%) |
| 35 to 64 Years | 0 (0.0%) | 4 (5.6%) |
| 65 to 74 Years | 0 (0.0%) | 0 (0.0%) |
| 75 Years and over | 0 (0.0%) | 0 (0.0%) |
Disability Class: Cognitive Difficulty
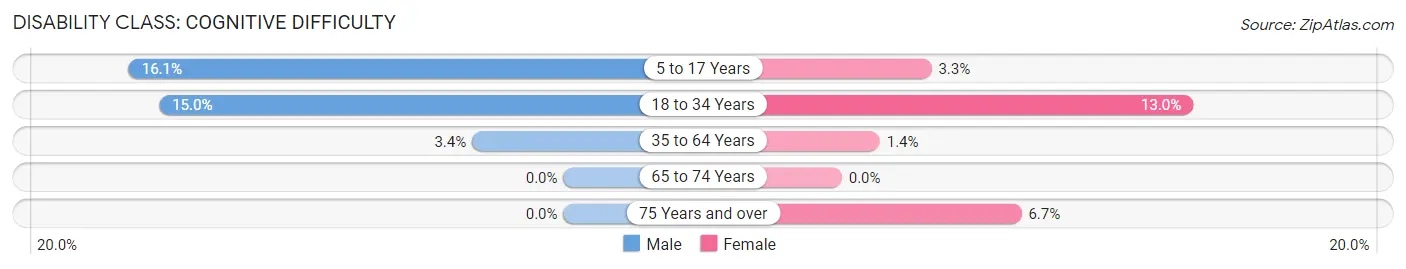
| Age Bracket | Male | Female |
| 5 to 17 Years | 5 (16.1%) | 1 (3.3%) |
| 18 to 34 Years | 6 (15.0%) | 3 (13.0%) |
| 35 to 64 Years | 2 (3.4%) | 1 (1.4%) |
| 65 to 74 Years | 0 (0.0%) | 0 (0.0%) |
| 75 Years and over | 0 (0.0%) | 1 (6.7%) |
Disability Class: Ambulatory Difficulty
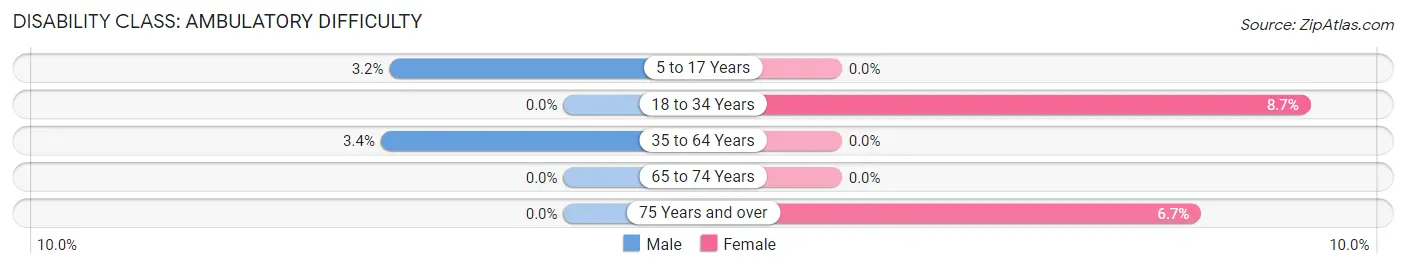
| Age Bracket | Male | Female |
| 5 to 17 Years | 1 (3.2%) | 0 (0.0%) |
| 18 to 34 Years | 0 (0.0%) | 2 (8.7%) |
| 35 to 64 Years | 2 (3.4%) | 0 (0.0%) |
| 65 to 74 Years | 0 (0.0%) | 0 (0.0%) |
| 75 Years and over | 0 (0.0%) | 1 (6.7%) |
Disability Class: Self-Care Difficulty
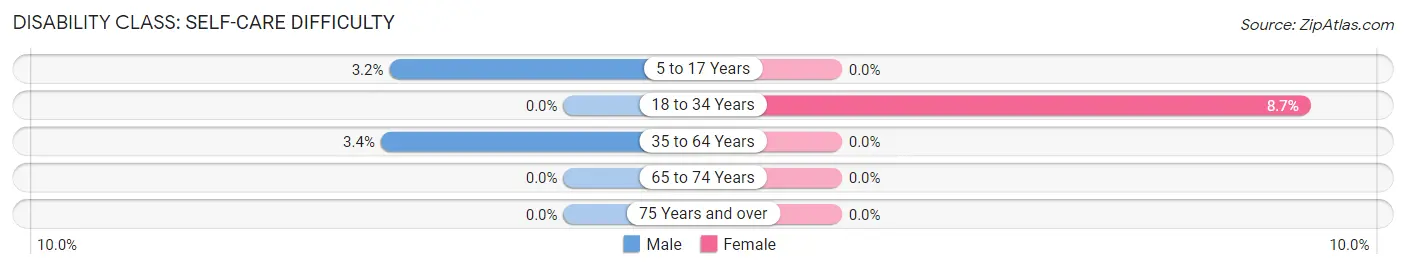
| Age Bracket | Male | Female |
| 5 to 17 Years | 1 (3.2%) | 0 (0.0%) |
| 18 to 34 Years | 0 (0.0%) | 2 (8.7%) |
| 35 to 64 Years | 2 (3.4%) | 0 (0.0%) |
| 65 to 74 Years | 0 (0.0%) | 0 (0.0%) |
| 75 Years and over | 0 (0.0%) | 0 (0.0%) |
Technology Access in Ney
Computing Device Access in Ney
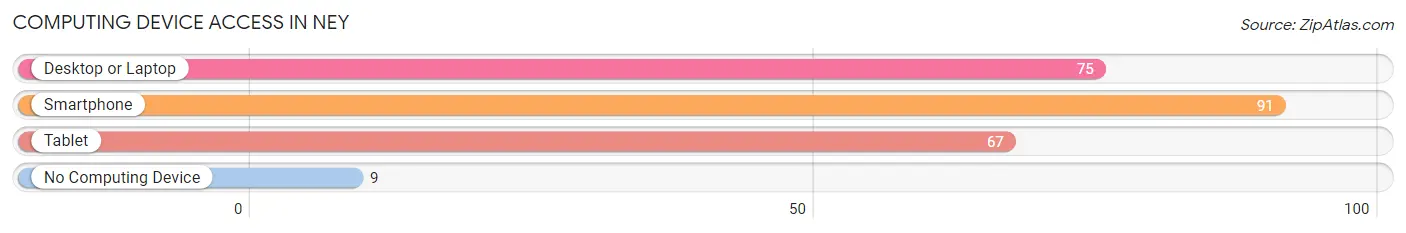
| Device Type | # Households | % Households |
| Desktop or Laptop | 75 | 67.6% |
| Smartphone | 91 | 82.0% |
| Tablet | 67 | 60.4% |
| No Computing Device | 9 | 8.1% |
| Total | 111 | 100.0% |
Internet Access in Ney
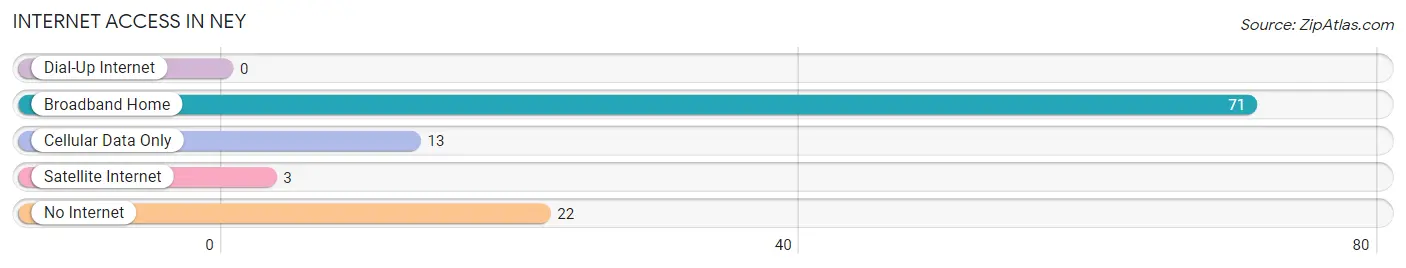
| Internet Type | # Households | % Households |
| Dial-Up Internet | 0 | 0.0% |
| Broadband Home | 71 | 64.0% |
| Cellular Data Only | 13 | 11.7% |
| Satellite Internet | 3 | 2.7% |
| No Internet | 22 | 19.8% |
| Total | 111 | 100.0% |
Ney Summary
Ohio is a state located in the Midwestern United States. It is bordered by Lake Erie to the north, Pennsylvania to the east, West Virginia to the southeast, Kentucky to the southwest, and Indiana to the west. Ohio is the 34th largest state in the United States, with an area of 44,825 square miles (116,096 km2). It is the 7th most populous state in the United States, with an estimated population of 11,689,100 in 2019.
History
Ohio was first inhabited by Native American tribes, including the Iroquois, Shawnee, and Miami. The first European settlers arrived in the late 17th century, and the area was ceded to the United States in 1783 as part of the Northwest Territory. Ohio became the 17th state in 1803.
During the 19th century, Ohio was a major center of immigration, with many German, Irish, and Italian immigrants settling in the state. The state also experienced a period of industrialization, with the development of the steel and automotive industries.
Geography
Ohio is located in the Midwestern United States, bordered by Lake Erie to the north, Pennsylvania to the east, West Virginia to the southeast, Kentucky to the southwest, and Indiana to the west. The state has a total area of 44,825 square miles (116,096 km2), making it the 34th largest state in the United States.
The state is divided into 88 counties, and its capital is Columbus. Ohio is home to several major cities, including Cleveland, Cincinnati, Toledo, Akron, and Dayton. The state also contains several national parks, including Cuyahoga Valley National Park, Hocking Hills State Park, and Wayne National Forest.
Economy
Ohio has a diverse economy, with a mix of manufacturing, services, and agriculture. The state is home to several major companies, including Procter & Gamble, Goodyear Tire & Rubber, and Marathon Petroleum.
The state’s largest industries are manufacturing, finance and insurance, and health care and social assistance. Ohio is also a major producer of steel, aluminum, and automotive parts.
Demographics
As of 2019, the estimated population of Ohio was 11,689,100. The state has a population density of 261.3 people per square mile (100.9/km2).
The largest racial group in Ohio is white, making up 81.2% of the population. The second largest group is African American, making up 12.3% of the population. Other racial groups include Asian (2.7%), Native American (0.4%), and Hispanic or Latino (3.4%).
The median household income in Ohio is $54,822, and the median age is 39.7 years. The state has a poverty rate of 13.7%.
Common Questions
What is Per Capita Income in Ney?
Per Capita income in Ney is $25,435.
What is the Median Family Income in Ney?
Median Family Income in Ney is $75,833.
What is the Median Household income in Ney?
Median Household Income in Ney is $64,792.
What is Income or Wage Gap in Ney?
Income or Wage Gap in Ney is 8.1%.
Women in Ney earn 91.9 cents for every dollar earned by a man.
What is Inequality or Gini Index in Ney?
Inequality or Gini Index in Ney is 0.34.
What is the Total Population of Ney?
Total Population of Ney is 301.
What is the Total Male Population of Ney?
Total Male Population of Ney is 147.
What is the Total Female Population of Ney?
Total Female Population of Ney is 154.
What is the Ratio of Males per 100 Females in Ney?
There are 95.45 Males per 100 Females in Ney.
What is the Ratio of Females per 100 Males in Ney?
There are 104.76 Females per 100 Males in Ney.
What is the Median Population Age in Ney?
Median Population Age in Ney is 39.8 Years.
What is the Average Family Size in Ney
Average Family Size in Ney is 3.5 People.
What is the Average Household Size in Ney
Average Household Size in Ney is 2.7 People.
How Large is the Labor Force in Ney?
There are 175 People in the Labor Forcein in Ney.
What is the Percentage of People in the Labor Force in Ney?
74.8% of People are in the Labor Force in Ney.
What is the Unemployment Rate in Ney?
Unemployment Rate in Ney is 0.6%.