New Washington, OH Map & Demographics
New Washington Map
New Washington Overview
$37,044
PER CAPITA INCOME
$70,063
AVG FAMILY INCOME
$57,969
AVG HOUSEHOLD INCOME
36.7%
WAGE / INCOME GAP [ % ]
63.3¢/ $1
WAGE / INCOME GAP [ $ ]
0.43
INEQUALITY / GINI INDEX
900
TOTAL POPULATION
485
MALE POPULATION
415
FEMALE POPULATION
116.87
MALES / 100 FEMALES
85.57
FEMALES / 100 MALES
32.3
MEDIAN AGE
3.0
AVG FAMILY SIZE
2.3
AVG HOUSEHOLD SIZE
457
LABOR FORCE [ PEOPLE ]
67.3%
PERCENT IN LABOR FORCE
0.9%
UNEMPLOYMENT RATE
New Washington Zip Codes
Income in New Washington
Income Overview in New Washington
Per Capita Income in New Washington is $37,044, while median incomes of families and households are $70,063 and $57,969 respectively.
| Characteristic | Number | Measure |
| Per Capita Income | 900 | $37,044 |
| Median Family Income | 241 | $70,063 |
| Mean Family Income | 241 | $102,635 |
| Median Household Income | 387 | $57,969 |
| Mean Household Income | 387 | $84,683 |
| Income Deficit | 241 | $0 |
| Wage / Income Gap (%) | 900 | 36.73% |
| Wage / Income Gap ($) | 900 | 63.27¢ per $1 |
| Gini / Inequality Index | 900 | 0.43 |
Earnings by Sex in New Washington
Average Earnings in New Washington are $36,731, $47,708 for men and $30,185 for women, a difference of 36.7%.
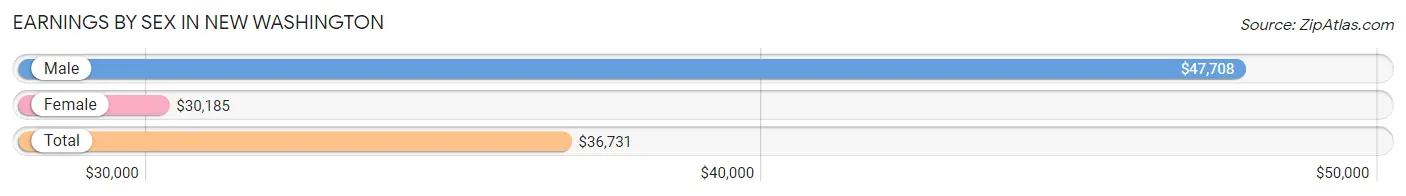
| Sex | Number | Average Earnings |
| Male | 262 (50.6%) | $47,708 |
| Female | 256 (49.4%) | $30,185 |
| Total | 518 (100.0%) | $36,731 |
Earnings by Sex by Income Bracket in New Washington
The most common earnings brackets in New Washington are $75,000 to $99,999 for men (47 | 17.9%) and $30,000 to $34,999 for women (36 | 14.1%).
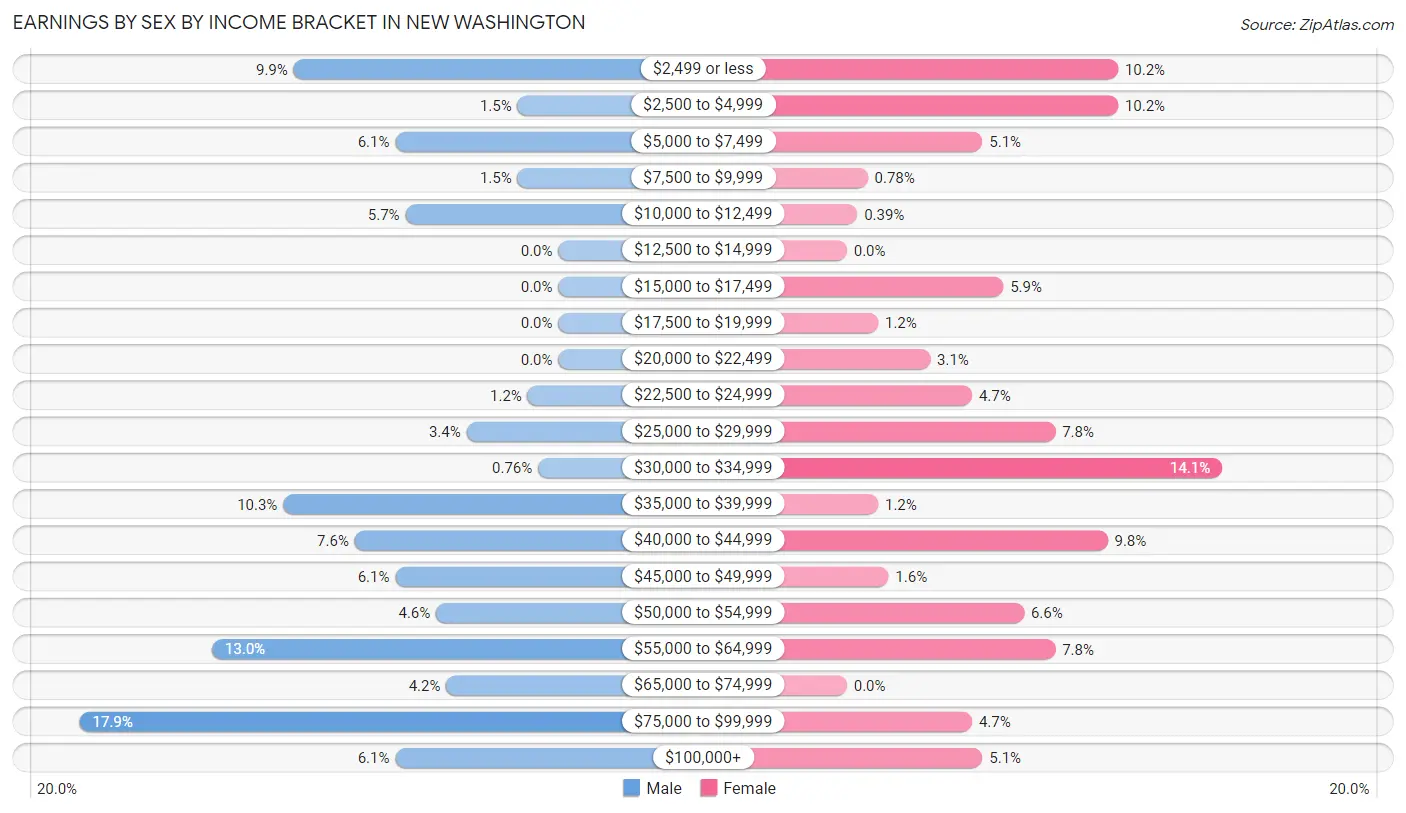
| Income | Male | Female |
| $2,499 or less | 26 (9.9%) | 26 (10.2%) |
| $2,500 to $4,999 | 4 (1.5%) | 26 (10.2%) |
| $5,000 to $7,499 | 16 (6.1%) | 13 (5.1%) |
| $7,500 to $9,999 | 4 (1.5%) | 2 (0.8%) |
| $10,000 to $12,499 | 15 (5.7%) | 1 (0.4%) |
| $12,500 to $14,999 | 0 (0.0%) | 0 (0.0%) |
| $15,000 to $17,499 | 0 (0.0%) | 15 (5.9%) |
| $17,500 to $19,999 | 0 (0.0%) | 3 (1.2%) |
| $20,000 to $22,499 | 0 (0.0%) | 8 (3.1%) |
| $22,500 to $24,999 | 3 (1.1%) | 12 (4.7%) |
| $25,000 to $29,999 | 9 (3.4%) | 20 (7.8%) |
| $30,000 to $34,999 | 2 (0.8%) | 36 (14.1%) |
| $35,000 to $39,999 | 27 (10.3%) | 3 (1.2%) |
| $40,000 to $44,999 | 20 (7.6%) | 25 (9.8%) |
| $45,000 to $49,999 | 16 (6.1%) | 4 (1.6%) |
| $50,000 to $54,999 | 12 (4.6%) | 17 (6.6%) |
| $55,000 to $64,999 | 34 (13.0%) | 20 (7.8%) |
| $65,000 to $74,999 | 11 (4.2%) | 0 (0.0%) |
| $75,000 to $99,999 | 47 (17.9%) | 12 (4.7%) |
| $100,000+ | 16 (6.1%) | 13 (5.1%) |
| Total | 262 (100.0%) | 256 (100.0%) |
Earnings by Sex by Educational Attainment in New Washington
Average earnings in New Washington are $53,646 for men and $31,852 for women, a difference of 40.6%. Men with an educational attainment of bachelor's degree enjoy the highest average annual earnings of $91,000, while those with high school diploma education earn the least with $48,229. Women with an educational attainment of college or associate's degree earn the most with the average annual earnings of $35,417, while those with high school diploma education have the smallest earnings of $21,719.
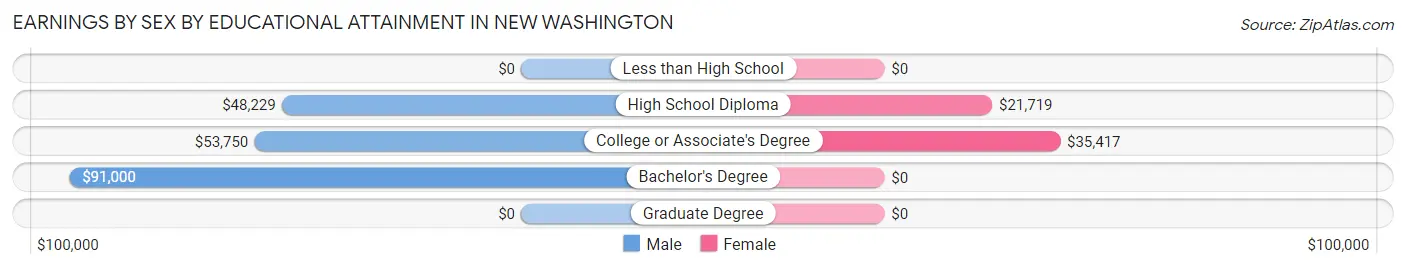
| Educational Attainment | Male Income | Female Income |
| Less than High School | - | - |
| High School Diploma | $48,229 | $21,719 |
| College or Associate's Degree | $53,750 | $35,417 |
| Bachelor's Degree | $91,000 | $0 |
| Graduate Degree | - | - |
| Total | $53,646 | $31,852 |
Family Income in New Washington
Family Income Brackets in New Washington
According to the New Washington family income data, there are 74 families falling into the $50,000 to $74,999 income range, which is the most common income bracket and makes up 30.7% of all families.
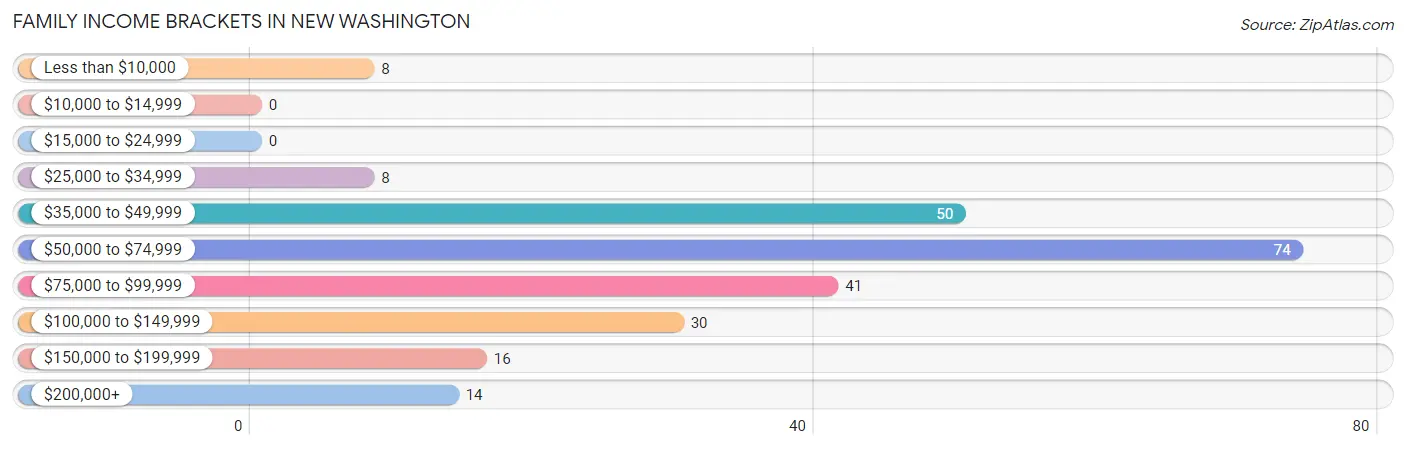
| Income Bracket | # Families | % Families |
| Less than $10,000 | 8 | 3.3% |
| $10,000 to $14,999 | 0 | 0.0% |
| $15,000 to $24,999 | 0 | 0.0% |
| $25,000 to $34,999 | 8 | 3.3% |
| $35,000 to $49,999 | 50 | 20.7% |
| $50,000 to $74,999 | 74 | 30.7% |
| $75,000 to $99,999 | 41 | 17.0% |
| $100,000 to $149,999 | 30 | 12.4% |
| $150,000 to $199,999 | 16 | 6.6% |
| $200,000+ | 14 | 5.8% |
Family Income by Famaliy Size in New Washington
5-person families (16 | 6.6%) account for the highest median family income in New Washington with $171,250 per family, while 5-person families (16 | 6.6%) have the highest median income of $34,250 per family member.
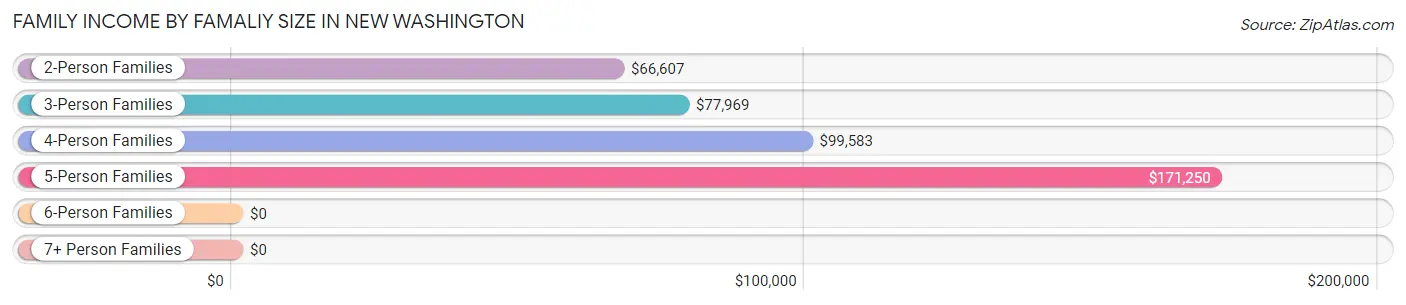
| Income Bracket | # Families | Median Income |
| 2-Person Families | 105 (43.6%) | $66,607 |
| 3-Person Families | 71 (29.5%) | $77,969 |
| 4-Person Families | 25 (10.4%) | $99,583 |
| 5-Person Families | 16 (6.6%) | $171,250 |
| 6-Person Families | 2 (0.8%) | $0 |
| 7+ Person Families | 22 (9.1%) | $0 |
| Total | 241 (100.0%) | $70,063 |
Family Income by Number of Earners in New Washington
The median family income in New Washington is $70,063, with families comprising 3+ earners (31) having the highest median family income of $144,583, while families with 1 earner (58) have the lowest median family income of $45,833, accounting for 12.9% and 24.1% of families, respectively.
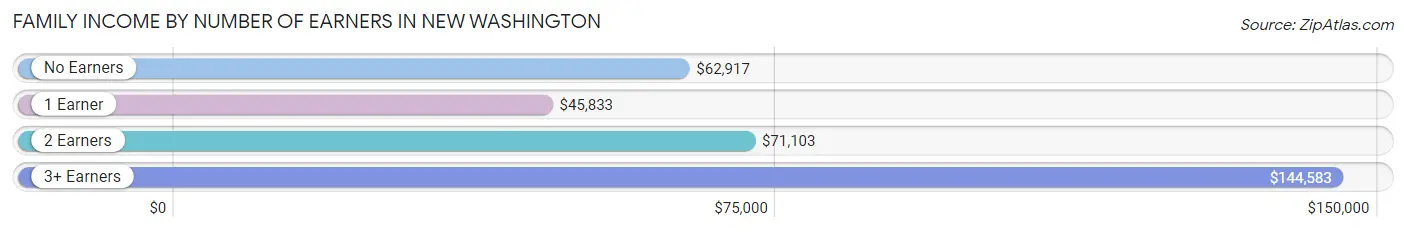
| Number of Earners | # Families | Median Income |
| No Earners | 33 (13.7%) | $62,917 |
| 1 Earner | 58 (24.1%) | $45,833 |
| 2 Earners | 119 (49.4%) | $71,103 |
| 3+ Earners | 31 (12.9%) | $144,583 |
| Total | 241 (100.0%) | $70,063 |
Household Income in New Washington
Household Income Brackets in New Washington
With 128 households falling in the category, the $50,000 to $74,999 income range is the most frequent in New Washington, accounting for 33.1% of all households. In contrast, only 3 households (0.8%) fall into the $10,000 to $14,999 income bracket, making it the least populous group.
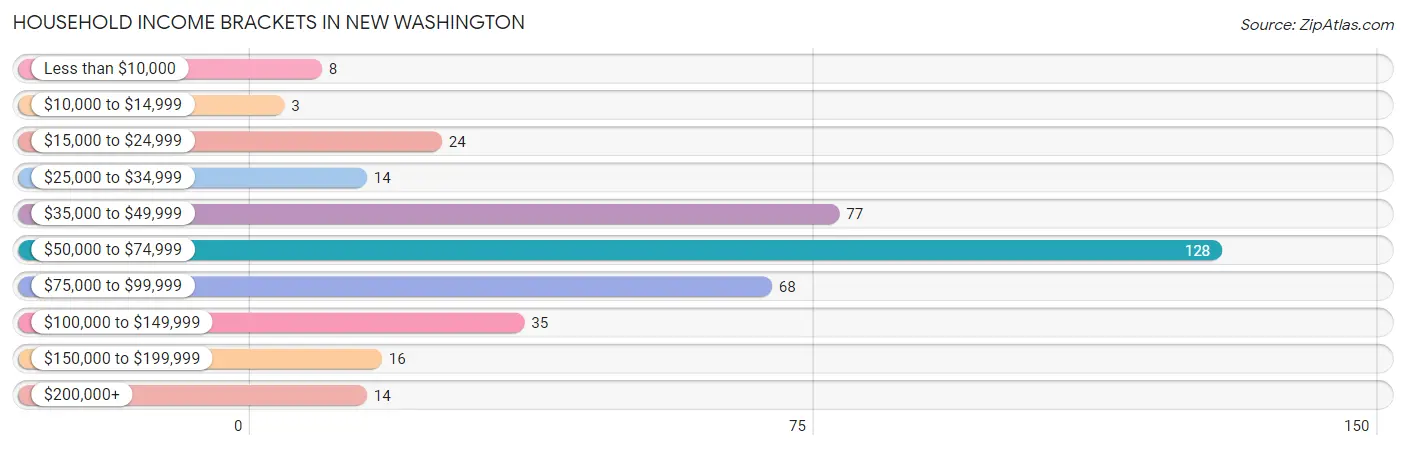
| Income Bracket | # Households | % Households |
| Less than $10,000 | 8 | 2.1% |
| $10,000 to $14,999 | 3 | 0.8% |
| $15,000 to $24,999 | 24 | 6.2% |
| $25,000 to $34,999 | 14 | 3.6% |
| $35,000 to $49,999 | 77 | 19.9% |
| $50,000 to $74,999 | 128 | 33.1% |
| $75,000 to $99,999 | 68 | 17.6% |
| $100,000 to $149,999 | 35 | 9.0% |
| $150,000 to $199,999 | 16 | 4.1% |
| $200,000+ | 14 | 3.6% |
Household Income by Householder Age in New Washington
The median household income in New Washington is $57,969, with the highest median household income of $74,018 found in the 45 to 64 years age bracket for the primary householder. A total of 103 households (26.6%) fall into this category. Meanwhile, the 15 to 24 years age bracket for the primary householder has the lowest median household income of $0, with 11 households (2.8%) in this group.
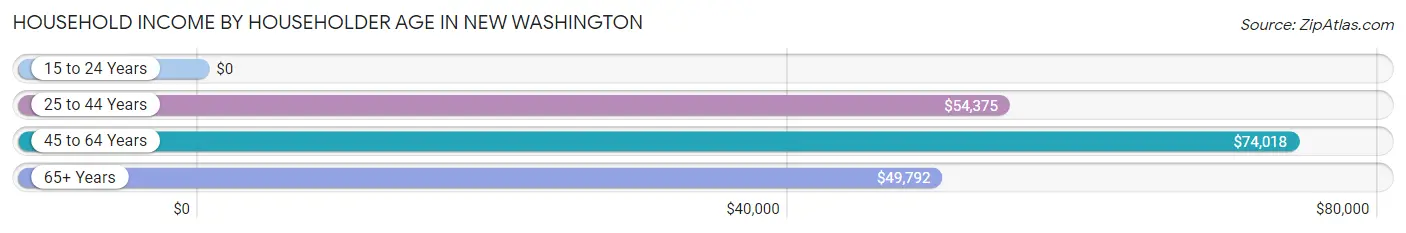
| Income Bracket | # Households | Median Income |
| 15 to 24 Years | 11 (2.8%) | $0 |
| 25 to 44 Years | 196 (50.6%) | $54,375 |
| 45 to 64 Years | 103 (26.6%) | $74,018 |
| 65+ Years | 77 (19.9%) | $49,792 |
| Total | 387 (100.0%) | $57,969 |
Poverty in New Washington
Income Below Poverty by Sex and Age in New Washington
With 4.2% poverty level for males and 1.7% for females among the residents of New Washington, 18 to 24 year old males and 75 year old and over females are the most vulnerable to poverty, with 7 males (38.9%) and 4 females (12.5%) in their respective age groups living below the poverty level.
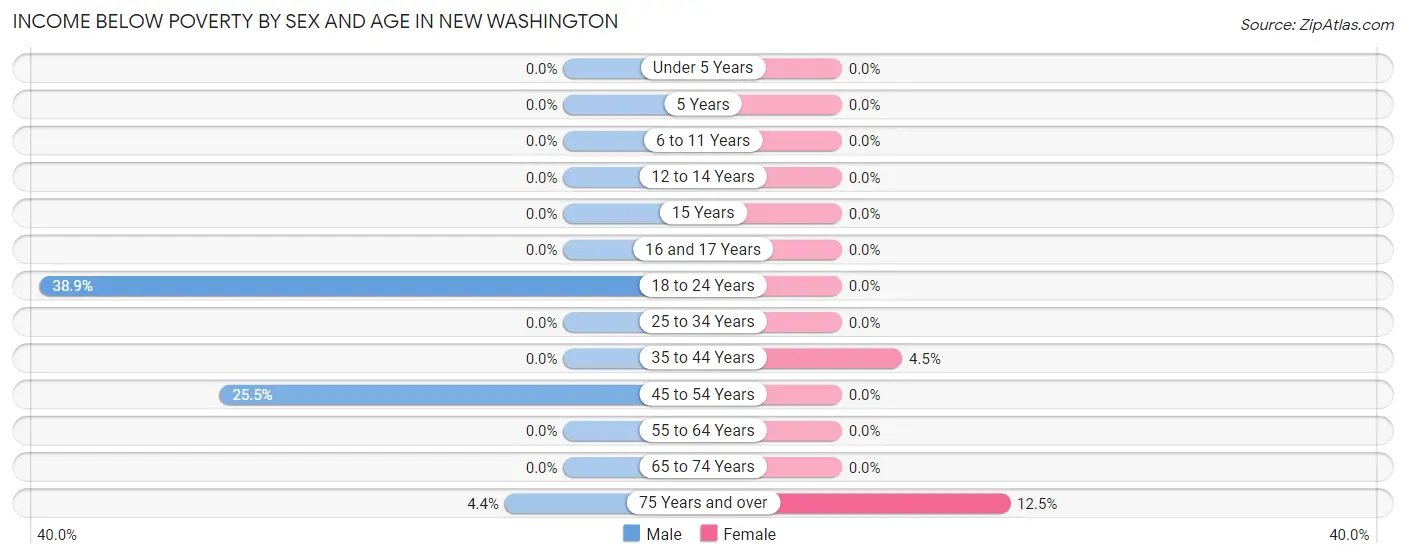
| Age Bracket | Male | Female |
| Under 5 Years | 0 (0.0%) | 0 (0.0%) |
| 5 Years | 0 (0.0%) | 0 (0.0%) |
| 6 to 11 Years | 0 (0.0%) | 0 (0.0%) |
| 12 to 14 Years | 0 (0.0%) | 0 (0.0%) |
| 15 Years | 0 (0.0%) | 0 (0.0%) |
| 16 and 17 Years | 0 (0.0%) | 0 (0.0%) |
| 18 to 24 Years | 7 (38.9%) | 0 (0.0%) |
| 25 to 34 Years | 0 (0.0%) | 0 (0.0%) |
| 35 to 44 Years | 0 (0.0%) | 3 (4.5%) |
| 45 to 54 Years | 12 (25.5%) | 0 (0.0%) |
| 55 to 64 Years | 0 (0.0%) | 0 (0.0%) |
| 65 to 74 Years | 0 (0.0%) | 0 (0.0%) |
| 75 Years and over | 1 (4.3%) | 4 (12.5%) |
| Total | 20 (4.2%) | 7 (1.7%) |
Income Above Poverty by Sex and Age in New Washington
According to the poverty statistics in New Washington, males aged under 5 years and females aged under 5 years are the age groups that are most secure financially, with 100.0% of males and 100.0% of females in these age groups living above the poverty line.
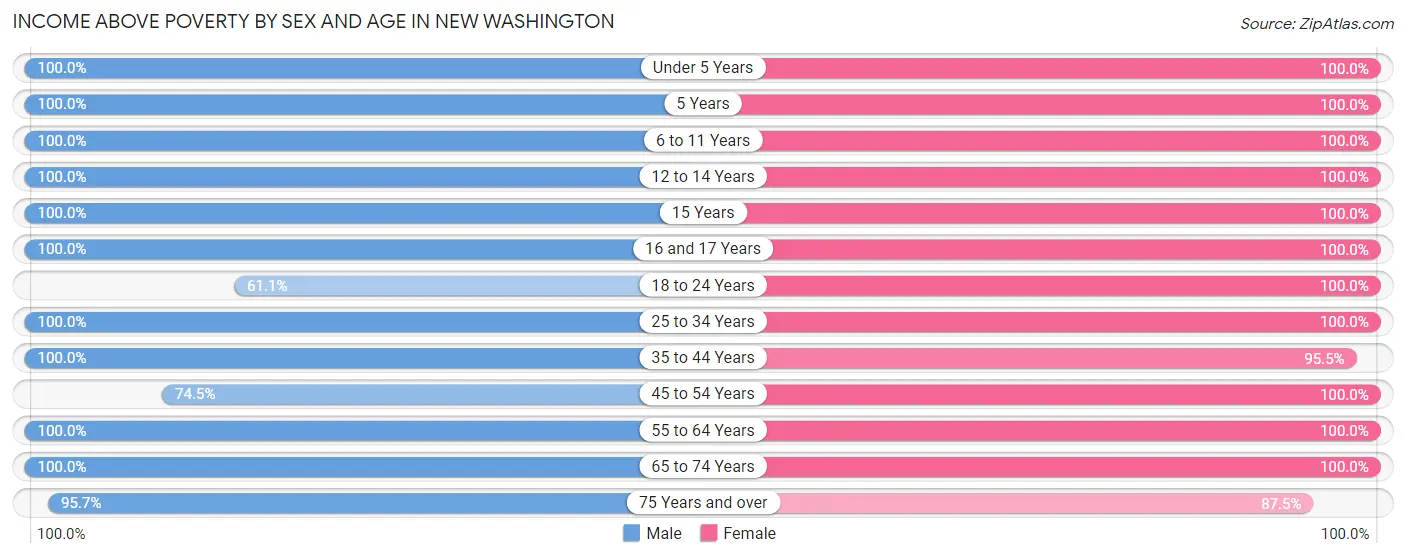
| Age Bracket | Male | Female |
| Under 5 Years | 21 (100.0%) | 9 (100.0%) |
| 5 Years | 4 (100.0%) | 36 (100.0%) |
| 6 to 11 Years | 88 (100.0%) | 15 (100.0%) |
| 12 to 14 Years | 14 (100.0%) | 8 (100.0%) |
| 15 Years | 10 (100.0%) | 11 (100.0%) |
| 16 and 17 Years | 26 (100.0%) | 5 (100.0%) |
| 18 to 24 Years | 11 (61.1%) | 31 (100.0%) |
| 25 to 34 Years | 96 (100.0%) | 98 (100.0%) |
| 35 to 44 Years | 58 (100.0%) | 64 (95.5%) |
| 45 to 54 Years | 35 (74.5%) | 28 (100.0%) |
| 55 to 64 Years | 42 (100.0%) | 44 (100.0%) |
| 65 to 74 Years | 33 (100.0%) | 31 (100.0%) |
| 75 Years and over | 22 (95.7%) | 28 (87.5%) |
| Total | 460 (95.8%) | 408 (98.3%) |
Income Below Poverty Among Married-Couple Families in New Washington
The poverty statistics for married-couple families in New Washington show that 0.6% or 1 of the total 179 families live below the poverty line. Families with no children have the highest poverty rate of 1.1%, comprising of 1 families. On the other hand, families with 1 or 2 children have the lowest poverty rate of 0.0%, which includes 0 families.
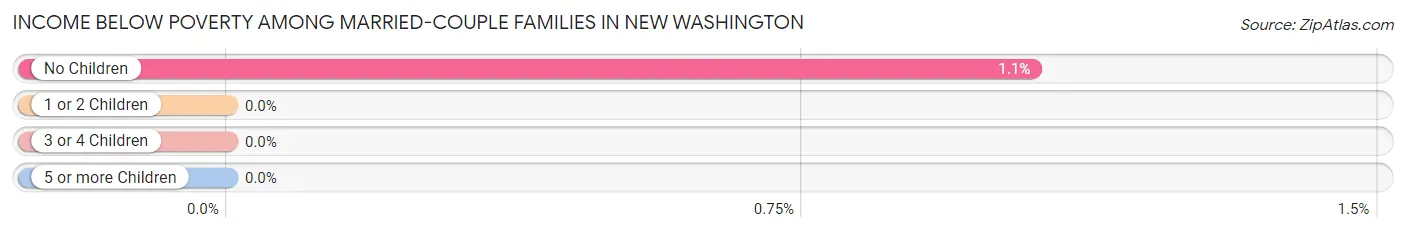
| Children | Above Poverty | Below Poverty |
| No Children | 94 (99.0%) | 1 (1.1%) |
| 1 or 2 Children | 57 (100.0%) | 0 (0.0%) |
| 3 or 4 Children | 5 (100.0%) | 0 (0.0%) |
| 5 or more Children | 22 (100.0%) | 0 (0.0%) |
| Total | 178 (99.4%) | 1 (0.6%) |
Income Below Poverty Among Single-Parent Households in New Washington
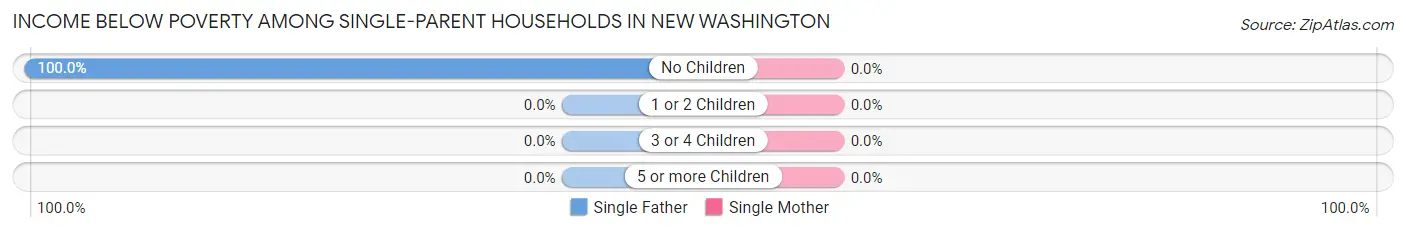
| Children | Single Father | Single Mother |
| No Children | 7 (100.0%) | 0 (0.0%) |
| 1 or 2 Children | 0 (0.0%) | 0 (0.0%) |
| 3 or 4 Children | 0 (0.0%) | 0 (0.0%) |
| 5 or more Children | 0 (0.0%) | 0 (0.0%) |
| Total | 7 (36.8%) | 0 (0.0%) |
Income Below Poverty Among Married-Couple vs Single-Parent Households in New Washington
The poverty data for New Washington shows that 1 of the married-couple family households (0.6%) and 7 of the single-parent households (11.3%) are living below the poverty level. Within the married-couple family households, those with no children have the highest poverty rate, with 1 households (1.1%) falling below the poverty line. Among the single-parent households, those with no children have the highest poverty rate, with 7 household (46.7%) living below poverty.
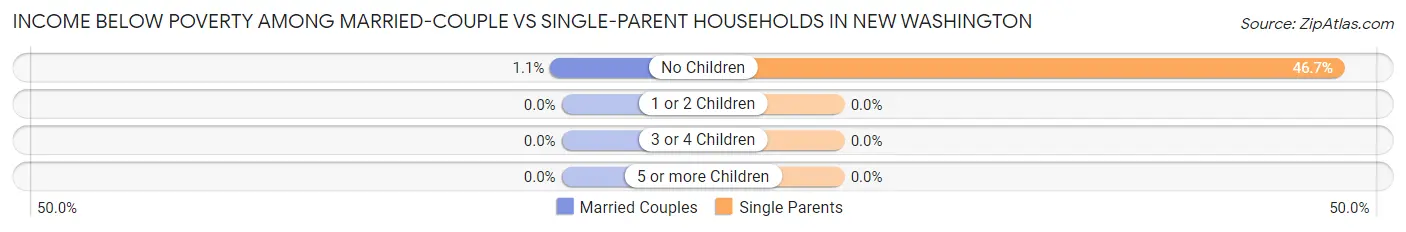
| Children | Married-Couple Families | Single-Parent Households |
| No Children | 1 (1.1%) | 7 (46.7%) |
| 1 or 2 Children | 0 (0.0%) | 0 (0.0%) |
| 3 or 4 Children | 0 (0.0%) | 0 (0.0%) |
| 5 or more Children | 0 (0.0%) | 0 (0.0%) |
| Total | 1 (0.6%) | 7 (11.3%) |
Race in New Washington
The most populous races in New Washington are White / Caucasian (875 | 97.2%), Hispanic or Latino (25 | 2.8%), and Two or more Races (25 | 2.8%).
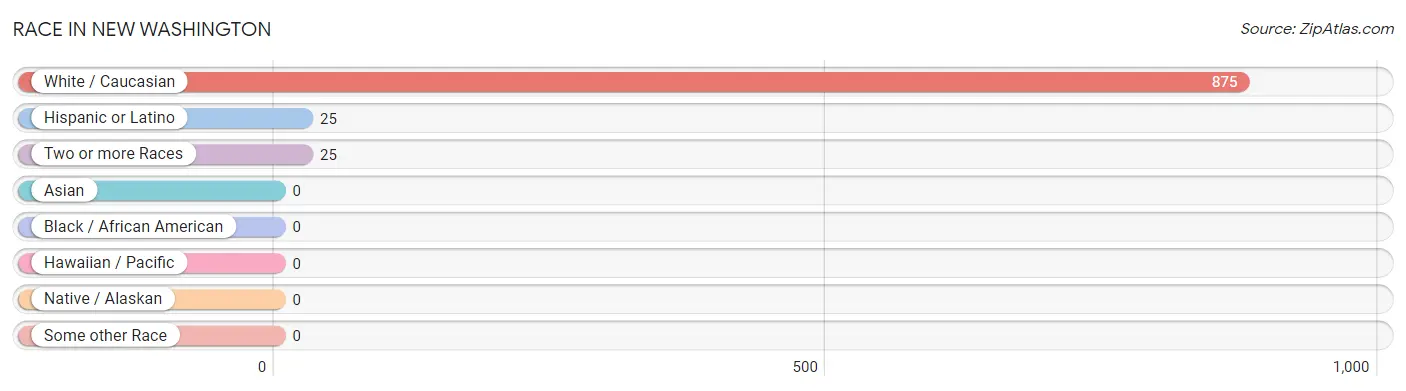
| Race | # Population | % Population |
| Asian | 0 | 0.0% |
| Black / African American | 0 | 0.0% |
| Hawaiian / Pacific | 0 | 0.0% |
| Hispanic or Latino | 25 | 2.8% |
| Native / Alaskan | 0 | 0.0% |
| White / Caucasian | 875 | 97.2% |
| Two or more Races | 25 | 2.8% |
| Some other Race | 0 | 0.0% |
| Total | 900 | 100.0% |
Ancestry in New Washington
The most populous ancestries reported in New Washington are German (329 | 36.6%), American (106 | 11.8%), English (63 | 7.0%), French (39 | 4.3%), and Irish (39 | 4.3%), together accounting for 64.0% of all New Washington residents.
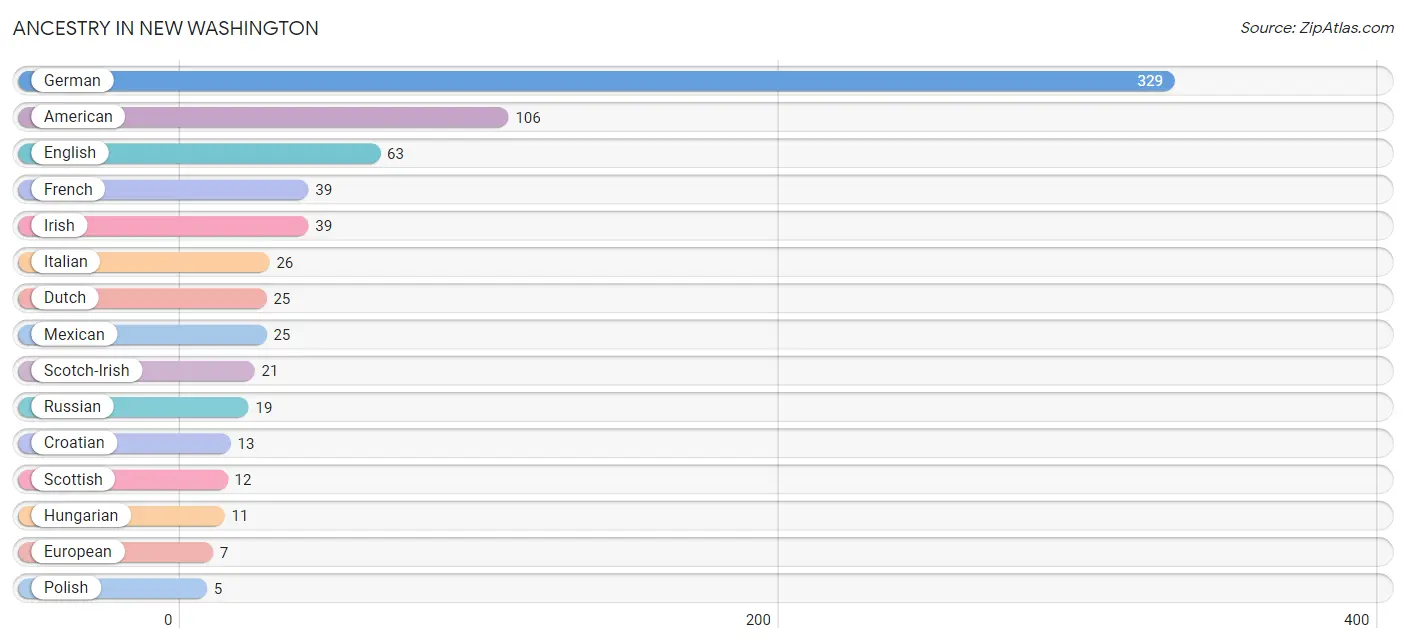
| Ancestry | # Population | % Population |
| Alsatian | 3 | 0.3% |
| American | 106 | 11.8% |
| Austrian | 3 | 0.3% |
| Croatian | 13 | 1.4% |
| Dutch | 25 | 2.8% |
| English | 63 | 7.0% |
| European | 7 | 0.8% |
| French | 39 | 4.3% |
| German | 329 | 36.6% |
| Greek | 4 | 0.4% |
| Hungarian | 11 | 1.2% |
| Irish | 39 | 4.3% |
| Italian | 26 | 2.9% |
| Mexican | 25 | 2.8% |
| Northern European | 3 | 0.3% |
| Polish | 5 | 0.6% |
| Russian | 19 | 2.1% |
| Scotch-Irish | 21 | 2.3% |
| Scottish | 12 | 1.3% |
| Slovak | 3 | 0.3% |
| Swiss | 2 | 0.2% |
| Yugoslavian | 3 | 0.3% | View All 22 Rows |
Immigrants in New Washington

| Immigration Origin | # Population | % Population | View All 0 Rows |
Sex and Age in New Washington
Sex and Age in New Washington
The most populous age groups in New Washington are 5 to 9 Years (78 | 16.1%) for men and 25 to 29 Years (54 | 13.0%) for women.
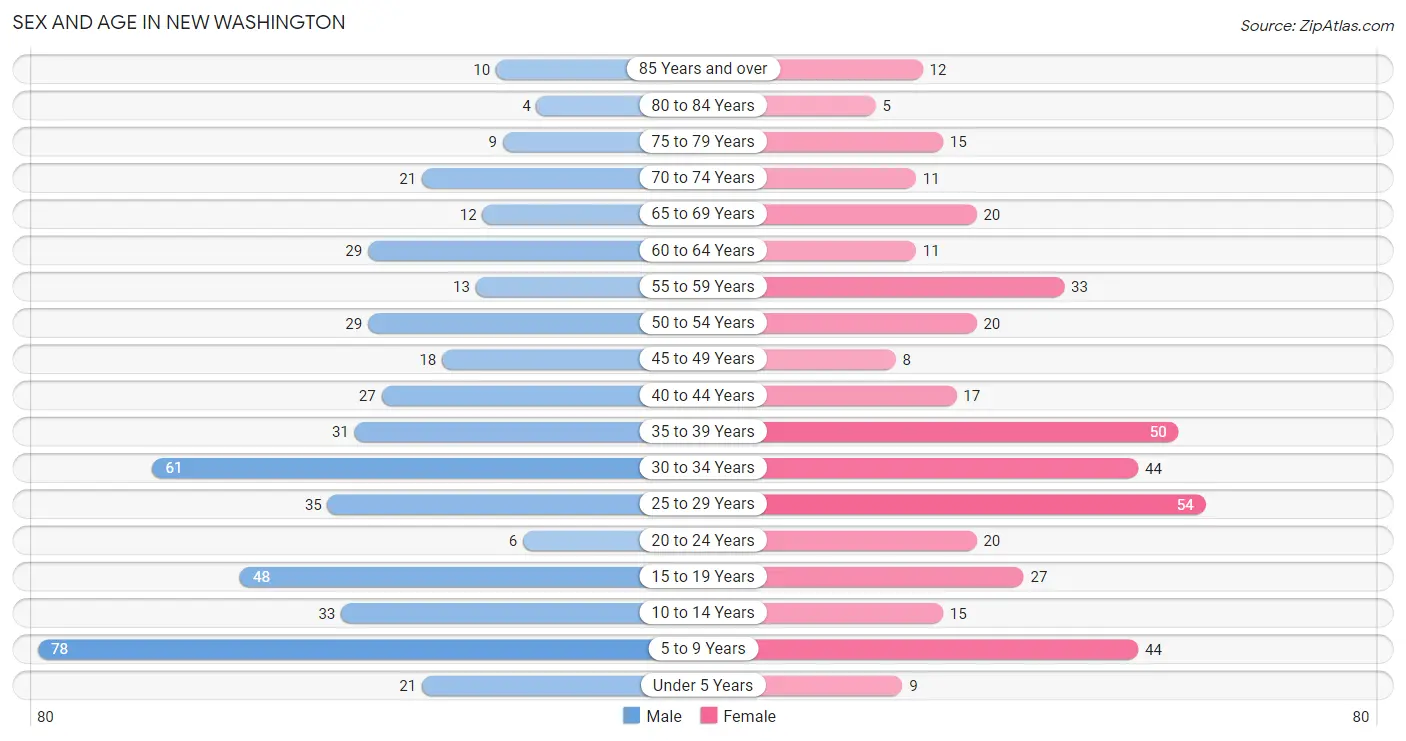
| Age Bracket | Male | Female |
| Under 5 Years | 21 (4.3%) | 9 (2.2%) |
| 5 to 9 Years | 78 (16.1%) | 44 (10.6%) |
| 10 to 14 Years | 33 (6.8%) | 15 (3.6%) |
| 15 to 19 Years | 48 (9.9%) | 27 (6.5%) |
| 20 to 24 Years | 6 (1.2%) | 20 (4.8%) |
| 25 to 29 Years | 35 (7.2%) | 54 (13.0%) |
| 30 to 34 Years | 61 (12.6%) | 44 (10.6%) |
| 35 to 39 Years | 31 (6.4%) | 50 (12.0%) |
| 40 to 44 Years | 27 (5.6%) | 17 (4.1%) |
| 45 to 49 Years | 18 (3.7%) | 8 (1.9%) |
| 50 to 54 Years | 29 (6.0%) | 20 (4.8%) |
| 55 to 59 Years | 13 (2.7%) | 33 (8.0%) |
| 60 to 64 Years | 29 (6.0%) | 11 (2.6%) |
| 65 to 69 Years | 12 (2.5%) | 20 (4.8%) |
| 70 to 74 Years | 21 (4.3%) | 11 (2.6%) |
| 75 to 79 Years | 9 (1.9%) | 15 (3.6%) |
| 80 to 84 Years | 4 (0.8%) | 5 (1.2%) |
| 85 Years and over | 10 (2.1%) | 12 (2.9%) |
| Total | 485 (100.0%) | 415 (100.0%) |
Families and Households in New Washington
Median Family Size in New Washington
The median family size in New Washington is 2.96 persons per family, with married-couple families (179 | 74.3%) accounting for the largest median family size of 3.18 persons per family. On the other hand, single male/father families (19 | 7.9%) represent the smallest median family size with 1.68 persons per family.
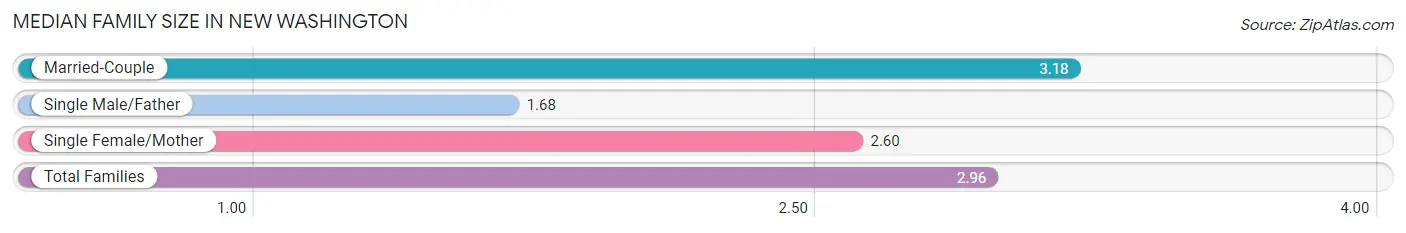
| Family Type | # Families | Family Size |
| Married-Couple | 179 (74.3%) | 3.18 |
| Single Male/Father | 19 (7.9%) | 1.68 |
| Single Female/Mother | 43 (17.8%) | 2.60 |
| Total Families | 241 (100.0%) | 2.96 |
Median Household Size in New Washington
The median household size in New Washington is 2.33 persons per household, with married-couple households (179 | 46.3%) accounting for the largest median household size of 3.18 persons per household. non-family households (146 | 37.7%) represent the smallest median household size with 1.12 persons per household.
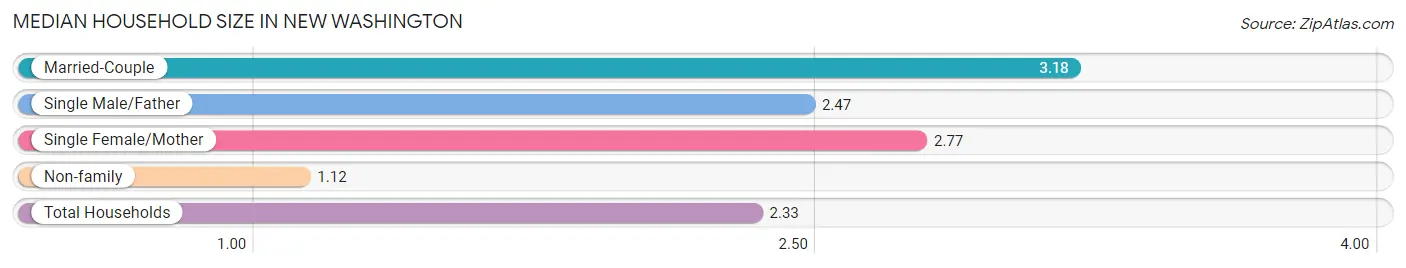
| Household Type | # Households | Household Size |
| Married-Couple | 179 (46.3%) | 3.18 |
| Single Male/Father | 19 (4.9%) | 2.47 |
| Single Female/Mother | 43 (11.1%) | 2.77 |
| Non-family | 146 (37.7%) | 1.12 |
| Total Households | 387 (100.0%) | 2.33 |
Household Size by Marriage Status in New Washington
Out of a total of 387 households in New Washington, 241 (62.3%) are family households, while 146 (37.7%) are nonfamily households. The most numerous type of family households are 2-person households, comprising 96, and the most common type of nonfamily households are 1-person households, comprising 129.
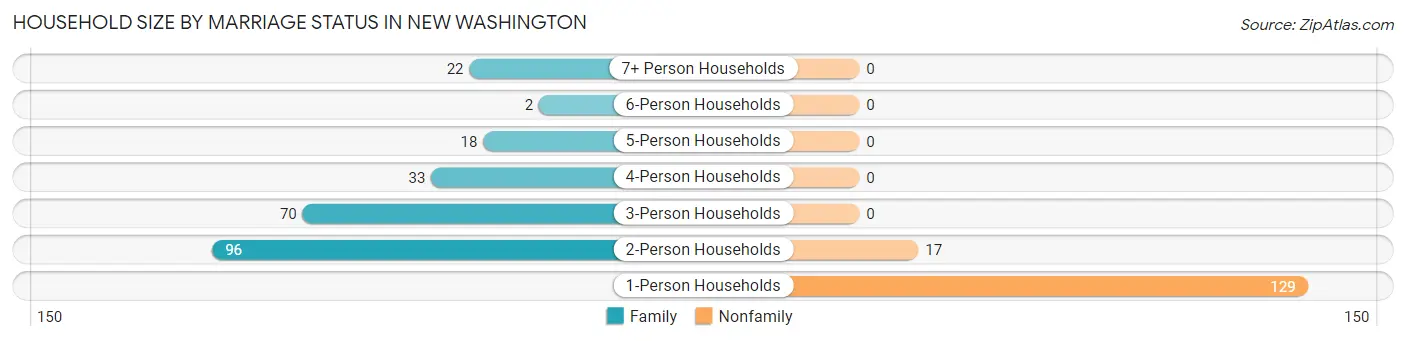
| Household Size | Family Households | Nonfamily Households |
| 1-Person Households | - | 129 (33.3%) |
| 2-Person Households | 96 (24.8%) | 17 (4.4%) |
| 3-Person Households | 70 (18.1%) | 0 (0.0%) |
| 4-Person Households | 33 (8.5%) | 0 (0.0%) |
| 5-Person Households | 18 (4.6%) | 0 (0.0%) |
| 6-Person Households | 2 (0.5%) | 0 (0.0%) |
| 7+ Person Households | 22 (5.7%) | 0 (0.0%) |
| Total | 241 (62.3%) | 146 (37.7%) |
Female Fertility in New Washington
Fertility by Age in New Washington
Average fertility rate in New Washington is 41.0 births per 1,000 women. Women in the age bracket of 20 to 34 years have the highest fertility rate with 76.0 births per 1,000 women. Women in the age bracket of 20 to 34 years acount for 100.0% of all women with births.
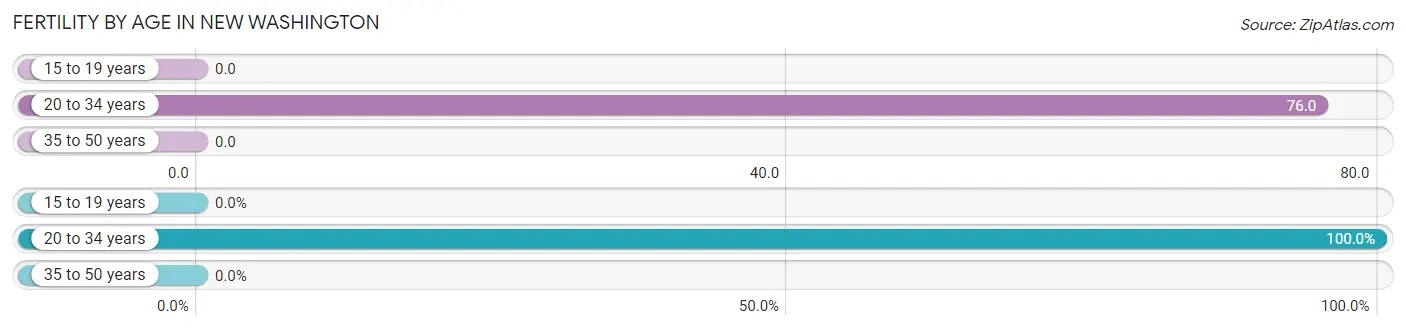
| Age Bracket | Women with Births | Births / 1,000 Women |
| 15 to 19 years | 0 (0.0%) | 0.0 |
| 20 to 34 years | 9 (100.0%) | 76.0 |
| 35 to 50 years | 0 (0.0%) | 0.0 |
| Total | 9 (100.0%) | 41.0 |
Fertility by Age by Marriage Status in New Washington
33.3% of women with births (9) in New Washington are married. The highest percentage of unmarried women with births falls into 20 to 34 years age bracket with 66.7% of them unmarried at the time of birth, while the lowest percentage of unmarried women with births belong to 20 to 34 years age bracket with 66.7% of them unmarried.
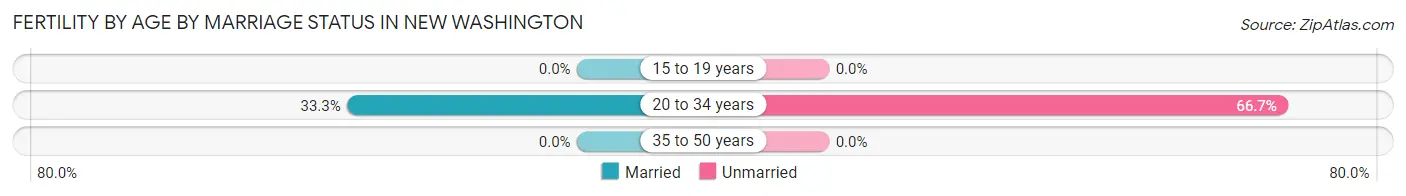
| Age Bracket | Married | Unmarried |
| 15 to 19 years | 0 (0.0%) | 0 (0.0%) |
| 20 to 34 years | 3 (33.3%) | 6 (66.7%) |
| 35 to 50 years | 0 (0.0%) | 0 (0.0%) |
| Total | 3 (33.3%) | 6 (66.7%) |
Fertility by Education in New Washington
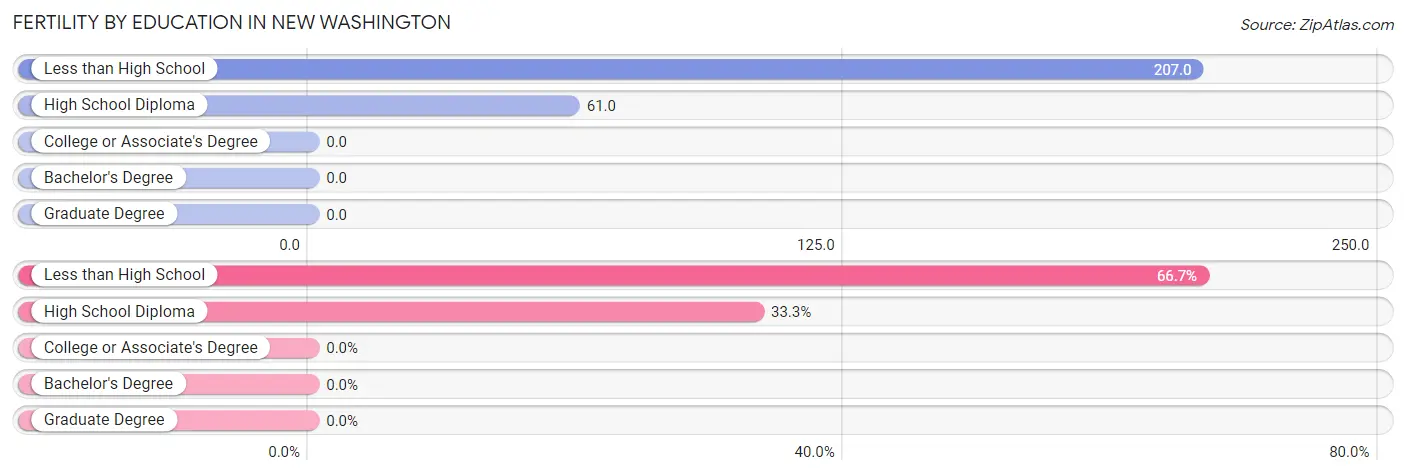
| Educational Attainment | Women with Births | Births / 1,000 Women |
| Less than High School | 6 (66.7%) | 207.0 |
| High School Diploma | 3 (33.3%) | 61.0 |
| College or Associate's Degree | 0 (0.0%) | 0.0 |
| Bachelor's Degree | 0 (0.0%) | 0.0 |
| Graduate Degree | 0 (0.0%) | 0.0 |
| Total | 9 (100.0%) | 41.0 |
Fertility by Education by Marriage Status in New Washington
66.7% of women with births in New Washington are unmarried. Women with the educational attainment of high school diploma are most likely to be married with 100.0% of them married at childbirth, while women with the educational attainment of less than high school are least likely to be married with 100.0% of them unmarried at childbirth.
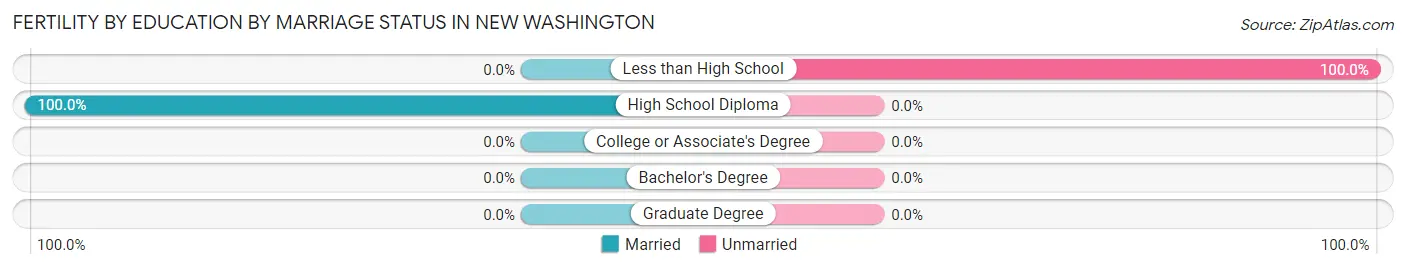
| Educational Attainment | Married | Unmarried |
| Less than High School | 0 (0.0%) | 6 (100.0%) |
| High School Diploma | 3 (100.0%) | 0 (0.0%) |
| College or Associate's Degree | 0 (0.0%) | 0 (0.0%) |
| Bachelor's Degree | 0 (0.0%) | 0 (0.0%) |
| Graduate Degree | 0 (0.0%) | 0 (0.0%) |
| Total | 3 (33.3%) | 6 (66.7%) |
Employment Characteristics in New Washington
Employment by Class of Employer in New Washington
Among the 447 employed individuals in New Washington, private company employees (331 | 74.1%), not-for-profit organizations (33 | 7.4%), and state government employees (31 | 6.9%) make up the most common classes of employment.
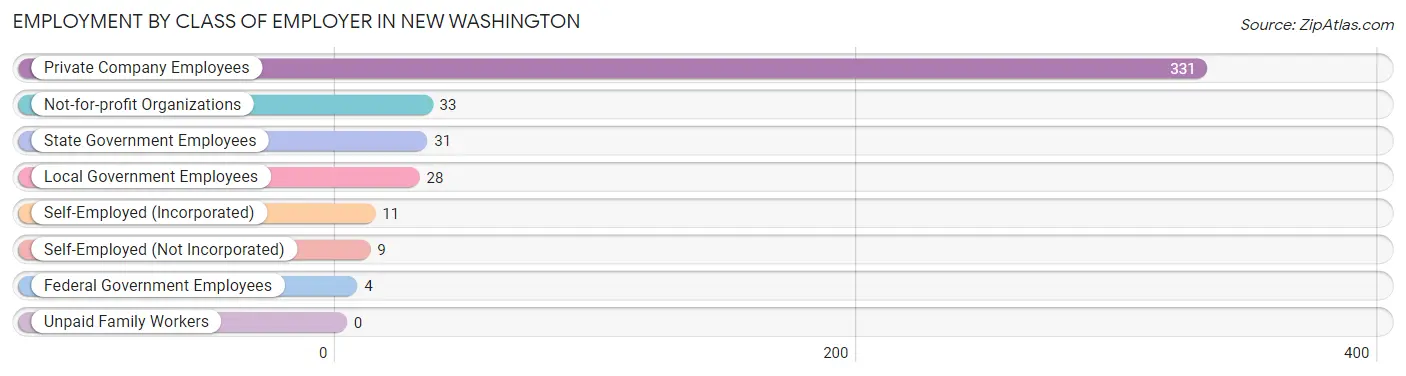
| Employer Class | # Employees | % Employees |
| Private Company Employees | 331 | 74.1% |
| Self-Employed (Incorporated) | 11 | 2.5% |
| Self-Employed (Not Incorporated) | 9 | 2.0% |
| Not-for-profit Organizations | 33 | 7.4% |
| Local Government Employees | 28 | 6.3% |
| State Government Employees | 31 | 6.9% |
| Federal Government Employees | 4 | 0.9% |
| Unpaid Family Workers | 0 | 0.0% |
| Total | 447 | 100.0% |
Employment Status by Age in New Washington
According to the labor force statistics for New Washington, out of the total population over 16 years of age (679), 67.3% or 457 individuals are in the labor force, with 0.9% or 4 of them unemployed. The age group with the highest labor force participation rate is 20 to 24 years, with 100.0% or 26 individuals in the labor force. Within the labor force, the 30 to 34 years age range has the highest percentage of unemployed individuals, with 4.1% or 4 of them being unemployed.
| Age Bracket | In Labor Force | Unemployed |
| 16 to 19 Years | 15 (27.8%) | 0 (0.0%) |
| 20 to 24 Years | 26 (100.0%) | 0 (0.0%) |
| 25 to 29 Years | 79 (88.8%) | 0 (0.0%) |
| 30 to 34 Years | 97 (92.4%) | 4 (4.1%) |
| 35 to 44 Years | 119 (95.2%) | 0 (0.0%) |
| 45 to 54 Years | 56 (74.7%) | 0 (0.0%) |
| 55 to 59 Years | 43 (93.5%) | 0 (0.0%) |
| 60 to 64 Years | 16 (40.0%) | 0 (0.0%) |
| 65 to 74 Years | 6 (9.4%) | 0 (0.0%) |
| 75 Years and over | 0 (0.0%) | 0 (0.0%) |
| Total | 457 (67.3%) | 4 (0.9%) |
Employment Status by Educational Attainment in New Washington
According to labor force statistics for New Washington, 85.4% of individuals (410) out of the total population between 25 and 64 years of age (480) are in the labor force, with 1.0% or 4 of them being unemployed. The group with the highest labor force participation rate are those with the educational attainment of bachelor's degree or higher, with 100.0% or 82 individuals in the labor force. Within the labor force, individuals with high school diploma education have the highest percentage of unemployment, with 2.3% or 4 of them being unemployed.
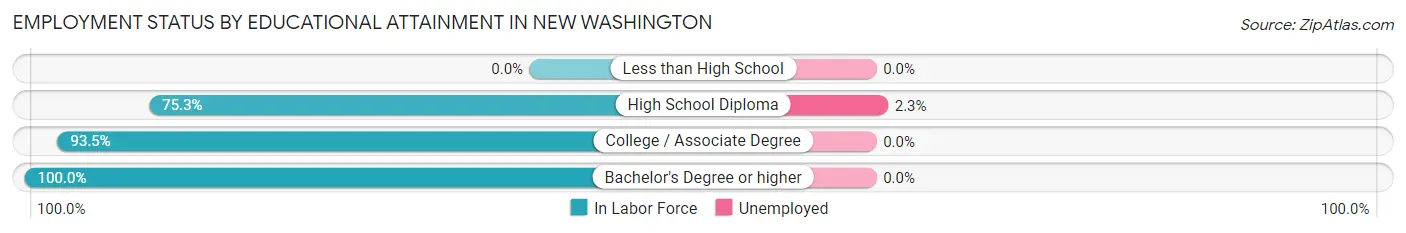
| Educational Attainment | In Labor Force | Unemployed |
| Less than High School | 0 (0.0%) | 0 (0.0%) |
| High School Diploma | 171 (75.3%) | 5 (2.3%) |
| College / Associate Degree | 157 (93.5%) | 0 (0.0%) |
| Bachelor's Degree or higher | 82 (100.0%) | 0 (0.0%) |
| Total | 410 (85.4%) | 5 (1.0%) |
Employment Occupations by Sex in New Washington
Management, Business, Science and Arts Occupations
The most common Management, Business, Science and Arts occupations in New Washington are Community & Social Service (44 | 9.7%), Management (36 | 8.0%), Education Instruction & Library (35 | 7.7%), Health Diagnosing & Treating (27 | 6.0%), and Business & Financial (20 | 4.4%).
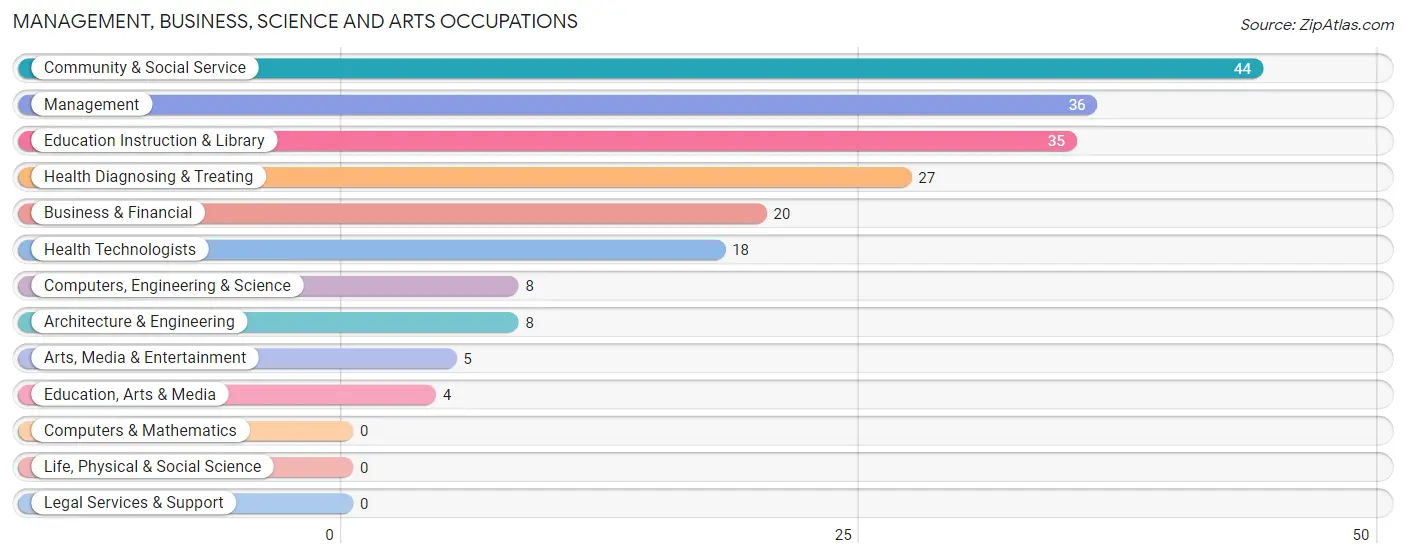
Management, Business, Science and Arts Occupations by Sex
Within the Management, Business, Science and Arts occupations in New Washington, the most male-oriented occupations are Computers, Engineering & Science (100.0%), Architecture & Engineering (100.0%), and Education, Arts & Media (100.0%), while the most female-oriented occupations are Education Instruction & Library (94.3%), Health Technologists (83.3%), and Community & Social Service (79.5%).
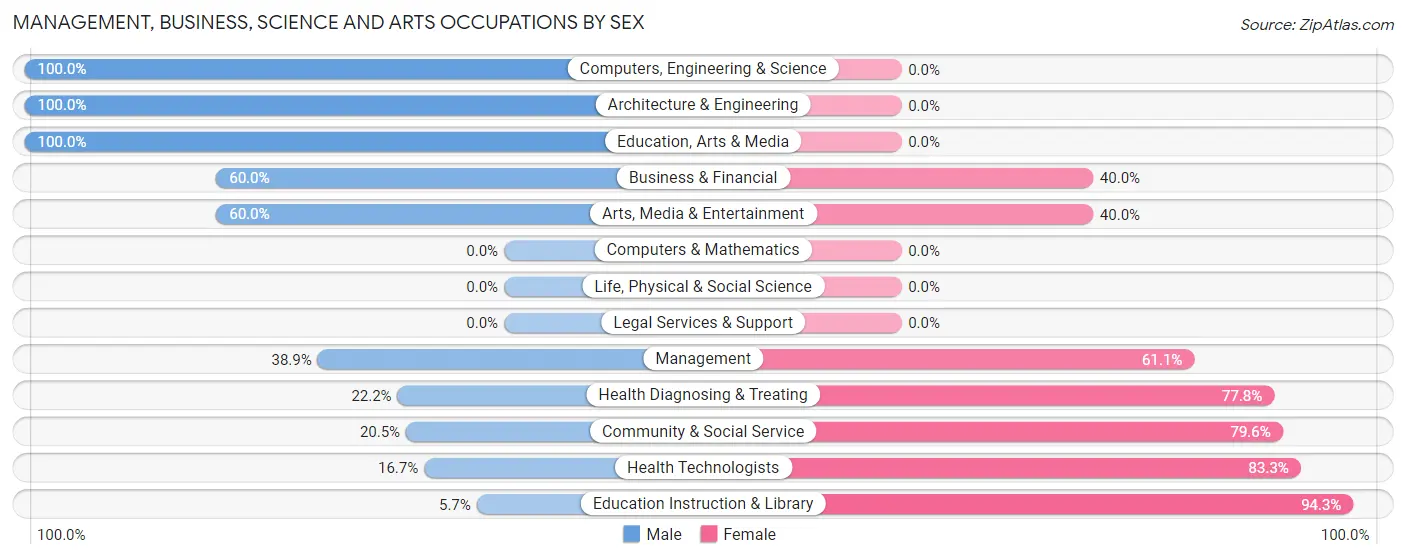
| Occupation | Male | Female |
| Management | 14 (38.9%) | 22 (61.1%) |
| Business & Financial | 12 (60.0%) | 8 (40.0%) |
| Computers, Engineering & Science | 8 (100.0%) | 0 (0.0%) |
| Computers & Mathematics | 0 (0.0%) | 0 (0.0%) |
| Architecture & Engineering | 8 (100.0%) | 0 (0.0%) |
| Life, Physical & Social Science | 0 (0.0%) | 0 (0.0%) |
| Community & Social Service | 9 (20.4%) | 35 (79.5%) |
| Education, Arts & Media | 4 (100.0%) | 0 (0.0%) |
| Legal Services & Support | 0 (0.0%) | 0 (0.0%) |
| Education Instruction & Library | 2 (5.7%) | 33 (94.3%) |
| Arts, Media & Entertainment | 3 (60.0%) | 2 (40.0%) |
| Health Diagnosing & Treating | 6 (22.2%) | 21 (77.8%) |
| Health Technologists | 3 (16.7%) | 15 (83.3%) |
| Total (Category) | 49 (36.3%) | 86 (63.7%) |
| Total (Overall) | 216 (47.7%) | 237 (52.3%) |
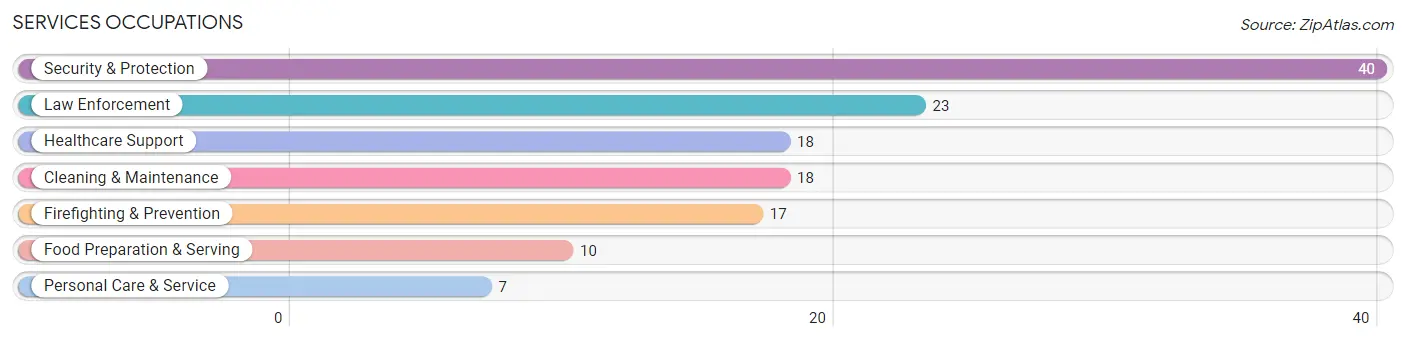
Services Occupations
The most common Services occupations in New Washington are Security & Protection (40 | 8.8%), Law Enforcement (23 | 5.1%), Healthcare Support (18 | 4.0%), Cleaning & Maintenance (18 | 4.0%), and Firefighting & Prevention (17 | 3.7%).
Services Occupations by Sex
Within the Services occupations in New Washington, the most male-oriented occupations are Law Enforcement (100.0%), Cleaning & Maintenance (72.2%), and Security & Protection (65.0%), while the most female-oriented occupations are Healthcare Support (100.0%), Personal Care & Service (100.0%), and Firefighting & Prevention (82.4%).
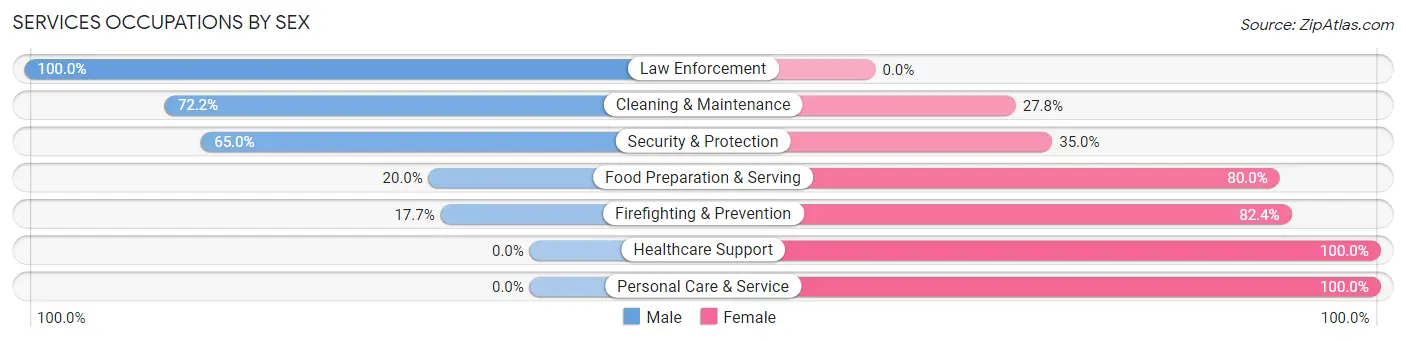
| Occupation | Male | Female |
| Healthcare Support | 0 (0.0%) | 18 (100.0%) |
| Security & Protection | 26 (65.0%) | 14 (35.0%) |
| Firefighting & Prevention | 3 (17.6%) | 14 (82.4%) |
| Law Enforcement | 23 (100.0%) | 0 (0.0%) |
| Food Preparation & Serving | 2 (20.0%) | 8 (80.0%) |
| Cleaning & Maintenance | 13 (72.2%) | 5 (27.8%) |
| Personal Care & Service | 0 (0.0%) | 7 (100.0%) |
| Total (Category) | 41 (44.1%) | 52 (55.9%) |
| Total (Overall) | 216 (47.7%) | 237 (52.3%) |
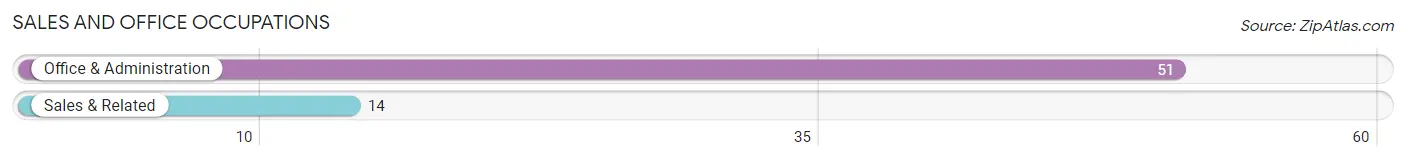
Sales and Office Occupations
The most common Sales and Office occupations in New Washington are Office & Administration (51 | 11.3%), and Sales & Related (14 | 3.1%).
Sales and Office Occupations by Sex
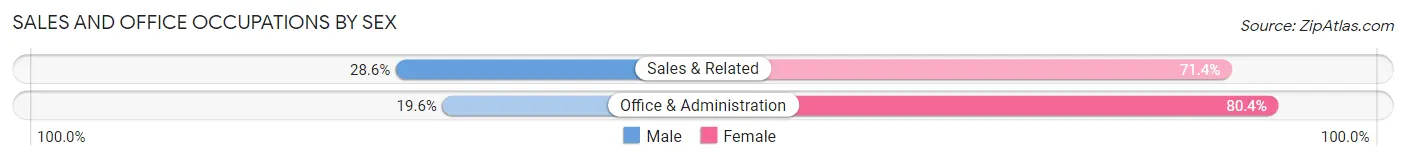
| Occupation | Male | Female |
| Sales & Related | 4 (28.6%) | 10 (71.4%) |
| Office & Administration | 10 (19.6%) | 41 (80.4%) |
| Total (Category) | 14 (21.5%) | 51 (78.5%) |
| Total (Overall) | 216 (47.7%) | 237 (52.3%) |
Natural Resources, Construction and Maintenance Occupations
The most common Natural Resources, Construction and Maintenance occupations in New Washington are Installation, Maintenance & Repair (20 | 4.4%), Farming, Fishing & Forestry (17 | 3.7%), and Construction & Extraction (9 | 2.0%).
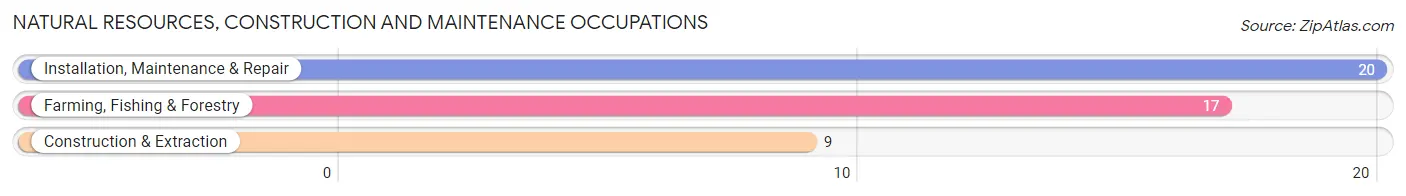
Natural Resources, Construction and Maintenance Occupations by Sex
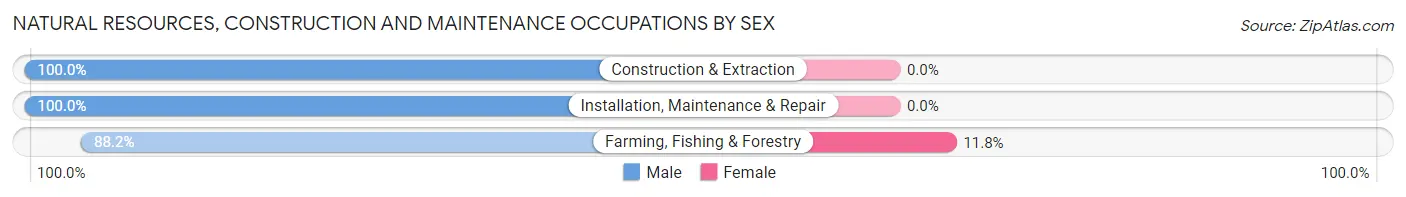
| Occupation | Male | Female |
| Farming, Fishing & Forestry | 15 (88.2%) | 2 (11.8%) |
| Construction & Extraction | 9 (100.0%) | 0 (0.0%) |
| Installation, Maintenance & Repair | 20 (100.0%) | 0 (0.0%) |
| Total (Category) | 44 (95.7%) | 2 (4.3%) |
| Total (Overall) | 216 (47.7%) | 237 (52.3%) |
Production, Transportation and Moving Occupations
The most common Production, Transportation and Moving occupations in New Washington are Production (62 | 13.7%), Material Moving (36 | 8.0%), and Transportation (16 | 3.5%).
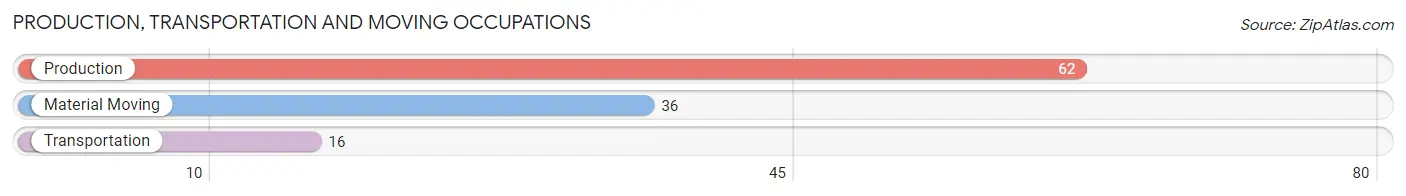
Production, Transportation and Moving Occupations by Sex
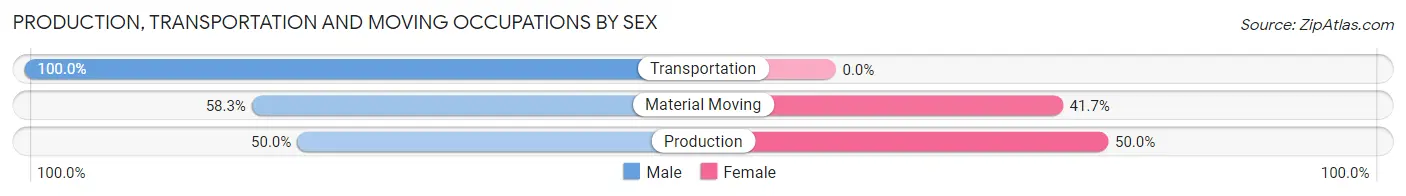
| Occupation | Male | Female |
| Production | 31 (50.0%) | 31 (50.0%) |
| Transportation | 16 (100.0%) | 0 (0.0%) |
| Material Moving | 21 (58.3%) | 15 (41.7%) |
| Total (Category) | 68 (59.7%) | 46 (40.4%) |
| Total (Overall) | 216 (47.7%) | 237 (52.3%) |
Employment Industries by Sex in New Washington
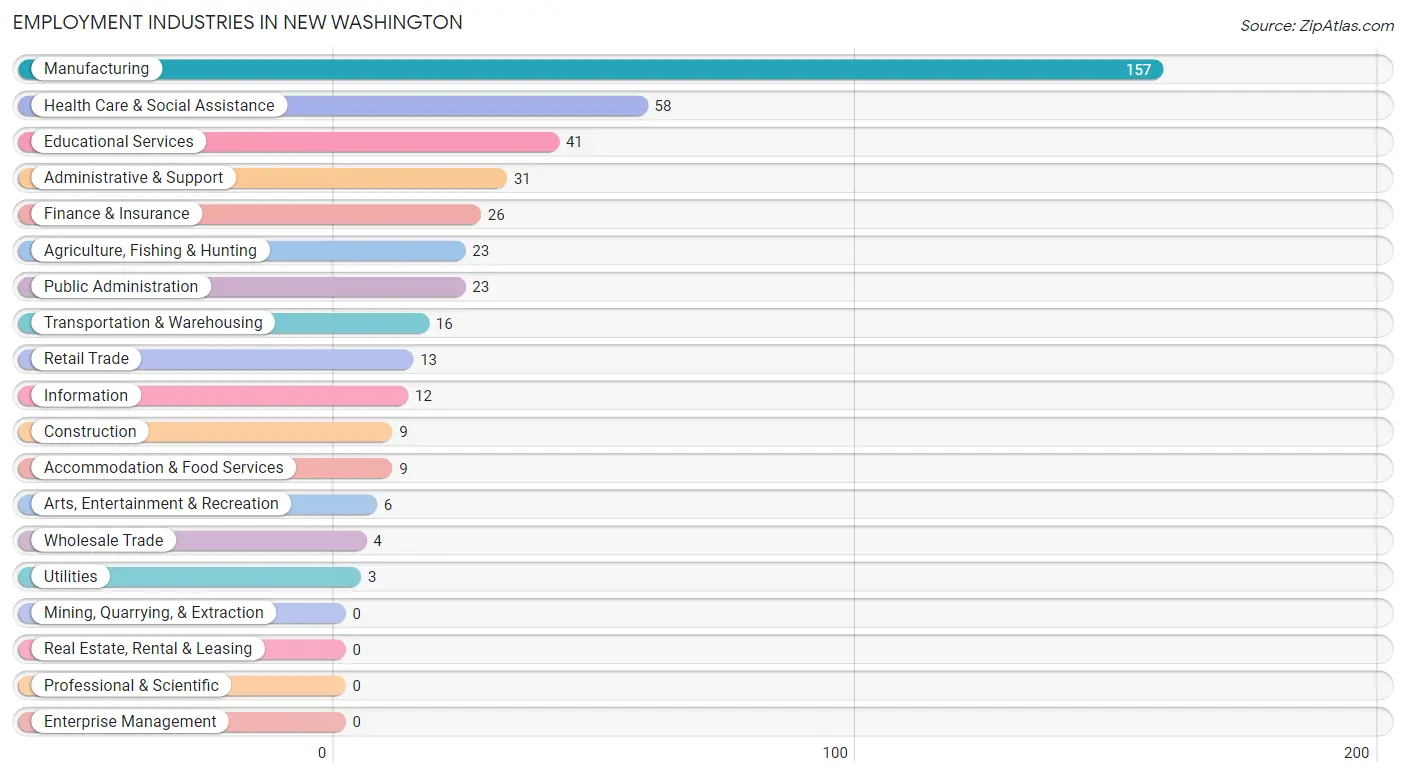
Employment Industries in New Washington
The major employment industries in New Washington include Manufacturing (157 | 34.7%), Health Care & Social Assistance (58 | 12.8%), Educational Services (41 | 9.0%), Administrative & Support (31 | 6.8%), and Finance & Insurance (26 | 5.7%).
Employment Industries by Sex in New Washington
The New Washington industries that see more men than women are Construction (100.0%), Transportation & Warehousing (100.0%), and Utilities (100.0%), whereas the industries that tend to have a higher number of women are Wholesale Trade (100.0%), Educational Services (92.7%), and Health Care & Social Assistance (84.5%).
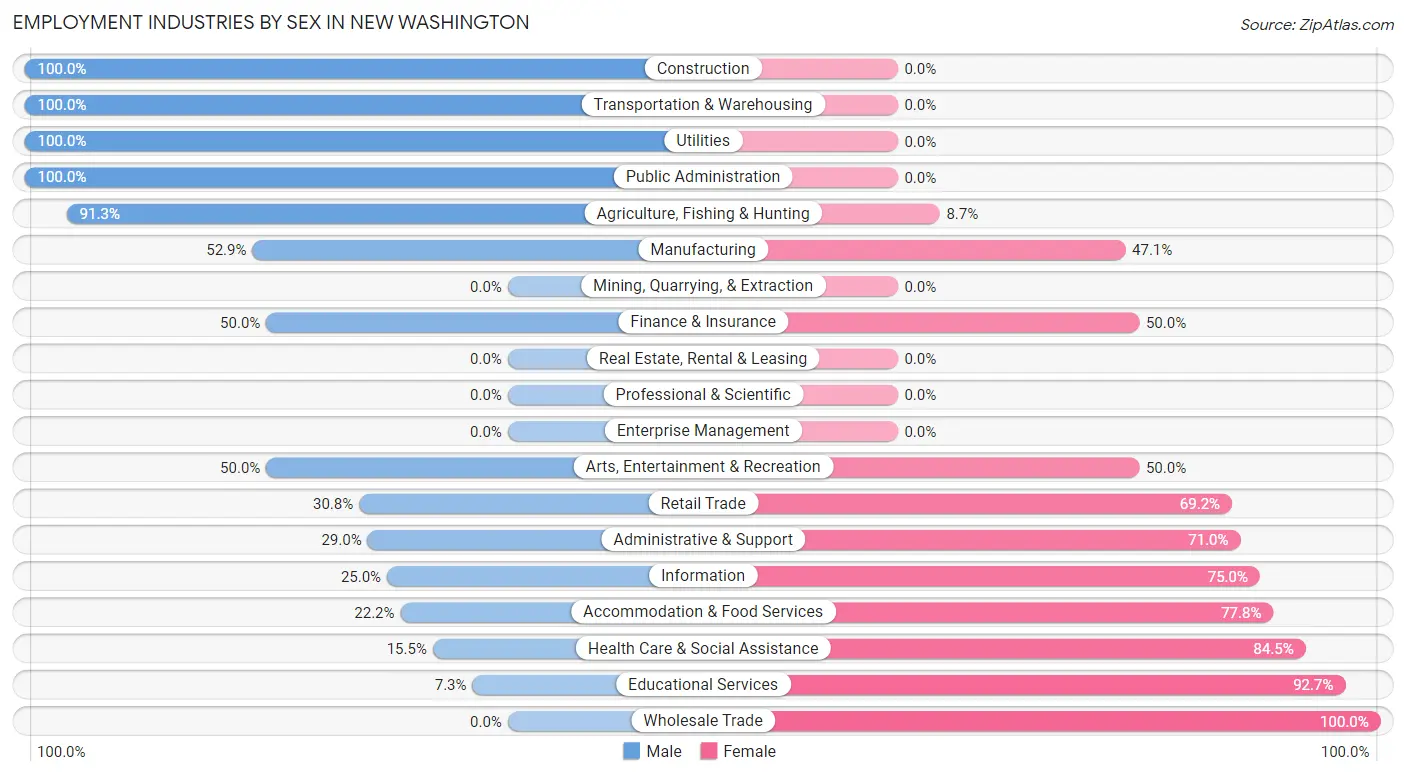
| Industry | Male | Female |
| Agriculture, Fishing & Hunting | 21 (91.3%) | 2 (8.7%) |
| Mining, Quarrying, & Extraction | 0 (0.0%) | 0 (0.0%) |
| Construction | 9 (100.0%) | 0 (0.0%) |
| Manufacturing | 83 (52.9%) | 74 (47.1%) |
| Wholesale Trade | 0 (0.0%) | 4 (100.0%) |
| Retail Trade | 4 (30.8%) | 9 (69.2%) |
| Transportation & Warehousing | 16 (100.0%) | 0 (0.0%) |
| Utilities | 3 (100.0%) | 0 (0.0%) |
| Information | 3 (25.0%) | 9 (75.0%) |
| Finance & Insurance | 13 (50.0%) | 13 (50.0%) |
| Real Estate, Rental & Leasing | 0 (0.0%) | 0 (0.0%) |
| Professional & Scientific | 0 (0.0%) | 0 (0.0%) |
| Enterprise Management | 0 (0.0%) | 0 (0.0%) |
| Administrative & Support | 9 (29.0%) | 22 (71.0%) |
| Educational Services | 3 (7.3%) | 38 (92.7%) |
| Health Care & Social Assistance | 9 (15.5%) | 49 (84.5%) |
| Arts, Entertainment & Recreation | 3 (50.0%) | 3 (50.0%) |
| Accommodation & Food Services | 2 (22.2%) | 7 (77.8%) |
| Public Administration | 23 (100.0%) | 0 (0.0%) |
| Total | 216 (47.7%) | 237 (52.3%) |
Education in New Washington
School Enrollment in New Washington
The most common levels of schooling among the 257 students in New Washington are elementary school (95 | 37.0%), high school (60 | 23.4%), and college / undergraduate (50 | 19.5%).
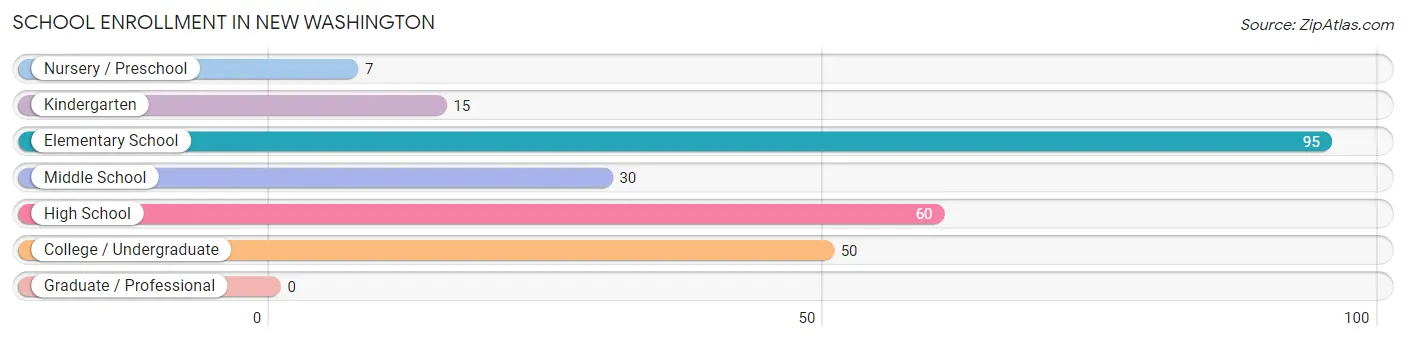
| School Level | # Students | % Students |
| Nursery / Preschool | 7 | 2.7% |
| Kindergarten | 15 | 5.8% |
| Elementary School | 95 | 37.0% |
| Middle School | 30 | 11.7% |
| High School | 60 | 23.4% |
| College / Undergraduate | 50 | 19.5% |
| Graduate / Professional | 0 | 0.0% |
| Total | 257 | 100.0% |
School Enrollment by Age by Funding Source in New Washington
Out of a total of 257 students who are enrolled in schools in New Washington, 14 (5.4%) attend a private institution, while the remaining 243 (94.6%) are enrolled in public schools. The age group of 35 years and over has the highest likelihood of being enrolled in private schools, with 2 (100.0% in the age bracket) enrolled. Conversely, the age group of 10 to 14 year olds has the lowest likelihood of being enrolled in a private school, with 48 (100.0% in the age bracket) attending a public institution.
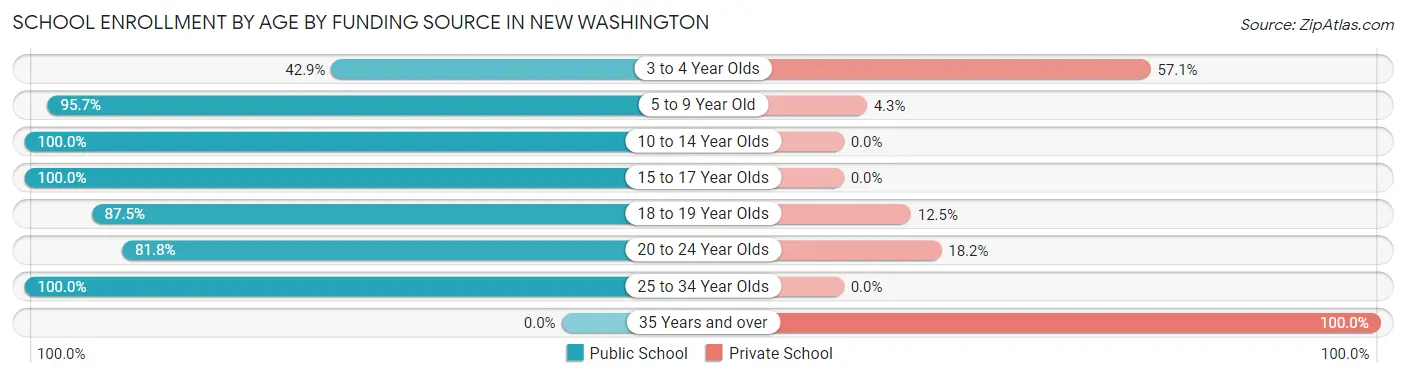
| Age Bracket | Public School | Private School |
| 3 to 4 Year Olds | 3 (42.9%) | 4 (57.1%) |
| 5 to 9 Year Old | 89 (95.7%) | 4 (4.3%) |
| 10 to 14 Year Olds | 48 (100.0%) | 0 (0.0%) |
| 15 to 17 Year Olds | 52 (100.0%) | 0 (0.0%) |
| 18 to 19 Year Olds | 14 (87.5%) | 2 (12.5%) |
| 20 to 24 Year Olds | 9 (81.8%) | 2 (18.2%) |
| 25 to 34 Year Olds | 28 (100.0%) | 0 (0.0%) |
| 35 Years and over | 0 (0.0%) | 2 (100.0%) |
| Total | 243 (94.6%) | 14 (5.4%) |
Educational Attainment by Field of Study in New Washington
Business (65 | 56.5%), education (23 | 20.0%), science & technology (9 | 7.8%), communications (6 | 5.2%), and arts & humanities (5 | 4.3%) are the most common fields of study among 115 individuals in New Washington who have obtained a bachelor's degree or higher.
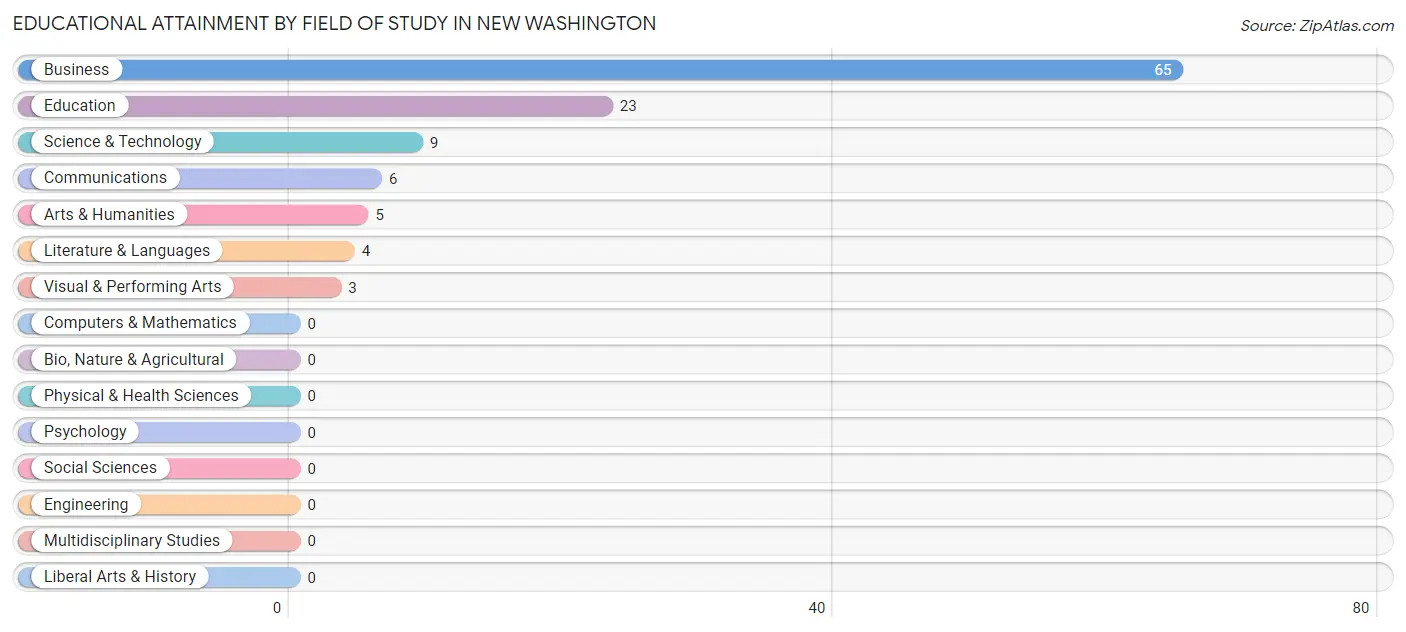
| Field of Study | # Graduates | % Graduates |
| Computers & Mathematics | 0 | 0.0% |
| Bio, Nature & Agricultural | 0 | 0.0% |
| Physical & Health Sciences | 0 | 0.0% |
| Psychology | 0 | 0.0% |
| Social Sciences | 0 | 0.0% |
| Engineering | 0 | 0.0% |
| Multidisciplinary Studies | 0 | 0.0% |
| Science & Technology | 9 | 7.8% |
| Business | 65 | 56.5% |
| Education | 23 | 20.0% |
| Literature & Languages | 4 | 3.5% |
| Liberal Arts & History | 0 | 0.0% |
| Visual & Performing Arts | 3 | 2.6% |
| Communications | 6 | 5.2% |
| Arts & Humanities | 5 | 4.3% |
| Total | 115 | 100.0% |
Transportation & Commute in New Washington
Vehicle Availability by Sex in New Washington
The most prevalent vehicle ownership categories in New Washington are males with 2 vehicles (87, accounting for 40.3%) and females with 2 vehicles (93, making up 37.7%).
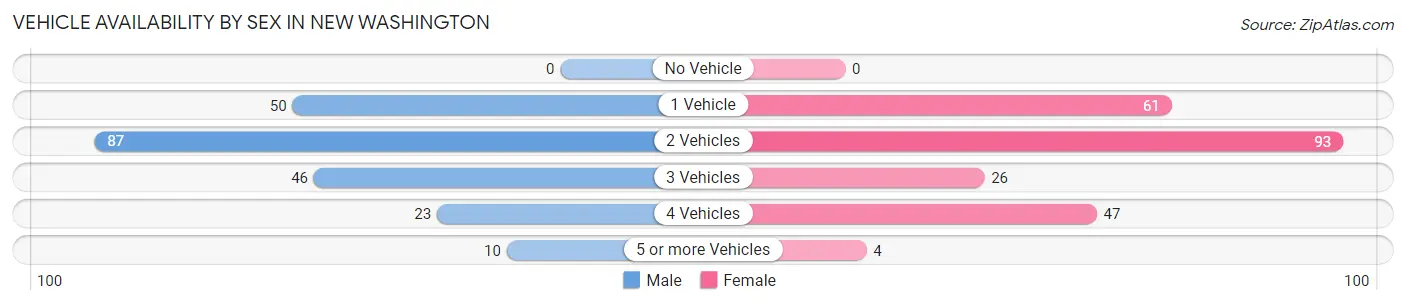
| Vehicles Available | Male | Female |
| No Vehicle | 0 (0.0%) | 0 (0.0%) |
| 1 Vehicle | 50 (23.2%) | 61 (26.4%) |
| 2 Vehicles | 87 (40.3%) | 93 (40.3%) |
| 3 Vehicles | 46 (21.3%) | 26 (11.3%) |
| 4 Vehicles | 23 (10.6%) | 47 (20.3%) |
| 5 or more Vehicles | 10 (4.6%) | 4 (1.7%) |
| Total | 216 (100.0%) | 231 (100.0%) |
Commute Time in New Washington
The most frequently occuring commute durations in New Washington are 20 to 24 minutes (89 commuters, 20.5%), less than 5 minutes (64 commuters, 14.7%), and 25 to 29 minutes (62 commuters, 14.2%).
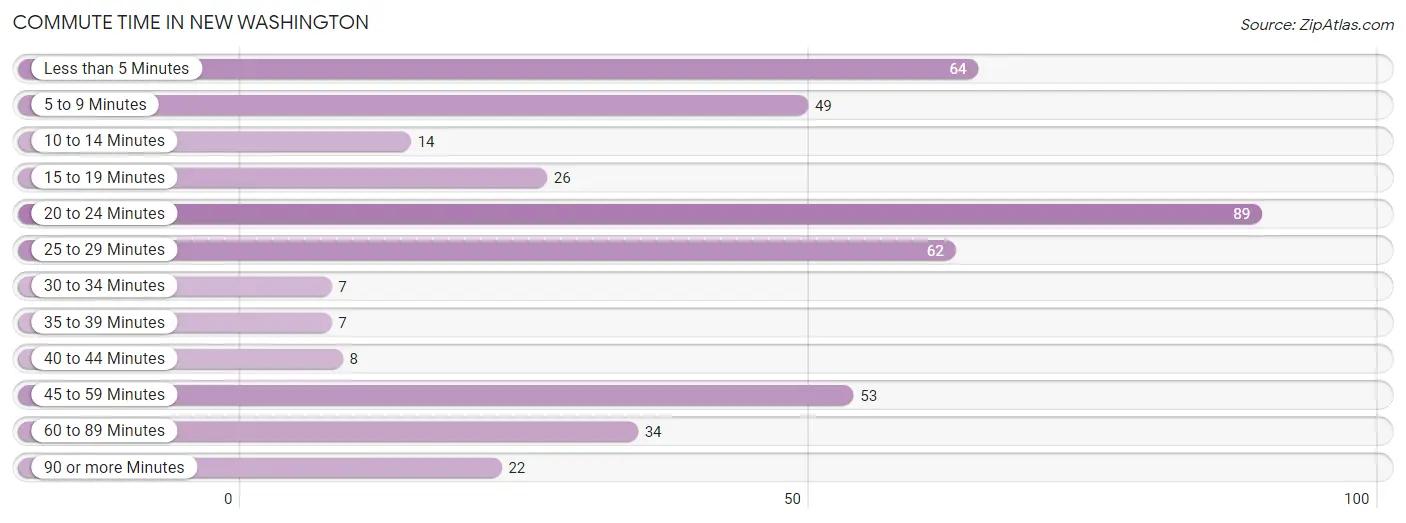
| Commute Time | # Commuters | % Commuters |
| Less than 5 Minutes | 64 | 14.7% |
| 5 to 9 Minutes | 49 | 11.3% |
| 10 to 14 Minutes | 14 | 3.2% |
| 15 to 19 Minutes | 26 | 6.0% |
| 20 to 24 Minutes | 89 | 20.5% |
| 25 to 29 Minutes | 62 | 14.2% |
| 30 to 34 Minutes | 7 | 1.6% |
| 35 to 39 Minutes | 7 | 1.6% |
| 40 to 44 Minutes | 8 | 1.8% |
| 45 to 59 Minutes | 53 | 12.2% |
| 60 to 89 Minutes | 34 | 7.8% |
| 90 or more Minutes | 22 | 5.1% |
Commute Time by Sex in New Washington
The most common commute times in New Washington are 5 to 9 minutes (34 commuters, 16.0%) for males and 20 to 24 minutes (58 commuters, 26.0%) for females.
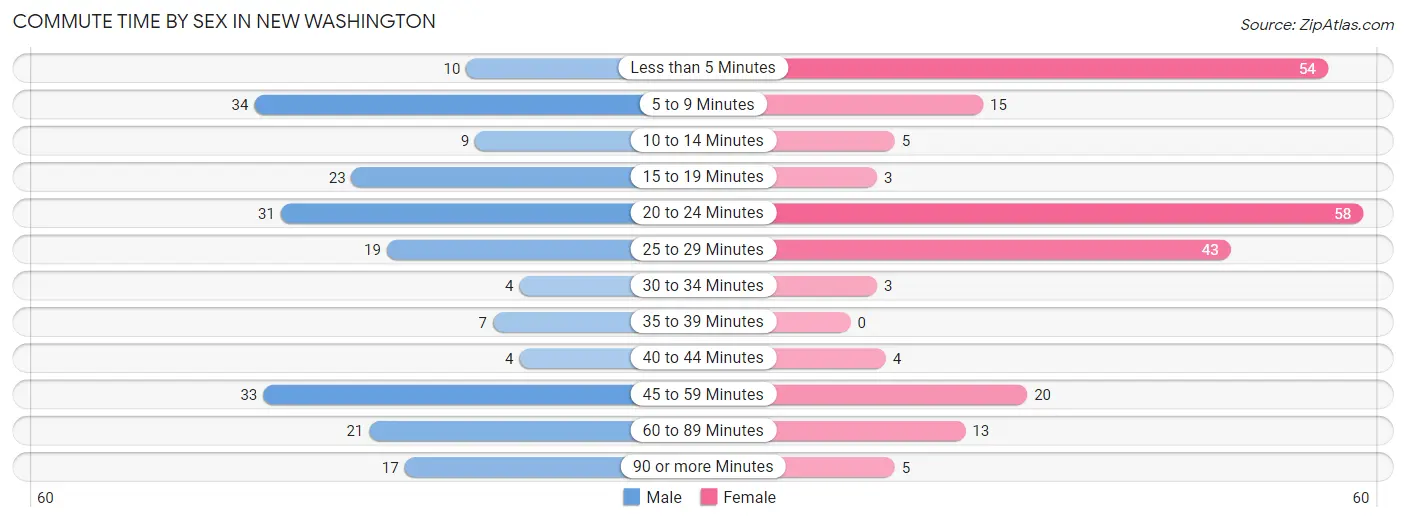
| Commute Time | Male | Female |
| Less than 5 Minutes | 10 (4.7%) | 54 (24.2%) |
| 5 to 9 Minutes | 34 (16.0%) | 15 (6.7%) |
| 10 to 14 Minutes | 9 (4.3%) | 5 (2.2%) |
| 15 to 19 Minutes | 23 (10.8%) | 3 (1.3%) |
| 20 to 24 Minutes | 31 (14.6%) | 58 (26.0%) |
| 25 to 29 Minutes | 19 (9.0%) | 43 (19.3%) |
| 30 to 34 Minutes | 4 (1.9%) | 3 (1.3%) |
| 35 to 39 Minutes | 7 (3.3%) | 0 (0.0%) |
| 40 to 44 Minutes | 4 (1.9%) | 4 (1.8%) |
| 45 to 59 Minutes | 33 (15.6%) | 20 (9.0%) |
| 60 to 89 Minutes | 21 (9.9%) | 13 (5.8%) |
| 90 or more Minutes | 17 (8.0%) | 5 (2.2%) |
Time of Departure to Work by Sex in New Washington
The most frequent times of departure to work in New Washington are 4:00 PM to 11:59 PM (35, 16.5%) for males and 7:00 AM to 7:29 AM (56, 25.1%) for females.
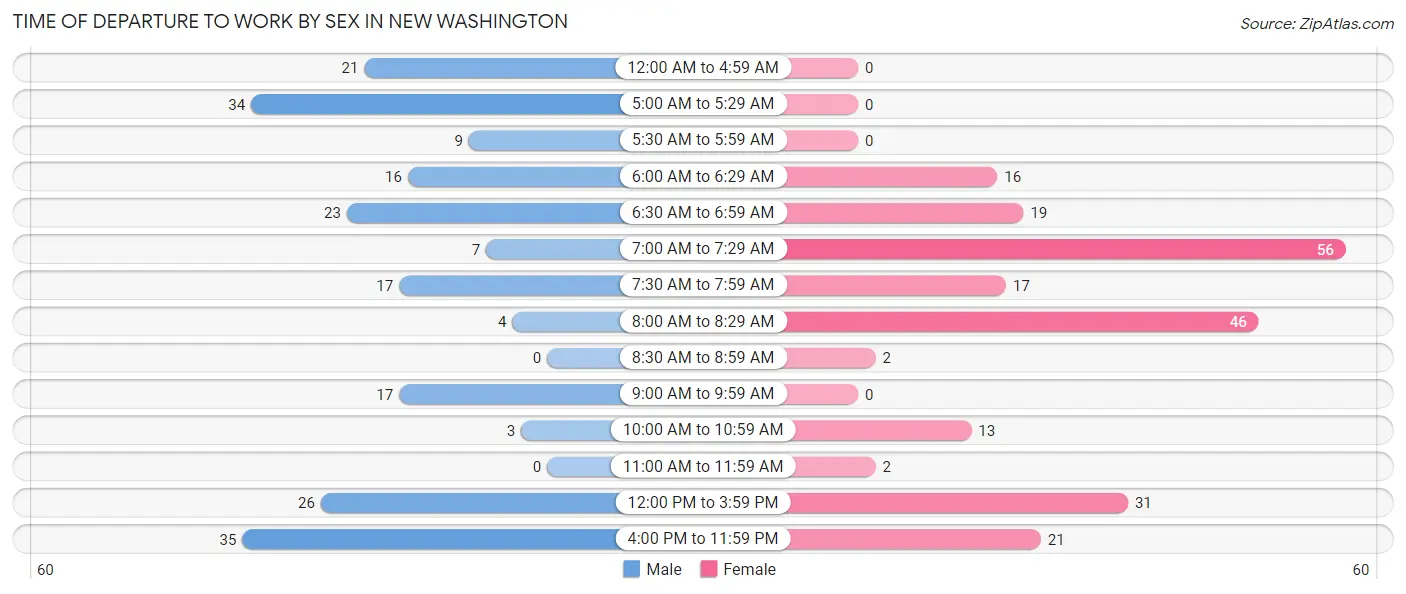
| Time of Departure | Male | Female |
| 12:00 AM to 4:59 AM | 21 (9.9%) | 0 (0.0%) |
| 5:00 AM to 5:29 AM | 34 (16.0%) | 0 (0.0%) |
| 5:30 AM to 5:59 AM | 9 (4.3%) | 0 (0.0%) |
| 6:00 AM to 6:29 AM | 16 (7.5%) | 16 (7.2%) |
| 6:30 AM to 6:59 AM | 23 (10.8%) | 19 (8.5%) |
| 7:00 AM to 7:29 AM | 7 (3.3%) | 56 (25.1%) |
| 7:30 AM to 7:59 AM | 17 (8.0%) | 17 (7.6%) |
| 8:00 AM to 8:29 AM | 4 (1.9%) | 46 (20.6%) |
| 8:30 AM to 8:59 AM | 0 (0.0%) | 2 (0.9%) |
| 9:00 AM to 9:59 AM | 17 (8.0%) | 0 (0.0%) |
| 10:00 AM to 10:59 AM | 3 (1.4%) | 13 (5.8%) |
| 11:00 AM to 11:59 AM | 0 (0.0%) | 2 (0.9%) |
| 12:00 PM to 3:59 PM | 26 (12.3%) | 31 (13.9%) |
| 4:00 PM to 11:59 PM | 35 (16.5%) | 21 (9.4%) |
| Total | 212 (100.0%) | 223 (100.0%) |
Housing Occupancy in New Washington
Occupancy by Ownership in New Washington
Of the total 387 dwellings in New Washington, owner-occupied units account for 261 (67.4%), while renter-occupied units make up 126 (32.6%).
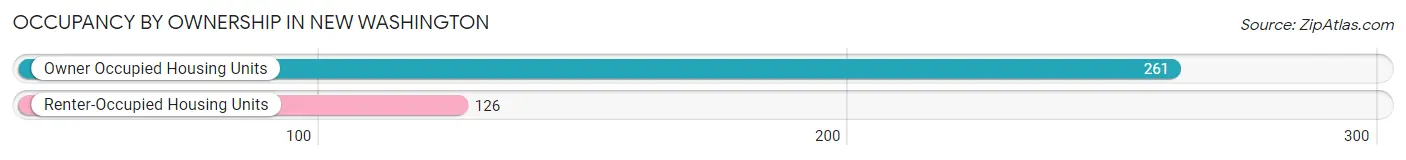
| Occupancy | # Housing Units | % Housing Units |
| Owner Occupied Housing Units | 261 | 67.4% |
| Renter-Occupied Housing Units | 126 | 32.6% |
| Total Occupied Housing Units | 387 | 100.0% |
Occupancy by Household Size in New Washington
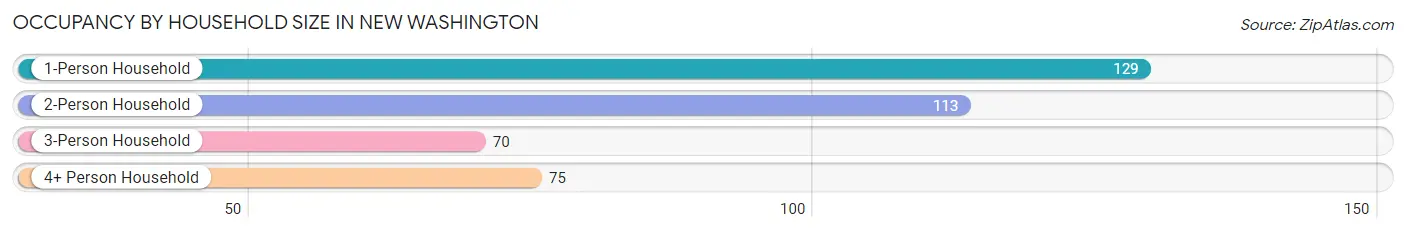
| Household Size | # Housing Units | % Housing Units |
| 1-Person Household | 129 | 33.3% |
| 2-Person Household | 113 | 29.2% |
| 3-Person Household | 70 | 18.1% |
| 4+ Person Household | 75 | 19.4% |
| Total Housing Units | 387 | 100.0% |
Occupancy by Ownership by Household Size in New Washington
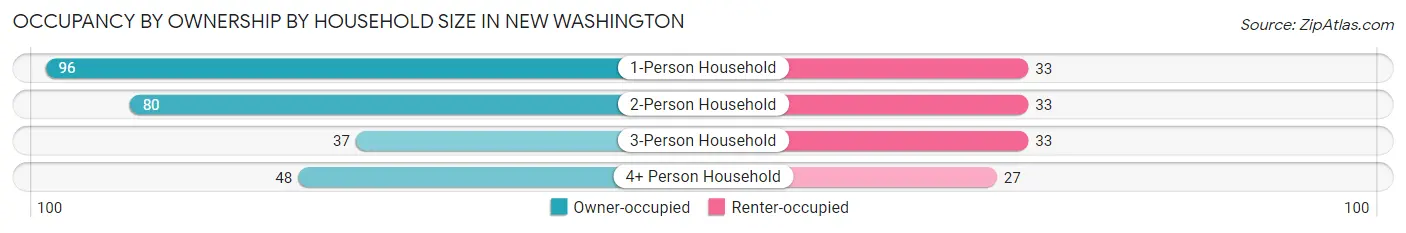
| Household Size | Owner-occupied | Renter-occupied |
| 1-Person Household | 96 (74.4%) | 33 (25.6%) |
| 2-Person Household | 80 (70.8%) | 33 (29.2%) |
| 3-Person Household | 37 (52.9%) | 33 (47.1%) |
| 4+ Person Household | 48 (64.0%) | 27 (36.0%) |
| Total Housing Units | 261 (67.4%) | 126 (32.6%) |
Occupancy by Educational Attainment in New Washington
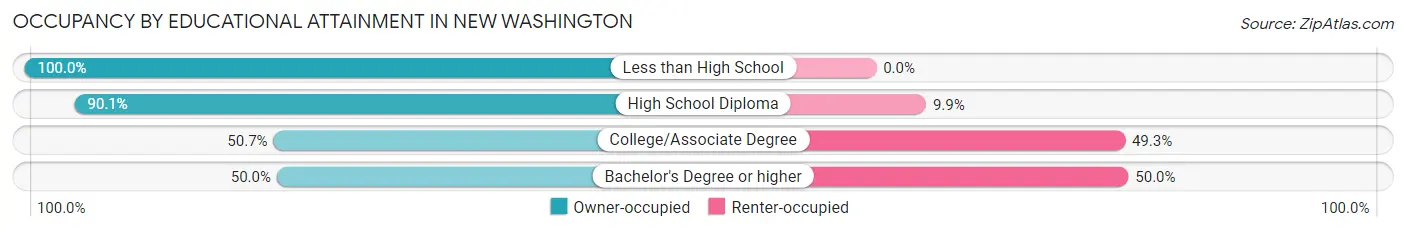
| Household Size | Owner-occupied | Renter-occupied |
| Less than High School | 3 (100.0%) | 0 (0.0%) |
| High School Diploma | 146 (90.1%) | 16 (9.9%) |
| College/Associate Degree | 76 (50.7%) | 74 (49.3%) |
| Bachelor's Degree or higher | 36 (50.0%) | 36 (50.0%) |
Occupancy by Age of Householder in New Washington
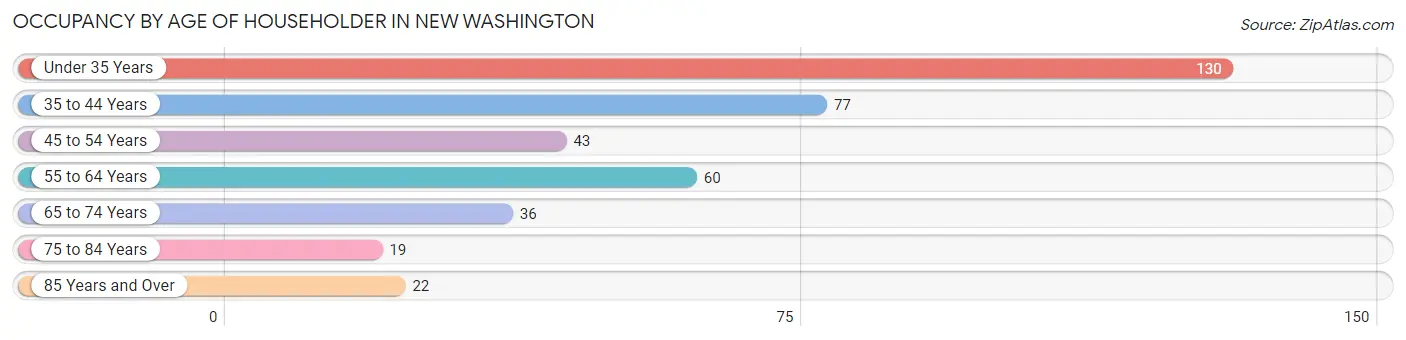
| Age Bracket | # Households | % Households |
| Under 35 Years | 130 | 33.6% |
| 35 to 44 Years | 77 | 19.9% |
| 45 to 54 Years | 43 | 11.1% |
| 55 to 64 Years | 60 | 15.5% |
| 65 to 74 Years | 36 | 9.3% |
| 75 to 84 Years | 19 | 4.9% |
| 85 Years and Over | 22 | 5.7% |
| Total | 387 | 100.0% |
Housing Finances in New Washington
Median Income by Occupancy in New Washington
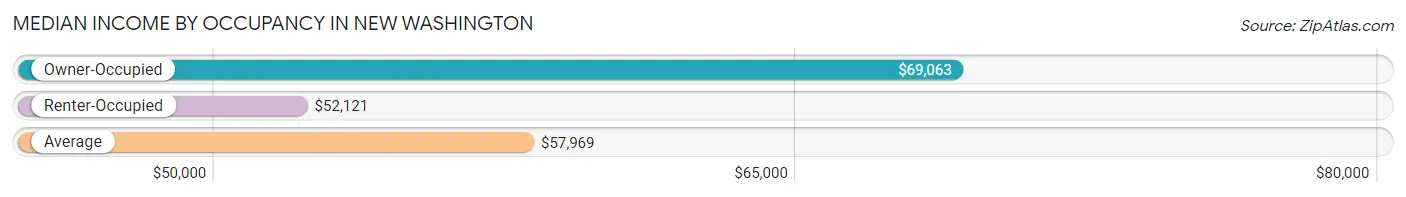
| Occupancy Type | # Households | Median Income |
| Owner-Occupied | 261 (67.4%) | $69,063 |
| Renter-Occupied | 126 (32.6%) | $52,121 |
| Average | 387 (100.0%) | $57,969 |
Occupancy by Householder Income Bracket in New Washington
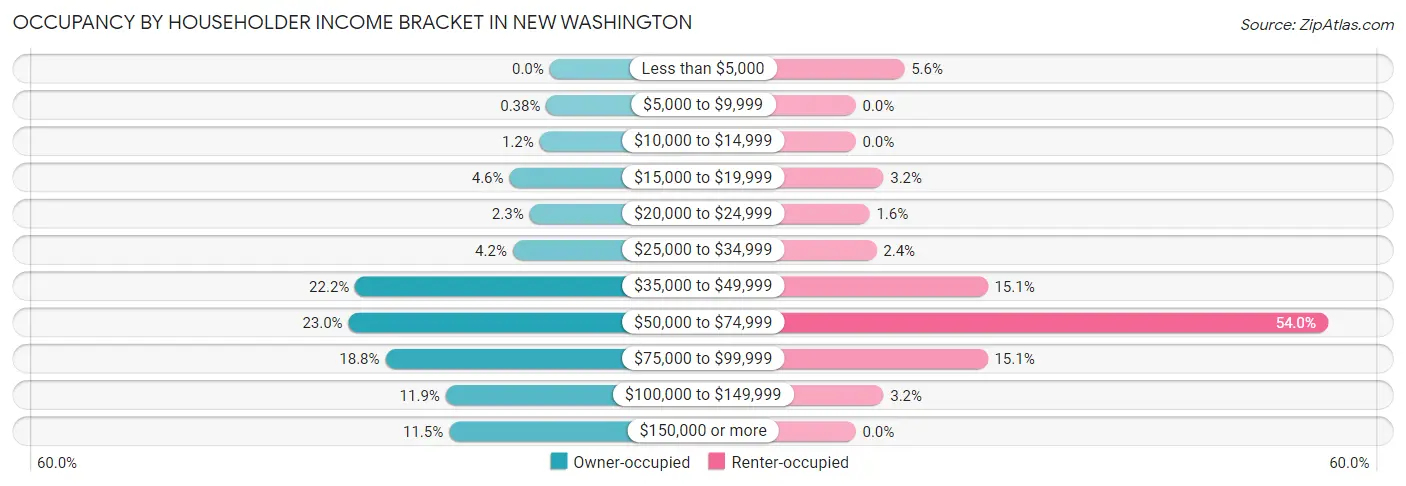
| Income Bracket | Owner-occupied | Renter-occupied |
| Less than $5,000 | 0 (0.0%) | 7 (5.6%) |
| $5,000 to $9,999 | 1 (0.4%) | 0 (0.0%) |
| $10,000 to $14,999 | 3 (1.1%) | 0 (0.0%) |
| $15,000 to $19,999 | 12 (4.6%) | 4 (3.2%) |
| $20,000 to $24,999 | 6 (2.3%) | 2 (1.6%) |
| $25,000 to $34,999 | 11 (4.2%) | 3 (2.4%) |
| $35,000 to $49,999 | 58 (22.2%) | 19 (15.1%) |
| $50,000 to $74,999 | 60 (23.0%) | 68 (54.0%) |
| $75,000 to $99,999 | 49 (18.8%) | 19 (15.1%) |
| $100,000 to $149,999 | 31 (11.9%) | 4 (3.2%) |
| $150,000 or more | 30 (11.5%) | 0 (0.0%) |
| Total | 261 (100.0%) | 126 (100.0%) |
Monthly Housing Cost Tiers in New Washington
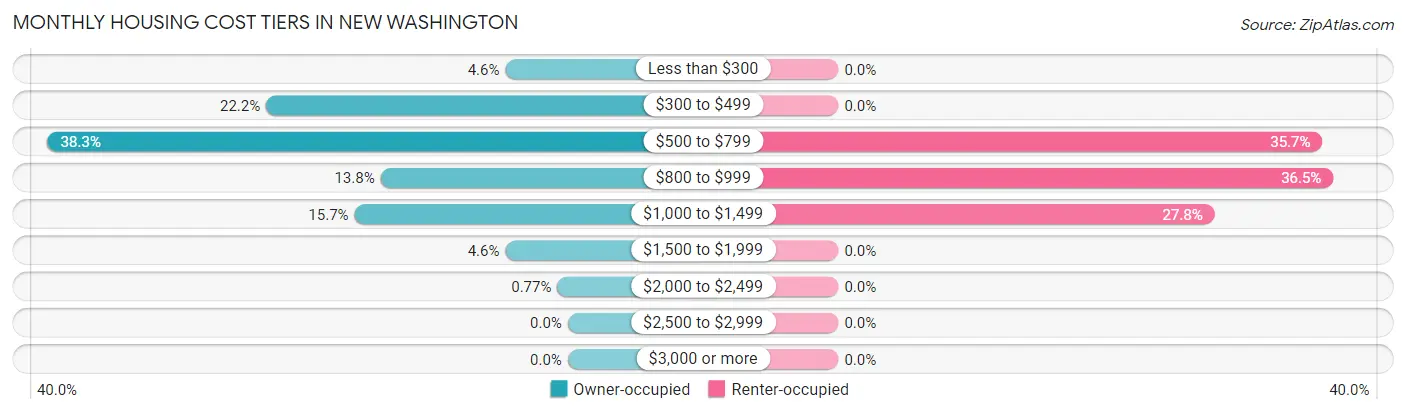
| Monthly Cost | Owner-occupied | Renter-occupied |
| Less than $300 | 12 (4.6%) | 0 (0.0%) |
| $300 to $499 | 58 (22.2%) | 0 (0.0%) |
| $500 to $799 | 100 (38.3%) | 45 (35.7%) |
| $800 to $999 | 36 (13.8%) | 46 (36.5%) |
| $1,000 to $1,499 | 41 (15.7%) | 35 (27.8%) |
| $1,500 to $1,999 | 12 (4.6%) | 0 (0.0%) |
| $2,000 to $2,499 | 2 (0.8%) | 0 (0.0%) |
| $2,500 to $2,999 | 0 (0.0%) | 0 (0.0%) |
| $3,000 or more | 0 (0.0%) | 0 (0.0%) |
| Total | 261 (100.0%) | 126 (100.0%) |
Physical Housing Characteristics in New Washington
Housing Structures in New Washington
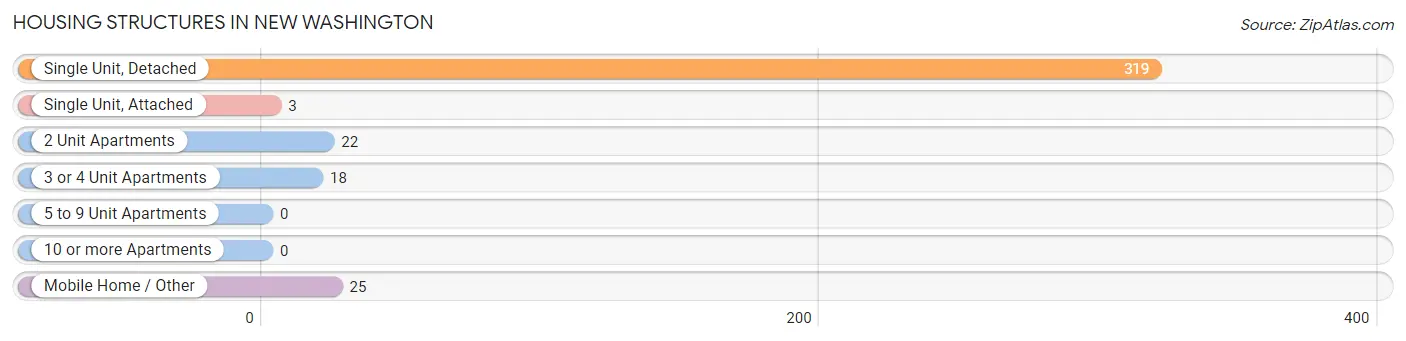
| Structure Type | # Housing Units | % Housing Units |
| Single Unit, Detached | 319 | 82.4% |
| Single Unit, Attached | 3 | 0.8% |
| 2 Unit Apartments | 22 | 5.7% |
| 3 or 4 Unit Apartments | 18 | 4.6% |
| 5 to 9 Unit Apartments | 0 | 0.0% |
| 10 or more Apartments | 0 | 0.0% |
| Mobile Home / Other | 25 | 6.5% |
| Total | 387 | 100.0% |
Housing Structures by Occupancy in New Washington
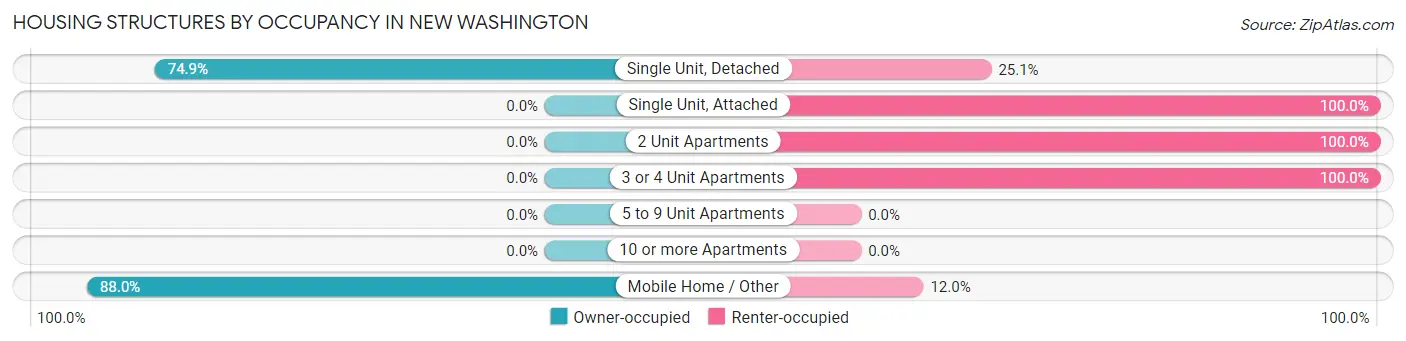
| Structure Type | Owner-occupied | Renter-occupied |
| Single Unit, Detached | 239 (74.9%) | 80 (25.1%) |
| Single Unit, Attached | 0 (0.0%) | 3 (100.0%) |
| 2 Unit Apartments | 0 (0.0%) | 22 (100.0%) |
| 3 or 4 Unit Apartments | 0 (0.0%) | 18 (100.0%) |
| 5 to 9 Unit Apartments | 0 (0.0%) | 0 (0.0%) |
| 10 or more Apartments | 0 (0.0%) | 0 (0.0%) |
| Mobile Home / Other | 22 (88.0%) | 3 (12.0%) |
| Total | 261 (67.4%) | 126 (32.6%) |
Housing Structures by Number of Rooms in New Washington
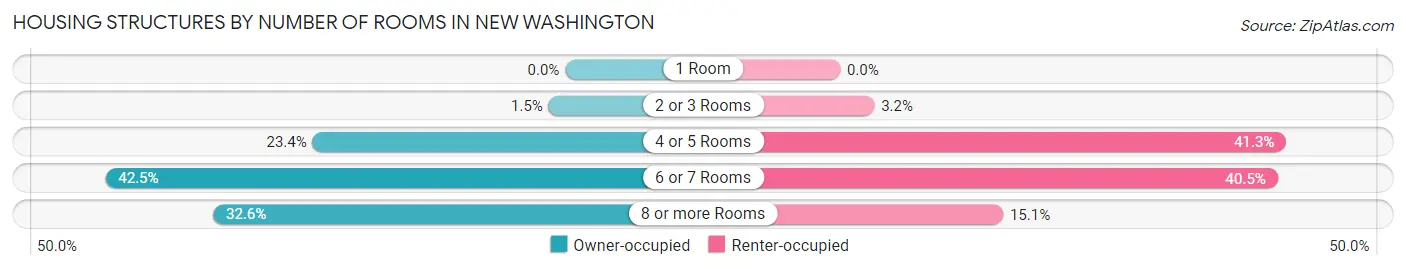
| Number of Rooms | Owner-occupied | Renter-occupied |
| 1 Room | 0 (0.0%) | 0 (0.0%) |
| 2 or 3 Rooms | 4 (1.5%) | 4 (3.2%) |
| 4 or 5 Rooms | 61 (23.4%) | 52 (41.3%) |
| 6 or 7 Rooms | 111 (42.5%) | 51 (40.5%) |
| 8 or more Rooms | 85 (32.6%) | 19 (15.1%) |
| Total | 261 (100.0%) | 126 (100.0%) |
Housing Structure by Heating Type in New Washington
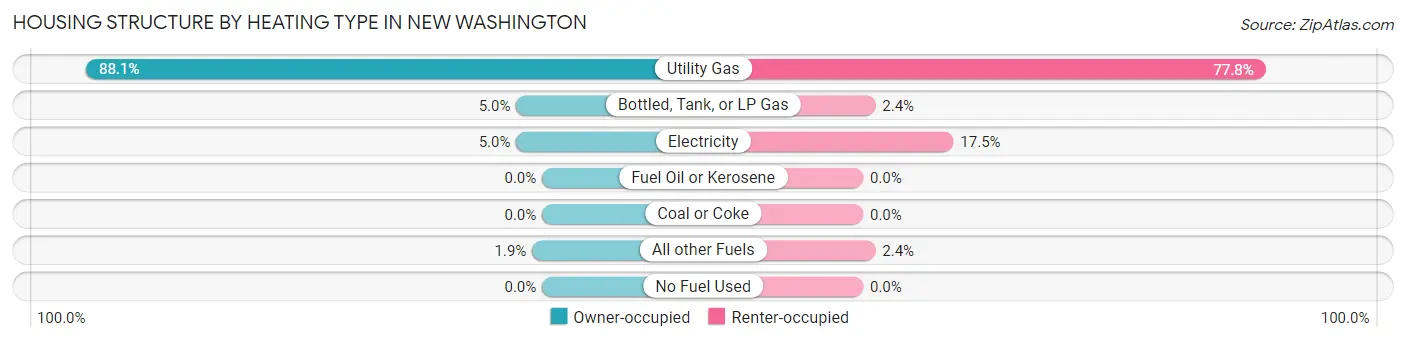
| Heating Type | Owner-occupied | Renter-occupied |
| Utility Gas | 230 (88.1%) | 98 (77.8%) |
| Bottled, Tank, or LP Gas | 13 (5.0%) | 3 (2.4%) |
| Electricity | 13 (5.0%) | 22 (17.5%) |
| Fuel Oil or Kerosene | 0 (0.0%) | 0 (0.0%) |
| Coal or Coke | 0 (0.0%) | 0 (0.0%) |
| All other Fuels | 5 (1.9%) | 3 (2.4%) |
| No Fuel Used | 0 (0.0%) | 0 (0.0%) |
| Total | 261 (100.0%) | 126 (100.0%) |
Household Vehicle Usage in New Washington
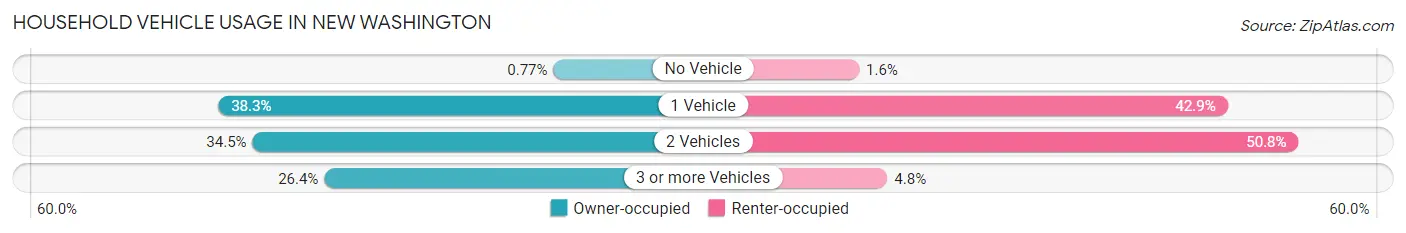
| Vehicles per Household | Owner-occupied | Renter-occupied |
| No Vehicle | 2 (0.8%) | 2 (1.6%) |
| 1 Vehicle | 100 (38.3%) | 54 (42.9%) |
| 2 Vehicles | 90 (34.5%) | 64 (50.8%) |
| 3 or more Vehicles | 69 (26.4%) | 6 (4.8%) |
| Total | 261 (100.0%) | 126 (100.0%) |
Real Estate & Mortgages in New Washington
Real Estate and Mortgage Overview in New Washington
| Characteristic | Without Mortgage | With Mortgage |
| Housing Units | 131 | 130 |
| Median Property Value | $97,300 | $112,100 |
| Median Household Income | $57,656 | $19 |
| Monthly Housing Costs | $501 | $0 |
| Real Estate Taxes | $1,036 | $28 |
Property Value by Mortgage Status in New Washington
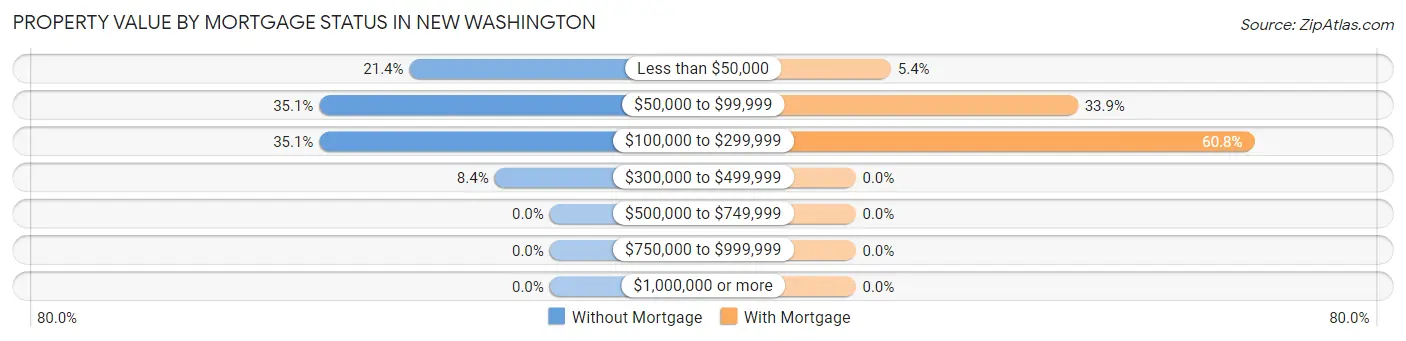
| Property Value | Without Mortgage | With Mortgage |
| Less than $50,000 | 28 (21.4%) | 7 (5.4%) |
| $50,000 to $99,999 | 46 (35.1%) | 44 (33.9%) |
| $100,000 to $299,999 | 46 (35.1%) | 79 (60.8%) |
| $300,000 to $499,999 | 11 (8.4%) | 0 (0.0%) |
| $500,000 to $749,999 | 0 (0.0%) | 0 (0.0%) |
| $750,000 to $999,999 | 0 (0.0%) | 0 (0.0%) |
| $1,000,000 or more | 0 (0.0%) | 0 (0.0%) |
| Total | 131 (100.0%) | 130 (100.0%) |
Household Income by Mortgage Status in New Washington
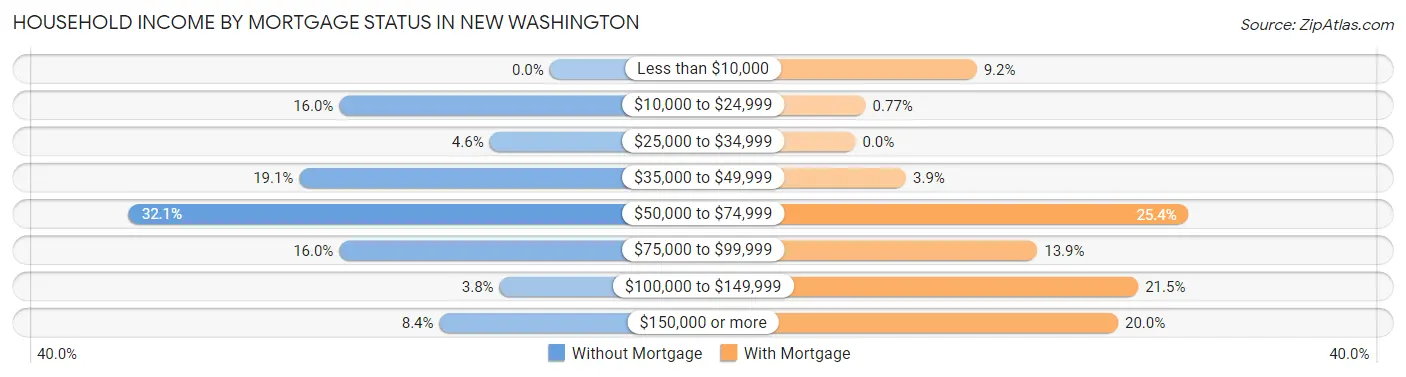
| Household Income | Without Mortgage | With Mortgage |
| Less than $10,000 | 0 (0.0%) | 12 (9.2%) |
| $10,000 to $24,999 | 21 (16.0%) | 1 (0.8%) |
| $25,000 to $34,999 | 6 (4.6%) | 0 (0.0%) |
| $35,000 to $49,999 | 25 (19.1%) | 5 (3.8%) |
| $50,000 to $74,999 | 42 (32.1%) | 33 (25.4%) |
| $75,000 to $99,999 | 21 (16.0%) | 18 (13.9%) |
| $100,000 to $149,999 | 5 (3.8%) | 28 (21.5%) |
| $150,000 or more | 11 (8.4%) | 26 (20.0%) |
| Total | 131 (100.0%) | 130 (100.0%) |
Property Value to Household Income Ratio in New Washington
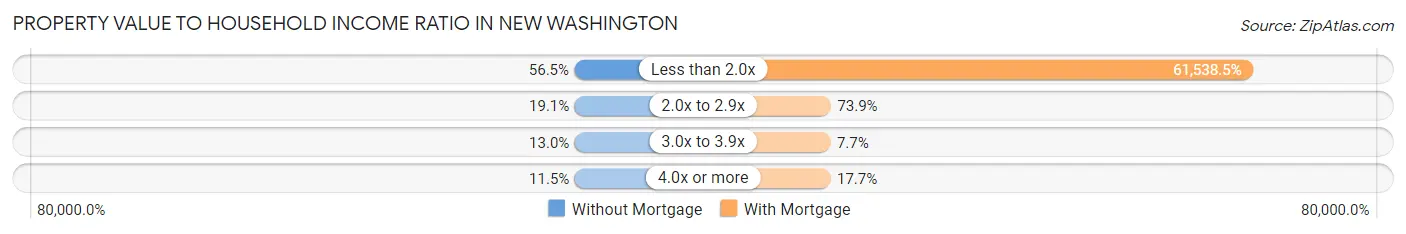
| Value-to-Income Ratio | Without Mortgage | With Mortgage |
| Less than 2.0x | 74 (56.5%) | 80,000 (61,538.5%) |
| 2.0x to 2.9x | 25 (19.1%) | 96 (73.9%) |
| 3.0x to 3.9x | 17 (13.0%) | 10 (7.7%) |
| 4.0x or more | 15 (11.5%) | 23 (17.7%) |
| Total | 131 (100.0%) | 130 (100.0%) |
Real Estate Taxes by Mortgage Status in New Washington
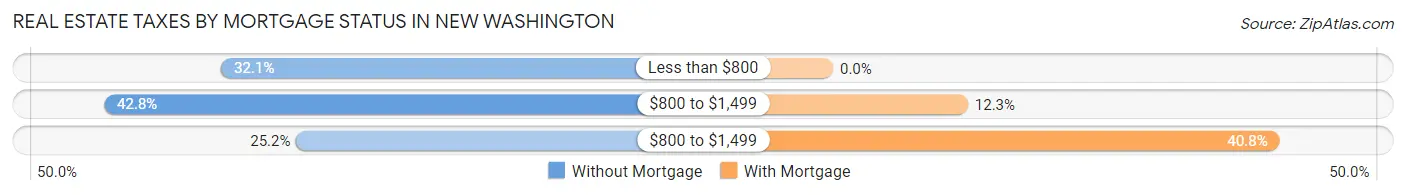
| Property Taxes | Without Mortgage | With Mortgage |
| Less than $800 | 42 (32.1%) | 0 (0.0%) |
| $800 to $1,499 | 56 (42.7%) | 16 (12.3%) |
| $800 to $1,499 | 33 (25.2%) | 53 (40.8%) |
| Total | 131 (100.0%) | 130 (100.0%) |
Health & Disability in New Washington
Health Insurance Coverage by Age in New Washington
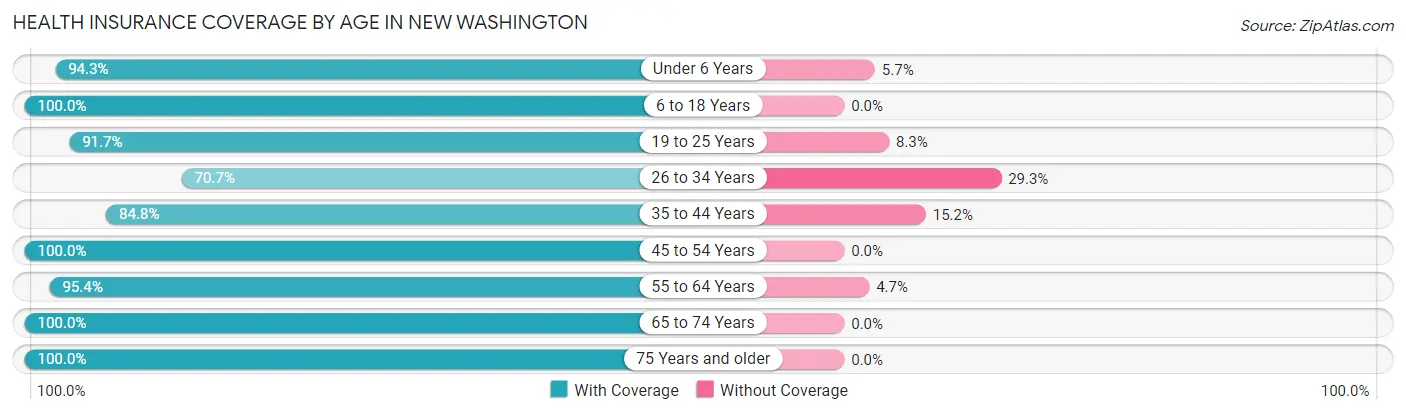
| Age Bracket | With Coverage | Without Coverage |
| Under 6 Years | 66 (94.3%) | 4 (5.7%) |
| 6 to 18 Years | 189 (100.0%) | 0 (0.0%) |
| 19 to 25 Years | 44 (91.7%) | 4 (8.3%) |
| 26 to 34 Years | 133 (70.7%) | 55 (29.3%) |
| 35 to 44 Years | 106 (84.8%) | 19 (15.2%) |
| 45 to 54 Years | 75 (100.0%) | 0 (0.0%) |
| 55 to 64 Years | 82 (95.4%) | 4 (4.6%) |
| 65 to 74 Years | 64 (100.0%) | 0 (0.0%) |
| 75 Years and older | 55 (100.0%) | 0 (0.0%) |
| Total | 814 (90.4%) | 86 (9.6%) |
Health Insurance Coverage by Citizenship Status in New Washington
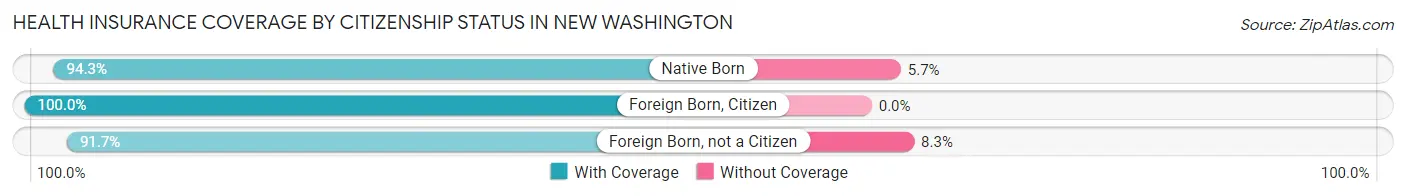
| Citizenship Status | With Coverage | Without Coverage |
| Native Born | 66 (94.3%) | 4 (5.7%) |
| Foreign Born, Citizen | 189 (100.0%) | 0 (0.0%) |
| Foreign Born, not a Citizen | 44 (91.7%) | 4 (8.3%) |
Health Insurance Coverage by Household Income in New Washington
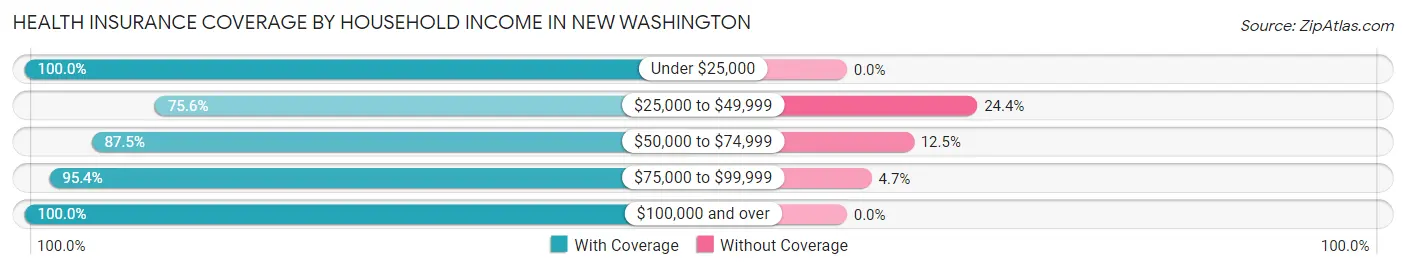
| Household Income | With Coverage | Without Coverage |
| Under $25,000 | 39 (100.0%) | 0 (0.0%) |
| $25,000 to $49,999 | 133 (75.6%) | 43 (24.4%) |
| $50,000 to $74,999 | 244 (87.5%) | 35 (12.5%) |
| $75,000 to $99,999 | 164 (95.4%) | 8 (4.6%) |
| $100,000 and over | 234 (100.0%) | 0 (0.0%) |
Public vs Private Health Insurance Coverage by Age in New Washington
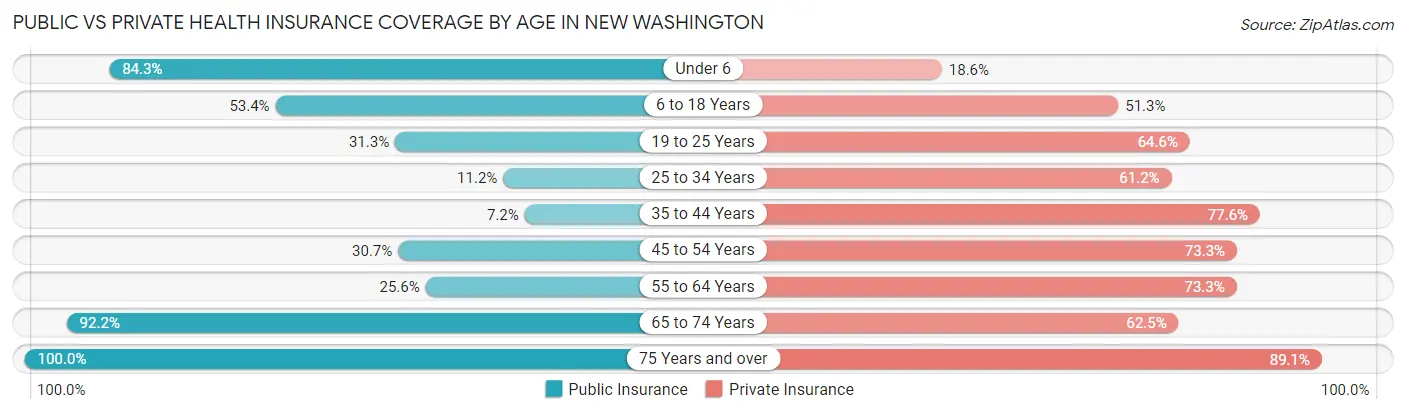
| Age Bracket | Public Insurance | Private Insurance |
| Under 6 | 59 (84.3%) | 13 (18.6%) |
| 6 to 18 Years | 101 (53.4%) | 97 (51.3%) |
| 19 to 25 Years | 15 (31.2%) | 31 (64.6%) |
| 25 to 34 Years | 21 (11.2%) | 115 (61.2%) |
| 35 to 44 Years | 9 (7.2%) | 97 (77.6%) |
| 45 to 54 Years | 23 (30.7%) | 55 (73.3%) |
| 55 to 64 Years | 22 (25.6%) | 63 (73.3%) |
| 65 to 74 Years | 59 (92.2%) | 40 (62.5%) |
| 75 Years and over | 55 (100.0%) | 49 (89.1%) |
| Total | 364 (40.4%) | 560 (62.2%) |
Disability Status by Sex by Age in New Washington
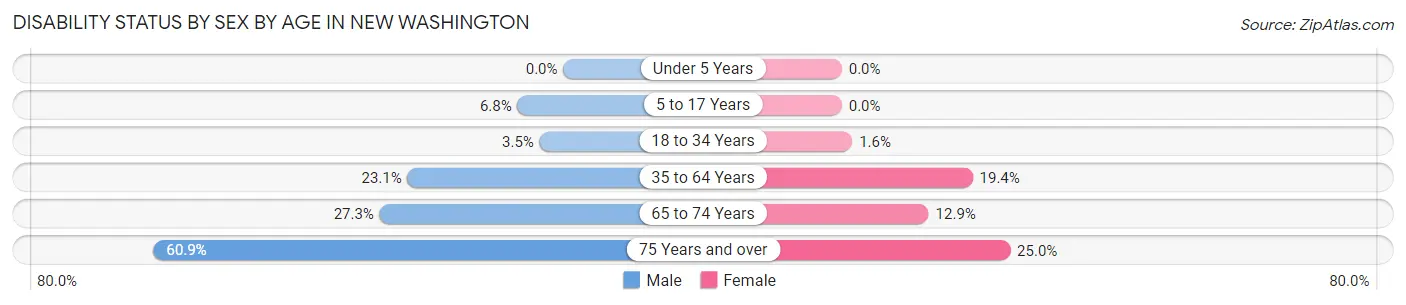
| Age Bracket | Male | Female |
| Under 5 Years | 0 (0.0%) | 0 (0.0%) |
| 5 to 17 Years | 10 (6.8%) | 0 (0.0%) |
| 18 to 34 Years | 4 (3.5%) | 2 (1.5%) |
| 35 to 64 Years | 34 (23.1%) | 27 (19.4%) |
| 65 to 74 Years | 9 (27.3%) | 4 (12.9%) |
| 75 Years and over | 14 (60.9%) | 8 (25.0%) |
Disability Class by Sex by Age in New Washington
Disability Class: Hearing Difficulty
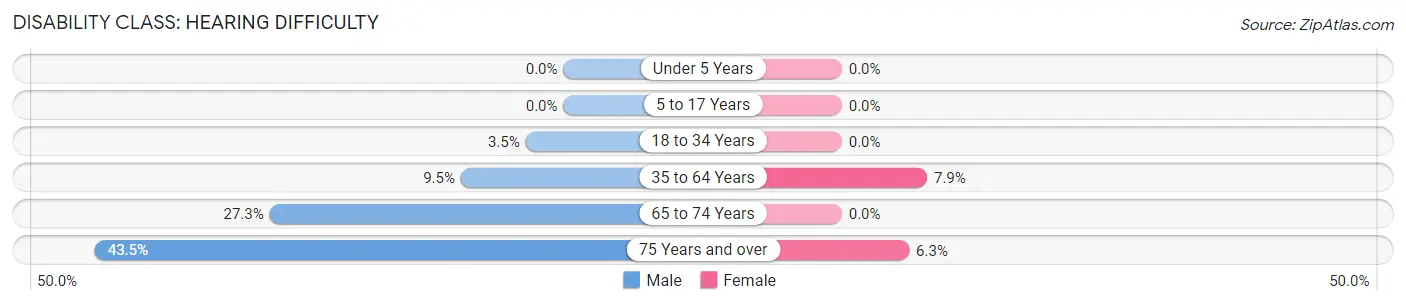
| Age Bracket | Male | Female |
| Under 5 Years | 0 (0.0%) | 0 (0.0%) |
| 5 to 17 Years | 0 (0.0%) | 0 (0.0%) |
| 18 to 34 Years | 4 (3.5%) | 0 (0.0%) |
| 35 to 64 Years | 14 (9.5%) | 11 (7.9%) |
| 65 to 74 Years | 9 (27.3%) | 0 (0.0%) |
| 75 Years and over | 10 (43.5%) | 2 (6.2%) |
Disability Class: Vision Difficulty
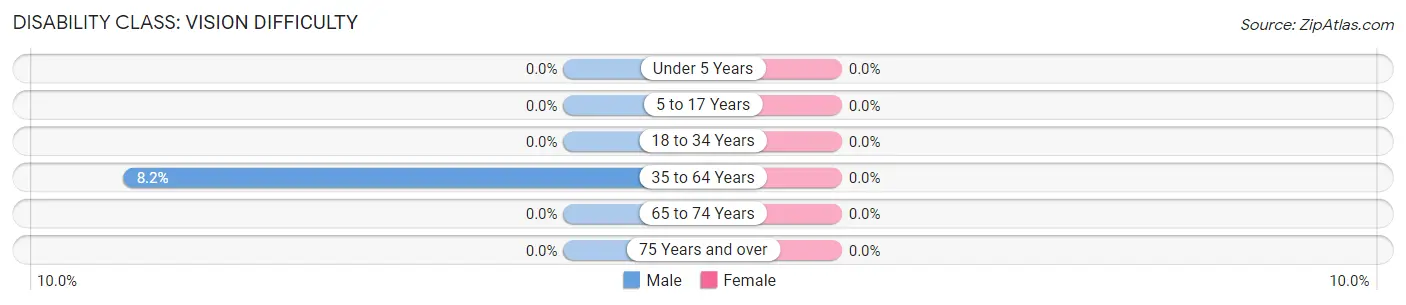
| Age Bracket | Male | Female |
| Under 5 Years | 0 (0.0%) | 0 (0.0%) |
| 5 to 17 Years | 0 (0.0%) | 0 (0.0%) |
| 18 to 34 Years | 0 (0.0%) | 0 (0.0%) |
| 35 to 64 Years | 12 (8.2%) | 0 (0.0%) |
| 65 to 74 Years | 0 (0.0%) | 0 (0.0%) |
| 75 Years and over | 0 (0.0%) | 0 (0.0%) |
Disability Class: Cognitive Difficulty
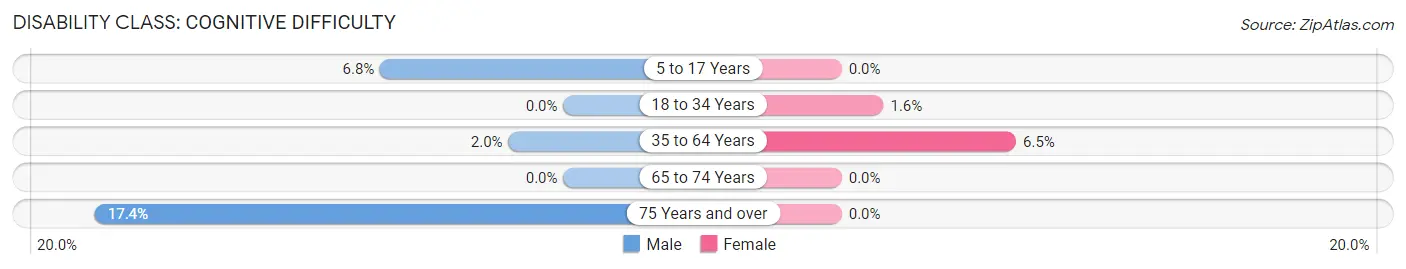
| Age Bracket | Male | Female |
| 5 to 17 Years | 10 (6.8%) | 0 (0.0%) |
| 18 to 34 Years | 0 (0.0%) | 2 (1.5%) |
| 35 to 64 Years | 3 (2.0%) | 9 (6.5%) |
| 65 to 74 Years | 0 (0.0%) | 0 (0.0%) |
| 75 Years and over | 4 (17.4%) | 0 (0.0%) |
Disability Class: Ambulatory Difficulty
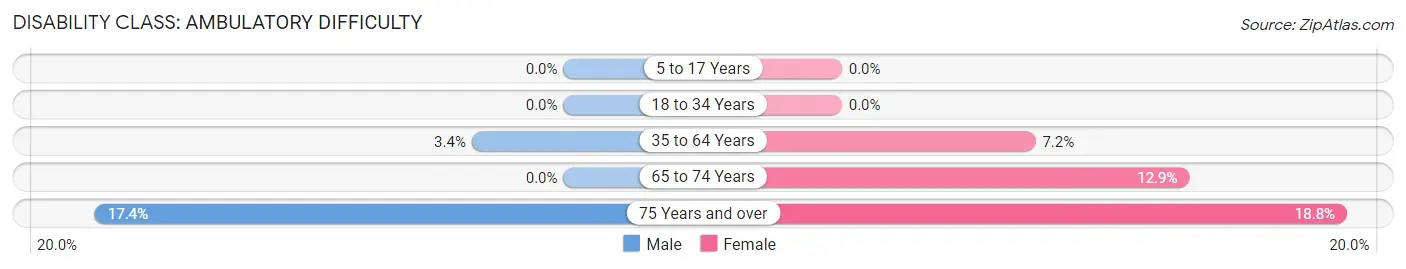
| Age Bracket | Male | Female |
| 5 to 17 Years | 0 (0.0%) | 0 (0.0%) |
| 18 to 34 Years | 0 (0.0%) | 0 (0.0%) |
| 35 to 64 Years | 5 (3.4%) | 10 (7.2%) |
| 65 to 74 Years | 0 (0.0%) | 4 (12.9%) |
| 75 Years and over | 4 (17.4%) | 6 (18.8%) |
Disability Class: Self-Care Difficulty
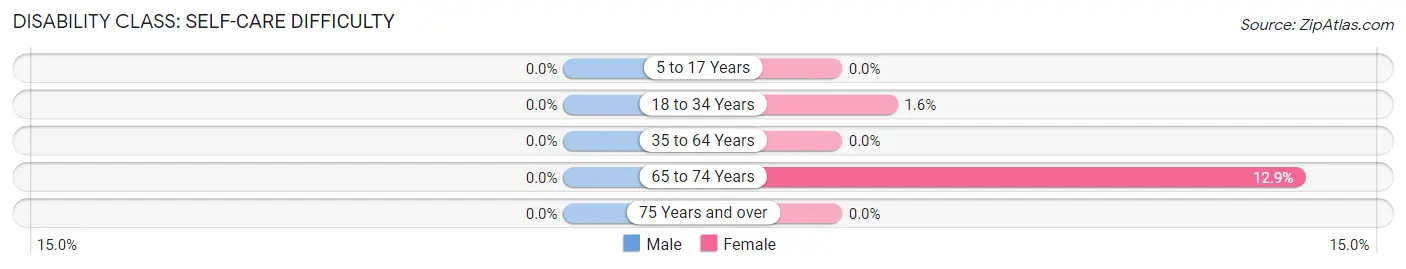
| Age Bracket | Male | Female |
| 5 to 17 Years | 0 (0.0%) | 0 (0.0%) |
| 18 to 34 Years | 0 (0.0%) | 2 (1.5%) |
| 35 to 64 Years | 0 (0.0%) | 0 (0.0%) |
| 65 to 74 Years | 0 (0.0%) | 4 (12.9%) |
| 75 Years and over | 0 (0.0%) | 0 (0.0%) |
Technology Access in New Washington
Computing Device Access in New Washington
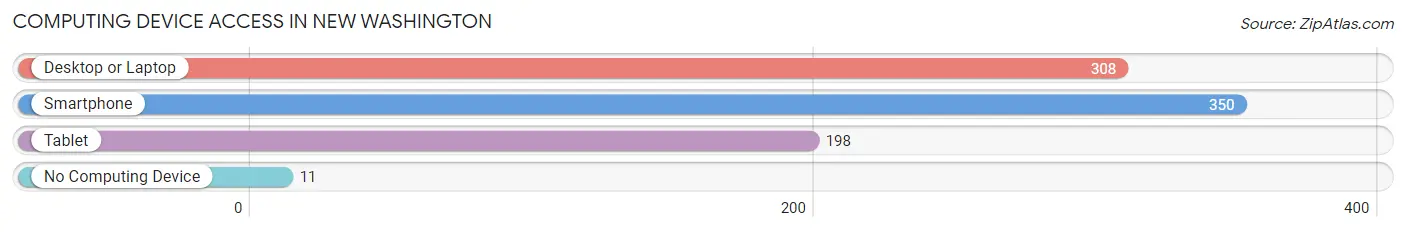
| Device Type | # Households | % Households |
| Desktop or Laptop | 308 | 79.6% |
| Smartphone | 350 | 90.4% |
| Tablet | 198 | 51.2% |
| No Computing Device | 11 | 2.8% |
| Total | 387 | 100.0% |
Internet Access in New Washington
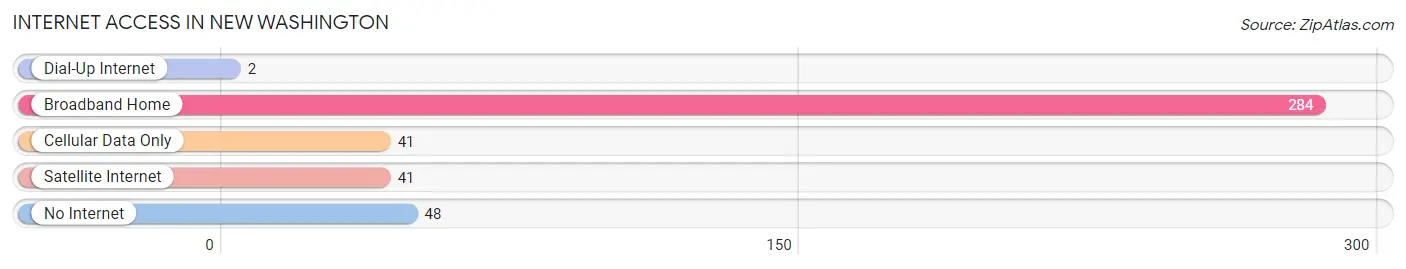
| Internet Type | # Households | % Households |
| Dial-Up Internet | 2 | 0.5% |
| Broadband Home | 284 | 73.4% |
| Cellular Data Only | 41 | 10.6% |
| Satellite Internet | 41 | 10.6% |
| No Internet | 48 | 12.4% |
| Total | 387 | 100.0% |
New Washington Summary
Washington, Ohio is a small city located in Fayette County, Ohio. It is situated on the banks of the Great Miami River, approximately 40 miles southwest of Columbus. The city has a population of approximately 11,000 people and is the county seat of Fayette County.
History
Washington, Ohio was founded in 1810 by a group of settlers from Virginia. The city was named after George Washington, the first president of the United States. The city was originally a small farming community, but it quickly grew into a bustling town. In 1817, the city was officially incorporated and the first mayor was elected.
In the mid-1800s, Washington, Ohio became a major hub for the railroad industry. The city was home to several major railroads, including the Baltimore and Ohio Railroad, the Cincinnati and Muskingum Valley Railroad, and the Cincinnati, Hamilton and Dayton Railroad. This allowed the city to become a major transportation hub for the region.
The city also became a major industrial center in the late 1800s. Several factories were built in the city, including a glass factory, a paper mill, and a steel mill. These factories provided jobs for many of the city’s residents and helped to fuel the city’s growth.
In the early 1900s, Washington, Ohio became a major center for the automotive industry. Several major car companies, including Ford, General Motors, and Chrysler, had factories in the city. This allowed the city to become a major center for the automotive industry in the region.
Geography
Washington, Ohio is located in Fayette County, Ohio. The city is situated on the banks of the Great Miami River, approximately 40 miles southwest of Columbus. The city has a total area of 4.3 square miles, all of which is land.
The city is located in a hilly region of Ohio, with the highest point being the hilltop of the city’s courthouse. The city is also located near several major highways, including Interstate 70, Interstate 75, and US Route 35.
Economy
Washington, Ohio has a diverse economy that is driven by several major industries. The city is home to several major manufacturing companies, including a glass factory, a paper mill, and a steel mill. The city is also home to several automotive companies, including Ford, General Motors, and Chrysler.
The city is also home to several major retail stores, including Walmart, Target, and Kohl’s. The city is also home to several major restaurants, including McDonald’s, Burger King, and Wendy’s.
Demographics
As of the 2010 census, the population of Washington, Ohio was 11,000 people. The racial makeup of the city was 90.3% White, 4.2% African American, 0.7% Native American, 0.7% Asian, 0.1% Pacific Islander, and 3.9% from other races. Hispanic or Latino of any race were 2.2% of the population.
The median household income in Washington, Ohio was $37,000, and the median family income was $45,000. The per capita income in the city was $19,000. Approximately 17.3% of the population was below the poverty line.
Conclusion
Washington, Ohio is a small city located in Fayette County, Ohio. It is situated on the banks of the Great Miami River, approximately 40 miles southwest of Columbus. The city has a population of approximately 11,000 people and is the county seat of Fayette County. The city has a diverse economy that is driven by several major industries, including manufacturing, automotive, retail, and restaurants. The city also has a diverse population, with a median household income of $37,000 and a median family income of $45,000. Washington, Ohio is a vibrant city with a rich history and a bright future.
Common Questions
What is Per Capita Income in New Washington?
Per Capita income in New Washington is $37,044.
What is the Median Family Income in New Washington?
Median Family Income in New Washington is $70,063.
What is the Median Household income in New Washington?
Median Household Income in New Washington is $57,969.
What is Income or Wage Gap in New Washington?
Income or Wage Gap in New Washington is 36.7%.
Women in New Washington earn 63.3 cents for every dollar earned by a man.
What is Inequality or Gini Index in New Washington?
Inequality or Gini Index in New Washington is 0.43.
What is the Total Population of New Washington?
Total Population of New Washington is 900.
What is the Total Male Population of New Washington?
Total Male Population of New Washington is 485.
What is the Total Female Population of New Washington?
Total Female Population of New Washington is 415.
What is the Ratio of Males per 100 Females in New Washington?
There are 116.87 Males per 100 Females in New Washington.
What is the Ratio of Females per 100 Males in New Washington?
There are 85.57 Females per 100 Males in New Washington.
What is the Median Population Age in New Washington?
Median Population Age in New Washington is 32.3 Years.
What is the Average Family Size in New Washington
Average Family Size in New Washington is 3.0 People.
What is the Average Household Size in New Washington
Average Household Size in New Washington is 2.3 People.
How Large is the Labor Force in New Washington?
There are 457 People in the Labor Forcein in New Washington.
What is the Percentage of People in the Labor Force in New Washington?
67.3% of People are in the Labor Force in New Washington.
What is the Unemployment Rate in New Washington?
Unemployment Rate in New Washington is 0.9%.