New Marshfield, OH Map & Demographics
New Marshfield Map
New Marshfield Overview
$28,686
PER CAPITA INCOME
$29,261
AVG HOUSEHOLD INCOME
0.44
INEQUALITY / GINI INDEX
184
TOTAL POPULATION
100
MALE POPULATION
84
FEMALE POPULATION
119.05
MALES / 100 FEMALES
84.00
FEMALES / 100 MALES
58.4
MEDIAN AGE
2.5
AVG FAMILY SIZE
1.8
AVG HOUSEHOLD SIZE
85
LABOR FORCE [ PEOPLE ]
50.0%
PERCENT IN LABOR FORCE
New Marshfield Zip Codes
New Marshfield Area Codes
Income in New Marshfield
Income Overview in New Marshfield
| Characteristic | Number | Measure |
| Per Capita Income | 184 | $28,686 |
| Median Family Income | 45 | $0 |
| Mean Family Income | 45 | $46,047 |
| Median Household Income | 101 | $29,261 |
| Mean Household Income | 101 | $48,657 |
| Income Deficit | 45 | $0 |
| Wage / Income Gap (%) | 184 | 0.00% |
| Wage / Income Gap ($) | 184 | 100.00¢ per $1 |
| Gini / Inequality Index | 184 | 0.44 |
Earnings by Sex in New Marshfield
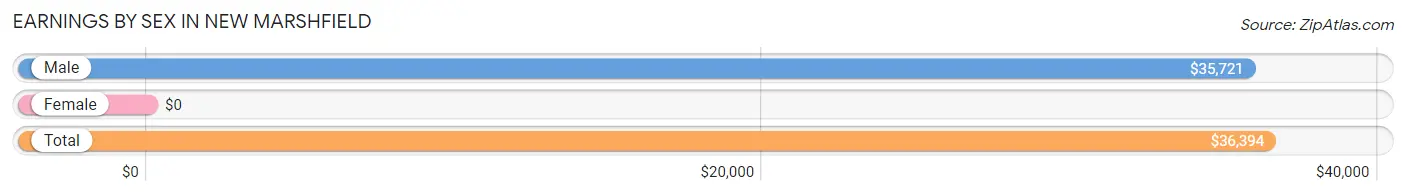
| Sex | Number | Average Earnings |
| Male | 71 (83.5%) | $35,721 |
| Female | 14 (16.5%) | $0 |
| Total | 85 (100.0%) | $36,394 |
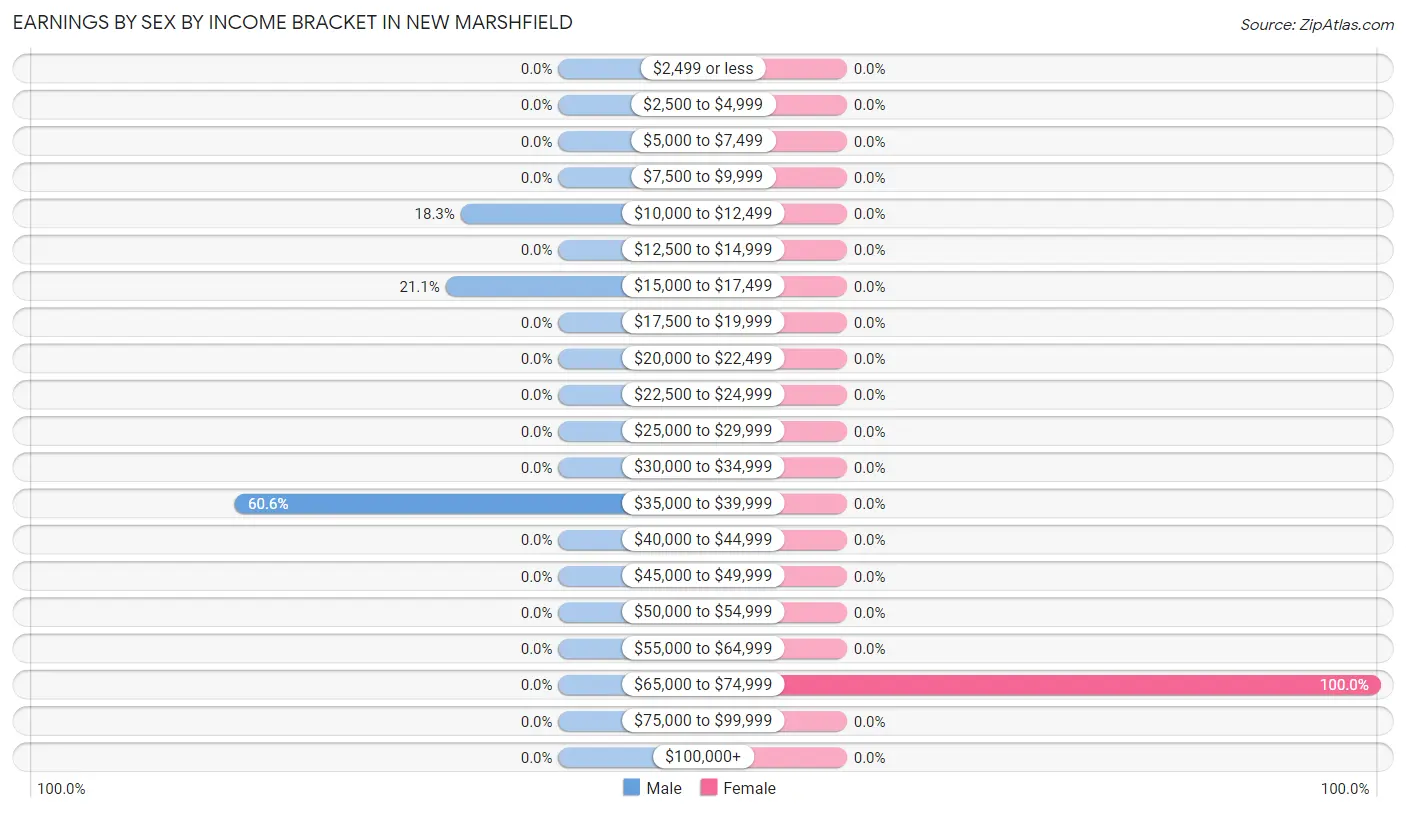
Earnings by Sex by Income Bracket in New Marshfield
The most common earnings brackets in New Marshfield are $35,000 to $39,999 for men (43 | 60.6%) and $65,000 to $74,999 for women (14 | 100.0%).
| Income | Male | Female |
| $2,499 or less | 0 (0.0%) | 0 (0.0%) |
| $2,500 to $4,999 | 0 (0.0%) | 0 (0.0%) |
| $5,000 to $7,499 | 0 (0.0%) | 0 (0.0%) |
| $7,500 to $9,999 | 0 (0.0%) | 0 (0.0%) |
| $10,000 to $12,499 | 13 (18.3%) | 0 (0.0%) |
| $12,500 to $14,999 | 0 (0.0%) | 0 (0.0%) |
| $15,000 to $17,499 | 15 (21.1%) | 0 (0.0%) |
| $17,500 to $19,999 | 0 (0.0%) | 0 (0.0%) |
| $20,000 to $22,499 | 0 (0.0%) | 0 (0.0%) |
| $22,500 to $24,999 | 0 (0.0%) | 0 (0.0%) |
| $25,000 to $29,999 | 0 (0.0%) | 0 (0.0%) |
| $30,000 to $34,999 | 0 (0.0%) | 0 (0.0%) |
| $35,000 to $39,999 | 43 (60.6%) | 0 (0.0%) |
| $40,000 to $44,999 | 0 (0.0%) | 0 (0.0%) |
| $45,000 to $49,999 | 0 (0.0%) | 0 (0.0%) |
| $50,000 to $54,999 | 0 (0.0%) | 0 (0.0%) |
| $55,000 to $64,999 | 0 (0.0%) | 0 (0.0%) |
| $65,000 to $74,999 | 0 (0.0%) | 14 (100.0%) |
| $75,000 to $99,999 | 0 (0.0%) | 0 (0.0%) |
| $100,000+ | 0 (0.0%) | 0 (0.0%) |
| Total | 71 (100.0%) | 14 (100.0%) |
Earnings by Sex by Educational Attainment in New Marshfield
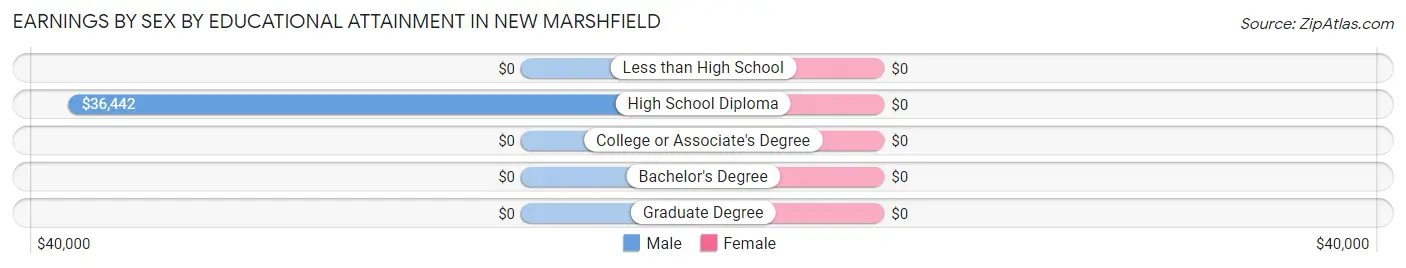
| Educational Attainment | Male Income | Female Income |
| Less than High School | - | - |
| High School Diploma | $36,442 | $0 |
| College or Associate's Degree | - | - |
| Bachelor's Degree | - | - |
| Graduate Degree | - | - |
| Total | $35,721 | $0 |
Family Income in New Marshfield
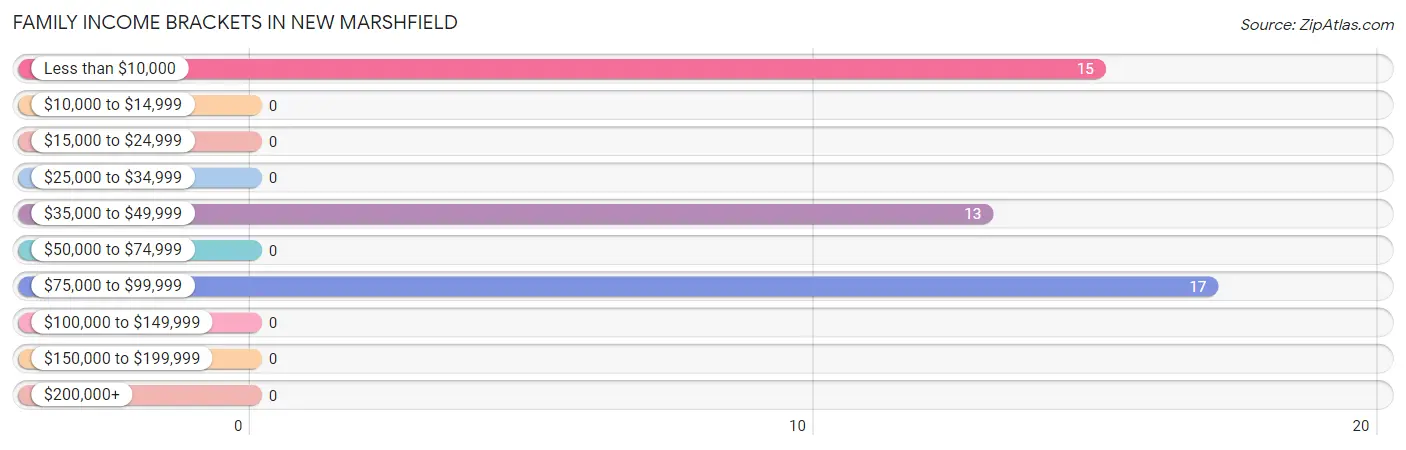
Family Income Brackets in New Marshfield
According to the New Marshfield family income data, there are 17 families falling into the $75,000 to $99,999 income range, which is the most common income bracket and makes up 37.8% of all families.
| Income Bracket | # Families | % Families |
| Less than $10,000 | 15 | 33.3% |
| $10,000 to $14,999 | 0 | 0.0% |
| $15,000 to $24,999 | 0 | 0.0% |
| $25,000 to $34,999 | 0 | 0.0% |
| $35,000 to $49,999 | 13 | 28.9% |
| $50,000 to $74,999 | 0 | 0.0% |
| $75,000 to $99,999 | 17 | 37.8% |
| $100,000 to $149,999 | 0 | 0.0% |
| $150,000 to $199,999 | 0 | 0.0% |
| $200,000+ | 0 | 0.0% |
Family Income by Famaliy Size in New Marshfield
| Income Bracket | # Families | Median Income |
| 2-Person Families | 28 (62.2%) | $0 |
| 3-Person Families | 17 (37.8%) | $0 |
| 4-Person Families | 0 (0.0%) | $0 |
| 5-Person Families | 0 (0.0%) | $0 |
| 6-Person Families | 0 (0.0%) | $0 |
| 7+ Person Families | 0 (0.0%) | $0 |
| Total | 45 (100.0%) | $0 |
Family Income by Number of Earners in New Marshfield
| Number of Earners | # Families | Median Income |
| No Earners | 15 (33.3%) | $0 |
| 1 Earner | 13 (28.9%) | $0 |
| 2 Earners | 17 (37.8%) | $0 |
| 3+ Earners | 0 (0.0%) | $0 |
| Total | 45 (100.0%) | $0 |
Household Income in New Marshfield
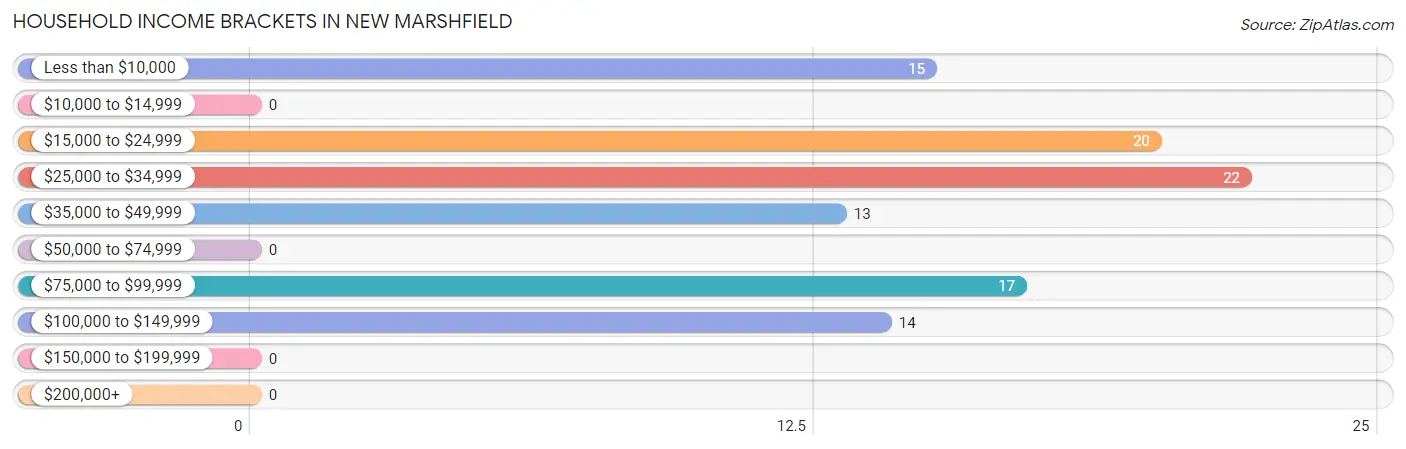
Household Income Brackets in New Marshfield
With 22 households falling in the category, the $25,000 to $34,999 income range is the most frequent in New Marshfield, accounting for 21.8% of all households.
| Income Bracket | # Households | % Households |
| Less than $10,000 | 15 | 14.9% |
| $10,000 to $14,999 | 0 | 0.0% |
| $15,000 to $24,999 | 20 | 19.8% |
| $25,000 to $34,999 | 22 | 21.8% |
| $35,000 to $49,999 | 13 | 12.9% |
| $50,000 to $74,999 | 0 | 0.0% |
| $75,000 to $99,999 | 17 | 16.8% |
| $100,000 to $149,999 | 14 | 13.9% |
| $150,000 to $199,999 | 0 | 0.0% |
| $200,000+ | 0 | 0.0% |
Household Income by Householder Age in New Marshfield
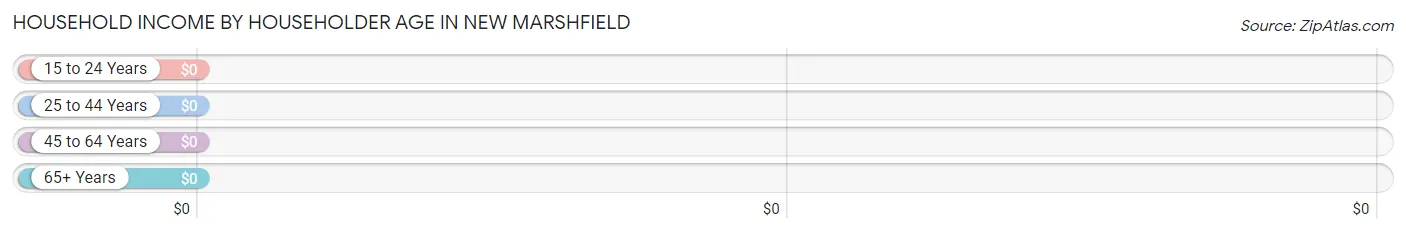
| Income Bracket | # Households | Median Income |
| 15 to 24 Years | 0 (0.0%) | $0 |
| 25 to 44 Years | 0 (0.0%) | $0 |
| 45 to 64 Years | 79 (78.2%) | $0 |
| 65+ Years | 22 (21.8%) | $0 |
| Total | 101 (100.0%) | $29,261 |
Poverty in New Marshfield
Income Below Poverty by Sex and Age in New Marshfield
With 15.0% poverty level for males and 17.9% for females among the residents of New Marshfield, 55 to 64 year old males and 55 to 64 year old females are the most vulnerable to poverty, with 15 males (25.0%) and 15 females (24.2%) in their respective age groups living below the poverty level.
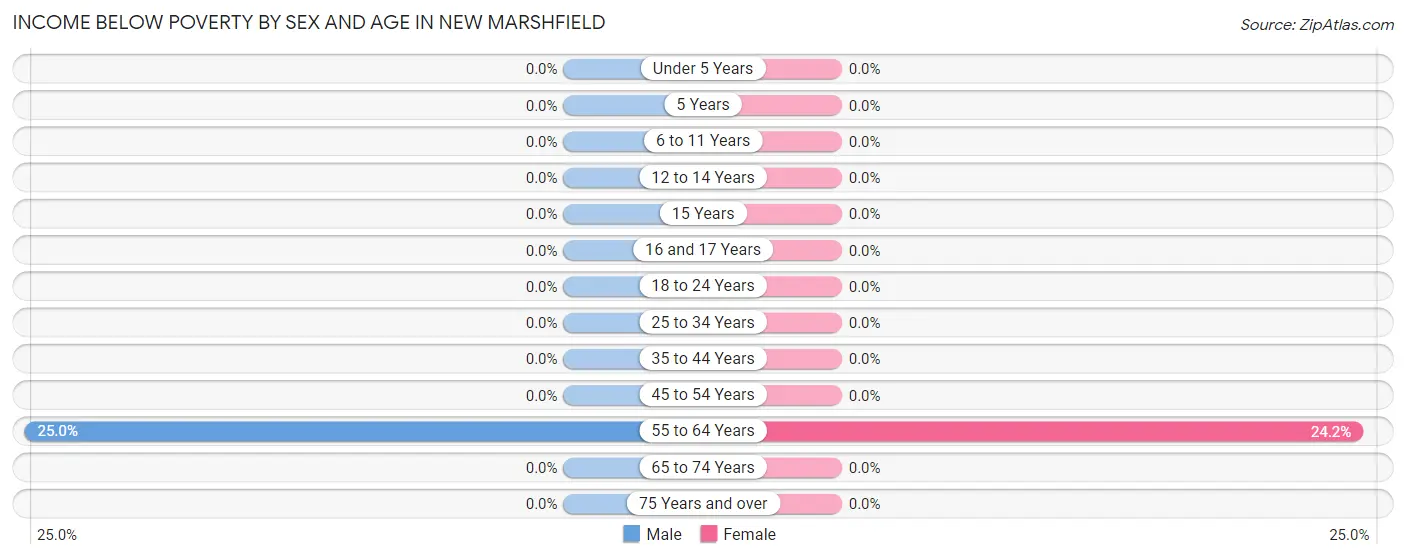
| Age Bracket | Male | Female |
| Under 5 Years | 0 (0.0%) | 0 (0.0%) |
| 5 Years | 0 (0.0%) | 0 (0.0%) |
| 6 to 11 Years | 0 (0.0%) | 0 (0.0%) |
| 12 to 14 Years | 0 (0.0%) | 0 (0.0%) |
| 15 Years | 0 (0.0%) | 0 (0.0%) |
| 16 and 17 Years | 0 (0.0%) | 0 (0.0%) |
| 18 to 24 Years | 0 (0.0%) | 0 (0.0%) |
| 25 to 34 Years | 0 (0.0%) | 0 (0.0%) |
| 35 to 44 Years | 0 (0.0%) | 0 (0.0%) |
| 45 to 54 Years | 0 (0.0%) | 0 (0.0%) |
| 55 to 64 Years | 15 (25.0%) | 15 (24.2%) |
| 65 to 74 Years | 0 (0.0%) | 0 (0.0%) |
| 75 Years and over | 0 (0.0%) | 0 (0.0%) |
| Total | 15 (15.0%) | 15 (17.9%) |
Income Above Poverty by Sex and Age in New Marshfield
According to the poverty statistics in New Marshfield, males aged 15 years and females aged 75 years and over are the age groups that are most secure financially, with 100.0% of males and 100.0% of females in these age groups living above the poverty line.
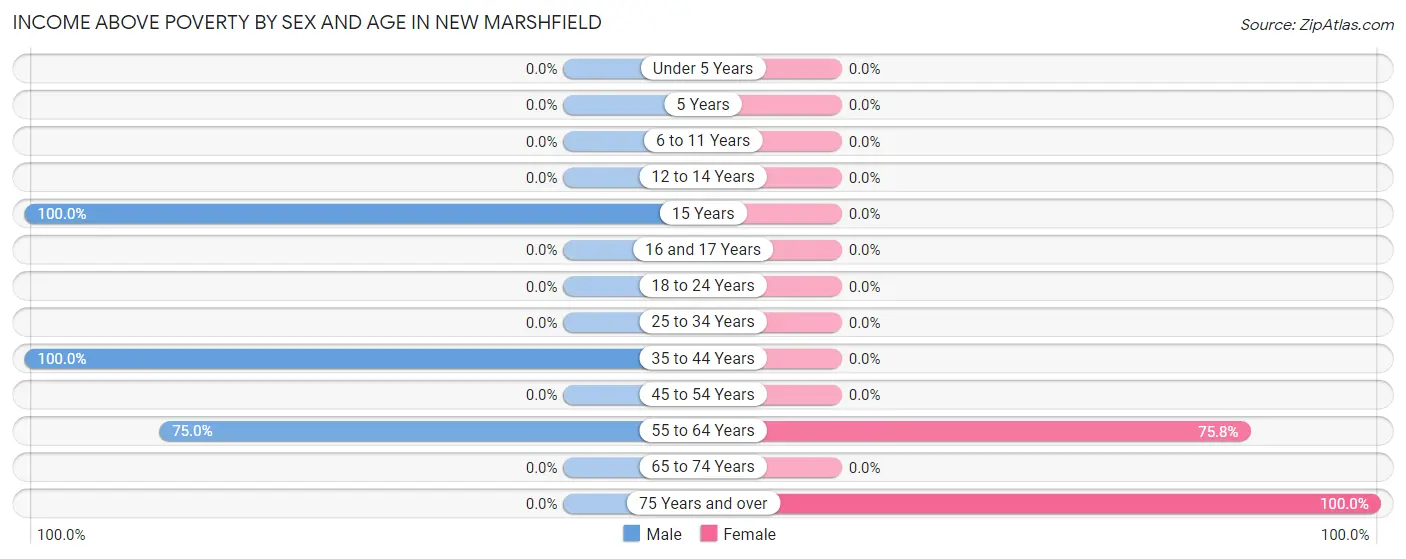
| Age Bracket | Male | Female |
| Under 5 Years | 0 (0.0%) | 0 (0.0%) |
| 5 Years | 0 (0.0%) | 0 (0.0%) |
| 6 to 11 Years | 0 (0.0%) | 0 (0.0%) |
| 12 to 14 Years | 0 (0.0%) | 0 (0.0%) |
| 15 Years | 14 (100.0%) | 0 (0.0%) |
| 16 and 17 Years | 0 (0.0%) | 0 (0.0%) |
| 18 to 24 Years | 0 (0.0%) | 0 (0.0%) |
| 25 to 34 Years | 0 (0.0%) | 0 (0.0%) |
| 35 to 44 Years | 26 (100.0%) | 0 (0.0%) |
| 45 to 54 Years | 0 (0.0%) | 0 (0.0%) |
| 55 to 64 Years | 45 (75.0%) | 47 (75.8%) |
| 65 to 74 Years | 0 (0.0%) | 0 (0.0%) |
| 75 Years and over | 0 (0.0%) | 22 (100.0%) |
| Total | 85 (85.0%) | 69 (82.1%) |
Income Below Poverty Among Married-Couple Families in New Marshfield
The poverty statistics for married-couple families in New Marshfield show that 53.6% or 15 of the total 28 families live below the poverty line. Families with no children have the highest poverty rate of 53.6%, comprising of 15 families. On the other hand, families with no children have the lowest poverty rate of 53.6%, which includes 15 families.
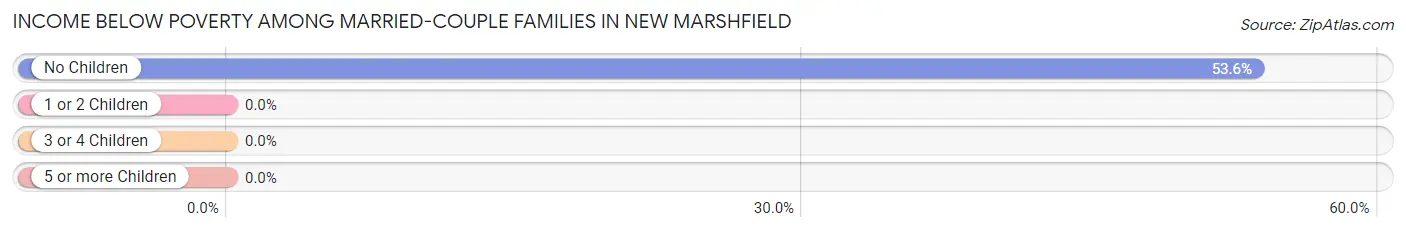
| Children | Above Poverty | Below Poverty |
| No Children | 13 (46.4%) | 15 (53.6%) |
| 1 or 2 Children | 0 (0.0%) | 0 (0.0%) |
| 3 or 4 Children | 0 (0.0%) | 0 (0.0%) |
| 5 or more Children | 0 (0.0%) | 0 (0.0%) |
| Total | 13 (46.4%) | 15 (53.6%) |
Income Below Poverty Among Single-Parent Households in New Marshfield
| Children | Single Father | Single Mother |
| No Children | 0 (0.0%) | 0 (0.0%) |
| 1 or 2 Children | 0 (0.0%) | 0 (0.0%) |
| 3 or 4 Children | 0 (0.0%) | 0 (0.0%) |
| 5 or more Children | 0 (0.0%) | 0 (0.0%) |
| Total | 0 (0.0%) | 0 (0.0%) |
Income Below Poverty Among Married-Couple vs Single-Parent Households in New Marshfield
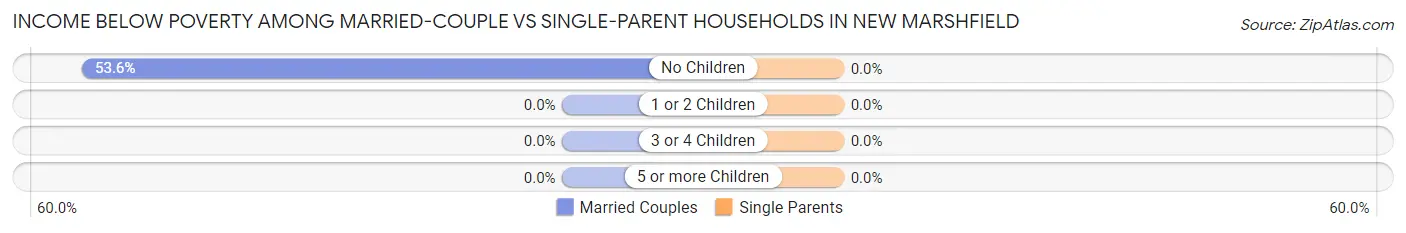
| Children | Married-Couple Families | Single-Parent Households |
| No Children | 15 (53.6%) | 0 (0.0%) |
| 1 or 2 Children | 0 (0.0%) | 0 (0.0%) |
| 3 or 4 Children | 0 (0.0%) | 0 (0.0%) |
| 5 or more Children | 0 (0.0%) | 0 (0.0%) |
| Total | 15 (53.6%) | 0 (0.0%) |
Race in New Marshfield
The most populous races in New Marshfield are , and White / Caucasian (184 | 100.0%).
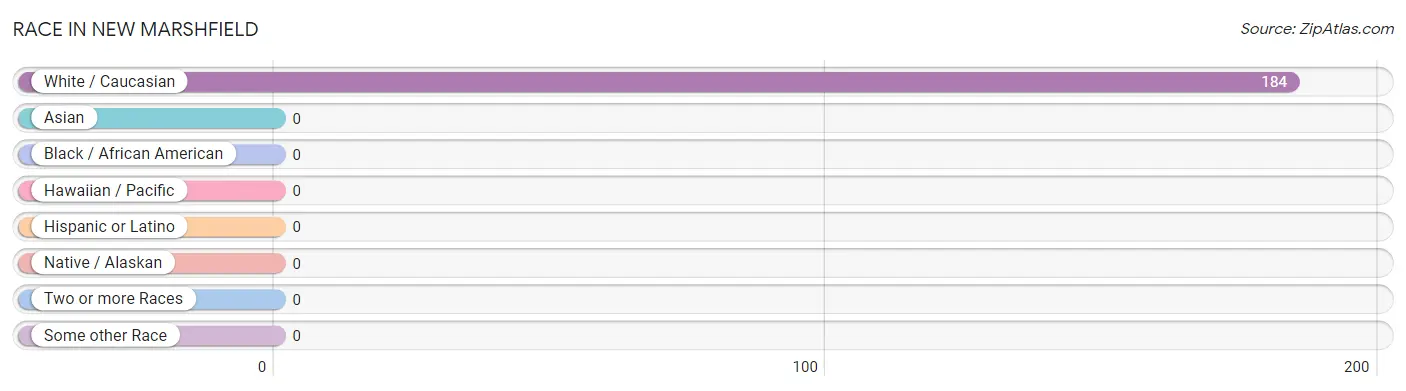
| Race | # Population | % Population |
| Asian | 0 | 0.0% |
| Black / African American | 0 | 0.0% |
| Hawaiian / Pacific | 0 | 0.0% |
| Hispanic or Latino | 0 | 0.0% |
| Native / Alaskan | 0 | 0.0% |
| White / Caucasian | 184 | 100.0% |
| Two or more Races | 0 | 0.0% |
| Some other Race | 0 | 0.0% |
| Total | 184 | 100.0% |
Ancestry in New Marshfield
The most populous ancestries reported in New Marshfield are American (57 | 31.0%), German (35 | 19.0%), English (22 | 12.0%), Russian (20 | 10.9%), and Scotch-Irish (15 | 8.2%), together accounting for 81.0% of all New Marshfield residents.
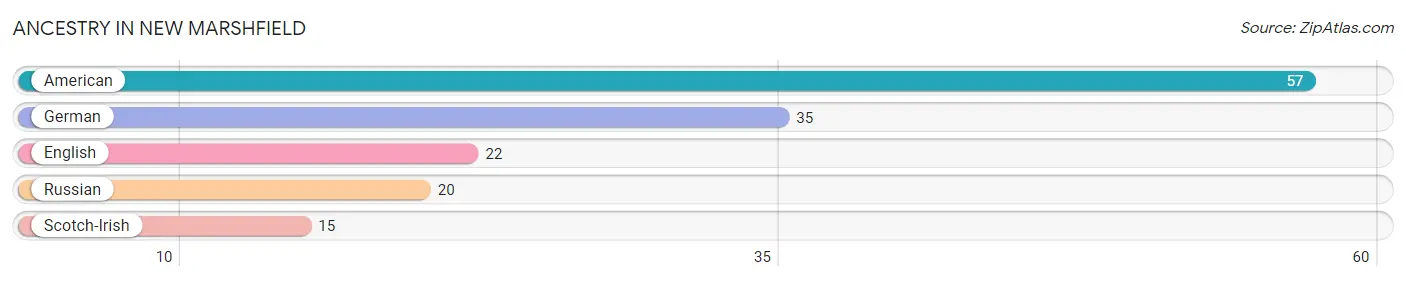
| Ancestry | # Population | % Population |
| American | 57 | 31.0% |
| English | 22 | 12.0% |
| German | 35 | 19.0% |
| Russian | 20 | 10.9% |
| Scotch-Irish | 15 | 8.2% | View All 5 Rows |
Immigrants in New Marshfield

| Immigration Origin | # Population | % Population | View All 0 Rows |
Sex and Age in New Marshfield
Sex and Age in New Marshfield
The most populous age groups in New Marshfield are 60 to 64 Years (32 | 32.0%) for men and 55 to 59 Years (33 | 39.3%) for women.
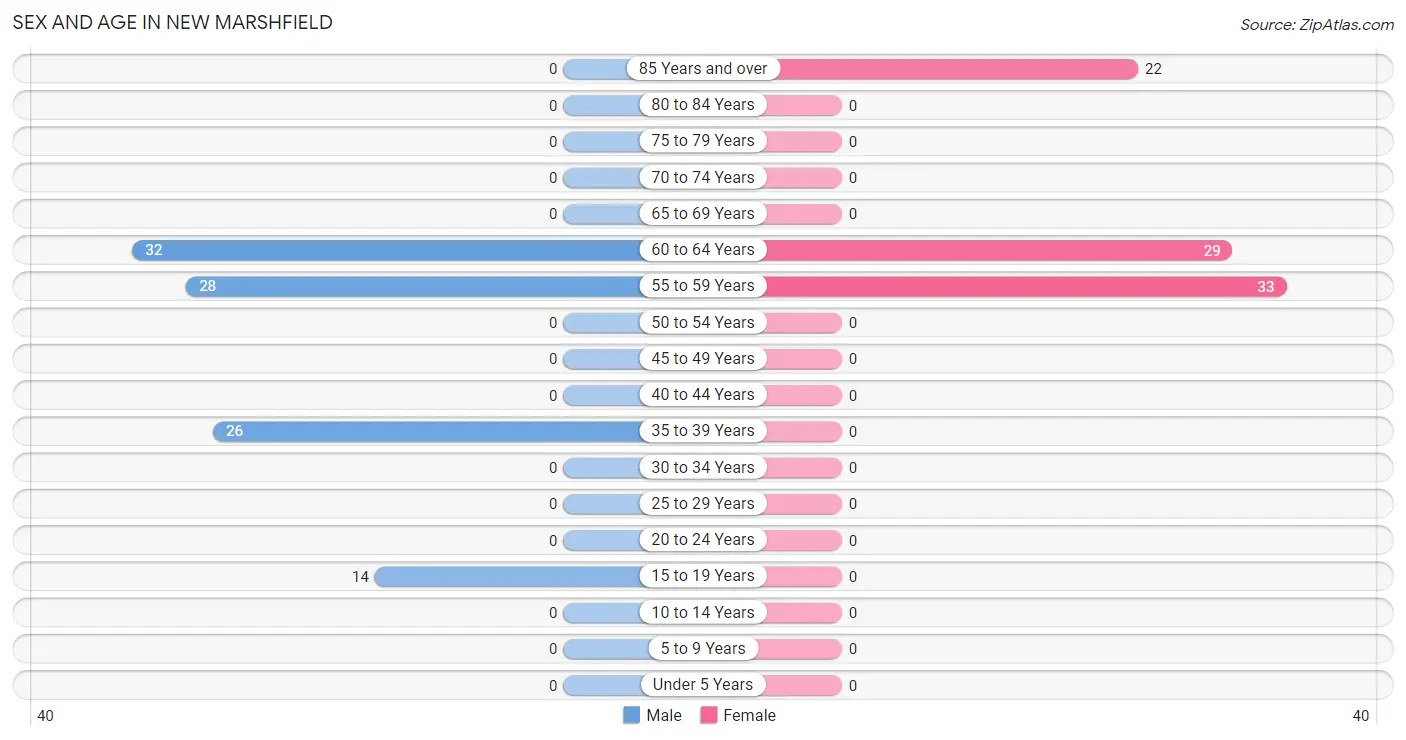
| Age Bracket | Male | Female |
| Under 5 Years | 0 (0.0%) | 0 (0.0%) |
| 5 to 9 Years | 0 (0.0%) | 0 (0.0%) |
| 10 to 14 Years | 0 (0.0%) | 0 (0.0%) |
| 15 to 19 Years | 14 (14.0%) | 0 (0.0%) |
| 20 to 24 Years | 0 (0.0%) | 0 (0.0%) |
| 25 to 29 Years | 0 (0.0%) | 0 (0.0%) |
| 30 to 34 Years | 0 (0.0%) | 0 (0.0%) |
| 35 to 39 Years | 26 (26.0%) | 0 (0.0%) |
| 40 to 44 Years | 0 (0.0%) | 0 (0.0%) |
| 45 to 49 Years | 0 (0.0%) | 0 (0.0%) |
| 50 to 54 Years | 0 (0.0%) | 0 (0.0%) |
| 55 to 59 Years | 28 (28.0%) | 33 (39.3%) |
| 60 to 64 Years | 32 (32.0%) | 29 (34.5%) |
| 65 to 69 Years | 0 (0.0%) | 0 (0.0%) |
| 70 to 74 Years | 0 (0.0%) | 0 (0.0%) |
| 75 to 79 Years | 0 (0.0%) | 0 (0.0%) |
| 80 to 84 Years | 0 (0.0%) | 0 (0.0%) |
| 85 Years and over | 0 (0.0%) | 22 (26.2%) |
| Total | 100 (100.0%) | 84 (100.0%) |
Families and Households in New Marshfield
Median Family Size in New Marshfield
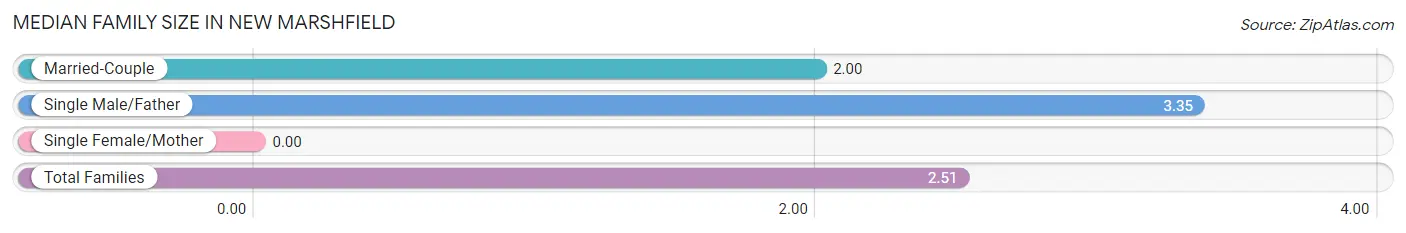
| Family Type | # Families | Family Size |
| Married-Couple | 28 (62.2%) | 2.00 |
| Single Male/Father | 17 (37.8%) | 3.35 |
| Single Female/Mother | 0 (0.0%) | - |
| Total Families | 45 (100.0%) | 2.51 |
Median Household Size in New Marshfield
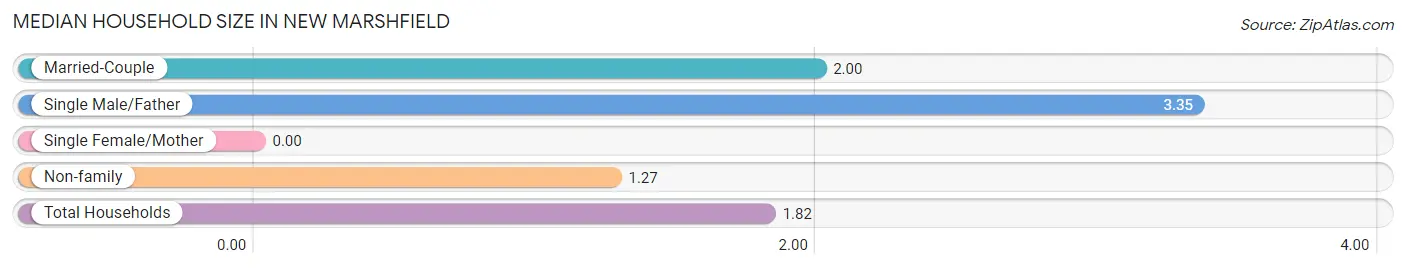
| Household Type | # Households | Household Size |
| Married-Couple | 28 (27.7%) | 2.00 |
| Single Male/Father | 17 (16.8%) | 3.35 |
| Single Female/Mother | 0 (0.0%) | - |
| Non-family | 56 (55.4%) | 1.27 |
| Total Households | 101 (100.0%) | 1.82 |
Household Size by Marriage Status in New Marshfield
Out of a total of 101 households in New Marshfield, 45 (44.6%) are family households, while 56 (55.4%) are nonfamily households. The most numerous type of family households are 2-person households, comprising 28, and the most common type of nonfamily households are 1-person households, comprising 42.
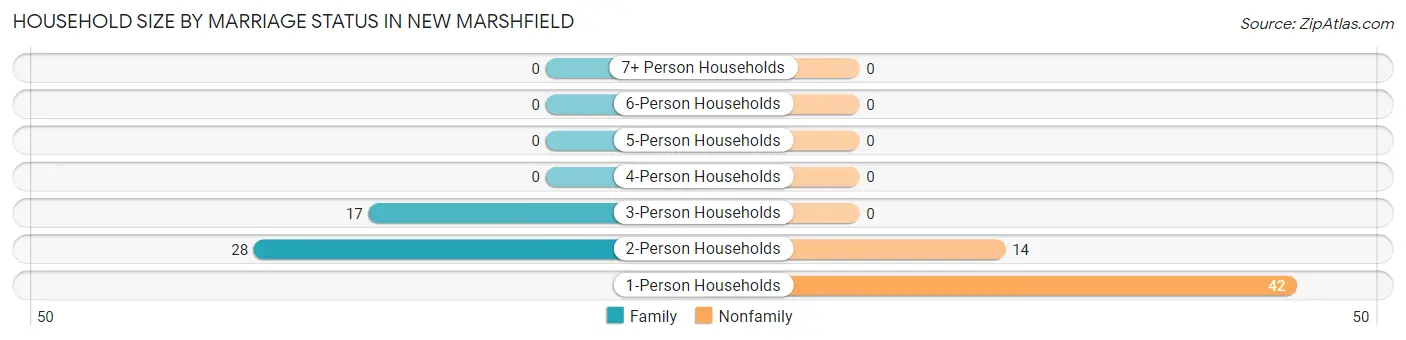
| Household Size | Family Households | Nonfamily Households |
| 1-Person Households | - | 42 (41.6%) |
| 2-Person Households | 28 (27.7%) | 14 (13.9%) |
| 3-Person Households | 17 (16.8%) | 0 (0.0%) |
| 4-Person Households | 0 (0.0%) | 0 (0.0%) |
| 5-Person Households | 0 (0.0%) | 0 (0.0%) |
| 6-Person Households | 0 (0.0%) | 0 (0.0%) |
| 7+ Person Households | 0 (0.0%) | 0 (0.0%) |
| Total | 45 (44.6%) | 56 (55.4%) |
Female Fertility in New Marshfield
Fertility by Age in New Marshfield
| Age Bracket | Women with Births | Births / 1,000 Women |
| 15 to 19 years | 0 (0.0%) | 0.0 |
| 20 to 34 years | 0 (0.0%) | 0.0 |
| 35 to 50 years | 0 (0.0%) | 0.0 |
| Total | 0 (0.0%) | 0.0 |
Fertility by Age by Marriage Status in New Marshfield
| Age Bracket | Married | Unmarried |
| 15 to 19 years | 0 (0.0%) | 0 (0.0%) |
| 20 to 34 years | 0 (0.0%) | 0 (0.0%) |
| 35 to 50 years | 0 (0.0%) | 0 (0.0%) |
| Total | 0 (0.0%) | 0 (0.0%) |
Fertility by Education in New Marshfield
| Educational Attainment | Women with Births | Births / 1,000 Women |
| Less than High School | 0 (0.0%) | 0.0 |
| High School Diploma | 0 (0.0%) | 0.0 |
| College or Associate's Degree | 0 (0.0%) | 0.0 |
| Bachelor's Degree | 0 (0.0%) | 0.0 |
| Graduate Degree | 0 (0.0%) | 0.0 |
| Total | 0 (0.0%) | 0.0 |
Fertility by Education by Marriage Status in New Marshfield
| Educational Attainment | Married | Unmarried |
| Less than High School | 0 (0.0%) | 0 (0.0%) |
| High School Diploma | 0 (0.0%) | 0 (0.0%) |
| College or Associate's Degree | 0 (0.0%) | 0 (0.0%) |
| Bachelor's Degree | 0 (0.0%) | 0 (0.0%) |
| Graduate Degree | 0 (0.0%) | 0 (0.0%) |
| Total | 0 (0.0%) | 0 (0.0%) |
Employment Characteristics in New Marshfield
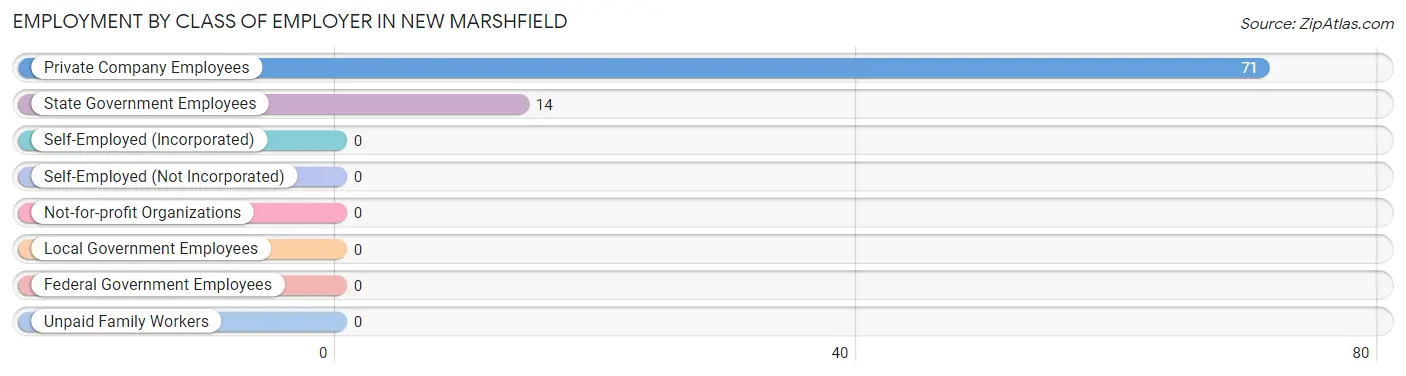
Employment by Class of Employer in New Marshfield
Among the 85 employed individuals in New Marshfield, private company employees (71 | 83.5%), and state government employees (14 | 16.5%) make up the most common classes of employment.
| Employer Class | # Employees | % Employees |
| Private Company Employees | 71 | 83.5% |
| Self-Employed (Incorporated) | 0 | 0.0% |
| Self-Employed (Not Incorporated) | 0 | 0.0% |
| Not-for-profit Organizations | 0 | 0.0% |
| Local Government Employees | 0 | 0.0% |
| State Government Employees | 14 | 16.5% |
| Federal Government Employees | 0 | 0.0% |
| Unpaid Family Workers | 0 | 0.0% |
| Total | 85 | 100.0% |
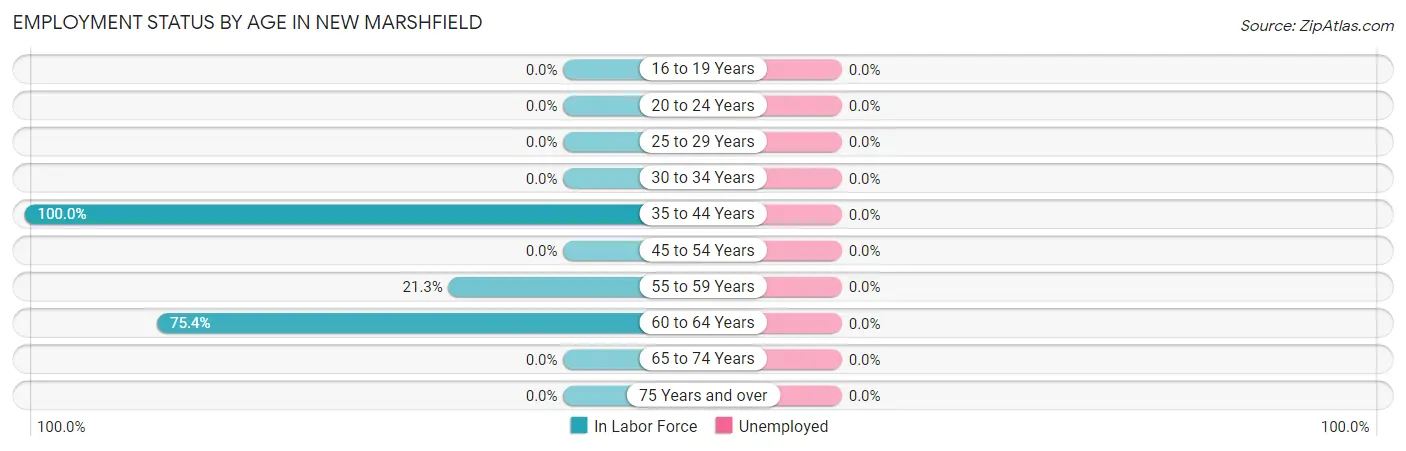
Employment Status by Age in New Marshfield
| Age Bracket | In Labor Force | Unemployed |
| 16 to 19 Years | 0 (0.0%) | 0 (0.0%) |
| 20 to 24 Years | 0 (0.0%) | 0 (0.0%) |
| 25 to 29 Years | 0 (0.0%) | 0 (0.0%) |
| 30 to 34 Years | 0 (0.0%) | 0 (0.0%) |
| 35 to 44 Years | 26 (100.0%) | 0 (0.0%) |
| 45 to 54 Years | 0 (0.0%) | 0 (0.0%) |
| 55 to 59 Years | 13 (21.3%) | 0 (0.0%) |
| 60 to 64 Years | 46 (75.4%) | 0 (0.0%) |
| 65 to 74 Years | 0 (0.0%) | 0 (0.0%) |
| 75 Years and over | 0 (0.0%) | 0 (0.0%) |
| Total | 85 (50.0%) | 0 (0.0%) |
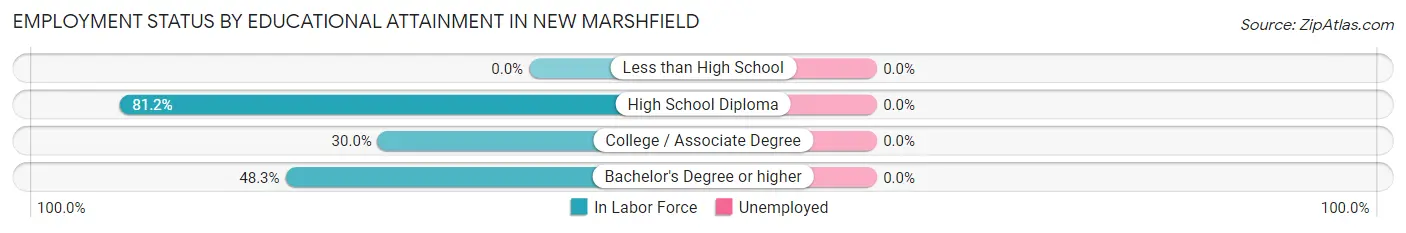
Employment Status by Educational Attainment in New Marshfield
| Educational Attainment | In Labor Force | Unemployed |
| Less than High School | 0 (0.0%) | 0 (0.0%) |
| High School Diploma | 56 (81.2%) | 0 (0.0%) |
| College / Associate Degree | 15 (30.0%) | 0 (0.0%) |
| Bachelor's Degree or higher | 14 (48.3%) | 0 (0.0%) |
| Total | 85 (57.4%) | 0 (0.0%) |
Employment Occupations by Sex in New Marshfield
Management, Business, Science and Arts Occupations
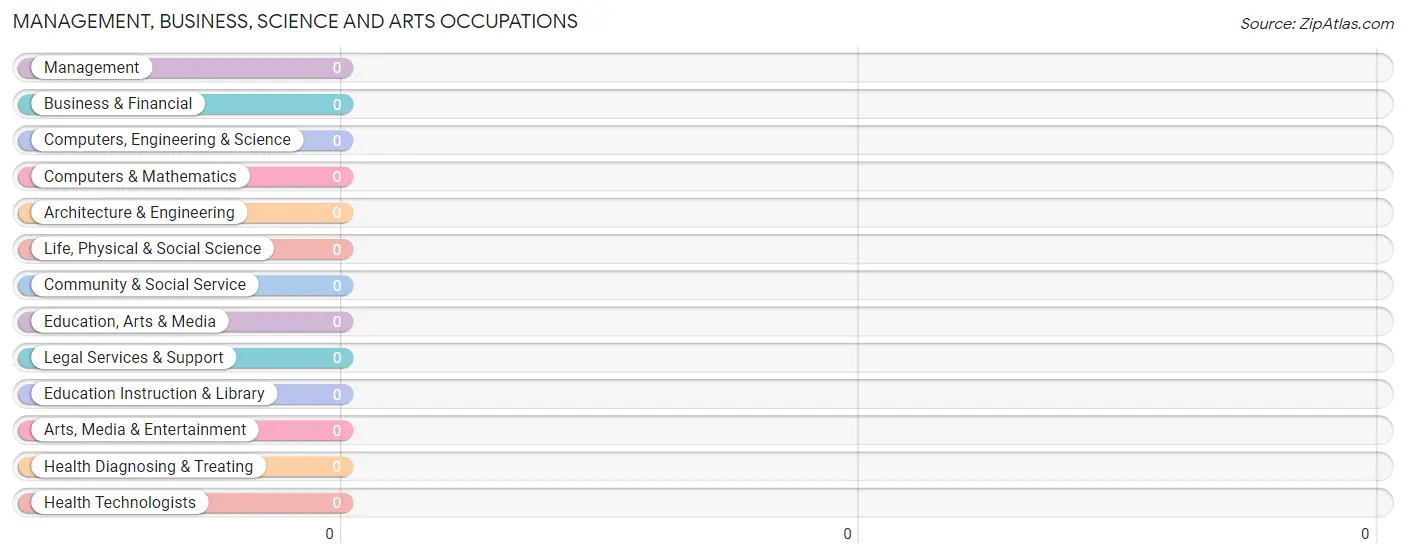
Management, Business, Science and Arts Occupations by Sex
| Occupation | Male | Female |
| Management | 0 (0.0%) | 0 (0.0%) |
| Business & Financial | 0 (0.0%) | 0 (0.0%) |
| Computers, Engineering & Science | 0 (0.0%) | 0 (0.0%) |
| Computers & Mathematics | 0 (0.0%) | 0 (0.0%) |
| Architecture & Engineering | 0 (0.0%) | 0 (0.0%) |
| Life, Physical & Social Science | 0 (0.0%) | 0 (0.0%) |
| Community & Social Service | 0 (0.0%) | 0 (0.0%) |
| Education, Arts & Media | 0 (0.0%) | 0 (0.0%) |
| Legal Services & Support | 0 (0.0%) | 0 (0.0%) |
| Education Instruction & Library | 0 (0.0%) | 0 (0.0%) |
| Arts, Media & Entertainment | 0 (0.0%) | 0 (0.0%) |
| Health Diagnosing & Treating | 0 (0.0%) | 0 (0.0%) |
| Health Technologists | 0 (0.0%) | 0 (0.0%) |
| Total (Category) | 0 (0.0%) | 0 (0.0%) |
| Total (Overall) | 71 (83.5%) | 14 (16.5%) |
Services Occupations
The most common Services occupations in New Marshfield are , and Cleaning & Maintenance (14 | 16.5%).
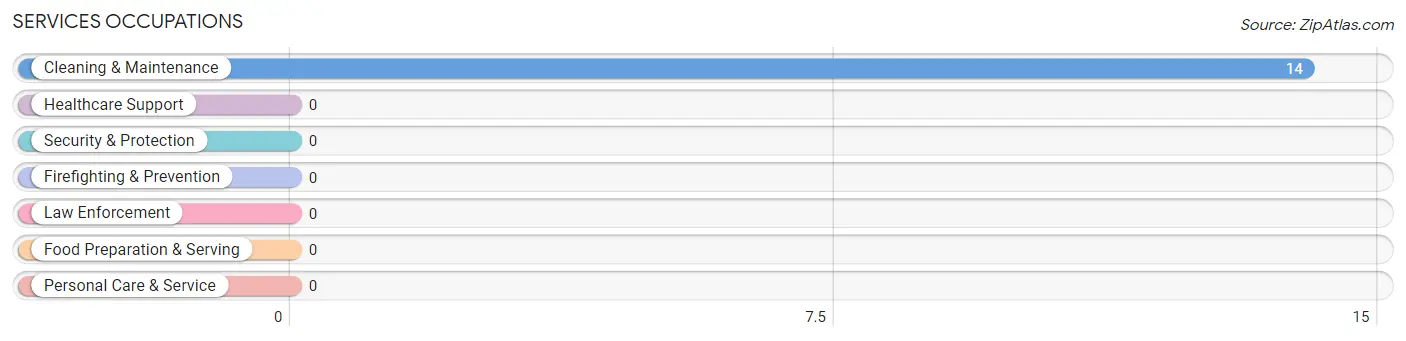
Services Occupations by Sex
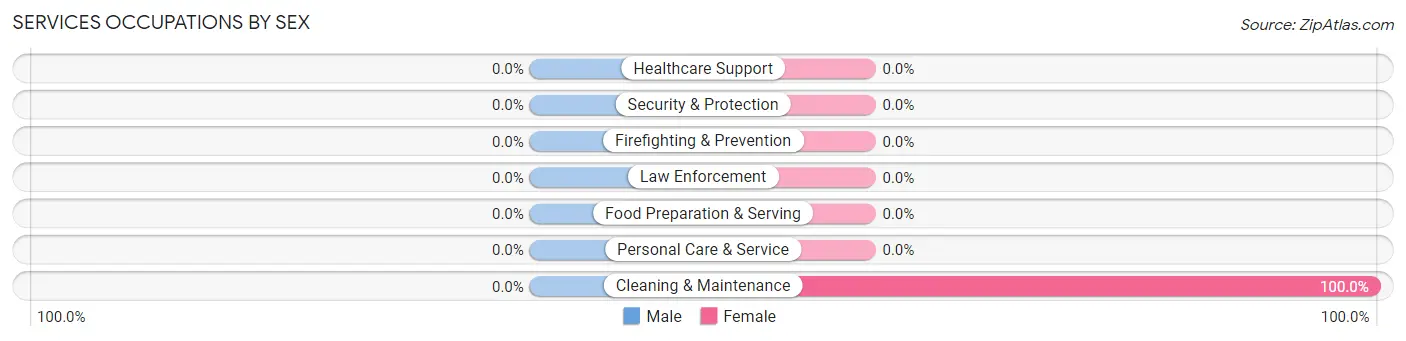
| Occupation | Male | Female |
| Healthcare Support | 0 (0.0%) | 0 (0.0%) |
| Security & Protection | 0 (0.0%) | 0 (0.0%) |
| Firefighting & Prevention | 0 (0.0%) | 0 (0.0%) |
| Law Enforcement | 0 (0.0%) | 0 (0.0%) |
| Food Preparation & Serving | 0 (0.0%) | 0 (0.0%) |
| Cleaning & Maintenance | 0 (0.0%) | 14 (100.0%) |
| Personal Care & Service | 0 (0.0%) | 0 (0.0%) |
| Total (Category) | 0 (0.0%) | 14 (100.0%) |
| Total (Overall) | 71 (83.5%) | 14 (16.5%) |
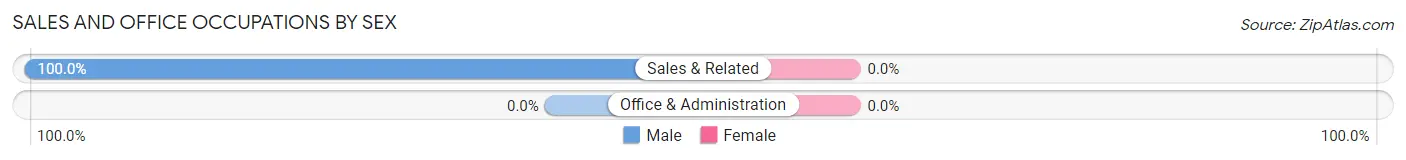
Sales and Office Occupations
The most common Sales and Office occupations in New Marshfield are , and Sales & Related (39 | 45.9%).
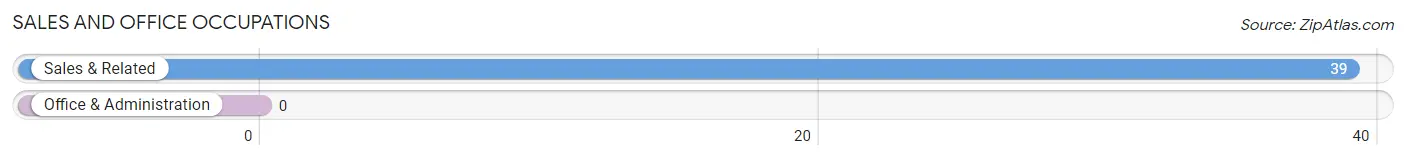
Sales and Office Occupations by Sex
| Occupation | Male | Female |
| Sales & Related | 39 (100.0%) | 0 (0.0%) |
| Office & Administration | 0 (0.0%) | 0 (0.0%) |
| Total (Category) | 39 (100.0%) | 0 (0.0%) |
| Total (Overall) | 71 (83.5%) | 14 (16.5%) |
Natural Resources, Construction and Maintenance Occupations
Natural Resources, Construction and Maintenance Occupations by Sex
| Occupation | Male | Female |
| Farming, Fishing & Forestry | 0 (0.0%) | 0 (0.0%) |
| Construction & Extraction | 0 (0.0%) | 0 (0.0%) |
| Installation, Maintenance & Repair | 0 (0.0%) | 0 (0.0%) |
| Total (Category) | 0 (0.0%) | 0 (0.0%) |
| Total (Overall) | 71 (83.5%) | 14 (16.5%) |
Production, Transportation and Moving Occupations
The most common Production, Transportation and Moving occupations in New Marshfield are Transportation (17 | 20.0%), and Material Moving (15 | 17.6%).
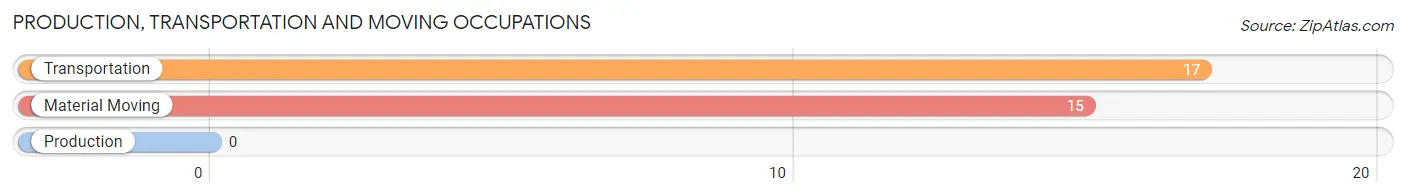
Production, Transportation and Moving Occupations by Sex
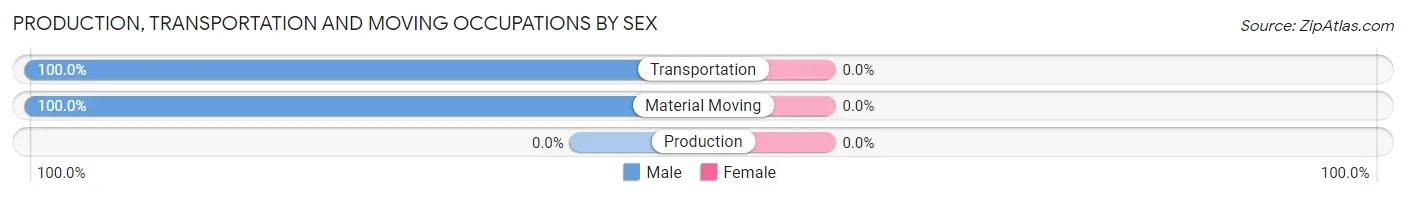
| Occupation | Male | Female |
| Production | 0 (0.0%) | 0 (0.0%) |
| Transportation | 17 (100.0%) | 0 (0.0%) |
| Material Moving | 15 (100.0%) | 0 (0.0%) |
| Total (Category) | 32 (100.0%) | 0 (0.0%) |
| Total (Overall) | 71 (83.5%) | 14 (16.5%) |
Employment Industries by Sex in New Marshfield
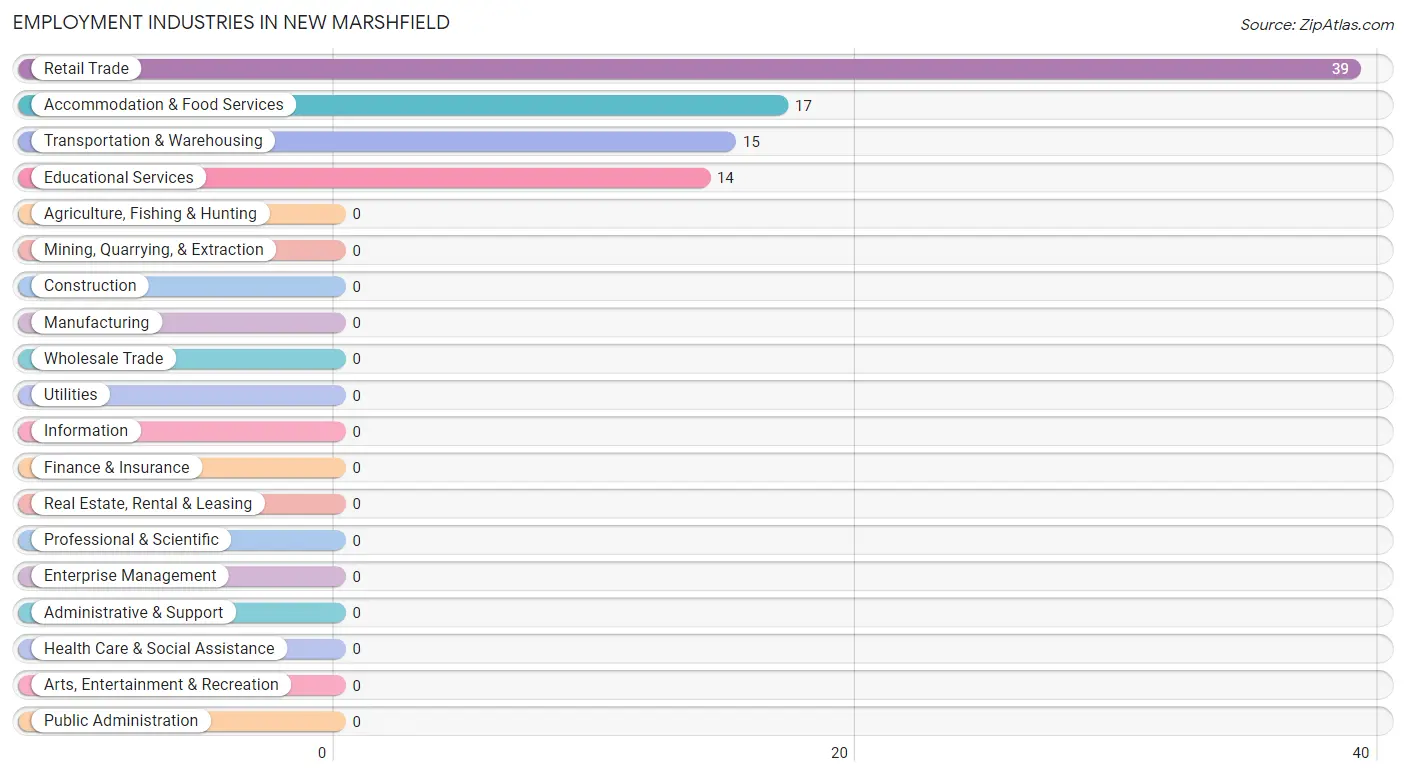
Employment Industries in New Marshfield
The major employment industries in New Marshfield include Retail Trade (39 | 45.9%), Accommodation & Food Services (17 | 20.0%), Transportation & Warehousing (15 | 17.6%), and Educational Services (14 | 16.5%).
Employment Industries by Sex in New Marshfield
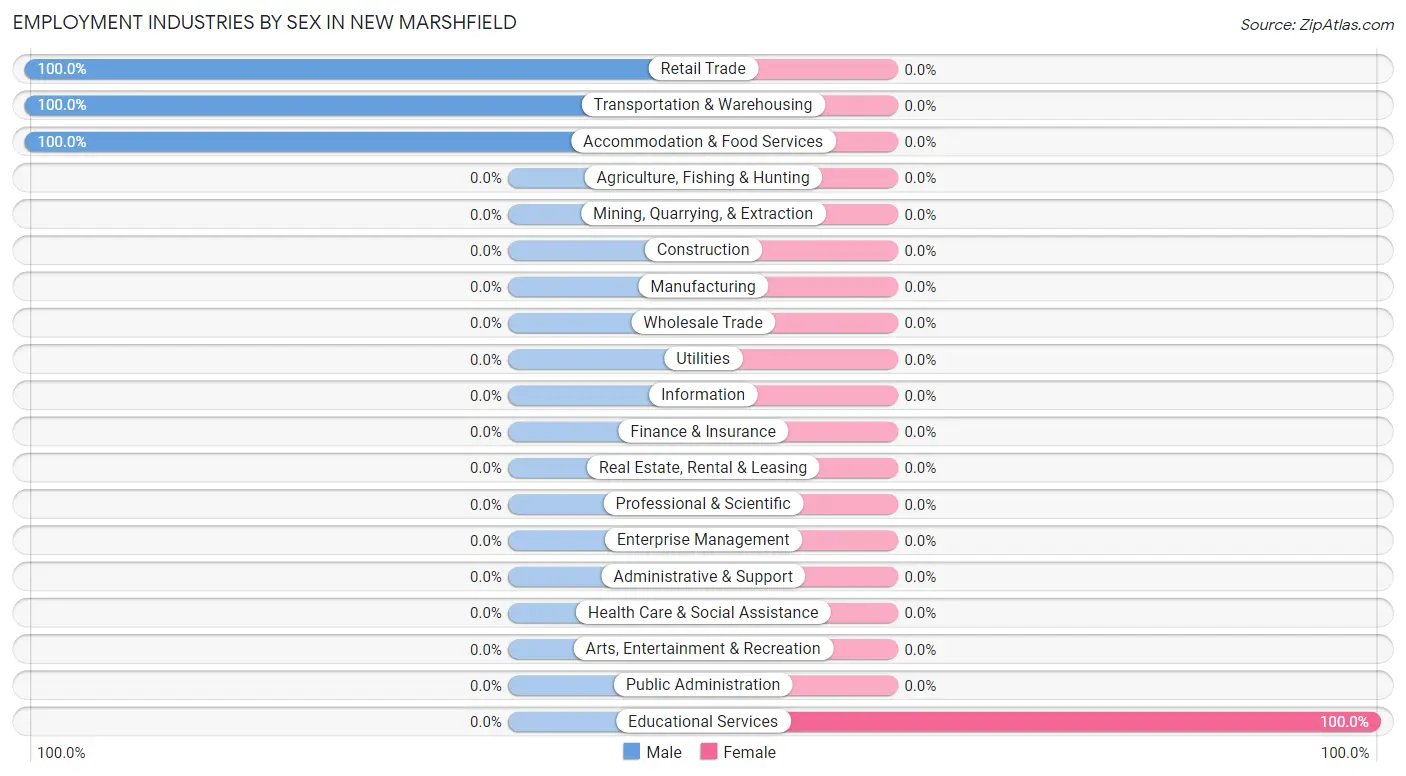
| Industry | Male | Female |
| Agriculture, Fishing & Hunting | 0 (0.0%) | 0 (0.0%) |
| Mining, Quarrying, & Extraction | 0 (0.0%) | 0 (0.0%) |
| Construction | 0 (0.0%) | 0 (0.0%) |
| Manufacturing | 0 (0.0%) | 0 (0.0%) |
| Wholesale Trade | 0 (0.0%) | 0 (0.0%) |
| Retail Trade | 39 (100.0%) | 0 (0.0%) |
| Transportation & Warehousing | 15 (100.0%) | 0 (0.0%) |
| Utilities | 0 (0.0%) | 0 (0.0%) |
| Information | 0 (0.0%) | 0 (0.0%) |
| Finance & Insurance | 0 (0.0%) | 0 (0.0%) |
| Real Estate, Rental & Leasing | 0 (0.0%) | 0 (0.0%) |
| Professional & Scientific | 0 (0.0%) | 0 (0.0%) |
| Enterprise Management | 0 (0.0%) | 0 (0.0%) |
| Administrative & Support | 0 (0.0%) | 0 (0.0%) |
| Educational Services | 0 (0.0%) | 14 (100.0%) |
| Health Care & Social Assistance | 0 (0.0%) | 0 (0.0%) |
| Arts, Entertainment & Recreation | 0 (0.0%) | 0 (0.0%) |
| Accommodation & Food Services | 17 (100.0%) | 0 (0.0%) |
| Public Administration | 0 (0.0%) | 0 (0.0%) |
| Total | 71 (83.5%) | 14 (16.5%) |
Education in New Marshfield
School Enrollment in New Marshfield
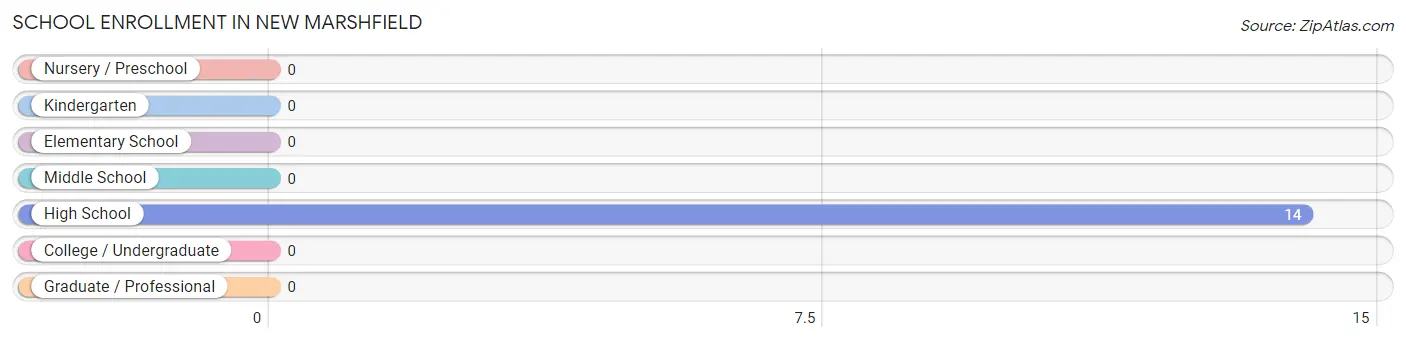
| School Level | # Students | % Students |
| Nursery / Preschool | 0 | 0.0% |
| Kindergarten | 0 | 0.0% |
| Elementary School | 0 | 0.0% |
| Middle School | 0 | 0.0% |
| High School | 14 | 100.0% |
| College / Undergraduate | 0 | 0.0% |
| Graduate / Professional | 0 | 0.0% |
| Total | 14 | 100.0% |
School Enrollment by Age by Funding Source in New Marshfield
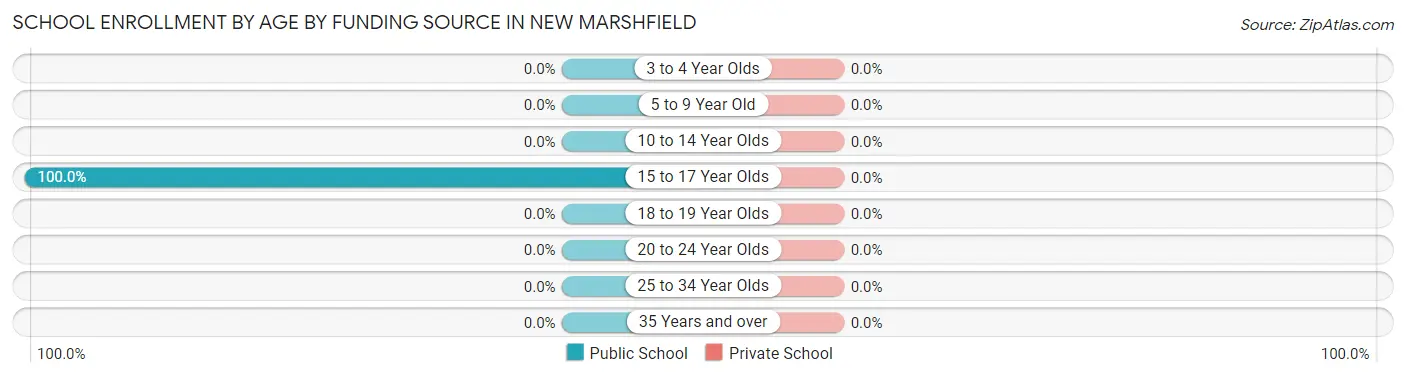
| Age Bracket | Public School | Private School |
| 3 to 4 Year Olds | 0 (0.0%) | 0 (0.0%) |
| 5 to 9 Year Old | 0 (0.0%) | 0 (0.0%) |
| 10 to 14 Year Olds | 0 (0.0%) | 0 (0.0%) |
| 15 to 17 Year Olds | 14 (100.0%) | 0 (0.0%) |
| 18 to 19 Year Olds | 0 (0.0%) | 0 (0.0%) |
| 20 to 24 Year Olds | 0 (0.0%) | 0 (0.0%) |
| 25 to 34 Year Olds | 0 (0.0%) | 0 (0.0%) |
| 35 Years and over | 0 (0.0%) | 0 (0.0%) |
| Total | 14 (100.0%) | 0 (0.0%) |
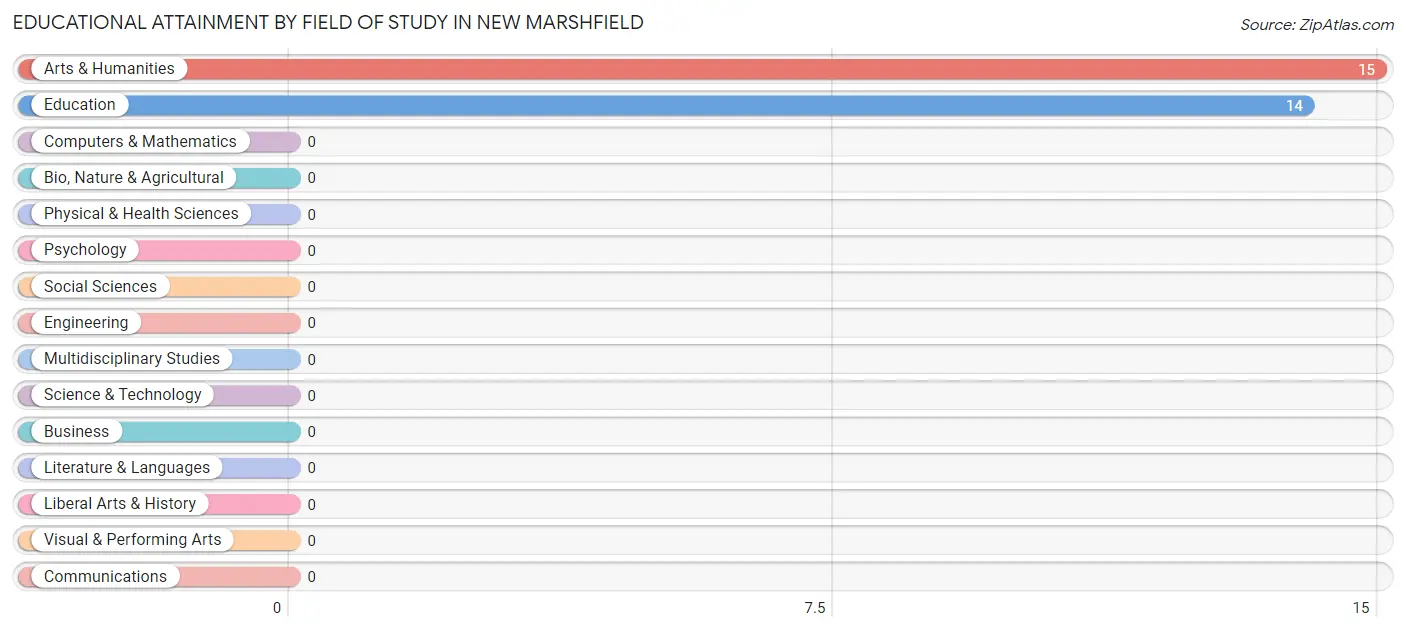
Educational Attainment by Field of Study in New Marshfield
Arts & humanities (15 | 51.7%), and education (14 | 48.3%) are the most common fields of study among 29 individuals in New Marshfield who have obtained a bachelor's degree or higher.
| Field of Study | # Graduates | % Graduates |
| Computers & Mathematics | 0 | 0.0% |
| Bio, Nature & Agricultural | 0 | 0.0% |
| Physical & Health Sciences | 0 | 0.0% |
| Psychology | 0 | 0.0% |
| Social Sciences | 0 | 0.0% |
| Engineering | 0 | 0.0% |
| Multidisciplinary Studies | 0 | 0.0% |
| Science & Technology | 0 | 0.0% |
| Business | 0 | 0.0% |
| Education | 14 | 48.3% |
| Literature & Languages | 0 | 0.0% |
| Liberal Arts & History | 0 | 0.0% |
| Visual & Performing Arts | 0 | 0.0% |
| Communications | 0 | 0.0% |
| Arts & Humanities | 15 | 51.7% |
| Total | 29 | 100.0% |
Transportation & Commute in New Marshfield
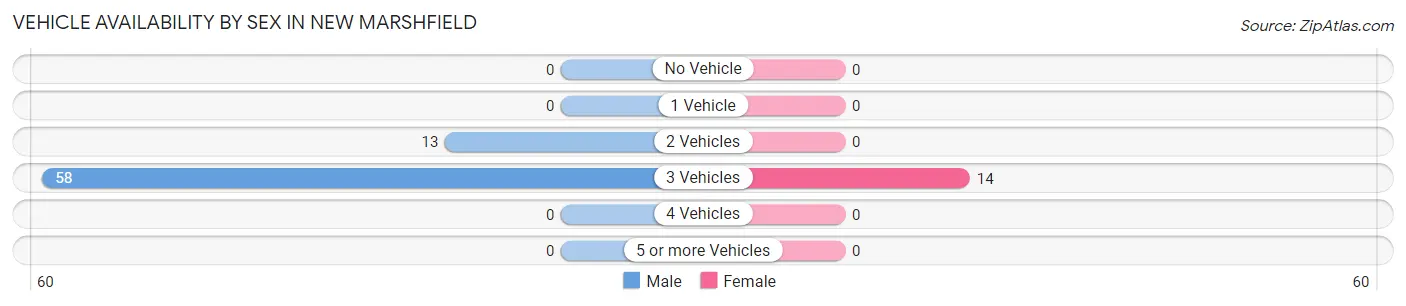
Vehicle Availability by Sex in New Marshfield
The most prevalent vehicle ownership categories in New Marshfield are males with 3 vehicles (58, accounting for 81.7%) and females with 3 vehicles (14, making up 414.3%).
| Vehicles Available | Male | Female |
| No Vehicle | 0 (0.0%) | 0 (0.0%) |
| 1 Vehicle | 0 (0.0%) | 0 (0.0%) |
| 2 Vehicles | 13 (18.3%) | 0 (0.0%) |
| 3 Vehicles | 58 (81.7%) | 14 (100.0%) |
| 4 Vehicles | 0 (0.0%) | 0 (0.0%) |
| 5 or more Vehicles | 0 (0.0%) | 0 (0.0%) |
| Total | 71 (100.0%) | 14 (100.0%) |
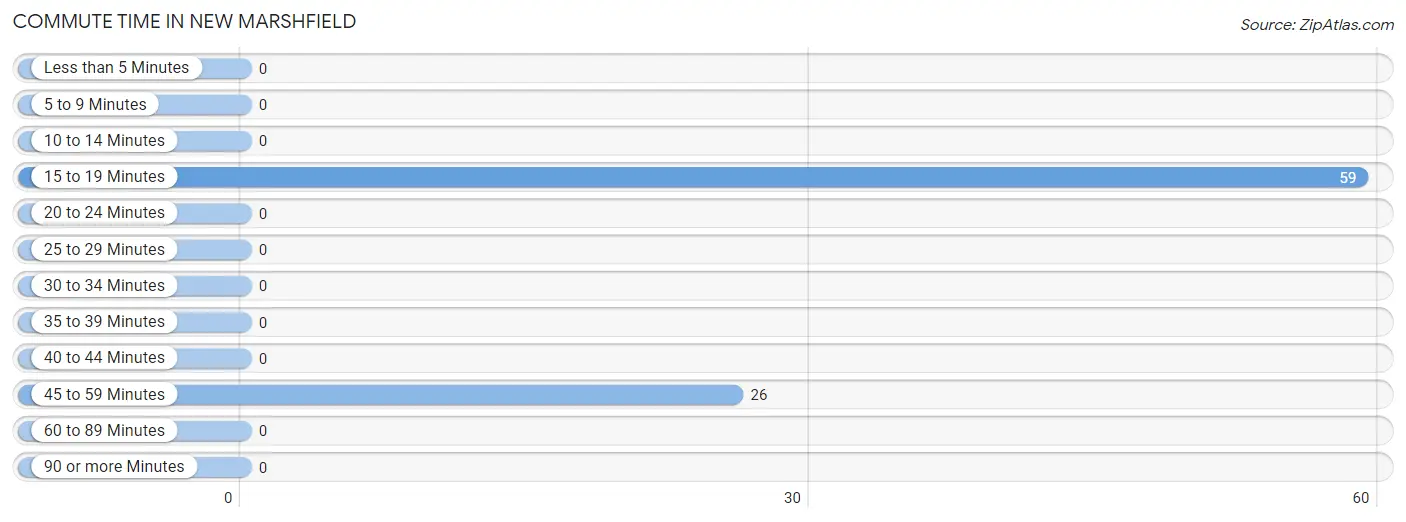
Commute Time in New Marshfield
The most frequently occuring commute durations in New Marshfield are 15 to 19 minutes (59 commuters, 69.4%), 45 to 59 minutes (26 commuters, 30.6%), and less than 5 minutes (0 commuters, 0.0%).
| Commute Time | # Commuters | % Commuters |
| Less than 5 Minutes | 0 | 0.0% |
| 5 to 9 Minutes | 0 | 0.0% |
| 10 to 14 Minutes | 0 | 0.0% |
| 15 to 19 Minutes | 59 | 69.4% |
| 20 to 24 Minutes | 0 | 0.0% |
| 25 to 29 Minutes | 0 | 0.0% |
| 30 to 34 Minutes | 0 | 0.0% |
| 35 to 39 Minutes | 0 | 0.0% |
| 40 to 44 Minutes | 0 | 0.0% |
| 45 to 59 Minutes | 26 | 30.6% |
| 60 to 89 Minutes | 0 | 0.0% |
| 90 or more Minutes | 0 | 0.0% |
Commute Time by Sex in New Marshfield
The most common commute times in New Marshfield are 15 to 19 minutes (45 commuters, 63.4%) for males and 15 to 19 minutes (14 commuters, 100.0%) for females.
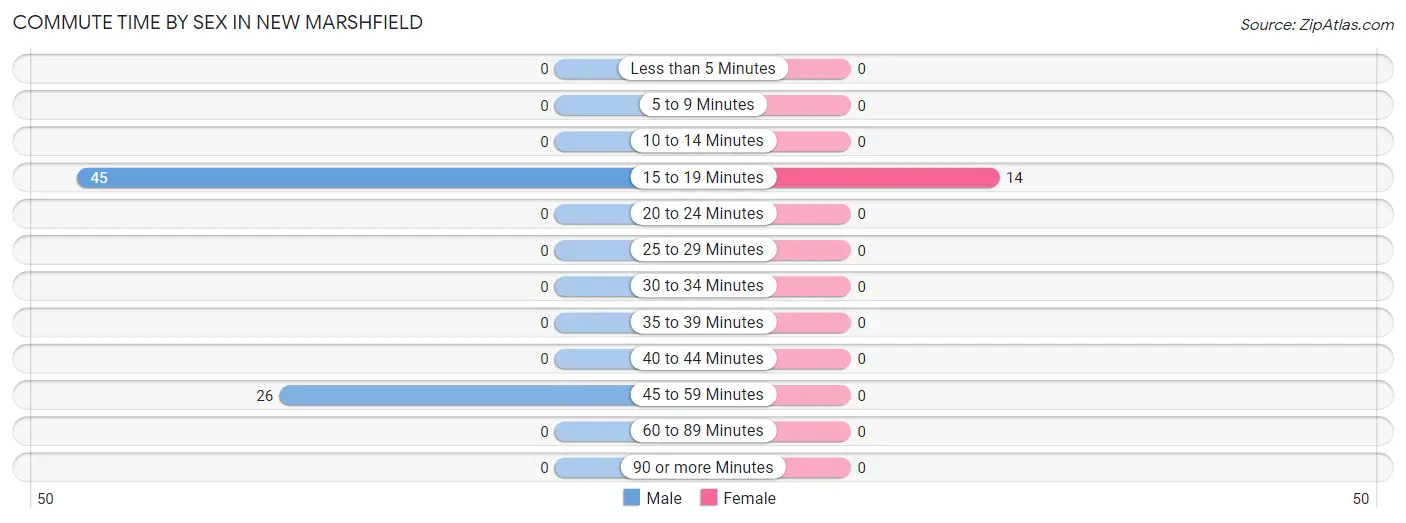
| Commute Time | Male | Female |
| Less than 5 Minutes | 0 (0.0%) | 0 (0.0%) |
| 5 to 9 Minutes | 0 (0.0%) | 0 (0.0%) |
| 10 to 14 Minutes | 0 (0.0%) | 0 (0.0%) |
| 15 to 19 Minutes | 45 (63.4%) | 14 (100.0%) |
| 20 to 24 Minutes | 0 (0.0%) | 0 (0.0%) |
| 25 to 29 Minutes | 0 (0.0%) | 0 (0.0%) |
| 30 to 34 Minutes | 0 (0.0%) | 0 (0.0%) |
| 35 to 39 Minutes | 0 (0.0%) | 0 (0.0%) |
| 40 to 44 Minutes | 0 (0.0%) | 0 (0.0%) |
| 45 to 59 Minutes | 26 (36.6%) | 0 (0.0%) |
| 60 to 89 Minutes | 0 (0.0%) | 0 (0.0%) |
| 90 or more Minutes | 0 (0.0%) | 0 (0.0%) |
Time of Departure to Work by Sex in New Marshfield
The most frequent times of departure to work in New Marshfield are 7:30 AM to 7:59 AM (43, 60.6%) for males and 6:30 AM to 6:59 AM (14, 100.0%) for females.
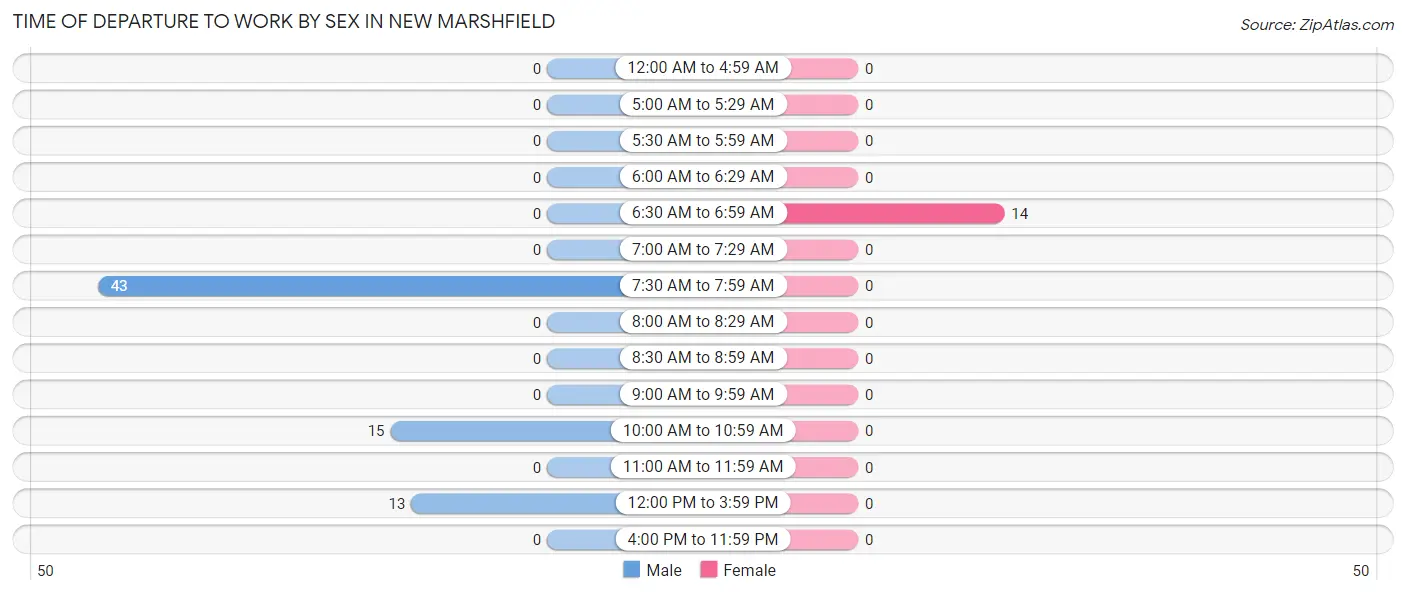
| Time of Departure | Male | Female |
| 12:00 AM to 4:59 AM | 0 (0.0%) | 0 (0.0%) |
| 5:00 AM to 5:29 AM | 0 (0.0%) | 0 (0.0%) |
| 5:30 AM to 5:59 AM | 0 (0.0%) | 0 (0.0%) |
| 6:00 AM to 6:29 AM | 0 (0.0%) | 0 (0.0%) |
| 6:30 AM to 6:59 AM | 0 (0.0%) | 14 (100.0%) |
| 7:00 AM to 7:29 AM | 0 (0.0%) | 0 (0.0%) |
| 7:30 AM to 7:59 AM | 43 (60.6%) | 0 (0.0%) |
| 8:00 AM to 8:29 AM | 0 (0.0%) | 0 (0.0%) |
| 8:30 AM to 8:59 AM | 0 (0.0%) | 0 (0.0%) |
| 9:00 AM to 9:59 AM | 0 (0.0%) | 0 (0.0%) |
| 10:00 AM to 10:59 AM | 15 (21.1%) | 0 (0.0%) |
| 11:00 AM to 11:59 AM | 0 (0.0%) | 0 (0.0%) |
| 12:00 PM to 3:59 PM | 13 (18.3%) | 0 (0.0%) |
| 4:00 PM to 11:59 PM | 0 (0.0%) | 0 (0.0%) |
| Total | 71 (100.0%) | 14 (100.0%) |
Housing Occupancy in New Marshfield
Occupancy by Ownership in New Marshfield
Of the total 101 dwellings in New Marshfield, owner-occupied units account for 84 (83.2%), while renter-occupied units make up 17 (16.8%).
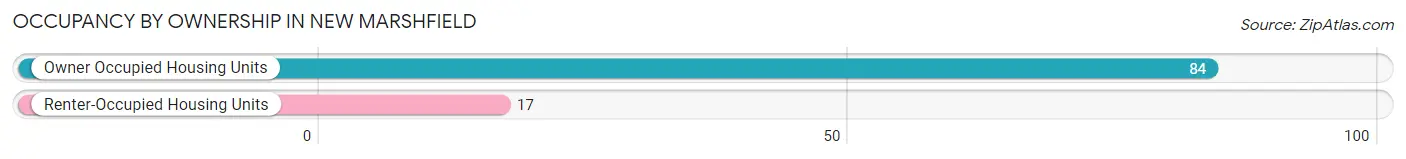
| Occupancy | # Housing Units | % Housing Units |
| Owner Occupied Housing Units | 84 | 83.2% |
| Renter-Occupied Housing Units | 17 | 16.8% |
| Total Occupied Housing Units | 101 | 100.0% |
Occupancy by Household Size in New Marshfield
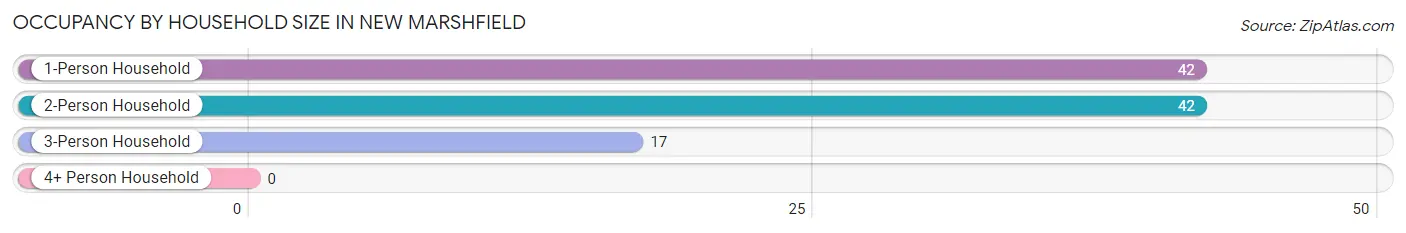
| Household Size | # Housing Units | % Housing Units |
| 1-Person Household | 42 | 41.6% |
| 2-Person Household | 42 | 41.6% |
| 3-Person Household | 17 | 16.8% |
| 4+ Person Household | 0 | 0.0% |
| Total Housing Units | 101 | 100.0% |
Occupancy by Ownership by Household Size in New Marshfield
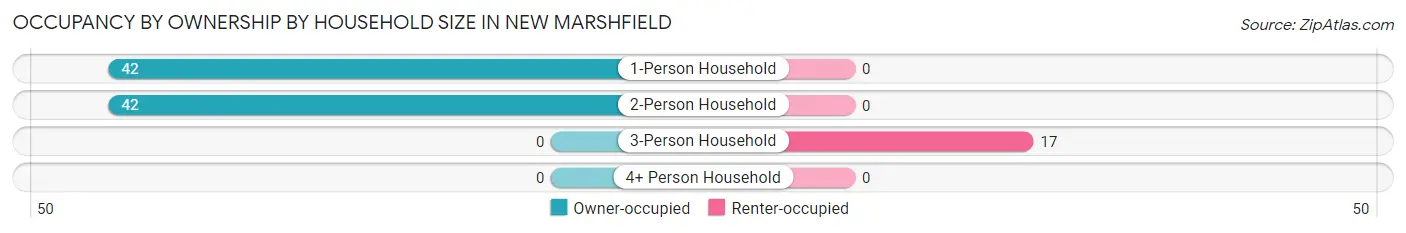
| Household Size | Owner-occupied | Renter-occupied |
| 1-Person Household | 42 (100.0%) | 0 (0.0%) |
| 2-Person Household | 42 (100.0%) | 0 (0.0%) |
| 3-Person Household | 0 (0.0%) | 17 (100.0%) |
| 4+ Person Household | 0 (0.0%) | 0 (0.0%) |
| Total Housing Units | 84 (83.2%) | 17 (16.8%) |
Occupancy by Educational Attainment in New Marshfield
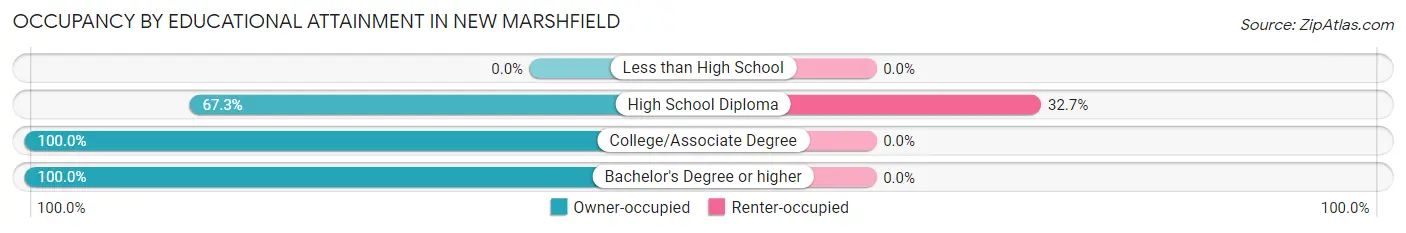
| Household Size | Owner-occupied | Renter-occupied |
| Less than High School | 0 (0.0%) | 0 (0.0%) |
| High School Diploma | 35 (67.3%) | 17 (32.7%) |
| College/Associate Degree | 20 (100.0%) | 0 (0.0%) |
| Bachelor's Degree or higher | 29 (100.0%) | 0 (0.0%) |
Occupancy by Age of Householder in New Marshfield
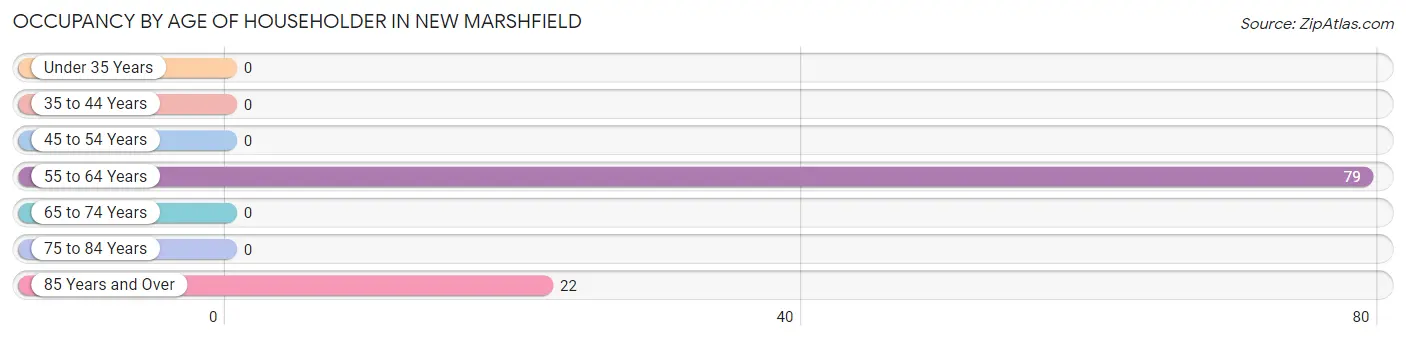
| Age Bracket | # Households | % Households |
| Under 35 Years | 0 | 0.0% |
| 35 to 44 Years | 0 | 0.0% |
| 45 to 54 Years | 0 | 0.0% |
| 55 to 64 Years | 79 | 78.2% |
| 65 to 74 Years | 0 | 0.0% |
| 75 to 84 Years | 0 | 0.0% |
| 85 Years and Over | 22 | 21.8% |
| Total | 101 | 100.0% |
Housing Finances in New Marshfield
Median Income by Occupancy in New Marshfield
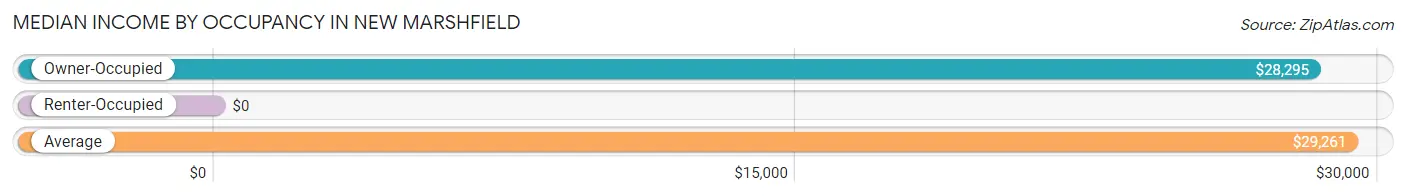
| Occupancy Type | # Households | Median Income |
| Owner-Occupied | 84 (83.2%) | $28,295 |
| Renter-Occupied | 17 (16.8%) | $0 |
| Average | 101 (100.0%) | $29,261 |
Occupancy by Householder Income Bracket in New Marshfield
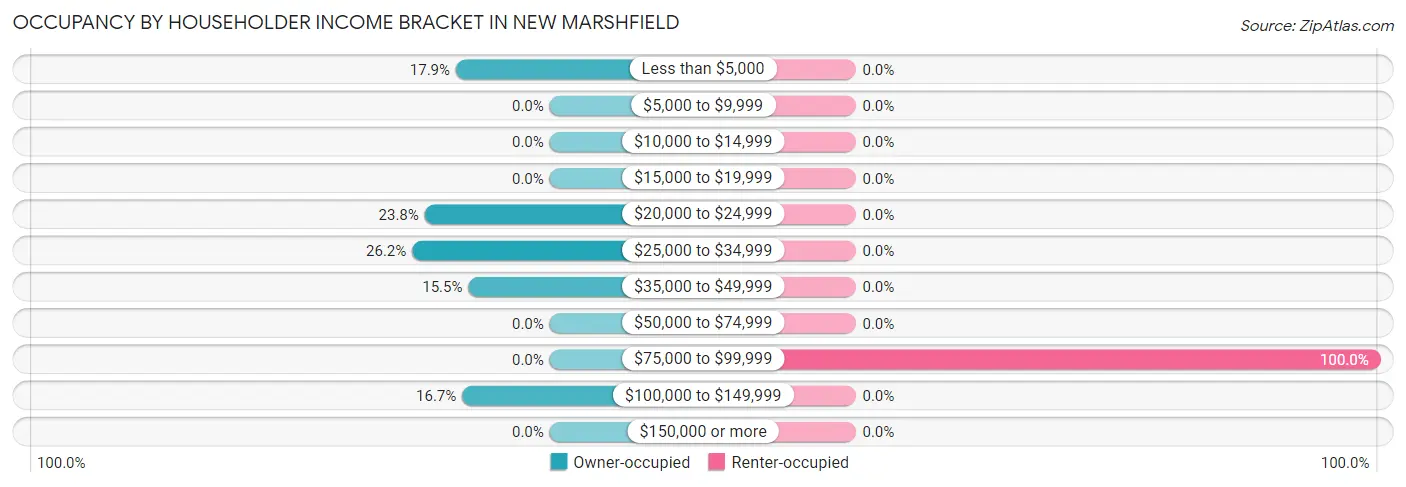
| Income Bracket | Owner-occupied | Renter-occupied |
| Less than $5,000 | 15 (17.9%) | 0 (0.0%) |
| $5,000 to $9,999 | 0 (0.0%) | 0 (0.0%) |
| $10,000 to $14,999 | 0 (0.0%) | 0 (0.0%) |
| $15,000 to $19,999 | 0 (0.0%) | 0 (0.0%) |
| $20,000 to $24,999 | 20 (23.8%) | 0 (0.0%) |
| $25,000 to $34,999 | 22 (26.2%) | 0 (0.0%) |
| $35,000 to $49,999 | 13 (15.5%) | 0 (0.0%) |
| $50,000 to $74,999 | 0 (0.0%) | 0 (0.0%) |
| $75,000 to $99,999 | 0 (0.0%) | 17 (100.0%) |
| $100,000 to $149,999 | 14 (16.7%) | 0 (0.0%) |
| $150,000 or more | 0 (0.0%) | 0 (0.0%) |
| Total | 84 (100.0%) | 17 (100.0%) |
Monthly Housing Cost Tiers in New Marshfield
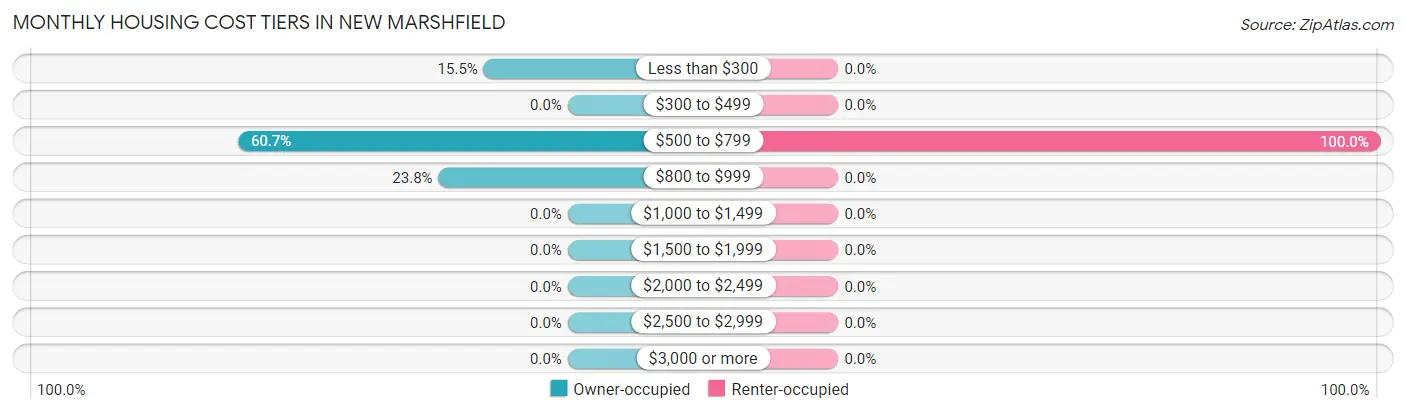
| Monthly Cost | Owner-occupied | Renter-occupied |
| Less than $300 | 13 (15.5%) | 0 (0.0%) |
| $300 to $499 | 0 (0.0%) | 0 (0.0%) |
| $500 to $799 | 51 (60.7%) | 17 (100.0%) |
| $800 to $999 | 20 (23.8%) | 0 (0.0%) |
| $1,000 to $1,499 | 0 (0.0%) | 0 (0.0%) |
| $1,500 to $1,999 | 0 (0.0%) | 0 (0.0%) |
| $2,000 to $2,499 | 0 (0.0%) | 0 (0.0%) |
| $2,500 to $2,999 | 0 (0.0%) | 0 (0.0%) |
| $3,000 or more | 0 (0.0%) | 0 (0.0%) |
| Total | 84 (100.0%) | 17 (100.0%) |
Physical Housing Characteristics in New Marshfield
Housing Structures in New Marshfield
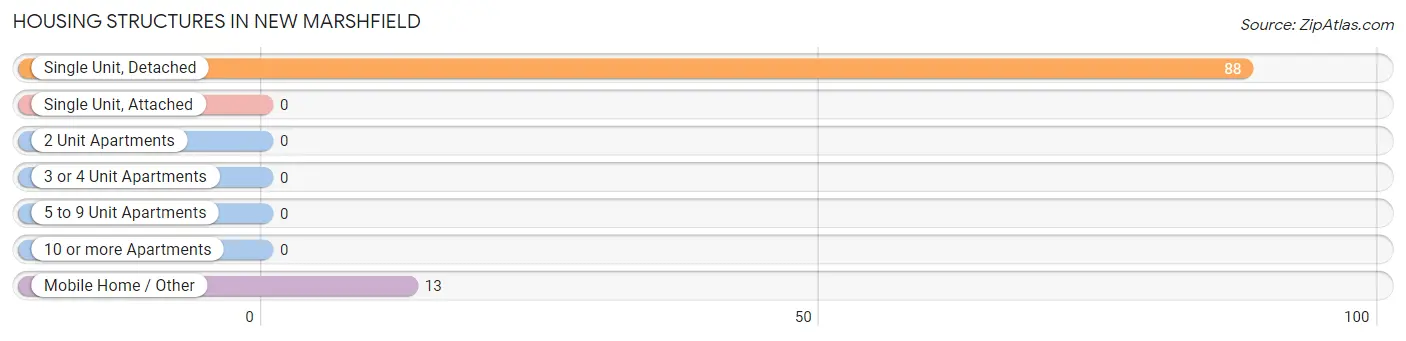
| Structure Type | # Housing Units | % Housing Units |
| Single Unit, Detached | 88 | 87.1% |
| Single Unit, Attached | 0 | 0.0% |
| 2 Unit Apartments | 0 | 0.0% |
| 3 or 4 Unit Apartments | 0 | 0.0% |
| 5 to 9 Unit Apartments | 0 | 0.0% |
| 10 or more Apartments | 0 | 0.0% |
| Mobile Home / Other | 13 | 12.9% |
| Total | 101 | 100.0% |
Housing Structures by Occupancy in New Marshfield
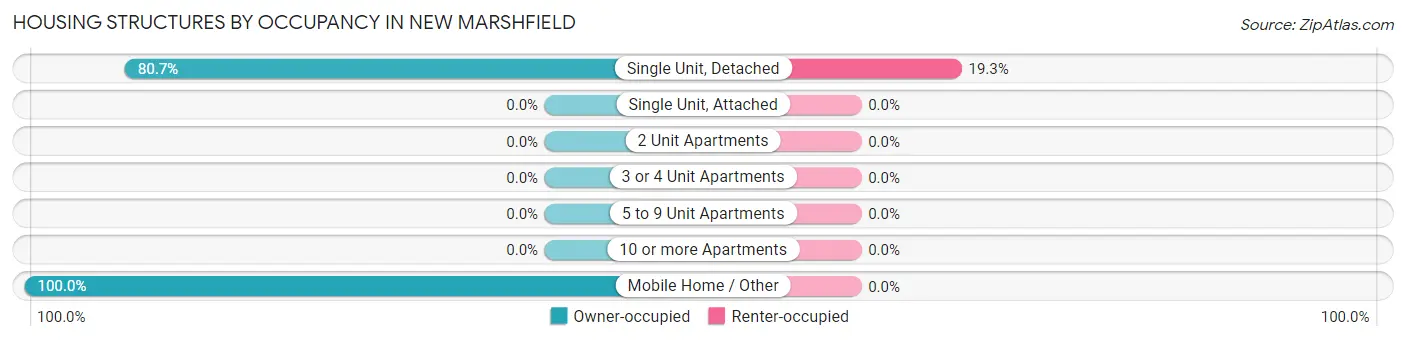
| Structure Type | Owner-occupied | Renter-occupied |
| Single Unit, Detached | 71 (80.7%) | 17 (19.3%) |
| Single Unit, Attached | 0 (0.0%) | 0 (0.0%) |
| 2 Unit Apartments | 0 (0.0%) | 0 (0.0%) |
| 3 or 4 Unit Apartments | 0 (0.0%) | 0 (0.0%) |
| 5 to 9 Unit Apartments | 0 (0.0%) | 0 (0.0%) |
| 10 or more Apartments | 0 (0.0%) | 0 (0.0%) |
| Mobile Home / Other | 13 (100.0%) | 0 (0.0%) |
| Total | 84 (83.2%) | 17 (16.8%) |
Housing Structures by Number of Rooms in New Marshfield
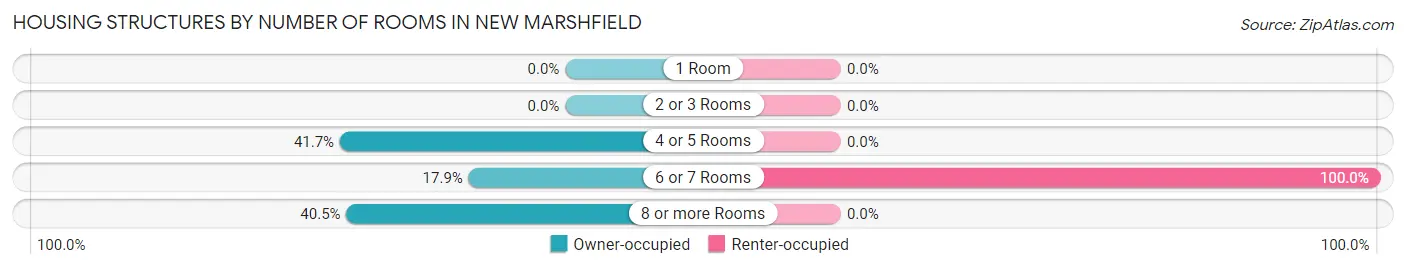
| Number of Rooms | Owner-occupied | Renter-occupied |
| 1 Room | 0 (0.0%) | 0 (0.0%) |
| 2 or 3 Rooms | 0 (0.0%) | 0 (0.0%) |
| 4 or 5 Rooms | 35 (41.7%) | 0 (0.0%) |
| 6 or 7 Rooms | 15 (17.9%) | 17 (100.0%) |
| 8 or more Rooms | 34 (40.5%) | 0 (0.0%) |
| Total | 84 (100.0%) | 17 (100.0%) |
Housing Structure by Heating Type in New Marshfield
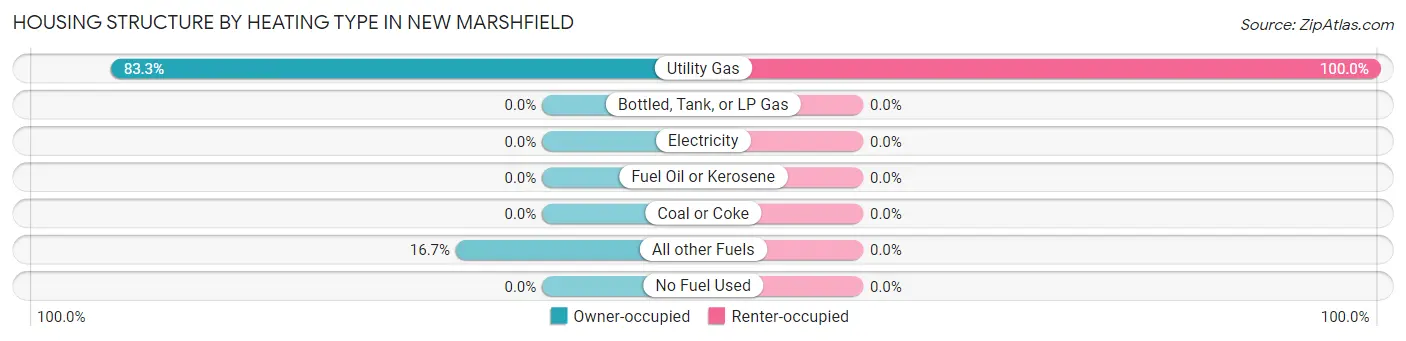
| Heating Type | Owner-occupied | Renter-occupied |
| Utility Gas | 70 (83.3%) | 17 (100.0%) |
| Bottled, Tank, or LP Gas | 0 (0.0%) | 0 (0.0%) |
| Electricity | 0 (0.0%) | 0 (0.0%) |
| Fuel Oil or Kerosene | 0 (0.0%) | 0 (0.0%) |
| Coal or Coke | 0 (0.0%) | 0 (0.0%) |
| All other Fuels | 14 (16.7%) | 0 (0.0%) |
| No Fuel Used | 0 (0.0%) | 0 (0.0%) |
| Total | 84 (100.0%) | 17 (100.0%) |
Household Vehicle Usage in New Marshfield
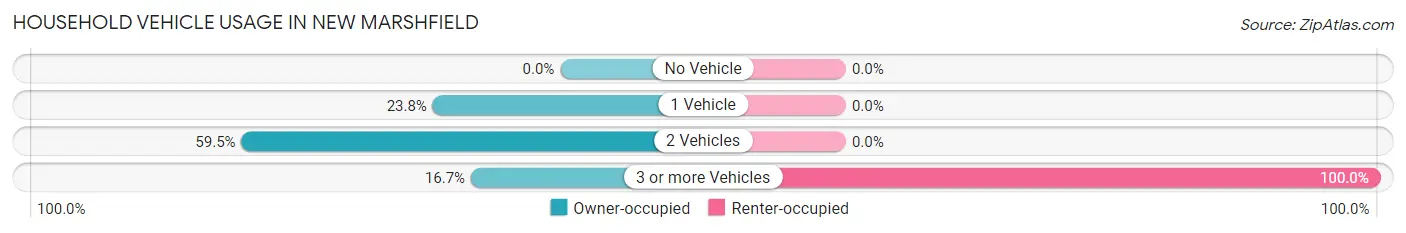
| Vehicles per Household | Owner-occupied | Renter-occupied |
| No Vehicle | 0 (0.0%) | 0 (0.0%) |
| 1 Vehicle | 20 (23.8%) | 0 (0.0%) |
| 2 Vehicles | 50 (59.5%) | 0 (0.0%) |
| 3 or more Vehicles | 14 (16.7%) | 17 (100.0%) |
| Total | 84 (100.0%) | 17 (100.0%) |
Real Estate & Mortgages in New Marshfield
Real Estate and Mortgage Overview in New Marshfield
| Characteristic | Without Mortgage | With Mortgage |
| Housing Units | 49 | 35 |
| Median Property Value | $163,100 | $0 |
| Median Household Income | - | - |
| Monthly Housing Costs | $552 | $0 |
| Real Estate Taxes | $2,319 | $0 |
Property Value by Mortgage Status in New Marshfield
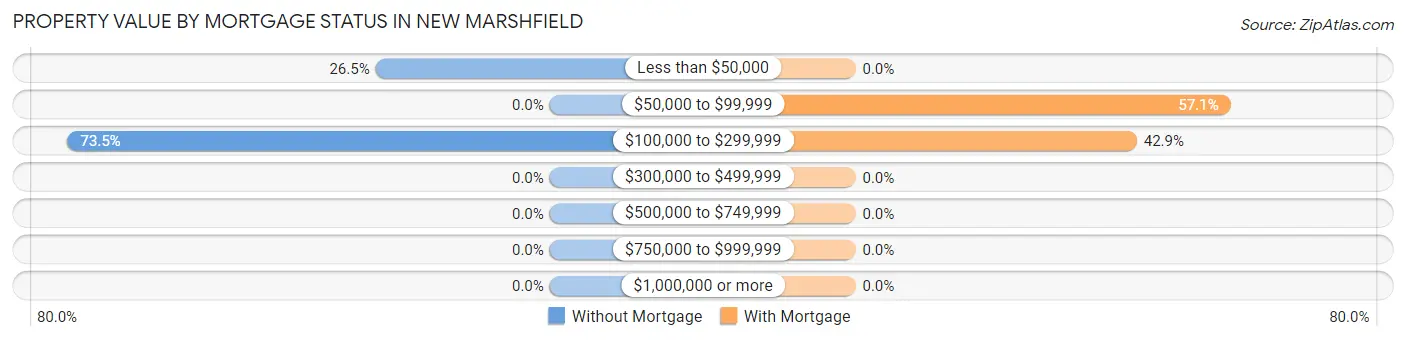
| Property Value | Without Mortgage | With Mortgage |
| Less than $50,000 | 13 (26.5%) | 0 (0.0%) |
| $50,000 to $99,999 | 0 (0.0%) | 20 (57.1%) |
| $100,000 to $299,999 | 36 (73.5%) | 15 (42.9%) |
| $300,000 to $499,999 | 0 (0.0%) | 0 (0.0%) |
| $500,000 to $749,999 | 0 (0.0%) | 0 (0.0%) |
| $750,000 to $999,999 | 0 (0.0%) | 0 (0.0%) |
| $1,000,000 or more | 0 (0.0%) | 0 (0.0%) |
| Total | 49 (100.0%) | 35 (100.0%) |
Household Income by Mortgage Status in New Marshfield
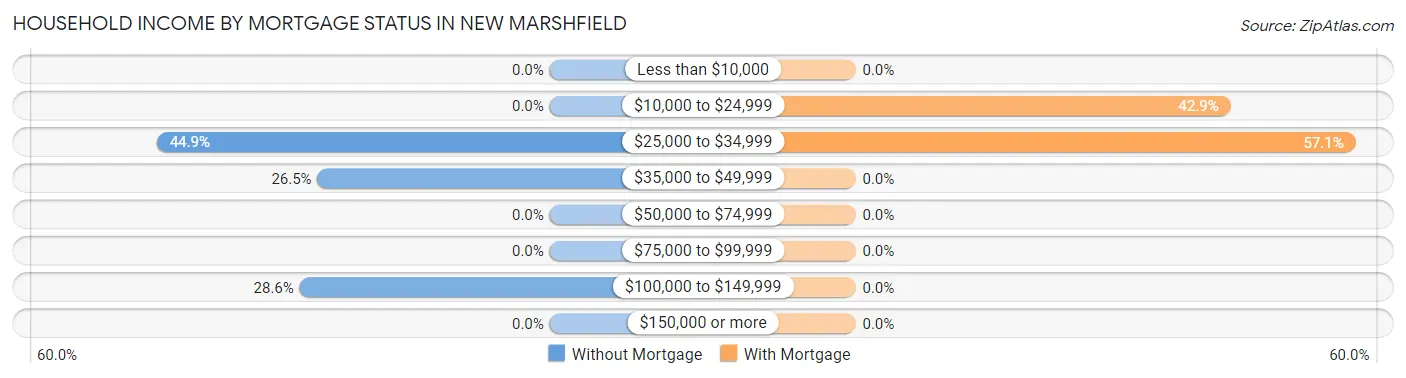
| Household Income | Without Mortgage | With Mortgage |
| Less than $10,000 | 0 (0.0%) | 0 (0.0%) |
| $10,000 to $24,999 | 0 (0.0%) | 15 (42.9%) |
| $25,000 to $34,999 | 22 (44.9%) | 20 (57.1%) |
| $35,000 to $49,999 | 13 (26.5%) | 0 (0.0%) |
| $50,000 to $74,999 | 0 (0.0%) | 0 (0.0%) |
| $75,000 to $99,999 | 0 (0.0%) | 0 (0.0%) |
| $100,000 to $149,999 | 14 (28.6%) | 0 (0.0%) |
| $150,000 or more | 0 (0.0%) | 0 (0.0%) |
| Total | 49 (100.0%) | 35 (100.0%) |
Property Value to Household Income Ratio in New Marshfield
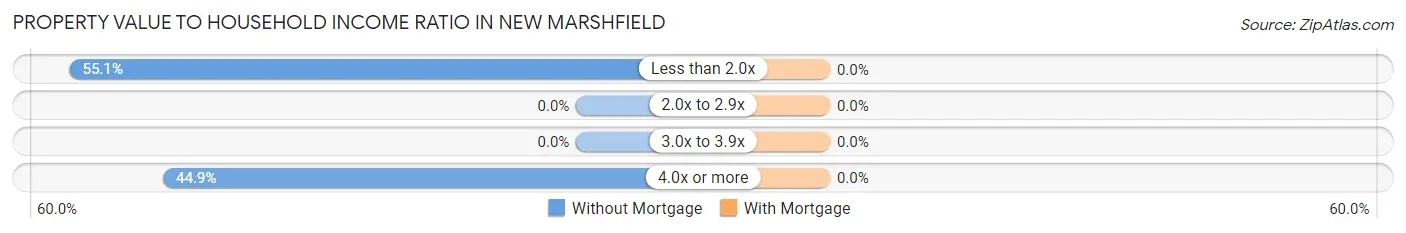
| Value-to-Income Ratio | Without Mortgage | With Mortgage |
| Less than 2.0x | 27 (55.1%) | 0 (0.0%) |
| 2.0x to 2.9x | 0 (0.0%) | 0 (0.0%) |
| 3.0x to 3.9x | 0 (0.0%) | 0 (0.0%) |
| 4.0x or more | 22 (44.9%) | 0 (0.0%) |
| Total | 49 (100.0%) | 35 (100.0%) |
Real Estate Taxes by Mortgage Status in New Marshfield
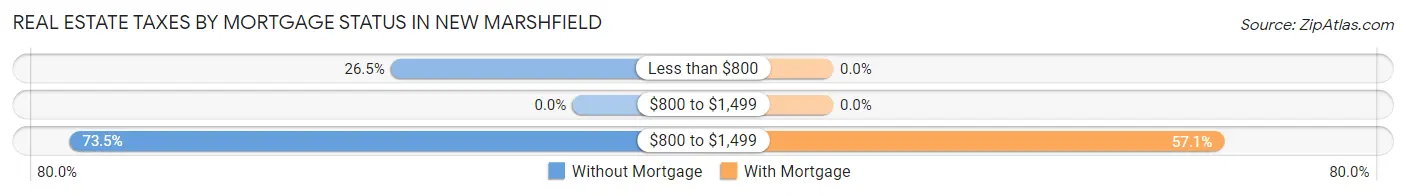
| Property Taxes | Without Mortgage | With Mortgage |
| Less than $800 | 13 (26.5%) | 0 (0.0%) |
| $800 to $1,499 | 0 (0.0%) | 0 (0.0%) |
| $800 to $1,499 | 36 (73.5%) | 20 (57.1%) |
| Total | 49 (100.0%) | 35 (100.0%) |
Health & Disability in New Marshfield
Health Insurance Coverage by Age in New Marshfield
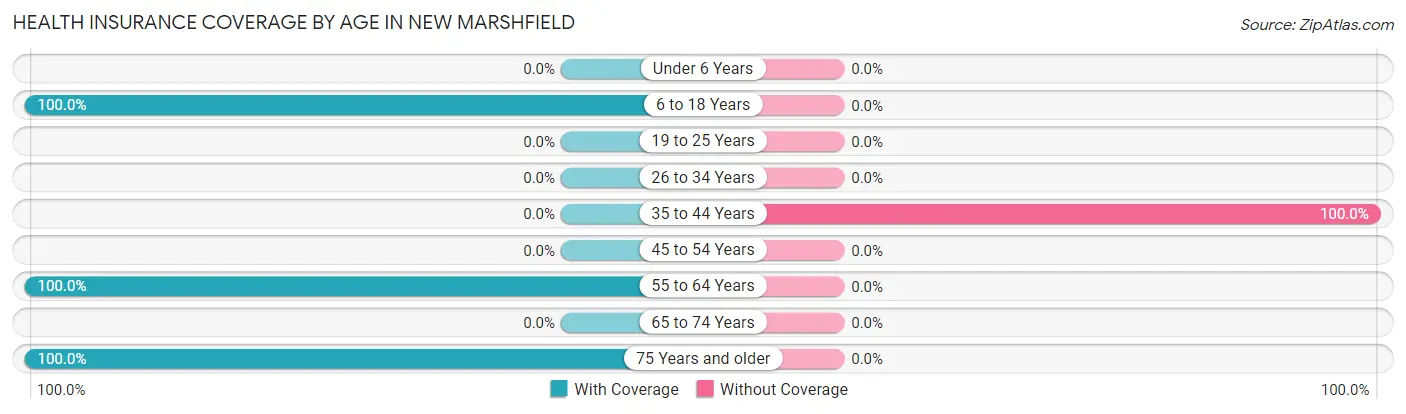
| Age Bracket | With Coverage | Without Coverage |
| Under 6 Years | 0 (0.0%) | 0 (0.0%) |
| 6 to 18 Years | 14 (100.0%) | 0 (0.0%) |
| 19 to 25 Years | 0 (0.0%) | 0 (0.0%) |
| 26 to 34 Years | 0 (0.0%) | 0 (0.0%) |
| 35 to 44 Years | 0 (0.0%) | 26 (100.0%) |
| 45 to 54 Years | 0 (0.0%) | 0 (0.0%) |
| 55 to 64 Years | 122 (100.0%) | 0 (0.0%) |
| 65 to 74 Years | 0 (0.0%) | 0 (0.0%) |
| 75 Years and older | 22 (100.0%) | 0 (0.0%) |
| Total | 158 (85.9%) | 26 (14.1%) |
Health Insurance Coverage by Citizenship Status in New Marshfield
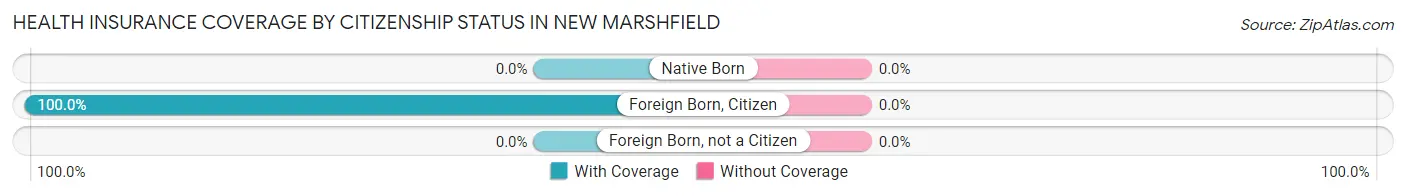
| Citizenship Status | With Coverage | Without Coverage |
| Native Born | 0 (0.0%) | 0 (0.0%) |
| Foreign Born, Citizen | 14 (100.0%) | 0 (0.0%) |
| Foreign Born, not a Citizen | 0 (0.0%) | 0 (0.0%) |
Health Insurance Coverage by Household Income in New Marshfield
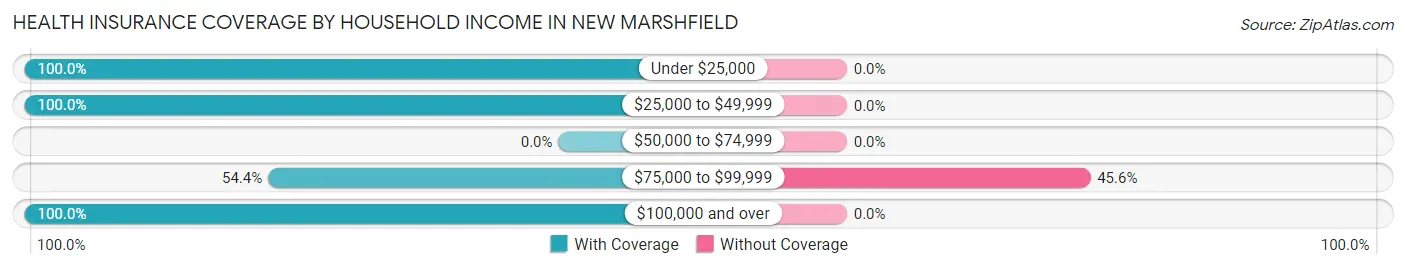
| Household Income | With Coverage | Without Coverage |
| Under $25,000 | 50 (100.0%) | 0 (0.0%) |
| $25,000 to $49,999 | 48 (100.0%) | 0 (0.0%) |
| $50,000 to $74,999 | 0 (0.0%) | 0 (0.0%) |
| $75,000 to $99,999 | 31 (54.4%) | 26 (45.6%) |
| $100,000 and over | 29 (100.0%) | 0 (0.0%) |
Public vs Private Health Insurance Coverage by Age in New Marshfield
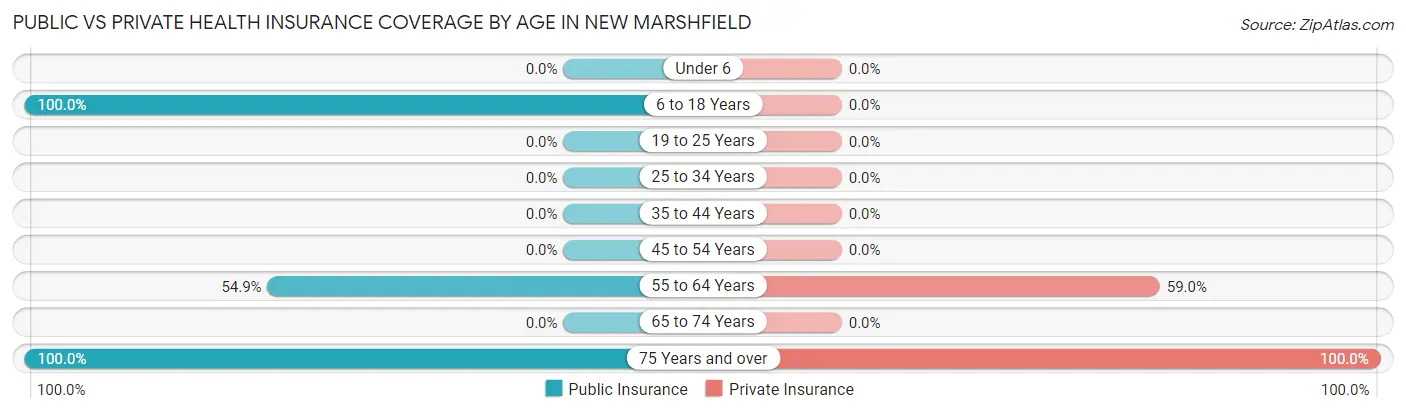
| Age Bracket | Public Insurance | Private Insurance |
| Under 6 | 0 (0.0%) | 0 (0.0%) |
| 6 to 18 Years | 14 (100.0%) | 0 (0.0%) |
| 19 to 25 Years | 0 (0.0%) | 0 (0.0%) |
| 25 to 34 Years | 0 (0.0%) | 0 (0.0%) |
| 35 to 44 Years | 0 (0.0%) | 0 (0.0%) |
| 45 to 54 Years | 0 (0.0%) | 0 (0.0%) |
| 55 to 64 Years | 67 (54.9%) | 72 (59.0%) |
| 65 to 74 Years | 0 (0.0%) | 0 (0.0%) |
| 75 Years and over | 22 (100.0%) | 22 (100.0%) |
| Total | 103 (56.0%) | 94 (51.1%) |
Disability Status by Sex by Age in New Marshfield
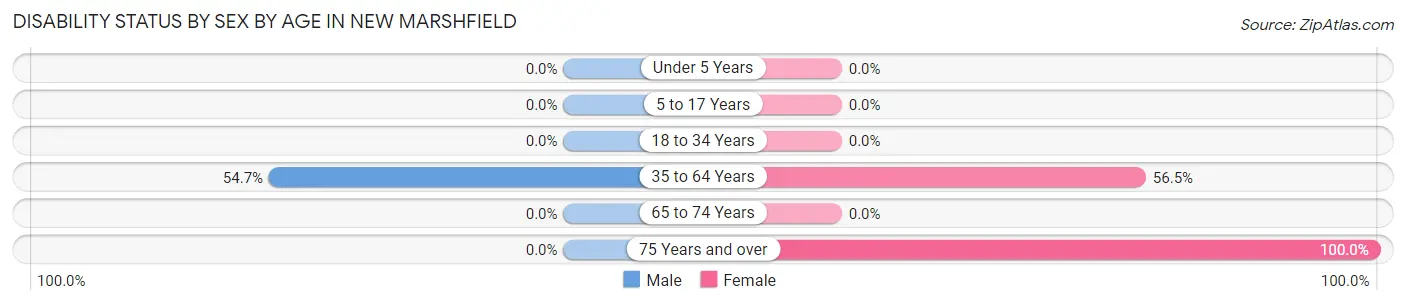
| Age Bracket | Male | Female |
| Under 5 Years | 0 (0.0%) | 0 (0.0%) |
| 5 to 17 Years | 0 (0.0%) | 0 (0.0%) |
| 18 to 34 Years | 0 (0.0%) | 0 (0.0%) |
| 35 to 64 Years | 47 (54.6%) | 35 (56.5%) |
| 65 to 74 Years | 0 (0.0%) | 0 (0.0%) |
| 75 Years and over | 0 (0.0%) | 22 (100.0%) |
Disability Class by Sex by Age in New Marshfield
Disability Class: Hearing Difficulty
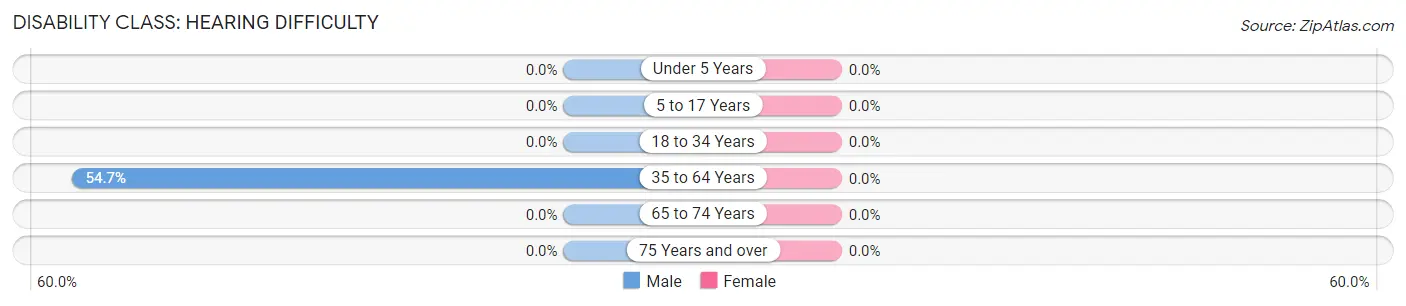
| Age Bracket | Male | Female |
| Under 5 Years | 0 (0.0%) | 0 (0.0%) |
| 5 to 17 Years | 0 (0.0%) | 0 (0.0%) |
| 18 to 34 Years | 0 (0.0%) | 0 (0.0%) |
| 35 to 64 Years | 47 (54.6%) | 0 (0.0%) |
| 65 to 74 Years | 0 (0.0%) | 0 (0.0%) |
| 75 Years and over | 0 (0.0%) | 0 (0.0%) |
Disability Class: Vision Difficulty
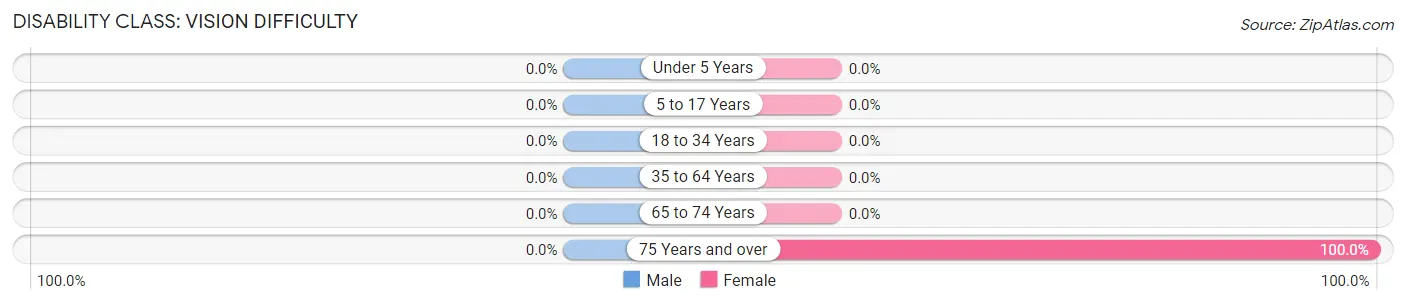
| Age Bracket | Male | Female |
| Under 5 Years | 0 (0.0%) | 0 (0.0%) |
| 5 to 17 Years | 0 (0.0%) | 0 (0.0%) |
| 18 to 34 Years | 0 (0.0%) | 0 (0.0%) |
| 35 to 64 Years | 0 (0.0%) | 0 (0.0%) |
| 65 to 74 Years | 0 (0.0%) | 0 (0.0%) |
| 75 Years and over | 0 (0.0%) | 22 (100.0%) |
Disability Class: Cognitive Difficulty
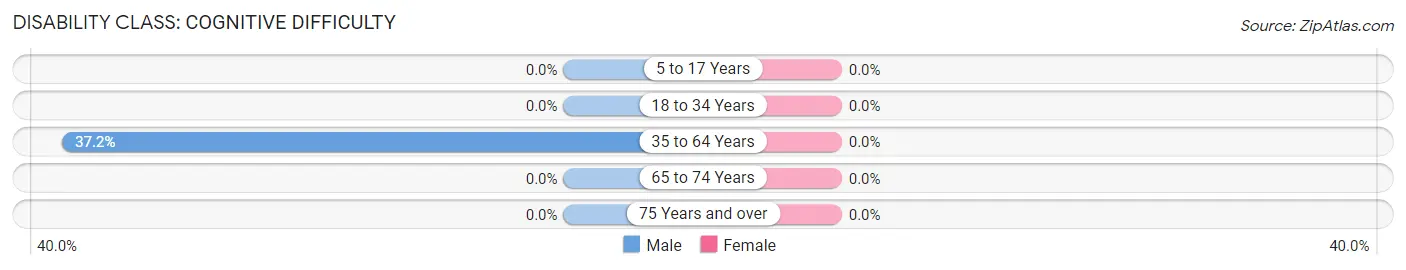
| Age Bracket | Male | Female |
| 5 to 17 Years | 0 (0.0%) | 0 (0.0%) |
| 18 to 34 Years | 0 (0.0%) | 0 (0.0%) |
| 35 to 64 Years | 32 (37.2%) | 0 (0.0%) |
| 65 to 74 Years | 0 (0.0%) | 0 (0.0%) |
| 75 Years and over | 0 (0.0%) | 0 (0.0%) |
Disability Class: Ambulatory Difficulty
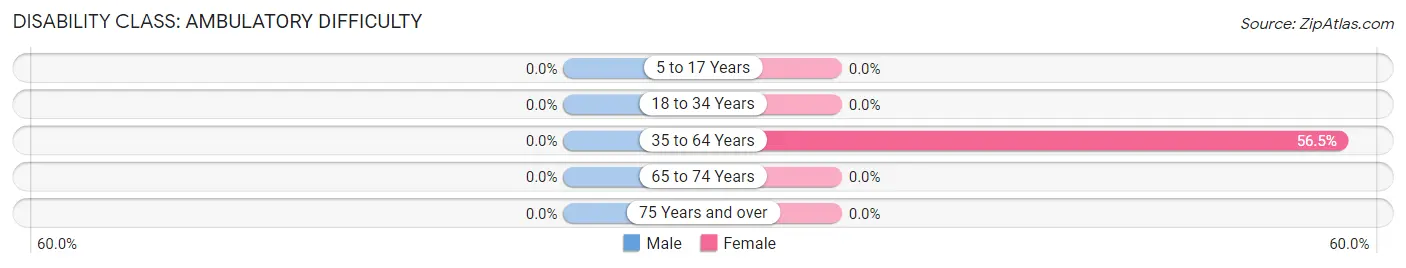
| Age Bracket | Male | Female |
| 5 to 17 Years | 0 (0.0%) | 0 (0.0%) |
| 18 to 34 Years | 0 (0.0%) | 0 (0.0%) |
| 35 to 64 Years | 0 (0.0%) | 35 (56.5%) |
| 65 to 74 Years | 0 (0.0%) | 0 (0.0%) |
| 75 Years and over | 0 (0.0%) | 0 (0.0%) |
Disability Class: Self-Care Difficulty
| Age Bracket | Male | Female |
| 5 to 17 Years | 0 (0.0%) | 0 (0.0%) |
| 18 to 34 Years | 0 (0.0%) | 0 (0.0%) |
| 35 to 64 Years | 0 (0.0%) | 0 (0.0%) |
| 65 to 74 Years | 0 (0.0%) | 0 (0.0%) |
| 75 Years and over | 0 (0.0%) | 0 (0.0%) |
Technology Access in New Marshfield
Computing Device Access in New Marshfield
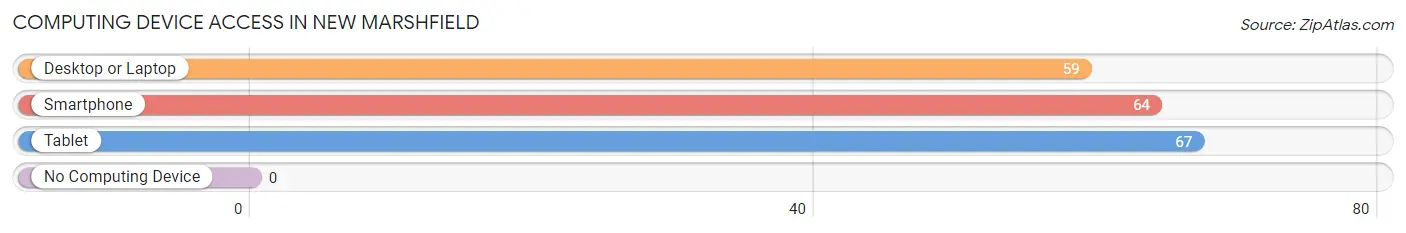
| Device Type | # Households | % Households |
| Desktop or Laptop | 59 | 58.4% |
| Smartphone | 64 | 63.4% |
| Tablet | 67 | 66.3% |
| No Computing Device | 0 | 0.0% |
| Total | 101 | 100.0% |
Internet Access in New Marshfield
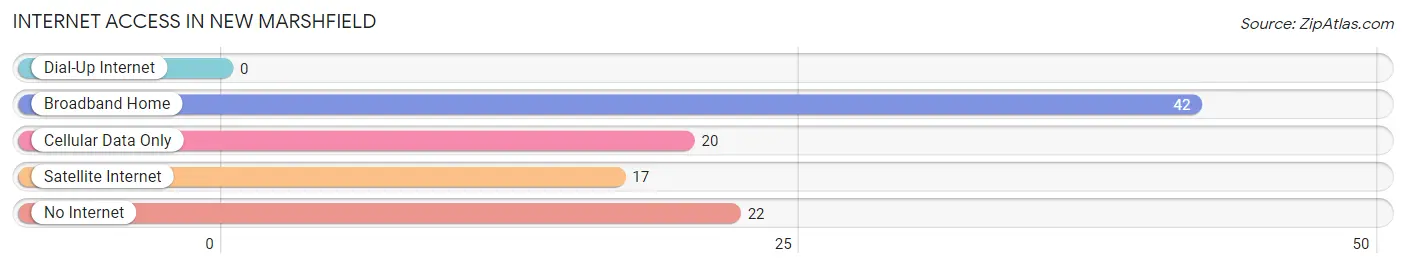
| Internet Type | # Households | % Households |
| Dial-Up Internet | 0 | 0.0% |
| Broadband Home | 42 | 41.6% |
| Cellular Data Only | 20 | 19.8% |
| Satellite Internet | 17 | 16.8% |
| No Internet | 22 | 21.8% |
| Total | 101 | 100.0% |
New Marshfield Summary
Marshfield, Ohio is a small village located in Athens County, Ohio. It is situated on the banks of the Hocking River, approximately 10 miles south of Athens. The village was founded in 1817 by a group of settlers from New England, and was named after the town of Marshfield, Massachusetts.
History
Marshfield was founded in 1817 by a group of settlers from New England. The settlers were looking for a place to settle and start a new life, and they chose the area around the Hocking River. The village was named after the town of Marshfield, Massachusetts, and the settlers brought with them many of the same customs and traditions that they had in their home state.
The village grew slowly over the years, and by the mid-1800s, it had become a thriving community. The village was home to a variety of businesses, including a sawmill, a gristmill, a blacksmith shop, and a general store. The village also had a post office, a school, and a church.
In the late 1800s, the village began to experience a period of growth and prosperity. The railroad came to the village in 1881, and this allowed for the transportation of goods and people to and from the village. This increased the population of the village, and it also allowed for the development of new businesses.
In the early 1900s, the village experienced a period of decline. The railroad was no longer in use, and the businesses that had been established in the village began to close. The population of the village began to decline, and by the 1950s, the village was nearly abandoned.
In the late 1970s, the village began to experience a period of revitalization. The village was designated as a historic district, and many of the buildings were restored. The village also began to attract new businesses, and the population began to increase.
Geography
Marshfield is located in Athens County, Ohio. It is situated on the banks of the Hocking River, approximately 10 miles south of Athens. The village is surrounded by rolling hills and farmland, and is located in a rural area.
The village is located in a temperate climate, with hot summers and cold winters. The average temperature in the summer is around 75 degrees Fahrenheit, and the average temperature in the winter is around 30 degrees Fahrenheit.
Economy
The economy of Marshfield is largely based on agriculture. The village is home to several farms, and the surrounding area is used for growing crops such as corn, soybeans, and wheat. The village also has a few small businesses, including a general store, a restaurant, and a gas station.
Demographics
As of the 2010 census, the population of Marshfield was 1,093. The population is largely white, with a small percentage of African Americans and Hispanics. The median household income is $37,500, and the median home value is $117,000.
Conclusion
Marshfield, Ohio is a small village located in Athens County, Ohio. It was founded in 1817 by a group of settlers from New England, and was named after the town of Marshfield, Massachusetts. The village has experienced periods of growth and decline over the years, but it is currently experiencing a period of revitalization. The economy of the village is largely based on agriculture, and the population is largely white.
Common Questions
What is Per Capita Income in New Marshfield?
Per Capita income in New Marshfield is $28,686.
What is the Median Household income in New Marshfield?
Median Household Income in New Marshfield is $29,261.
What is Inequality or Gini Index in New Marshfield?
Inequality or Gini Index in New Marshfield is 0.44.
What is the Total Population of New Marshfield?
Total Population of New Marshfield is 184.
What is the Total Male Population of New Marshfield?
Total Male Population of New Marshfield is 100.
What is the Total Female Population of New Marshfield?
Total Female Population of New Marshfield is 84.
What is the Ratio of Males per 100 Females in New Marshfield?
There are 119.05 Males per 100 Females in New Marshfield.
What is the Ratio of Females per 100 Males in New Marshfield?
There are 84.00 Females per 100 Males in New Marshfield.
What is the Median Population Age in New Marshfield?
Median Population Age in New Marshfield is 58.4 Years.
What is the Average Family Size in New Marshfield
Average Family Size in New Marshfield is 2.5 People.
What is the Average Household Size in New Marshfield
Average Household Size in New Marshfield is 1.8 People.
How Large is the Labor Force in New Marshfield?
There are 85 People in the Labor Forcein in New Marshfield.
What is the Percentage of People in the Labor Force in New Marshfield?
50.0% of People are in the Labor Force in New Marshfield.