New Lebanon, OH Map & Demographics
New Lebanon Map
New Lebanon Overview
$23,833
PER CAPITA INCOME
$69,022
AVG FAMILY INCOME
$59,365
AVG HOUSEHOLD INCOME
41.0%
WAGE / INCOME GAP [ % ]
59.0¢/ $1
WAGE / INCOME GAP [ $ ]
$11,173
FAMILY INCOME DEFICIT
0.36
INEQUALITY / GINI INDEX
4,131
TOTAL POPULATION
1,847
MALE POPULATION
2,284
FEMALE POPULATION
80.87
MALES / 100 FEMALES
123.66
FEMALES / 100 MALES
33.1
MEDIAN AGE
3.1
AVG FAMILY SIZE
2.7
AVG HOUSEHOLD SIZE
1,620
LABOR FORCE [ PEOPLE ]
53.0%
PERCENT IN LABOR FORCE
1.2%
UNEMPLOYMENT RATE
New Lebanon Zip Codes
New Lebanon Area Codes
Income in New Lebanon
Income Overview in New Lebanon
Per Capita Income in New Lebanon is $23,833, while median incomes of families and households are $69,022 and $59,365 respectively.
| Characteristic | Number | Measure |
| Per Capita Income | 4,131 | $23,833 |
| Median Family Income | 1,032 | $69,022 |
| Mean Family Income | 1,032 | $71,953 |
| Median Household Income | 1,504 | $59,365 |
| Mean Household Income | 1,504 | $64,646 |
| Income Deficit | 1,032 | $11,173 |
| Wage / Income Gap (%) | 4,131 | 41.02% |
| Wage / Income Gap ($) | 4,131 | 58.98¢ per $1 |
| Gini / Inequality Index | 4,131 | 0.36 |
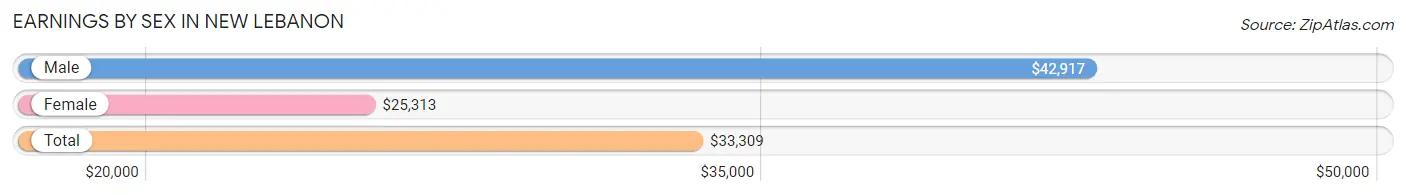
Earnings by Sex in New Lebanon
Average Earnings in New Lebanon are $33,309, $42,917 for men and $25,313 for women, a difference of 41.0%.
| Sex | Number | Average Earnings |
| Male | 887 (49.4%) | $42,917 |
| Female | 908 (50.6%) | $25,313 |
| Total | 1,795 (100.0%) | $33,309 |
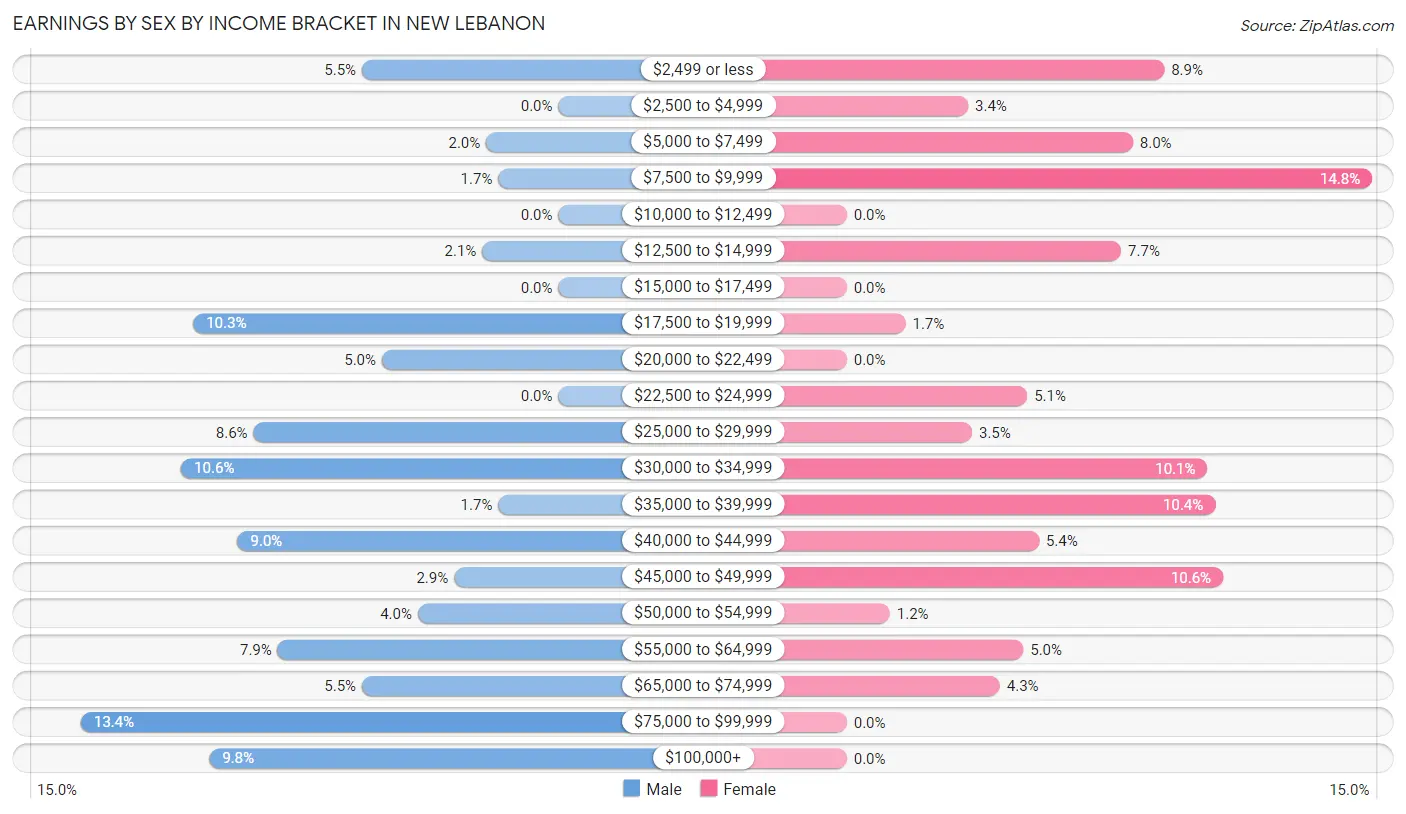
Earnings by Sex by Income Bracket in New Lebanon
The most common earnings brackets in New Lebanon are $75,000 to $99,999 for men (119 | 13.4%) and $7,500 to $9,999 for women (134 | 14.8%).
| Income | Male | Female |
| $2,499 or less | 49 (5.5%) | 81 (8.9%) |
| $2,500 to $4,999 | 0 (0.0%) | 31 (3.4%) |
| $5,000 to $7,499 | 18 (2.0%) | 73 (8.0%) |
| $7,500 to $9,999 | 15 (1.7%) | 134 (14.8%) |
| $10,000 to $12,499 | 0 (0.0%) | 0 (0.0%) |
| $12,500 to $14,999 | 19 (2.1%) | 70 (7.7%) |
| $15,000 to $17,499 | 0 (0.0%) | 0 (0.0%) |
| $17,500 to $19,999 | 91 (10.3%) | 15 (1.7%) |
| $20,000 to $22,499 | 44 (5.0%) | 0 (0.0%) |
| $22,500 to $24,999 | 0 (0.0%) | 46 (5.1%) |
| $25,000 to $29,999 | 76 (8.6%) | 32 (3.5%) |
| $30,000 to $34,999 | 94 (10.6%) | 92 (10.1%) |
| $35,000 to $39,999 | 15 (1.7%) | 94 (10.3%) |
| $40,000 to $44,999 | 80 (9.0%) | 49 (5.4%) |
| $45,000 to $49,999 | 26 (2.9%) | 96 (10.6%) |
| $50,000 to $54,999 | 35 (4.0%) | 11 (1.2%) |
| $55,000 to $64,999 | 70 (7.9%) | 45 (5.0%) |
| $65,000 to $74,999 | 49 (5.5%) | 39 (4.3%) |
| $75,000 to $99,999 | 119 (13.4%) | 0 (0.0%) |
| $100,000+ | 87 (9.8%) | 0 (0.0%) |
| Total | 887 (100.0%) | 908 (100.0%) |
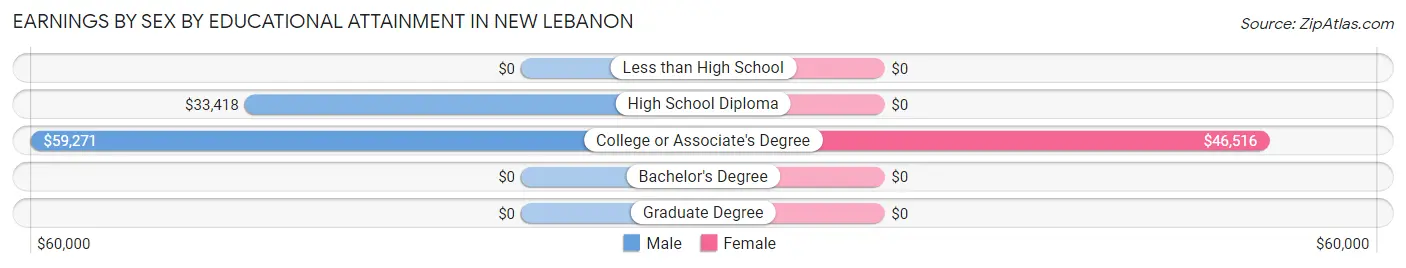
Earnings by Sex by Educational Attainment in New Lebanon
Average earnings in New Lebanon are $48,894 for men and $32,031 for women, a difference of 34.5%. Men with an educational attainment of college or associate's degree enjoy the highest average annual earnings of $59,271, while those with high school diploma education earn the least with $33,418. Women with an educational attainment of college or associate's degree earn the most with the average annual earnings of $46,516, while those with college or associate's degree education have the smallest earnings of $46,516.
| Educational Attainment | Male Income | Female Income |
| Less than High School | - | - |
| High School Diploma | $33,418 | $0 |
| College or Associate's Degree | $59,271 | $46,516 |
| Bachelor's Degree | - | - |
| Graduate Degree | - | - |
| Total | $48,894 | $32,031 |
Family Income in New Lebanon
Family Income Brackets in New Lebanon
According to the New Lebanon family income data, there are 295 families falling into the $50,000 to $74,999 income range, which is the most common income bracket and makes up 28.6% of all families.
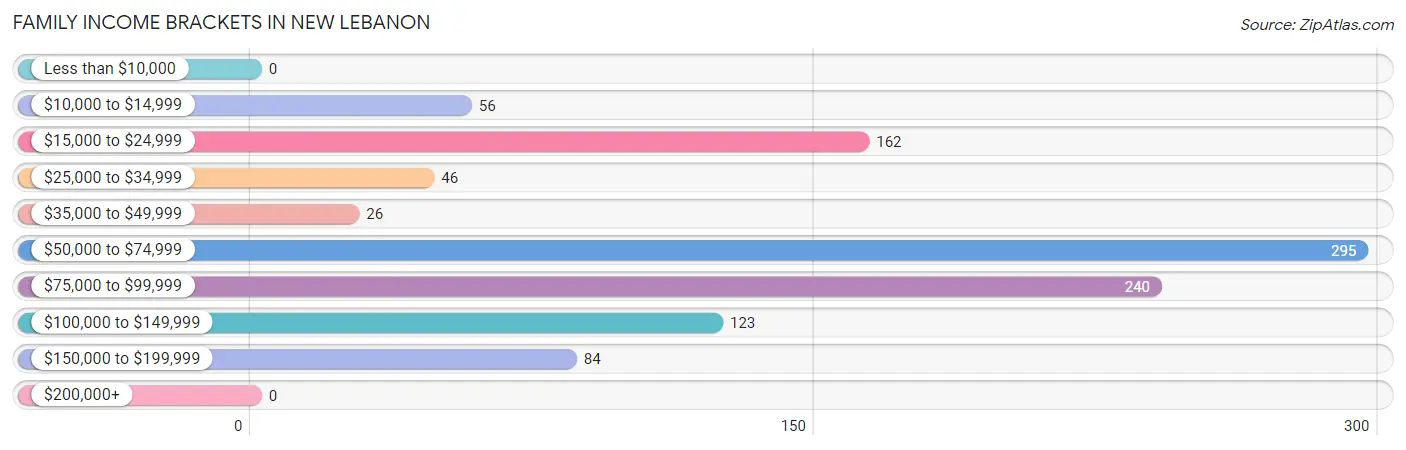
| Income Bracket | # Families | % Families |
| Less than $10,000 | 0 | 0.0% |
| $10,000 to $14,999 | 56 | 5.4% |
| $15,000 to $24,999 | 162 | 15.7% |
| $25,000 to $34,999 | 46 | 4.5% |
| $35,000 to $49,999 | 26 | 2.5% |
| $50,000 to $74,999 | 295 | 28.6% |
| $75,000 to $99,999 | 240 | 23.3% |
| $100,000 to $149,999 | 123 | 11.9% |
| $150,000 to $199,999 | 84 | 8.1% |
| $200,000+ | 0 | 0.0% |
Family Income by Famaliy Size in New Lebanon
4-person families (145 | 14.1%) account for the highest median family income in New Lebanon with $160,542 per family, while 4-person families (145 | 14.1%) have the highest median income of $40,136 per family member.
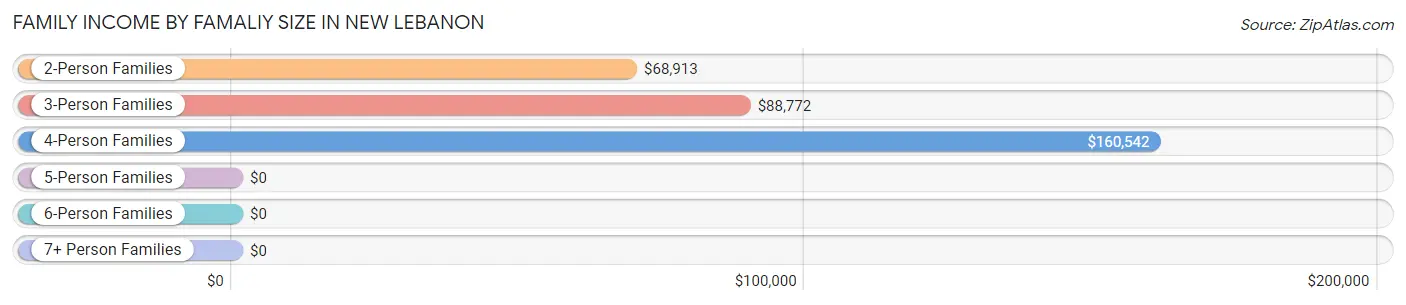
| Income Bracket | # Families | Median Income |
| 2-Person Families | 504 (48.8%) | $68,913 |
| 3-Person Families | 166 (16.1%) | $88,772 |
| 4-Person Families | 145 (14.1%) | $160,542 |
| 5-Person Families | 152 (14.7%) | $0 |
| 6-Person Families | 65 (6.3%) | $0 |
| 7+ Person Families | 0 (0.0%) | $0 |
| Total | 1,032 (100.0%) | $69,022 |
Family Income by Number of Earners in New Lebanon
The median family income in New Lebanon is $69,022, with families comprising 3+ earners (89) having the highest median family income of $119,135, while families with no earners (227) have the lowest median family income of $59,583, accounting for 8.6% and 22.0% of families, respectively.
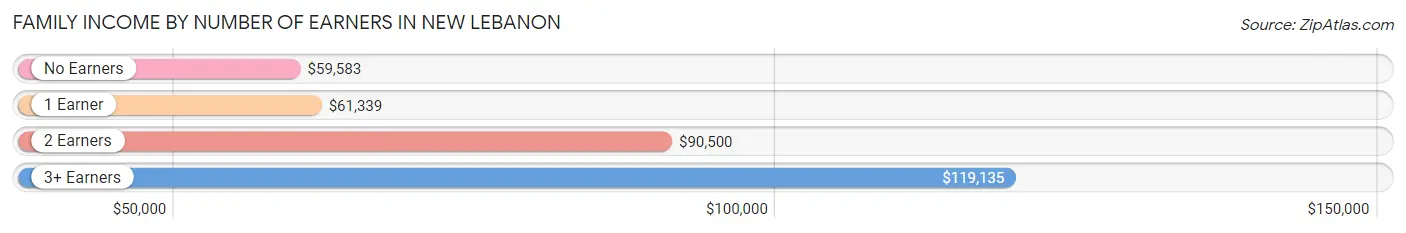
| Number of Earners | # Families | Median Income |
| No Earners | 227 (22.0%) | $59,583 |
| 1 Earner | 448 (43.4%) | $61,339 |
| 2 Earners | 268 (26.0%) | $90,500 |
| 3+ Earners | 89 (8.6%) | $119,135 |
| Total | 1,032 (100.0%) | $69,022 |
Household Income in New Lebanon
Household Income Brackets in New Lebanon
With 347 households falling in the category, the $50,000 to $74,999 income range is the most frequent in New Lebanon, accounting for 23.1% of all households.
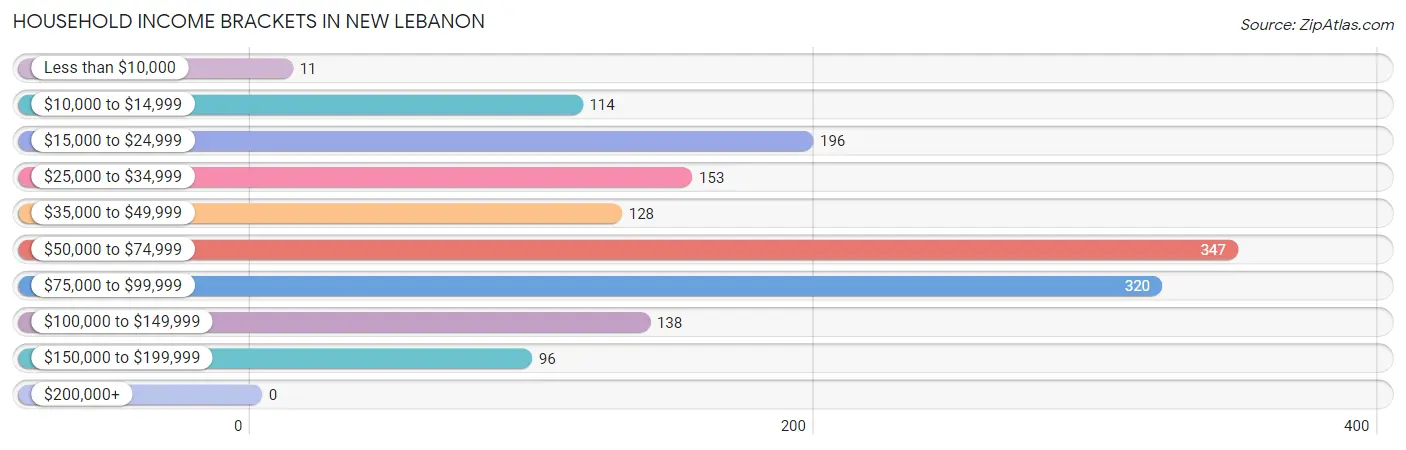
| Income Bracket | # Households | % Households |
| Less than $10,000 | 11 | 0.7% |
| $10,000 to $14,999 | 114 | 7.6% |
| $15,000 to $24,999 | 196 | 13.0% |
| $25,000 to $34,999 | 153 | 10.2% |
| $35,000 to $49,999 | 128 | 8.5% |
| $50,000 to $74,999 | 347 | 23.1% |
| $75,000 to $99,999 | 320 | 21.3% |
| $100,000 to $149,999 | 138 | 9.2% |
| $150,000 to $199,999 | 96 | 6.4% |
| $200,000+ | 0 | 0.0% |
Household Income by Householder Age in New Lebanon
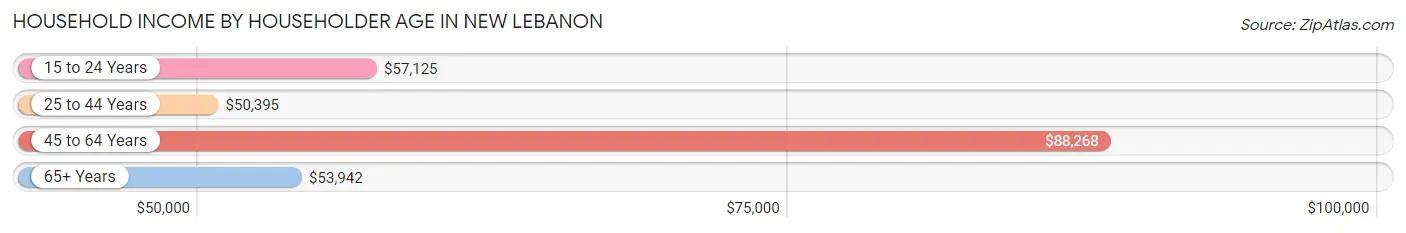
The median household income in New Lebanon is $59,365, with the highest median household income of $88,268 found in the 45 to 64 years age bracket for the primary householder. A total of 321 households (21.3%) fall into this category. Meanwhile, the 25 to 44 years age bracket for the primary householder has the lowest median household income of $50,395, with 510 households (33.9%) in this group.
| Income Bracket | # Households | Median Income |
| 15 to 24 Years | 132 (8.8%) | $57,125 |
| 25 to 44 Years | 510 (33.9%) | $50,395 |
| 45 to 64 Years | 321 (21.3%) | $88,268 |
| 65+ Years | 541 (36.0%) | $53,942 |
| Total | 1,504 (100.0%) | $59,365 |
Poverty in New Lebanon
Income Below Poverty by Sex and Age in New Lebanon
With 29.1% poverty level for males and 32.0% for females among the residents of New Lebanon, 5 year old males and 16 and 17 year old females are the most vulnerable to poverty, with 129 males (100.0%) and 71 females (77.2%) in their respective age groups living below the poverty level.
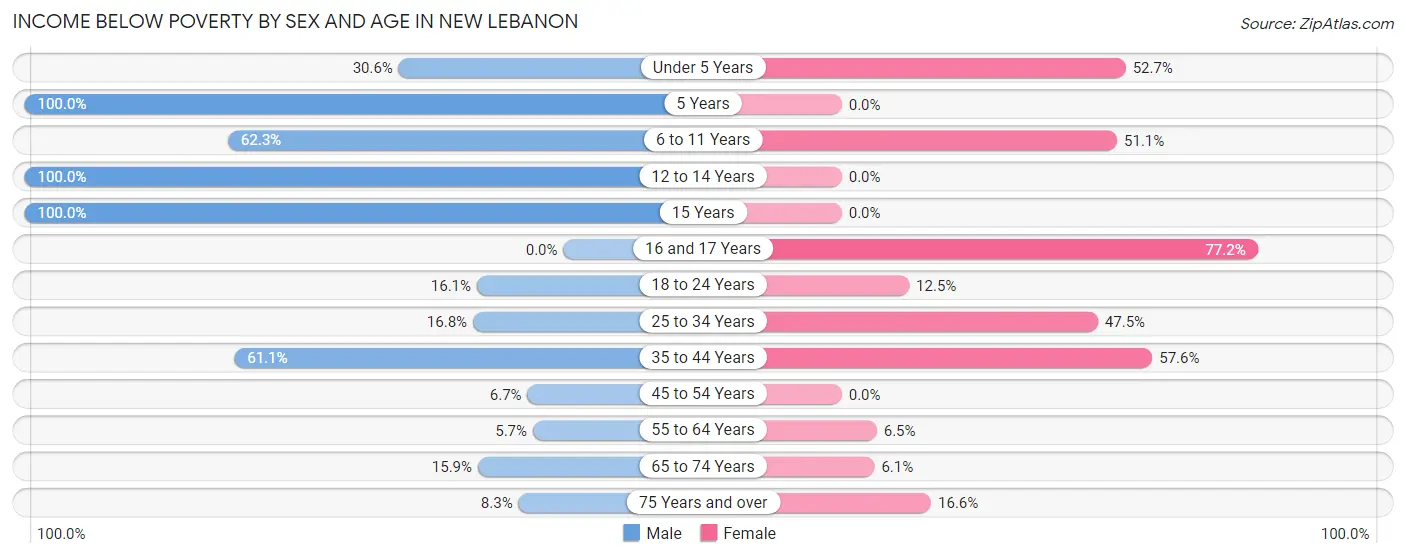
| Age Bracket | Male | Female |
| Under 5 Years | 22 (30.6%) | 117 (52.7%) |
| 5 Years | 129 (100.0%) | 0 (0.0%) |
| 6 to 11 Years | 66 (62.3%) | 209 (51.1%) |
| 12 to 14 Years | 21 (100.0%) | 0 (0.0%) |
| 15 Years | 26 (100.0%) | 0 (0.0%) |
| 16 and 17 Years | 0 (0.0%) | 71 (77.2%) |
| 18 to 24 Years | 35 (16.1%) | 33 (12.5%) |
| 25 to 34 Years | 47 (16.8%) | 87 (47.5%) |
| 35 to 44 Years | 91 (61.1%) | 151 (57.6%) |
| 45 to 54 Years | 10 (6.7%) | 0 (0.0%) |
| 55 to 64 Years | 9 (5.7%) | 8 (6.5%) |
| 65 to 74 Years | 33 (15.9%) | 14 (6.1%) |
| 75 Years and over | 15 (8.3%) | 31 (16.6%) |
| Total | 504 (29.1%) | 721 (32.0%) |
Income Above Poverty by Sex and Age in New Lebanon
According to the poverty statistics in New Lebanon, males aged 16 and 17 years and females aged 12 to 14 years are the age groups that are most secure financially, with 100.0% of males and 100.0% of females in these age groups living above the poverty line.
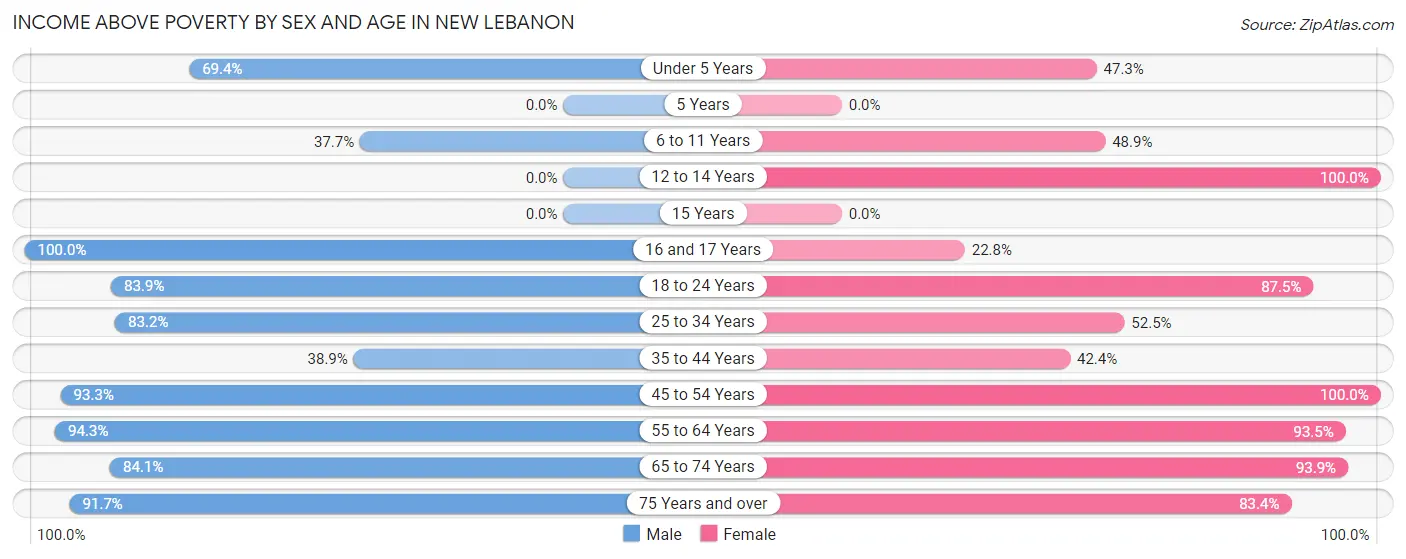
| Age Bracket | Male | Female |
| Under 5 Years | 50 (69.4%) | 105 (47.3%) |
| 5 Years | 0 (0.0%) | 0 (0.0%) |
| 6 to 11 Years | 40 (37.7%) | 200 (48.9%) |
| 12 to 14 Years | 0 (0.0%) | 39 (100.0%) |
| 15 Years | 0 (0.0%) | 0 (0.0%) |
| 16 and 17 Years | 35 (100.0%) | 21 (22.8%) |
| 18 to 24 Years | 183 (83.9%) | 231 (87.5%) |
| 25 to 34 Years | 233 (83.2%) | 96 (52.5%) |
| 35 to 44 Years | 58 (38.9%) | 111 (42.4%) |
| 45 to 54 Years | 140 (93.3%) | 241 (100.0%) |
| 55 to 64 Years | 150 (94.3%) | 115 (93.5%) |
| 65 to 74 Years | 175 (84.1%) | 217 (93.9%) |
| 75 Years and over | 165 (91.7%) | 156 (83.4%) |
| Total | 1,229 (70.9%) | 1,532 (68.0%) |
Income Below Poverty Among Married-Couple Families in New Lebanon
The poverty statistics for married-couple families in New Lebanon show that 18.7% or 152 of the total 812 families live below the poverty line. Families with 3 or 4 children have the highest poverty rate of 70.6%, comprising of 137 families. On the other hand, families with 1 or 2 children have the lowest poverty rate of 0.0%, which includes 0 families.
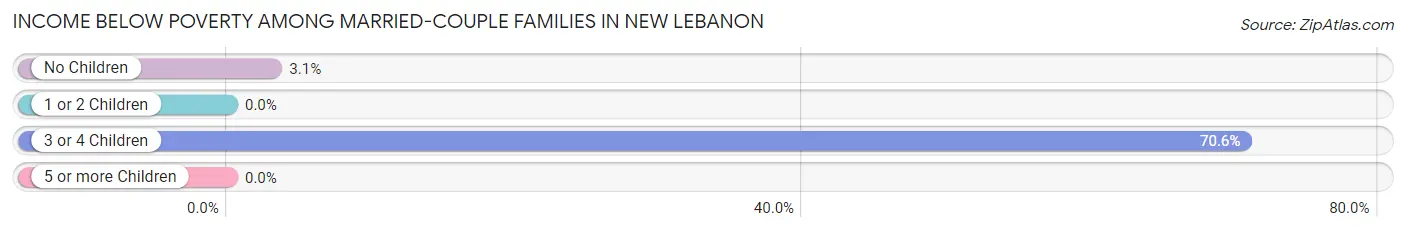
| Children | Above Poverty | Below Poverty |
| No Children | 471 (96.9%) | 15 (3.1%) |
| 1 or 2 Children | 132 (100.0%) | 0 (0.0%) |
| 3 or 4 Children | 57 (29.4%) | 137 (70.6%) |
| 5 or more Children | 0 (0.0%) | 0 (0.0%) |
| Total | 660 (81.3%) | 152 (18.7%) |
Income Below Poverty Among Single-Parent Households in New Lebanon
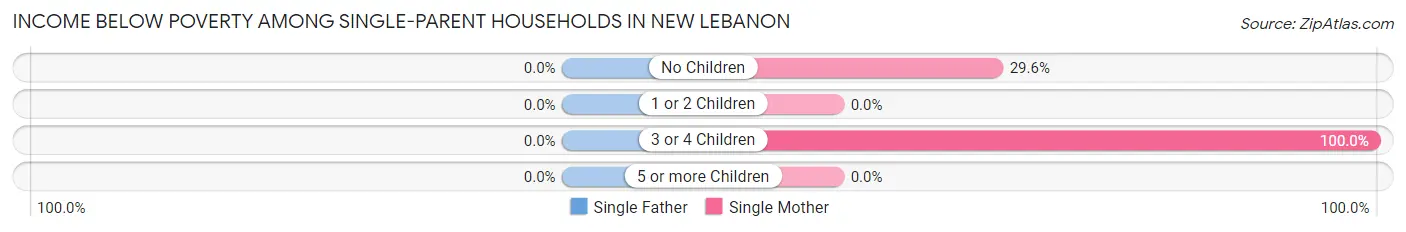
| Children | Single Father | Single Mother |
| No Children | 0 (0.0%) | 8 (29.6%) |
| 1 or 2 Children | 0 (0.0%) | 0 (0.0%) |
| 3 or 4 Children | 0 (0.0%) | 64 (100.0%) |
| 5 or more Children | 0 (0.0%) | 0 (0.0%) |
| Total | 0 (0.0%) | 72 (41.9%) |
Income Below Poverty Among Married-Couple vs Single-Parent Households in New Lebanon
The poverty data for New Lebanon shows that 152 of the married-couple family households (18.7%) and 72 of the single-parent households (32.7%) are living below the poverty level. Within the married-couple family households, those with 3 or 4 children have the highest poverty rate, with 137 households (70.6%) falling below the poverty line. Among the single-parent households, those with 3 or 4 children have the highest poverty rate, with 64 household (100.0%) living below poverty.
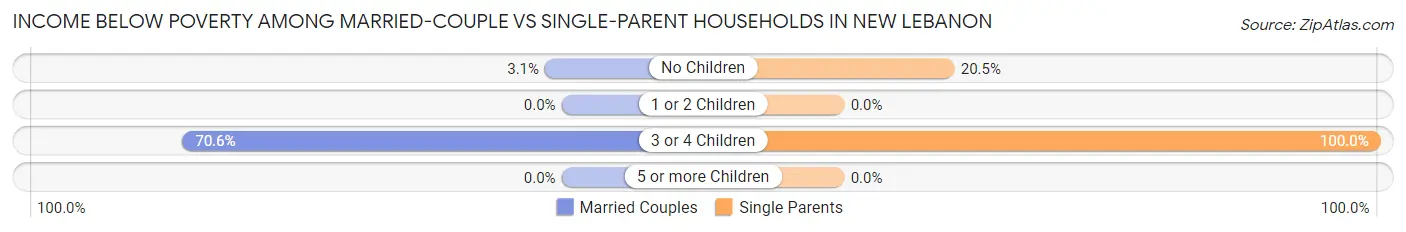
| Children | Married-Couple Families | Single-Parent Households |
| No Children | 15 (3.1%) | 8 (20.5%) |
| 1 or 2 Children | 0 (0.0%) | 0 (0.0%) |
| 3 or 4 Children | 137 (70.6%) | 64 (100.0%) |
| 5 or more Children | 0 (0.0%) | 0 (0.0%) |
| Total | 152 (18.7%) | 72 (32.7%) |
Race in New Lebanon
The most populous races in New Lebanon are White / Caucasian (3,893 | 94.2%), Two or more Races (145 | 3.5%), and Black / African American (54 | 1.3%).
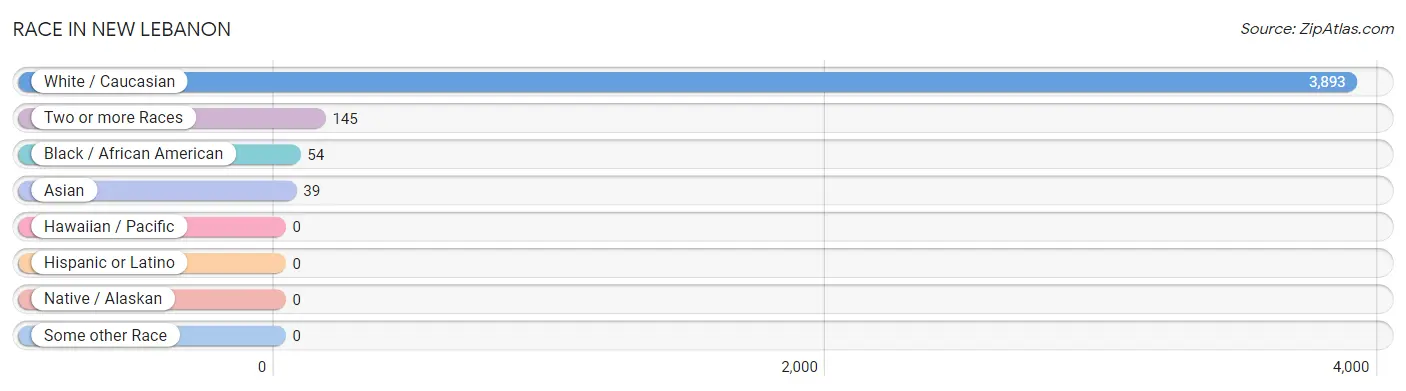
| Race | # Population | % Population |
| Asian | 39 | 0.9% |
| Black / African American | 54 | 1.3% |
| Hawaiian / Pacific | 0 | 0.0% |
| Hispanic or Latino | 0 | 0.0% |
| Native / Alaskan | 0 | 0.0% |
| White / Caucasian | 3,893 | 94.2% |
| Two or more Races | 145 | 3.5% |
| Some other Race | 0 | 0.0% |
| Total | 4,131 | 100.0% |
Ancestry in New Lebanon
The most populous ancestries reported in New Lebanon are German (812 | 19.7%), Irish (321 | 7.8%), English (301 | 7.3%), American (228 | 5.5%), and Indian (Asian) (100 | 2.4%), together accounting for 42.7% of all New Lebanon residents.
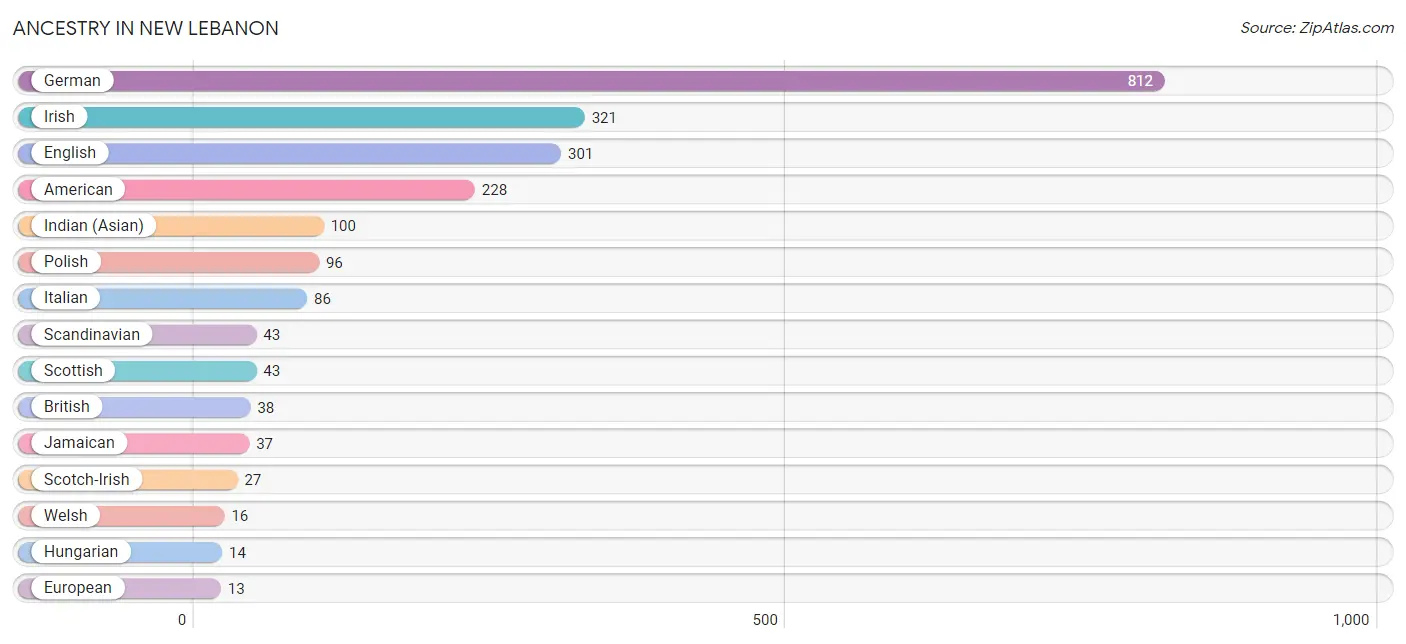
| Ancestry | # Population | % Population |
| American | 228 | 5.5% |
| British | 38 | 0.9% |
| English | 301 | 7.3% |
| European | 13 | 0.3% |
| French | 12 | 0.3% |
| German | 812 | 19.7% |
| Hungarian | 14 | 0.3% |
| Indian (Asian) | 100 | 2.4% |
| Irish | 321 | 7.8% |
| Italian | 86 | 2.1% |
| Jamaican | 37 | 0.9% |
| Polish | 96 | 2.3% |
| Scandinavian | 43 | 1.0% |
| Scotch-Irish | 27 | 0.6% |
| Scottish | 43 | 1.0% |
| Welsh | 16 | 0.4% | View All 16 Rows |
Immigrants in New Lebanon
The most numerous immigrant groups reported in New Lebanon came from Asia (39 | 0.9%), China (39 | 0.9%), and Eastern Asia (39 | 0.9%), together accounting for 2.8% of all New Lebanon residents.
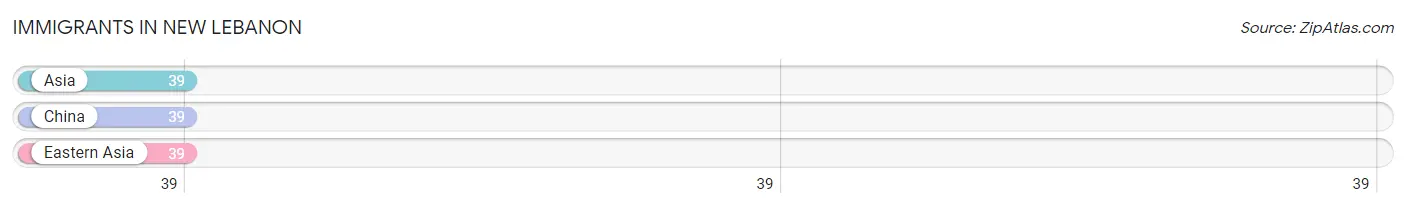
| Immigration Origin | # Population | % Population |
| Asia | 39 | 0.9% |
| China | 39 | 0.9% |
| Eastern Asia | 39 | 0.9% | View All 3 Rows |
Sex and Age in New Lebanon
Sex and Age in New Lebanon
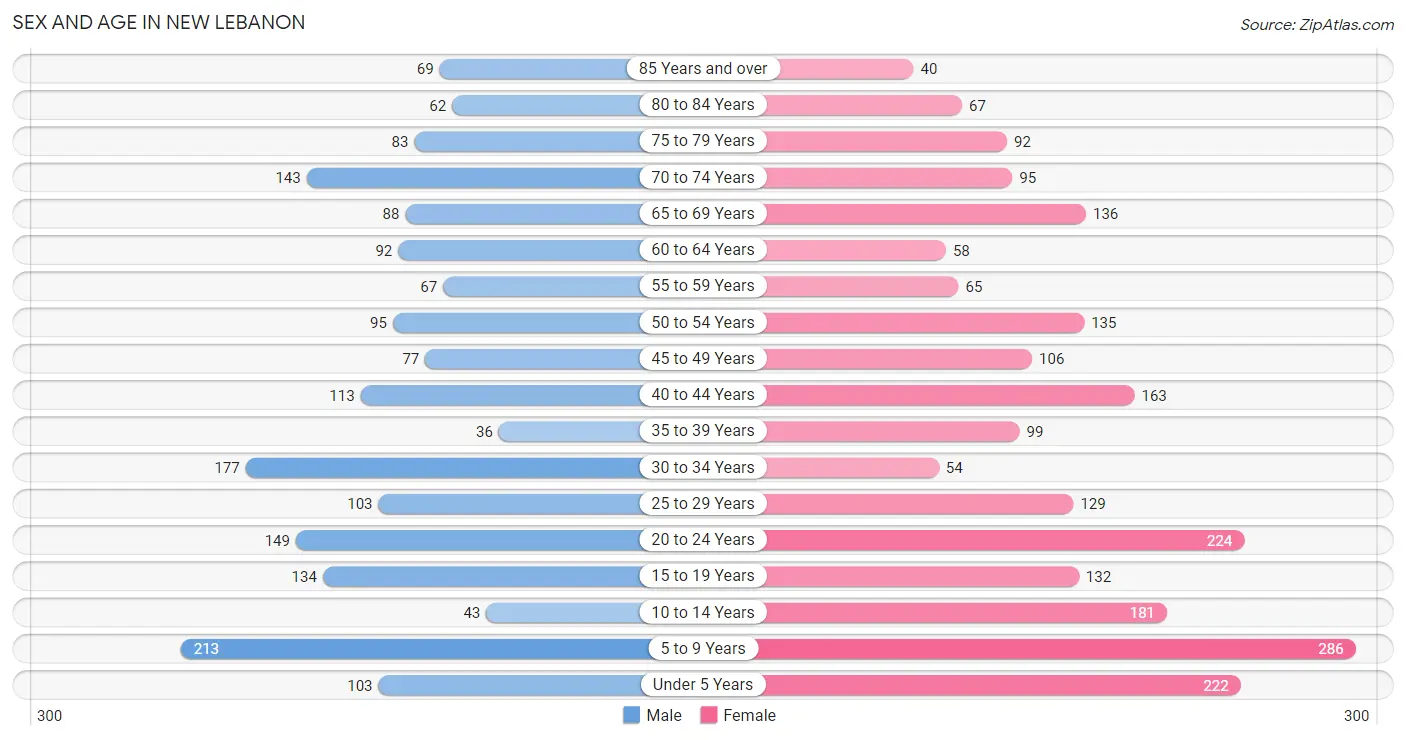
The most populous age groups in New Lebanon are 5 to 9 Years (213 | 11.5%) for men and 5 to 9 Years (286 | 12.5%) for women.
| Age Bracket | Male | Female |
| Under 5 Years | 103 (5.6%) | 222 (9.7%) |
| 5 to 9 Years | 213 (11.5%) | 286 (12.5%) |
| 10 to 14 Years | 43 (2.3%) | 181 (7.9%) |
| 15 to 19 Years | 134 (7.3%) | 132 (5.8%) |
| 20 to 24 Years | 149 (8.1%) | 224 (9.8%) |
| 25 to 29 Years | 103 (5.6%) | 129 (5.7%) |
| 30 to 34 Years | 177 (9.6%) | 54 (2.4%) |
| 35 to 39 Years | 36 (1.9%) | 99 (4.3%) |
| 40 to 44 Years | 113 (6.1%) | 163 (7.1%) |
| 45 to 49 Years | 77 (4.2%) | 106 (4.6%) |
| 50 to 54 Years | 95 (5.1%) | 135 (5.9%) |
| 55 to 59 Years | 67 (3.6%) | 65 (2.9%) |
| 60 to 64 Years | 92 (5.0%) | 58 (2.5%) |
| 65 to 69 Years | 88 (4.8%) | 136 (5.9%) |
| 70 to 74 Years | 143 (7.7%) | 95 (4.2%) |
| 75 to 79 Years | 83 (4.5%) | 92 (4.0%) |
| 80 to 84 Years | 62 (3.4%) | 67 (2.9%) |
| 85 Years and over | 69 (3.7%) | 40 (1.8%) |
| Total | 1,847 (100.0%) | 2,284 (100.0%) |
Families and Households in New Lebanon
Median Family Size in New Lebanon
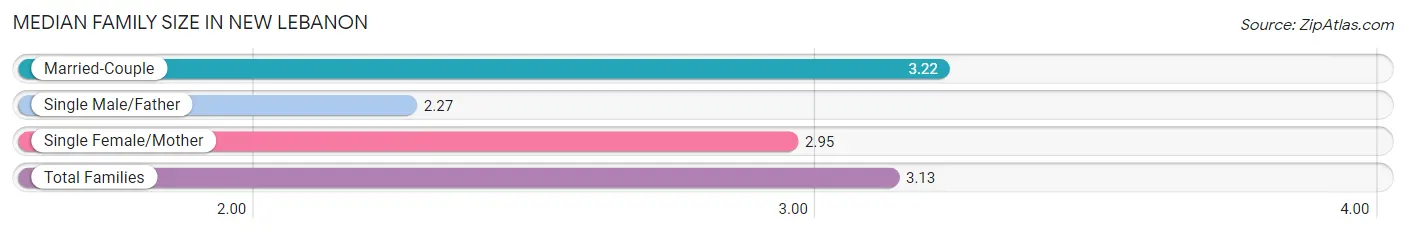
The median family size in New Lebanon is 3.13 persons per family, with married-couple families (812 | 78.7%) accounting for the largest median family size of 3.22 persons per family. On the other hand, single male/father families (48 | 4.6%) represent the smallest median family size with 2.27 persons per family.
| Family Type | # Families | Family Size |
| Married-Couple | 812 (78.7%) | 3.22 |
| Single Male/Father | 48 (4.6%) | 2.27 |
| Single Female/Mother | 172 (16.7%) | 2.95 |
| Total Families | 1,032 (100.0%) | 3.13 |
Median Household Size in New Lebanon
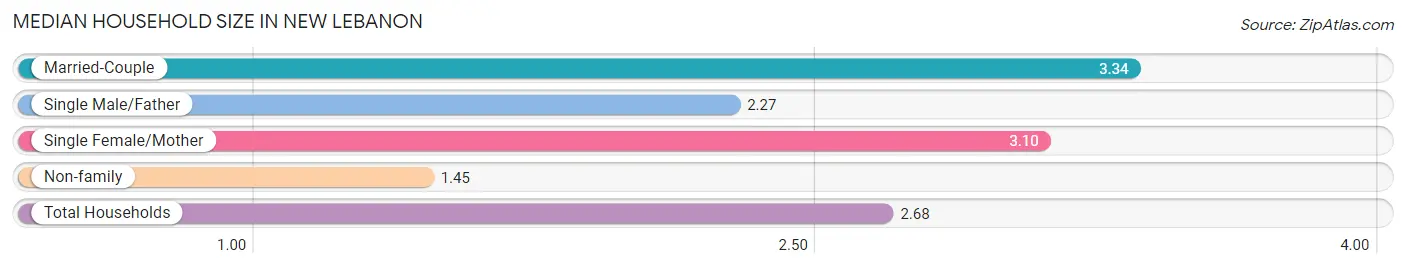
The median household size in New Lebanon is 2.68 persons per household, with married-couple households (812 | 54.0%) accounting for the largest median household size of 3.34 persons per household. non-family households (472 | 31.4%) represent the smallest median household size with 1.45 persons per household.
| Household Type | # Households | Household Size |
| Married-Couple | 812 (54.0%) | 3.34 |
| Single Male/Father | 48 (3.2%) | 2.27 |
| Single Female/Mother | 172 (11.4%) | 3.10 |
| Non-family | 472 (31.4%) | 1.45 |
| Total Households | 1,504 (100.0%) | 2.68 |
Household Size by Marriage Status in New Lebanon
Out of a total of 1,504 households in New Lebanon, 1,032 (68.6%) are family households, while 472 (31.4%) are nonfamily households. The most numerous type of family households are 2-person households, comprising 485, and the most common type of nonfamily households are 1-person households, comprising 290.
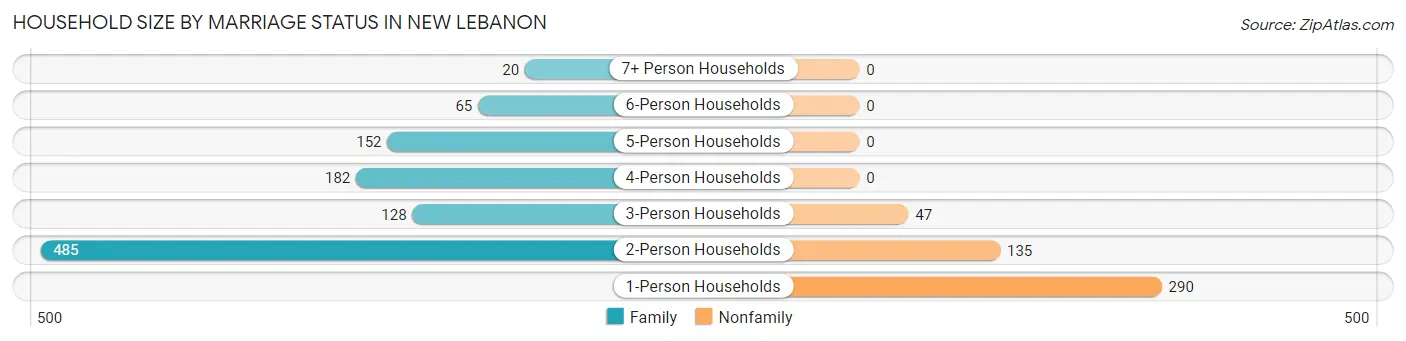
| Household Size | Family Households | Nonfamily Households |
| 1-Person Households | - | 290 (19.3%) |
| 2-Person Households | 485 (32.3%) | 135 (9.0%) |
| 3-Person Households | 128 (8.5%) | 47 (3.1%) |
| 4-Person Households | 182 (12.1%) | 0 (0.0%) |
| 5-Person Households | 152 (10.1%) | 0 (0.0%) |
| 6-Person Households | 65 (4.3%) | 0 (0.0%) |
| 7+ Person Households | 20 (1.3%) | 0 (0.0%) |
| Total | 1,032 (68.6%) | 472 (31.4%) |
Female Fertility in New Lebanon
Fertility by Age in New Lebanon
Average fertility rate in New Lebanon is 67.0 births per 1,000 women. Women in the age bracket of 20 to 34 years have the highest fertility rate with 128.0 births per 1,000 women. Women in the age bracket of 20 to 34 years acount for 78.8% of all women with births.
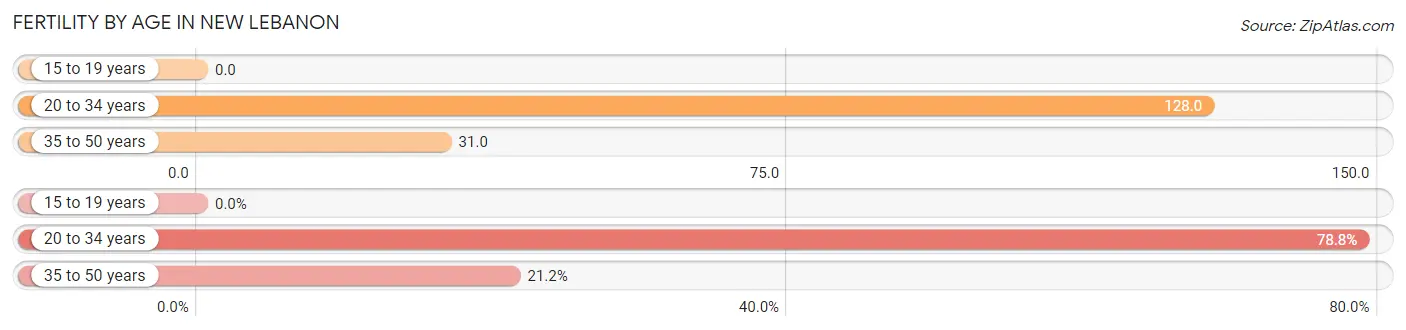
| Age Bracket | Women with Births | Births / 1,000 Women |
| 15 to 19 years | 0 (0.0%) | 0.0 |
| 20 to 34 years | 52 (78.8%) | 128.0 |
| 35 to 50 years | 14 (21.2%) | 31.0 |
| Total | 66 (100.0%) | 67.0 |
Fertility by Age by Marriage Status in New Lebanon
78.8% of women with births (66) in New Lebanon are married. The highest percentage of unmarried women with births falls into 35 to 50 years age bracket with 100.0% of them unmarried at the time of birth, while the lowest percentage of unmarried women with births belong to 20 to 34 years age bracket with 0.0% of them unmarried.
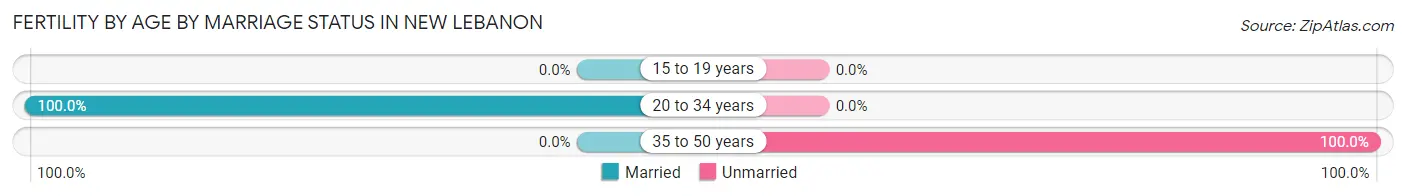
| Age Bracket | Married | Unmarried |
| 15 to 19 years | 0 (0.0%) | 0 (0.0%) |
| 20 to 34 years | 52 (100.0%) | 0 (0.0%) |
| 35 to 50 years | 0 (0.0%) | 14 (100.0%) |
| Total | 52 (78.8%) | 14 (21.2%) |
Fertility by Education in New Lebanon
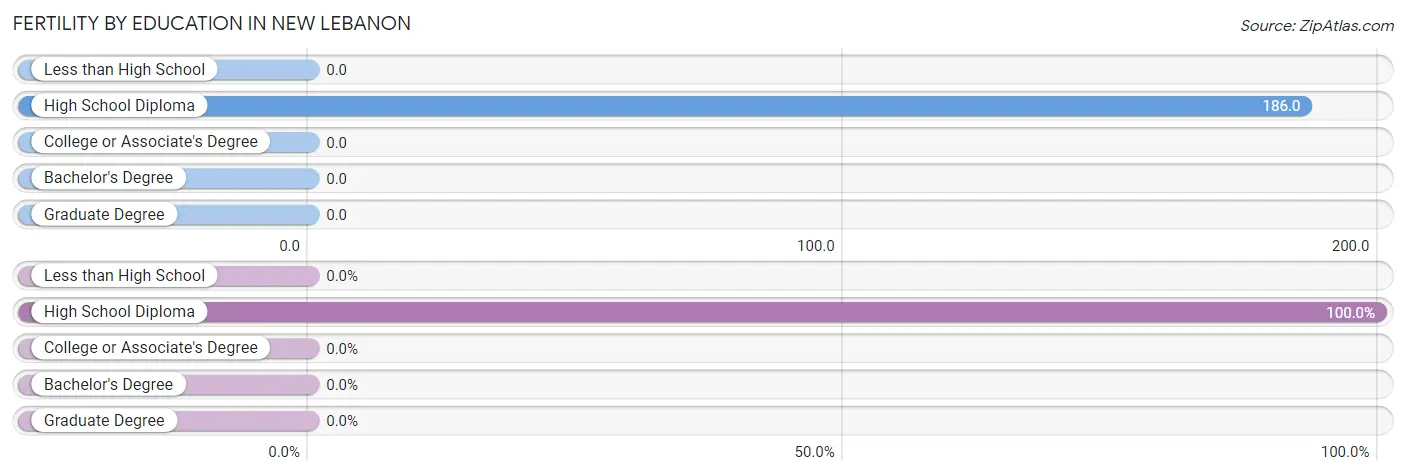
| Educational Attainment | Women with Births | Births / 1,000 Women |
| Less than High School | 0 (0.0%) | 0.0 |
| High School Diploma | 66 (100.0%) | 186.0 |
| College or Associate's Degree | 0 (0.0%) | 0.0 |
| Bachelor's Degree | 0 (0.0%) | 0.0 |
| Graduate Degree | 0 (0.0%) | 0.0 |
| Total | 66 (100.0%) | 67.0 |
Fertility by Education by Marriage Status in New Lebanon
21.2% of women with births in New Lebanon are unmarried. Women with the educational attainment of high school diploma are most likely to be married with 78.8% of them married at childbirth, while women with the educational attainment of high school diploma are least likely to be married with 21.2% of them unmarried at childbirth.
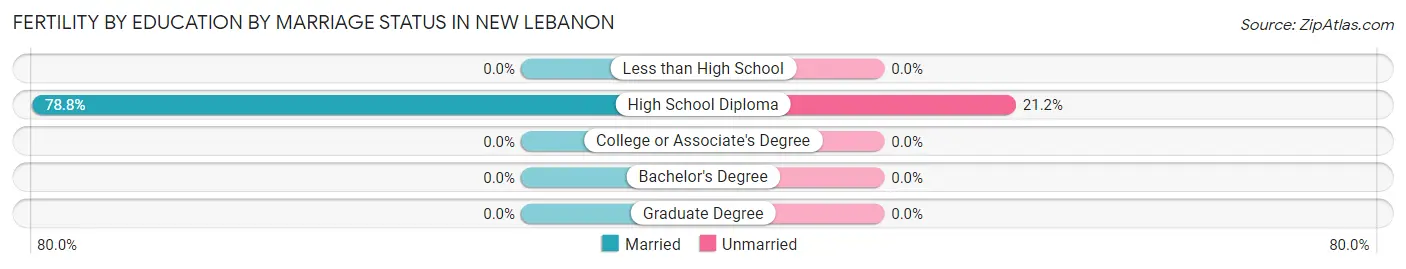
| Educational Attainment | Married | Unmarried |
| Less than High School | 0 (0.0%) | 0 (0.0%) |
| High School Diploma | 52 (78.8%) | 14 (21.2%) |
| College or Associate's Degree | 0 (0.0%) | 0 (0.0%) |
| Bachelor's Degree | 0 (0.0%) | 0 (0.0%) |
| Graduate Degree | 0 (0.0%) | 0 (0.0%) |
| Total | 52 (78.8%) | 14 (21.2%) |
Employment Characteristics in New Lebanon
Employment by Class of Employer in New Lebanon
Among the 1,525 employed individuals in New Lebanon, private company employees (1,120 | 73.4%), not-for-profit organizations (218 | 14.3%), and self-employed (incorporated) (53 | 3.5%) make up the most common classes of employment.
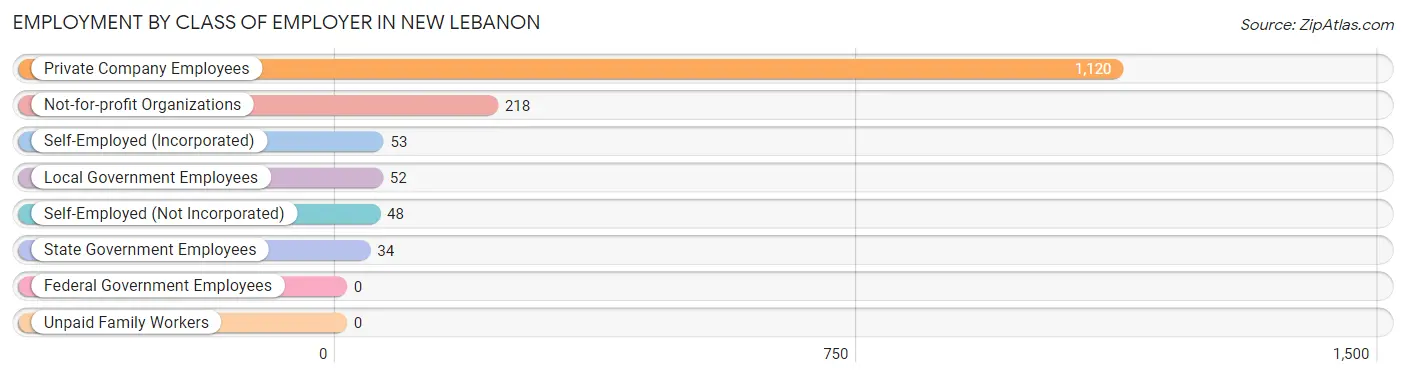
| Employer Class | # Employees | % Employees |
| Private Company Employees | 1,120 | 73.4% |
| Self-Employed (Incorporated) | 53 | 3.5% |
| Self-Employed (Not Incorporated) | 48 | 3.2% |
| Not-for-profit Organizations | 218 | 14.3% |
| Local Government Employees | 52 | 3.4% |
| State Government Employees | 34 | 2.2% |
| Federal Government Employees | 0 | 0.0% |
| Unpaid Family Workers | 0 | 0.0% |
| Total | 1,525 | 100.0% |
Employment Status by Age in New Lebanon
According to the labor force statistics for New Lebanon, out of the total population over 16 years of age (3,057), 53.0% or 1,620 individuals are in the labor force, with 1.2% or 19 of them unemployed. The age group with the highest labor force participation rate is 30 to 34 years, with 92.6% or 214 individuals in the labor force. Within the labor force, the 30 to 34 years age range has the highest percentage of unemployed individuals, with 9.3% or 20 of them being unemployed.
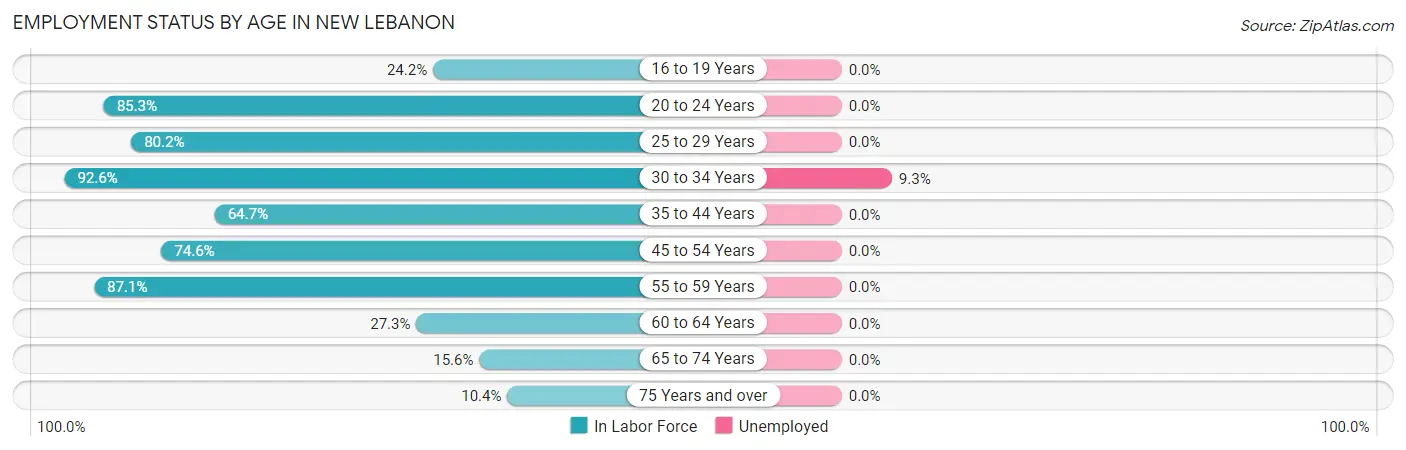
| Age Bracket | In Labor Force | Unemployed |
| 16 to 19 Years | 58 (24.2%) | 0 (0.0%) |
| 20 to 24 Years | 318 (85.3%) | 0 (0.0%) |
| 25 to 29 Years | 186 (80.2%) | 0 (0.0%) |
| 30 to 34 Years | 214 (92.6%) | 20 (9.3%) |
| 35 to 44 Years | 266 (64.7%) | 0 (0.0%) |
| 45 to 54 Years | 308 (74.6%) | 0 (0.0%) |
| 55 to 59 Years | 115 (87.1%) | 0 (0.0%) |
| 60 to 64 Years | 41 (27.3%) | 0 (0.0%) |
| 65 to 74 Years | 72 (15.6%) | 0 (0.0%) |
| 75 Years and over | 43 (10.4%) | 0 (0.0%) |
| Total | 1,620 (53.0%) | 19 (1.2%) |
Employment Status by Educational Attainment in New Lebanon
According to labor force statistics for New Lebanon, 72.0% of individuals (1,130) out of the total population between 25 and 64 years of age (1,569) are in the labor force, with 1.8% or 20 of them being unemployed. The group with the highest labor force participation rate are those with the educational attainment of high school diploma, with 84.9% or 551 individuals in the labor force. Within the labor force, individuals with less than high school education have the highest percentage of unemployment, with 14.1% or 20 of them being unemployed.
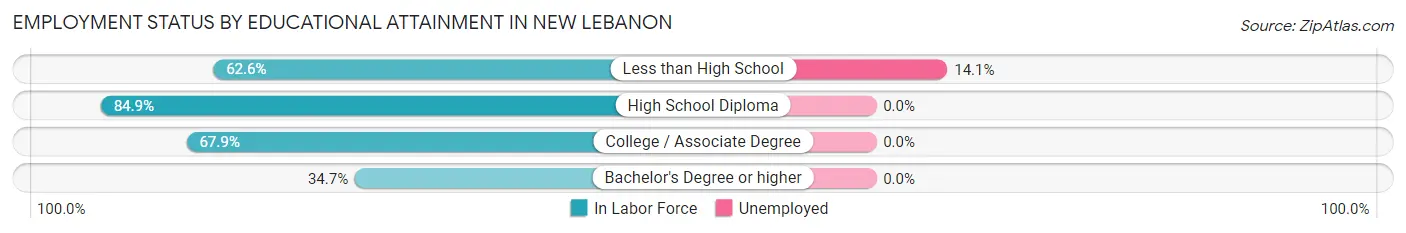
| Educational Attainment | In Labor Force | Unemployed |
| Less than High School | 142 (62.6%) | 32 (14.1%) |
| High School Diploma | 551 (84.9%) | 0 (0.0%) |
| College / Associate Degree | 402 (67.9%) | 0 (0.0%) |
| Bachelor's Degree or higher | 35 (34.7%) | 0 (0.0%) |
| Total | 1,130 (72.0%) | 28 (1.8%) |
Employment Occupations by Sex in New Lebanon
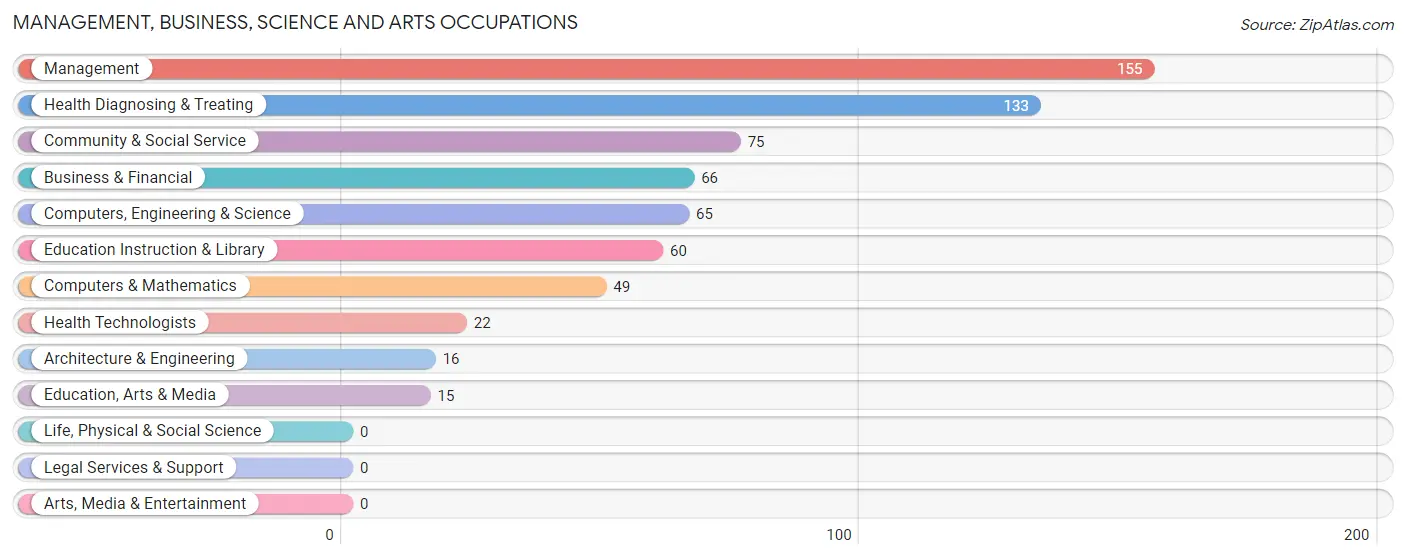
Management, Business, Science and Arts Occupations
The most common Management, Business, Science and Arts occupations in New Lebanon are Management (155 | 9.7%), Health Diagnosing & Treating (133 | 8.3%), Community & Social Service (75 | 4.7%), Business & Financial (66 | 4.1%), and Computers, Engineering & Science (65 | 4.1%).
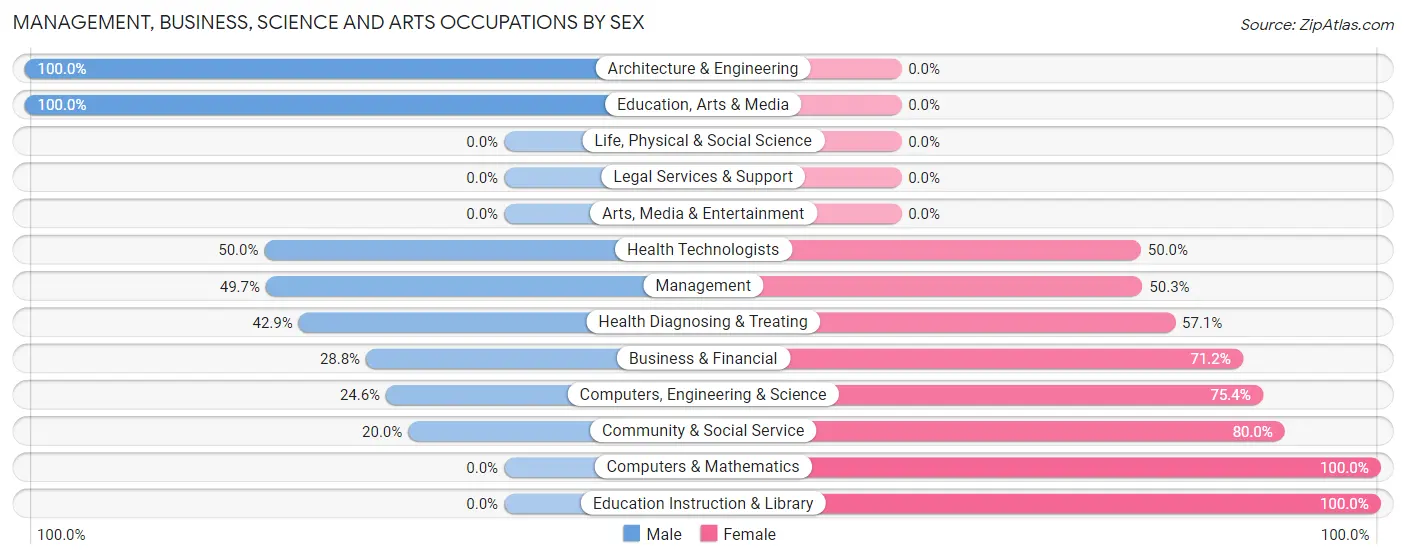
Management, Business, Science and Arts Occupations by Sex
Within the Management, Business, Science and Arts occupations in New Lebanon, the most male-oriented occupations are Architecture & Engineering (100.0%), Education, Arts & Media (100.0%), and Health Technologists (50.0%), while the most female-oriented occupations are Computers & Mathematics (100.0%), Education Instruction & Library (100.0%), and Community & Social Service (80.0%).
| Occupation | Male | Female |
| Management | 77 (49.7%) | 78 (50.3%) |
| Business & Financial | 19 (28.8%) | 47 (71.2%) |
| Computers, Engineering & Science | 16 (24.6%) | 49 (75.4%) |
| Computers & Mathematics | 0 (0.0%) | 49 (100.0%) |
| Architecture & Engineering | 16 (100.0%) | 0 (0.0%) |
| Life, Physical & Social Science | 0 (0.0%) | 0 (0.0%) |
| Community & Social Service | 15 (20.0%) | 60 (80.0%) |
| Education, Arts & Media | 15 (100.0%) | 0 (0.0%) |
| Legal Services & Support | 0 (0.0%) | 0 (0.0%) |
| Education Instruction & Library | 0 (0.0%) | 60 (100.0%) |
| Arts, Media & Entertainment | 0 (0.0%) | 0 (0.0%) |
| Health Diagnosing & Treating | 57 (42.9%) | 76 (57.1%) |
| Health Technologists | 11 (50.0%) | 11 (50.0%) |
| Total (Category) | 184 (37.2%) | 310 (62.7%) |
| Total (Overall) | 855 (53.4%) | 746 (46.6%) |
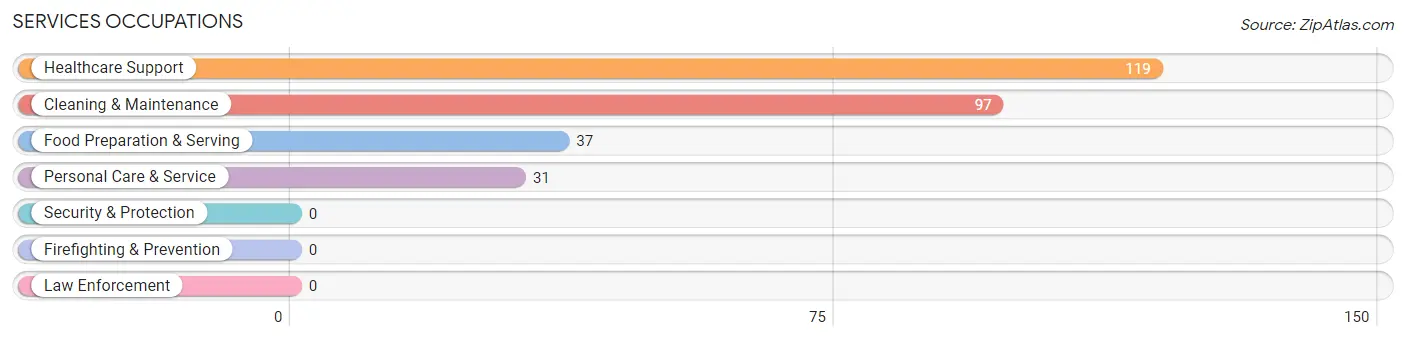
Services Occupations
The most common Services occupations in New Lebanon are Healthcare Support (119 | 7.4%), Cleaning & Maintenance (97 | 6.1%), Food Preparation & Serving (37 | 2.3%), and Personal Care & Service (31 | 1.9%).
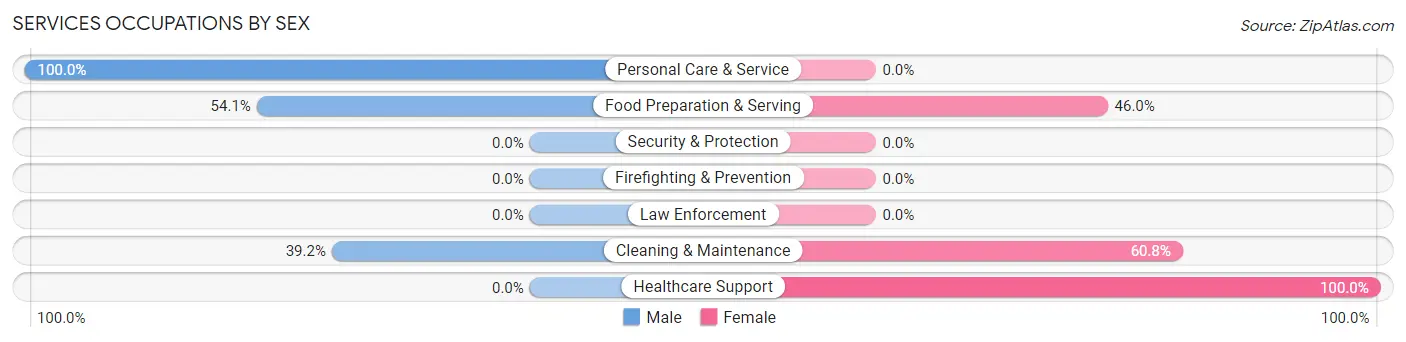
Services Occupations by Sex
Within the Services occupations in New Lebanon, the most male-oriented occupations are Personal Care & Service (100.0%), Food Preparation & Serving (54.0%), and Cleaning & Maintenance (39.2%), while the most female-oriented occupations are Healthcare Support (100.0%), Cleaning & Maintenance (60.8%), and Food Preparation & Serving (46.0%).
| Occupation | Male | Female |
| Healthcare Support | 0 (0.0%) | 119 (100.0%) |
| Security & Protection | 0 (0.0%) | 0 (0.0%) |
| Firefighting & Prevention | 0 (0.0%) | 0 (0.0%) |
| Law Enforcement | 0 (0.0%) | 0 (0.0%) |
| Food Preparation & Serving | 20 (54.0%) | 17 (46.0%) |
| Cleaning & Maintenance | 38 (39.2%) | 59 (60.8%) |
| Personal Care & Service | 31 (100.0%) | 0 (0.0%) |
| Total (Category) | 89 (31.3%) | 195 (68.7%) |
| Total (Overall) | 855 (53.4%) | 746 (46.6%) |
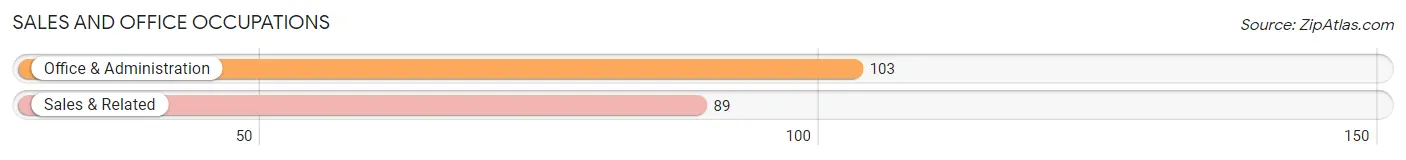
Sales and Office Occupations
The most common Sales and Office occupations in New Lebanon are Office & Administration (103 | 6.4%), and Sales & Related (89 | 5.6%).
Sales and Office Occupations by Sex
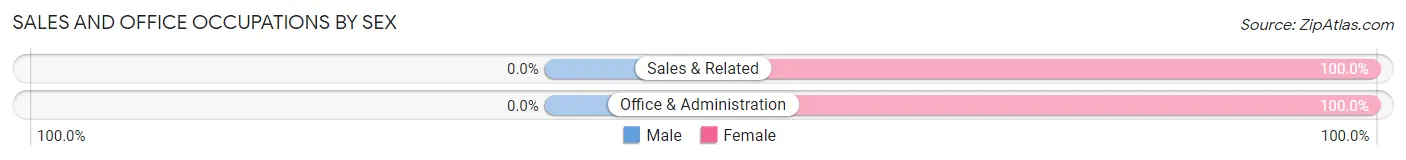
| Occupation | Male | Female |
| Sales & Related | 0 (0.0%) | 89 (100.0%) |
| Office & Administration | 0 (0.0%) | 103 (100.0%) |
| Total (Category) | 0 (0.0%) | 192 (100.0%) |
| Total (Overall) | 855 (53.4%) | 746 (46.6%) |
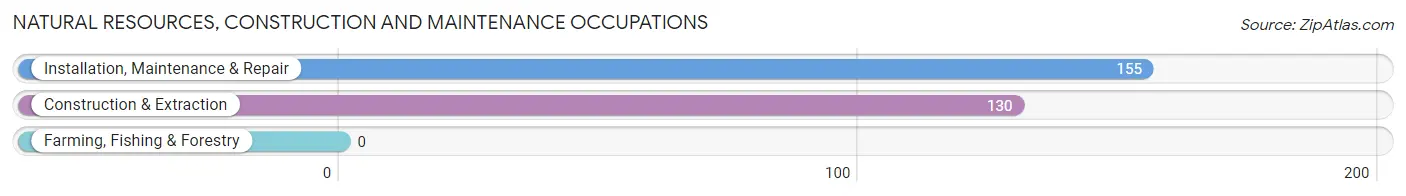
Natural Resources, Construction and Maintenance Occupations
The most common Natural Resources, Construction and Maintenance occupations in New Lebanon are Installation, Maintenance & Repair (155 | 9.7%), and Construction & Extraction (130 | 8.1%).
Natural Resources, Construction and Maintenance Occupations by Sex
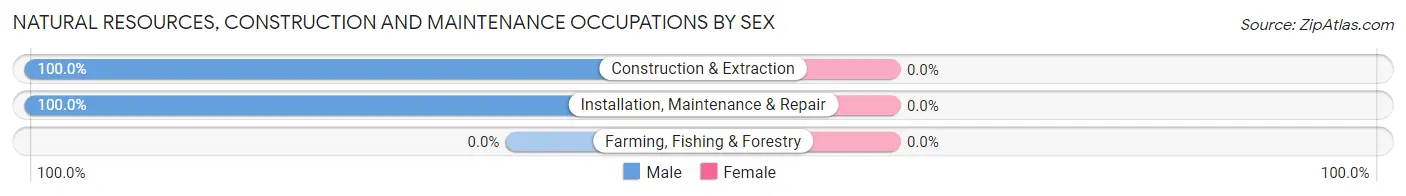
| Occupation | Male | Female |
| Farming, Fishing & Forestry | 0 (0.0%) | 0 (0.0%) |
| Construction & Extraction | 130 (100.0%) | 0 (0.0%) |
| Installation, Maintenance & Repair | 155 (100.0%) | 0 (0.0%) |
| Total (Category) | 285 (100.0%) | 0 (0.0%) |
| Total (Overall) | 855 (53.4%) | 746 (46.6%) |
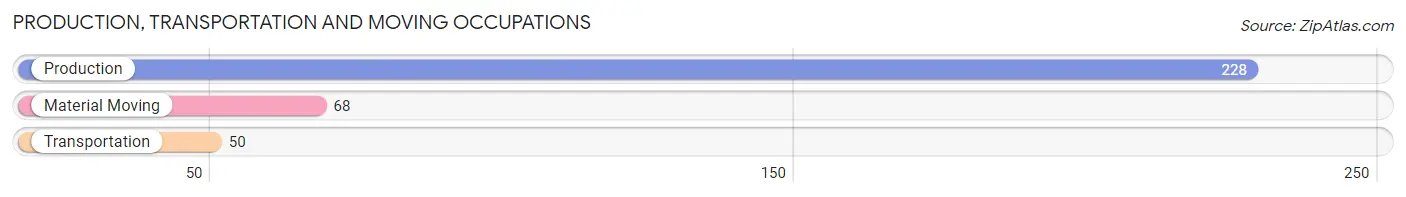
Production, Transportation and Moving Occupations
The most common Production, Transportation and Moving occupations in New Lebanon are Production (228 | 14.2%), Material Moving (68 | 4.3%), and Transportation (50 | 3.1%).
Production, Transportation and Moving Occupations by Sex
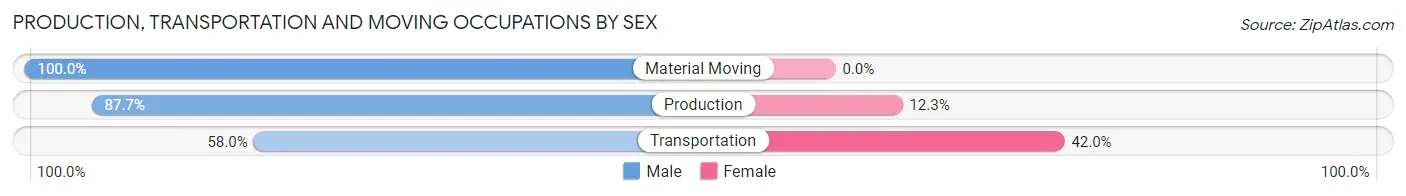
| Occupation | Male | Female |
| Production | 200 (87.7%) | 28 (12.3%) |
| Transportation | 29 (58.0%) | 21 (42.0%) |
| Material Moving | 68 (100.0%) | 0 (0.0%) |
| Total (Category) | 297 (85.8%) | 49 (14.2%) |
| Total (Overall) | 855 (53.4%) | 746 (46.6%) |
Employment Industries by Sex in New Lebanon
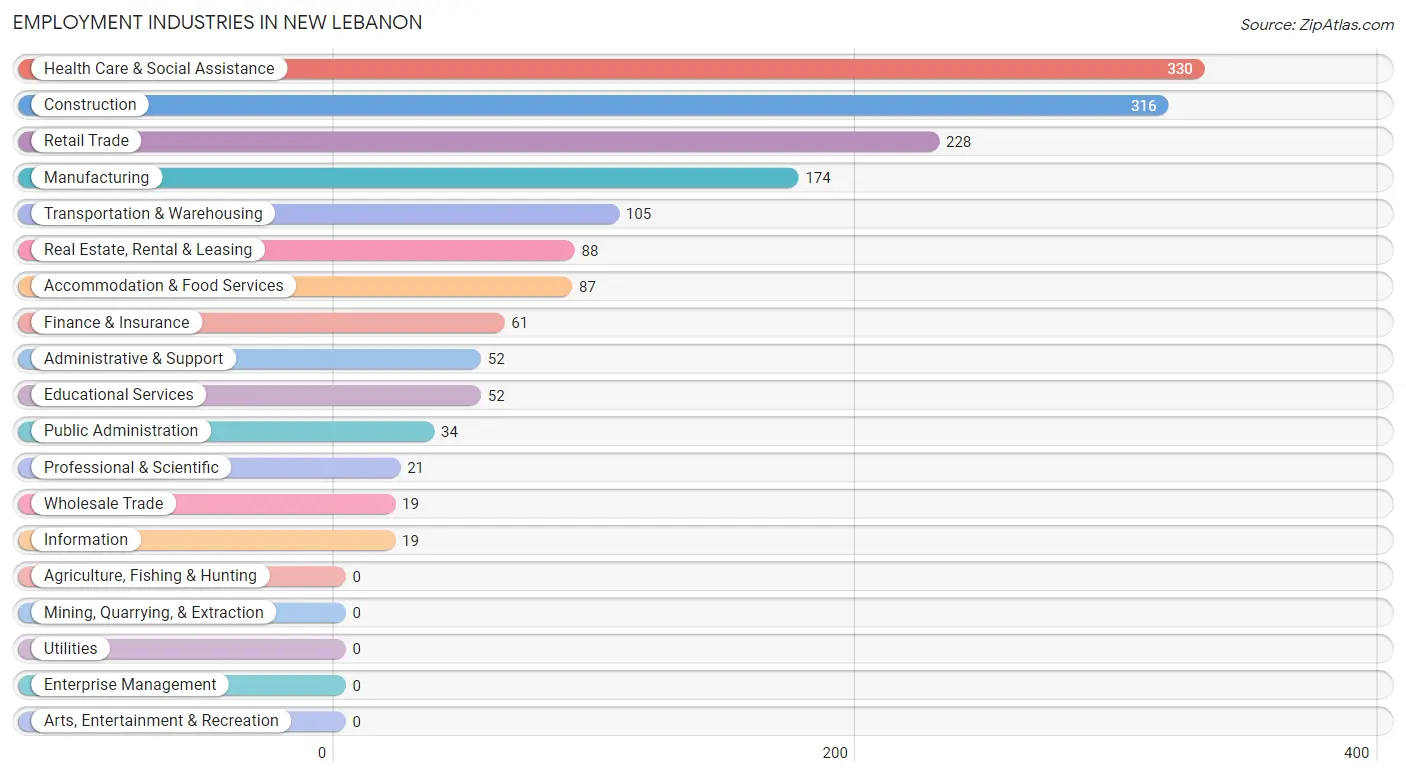
Employment Industries in New Lebanon
The major employment industries in New Lebanon include Health Care & Social Assistance (330 | 20.6%), Construction (316 | 19.7%), Retail Trade (228 | 14.2%), Manufacturing (174 | 10.9%), and Transportation & Warehousing (105 | 6.6%).
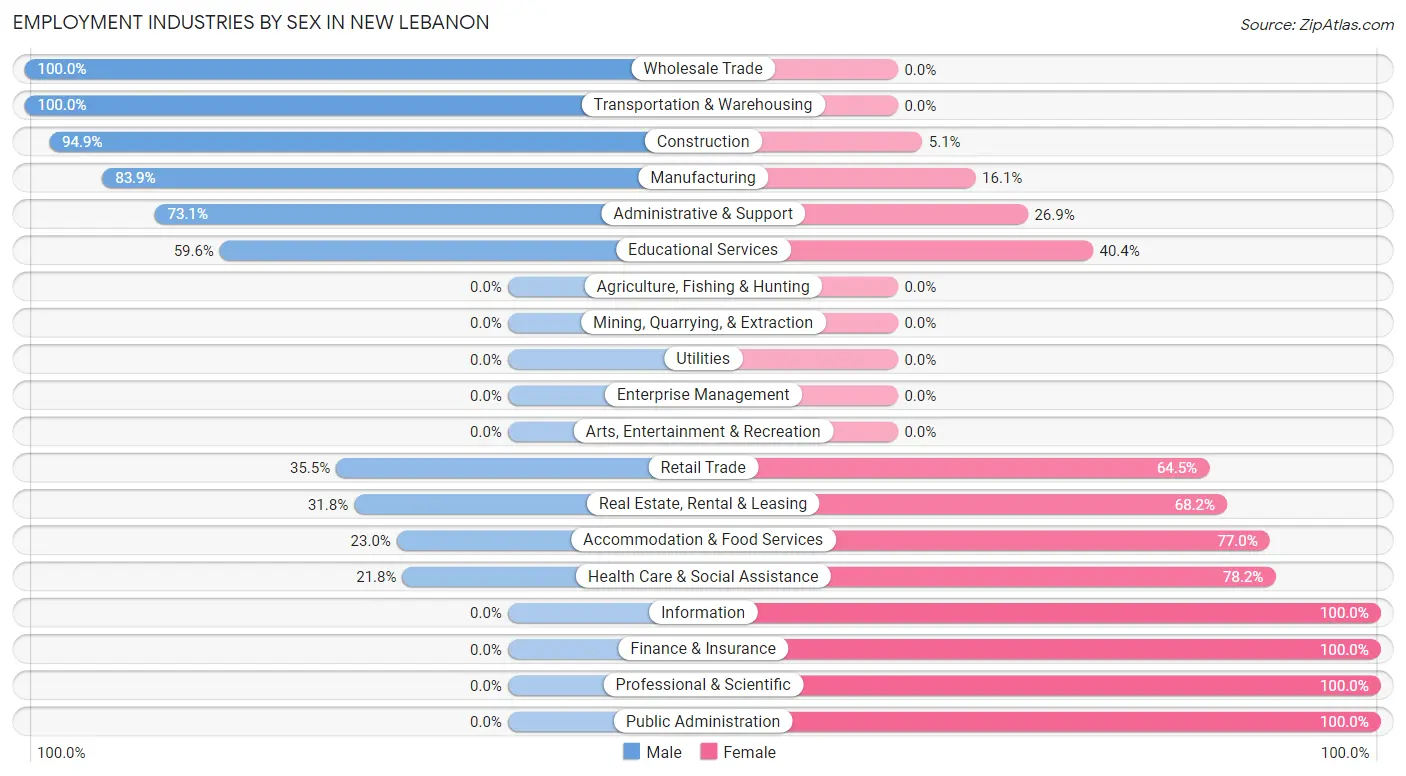
Employment Industries by Sex in New Lebanon
The New Lebanon industries that see more men than women are Wholesale Trade (100.0%), Transportation & Warehousing (100.0%), and Construction (94.9%), whereas the industries that tend to have a higher number of women are Information (100.0%), Finance & Insurance (100.0%), and Professional & Scientific (100.0%).
| Industry | Male | Female |
| Agriculture, Fishing & Hunting | 0 (0.0%) | 0 (0.0%) |
| Mining, Quarrying, & Extraction | 0 (0.0%) | 0 (0.0%) |
| Construction | 300 (94.9%) | 16 (5.1%) |
| Manufacturing | 146 (83.9%) | 28 (16.1%) |
| Wholesale Trade | 19 (100.0%) | 0 (0.0%) |
| Retail Trade | 81 (35.5%) | 147 (64.5%) |
| Transportation & Warehousing | 105 (100.0%) | 0 (0.0%) |
| Utilities | 0 (0.0%) | 0 (0.0%) |
| Information | 0 (0.0%) | 19 (100.0%) |
| Finance & Insurance | 0 (0.0%) | 61 (100.0%) |
| Real Estate, Rental & Leasing | 28 (31.8%) | 60 (68.2%) |
| Professional & Scientific | 0 (0.0%) | 21 (100.0%) |
| Enterprise Management | 0 (0.0%) | 0 (0.0%) |
| Administrative & Support | 38 (73.1%) | 14 (26.9%) |
| Educational Services | 31 (59.6%) | 21 (40.4%) |
| Health Care & Social Assistance | 72 (21.8%) | 258 (78.2%) |
| Arts, Entertainment & Recreation | 0 (0.0%) | 0 (0.0%) |
| Accommodation & Food Services | 20 (23.0%) | 67 (77.0%) |
| Public Administration | 0 (0.0%) | 34 (100.0%) |
| Total | 855 (53.4%) | 746 (46.6%) |
Education in New Lebanon
School Enrollment in New Lebanon
The most common levels of schooling among the 1,112 students in New Lebanon are elementary school (369 | 33.2%), high school (222 | 20.0%), and middle school (202 | 18.2%).
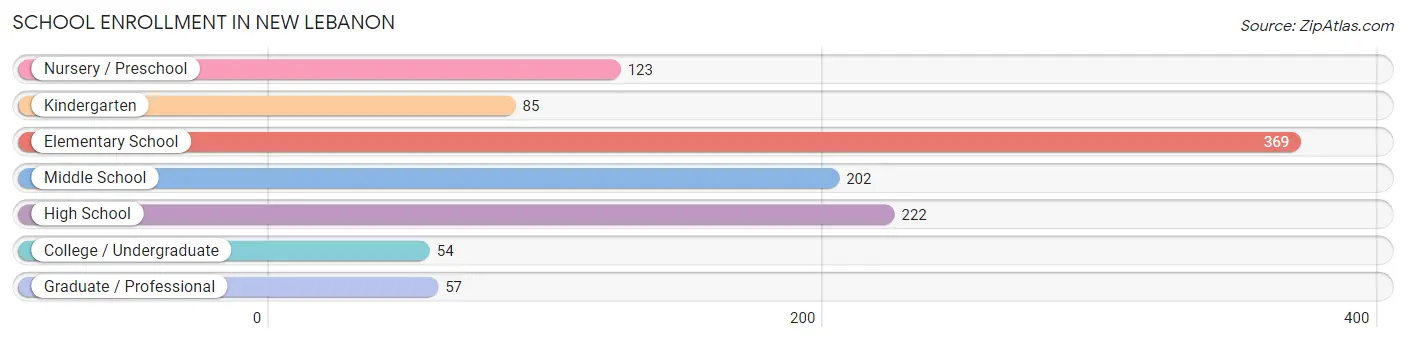
| School Level | # Students | % Students |
| Nursery / Preschool | 123 | 11.1% |
| Kindergarten | 85 | 7.6% |
| Elementary School | 369 | 33.2% |
| Middle School | 202 | 18.2% |
| High School | 222 | 20.0% |
| College / Undergraduate | 54 | 4.9% |
| Graduate / Professional | 57 | 5.1% |
| Total | 1,112 | 100.0% |
School Enrollment by Age by Funding Source in New Lebanon
Out of a total of 1,112 students who are enrolled in schools in New Lebanon, 57 (5.1%) attend a private institution, while the remaining 1,055 (94.9%) are enrolled in public schools. The age group of 35 years and over has the highest likelihood of being enrolled in private schools, with 57 (100.0% in the age bracket) enrolled. Conversely, the age group of 3 to 4 year olds has the lowest likelihood of being enrolled in a private school, with 100 (100.0% in the age bracket) attending a public institution.
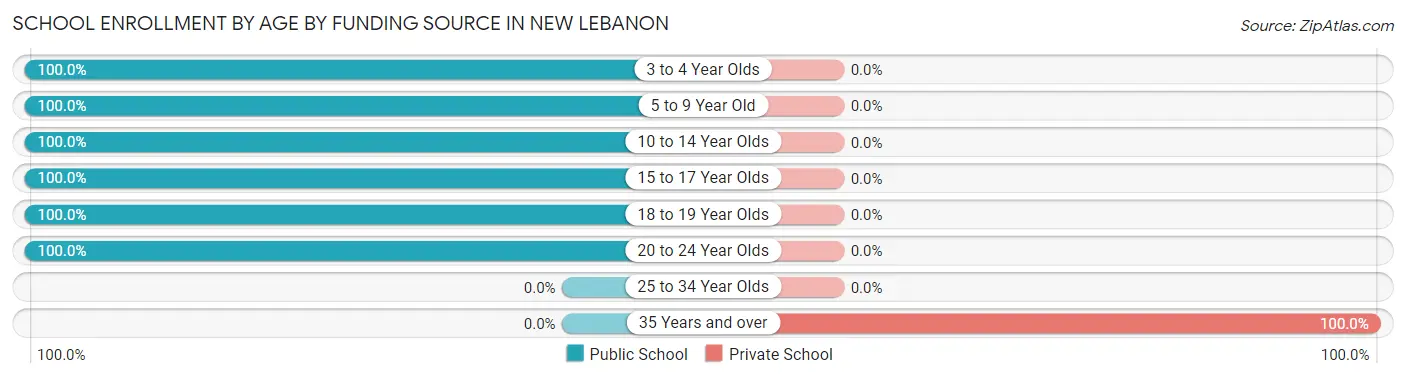
| Age Bracket | Public School | Private School |
| 3 to 4 Year Olds | 100 (100.0%) | 0 (0.0%) |
| 5 to 9 Year Old | 455 (100.0%) | 0 (0.0%) |
| 10 to 14 Year Olds | 224 (100.0%) | 0 (0.0%) |
| 15 to 17 Year Olds | 153 (100.0%) | 0 (0.0%) |
| 18 to 19 Year Olds | 69 (100.0%) | 0 (0.0%) |
| 20 to 24 Year Olds | 54 (100.0%) | 0 (0.0%) |
| 25 to 34 Year Olds | 0 (0.0%) | 0 (0.0%) |
| 35 Years and over | 0 (0.0%) | 57 (100.0%) |
| Total | 1,055 (94.9%) | 57 (5.1%) |
Educational Attainment by Field of Study in New Lebanon
Business (76 | 52.0%), education (27 | 18.5%), social sciences (18 | 12.3%), communications (16 | 11.0%), and liberal arts & history (9 | 6.2%) are the most common fields of study among 146 individuals in New Lebanon who have obtained a bachelor's degree or higher.
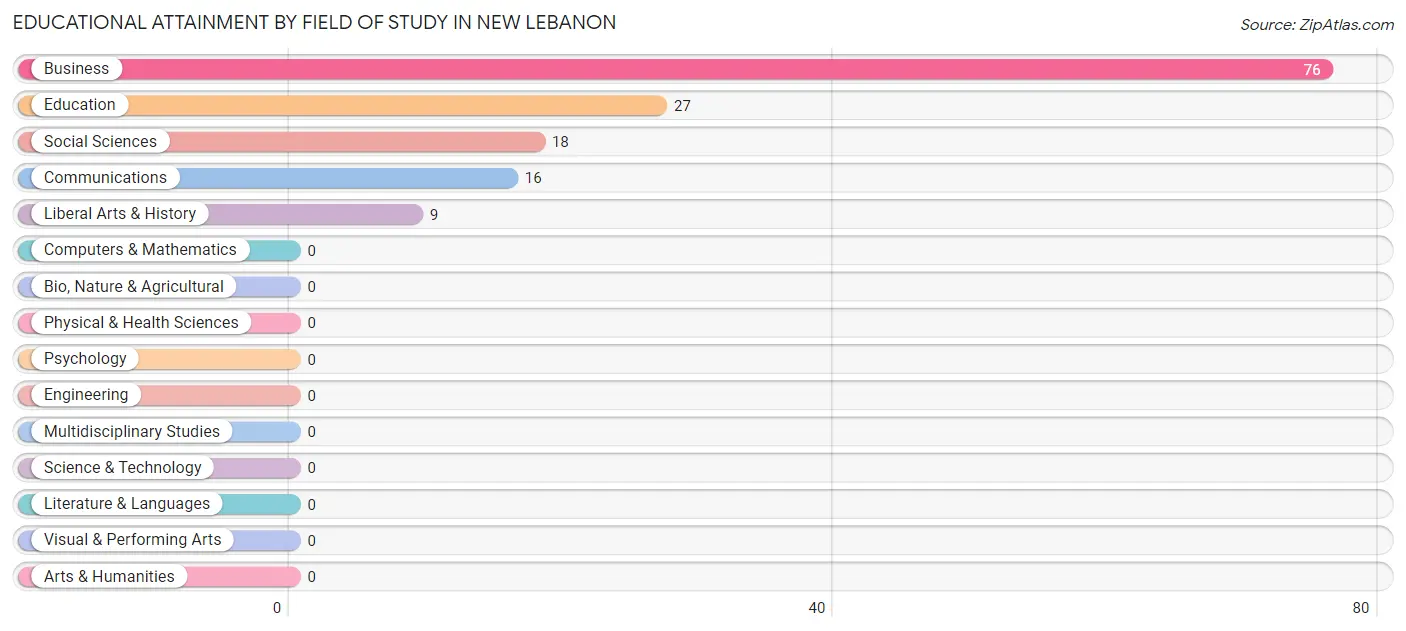
| Field of Study | # Graduates | % Graduates |
| Computers & Mathematics | 0 | 0.0% |
| Bio, Nature & Agricultural | 0 | 0.0% |
| Physical & Health Sciences | 0 | 0.0% |
| Psychology | 0 | 0.0% |
| Social Sciences | 18 | 12.3% |
| Engineering | 0 | 0.0% |
| Multidisciplinary Studies | 0 | 0.0% |
| Science & Technology | 0 | 0.0% |
| Business | 76 | 52.0% |
| Education | 27 | 18.5% |
| Literature & Languages | 0 | 0.0% |
| Liberal Arts & History | 9 | 6.2% |
| Visual & Performing Arts | 0 | 0.0% |
| Communications | 16 | 11.0% |
| Arts & Humanities | 0 | 0.0% |
| Total | 146 | 100.0% |
Transportation & Commute in New Lebanon
Vehicle Availability by Sex in New Lebanon
The most prevalent vehicle ownership categories in New Lebanon are males with 3 vehicles (321, accounting for 37.5%) and females with 3 vehicles (218, making up 47.9%).
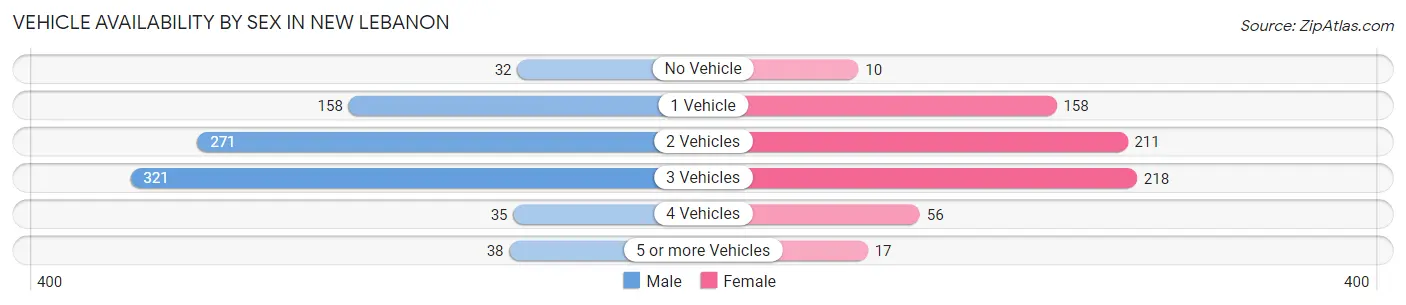
| Vehicles Available | Male | Female |
| No Vehicle | 32 (3.7%) | 10 (1.5%) |
| 1 Vehicle | 158 (18.5%) | 158 (23.6%) |
| 2 Vehicles | 271 (31.7%) | 211 (31.5%) |
| 3 Vehicles | 321 (37.5%) | 218 (32.5%) |
| 4 Vehicles | 35 (4.1%) | 56 (8.4%) |
| 5 or more Vehicles | 38 (4.4%) | 17 (2.5%) |
| Total | 855 (100.0%) | 670 (100.0%) |
Commute Time in New Lebanon
The most frequently occuring commute durations in New Lebanon are 30 to 34 minutes (361 commuters, 26.1%), 20 to 24 minutes (274 commuters, 19.8%), and 15 to 19 minutes (216 commuters, 15.6%).
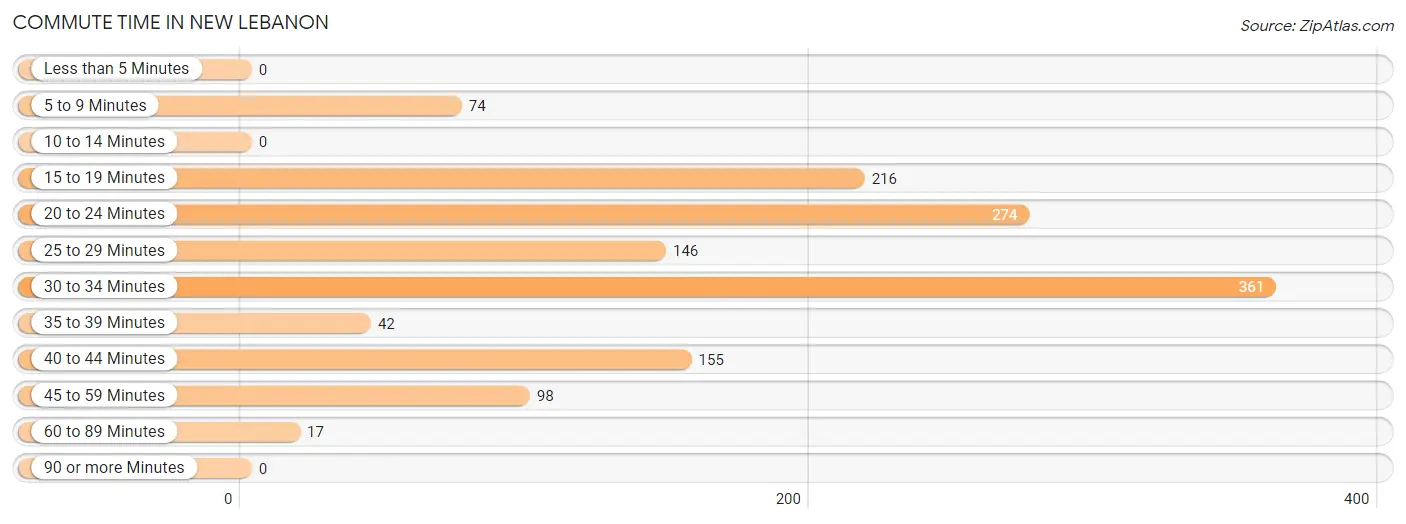
| Commute Time | # Commuters | % Commuters |
| Less than 5 Minutes | 0 | 0.0% |
| 5 to 9 Minutes | 74 | 5.3% |
| 10 to 14 Minutes | 0 | 0.0% |
| 15 to 19 Minutes | 216 | 15.6% |
| 20 to 24 Minutes | 274 | 19.8% |
| 25 to 29 Minutes | 146 | 10.6% |
| 30 to 34 Minutes | 361 | 26.1% |
| 35 to 39 Minutes | 42 | 3.0% |
| 40 to 44 Minutes | 155 | 11.2% |
| 45 to 59 Minutes | 98 | 7.1% |
| 60 to 89 Minutes | 17 | 1.2% |
| 90 or more Minutes | 0 | 0.0% |
Commute Time by Sex in New Lebanon
The most common commute times in New Lebanon are 30 to 34 minutes (235 commuters, 28.7%) for males and 30 to 34 minutes (126 commuters, 22.3%) for females.
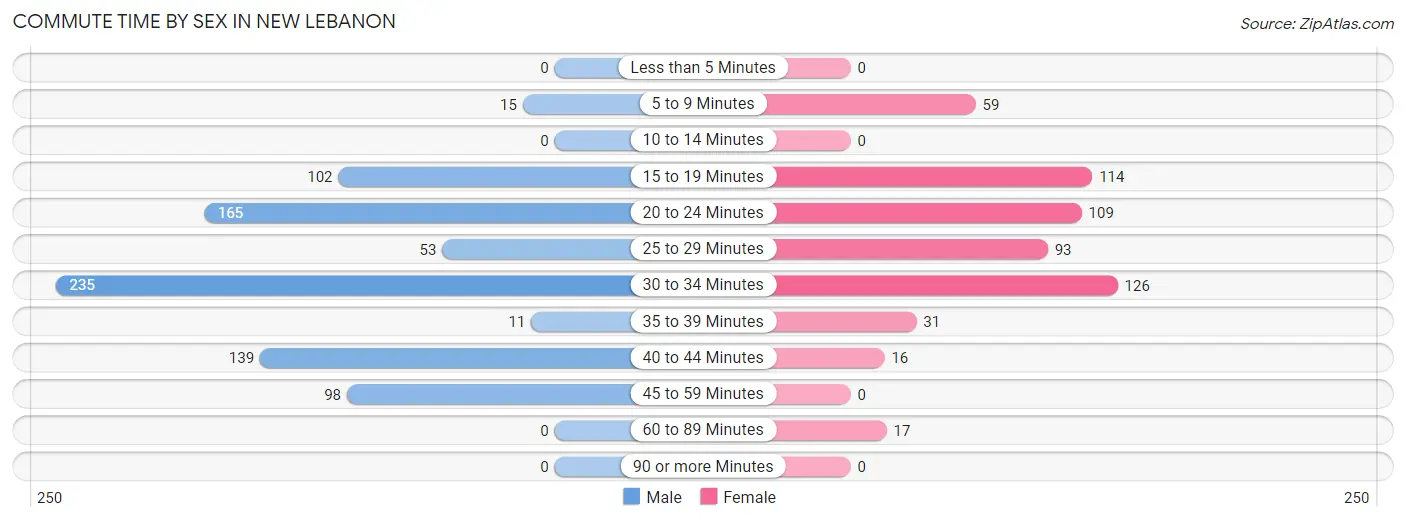
| Commute Time | Male | Female |
| Less than 5 Minutes | 0 (0.0%) | 0 (0.0%) |
| 5 to 9 Minutes | 15 (1.8%) | 59 (10.4%) |
| 10 to 14 Minutes | 0 (0.0%) | 0 (0.0%) |
| 15 to 19 Minutes | 102 (12.5%) | 114 (20.2%) |
| 20 to 24 Minutes | 165 (20.2%) | 109 (19.3%) |
| 25 to 29 Minutes | 53 (6.5%) | 93 (16.5%) |
| 30 to 34 Minutes | 235 (28.7%) | 126 (22.3%) |
| 35 to 39 Minutes | 11 (1.3%) | 31 (5.5%) |
| 40 to 44 Minutes | 139 (17.0%) | 16 (2.8%) |
| 45 to 59 Minutes | 98 (12.0%) | 0 (0.0%) |
| 60 to 89 Minutes | 0 (0.0%) | 17 (3.0%) |
| 90 or more Minutes | 0 (0.0%) | 0 (0.0%) |
Time of Departure to Work by Sex in New Lebanon
The most frequent times of departure to work in New Lebanon are 4:00 PM to 11:59 PM (260, 31.8%) for males and 6:30 AM to 6:59 AM (133, 23.5%) for females.
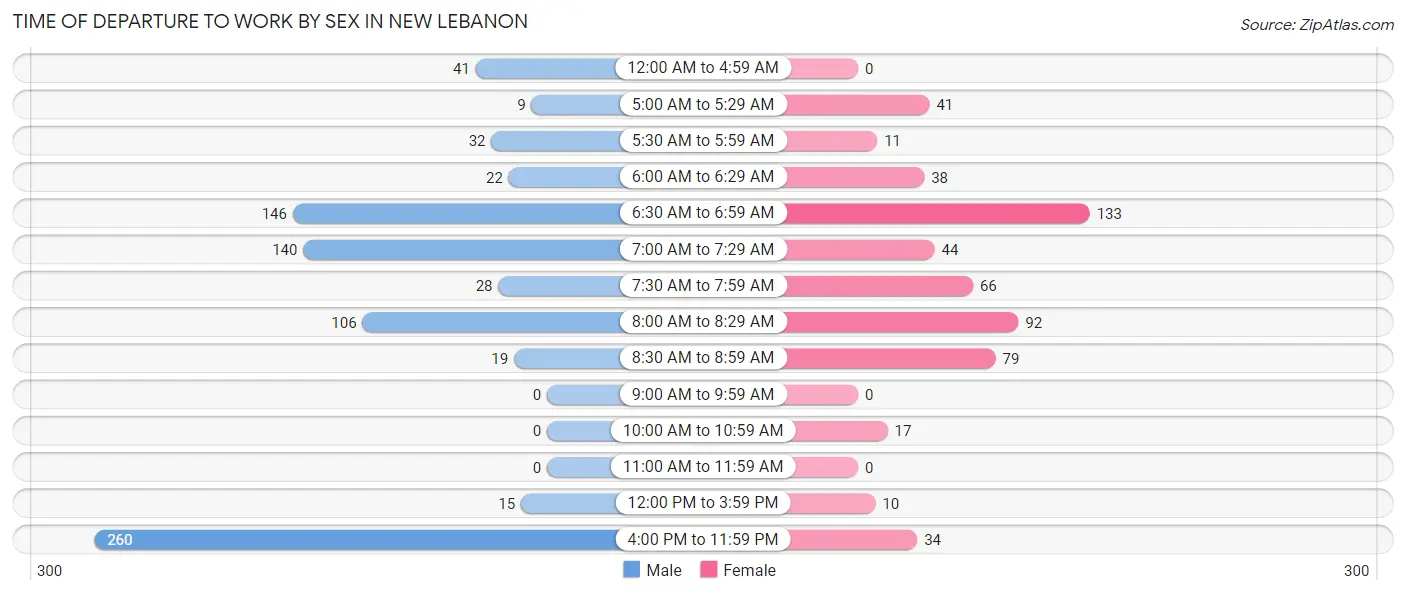
| Time of Departure | Male | Female |
| 12:00 AM to 4:59 AM | 41 (5.0%) | 0 (0.0%) |
| 5:00 AM to 5:29 AM | 9 (1.1%) | 41 (7.3%) |
| 5:30 AM to 5:59 AM | 32 (3.9%) | 11 (1.9%) |
| 6:00 AM to 6:29 AM | 22 (2.7%) | 38 (6.7%) |
| 6:30 AM to 6:59 AM | 146 (17.8%) | 133 (23.5%) |
| 7:00 AM to 7:29 AM | 140 (17.1%) | 44 (7.8%) |
| 7:30 AM to 7:59 AM | 28 (3.4%) | 66 (11.7%) |
| 8:00 AM to 8:29 AM | 106 (13.0%) | 92 (16.3%) |
| 8:30 AM to 8:59 AM | 19 (2.3%) | 79 (14.0%) |
| 9:00 AM to 9:59 AM | 0 (0.0%) | 0 (0.0%) |
| 10:00 AM to 10:59 AM | 0 (0.0%) | 17 (3.0%) |
| 11:00 AM to 11:59 AM | 0 (0.0%) | 0 (0.0%) |
| 12:00 PM to 3:59 PM | 15 (1.8%) | 10 (1.8%) |
| 4:00 PM to 11:59 PM | 260 (31.8%) | 34 (6.0%) |
| Total | 818 (100.0%) | 565 (100.0%) |
Housing Occupancy in New Lebanon
Occupancy by Ownership in New Lebanon
Of the total 1,504 dwellings in New Lebanon, owner-occupied units account for 1,064 (70.7%), while renter-occupied units make up 440 (29.3%).
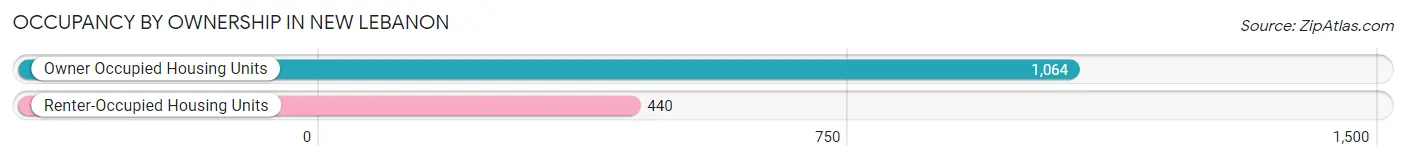
| Occupancy | # Housing Units | % Housing Units |
| Owner Occupied Housing Units | 1,064 | 70.7% |
| Renter-Occupied Housing Units | 440 | 29.3% |
| Total Occupied Housing Units | 1,504 | 100.0% |
Occupancy by Household Size in New Lebanon
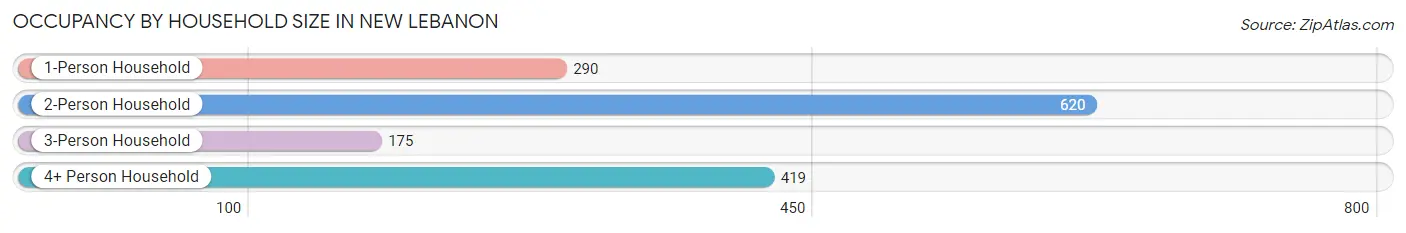
| Household Size | # Housing Units | % Housing Units |
| 1-Person Household | 290 | 19.3% |
| 2-Person Household | 620 | 41.2% |
| 3-Person Household | 175 | 11.6% |
| 4+ Person Household | 419 | 27.9% |
| Total Housing Units | 1,504 | 100.0% |
Occupancy by Ownership by Household Size in New Lebanon
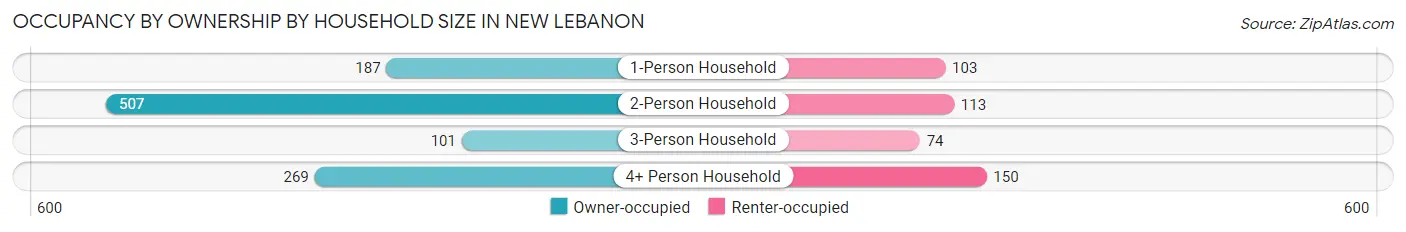
| Household Size | Owner-occupied | Renter-occupied |
| 1-Person Household | 187 (64.5%) | 103 (35.5%) |
| 2-Person Household | 507 (81.8%) | 113 (18.2%) |
| 3-Person Household | 101 (57.7%) | 74 (42.3%) |
| 4+ Person Household | 269 (64.2%) | 150 (35.8%) |
| Total Housing Units | 1,064 (70.7%) | 440 (29.3%) |
Occupancy by Educational Attainment in New Lebanon
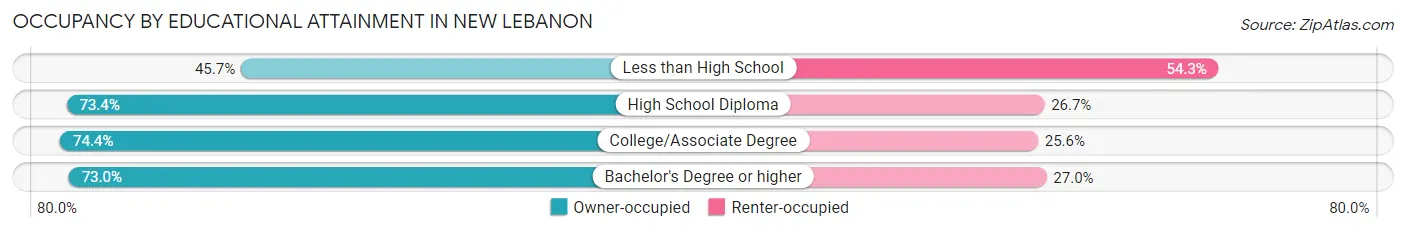
| Household Size | Owner-occupied | Renter-occupied |
| Less than High School | 74 (45.7%) | 88 (54.3%) |
| High School Diploma | 479 (73.4%) | 174 (26.7%) |
| College/Associate Degree | 438 (74.4%) | 151 (25.6%) |
| Bachelor's Degree or higher | 73 (73.0%) | 27 (27.0%) |
Occupancy by Age of Householder in New Lebanon
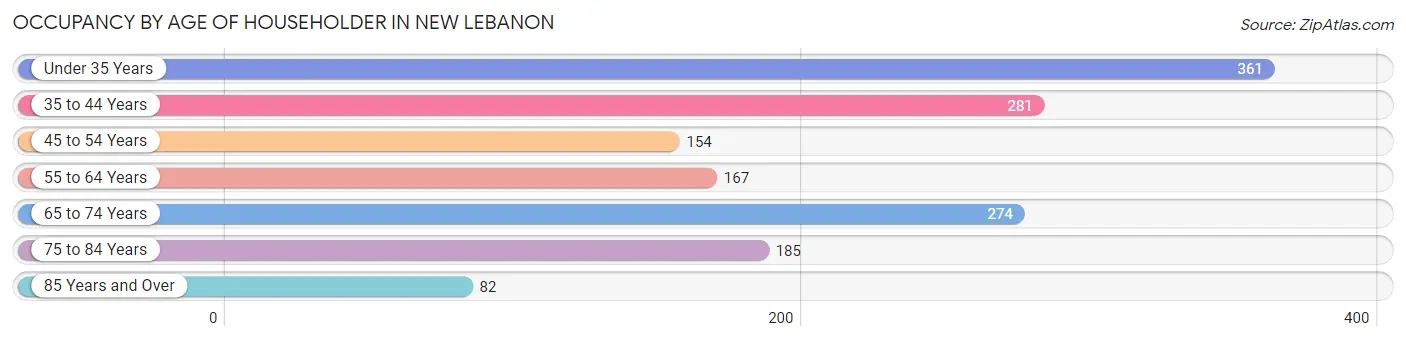
| Age Bracket | # Households | % Households |
| Under 35 Years | 361 | 24.0% |
| 35 to 44 Years | 281 | 18.7% |
| 45 to 54 Years | 154 | 10.2% |
| 55 to 64 Years | 167 | 11.1% |
| 65 to 74 Years | 274 | 18.2% |
| 75 to 84 Years | 185 | 12.3% |
| 85 Years and Over | 82 | 5.4% |
| Total | 1,504 | 100.0% |
Housing Finances in New Lebanon
Median Income by Occupancy in New Lebanon
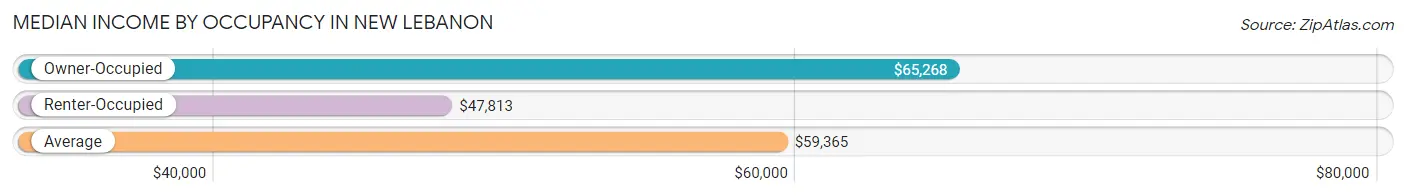
| Occupancy Type | # Households | Median Income |
| Owner-Occupied | 1,064 (70.7%) | $65,268 |
| Renter-Occupied | 440 (29.3%) | $47,813 |
| Average | 1,504 (100.0%) | $59,365 |
Occupancy by Householder Income Bracket in New Lebanon
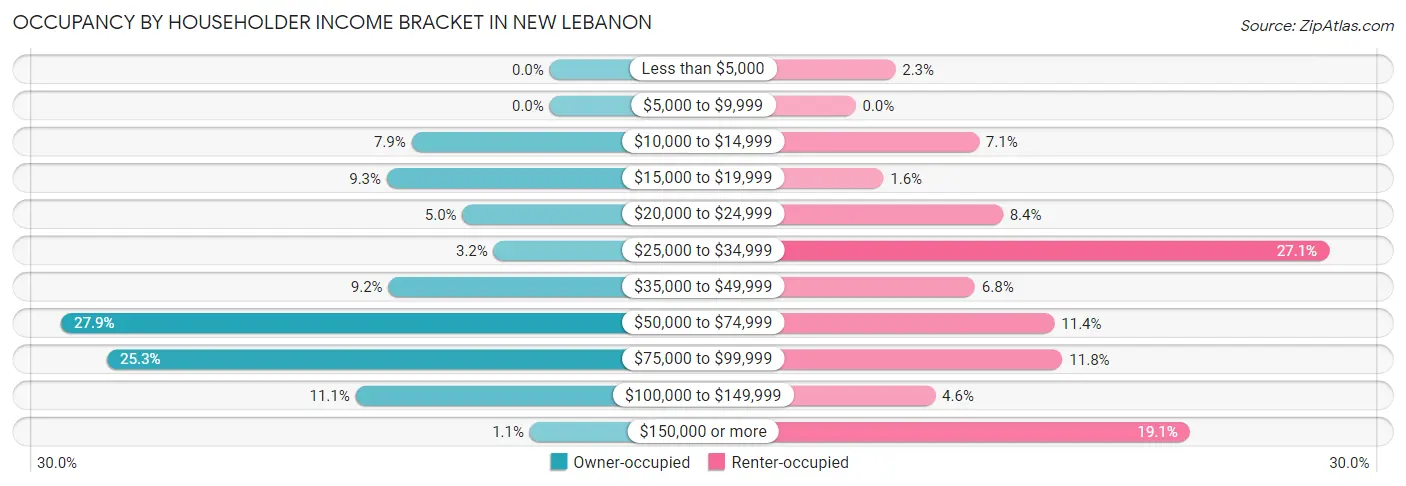
| Income Bracket | Owner-occupied | Renter-occupied |
| Less than $5,000 | 0 (0.0%) | 10 (2.3%) |
| $5,000 to $9,999 | 0 (0.0%) | 0 (0.0%) |
| $10,000 to $14,999 | 84 (7.9%) | 31 (7.0%) |
| $15,000 to $19,999 | 99 (9.3%) | 7 (1.6%) |
| $20,000 to $24,999 | 53 (5.0%) | 37 (8.4%) |
| $25,000 to $34,999 | 34 (3.2%) | 119 (27.1%) |
| $35,000 to $49,999 | 98 (9.2%) | 30 (6.8%) |
| $50,000 to $74,999 | 297 (27.9%) | 50 (11.4%) |
| $75,000 to $99,999 | 269 (25.3%) | 52 (11.8%) |
| $100,000 to $149,999 | 118 (11.1%) | 20 (4.5%) |
| $150,000 or more | 12 (1.1%) | 84 (19.1%) |
| Total | 1,064 (100.0%) | 440 (100.0%) |
Monthly Housing Cost Tiers in New Lebanon
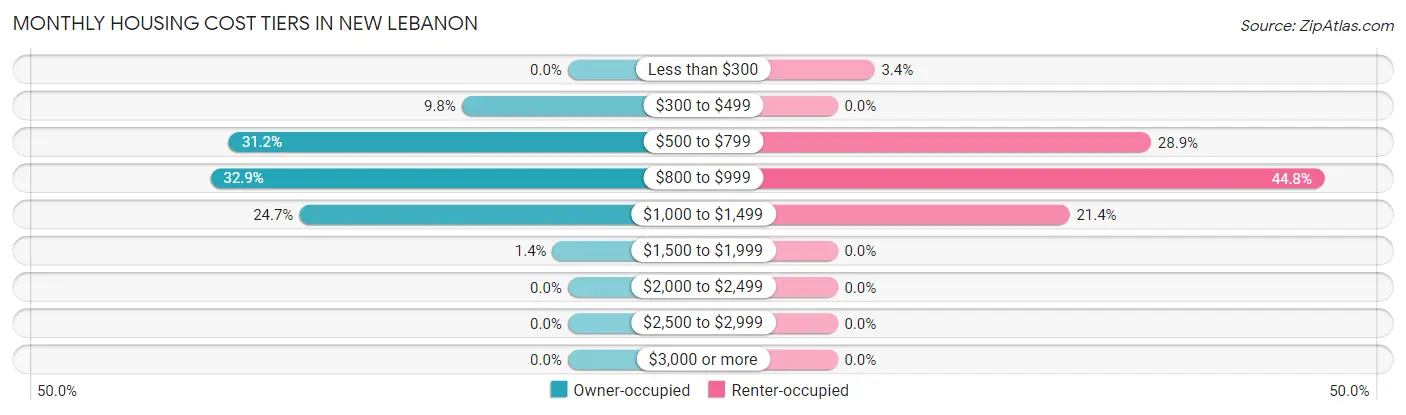
| Monthly Cost | Owner-occupied | Renter-occupied |
| Less than $300 | 0 (0.0%) | 15 (3.4%) |
| $300 to $499 | 104 (9.8%) | 0 (0.0%) |
| $500 to $799 | 332 (31.2%) | 127 (28.9%) |
| $800 to $999 | 350 (32.9%) | 197 (44.8%) |
| $1,000 to $1,499 | 263 (24.7%) | 94 (21.4%) |
| $1,500 to $1,999 | 15 (1.4%) | 0 (0.0%) |
| $2,000 to $2,499 | 0 (0.0%) | 0 (0.0%) |
| $2,500 to $2,999 | 0 (0.0%) | 0 (0.0%) |
| $3,000 or more | 0 (0.0%) | 0 (0.0%) |
| Total | 1,064 (100.0%) | 440 (100.0%) |
Physical Housing Characteristics in New Lebanon
Housing Structures in New Lebanon
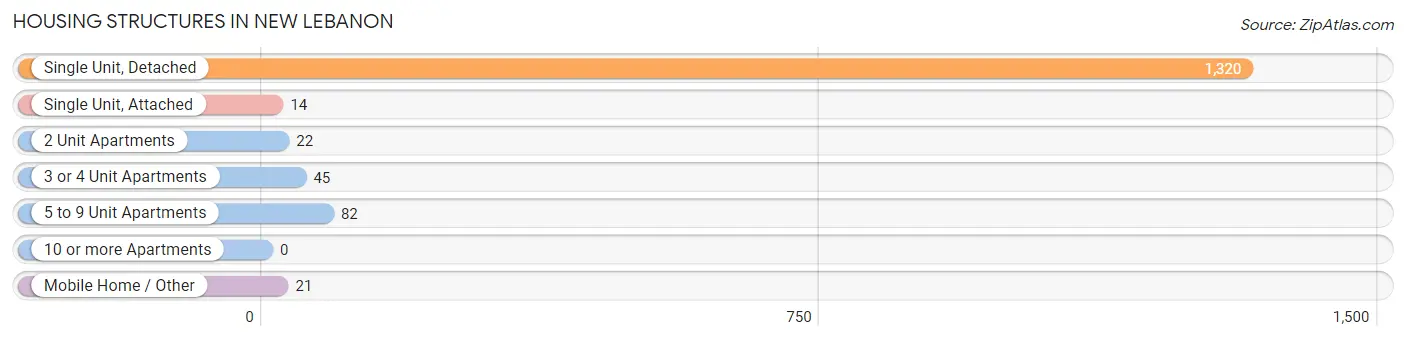
| Structure Type | # Housing Units | % Housing Units |
| Single Unit, Detached | 1,320 | 87.8% |
| Single Unit, Attached | 14 | 0.9% |
| 2 Unit Apartments | 22 | 1.5% |
| 3 or 4 Unit Apartments | 45 | 3.0% |
| 5 to 9 Unit Apartments | 82 | 5.4% |
| 10 or more Apartments | 0 | 0.0% |
| Mobile Home / Other | 21 | 1.4% |
| Total | 1,504 | 100.0% |
Housing Structures by Occupancy in New Lebanon
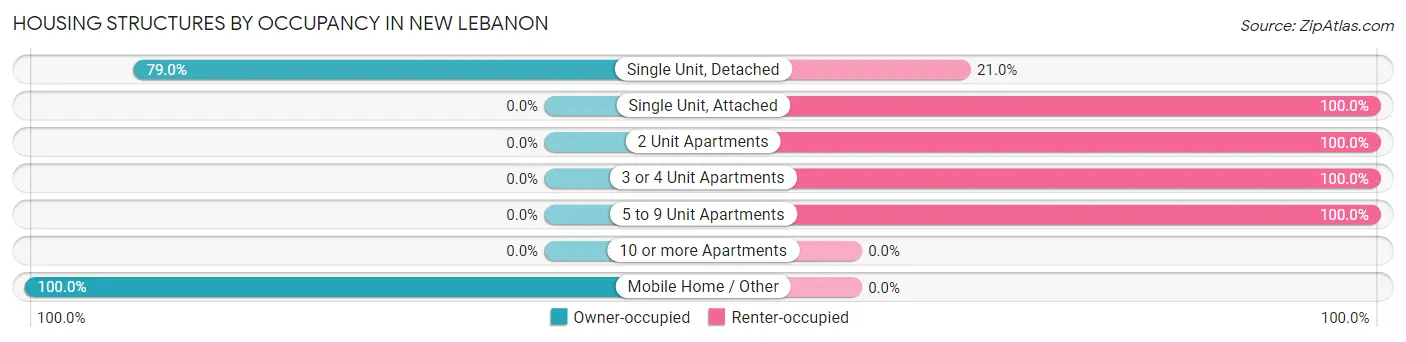
| Structure Type | Owner-occupied | Renter-occupied |
| Single Unit, Detached | 1,043 (79.0%) | 277 (21.0%) |
| Single Unit, Attached | 0 (0.0%) | 14 (100.0%) |
| 2 Unit Apartments | 0 (0.0%) | 22 (100.0%) |
| 3 or 4 Unit Apartments | 0 (0.0%) | 45 (100.0%) |
| 5 to 9 Unit Apartments | 0 (0.0%) | 82 (100.0%) |
| 10 or more Apartments | 0 (0.0%) | 0 (0.0%) |
| Mobile Home / Other | 21 (100.0%) | 0 (0.0%) |
| Total | 1,064 (70.7%) | 440 (29.3%) |
Housing Structures by Number of Rooms in New Lebanon
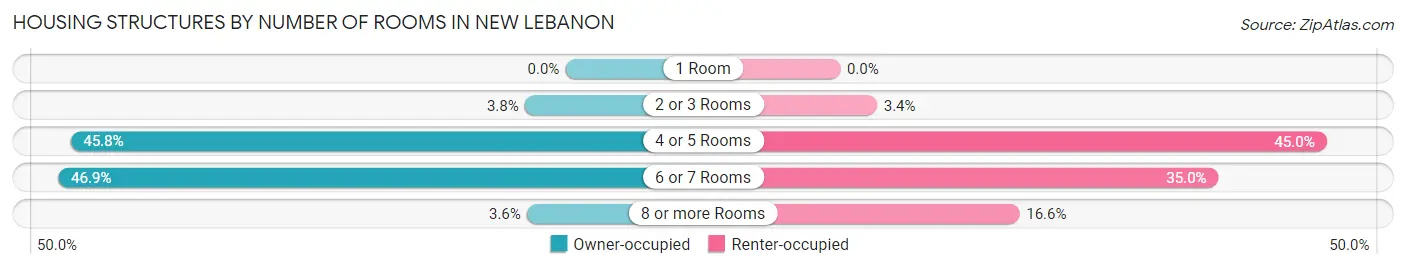
| Number of Rooms | Owner-occupied | Renter-occupied |
| 1 Room | 0 (0.0%) | 0 (0.0%) |
| 2 or 3 Rooms | 40 (3.8%) | 15 (3.4%) |
| 4 or 5 Rooms | 487 (45.8%) | 198 (45.0%) |
| 6 or 7 Rooms | 499 (46.9%) | 154 (35.0%) |
| 8 or more Rooms | 38 (3.6%) | 73 (16.6%) |
| Total | 1,064 (100.0%) | 440 (100.0%) |
Housing Structure by Heating Type in New Lebanon
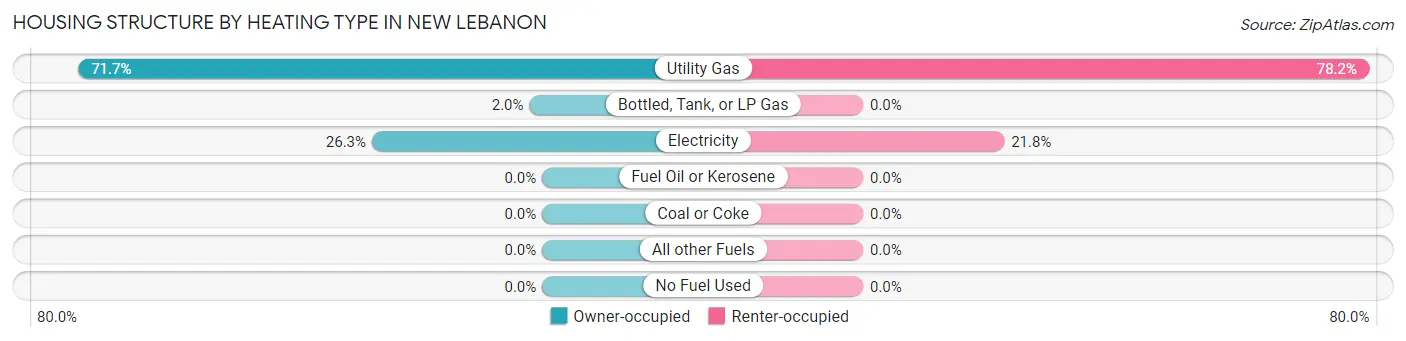
| Heating Type | Owner-occupied | Renter-occupied |
| Utility Gas | 763 (71.7%) | 344 (78.2%) |
| Bottled, Tank, or LP Gas | 21 (2.0%) | 0 (0.0%) |
| Electricity | 280 (26.3%) | 96 (21.8%) |
| Fuel Oil or Kerosene | 0 (0.0%) | 0 (0.0%) |
| Coal or Coke | 0 (0.0%) | 0 (0.0%) |
| All other Fuels | 0 (0.0%) | 0 (0.0%) |
| No Fuel Used | 0 (0.0%) | 0 (0.0%) |
| Total | 1,064 (100.0%) | 440 (100.0%) |
Household Vehicle Usage in New Lebanon
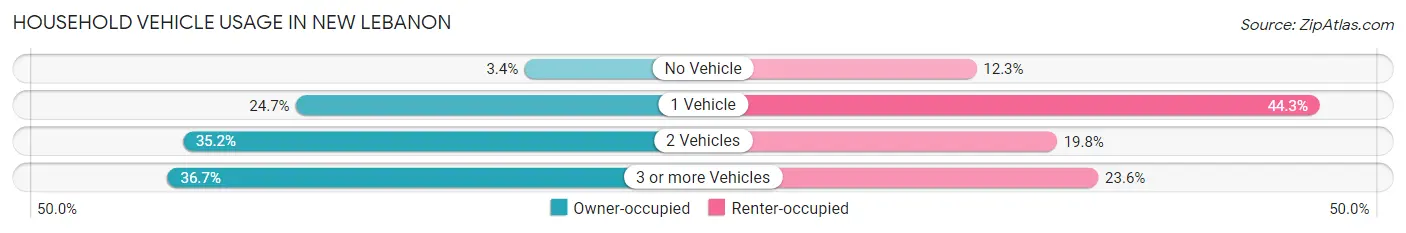
| Vehicles per Household | Owner-occupied | Renter-occupied |
| No Vehicle | 36 (3.4%) | 54 (12.3%) |
| 1 Vehicle | 263 (24.7%) | 195 (44.3%) |
| 2 Vehicles | 375 (35.2%) | 87 (19.8%) |
| 3 or more Vehicles | 390 (36.6%) | 104 (23.6%) |
| Total | 1,064 (100.0%) | 440 (100.0%) |
Real Estate & Mortgages in New Lebanon
Real Estate and Mortgage Overview in New Lebanon
| Characteristic | Without Mortgage | With Mortgage |
| Housing Units | 387 | 677 |
| Median Property Value | $98,600 | $96,200 |
| Median Household Income | $51,172 | $12 |
| Monthly Housing Costs | $543 | $0 |
| Real Estate Taxes | $2,057 | $29 |
Property Value by Mortgage Status in New Lebanon
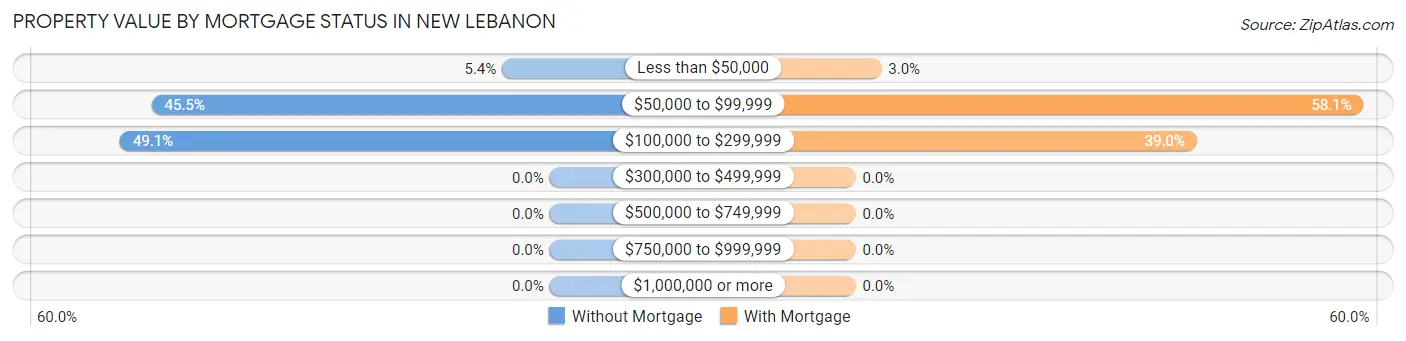
| Property Value | Without Mortgage | With Mortgage |
| Less than $50,000 | 21 (5.4%) | 20 (2.9%) |
| $50,000 to $99,999 | 176 (45.5%) | 393 (58.1%) |
| $100,000 to $299,999 | 190 (49.1%) | 264 (39.0%) |
| $300,000 to $499,999 | 0 (0.0%) | 0 (0.0%) |
| $500,000 to $749,999 | 0 (0.0%) | 0 (0.0%) |
| $750,000 to $999,999 | 0 (0.0%) | 0 (0.0%) |
| $1,000,000 or more | 0 (0.0%) | 0 (0.0%) |
| Total | 387 (100.0%) | 677 (100.0%) |
Household Income by Mortgage Status in New Lebanon
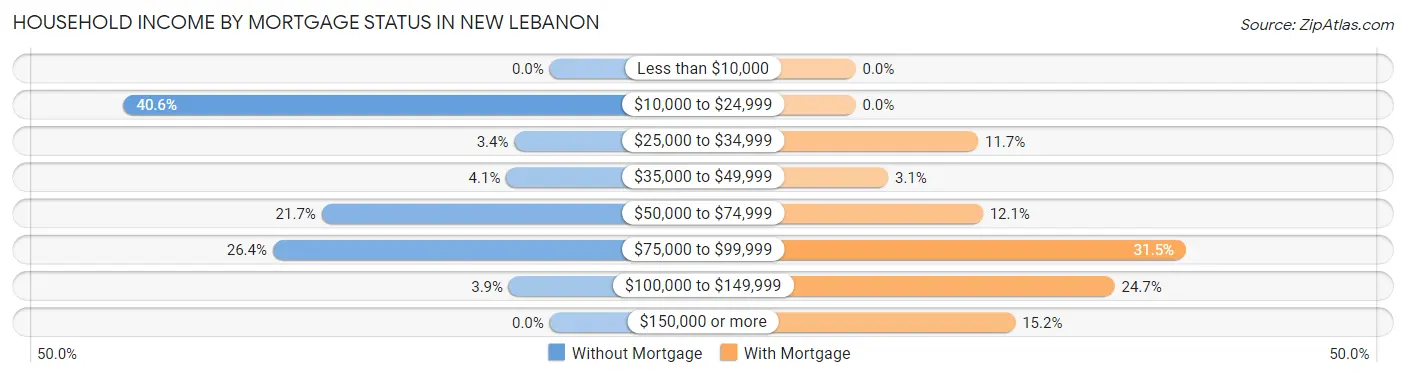
| Household Income | Without Mortgage | With Mortgage |
| Less than $10,000 | 0 (0.0%) | 0 (0.0%) |
| $10,000 to $24,999 | 157 (40.6%) | 0 (0.0%) |
| $25,000 to $34,999 | 13 (3.4%) | 79 (11.7%) |
| $35,000 to $49,999 | 16 (4.1%) | 21 (3.1%) |
| $50,000 to $74,999 | 84 (21.7%) | 82 (12.1%) |
| $75,000 to $99,999 | 102 (26.4%) | 213 (31.5%) |
| $100,000 to $149,999 | 15 (3.9%) | 167 (24.7%) |
| $150,000 or more | 0 (0.0%) | 103 (15.2%) |
| Total | 387 (100.0%) | 677 (100.0%) |
Property Value to Household Income Ratio in New Lebanon
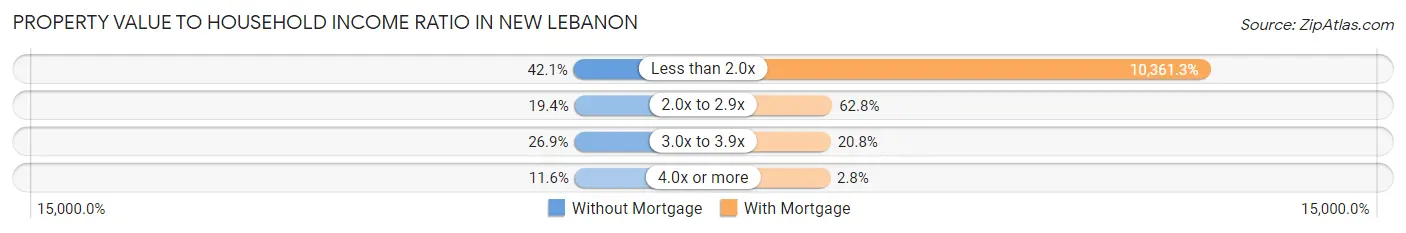
| Value-to-Income Ratio | Without Mortgage | With Mortgage |
| Less than 2.0x | 163 (42.1%) | 70,146 (10,361.3%) |
| 2.0x to 2.9x | 75 (19.4%) | 425 (62.8%) |
| 3.0x to 3.9x | 104 (26.9%) | 141 (20.8%) |
| 4.0x or more | 45 (11.6%) | 19 (2.8%) |
| Total | 387 (100.0%) | 677 (100.0%) |
Real Estate Taxes by Mortgage Status in New Lebanon
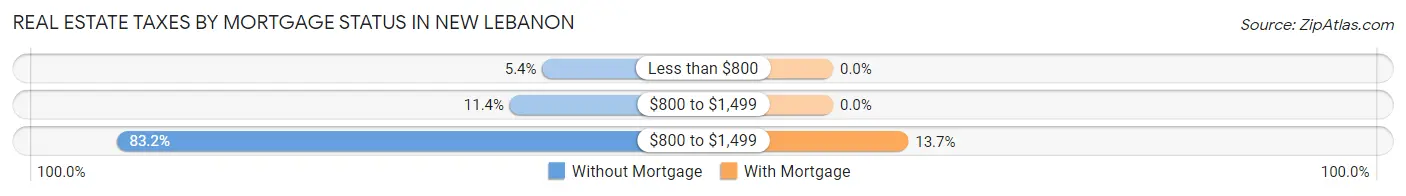
| Property Taxes | Without Mortgage | With Mortgage |
| Less than $800 | 21 (5.4%) | 0 (0.0%) |
| $800 to $1,499 | 44 (11.4%) | 0 (0.0%) |
| $800 to $1,499 | 322 (83.2%) | 93 (13.7%) |
| Total | 387 (100.0%) | 677 (100.0%) |
Health & Disability in New Lebanon
Health Insurance Coverage by Age in New Lebanon
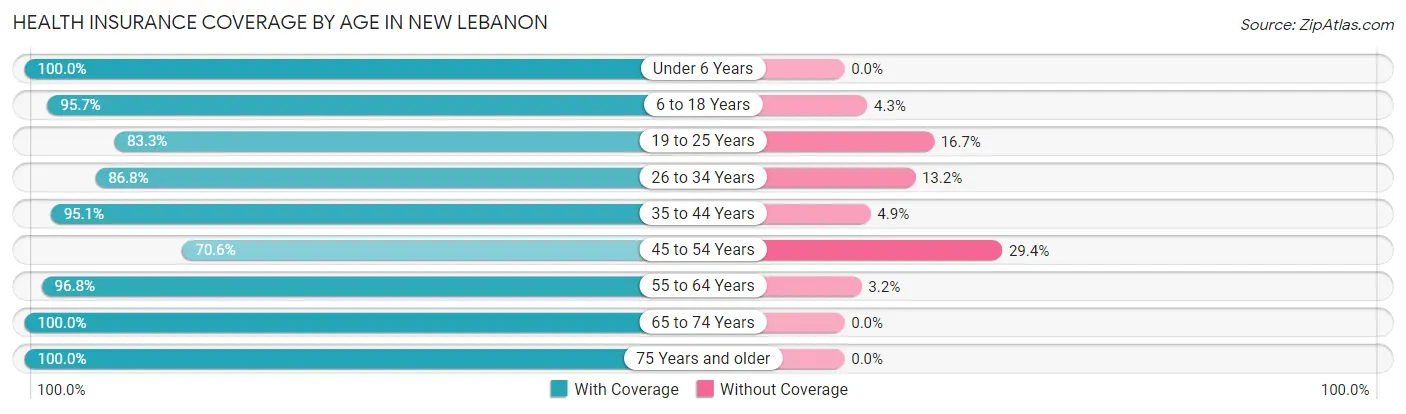
| Age Bracket | With Coverage | Without Coverage |
| Under 6 Years | 454 (100.0%) | 0 (0.0%) |
| 6 to 18 Years | 764 (95.7%) | 34 (4.3%) |
| 19 to 25 Years | 410 (83.3%) | 82 (16.7%) |
| 26 to 34 Years | 349 (86.8%) | 53 (13.2%) |
| 35 to 44 Years | 391 (95.1%) | 20 (4.9%) |
| 45 to 54 Years | 276 (70.6%) | 115 (29.4%) |
| 55 to 64 Years | 273 (96.8%) | 9 (3.2%) |
| 65 to 74 Years | 439 (100.0%) | 0 (0.0%) |
| 75 Years and older | 367 (100.0%) | 0 (0.0%) |
| Total | 3,723 (92.2%) | 313 (7.8%) |
Health Insurance Coverage by Citizenship Status in New Lebanon
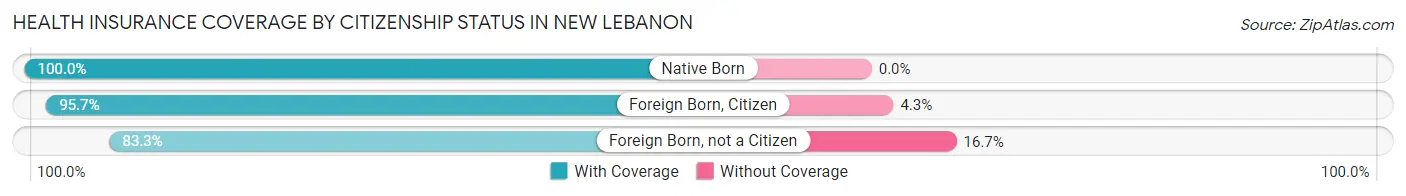
| Citizenship Status | With Coverage | Without Coverage |
| Native Born | 454 (100.0%) | 0 (0.0%) |
| Foreign Born, Citizen | 764 (95.7%) | 34 (4.3%) |
| Foreign Born, not a Citizen | 410 (83.3%) | 82 (16.7%) |
Health Insurance Coverage by Household Income in New Lebanon
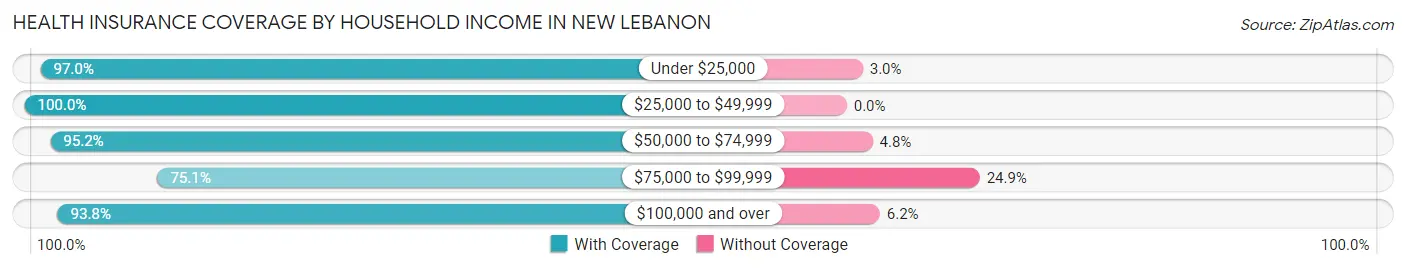
| Household Income | With Coverage | Without Coverage |
| Under $25,000 | 940 (97.0%) | 29 (3.0%) |
| $25,000 to $49,999 | 617 (100.0%) | 0 (0.0%) |
| $50,000 to $74,999 | 787 (95.2%) | 40 (4.8%) |
| $75,000 to $99,999 | 576 (75.1%) | 191 (24.9%) |
| $100,000 and over | 803 (93.8%) | 53 (6.2%) |
Public vs Private Health Insurance Coverage by Age in New Lebanon
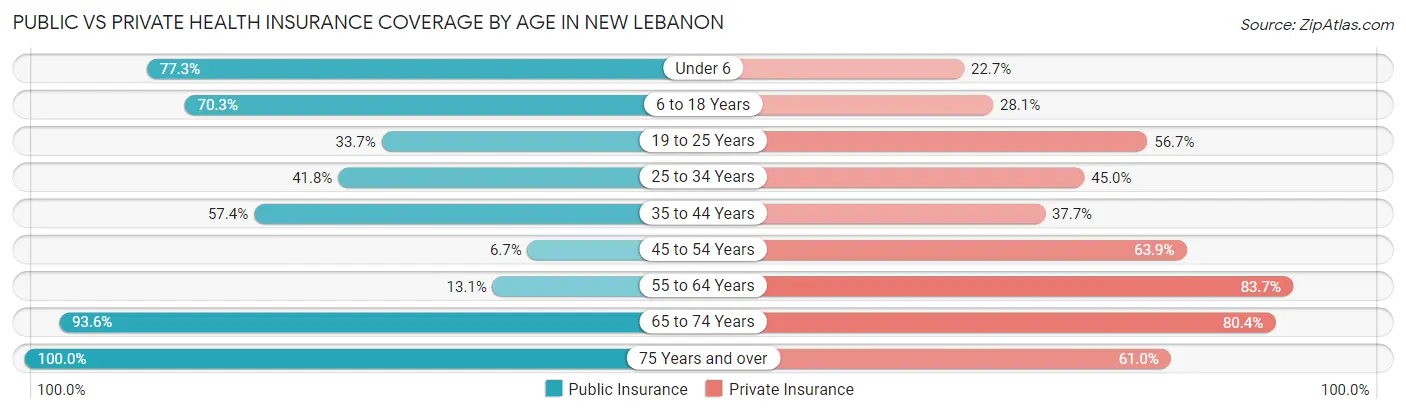
| Age Bracket | Public Insurance | Private Insurance |
| Under 6 | 351 (77.3%) | 103 (22.7%) |
| 6 to 18 Years | 561 (70.3%) | 224 (28.1%) |
| 19 to 25 Years | 166 (33.7%) | 279 (56.7%) |
| 25 to 34 Years | 168 (41.8%) | 181 (45.0%) |
| 35 to 44 Years | 236 (57.4%) | 155 (37.7%) |
| 45 to 54 Years | 26 (6.7%) | 250 (63.9%) |
| 55 to 64 Years | 37 (13.1%) | 236 (83.7%) |
| 65 to 74 Years | 411 (93.6%) | 353 (80.4%) |
| 75 Years and over | 367 (100.0%) | 224 (61.0%) |
| Total | 2,323 (57.6%) | 2,005 (49.7%) |
Disability Status by Sex by Age in New Lebanon
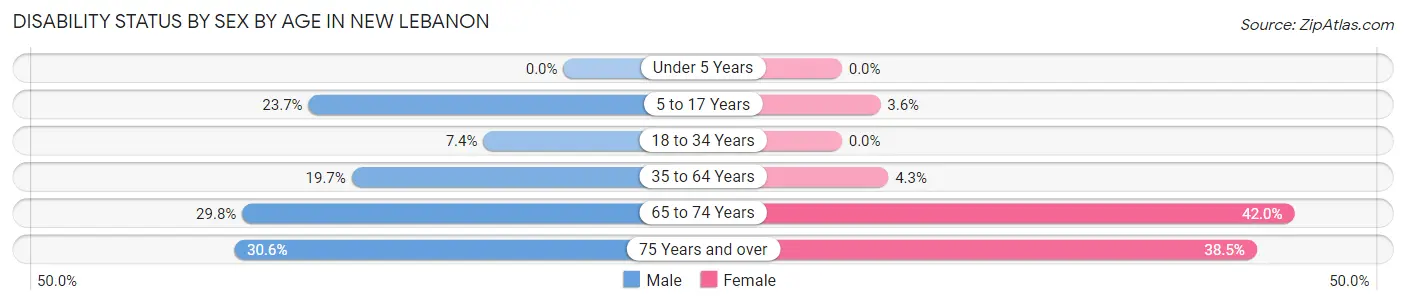
| Age Bracket | Male | Female |
| Under 5 Years | 0 (0.0%) | 0 (0.0%) |
| 5 to 17 Years | 75 (23.7%) | 20 (3.6%) |
| 18 to 34 Years | 37 (7.4%) | 0 (0.0%) |
| 35 to 64 Years | 90 (19.7%) | 27 (4.3%) |
| 65 to 74 Years | 62 (29.8%) | 97 (42.0%) |
| 75 Years and over | 55 (30.6%) | 72 (38.5%) |
Disability Class by Sex by Age in New Lebanon
Disability Class: Hearing Difficulty
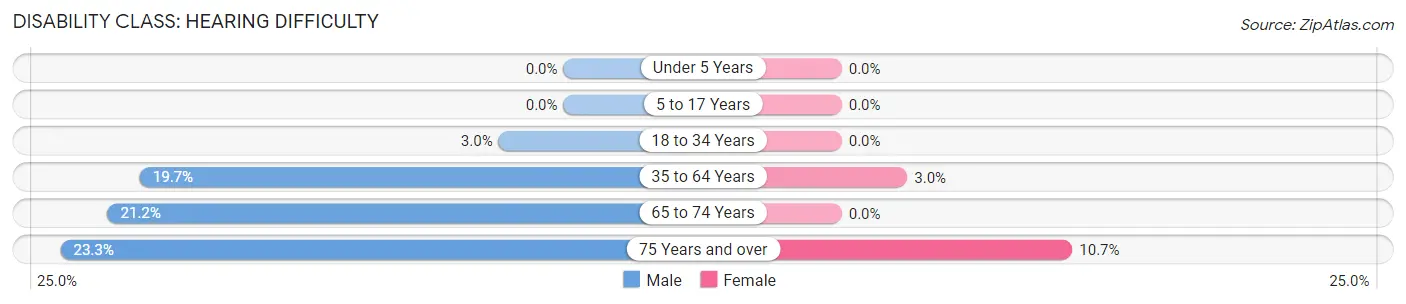
| Age Bracket | Male | Female |
| Under 5 Years | 0 (0.0%) | 0 (0.0%) |
| 5 to 17 Years | 0 (0.0%) | 0 (0.0%) |
| 18 to 34 Years | 15 (3.0%) | 0 (0.0%) |
| 35 to 64 Years | 90 (19.7%) | 19 (3.0%) |
| 65 to 74 Years | 44 (21.1%) | 0 (0.0%) |
| 75 Years and over | 42 (23.3%) | 20 (10.7%) |
Disability Class: Vision Difficulty
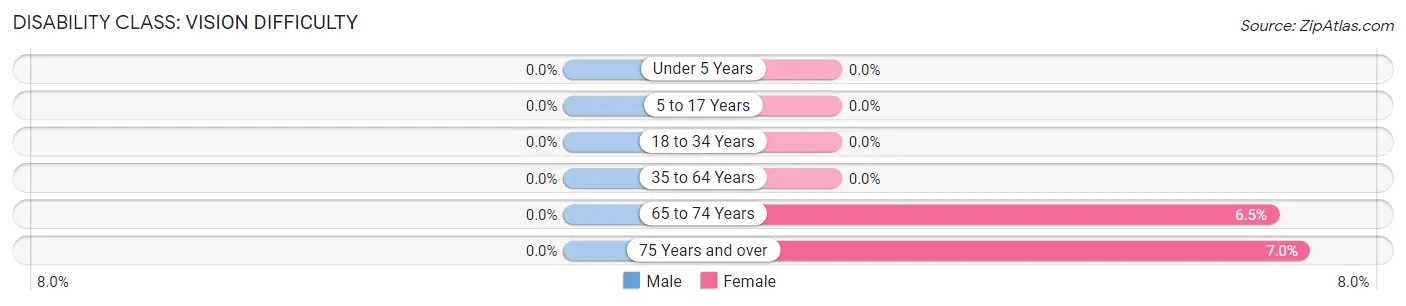
| Age Bracket | Male | Female |
| Under 5 Years | 0 (0.0%) | 0 (0.0%) |
| 5 to 17 Years | 0 (0.0%) | 0 (0.0%) |
| 18 to 34 Years | 0 (0.0%) | 0 (0.0%) |
| 35 to 64 Years | 0 (0.0%) | 0 (0.0%) |
| 65 to 74 Years | 0 (0.0%) | 15 (6.5%) |
| 75 Years and over | 0 (0.0%) | 13 (7.0%) |
Disability Class: Cognitive Difficulty
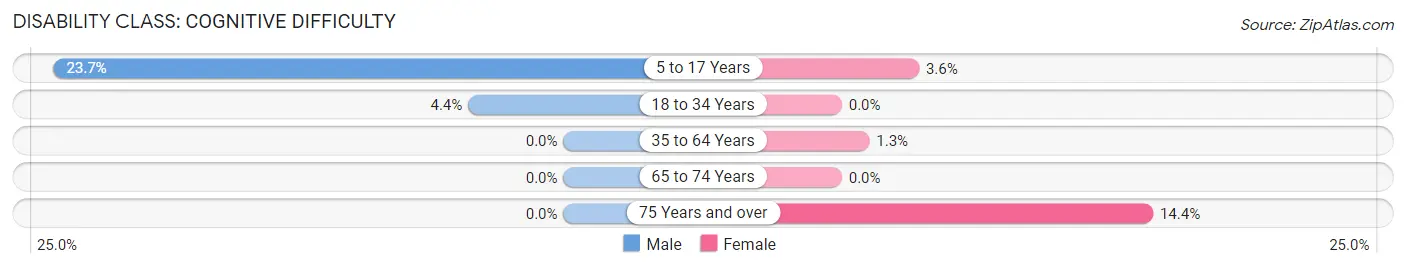
| Age Bracket | Male | Female |
| 5 to 17 Years | 75 (23.7%) | 20 (3.6%) |
| 18 to 34 Years | 22 (4.4%) | 0 (0.0%) |
| 35 to 64 Years | 0 (0.0%) | 8 (1.3%) |
| 65 to 74 Years | 0 (0.0%) | 0 (0.0%) |
| 75 Years and over | 0 (0.0%) | 27 (14.4%) |
Disability Class: Ambulatory Difficulty
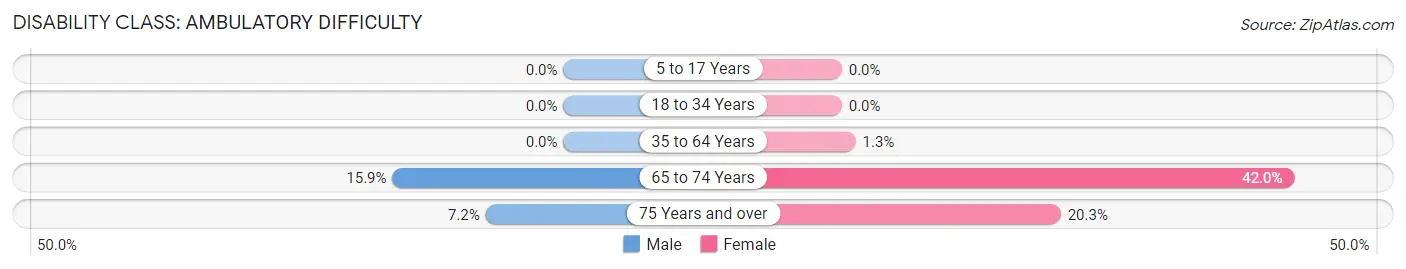
| Age Bracket | Male | Female |
| 5 to 17 Years | 0 (0.0%) | 0 (0.0%) |
| 18 to 34 Years | 0 (0.0%) | 0 (0.0%) |
| 35 to 64 Years | 0 (0.0%) | 8 (1.3%) |
| 65 to 74 Years | 33 (15.9%) | 97 (42.0%) |
| 75 Years and over | 13 (7.2%) | 38 (20.3%) |
Disability Class: Self-Care Difficulty
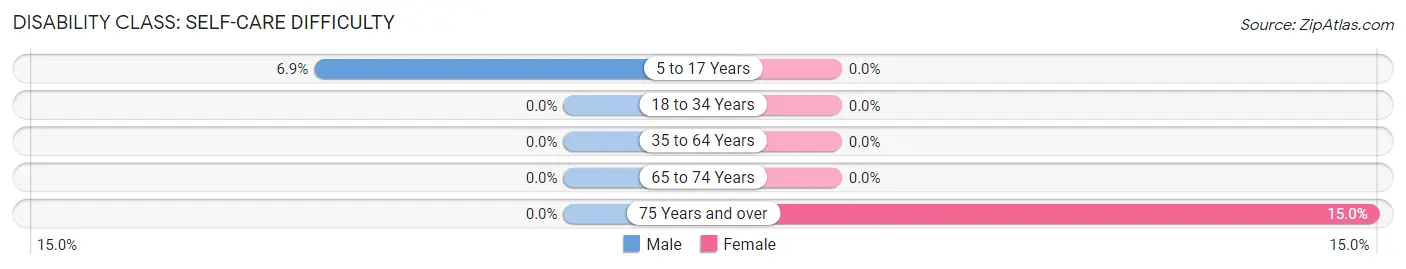
| Age Bracket | Male | Female |
| 5 to 17 Years | 22 (6.9%) | 0 (0.0%) |
| 18 to 34 Years | 0 (0.0%) | 0 (0.0%) |
| 35 to 64 Years | 0 (0.0%) | 0 (0.0%) |
| 65 to 74 Years | 0 (0.0%) | 0 (0.0%) |
| 75 Years and over | 0 (0.0%) | 28 (15.0%) |
Technology Access in New Lebanon
Computing Device Access in New Lebanon
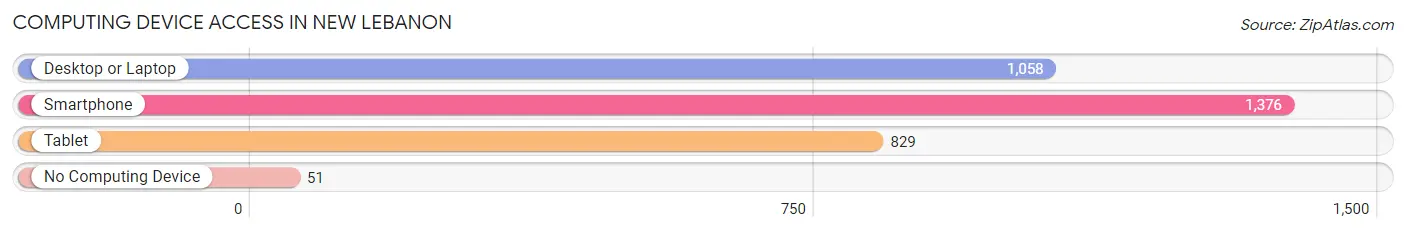
| Device Type | # Households | % Households |
| Desktop or Laptop | 1,058 | 70.4% |
| Smartphone | 1,376 | 91.5% |
| Tablet | 829 | 55.1% |
| No Computing Device | 51 | 3.4% |
| Total | 1,504 | 100.0% |
Internet Access in New Lebanon
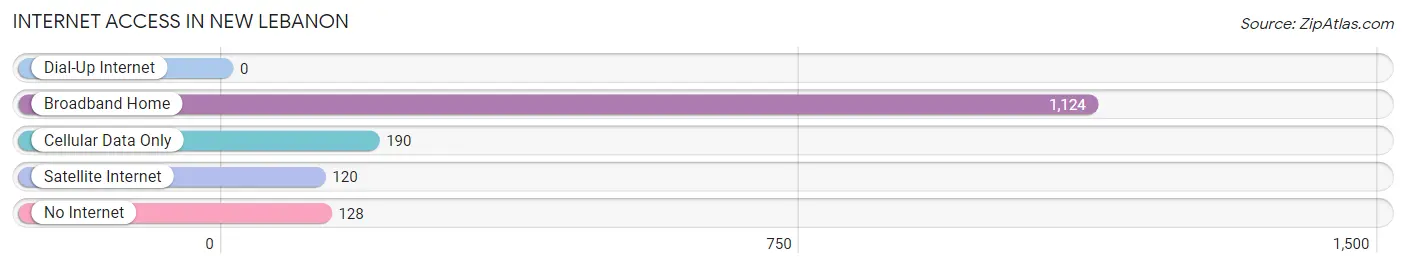
| Internet Type | # Households | % Households |
| Dial-Up Internet | 0 | 0.0% |
| Broadband Home | 1,124 | 74.7% |
| Cellular Data Only | 190 | 12.6% |
| Satellite Internet | 120 | 8.0% |
| No Internet | 128 | 8.5% |
| Total | 1,504 | 100.0% |
New Lebanon Summary
New Lebanon, Ohio is a small village located in Montgomery County, Ohio. It is situated approximately 25 miles northeast of Dayton and is part of the Dayton Metropolitan Statistical Area. The village has a population of approximately 1,800 people and covers an area of 0.7 square miles.
History
New Lebanon was founded in 1817 by a group of settlers from New Lebanon, New York. The settlers were led by a man named John Smith, who had purchased the land from the government. The village was originally known as Smithville, but was later changed to New Lebanon in 1820.
The village was incorporated in 1837 and was home to a variety of businesses, including a sawmill, a gristmill, a tannery, and a blacksmith shop. The village also had a post office, a school, and a church.
In the late 19th century, the village experienced a period of growth and development. The railroad was extended to the village in 1881, and the village was connected to the electric grid in 1891. The village also had a variety of stores, including a general store, a drug store, and a hardware store.
Geography
New Lebanon is located in the Miami Valley region of Ohio. The village is situated on the western edge of the Great Miami River, which flows through the village. The village is surrounded by farmland and is located approximately 25 miles northeast of Dayton.
The village has a total area of 0.7 square miles, all of which is land. The village is located at an elevation of 845 feet above sea level.
Economy
The economy of New Lebanon is largely based on agriculture. The village is home to a variety of farms, including dairy farms, beef farms, and vegetable farms. The village also has a variety of small businesses, including restaurants, stores, and service providers.
Demographics
As of the 2010 census, the population of New Lebanon was 1,811. The racial makeup of the village was 97.2% White, 0.7% African American, 0.3% Native American, 0.2% Asian, 0.1% Pacific Islander, 0.3% from other races, and 1.3% from two or more races. Hispanic or Latino of any race were 1.2% of the population.
The median household income in New Lebanon was $45,938, and the median family income was $51,250. The per capita income for the village was $20,945. About 8.2% of families and 10.2% of the population were below the poverty line, including 14.2% of those under age 18 and 5.2% of those age 65 or over.
New Lebanon is served by the New Lebanon Local School District. The village is home to one elementary school, one middle school, and one high school. The village also has a public library and a variety of parks and recreational facilities.
Common Questions
What is Per Capita Income in New Lebanon?
Per Capita income in New Lebanon is $23,833.
What is the Median Family Income in New Lebanon?
Median Family Income in New Lebanon is $69,022.
What is the Median Household income in New Lebanon?
Median Household Income in New Lebanon is $59,365.
What is Income or Wage Gap in New Lebanon?
Income or Wage Gap in New Lebanon is 41.0%.
Women in New Lebanon earn 59.0 cents for every dollar earned by a man.
What is Family Income Deficit in New Lebanon?
Family Income Deficit in New Lebanon is $11,173.
Families that are below poverty line in New Lebanon earn $11,173 less on average than the poverty threshold level.
What is Inequality or Gini Index in New Lebanon?
Inequality or Gini Index in New Lebanon is 0.36.
What is the Total Population of New Lebanon?
Total Population of New Lebanon is 4,131.
What is the Total Male Population of New Lebanon?
Total Male Population of New Lebanon is 1,847.
What is the Total Female Population of New Lebanon?
Total Female Population of New Lebanon is 2,284.
What is the Ratio of Males per 100 Females in New Lebanon?
There are 80.87 Males per 100 Females in New Lebanon.
What is the Ratio of Females per 100 Males in New Lebanon?
There are 123.66 Females per 100 Males in New Lebanon.
What is the Median Population Age in New Lebanon?
Median Population Age in New Lebanon is 33.1 Years.
What is the Average Family Size in New Lebanon
Average Family Size in New Lebanon is 3.1 People.
What is the Average Household Size in New Lebanon
Average Household Size in New Lebanon is 2.7 People.
How Large is the Labor Force in New Lebanon?
There are 1,620 People in the Labor Forcein in New Lebanon.
What is the Percentage of People in the Labor Force in New Lebanon?
53.0% of People are in the Labor Force in New Lebanon.
What is the Unemployment Rate in New Lebanon?
Unemployment Rate in New Lebanon is 1.2%.