New Holland, OH Map & Demographics
New Holland Map
New Holland Overview
$22,495
PER CAPITA INCOME
$52,188
AVG FAMILY INCOME
$44,167
AVG HOUSEHOLD INCOME
34.7%
WAGE / INCOME GAP [ % ]
65.3¢/ $1
WAGE / INCOME GAP [ $ ]
0.48
INEQUALITY / GINI INDEX
909
TOTAL POPULATION
396
MALE POPULATION
513
FEMALE POPULATION
77.19
MALES / 100 FEMALES
129.55
FEMALES / 100 MALES
40.4
MEDIAN AGE
3.2
AVG FAMILY SIZE
2.6
AVG HOUSEHOLD SIZE
336
LABOR FORCE [ PEOPLE ]
49.1%
PERCENT IN LABOR FORCE
4.5%
UNEMPLOYMENT RATE
New Holland Zip Codes
New Holland Area Codes
Income in New Holland
Income Overview in New Holland
Per Capita Income in New Holland is $22,495, while median incomes of families and households are $52,188 and $44,167 respectively.
| Characteristic | Number | Measure |
| Per Capita Income | 909 | $22,495 |
| Median Family Income | 227 | $52,188 |
| Mean Family Income | 227 | $65,986 |
| Median Household Income | 344 | $44,167 |
| Mean Household Income | 344 | $56,425 |
| Income Deficit | 227 | $0 |
| Wage / Income Gap (%) | 909 | 34.69% |
| Wage / Income Gap ($) | 909 | 65.31¢ per $1 |
| Gini / Inequality Index | 909 | 0.48 |
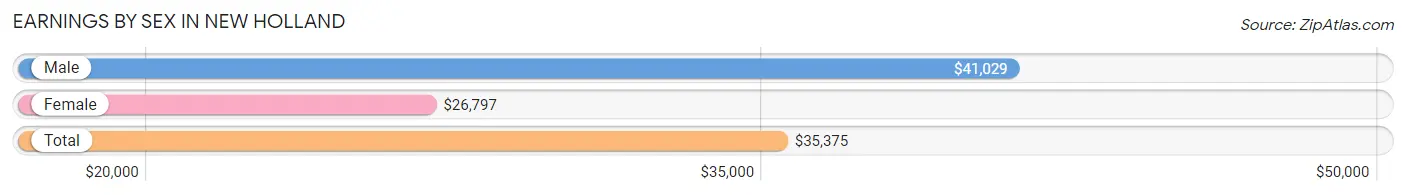
Earnings by Sex in New Holland
Average Earnings in New Holland are $35,375, $41,029 for men and $26,797 for women, a difference of 34.7%.
| Sex | Number | Average Earnings |
| Male | 172 (47.6%) | $41,029 |
| Female | 189 (52.3%) | $26,797 |
| Total | 361 (100.0%) | $35,375 |
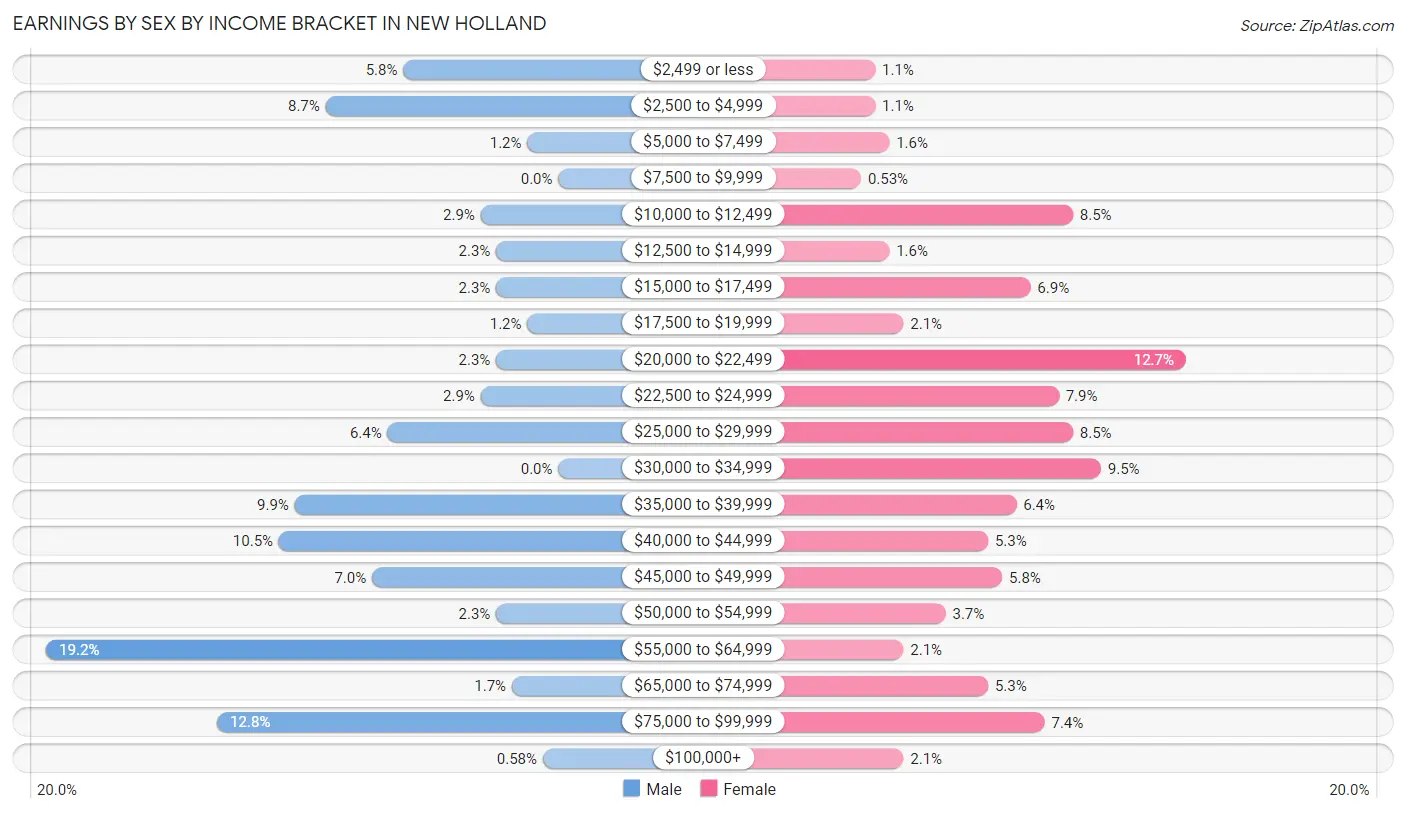
Earnings by Sex by Income Bracket in New Holland
The most common earnings brackets in New Holland are $55,000 to $64,999 for men (33 | 19.2%) and $20,000 to $22,499 for women (24 | 12.7%).
| Income | Male | Female |
| $2,499 or less | 10 (5.8%) | 2 (1.1%) |
| $2,500 to $4,999 | 15 (8.7%) | 2 (1.1%) |
| $5,000 to $7,499 | 2 (1.2%) | 3 (1.6%) |
| $7,500 to $9,999 | 0 (0.0%) | 1 (0.5%) |
| $10,000 to $12,499 | 5 (2.9%) | 16 (8.5%) |
| $12,500 to $14,999 | 4 (2.3%) | 3 (1.6%) |
| $15,000 to $17,499 | 4 (2.3%) | 13 (6.9%) |
| $17,500 to $19,999 | 2 (1.2%) | 4 (2.1%) |
| $20,000 to $22,499 | 4 (2.3%) | 24 (12.7%) |
| $22,500 to $24,999 | 5 (2.9%) | 15 (7.9%) |
| $25,000 to $29,999 | 11 (6.4%) | 16 (8.5%) |
| $30,000 to $34,999 | 0 (0.0%) | 18 (9.5%) |
| $35,000 to $39,999 | 17 (9.9%) | 12 (6.4%) |
| $40,000 to $44,999 | 18 (10.5%) | 10 (5.3%) |
| $45,000 to $49,999 | 12 (7.0%) | 11 (5.8%) |
| $50,000 to $54,999 | 4 (2.3%) | 7 (3.7%) |
| $55,000 to $64,999 | 33 (19.2%) | 4 (2.1%) |
| $65,000 to $74,999 | 3 (1.7%) | 10 (5.3%) |
| $75,000 to $99,999 | 22 (12.8%) | 14 (7.4%) |
| $100,000+ | 1 (0.6%) | 4 (2.1%) |
| Total | 172 (100.0%) | 189 (100.0%) |
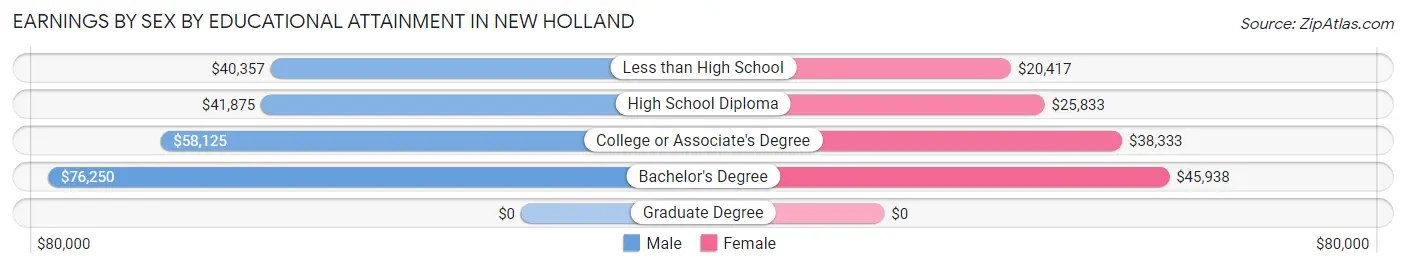
Earnings by Sex by Educational Attainment in New Holland
Average earnings in New Holland are $47,083 for men and $31,250 for women, a difference of 33.6%. Men with an educational attainment of bachelor's degree enjoy the highest average annual earnings of $76,250, while those with less than high school education earn the least with $40,357. Women with an educational attainment of bachelor's degree earn the most with the average annual earnings of $45,938, while those with less than high school education have the smallest earnings of $20,417.
| Educational Attainment | Male Income | Female Income |
| Less than High School | $40,357 | $20,417 |
| High School Diploma | $41,875 | $25,833 |
| College or Associate's Degree | $58,125 | $38,333 |
| Bachelor's Degree | $76,250 | $45,938 |
| Graduate Degree | - | - |
| Total | $47,083 | $31,250 |
Family Income in New Holland
Family Income Brackets in New Holland
According to the New Holland family income data, there are 43 families falling into the $75,000 to $99,999 income range, which is the most common income bracket and makes up 18.9% of all families. Conversely, the $200,000+ income bracket is the least frequent group with only 6 families (2.6%) belonging to this category.
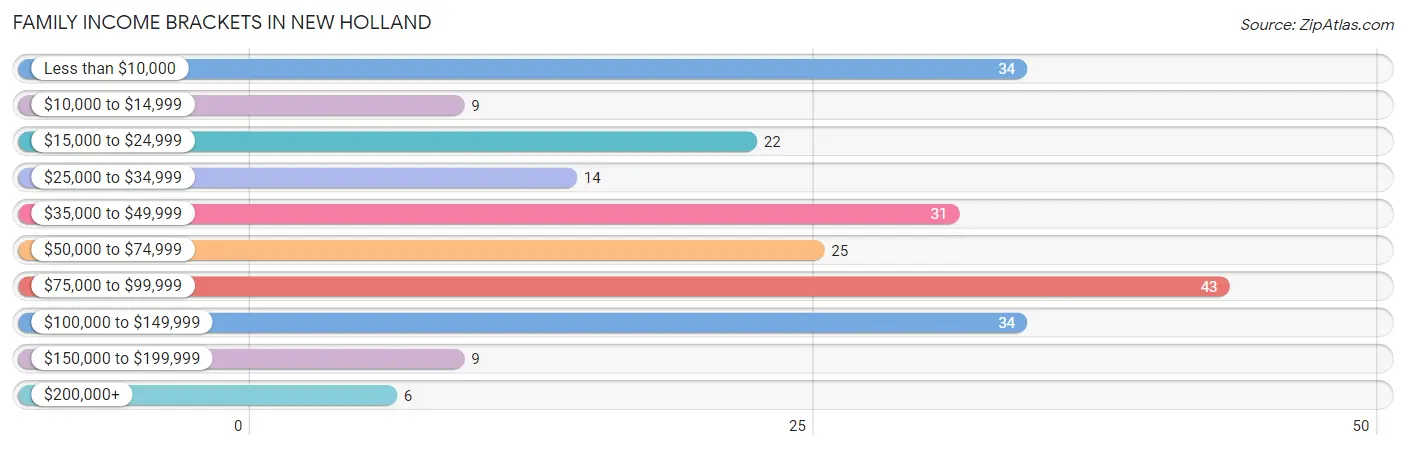
| Income Bracket | # Families | % Families |
| Less than $10,000 | 34 | 15.0% |
| $10,000 to $14,999 | 9 | 4.0% |
| $15,000 to $24,999 | 22 | 9.7% |
| $25,000 to $34,999 | 14 | 6.2% |
| $35,000 to $49,999 | 31 | 13.7% |
| $50,000 to $74,999 | 25 | 11.0% |
| $75,000 to $99,999 | 43 | 18.9% |
| $100,000 to $149,999 | 34 | 15.0% |
| $150,000 to $199,999 | 9 | 4.0% |
| $200,000+ | 6 | 2.6% |
Family Income by Famaliy Size in New Holland
4-person families (21 | 9.2%) account for the highest median family income in New Holland with $145,536 per family, while 4-person families (21 | 9.2%) have the highest median income of $36,384 per family member.
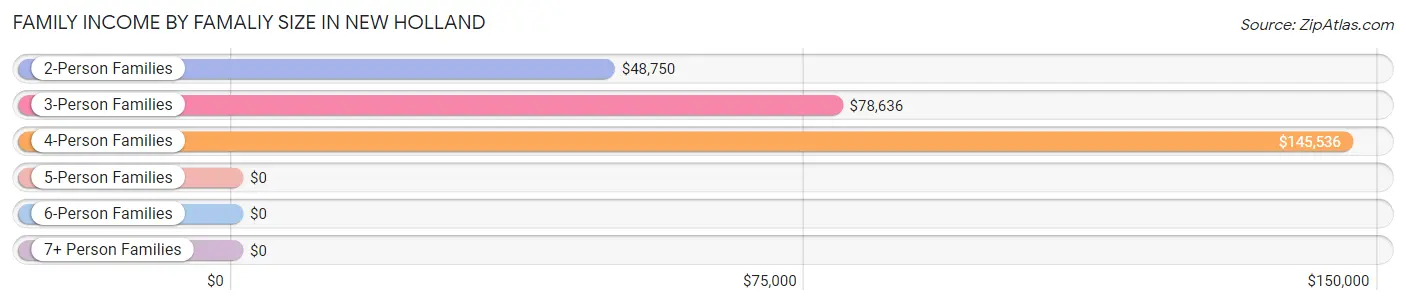
| Income Bracket | # Families | Median Income |
| 2-Person Families | 121 (53.3%) | $48,750 |
| 3-Person Families | 34 (15.0%) | $78,636 |
| 4-Person Families | 21 (9.2%) | $145,536 |
| 5-Person Families | 48 (21.1%) | $0 |
| 6-Person Families | 3 (1.3%) | $0 |
| 7+ Person Families | 0 (0.0%) | $0 |
| Total | 227 (100.0%) | $52,188 |
Family Income by Number of Earners in New Holland
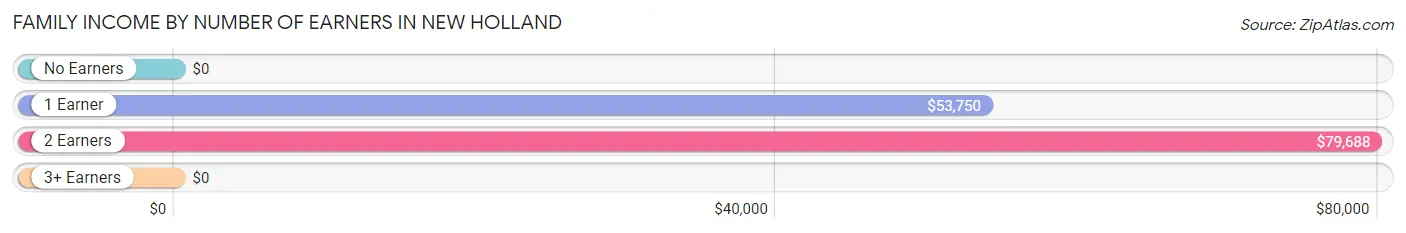
| Number of Earners | # Families | Median Income |
| No Earners | 88 (38.8%) | $0 |
| 1 Earner | 36 (15.9%) | $53,750 |
| 2 Earners | 93 (41.0%) | $79,688 |
| 3+ Earners | 10 (4.4%) | $0 |
| Total | 227 (100.0%) | $52,188 |
Household Income in New Holland
Household Income Brackets in New Holland
With 57 households falling in the category, the $75,000 to $99,999 income range is the most frequent in New Holland, accounting for 16.6% of all households. In contrast, only 6 households (1.7%) fall into the $200,000+ income bracket, making it the least populous group.
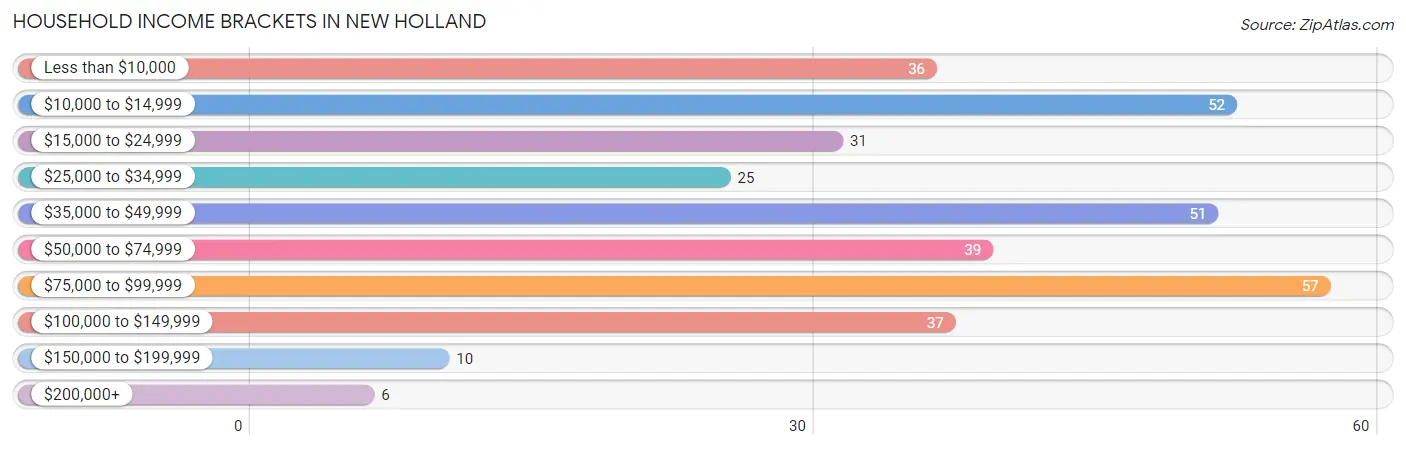
| Income Bracket | # Households | % Households |
| Less than $10,000 | 36 | 10.5% |
| $10,000 to $14,999 | 52 | 15.1% |
| $15,000 to $24,999 | 31 | 9.0% |
| $25,000 to $34,999 | 25 | 7.3% |
| $35,000 to $49,999 | 51 | 14.8% |
| $50,000 to $74,999 | 39 | 11.3% |
| $75,000 to $99,999 | 57 | 16.6% |
| $100,000 to $149,999 | 37 | 10.8% |
| $150,000 to $199,999 | 10 | 2.9% |
| $200,000+ | 6 | 1.7% |
Household Income by Householder Age in New Holland
The median household income in New Holland is $44,167, with the highest median household income of $61,667 found in the 45 to 64 years age bracket for the primary householder. A total of 92 households (26.7%) fall into this category. Meanwhile, the 15 to 24 years age bracket for the primary householder has the lowest median household income of $0, with 1 households (0.3%) in this group.
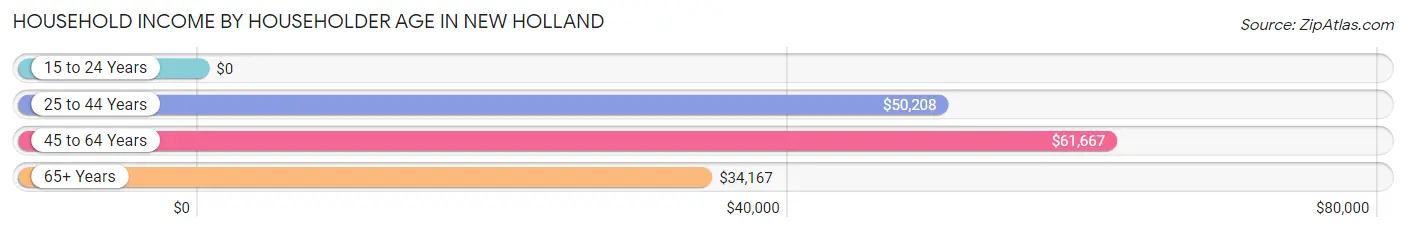
| Income Bracket | # Households | Median Income |
| 15 to 24 Years | 1 (0.3%) | $0 |
| 25 to 44 Years | 109 (31.7%) | $50,208 |
| 45 to 64 Years | 92 (26.7%) | $61,667 |
| 65+ Years | 142 (41.3%) | $34,167 |
| Total | 344 (100.0%) | $44,167 |
Poverty in New Holland
Income Below Poverty by Sex and Age in New Holland
With 26.3% poverty level for males and 37.2% for females among the residents of New Holland, 15 year old males and 16 and 17 year old females are the most vulnerable to poverty, with 9 males (100.0%) and 6 females (100.0%) in their respective age groups living below the poverty level.
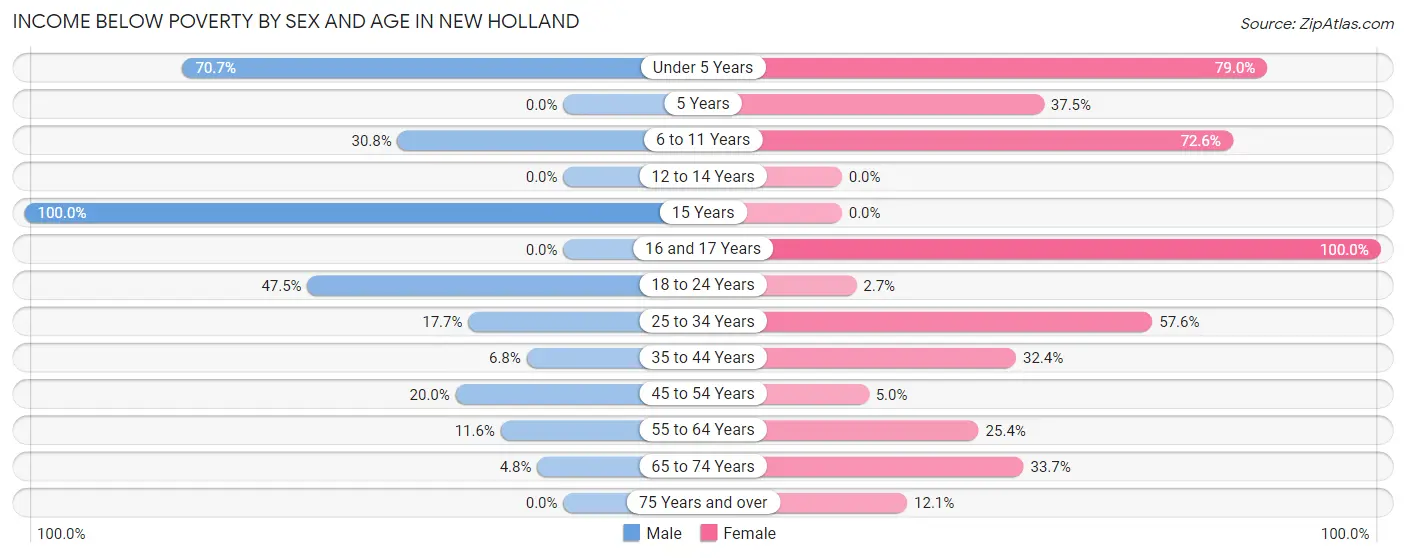
| Age Bracket | Male | Female |
| Under 5 Years | 41 (70.7%) | 45 (78.9%) |
| 5 Years | 0 (0.0%) | 6 (37.5%) |
| 6 to 11 Years | 4 (30.8%) | 37 (72.6%) |
| 12 to 14 Years | 0 (0.0%) | 0 (0.0%) |
| 15 Years | 9 (100.0%) | 0 (0.0%) |
| 16 and 17 Years | 0 (0.0%) | 6 (100.0%) |
| 18 to 24 Years | 19 (47.5%) | 1 (2.7%) |
| 25 to 34 Years | 9 (17.6%) | 34 (57.6%) |
| 35 to 44 Years | 3 (6.8%) | 11 (32.4%) |
| 45 to 54 Years | 11 (20.0%) | 3 (5.0%) |
| 55 to 64 Years | 5 (11.6%) | 16 (25.4%) |
| 65 to 74 Years | 3 (4.8%) | 28 (33.7%) |
| 75 Years and over | 0 (0.0%) | 4 (12.1%) |
| Total | 104 (26.3%) | 191 (37.2%) |
Income Above Poverty by Sex and Age in New Holland
According to the poverty statistics in New Holland, males aged 12 to 14 years and females aged 12 to 14 years are the age groups that are most secure financially, with 100.0% of males and 100.0% of females in these age groups living above the poverty line.
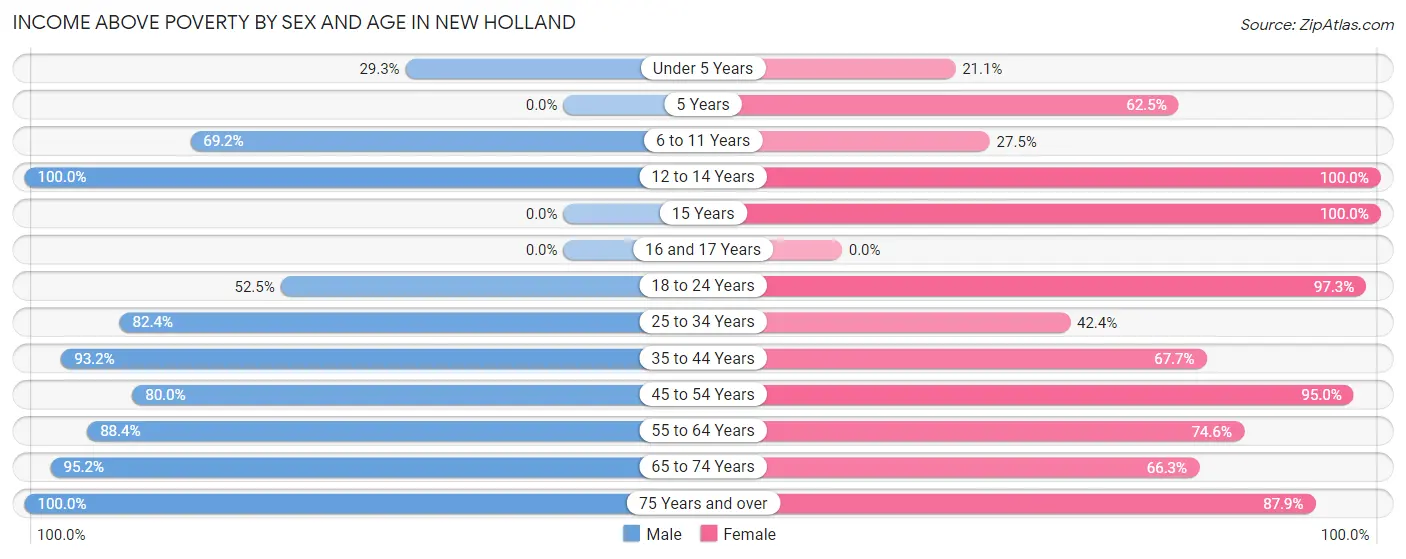
| Age Bracket | Male | Female |
| Under 5 Years | 17 (29.3%) | 12 (21.0%) |
| 5 Years | 0 (0.0%) | 10 (62.5%) |
| 6 to 11 Years | 9 (69.2%) | 14 (27.5%) |
| 12 to 14 Years | 7 (100.0%) | 10 (100.0%) |
| 15 Years | 0 (0.0%) | 4 (100.0%) |
| 16 and 17 Years | 0 (0.0%) | 0 (0.0%) |
| 18 to 24 Years | 21 (52.5%) | 36 (97.3%) |
| 25 to 34 Years | 42 (82.4%) | 25 (42.4%) |
| 35 to 44 Years | 41 (93.2%) | 23 (67.6%) |
| 45 to 54 Years | 44 (80.0%) | 57 (95.0%) |
| 55 to 64 Years | 38 (88.4%) | 47 (74.6%) |
| 65 to 74 Years | 59 (95.2%) | 55 (66.3%) |
| 75 Years and over | 14 (100.0%) | 29 (87.9%) |
| Total | 292 (73.7%) | 322 (62.8%) |
Income Below Poverty Among Married-Couple Families in New Holland
The poverty statistics for married-couple families in New Holland show that 2.2% or 3 of the total 136 families live below the poverty line. Families with no children have the highest poverty rate of 3.1%, comprising of 3 families. On the other hand, families with 1 or 2 children have the lowest poverty rate of 0.0%, which includes 0 families.
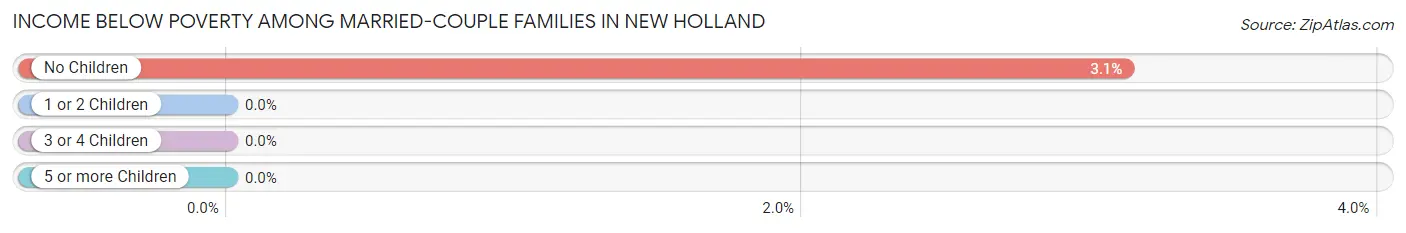
| Children | Above Poverty | Below Poverty |
| No Children | 93 (96.9%) | 3 (3.1%) |
| 1 or 2 Children | 37 (100.0%) | 0 (0.0%) |
| 3 or 4 Children | 3 (100.0%) | 0 (0.0%) |
| 5 or more Children | 0 (0.0%) | 0 (0.0%) |
| Total | 133 (97.8%) | 3 (2.2%) |
Income Below Poverty Among Single-Parent Households in New Holland
According to the poverty data in New Holland, 87.5% or 14 single-father households and 54.7% or 41 single-mother households are living below the poverty line. Among single-father households, those with 1 or 2 children have the highest poverty rate, with 14 households (100.0%) experiencing poverty. Likewise, among single-mother households, those with 3 or 4 children have the highest poverty rate, with 31 households (100.0%) falling below the poverty line.
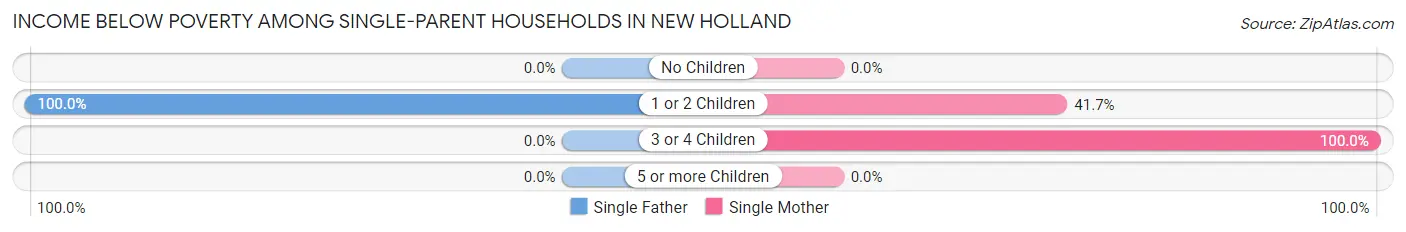
| Children | Single Father | Single Mother |
| No Children | 0 (0.0%) | 0 (0.0%) |
| 1 or 2 Children | 14 (100.0%) | 10 (41.7%) |
| 3 or 4 Children | 0 (0.0%) | 31 (100.0%) |
| 5 or more Children | 0 (0.0%) | 0 (0.0%) |
| Total | 14 (87.5%) | 41 (54.7%) |
Income Below Poverty Among Married-Couple vs Single-Parent Households in New Holland
The poverty data for New Holland shows that 3 of the married-couple family households (2.2%) and 55 of the single-parent households (60.4%) are living below the poverty level. Within the married-couple family households, those with no children have the highest poverty rate, with 3 households (3.1%) falling below the poverty line. Among the single-parent households, those with 3 or 4 children have the highest poverty rate, with 31 household (100.0%) living below poverty.
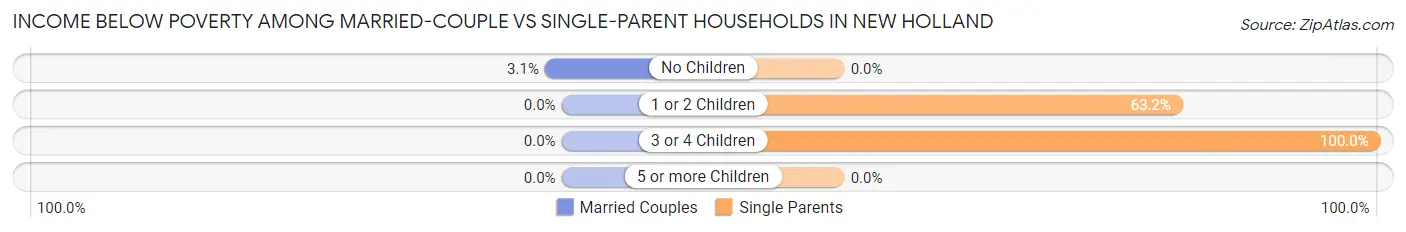
| Children | Married-Couple Families | Single-Parent Households |
| No Children | 3 (3.1%) | 0 (0.0%) |
| 1 or 2 Children | 0 (0.0%) | 24 (63.2%) |
| 3 or 4 Children | 0 (0.0%) | 31 (100.0%) |
| 5 or more Children | 0 (0.0%) | 0 (0.0%) |
| Total | 3 (2.2%) | 55 (60.4%) |
Race in New Holland
The most populous races in New Holland are White / Caucasian (856 | 94.2%), Two or more Races (27 | 3.0%), and Hispanic or Latino (17 | 1.9%).
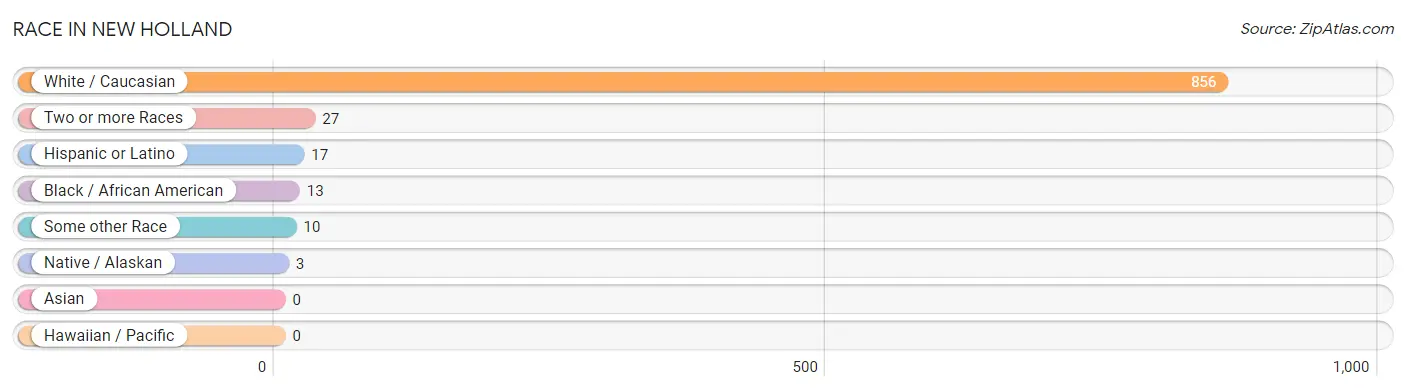
| Race | # Population | % Population |
| Asian | 0 | 0.0% |
| Black / African American | 13 | 1.4% |
| Hawaiian / Pacific | 0 | 0.0% |
| Hispanic or Latino | 17 | 1.9% |
| Native / Alaskan | 3 | 0.3% |
| White / Caucasian | 856 | 94.2% |
| Two or more Races | 27 | 3.0% |
| Some other Race | 10 | 1.1% |
| Total | 909 | 100.0% |
Ancestry in New Holland
The most populous ancestries reported in New Holland are German (276 | 30.4%), Irish (230 | 25.3%), English (102 | 11.2%), American (61 | 6.7%), and Scotch-Irish (45 | 5.0%), together accounting for 78.5% of all New Holland residents.
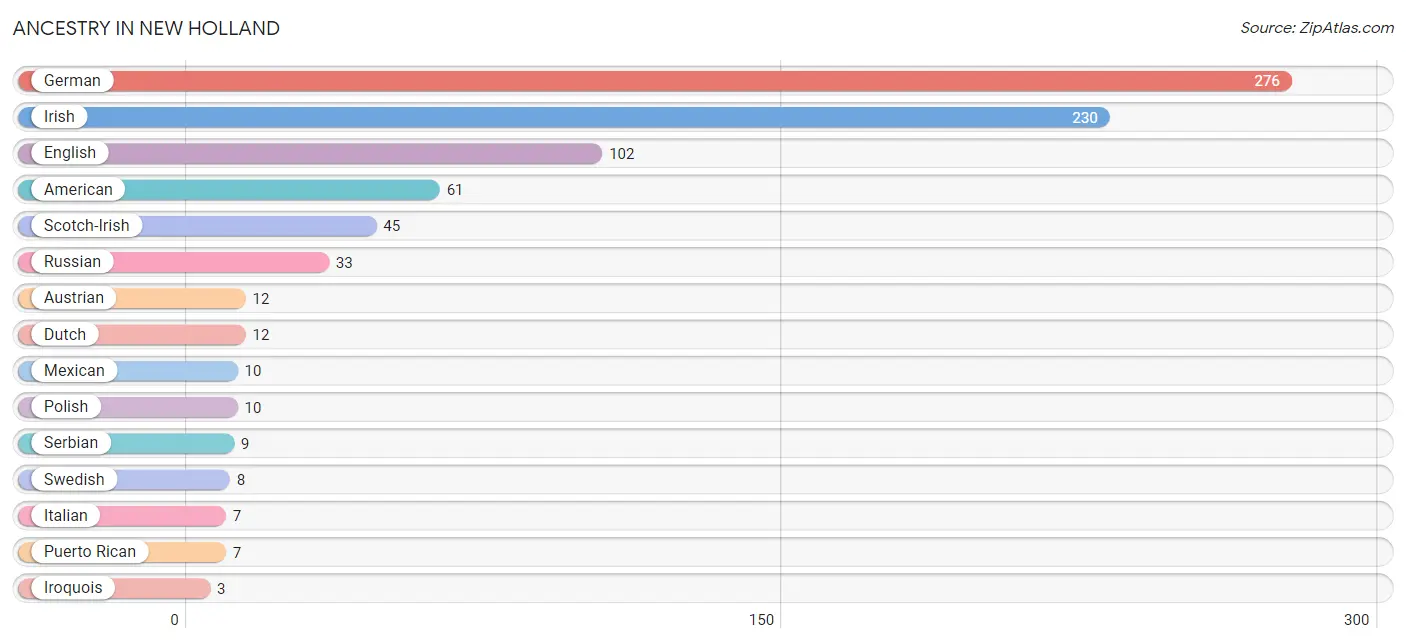
| Ancestry | # Population | % Population |
| American | 61 | 6.7% |
| Austrian | 12 | 1.3% |
| Dutch | 12 | 1.3% |
| English | 102 | 11.2% |
| German | 276 | 30.4% |
| Hungarian | 2 | 0.2% |
| Irish | 230 | 25.3% |
| Iroquois | 3 | 0.3% |
| Italian | 7 | 0.8% |
| Mexican | 10 | 1.1% |
| Northern European | 2 | 0.2% |
| Polish | 10 | 1.1% |
| Puerto Rican | 7 | 0.8% |
| Russian | 33 | 3.6% |
| Scotch-Irish | 45 | 5.0% |
| Scottish | 3 | 0.3% |
| Serbian | 9 | 1.0% |
| Swedish | 8 | 0.9% |
| Swiss | 1 | 0.1% |
| Welsh | 2 | 0.2% | View All 20 Rows |
Immigrants in New Holland
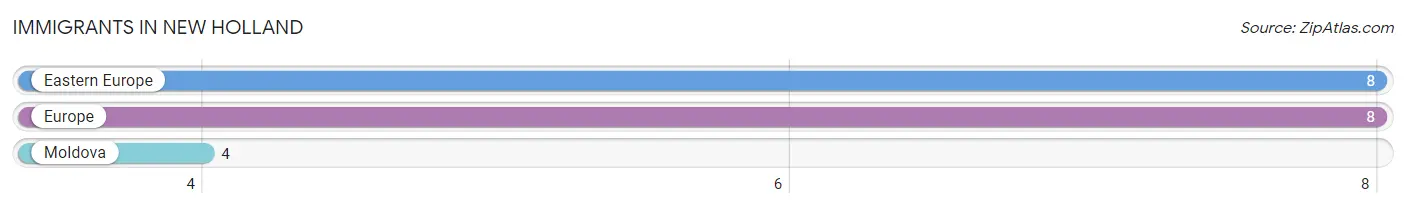
The most numerous immigrant groups reported in New Holland came from Eastern Europe (8 | 0.9%), Europe (8 | 0.9%), and Moldova (4 | 0.4%), together accounting for 2.2% of all New Holland residents.
| Immigration Origin | # Population | % Population |
| Eastern Europe | 8 | 0.9% |
| Europe | 8 | 0.9% |
| Moldova | 4 | 0.4% | View All 3 Rows |
Sex and Age in New Holland
Sex and Age in New Holland
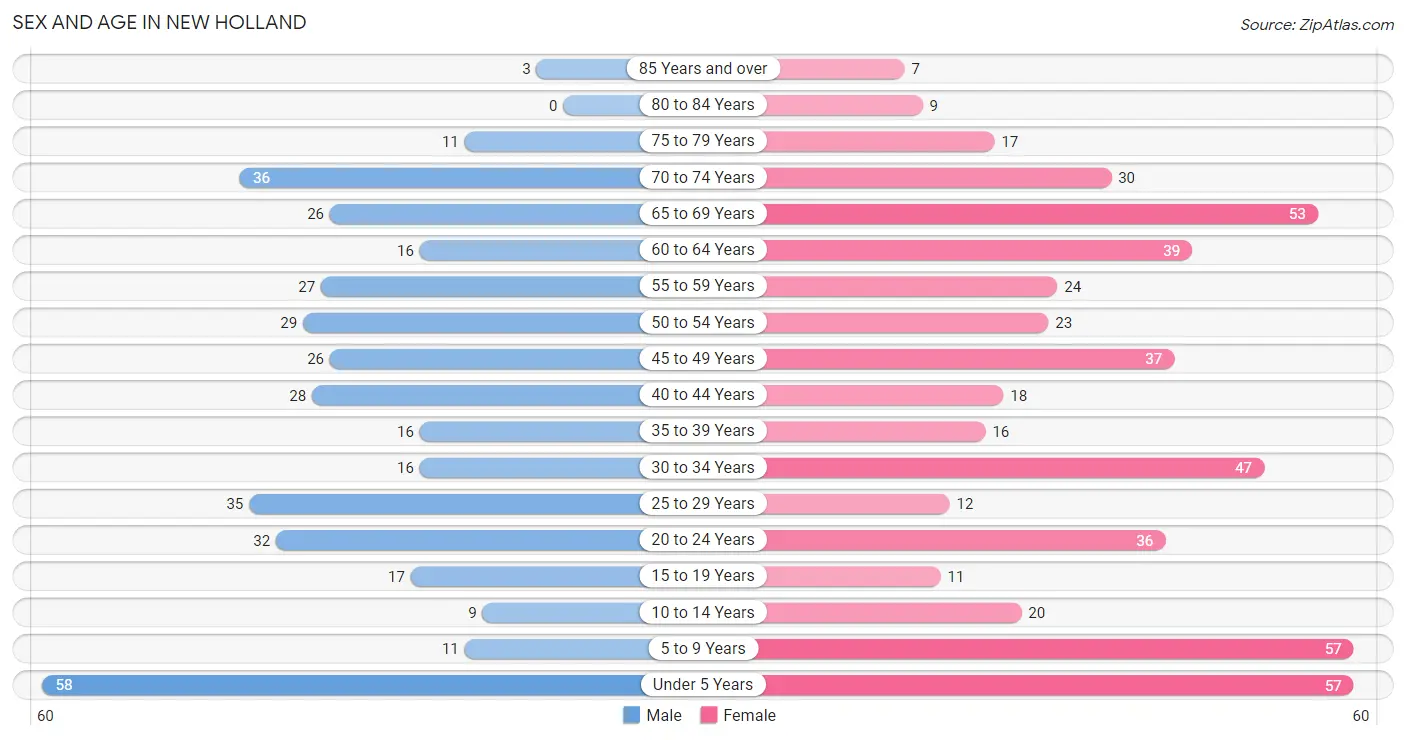
The most populous age groups in New Holland are Under 5 Years (58 | 14.6%) for men and Under 5 Years (57 | 11.1%) for women.
| Age Bracket | Male | Female |
| Under 5 Years | 58 (14.6%) | 57 (11.1%) |
| 5 to 9 Years | 11 (2.8%) | 57 (11.1%) |
| 10 to 14 Years | 9 (2.3%) | 20 (3.9%) |
| 15 to 19 Years | 17 (4.3%) | 11 (2.1%) |
| 20 to 24 Years | 32 (8.1%) | 36 (7.0%) |
| 25 to 29 Years | 35 (8.8%) | 12 (2.3%) |
| 30 to 34 Years | 16 (4.0%) | 47 (9.2%) |
| 35 to 39 Years | 16 (4.0%) | 16 (3.1%) |
| 40 to 44 Years | 28 (7.1%) | 18 (3.5%) |
| 45 to 49 Years | 26 (6.6%) | 37 (7.2%) |
| 50 to 54 Years | 29 (7.3%) | 23 (4.5%) |
| 55 to 59 Years | 27 (6.8%) | 24 (4.7%) |
| 60 to 64 Years | 16 (4.0%) | 39 (7.6%) |
| 65 to 69 Years | 26 (6.6%) | 53 (10.3%) |
| 70 to 74 Years | 36 (9.1%) | 30 (5.9%) |
| 75 to 79 Years | 11 (2.8%) | 17 (3.3%) |
| 80 to 84 Years | 0 (0.0%) | 9 (1.8%) |
| 85 Years and over | 3 (0.8%) | 7 (1.4%) |
| Total | 396 (100.0%) | 513 (100.0%) |
Families and Households in New Holland
Median Family Size in New Holland
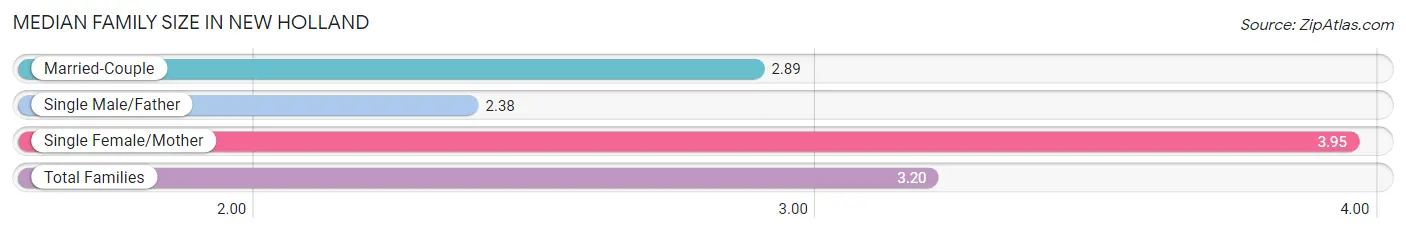
The median family size in New Holland is 3.20 persons per family, with single female/mother families (75 | 33.0%) accounting for the largest median family size of 3.95 persons per family. On the other hand, single male/father families (16 | 7.0%) represent the smallest median family size with 2.38 persons per family.
| Family Type | # Families | Family Size |
| Married-Couple | 136 (59.9%) | 2.89 |
| Single Male/Father | 16 (7.0%) | 2.38 |
| Single Female/Mother | 75 (33.0%) | 3.95 |
| Total Families | 227 (100.0%) | 3.20 |
Median Household Size in New Holland
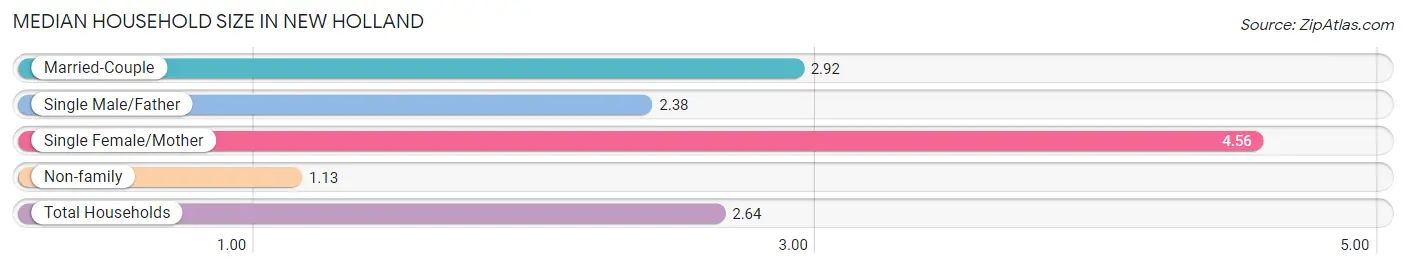
The median household size in New Holland is 2.64 persons per household, with single female/mother households (75 | 21.8%) accounting for the largest median household size of 4.56 persons per household. non-family households (117 | 34.0%) represent the smallest median household size with 1.13 persons per household.
| Household Type | # Households | Household Size |
| Married-Couple | 136 (39.5%) | 2.92 |
| Single Male/Father | 16 (4.6%) | 2.38 |
| Single Female/Mother | 75 (21.8%) | 4.56 |
| Non-family | 117 (34.0%) | 1.13 |
| Total Households | 344 (100.0%) | 2.64 |
Household Size by Marriage Status in New Holland
Out of a total of 344 households in New Holland, 227 (66.0%) are family households, while 117 (34.0%) are nonfamily households. The most numerous type of family households are 2-person households, comprising 102, and the most common type of nonfamily households are 1-person households, comprising 104.
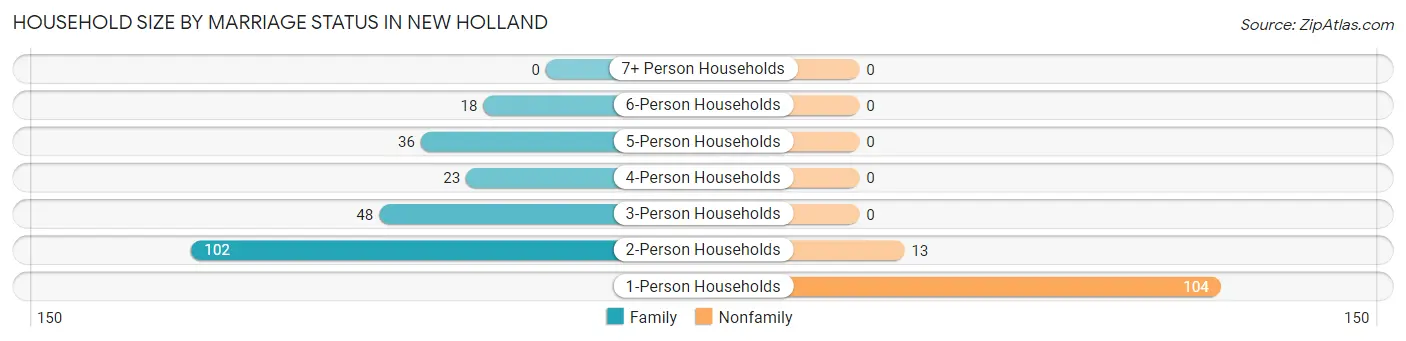
| Household Size | Family Households | Nonfamily Households |
| 1-Person Households | - | 104 (30.2%) |
| 2-Person Households | 102 (29.6%) | 13 (3.8%) |
| 3-Person Households | 48 (14.0%) | 0 (0.0%) |
| 4-Person Households | 23 (6.7%) | 0 (0.0%) |
| 5-Person Households | 36 (10.5%) | 0 (0.0%) |
| 6-Person Households | 18 (5.2%) | 0 (0.0%) |
| 7+ Person Households | 0 (0.0%) | 0 (0.0%) |
| Total | 227 (66.0%) | 117 (34.0%) |
Female Fertility in New Holland
Fertility by Age in New Holland
Average fertility rate in New Holland is 72.0 births per 1,000 women. Women in the age bracket of 20 to 34 years have the highest fertility rate with 95.0 births per 1,000 women. Women in the age bracket of 20 to 34 years acount for 69.2% of all women with births.
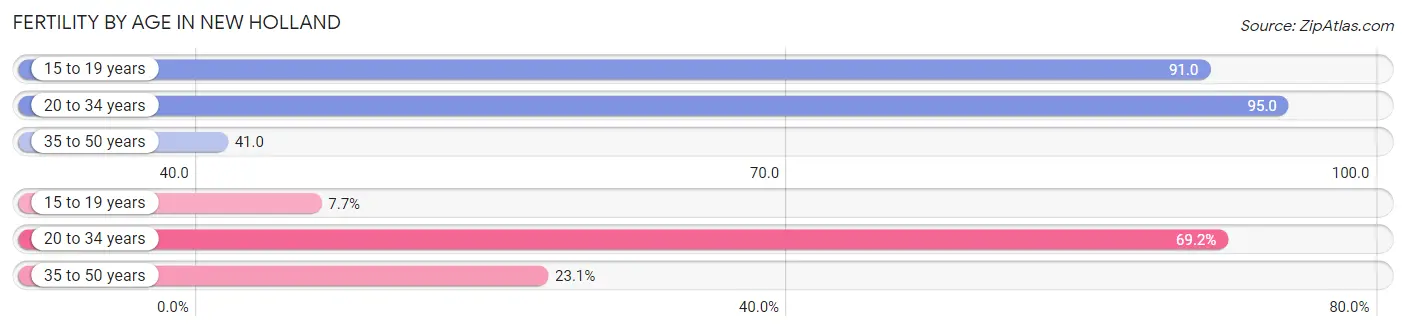
| Age Bracket | Women with Births | Births / 1,000 Women |
| 15 to 19 years | 1 (7.7%) | 91.0 |
| 20 to 34 years | 9 (69.2%) | 95.0 |
| 35 to 50 years | 3 (23.1%) | 41.0 |
| Total | 13 (100.0%) | 72.0 |
Fertility by Age by Marriage Status in New Holland
92.3% of women with births (13) in New Holland are married. The highest percentage of unmarried women with births falls into 15 to 19 years age bracket with 100.0% of them unmarried at the time of birth, while the lowest percentage of unmarried women with births belong to 20 to 34 years age bracket with 0.0% of them unmarried.
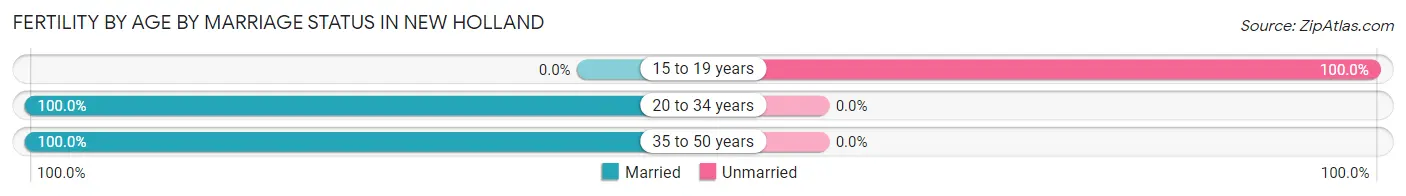
| Age Bracket | Married | Unmarried |
| 15 to 19 years | 0 (0.0%) | 1 (100.0%) |
| 20 to 34 years | 9 (100.0%) | 0 (0.0%) |
| 35 to 50 years | 3 (100.0%) | 0 (0.0%) |
| Total | 12 (92.3%) | 1 (7.7%) |
Fertility by Education in New Holland
Average fertility rate in New Holland is 72.0 births per 1,000 women. Women with the education attainment of graduate degree have the highest fertility rate of 444.0 births per 1,000 women, while women with the education attainment of less than high school have the lowest fertility at 21.0 births per 1,000 women. Women with the education attainment of graduate degree represent 30.8% of all women with births.
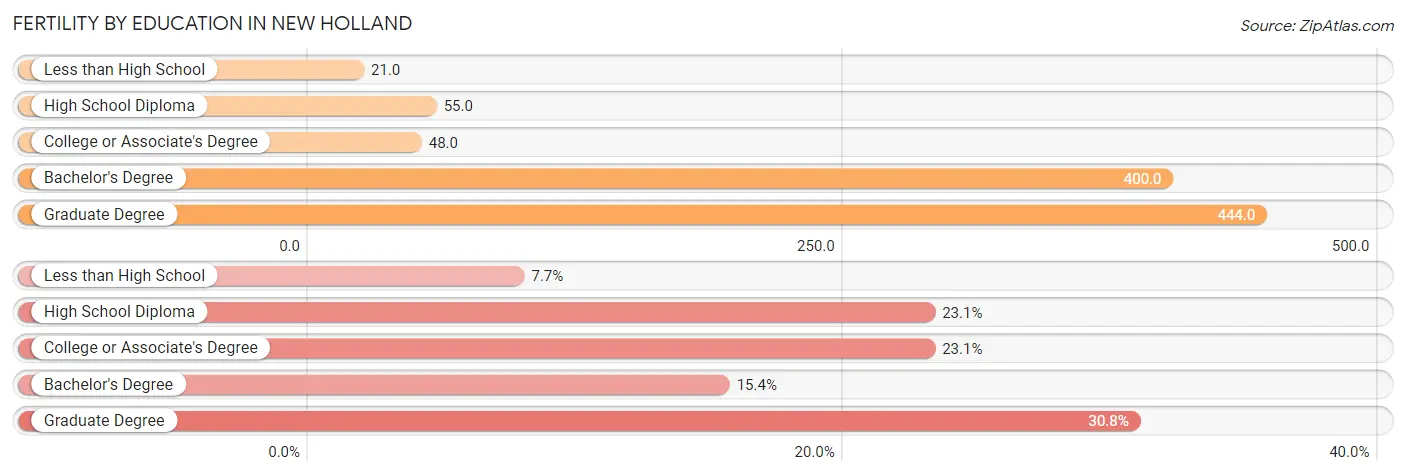
| Educational Attainment | Women with Births | Births / 1,000 Women |
| Less than High School | 1 (7.7%) | 21.0 |
| High School Diploma | 3 (23.1%) | 55.0 |
| College or Associate's Degree | 3 (23.1%) | 48.0 |
| Bachelor's Degree | 2 (15.4%) | 400.0 |
| Graduate Degree | 4 (30.8%) | 444.0 |
| Total | 13 (100.0%) | 72.0 |
Fertility by Education by Marriage Status in New Holland
7.7% of women with births in New Holland are unmarried. Women with the educational attainment of high school diploma are most likely to be married with 100.0% of them married at childbirth, while women with the educational attainment of less than high school are least likely to be married with 100.0% of them unmarried at childbirth.
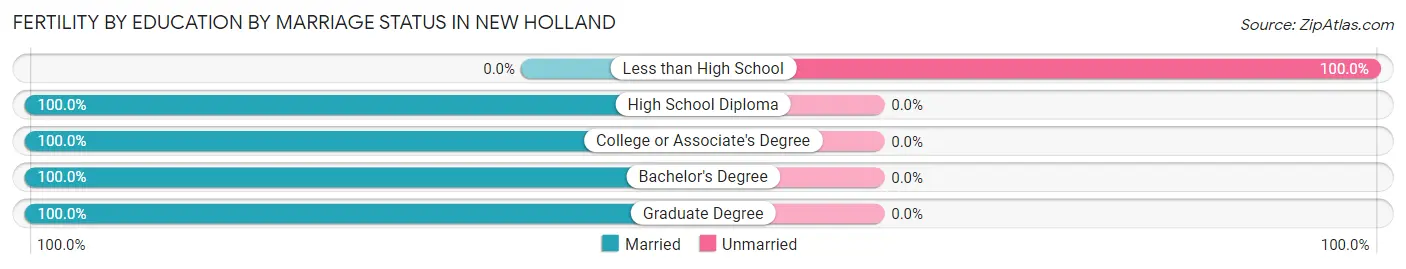
| Educational Attainment | Married | Unmarried |
| Less than High School | 0 (0.0%) | 1 (100.0%) |
| High School Diploma | 3 (100.0%) | 0 (0.0%) |
| College or Associate's Degree | 3 (100.0%) | 0 (0.0%) |
| Bachelor's Degree | 2 (100.0%) | 0 (0.0%) |
| Graduate Degree | 4 (100.0%) | 0 (0.0%) |
| Total | 12 (92.3%) | 1 (7.7%) |
Employment Characteristics in New Holland
Employment by Class of Employer in New Holland
Among the 316 employed individuals in New Holland, private company employees (246 | 77.8%), not-for-profit organizations (19 | 6.0%), and local government employees (17 | 5.4%) make up the most common classes of employment.
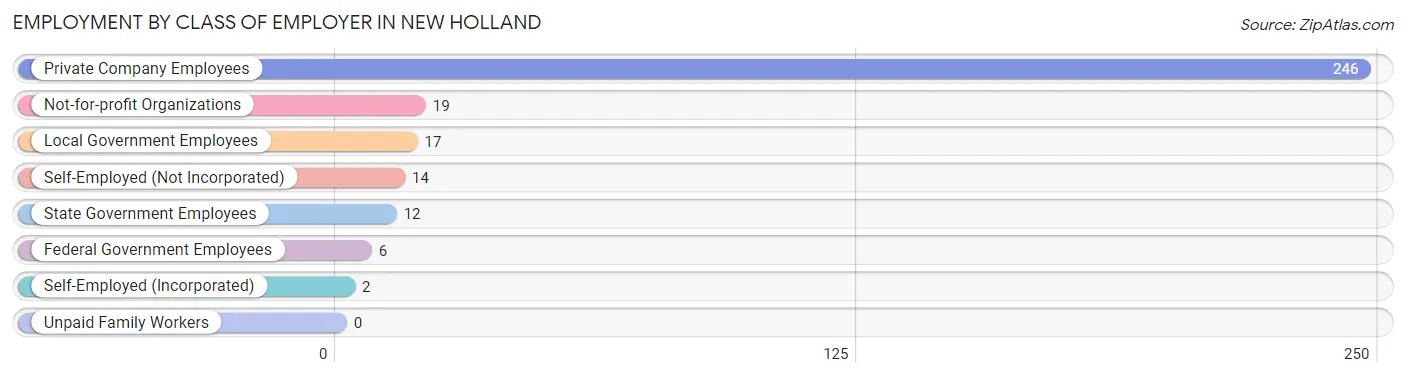
| Employer Class | # Employees | % Employees |
| Private Company Employees | 246 | 77.8% |
| Self-Employed (Incorporated) | 2 | 0.6% |
| Self-Employed (Not Incorporated) | 14 | 4.4% |
| Not-for-profit Organizations | 19 | 6.0% |
| Local Government Employees | 17 | 5.4% |
| State Government Employees | 12 | 3.8% |
| Federal Government Employees | 6 | 1.9% |
| Unpaid Family Workers | 0 | 0.0% |
| Total | 316 | 100.0% |
Employment Status by Age in New Holland
According to the labor force statistics for New Holland, out of the total population over 16 years of age (684), 49.1% or 336 individuals are in the labor force, with 4.5% or 15 of them unemployed. The age group with the highest labor force participation rate is 25 to 29 years, with 85.1% or 40 individuals in the labor force. Within the labor force, the 60 to 64 years age range has the highest percentage of unemployed individuals, with 28.1% or 9 of them being unemployed.
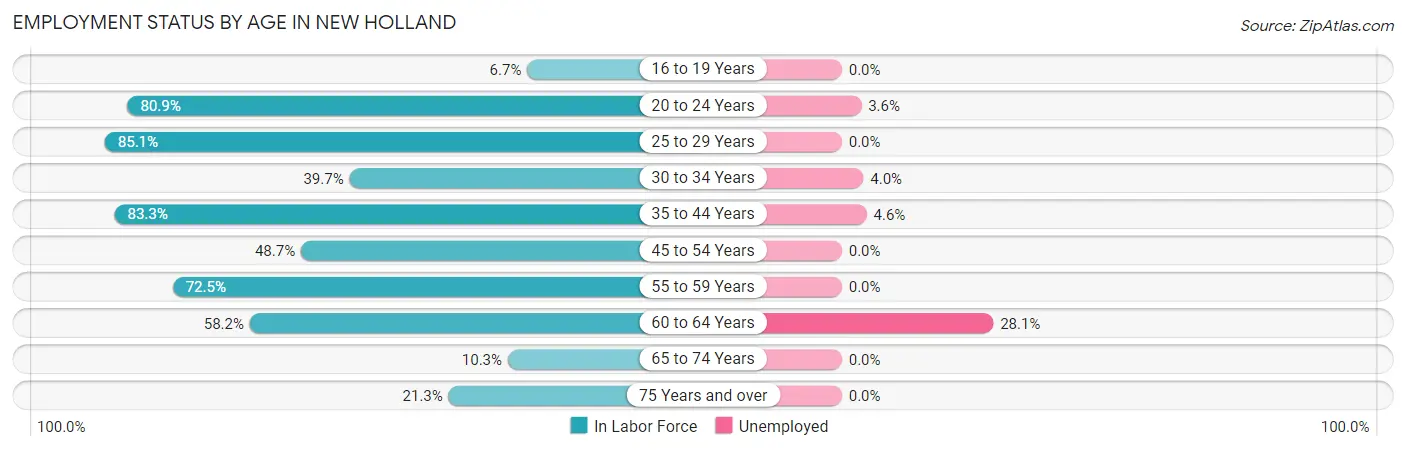
| Age Bracket | In Labor Force | Unemployed |
| 16 to 19 Years | 1 (6.7%) | 0 (0.0%) |
| 20 to 24 Years | 55 (80.9%) | 2 (3.6%) |
| 25 to 29 Years | 40 (85.1%) | 0 (0.0%) |
| 30 to 34 Years | 25 (39.7%) | 1 (4.0%) |
| 35 to 44 Years | 65 (83.3%) | 3 (4.6%) |
| 45 to 54 Years | 56 (48.7%) | 0 (0.0%) |
| 55 to 59 Years | 37 (72.5%) | 0 (0.0%) |
| 60 to 64 Years | 32 (58.2%) | 9 (28.1%) |
| 65 to 74 Years | 15 (10.3%) | 0 (0.0%) |
| 75 Years and over | 10 (21.3%) | 0 (0.0%) |
| Total | 336 (49.1%) | 15 (4.5%) |
Employment Status by Educational Attainment in New Holland
According to labor force statistics for New Holland, 62.3% of individuals (255) out of the total population between 25 and 64 years of age (409) are in the labor force, with 5.1% or 13 of them being unemployed. The group with the highest labor force participation rate are those with the educational attainment of bachelor's degree or higher, with 100.0% or 33 individuals in the labor force. Within the labor force, individuals with less than high school education have the highest percentage of unemployment, with 28.3% or 13 of them being unemployed.
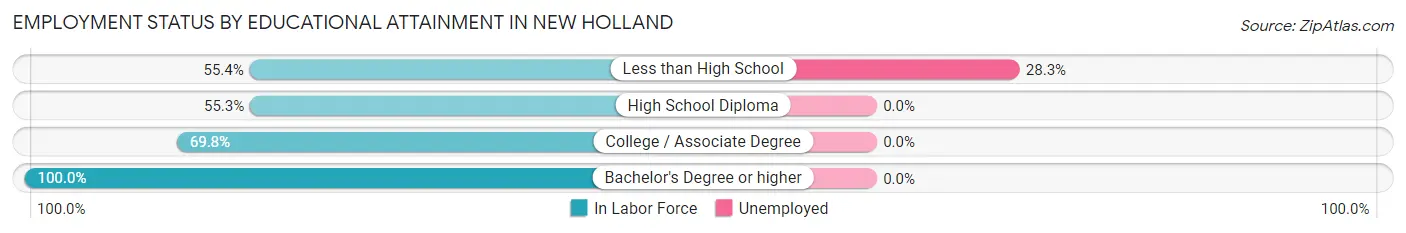
| Educational Attainment | In Labor Force | Unemployed |
| Less than High School | 46 (55.4%) | 23 (28.3%) |
| High School Diploma | 109 (55.3%) | 0 (0.0%) |
| College / Associate Degree | 67 (69.8%) | 0 (0.0%) |
| Bachelor's Degree or higher | 33 (100.0%) | 0 (0.0%) |
| Total | 255 (62.3%) | 21 (5.1%) |
Employment Occupations by Sex in New Holland
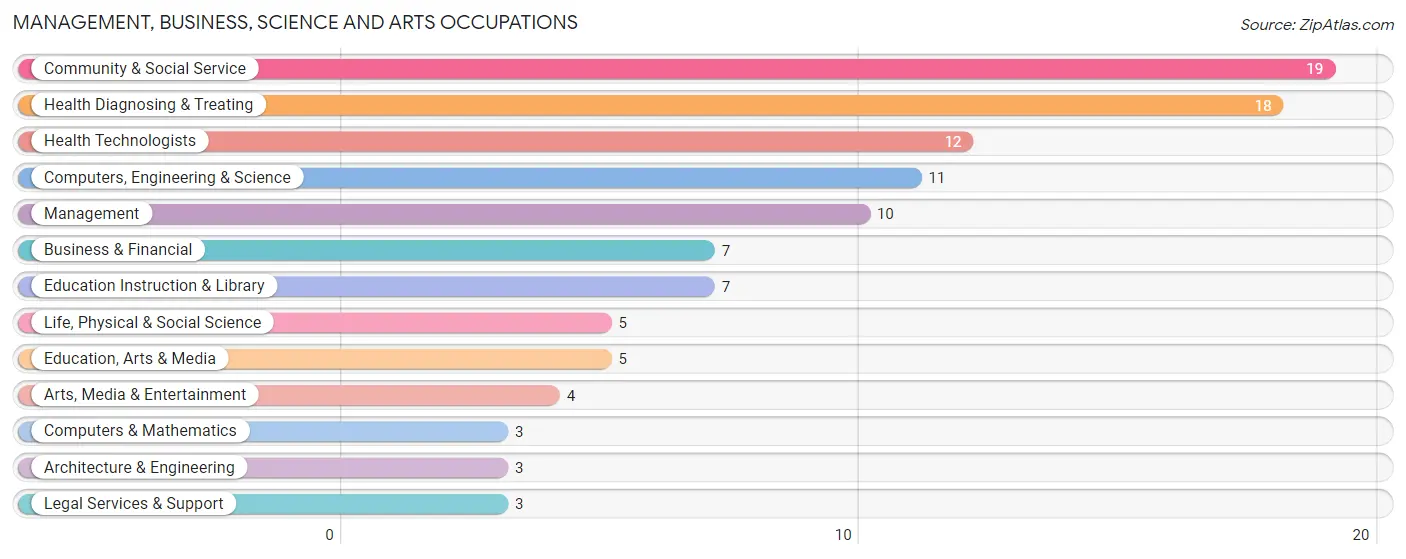
Management, Business, Science and Arts Occupations
The most common Management, Business, Science and Arts occupations in New Holland are Community & Social Service (19 | 5.9%), Health Diagnosing & Treating (18 | 5.6%), Health Technologists (12 | 3.7%), Computers, Engineering & Science (11 | 3.4%), and Management (10 | 3.1%).
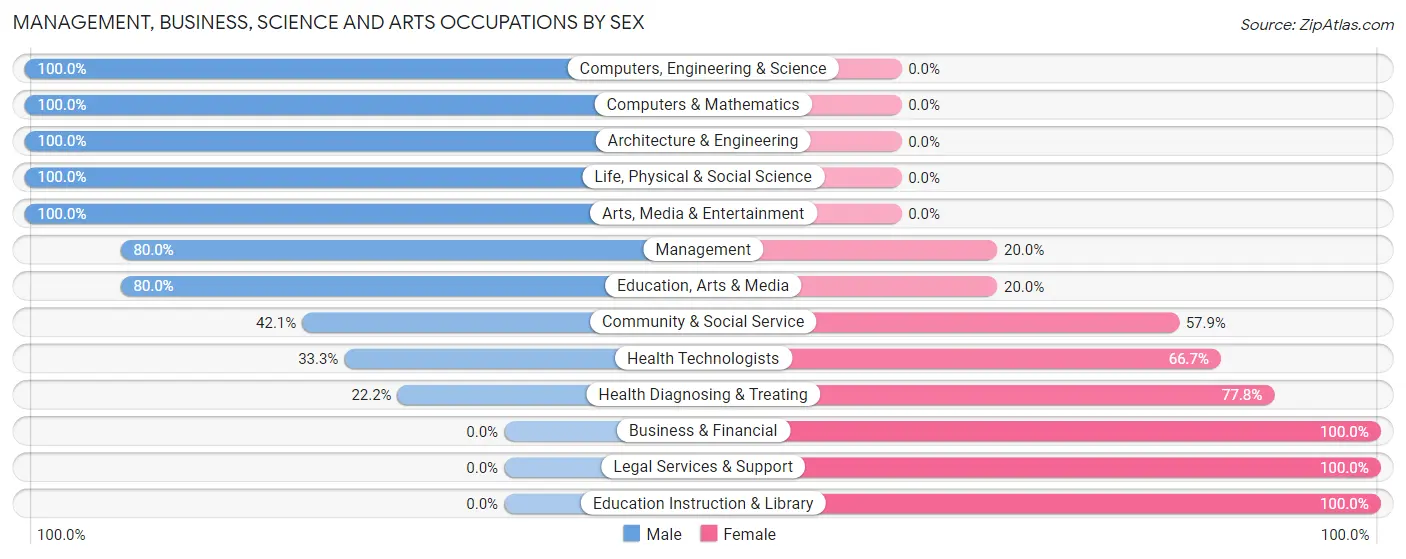
Management, Business, Science and Arts Occupations by Sex
Within the Management, Business, Science and Arts occupations in New Holland, the most male-oriented occupations are Computers, Engineering & Science (100.0%), Computers & Mathematics (100.0%), and Architecture & Engineering (100.0%), while the most female-oriented occupations are Business & Financial (100.0%), Legal Services & Support (100.0%), and Education Instruction & Library (100.0%).
| Occupation | Male | Female |
| Management | 8 (80.0%) | 2 (20.0%) |
| Business & Financial | 0 (0.0%) | 7 (100.0%) |
| Computers, Engineering & Science | 11 (100.0%) | 0 (0.0%) |
| Computers & Mathematics | 3 (100.0%) | 0 (0.0%) |
| Architecture & Engineering | 3 (100.0%) | 0 (0.0%) |
| Life, Physical & Social Science | 5 (100.0%) | 0 (0.0%) |
| Community & Social Service | 8 (42.1%) | 11 (57.9%) |
| Education, Arts & Media | 4 (80.0%) | 1 (20.0%) |
| Legal Services & Support | 0 (0.0%) | 3 (100.0%) |
| Education Instruction & Library | 0 (0.0%) | 7 (100.0%) |
| Arts, Media & Entertainment | 4 (100.0%) | 0 (0.0%) |
| Health Diagnosing & Treating | 4 (22.2%) | 14 (77.8%) |
| Health Technologists | 4 (33.3%) | 8 (66.7%) |
| Total (Category) | 31 (47.7%) | 34 (52.3%) |
| Total (Overall) | 154 (48.0%) | 167 (52.0%) |
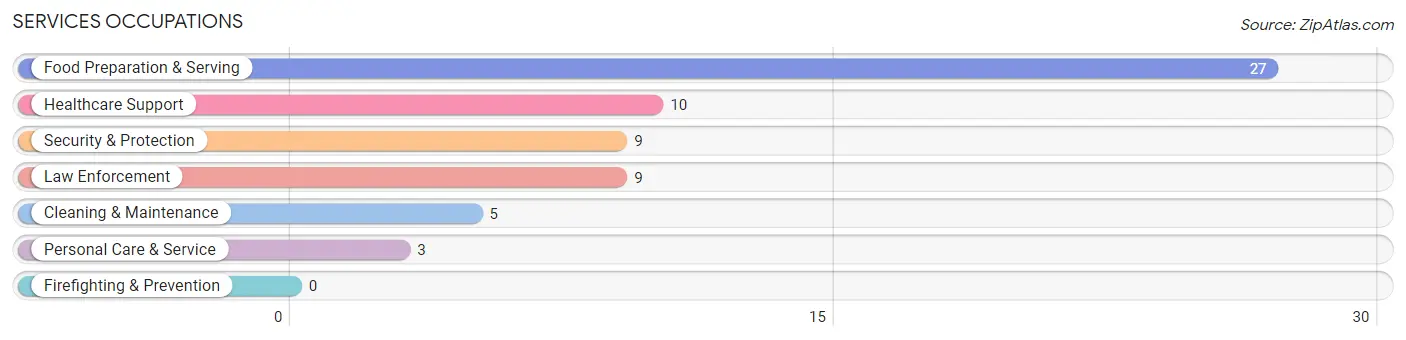
Services Occupations
The most common Services occupations in New Holland are Food Preparation & Serving (27 | 8.4%), Healthcare Support (10 | 3.1%), Security & Protection (9 | 2.8%), Law Enforcement (9 | 2.8%), and Cleaning & Maintenance (5 | 1.6%).
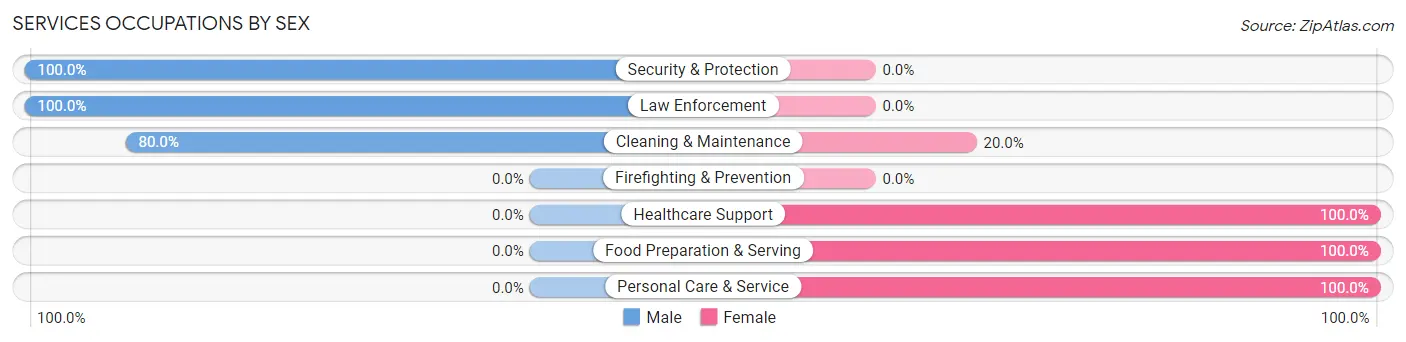
Services Occupations by Sex
Within the Services occupations in New Holland, the most male-oriented occupations are Security & Protection (100.0%), Law Enforcement (100.0%), and Cleaning & Maintenance (80.0%), while the most female-oriented occupations are Healthcare Support (100.0%), Food Preparation & Serving (100.0%), and Personal Care & Service (100.0%).
| Occupation | Male | Female |
| Healthcare Support | 0 (0.0%) | 10 (100.0%) |
| Security & Protection | 9 (100.0%) | 0 (0.0%) |
| Firefighting & Prevention | 0 (0.0%) | 0 (0.0%) |
| Law Enforcement | 9 (100.0%) | 0 (0.0%) |
| Food Preparation & Serving | 0 (0.0%) | 27 (100.0%) |
| Cleaning & Maintenance | 4 (80.0%) | 1 (20.0%) |
| Personal Care & Service | 0 (0.0%) | 3 (100.0%) |
| Total (Category) | 13 (24.1%) | 41 (75.9%) |
| Total (Overall) | 154 (48.0%) | 167 (52.0%) |
Sales and Office Occupations
The most common Sales and Office occupations in New Holland are Sales & Related (33 | 10.3%), and Office & Administration (28 | 8.7%).

Sales and Office Occupations by Sex

| Occupation | Male | Female |
| Sales & Related | 1 (3.0%) | 32 (97.0%) |
| Office & Administration | 0 (0.0%) | 28 (100.0%) |
| Total (Category) | 1 (1.6%) | 60 (98.4%) |
| Total (Overall) | 154 (48.0%) | 167 (52.0%) |
Natural Resources, Construction and Maintenance Occupations
The most common Natural Resources, Construction and Maintenance occupations in New Holland are Installation, Maintenance & Repair (20 | 6.2%), and Construction & Extraction (7 | 2.2%).

Natural Resources, Construction and Maintenance Occupations by Sex

| Occupation | Male | Female |
| Farming, Fishing & Forestry | 0 (0.0%) | 0 (0.0%) |
| Construction & Extraction | 7 (100.0%) | 0 (0.0%) |
| Installation, Maintenance & Repair | 20 (100.0%) | 0 (0.0%) |
| Total (Category) | 27 (100.0%) | 0 (0.0%) |
| Total (Overall) | 154 (48.0%) | 167 (52.0%) |
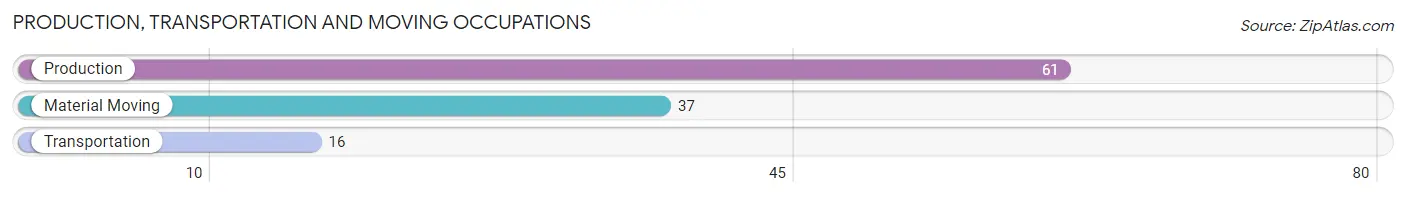
Production, Transportation and Moving Occupations
The most common Production, Transportation and Moving occupations in New Holland are Production (61 | 19.0%), Material Moving (37 | 11.5%), and Transportation (16 | 5.0%).
Production, Transportation and Moving Occupations by Sex
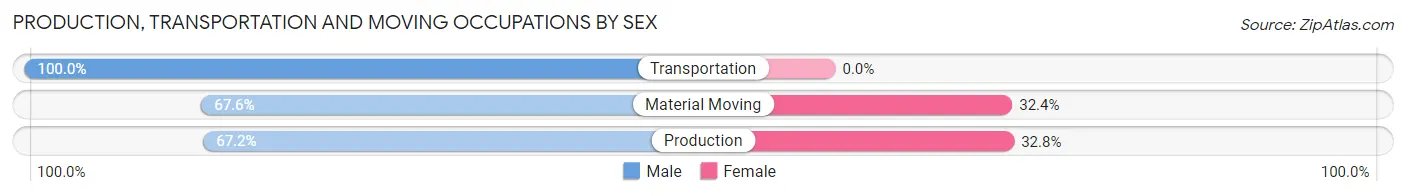
| Occupation | Male | Female |
| Production | 41 (67.2%) | 20 (32.8%) |
| Transportation | 16 (100.0%) | 0 (0.0%) |
| Material Moving | 25 (67.6%) | 12 (32.4%) |
| Total (Category) | 82 (71.9%) | 32 (28.1%) |
| Total (Overall) | 154 (48.0%) | 167 (52.0%) |
Employment Industries by Sex in New Holland
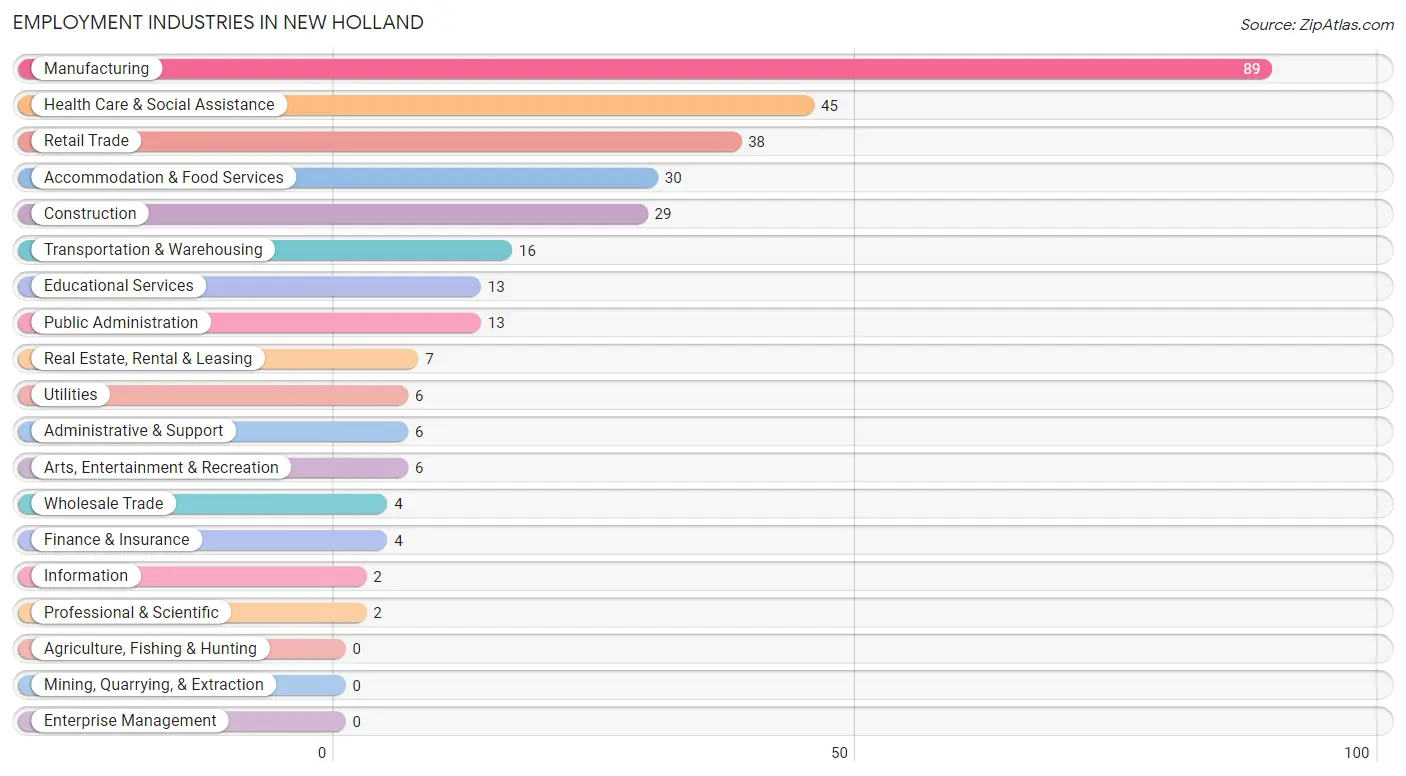
Employment Industries in New Holland
The major employment industries in New Holland include Manufacturing (89 | 27.7%), Health Care & Social Assistance (45 | 14.0%), Retail Trade (38 | 11.8%), Accommodation & Food Services (30 | 9.3%), and Construction (29 | 9.0%).
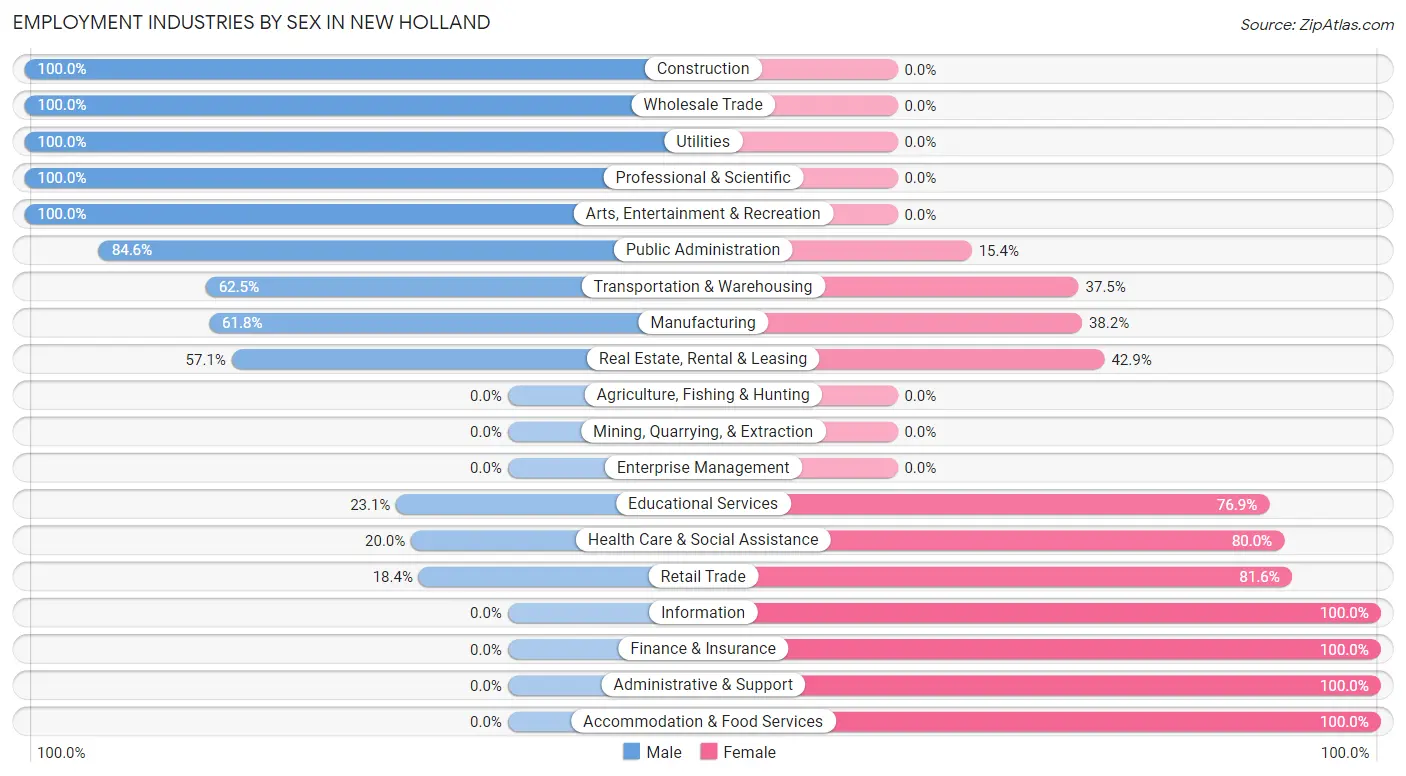
Employment Industries by Sex in New Holland
The New Holland industries that see more men than women are Construction (100.0%), Wholesale Trade (100.0%), and Utilities (100.0%), whereas the industries that tend to have a higher number of women are Information (100.0%), Finance & Insurance (100.0%), and Administrative & Support (100.0%).
| Industry | Male | Female |
| Agriculture, Fishing & Hunting | 0 (0.0%) | 0 (0.0%) |
| Mining, Quarrying, & Extraction | 0 (0.0%) | 0 (0.0%) |
| Construction | 29 (100.0%) | 0 (0.0%) |
| Manufacturing | 55 (61.8%) | 34 (38.2%) |
| Wholesale Trade | 4 (100.0%) | 0 (0.0%) |
| Retail Trade | 7 (18.4%) | 31 (81.6%) |
| Transportation & Warehousing | 10 (62.5%) | 6 (37.5%) |
| Utilities | 6 (100.0%) | 0 (0.0%) |
| Information | 0 (0.0%) | 2 (100.0%) |
| Finance & Insurance | 0 (0.0%) | 4 (100.0%) |
| Real Estate, Rental & Leasing | 4 (57.1%) | 3 (42.9%) |
| Professional & Scientific | 2 (100.0%) | 0 (0.0%) |
| Enterprise Management | 0 (0.0%) | 0 (0.0%) |
| Administrative & Support | 0 (0.0%) | 6 (100.0%) |
| Educational Services | 3 (23.1%) | 10 (76.9%) |
| Health Care & Social Assistance | 9 (20.0%) | 36 (80.0%) |
| Arts, Entertainment & Recreation | 6 (100.0%) | 0 (0.0%) |
| Accommodation & Food Services | 0 (0.0%) | 30 (100.0%) |
| Public Administration | 11 (84.6%) | 2 (15.4%) |
| Total | 154 (48.0%) | 167 (52.0%) |
Education in New Holland
School Enrollment in New Holland
The most common levels of schooling among the 152 students in New Holland are elementary school (54 | 35.5%), middle school (36 | 23.7%), and college / undergraduate (27 | 17.8%).
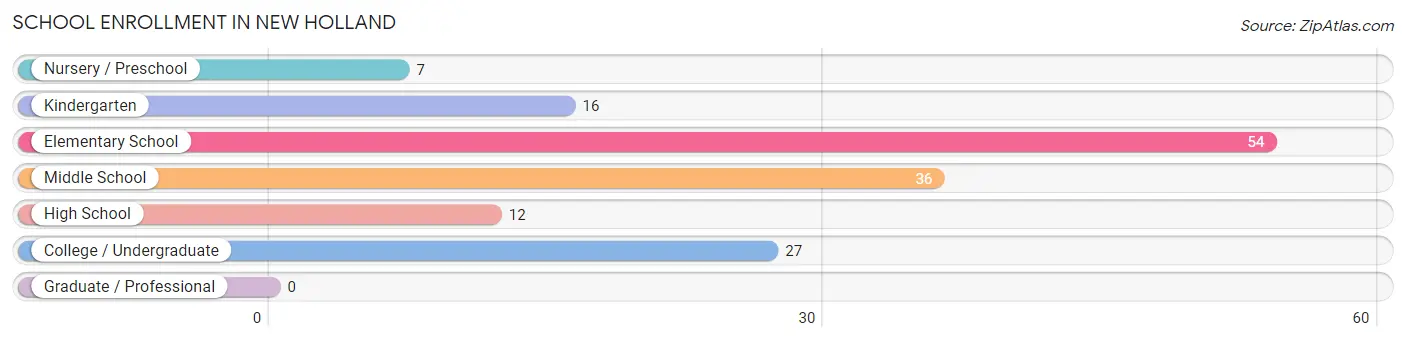
| School Level | # Students | % Students |
| Nursery / Preschool | 7 | 4.6% |
| Kindergarten | 16 | 10.5% |
| Elementary School | 54 | 35.5% |
| Middle School | 36 | 23.7% |
| High School | 12 | 7.9% |
| College / Undergraduate | 27 | 17.8% |
| Graduate / Professional | 0 | 0.0% |
| Total | 152 | 100.0% |
School Enrollment by Age by Funding Source in New Holland
Out of a total of 152 students who are enrolled in schools in New Holland, 7 (4.6%) attend a private institution, while the remaining 145 (95.4%) are enrolled in public schools. The age group of 3 to 4 year olds has the highest likelihood of being enrolled in private schools, with 3 (42.9% in the age bracket) enrolled. Conversely, the age group of 5 to 9 year old has the lowest likelihood of being enrolled in a private school, with 68 (100.0% in the age bracket) attending a public institution.
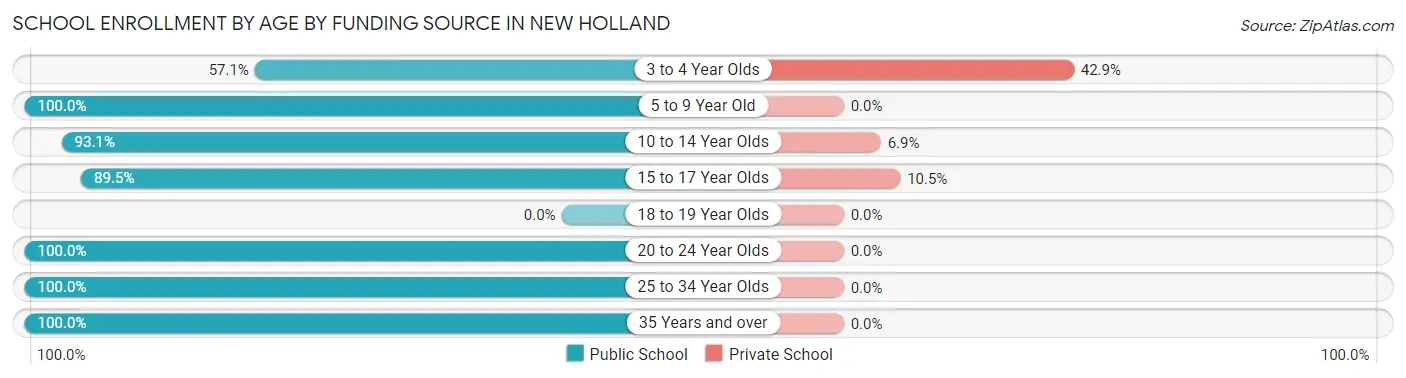
| Age Bracket | Public School | Private School |
| 3 to 4 Year Olds | 4 (57.1%) | 3 (42.9%) |
| 5 to 9 Year Old | 68 (100.0%) | 0 (0.0%) |
| 10 to 14 Year Olds | 27 (93.1%) | 2 (6.9%) |
| 15 to 17 Year Olds | 17 (89.5%) | 2 (10.5%) |
| 18 to 19 Year Olds | 0 (0.0%) | 0 (0.0%) |
| 20 to 24 Year Olds | 25 (100.0%) | 0 (0.0%) |
| 25 to 34 Year Olds | 2 (100.0%) | 0 (0.0%) |
| 35 Years and over | 2 (100.0%) | 0 (0.0%) |
| Total | 145 (95.4%) | 7 (4.6%) |
Educational Attainment by Field of Study in New Holland
Education (16 | 37.2%), social sciences (11 | 25.6%), science & technology (9 | 20.9%), literature & languages (2 | 4.6%), and communications (2 | 4.6%) are the most common fields of study among 43 individuals in New Holland who have obtained a bachelor's degree or higher.
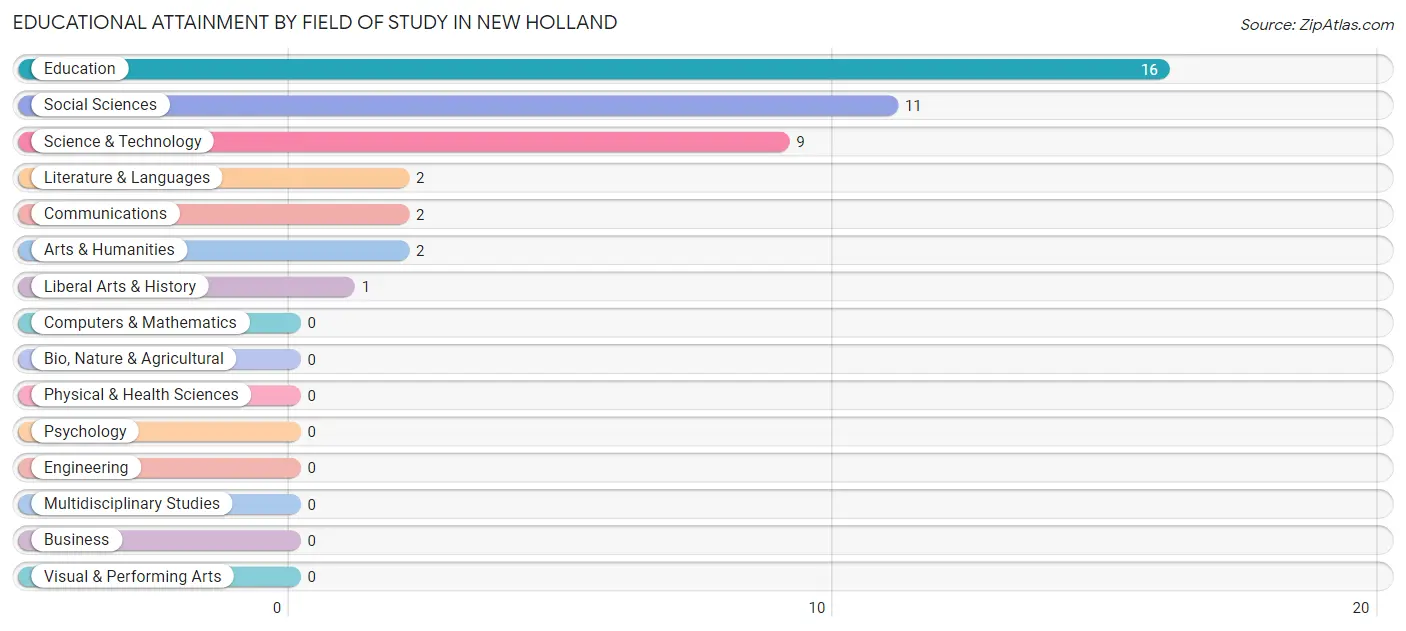
| Field of Study | # Graduates | % Graduates |
| Computers & Mathematics | 0 | 0.0% |
| Bio, Nature & Agricultural | 0 | 0.0% |
| Physical & Health Sciences | 0 | 0.0% |
| Psychology | 0 | 0.0% |
| Social Sciences | 11 | 25.6% |
| Engineering | 0 | 0.0% |
| Multidisciplinary Studies | 0 | 0.0% |
| Science & Technology | 9 | 20.9% |
| Business | 0 | 0.0% |
| Education | 16 | 37.2% |
| Literature & Languages | 2 | 4.6% |
| Liberal Arts & History | 1 | 2.3% |
| Visual & Performing Arts | 0 | 0.0% |
| Communications | 2 | 4.6% |
| Arts & Humanities | 2 | 4.6% |
| Total | 43 | 100.0% |
Transportation & Commute in New Holland
Vehicle Availability by Sex in New Holland
The most prevalent vehicle ownership categories in New Holland are males with 2 vehicles (86, accounting for 55.8%) and females with 2 vehicles (56, making up 53.1%).
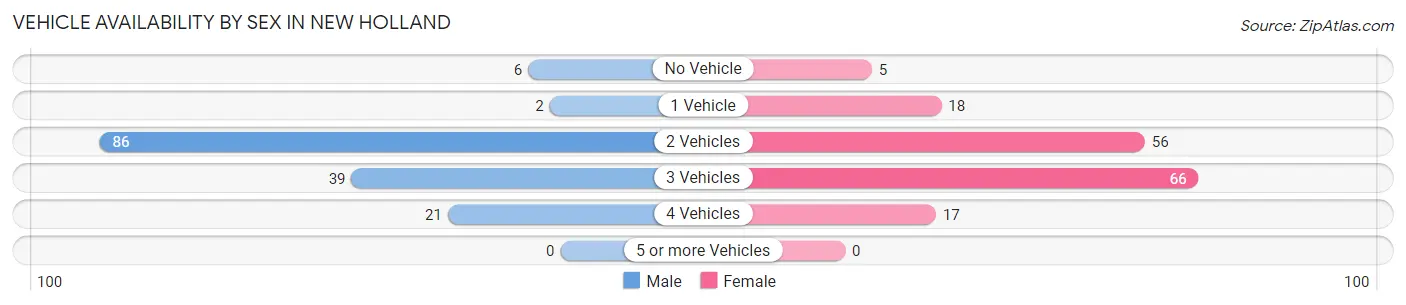
| Vehicles Available | Male | Female |
| No Vehicle | 6 (3.9%) | 5 (3.1%) |
| 1 Vehicle | 2 (1.3%) | 18 (11.1%) |
| 2 Vehicles | 86 (55.8%) | 56 (34.6%) |
| 3 Vehicles | 39 (25.3%) | 66 (40.7%) |
| 4 Vehicles | 21 (13.6%) | 17 (10.5%) |
| 5 or more Vehicles | 0 (0.0%) | 0 (0.0%) |
| Total | 154 (100.0%) | 162 (100.0%) |
Commute Time in New Holland
The most frequently occuring commute durations in New Holland are 15 to 19 minutes (63 commuters, 20.6%), 45 to 59 minutes (40 commuters, 13.1%), and 20 to 24 minutes (36 commuters, 11.8%).
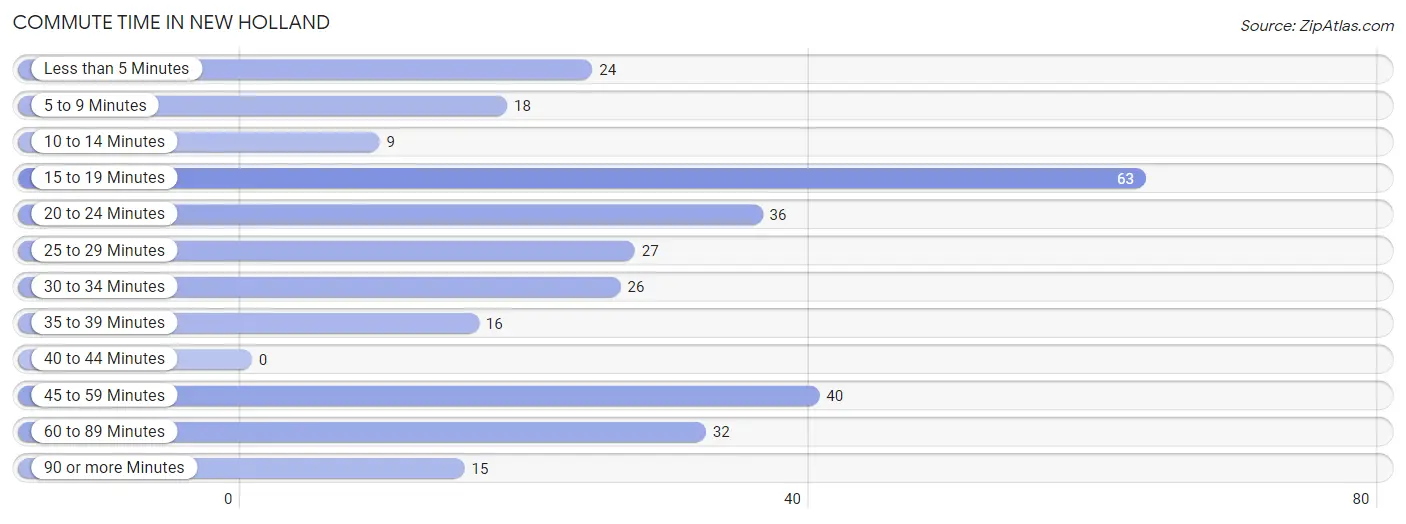
| Commute Time | # Commuters | % Commuters |
| Less than 5 Minutes | 24 | 7.8% |
| 5 to 9 Minutes | 18 | 5.9% |
| 10 to 14 Minutes | 9 | 2.9% |
| 15 to 19 Minutes | 63 | 20.6% |
| 20 to 24 Minutes | 36 | 11.8% |
| 25 to 29 Minutes | 27 | 8.8% |
| 30 to 34 Minutes | 26 | 8.5% |
| 35 to 39 Minutes | 16 | 5.2% |
| 40 to 44 Minutes | 0 | 0.0% |
| 45 to 59 Minutes | 40 | 13.1% |
| 60 to 89 Minutes | 32 | 10.5% |
| 90 or more Minutes | 15 | 4.9% |
Commute Time by Sex in New Holland
The most common commute times in New Holland are 45 to 59 minutes (24 commuters, 15.8%) for males and 15 to 19 minutes (44 commuters, 28.6%) for females.
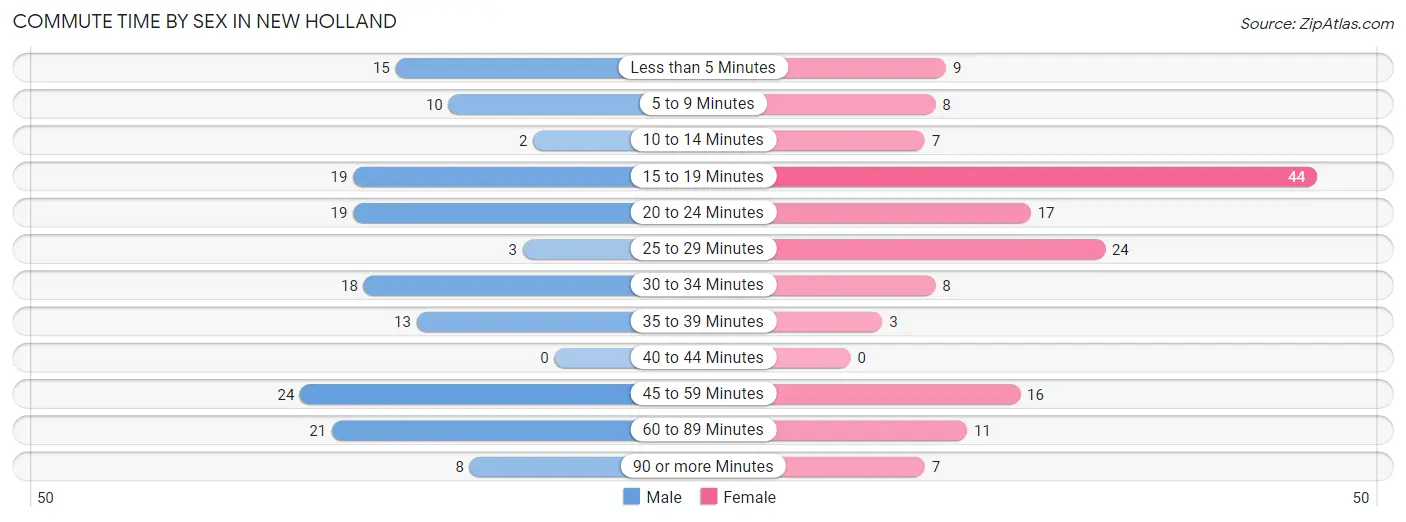
| Commute Time | Male | Female |
| Less than 5 Minutes | 15 (9.9%) | 9 (5.8%) |
| 5 to 9 Minutes | 10 (6.6%) | 8 (5.2%) |
| 10 to 14 Minutes | 2 (1.3%) | 7 (4.5%) |
| 15 to 19 Minutes | 19 (12.5%) | 44 (28.6%) |
| 20 to 24 Minutes | 19 (12.5%) | 17 (11.0%) |
| 25 to 29 Minutes | 3 (2.0%) | 24 (15.6%) |
| 30 to 34 Minutes | 18 (11.8%) | 8 (5.2%) |
| 35 to 39 Minutes | 13 (8.6%) | 3 (1.9%) |
| 40 to 44 Minutes | 0 (0.0%) | 0 (0.0%) |
| 45 to 59 Minutes | 24 (15.8%) | 16 (10.4%) |
| 60 to 89 Minutes | 21 (13.8%) | 11 (7.1%) |
| 90 or more Minutes | 8 (5.3%) | 7 (4.5%) |
Time of Departure to Work by Sex in New Holland
The most frequent times of departure to work in New Holland are 6:00 AM to 6:29 AM (22, 14.5%) for males and 10:00 AM to 10:59 AM (24, 15.6%) for females.
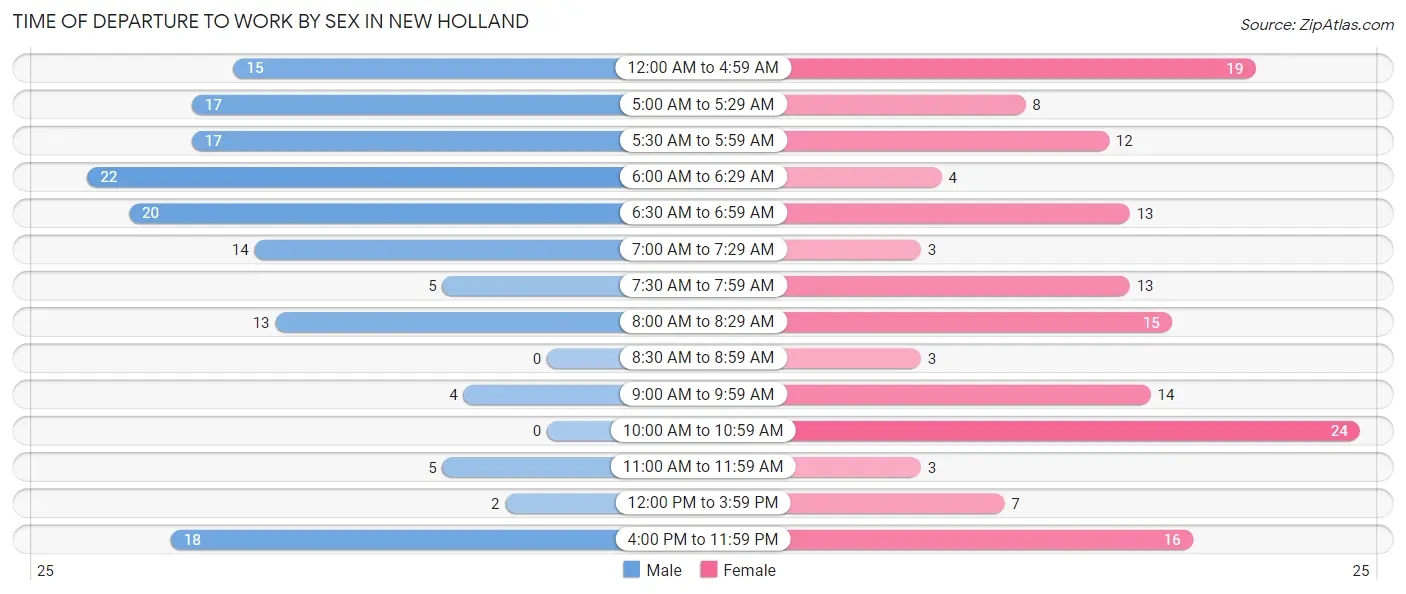
| Time of Departure | Male | Female |
| 12:00 AM to 4:59 AM | 15 (9.9%) | 19 (12.3%) |
| 5:00 AM to 5:29 AM | 17 (11.2%) | 8 (5.2%) |
| 5:30 AM to 5:59 AM | 17 (11.2%) | 12 (7.8%) |
| 6:00 AM to 6:29 AM | 22 (14.5%) | 4 (2.6%) |
| 6:30 AM to 6:59 AM | 20 (13.2%) | 13 (8.4%) |
| 7:00 AM to 7:29 AM | 14 (9.2%) | 3 (1.9%) |
| 7:30 AM to 7:59 AM | 5 (3.3%) | 13 (8.4%) |
| 8:00 AM to 8:29 AM | 13 (8.6%) | 15 (9.7%) |
| 8:30 AM to 8:59 AM | 0 (0.0%) | 3 (1.9%) |
| 9:00 AM to 9:59 AM | 4 (2.6%) | 14 (9.1%) |
| 10:00 AM to 10:59 AM | 0 (0.0%) | 24 (15.6%) |
| 11:00 AM to 11:59 AM | 5 (3.3%) | 3 (1.9%) |
| 12:00 PM to 3:59 PM | 2 (1.3%) | 7 (4.5%) |
| 4:00 PM to 11:59 PM | 18 (11.8%) | 16 (10.4%) |
| Total | 152 (100.0%) | 154 (100.0%) |
Housing Occupancy in New Holland
Occupancy by Ownership in New Holland
Of the total 344 dwellings in New Holland, owner-occupied units account for 230 (66.9%), while renter-occupied units make up 114 (33.1%).
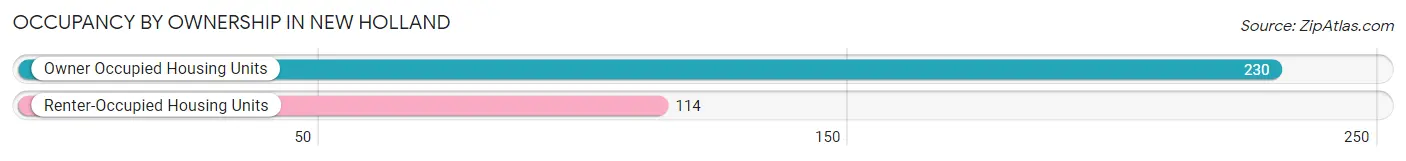
| Occupancy | # Housing Units | % Housing Units |
| Owner Occupied Housing Units | 230 | 66.9% |
| Renter-Occupied Housing Units | 114 | 33.1% |
| Total Occupied Housing Units | 344 | 100.0% |
Occupancy by Household Size in New Holland
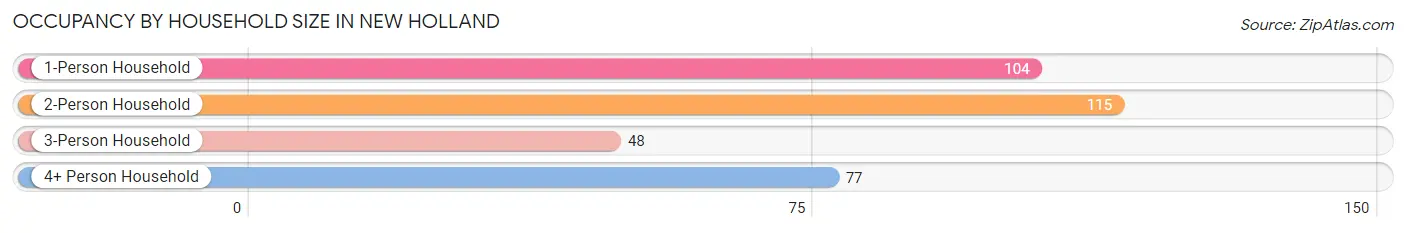
| Household Size | # Housing Units | % Housing Units |
| 1-Person Household | 104 | 30.2% |
| 2-Person Household | 115 | 33.4% |
| 3-Person Household | 48 | 14.0% |
| 4+ Person Household | 77 | 22.4% |
| Total Housing Units | 344 | 100.0% |
Occupancy by Ownership by Household Size in New Holland
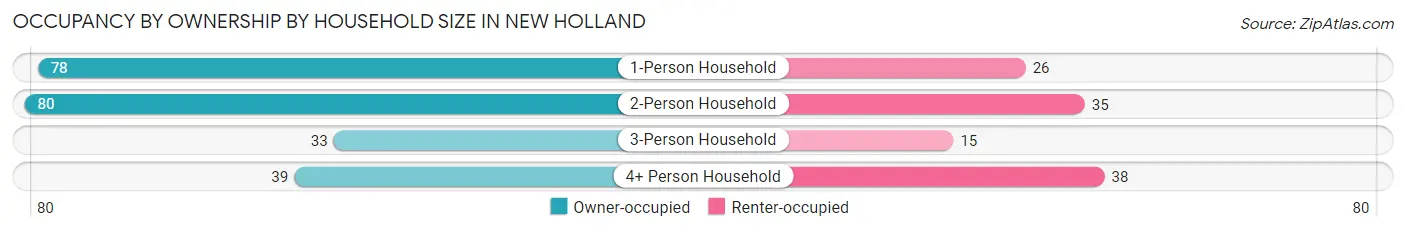
| Household Size | Owner-occupied | Renter-occupied |
| 1-Person Household | 78 (75.0%) | 26 (25.0%) |
| 2-Person Household | 80 (69.6%) | 35 (30.4%) |
| 3-Person Household | 33 (68.8%) | 15 (31.2%) |
| 4+ Person Household | 39 (50.6%) | 38 (49.3%) |
| Total Housing Units | 230 (66.9%) | 114 (33.1%) |
Occupancy by Educational Attainment in New Holland
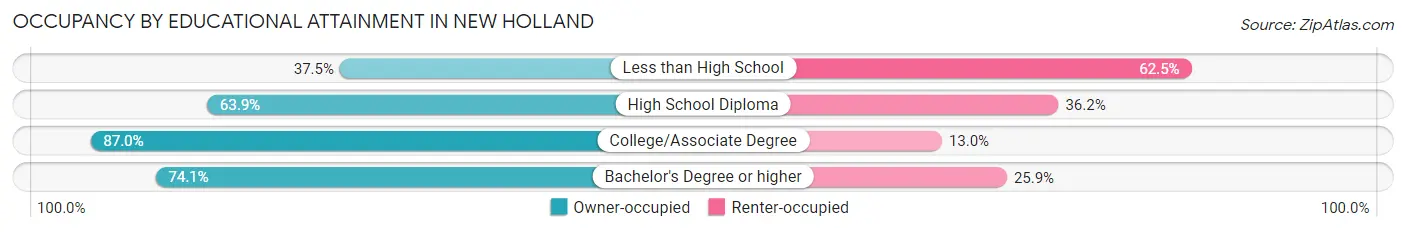
| Household Size | Owner-occupied | Renter-occupied |
| Less than High School | 27 (37.5%) | 45 (62.5%) |
| High School Diploma | 83 (63.8%) | 47 (36.1%) |
| College/Associate Degree | 100 (87.0%) | 15 (13.0%) |
| Bachelor's Degree or higher | 20 (74.1%) | 7 (25.9%) |
Occupancy by Age of Householder in New Holland
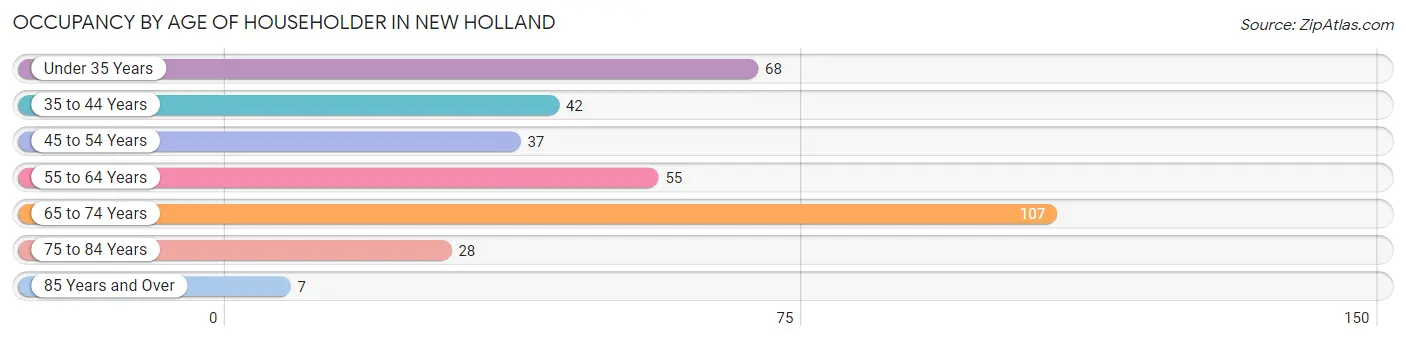
| Age Bracket | # Households | % Households |
| Under 35 Years | 68 | 19.8% |
| 35 to 44 Years | 42 | 12.2% |
| 45 to 54 Years | 37 | 10.8% |
| 55 to 64 Years | 55 | 16.0% |
| 65 to 74 Years | 107 | 31.1% |
| 75 to 84 Years | 28 | 8.1% |
| 85 Years and Over | 7 | 2.0% |
| Total | 344 | 100.0% |
Housing Finances in New Holland
Median Income by Occupancy in New Holland
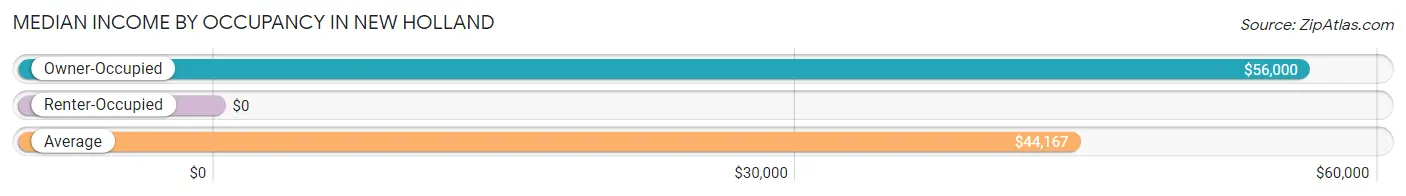
| Occupancy Type | # Households | Median Income |
| Owner-Occupied | 230 (66.9%) | $56,000 |
| Renter-Occupied | 114 (33.1%) | $0 |
| Average | 344 (100.0%) | $44,167 |
Occupancy by Householder Income Bracket in New Holland
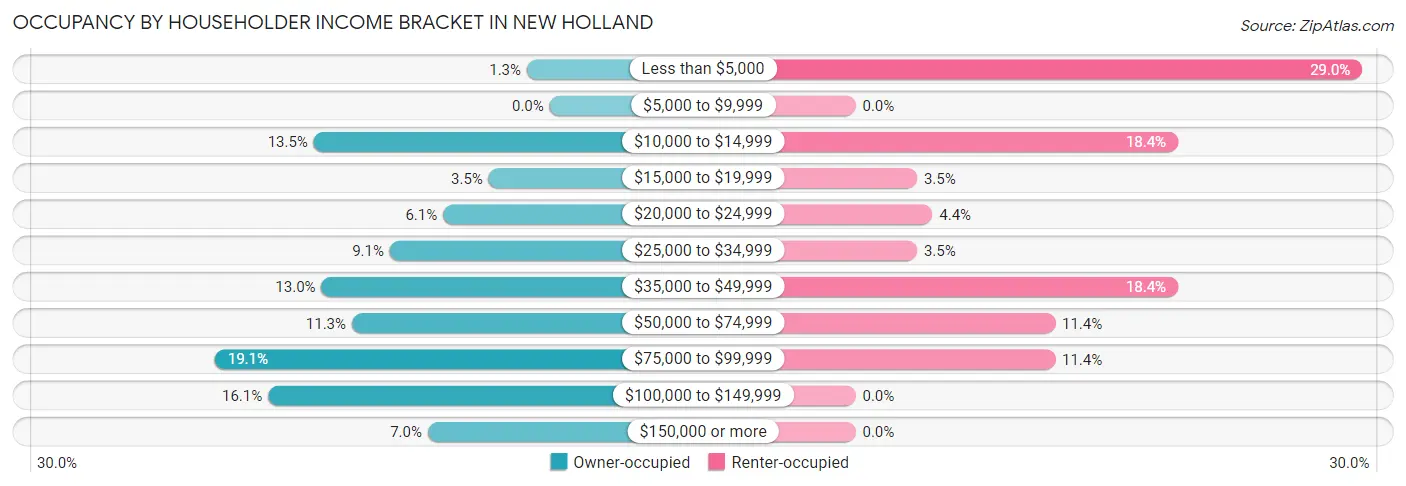
| Income Bracket | Owner-occupied | Renter-occupied |
| Less than $5,000 | 3 (1.3%) | 33 (28.9%) |
| $5,000 to $9,999 | 0 (0.0%) | 0 (0.0%) |
| $10,000 to $14,999 | 31 (13.5%) | 21 (18.4%) |
| $15,000 to $19,999 | 8 (3.5%) | 4 (3.5%) |
| $20,000 to $24,999 | 14 (6.1%) | 5 (4.4%) |
| $25,000 to $34,999 | 21 (9.1%) | 4 (3.5%) |
| $35,000 to $49,999 | 30 (13.0%) | 21 (18.4%) |
| $50,000 to $74,999 | 26 (11.3%) | 13 (11.4%) |
| $75,000 to $99,999 | 44 (19.1%) | 13 (11.4%) |
| $100,000 to $149,999 | 37 (16.1%) | 0 (0.0%) |
| $150,000 or more | 16 (7.0%) | 0 (0.0%) |
| Total | 230 (100.0%) | 114 (100.0%) |
Monthly Housing Cost Tiers in New Holland
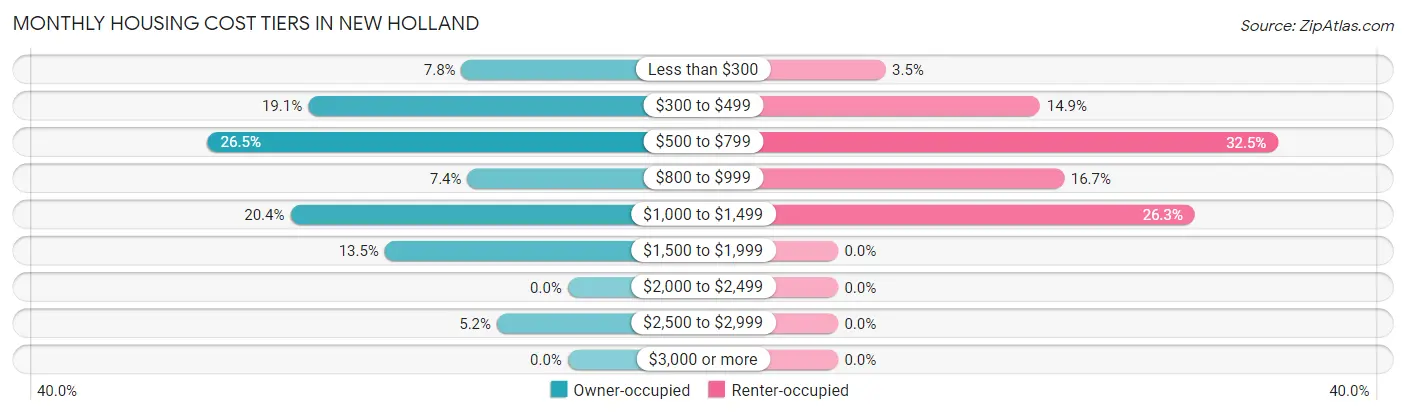
| Monthly Cost | Owner-occupied | Renter-occupied |
| Less than $300 | 18 (7.8%) | 4 (3.5%) |
| $300 to $499 | 44 (19.1%) | 17 (14.9%) |
| $500 to $799 | 61 (26.5%) | 37 (32.5%) |
| $800 to $999 | 17 (7.4%) | 19 (16.7%) |
| $1,000 to $1,499 | 47 (20.4%) | 30 (26.3%) |
| $1,500 to $1,999 | 31 (13.5%) | 0 (0.0%) |
| $2,000 to $2,499 | 0 (0.0%) | 0 (0.0%) |
| $2,500 to $2,999 | 12 (5.2%) | 0 (0.0%) |
| $3,000 or more | 0 (0.0%) | 0 (0.0%) |
| Total | 230 (100.0%) | 114 (100.0%) |
Physical Housing Characteristics in New Holland
Housing Structures in New Holland
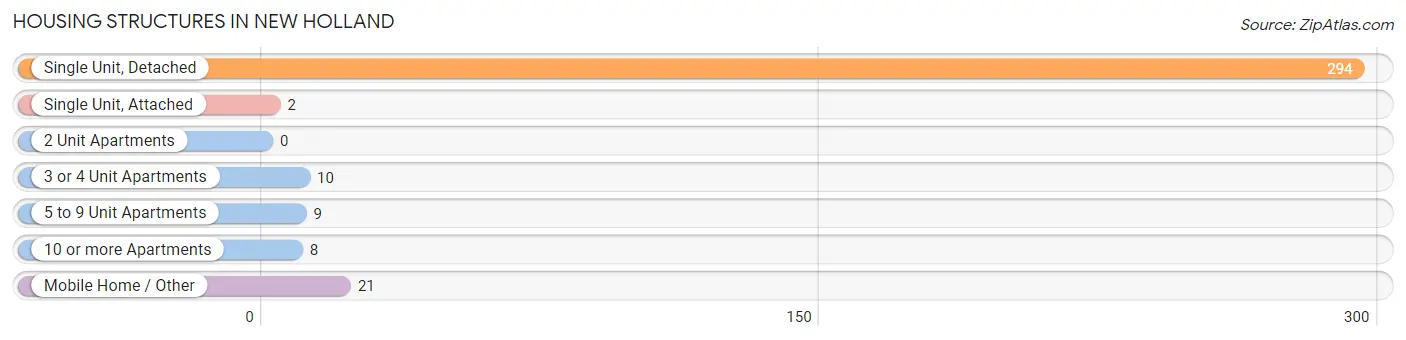
| Structure Type | # Housing Units | % Housing Units |
| Single Unit, Detached | 294 | 85.5% |
| Single Unit, Attached | 2 | 0.6% |
| 2 Unit Apartments | 0 | 0.0% |
| 3 or 4 Unit Apartments | 10 | 2.9% |
| 5 to 9 Unit Apartments | 9 | 2.6% |
| 10 or more Apartments | 8 | 2.3% |
| Mobile Home / Other | 21 | 6.1% |
| Total | 344 | 100.0% |
Housing Structures by Occupancy in New Holland
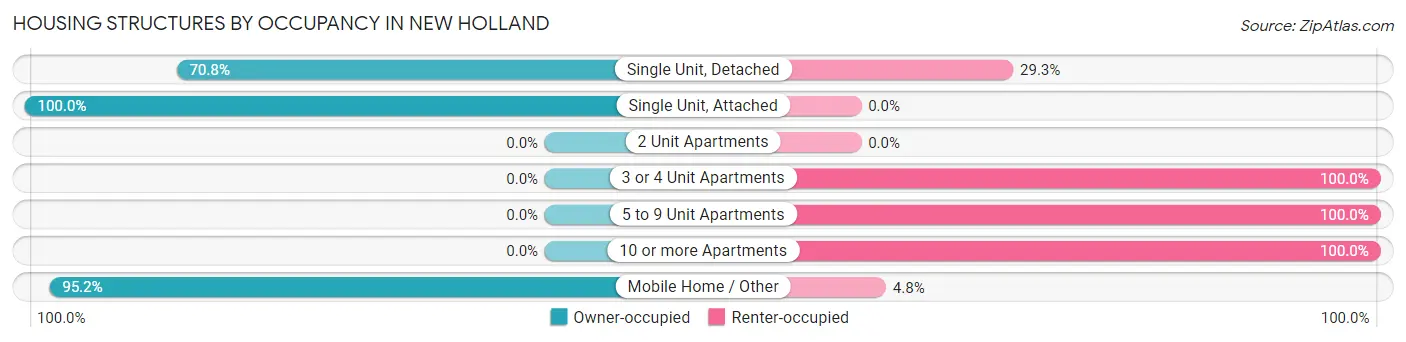
| Structure Type | Owner-occupied | Renter-occupied |
| Single Unit, Detached | 208 (70.8%) | 86 (29.2%) |
| Single Unit, Attached | 2 (100.0%) | 0 (0.0%) |
| 2 Unit Apartments | 0 (0.0%) | 0 (0.0%) |
| 3 or 4 Unit Apartments | 0 (0.0%) | 10 (100.0%) |
| 5 to 9 Unit Apartments | 0 (0.0%) | 9 (100.0%) |
| 10 or more Apartments | 0 (0.0%) | 8 (100.0%) |
| Mobile Home / Other | 20 (95.2%) | 1 (4.8%) |
| Total | 230 (66.9%) | 114 (33.1%) |
Housing Structures by Number of Rooms in New Holland
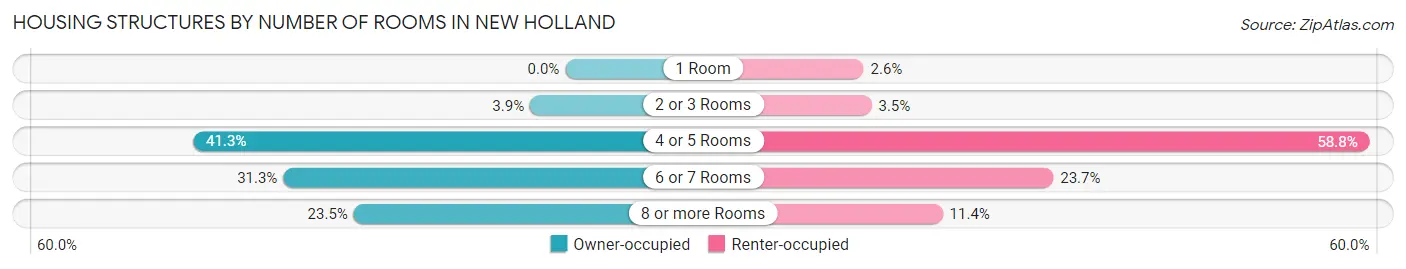
| Number of Rooms | Owner-occupied | Renter-occupied |
| 1 Room | 0 (0.0%) | 3 (2.6%) |
| 2 or 3 Rooms | 9 (3.9%) | 4 (3.5%) |
| 4 or 5 Rooms | 95 (41.3%) | 67 (58.8%) |
| 6 or 7 Rooms | 72 (31.3%) | 27 (23.7%) |
| 8 or more Rooms | 54 (23.5%) | 13 (11.4%) |
| Total | 230 (100.0%) | 114 (100.0%) |
Housing Structure by Heating Type in New Holland
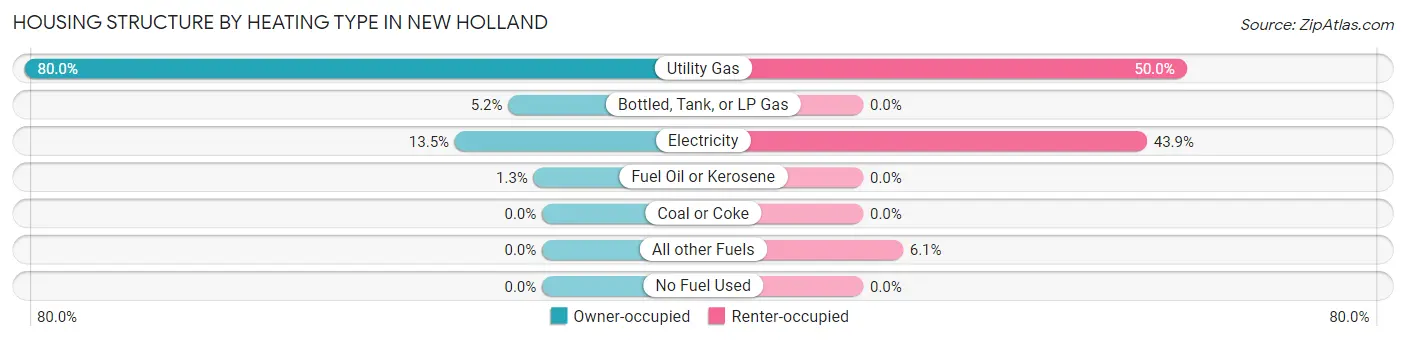
| Heating Type | Owner-occupied | Renter-occupied |
| Utility Gas | 184 (80.0%) | 57 (50.0%) |
| Bottled, Tank, or LP Gas | 12 (5.2%) | 0 (0.0%) |
| Electricity | 31 (13.5%) | 50 (43.9%) |
| Fuel Oil or Kerosene | 3 (1.3%) | 0 (0.0%) |
| Coal or Coke | 0 (0.0%) | 0 (0.0%) |
| All other Fuels | 0 (0.0%) | 7 (6.1%) |
| No Fuel Used | 0 (0.0%) | 0 (0.0%) |
| Total | 230 (100.0%) | 114 (100.0%) |
Household Vehicle Usage in New Holland
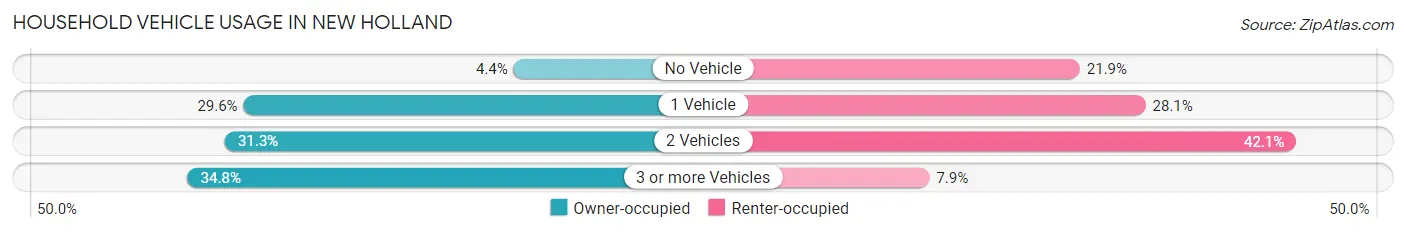
| Vehicles per Household | Owner-occupied | Renter-occupied |
| No Vehicle | 10 (4.3%) | 25 (21.9%) |
| 1 Vehicle | 68 (29.6%) | 32 (28.1%) |
| 2 Vehicles | 72 (31.3%) | 48 (42.1%) |
| 3 or more Vehicles | 80 (34.8%) | 9 (7.9%) |
| Total | 230 (100.0%) | 114 (100.0%) |
Real Estate & Mortgages in New Holland
Real Estate and Mortgage Overview in New Holland
| Characteristic | Without Mortgage | With Mortgage |
| Housing Units | 106 | 124 |
| Median Property Value | $108,300 | $131,800 |
| Median Household Income | $48,750 | $10 |
| Monthly Housing Costs | $471 | $0 |
| Real Estate Taxes | $1,356 | $4 |
Property Value by Mortgage Status in New Holland
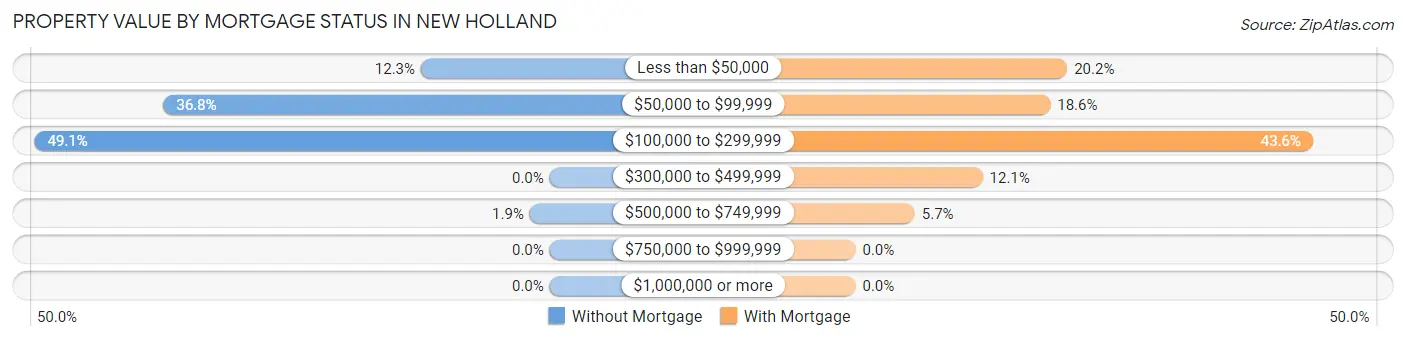
| Property Value | Without Mortgage | With Mortgage |
| Less than $50,000 | 13 (12.3%) | 25 (20.2%) |
| $50,000 to $99,999 | 39 (36.8%) | 23 (18.5%) |
| $100,000 to $299,999 | 52 (49.1%) | 54 (43.5%) |
| $300,000 to $499,999 | 0 (0.0%) | 15 (12.1%) |
| $500,000 to $749,999 | 2 (1.9%) | 7 (5.7%) |
| $750,000 to $999,999 | 0 (0.0%) | 0 (0.0%) |
| $1,000,000 or more | 0 (0.0%) | 0 (0.0%) |
| Total | 106 (100.0%) | 124 (100.0%) |
Household Income by Mortgage Status in New Holland
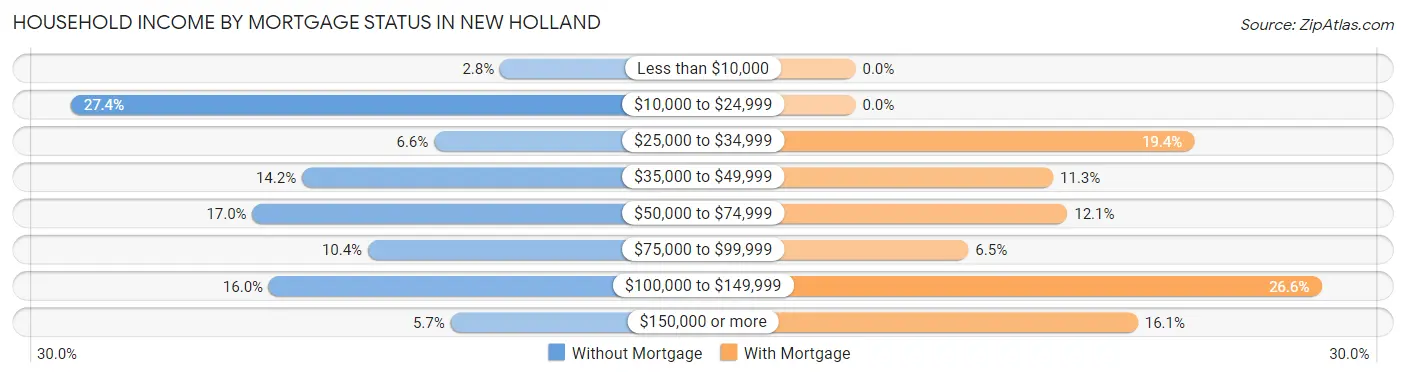
| Household Income | Without Mortgage | With Mortgage |
| Less than $10,000 | 3 (2.8%) | 0 (0.0%) |
| $10,000 to $24,999 | 29 (27.4%) | 0 (0.0%) |
| $25,000 to $34,999 | 7 (6.6%) | 24 (19.4%) |
| $35,000 to $49,999 | 15 (14.1%) | 14 (11.3%) |
| $50,000 to $74,999 | 18 (17.0%) | 15 (12.1%) |
| $75,000 to $99,999 | 11 (10.4%) | 8 (6.5%) |
| $100,000 to $149,999 | 17 (16.0%) | 33 (26.6%) |
| $150,000 or more | 6 (5.7%) | 20 (16.1%) |
| Total | 106 (100.0%) | 124 (100.0%) |
Property Value to Household Income Ratio in New Holland
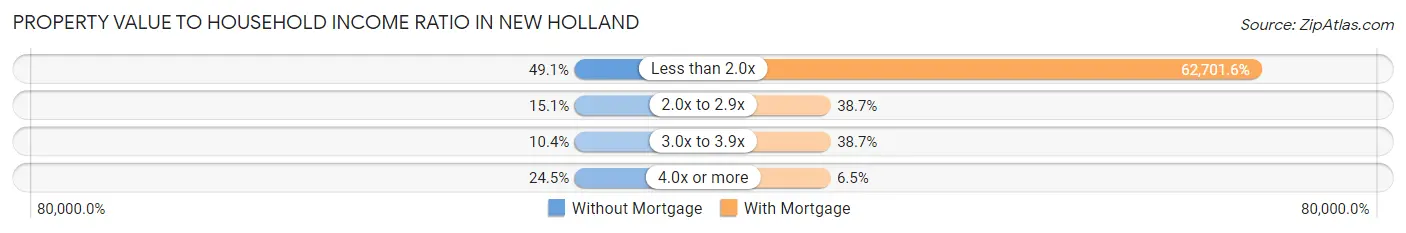
| Value-to-Income Ratio | Without Mortgage | With Mortgage |
| Less than 2.0x | 52 (49.1%) | 77,750 (62,701.6%) |
| 2.0x to 2.9x | 16 (15.1%) | 48 (38.7%) |
| 3.0x to 3.9x | 11 (10.4%) | 48 (38.7%) |
| 4.0x or more | 26 (24.5%) | 8 (6.5%) |
| Total | 106 (100.0%) | 124 (100.0%) |
Real Estate Taxes by Mortgage Status in New Holland

| Property Taxes | Without Mortgage | With Mortgage |
| Less than $800 | 27 (25.5%) | 0 (0.0%) |
| $800 to $1,499 | 31 (29.2%) | 39 (31.5%) |
| $800 to $1,499 | 43 (40.6%) | 18 (14.5%) |
| Total | 106 (100.0%) | 124 (100.0%) |
Health & Disability in New Holland
Health Insurance Coverage by Age in New Holland
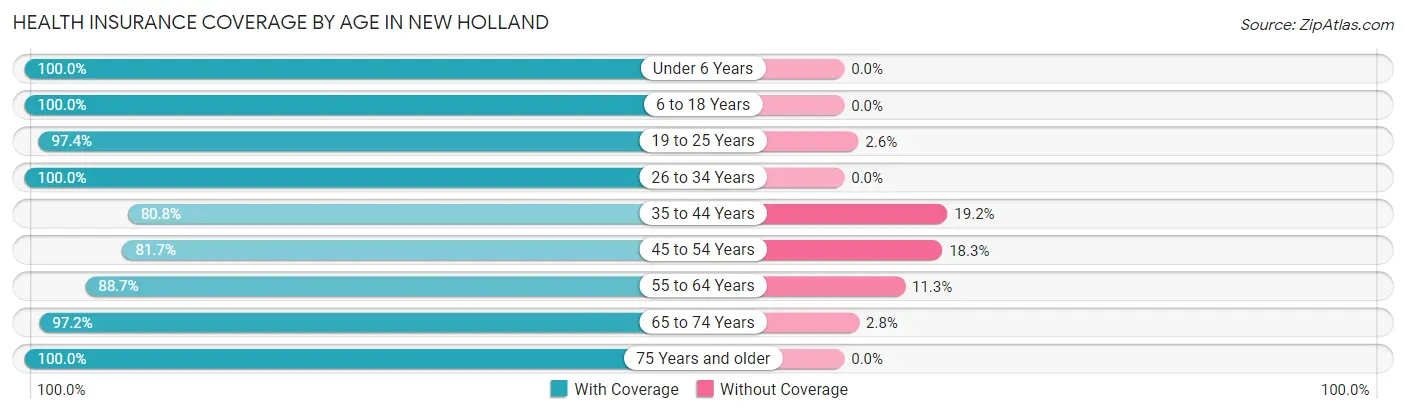
| Age Bracket | With Coverage | Without Coverage |
| Under 6 Years | 131 (100.0%) | 0 (0.0%) |
| 6 to 18 Years | 108 (100.0%) | 0 (0.0%) |
| 19 to 25 Years | 74 (97.4%) | 2 (2.6%) |
| 26 to 34 Years | 103 (100.0%) | 0 (0.0%) |
| 35 to 44 Years | 63 (80.8%) | 15 (19.2%) |
| 45 to 54 Years | 94 (81.7%) | 21 (18.3%) |
| 55 to 64 Years | 94 (88.7%) | 12 (11.3%) |
| 65 to 74 Years | 141 (97.2%) | 4 (2.8%) |
| 75 Years and older | 47 (100.0%) | 0 (0.0%) |
| Total | 855 (94.1%) | 54 (5.9%) |
Health Insurance Coverage by Citizenship Status in New Holland

| Citizenship Status | With Coverage | Without Coverage |
| Native Born | 131 (100.0%) | 0 (0.0%) |
| Foreign Born, Citizen | 108 (100.0%) | 0 (0.0%) |
| Foreign Born, not a Citizen | 74 (97.4%) | 2 (2.6%) |
Health Insurance Coverage by Household Income in New Holland
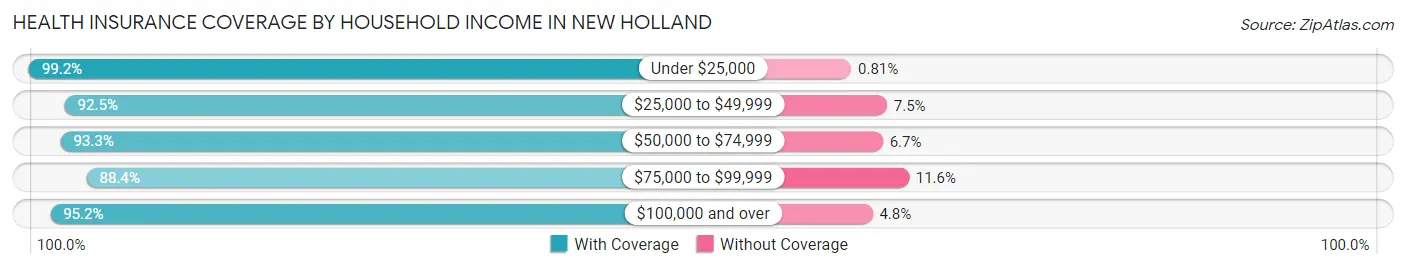
| Household Income | With Coverage | Without Coverage |
| Under $25,000 | 245 (99.2%) | 2 (0.8%) |
| $25,000 to $49,999 | 160 (92.5%) | 13 (7.5%) |
| $50,000 to $74,999 | 97 (93.3%) | 7 (6.7%) |
| $75,000 to $99,999 | 175 (88.4%) | 23 (11.6%) |
| $100,000 and over | 178 (95.2%) | 9 (4.8%) |
Public vs Private Health Insurance Coverage by Age in New Holland
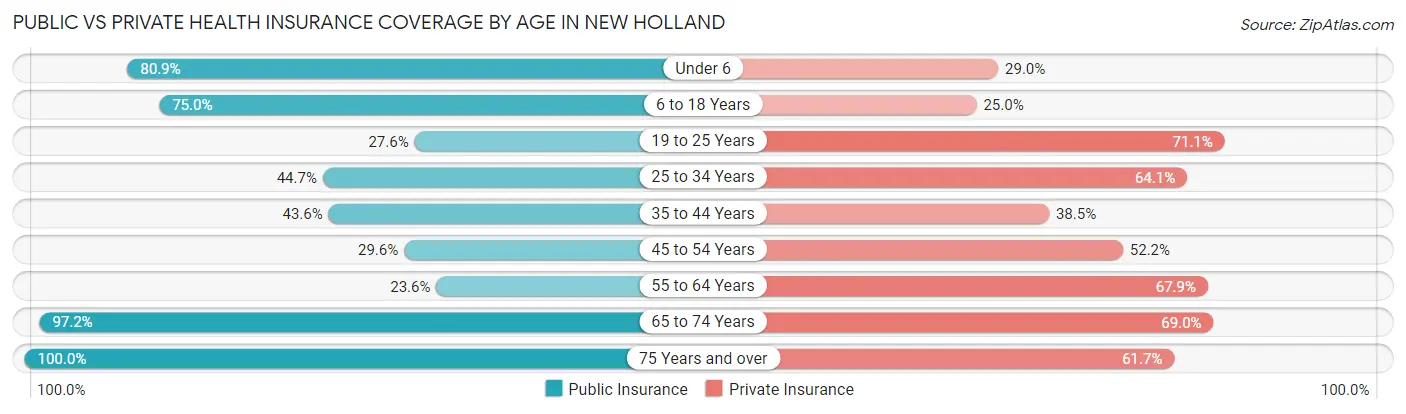
| Age Bracket | Public Insurance | Private Insurance |
| Under 6 | 106 (80.9%) | 38 (29.0%) |
| 6 to 18 Years | 81 (75.0%) | 27 (25.0%) |
| 19 to 25 Years | 21 (27.6%) | 54 (71.1%) |
| 25 to 34 Years | 46 (44.7%) | 66 (64.1%) |
| 35 to 44 Years | 34 (43.6%) | 30 (38.5%) |
| 45 to 54 Years | 34 (29.6%) | 60 (52.2%) |
| 55 to 64 Years | 25 (23.6%) | 72 (67.9%) |
| 65 to 74 Years | 141 (97.2%) | 100 (69.0%) |
| 75 Years and over | 47 (100.0%) | 29 (61.7%) |
| Total | 535 (58.9%) | 476 (52.4%) |
Disability Status by Sex by Age in New Holland
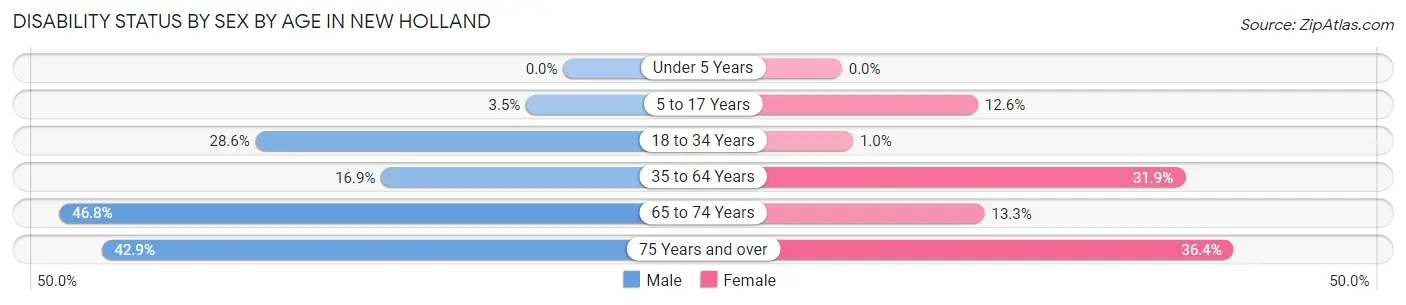
| Age Bracket | Male | Female |
| Under 5 Years | 0 (0.0%) | 0 (0.0%) |
| 5 to 17 Years | 1 (3.5%) | 11 (12.6%) |
| 18 to 34 Years | 26 (28.6%) | 1 (1.0%) |
| 35 to 64 Years | 24 (16.9%) | 50 (31.9%) |
| 65 to 74 Years | 29 (46.8%) | 11 (13.3%) |
| 75 Years and over | 6 (42.9%) | 12 (36.4%) |
Disability Class by Sex by Age in New Holland
Disability Class: Hearing Difficulty
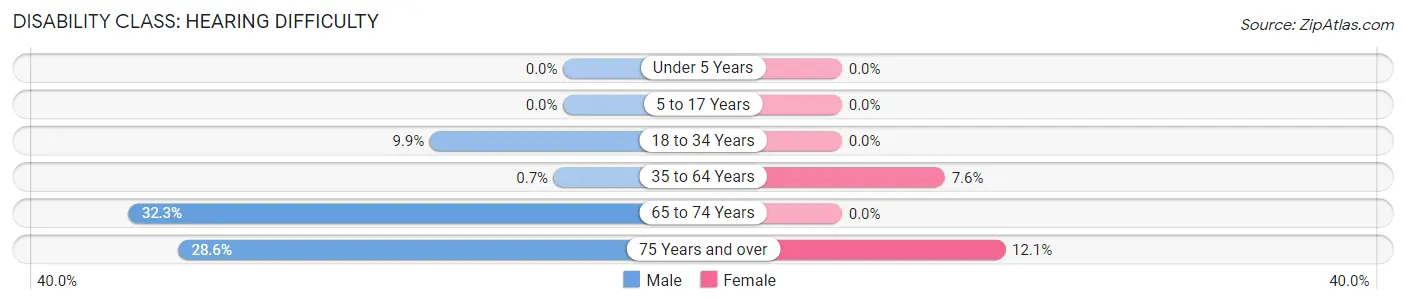
| Age Bracket | Male | Female |
| Under 5 Years | 0 (0.0%) | 0 (0.0%) |
| 5 to 17 Years | 0 (0.0%) | 0 (0.0%) |
| 18 to 34 Years | 9 (9.9%) | 0 (0.0%) |
| 35 to 64 Years | 1 (0.7%) | 12 (7.6%) |
| 65 to 74 Years | 20 (32.3%) | 0 (0.0%) |
| 75 Years and over | 4 (28.6%) | 4 (12.1%) |
Disability Class: Vision Difficulty
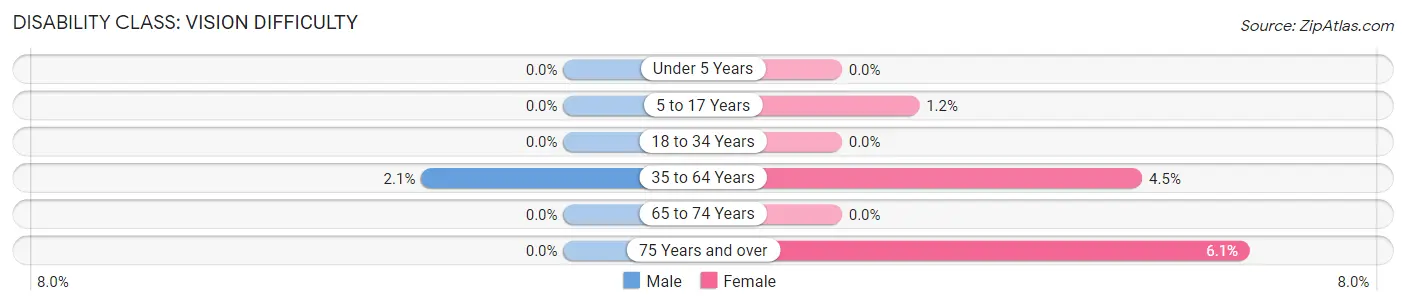
| Age Bracket | Male | Female |
| Under 5 Years | 0 (0.0%) | 0 (0.0%) |
| 5 to 17 Years | 0 (0.0%) | 1 (1.1%) |
| 18 to 34 Years | 0 (0.0%) | 0 (0.0%) |
| 35 to 64 Years | 3 (2.1%) | 7 (4.5%) |
| 65 to 74 Years | 0 (0.0%) | 0 (0.0%) |
| 75 Years and over | 0 (0.0%) | 2 (6.1%) |
Disability Class: Cognitive Difficulty
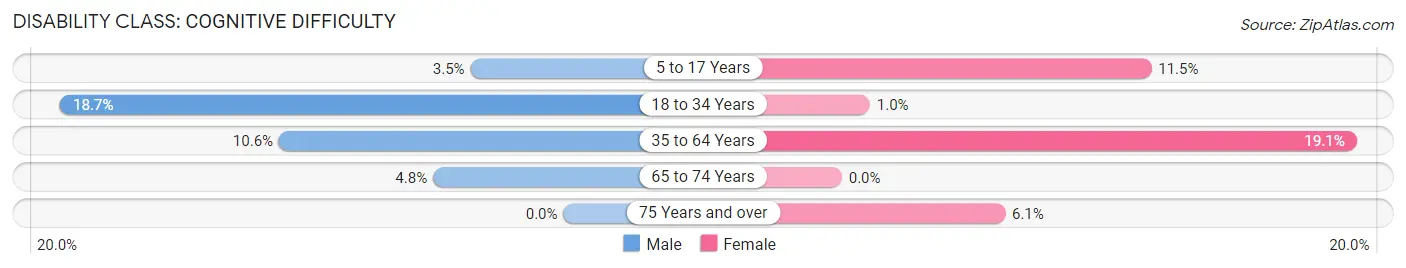
| Age Bracket | Male | Female |
| 5 to 17 Years | 1 (3.5%) | 10 (11.5%) |
| 18 to 34 Years | 17 (18.7%) | 1 (1.0%) |
| 35 to 64 Years | 15 (10.6%) | 30 (19.1%) |
| 65 to 74 Years | 3 (4.8%) | 0 (0.0%) |
| 75 Years and over | 0 (0.0%) | 2 (6.1%) |
Disability Class: Ambulatory Difficulty
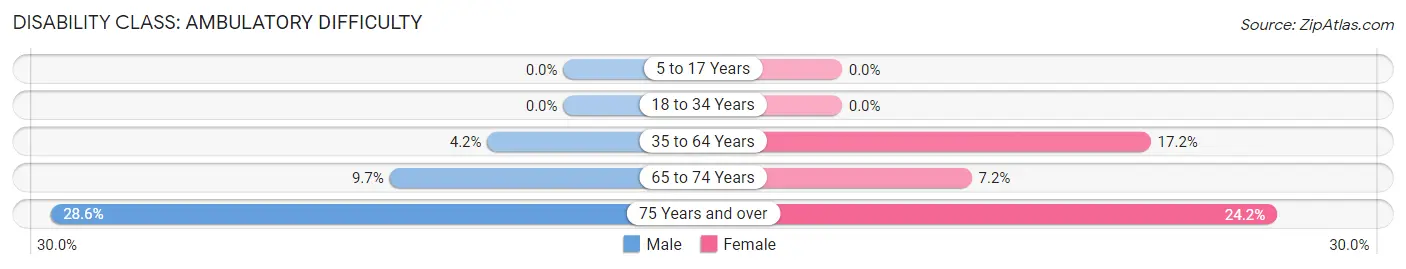
| Age Bracket | Male | Female |
| 5 to 17 Years | 0 (0.0%) | 0 (0.0%) |
| 18 to 34 Years | 0 (0.0%) | 0 (0.0%) |
| 35 to 64 Years | 6 (4.2%) | 27 (17.2%) |
| 65 to 74 Years | 6 (9.7%) | 6 (7.2%) |
| 75 Years and over | 4 (28.6%) | 8 (24.2%) |
Disability Class: Self-Care Difficulty
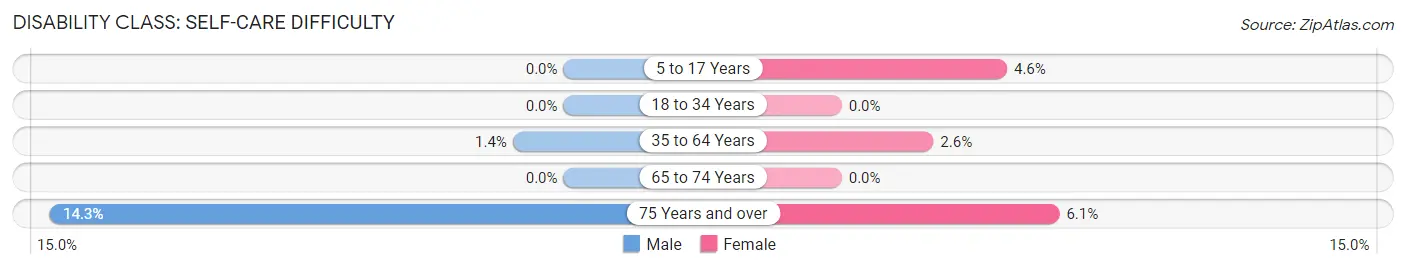
| Age Bracket | Male | Female |
| 5 to 17 Years | 0 (0.0%) | 4 (4.6%) |
| 18 to 34 Years | 0 (0.0%) | 0 (0.0%) |
| 35 to 64 Years | 2 (1.4%) | 4 (2.5%) |
| 65 to 74 Years | 0 (0.0%) | 0 (0.0%) |
| 75 Years and over | 2 (14.3%) | 2 (6.1%) |
Technology Access in New Holland
Computing Device Access in New Holland
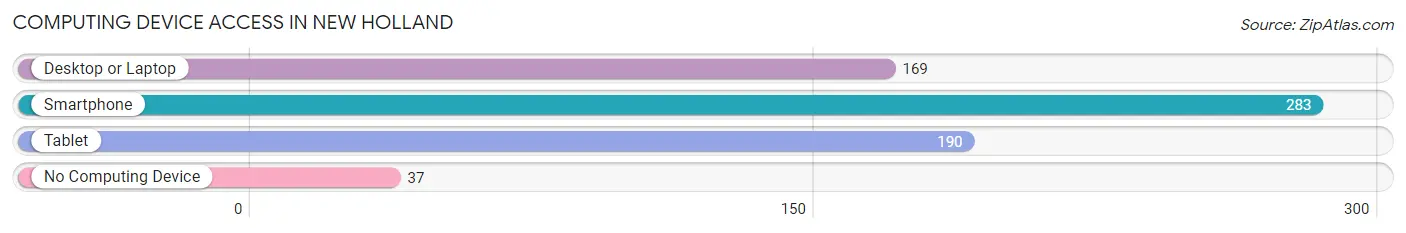
| Device Type | # Households | % Households |
| Desktop or Laptop | 169 | 49.1% |
| Smartphone | 283 | 82.3% |
| Tablet | 190 | 55.2% |
| No Computing Device | 37 | 10.8% |
| Total | 344 | 100.0% |
Internet Access in New Holland
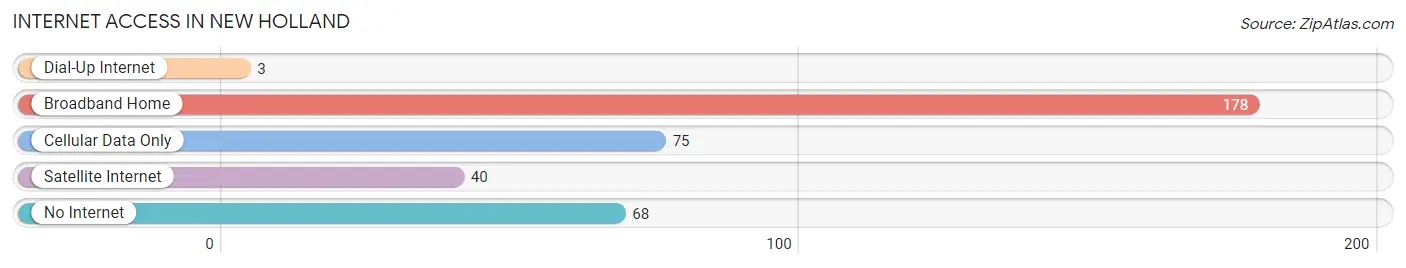
| Internet Type | # Households | % Households |
| Dial-Up Internet | 3 | 0.9% |
| Broadband Home | 178 | 51.7% |
| Cellular Data Only | 75 | 21.8% |
| Satellite Internet | 40 | 11.6% |
| No Internet | 68 | 19.8% |
| Total | 344 | 100.0% |
New Holland Summary
New Holland is a small village located in Pickaway County, Ohio. It is situated on the banks of the Scioto River, approximately 25 miles south of Columbus. The village has a population of approximately 1,000 people and is part of the Circleville Micropolitan Statistical Area.
History
New Holland was founded in 1817 by a group of settlers from Pennsylvania. The village was named after the Dutch province of Holland, which was the homeland of many of the settlers. The village was originally known as “New Holland Station”, as it was a stop on the Scioto and Hocking Valley Railroad. The railroad was built in 1851 and connected New Holland to Columbus.
The village was incorporated in 1867 and the first mayor was elected in 1868. The village was a thriving agricultural community and was known for its production of wheat, corn, and other grains. The village also had a number of mills, including a flour mill, a saw mill, and a grist mill.
In the late 19th century, the village began to experience a decline in population due to the decline of the railroad industry. The village was also affected by the Great Depression and World War II. The population of the village decreased from 1,500 in 1900 to just over 1,000 in 2000.
Geography
New Holland is located in Pickaway County, Ohio. It is situated on the banks of the Scioto River, approximately 25 miles south of Columbus. The village is located in the Scioto Valley, which is a region of rolling hills and fertile farmland. The village is surrounded by the towns of Circleville, Ashville, and Williamsport.
The village has a total area of 0.7 square miles, all of which is land. The village is located at an elevation of 845 feet above sea level. The climate in New Holland is classified as humid continental, with hot summers and cold winters.
Economy
The economy of New Holland is largely based on agriculture. The village is home to several farms, which produce a variety of crops, including corn, wheat, soybeans, and hay. The village also has a number of small businesses, including a grocery store, a hardware store, and a restaurant.
The village is also home to a number of manufacturing companies, including a plastics manufacturer and a metal fabrication company. The village is also home to a number of service-based businesses, including a bank, a post office, and a library.
Demographics
As of the 2010 census, the population of New Holland was 1,039. The racial makeup of the village was 97.3% White, 0.7% African American, 0.3% Native American, 0.2% Asian, and 1.5% from other races. The median household income was $41,250 and the median family income was $50,000.
The village is served by the Circleville City School District. The village is home to one elementary school, one middle school, and one high school. The village is also home to a number of churches, including the New Holland United Methodist Church, the New Holland Presbyterian Church, and the New Holland Baptist Church.
Conclusion
New Holland is a small village located in Pickaway County, Ohio. It is situated on the banks of the Scioto River, approximately 25 miles south of Columbus. The village has a population of approximately 1,000 people and is part of the Circleville Micropolitan Statistical Area. The economy of the village is largely based on agriculture and manufacturing, and the village is served by the Circleville City School District. New Holland is a small but vibrant community with a rich history and a bright future.
Common Questions
What is Per Capita Income in New Holland?
Per Capita income in New Holland is $22,495.
What is the Median Family Income in New Holland?
Median Family Income in New Holland is $52,188.
What is the Median Household income in New Holland?
Median Household Income in New Holland is $44,167.
What is Income or Wage Gap in New Holland?
Income or Wage Gap in New Holland is 34.7%.
Women in New Holland earn 65.3 cents for every dollar earned by a man.
What is Inequality or Gini Index in New Holland?
Inequality or Gini Index in New Holland is 0.48.
What is the Total Population of New Holland?
Total Population of New Holland is 909.
What is the Total Male Population of New Holland?
Total Male Population of New Holland is 396.
What is the Total Female Population of New Holland?
Total Female Population of New Holland is 513.
What is the Ratio of Males per 100 Females in New Holland?
There are 77.19 Males per 100 Females in New Holland.
What is the Ratio of Females per 100 Males in New Holland?
There are 129.55 Females per 100 Males in New Holland.
What is the Median Population Age in New Holland?
Median Population Age in New Holland is 40.4 Years.
What is the Average Family Size in New Holland
Average Family Size in New Holland is 3.2 People.
What is the Average Household Size in New Holland
Average Household Size in New Holland is 2.6 People.
How Large is the Labor Force in New Holland?
There are 336 People in the Labor Forcein in New Holland.
What is the Percentage of People in the Labor Force in New Holland?
49.1% of People are in the Labor Force in New Holland.
What is the Unemployment Rate in New Holland?
Unemployment Rate in New Holland is 4.5%.