Napoleon, OH Map & Demographics
Napoleon Map
Napoleon Overview
$34,132
PER CAPITA INCOME
$71,154
AVG FAMILY INCOME
$59,414
AVG HOUSEHOLD INCOME
19.0%
WAGE / INCOME GAP [ % ]
81.0¢/ $1
WAGE / INCOME GAP [ $ ]
0.46
INEQUALITY / GINI INDEX
8,888
TOTAL POPULATION
4,277
MALE POPULATION
4,611
FEMALE POPULATION
92.76
MALES / 100 FEMALES
107.81
FEMALES / 100 MALES
39.4
MEDIAN AGE
3.0
AVG FAMILY SIZE
2.3
AVG HOUSEHOLD SIZE
4,295
LABOR FORCE [ PEOPLE ]
63.3%
PERCENT IN LABOR FORCE
2.8%
UNEMPLOYMENT RATE
Napoleon Zip Codes
Income in Napoleon
Income Overview in Napoleon
Per Capita Income in Napoleon is $34,132, while median incomes of families and households are $71,154 and $59,414 respectively.
| Characteristic | Number | Measure |
| Per Capita Income | 8,888 | $34,132 |
| Median Family Income | 2,274 | $71,154 |
| Mean Family Income | 2,274 | $81,015 |
| Median Household Income | 3,751 | $59,414 |
| Mean Household Income | 3,751 | $80,116 |
| Income Deficit | 2,274 | $0 |
| Wage / Income Gap (%) | 8,888 | 19.02% |
| Wage / Income Gap ($) | 8,888 | 80.98¢ per $1 |
| Gini / Inequality Index | 8,888 | 0.46 |
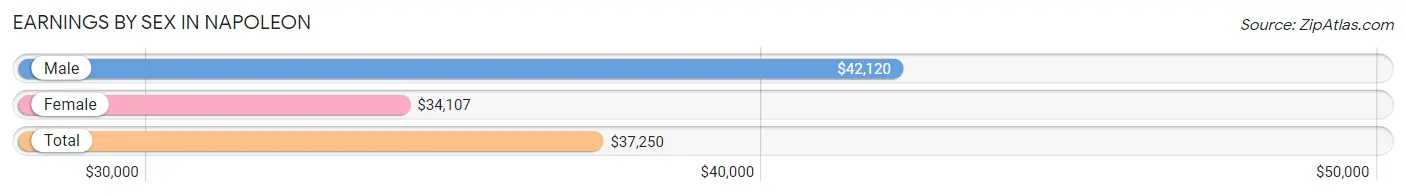
Earnings by Sex in Napoleon
Average Earnings in Napoleon are $37,250, $42,120 for men and $34,107 for women, a difference of 19.0%.
| Sex | Number | Average Earnings |
| Male | 2,270 (49.6%) | $42,120 |
| Female | 2,305 (50.4%) | $34,107 |
| Total | 4,575 (100.0%) | $37,250 |
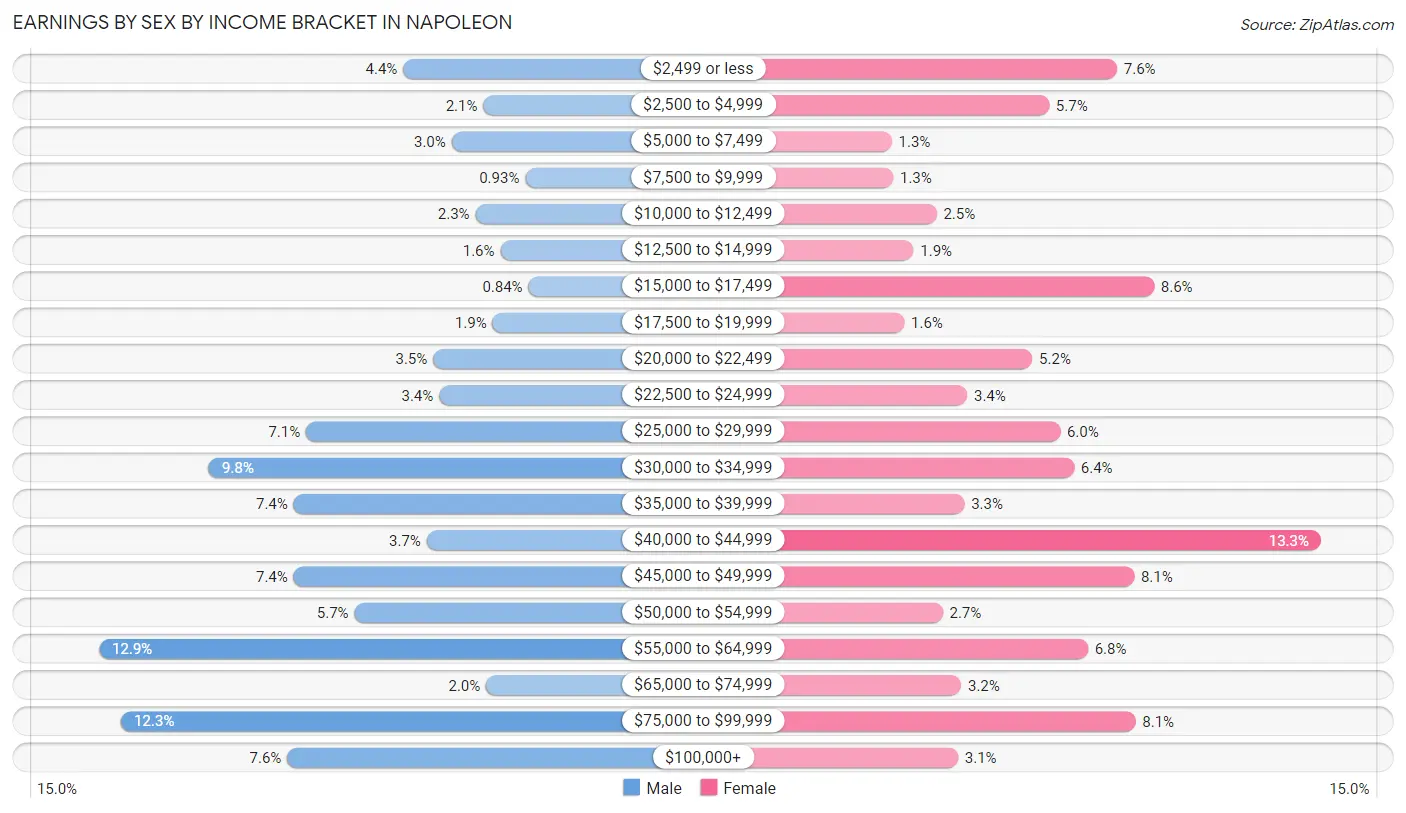
Earnings by Sex by Income Bracket in Napoleon
The most common earnings brackets in Napoleon are $55,000 to $64,999 for men (293 | 12.9%) and $40,000 to $44,999 for women (307 | 13.3%).
| Income | Male | Female |
| $2,499 or less | 99 (4.4%) | 175 (7.6%) |
| $2,500 to $4,999 | 48 (2.1%) | 131 (5.7%) |
| $5,000 to $7,499 | 68 (3.0%) | 29 (1.3%) |
| $7,500 to $9,999 | 21 (0.9%) | 30 (1.3%) |
| $10,000 to $12,499 | 53 (2.3%) | 58 (2.5%) |
| $12,500 to $14,999 | 37 (1.6%) | 43 (1.9%) |
| $15,000 to $17,499 | 19 (0.8%) | 199 (8.6%) |
| $17,500 to $19,999 | 42 (1.8%) | 37 (1.6%) |
| $20,000 to $22,499 | 80 (3.5%) | 120 (5.2%) |
| $22,500 to $24,999 | 76 (3.4%) | 78 (3.4%) |
| $25,000 to $29,999 | 161 (7.1%) | 138 (6.0%) |
| $30,000 to $34,999 | 223 (9.8%) | 147 (6.4%) |
| $35,000 to $39,999 | 169 (7.4%) | 76 (3.3%) |
| $40,000 to $44,999 | 84 (3.7%) | 307 (13.3%) |
| $45,000 to $49,999 | 169 (7.4%) | 186 (8.1%) |
| $50,000 to $54,999 | 130 (5.7%) | 62 (2.7%) |
| $55,000 to $64,999 | 293 (12.9%) | 156 (6.8%) |
| $65,000 to $74,999 | 46 (2.0%) | 74 (3.2%) |
| $75,000 to $99,999 | 279 (12.3%) | 187 (8.1%) |
| $100,000+ | 173 (7.6%) | 72 (3.1%) |
| Total | 2,270 (100.0%) | 2,305 (100.0%) |
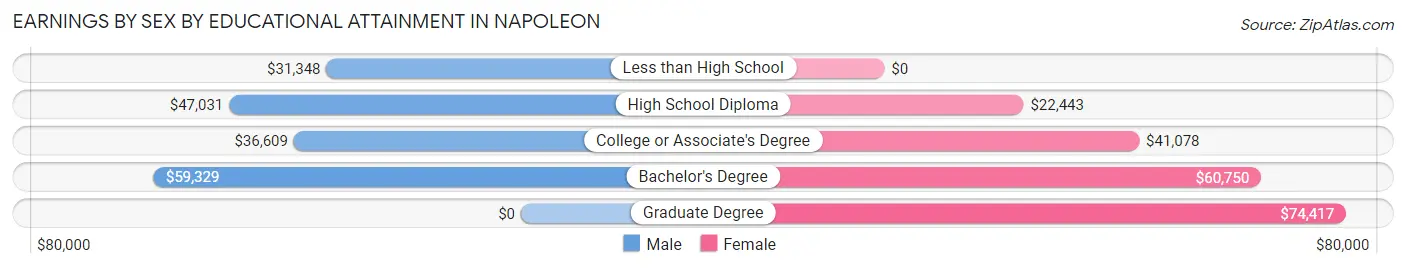
Earnings by Sex by Educational Attainment in Napoleon
Average earnings in Napoleon are $45,545 for men and $40,511 for women, a difference of 11.1%. Men with an educational attainment of bachelor's degree enjoy the highest average annual earnings of $59,329, while those with less than high school education earn the least with $31,348. Women with an educational attainment of graduate degree earn the most with the average annual earnings of $74,417, while those with high school diploma education have the smallest earnings of $22,443.
| Educational Attainment | Male Income | Female Income |
| Less than High School | $31,348 | $0 |
| High School Diploma | $47,031 | $22,443 |
| College or Associate's Degree | $36,609 | $41,078 |
| Bachelor's Degree | $59,329 | $60,750 |
| Graduate Degree | - | - |
| Total | $45,545 | $40,511 |
Family Income in Napoleon
Family Income Brackets in Napoleon
According to the Napoleon family income data, there are 589 families falling into the $100,000 to $149,999 income range, which is the most common income bracket and makes up 25.9% of all families. Conversely, the $10,000 to $14,999 income bracket is the least frequent group with only 7 families (0.3%) belonging to this category.
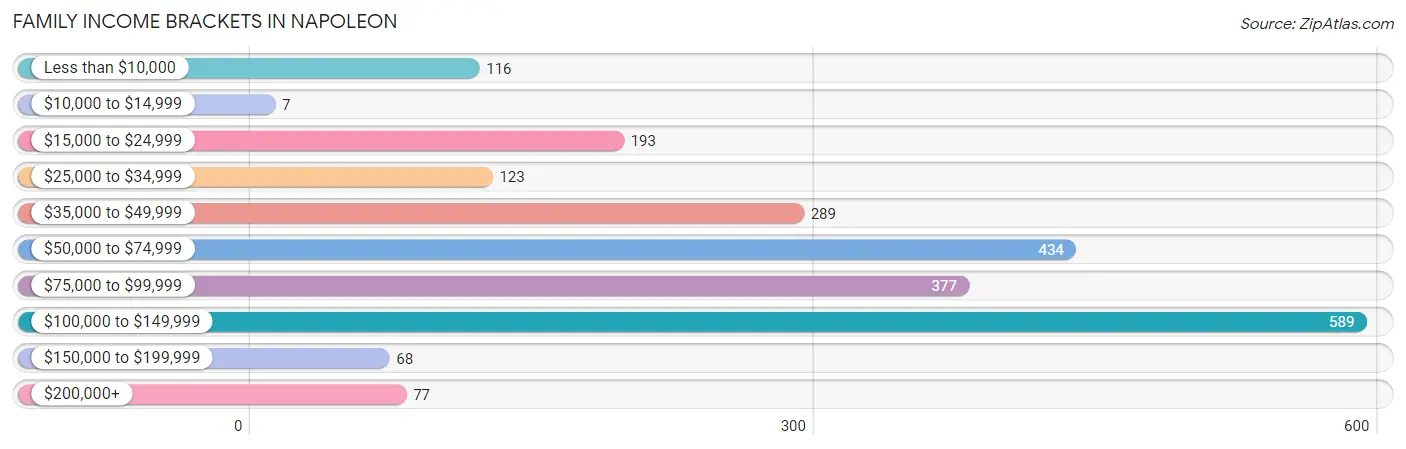
| Income Bracket | # Families | % Families |
| Less than $10,000 | 116 | 5.1% |
| $10,000 to $14,999 | 7 | 0.3% |
| $15,000 to $24,999 | 193 | 8.5% |
| $25,000 to $34,999 | 123 | 5.4% |
| $35,000 to $49,999 | 289 | 12.7% |
| $50,000 to $74,999 | 434 | 19.1% |
| $75,000 to $99,999 | 377 | 16.6% |
| $100,000 to $149,999 | 589 | 25.9% |
| $150,000 to $199,999 | 68 | 3.0% |
| $200,000+ | 77 | 3.4% |
Family Income by Famaliy Size in Napoleon
6-person families (103 | 4.5%) account for the highest median family income in Napoleon with $137,750 per family, while 2-person families (1,107 | 48.7%) have the highest median income of $31,953 per family member.
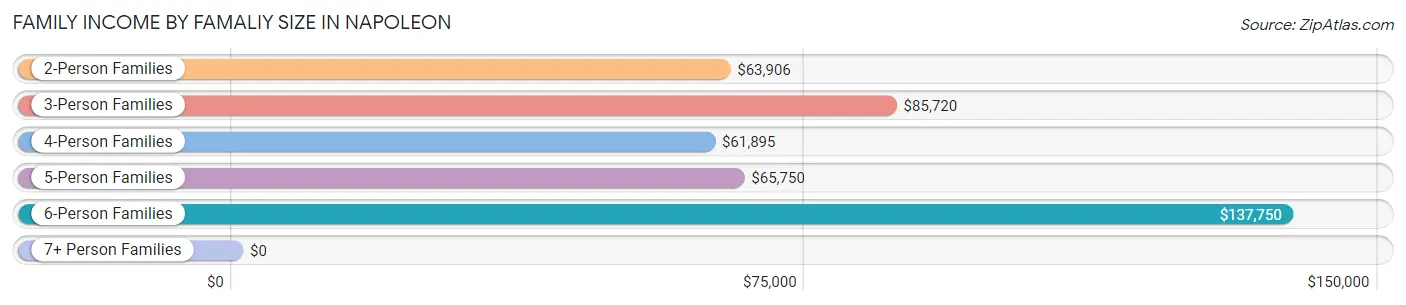
| Income Bracket | # Families | Median Income |
| 2-Person Families | 1,107 (48.7%) | $63,906 |
| 3-Person Families | 429 (18.9%) | $85,720 |
| 4-Person Families | 403 (17.7%) | $61,895 |
| 5-Person Families | 200 (8.8%) | $65,750 |
| 6-Person Families | 103 (4.5%) | $137,750 |
| 7+ Person Families | 32 (1.4%) | $0 |
| Total | 2,274 (100.0%) | $71,154 |
Family Income by Number of Earners in Napoleon
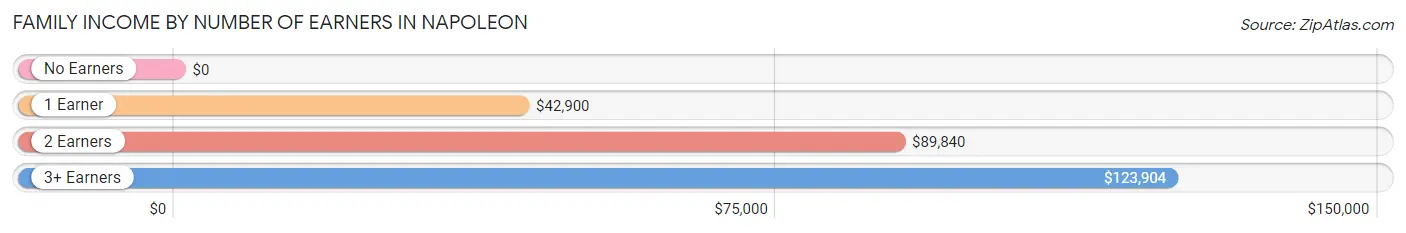
| Number of Earners | # Families | Median Income |
| No Earners | 285 (12.5%) | $0 |
| 1 Earner | 694 (30.5%) | $42,900 |
| 2 Earners | 1,043 (45.9%) | $89,840 |
| 3+ Earners | 252 (11.1%) | $123,904 |
| Total | 2,274 (100.0%) | $71,154 |
Household Income in Napoleon
Household Income Brackets in Napoleon
With 686 households falling in the category, the $100,000 to $149,999 income range is the most frequent in Napoleon, accounting for 18.3% of all households. In contrast, only 75 households (2.0%) fall into the $150,000 to $199,999 income bracket, making it the least populous group.
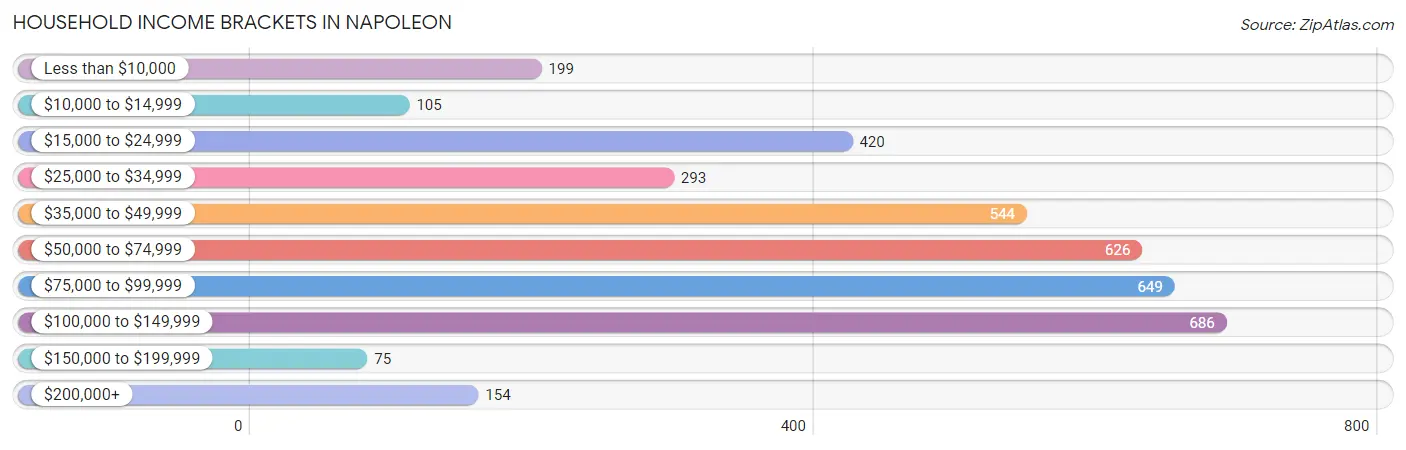
| Income Bracket | # Households | % Households |
| Less than $10,000 | 199 | 5.3% |
| $10,000 to $14,999 | 105 | 2.8% |
| $15,000 to $24,999 | 420 | 11.2% |
| $25,000 to $34,999 | 293 | 7.8% |
| $35,000 to $49,999 | 544 | 14.5% |
| $50,000 to $74,999 | 626 | 16.7% |
| $75,000 to $99,999 | 649 | 17.3% |
| $100,000 to $149,999 | 686 | 18.3% |
| $150,000 to $199,999 | 75 | 2.0% |
| $200,000+ | 154 | 4.1% |
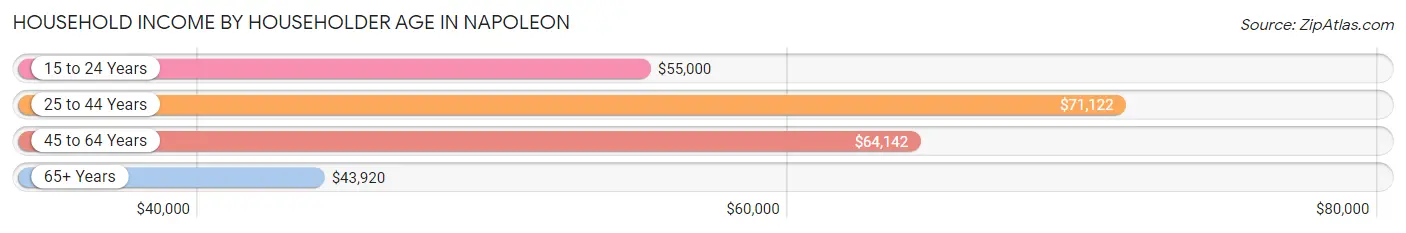
Household Income by Householder Age in Napoleon
The median household income in Napoleon is $59,414, with the highest median household income of $71,122 found in the 25 to 44 years age bracket for the primary householder. A total of 1,238 households (33.0%) fall into this category. Meanwhile, the 65+ years age bracket for the primary householder has the lowest median household income of $43,920, with 1,000 households (26.7%) in this group.
| Income Bracket | # Households | Median Income |
| 15 to 24 Years | 110 (2.9%) | $55,000 |
| 25 to 44 Years | 1,238 (33.0%) | $71,122 |
| 45 to 64 Years | 1,403 (37.4%) | $64,142 |
| 65+ Years | 1,000 (26.7%) | $43,920 |
| Total | 3,751 (100.0%) | $59,414 |
Poverty in Napoleon
Income Below Poverty by Sex and Age in Napoleon
With 10.9% poverty level for males and 15.4% for females among the residents of Napoleon, 5 year old males and 12 to 14 year old females are the most vulnerable to poverty, with 36 males (100.0%) and 122 females (60.4%) in their respective age groups living below the poverty level.
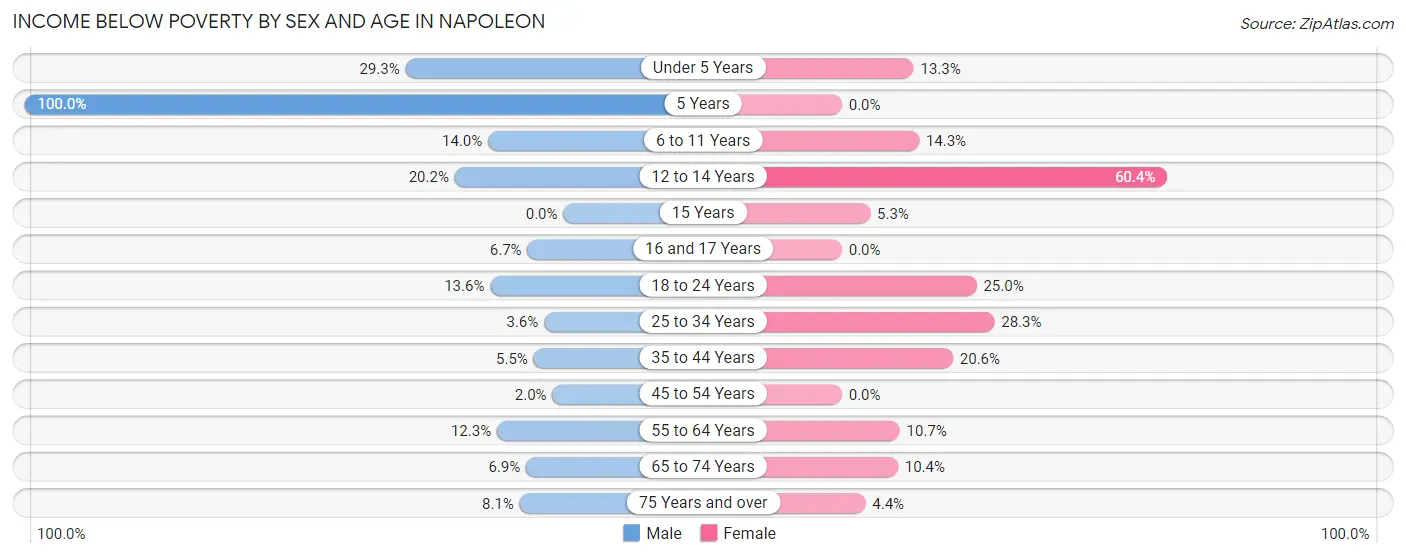
| Age Bracket | Male | Female |
| Under 5 Years | 104 (29.3%) | 49 (13.3%) |
| 5 Years | 36 (100.0%) | 0 (0.0%) |
| 6 to 11 Years | 51 (14.0%) | 55 (14.3%) |
| 12 to 14 Years | 52 (20.2%) | 122 (60.4%) |
| 15 Years | 0 (0.0%) | 2 (5.3%) |
| 16 and 17 Years | 12 (6.7%) | 0 (0.0%) |
| 18 to 24 Years | 35 (13.6%) | 71 (25.0%) |
| 25 to 34 Years | 21 (3.6%) | 150 (28.3%) |
| 35 to 44 Years | 23 (5.5%) | 120 (20.6%) |
| 45 to 54 Years | 11 (2.0%) | 0 (0.0%) |
| 55 to 64 Years | 70 (12.3%) | 58 (10.7%) |
| 65 to 74 Years | 23 (6.9%) | 45 (10.4%) |
| 75 Years and over | 21 (8.1%) | 18 (4.4%) |
| Total | 459 (10.9%) | 690 (15.4%) |
Income Above Poverty by Sex and Age in Napoleon
According to the poverty statistics in Napoleon, males aged 15 years and females aged 5 years are the age groups that are most secure financially, with 100.0% of males and 100.0% of females in these age groups living above the poverty line.
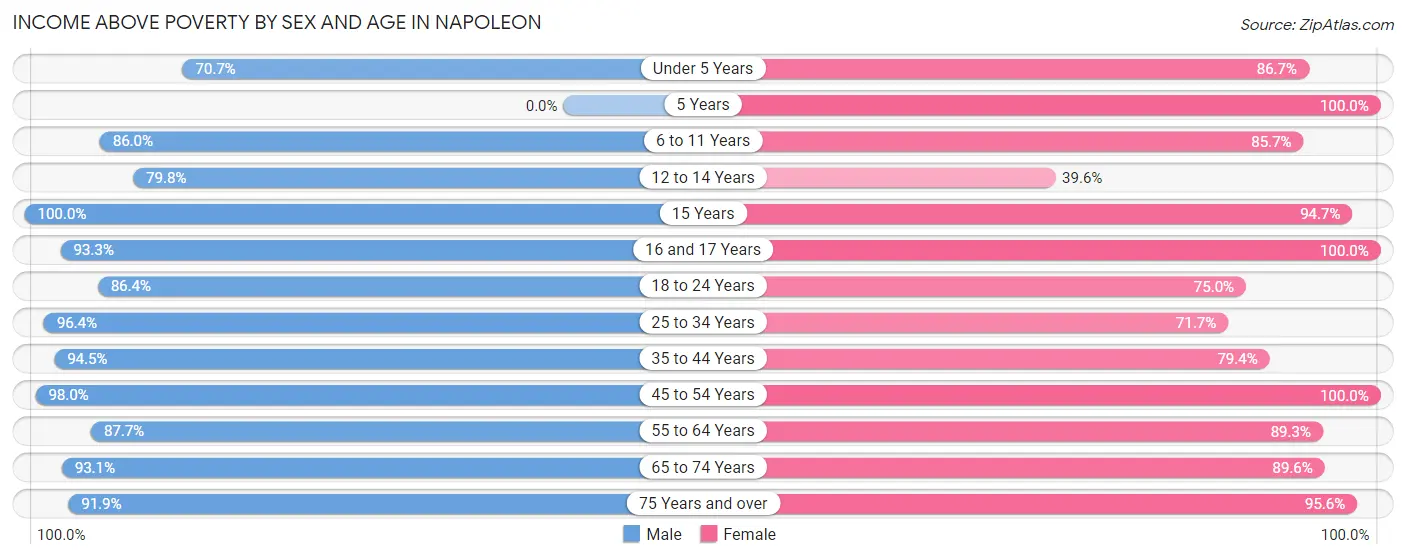
| Age Bracket | Male | Female |
| Under 5 Years | 251 (70.7%) | 319 (86.7%) |
| 5 Years | 0 (0.0%) | 20 (100.0%) |
| 6 to 11 Years | 314 (86.0%) | 329 (85.7%) |
| 12 to 14 Years | 206 (79.8%) | 80 (39.6%) |
| 15 Years | 31 (100.0%) | 36 (94.7%) |
| 16 and 17 Years | 168 (93.3%) | 118 (100.0%) |
| 18 to 24 Years | 223 (86.4%) | 213 (75.0%) |
| 25 to 34 Years | 568 (96.4%) | 380 (71.7%) |
| 35 to 44 Years | 395 (94.5%) | 462 (79.4%) |
| 45 to 54 Years | 533 (98.0%) | 560 (100.0%) |
| 55 to 64 Years | 498 (87.7%) | 482 (89.3%) |
| 65 to 74 Years | 310 (93.1%) | 388 (89.6%) |
| 75 Years and over | 238 (91.9%) | 394 (95.6%) |
| Total | 3,735 (89.1%) | 3,781 (84.6%) |
Income Below Poverty Among Married-Couple Families in Napoleon
The poverty statistics for married-couple families in Napoleon show that 1.9% or 29 of the total 1,519 families live below the poverty line. Families with 3 or 4 children have the highest poverty rate of 7.4%, comprising of 15 families. On the other hand, families with 1 or 2 children have the lowest poverty rate of 0.0%, which includes 0 families.
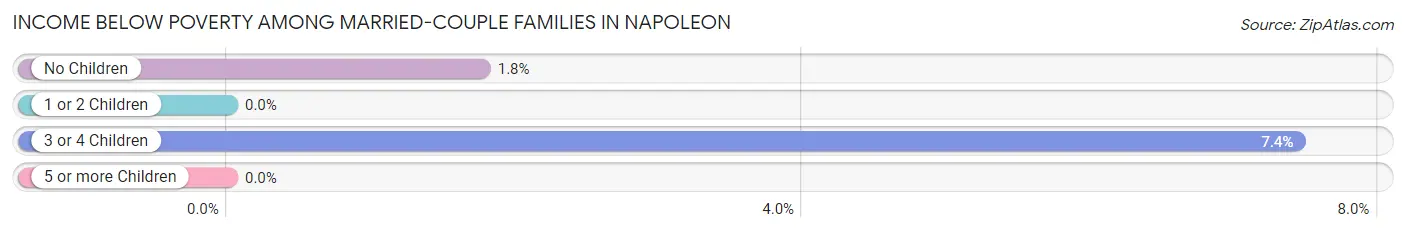
| Children | Above Poverty | Below Poverty |
| No Children | 783 (98.2%) | 14 (1.8%) |
| 1 or 2 Children | 488 (100.0%) | 0 (0.0%) |
| 3 or 4 Children | 187 (92.6%) | 15 (7.4%) |
| 5 or more Children | 32 (100.0%) | 0 (0.0%) |
| Total | 1,490 (98.1%) | 29 (1.9%) |
Income Below Poverty Among Single-Parent Households in Napoleon
According to the poverty data in Napoleon, 10.5% or 29 single-father households and 45.6% or 219 single-mother households are living below the poverty line. Among single-father households, those with 3 or 4 children have the highest poverty rate, with 29 households (64.4%) experiencing poverty. Likewise, among single-mother households, those with 3 or 4 children have the highest poverty rate, with 75 households (78.1%) falling below the poverty line.
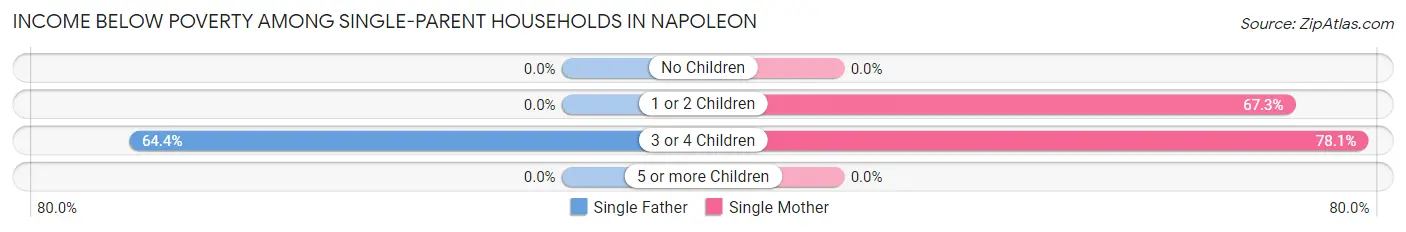
| Children | Single Father | Single Mother |
| No Children | 0 (0.0%) | 0 (0.0%) |
| 1 or 2 Children | 0 (0.0%) | 144 (67.3%) |
| 3 or 4 Children | 29 (64.4%) | 75 (78.1%) |
| 5 or more Children | 0 (0.0%) | 0 (0.0%) |
| Total | 29 (10.5%) | 219 (45.6%) |
Income Below Poverty Among Married-Couple vs Single-Parent Households in Napoleon
The poverty data for Napoleon shows that 29 of the married-couple family households (1.9%) and 248 of the single-parent households (32.9%) are living below the poverty level. Within the married-couple family households, those with 3 or 4 children have the highest poverty rate, with 15 households (7.4%) falling below the poverty line. Among the single-parent households, those with 3 or 4 children have the highest poverty rate, with 104 household (73.8%) living below poverty.
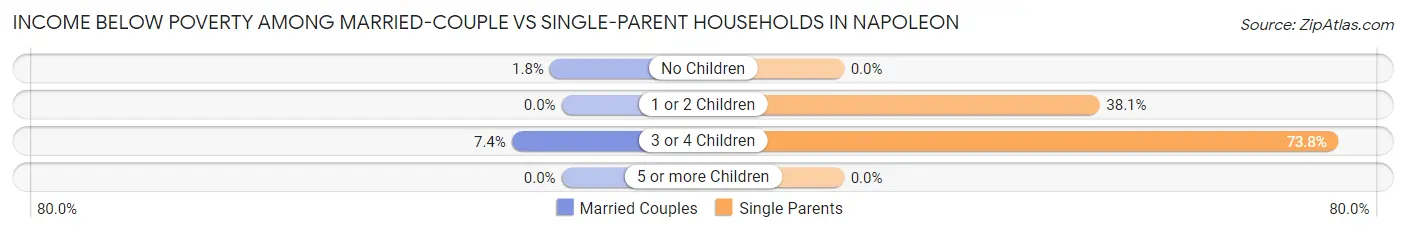
| Children | Married-Couple Families | Single-Parent Households |
| No Children | 14 (1.8%) | 0 (0.0%) |
| 1 or 2 Children | 0 (0.0%) | 144 (38.1%) |
| 3 or 4 Children | 15 (7.4%) | 104 (73.8%) |
| 5 or more Children | 0 (0.0%) | 0 (0.0%) |
| Total | 29 (1.9%) | 248 (32.9%) |
Race in Napoleon
The most populous races in Napoleon are White / Caucasian (7,693 | 86.6%), Some other Race (754 | 8.5%), and Hispanic or Latino (720 | 8.1%).
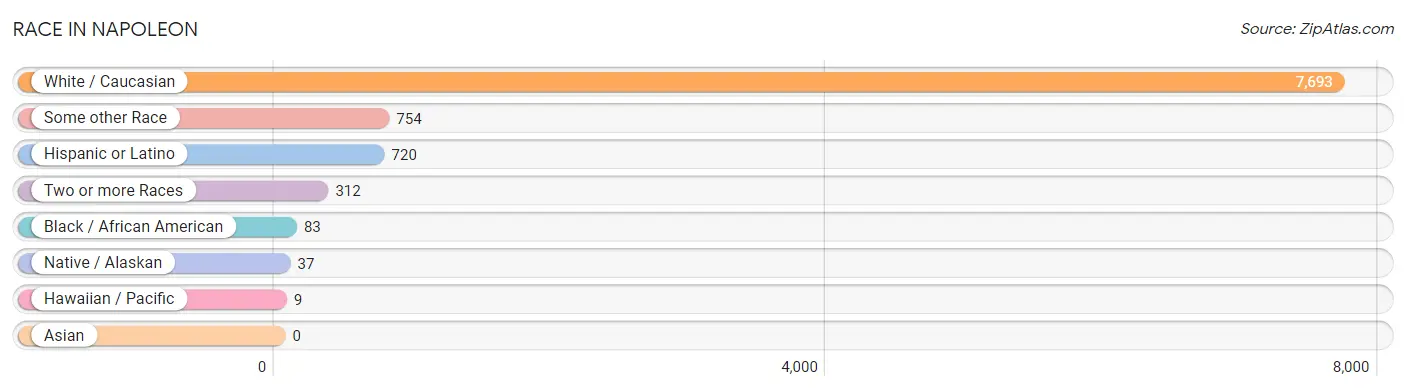
| Race | # Population | % Population |
| Asian | 0 | 0.0% |
| Black / African American | 83 | 0.9% |
| Hawaiian / Pacific | 9 | 0.1% |
| Hispanic or Latino | 720 | 8.1% |
| Native / Alaskan | 37 | 0.4% |
| White / Caucasian | 7,693 | 86.6% |
| Two or more Races | 312 | 3.5% |
| Some other Race | 754 | 8.5% |
| Total | 8,888 | 100.0% |
Ancestry in Napoleon
The most populous ancestries reported in Napoleon are German (3,474 | 39.1%), Irish (1,203 | 13.5%), American (982 | 11.1%), English (549 | 6.2%), and Mexican (473 | 5.3%), together accounting for 75.2% of all Napoleon residents.
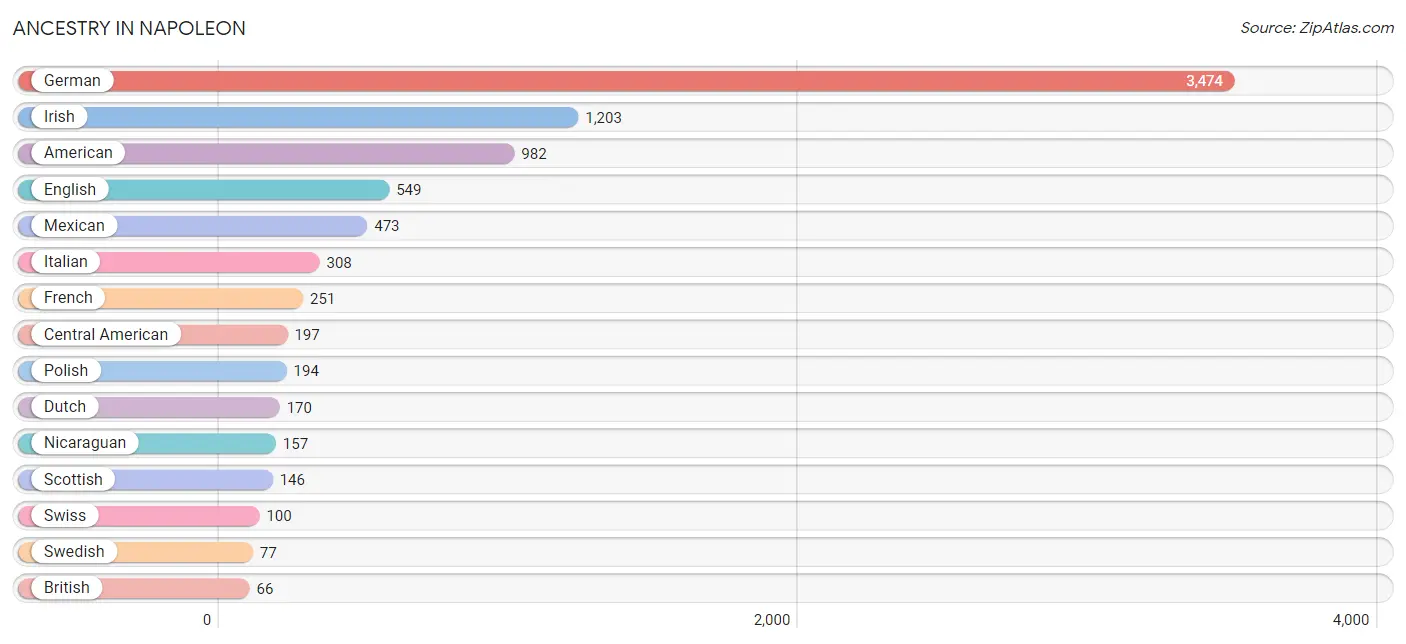
| Ancestry | # Population | % Population |
| African | 10 | 0.1% |
| American | 982 | 11.1% |
| Arab | 22 | 0.3% |
| Blackfeet | 16 | 0.2% |
| British | 66 | 0.7% |
| Canadian | 23 | 0.3% |
| Central American | 197 | 2.2% |
| Cherokee | 31 | 0.4% |
| Chippewa | 7 | 0.1% |
| Costa Rican | 7 | 0.1% |
| Czech | 15 | 0.2% |
| Czechoslovakian | 14 | 0.2% |
| Dutch | 170 | 1.9% |
| Eastern European | 19 | 0.2% |
| Ecuadorian | 24 | 0.3% |
| English | 549 | 6.2% |
| European | 56 | 0.6% |
| French | 251 | 2.8% |
| French American Indian | 9 | 0.1% |
| French Canadian | 17 | 0.2% |
| German | 3,474 | 39.1% |
| Honduran | 33 | 0.4% |
| Hungarian | 10 | 0.1% |
| Indian (Asian) | 35 | 0.4% |
| Irish | 1,203 | 13.5% |
| Italian | 308 | 3.5% |
| Lebanese | 22 | 0.3% |
| Mexican | 473 | 5.3% |
| New Zealander | 22 | 0.3% |
| Nicaraguan | 157 | 1.8% |
| Polish | 194 | 2.2% |
| Puerto Rican | 10 | 0.1% |
| Scotch-Irish | 57 | 0.6% |
| Scottish | 146 | 1.6% |
| Slovak | 19 | 0.2% |
| Slovene | 16 | 0.2% |
| South American | 24 | 0.3% |
| Spanish | 6 | 0.1% |
| Subsaharan African | 10 | 0.1% |
| Swedish | 77 | 0.9% |
| Swiss | 100 | 1.1% |
| Welsh | 39 | 0.4% | View All 42 Rows |
Immigrants in Napoleon
The most numerous immigrant groups reported in Napoleon came from Latin America (217 | 2.4%), Central America (207 | 2.3%), Nicaragua (136 | 1.5%), Mexico (49 | 0.5%), and Honduras (22 | 0.3%), together accounting for 7.1% of all Napoleon residents.
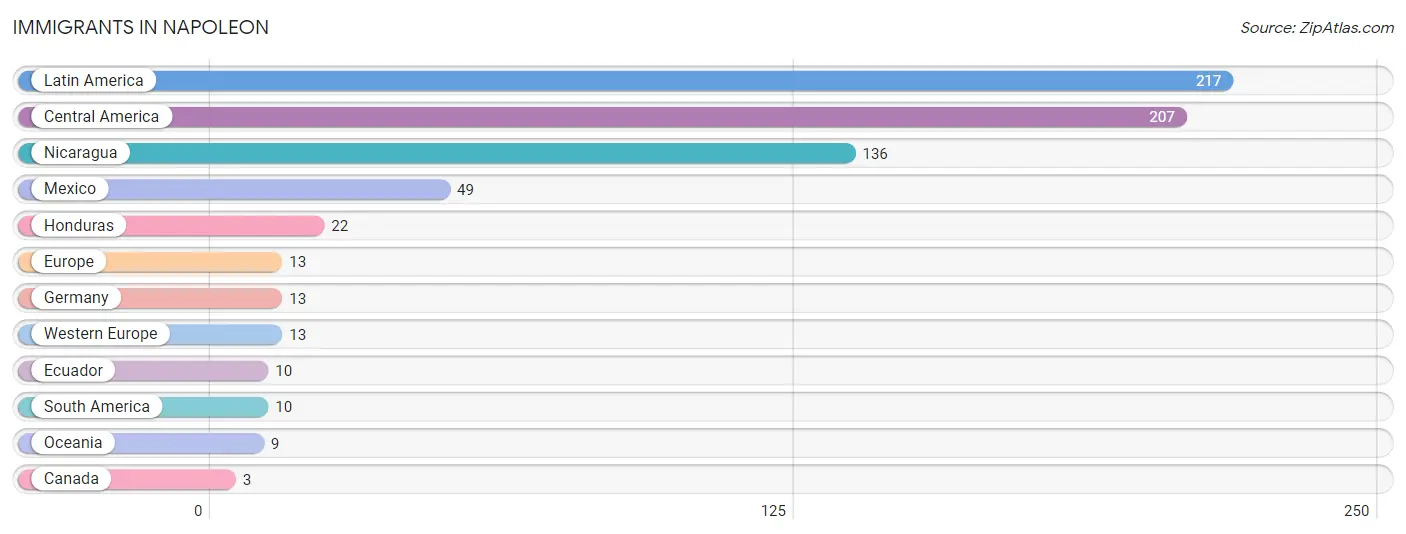
| Immigration Origin | # Population | % Population |
| Canada | 3 | 0.0% |
| Central America | 207 | 2.3% |
| Ecuador | 10 | 0.1% |
| Europe | 13 | 0.2% |
| Germany | 13 | 0.2% |
| Honduras | 22 | 0.3% |
| Latin America | 217 | 2.4% |
| Mexico | 49 | 0.5% |
| Nicaragua | 136 | 1.5% |
| Oceania | 9 | 0.1% |
| South America | 10 | 0.1% |
| Western Europe | 13 | 0.2% | View All 12 Rows |
Sex and Age in Napoleon
Sex and Age in Napoleon
The most populous age groups in Napoleon are 10 to 14 Years (395 | 9.2%) for men and Under 5 Years (368 | 8.0%) for women.
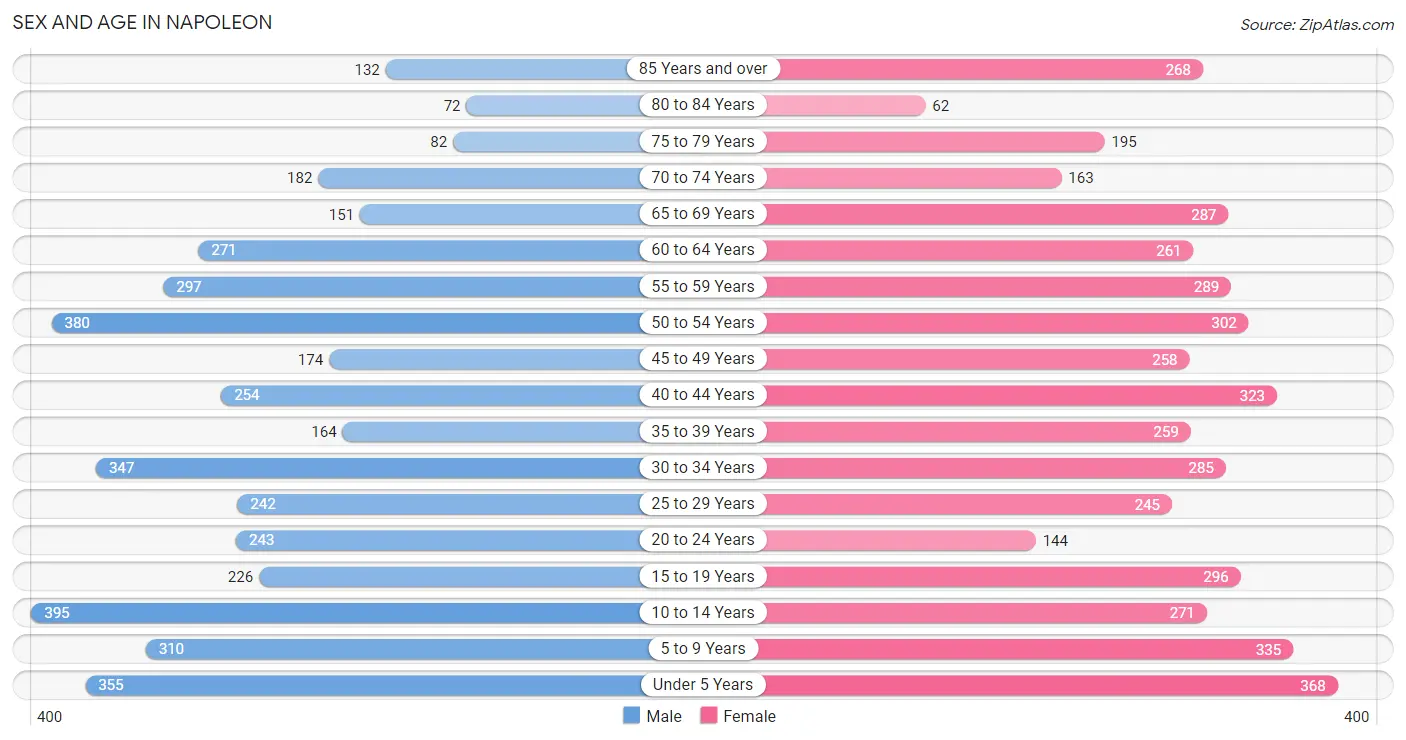
| Age Bracket | Male | Female |
| Under 5 Years | 355 (8.3%) | 368 (8.0%) |
| 5 to 9 Years | 310 (7.2%) | 335 (7.3%) |
| 10 to 14 Years | 395 (9.2%) | 271 (5.9%) |
| 15 to 19 Years | 226 (5.3%) | 296 (6.4%) |
| 20 to 24 Years | 243 (5.7%) | 144 (3.1%) |
| 25 to 29 Years | 242 (5.7%) | 245 (5.3%) |
| 30 to 34 Years | 347 (8.1%) | 285 (6.2%) |
| 35 to 39 Years | 164 (3.8%) | 259 (5.6%) |
| 40 to 44 Years | 254 (5.9%) | 323 (7.0%) |
| 45 to 49 Years | 174 (4.1%) | 258 (5.6%) |
| 50 to 54 Years | 380 (8.9%) | 302 (6.6%) |
| 55 to 59 Years | 297 (6.9%) | 289 (6.3%) |
| 60 to 64 Years | 271 (6.3%) | 261 (5.7%) |
| 65 to 69 Years | 151 (3.5%) | 287 (6.2%) |
| 70 to 74 Years | 182 (4.3%) | 163 (3.5%) |
| 75 to 79 Years | 82 (1.9%) | 195 (4.2%) |
| 80 to 84 Years | 72 (1.7%) | 62 (1.3%) |
| 85 Years and over | 132 (3.1%) | 268 (5.8%) |
| Total | 4,277 (100.0%) | 4,611 (100.0%) |
Families and Households in Napoleon
Median Family Size in Napoleon
The median family size in Napoleon is 2.98 persons per family, with married-couple families (1,519 | 66.8%) accounting for the largest median family size of 3.2 persons per family. On the other hand, single female/mother families (480 | 21.1%) represent the smallest median family size with 2.42 persons per family.
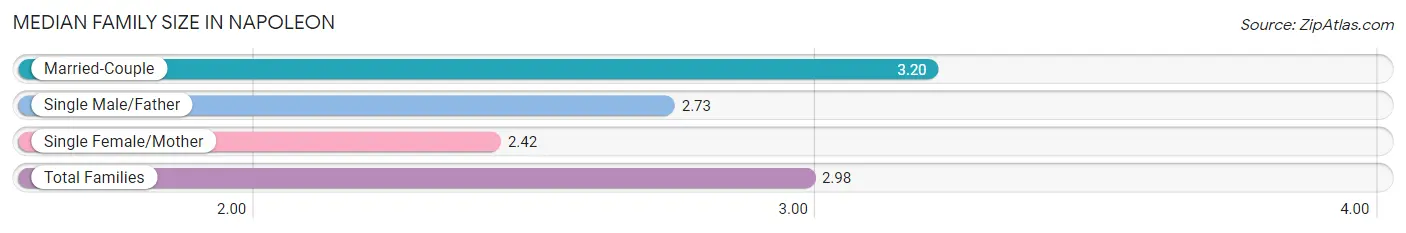
| Family Type | # Families | Family Size |
| Married-Couple | 1,519 (66.8%) | 3.20 |
| Single Male/Father | 275 (12.1%) | 2.73 |
| Single Female/Mother | 480 (21.1%) | 2.42 |
| Total Families | 2,274 (100.0%) | 2.98 |
Median Household Size in Napoleon
The median household size in Napoleon is 2.31 persons per household, with married-couple households (1,519 | 40.5%) accounting for the largest median household size of 3.23 persons per household. non-family households (1,477 | 39.4%) represent the smallest median household size with 1.08 persons per household.
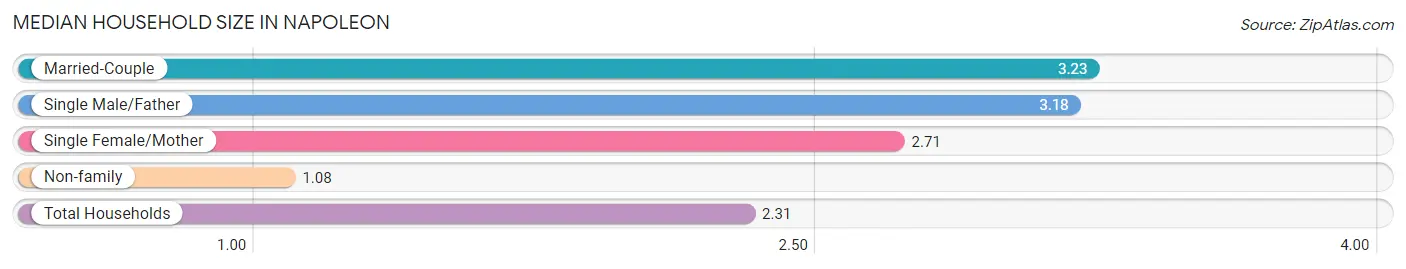
| Household Type | # Households | Household Size |
| Married-Couple | 1,519 (40.5%) | 3.23 |
| Single Male/Father | 275 (7.3%) | 3.18 |
| Single Female/Mother | 480 (12.8%) | 2.71 |
| Non-family | 1,477 (39.4%) | 1.08 |
| Total Households | 3,751 (100.0%) | 2.31 |
Household Size by Marriage Status in Napoleon
Out of a total of 3,751 households in Napoleon, 2,274 (60.6%) are family households, while 1,477 (39.4%) are nonfamily households. The most numerous type of family households are 2-person households, comprising 950, and the most common type of nonfamily households are 1-person households, comprising 1,361.
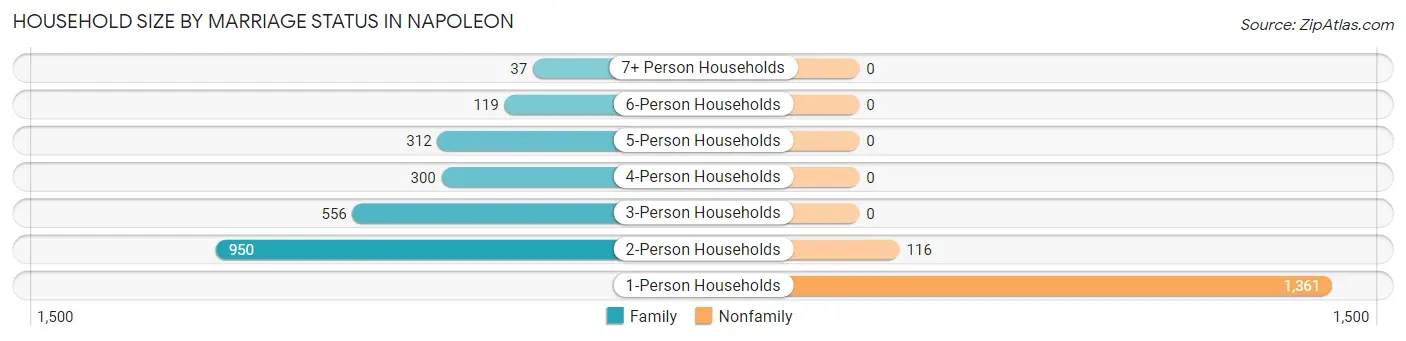
| Household Size | Family Households | Nonfamily Households |
| 1-Person Households | - | 1,361 (36.3%) |
| 2-Person Households | 950 (25.3%) | 116 (3.1%) |
| 3-Person Households | 556 (14.8%) | 0 (0.0%) |
| 4-Person Households | 300 (8.0%) | 0 (0.0%) |
| 5-Person Households | 312 (8.3%) | 0 (0.0%) |
| 6-Person Households | 119 (3.2%) | 0 (0.0%) |
| 7+ Person Households | 37 (1.0%) | 0 (0.0%) |
| Total | 2,274 (60.6%) | 1,477 (39.4%) |
Female Fertility in Napoleon
Fertility by Age in Napoleon
Average fertility rate in Napoleon is 125.0 births per 1,000 women. Women in the age bracket of 20 to 34 years have the highest fertility rate with 269.0 births per 1,000 women. Women in the age bracket of 20 to 34 years acount for 78.7% of all women with births.
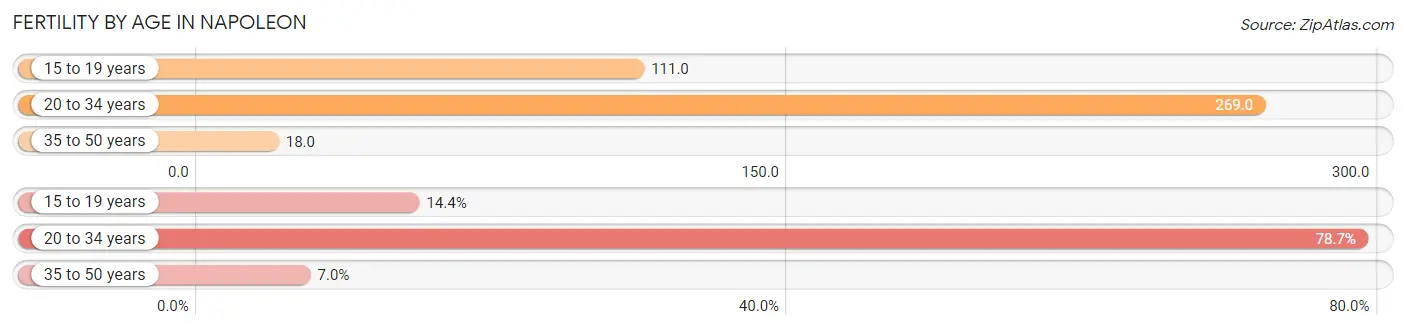
| Age Bracket | Women with Births | Births / 1,000 Women |
| 15 to 19 years | 33 (14.3%) | 111.0 |
| 20 to 34 years | 181 (78.7%) | 269.0 |
| 35 to 50 years | 16 (7.0%) | 18.0 |
| Total | 230 (100.0%) | 125.0 |
Fertility by Age by Marriage Status in Napoleon
60.4% of women with births (230) in Napoleon are married. The highest percentage of unmarried women with births falls into 15 to 19 years age bracket with 100.0% of them unmarried at the time of birth, while the lowest percentage of unmarried women with births belong to 35 to 50 years age bracket with 0.0% of them unmarried.
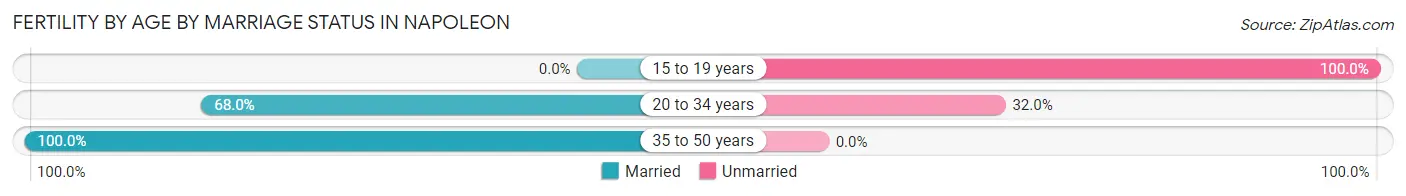
| Age Bracket | Married | Unmarried |
| 15 to 19 years | 0 (0.0%) | 33 (100.0%) |
| 20 to 34 years | 123 (68.0%) | 58 (32.0%) |
| 35 to 50 years | 16 (100.0%) | 0 (0.0%) |
| Total | 139 (60.4%) | 91 (39.6%) |
Fertility by Education in Napoleon
Average fertility rate in Napoleon is 125.0 births per 1,000 women. Women with the education attainment of graduate degree have the highest fertility rate of 385.0 births per 1,000 women, while women with the education attainment of college or associate's degree have the lowest fertility at 54.0 births per 1,000 women. Women with the education attainment of high school diploma represent 37.8% of all women with births.
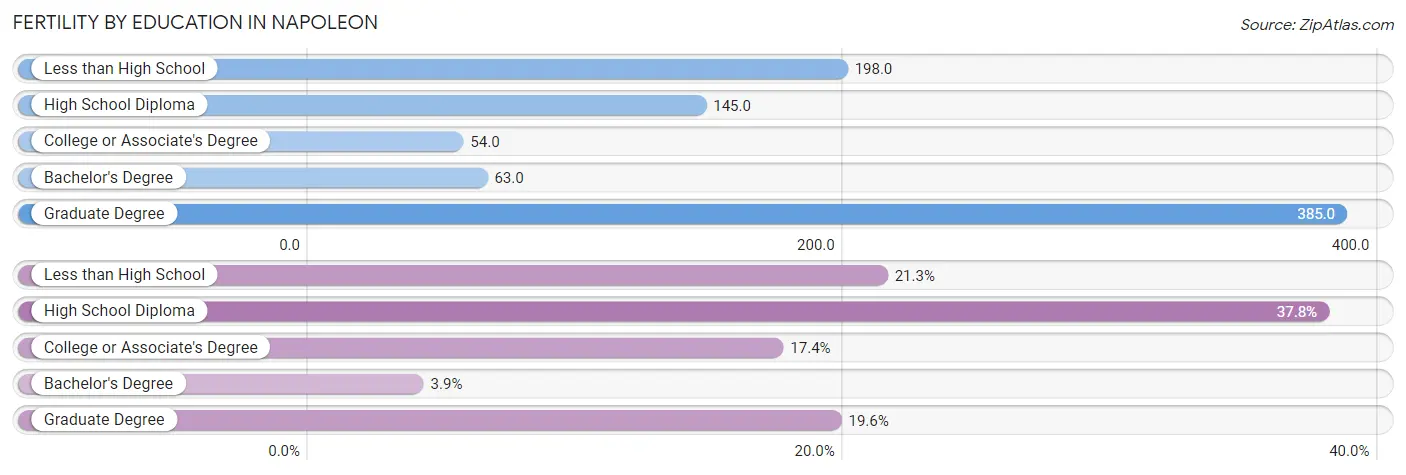
| Educational Attainment | Women with Births | Births / 1,000 Women |
| Less than High School | 49 (21.3%) | 198.0 |
| High School Diploma | 87 (37.8%) | 145.0 |
| College or Associate's Degree | 40 (17.4%) | 54.0 |
| Bachelor's Degree | 9 (3.9%) | 63.0 |
| Graduate Degree | 45 (19.6%) | 385.0 |
| Total | 230 (100.0%) | 125.0 |
Fertility by Education by Marriage Status in Napoleon
39.6% of women with births in Napoleon are unmarried. Women with the educational attainment of bachelor's degree are most likely to be married with 100.0% of them married at childbirth, while women with the educational attainment of less than high school are least likely to be married with 67.3% of them unmarried at childbirth.
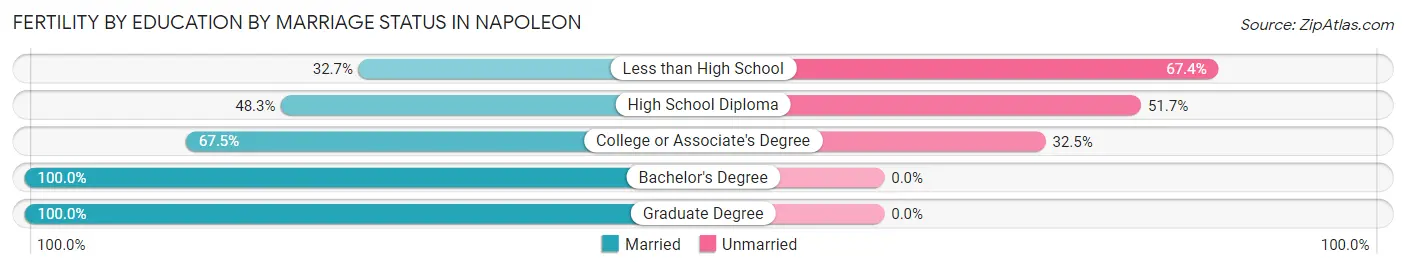
| Educational Attainment | Married | Unmarried |
| Less than High School | 16 (32.7%) | 33 (67.3%) |
| High School Diploma | 42 (48.3%) | 45 (51.7%) |
| College or Associate's Degree | 27 (67.5%) | 13 (32.5%) |
| Bachelor's Degree | 9 (100.0%) | 0 (0.0%) |
| Graduate Degree | 45 (100.0%) | 0 (0.0%) |
| Total | 139 (60.4%) | 91 (39.6%) |
Employment Characteristics in Napoleon
Employment by Class of Employer in Napoleon
Among the 4,141 employed individuals in Napoleon, private company employees (3,080 | 74.4%), local government employees (324 | 7.8%), and not-for-profit organizations (320 | 7.7%) make up the most common classes of employment.
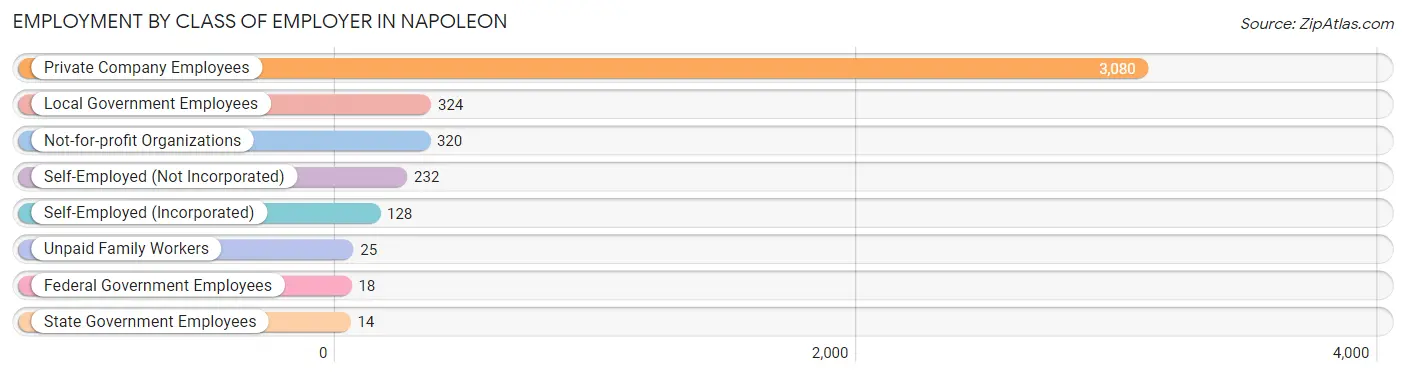
| Employer Class | # Employees | % Employees |
| Private Company Employees | 3,080 | 74.4% |
| Self-Employed (Incorporated) | 128 | 3.1% |
| Self-Employed (Not Incorporated) | 232 | 5.6% |
| Not-for-profit Organizations | 320 | 7.7% |
| Local Government Employees | 324 | 7.8% |
| State Government Employees | 14 | 0.3% |
| Federal Government Employees | 18 | 0.4% |
| Unpaid Family Workers | 25 | 0.6% |
| Total | 4,141 | 100.0% |
Employment Status by Age in Napoleon
According to the labor force statistics for Napoleon, out of the total population over 16 years of age (6,785), 63.3% or 4,295 individuals are in the labor force, with 2.8% or 120 of them unemployed. The age group with the highest labor force participation rate is 30 to 34 years, with 92.9% or 587 individuals in the labor force. Within the labor force, the 20 to 24 years age range has the highest percentage of unemployed individuals, with 8.8% or 23 of them being unemployed.
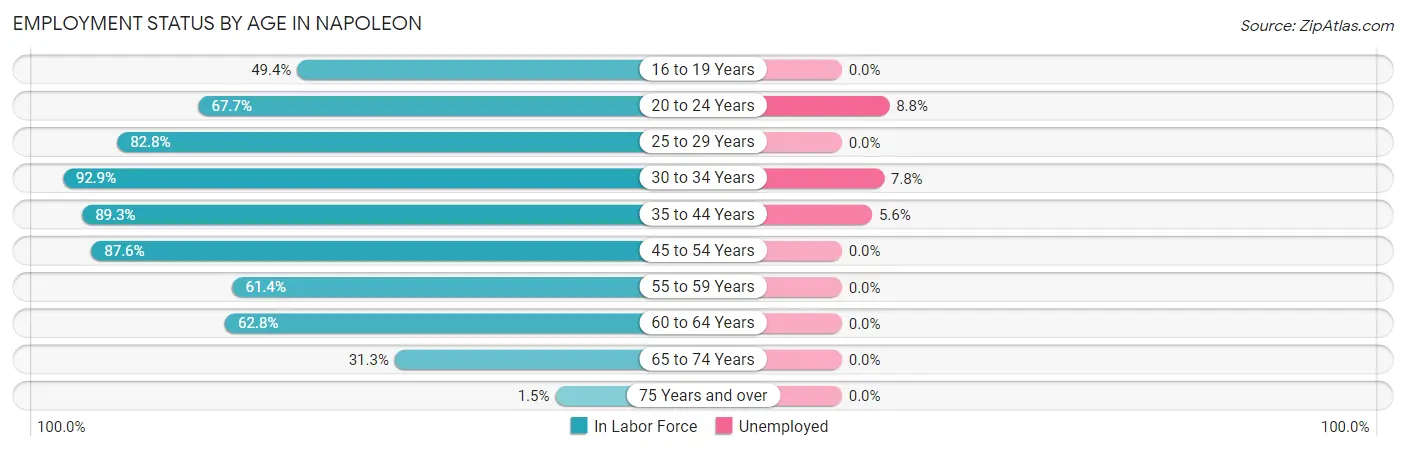
| Age Bracket | In Labor Force | Unemployed |
| 16 to 19 Years | 224 (49.4%) | 0 (0.0%) |
| 20 to 24 Years | 262 (67.7%) | 23 (8.8%) |
| 25 to 29 Years | 403 (82.8%) | 0 (0.0%) |
| 30 to 34 Years | 587 (92.9%) | 46 (7.8%) |
| 35 to 44 Years | 893 (89.3%) | 50 (5.6%) |
| 45 to 54 Years | 976 (87.6%) | 0 (0.0%) |
| 55 to 59 Years | 360 (61.4%) | 0 (0.0%) |
| 60 to 64 Years | 334 (62.8%) | 0 (0.0%) |
| 65 to 74 Years | 245 (31.3%) | 0 (0.0%) |
| 75 Years and over | 12 (1.5%) | 0 (0.0%) |
| Total | 4,295 (63.3%) | 120 (2.8%) |
Employment Status by Educational Attainment in Napoleon
According to labor force statistics for Napoleon, 81.7% of individuals (3,555) out of the total population between 25 and 64 years of age (4,351) are in the labor force, with 2.7% or 96 of them being unemployed. The group with the highest labor force participation rate are those with the educational attainment of college / associate degree, with 92.0% or 1,527 individuals in the labor force. Within the labor force, individuals with high school diploma education have the highest percentage of unemployment, with 5.7% or 70 of them being unemployed.
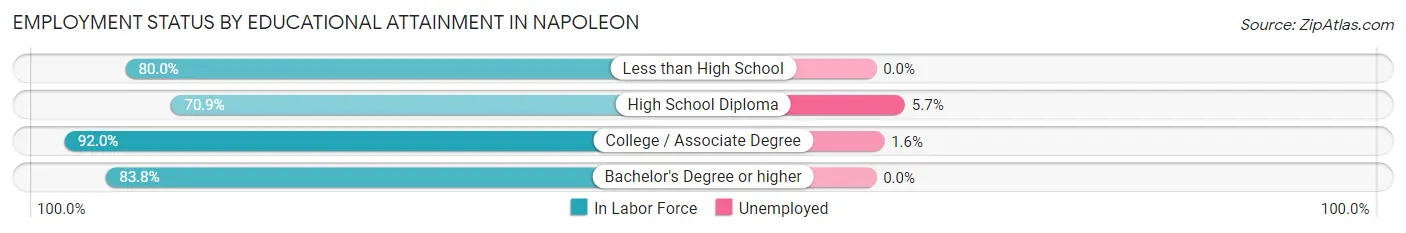
| Educational Attainment | In Labor Force | Unemployed |
| Less than High School | 124 (80.0%) | 0 (0.0%) |
| High School Diploma | 1,236 (70.9%) | 99 (5.7%) |
| College / Associate Degree | 1,527 (92.0%) | 27 (1.6%) |
| Bachelor's Degree or higher | 664 (83.8%) | 0 (0.0%) |
| Total | 3,555 (81.7%) | 117 (2.7%) |
Employment Occupations by Sex in Napoleon
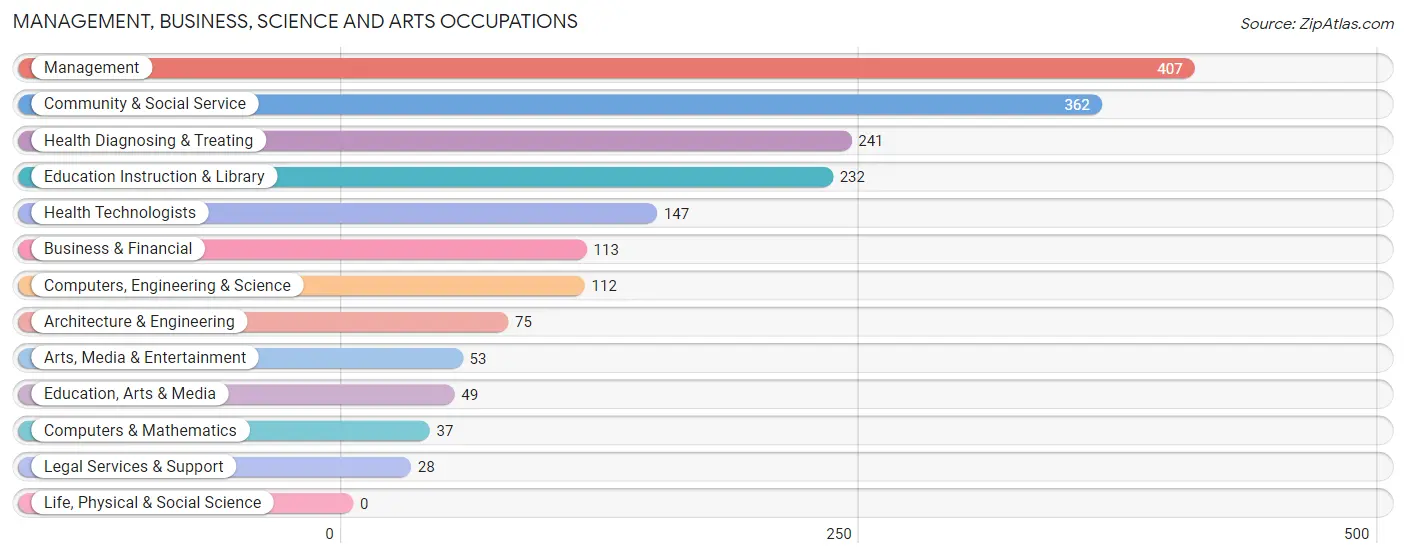
Management, Business, Science and Arts Occupations
The most common Management, Business, Science and Arts occupations in Napoleon are Management (407 | 9.7%), Community & Social Service (362 | 8.7%), Health Diagnosing & Treating (241 | 5.8%), Education Instruction & Library (232 | 5.6%), and Health Technologists (147 | 3.5%).
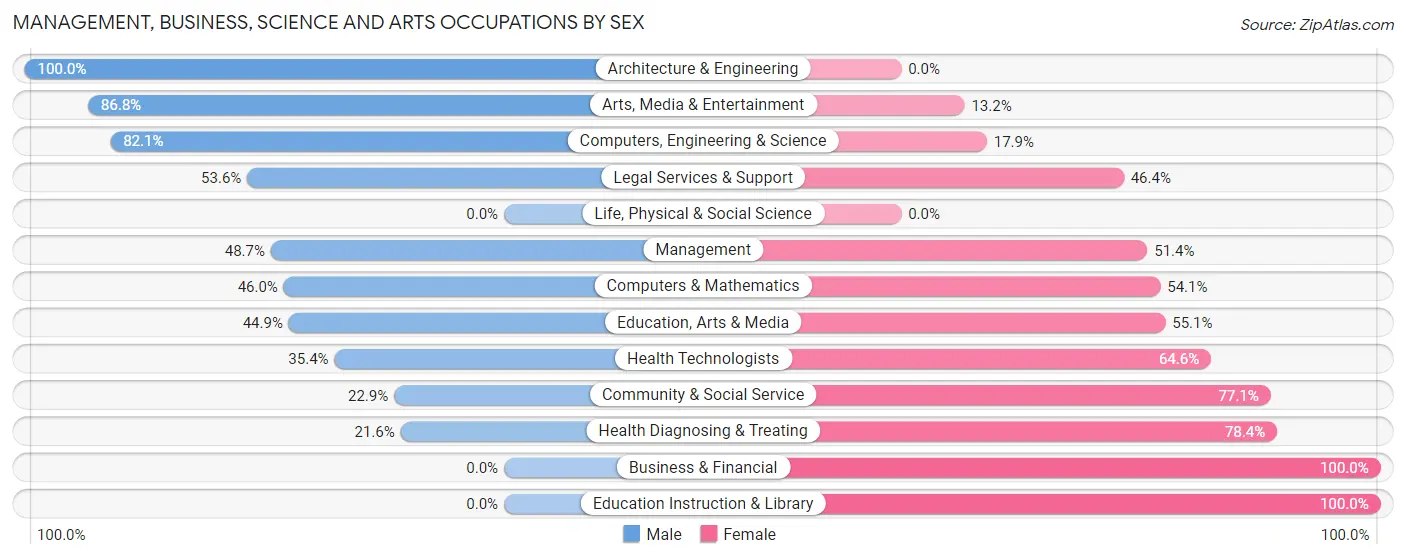
Management, Business, Science and Arts Occupations by Sex
Within the Management, Business, Science and Arts occupations in Napoleon, the most male-oriented occupations are Architecture & Engineering (100.0%), Arts, Media & Entertainment (86.8%), and Computers, Engineering & Science (82.1%), while the most female-oriented occupations are Business & Financial (100.0%), Education Instruction & Library (100.0%), and Health Diagnosing & Treating (78.4%).
| Occupation | Male | Female |
| Management | 198 (48.6%) | 209 (51.3%) |
| Business & Financial | 0 (0.0%) | 113 (100.0%) |
| Computers, Engineering & Science | 92 (82.1%) | 20 (17.9%) |
| Computers & Mathematics | 17 (46.0%) | 20 (54.0%) |
| Architecture & Engineering | 75 (100.0%) | 0 (0.0%) |
| Life, Physical & Social Science | 0 (0.0%) | 0 (0.0%) |
| Community & Social Service | 83 (22.9%) | 279 (77.1%) |
| Education, Arts & Media | 22 (44.9%) | 27 (55.1%) |
| Legal Services & Support | 15 (53.6%) | 13 (46.4%) |
| Education Instruction & Library | 0 (0.0%) | 232 (100.0%) |
| Arts, Media & Entertainment | 46 (86.8%) | 7 (13.2%) |
| Health Diagnosing & Treating | 52 (21.6%) | 189 (78.4%) |
| Health Technologists | 52 (35.4%) | 95 (64.6%) |
| Total (Category) | 425 (34.4%) | 810 (65.6%) |
| Total (Overall) | 2,139 (51.2%) | 2,038 (48.8%) |
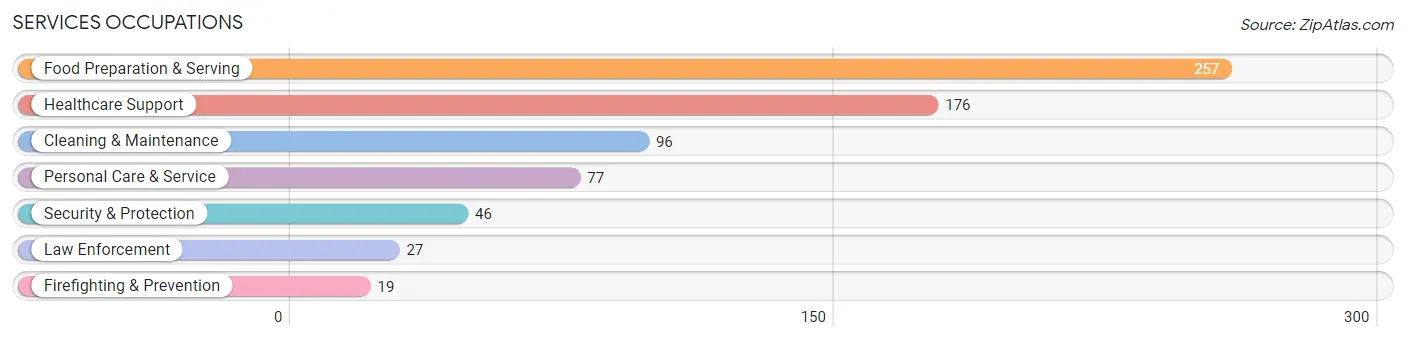
Services Occupations
The most common Services occupations in Napoleon are Food Preparation & Serving (257 | 6.1%), Healthcare Support (176 | 4.2%), Cleaning & Maintenance (96 | 2.3%), Personal Care & Service (77 | 1.8%), and Security & Protection (46 | 1.1%).
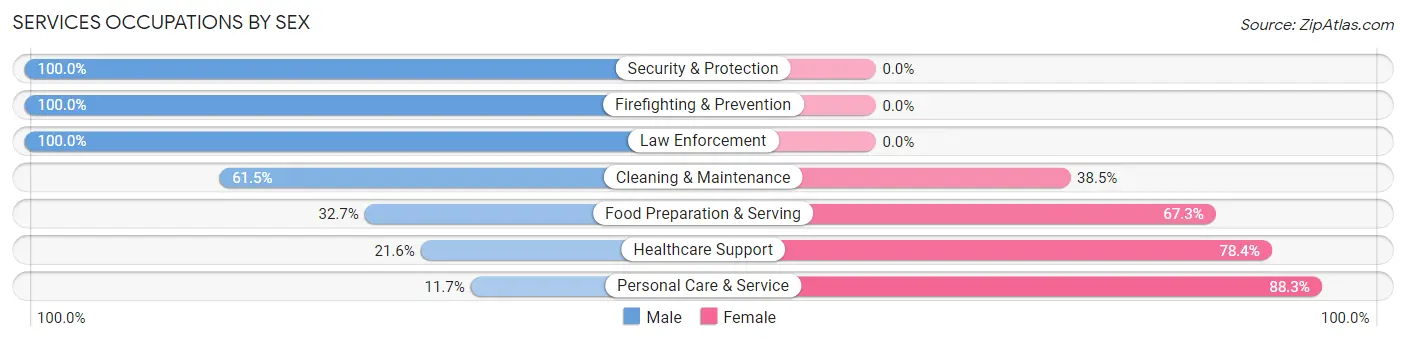
Services Occupations by Sex
Within the Services occupations in Napoleon, the most male-oriented occupations are Security & Protection (100.0%), Firefighting & Prevention (100.0%), and Law Enforcement (100.0%), while the most female-oriented occupations are Personal Care & Service (88.3%), Healthcare Support (78.4%), and Food Preparation & Serving (67.3%).
| Occupation | Male | Female |
| Healthcare Support | 38 (21.6%) | 138 (78.4%) |
| Security & Protection | 46 (100.0%) | 0 (0.0%) |
| Firefighting & Prevention | 19 (100.0%) | 0 (0.0%) |
| Law Enforcement | 27 (100.0%) | 0 (0.0%) |
| Food Preparation & Serving | 84 (32.7%) | 173 (67.3%) |
| Cleaning & Maintenance | 59 (61.5%) | 37 (38.5%) |
| Personal Care & Service | 9 (11.7%) | 68 (88.3%) |
| Total (Category) | 236 (36.2%) | 416 (63.8%) |
| Total (Overall) | 2,139 (51.2%) | 2,038 (48.8%) |
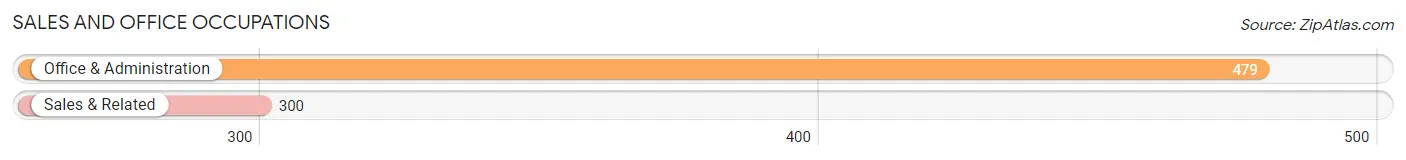
Sales and Office Occupations
The most common Sales and Office occupations in Napoleon are Office & Administration (479 | 11.5%), and Sales & Related (300 | 7.2%).
Sales and Office Occupations by Sex
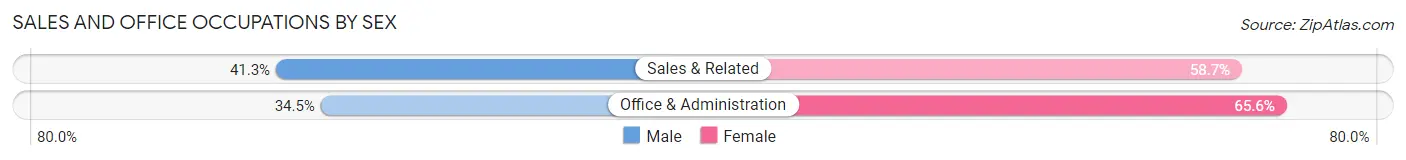
| Occupation | Male | Female |
| Sales & Related | 124 (41.3%) | 176 (58.7%) |
| Office & Administration | 165 (34.4%) | 314 (65.5%) |
| Total (Category) | 289 (37.1%) | 490 (62.9%) |
| Total (Overall) | 2,139 (51.2%) | 2,038 (48.8%) |
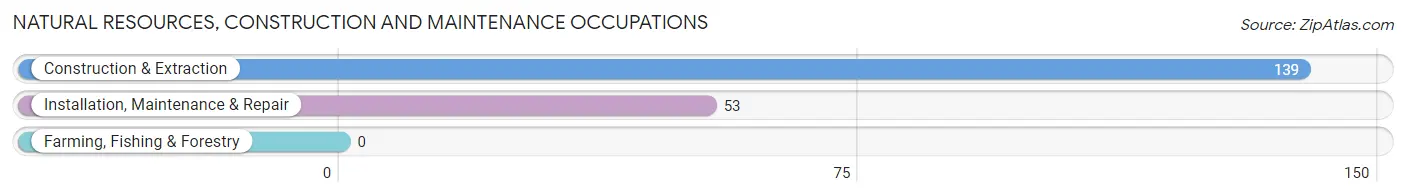
Natural Resources, Construction and Maintenance Occupations
The most common Natural Resources, Construction and Maintenance occupations in Napoleon are Construction & Extraction (139 | 3.3%), and Installation, Maintenance & Repair (53 | 1.3%).
Natural Resources, Construction and Maintenance Occupations by Sex
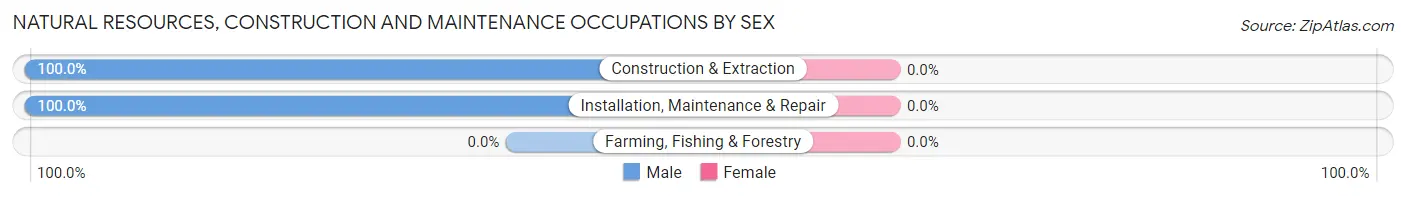
| Occupation | Male | Female |
| Farming, Fishing & Forestry | 0 (0.0%) | 0 (0.0%) |
| Construction & Extraction | 139 (100.0%) | 0 (0.0%) |
| Installation, Maintenance & Repair | 53 (100.0%) | 0 (0.0%) |
| Total (Category) | 192 (100.0%) | 0 (0.0%) |
| Total (Overall) | 2,139 (51.2%) | 2,038 (48.8%) |
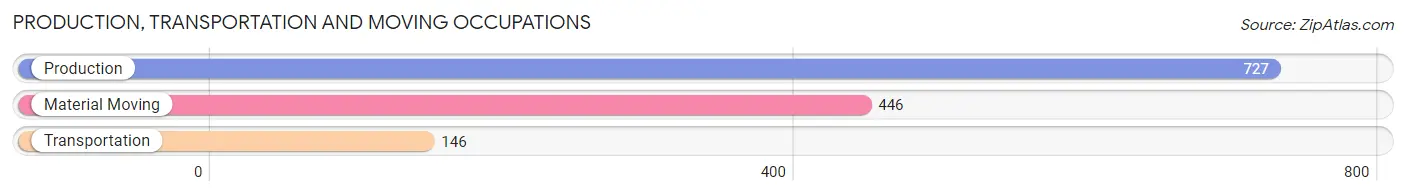
Production, Transportation and Moving Occupations
The most common Production, Transportation and Moving occupations in Napoleon are Production (727 | 17.4%), Material Moving (446 | 10.7%), and Transportation (146 | 3.5%).
Production, Transportation and Moving Occupations by Sex
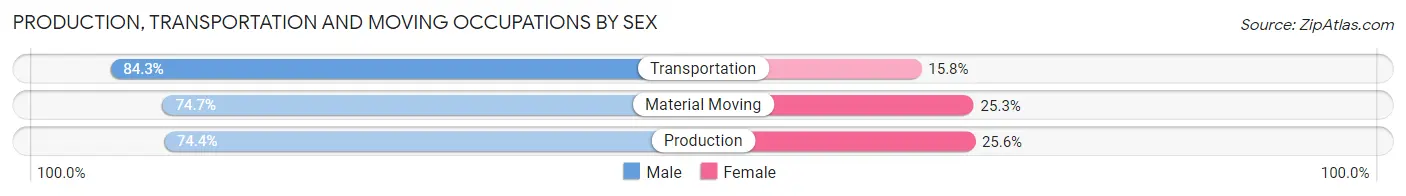
| Occupation | Male | Female |
| Production | 541 (74.4%) | 186 (25.6%) |
| Transportation | 123 (84.3%) | 23 (15.8%) |
| Material Moving | 333 (74.7%) | 113 (25.3%) |
| Total (Category) | 997 (75.6%) | 322 (24.4%) |
| Total (Overall) | 2,139 (51.2%) | 2,038 (48.8%) |
Employment Industries by Sex in Napoleon
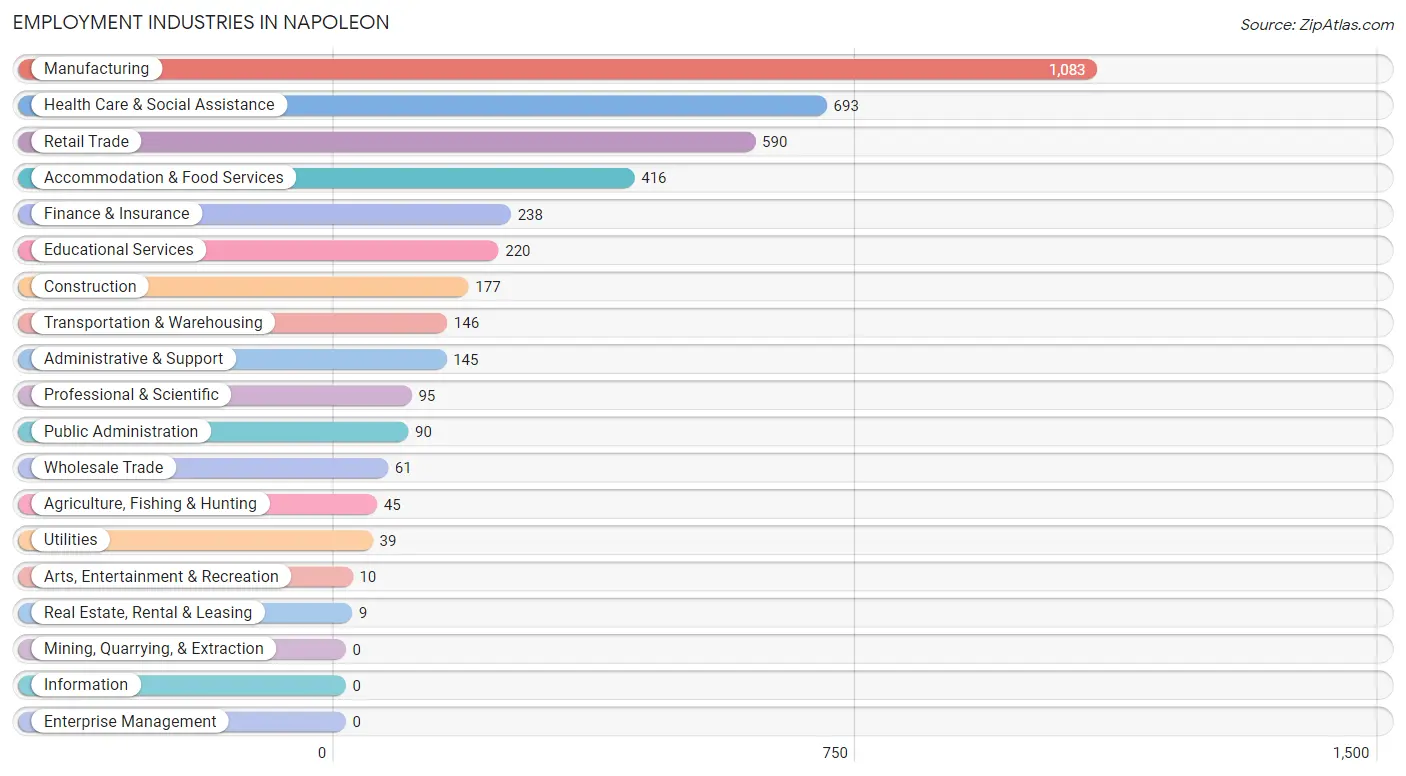
Employment Industries in Napoleon
The major employment industries in Napoleon include Manufacturing (1,083 | 25.9%), Health Care & Social Assistance (693 | 16.6%), Retail Trade (590 | 14.1%), Accommodation & Food Services (416 | 10.0%), and Finance & Insurance (238 | 5.7%).
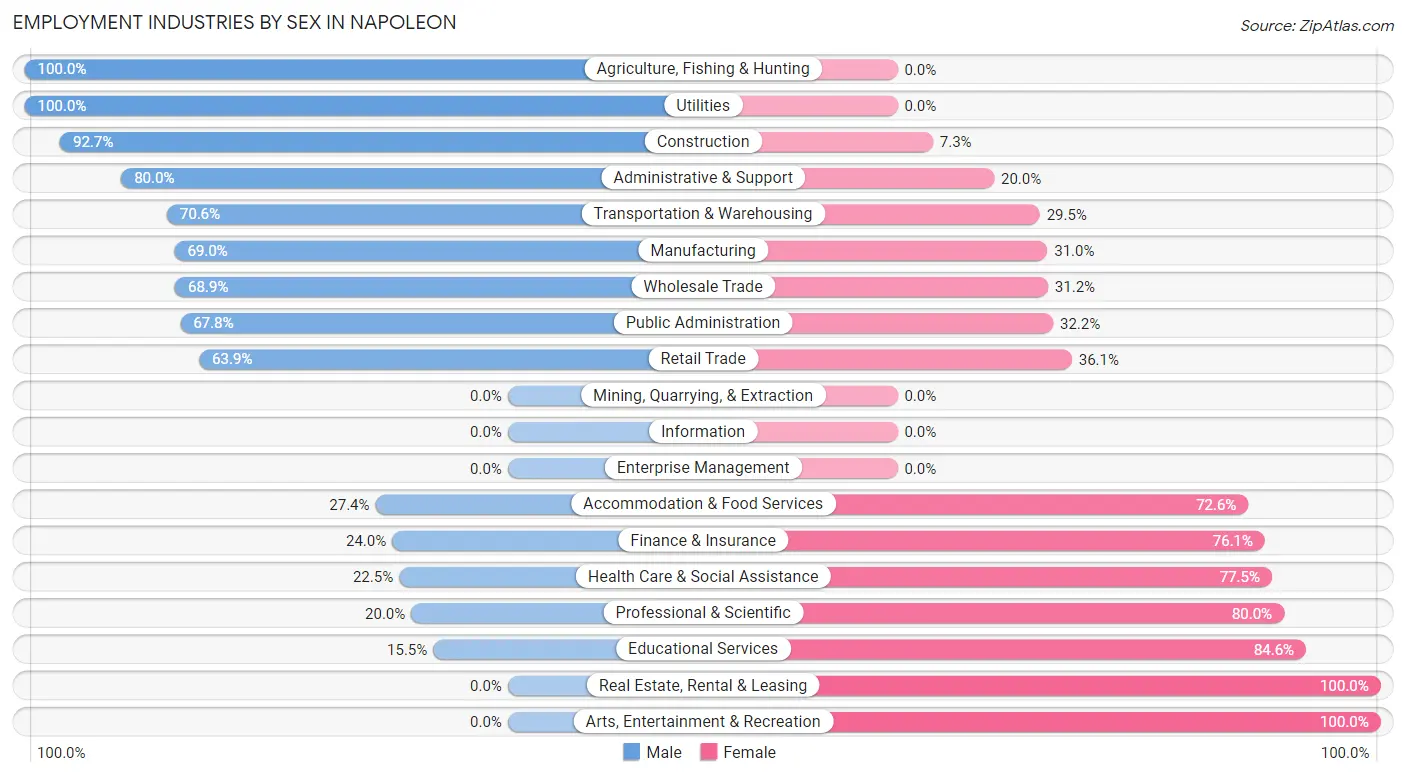
Employment Industries by Sex in Napoleon
The Napoleon industries that see more men than women are Agriculture, Fishing & Hunting (100.0%), Utilities (100.0%), and Construction (92.7%), whereas the industries that tend to have a higher number of women are Real Estate, Rental & Leasing (100.0%), Arts, Entertainment & Recreation (100.0%), and Educational Services (84.6%).
| Industry | Male | Female |
| Agriculture, Fishing & Hunting | 45 (100.0%) | 0 (0.0%) |
| Mining, Quarrying, & Extraction | 0 (0.0%) | 0 (0.0%) |
| Construction | 164 (92.7%) | 13 (7.3%) |
| Manufacturing | 747 (69.0%) | 336 (31.0%) |
| Wholesale Trade | 42 (68.9%) | 19 (31.1%) |
| Retail Trade | 377 (63.9%) | 213 (36.1%) |
| Transportation & Warehousing | 103 (70.6%) | 43 (29.4%) |
| Utilities | 39 (100.0%) | 0 (0.0%) |
| Information | 0 (0.0%) | 0 (0.0%) |
| Finance & Insurance | 57 (23.9%) | 181 (76.0%) |
| Real Estate, Rental & Leasing | 0 (0.0%) | 9 (100.0%) |
| Professional & Scientific | 19 (20.0%) | 76 (80.0%) |
| Enterprise Management | 0 (0.0%) | 0 (0.0%) |
| Administrative & Support | 116 (80.0%) | 29 (20.0%) |
| Educational Services | 34 (15.4%) | 186 (84.6%) |
| Health Care & Social Assistance | 156 (22.5%) | 537 (77.5%) |
| Arts, Entertainment & Recreation | 0 (0.0%) | 10 (100.0%) |
| Accommodation & Food Services | 114 (27.4%) | 302 (72.6%) |
| Public Administration | 61 (67.8%) | 29 (32.2%) |
| Total | 2,139 (51.2%) | 2,038 (48.8%) |
Education in Napoleon
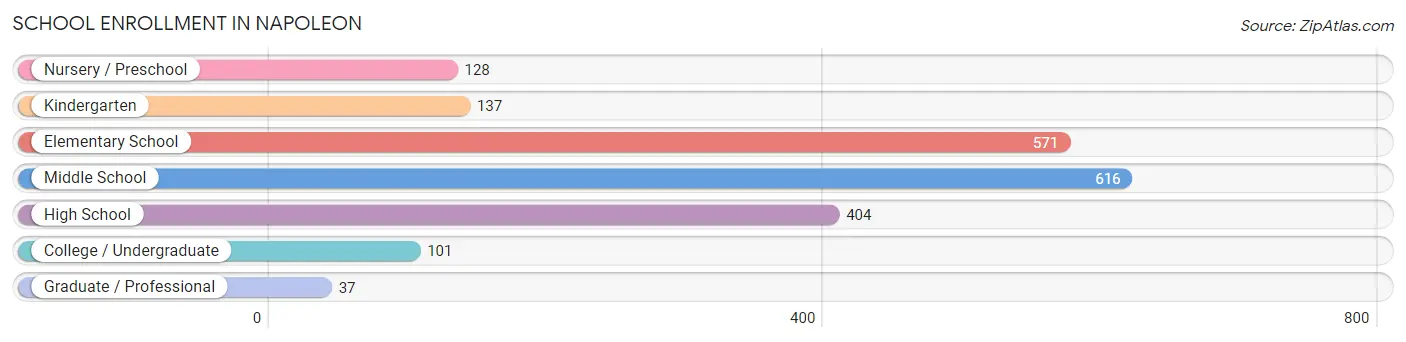
School Enrollment in Napoleon
The most common levels of schooling among the 1,994 students in Napoleon are middle school (616 | 30.9%), elementary school (571 | 28.6%), and high school (404 | 20.3%).
| School Level | # Students | % Students |
| Nursery / Preschool | 128 | 6.4% |
| Kindergarten | 137 | 6.9% |
| Elementary School | 571 | 28.6% |
| Middle School | 616 | 30.9% |
| High School | 404 | 20.3% |
| College / Undergraduate | 101 | 5.1% |
| Graduate / Professional | 37 | 1.9% |
| Total | 1,994 | 100.0% |
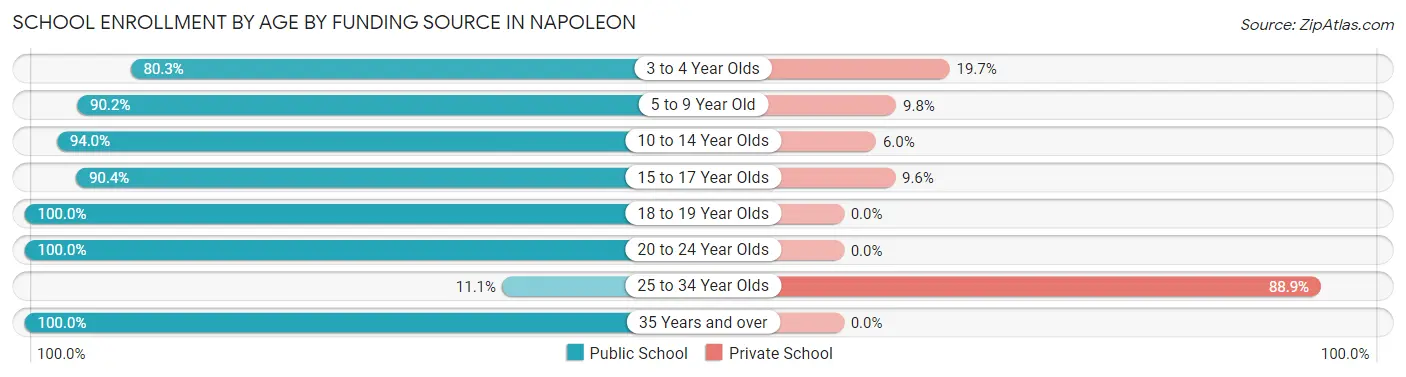
School Enrollment by Age by Funding Source in Napoleon
Out of a total of 1,994 students who are enrolled in schools in Napoleon, 209 (10.5%) attend a private institution, while the remaining 1,785 (89.5%) are enrolled in public schools. The age group of 25 to 34 year olds has the highest likelihood of being enrolled in private schools, with 48 (88.9% in the age bracket) enrolled. Conversely, the age group of 18 to 19 year olds has the lowest likelihood of being enrolled in a private school, with 116 (100.0% in the age bracket) attending a public institution.
| Age Bracket | Public School | Private School |
| 3 to 4 Year Olds | 114 (80.3%) | 28 (19.7%) |
| 5 to 9 Year Old | 582 (90.2%) | 63 (9.8%) |
| 10 to 14 Year Olds | 626 (94.0%) | 40 (6.0%) |
| 15 to 17 Year Olds | 293 (90.4%) | 31 (9.6%) |
| 18 to 19 Year Olds | 116 (100.0%) | 0 (0.0%) |
| 20 to 24 Year Olds | 44 (100.0%) | 0 (0.0%) |
| 25 to 34 Year Olds | 6 (11.1%) | 48 (88.9%) |
| 35 Years and over | 3 (100.0%) | 0 (0.0%) |
| Total | 1,785 (89.5%) | 209 (10.5%) |
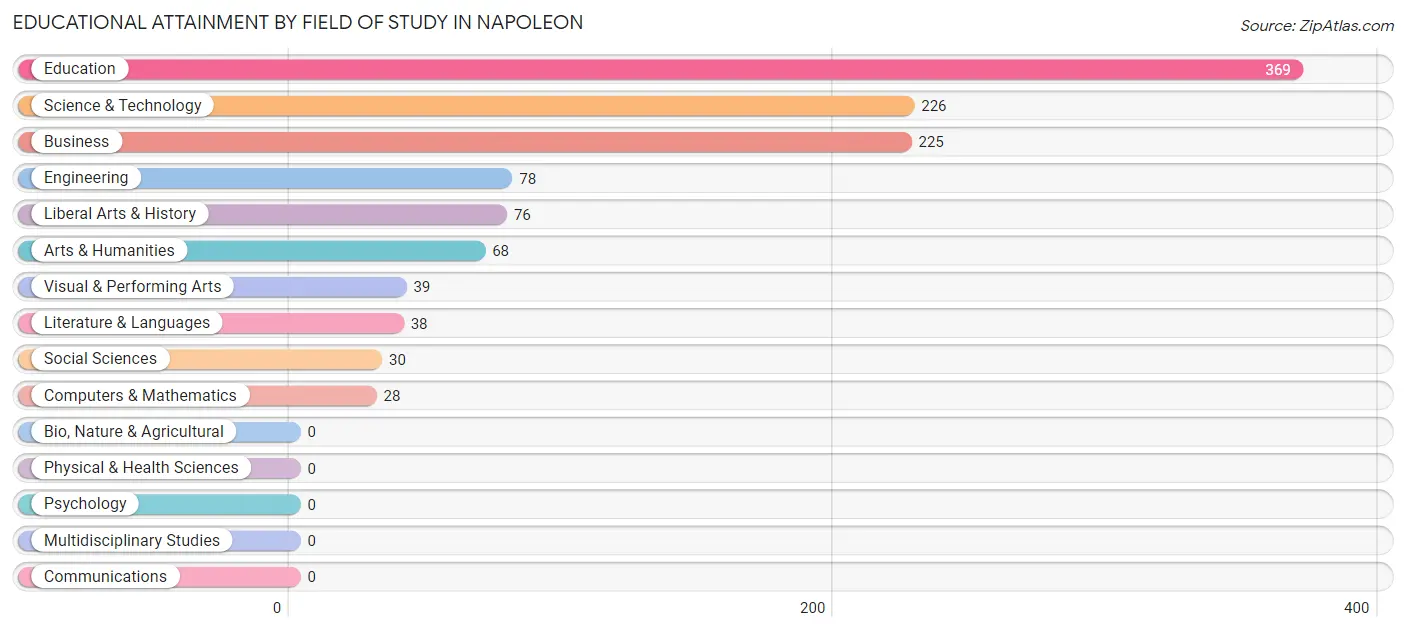
Educational Attainment by Field of Study in Napoleon
Education (369 | 31.4%), science & technology (226 | 19.2%), business (225 | 19.1%), engineering (78 | 6.6%), and liberal arts & history (76 | 6.5%) are the most common fields of study among 1,177 individuals in Napoleon who have obtained a bachelor's degree or higher.
| Field of Study | # Graduates | % Graduates |
| Computers & Mathematics | 28 | 2.4% |
| Bio, Nature & Agricultural | 0 | 0.0% |
| Physical & Health Sciences | 0 | 0.0% |
| Psychology | 0 | 0.0% |
| Social Sciences | 30 | 2.5% |
| Engineering | 78 | 6.6% |
| Multidisciplinary Studies | 0 | 0.0% |
| Science & Technology | 226 | 19.2% |
| Business | 225 | 19.1% |
| Education | 369 | 31.4% |
| Literature & Languages | 38 | 3.2% |
| Liberal Arts & History | 76 | 6.5% |
| Visual & Performing Arts | 39 | 3.3% |
| Communications | 0 | 0.0% |
| Arts & Humanities | 68 | 5.8% |
| Total | 1,177 | 100.0% |
Transportation & Commute in Napoleon
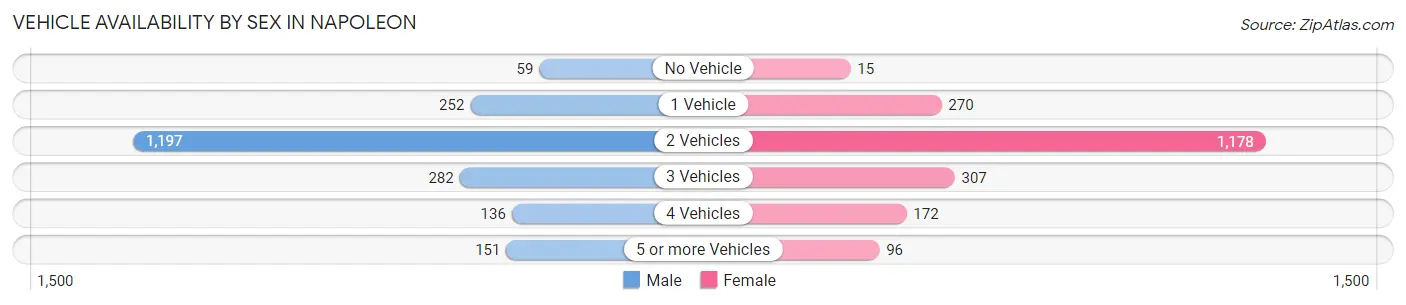
Vehicle Availability by Sex in Napoleon
The most prevalent vehicle ownership categories in Napoleon are males with 2 vehicles (1,197, accounting for 57.6%) and females with 2 vehicles (1,178, making up 58.7%).
| Vehicles Available | Male | Female |
| No Vehicle | 59 (2.8%) | 15 (0.7%) |
| 1 Vehicle | 252 (12.1%) | 270 (13.3%) |
| 2 Vehicles | 1,197 (57.6%) | 1,178 (57.8%) |
| 3 Vehicles | 282 (13.6%) | 307 (15.1%) |
| 4 Vehicles | 136 (6.6%) | 172 (8.4%) |
| 5 or more Vehicles | 151 (7.3%) | 96 (4.7%) |
| Total | 2,077 (100.0%) | 2,038 (100.0%) |
Commute Time in Napoleon
The most frequently occuring commute durations in Napoleon are 5 to 9 minutes (1,267 commuters, 31.6%), 20 to 24 minutes (654 commuters, 16.3%), and 10 to 14 minutes (521 commuters, 13.0%).
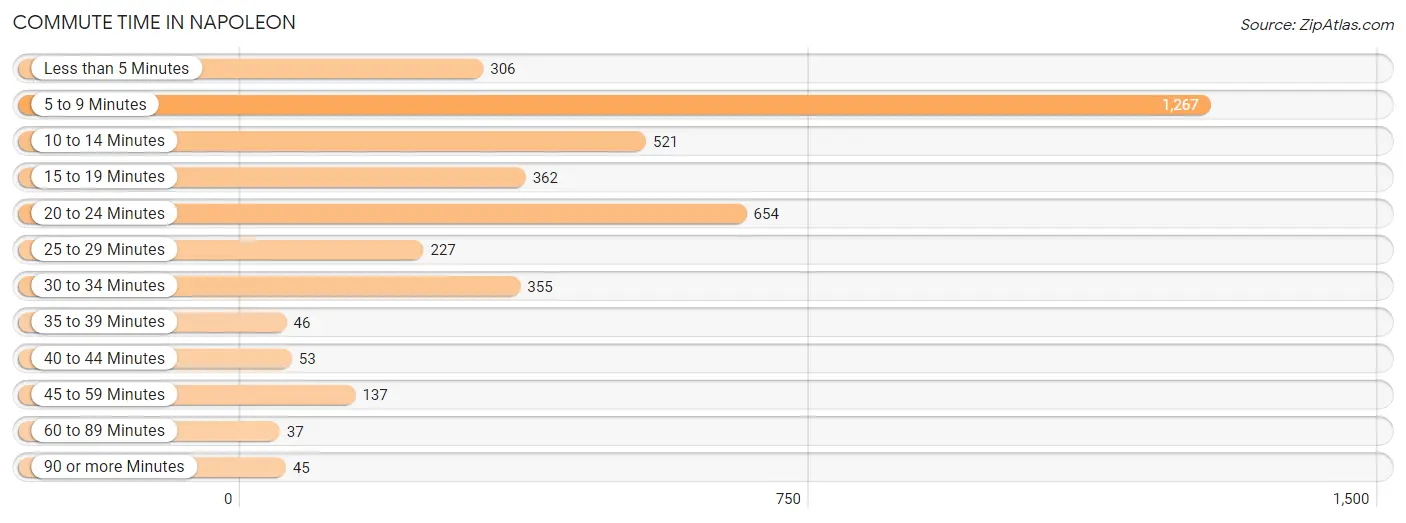
| Commute Time | # Commuters | % Commuters |
| Less than 5 Minutes | 306 | 7.6% |
| 5 to 9 Minutes | 1,267 | 31.6% |
| 10 to 14 Minutes | 521 | 13.0% |
| 15 to 19 Minutes | 362 | 9.0% |
| 20 to 24 Minutes | 654 | 16.3% |
| 25 to 29 Minutes | 227 | 5.7% |
| 30 to 34 Minutes | 355 | 8.8% |
| 35 to 39 Minutes | 46 | 1.1% |
| 40 to 44 Minutes | 53 | 1.3% |
| 45 to 59 Minutes | 137 | 3.4% |
| 60 to 89 Minutes | 37 | 0.9% |
| 90 or more Minutes | 45 | 1.1% |
Commute Time by Sex in Napoleon
The most common commute times in Napoleon are 5 to 9 minutes (694 commuters, 33.4%) for males and 5 to 9 minutes (573 commuters, 29.7%) for females.
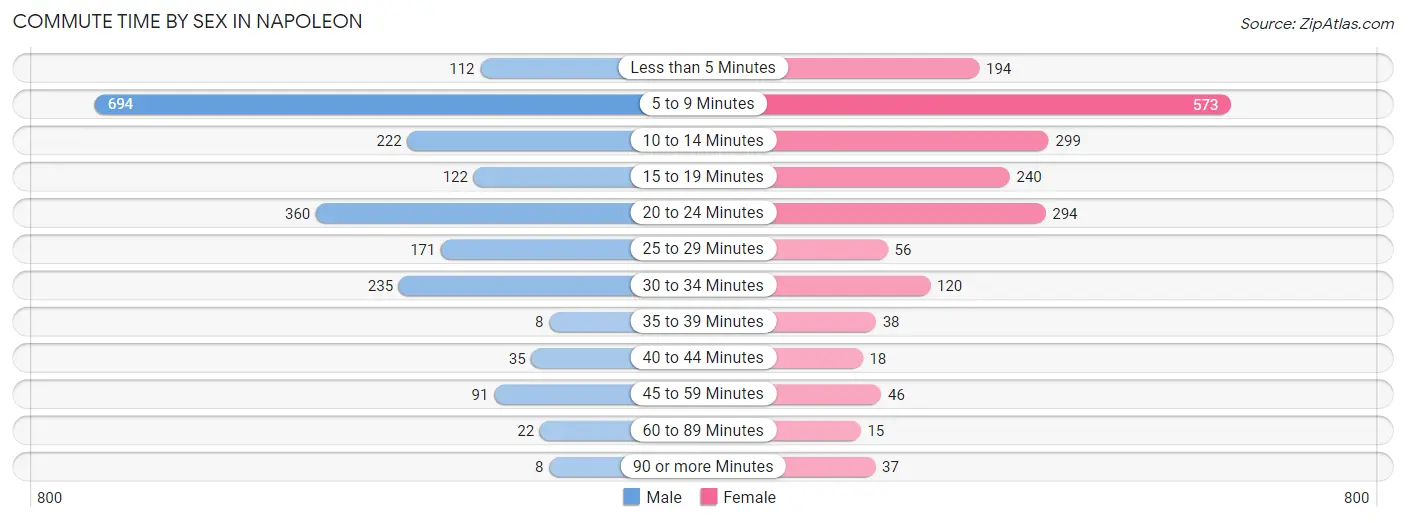
| Commute Time | Male | Female |
| Less than 5 Minutes | 112 (5.4%) | 194 (10.1%) |
| 5 to 9 Minutes | 694 (33.4%) | 573 (29.7%) |
| 10 to 14 Minutes | 222 (10.7%) | 299 (15.5%) |
| 15 to 19 Minutes | 122 (5.9%) | 240 (12.4%) |
| 20 to 24 Minutes | 360 (17.3%) | 294 (15.2%) |
| 25 to 29 Minutes | 171 (8.2%) | 56 (2.9%) |
| 30 to 34 Minutes | 235 (11.3%) | 120 (6.2%) |
| 35 to 39 Minutes | 8 (0.4%) | 38 (2.0%) |
| 40 to 44 Minutes | 35 (1.7%) | 18 (0.9%) |
| 45 to 59 Minutes | 91 (4.4%) | 46 (2.4%) |
| 60 to 89 Minutes | 22 (1.1%) | 15 (0.8%) |
| 90 or more Minutes | 8 (0.4%) | 37 (1.9%) |
Time of Departure to Work by Sex in Napoleon
The most frequent times of departure to work in Napoleon are 6:30 AM to 6:59 AM (330, 15.9%) for males and 7:30 AM to 7:59 AM (446, 23.1%) for females.
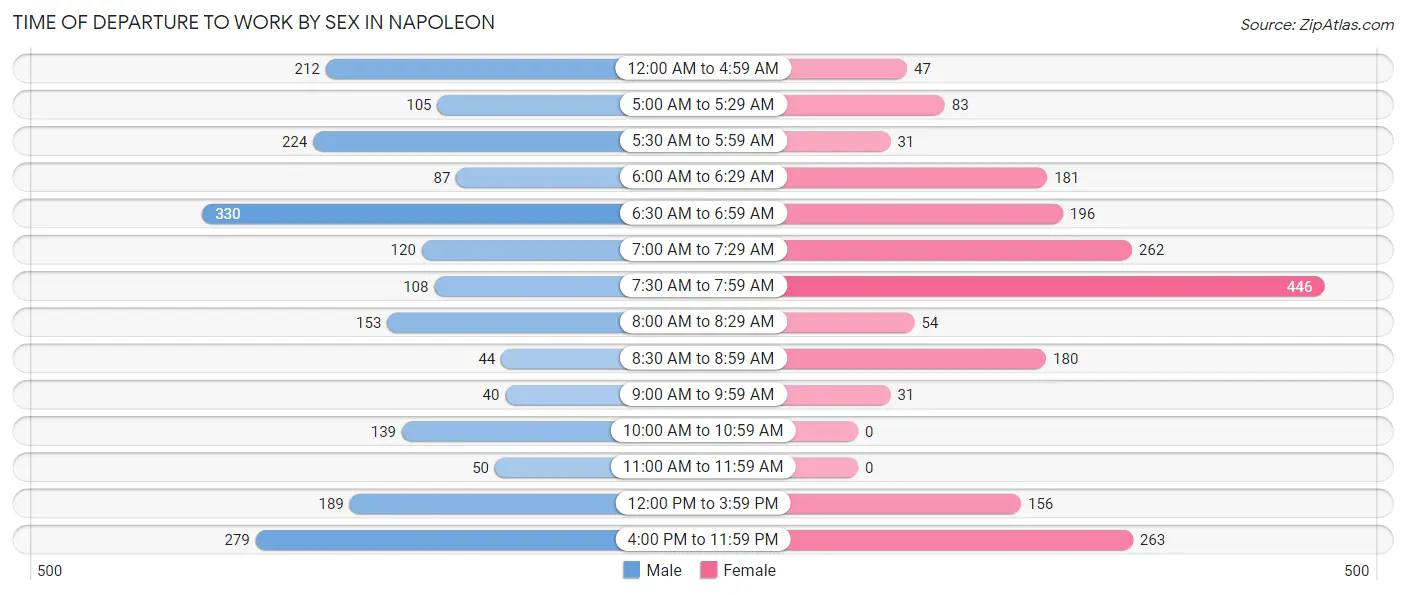
| Time of Departure | Male | Female |
| 12:00 AM to 4:59 AM | 212 (10.2%) | 47 (2.4%) |
| 5:00 AM to 5:29 AM | 105 (5.1%) | 83 (4.3%) |
| 5:30 AM to 5:59 AM | 224 (10.8%) | 31 (1.6%) |
| 6:00 AM to 6:29 AM | 87 (4.2%) | 181 (9.4%) |
| 6:30 AM to 6:59 AM | 330 (15.9%) | 196 (10.2%) |
| 7:00 AM to 7:29 AM | 120 (5.8%) | 262 (13.6%) |
| 7:30 AM to 7:59 AM | 108 (5.2%) | 446 (23.1%) |
| 8:00 AM to 8:29 AM | 153 (7.4%) | 54 (2.8%) |
| 8:30 AM to 8:59 AM | 44 (2.1%) | 180 (9.3%) |
| 9:00 AM to 9:59 AM | 40 (1.9%) | 31 (1.6%) |
| 10:00 AM to 10:59 AM | 139 (6.7%) | 0 (0.0%) |
| 11:00 AM to 11:59 AM | 50 (2.4%) | 0 (0.0%) |
| 12:00 PM to 3:59 PM | 189 (9.1%) | 156 (8.1%) |
| 4:00 PM to 11:59 PM | 279 (13.4%) | 263 (13.6%) |
| Total | 2,080 (100.0%) | 1,930 (100.0%) |
Housing Occupancy in Napoleon
Occupancy by Ownership in Napoleon
Of the total 3,751 dwellings in Napoleon, owner-occupied units account for 2,476 (66.0%), while renter-occupied units make up 1,275 (34.0%).
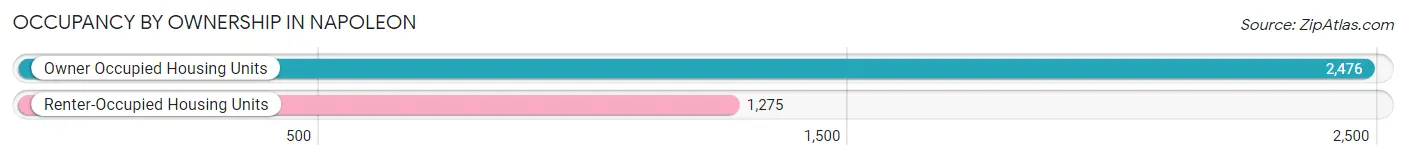
| Occupancy | # Housing Units | % Housing Units |
| Owner Occupied Housing Units | 2,476 | 66.0% |
| Renter-Occupied Housing Units | 1,275 | 34.0% |
| Total Occupied Housing Units | 3,751 | 100.0% |
Occupancy by Household Size in Napoleon
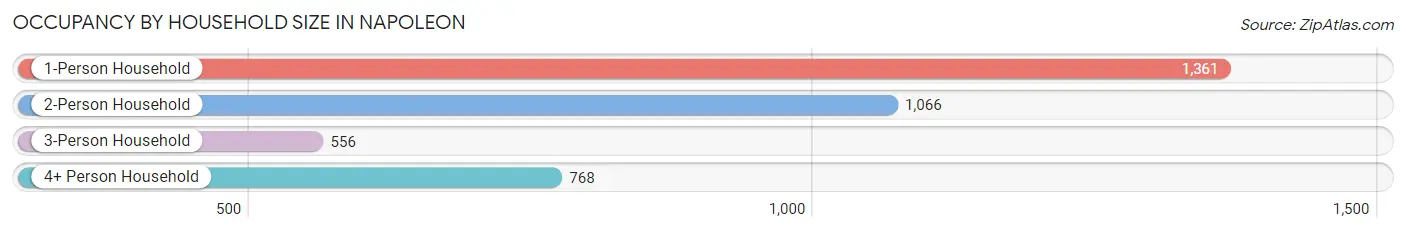
| Household Size | # Housing Units | % Housing Units |
| 1-Person Household | 1,361 | 36.3% |
| 2-Person Household | 1,066 | 28.4% |
| 3-Person Household | 556 | 14.8% |
| 4+ Person Household | 768 | 20.5% |
| Total Housing Units | 3,751 | 100.0% |
Occupancy by Ownership by Household Size in Napoleon
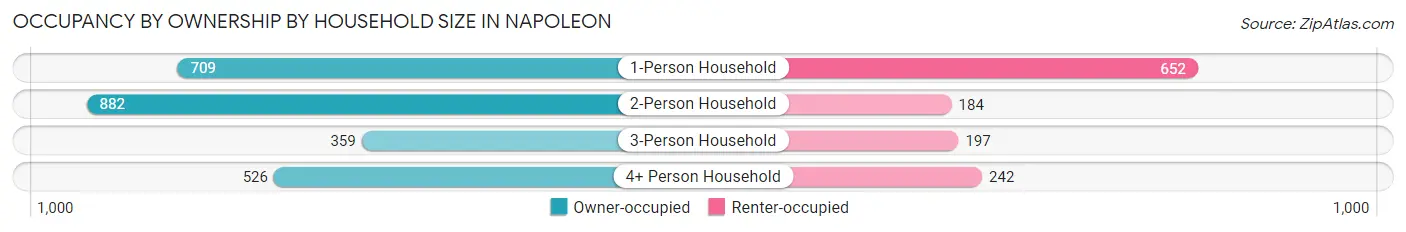
| Household Size | Owner-occupied | Renter-occupied |
| 1-Person Household | 709 (52.1%) | 652 (47.9%) |
| 2-Person Household | 882 (82.7%) | 184 (17.3%) |
| 3-Person Household | 359 (64.6%) | 197 (35.4%) |
| 4+ Person Household | 526 (68.5%) | 242 (31.5%) |
| Total Housing Units | 2,476 (66.0%) | 1,275 (34.0%) |
Occupancy by Educational Attainment in Napoleon
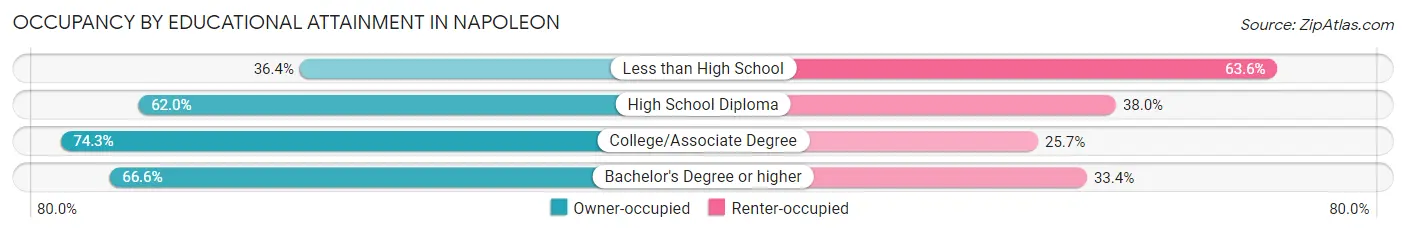
| Household Size | Owner-occupied | Renter-occupied |
| Less than High School | 52 (36.4%) | 91 (63.6%) |
| High School Diploma | 1,043 (62.0%) | 640 (38.0%) |
| College/Associate Degree | 955 (74.3%) | 330 (25.7%) |
| Bachelor's Degree or higher | 426 (66.6%) | 214 (33.4%) |
Occupancy by Age of Householder in Napoleon
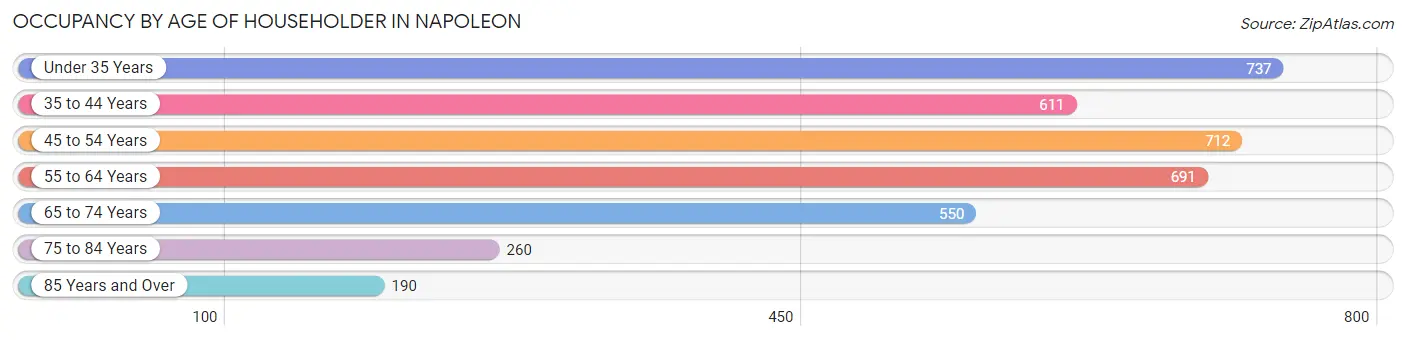
| Age Bracket | # Households | % Households |
| Under 35 Years | 737 | 19.7% |
| 35 to 44 Years | 611 | 16.3% |
| 45 to 54 Years | 712 | 19.0% |
| 55 to 64 Years | 691 | 18.4% |
| 65 to 74 Years | 550 | 14.7% |
| 75 to 84 Years | 260 | 6.9% |
| 85 Years and Over | 190 | 5.1% |
| Total | 3,751 | 100.0% |
Housing Finances in Napoleon
Median Income by Occupancy in Napoleon
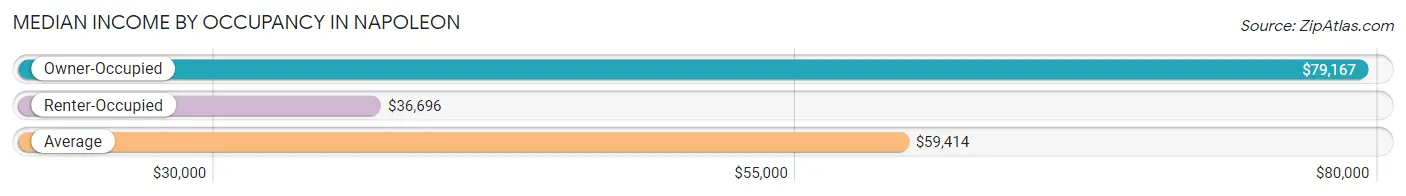
| Occupancy Type | # Households | Median Income |
| Owner-Occupied | 2,476 (66.0%) | $79,167 |
| Renter-Occupied | 1,275 (34.0%) | $36,696 |
| Average | 3,751 (100.0%) | $59,414 |
Occupancy by Householder Income Bracket in Napoleon
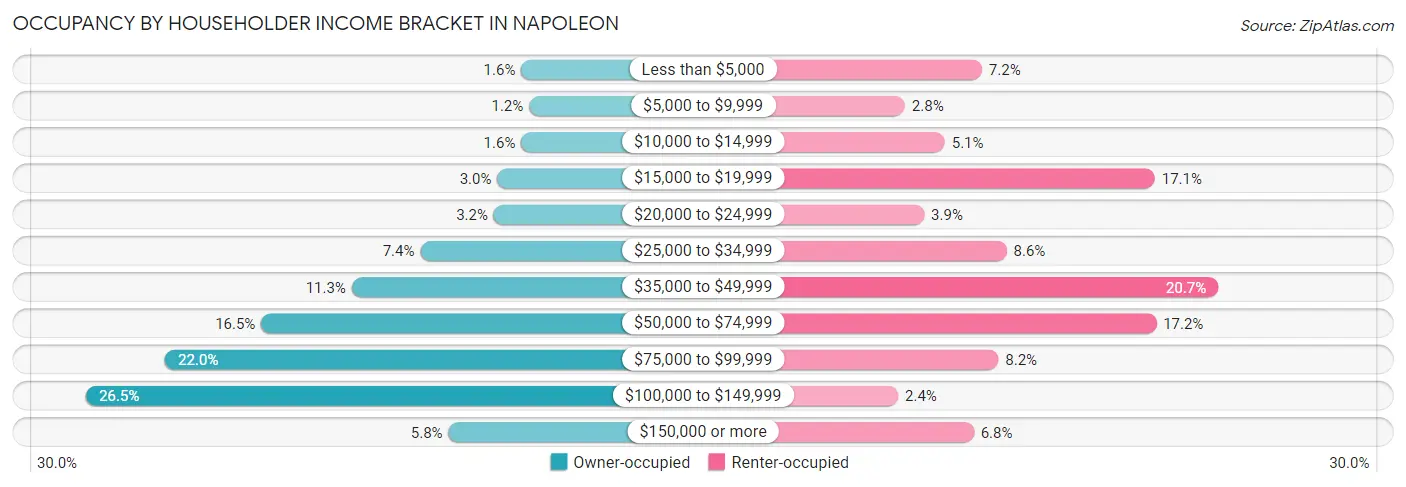
| Income Bracket | Owner-occupied | Renter-occupied |
| Less than $5,000 | 40 (1.6%) | 92 (7.2%) |
| $5,000 to $9,999 | 29 (1.2%) | 36 (2.8%) |
| $10,000 to $14,999 | 40 (1.6%) | 65 (5.1%) |
| $15,000 to $19,999 | 74 (3.0%) | 218 (17.1%) |
| $20,000 to $24,999 | 79 (3.2%) | 50 (3.9%) |
| $25,000 to $34,999 | 183 (7.4%) | 110 (8.6%) |
| $35,000 to $49,999 | 280 (11.3%) | 264 (20.7%) |
| $50,000 to $74,999 | 408 (16.5%) | 219 (17.2%) |
| $75,000 to $99,999 | 544 (22.0%) | 104 (8.2%) |
| $100,000 to $149,999 | 656 (26.5%) | 31 (2.4%) |
| $150,000 or more | 143 (5.8%) | 86 (6.8%) |
| Total | 2,476 (100.0%) | 1,275 (100.0%) |
Monthly Housing Cost Tiers in Napoleon
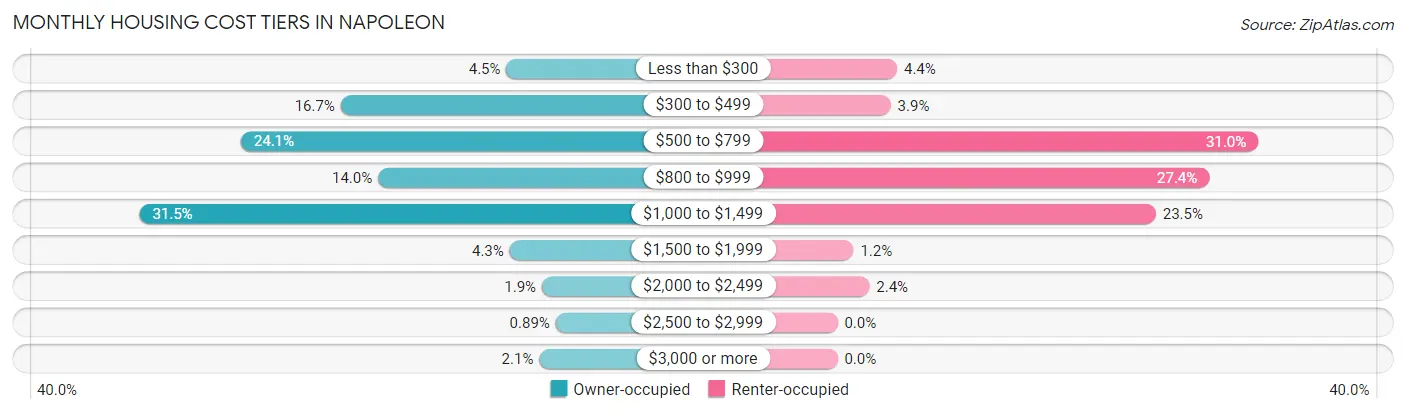
| Monthly Cost | Owner-occupied | Renter-occupied |
| Less than $300 | 112 (4.5%) | 56 (4.4%) |
| $300 to $499 | 414 (16.7%) | 50 (3.9%) |
| $500 to $799 | 596 (24.1%) | 395 (31.0%) |
| $800 to $999 | 346 (14.0%) | 349 (27.4%) |
| $1,000 to $1,499 | 781 (31.5%) | 299 (23.4%) |
| $1,500 to $1,999 | 106 (4.3%) | 15 (1.2%) |
| $2,000 to $2,499 | 47 (1.9%) | 30 (2.4%) |
| $2,500 to $2,999 | 22 (0.9%) | 0 (0.0%) |
| $3,000 or more | 52 (2.1%) | 0 (0.0%) |
| Total | 2,476 (100.0%) | 1,275 (100.0%) |
Physical Housing Characteristics in Napoleon
Housing Structures in Napoleon
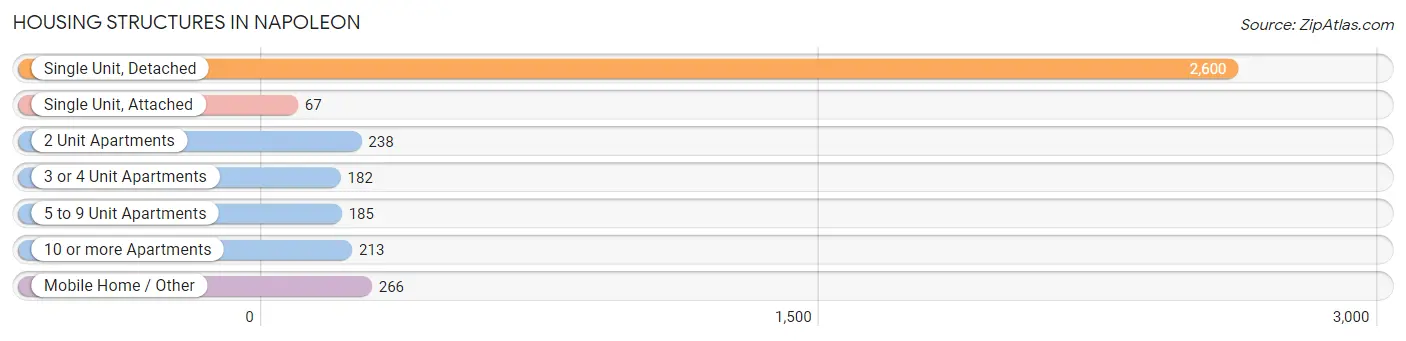
| Structure Type | # Housing Units | % Housing Units |
| Single Unit, Detached | 2,600 | 69.3% |
| Single Unit, Attached | 67 | 1.8% |
| 2 Unit Apartments | 238 | 6.3% |
| 3 or 4 Unit Apartments | 182 | 4.9% |
| 5 to 9 Unit Apartments | 185 | 4.9% |
| 10 or more Apartments | 213 | 5.7% |
| Mobile Home / Other | 266 | 7.1% |
| Total | 3,751 | 100.0% |
Housing Structures by Occupancy in Napoleon
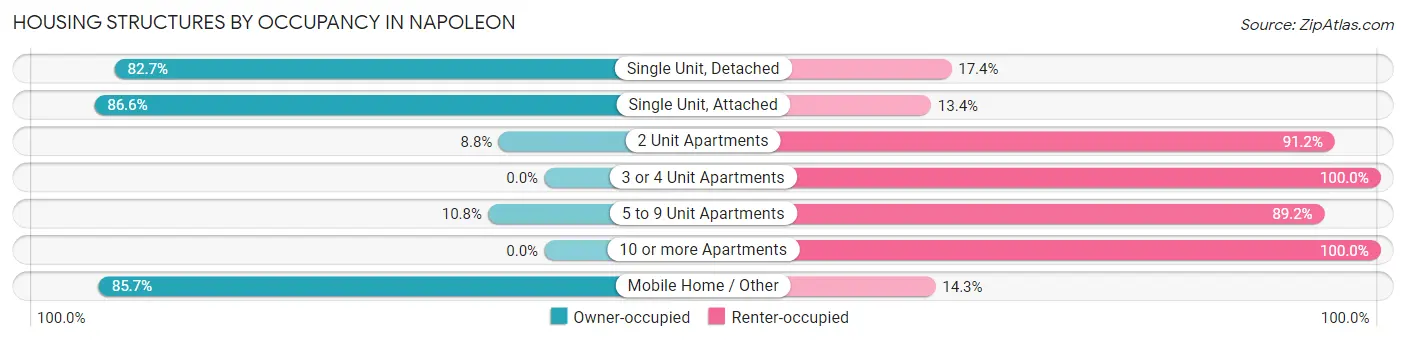
| Structure Type | Owner-occupied | Renter-occupied |
| Single Unit, Detached | 2,149 (82.7%) | 451 (17.3%) |
| Single Unit, Attached | 58 (86.6%) | 9 (13.4%) |
| 2 Unit Apartments | 21 (8.8%) | 217 (91.2%) |
| 3 or 4 Unit Apartments | 0 (0.0%) | 182 (100.0%) |
| 5 to 9 Unit Apartments | 20 (10.8%) | 165 (89.2%) |
| 10 or more Apartments | 0 (0.0%) | 213 (100.0%) |
| Mobile Home / Other | 228 (85.7%) | 38 (14.3%) |
| Total | 2,476 (66.0%) | 1,275 (34.0%) |
Housing Structures by Number of Rooms in Napoleon
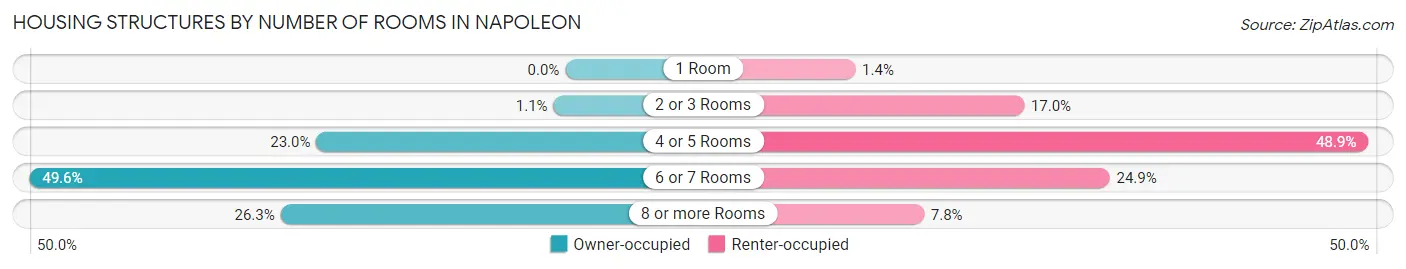
| Number of Rooms | Owner-occupied | Renter-occupied |
| 1 Room | 0 (0.0%) | 18 (1.4%) |
| 2 or 3 Rooms | 27 (1.1%) | 217 (17.0%) |
| 4 or 5 Rooms | 570 (23.0%) | 623 (48.9%) |
| 6 or 7 Rooms | 1,227 (49.6%) | 318 (24.9%) |
| 8 or more Rooms | 652 (26.3%) | 99 (7.8%) |
| Total | 2,476 (100.0%) | 1,275 (100.0%) |
Housing Structure by Heating Type in Napoleon
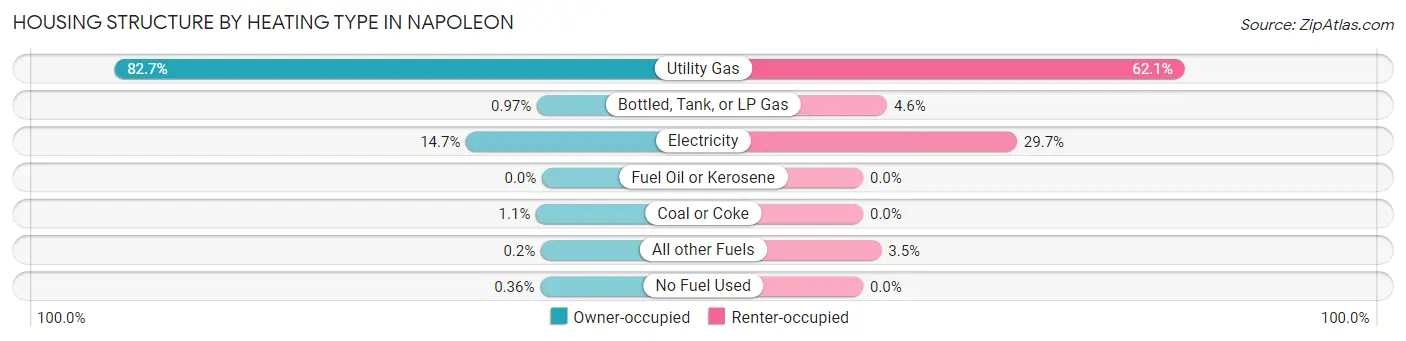
| Heating Type | Owner-occupied | Renter-occupied |
| Utility Gas | 2,047 (82.7%) | 792 (62.1%) |
| Bottled, Tank, or LP Gas | 24 (1.0%) | 59 (4.6%) |
| Electricity | 363 (14.7%) | 379 (29.7%) |
| Fuel Oil or Kerosene | 0 (0.0%) | 0 (0.0%) |
| Coal or Coke | 28 (1.1%) | 0 (0.0%) |
| All other Fuels | 5 (0.2%) | 45 (3.5%) |
| No Fuel Used | 9 (0.4%) | 0 (0.0%) |
| Total | 2,476 (100.0%) | 1,275 (100.0%) |
Household Vehicle Usage in Napoleon
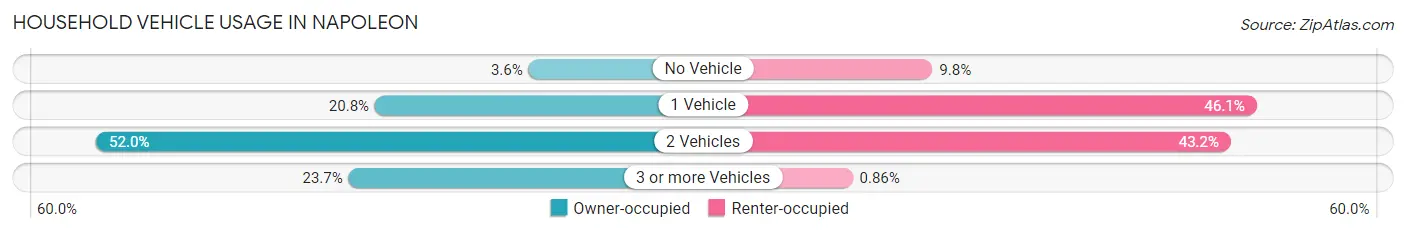
| Vehicles per Household | Owner-occupied | Renter-occupied |
| No Vehicle | 88 (3.5%) | 125 (9.8%) |
| 1 Vehicle | 514 (20.8%) | 588 (46.1%) |
| 2 Vehicles | 1,287 (52.0%) | 551 (43.2%) |
| 3 or more Vehicles | 587 (23.7%) | 11 (0.9%) |
| Total | 2,476 (100.0%) | 1,275 (100.0%) |
Real Estate & Mortgages in Napoleon
Real Estate and Mortgage Overview in Napoleon
| Characteristic | Without Mortgage | With Mortgage |
| Housing Units | 1,106 | 1,370 |
| Median Property Value | $134,400 | $140,900 |
| Median Household Income | $55,000 | $112 |
| Monthly Housing Costs | $512 | $33 |
| Real Estate Taxes | $1,619 | $25 |
Property Value by Mortgage Status in Napoleon
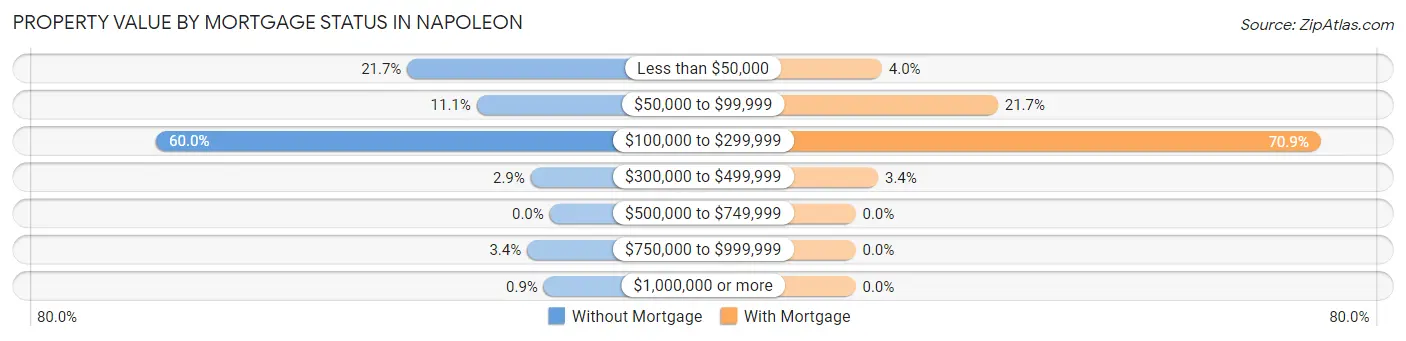
| Property Value | Without Mortgage | With Mortgage |
| Less than $50,000 | 240 (21.7%) | 55 (4.0%) |
| $50,000 to $99,999 | 123 (11.1%) | 297 (21.7%) |
| $100,000 to $299,999 | 663 (60.0%) | 971 (70.9%) |
| $300,000 to $499,999 | 32 (2.9%) | 47 (3.4%) |
| $500,000 to $749,999 | 0 (0.0%) | 0 (0.0%) |
| $750,000 to $999,999 | 38 (3.4%) | 0 (0.0%) |
| $1,000,000 or more | 10 (0.9%) | 0 (0.0%) |
| Total | 1,106 (100.0%) | 1,370 (100.0%) |
Household Income by Mortgage Status in Napoleon
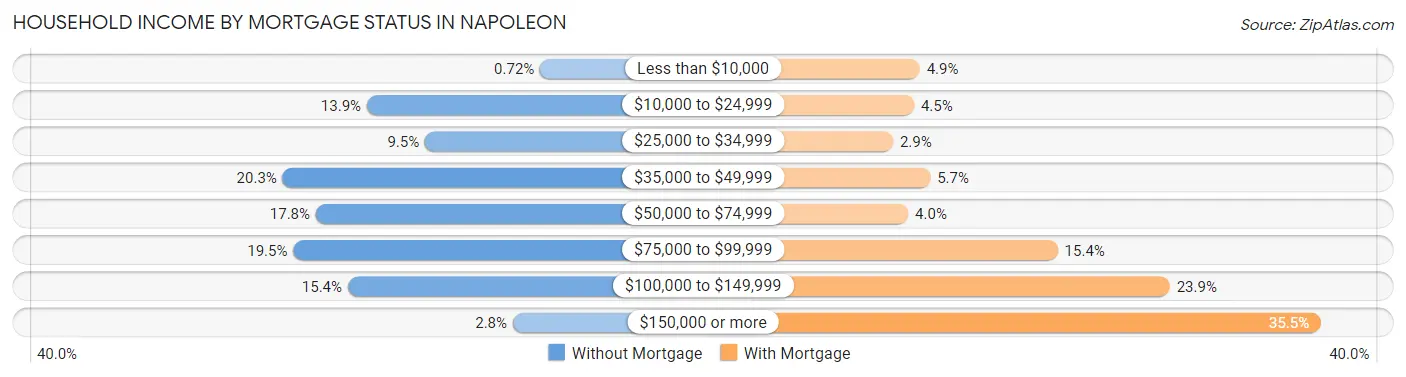
| Household Income | Without Mortgage | With Mortgage |
| Less than $10,000 | 8 (0.7%) | 67 (4.9%) |
| $10,000 to $24,999 | 154 (13.9%) | 61 (4.4%) |
| $25,000 to $34,999 | 105 (9.5%) | 39 (2.9%) |
| $35,000 to $49,999 | 225 (20.3%) | 78 (5.7%) |
| $50,000 to $74,999 | 197 (17.8%) | 55 (4.0%) |
| $75,000 to $99,999 | 216 (19.5%) | 211 (15.4%) |
| $100,000 to $149,999 | 170 (15.4%) | 328 (23.9%) |
| $150,000 or more | 31 (2.8%) | 486 (35.5%) |
| Total | 1,106 (100.0%) | 1,370 (100.0%) |
Property Value to Household Income Ratio in Napoleon
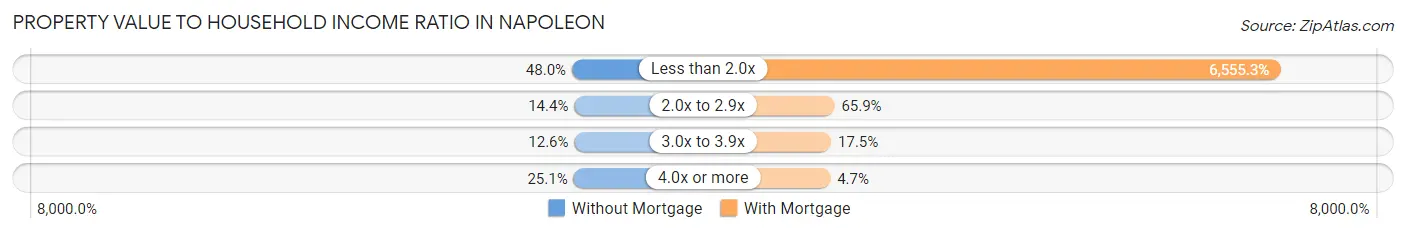
| Value-to-Income Ratio | Without Mortgage | With Mortgage |
| Less than 2.0x | 531 (48.0%) | 89,808 (6,555.3%) |
| 2.0x to 2.9x | 159 (14.4%) | 903 (65.9%) |
| 3.0x to 3.9x | 139 (12.6%) | 239 (17.4%) |
| 4.0x or more | 277 (25.1%) | 64 (4.7%) |
| Total | 1,106 (100.0%) | 1,370 (100.0%) |
Real Estate Taxes by Mortgage Status in Napoleon
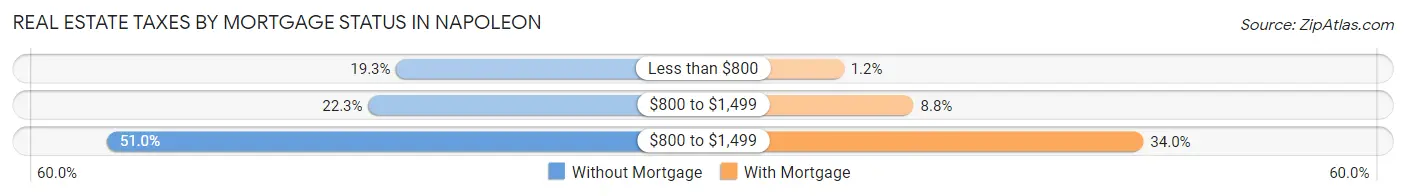
| Property Taxes | Without Mortgage | With Mortgage |
| Less than $800 | 213 (19.3%) | 16 (1.2%) |
| $800 to $1,499 | 247 (22.3%) | 121 (8.8%) |
| $800 to $1,499 | 564 (51.0%) | 466 (34.0%) |
| Total | 1,106 (100.0%) | 1,370 (100.0%) |
Health & Disability in Napoleon
Health Insurance Coverage by Age in Napoleon
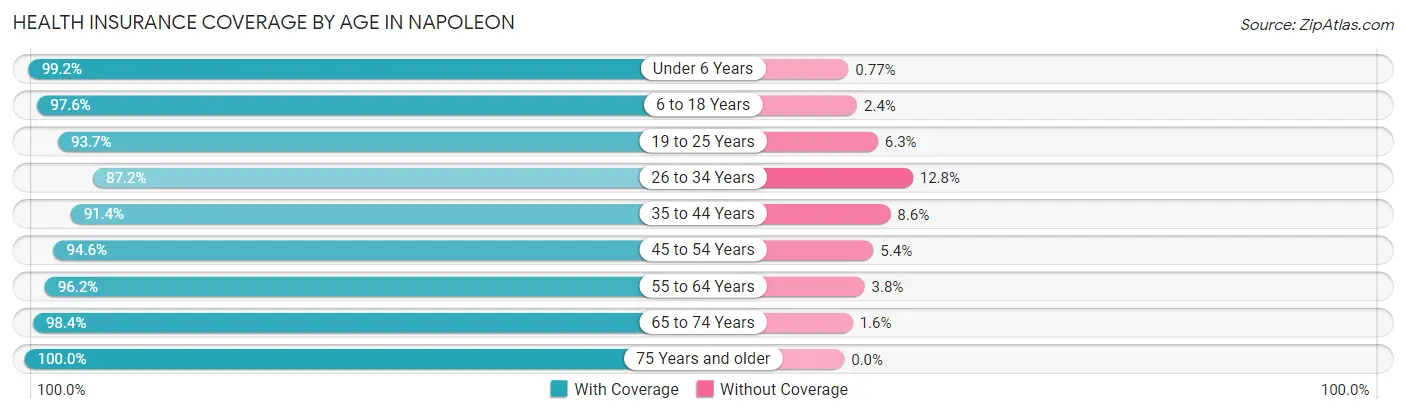
| Age Bracket | With Coverage | Without Coverage |
| Under 6 Years | 773 (99.2%) | 6 (0.8%) |
| 6 to 18 Years | 1,675 (97.6%) | 41 (2.4%) |
| 19 to 25 Years | 434 (93.7%) | 29 (6.3%) |
| 26 to 34 Years | 963 (87.2%) | 141 (12.8%) |
| 35 to 44 Years | 914 (91.4%) | 86 (8.6%) |
| 45 to 54 Years | 1,044 (94.6%) | 60 (5.4%) |
| 55 to 64 Years | 1,066 (96.2%) | 42 (3.8%) |
| 65 to 74 Years | 754 (98.4%) | 12 (1.6%) |
| 75 Years and older | 671 (100.0%) | 0 (0.0%) |
| Total | 8,294 (95.2%) | 417 (4.8%) |
Health Insurance Coverage by Citizenship Status in Napoleon
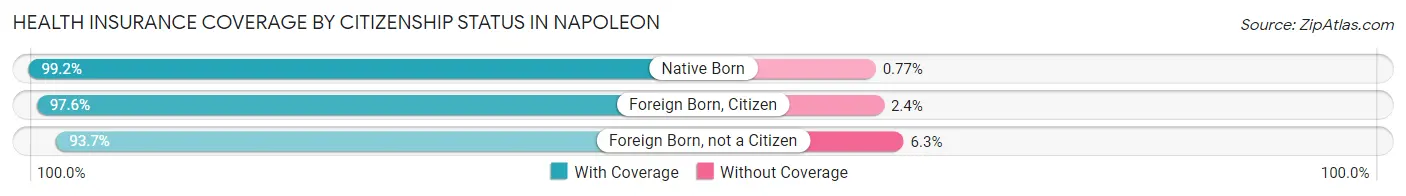
| Citizenship Status | With Coverage | Without Coverage |
| Native Born | 773 (99.2%) | 6 (0.8%) |
| Foreign Born, Citizen | 1,675 (97.6%) | 41 (2.4%) |
| Foreign Born, not a Citizen | 434 (93.7%) | 29 (6.3%) |
Health Insurance Coverage by Household Income in Napoleon
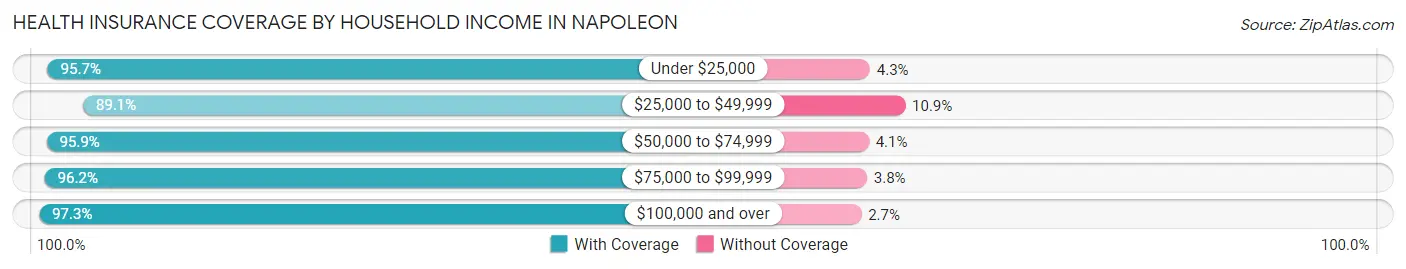
| Household Income | With Coverage | Without Coverage |
| Under $25,000 | 1,219 (95.7%) | 55 (4.3%) |
| $25,000 to $49,999 | 1,305 (89.1%) | 160 (10.9%) |
| $50,000 to $74,999 | 1,659 (95.9%) | 71 (4.1%) |
| $75,000 to $99,999 | 1,588 (96.2%) | 62 (3.8%) |
| $100,000 and over | 2,484 (97.3%) | 69 (2.7%) |
Public vs Private Health Insurance Coverage by Age in Napoleon
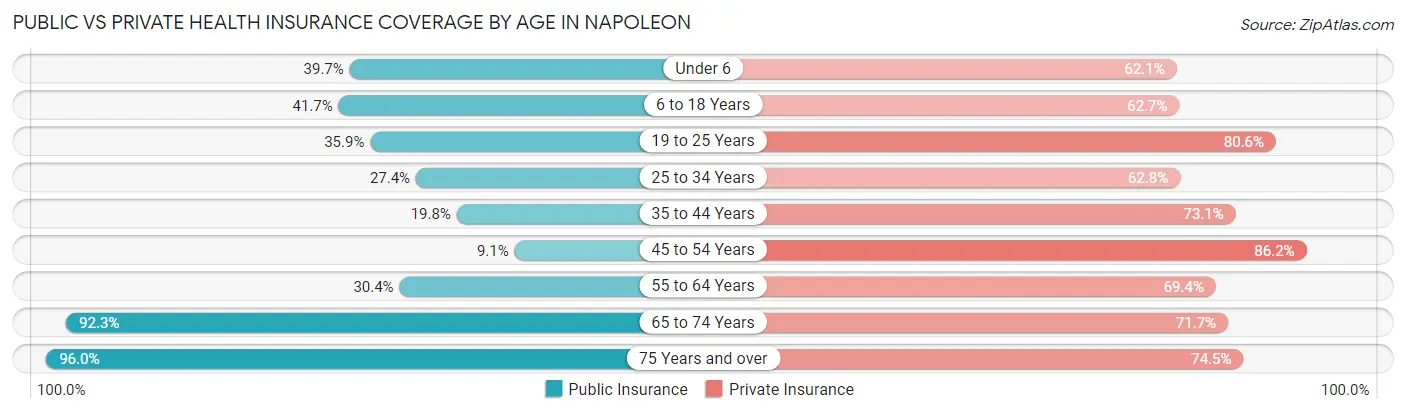
| Age Bracket | Public Insurance | Private Insurance |
| Under 6 | 309 (39.7%) | 484 (62.1%) |
| 6 to 18 Years | 716 (41.7%) | 1,075 (62.6%) |
| 19 to 25 Years | 166 (35.8%) | 373 (80.6%) |
| 25 to 34 Years | 302 (27.4%) | 693 (62.8%) |
| 35 to 44 Years | 198 (19.8%) | 731 (73.1%) |
| 45 to 54 Years | 100 (9.1%) | 952 (86.2%) |
| 55 to 64 Years | 337 (30.4%) | 769 (69.4%) |
| 65 to 74 Years | 707 (92.3%) | 549 (71.7%) |
| 75 Years and over | 644 (96.0%) | 500 (74.5%) |
| Total | 3,479 (39.9%) | 6,126 (70.3%) |
Disability Status by Sex by Age in Napoleon
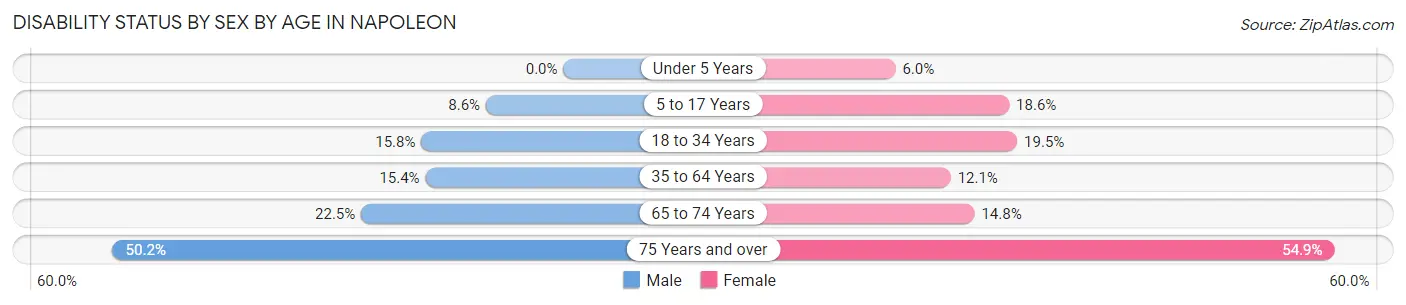
| Age Bracket | Male | Female |
| Under 5 Years | 0 (0.0%) | 22 (6.0%) |
| 5 to 17 Years | 79 (8.6%) | 142 (18.6%) |
| 18 to 34 Years | 134 (15.8%) | 159 (19.5%) |
| 35 to 64 Years | 235 (15.4%) | 204 (12.1%) |
| 65 to 74 Years | 75 (22.5%) | 64 (14.8%) |
| 75 Years and over | 130 (50.2%) | 226 (54.8%) |
Disability Class by Sex by Age in Napoleon
Disability Class: Hearing Difficulty
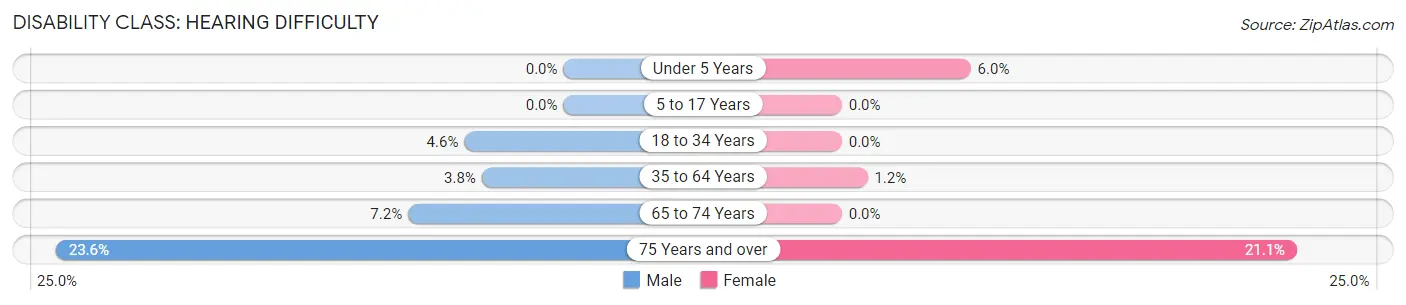
| Age Bracket | Male | Female |
| Under 5 Years | 0 (0.0%) | 22 (6.0%) |
| 5 to 17 Years | 0 (0.0%) | 0 (0.0%) |
| 18 to 34 Years | 39 (4.6%) | 0 (0.0%) |
| 35 to 64 Years | 58 (3.8%) | 20 (1.2%) |
| 65 to 74 Years | 24 (7.2%) | 0 (0.0%) |
| 75 Years and over | 61 (23.5%) | 87 (21.1%) |
Disability Class: Vision Difficulty
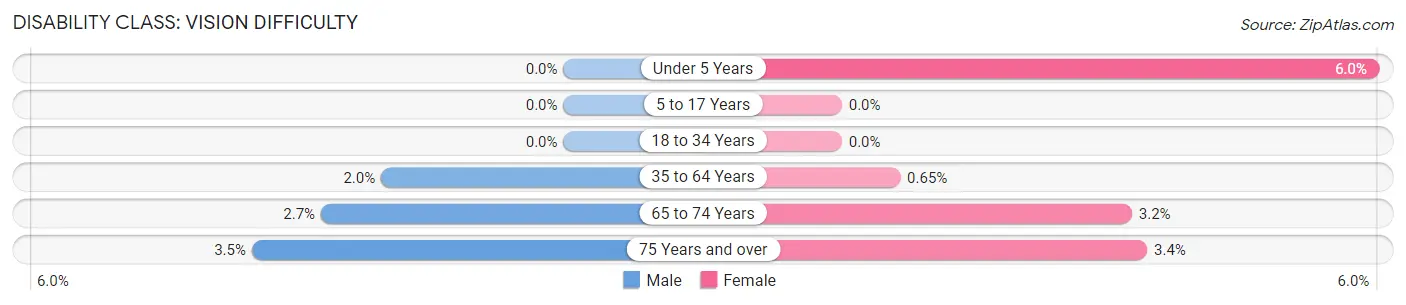
| Age Bracket | Male | Female |
| Under 5 Years | 0 (0.0%) | 22 (6.0%) |
| 5 to 17 Years | 0 (0.0%) | 0 (0.0%) |
| 18 to 34 Years | 0 (0.0%) | 0 (0.0%) |
| 35 to 64 Years | 31 (2.0%) | 11 (0.6%) |
| 65 to 74 Years | 9 (2.7%) | 14 (3.2%) |
| 75 Years and over | 9 (3.5%) | 14 (3.4%) |
Disability Class: Cognitive Difficulty
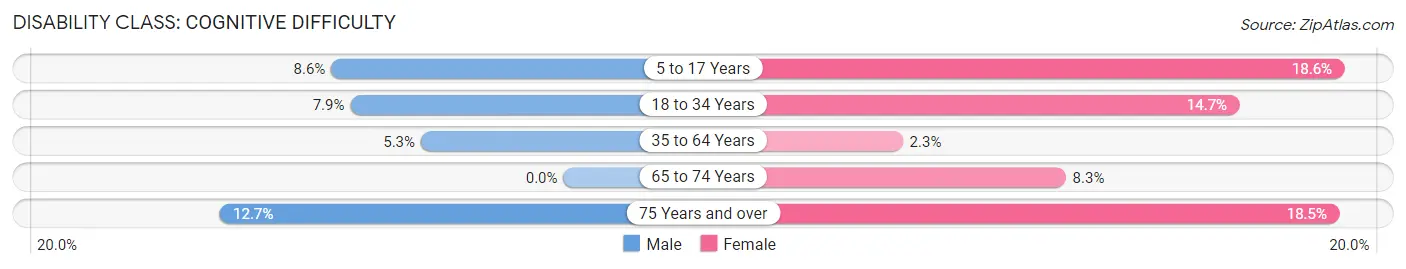
| Age Bracket | Male | Female |
| 5 to 17 Years | 79 (8.6%) | 142 (18.6%) |
| 18 to 34 Years | 67 (7.9%) | 120 (14.7%) |
| 35 to 64 Years | 81 (5.3%) | 38 (2.3%) |
| 65 to 74 Years | 0 (0.0%) | 36 (8.3%) |
| 75 Years and over | 33 (12.7%) | 76 (18.4%) |
Disability Class: Ambulatory Difficulty
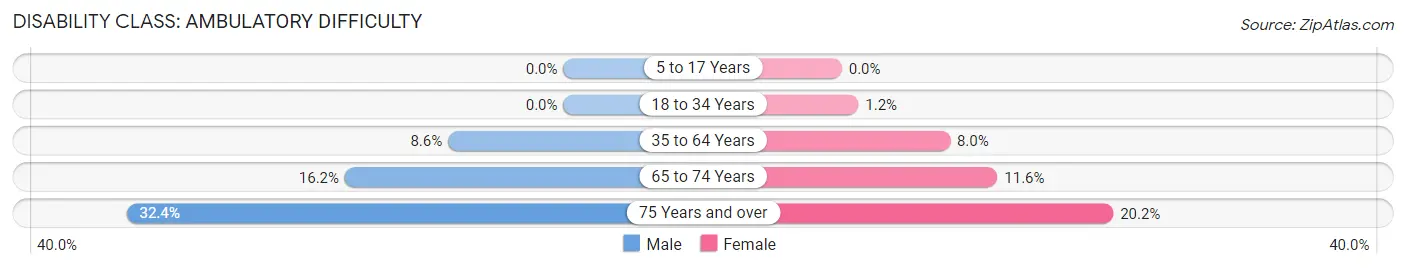
| Age Bracket | Male | Female |
| 5 to 17 Years | 0 (0.0%) | 0 (0.0%) |
| 18 to 34 Years | 0 (0.0%) | 10 (1.2%) |
| 35 to 64 Years | 131 (8.6%) | 135 (8.0%) |
| 65 to 74 Years | 54 (16.2%) | 50 (11.6%) |
| 75 Years and over | 84 (32.4%) | 83 (20.2%) |
Disability Class: Self-Care Difficulty
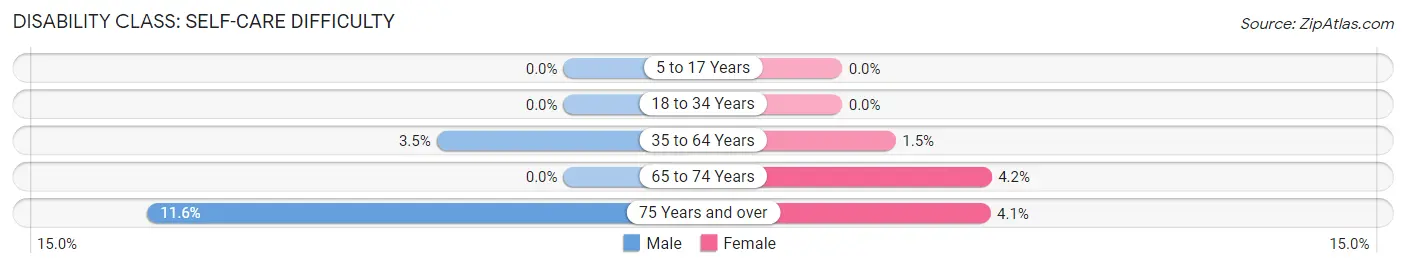
| Age Bracket | Male | Female |
| 5 to 17 Years | 0 (0.0%) | 0 (0.0%) |
| 18 to 34 Years | 0 (0.0%) | 0 (0.0%) |
| 35 to 64 Years | 54 (3.5%) | 25 (1.5%) |
| 65 to 74 Years | 0 (0.0%) | 18 (4.2%) |
| 75 Years and over | 30 (11.6%) | 17 (4.1%) |
Technology Access in Napoleon
Computing Device Access in Napoleon
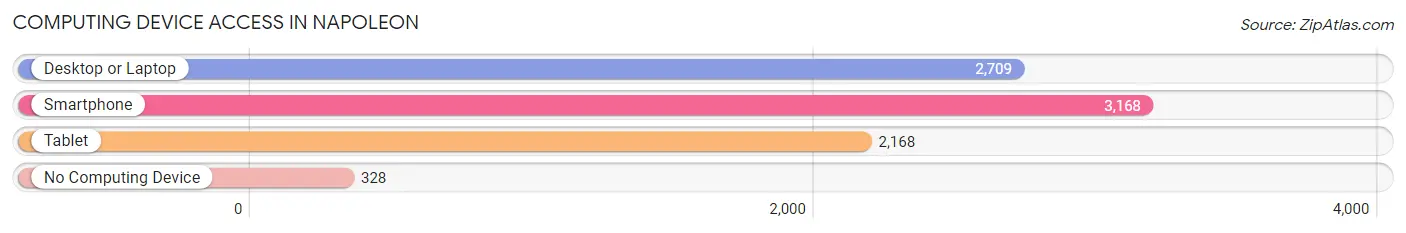
| Device Type | # Households | % Households |
| Desktop or Laptop | 2,709 | 72.2% |
| Smartphone | 3,168 | 84.5% |
| Tablet | 2,168 | 57.8% |
| No Computing Device | 328 | 8.7% |
| Total | 3,751 | 100.0% |
Internet Access in Napoleon
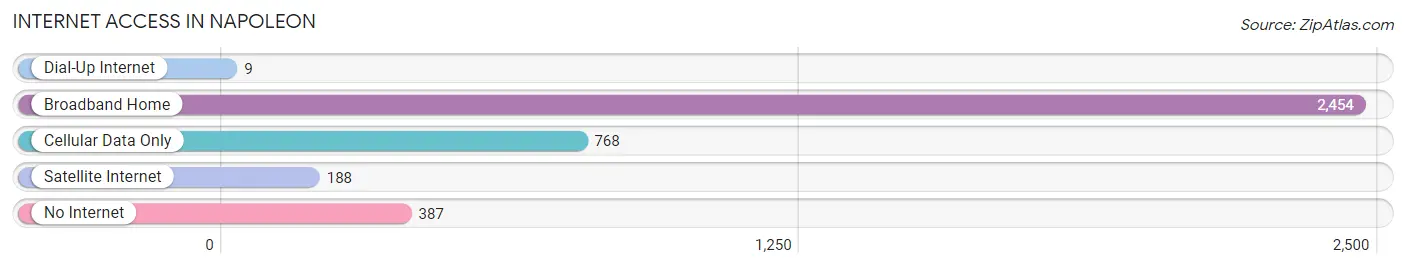
| Internet Type | # Households | % Households |
| Dial-Up Internet | 9 | 0.2% |
| Broadband Home | 2,454 | 65.4% |
| Cellular Data Only | 768 | 20.5% |
| Satellite Internet | 188 | 5.0% |
| No Internet | 387 | 10.3% |
| Total | 3,751 | 100.0% |
Napoleon Summary
Napoleon, Ohio is a city located in Henry County in the northwestern part of the state. It is the county seat and the largest city in the county. The city is situated along the Maumee River and is part of the Toledo Metropolitan Area. As of the 2010 census, the population of Napoleon was 8,739.
History
Napoleon was founded in 1832 by a group of settlers from Pennsylvania. The city was named after Napoleon Bonaparte, the French military leader and emperor. The city was incorporated in 1845 and was designated as the county seat of Henry County in 1852.
In the late 19th century, Napoleon was a major center for the production of agricultural products, including wheat, corn, and oats. The city was also home to several manufacturing companies, including a flour mill, a sawmill, and a furniture factory.
Geography
Napoleon is located at 41°17'N 84°20'W (41.2833, -84.3333). The city has a total area of 4.2 square miles, all of which is land.
The Maumee River runs through the city and is a major source of recreation for the area. The city is also home to several parks, including the Napoleon City Park, which features a playground, picnic areas, and a walking trail.
Economy
The economy of Napoleon is largely based on agriculture and manufacturing. The city is home to several agricultural businesses, including a grain elevator, a feed mill, and a dairy farm. The city is also home to several manufacturing companies, including a furniture factory, a plastics factory, and a metal fabrication plant.
Napoleon is also home to several retail businesses, including a grocery store, a hardware store, and several restaurants. The city is also home to a branch of the Henry County Bank.
Demographics
As of the 2010 census, the population of Napoleon was 8,739. The racial makeup of the city was 95.2% White, 0.7% African American, 0.3% Native American, 0.5% Asian, 0.1% Pacific Islander, 1.3% from other races, and 2.0% from two or more races. Hispanic or Latino of any race were 3.2% of the population.
The median household income in Napoleon was $41,945, and the median family income was $50,945. The per capita income was $20,945. About 11.2% of the population was below the poverty line.
Common Questions
What is Per Capita Income in Napoleon?
Per Capita income in Napoleon is $34,132.
What is the Median Family Income in Napoleon?
Median Family Income in Napoleon is $71,154.
What is the Median Household income in Napoleon?
Median Household Income in Napoleon is $59,414.
What is Income or Wage Gap in Napoleon?
Income or Wage Gap in Napoleon is 19.0%.
Women in Napoleon earn 81.0 cents for every dollar earned by a man.
What is Inequality or Gini Index in Napoleon?
Inequality or Gini Index in Napoleon is 0.46.
What is the Total Population of Napoleon?
Total Population of Napoleon is 8,888.
What is the Total Male Population of Napoleon?
Total Male Population of Napoleon is 4,277.
What is the Total Female Population of Napoleon?
Total Female Population of Napoleon is 4,611.
What is the Ratio of Males per 100 Females in Napoleon?
There are 92.76 Males per 100 Females in Napoleon.
What is the Ratio of Females per 100 Males in Napoleon?
There are 107.81 Females per 100 Males in Napoleon.
What is the Median Population Age in Napoleon?
Median Population Age in Napoleon is 39.4 Years.
What is the Average Family Size in Napoleon
Average Family Size in Napoleon is 3.0 People.
What is the Average Household Size in Napoleon
Average Household Size in Napoleon is 2.3 People.
How Large is the Labor Force in Napoleon?
There are 4,295 People in the Labor Forcein in Napoleon.
What is the Percentage of People in the Labor Force in Napoleon?
63.3% of People are in the Labor Force in Napoleon.
What is the Unemployment Rate in Napoleon?
Unemployment Rate in Napoleon is 2.8%.