Mount Sterling, OH Map & Demographics
Mount Sterling Map
Mount Sterling Overview
$26,741
PER CAPITA INCOME
$68,182
AVG FAMILY INCOME
$59,514
AVG HOUSEHOLD INCOME
27.1%
WAGE / INCOME GAP [ % ]
72.9¢/ $1
WAGE / INCOME GAP [ $ ]
0.35
INEQUALITY / GINI INDEX
1,890
TOTAL POPULATION
887
MALE POPULATION
1,003
FEMALE POPULATION
88.43
MALES / 100 FEMALES
113.08
FEMALES / 100 MALES
35.5
MEDIAN AGE
3.0
AVG FAMILY SIZE
2.4
AVG HOUSEHOLD SIZE
887
LABOR FORCE [ PEOPLE ]
60.8%
PERCENT IN LABOR FORCE
7.8%
UNEMPLOYMENT RATE
Mount Sterling Zip Codes
Mount Sterling Area Codes
Income in Mount Sterling
Income Overview in Mount Sterling
Per Capita Income in Mount Sterling is $26,741, while median incomes of families and households are $68,182 and $59,514 respectively.
| Characteristic | Number | Measure |
| Per Capita Income | 1,890 | $26,741 |
| Median Family Income | 498 | $68,182 |
| Mean Family Income | 498 | $74,881 |
| Median Household Income | 769 | $59,514 |
| Mean Household Income | 769 | $65,930 |
| Income Deficit | 498 | $0 |
| Wage / Income Gap (%) | 1,890 | 27.07% |
| Wage / Income Gap ($) | 1,890 | 72.93¢ per $1 |
| Gini / Inequality Index | 1,890 | 0.35 |
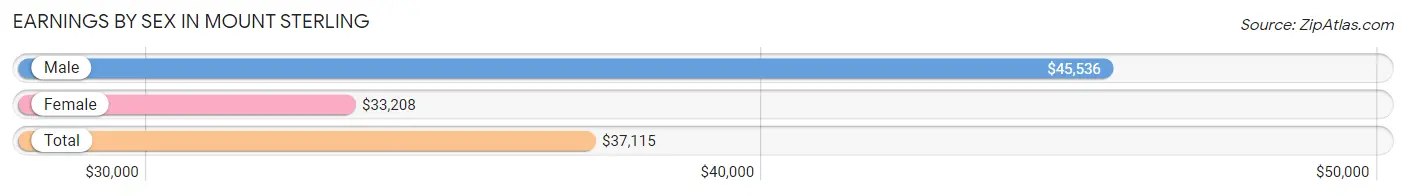
Earnings by Sex in Mount Sterling
Average Earnings in Mount Sterling are $37,115, $45,536 for men and $33,208 for women, a difference of 27.1%.
| Sex | Number | Average Earnings |
| Male | 467 (48.9%) | $45,536 |
| Female | 487 (51.0%) | $33,208 |
| Total | 954 (100.0%) | $37,115 |
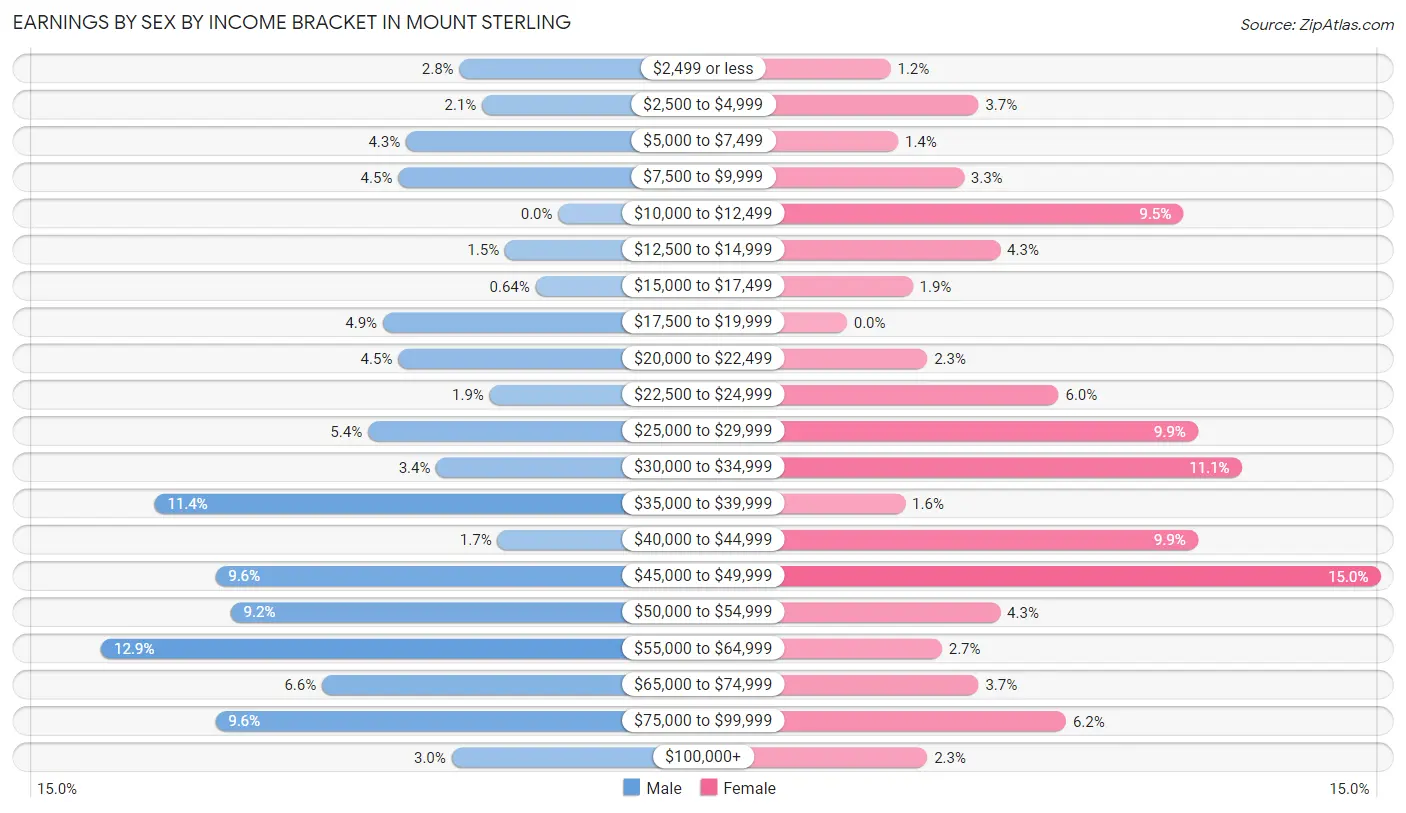
Earnings by Sex by Income Bracket in Mount Sterling
The most common earnings brackets in Mount Sterling are $55,000 to $64,999 for men (60 | 12.9%) and $45,000 to $49,999 for women (73 | 15.0%).
| Income | Male | Female |
| $2,499 or less | 13 (2.8%) | 6 (1.2%) |
| $2,500 to $4,999 | 10 (2.1%) | 18 (3.7%) |
| $5,000 to $7,499 | 20 (4.3%) | 7 (1.4%) |
| $7,500 to $9,999 | 21 (4.5%) | 16 (3.3%) |
| $10,000 to $12,499 | 0 (0.0%) | 46 (9.5%) |
| $12,500 to $14,999 | 7 (1.5%) | 21 (4.3%) |
| $15,000 to $17,499 | 3 (0.6%) | 9 (1.8%) |
| $17,500 to $19,999 | 23 (4.9%) | 0 (0.0%) |
| $20,000 to $22,499 | 21 (4.5%) | 11 (2.3%) |
| $22,500 to $24,999 | 9 (1.9%) | 29 (5.9%) |
| $25,000 to $29,999 | 25 (5.3%) | 48 (9.9%) |
| $30,000 to $34,999 | 16 (3.4%) | 54 (11.1%) |
| $35,000 to $39,999 | 53 (11.4%) | 8 (1.6%) |
| $40,000 to $44,999 | 8 (1.7%) | 48 (9.9%) |
| $45,000 to $49,999 | 45 (9.6%) | 73 (15.0%) |
| $50,000 to $54,999 | 43 (9.2%) | 21 (4.3%) |
| $55,000 to $64,999 | 60 (12.9%) | 13 (2.7%) |
| $65,000 to $74,999 | 31 (6.6%) | 18 (3.7%) |
| $75,000 to $99,999 | 45 (9.6%) | 30 (6.2%) |
| $100,000+ | 14 (3.0%) | 11 (2.3%) |
| Total | 467 (100.0%) | 487 (100.0%) |
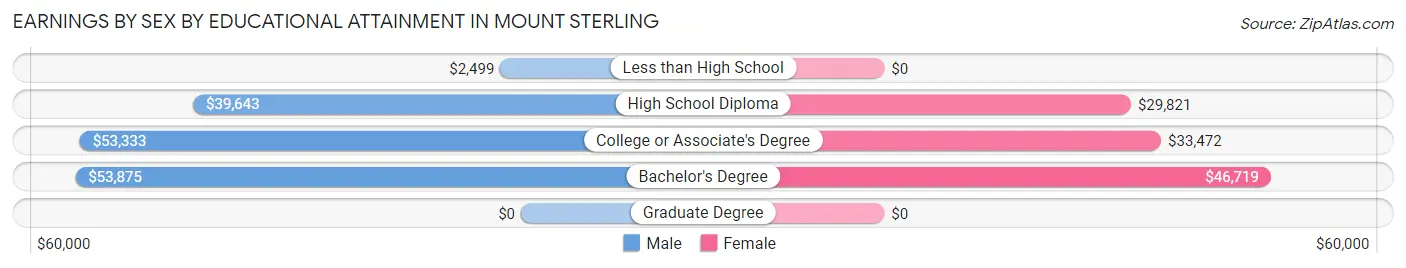
Earnings by Sex by Educational Attainment in Mount Sterling
Average earnings in Mount Sterling are $48,073 for men and $34,583 for women, a difference of 28.1%. Men with an educational attainment of bachelor's degree enjoy the highest average annual earnings of $53,875, while those with less than high school education earn the least with $2,499. Women with an educational attainment of bachelor's degree earn the most with the average annual earnings of $46,719, while those with high school diploma education have the smallest earnings of $29,821.
| Educational Attainment | Male Income | Female Income |
| Less than High School | $2,499 | $0 |
| High School Diploma | $39,643 | $29,821 |
| College or Associate's Degree | $53,333 | $33,472 |
| Bachelor's Degree | $53,875 | $46,719 |
| Graduate Degree | - | - |
| Total | $48,073 | $34,583 |
Family Income in Mount Sterling
Family Income Brackets in Mount Sterling
According to the Mount Sterling family income data, there are 127 families falling into the $50,000 to $74,999 income range, which is the most common income bracket and makes up 25.5% of all families.
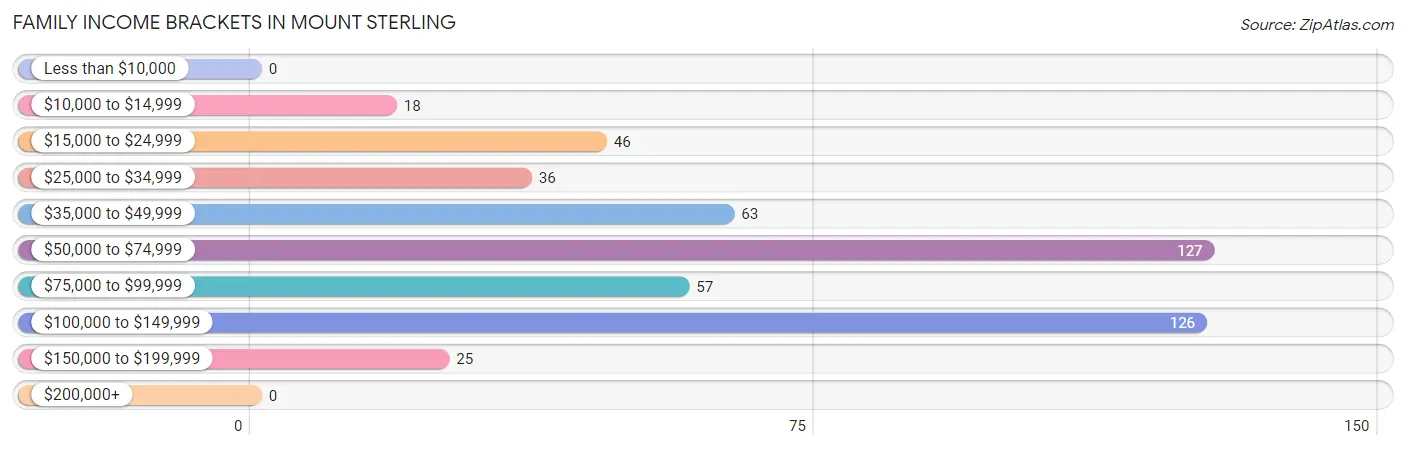
| Income Bracket | # Families | % Families |
| Less than $10,000 | 0 | 0.0% |
| $10,000 to $14,999 | 18 | 3.6% |
| $15,000 to $24,999 | 46 | 9.2% |
| $25,000 to $34,999 | 36 | 7.2% |
| $35,000 to $49,999 | 63 | 12.7% |
| $50,000 to $74,999 | 127 | 25.5% |
| $75,000 to $99,999 | 57 | 11.4% |
| $100,000 to $149,999 | 126 | 25.3% |
| $150,000 to $199,999 | 25 | 5.0% |
| $200,000+ | 0 | 0.0% |
Family Income by Famaliy Size in Mount Sterling
4-person families (48 | 9.6%) account for the highest median family income in Mount Sterling with $114,063 per family, while 3-person families (53 | 10.6%) have the highest median income of $31,979 per family member.
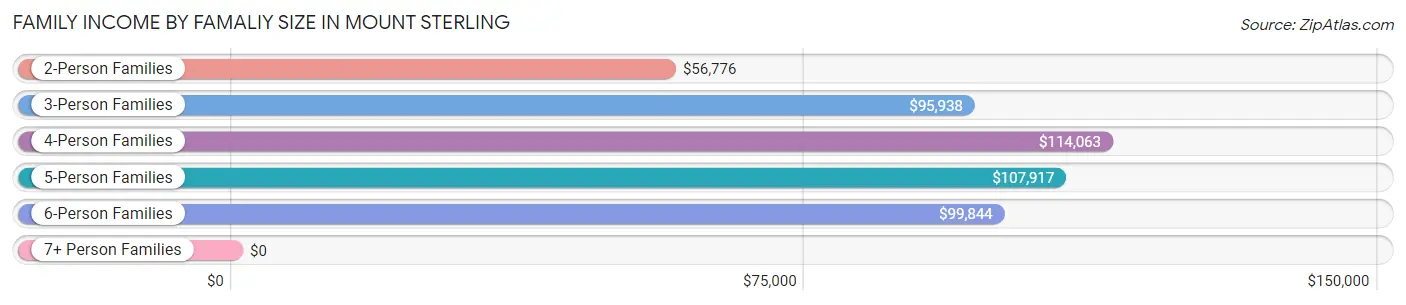
| Income Bracket | # Families | Median Income |
| 2-Person Families | 313 (62.8%) | $56,776 |
| 3-Person Families | 53 (10.6%) | $95,938 |
| 4-Person Families | 48 (9.6%) | $114,063 |
| 5-Person Families | 39 (7.8%) | $107,917 |
| 6-Person Families | 23 (4.6%) | $99,844 |
| 7+ Person Families | 22 (4.4%) | $0 |
| Total | 498 (100.0%) | $68,182 |
Family Income by Number of Earners in Mount Sterling
The median family income in Mount Sterling is $68,182, with families comprising 3+ earners (29) having the highest median family income of $101,250, while families with no earners (56) have the lowest median family income of $50,714, accounting for 5.8% and 11.2% of families, respectively.
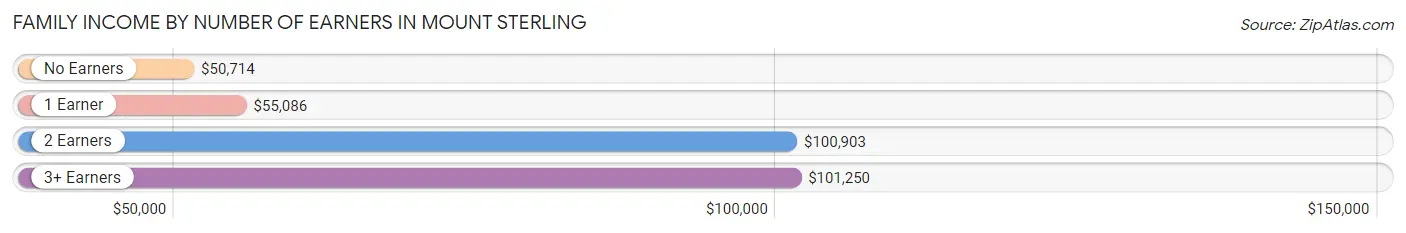
| Number of Earners | # Families | Median Income |
| No Earners | 56 (11.2%) | $50,714 |
| 1 Earner | 220 (44.2%) | $55,086 |
| 2 Earners | 193 (38.8%) | $100,903 |
| 3+ Earners | 29 (5.8%) | $101,250 |
| Total | 498 (100.0%) | $68,182 |
Household Income in Mount Sterling
Household Income Brackets in Mount Sterling
With 193 households falling in the category, the $50,000 to $74,999 income range is the most frequent in Mount Sterling, accounting for 25.1% of all households.
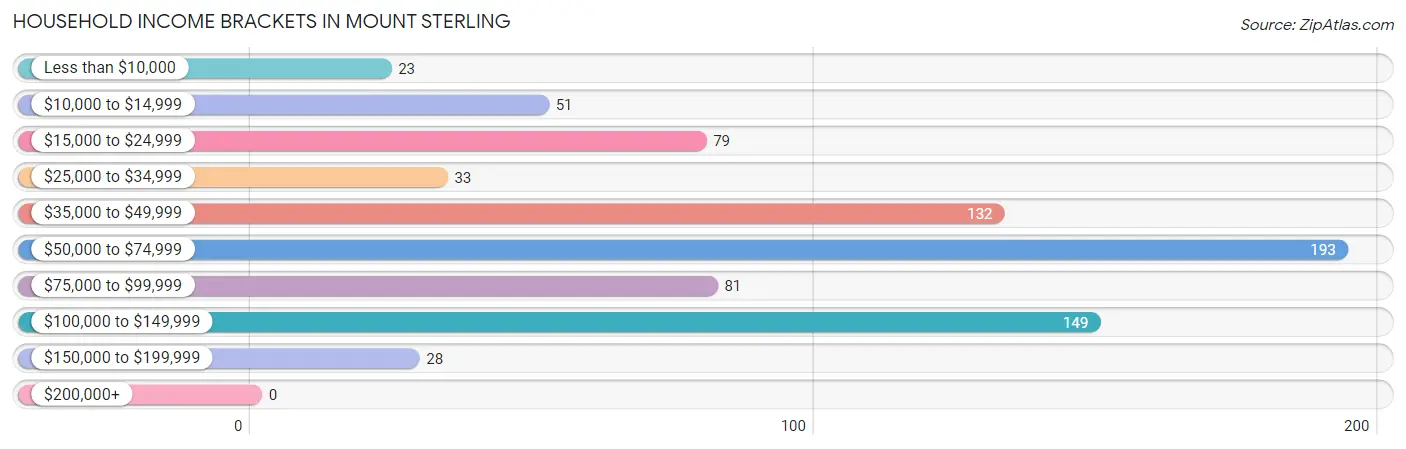
| Income Bracket | # Households | % Households |
| Less than $10,000 | 23 | 3.0% |
| $10,000 to $14,999 | 51 | 6.6% |
| $15,000 to $24,999 | 79 | 10.3% |
| $25,000 to $34,999 | 33 | 4.3% |
| $35,000 to $49,999 | 132 | 17.2% |
| $50,000 to $74,999 | 193 | 25.1% |
| $75,000 to $99,999 | 81 | 10.5% |
| $100,000 to $149,999 | 149 | 19.4% |
| $150,000 to $199,999 | 28 | 3.6% |
| $200,000+ | 0 | 0.0% |
Household Income by Householder Age in Mount Sterling
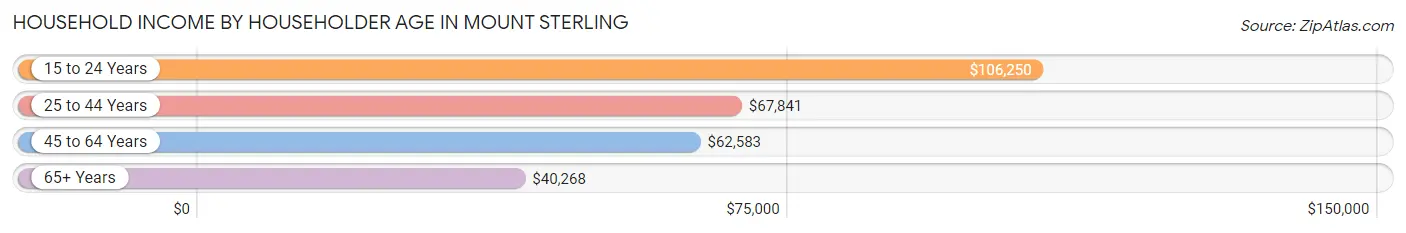
The median household income in Mount Sterling is $59,514, with the highest median household income of $106,250 found in the 15 to 24 years age bracket for the primary householder. A total of 11 households (1.4%) fall into this category. Meanwhile, the 65+ years age bracket for the primary householder has the lowest median household income of $40,268, with 185 households (24.1%) in this group.
| Income Bracket | # Households | Median Income |
| 15 to 24 Years | 11 (1.4%) | $106,250 |
| 25 to 44 Years | 291 (37.8%) | $67,841 |
| 45 to 64 Years | 282 (36.7%) | $62,583 |
| 65+ Years | 185 (24.1%) | $40,268 |
| Total | 769 (100.0%) | $59,514 |
Poverty in Mount Sterling
Income Below Poverty by Sex and Age in Mount Sterling
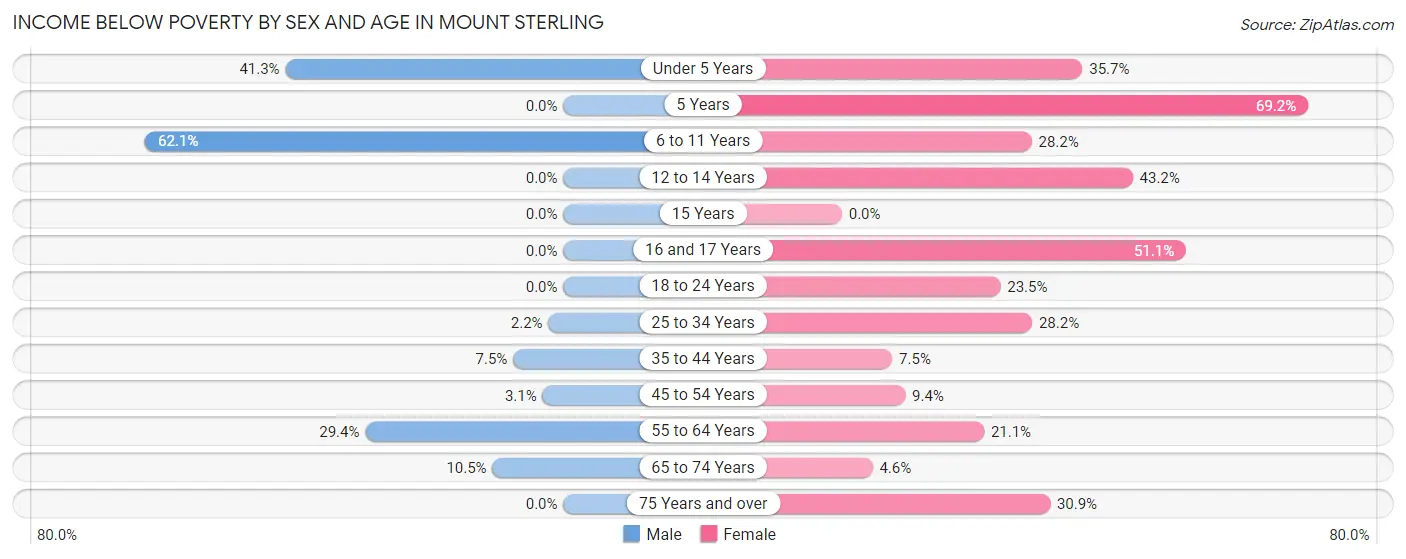
With 14.8% poverty level for males and 20.3% for females among the residents of Mount Sterling, 6 to 11 year old males and 5 year old females are the most vulnerable to poverty, with 59 males (62.1%) and 9 females (69.2%) in their respective age groups living below the poverty level.
| Age Bracket | Male | Female |
| Under 5 Years | 26 (41.3%) | 10 (35.7%) |
| 5 Years | 0 (0.0%) | 9 (69.2%) |
| 6 to 11 Years | 59 (62.1%) | 20 (28.2%) |
| 12 to 14 Years | 0 (0.0%) | 19 (43.2%) |
| 15 Years | 0 (0.0%) | 0 (0.0%) |
| 16 and 17 Years | 0 (0.0%) | 23 (51.1%) |
| 18 to 24 Years | 0 (0.0%) | 8 (23.5%) |
| 25 to 34 Years | 4 (2.2%) | 48 (28.2%) |
| 35 to 44 Years | 7 (7.4%) | 11 (7.5%) |
| 45 to 54 Years | 3 (3.1%) | 14 (9.4%) |
| 55 to 64 Years | 20 (29.4%) | 19 (21.1%) |
| 65 to 74 Years | 10 (10.5%) | 6 (4.5%) |
| 75 Years and over | 0 (0.0%) | 17 (30.9%) |
| Total | 129 (14.8%) | 204 (20.3%) |
Income Above Poverty by Sex and Age in Mount Sterling
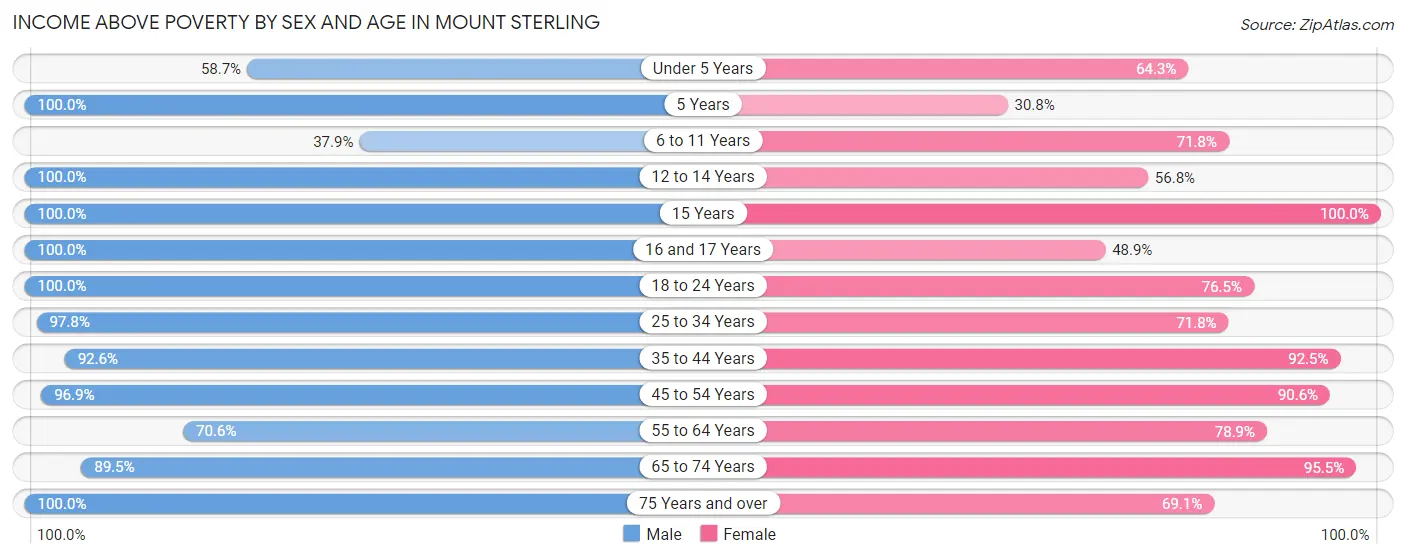
According to the poverty statistics in Mount Sterling, males aged 5 years and females aged 15 years are the age groups that are most secure financially, with 100.0% of males and 100.0% of females in these age groups living above the poverty line.
| Age Bracket | Male | Female |
| Under 5 Years | 37 (58.7%) | 18 (64.3%) |
| 5 Years | 11 (100.0%) | 4 (30.8%) |
| 6 to 11 Years | 36 (37.9%) | 51 (71.8%) |
| 12 to 14 Years | 48 (100.0%) | 25 (56.8%) |
| 15 Years | 19 (100.0%) | 25 (100.0%) |
| 16 and 17 Years | 10 (100.0%) | 22 (48.9%) |
| 18 to 24 Years | 60 (100.0%) | 26 (76.5%) |
| 25 to 34 Years | 177 (97.8%) | 122 (71.8%) |
| 35 to 44 Years | 87 (92.5%) | 136 (92.5%) |
| 45 to 54 Years | 94 (96.9%) | 135 (90.6%) |
| 55 to 64 Years | 48 (70.6%) | 71 (78.9%) |
| 65 to 74 Years | 85 (89.5%) | 126 (95.5%) |
| 75 Years and over | 32 (100.0%) | 38 (69.1%) |
| Total | 744 (85.2%) | 799 (79.7%) |
Income Below Poverty Among Married-Couple Families in Mount Sterling
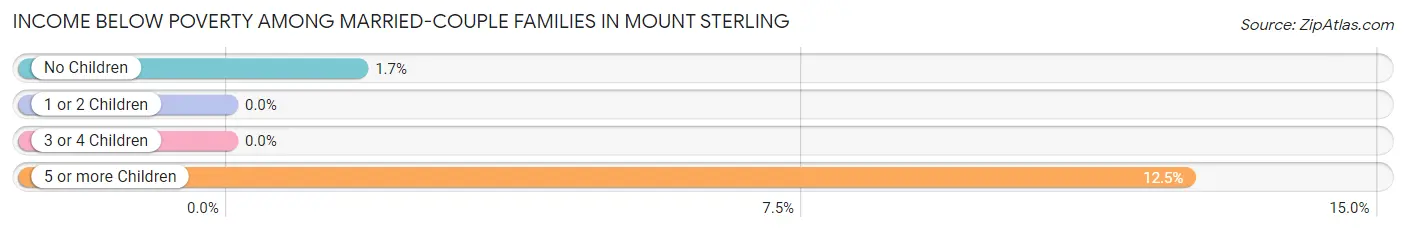
The poverty statistics for married-couple families in Mount Sterling show that 1.7% or 5 of the total 294 families live below the poverty line. Families with 5 or more children have the highest poverty rate of 12.5%, comprising of 2 families. On the other hand, families with 1 or 2 children have the lowest poverty rate of 0.0%, which includes 0 families.
| Children | Above Poverty | Below Poverty |
| No Children | 173 (98.3%) | 3 (1.7%) |
| 1 or 2 Children | 56 (100.0%) | 0 (0.0%) |
| 3 or 4 Children | 46 (100.0%) | 0 (0.0%) |
| 5 or more Children | 14 (87.5%) | 2 (12.5%) |
| Total | 289 (98.3%) | 5 (1.7%) |
Income Below Poverty Among Single-Parent Households in Mount Sterling
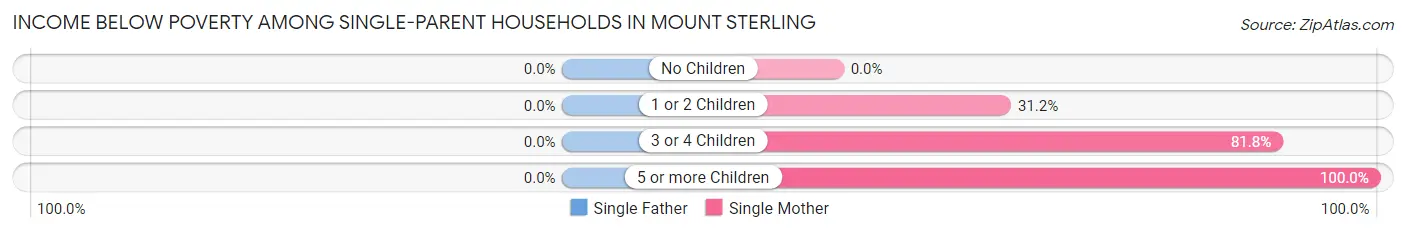
| Children | Single Father | Single Mother |
| No Children | 0 (0.0%) | 0 (0.0%) |
| 1 or 2 Children | 0 (0.0%) | 24 (31.2%) |
| 3 or 4 Children | 0 (0.0%) | 9 (81.8%) |
| 5 or more Children | 0 (0.0%) | 6 (100.0%) |
| Total | 0 (0.0%) | 39 (22.8%) |
Income Below Poverty Among Married-Couple vs Single-Parent Households in Mount Sterling
The poverty data for Mount Sterling shows that 5 of the married-couple family households (1.7%) and 39 of the single-parent households (19.1%) are living below the poverty level. Within the married-couple family households, those with 5 or more children have the highest poverty rate, with 2 households (12.5%) falling below the poverty line. Among the single-parent households, those with 5 or more children have the highest poverty rate, with 6 household (100.0%) living below poverty.
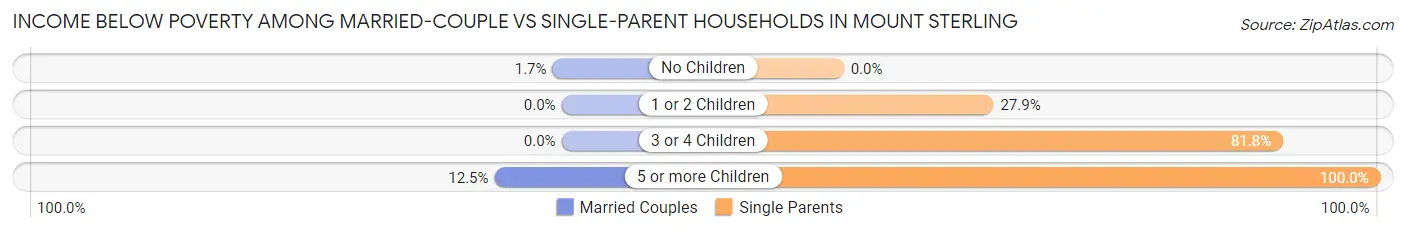
| Children | Married-Couple Families | Single-Parent Households |
| No Children | 3 (1.7%) | 0 (0.0%) |
| 1 or 2 Children | 0 (0.0%) | 24 (27.9%) |
| 3 or 4 Children | 0 (0.0%) | 9 (81.8%) |
| 5 or more Children | 2 (12.5%) | 6 (100.0%) |
| Total | 5 (1.7%) | 39 (19.1%) |
Race in Mount Sterling
The most populous races in Mount Sterling are White / Caucasian (1,735 | 91.8%), Two or more Races (116 | 6.1%), and Hispanic or Latino (50 | 2.6%).
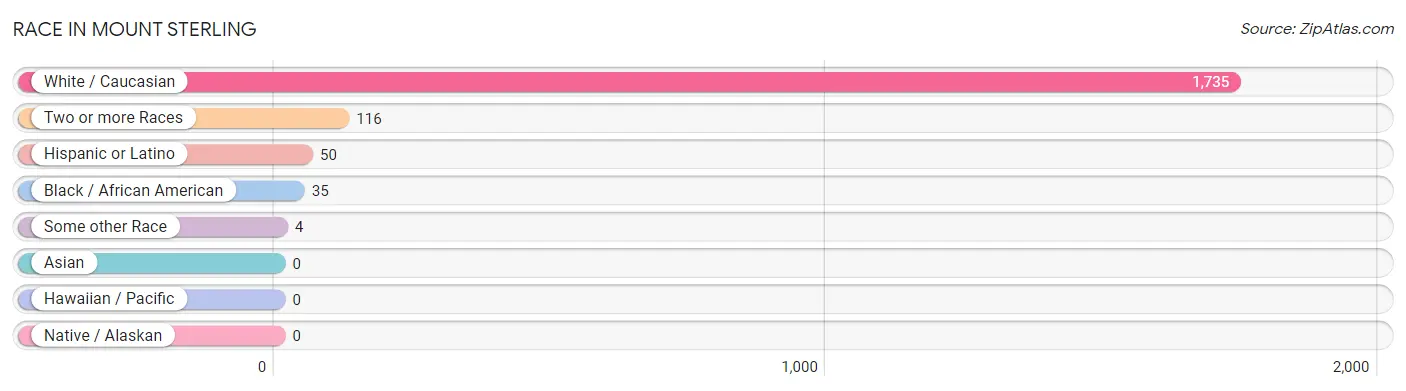
| Race | # Population | % Population |
| Asian | 0 | 0.0% |
| Black / African American | 35 | 1.8% |
| Hawaiian / Pacific | 0 | 0.0% |
| Hispanic or Latino | 50 | 2.6% |
| Native / Alaskan | 0 | 0.0% |
| White / Caucasian | 1,735 | 91.8% |
| Two or more Races | 116 | 6.1% |
| Some other Race | 4 | 0.2% |
| Total | 1,890 | 100.0% |
Ancestry in Mount Sterling
The most populous ancestries reported in Mount Sterling are German (400 | 21.2%), American (348 | 18.4%), Irish (295 | 15.6%), English (246 | 13.0%), and Scotch-Irish (82 | 4.3%), together accounting for 72.5% of all Mount Sterling residents.
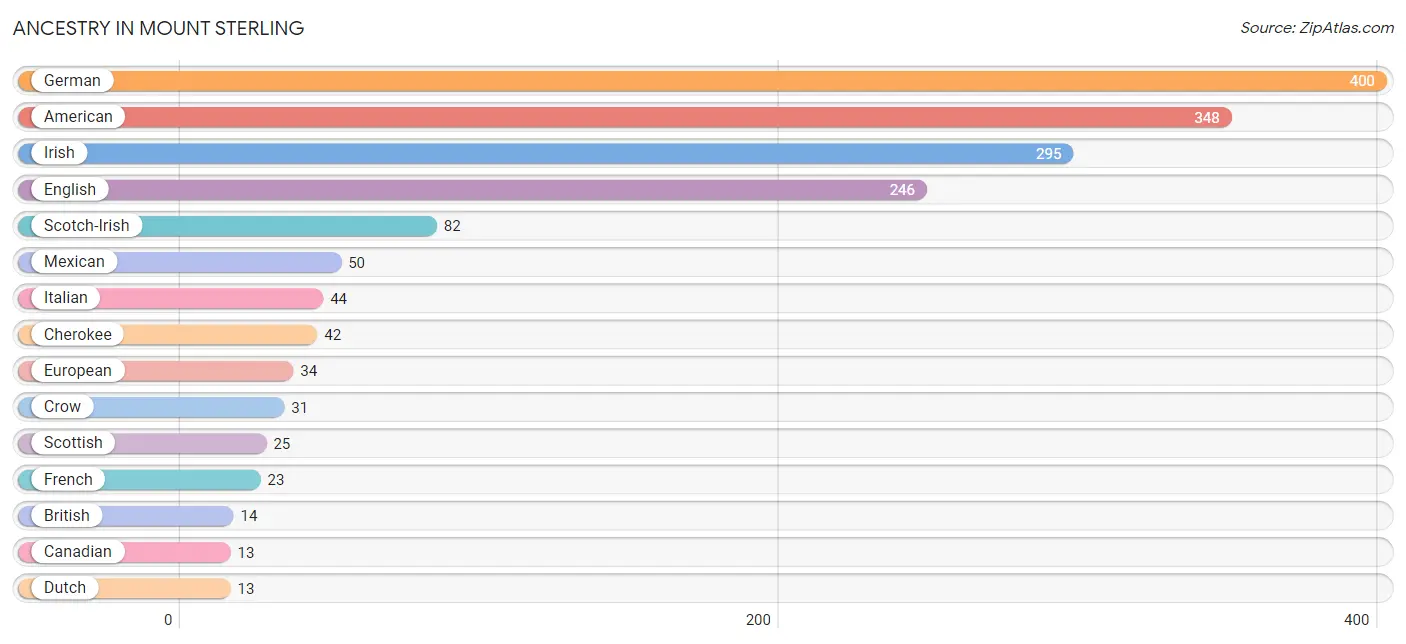
| Ancestry | # Population | % Population |
| American | 348 | 18.4% |
| British | 14 | 0.7% |
| Canadian | 13 | 0.7% |
| Cherokee | 42 | 2.2% |
| Crow | 31 | 1.6% |
| Dutch | 13 | 0.7% |
| Eastern European | 13 | 0.7% |
| English | 246 | 13.0% |
| European | 34 | 1.8% |
| French | 23 | 1.2% |
| German | 400 | 21.2% |
| Hungarian | 3 | 0.2% |
| Irish | 295 | 15.6% |
| Italian | 44 | 2.3% |
| Lithuanian | 3 | 0.2% |
| Mexican | 50 | 2.6% |
| Norwegian | 5 | 0.3% |
| Polish | 2 | 0.1% |
| Russian | 11 | 0.6% |
| Scotch-Irish | 82 | 4.3% |
| Scottish | 25 | 1.3% |
| Swedish | 9 | 0.5% |
| Welsh | 12 | 0.6% | View All 23 Rows |
Immigrants in Mount Sterling
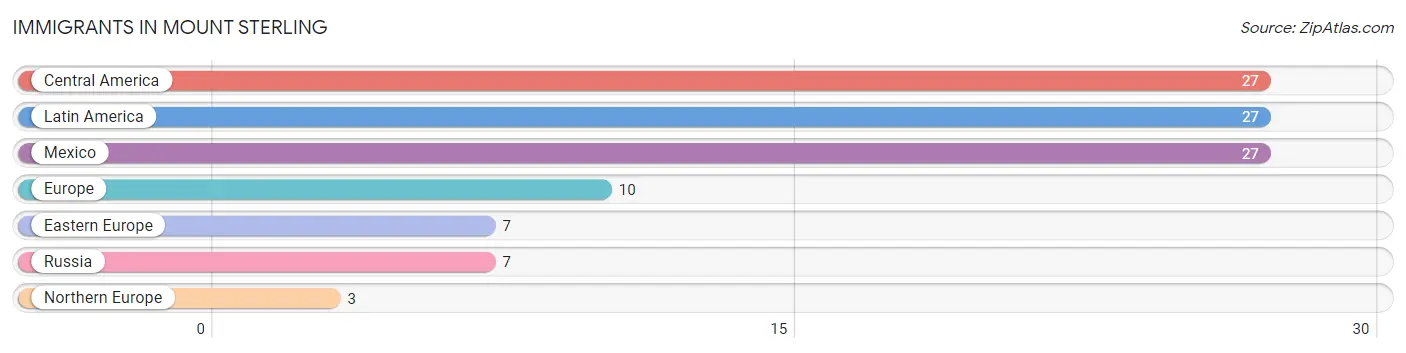
The most numerous immigrant groups reported in Mount Sterling came from Central America (27 | 1.4%), Latin America (27 | 1.4%), Mexico (27 | 1.4%), Europe (10 | 0.5%), and Eastern Europe (7 | 0.4%), together accounting for 5.2% of all Mount Sterling residents.
| Immigration Origin | # Population | % Population |
| Central America | 27 | 1.4% |
| Eastern Europe | 7 | 0.4% |
| Europe | 10 | 0.5% |
| Latin America | 27 | 1.4% |
| Mexico | 27 | 1.4% |
| Northern Europe | 3 | 0.2% |
| Russia | 7 | 0.4% | View All 7 Rows |
Sex and Age in Mount Sterling
Sex and Age in Mount Sterling
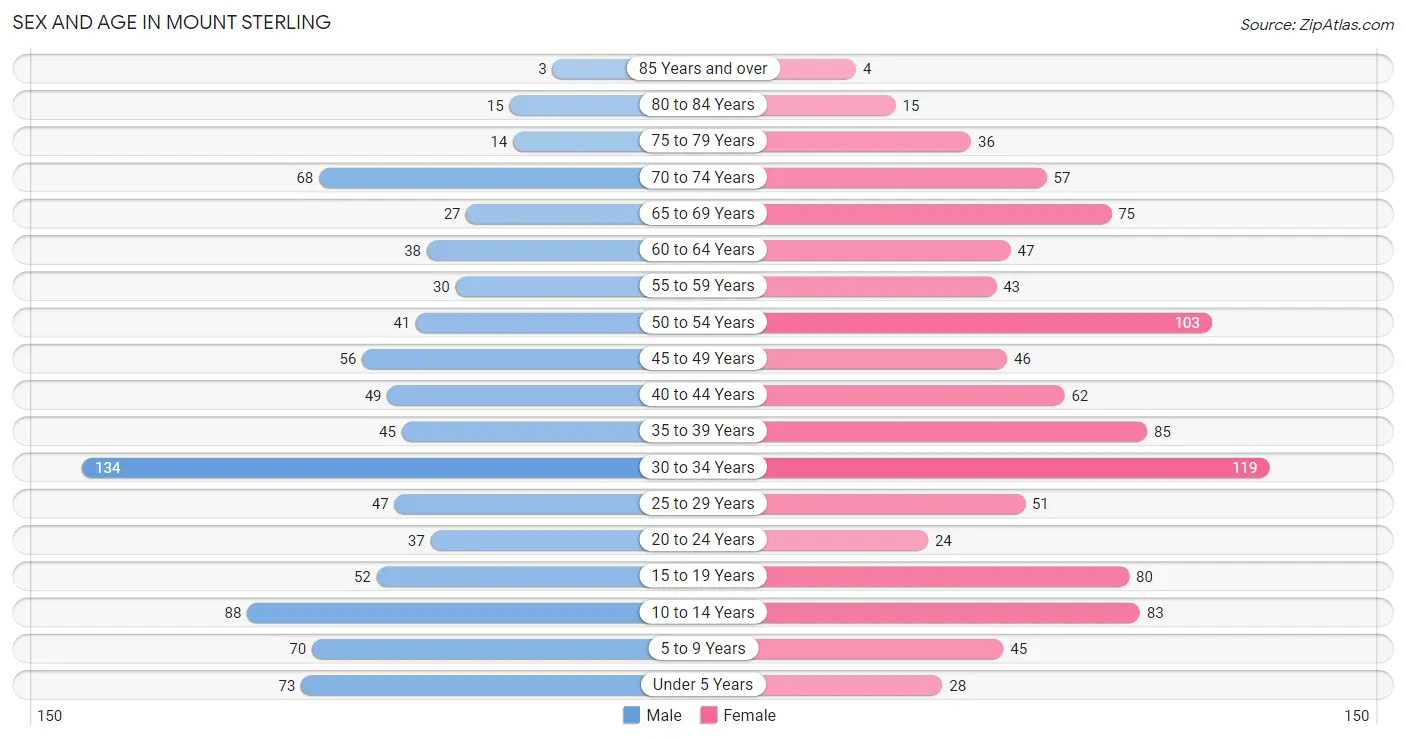
The most populous age groups in Mount Sterling are 30 to 34 Years (134 | 15.1%) for men and 30 to 34 Years (119 | 11.9%) for women.
| Age Bracket | Male | Female |
| Under 5 Years | 73 (8.2%) | 28 (2.8%) |
| 5 to 9 Years | 70 (7.9%) | 45 (4.5%) |
| 10 to 14 Years | 88 (9.9%) | 83 (8.3%) |
| 15 to 19 Years | 52 (5.9%) | 80 (8.0%) |
| 20 to 24 Years | 37 (4.2%) | 24 (2.4%) |
| 25 to 29 Years | 47 (5.3%) | 51 (5.1%) |
| 30 to 34 Years | 134 (15.1%) | 119 (11.9%) |
| 35 to 39 Years | 45 (5.1%) | 85 (8.5%) |
| 40 to 44 Years | 49 (5.5%) | 62 (6.2%) |
| 45 to 49 Years | 56 (6.3%) | 46 (4.6%) |
| 50 to 54 Years | 41 (4.6%) | 103 (10.3%) |
| 55 to 59 Years | 30 (3.4%) | 43 (4.3%) |
| 60 to 64 Years | 38 (4.3%) | 47 (4.7%) |
| 65 to 69 Years | 27 (3.0%) | 75 (7.5%) |
| 70 to 74 Years | 68 (7.7%) | 57 (5.7%) |
| 75 to 79 Years | 14 (1.6%) | 36 (3.6%) |
| 80 to 84 Years | 15 (1.7%) | 15 (1.5%) |
| 85 Years and over | 3 (0.3%) | 4 (0.4%) |
| Total | 887 (100.0%) | 1,003 (100.0%) |
Families and Households in Mount Sterling
Median Family Size in Mount Sterling
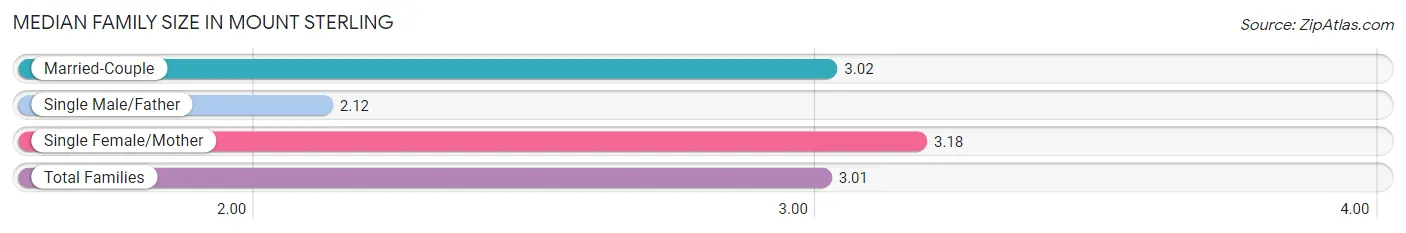
The median family size in Mount Sterling is 3.01 persons per family, with single female/mother families (171 | 34.3%) accounting for the largest median family size of 3.18 persons per family. On the other hand, single male/father families (33 | 6.6%) represent the smallest median family size with 2.12 persons per family.
| Family Type | # Families | Family Size |
| Married-Couple | 294 (59.0%) | 3.02 |
| Single Male/Father | 33 (6.6%) | 2.12 |
| Single Female/Mother | 171 (34.3%) | 3.18 |
| Total Families | 498 (100.0%) | 3.01 |
Median Household Size in Mount Sterling
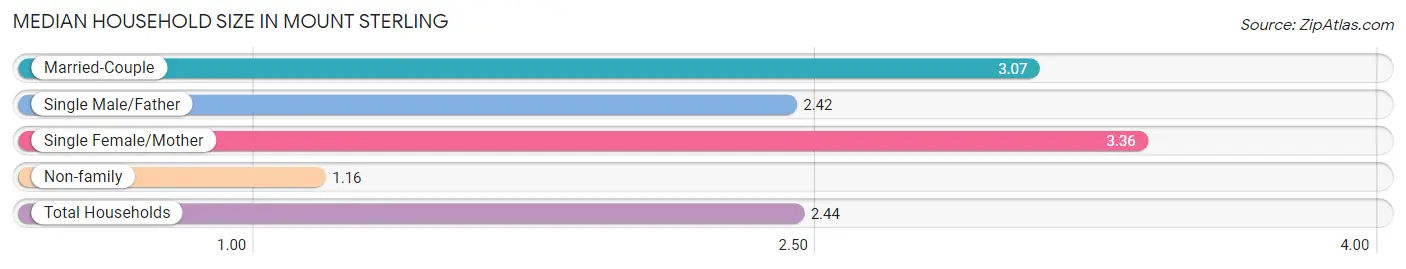
The median household size in Mount Sterling is 2.44 persons per household, with single female/mother households (171 | 22.2%) accounting for the largest median household size of 3.36 persons per household. non-family households (271 | 35.2%) represent the smallest median household size with 1.16 persons per household.
| Household Type | # Households | Household Size |
| Married-Couple | 294 (38.2%) | 3.07 |
| Single Male/Father | 33 (4.3%) | 2.42 |
| Single Female/Mother | 171 (22.2%) | 3.36 |
| Non-family | 271 (35.2%) | 1.16 |
| Total Households | 769 (100.0%) | 2.44 |
Household Size by Marriage Status in Mount Sterling
Out of a total of 769 households in Mount Sterling, 498 (64.8%) are family households, while 271 (35.2%) are nonfamily households. The most numerous type of family households are 2-person households, comprising 290, and the most common type of nonfamily households are 1-person households, comprising 232.
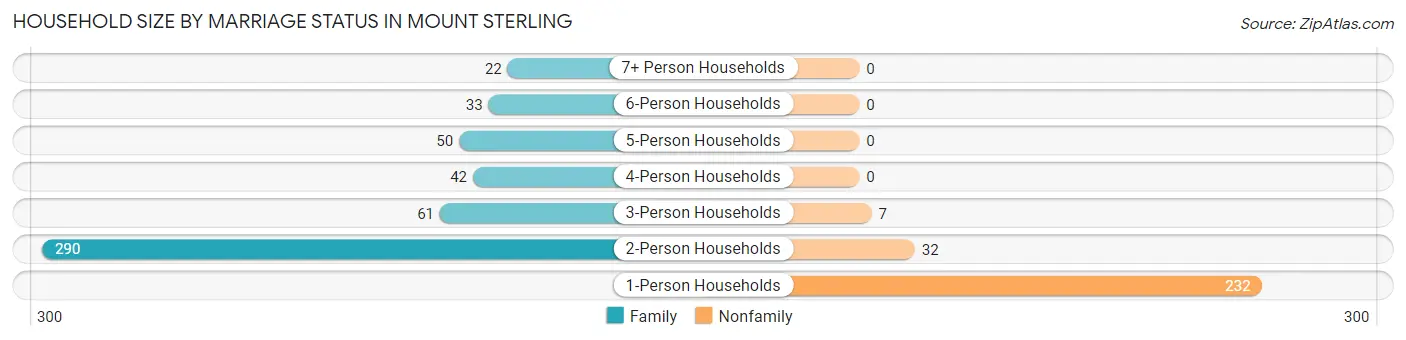
| Household Size | Family Households | Nonfamily Households |
| 1-Person Households | - | 232 (30.2%) |
| 2-Person Households | 290 (37.7%) | 32 (4.2%) |
| 3-Person Households | 61 (7.9%) | 7 (0.9%) |
| 4-Person Households | 42 (5.5%) | 0 (0.0%) |
| 5-Person Households | 50 (6.5%) | 0 (0.0%) |
| 6-Person Households | 33 (4.3%) | 0 (0.0%) |
| 7+ Person Households | 22 (2.9%) | 0 (0.0%) |
| Total | 498 (64.8%) | 271 (35.2%) |
Female Fertility in Mount Sterling
Fertility by Age in Mount Sterling
Average fertility rate in Mount Sterling is 61.0 births per 1,000 women. Women in the age bracket of 20 to 34 years have the highest fertility rate with 88.0 births per 1,000 women. Women in the age bracket of 20 to 34 years acount for 58.6% of all women with births.
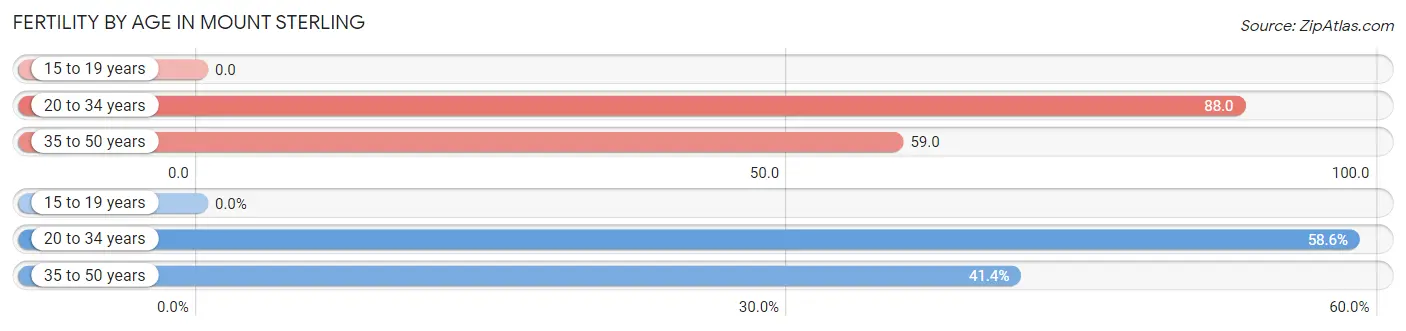
| Age Bracket | Women with Births | Births / 1,000 Women |
| 15 to 19 years | 0 (0.0%) | 0.0 |
| 20 to 34 years | 17 (58.6%) | 88.0 |
| 35 to 50 years | 12 (41.4%) | 59.0 |
| Total | 29 (100.0%) | 61.0 |
Fertility by Age by Marriage Status in Mount Sterling
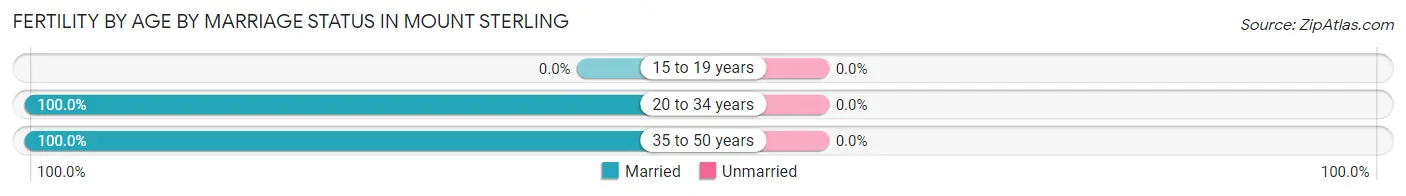
| Age Bracket | Married | Unmarried |
| 15 to 19 years | 0 (0.0%) | 0 (0.0%) |
| 20 to 34 years | 17 (100.0%) | 0 (0.0%) |
| 35 to 50 years | 12 (100.0%) | 0 (0.0%) |
| Total | 29 (100.0%) | 0 (0.0%) |
Fertility by Education in Mount Sterling
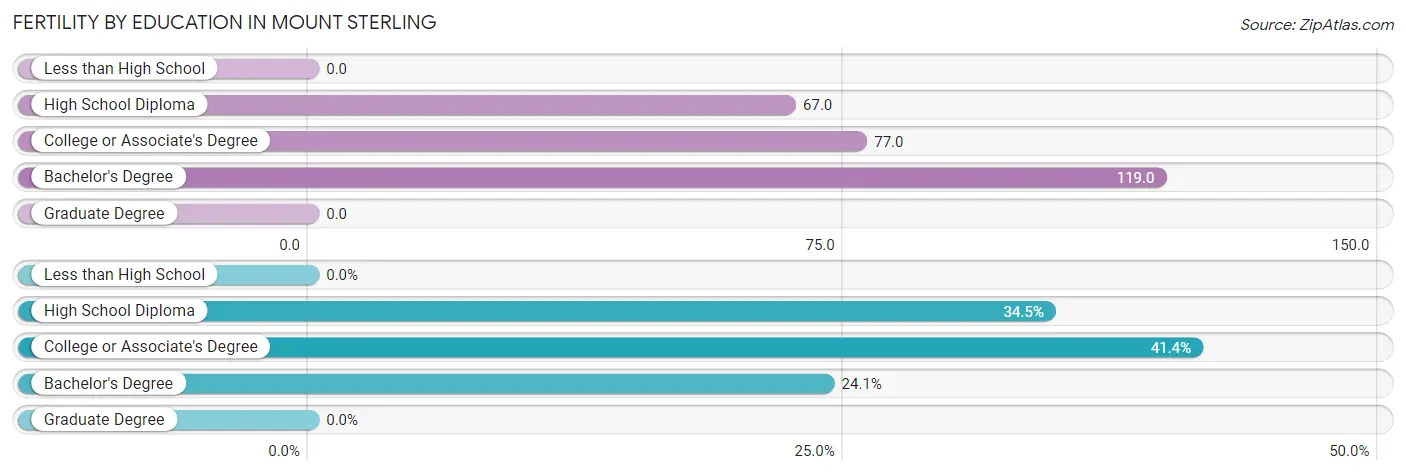
| Educational Attainment | Women with Births | Births / 1,000 Women |
| Less than High School | 0 (0.0%) | 0.0 |
| High School Diploma | 10 (34.5%) | 67.0 |
| College or Associate's Degree | 12 (41.4%) | 77.0 |
| Bachelor's Degree | 7 (24.1%) | 119.0 |
| Graduate Degree | 0 (0.0%) | 0.0 |
| Total | 29 (100.0%) | 61.0 |
Fertility by Education by Marriage Status in Mount Sterling
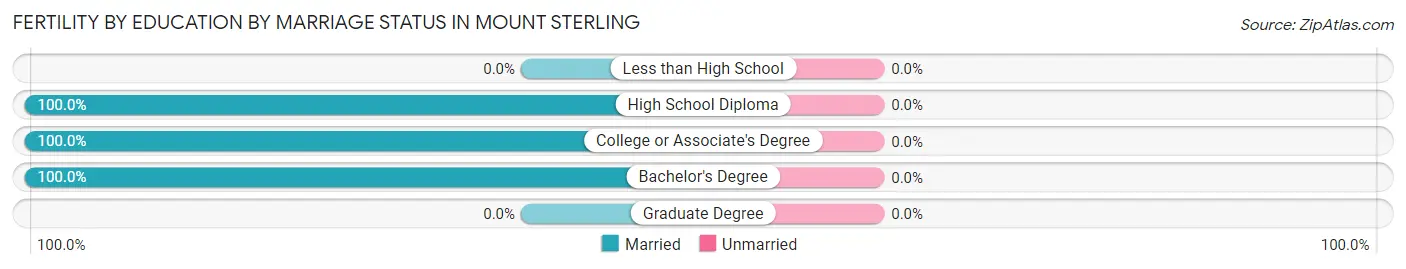
| Educational Attainment | Married | Unmarried |
| Less than High School | 0 (0.0%) | 0 (0.0%) |
| High School Diploma | 10 (100.0%) | 0 (0.0%) |
| College or Associate's Degree | 12 (100.0%) | 0 (0.0%) |
| Bachelor's Degree | 7 (100.0%) | 0 (0.0%) |
| Graduate Degree | 0 (0.0%) | 0 (0.0%) |
| Total | 29 (100.0%) | 0 (0.0%) |
Employment Characteristics in Mount Sterling
Employment by Class of Employer in Mount Sterling
Among the 818 employed individuals in Mount Sterling, private company employees (555 | 67.8%), not-for-profit organizations (92 | 11.3%), and local government employees (70 | 8.6%) make up the most common classes of employment.
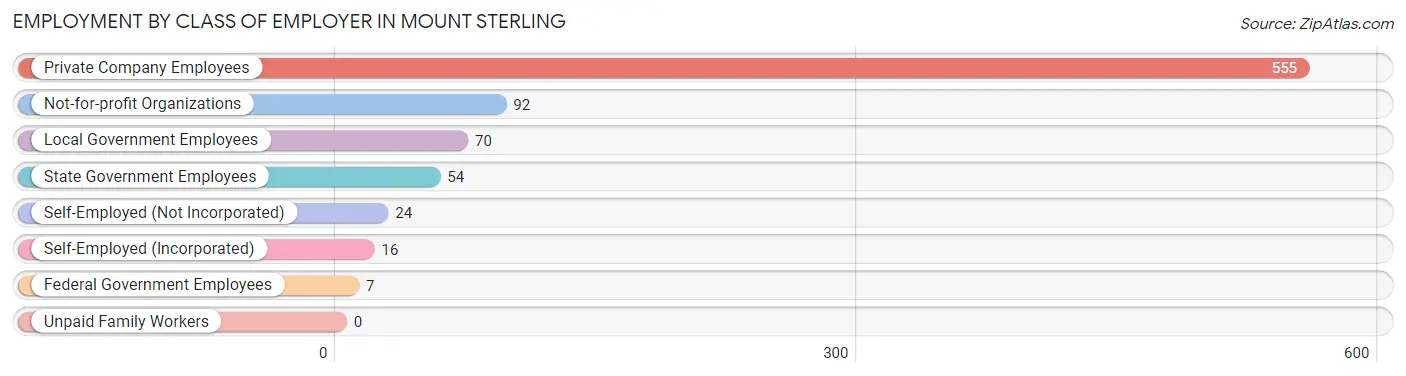
| Employer Class | # Employees | % Employees |
| Private Company Employees | 555 | 67.8% |
| Self-Employed (Incorporated) | 16 | 2.0% |
| Self-Employed (Not Incorporated) | 24 | 2.9% |
| Not-for-profit Organizations | 92 | 11.3% |
| Local Government Employees | 70 | 8.6% |
| State Government Employees | 54 | 6.6% |
| Federal Government Employees | 7 | 0.9% |
| Unpaid Family Workers | 0 | 0.0% |
| Total | 818 | 100.0% |
Employment Status by Age in Mount Sterling
According to the labor force statistics for Mount Sterling, out of the total population over 16 years of age (1,459), 60.8% or 887 individuals are in the labor force, with 7.8% or 69 of them unemployed. The age group with the highest labor force participation rate is 20 to 24 years, with 95.1% or 58 individuals in the labor force. Within the labor force, the 30 to 34 years age range has the highest percentage of unemployed individuals, with 26.4% or 57 of them being unemployed.
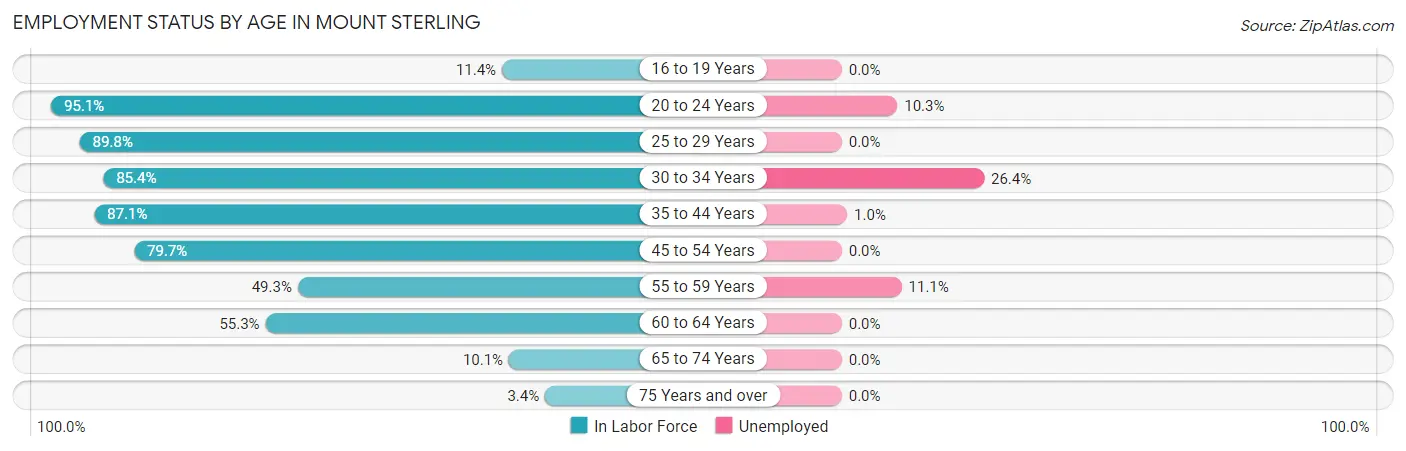
| Age Bracket | In Labor Force | Unemployed |
| 16 to 19 Years | 10 (11.4%) | 0 (0.0%) |
| 20 to 24 Years | 58 (95.1%) | 6 (10.3%) |
| 25 to 29 Years | 88 (89.8%) | 0 (0.0%) |
| 30 to 34 Years | 216 (85.4%) | 57 (26.4%) |
| 35 to 44 Years | 210 (87.1%) | 2 (1.0%) |
| 45 to 54 Years | 196 (79.7%) | 0 (0.0%) |
| 55 to 59 Years | 36 (49.3%) | 4 (11.1%) |
| 60 to 64 Years | 47 (55.3%) | 0 (0.0%) |
| 65 to 74 Years | 23 (10.1%) | 0 (0.0%) |
| 75 Years and over | 3 (3.4%) | 0 (0.0%) |
| Total | 887 (60.8%) | 69 (7.8%) |
Employment Status by Educational Attainment in Mount Sterling
According to labor force statistics for Mount Sterling, 79.6% of individuals (793) out of the total population between 25 and 64 years of age (996) are in the labor force, with 7.9% or 63 of them being unemployed. The group with the highest labor force participation rate are those with the educational attainment of bachelor's degree or higher, with 89.6% or 155 individuals in the labor force. Within the labor force, individuals with high school diploma education have the highest percentage of unemployment, with 10.3% or 40 of them being unemployed.
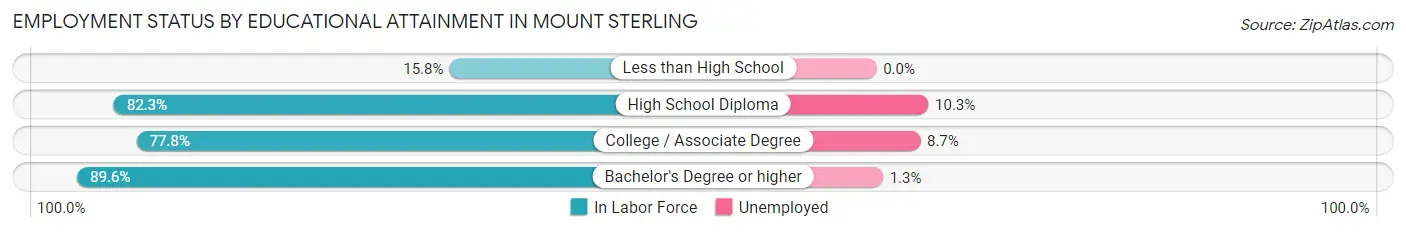
| Educational Attainment | In Labor Force | Unemployed |
| Less than High School | 6 (15.8%) | 0 (0.0%) |
| High School Diploma | 390 (82.3%) | 49 (10.3%) |
| College / Associate Degree | 242 (77.8%) | 27 (8.7%) |
| Bachelor's Degree or higher | 155 (89.6%) | 2 (1.3%) |
| Total | 793 (79.6%) | 79 (7.9%) |
Employment Occupations by Sex in Mount Sterling
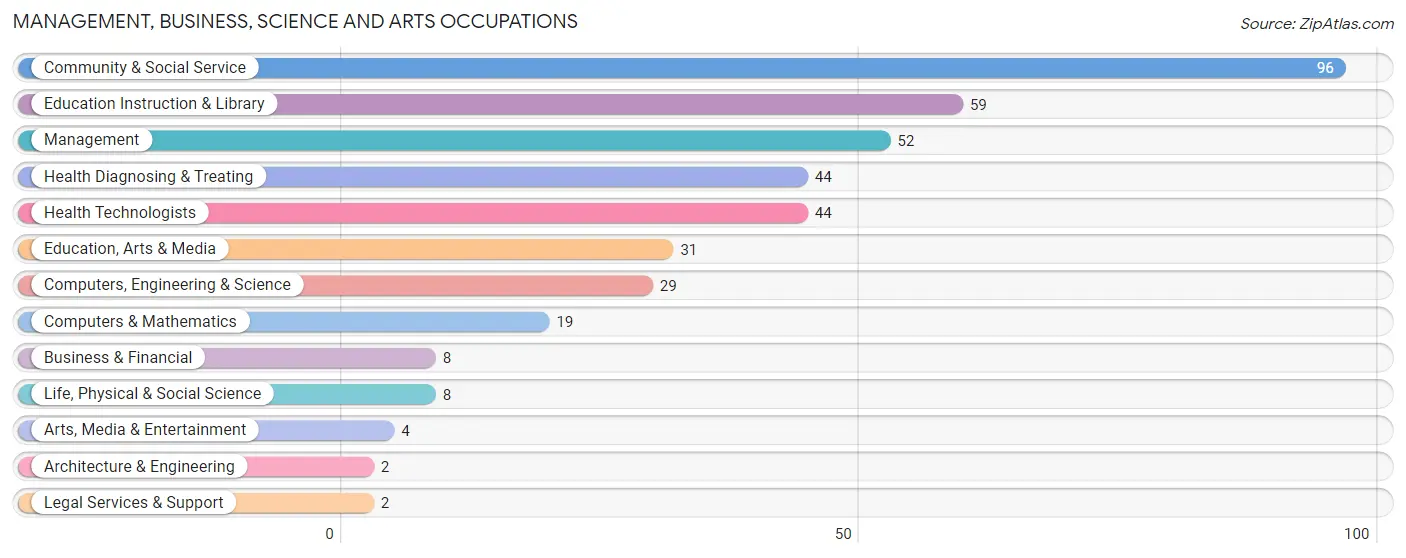
Management, Business, Science and Arts Occupations
The most common Management, Business, Science and Arts occupations in Mount Sterling are Community & Social Service (96 | 11.7%), Education Instruction & Library (59 | 7.2%), Management (52 | 6.4%), Health Diagnosing & Treating (44 | 5.4%), and Health Technologists (44 | 5.4%).
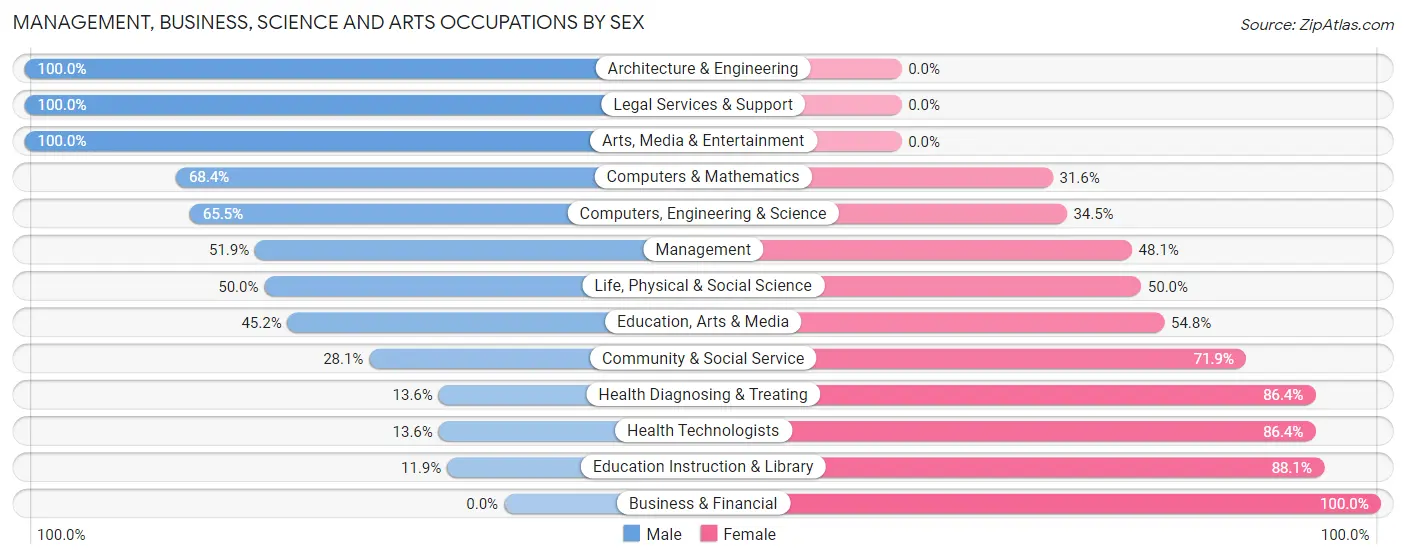
Management, Business, Science and Arts Occupations by Sex
Within the Management, Business, Science and Arts occupations in Mount Sterling, the most male-oriented occupations are Architecture & Engineering (100.0%), Legal Services & Support (100.0%), and Arts, Media & Entertainment (100.0%), while the most female-oriented occupations are Business & Financial (100.0%), Education Instruction & Library (88.1%), and Health Diagnosing & Treating (86.4%).
| Occupation | Male | Female |
| Management | 27 (51.9%) | 25 (48.1%) |
| Business & Financial | 0 (0.0%) | 8 (100.0%) |
| Computers, Engineering & Science | 19 (65.5%) | 10 (34.5%) |
| Computers & Mathematics | 13 (68.4%) | 6 (31.6%) |
| Architecture & Engineering | 2 (100.0%) | 0 (0.0%) |
| Life, Physical & Social Science | 4 (50.0%) | 4 (50.0%) |
| Community & Social Service | 27 (28.1%) | 69 (71.9%) |
| Education, Arts & Media | 14 (45.2%) | 17 (54.8%) |
| Legal Services & Support | 2 (100.0%) | 0 (0.0%) |
| Education Instruction & Library | 7 (11.9%) | 52 (88.1%) |
| Arts, Media & Entertainment | 4 (100.0%) | 0 (0.0%) |
| Health Diagnosing & Treating | 6 (13.6%) | 38 (86.4%) |
| Health Technologists | 6 (13.6%) | 38 (86.4%) |
| Total (Category) | 79 (34.5%) | 150 (65.5%) |
| Total (Overall) | 391 (47.8%) | 427 (52.2%) |
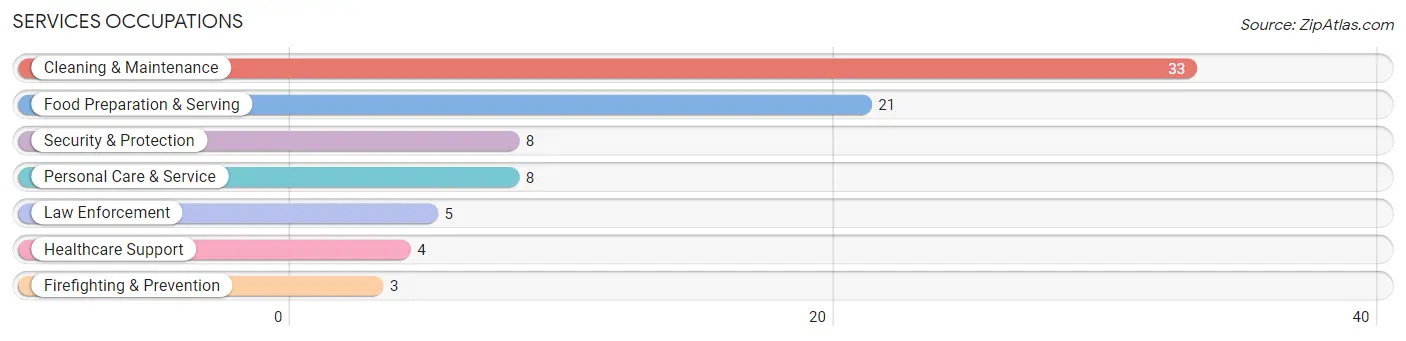
Services Occupations
The most common Services occupations in Mount Sterling are Cleaning & Maintenance (33 | 4.0%), Food Preparation & Serving (21 | 2.6%), Security & Protection (8 | 1.0%), Personal Care & Service (8 | 1.0%), and Law Enforcement (5 | 0.6%).
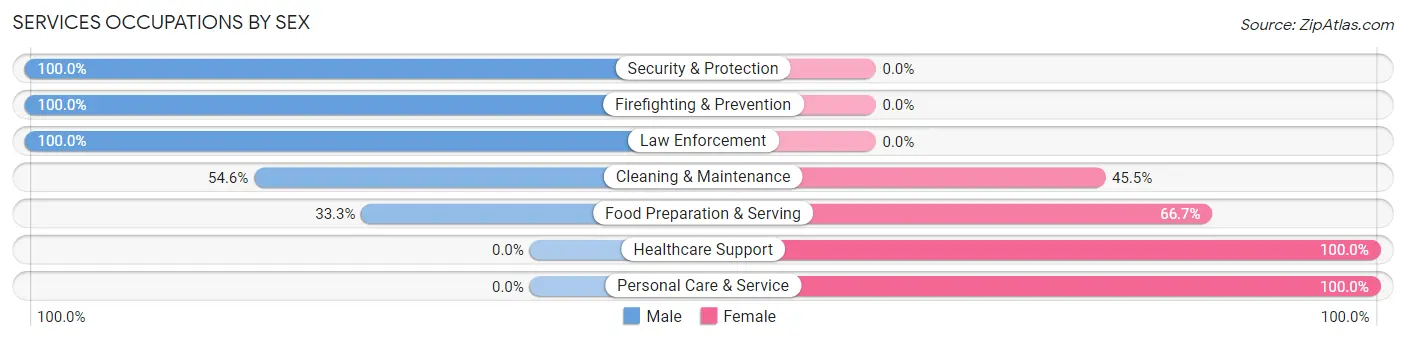
Services Occupations by Sex
Within the Services occupations in Mount Sterling, the most male-oriented occupations are Security & Protection (100.0%), Firefighting & Prevention (100.0%), and Law Enforcement (100.0%), while the most female-oriented occupations are Healthcare Support (100.0%), Personal Care & Service (100.0%), and Food Preparation & Serving (66.7%).
| Occupation | Male | Female |
| Healthcare Support | 0 (0.0%) | 4 (100.0%) |
| Security & Protection | 8 (100.0%) | 0 (0.0%) |
| Firefighting & Prevention | 3 (100.0%) | 0 (0.0%) |
| Law Enforcement | 5 (100.0%) | 0 (0.0%) |
| Food Preparation & Serving | 7 (33.3%) | 14 (66.7%) |
| Cleaning & Maintenance | 18 (54.5%) | 15 (45.5%) |
| Personal Care & Service | 0 (0.0%) | 8 (100.0%) |
| Total (Category) | 33 (44.6%) | 41 (55.4%) |
| Total (Overall) | 391 (47.8%) | 427 (52.2%) |
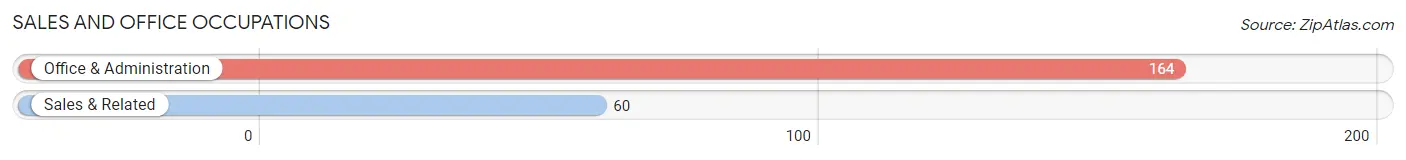
Sales and Office Occupations
The most common Sales and Office occupations in Mount Sterling are Office & Administration (164 | 20.1%), and Sales & Related (60 | 7.3%).
Sales and Office Occupations by Sex
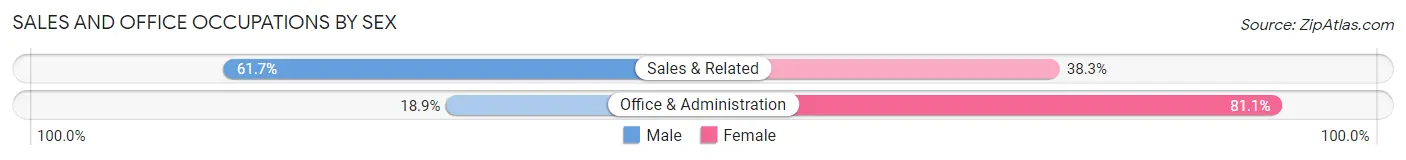
| Occupation | Male | Female |
| Sales & Related | 37 (61.7%) | 23 (38.3%) |
| Office & Administration | 31 (18.9%) | 133 (81.1%) |
| Total (Category) | 68 (30.4%) | 156 (69.6%) |
| Total (Overall) | 391 (47.8%) | 427 (52.2%) |
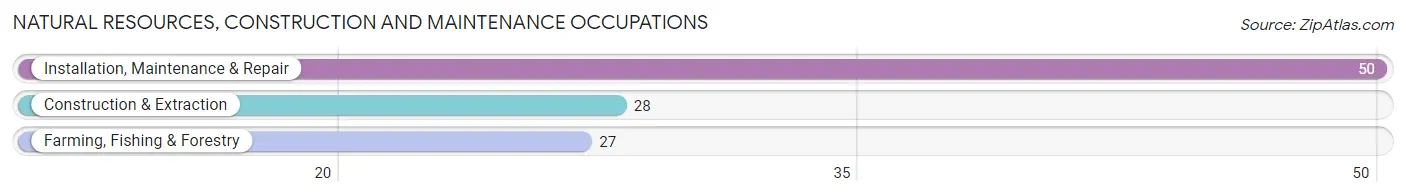
Natural Resources, Construction and Maintenance Occupations
The most common Natural Resources, Construction and Maintenance occupations in Mount Sterling are Installation, Maintenance & Repair (50 | 6.1%), Construction & Extraction (28 | 3.4%), and Farming, Fishing & Forestry (27 | 3.3%).
Natural Resources, Construction and Maintenance Occupations by Sex
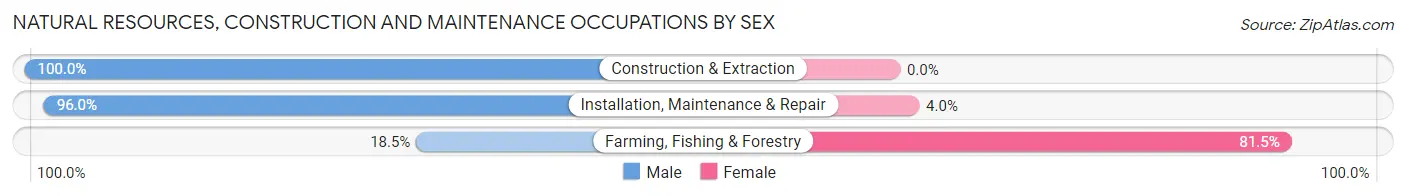
| Occupation | Male | Female |
| Farming, Fishing & Forestry | 5 (18.5%) | 22 (81.5%) |
| Construction & Extraction | 28 (100.0%) | 0 (0.0%) |
| Installation, Maintenance & Repair | 48 (96.0%) | 2 (4.0%) |
| Total (Category) | 81 (77.1%) | 24 (22.9%) |
| Total (Overall) | 391 (47.8%) | 427 (52.2%) |
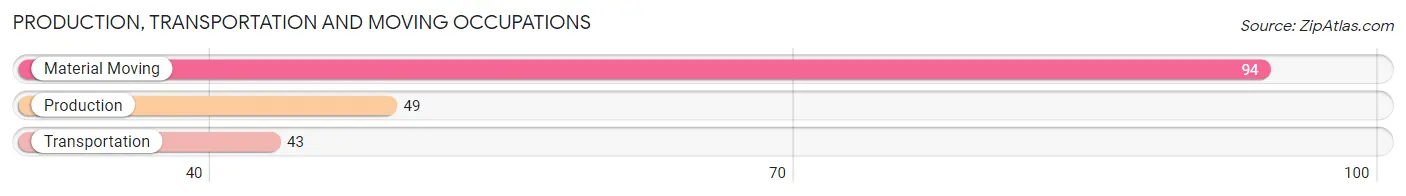
Production, Transportation and Moving Occupations
The most common Production, Transportation and Moving occupations in Mount Sterling are Material Moving (94 | 11.5%), Production (49 | 6.0%), and Transportation (43 | 5.3%).
Production, Transportation and Moving Occupations by Sex
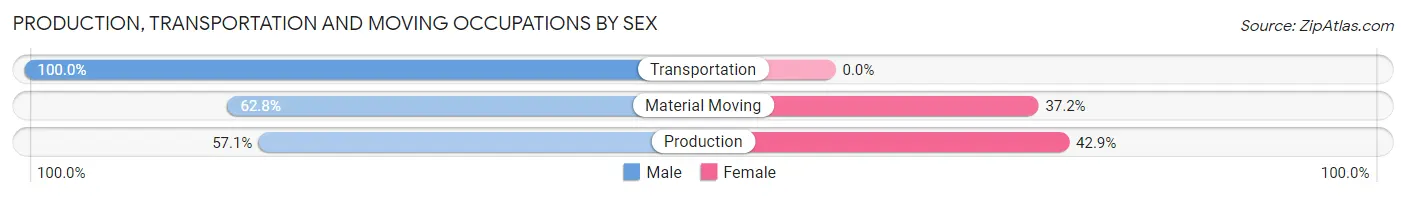
| Occupation | Male | Female |
| Production | 28 (57.1%) | 21 (42.9%) |
| Transportation | 43 (100.0%) | 0 (0.0%) |
| Material Moving | 59 (62.8%) | 35 (37.2%) |
| Total (Category) | 130 (69.9%) | 56 (30.1%) |
| Total (Overall) | 391 (47.8%) | 427 (52.2%) |
Employment Industries by Sex in Mount Sterling
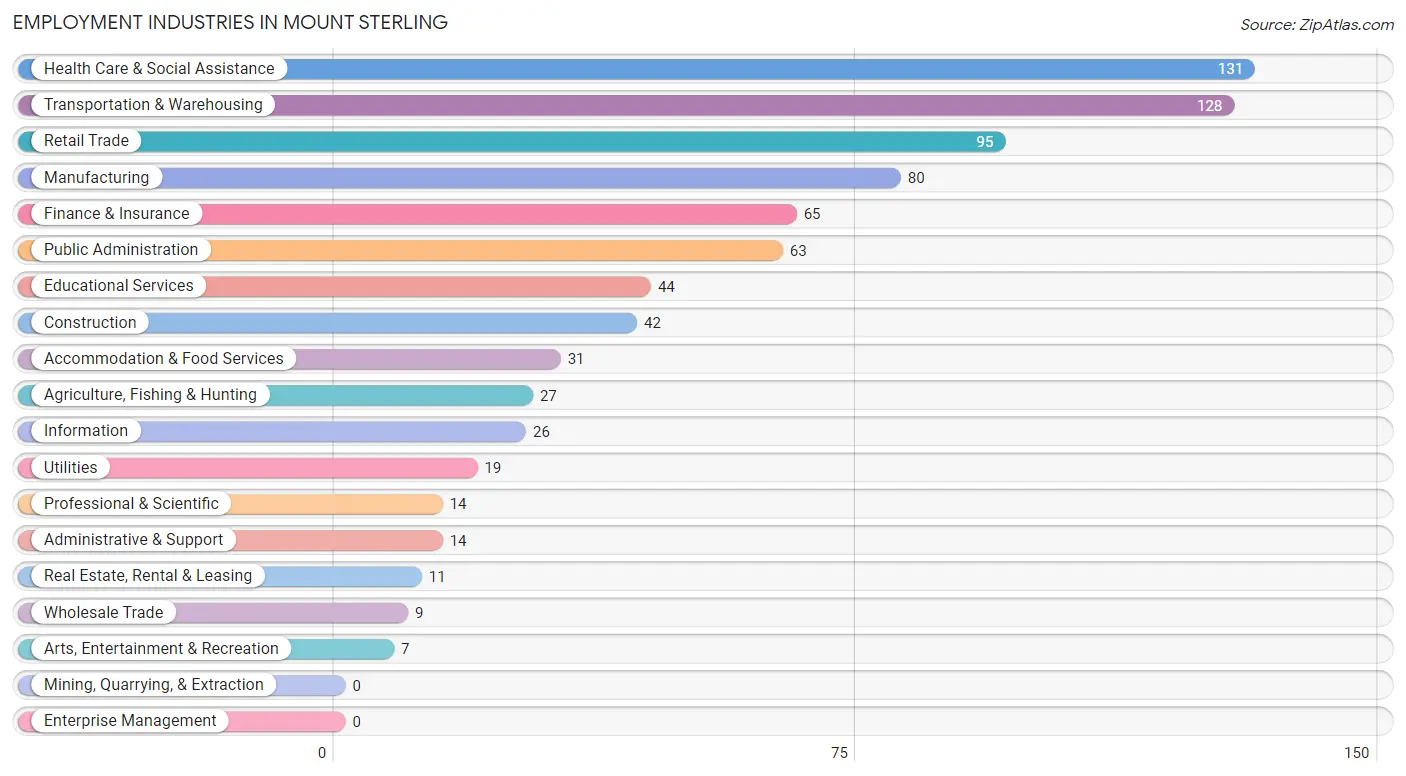
Employment Industries in Mount Sterling
The major employment industries in Mount Sterling include Health Care & Social Assistance (131 | 16.0%), Transportation & Warehousing (128 | 15.7%), Retail Trade (95 | 11.6%), Manufacturing (80 | 9.8%), and Finance & Insurance (65 | 8.0%).
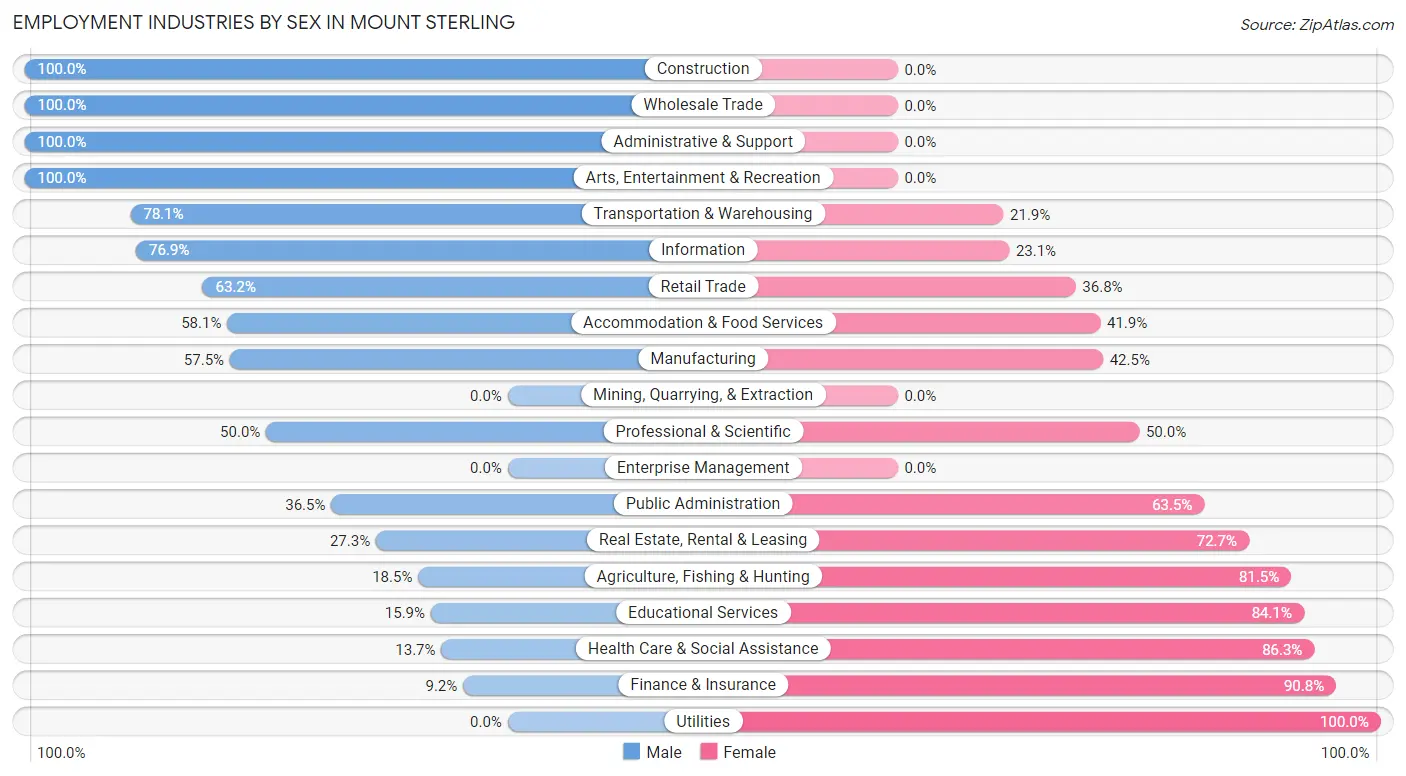
Employment Industries by Sex in Mount Sterling
The Mount Sterling industries that see more men than women are Construction (100.0%), Wholesale Trade (100.0%), and Administrative & Support (100.0%), whereas the industries that tend to have a higher number of women are Utilities (100.0%), Finance & Insurance (90.8%), and Health Care & Social Assistance (86.3%).
| Industry | Male | Female |
| Agriculture, Fishing & Hunting | 5 (18.5%) | 22 (81.5%) |
| Mining, Quarrying, & Extraction | 0 (0.0%) | 0 (0.0%) |
| Construction | 42 (100.0%) | 0 (0.0%) |
| Manufacturing | 46 (57.5%) | 34 (42.5%) |
| Wholesale Trade | 9 (100.0%) | 0 (0.0%) |
| Retail Trade | 60 (63.2%) | 35 (36.8%) |
| Transportation & Warehousing | 100 (78.1%) | 28 (21.9%) |
| Utilities | 0 (0.0%) | 19 (100.0%) |
| Information | 20 (76.9%) | 6 (23.1%) |
| Finance & Insurance | 6 (9.2%) | 59 (90.8%) |
| Real Estate, Rental & Leasing | 3 (27.3%) | 8 (72.7%) |
| Professional & Scientific | 7 (50.0%) | 7 (50.0%) |
| Enterprise Management | 0 (0.0%) | 0 (0.0%) |
| Administrative & Support | 14 (100.0%) | 0 (0.0%) |
| Educational Services | 7 (15.9%) | 37 (84.1%) |
| Health Care & Social Assistance | 18 (13.7%) | 113 (86.3%) |
| Arts, Entertainment & Recreation | 7 (100.0%) | 0 (0.0%) |
| Accommodation & Food Services | 18 (58.1%) | 13 (41.9%) |
| Public Administration | 23 (36.5%) | 40 (63.5%) |
| Total | 391 (47.8%) | 427 (52.2%) |
Education in Mount Sterling
School Enrollment in Mount Sterling
The most common levels of schooling among the 493 students in Mount Sterling are middle school (130 | 26.4%), high school (117 | 23.7%), and elementary school (114 | 23.1%).
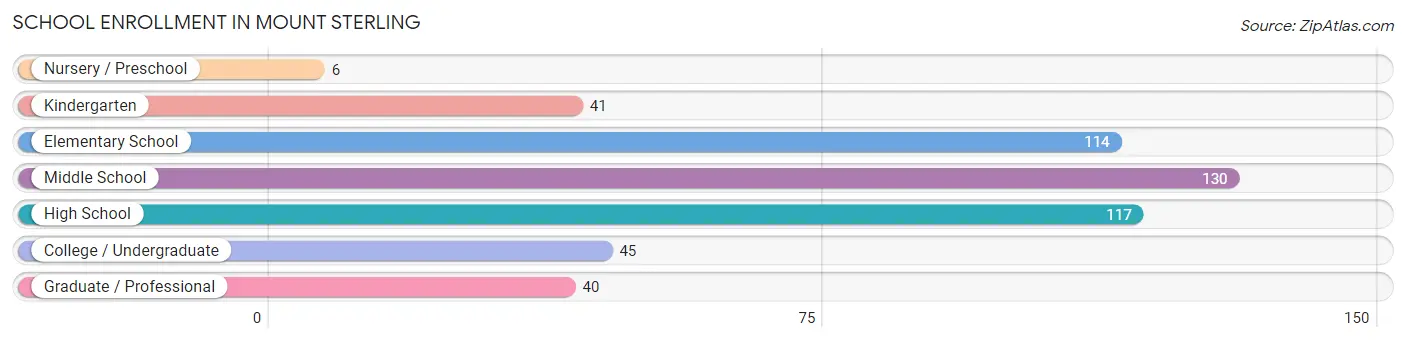
| School Level | # Students | % Students |
| Nursery / Preschool | 6 | 1.2% |
| Kindergarten | 41 | 8.3% |
| Elementary School | 114 | 23.1% |
| Middle School | 130 | 26.4% |
| High School | 117 | 23.7% |
| College / Undergraduate | 45 | 9.1% |
| Graduate / Professional | 40 | 8.1% |
| Total | 493 | 100.0% |
School Enrollment by Age by Funding Source in Mount Sterling
Out of a total of 493 students who are enrolled in schools in Mount Sterling, 70 (14.2%) attend a private institution, while the remaining 423 (85.8%) are enrolled in public schools. The age group of 3 to 4 year olds has the highest likelihood of being enrolled in private schools, with 5 (100.0% in the age bracket) enrolled. Conversely, the age group of 18 to 19 year olds has the lowest likelihood of being enrolled in a private school, with 22 (100.0% in the age bracket) attending a public institution.
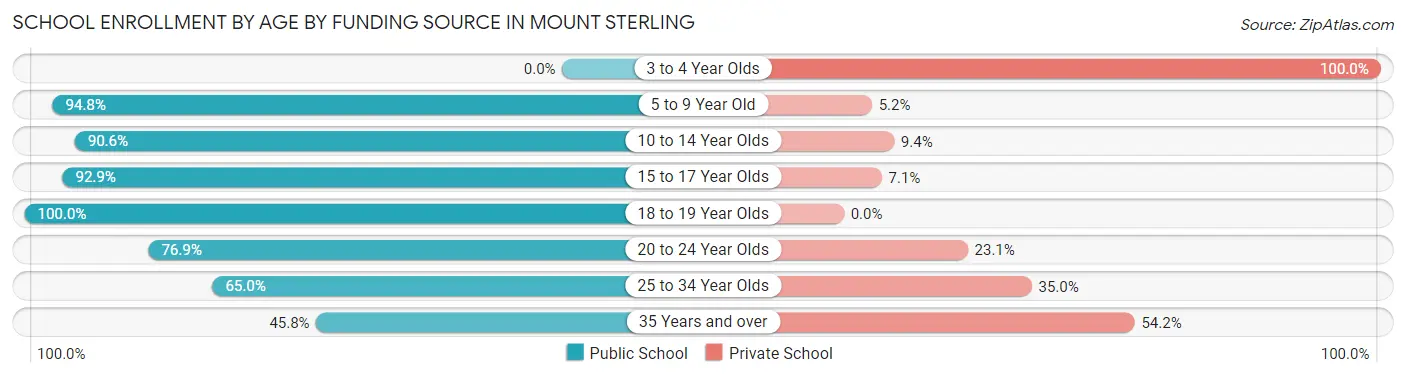
| Age Bracket | Public School | Private School |
| 3 to 4 Year Olds | 0 (0.0%) | 5 (100.0%) |
| 5 to 9 Year Old | 109 (94.8%) | 6 (5.2%) |
| 10 to 14 Year Olds | 155 (90.6%) | 16 (9.4%) |
| 15 to 17 Year Olds | 92 (92.9%) | 7 (7.1%) |
| 18 to 19 Year Olds | 22 (100.0%) | 0 (0.0%) |
| 20 to 24 Year Olds | 10 (76.9%) | 3 (23.1%) |
| 25 to 34 Year Olds | 13 (65.0%) | 7 (35.0%) |
| 35 Years and over | 22 (45.8%) | 26 (54.2%) |
| Total | 423 (85.8%) | 70 (14.2%) |
Educational Attainment by Field of Study in Mount Sterling
Business (51 | 22.8%), education (33 | 14.7%), physical & health sciences (21 | 9.4%), psychology (21 | 9.4%), and communications (18 | 8.0%) are the most common fields of study among 224 individuals in Mount Sterling who have obtained a bachelor's degree or higher.
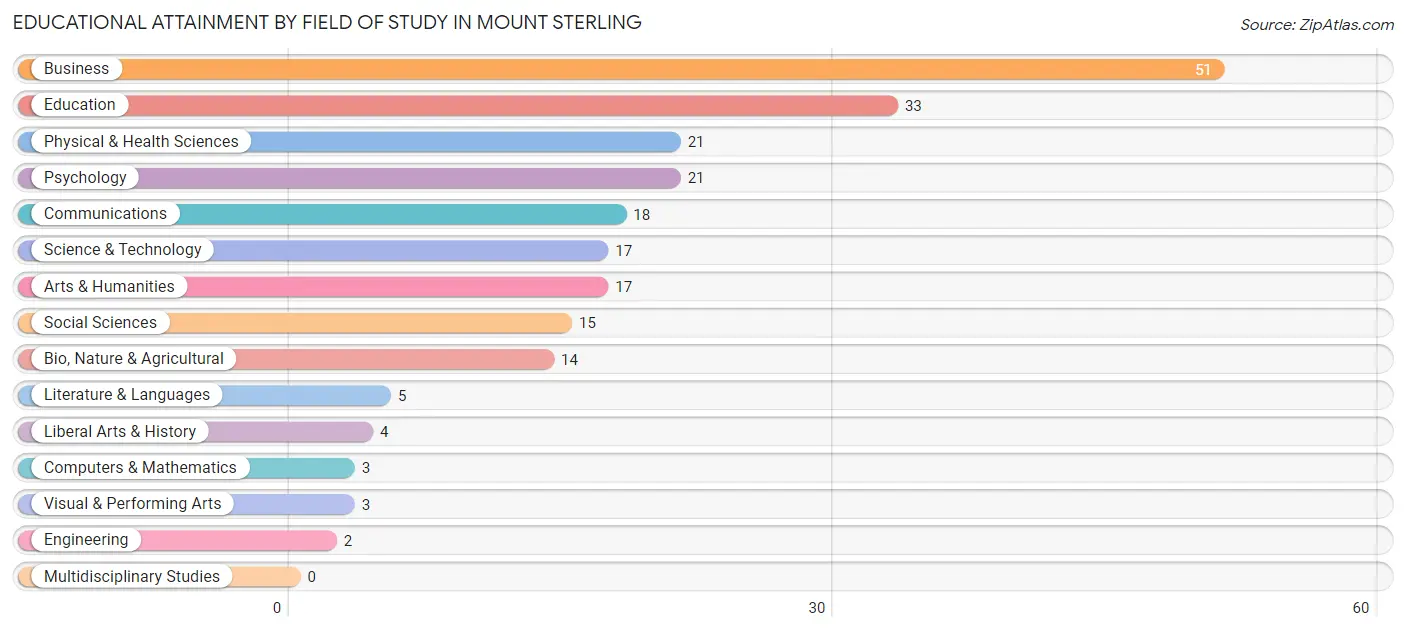
| Field of Study | # Graduates | % Graduates |
| Computers & Mathematics | 3 | 1.3% |
| Bio, Nature & Agricultural | 14 | 6.2% |
| Physical & Health Sciences | 21 | 9.4% |
| Psychology | 21 | 9.4% |
| Social Sciences | 15 | 6.7% |
| Engineering | 2 | 0.9% |
| Multidisciplinary Studies | 0 | 0.0% |
| Science & Technology | 17 | 7.6% |
| Business | 51 | 22.8% |
| Education | 33 | 14.7% |
| Literature & Languages | 5 | 2.2% |
| Liberal Arts & History | 4 | 1.8% |
| Visual & Performing Arts | 3 | 1.3% |
| Communications | 18 | 8.0% |
| Arts & Humanities | 17 | 7.6% |
| Total | 224 | 100.0% |
Transportation & Commute in Mount Sterling
Vehicle Availability by Sex in Mount Sterling
The most prevalent vehicle ownership categories in Mount Sterling are males with 2 vehicles (170, accounting for 43.5%) and females with 2 vehicles (157, making up 40.4%).
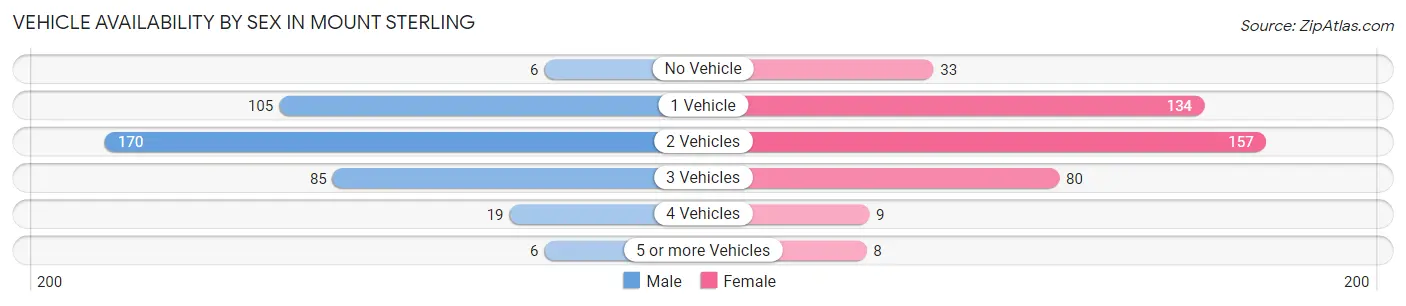
| Vehicles Available | Male | Female |
| No Vehicle | 6 (1.5%) | 33 (7.8%) |
| 1 Vehicle | 105 (26.9%) | 134 (31.8%) |
| 2 Vehicles | 170 (43.5%) | 157 (37.3%) |
| 3 Vehicles | 85 (21.7%) | 80 (19.0%) |
| 4 Vehicles | 19 (4.9%) | 9 (2.1%) |
| 5 or more Vehicles | 6 (1.5%) | 8 (1.9%) |
| Total | 391 (100.0%) | 421 (100.0%) |
Commute Time in Mount Sterling
The most frequently occuring commute durations in Mount Sterling are 30 to 34 minutes (150 commuters, 19.0%), 15 to 19 minutes (80 commuters, 10.1%), and 40 to 44 minutes (78 commuters, 9.9%).
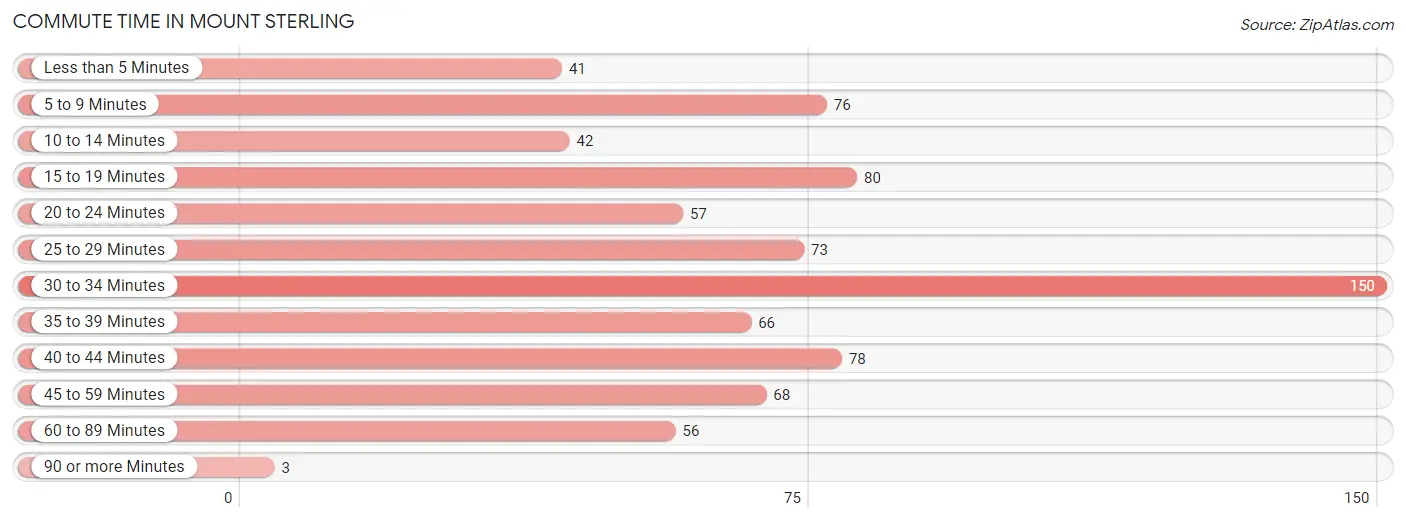
| Commute Time | # Commuters | % Commuters |
| Less than 5 Minutes | 41 | 5.2% |
| 5 to 9 Minutes | 76 | 9.6% |
| 10 to 14 Minutes | 42 | 5.3% |
| 15 to 19 Minutes | 80 | 10.1% |
| 20 to 24 Minutes | 57 | 7.2% |
| 25 to 29 Minutes | 73 | 9.2% |
| 30 to 34 Minutes | 150 | 19.0% |
| 35 to 39 Minutes | 66 | 8.4% |
| 40 to 44 Minutes | 78 | 9.9% |
| 45 to 59 Minutes | 68 | 8.6% |
| 60 to 89 Minutes | 56 | 7.1% |
| 90 or more Minutes | 3 | 0.4% |
Commute Time by Sex in Mount Sterling
The most common commute times in Mount Sterling are 30 to 34 minutes (99 commuters, 25.3%) for males and 15 to 19 minutes (68 commuters, 17.0%) for females.
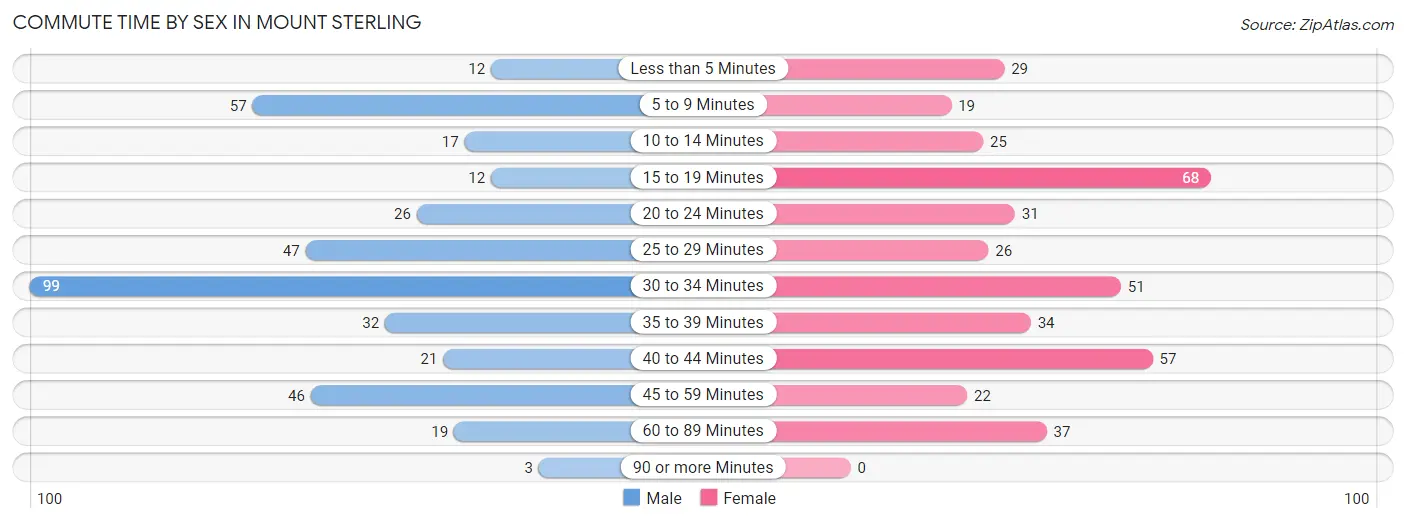
| Commute Time | Male | Female |
| Less than 5 Minutes | 12 (3.1%) | 29 (7.3%) |
| 5 to 9 Minutes | 57 (14.6%) | 19 (4.8%) |
| 10 to 14 Minutes | 17 (4.3%) | 25 (6.3%) |
| 15 to 19 Minutes | 12 (3.1%) | 68 (17.0%) |
| 20 to 24 Minutes | 26 (6.7%) | 31 (7.8%) |
| 25 to 29 Minutes | 47 (12.0%) | 26 (6.5%) |
| 30 to 34 Minutes | 99 (25.3%) | 51 (12.8%) |
| 35 to 39 Minutes | 32 (8.2%) | 34 (8.5%) |
| 40 to 44 Minutes | 21 (5.4%) | 57 (14.3%) |
| 45 to 59 Minutes | 46 (11.8%) | 22 (5.5%) |
| 60 to 89 Minutes | 19 (4.9%) | 37 (9.3%) |
| 90 or more Minutes | 3 (0.8%) | 0 (0.0%) |
Time of Departure to Work by Sex in Mount Sterling
The most frequent times of departure to work in Mount Sterling are 6:00 AM to 6:29 AM (58, 14.8%) for males and 4:00 PM to 11:59 PM (82, 20.5%) for females.
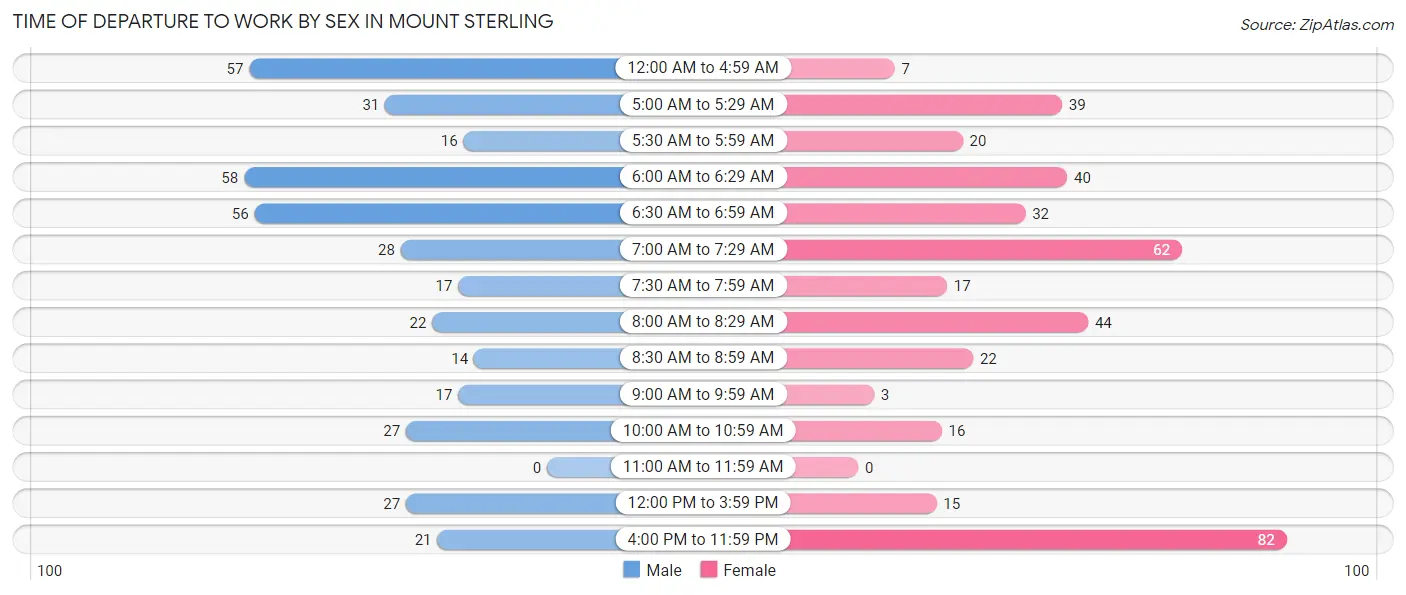
| Time of Departure | Male | Female |
| 12:00 AM to 4:59 AM | 57 (14.6%) | 7 (1.8%) |
| 5:00 AM to 5:29 AM | 31 (7.9%) | 39 (9.8%) |
| 5:30 AM to 5:59 AM | 16 (4.1%) | 20 (5.0%) |
| 6:00 AM to 6:29 AM | 58 (14.8%) | 40 (10.0%) |
| 6:30 AM to 6:59 AM | 56 (14.3%) | 32 (8.0%) |
| 7:00 AM to 7:29 AM | 28 (7.2%) | 62 (15.5%) |
| 7:30 AM to 7:59 AM | 17 (4.3%) | 17 (4.3%) |
| 8:00 AM to 8:29 AM | 22 (5.6%) | 44 (11.0%) |
| 8:30 AM to 8:59 AM | 14 (3.6%) | 22 (5.5%) |
| 9:00 AM to 9:59 AM | 17 (4.3%) | 3 (0.7%) |
| 10:00 AM to 10:59 AM | 27 (6.9%) | 16 (4.0%) |
| 11:00 AM to 11:59 AM | 0 (0.0%) | 0 (0.0%) |
| 12:00 PM to 3:59 PM | 27 (6.9%) | 15 (3.8%) |
| 4:00 PM to 11:59 PM | 21 (5.4%) | 82 (20.5%) |
| Total | 391 (100.0%) | 399 (100.0%) |
Housing Occupancy in Mount Sterling
Occupancy by Ownership in Mount Sterling
Of the total 769 dwellings in Mount Sterling, owner-occupied units account for 457 (59.4%), while renter-occupied units make up 312 (40.6%).
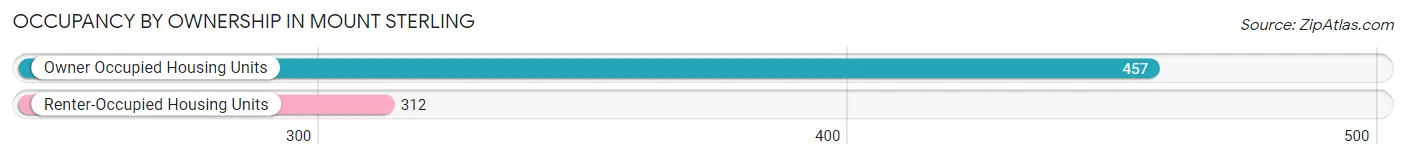
| Occupancy | # Housing Units | % Housing Units |
| Owner Occupied Housing Units | 457 | 59.4% |
| Renter-Occupied Housing Units | 312 | 40.6% |
| Total Occupied Housing Units | 769 | 100.0% |
Occupancy by Household Size in Mount Sterling
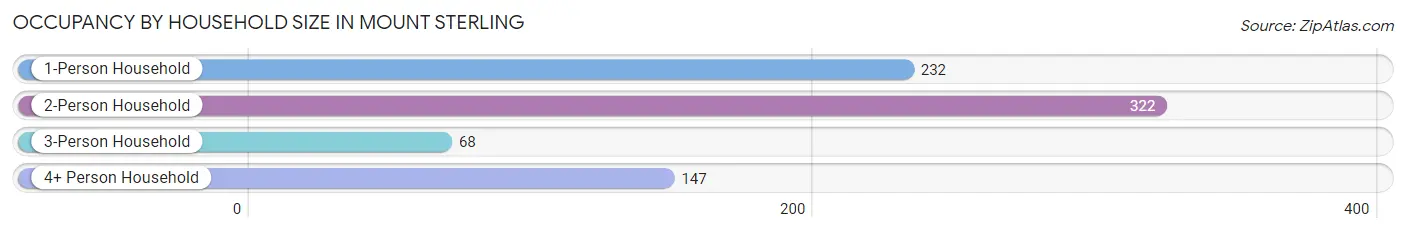
| Household Size | # Housing Units | % Housing Units |
| 1-Person Household | 232 | 30.2% |
| 2-Person Household | 322 | 41.9% |
| 3-Person Household | 68 | 8.8% |
| 4+ Person Household | 147 | 19.1% |
| Total Housing Units | 769 | 100.0% |
Occupancy by Ownership by Household Size in Mount Sterling
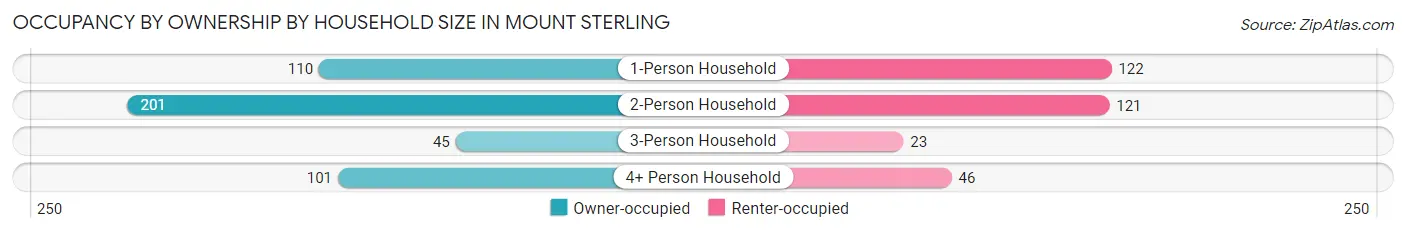
| Household Size | Owner-occupied | Renter-occupied |
| 1-Person Household | 110 (47.4%) | 122 (52.6%) |
| 2-Person Household | 201 (62.4%) | 121 (37.6%) |
| 3-Person Household | 45 (66.2%) | 23 (33.8%) |
| 4+ Person Household | 101 (68.7%) | 46 (31.3%) |
| Total Housing Units | 457 (59.4%) | 312 (40.6%) |
Occupancy by Educational Attainment in Mount Sterling
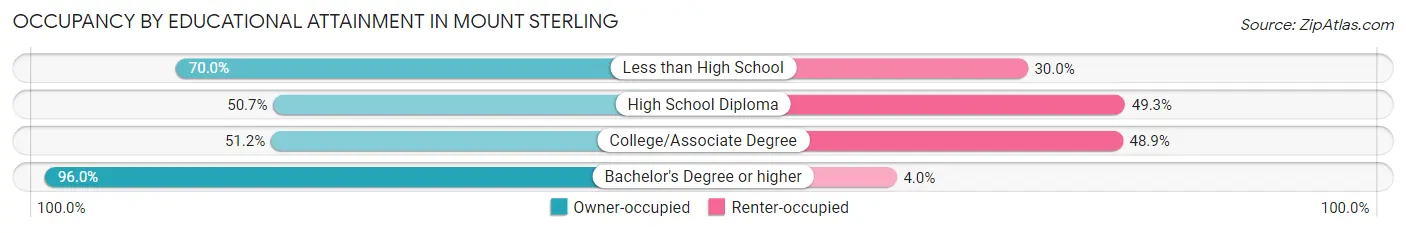
| Household Size | Owner-occupied | Renter-occupied |
| Less than High School | 35 (70.0%) | 15 (30.0%) |
| High School Diploma | 147 (50.7%) | 143 (49.3%) |
| College/Associate Degree | 156 (51.1%) | 149 (48.8%) |
| Bachelor's Degree or higher | 119 (96.0%) | 5 (4.0%) |
Occupancy by Age of Householder in Mount Sterling
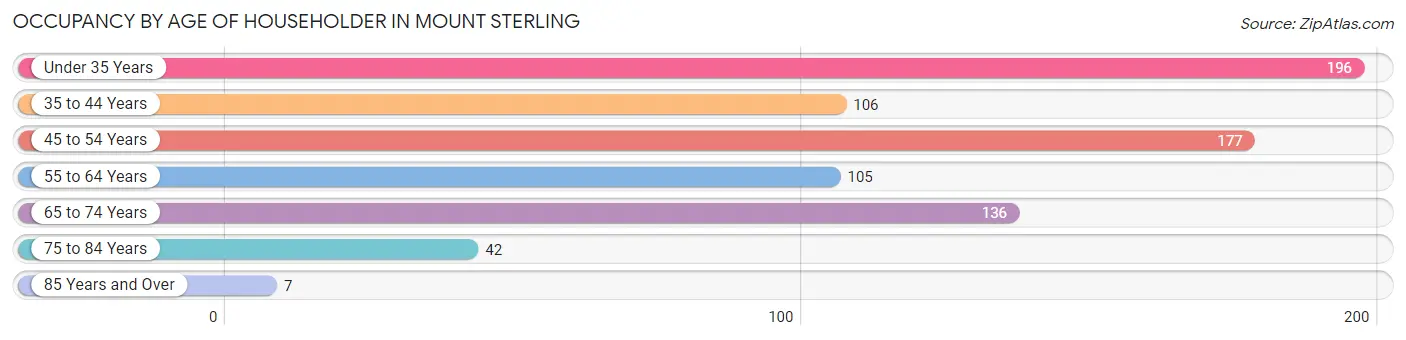
| Age Bracket | # Households | % Households |
| Under 35 Years | 196 | 25.5% |
| 35 to 44 Years | 106 | 13.8% |
| 45 to 54 Years | 177 | 23.0% |
| 55 to 64 Years | 105 | 13.7% |
| 65 to 74 Years | 136 | 17.7% |
| 75 to 84 Years | 42 | 5.5% |
| 85 Years and Over | 7 | 0.9% |
| Total | 769 | 100.0% |
Housing Finances in Mount Sterling
Median Income by Occupancy in Mount Sterling
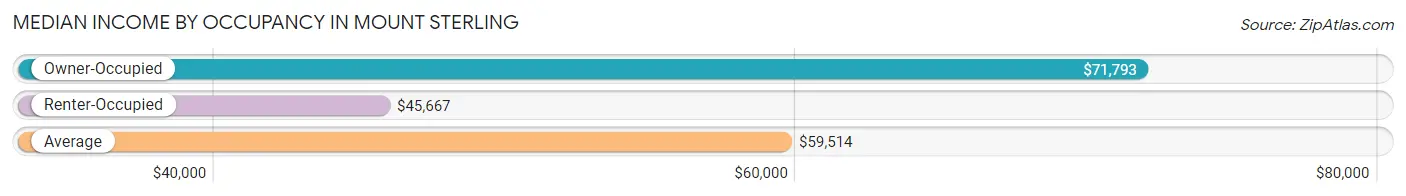
| Occupancy Type | # Households | Median Income |
| Owner-Occupied | 457 (59.4%) | $71,793 |
| Renter-Occupied | 312 (40.6%) | $45,667 |
| Average | 769 (100.0%) | $59,514 |
Occupancy by Householder Income Bracket in Mount Sterling
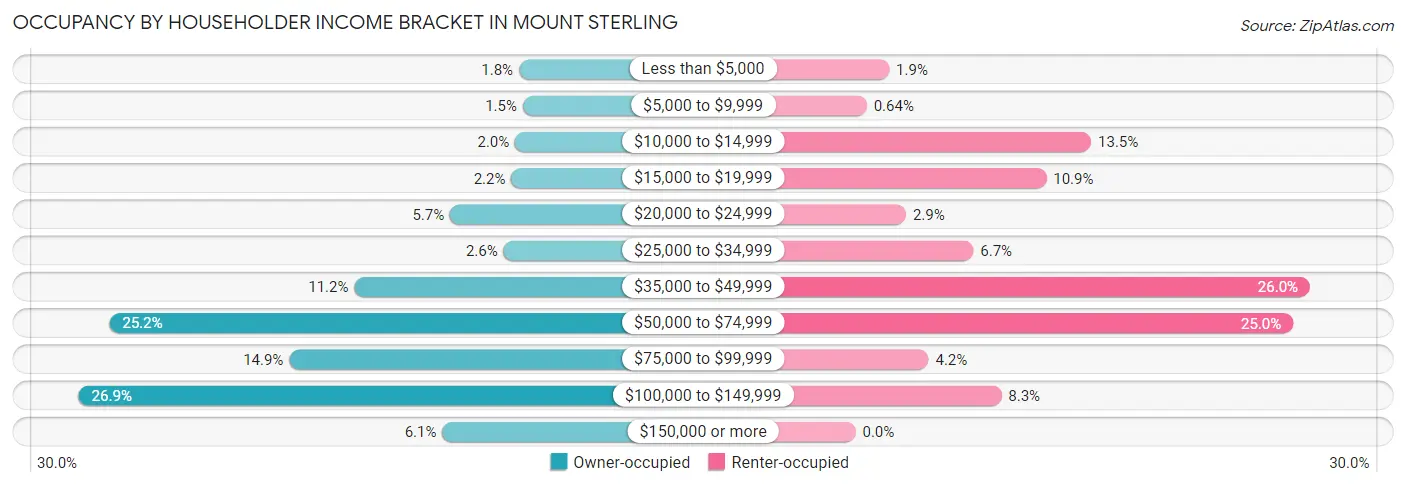
| Income Bracket | Owner-occupied | Renter-occupied |
| Less than $5,000 | 8 (1.8%) | 6 (1.9%) |
| $5,000 to $9,999 | 7 (1.5%) | 2 (0.6%) |
| $10,000 to $14,999 | 9 (2.0%) | 42 (13.5%) |
| $15,000 to $19,999 | 10 (2.2%) | 34 (10.9%) |
| $20,000 to $24,999 | 26 (5.7%) | 9 (2.9%) |
| $25,000 to $34,999 | 12 (2.6%) | 21 (6.7%) |
| $35,000 to $49,999 | 51 (11.2%) | 81 (26.0%) |
| $50,000 to $74,999 | 115 (25.2%) | 78 (25.0%) |
| $75,000 to $99,999 | 68 (14.9%) | 13 (4.2%) |
| $100,000 to $149,999 | 123 (26.9%) | 26 (8.3%) |
| $150,000 or more | 28 (6.1%) | 0 (0.0%) |
| Total | 457 (100.0%) | 312 (100.0%) |
Monthly Housing Cost Tiers in Mount Sterling
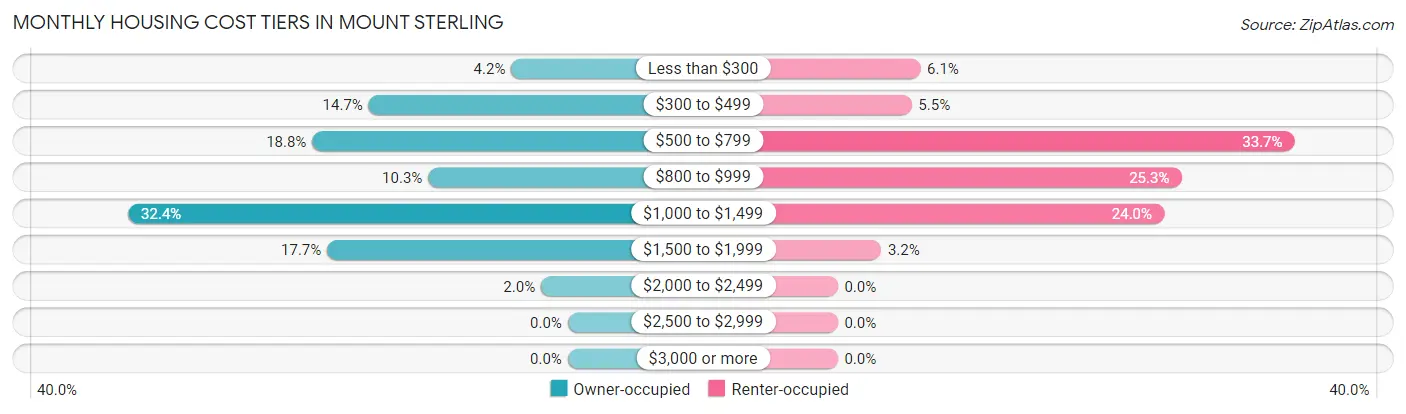
| Monthly Cost | Owner-occupied | Renter-occupied |
| Less than $300 | 19 (4.2%) | 19 (6.1%) |
| $300 to $499 | 67 (14.7%) | 17 (5.4%) |
| $500 to $799 | 86 (18.8%) | 105 (33.7%) |
| $800 to $999 | 47 (10.3%) | 79 (25.3%) |
| $1,000 to $1,499 | 148 (32.4%) | 75 (24.0%) |
| $1,500 to $1,999 | 81 (17.7%) | 10 (3.2%) |
| $2,000 to $2,499 | 9 (2.0%) | 0 (0.0%) |
| $2,500 to $2,999 | 0 (0.0%) | 0 (0.0%) |
| $3,000 or more | 0 (0.0%) | 0 (0.0%) |
| Total | 457 (100.0%) | 312 (100.0%) |
Physical Housing Characteristics in Mount Sterling
Housing Structures in Mount Sterling
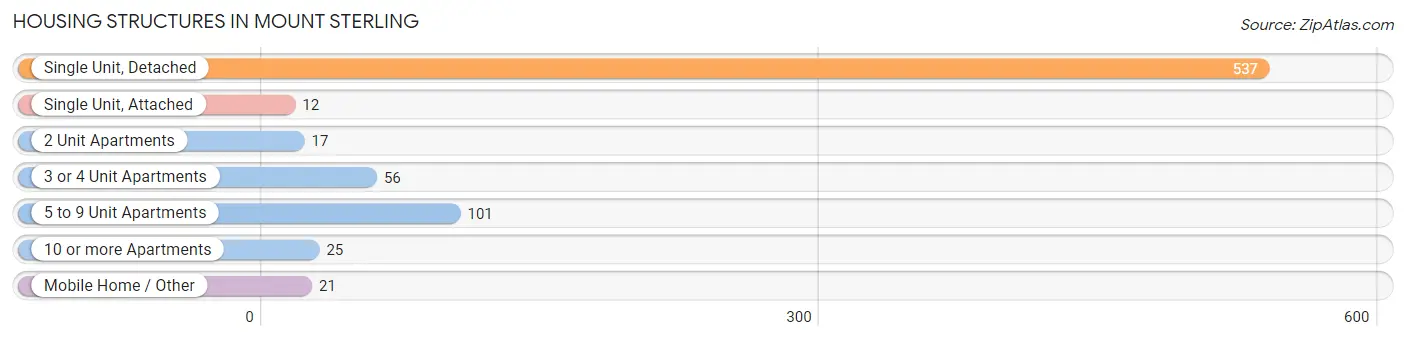
| Structure Type | # Housing Units | % Housing Units |
| Single Unit, Detached | 537 | 69.8% |
| Single Unit, Attached | 12 | 1.6% |
| 2 Unit Apartments | 17 | 2.2% |
| 3 or 4 Unit Apartments | 56 | 7.3% |
| 5 to 9 Unit Apartments | 101 | 13.1% |
| 10 or more Apartments | 25 | 3.3% |
| Mobile Home / Other | 21 | 2.7% |
| Total | 769 | 100.0% |
Housing Structures by Occupancy in Mount Sterling
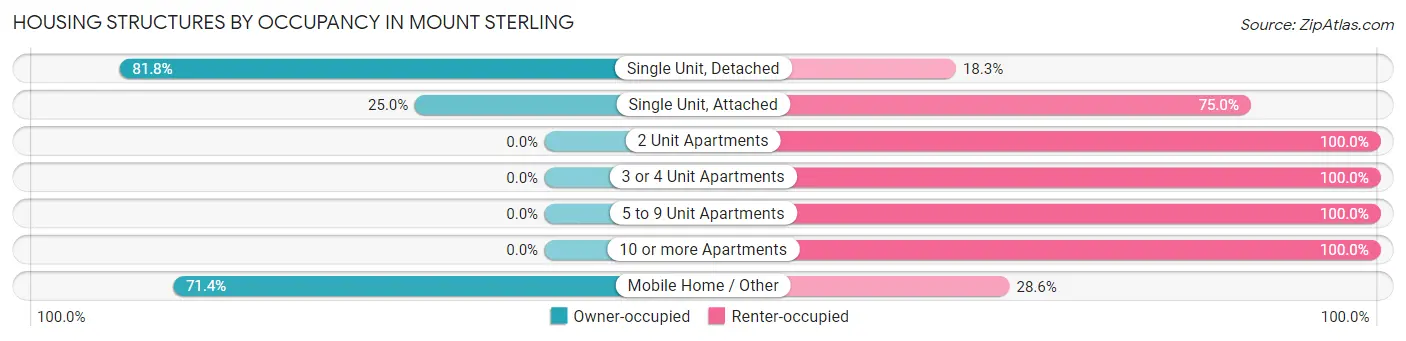
| Structure Type | Owner-occupied | Renter-occupied |
| Single Unit, Detached | 439 (81.8%) | 98 (18.2%) |
| Single Unit, Attached | 3 (25.0%) | 9 (75.0%) |
| 2 Unit Apartments | 0 (0.0%) | 17 (100.0%) |
| 3 or 4 Unit Apartments | 0 (0.0%) | 56 (100.0%) |
| 5 to 9 Unit Apartments | 0 (0.0%) | 101 (100.0%) |
| 10 or more Apartments | 0 (0.0%) | 25 (100.0%) |
| Mobile Home / Other | 15 (71.4%) | 6 (28.6%) |
| Total | 457 (59.4%) | 312 (40.6%) |
Housing Structures by Number of Rooms in Mount Sterling
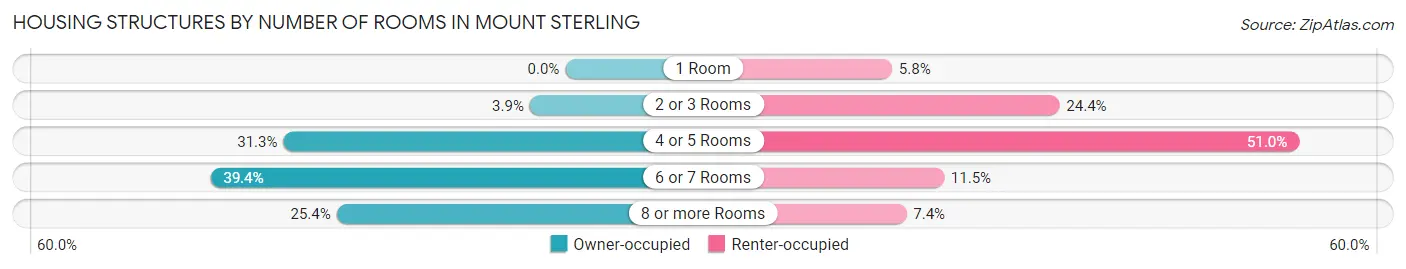
| Number of Rooms | Owner-occupied | Renter-occupied |
| 1 Room | 0 (0.0%) | 18 (5.8%) |
| 2 or 3 Rooms | 18 (3.9%) | 76 (24.4%) |
| 4 or 5 Rooms | 143 (31.3%) | 159 (51.0%) |
| 6 or 7 Rooms | 180 (39.4%) | 36 (11.5%) |
| 8 or more Rooms | 116 (25.4%) | 23 (7.4%) |
| Total | 457 (100.0%) | 312 (100.0%) |
Housing Structure by Heating Type in Mount Sterling
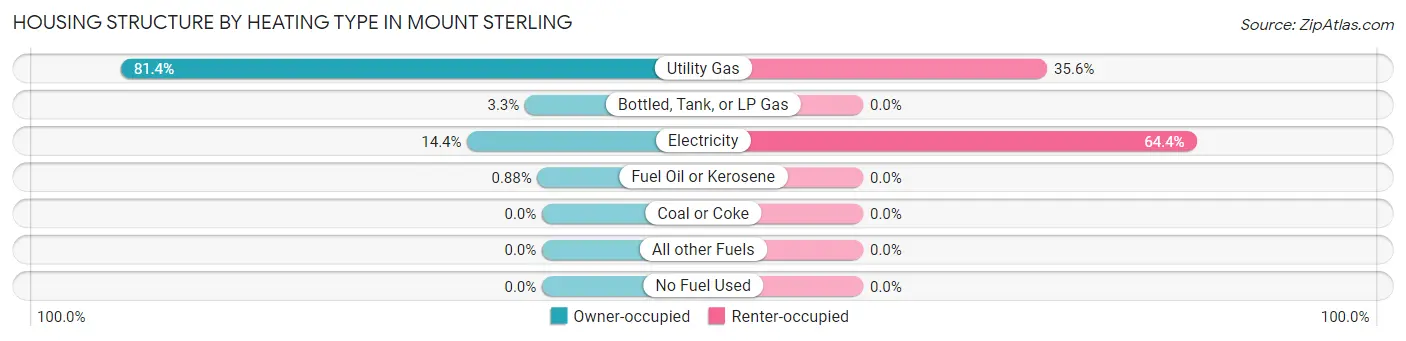
| Heating Type | Owner-occupied | Renter-occupied |
| Utility Gas | 372 (81.4%) | 111 (35.6%) |
| Bottled, Tank, or LP Gas | 15 (3.3%) | 0 (0.0%) |
| Electricity | 66 (14.4%) | 201 (64.4%) |
| Fuel Oil or Kerosene | 4 (0.9%) | 0 (0.0%) |
| Coal or Coke | 0 (0.0%) | 0 (0.0%) |
| All other Fuels | 0 (0.0%) | 0 (0.0%) |
| No Fuel Used | 0 (0.0%) | 0 (0.0%) |
| Total | 457 (100.0%) | 312 (100.0%) |
Household Vehicle Usage in Mount Sterling
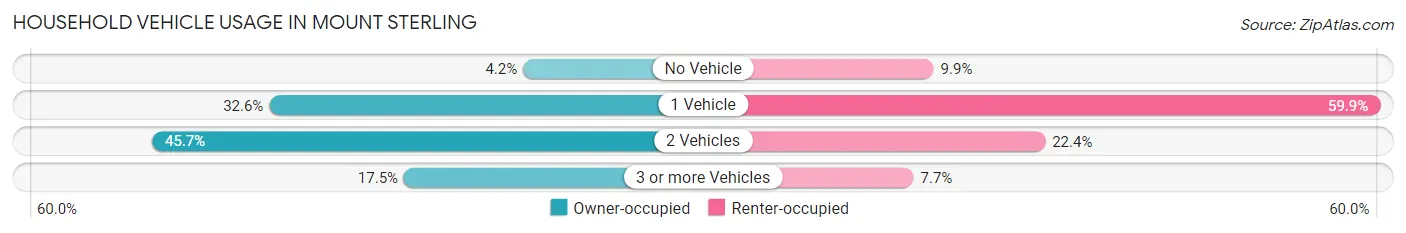
| Vehicles per Household | Owner-occupied | Renter-occupied |
| No Vehicle | 19 (4.2%) | 31 (9.9%) |
| 1 Vehicle | 149 (32.6%) | 187 (59.9%) |
| 2 Vehicles | 209 (45.7%) | 70 (22.4%) |
| 3 or more Vehicles | 80 (17.5%) | 24 (7.7%) |
| Total | 457 (100.0%) | 312 (100.0%) |
Real Estate & Mortgages in Mount Sterling
Real Estate and Mortgage Overview in Mount Sterling
| Characteristic | Without Mortgage | With Mortgage |
| Housing Units | 122 | 335 |
| Median Property Value | $130,800 | $153,300 |
| Median Household Income | $42,083 | $18 |
| Monthly Housing Costs | $454 | $0 |
| Real Estate Taxes | $1,275 | $8 |
Property Value by Mortgage Status in Mount Sterling
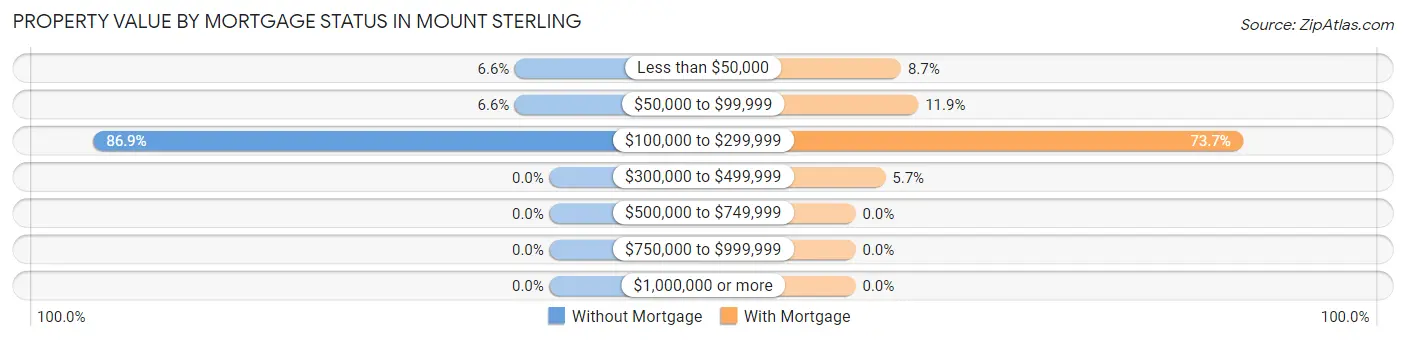
| Property Value | Without Mortgage | With Mortgage |
| Less than $50,000 | 8 (6.6%) | 29 (8.7%) |
| $50,000 to $99,999 | 8 (6.6%) | 40 (11.9%) |
| $100,000 to $299,999 | 106 (86.9%) | 247 (73.7%) |
| $300,000 to $499,999 | 0 (0.0%) | 19 (5.7%) |
| $500,000 to $749,999 | 0 (0.0%) | 0 (0.0%) |
| $750,000 to $999,999 | 0 (0.0%) | 0 (0.0%) |
| $1,000,000 or more | 0 (0.0%) | 0 (0.0%) |
| Total | 122 (100.0%) | 335 (100.0%) |
Household Income by Mortgage Status in Mount Sterling
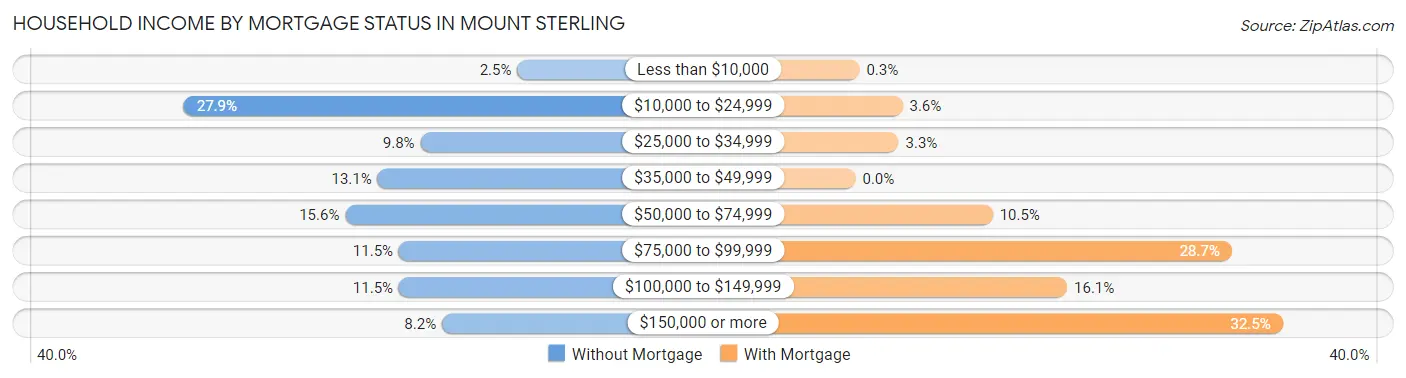
| Household Income | Without Mortgage | With Mortgage |
| Less than $10,000 | 3 (2.5%) | 1 (0.3%) |
| $10,000 to $24,999 | 34 (27.9%) | 12 (3.6%) |
| $25,000 to $34,999 | 12 (9.8%) | 11 (3.3%) |
| $35,000 to $49,999 | 16 (13.1%) | 0 (0.0%) |
| $50,000 to $74,999 | 19 (15.6%) | 35 (10.4%) |
| $75,000 to $99,999 | 14 (11.5%) | 96 (28.7%) |
| $100,000 to $149,999 | 14 (11.5%) | 54 (16.1%) |
| $150,000 or more | 10 (8.2%) | 109 (32.5%) |
| Total | 122 (100.0%) | 335 (100.0%) |
Property Value to Household Income Ratio in Mount Sterling
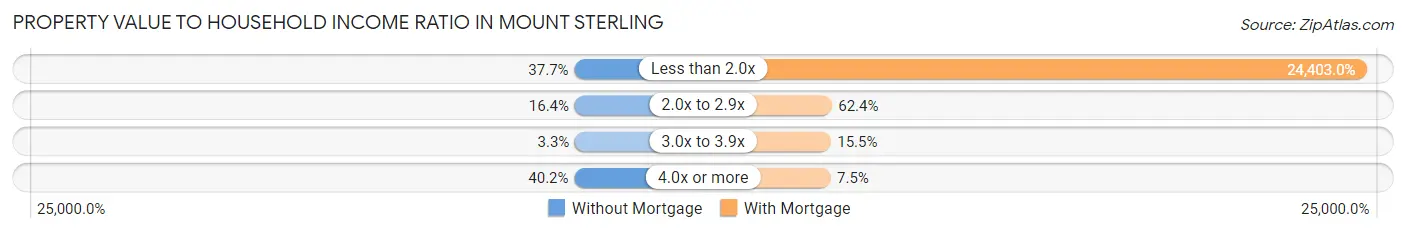
| Value-to-Income Ratio | Without Mortgage | With Mortgage |
| Less than 2.0x | 46 (37.7%) | 81,750 (24,403.0%) |
| 2.0x to 2.9x | 20 (16.4%) | 209 (62.4%) |
| 3.0x to 3.9x | 4 (3.3%) | 52 (15.5%) |
| 4.0x or more | 49 (40.2%) | 25 (7.5%) |
| Total | 122 (100.0%) | 335 (100.0%) |
Real Estate Taxes by Mortgage Status in Mount Sterling
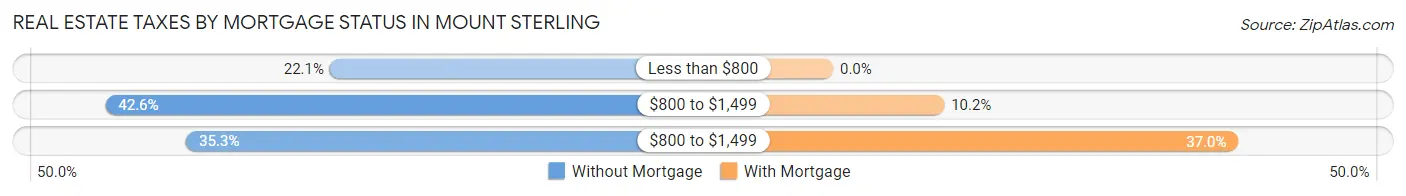
| Property Taxes | Without Mortgage | With Mortgage |
| Less than $800 | 27 (22.1%) | 0 (0.0%) |
| $800 to $1,499 | 52 (42.6%) | 34 (10.2%) |
| $800 to $1,499 | 43 (35.2%) | 124 (37.0%) |
| Total | 122 (100.0%) | 335 (100.0%) |
Health & Disability in Mount Sterling
Health Insurance Coverage by Age in Mount Sterling
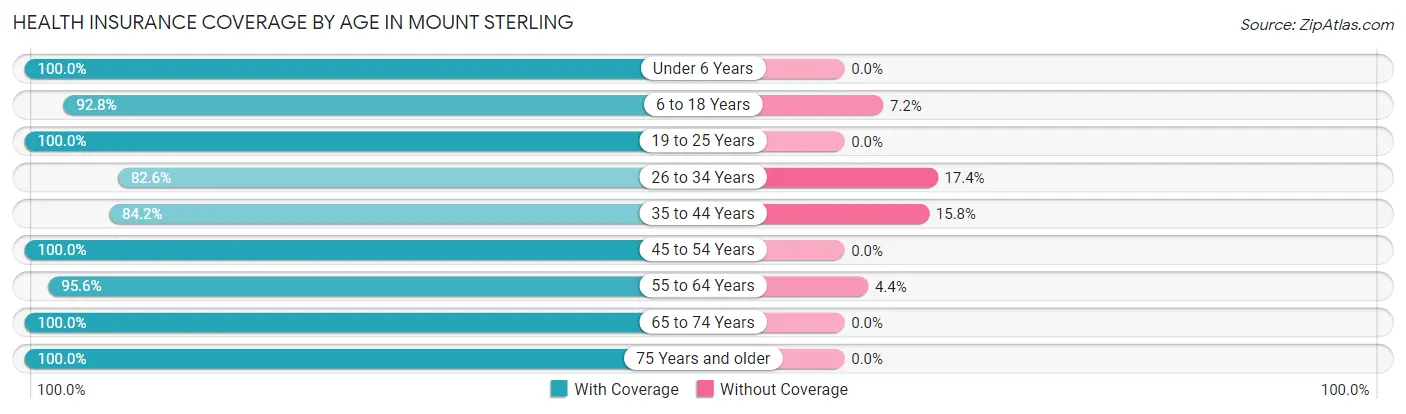
| Age Bracket | With Coverage | Without Coverage |
| Under 6 Years | 125 (100.0%) | 0 (0.0%) |
| 6 to 18 Years | 359 (92.8%) | 28 (7.2%) |
| 19 to 25 Years | 85 (100.0%) | 0 (0.0%) |
| 26 to 34 Years | 276 (82.6%) | 58 (17.4%) |
| 35 to 44 Years | 203 (84.2%) | 38 (15.8%) |
| 45 to 54 Years | 246 (100.0%) | 0 (0.0%) |
| 55 to 64 Years | 151 (95.6%) | 7 (4.4%) |
| 65 to 74 Years | 227 (100.0%) | 0 (0.0%) |
| 75 Years and older | 87 (100.0%) | 0 (0.0%) |
| Total | 1,759 (93.1%) | 131 (6.9%) |
Health Insurance Coverage by Citizenship Status in Mount Sterling
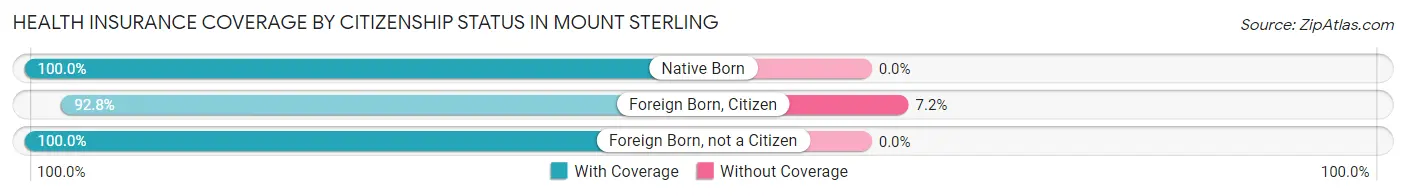
| Citizenship Status | With Coverage | Without Coverage |
| Native Born | 125 (100.0%) | 0 (0.0%) |
| Foreign Born, Citizen | 359 (92.8%) | 28 (7.2%) |
| Foreign Born, not a Citizen | 85 (100.0%) | 0 (0.0%) |
Health Insurance Coverage by Household Income in Mount Sterling
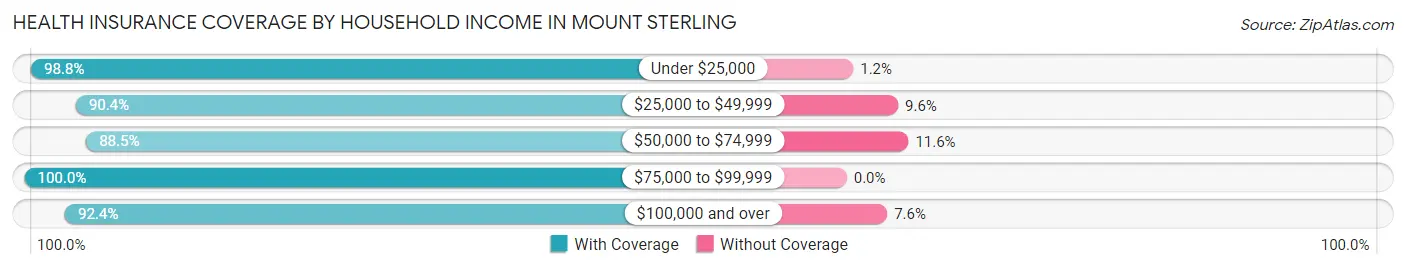
| Household Income | With Coverage | Without Coverage |
| Under $25,000 | 324 (98.8%) | 4 (1.2%) |
| $25,000 to $49,999 | 254 (90.4%) | 27 (9.6%) |
| $50,000 to $74,999 | 444 (88.4%) | 58 (11.6%) |
| $75,000 to $99,999 | 208 (100.0%) | 0 (0.0%) |
| $100,000 and over | 512 (92.4%) | 42 (7.6%) |
Public vs Private Health Insurance Coverage by Age in Mount Sterling
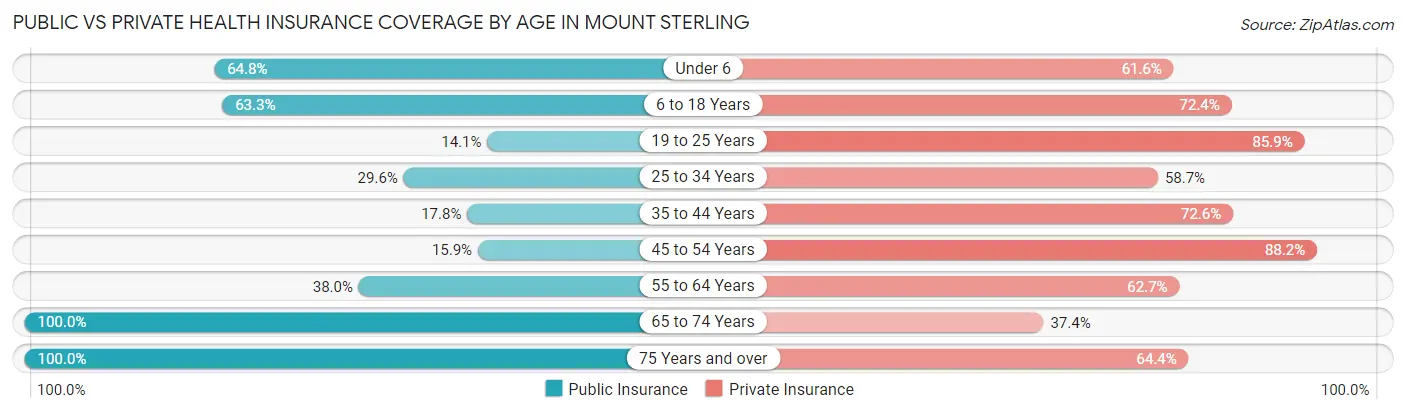
| Age Bracket | Public Insurance | Private Insurance |
| Under 6 | 81 (64.8%) | 77 (61.6%) |
| 6 to 18 Years | 245 (63.3%) | 280 (72.4%) |
| 19 to 25 Years | 12 (14.1%) | 73 (85.9%) |
| 25 to 34 Years | 99 (29.6%) | 196 (58.7%) |
| 35 to 44 Years | 43 (17.8%) | 175 (72.6%) |
| 45 to 54 Years | 39 (15.9%) | 217 (88.2%) |
| 55 to 64 Years | 60 (38.0%) | 99 (62.7%) |
| 65 to 74 Years | 227 (100.0%) | 85 (37.4%) |
| 75 Years and over | 87 (100.0%) | 56 (64.4%) |
| Total | 893 (47.2%) | 1,258 (66.6%) |
Disability Status by Sex by Age in Mount Sterling
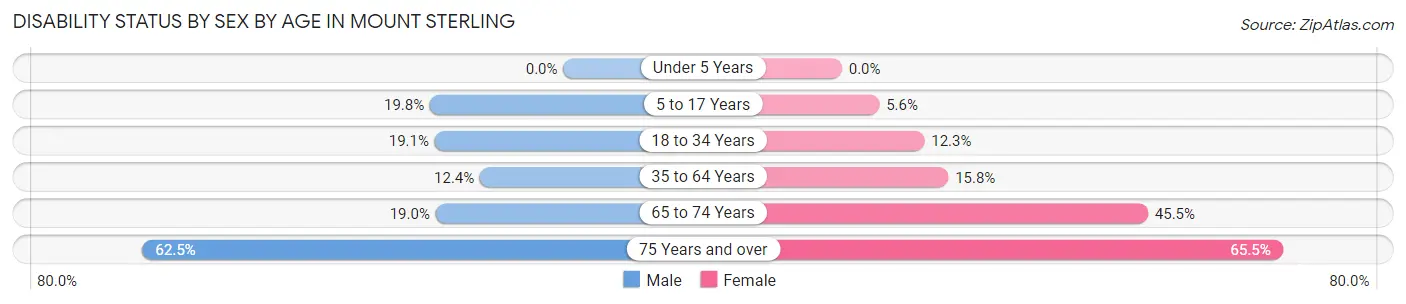
| Age Bracket | Male | Female |
| Under 5 Years | 0 (0.0%) | 0 (0.0%) |
| 5 to 17 Years | 37 (19.8%) | 11 (5.6%) |
| 18 to 34 Years | 46 (19.1%) | 25 (12.2%) |
| 35 to 64 Years | 32 (12.4%) | 61 (15.8%) |
| 65 to 74 Years | 18 (19.0%) | 60 (45.5%) |
| 75 Years and over | 20 (62.5%) | 36 (65.4%) |
Disability Class by Sex by Age in Mount Sterling
Disability Class: Hearing Difficulty
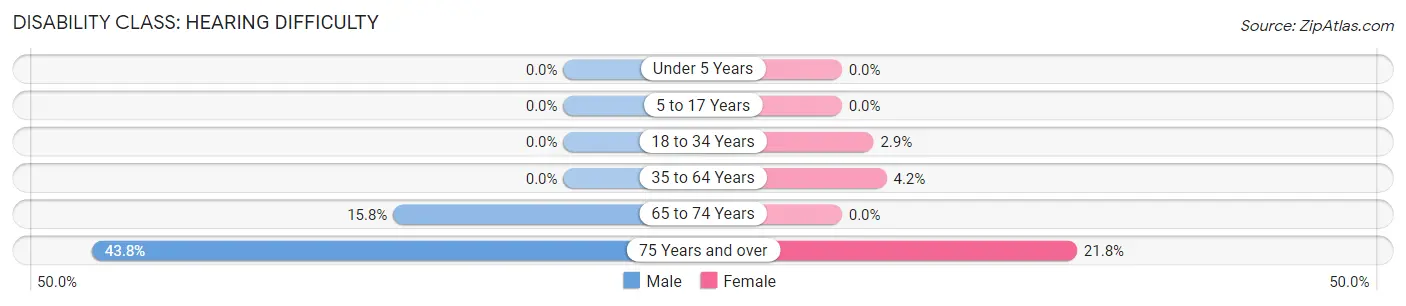
| Age Bracket | Male | Female |
| Under 5 Years | 0 (0.0%) | 0 (0.0%) |
| 5 to 17 Years | 0 (0.0%) | 0 (0.0%) |
| 18 to 34 Years | 0 (0.0%) | 6 (2.9%) |
| 35 to 64 Years | 0 (0.0%) | 16 (4.2%) |
| 65 to 74 Years | 15 (15.8%) | 0 (0.0%) |
| 75 Years and over | 14 (43.8%) | 12 (21.8%) |
Disability Class: Vision Difficulty
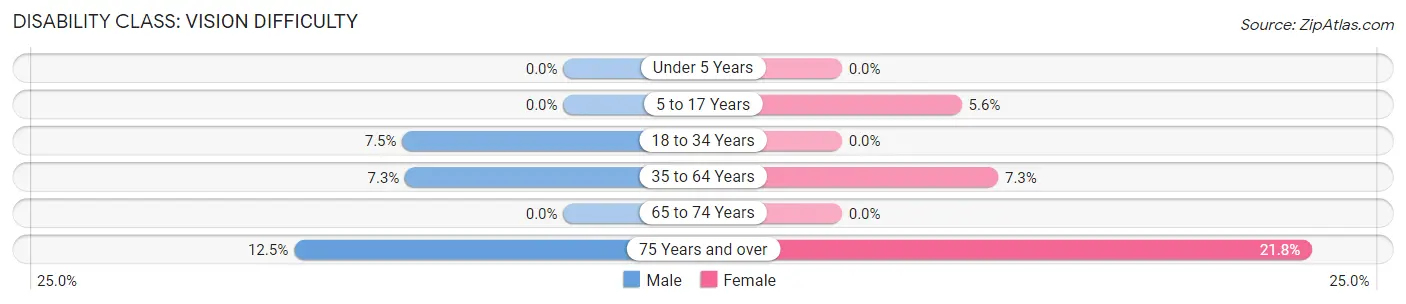
| Age Bracket | Male | Female |
| Under 5 Years | 0 (0.0%) | 0 (0.0%) |
| 5 to 17 Years | 0 (0.0%) | 11 (5.6%) |
| 18 to 34 Years | 18 (7.5%) | 0 (0.0%) |
| 35 to 64 Years | 19 (7.3%) | 28 (7.2%) |
| 65 to 74 Years | 0 (0.0%) | 0 (0.0%) |
| 75 Years and over | 4 (12.5%) | 12 (21.8%) |
Disability Class: Cognitive Difficulty
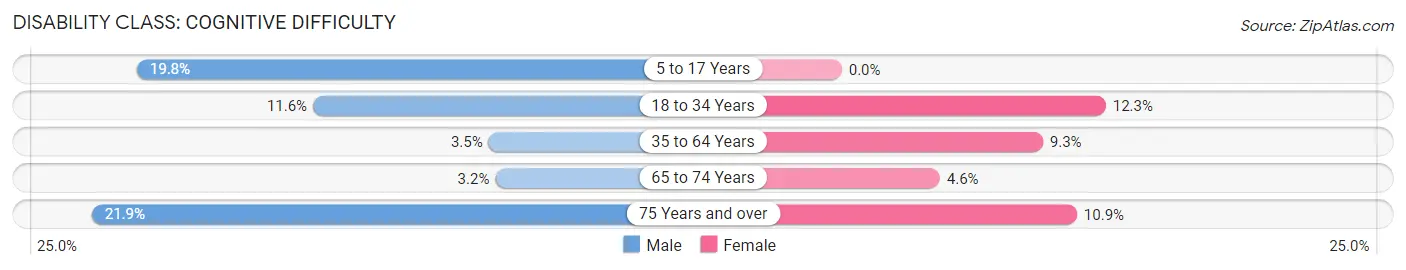
| Age Bracket | Male | Female |
| 5 to 17 Years | 37 (19.8%) | 0 (0.0%) |
| 18 to 34 Years | 28 (11.6%) | 25 (12.2%) |
| 35 to 64 Years | 9 (3.5%) | 36 (9.3%) |
| 65 to 74 Years | 3 (3.2%) | 6 (4.5%) |
| 75 Years and over | 7 (21.9%) | 6 (10.9%) |
Disability Class: Ambulatory Difficulty
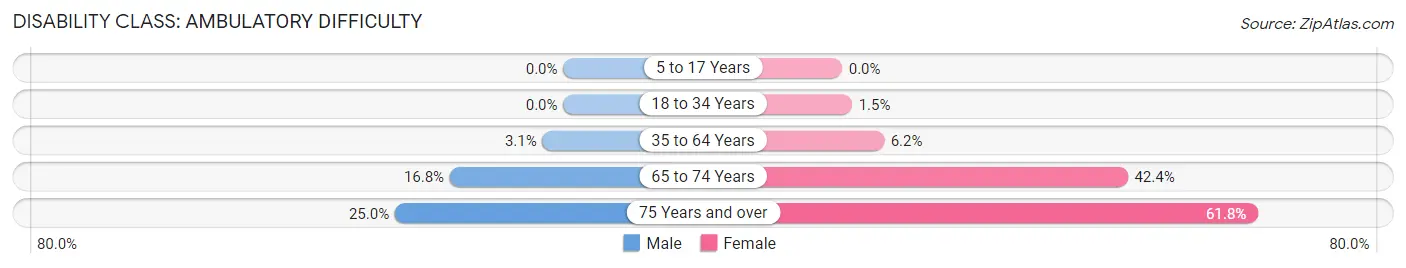
| Age Bracket | Male | Female |
| 5 to 17 Years | 0 (0.0%) | 0 (0.0%) |
| 18 to 34 Years | 0 (0.0%) | 3 (1.5%) |
| 35 to 64 Years | 8 (3.1%) | 24 (6.2%) |
| 65 to 74 Years | 16 (16.8%) | 56 (42.4%) |
| 75 Years and over | 8 (25.0%) | 34 (61.8%) |
Disability Class: Self-Care Difficulty
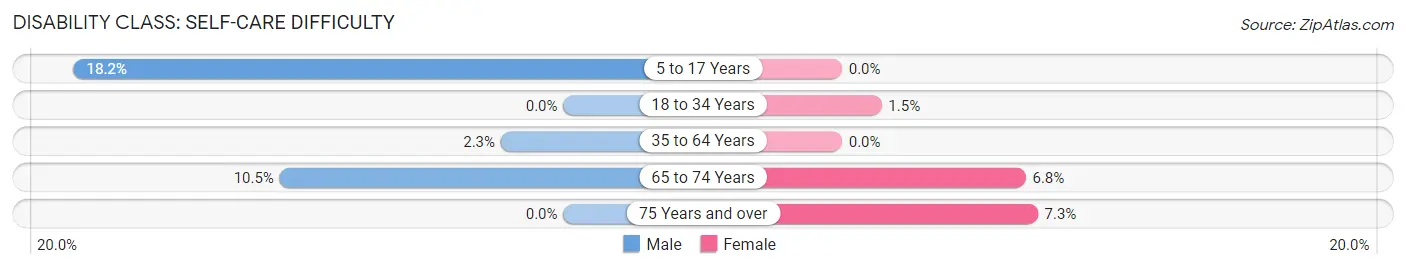
| Age Bracket | Male | Female |
| 5 to 17 Years | 34 (18.2%) | 0 (0.0%) |
| 18 to 34 Years | 0 (0.0%) | 3 (1.5%) |
| 35 to 64 Years | 6 (2.3%) | 0 (0.0%) |
| 65 to 74 Years | 10 (10.5%) | 9 (6.8%) |
| 75 Years and over | 0 (0.0%) | 4 (7.3%) |
Technology Access in Mount Sterling
Computing Device Access in Mount Sterling
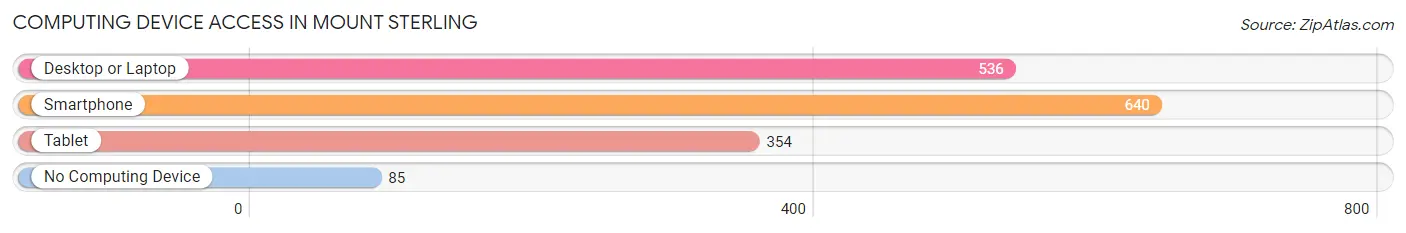
| Device Type | # Households | % Households |
| Desktop or Laptop | 536 | 69.7% |
| Smartphone | 640 | 83.2% |
| Tablet | 354 | 46.0% |
| No Computing Device | 85 | 11.1% |
| Total | 769 | 100.0% |
Internet Access in Mount Sterling
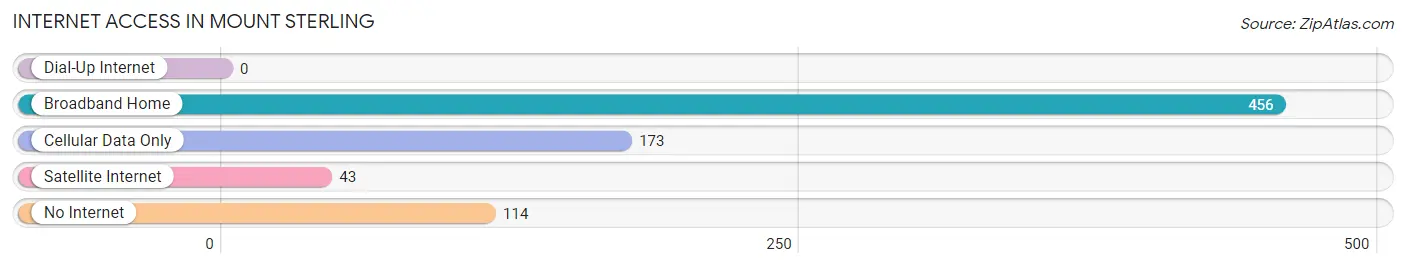
| Internet Type | # Households | % Households |
| Dial-Up Internet | 0 | 0.0% |
| Broadband Home | 456 | 59.3% |
| Cellular Data Only | 173 | 22.5% |
| Satellite Internet | 43 | 5.6% |
| No Internet | 114 | 14.8% |
| Total | 769 | 100.0% |
Mount Sterling Summary
History
Mount Sterling is a small village located in Madison County, Ohio. It was founded in 1817 by a group of settlers from Pennsylvania and Virginia. The village was named after the nearby Mount Sterling, which was a prominent landmark in the area. The village was originally a farming community, but it soon developed into a small industrial center. The first industry in the village was a sawmill, which was built in 1820. This was followed by a gristmill, a tannery, and a woolen mill.
In 1845, the village was incorporated as a village. The village grew slowly over the next few decades, but it was not until the late 19th century that it began to experience significant growth. This was due to the construction of the Columbus and Toledo Railroad, which connected the village to the larger cities of Columbus and Toledo. This allowed for the transportation of goods and people to and from the village, which helped to spur economic growth.
By the early 20th century, Mount Sterling had become a thriving industrial center. It was home to several factories, including a shoe factory, a furniture factory, and a canning factory. The village also had several stores, banks, and churches.
Geography
Mount Sterling is located in Madison County, Ohio. It is situated in the southwestern part of the county, about 25 miles east of Columbus. The village is located on the banks of the Scioto River, which flows through the area. The village is surrounded by rolling hills and farmland.
The climate in Mount Sterling is generally mild, with hot summers and cold winters. The average temperature in the summer is around 75 degrees Fahrenheit, while the average temperature in the winter is around 35 degrees Fahrenheit.
Economy
The economy of Mount Sterling is largely based on agriculture and manufacturing. The village is home to several factories, including a shoe factory, a furniture factory, and a canning factory. The village also has several stores, banks, and churches.
The village is also home to several small businesses, including restaurants, bars, and shops. The village is also home to a number of tourist attractions, including the Mount Sterling Historical Society Museum and the Mount Sterling Opera House.
Demographics
As of the 2010 census, the population of Mount Sterling was 2,845. The racial makeup of the village was 97.3% White, 0.7% African American, 0.2% Native American, 0.3% Asian, and 1.5% from other races. The median household income in the village was $41,250, and the median family income was $50,000.
The village is home to a number of churches, including the Mount Sterling United Methodist Church, the Mount Sterling Presbyterian Church, and the Mount Sterling Baptist Church. The village is also home to a number of schools, including the Mount Sterling Elementary School, the Mount Sterling Middle School, and the Mount Sterling High School.
Common Questions
What is Per Capita Income in Mount Sterling?
Per Capita income in Mount Sterling is $26,741.
What is the Median Family Income in Mount Sterling?
Median Family Income in Mount Sterling is $68,182.
What is the Median Household income in Mount Sterling?
Median Household Income in Mount Sterling is $59,514.
What is Income or Wage Gap in Mount Sterling?
Income or Wage Gap in Mount Sterling is 27.1%.
Women in Mount Sterling earn 72.9 cents for every dollar earned by a man.
What is Inequality or Gini Index in Mount Sterling?
Inequality or Gini Index in Mount Sterling is 0.35.
What is the Total Population of Mount Sterling?
Total Population of Mount Sterling is 1,890.
What is the Total Male Population of Mount Sterling?
Total Male Population of Mount Sterling is 887.
What is the Total Female Population of Mount Sterling?
Total Female Population of Mount Sterling is 1,003.
What is the Ratio of Males per 100 Females in Mount Sterling?
There are 88.43 Males per 100 Females in Mount Sterling.
What is the Ratio of Females per 100 Males in Mount Sterling?
There are 113.08 Females per 100 Males in Mount Sterling.
What is the Median Population Age in Mount Sterling?
Median Population Age in Mount Sterling is 35.5 Years.
What is the Average Family Size in Mount Sterling
Average Family Size in Mount Sterling is 3.0 People.
What is the Average Household Size in Mount Sterling
Average Household Size in Mount Sterling is 2.4 People.
How Large is the Labor Force in Mount Sterling?
There are 887 People in the Labor Forcein in Mount Sterling.
What is the Percentage of People in the Labor Force in Mount Sterling?
60.8% of People are in the Labor Force in Mount Sterling.
What is the Unemployment Rate in Mount Sterling?
Unemployment Rate in Mount Sterling is 7.8%.