Mount Orab, OH Map & Demographics
Mount Orab Map
Mount Orab Overview
$27,041
PER CAPITA INCOME
$84,105
AVG FAMILY INCOME
$62,833
AVG HOUSEHOLD INCOME
41.2%
WAGE / INCOME GAP [ % ]
58.8¢/ $1
WAGE / INCOME GAP [ $ ]
0.42
INEQUALITY / GINI INDEX
4,544
TOTAL POPULATION
2,265
MALE POPULATION
2,279
FEMALE POPULATION
99.39
MALES / 100 FEMALES
100.62
FEMALES / 100 MALES
30.4
MEDIAN AGE
3.2
AVG FAMILY SIZE
2.6
AVG HOUSEHOLD SIZE
2,038
LABOR FORCE [ PEOPLE ]
64.6%
PERCENT IN LABOR FORCE
7.0%
UNEMPLOYMENT RATE
Mount Orab Zip Codes
Mount Orab Area Codes
Income in Mount Orab
Income Overview in Mount Orab
Per Capita Income in Mount Orab is $27,041, while median incomes of families and households are $84,105 and $62,833 respectively.
| Characteristic | Number | Measure |
| Per Capita Income | 4,544 | $27,041 |
| Median Family Income | 1,092 | $84,105 |
| Mean Family Income | 1,092 | $82,089 |
| Median Household Income | 1,744 | $62,833 |
| Mean Household Income | 1,744 | $71,022 |
| Income Deficit | 1,092 | $0 |
| Wage / Income Gap (%) | 4,544 | 41.22% |
| Wage / Income Gap ($) | 4,544 | 58.78¢ per $1 |
| Gini / Inequality Index | 4,544 | 0.42 |
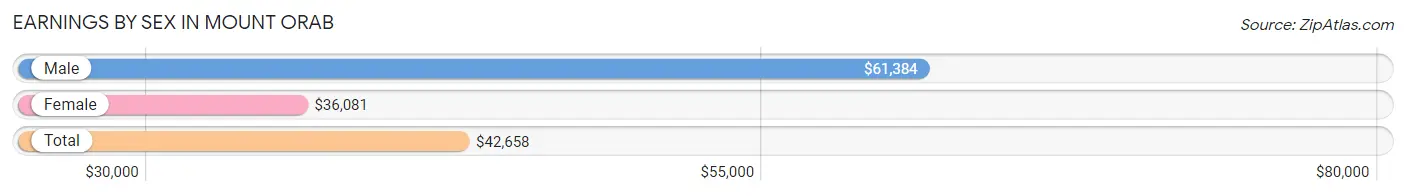
Earnings by Sex in Mount Orab
Average Earnings in Mount Orab are $42,658, $61,384 for men and $36,081 for women, a difference of 41.2%.
| Sex | Number | Average Earnings |
| Male | 960 (47.5%) | $61,384 |
| Female | 1,061 (52.5%) | $36,081 |
| Total | 2,021 (100.0%) | $42,658 |
Earnings by Sex by Income Bracket in Mount Orab
The most common earnings brackets in Mount Orab are $75,000 to $99,999 for men (280 | 29.2%) and $40,000 to $44,999 for women (196 | 18.5%).
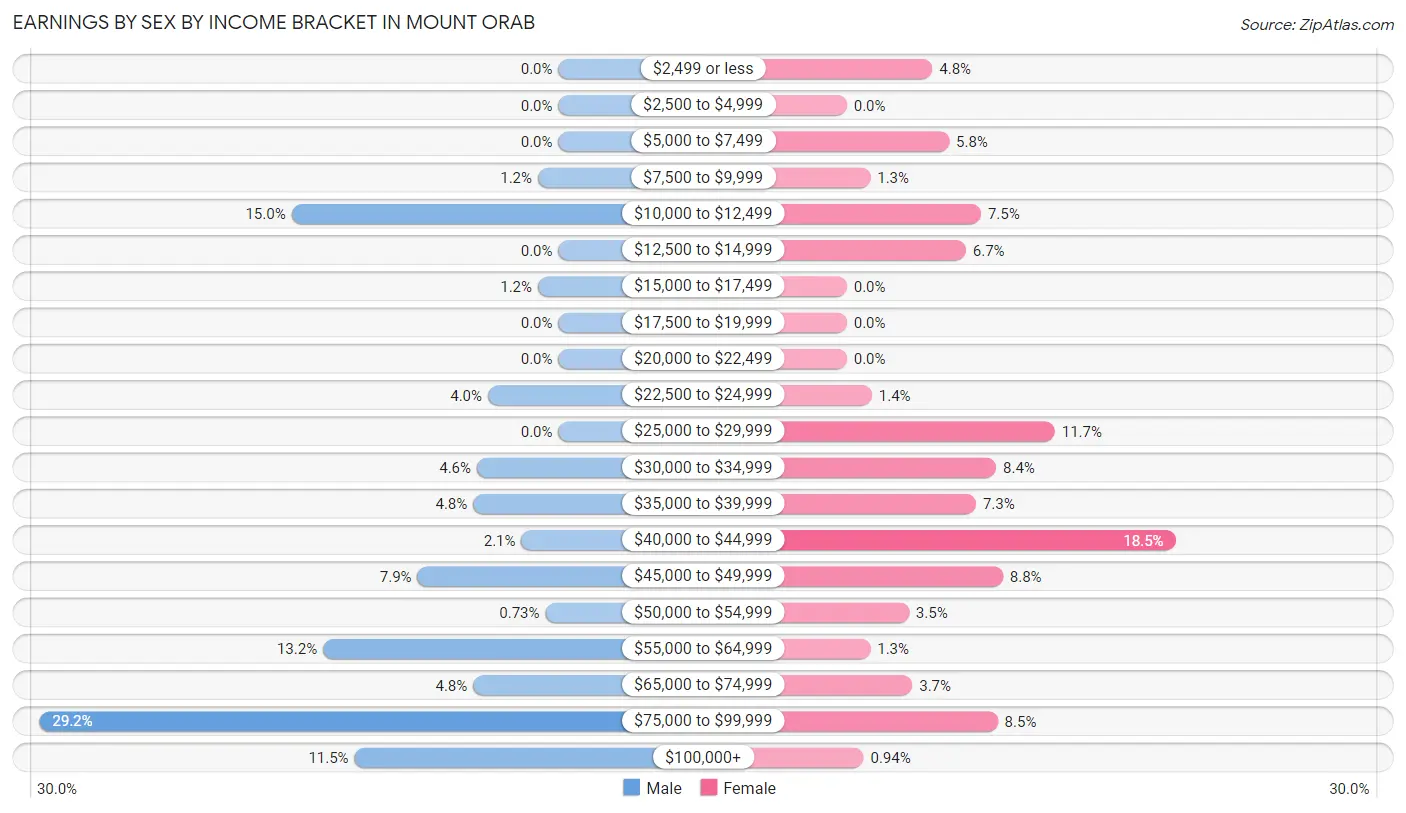
| Income | Male | Female |
| $2,499 or less | 0 (0.0%) | 51 (4.8%) |
| $2,500 to $4,999 | 0 (0.0%) | 0 (0.0%) |
| $5,000 to $7,499 | 0 (0.0%) | 61 (5.8%) |
| $7,500 to $9,999 | 11 (1.1%) | 14 (1.3%) |
| $10,000 to $12,499 | 144 (15.0%) | 80 (7.5%) |
| $12,500 to $14,999 | 0 (0.0%) | 71 (6.7%) |
| $15,000 to $17,499 | 11 (1.1%) | 0 (0.0%) |
| $17,500 to $19,999 | 0 (0.0%) | 0 (0.0%) |
| $20,000 to $22,499 | 0 (0.0%) | 0 (0.0%) |
| $22,500 to $24,999 | 38 (4.0%) | 15 (1.4%) |
| $25,000 to $29,999 | 0 (0.0%) | 124 (11.7%) |
| $30,000 to $34,999 | 44 (4.6%) | 89 (8.4%) |
| $35,000 to $39,999 | 46 (4.8%) | 77 (7.3%) |
| $40,000 to $44,999 | 20 (2.1%) | 196 (18.5%) |
| $45,000 to $49,999 | 76 (7.9%) | 93 (8.8%) |
| $50,000 to $54,999 | 7 (0.7%) | 37 (3.5%) |
| $55,000 to $64,999 | 127 (13.2%) | 14 (1.3%) |
| $65,000 to $74,999 | 46 (4.8%) | 39 (3.7%) |
| $75,000 to $99,999 | 280 (29.2%) | 90 (8.5%) |
| $100,000+ | 110 (11.5%) | 10 (0.9%) |
| Total | 960 (100.0%) | 1,061 (100.0%) |
Earnings by Sex by Educational Attainment in Mount Orab
Average earnings in Mount Orab are $61,585 for men and $39,653 for women, a difference of 35.6%. Men with an educational attainment of graduate degree enjoy the highest average annual earnings of $90,133, while those with college or associate's degree education earn the least with $55,270. Women with an educational attainment of graduate degree earn the most with the average annual earnings of $85,234, while those with less than high school education have the smallest earnings of $29,939.
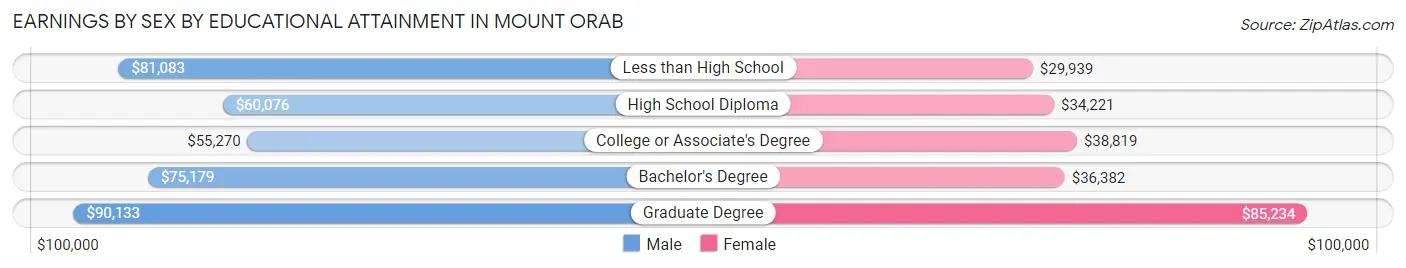
| Educational Attainment | Male Income | Female Income |
| Less than High School | $81,083 | $29,939 |
| High School Diploma | $60,076 | $34,221 |
| College or Associate's Degree | $55,270 | $38,819 |
| Bachelor's Degree | $75,179 | $36,382 |
| Graduate Degree | $90,133 | $85,234 |
| Total | $61,585 | $39,653 |
Family Income in Mount Orab
Family Income Brackets in Mount Orab
According to the Mount Orab family income data, there are 296 families falling into the $100,000 to $149,999 income range, which is the most common income bracket and makes up 27.1% of all families. Conversely, the $15,000 to $24,999 income bracket is the least frequent group with only 38 families (3.5%) belonging to this category.
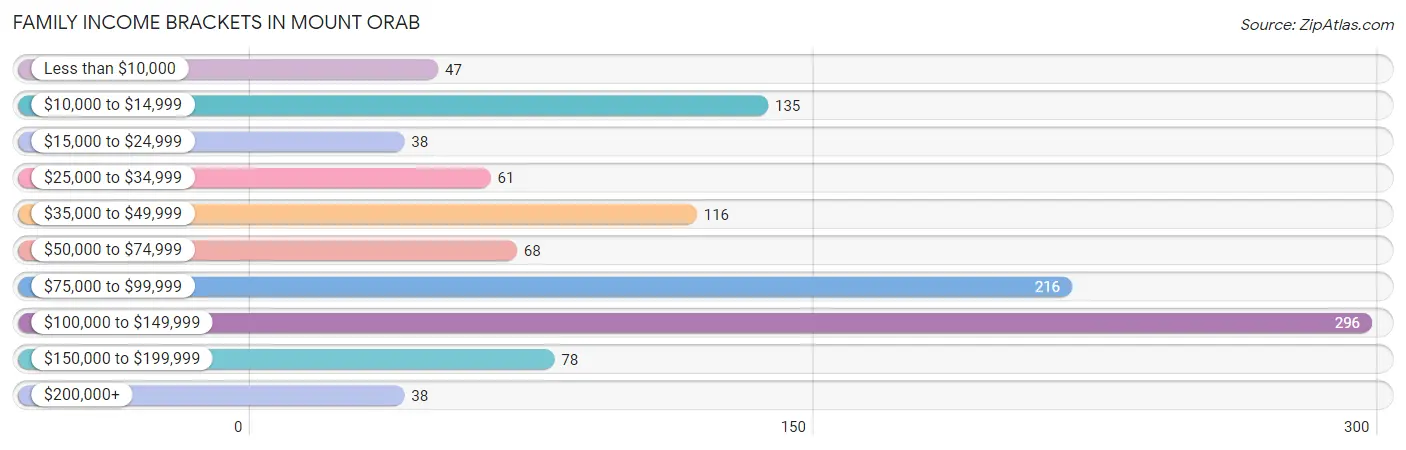
| Income Bracket | # Families | % Families |
| Less than $10,000 | 47 | 4.3% |
| $10,000 to $14,999 | 135 | 12.4% |
| $15,000 to $24,999 | 38 | 3.5% |
| $25,000 to $34,999 | 61 | 5.6% |
| $35,000 to $49,999 | 116 | 10.6% |
| $50,000 to $74,999 | 68 | 6.2% |
| $75,000 to $99,999 | 216 | 19.8% |
| $100,000 to $149,999 | 296 | 27.1% |
| $150,000 to $199,999 | 78 | 7.1% |
| $200,000+ | 38 | 3.5% |
Family Income by Famaliy Size in Mount Orab
3-person families (203 | 18.6%) account for the highest median family income in Mount Orab with $117,530 per family, while 2-person families (530 | 48.5%) have the highest median income of $41,342 per family member.
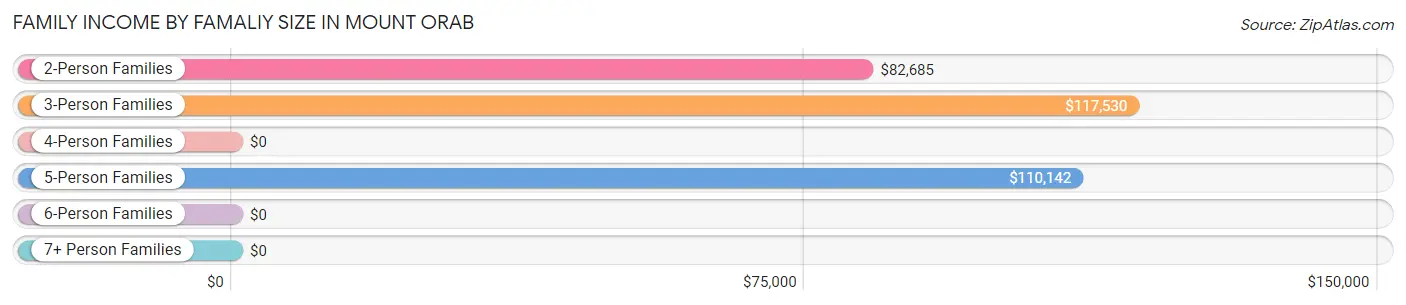
| Income Bracket | # Families | Median Income |
| 2-Person Families | 530 (48.5%) | $82,685 |
| 3-Person Families | 203 (18.6%) | $117,530 |
| 4-Person Families | 141 (12.9%) | $0 |
| 5-Person Families | 159 (14.6%) | $110,142 |
| 6-Person Families | 36 (3.3%) | $0 |
| 7+ Person Families | 23 (2.1%) | $0 |
| Total | 1,092 (100.0%) | $84,105 |
Family Income by Number of Earners in Mount Orab
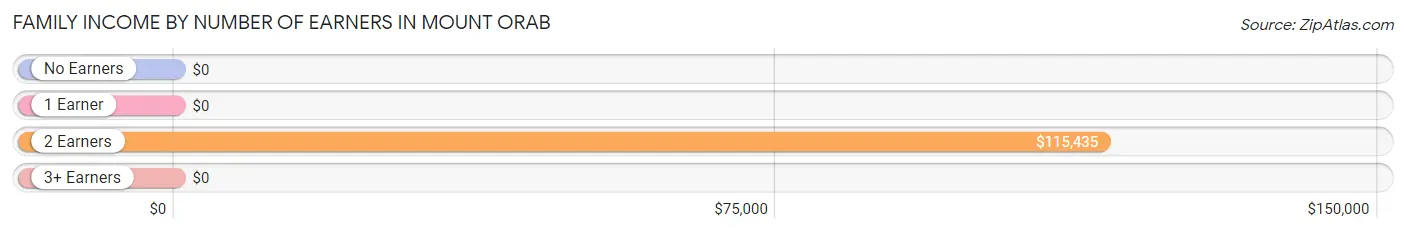
| Number of Earners | # Families | Median Income |
| No Earners | 148 (13.6%) | $0 |
| 1 Earner | 378 (34.6%) | $0 |
| 2 Earners | 550 (50.4%) | $115,435 |
| 3+ Earners | 16 (1.5%) | $0 |
| Total | 1,092 (100.0%) | $84,105 |
Household Income in Mount Orab
Household Income Brackets in Mount Orab
With 368 households falling in the category, the $100,000 to $149,999 income range is the most frequent in Mount Orab, accounting for 21.1% of all households. In contrast, only 37 households (2.1%) fall into the less than $10,000 income bracket, making it the least populous group.
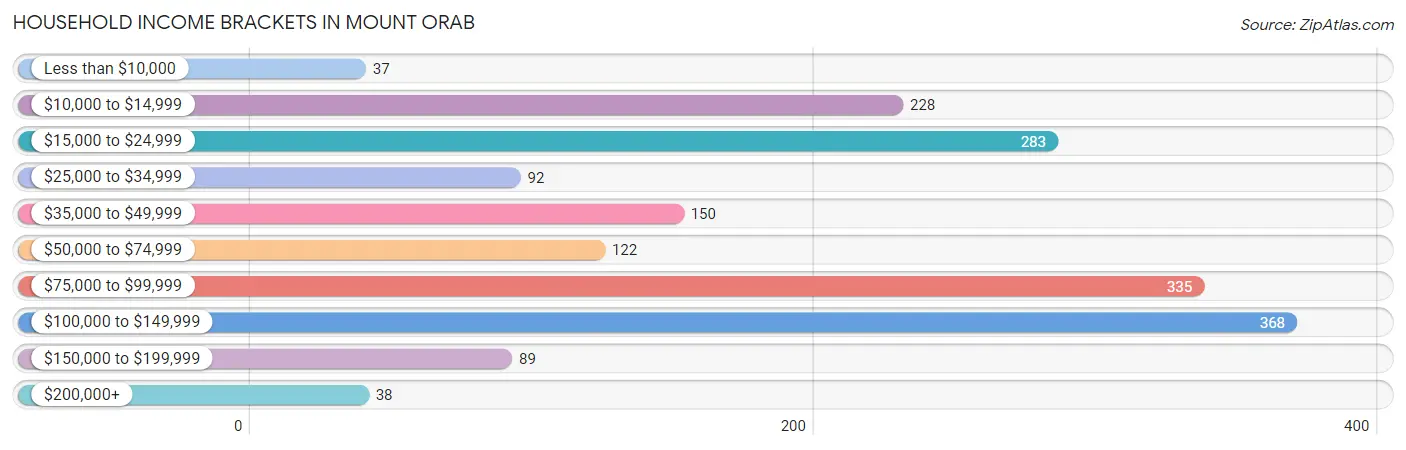
| Income Bracket | # Households | % Households |
| Less than $10,000 | 37 | 2.1% |
| $10,000 to $14,999 | 228 | 13.1% |
| $15,000 to $24,999 | 283 | 16.2% |
| $25,000 to $34,999 | 92 | 5.3% |
| $35,000 to $49,999 | 150 | 8.6% |
| $50,000 to $74,999 | 122 | 7.0% |
| $75,000 to $99,999 | 335 | 19.2% |
| $100,000 to $149,999 | 368 | 21.1% |
| $150,000 to $199,999 | 89 | 5.1% |
| $200,000+ | 38 | 2.2% |
Household Income by Householder Age in Mount Orab
The median household income in Mount Orab is $62,833, with the highest median household income of $83,723 found in the 45 to 64 years age bracket for the primary householder. A total of 750 households (43.0%) fall into this category. Meanwhile, the 15 to 24 years age bracket for the primary householder has the lowest median household income of $0, with 40 households (2.3%) in this group.
| Income Bracket | # Households | Median Income |
| 15 to 24 Years | 40 (2.3%) | $0 |
| 25 to 44 Years | 613 (35.1%) | $52,458 |
| 45 to 64 Years | 750 (43.0%) | $83,723 |
| 65+ Years | 341 (19.6%) | $0 |
| Total | 1,744 (100.0%) | $62,833 |
Poverty in Mount Orab
Income Below Poverty by Sex and Age in Mount Orab
With 28.0% poverty level for males and 23.7% for females among the residents of Mount Orab, 12 to 14 year old males and 15 year old females are the most vulnerable to poverty, with 133 males (86.4%) and 61 females (79.2%) in their respective age groups living below the poverty level.
| Age Bracket | Male | Female |
| Under 5 Years | 45 (14.5%) | 43 (18.6%) |
| 5 Years | 0 (0.0%) | 0 (0.0%) |
| 6 to 11 Years | 147 (41.9%) | 19 (10.7%) |
| 12 to 14 Years | 133 (86.4%) | 0 (0.0%) |
| 15 Years | 0 (0.0%) | 61 (79.2%) |
| 16 and 17 Years | 66 (57.9%) | 0 (0.0%) |
| 18 to 24 Years | 29 (24.6%) | 38 (46.9%) |
| 25 to 34 Years | 160 (44.6%) | 98 (21.7%) |
| 35 to 44 Years | 8 (5.4%) | 85 (26.2%) |
| 45 to 54 Years | 6 (2.2%) | 121 (40.5%) |
| 55 to 64 Years | 40 (14.2%) | 30 (12.5%) |
| 65 to 74 Years | 0 (0.0%) | 46 (30.5%) |
| 75 Years and over | 0 (0.0%) | 0 (0.0%) |
| Total | 634 (28.0%) | 541 (23.7%) |
Income Above Poverty by Sex and Age in Mount Orab
According to the poverty statistics in Mount Orab, males aged 5 years and females aged 5 years are the age groups that are most secure financially, with 100.0% of males and 100.0% of females in these age groups living above the poverty line.
| Age Bracket | Male | Female |
| Under 5 Years | 265 (85.5%) | 188 (81.4%) |
| 5 Years | 50 (100.0%) | 38 (100.0%) |
| 6 to 11 Years | 204 (58.1%) | 159 (89.3%) |
| 12 to 14 Years | 21 (13.6%) | 0 (0.0%) |
| 15 Years | 0 (0.0%) | 16 (20.8%) |
| 16 and 17 Years | 48 (42.1%) | 18 (100.0%) |
| 18 to 24 Years | 89 (75.4%) | 43 (53.1%) |
| 25 to 34 Years | 199 (55.4%) | 354 (78.3%) |
| 35 to 44 Years | 140 (94.6%) | 239 (73.8%) |
| 45 to 54 Years | 268 (97.8%) | 178 (59.5%) |
| 55 to 64 Years | 242 (85.8%) | 210 (87.5%) |
| 65 to 74 Years | 52 (100.0%) | 105 (69.5%) |
| 75 Years and over | 53 (100.0%) | 190 (100.0%) |
| Total | 1,631 (72.0%) | 1,738 (76.3%) |
Income Below Poverty Among Married-Couple Families in Mount Orab
The poverty statistics for married-couple families in Mount Orab show that 9.6% or 69 of the total 719 families live below the poverty line. Families with 3 or 4 children have the highest poverty rate of 31.3%, comprising of 61 families. On the other hand, families with 1 or 2 children have the lowest poverty rate of 0.0%, which includes 0 families.
| Children | Above Poverty | Below Poverty |
| No Children | 290 (97.3%) | 8 (2.7%) |
| 1 or 2 Children | 203 (100.0%) | 0 (0.0%) |
| 3 or 4 Children | 134 (68.7%) | 61 (31.3%) |
| 5 or more Children | 23 (100.0%) | 0 (0.0%) |
| Total | 650 (90.4%) | 69 (9.6%) |
Income Below Poverty Among Single-Parent Households in Mount Orab
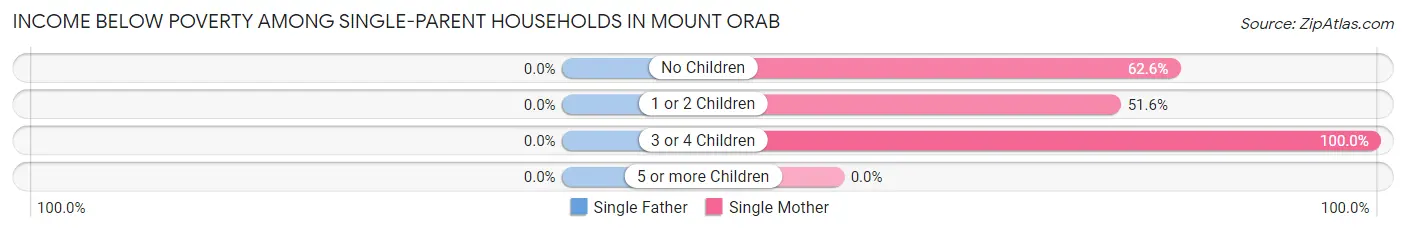
| Children | Single Father | Single Mother |
| No Children | 0 (0.0%) | 114 (62.6%) |
| 1 or 2 Children | 0 (0.0%) | 48 (51.6%) |
| 3 or 4 Children | 0 (0.0%) | 50 (100.0%) |
| 5 or more Children | 0 (0.0%) | 0 (0.0%) |
| Total | 0 (0.0%) | 212 (65.2%) |
Income Below Poverty Among Married-Couple vs Single-Parent Households in Mount Orab
The poverty data for Mount Orab shows that 69 of the married-couple family households (9.6%) and 212 of the single-parent households (56.8%) are living below the poverty level. Within the married-couple family households, those with 3 or 4 children have the highest poverty rate, with 61 households (31.3%) falling below the poverty line. Among the single-parent households, those with 3 or 4 children have the highest poverty rate, with 50 household (100.0%) living below poverty.
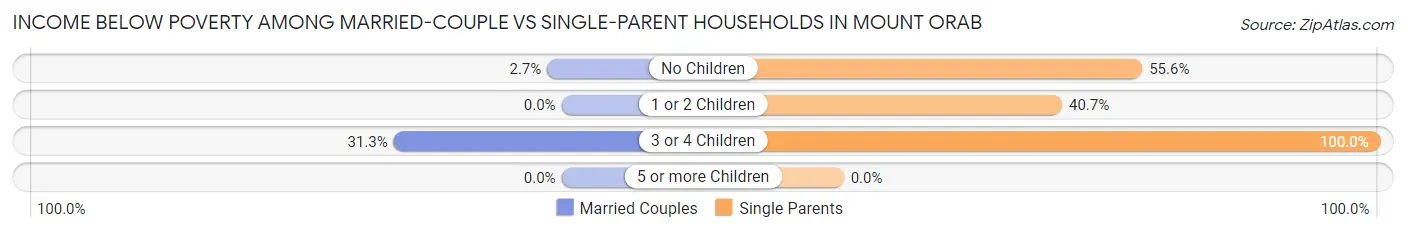
| Children | Married-Couple Families | Single-Parent Households |
| No Children | 8 (2.7%) | 114 (55.6%) |
| 1 or 2 Children | 0 (0.0%) | 48 (40.7%) |
| 3 or 4 Children | 61 (31.3%) | 50 (100.0%) |
| 5 or more Children | 0 (0.0%) | 0 (0.0%) |
| Total | 69 (9.6%) | 212 (56.8%) |
Race in Mount Orab
The most populous races in Mount Orab are White / Caucasian (4,442 | 97.8%), Black / African American (64 | 1.4%), and Two or more Races (38 | 0.8%).
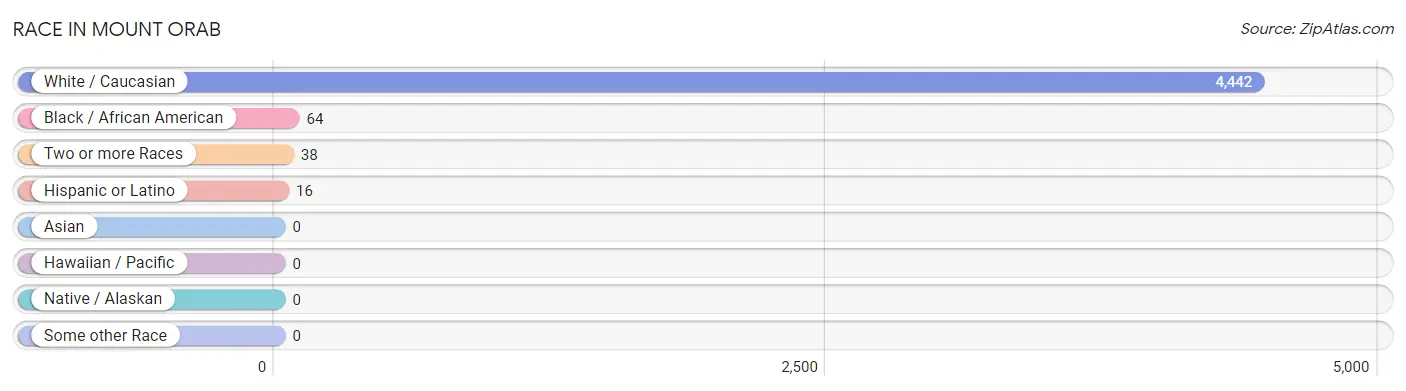
| Race | # Population | % Population |
| Asian | 0 | 0.0% |
| Black / African American | 64 | 1.4% |
| Hawaiian / Pacific | 0 | 0.0% |
| Hispanic or Latino | 16 | 0.4% |
| Native / Alaskan | 0 | 0.0% |
| White / Caucasian | 4,442 | 97.8% |
| Two or more Races | 38 | 0.8% |
| Some other Race | 0 | 0.0% |
| Total | 4,544 | 100.0% |
Ancestry in Mount Orab
The most populous ancestries reported in Mount Orab are English (576 | 12.7%), Irish (508 | 11.2%), German (484 | 10.6%), American (192 | 4.2%), and French (163 | 3.6%), together accounting for 42.3% of all Mount Orab residents.
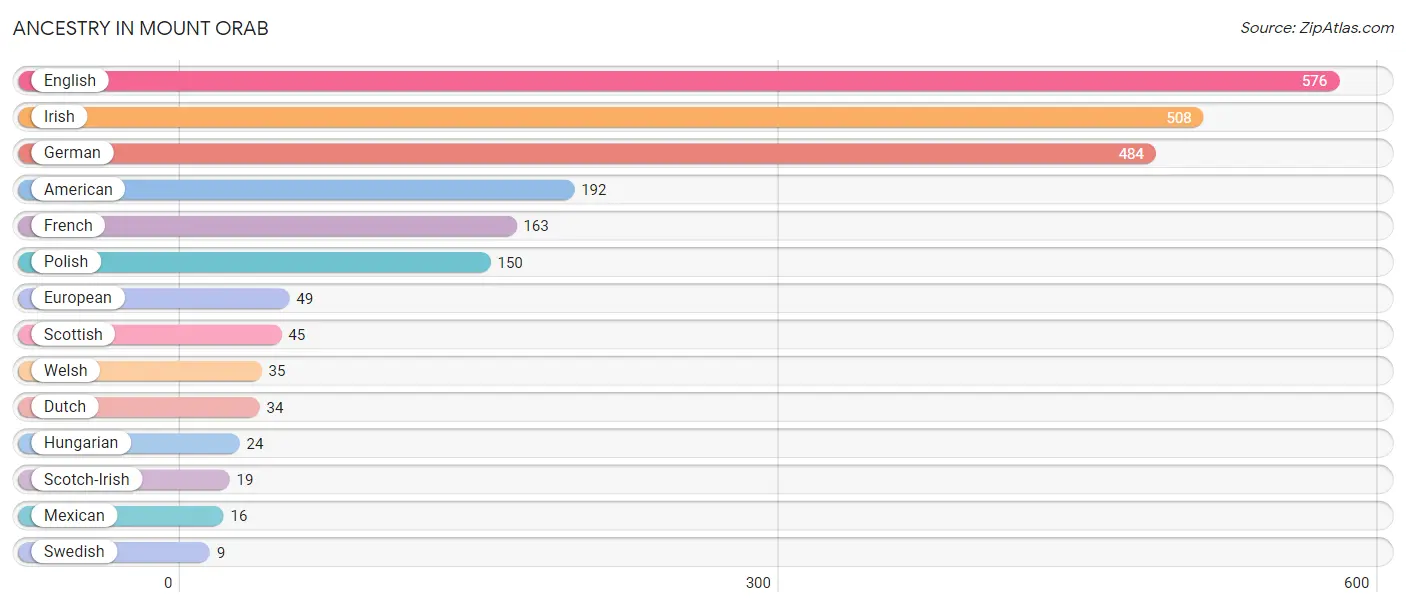
| Ancestry | # Population | % Population |
| American | 192 | 4.2% |
| Dutch | 34 | 0.7% |
| English | 576 | 12.7% |
| European | 49 | 1.1% |
| French | 163 | 3.6% |
| German | 484 | 10.6% |
| Hungarian | 24 | 0.5% |
| Irish | 508 | 11.2% |
| Mexican | 16 | 0.4% |
| Polish | 150 | 3.3% |
| Scotch-Irish | 19 | 0.4% |
| Scottish | 45 | 1.0% |
| Swedish | 9 | 0.2% |
| Welsh | 35 | 0.8% | View All 14 Rows |
Immigrants in Mount Orab

| Immigration Origin | # Population | % Population | View All 0 Rows |
Sex and Age in Mount Orab
Sex and Age in Mount Orab
The most populous age groups in Mount Orab are Under 5 Years (310 | 13.7%) for men and 25 to 29 Years (314 | 13.8%) for women.
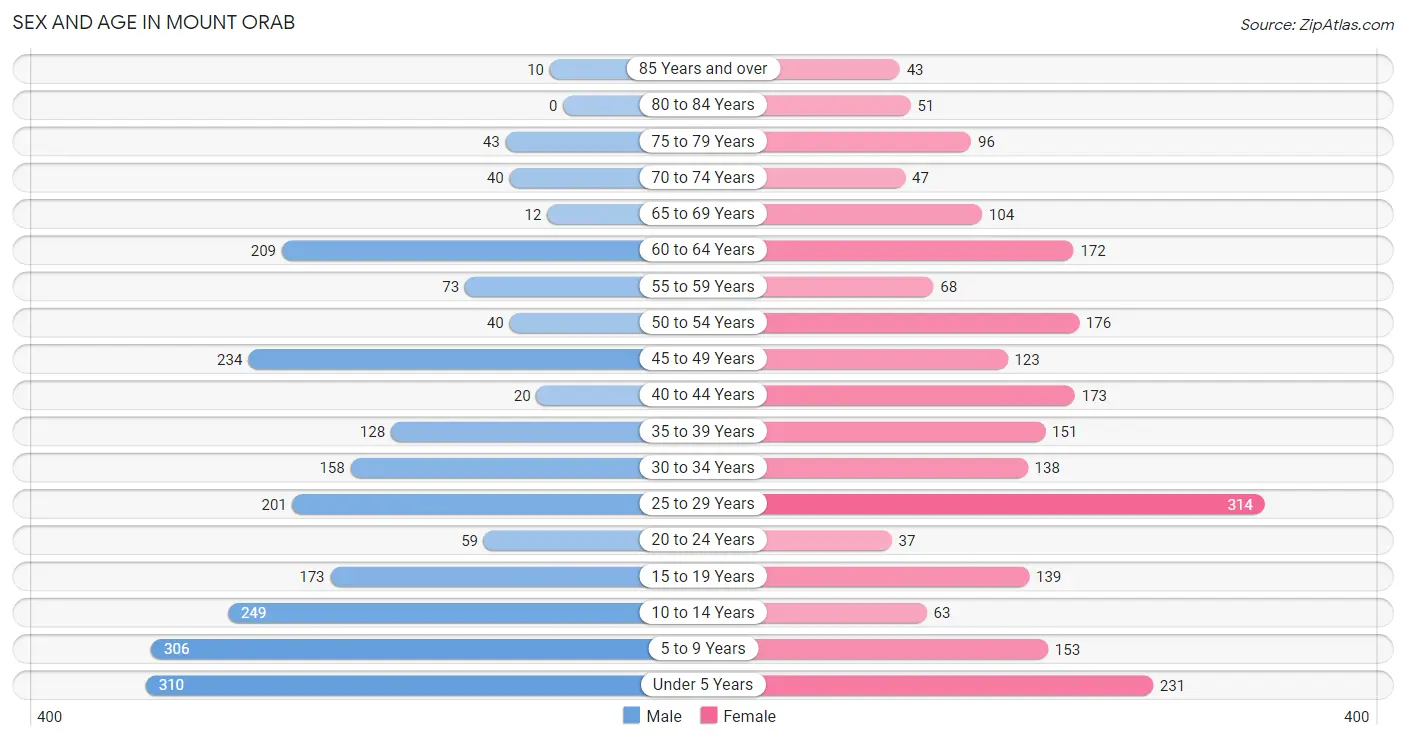
| Age Bracket | Male | Female |
| Under 5 Years | 310 (13.7%) | 231 (10.1%) |
| 5 to 9 Years | 306 (13.5%) | 153 (6.7%) |
| 10 to 14 Years | 249 (11.0%) | 63 (2.8%) |
| 15 to 19 Years | 173 (7.6%) | 139 (6.1%) |
| 20 to 24 Years | 59 (2.6%) | 37 (1.6%) |
| 25 to 29 Years | 201 (8.9%) | 314 (13.8%) |
| 30 to 34 Years | 158 (7.0%) | 138 (6.1%) |
| 35 to 39 Years | 128 (5.7%) | 151 (6.6%) |
| 40 to 44 Years | 20 (0.9%) | 173 (7.6%) |
| 45 to 49 Years | 234 (10.3%) | 123 (5.4%) |
| 50 to 54 Years | 40 (1.8%) | 176 (7.7%) |
| 55 to 59 Years | 73 (3.2%) | 68 (3.0%) |
| 60 to 64 Years | 209 (9.2%) | 172 (7.5%) |
| 65 to 69 Years | 12 (0.5%) | 104 (4.6%) |
| 70 to 74 Years | 40 (1.8%) | 47 (2.1%) |
| 75 to 79 Years | 43 (1.9%) | 96 (4.2%) |
| 80 to 84 Years | 0 (0.0%) | 51 (2.2%) |
| 85 Years and over | 10 (0.4%) | 43 (1.9%) |
| Total | 2,265 (100.0%) | 2,279 (100.0%) |
Families and Households in Mount Orab
Median Family Size in Mount Orab
The median family size in Mount Orab is 3.25 persons per family, with married-couple families (719 | 65.8%) accounting for the largest median family size of 3.69 persons per family. On the other hand, single male/father families (48 | 4.4%) represent the smallest median family size with 2.13 persons per family.
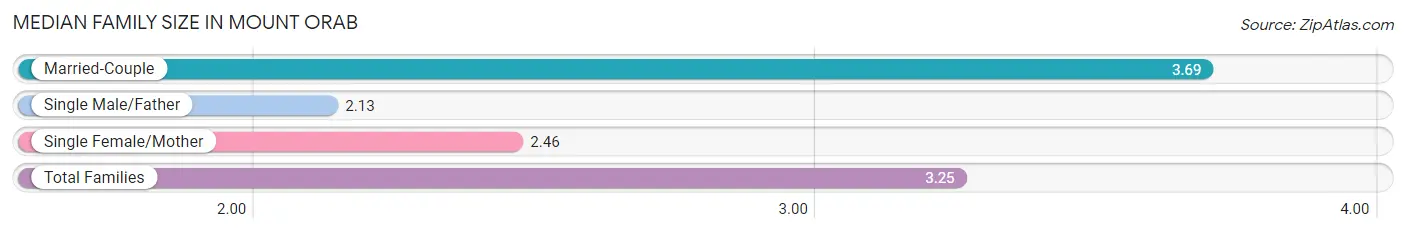
| Family Type | # Families | Family Size |
| Married-Couple | 719 (65.8%) | 3.69 |
| Single Male/Father | 48 (4.4%) | 2.13 |
| Single Female/Mother | 325 (29.8%) | 2.46 |
| Total Families | 1,092 (100.0%) | 3.25 |
Median Household Size in Mount Orab
The median household size in Mount Orab is 2.60 persons per household, with married-couple households (719 | 41.2%) accounting for the largest median household size of 3.75 persons per household. non-family households (652 | 37.4%) represent the smallest median household size with 1.15 persons per household.
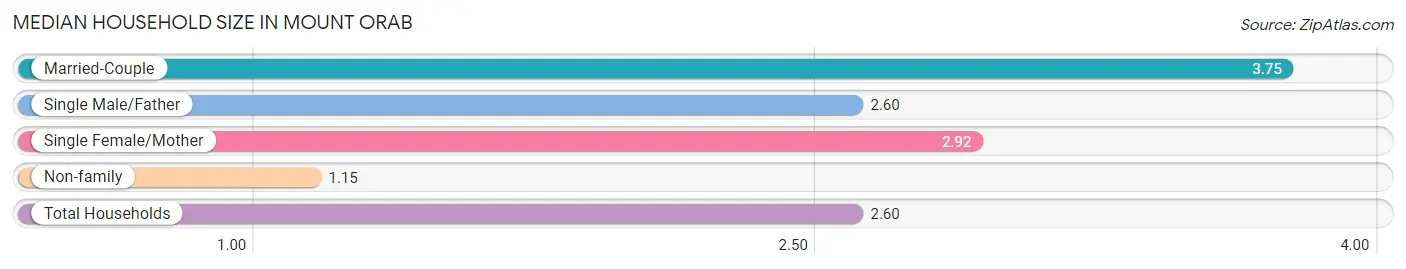
| Household Type | # Households | Household Size |
| Married-Couple | 719 (41.2%) | 3.75 |
| Single Male/Father | 48 (2.8%) | 2.60 |
| Single Female/Mother | 325 (18.6%) | 2.92 |
| Non-family | 652 (37.4%) | 1.15 |
| Total Households | 1,744 (100.0%) | 2.60 |
Household Size by Marriage Status in Mount Orab
Out of a total of 1,744 households in Mount Orab, 1,092 (62.6%) are family households, while 652 (37.4%) are nonfamily households. The most numerous type of family households are 2-person households, comprising 355, and the most common type of nonfamily households are 1-person households, comprising 548.
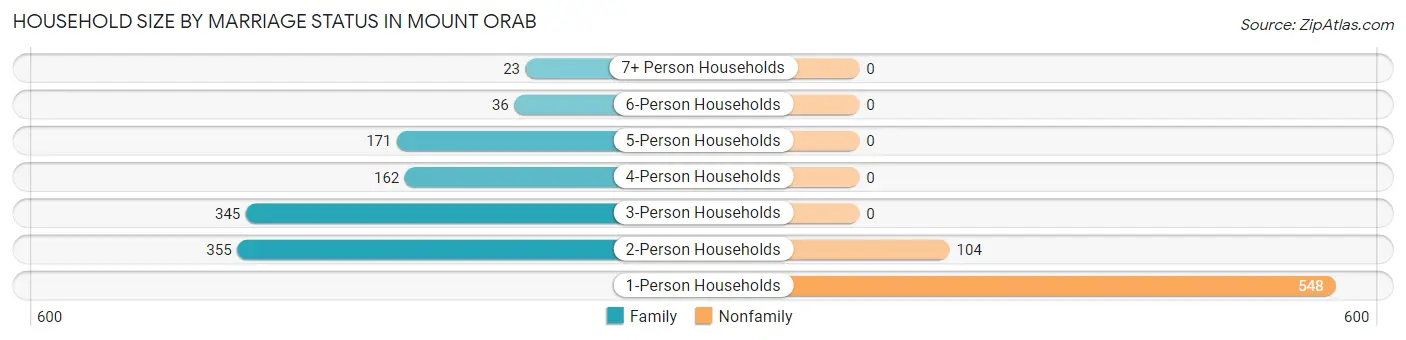
| Household Size | Family Households | Nonfamily Households |
| 1-Person Households | - | 548 (31.4%) |
| 2-Person Households | 355 (20.4%) | 104 (6.0%) |
| 3-Person Households | 345 (19.8%) | 0 (0.0%) |
| 4-Person Households | 162 (9.3%) | 0 (0.0%) |
| 5-Person Households | 171 (9.8%) | 0 (0.0%) |
| 6-Person Households | 36 (2.1%) | 0 (0.0%) |
| 7+ Person Households | 23 (1.3%) | 0 (0.0%) |
| Total | 1,092 (62.6%) | 652 (37.4%) |
Female Fertility in Mount Orab
Fertility by Age in Mount Orab
Average fertility rate in Mount Orab is 96.0 births per 1,000 women. Women in the age bracket of 20 to 34 years have the highest fertility rate with 241.0 births per 1,000 women. Women in the age bracket of 20 to 34 years acount for 100.0% of all women with births.
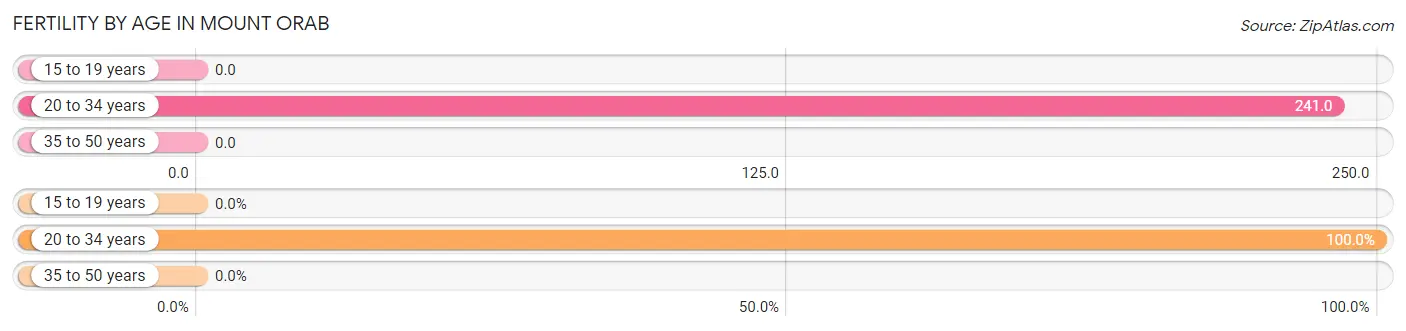
| Age Bracket | Women with Births | Births / 1,000 Women |
| 15 to 19 years | 0 (0.0%) | 0.0 |
| 20 to 34 years | 118 (100.0%) | 241.0 |
| 35 to 50 years | 0 (0.0%) | 0.0 |
| Total | 118 (100.0%) | 96.0 |
Fertility by Age by Marriage Status in Mount Orab
80.5% of women with births (118) in Mount Orab are married. The highest percentage of unmarried women with births falls into 20 to 34 years age bracket with 19.5% of them unmarried at the time of birth, while the lowest percentage of unmarried women with births belong to 20 to 34 years age bracket with 19.5% of them unmarried.
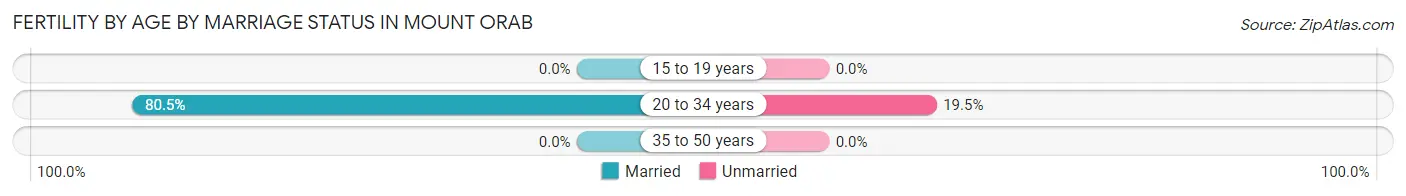
| Age Bracket | Married | Unmarried |
| 15 to 19 years | 0 (0.0%) | 0 (0.0%) |
| 20 to 34 years | 95 (80.5%) | 23 (19.5%) |
| 35 to 50 years | 0 (0.0%) | 0 (0.0%) |
| Total | 95 (80.5%) | 23 (19.5%) |
Fertility by Education in Mount Orab
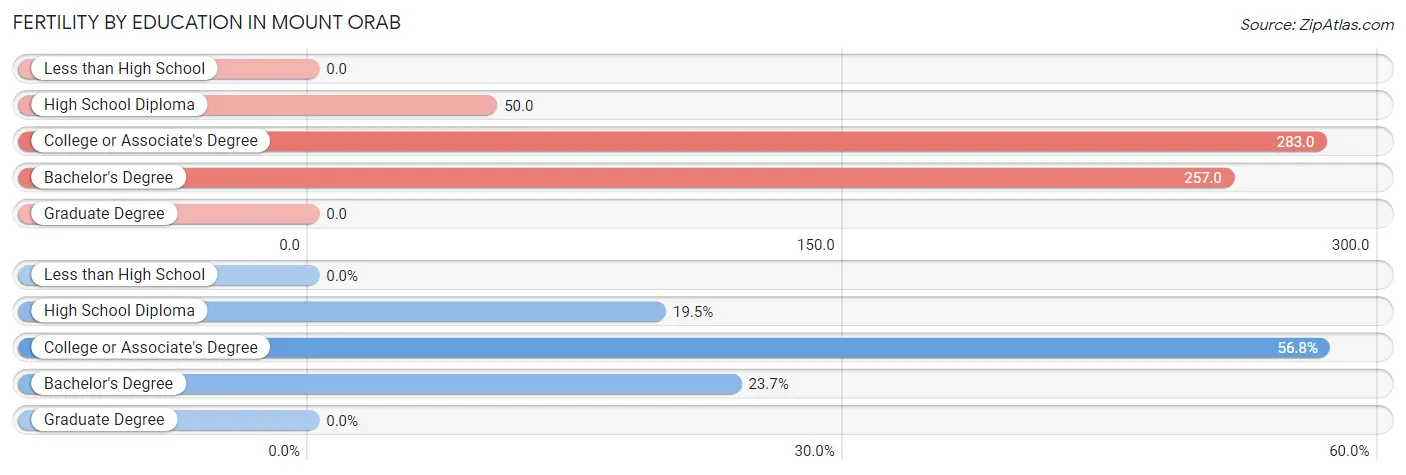
| Educational Attainment | Women with Births | Births / 1,000 Women |
| Less than High School | 0 (0.0%) | 0.0 |
| High School Diploma | 23 (19.5%) | 50.0 |
| College or Associate's Degree | 67 (56.8%) | 283.0 |
| Bachelor's Degree | 28 (23.7%) | 257.0 |
| Graduate Degree | 0 (0.0%) | 0.0 |
| Total | 118 (100.0%) | 96.0 |
Fertility by Education by Marriage Status in Mount Orab
19.5% of women with births in Mount Orab are unmarried. Women with the educational attainment of college or associate's degree are most likely to be married with 100.0% of them married at childbirth, while women with the educational attainment of high school diploma are least likely to be married with 100.0% of them unmarried at childbirth.
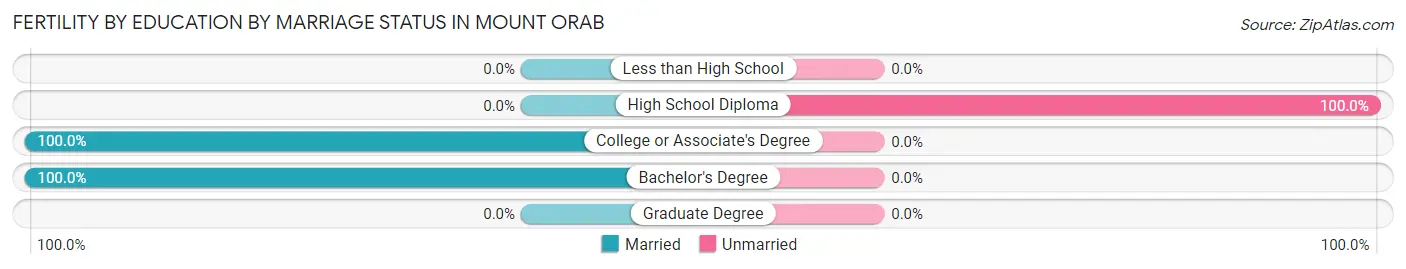
| Educational Attainment | Married | Unmarried |
| Less than High School | 0 (0.0%) | 0 (0.0%) |
| High School Diploma | 0 (0.0%) | 23 (100.0%) |
| College or Associate's Degree | 67 (100.0%) | 0 (0.0%) |
| Bachelor's Degree | 28 (100.0%) | 0 (0.0%) |
| Graduate Degree | 0 (0.0%) | 0 (0.0%) |
| Total | 95 (80.5%) | 23 (19.5%) |
Employment Characteristics in Mount Orab
Employment by Class of Employer in Mount Orab
Among the 1,894 employed individuals in Mount Orab, private company employees (1,352 | 71.4%), local government employees (208 | 11.0%), and state government employees (142 | 7.5%) make up the most common classes of employment.
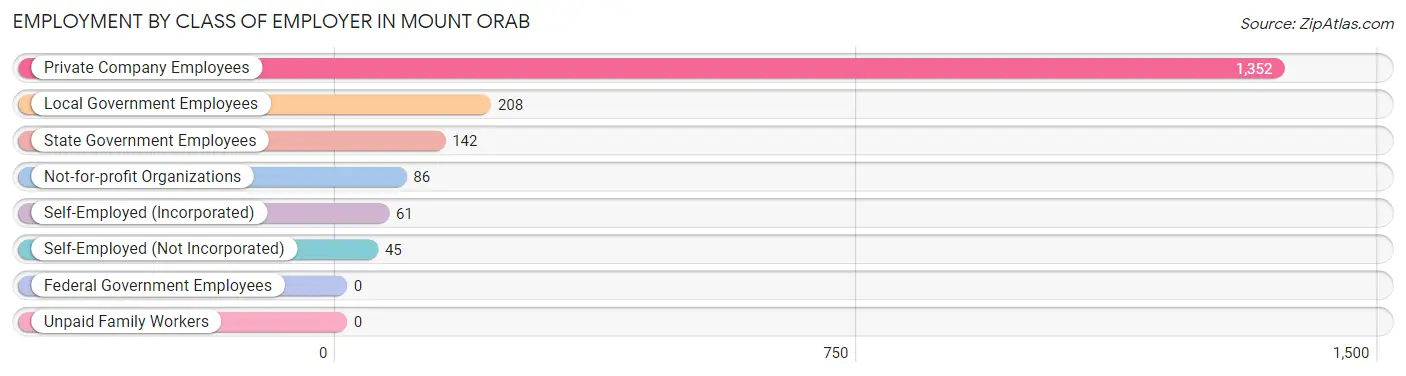
| Employer Class | # Employees | % Employees |
| Private Company Employees | 1,352 | 71.4% |
| Self-Employed (Incorporated) | 61 | 3.2% |
| Self-Employed (Not Incorporated) | 45 | 2.4% |
| Not-for-profit Organizations | 86 | 4.5% |
| Local Government Employees | 208 | 11.0% |
| State Government Employees | 142 | 7.5% |
| Federal Government Employees | 0 | 0.0% |
| Unpaid Family Workers | 0 | 0.0% |
| Total | 1,894 | 100.0% |
Employment Status by Age in Mount Orab
According to the labor force statistics for Mount Orab, out of the total population over 16 years of age (3,155), 64.6% or 2,038 individuals are in the labor force, with 7.0% or 143 of them unemployed. The age group with the highest labor force participation rate is 35 to 44 years, with 88.1% or 416 individuals in the labor force. Within the labor force, the 16 to 19 years age range has the highest percentage of unemployed individuals, with 33.0% or 30 of them being unemployed.
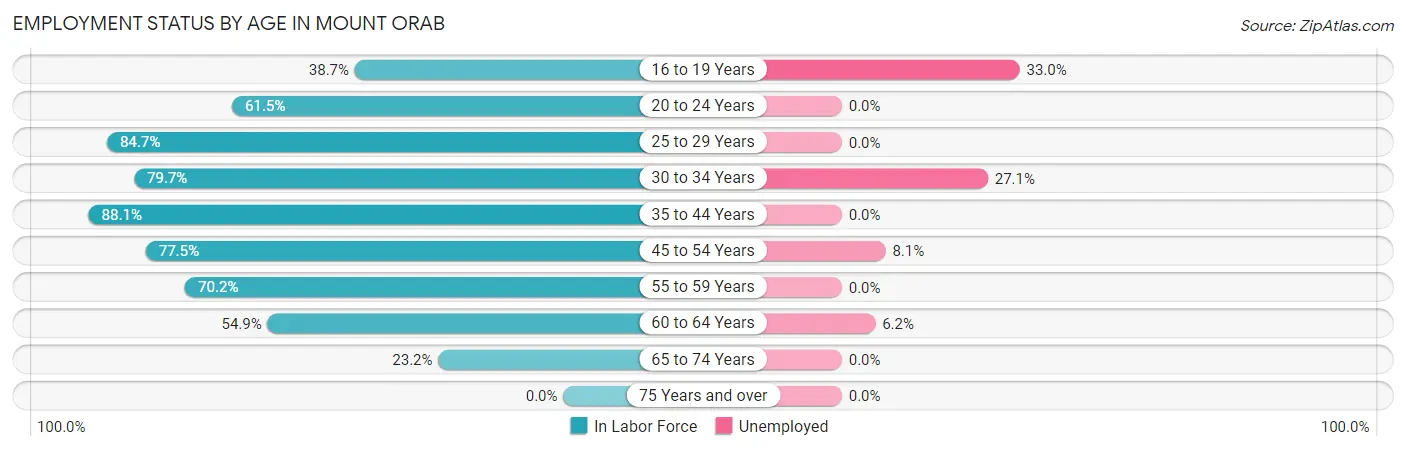
| Age Bracket | In Labor Force | Unemployed |
| 16 to 19 Years | 91 (38.7%) | 30 (33.0%) |
| 20 to 24 Years | 59 (61.5%) | 0 (0.0%) |
| 25 to 29 Years | 436 (84.7%) | 0 (0.0%) |
| 30 to 34 Years | 236 (79.7%) | 64 (27.1%) |
| 35 to 44 Years | 416 (88.1%) | 0 (0.0%) |
| 45 to 54 Years | 444 (77.5%) | 36 (8.1%) |
| 55 to 59 Years | 99 (70.2%) | 0 (0.0%) |
| 60 to 64 Years | 209 (54.9%) | 13 (6.2%) |
| 65 to 74 Years | 47 (23.2%) | 0 (0.0%) |
| 75 Years and over | 0 (0.0%) | 0 (0.0%) |
| Total | 2,038 (64.6%) | 143 (7.0%) |
Employment Status by Educational Attainment in Mount Orab
According to labor force statistics for Mount Orab, 77.4% of individuals (1,841) out of the total population between 25 and 64 years of age (2,378) are in the labor force, with 6.1% or 112 of them being unemployed. The group with the highest labor force participation rate are those with the educational attainment of bachelor's degree or higher, with 94.1% or 381 individuals in the labor force. Within the labor force, individuals with less than high school education have the highest percentage of unemployment, with 37.7% or 93 of them being unemployed.
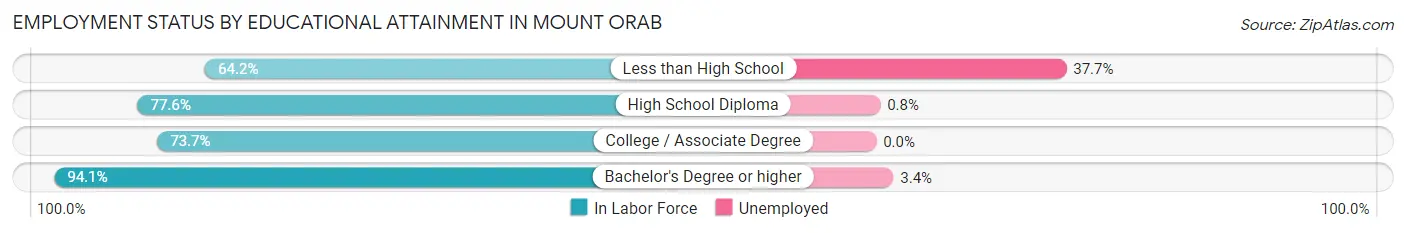
| Educational Attainment | In Labor Force | Unemployed |
| Less than High School | 247 (64.2%) | 145 (37.7%) |
| High School Diploma | 833 (77.6%) | 9 (0.8%) |
| College / Associate Degree | 379 (73.7%) | 0 (0.0%) |
| Bachelor's Degree or higher | 381 (94.1%) | 14 (3.4%) |
| Total | 1,841 (77.4%) | 145 (6.1%) |
Employment Occupations by Sex in Mount Orab
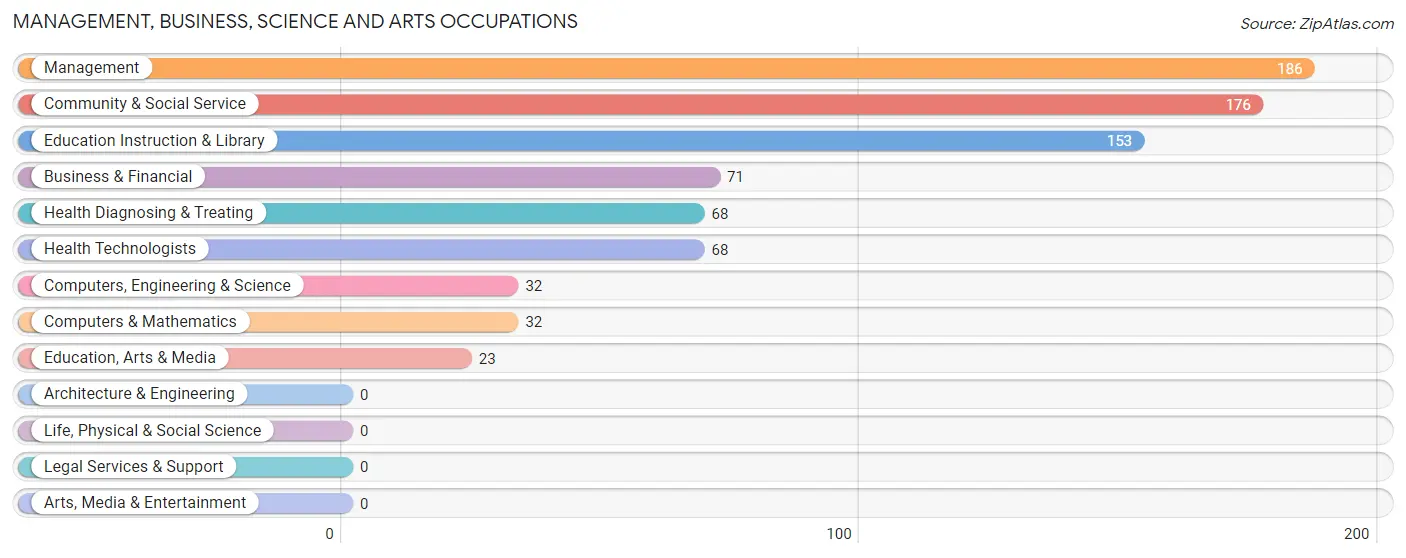
Management, Business, Science and Arts Occupations
The most common Management, Business, Science and Arts occupations in Mount Orab are Management (186 | 9.8%), Community & Social Service (176 | 9.3%), Education Instruction & Library (153 | 8.1%), Business & Financial (71 | 3.7%), and Health Diagnosing & Treating (68 | 3.6%).
Management, Business, Science and Arts Occupations by Sex
Within the Management, Business, Science and Arts occupations in Mount Orab, the most male-oriented occupations are Education, Arts & Media (100.0%), Management (80.1%), and Business & Financial (69.0%), while the most female-oriented occupations are Computers, Engineering & Science (100.0%), Computers & Mathematics (100.0%), and Health Diagnosing & Treating (100.0%).
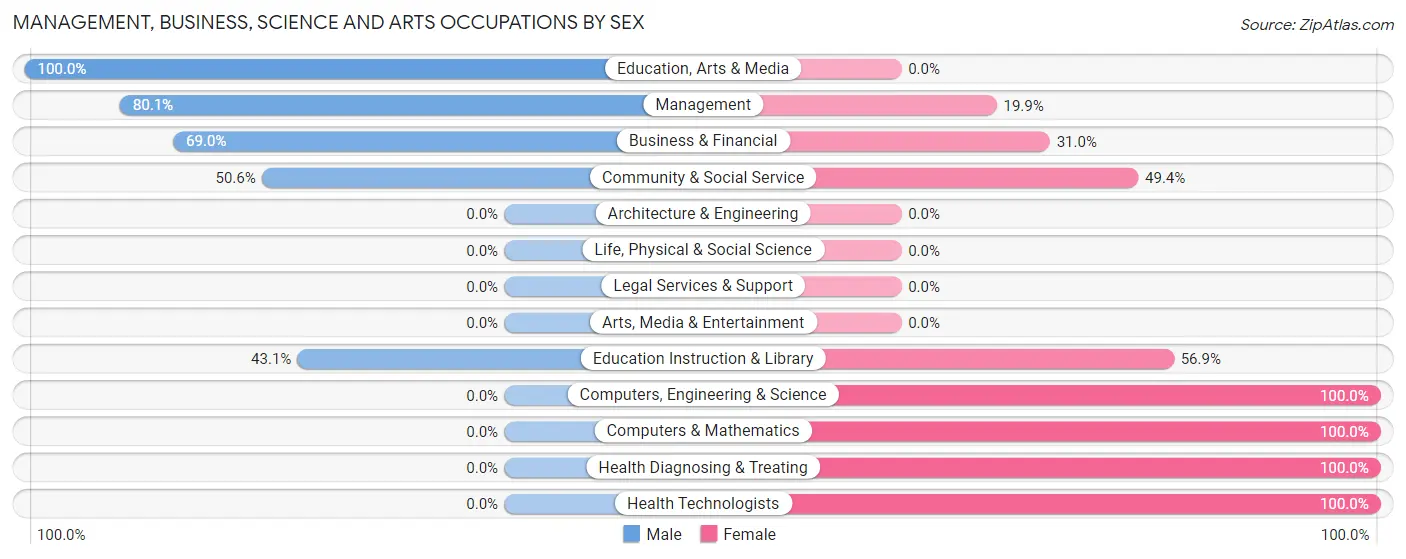
| Occupation | Male | Female |
| Management | 149 (80.1%) | 37 (19.9%) |
| Business & Financial | 49 (69.0%) | 22 (31.0%) |
| Computers, Engineering & Science | 0 (0.0%) | 32 (100.0%) |
| Computers & Mathematics | 0 (0.0%) | 32 (100.0%) |
| Architecture & Engineering | 0 (0.0%) | 0 (0.0%) |
| Life, Physical & Social Science | 0 (0.0%) | 0 (0.0%) |
| Community & Social Service | 89 (50.6%) | 87 (49.4%) |
| Education, Arts & Media | 23 (100.0%) | 0 (0.0%) |
| Legal Services & Support | 0 (0.0%) | 0 (0.0%) |
| Education Instruction & Library | 66 (43.1%) | 87 (56.9%) |
| Arts, Media & Entertainment | 0 (0.0%) | 0 (0.0%) |
| Health Diagnosing & Treating | 0 (0.0%) | 68 (100.0%) |
| Health Technologists | 0 (0.0%) | 68 (100.0%) |
| Total (Category) | 287 (53.8%) | 246 (46.2%) |
| Total (Overall) | 922 (48.7%) | 972 (51.3%) |
Services Occupations
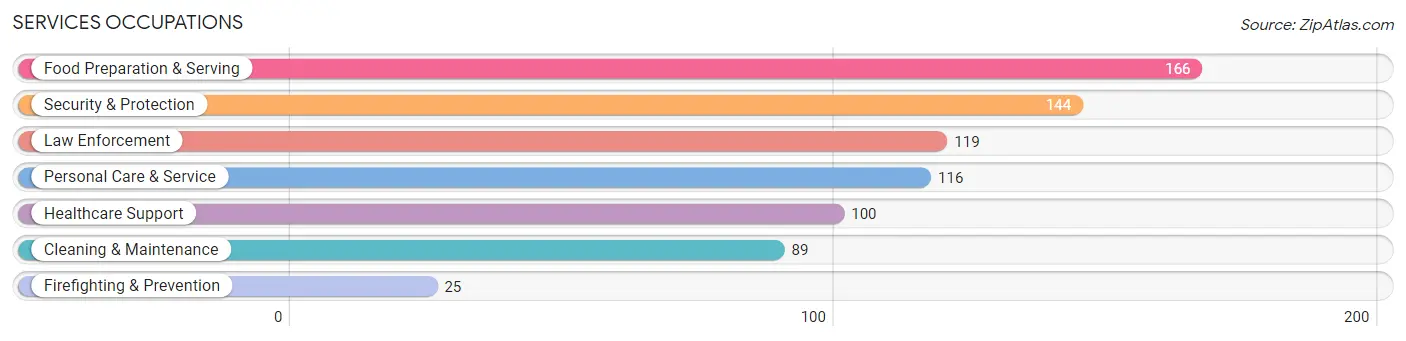
The most common Services occupations in Mount Orab are Food Preparation & Serving (166 | 8.8%), Security & Protection (144 | 7.6%), Law Enforcement (119 | 6.3%), Personal Care & Service (116 | 6.1%), and Healthcare Support (100 | 5.3%).
Services Occupations by Sex
Within the Services occupations in Mount Orab, the most male-oriented occupations are Firefighting & Prevention (100.0%), Security & Protection (86.1%), and Law Enforcement (83.2%), while the most female-oriented occupations are Healthcare Support (100.0%), Personal Care & Service (100.0%), and Cleaning & Maintenance (65.2%).
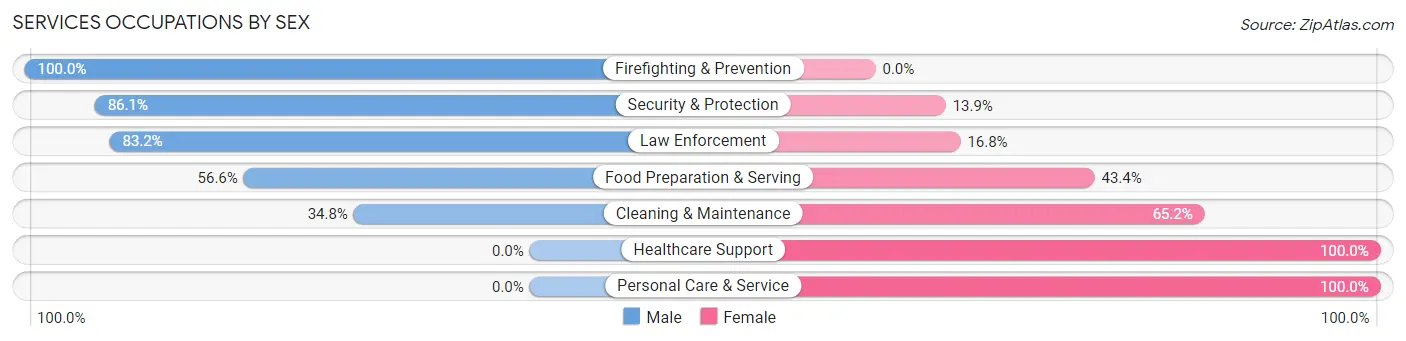
| Occupation | Male | Female |
| Healthcare Support | 0 (0.0%) | 100 (100.0%) |
| Security & Protection | 124 (86.1%) | 20 (13.9%) |
| Firefighting & Prevention | 25 (100.0%) | 0 (0.0%) |
| Law Enforcement | 99 (83.2%) | 20 (16.8%) |
| Food Preparation & Serving | 94 (56.6%) | 72 (43.4%) |
| Cleaning & Maintenance | 31 (34.8%) | 58 (65.2%) |
| Personal Care & Service | 0 (0.0%) | 116 (100.0%) |
| Total (Category) | 249 (40.5%) | 366 (59.5%) |
| Total (Overall) | 922 (48.7%) | 972 (51.3%) |
Sales and Office Occupations
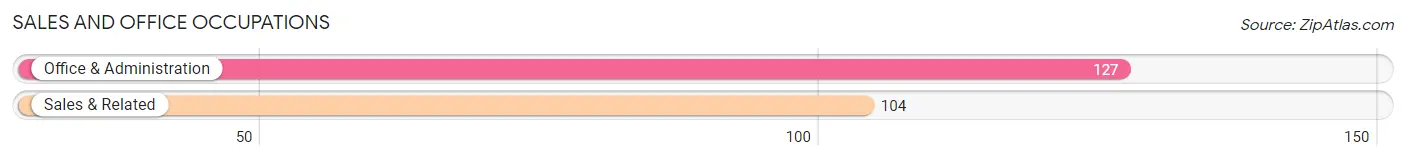
The most common Sales and Office occupations in Mount Orab are Office & Administration (127 | 6.7%), and Sales & Related (104 | 5.5%).
Sales and Office Occupations by Sex
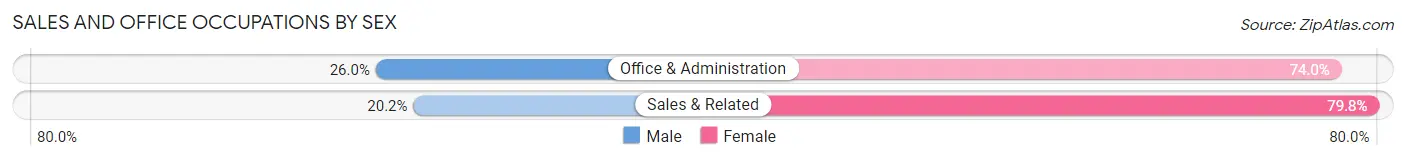
| Occupation | Male | Female |
| Sales & Related | 21 (20.2%) | 83 (79.8%) |
| Office & Administration | 33 (26.0%) | 94 (74.0%) |
| Total (Category) | 54 (23.4%) | 177 (76.6%) |
| Total (Overall) | 922 (48.7%) | 972 (51.3%) |
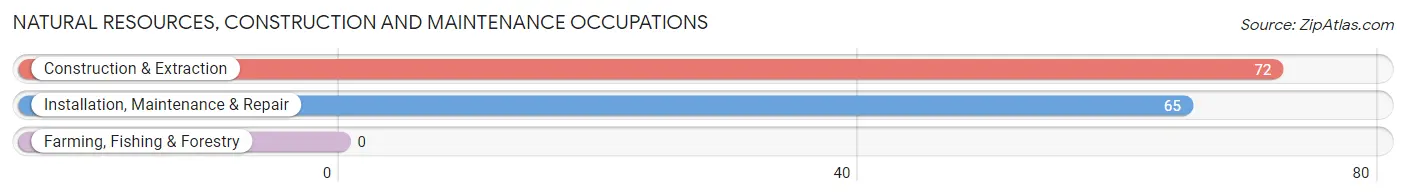
Natural Resources, Construction and Maintenance Occupations
The most common Natural Resources, Construction and Maintenance occupations in Mount Orab are Construction & Extraction (72 | 3.8%), and Installation, Maintenance & Repair (65 | 3.4%).
Natural Resources, Construction and Maintenance Occupations by Sex
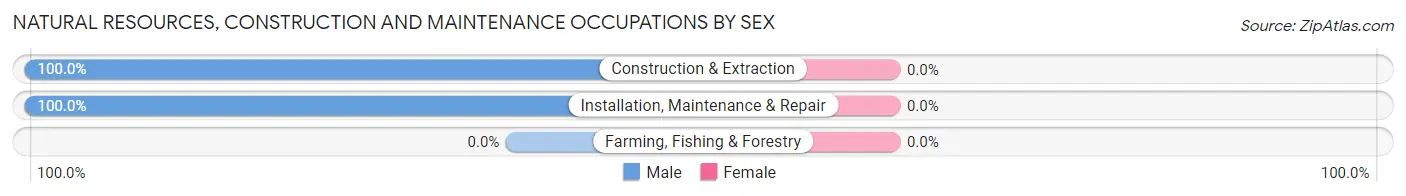
| Occupation | Male | Female |
| Farming, Fishing & Forestry | 0 (0.0%) | 0 (0.0%) |
| Construction & Extraction | 72 (100.0%) | 0 (0.0%) |
| Installation, Maintenance & Repair | 65 (100.0%) | 0 (0.0%) |
| Total (Category) | 137 (100.0%) | 0 (0.0%) |
| Total (Overall) | 922 (48.7%) | 972 (51.3%) |
Production, Transportation and Moving Occupations
The most common Production, Transportation and Moving occupations in Mount Orab are Production (245 | 12.9%), Material Moving (101 | 5.3%), and Transportation (32 | 1.7%).
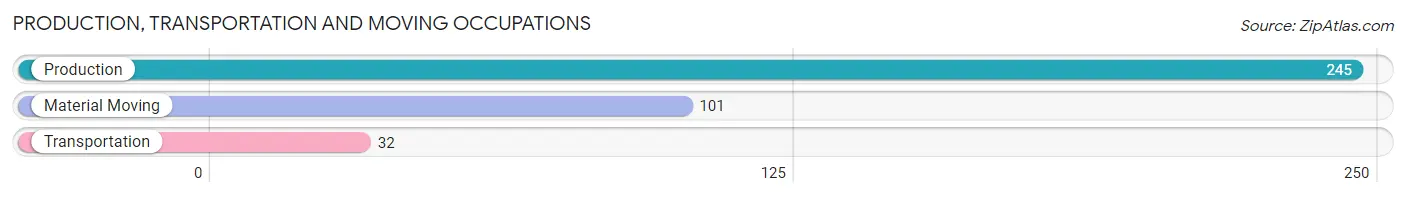
Production, Transportation and Moving Occupations by Sex
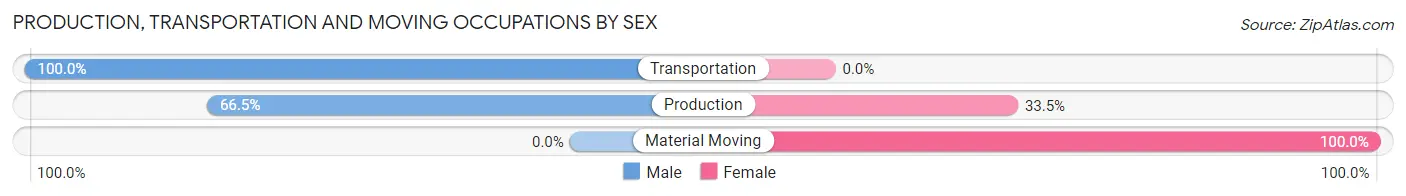
| Occupation | Male | Female |
| Production | 163 (66.5%) | 82 (33.5%) |
| Transportation | 32 (100.0%) | 0 (0.0%) |
| Material Moving | 0 (0.0%) | 101 (100.0%) |
| Total (Category) | 195 (51.6%) | 183 (48.4%) |
| Total (Overall) | 922 (48.7%) | 972 (51.3%) |
Employment Industries by Sex in Mount Orab
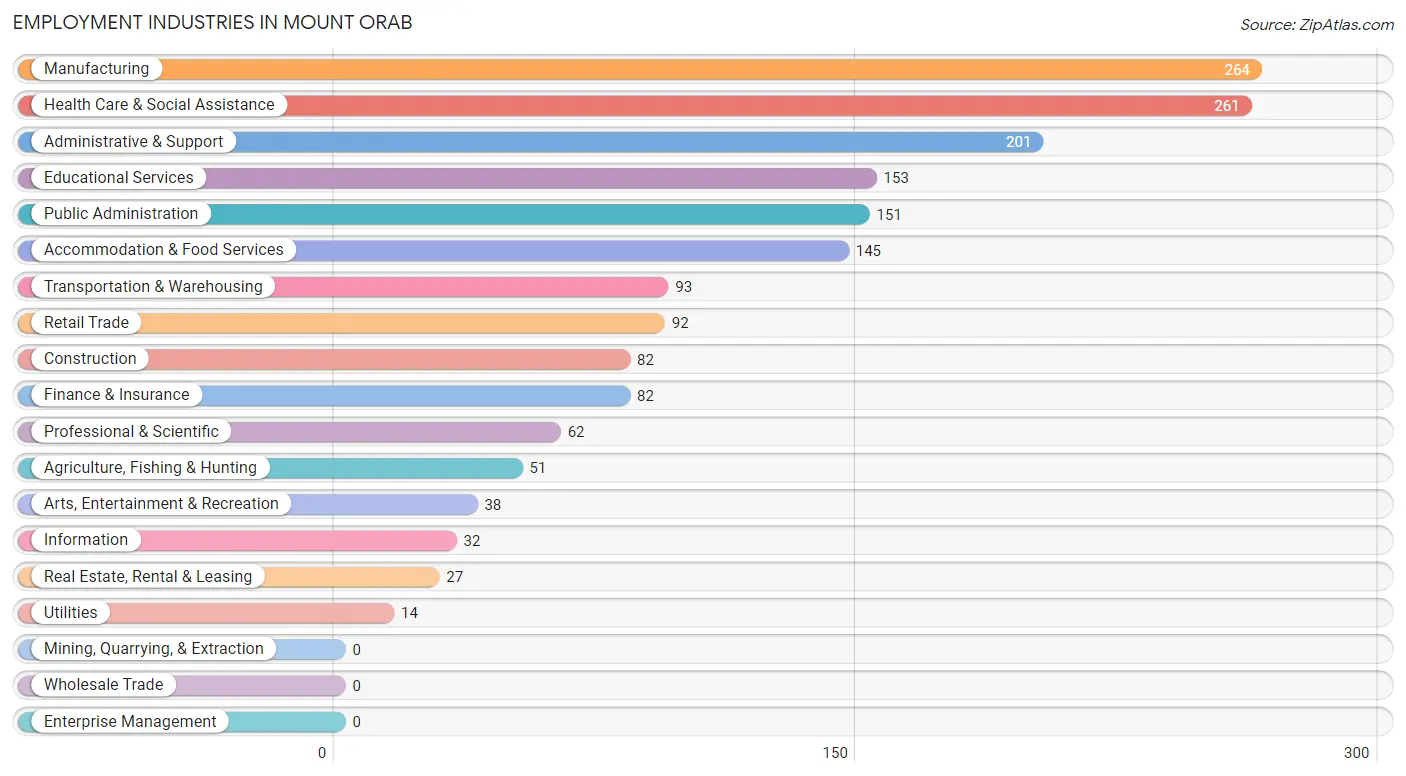
Employment Industries in Mount Orab
The major employment industries in Mount Orab include Manufacturing (264 | 13.9%), Health Care & Social Assistance (261 | 13.8%), Administrative & Support (201 | 10.6%), Educational Services (153 | 8.1%), and Public Administration (151 | 8.0%).
Employment Industries by Sex in Mount Orab
The Mount Orab industries that see more men than women are Utilities (100.0%), Finance & Insurance (100.0%), and Construction (87.8%), whereas the industries that tend to have a higher number of women are Information (100.0%), Health Care & Social Assistance (95.8%), and Retail Trade (91.3%).
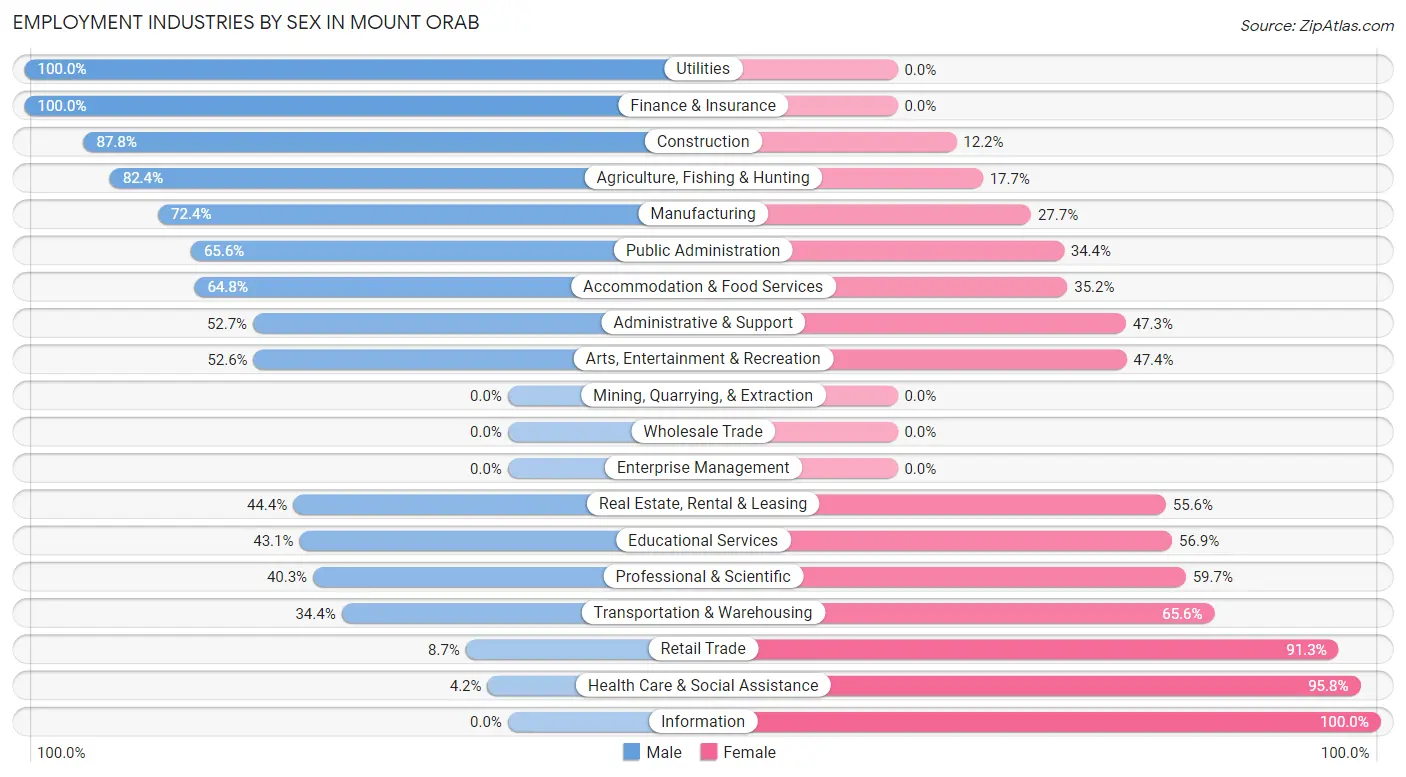
| Industry | Male | Female |
| Agriculture, Fishing & Hunting | 42 (82.4%) | 9 (17.6%) |
| Mining, Quarrying, & Extraction | 0 (0.0%) | 0 (0.0%) |
| Construction | 72 (87.8%) | 10 (12.2%) |
| Manufacturing | 191 (72.4%) | 73 (27.7%) |
| Wholesale Trade | 0 (0.0%) | 0 (0.0%) |
| Retail Trade | 8 (8.7%) | 84 (91.3%) |
| Transportation & Warehousing | 32 (34.4%) | 61 (65.6%) |
| Utilities | 14 (100.0%) | 0 (0.0%) |
| Information | 0 (0.0%) | 32 (100.0%) |
| Finance & Insurance | 82 (100.0%) | 0 (0.0%) |
| Real Estate, Rental & Leasing | 12 (44.4%) | 15 (55.6%) |
| Professional & Scientific | 25 (40.3%) | 37 (59.7%) |
| Enterprise Management | 0 (0.0%) | 0 (0.0%) |
| Administrative & Support | 106 (52.7%) | 95 (47.3%) |
| Educational Services | 66 (43.1%) | 87 (56.9%) |
| Health Care & Social Assistance | 11 (4.2%) | 250 (95.8%) |
| Arts, Entertainment & Recreation | 20 (52.6%) | 18 (47.4%) |
| Accommodation & Food Services | 94 (64.8%) | 51 (35.2%) |
| Public Administration | 99 (65.6%) | 52 (34.4%) |
| Total | 922 (48.7%) | 972 (51.3%) |
Education in Mount Orab
School Enrollment in Mount Orab
The most common levels of schooling among the 1,143 students in Mount Orab are elementary school (396 | 34.6%), high school (238 | 20.8%), and middle school (194 | 17.0%).
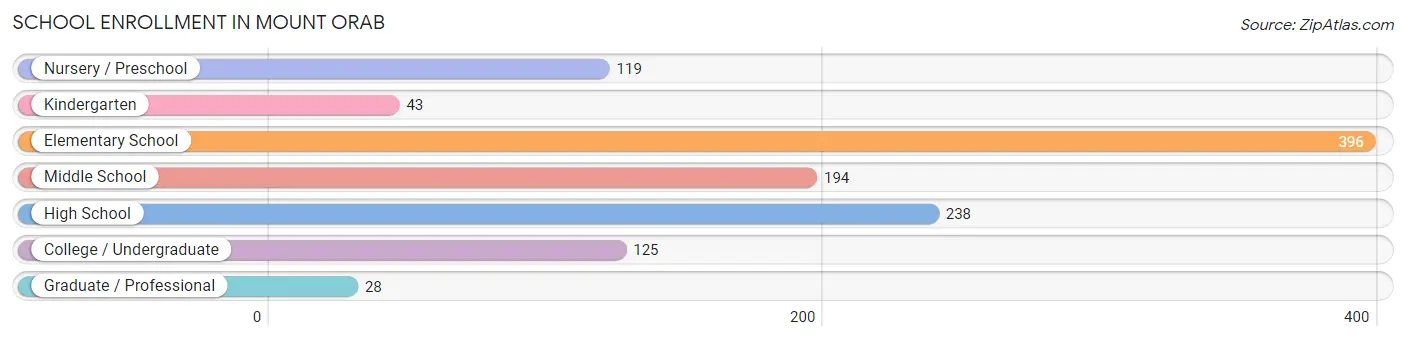
| School Level | # Students | % Students |
| Nursery / Preschool | 119 | 10.4% |
| Kindergarten | 43 | 3.8% |
| Elementary School | 396 | 34.6% |
| Middle School | 194 | 17.0% |
| High School | 238 | 20.8% |
| College / Undergraduate | 125 | 10.9% |
| Graduate / Professional | 28 | 2.5% |
| Total | 1,143 | 100.0% |
School Enrollment by Age by Funding Source in Mount Orab
Out of a total of 1,143 students who are enrolled in schools in Mount Orab, 155 (13.6%) attend a private institution, while the remaining 988 (86.4%) are enrolled in public schools. The age group of 3 to 4 year olds has the highest likelihood of being enrolled in private schools, with 79 (66.4% in the age bracket) enrolled. Conversely, the age group of 15 to 17 year olds has the lowest likelihood of being enrolled in a private school, with 209 (100.0% in the age bracket) attending a public institution.
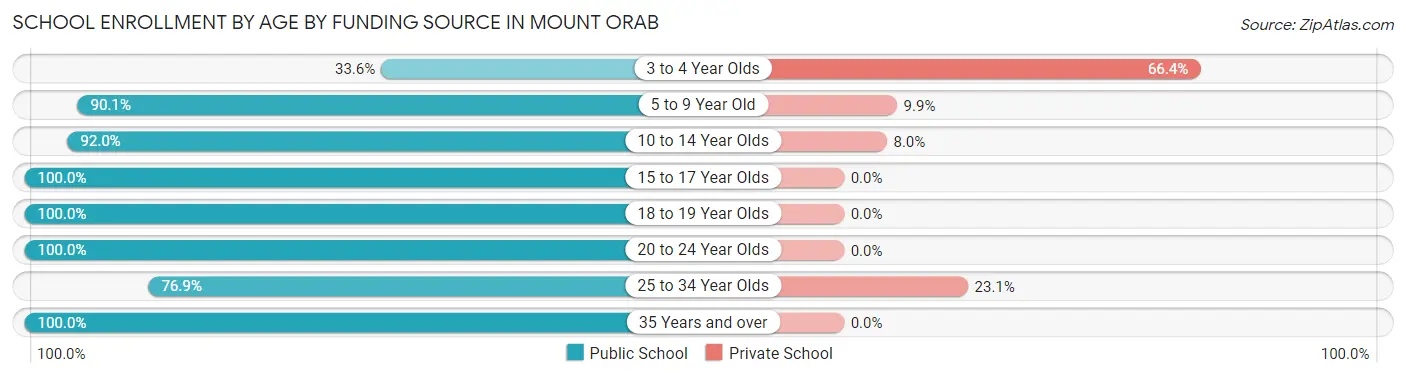
| Age Bracket | Public School | Private School |
| 3 to 4 Year Olds | 40 (33.6%) | 79 (66.4%) |
| 5 to 9 Year Old | 356 (90.1%) | 39 (9.9%) |
| 10 to 14 Year Olds | 219 (92.0%) | 19 (8.0%) |
| 15 to 17 Year Olds | 209 (100.0%) | 0 (0.0%) |
| 18 to 19 Year Olds | 81 (100.0%) | 0 (0.0%) |
| 20 to 24 Year Olds | 14 (100.0%) | 0 (0.0%) |
| 25 to 34 Year Olds | 60 (76.9%) | 18 (23.1%) |
| 35 Years and over | 9 (100.0%) | 0 (0.0%) |
| Total | 988 (86.4%) | 155 (13.6%) |
Educational Attainment by Field of Study in Mount Orab
Education (218 | 45.5%), liberal arts & history (82 | 17.1%), business (76 | 15.9%), science & technology (47 | 9.8%), and social sciences (20 | 4.2%) are the most common fields of study among 479 individuals in Mount Orab who have obtained a bachelor's degree or higher.
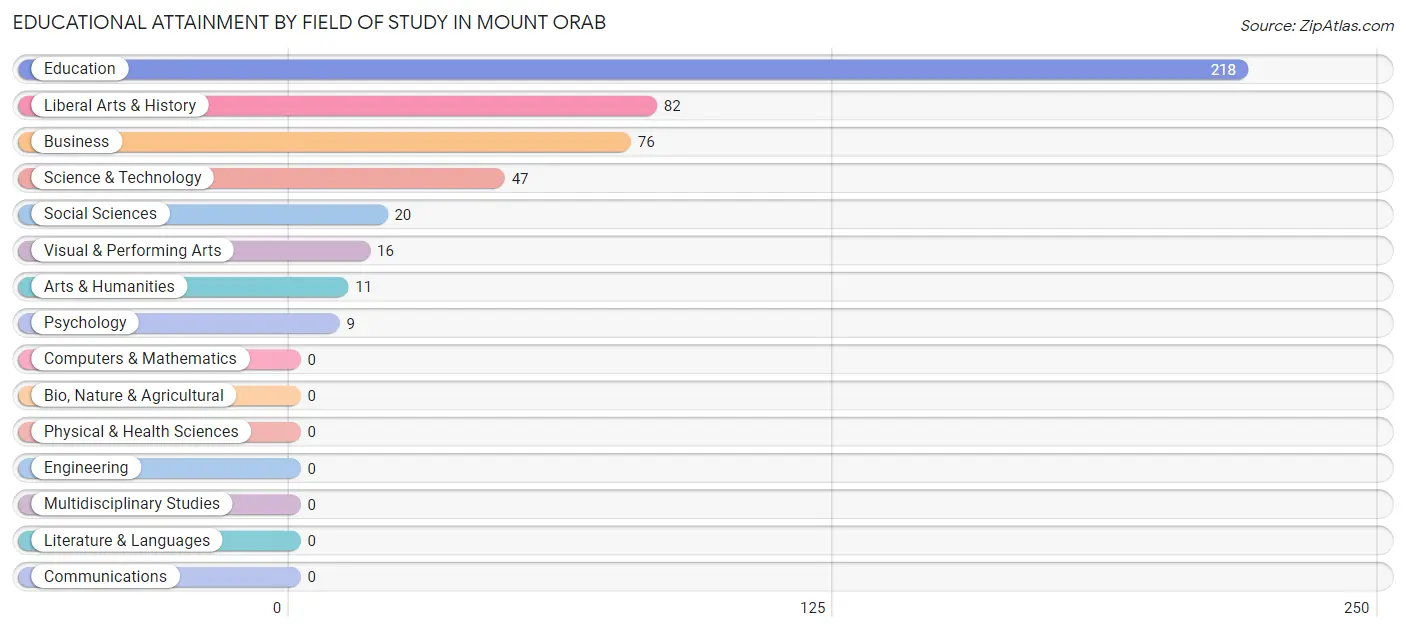
| Field of Study | # Graduates | % Graduates |
| Computers & Mathematics | 0 | 0.0% |
| Bio, Nature & Agricultural | 0 | 0.0% |
| Physical & Health Sciences | 0 | 0.0% |
| Psychology | 9 | 1.9% |
| Social Sciences | 20 | 4.2% |
| Engineering | 0 | 0.0% |
| Multidisciplinary Studies | 0 | 0.0% |
| Science & Technology | 47 | 9.8% |
| Business | 76 | 15.9% |
| Education | 218 | 45.5% |
| Literature & Languages | 0 | 0.0% |
| Liberal Arts & History | 82 | 17.1% |
| Visual & Performing Arts | 16 | 3.3% |
| Communications | 0 | 0.0% |
| Arts & Humanities | 11 | 2.3% |
| Total | 479 | 100.0% |
Transportation & Commute in Mount Orab
Vehicle Availability by Sex in Mount Orab
The most prevalent vehicle ownership categories in Mount Orab are males with 2 vehicles (456, accounting for 49.5%) and females with 2 vehicles (522, making up 46.9%).
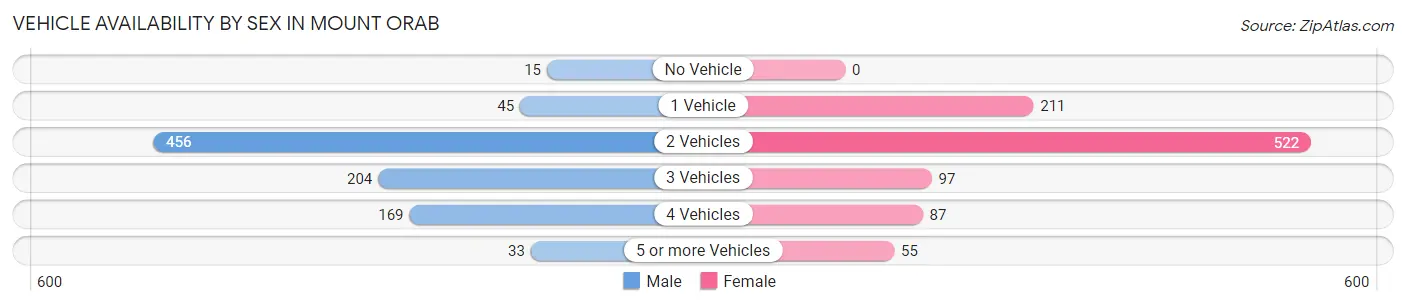
| Vehicles Available | Male | Female |
| No Vehicle | 15 (1.6%) | 0 (0.0%) |
| 1 Vehicle | 45 (4.9%) | 211 (21.7%) |
| 2 Vehicles | 456 (49.5%) | 522 (53.7%) |
| 3 Vehicles | 204 (22.1%) | 97 (10.0%) |
| 4 Vehicles | 169 (18.3%) | 87 (8.9%) |
| 5 or more Vehicles | 33 (3.6%) | 55 (5.7%) |
| Total | 922 (100.0%) | 972 (100.0%) |
Commute Time in Mount Orab
The most frequently occuring commute durations in Mount Orab are 30 to 34 minutes (389 commuters, 21.5%), 5 to 9 minutes (307 commuters, 17.0%), and 60 to 89 minutes (303 commuters, 16.8%).
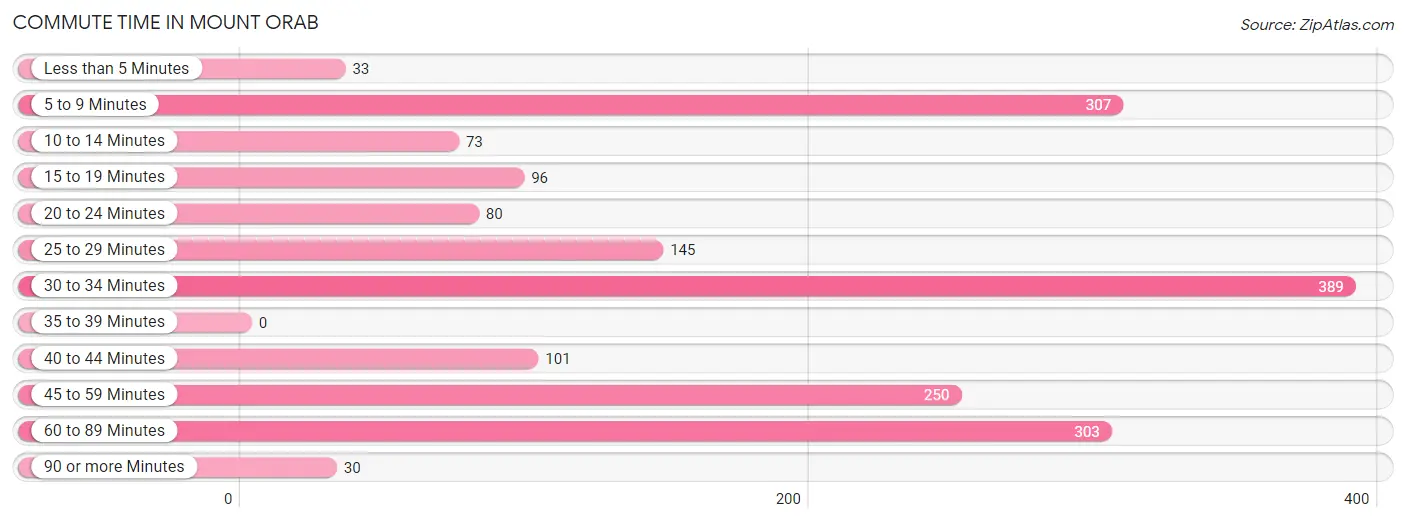
| Commute Time | # Commuters | % Commuters |
| Less than 5 Minutes | 33 | 1.8% |
| 5 to 9 Minutes | 307 | 17.0% |
| 10 to 14 Minutes | 73 | 4.0% |
| 15 to 19 Minutes | 96 | 5.3% |
| 20 to 24 Minutes | 80 | 4.4% |
| 25 to 29 Minutes | 145 | 8.0% |
| 30 to 34 Minutes | 389 | 21.5% |
| 35 to 39 Minutes | 0 | 0.0% |
| 40 to 44 Minutes | 101 | 5.6% |
| 45 to 59 Minutes | 250 | 13.8% |
| 60 to 89 Minutes | 303 | 16.8% |
| 90 or more Minutes | 30 | 1.7% |
Commute Time by Sex in Mount Orab
The most common commute times in Mount Orab are 60 to 89 minutes (214 commuters, 25.2%) for males and 30 to 34 minutes (291 commuters, 30.3%) for females.
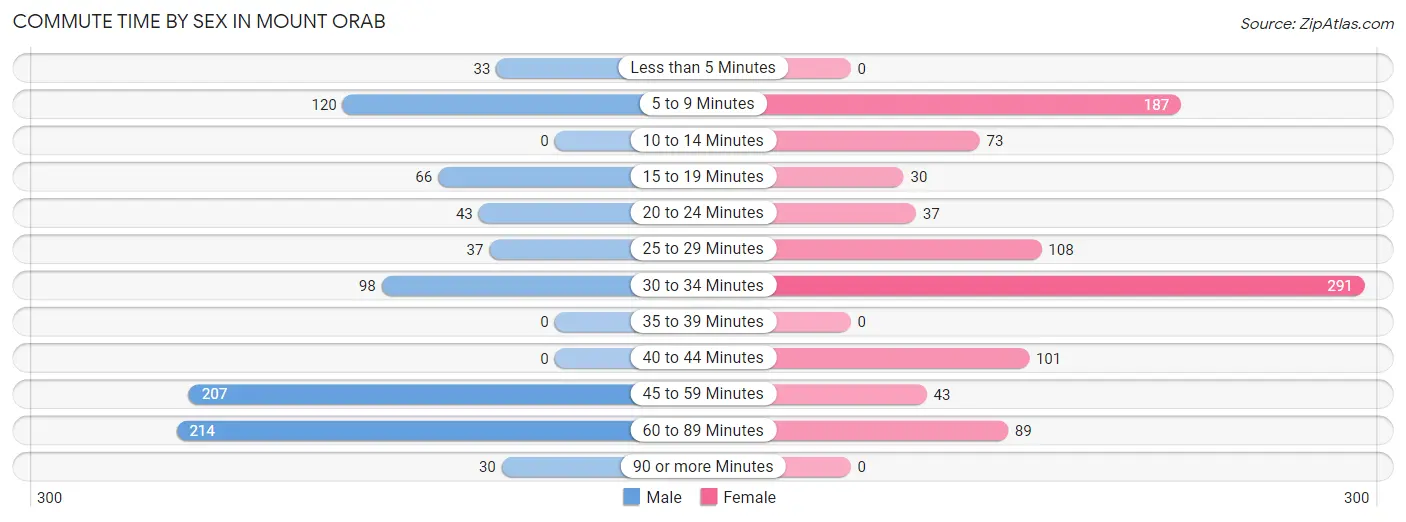
| Commute Time | Male | Female |
| Less than 5 Minutes | 33 (3.9%) | 0 (0.0%) |
| 5 to 9 Minutes | 120 (14.1%) | 187 (19.5%) |
| 10 to 14 Minutes | 0 (0.0%) | 73 (7.6%) |
| 15 to 19 Minutes | 66 (7.8%) | 30 (3.1%) |
| 20 to 24 Minutes | 43 (5.1%) | 37 (3.9%) |
| 25 to 29 Minutes | 37 (4.4%) | 108 (11.3%) |
| 30 to 34 Minutes | 98 (11.6%) | 291 (30.3%) |
| 35 to 39 Minutes | 0 (0.0%) | 0 (0.0%) |
| 40 to 44 Minutes | 0 (0.0%) | 101 (10.5%) |
| 45 to 59 Minutes | 207 (24.4%) | 43 (4.5%) |
| 60 to 89 Minutes | 214 (25.2%) | 89 (9.3%) |
| 90 or more Minutes | 30 (3.5%) | 0 (0.0%) |
Time of Departure to Work by Sex in Mount Orab
The most frequent times of departure to work in Mount Orab are 7:00 AM to 7:29 AM (162, 19.1%) for males and 12:00 PM to 3:59 PM (232, 24.2%) for females.
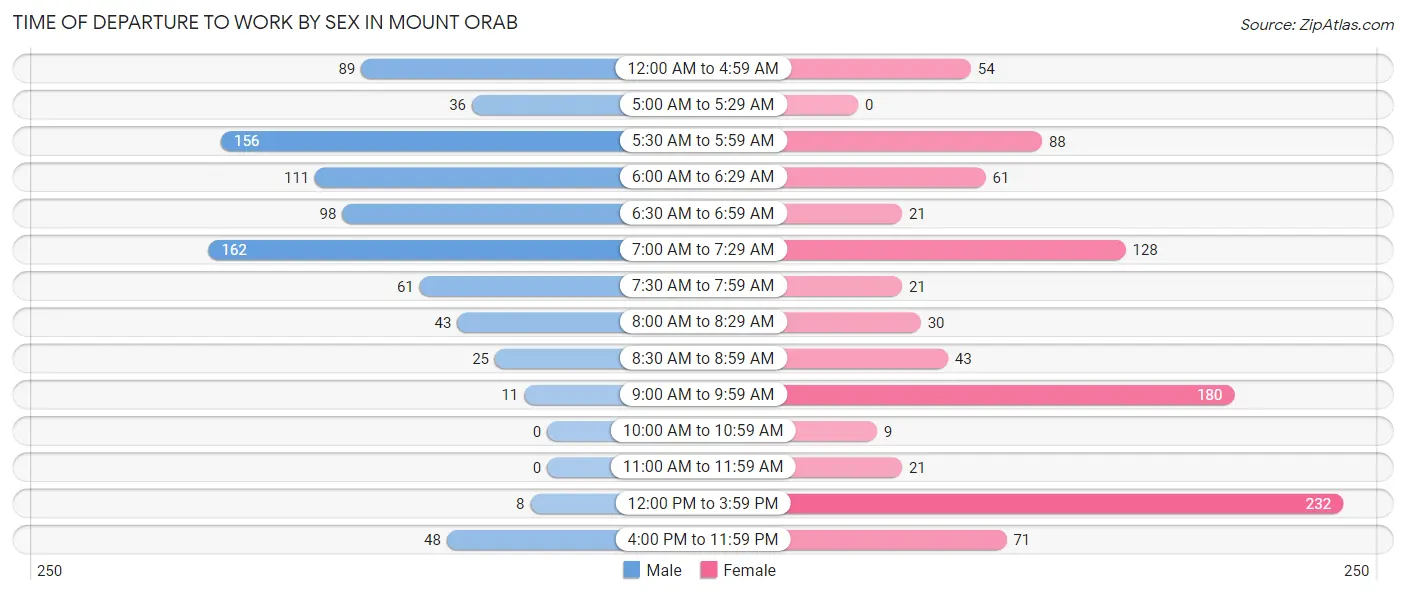
| Time of Departure | Male | Female |
| 12:00 AM to 4:59 AM | 89 (10.5%) | 54 (5.6%) |
| 5:00 AM to 5:29 AM | 36 (4.3%) | 0 (0.0%) |
| 5:30 AM to 5:59 AM | 156 (18.4%) | 88 (9.2%) |
| 6:00 AM to 6:29 AM | 111 (13.1%) | 61 (6.4%) |
| 6:30 AM to 6:59 AM | 98 (11.6%) | 21 (2.2%) |
| 7:00 AM to 7:29 AM | 162 (19.1%) | 128 (13.4%) |
| 7:30 AM to 7:59 AM | 61 (7.2%) | 21 (2.2%) |
| 8:00 AM to 8:29 AM | 43 (5.1%) | 30 (3.1%) |
| 8:30 AM to 8:59 AM | 25 (2.9%) | 43 (4.5%) |
| 9:00 AM to 9:59 AM | 11 (1.3%) | 180 (18.8%) |
| 10:00 AM to 10:59 AM | 0 (0.0%) | 9 (0.9%) |
| 11:00 AM to 11:59 AM | 0 (0.0%) | 21 (2.2%) |
| 12:00 PM to 3:59 PM | 8 (0.9%) | 232 (24.2%) |
| 4:00 PM to 11:59 PM | 48 (5.7%) | 71 (7.4%) |
| Total | 848 (100.0%) | 959 (100.0%) |
Housing Occupancy in Mount Orab
Occupancy by Ownership in Mount Orab
Of the total 1,744 dwellings in Mount Orab, owner-occupied units account for 951 (54.5%), while renter-occupied units make up 793 (45.5%).
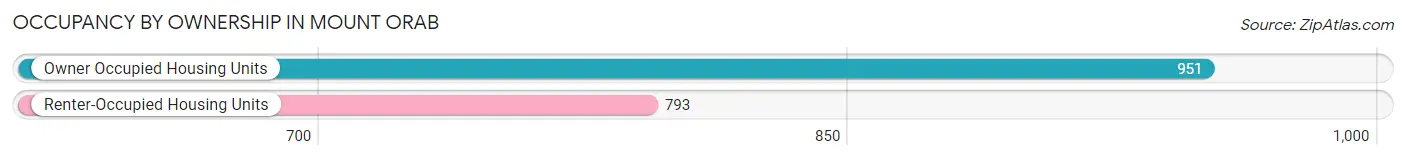
| Occupancy | # Housing Units | % Housing Units |
| Owner Occupied Housing Units | 951 | 54.5% |
| Renter-Occupied Housing Units | 793 | 45.5% |
| Total Occupied Housing Units | 1,744 | 100.0% |
Occupancy by Household Size in Mount Orab
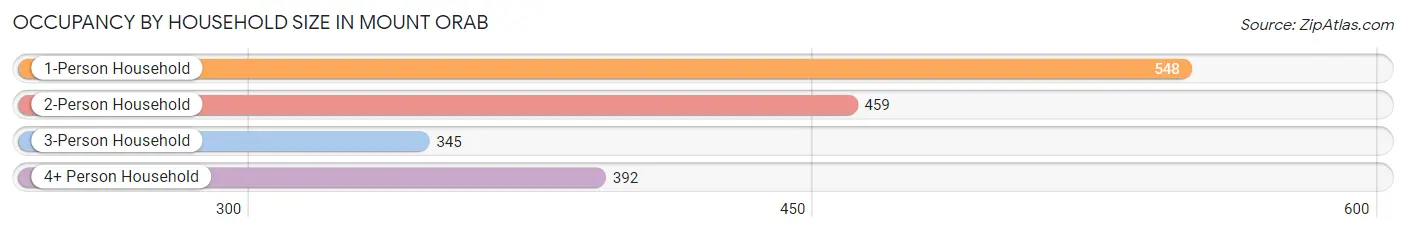
| Household Size | # Housing Units | % Housing Units |
| 1-Person Household | 548 | 31.4% |
| 2-Person Household | 459 | 26.3% |
| 3-Person Household | 345 | 19.8% |
| 4+ Person Household | 392 | 22.5% |
| Total Housing Units | 1,744 | 100.0% |
Occupancy by Ownership by Household Size in Mount Orab
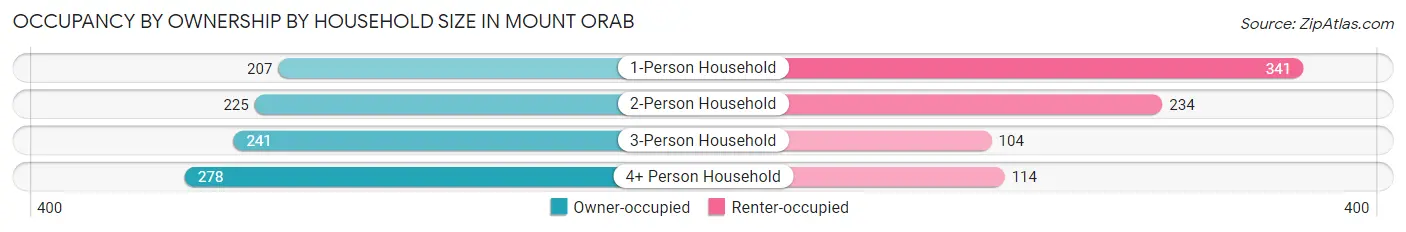
| Household Size | Owner-occupied | Renter-occupied |
| 1-Person Household | 207 (37.8%) | 341 (62.2%) |
| 2-Person Household | 225 (49.0%) | 234 (51.0%) |
| 3-Person Household | 241 (69.9%) | 104 (30.1%) |
| 4+ Person Household | 278 (70.9%) | 114 (29.1%) |
| Total Housing Units | 951 (54.5%) | 793 (45.5%) |
Occupancy by Educational Attainment in Mount Orab
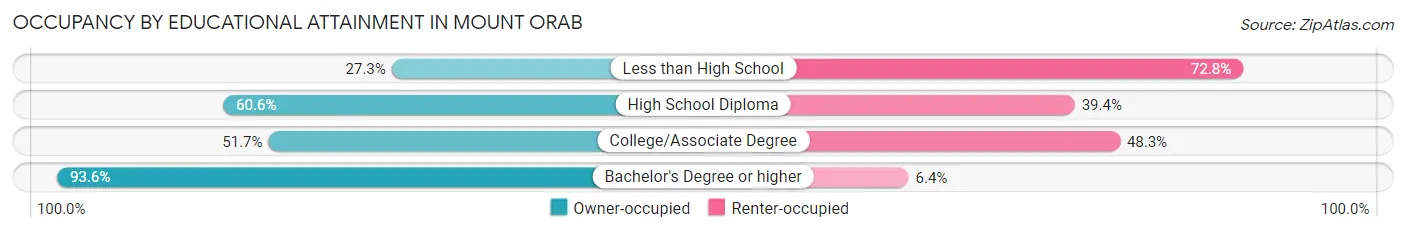
| Household Size | Owner-occupied | Renter-occupied |
| Less than High School | 121 (27.3%) | 323 (72.8%) |
| High School Diploma | 365 (60.6%) | 237 (39.4%) |
| College/Associate Degree | 232 (51.7%) | 217 (48.3%) |
| Bachelor's Degree or higher | 233 (93.6%) | 16 (6.4%) |
Occupancy by Age of Householder in Mount Orab
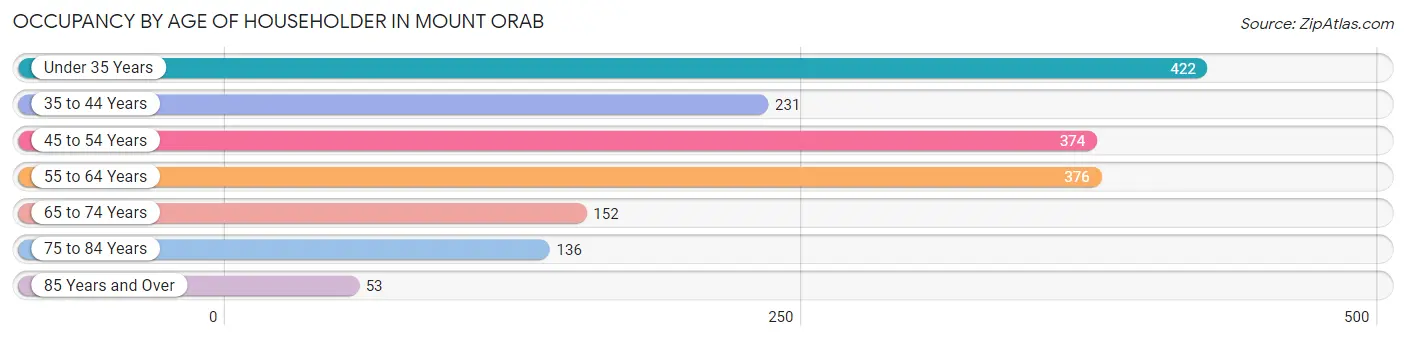
| Age Bracket | # Households | % Households |
| Under 35 Years | 422 | 24.2% |
| 35 to 44 Years | 231 | 13.3% |
| 45 to 54 Years | 374 | 21.4% |
| 55 to 64 Years | 376 | 21.6% |
| 65 to 74 Years | 152 | 8.7% |
| 75 to 84 Years | 136 | 7.8% |
| 85 Years and Over | 53 | 3.0% |
| Total | 1,744 | 100.0% |
Housing Finances in Mount Orab
Median Income by Occupancy in Mount Orab
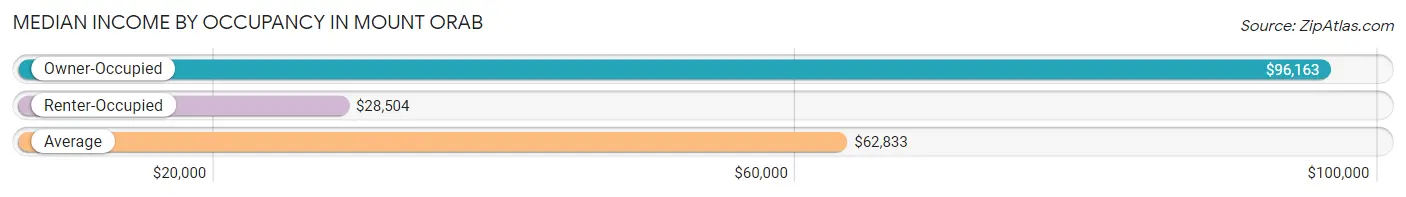
| Occupancy Type | # Households | Median Income |
| Owner-Occupied | 951 (54.5%) | $96,163 |
| Renter-Occupied | 793 (45.5%) | $28,504 |
| Average | 1,744 (100.0%) | $62,833 |
Occupancy by Householder Income Bracket in Mount Orab
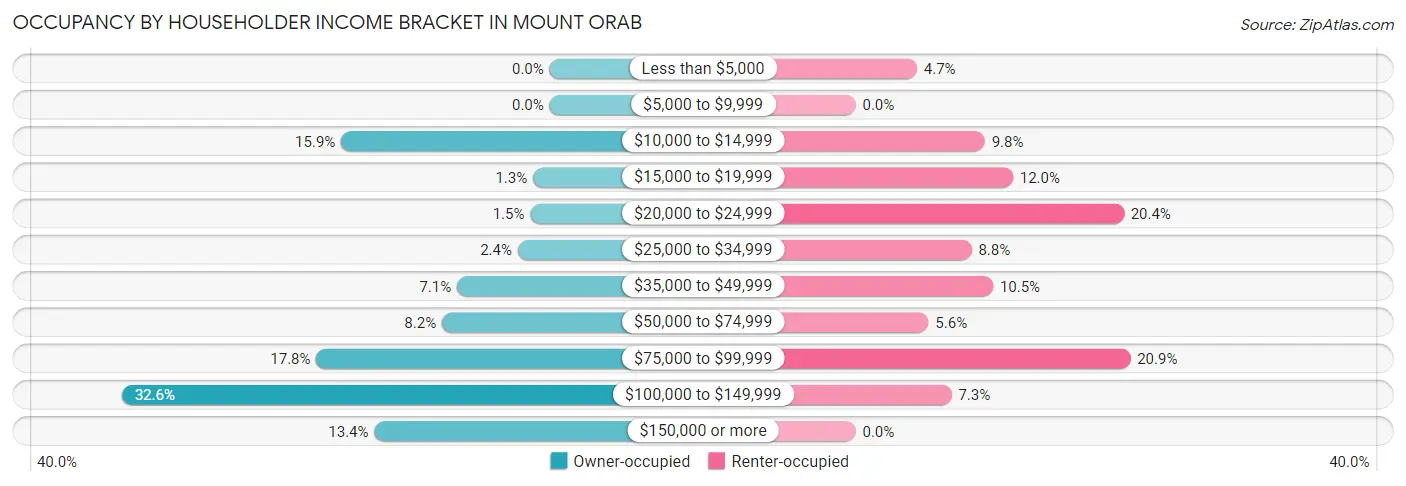
| Income Bracket | Owner-occupied | Renter-occupied |
| Less than $5,000 | 0 (0.0%) | 37 (4.7%) |
| $5,000 to $9,999 | 0 (0.0%) | 0 (0.0%) |
| $10,000 to $14,999 | 151 (15.9%) | 78 (9.8%) |
| $15,000 to $19,999 | 12 (1.3%) | 95 (12.0%) |
| $20,000 to $24,999 | 14 (1.5%) | 162 (20.4%) |
| $25,000 to $34,999 | 23 (2.4%) | 70 (8.8%) |
| $35,000 to $49,999 | 67 (7.0%) | 83 (10.5%) |
| $50,000 to $74,999 | 78 (8.2%) | 44 (5.6%) |
| $75,000 to $99,999 | 169 (17.8%) | 166 (20.9%) |
| $100,000 to $149,999 | 310 (32.6%) | 58 (7.3%) |
| $150,000 or more | 127 (13.4%) | 0 (0.0%) |
| Total | 951 (100.0%) | 793 (100.0%) |
Monthly Housing Cost Tiers in Mount Orab
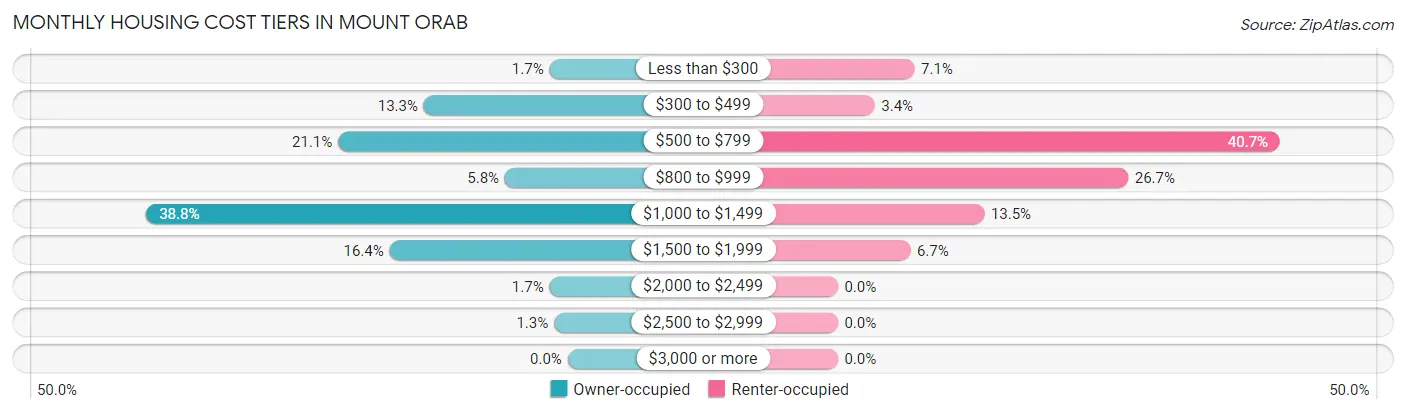
| Monthly Cost | Owner-occupied | Renter-occupied |
| Less than $300 | 16 (1.7%) | 56 (7.1%) |
| $300 to $499 | 126 (13.3%) | 27 (3.4%) |
| $500 to $799 | 201 (21.1%) | 323 (40.7%) |
| $800 to $999 | 55 (5.8%) | 212 (26.7%) |
| $1,000 to $1,499 | 369 (38.8%) | 107 (13.5%) |
| $1,500 to $1,999 | 156 (16.4%) | 53 (6.7%) |
| $2,000 to $2,499 | 16 (1.7%) | 0 (0.0%) |
| $2,500 to $2,999 | 12 (1.3%) | 0 (0.0%) |
| $3,000 or more | 0 (0.0%) | 0 (0.0%) |
| Total | 951 (100.0%) | 793 (100.0%) |
Physical Housing Characteristics in Mount Orab
Housing Structures in Mount Orab
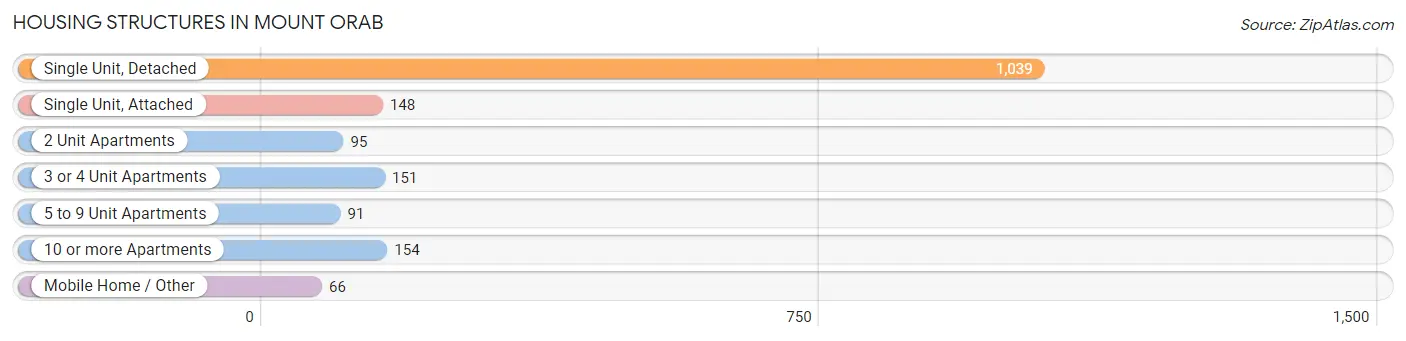
| Structure Type | # Housing Units | % Housing Units |
| Single Unit, Detached | 1,039 | 59.6% |
| Single Unit, Attached | 148 | 8.5% |
| 2 Unit Apartments | 95 | 5.4% |
| 3 or 4 Unit Apartments | 151 | 8.7% |
| 5 to 9 Unit Apartments | 91 | 5.2% |
| 10 or more Apartments | 154 | 8.8% |
| Mobile Home / Other | 66 | 3.8% |
| Total | 1,744 | 100.0% |
Housing Structures by Occupancy in Mount Orab
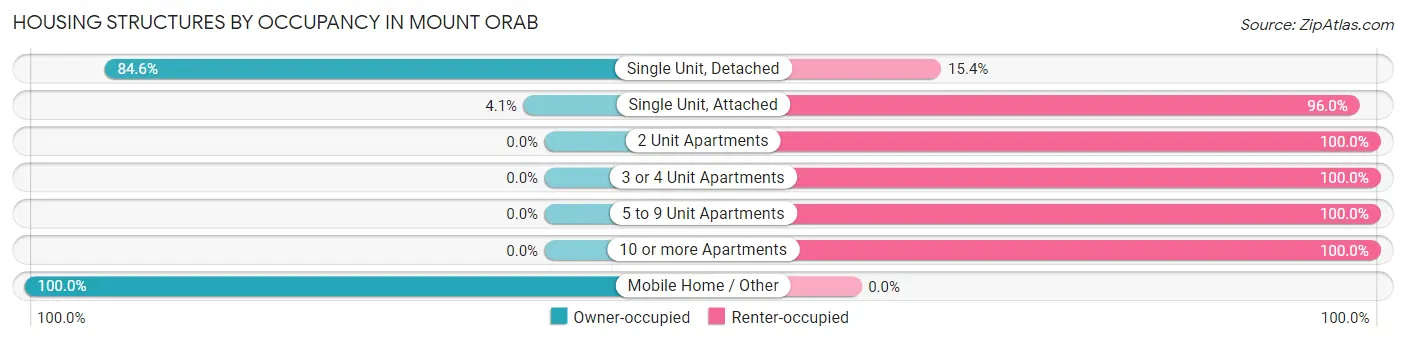
| Structure Type | Owner-occupied | Renter-occupied |
| Single Unit, Detached | 879 (84.6%) | 160 (15.4%) |
| Single Unit, Attached | 6 (4.1%) | 142 (96.0%) |
| 2 Unit Apartments | 0 (0.0%) | 95 (100.0%) |
| 3 or 4 Unit Apartments | 0 (0.0%) | 151 (100.0%) |
| 5 to 9 Unit Apartments | 0 (0.0%) | 91 (100.0%) |
| 10 or more Apartments | 0 (0.0%) | 154 (100.0%) |
| Mobile Home / Other | 66 (100.0%) | 0 (0.0%) |
| Total | 951 (54.5%) | 793 (45.5%) |
Housing Structures by Number of Rooms in Mount Orab
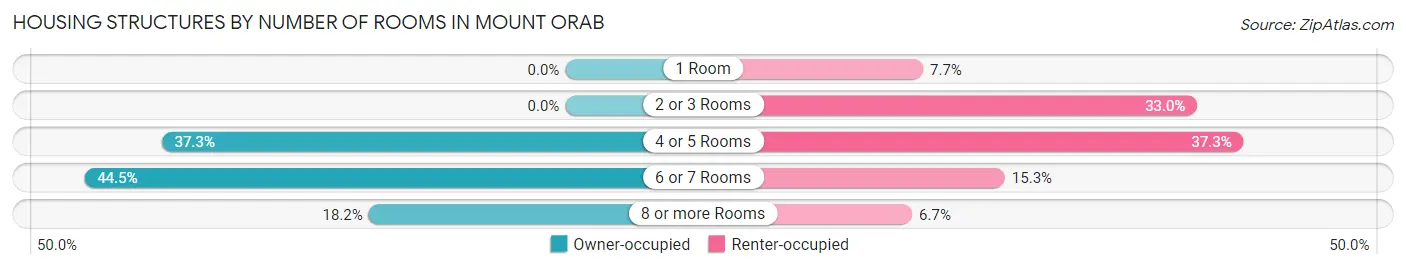
| Number of Rooms | Owner-occupied | Renter-occupied |
| 1 Room | 0 (0.0%) | 61 (7.7%) |
| 2 or 3 Rooms | 0 (0.0%) | 262 (33.0%) |
| 4 or 5 Rooms | 355 (37.3%) | 296 (37.3%) |
| 6 or 7 Rooms | 423 (44.5%) | 121 (15.3%) |
| 8 or more Rooms | 173 (18.2%) | 53 (6.7%) |
| Total | 951 (100.0%) | 793 (100.0%) |
Housing Structure by Heating Type in Mount Orab
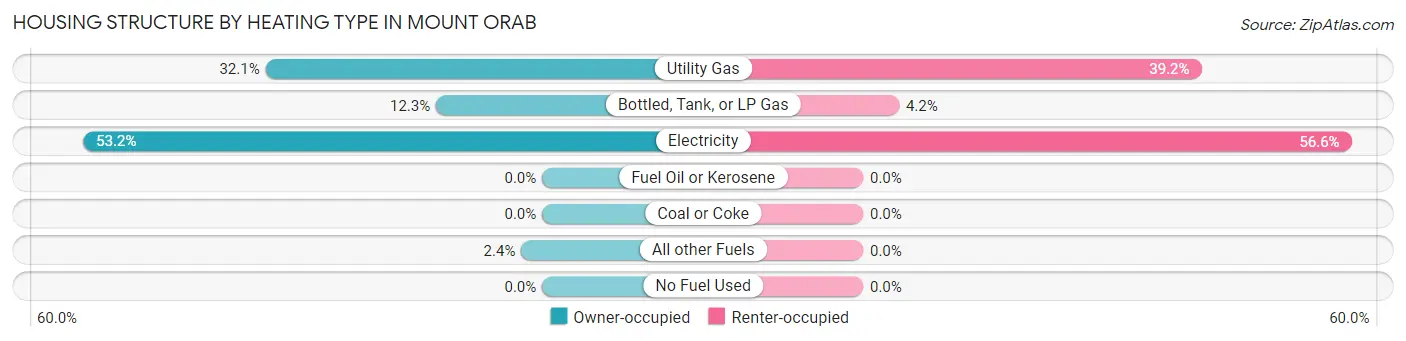
| Heating Type | Owner-occupied | Renter-occupied |
| Utility Gas | 305 (32.1%) | 311 (39.2%) |
| Bottled, Tank, or LP Gas | 117 (12.3%) | 33 (4.2%) |
| Electricity | 506 (53.2%) | 449 (56.6%) |
| Fuel Oil or Kerosene | 0 (0.0%) | 0 (0.0%) |
| Coal or Coke | 0 (0.0%) | 0 (0.0%) |
| All other Fuels | 23 (2.4%) | 0 (0.0%) |
| No Fuel Used | 0 (0.0%) | 0 (0.0%) |
| Total | 951 (100.0%) | 793 (100.0%) |
Household Vehicle Usage in Mount Orab
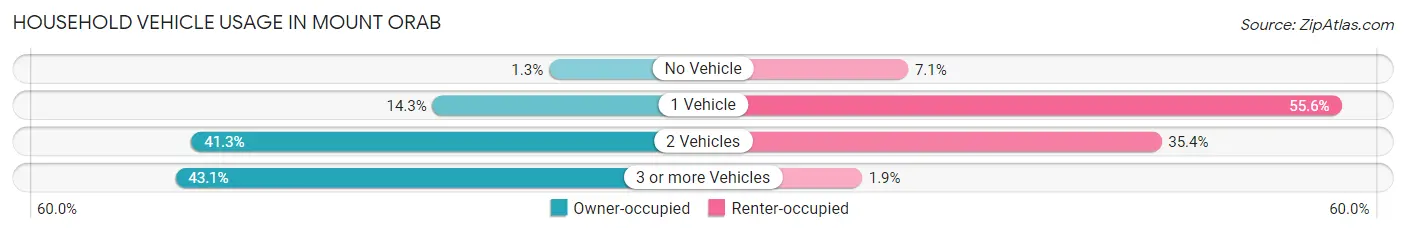
| Vehicles per Household | Owner-occupied | Renter-occupied |
| No Vehicle | 12 (1.3%) | 56 (7.1%) |
| 1 Vehicle | 136 (14.3%) | 441 (55.6%) |
| 2 Vehicles | 393 (41.3%) | 281 (35.4%) |
| 3 or more Vehicles | 410 (43.1%) | 15 (1.9%) |
| Total | 951 (100.0%) | 793 (100.0%) |
Real Estate & Mortgages in Mount Orab
Real Estate and Mortgage Overview in Mount Orab
| Characteristic | Without Mortgage | With Mortgage |
| Housing Units | 294 | 657 |
| Median Property Value | $235,100 | $181,300 |
| Median Household Income | - | - |
| Monthly Housing Costs | $511 | $0 |
| Real Estate Taxes | $1,821 | $0 |
Property Value by Mortgage Status in Mount Orab
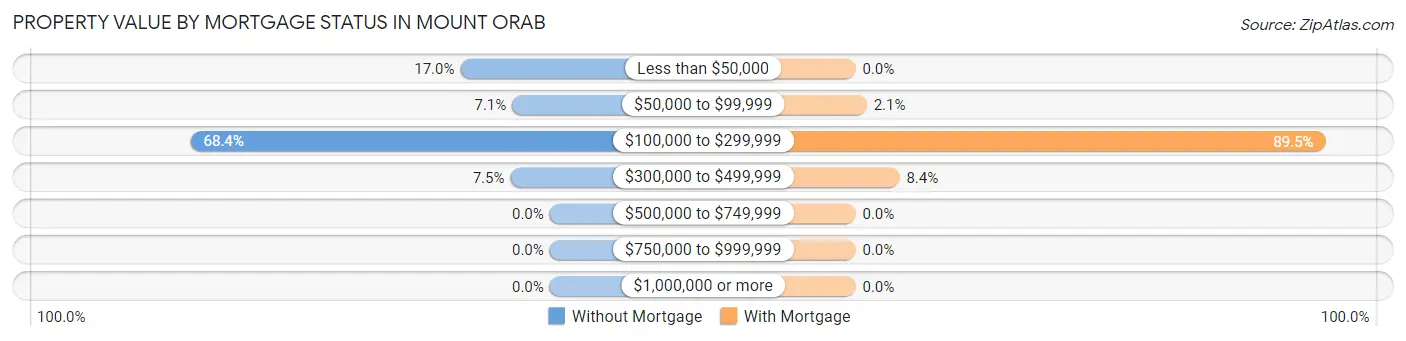
| Property Value | Without Mortgage | With Mortgage |
| Less than $50,000 | 50 (17.0%) | 0 (0.0%) |
| $50,000 to $99,999 | 21 (7.1%) | 14 (2.1%) |
| $100,000 to $299,999 | 201 (68.4%) | 588 (89.5%) |
| $300,000 to $499,999 | 22 (7.5%) | 55 (8.4%) |
| $500,000 to $749,999 | 0 (0.0%) | 0 (0.0%) |
| $750,000 to $999,999 | 0 (0.0%) | 0 (0.0%) |
| $1,000,000 or more | 0 (0.0%) | 0 (0.0%) |
| Total | 294 (100.0%) | 657 (100.0%) |
Household Income by Mortgage Status in Mount Orab
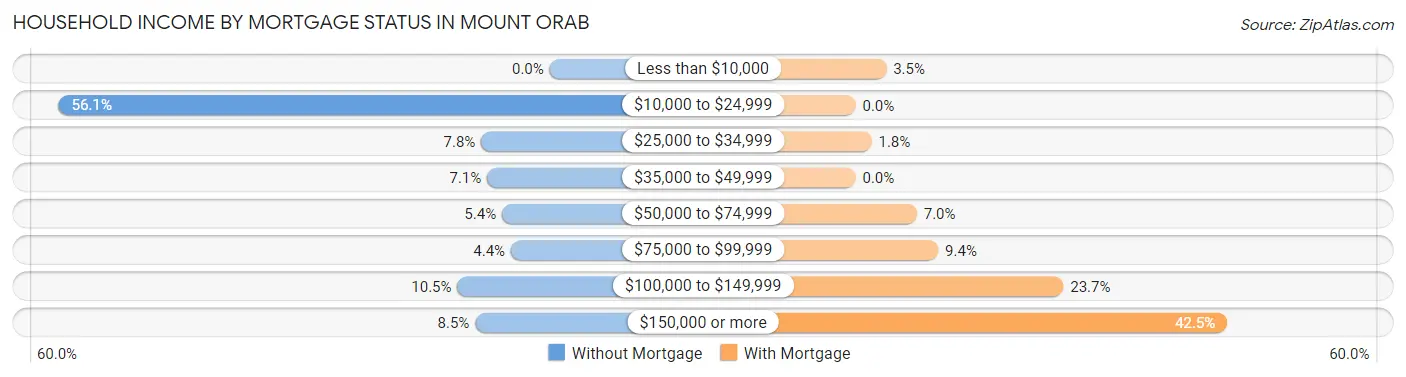
| Household Income | Without Mortgage | With Mortgage |
| Less than $10,000 | 0 (0.0%) | 23 (3.5%) |
| $10,000 to $24,999 | 165 (56.1%) | 0 (0.0%) |
| $25,000 to $34,999 | 23 (7.8%) | 12 (1.8%) |
| $35,000 to $49,999 | 21 (7.1%) | 0 (0.0%) |
| $50,000 to $74,999 | 16 (5.4%) | 46 (7.0%) |
| $75,000 to $99,999 | 13 (4.4%) | 62 (9.4%) |
| $100,000 to $149,999 | 31 (10.5%) | 156 (23.7%) |
| $150,000 or more | 25 (8.5%) | 279 (42.5%) |
| Total | 294 (100.0%) | 657 (100.0%) |
Property Value to Household Income Ratio in Mount Orab
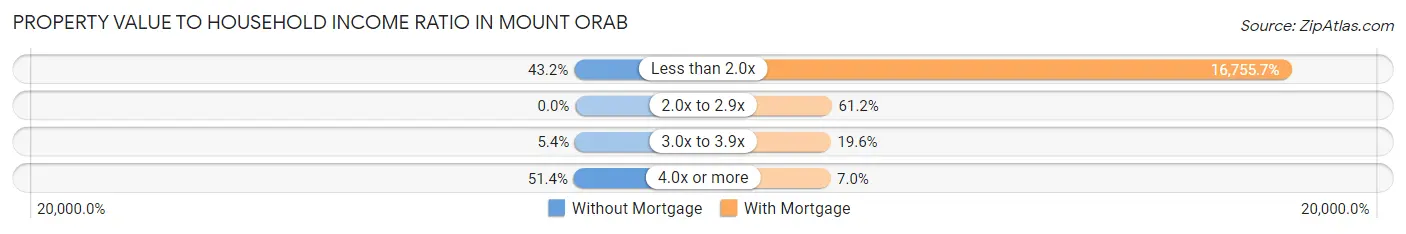
| Value-to-Income Ratio | Without Mortgage | With Mortgage |
| Less than 2.0x | 127 (43.2%) | 110,085 (16,755.7%) |
| 2.0x to 2.9x | 0 (0.0%) | 402 (61.2%) |
| 3.0x to 3.9x | 16 (5.4%) | 129 (19.6%) |
| 4.0x or more | 151 (51.4%) | 46 (7.0%) |
| Total | 294 (100.0%) | 657 (100.0%) |
Real Estate Taxes by Mortgage Status in Mount Orab
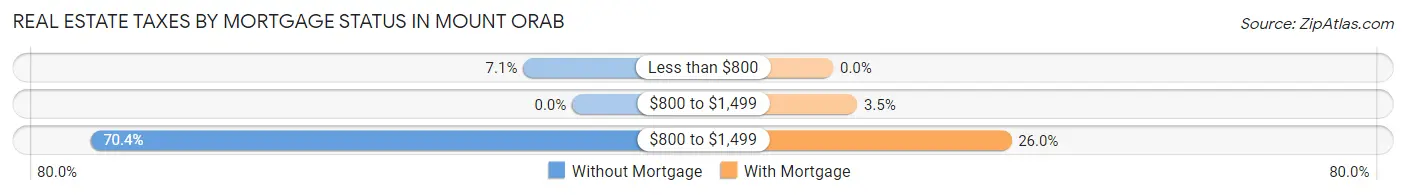
| Property Taxes | Without Mortgage | With Mortgage |
| Less than $800 | 21 (7.1%) | 0 (0.0%) |
| $800 to $1,499 | 0 (0.0%) | 23 (3.5%) |
| $800 to $1,499 | 207 (70.4%) | 171 (26.0%) |
| Total | 294 (100.0%) | 657 (100.0%) |
Health & Disability in Mount Orab
Health Insurance Coverage by Age in Mount Orab
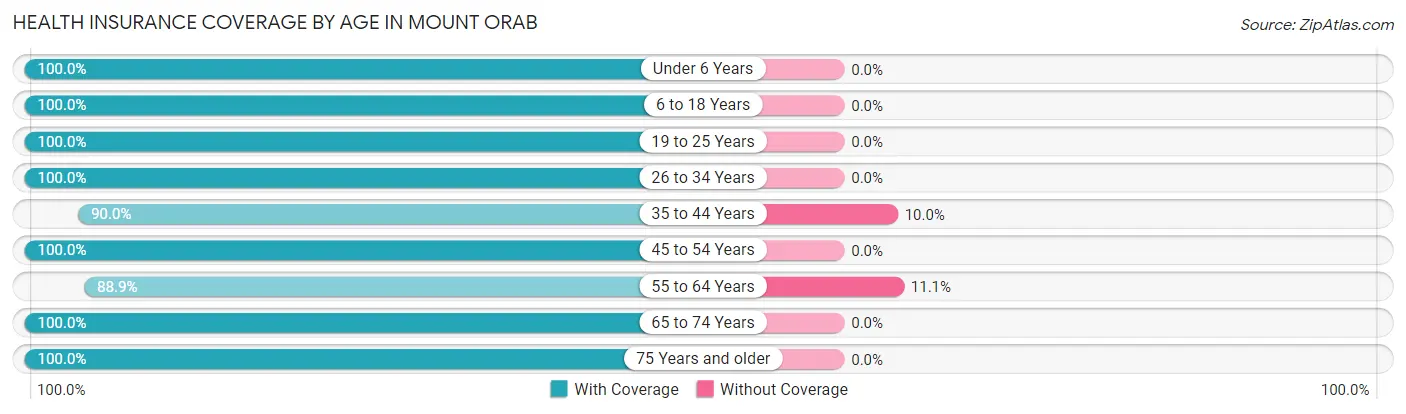
| Age Bracket | With Coverage | Without Coverage |
| Under 6 Years | 629 (100.0%) | 0 (0.0%) |
| 6 to 18 Years | 921 (100.0%) | 0 (0.0%) |
| 19 to 25 Years | 346 (100.0%) | 0 (0.0%) |
| 26 to 34 Years | 635 (100.0%) | 0 (0.0%) |
| 35 to 44 Years | 425 (90.0%) | 47 (10.0%) |
| 45 to 54 Years | 573 (100.0%) | 0 (0.0%) |
| 55 to 64 Years | 464 (88.9%) | 58 (11.1%) |
| 65 to 74 Years | 203 (100.0%) | 0 (0.0%) |
| 75 Years and older | 243 (100.0%) | 0 (0.0%) |
| Total | 4,439 (97.7%) | 105 (2.3%) |
Health Insurance Coverage by Citizenship Status in Mount Orab
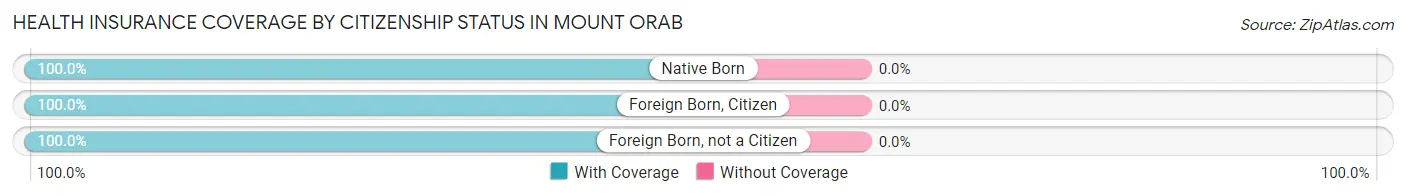
| Citizenship Status | With Coverage | Without Coverage |
| Native Born | 629 (100.0%) | 0 (0.0%) |
| Foreign Born, Citizen | 921 (100.0%) | 0 (0.0%) |
| Foreign Born, not a Citizen | 346 (100.0%) | 0 (0.0%) |
Health Insurance Coverage by Household Income in Mount Orab
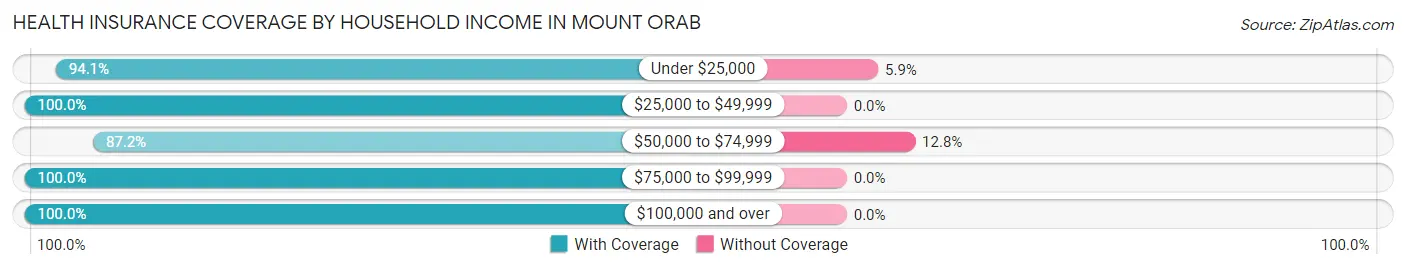
| Household Income | With Coverage | Without Coverage |
| Under $25,000 | 931 (94.1%) | 58 (5.9%) |
| $25,000 to $49,999 | 637 (100.0%) | 0 (0.0%) |
| $50,000 to $74,999 | 320 (87.2%) | 47 (12.8%) |
| $75,000 to $99,999 | 903 (100.0%) | 0 (0.0%) |
| $100,000 and over | 1,630 (100.0%) | 0 (0.0%) |
Public vs Private Health Insurance Coverage by Age in Mount Orab
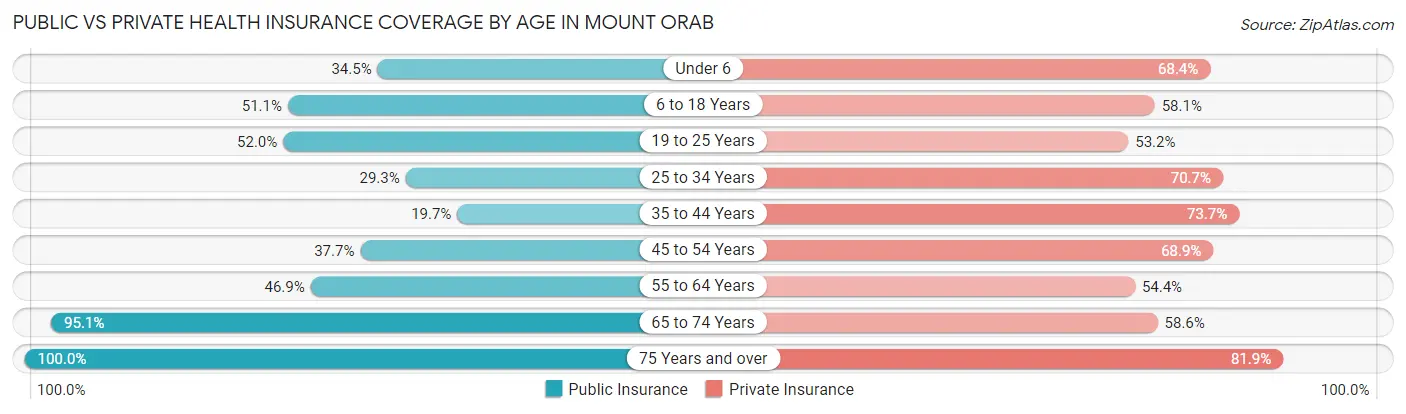
| Age Bracket | Public Insurance | Private Insurance |
| Under 6 | 217 (34.5%) | 430 (68.4%) |
| 6 to 18 Years | 471 (51.1%) | 535 (58.1%) |
| 19 to 25 Years | 180 (52.0%) | 184 (53.2%) |
| 25 to 34 Years | 186 (29.3%) | 449 (70.7%) |
| 35 to 44 Years | 93 (19.7%) | 348 (73.7%) |
| 45 to 54 Years | 216 (37.7%) | 395 (68.9%) |
| 55 to 64 Years | 245 (46.9%) | 284 (54.4%) |
| 65 to 74 Years | 193 (95.1%) | 119 (58.6%) |
| 75 Years and over | 243 (100.0%) | 199 (81.9%) |
| Total | 2,044 (45.0%) | 2,943 (64.8%) |
Disability Status by Sex by Age in Mount Orab
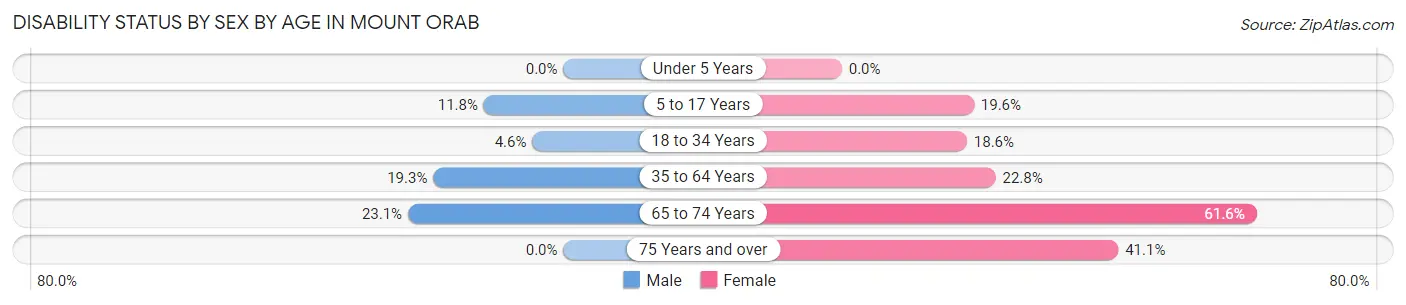
| Age Bracket | Male | Female |
| Under 5 Years | 0 (0.0%) | 0 (0.0%) |
| 5 to 17 Years | 79 (11.8%) | 61 (19.6%) |
| 18 to 34 Years | 22 (4.6%) | 99 (18.6%) |
| 35 to 64 Years | 136 (19.3%) | 197 (22.8%) |
| 65 to 74 Years | 12 (23.1%) | 93 (61.6%) |
| 75 Years and over | 0 (0.0%) | 78 (41.0%) |
Disability Class by Sex by Age in Mount Orab
Disability Class: Hearing Difficulty
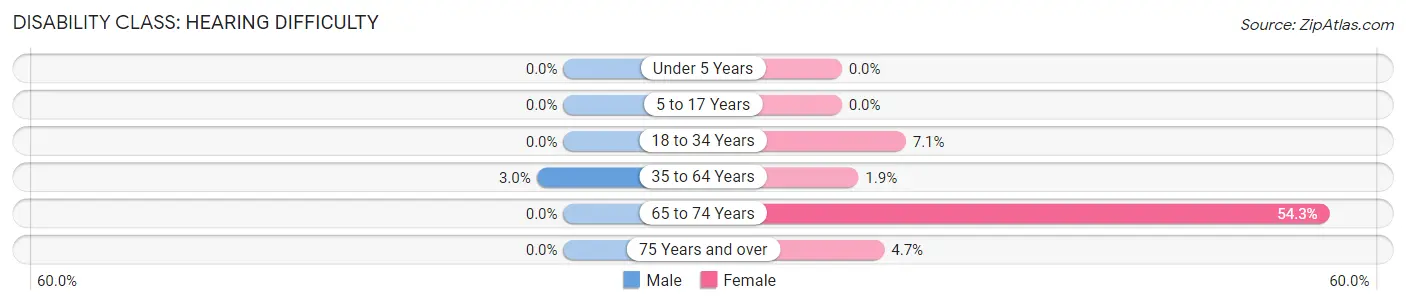
| Age Bracket | Male | Female |
| Under 5 Years | 0 (0.0%) | 0 (0.0%) |
| 5 to 17 Years | 0 (0.0%) | 0 (0.0%) |
| 18 to 34 Years | 0 (0.0%) | 38 (7.1%) |
| 35 to 64 Years | 21 (3.0%) | 16 (1.8%) |
| 65 to 74 Years | 0 (0.0%) | 82 (54.3%) |
| 75 Years and over | 0 (0.0%) | 9 (4.7%) |
Disability Class: Vision Difficulty
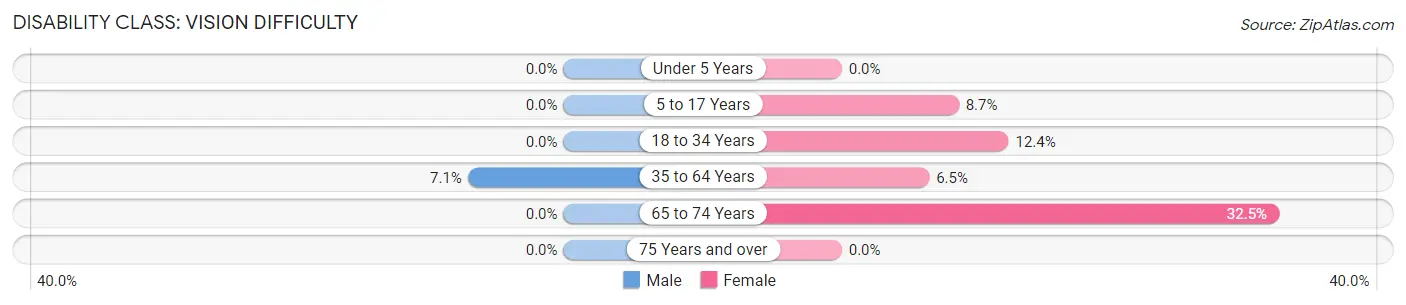
| Age Bracket | Male | Female |
| Under 5 Years | 0 (0.0%) | 0 (0.0%) |
| 5 to 17 Years | 0 (0.0%) | 27 (8.7%) |
| 18 to 34 Years | 0 (0.0%) | 66 (12.4%) |
| 35 to 64 Years | 50 (7.1%) | 56 (6.5%) |
| 65 to 74 Years | 0 (0.0%) | 49 (32.5%) |
| 75 Years and over | 0 (0.0%) | 0 (0.0%) |
Disability Class: Cognitive Difficulty
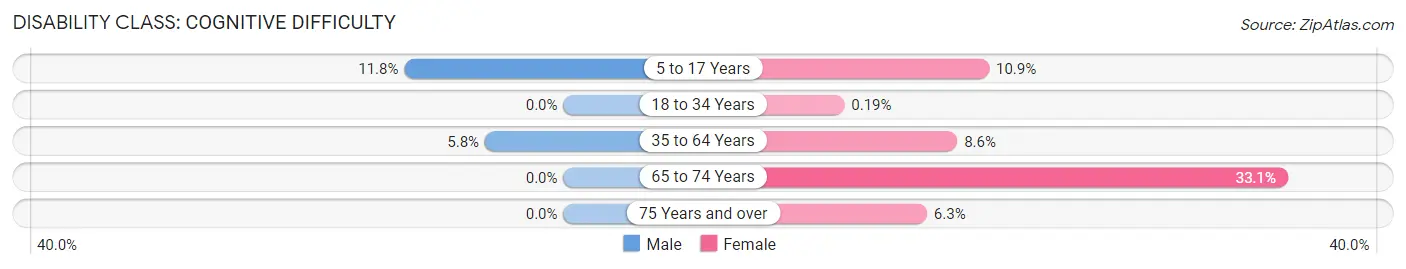
| Age Bracket | Male | Female |
| 5 to 17 Years | 79 (11.8%) | 34 (10.9%) |
| 18 to 34 Years | 0 (0.0%) | 1 (0.2%) |
| 35 to 64 Years | 41 (5.8%) | 74 (8.6%) |
| 65 to 74 Years | 0 (0.0%) | 50 (33.1%) |
| 75 Years and over | 0 (0.0%) | 12 (6.3%) |
Disability Class: Ambulatory Difficulty
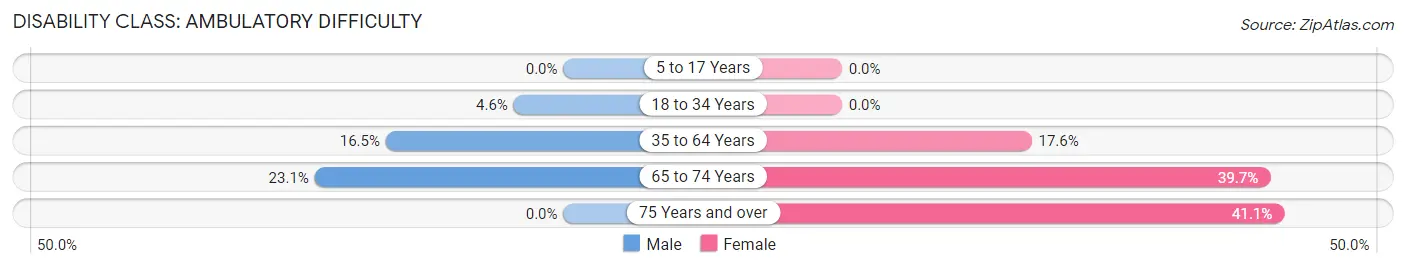
| Age Bracket | Male | Female |
| 5 to 17 Years | 0 (0.0%) | 0 (0.0%) |
| 18 to 34 Years | 22 (4.6%) | 0 (0.0%) |
| 35 to 64 Years | 116 (16.5%) | 152 (17.6%) |
| 65 to 74 Years | 12 (23.1%) | 60 (39.7%) |
| 75 Years and over | 0 (0.0%) | 78 (41.0%) |
Disability Class: Self-Care Difficulty
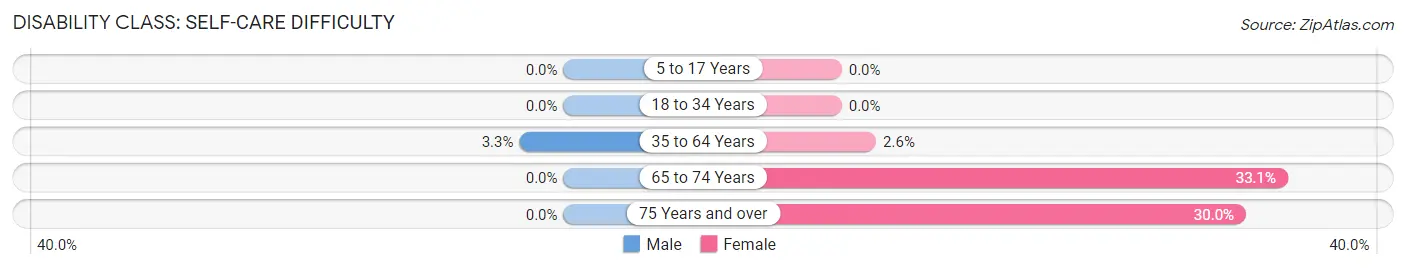
| Age Bracket | Male | Female |
| 5 to 17 Years | 0 (0.0%) | 0 (0.0%) |
| 18 to 34 Years | 0 (0.0%) | 0 (0.0%) |
| 35 to 64 Years | 23 (3.3%) | 22 (2.5%) |
| 65 to 74 Years | 0 (0.0%) | 50 (33.1%) |
| 75 Years and over | 0 (0.0%) | 57 (30.0%) |
Technology Access in Mount Orab
Computing Device Access in Mount Orab
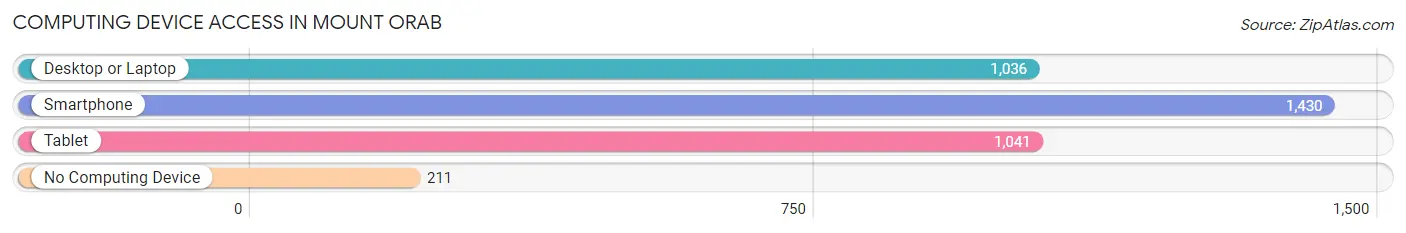
| Device Type | # Households | % Households |
| Desktop or Laptop | 1,036 | 59.4% |
| Smartphone | 1,430 | 82.0% |
| Tablet | 1,041 | 59.7% |
| No Computing Device | 211 | 12.1% |
| Total | 1,744 | 100.0% |
Internet Access in Mount Orab
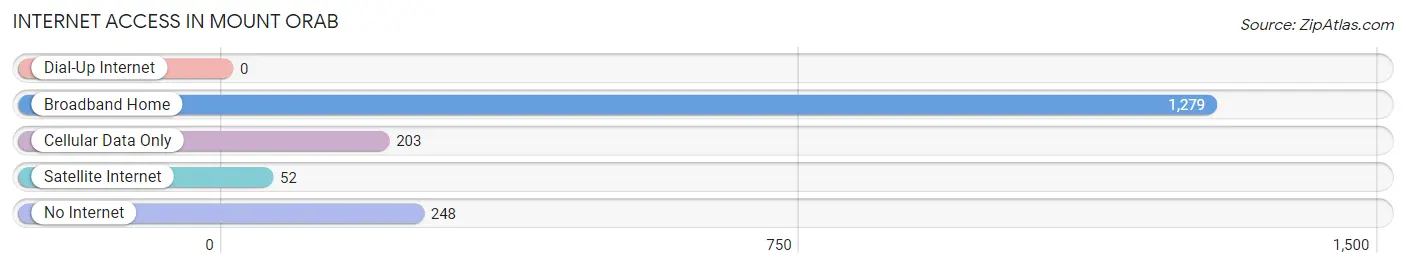
| Internet Type | # Households | % Households |
| Dial-Up Internet | 0 | 0.0% |
| Broadband Home | 1,279 | 73.3% |
| Cellular Data Only | 203 | 11.6% |
| Satellite Internet | 52 | 3.0% |
| No Internet | 248 | 14.2% |
| Total | 1,744 | 100.0% |
Mount Orab Summary
Mount Orab is a small village located in Brown County, Ohio. It is situated in the southwestern part of the state, approximately 40 miles east of Cincinnati. The village is home to a population of approximately 2,000 people, and is part of the larger Brown County area.
History
Mount Orab was founded in 1817 by a group of settlers from Virginia. The village was named after a nearby mountain, which was named after a local Native American chief. The village was originally a farming community, and the first post office was established in 1820.
In the late 19th century, the village began to grow and develop. The railroad arrived in 1881, and the village was incorporated in 1883. The village was home to several businesses, including a flour mill, a sawmill, and a brickyard.
Geography
Mount Orab is located in the southwestern part of Ohio, approximately 40 miles east of Cincinnati. The village is situated in the foothills of the Appalachian Mountains, and is surrounded by rolling hills and forests. The village is located on the banks of the Little Miami River, and is part of the larger Brown County area.
The village has a total area of 1.3 square miles, all of which is land. The village is located at an elevation of 890 feet above sea level.
Economy
The economy of Mount Orab is largely based on agriculture and tourism. The village is home to several farms, which produce a variety of crops, including corn, soybeans, and wheat. The village is also home to several small businesses, including restaurants, shops, and a local newspaper.
Tourism is an important part of the local economy. The village is home to several attractions, including the Little Miami Scenic Trail, which is a popular destination for hikers and cyclists. The village is also home to several historic sites, including the Mount Orab Historic District, which is listed on the National Register of Historic Places.
Demographics
As of the 2010 census, the population of Mount Orab was 2,000. The racial makeup of the village was 97.2% White, 0.7% African American, 0.2% Native American, 0.2% Asian, 0.2% from other races, and 1.7% from two or more races. Hispanic or Latino of any race were 0.7% of the population.
The median household income in Mount Orab was $41,250, and the median family income was $50,000. The per capita income for the village was $20,845. About 11.2% of families and 14.2% of the population were below the poverty line, including 18.2% of those under age 18 and 8.3% of those age 65 or over.
Mount Orab is a small village with a rich history and a vibrant economy. The village is home to a diverse population, and is a popular destination for tourists and outdoor enthusiasts. The village is a great place to live, work, and play, and is a great example of small-town Ohio life.
Common Questions
What is Per Capita Income in Mount Orab?
Per Capita income in Mount Orab is $27,041.
What is the Median Family Income in Mount Orab?
Median Family Income in Mount Orab is $84,105.
What is the Median Household income in Mount Orab?
Median Household Income in Mount Orab is $62,833.
What is Income or Wage Gap in Mount Orab?
Income or Wage Gap in Mount Orab is 41.2%.
Women in Mount Orab earn 58.8 cents for every dollar earned by a man.
What is Inequality or Gini Index in Mount Orab?
Inequality or Gini Index in Mount Orab is 0.42.
What is the Total Population of Mount Orab?
Total Population of Mount Orab is 4,544.
What is the Total Male Population of Mount Orab?
Total Male Population of Mount Orab is 2,265.
What is the Total Female Population of Mount Orab?
Total Female Population of Mount Orab is 2,279.
What is the Ratio of Males per 100 Females in Mount Orab?
There are 99.39 Males per 100 Females in Mount Orab.
What is the Ratio of Females per 100 Males in Mount Orab?
There are 100.62 Females per 100 Males in Mount Orab.
What is the Median Population Age in Mount Orab?
Median Population Age in Mount Orab is 30.4 Years.
What is the Average Family Size in Mount Orab
Average Family Size in Mount Orab is 3.2 People.
What is the Average Household Size in Mount Orab
Average Household Size in Mount Orab is 2.6 People.
How Large is the Labor Force in Mount Orab?
There are 2,038 People in the Labor Forcein in Mount Orab.
What is the Percentage of People in the Labor Force in Mount Orab?
64.6% of People are in the Labor Force in Mount Orab.
What is the Unemployment Rate in Mount Orab?
Unemployment Rate in Mount Orab is 7.0%.