Mingo Junction, OH Map & Demographics
Mingo Junction Map
Mingo Junction Overview
$29,148
PER CAPITA INCOME
$67,784
AVG FAMILY INCOME
$58,141
AVG HOUSEHOLD INCOME
49.7%
WAGE / INCOME GAP [ % ]
50.3¢/ $1
WAGE / INCOME GAP [ $ ]
0.42
INEQUALITY / GINI INDEX
3,565
TOTAL POPULATION
1,777
MALE POPULATION
1,788
FEMALE POPULATION
99.38
MALES / 100 FEMALES
100.62
FEMALES / 100 MALES
41.2
MEDIAN AGE
2.8
AVG FAMILY SIZE
2.4
AVG HOUSEHOLD SIZE
1,808
LABOR FORCE [ PEOPLE ]
60.2%
PERCENT IN LABOR FORCE
4.5%
UNEMPLOYMENT RATE
Mingo Junction Zip Codes
Mingo Junction Area Codes
Income in Mingo Junction
Income Overview in Mingo Junction
Per Capita Income in Mingo Junction is $29,148, while median incomes of families and households are $67,784 and $58,141 respectively.
| Characteristic | Number | Measure |
| Per Capita Income | 3,565 | $29,148 |
| Median Family Income | 1,058 | $67,784 |
| Mean Family Income | 1,058 | $71,637 |
| Median Household Income | 1,468 | $58,141 |
| Mean Household Income | 1,468 | $69,178 |
| Income Deficit | 1,058 | $0 |
| Wage / Income Gap (%) | 3,565 | 49.66% |
| Wage / Income Gap ($) | 3,565 | 50.34¢ per $1 |
| Gini / Inequality Index | 3,565 | 0.42 |
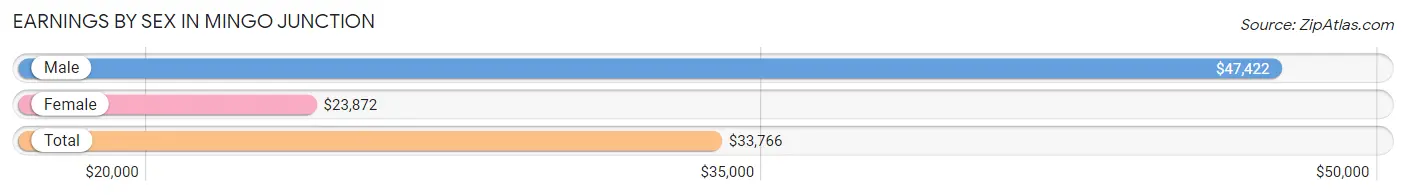
Earnings by Sex in Mingo Junction
Average Earnings in Mingo Junction are $33,766, $47,422 for men and $23,872 for women, a difference of 49.7%.
| Sex | Number | Average Earnings |
| Male | 915 (49.4%) | $47,422 |
| Female | 937 (50.6%) | $23,872 |
| Total | 1,852 (100.0%) | $33,766 |
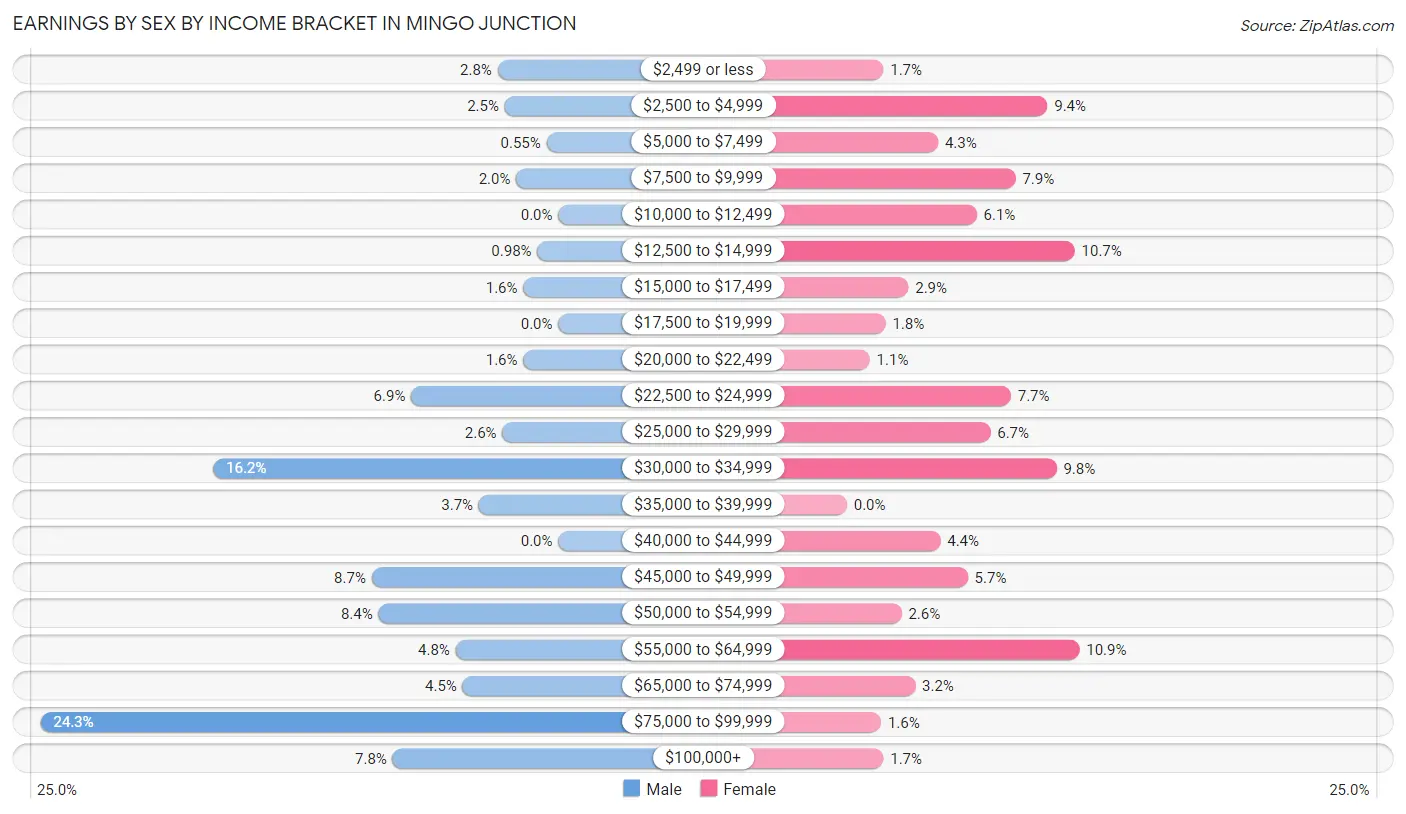
Earnings by Sex by Income Bracket in Mingo Junction
The most common earnings brackets in Mingo Junction are $75,000 to $99,999 for men (222 | 24.3%) and $55,000 to $64,999 for women (102 | 10.9%).
| Income | Male | Female |
| $2,499 or less | 26 (2.8%) | 16 (1.7%) |
| $2,500 to $4,999 | 23 (2.5%) | 88 (9.4%) |
| $5,000 to $7,499 | 5 (0.5%) | 40 (4.3%) |
| $7,500 to $9,999 | 18 (2.0%) | 74 (7.9%) |
| $10,000 to $12,499 | 0 (0.0%) | 57 (6.1%) |
| $12,500 to $14,999 | 9 (1.0%) | 100 (10.7%) |
| $15,000 to $17,499 | 15 (1.6%) | 27 (2.9%) |
| $17,500 to $19,999 | 0 (0.0%) | 17 (1.8%) |
| $20,000 to $22,499 | 15 (1.6%) | 10 (1.1%) |
| $22,500 to $24,999 | 63 (6.9%) | 72 (7.7%) |
| $25,000 to $29,999 | 24 (2.6%) | 63 (6.7%) |
| $30,000 to $34,999 | 148 (16.2%) | 92 (9.8%) |
| $35,000 to $39,999 | 34 (3.7%) | 0 (0.0%) |
| $40,000 to $44,999 | 0 (0.0%) | 41 (4.4%) |
| $45,000 to $49,999 | 80 (8.7%) | 53 (5.7%) |
| $50,000 to $54,999 | 77 (8.4%) | 24 (2.6%) |
| $55,000 to $64,999 | 44 (4.8%) | 102 (10.9%) |
| $65,000 to $74,999 | 41 (4.5%) | 30 (3.2%) |
| $75,000 to $99,999 | 222 (24.3%) | 15 (1.6%) |
| $100,000+ | 71 (7.8%) | 16 (1.7%) |
| Total | 915 (100.0%) | 937 (100.0%) |
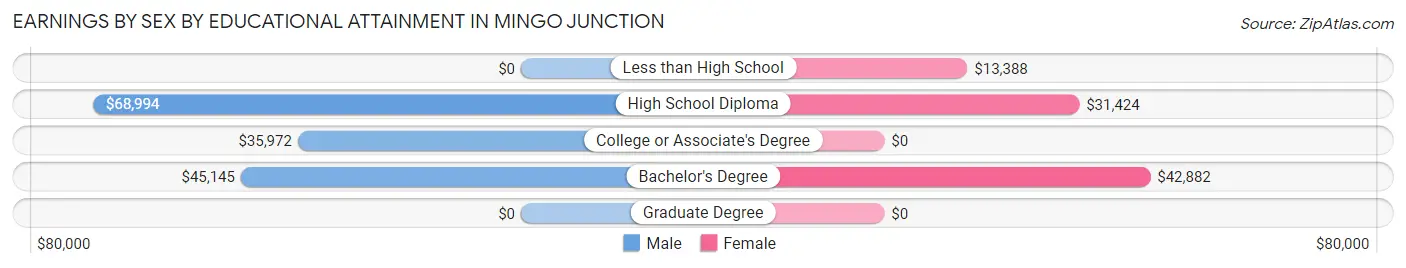
Earnings by Sex by Educational Attainment in Mingo Junction
Average earnings in Mingo Junction are $50,980 for men and $30,436 for women, a difference of 40.3%. Men with an educational attainment of high school diploma enjoy the highest average annual earnings of $68,994, while those with college or associate's degree education earn the least with $35,972. Women with an educational attainment of bachelor's degree earn the most with the average annual earnings of $42,882, while those with less than high school education have the smallest earnings of $13,388.
| Educational Attainment | Male Income | Female Income |
| Less than High School | - | - |
| High School Diploma | $68,994 | $31,424 |
| College or Associate's Degree | $35,972 | $0 |
| Bachelor's Degree | $45,145 | $42,882 |
| Graduate Degree | - | - |
| Total | $50,980 | $30,436 |
Family Income in Mingo Junction
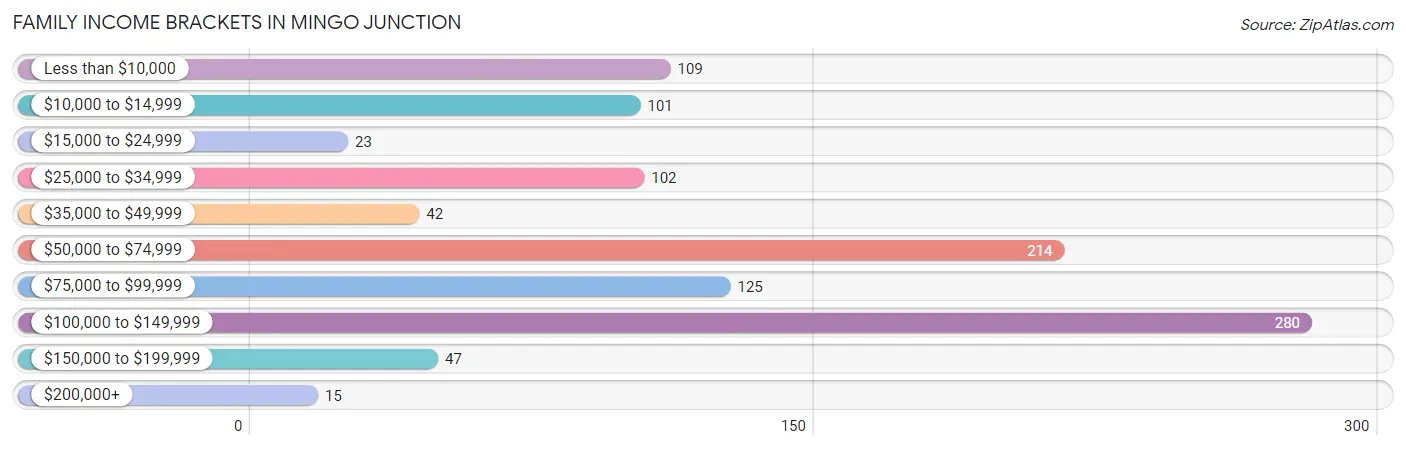
Family Income Brackets in Mingo Junction
According to the Mingo Junction family income data, there are 280 families falling into the $100,000 to $149,999 income range, which is the most common income bracket and makes up 26.5% of all families. Conversely, the $200,000+ income bracket is the least frequent group with only 15 families (1.4%) belonging to this category.
| Income Bracket | # Families | % Families |
| Less than $10,000 | 109 | 10.3% |
| $10,000 to $14,999 | 101 | 9.5% |
| $15,000 to $24,999 | 23 | 2.2% |
| $25,000 to $34,999 | 102 | 9.6% |
| $35,000 to $49,999 | 42 | 4.0% |
| $50,000 to $74,999 | 214 | 20.2% |
| $75,000 to $99,999 | 125 | 11.8% |
| $100,000 to $149,999 | 280 | 26.5% |
| $150,000 to $199,999 | 47 | 4.4% |
| $200,000+ | 15 | 1.4% |
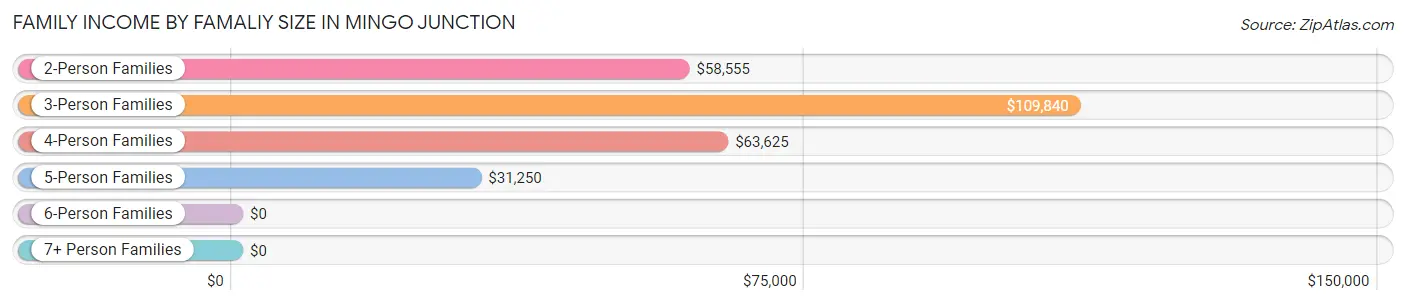
Family Income by Famaliy Size in Mingo Junction
3-person families (221 | 20.9%) account for the highest median family income in Mingo Junction with $109,840 per family, while 3-person families (221 | 20.9%) have the highest median income of $36,613 per family member.
| Income Bracket | # Families | Median Income |
| 2-Person Families | 599 (56.6%) | $58,555 |
| 3-Person Families | 221 (20.9%) | $109,840 |
| 4-Person Families | 173 (16.4%) | $63,625 |
| 5-Person Families | 65 (6.1%) | $31,250 |
| 6-Person Families | 0 (0.0%) | $0 |
| 7+ Person Families | 0 (0.0%) | $0 |
| Total | 1,058 (100.0%) | $67,784 |
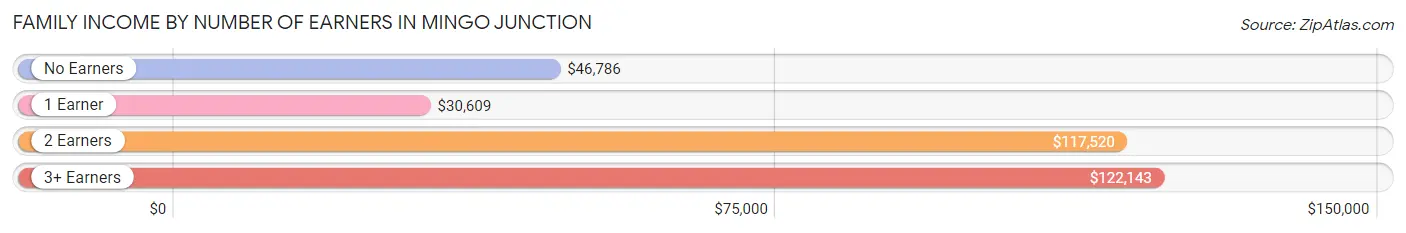
Family Income by Number of Earners in Mingo Junction
The median family income in Mingo Junction is $67,784, with families comprising 3+ earners (72) having the highest median family income of $122,143, while families with 1 earner (441) have the lowest median family income of $30,609, accounting for 6.8% and 41.7% of families, respectively.
| Number of Earners | # Families | Median Income |
| No Earners | 192 (18.1%) | $46,786 |
| 1 Earner | 441 (41.7%) | $30,609 |
| 2 Earners | 353 (33.4%) | $117,520 |
| 3+ Earners | 72 (6.8%) | $122,143 |
| Total | 1,058 (100.0%) | $67,784 |
Household Income in Mingo Junction
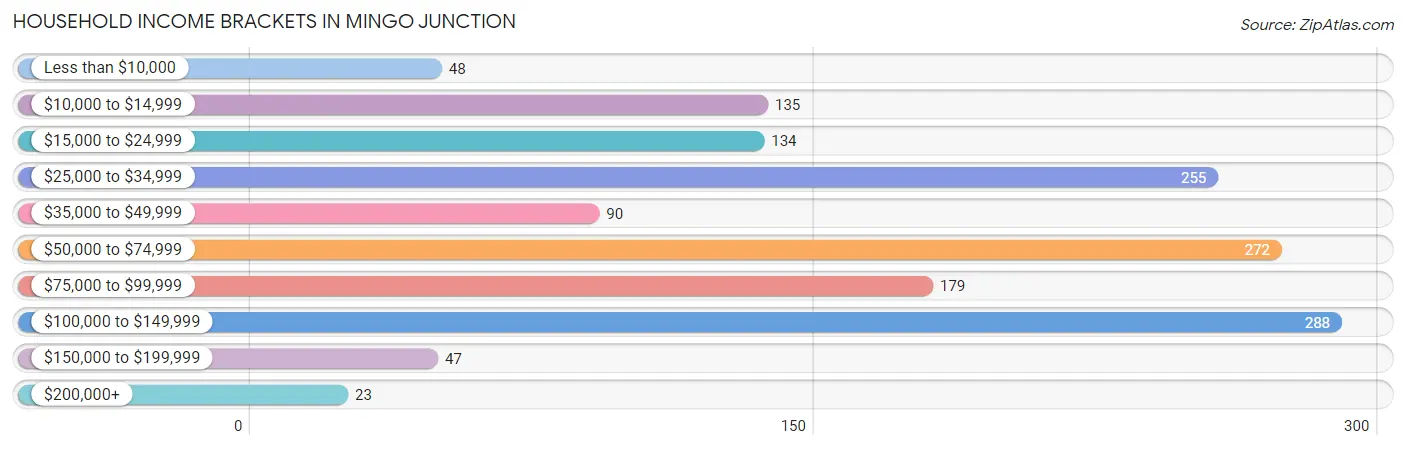
Household Income Brackets in Mingo Junction
With 288 households falling in the category, the $100,000 to $149,999 income range is the most frequent in Mingo Junction, accounting for 19.6% of all households. In contrast, only 23 households (1.6%) fall into the $200,000+ income bracket, making it the least populous group.
| Income Bracket | # Households | % Households |
| Less than $10,000 | 48 | 3.3% |
| $10,000 to $14,999 | 135 | 9.2% |
| $15,000 to $24,999 | 134 | 9.1% |
| $25,000 to $34,999 | 255 | 17.4% |
| $35,000 to $49,999 | 90 | 6.1% |
| $50,000 to $74,999 | 272 | 18.5% |
| $75,000 to $99,999 | 179 | 12.2% |
| $100,000 to $149,999 | 288 | 19.6% |
| $150,000 to $199,999 | 47 | 3.2% |
| $200,000+ | 23 | 1.6% |
Household Income by Householder Age in Mingo Junction
The median household income in Mingo Junction is $58,141, with the highest median household income of $84,018 found in the 45 to 64 years age bracket for the primary householder. A total of 481 households (32.8%) fall into this category. Meanwhile, the 15 to 24 years age bracket for the primary householder has the lowest median household income of $0, with 44 households (3.0%) in this group.
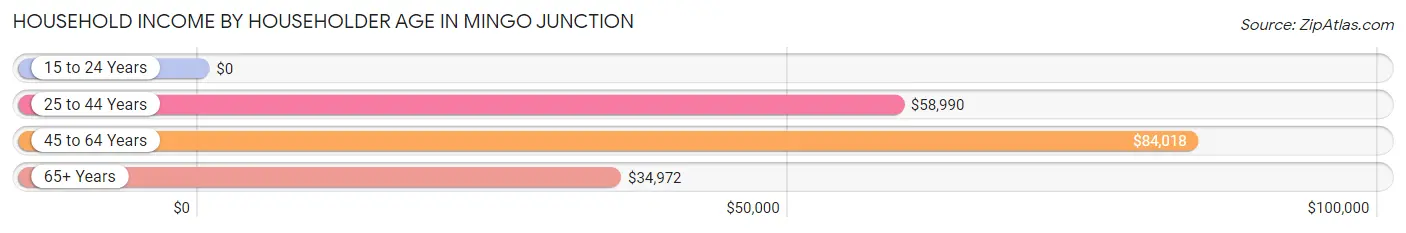
| Income Bracket | # Households | Median Income |
| 15 to 24 Years | 44 (3.0%) | $0 |
| 25 to 44 Years | 465 (31.7%) | $58,990 |
| 45 to 64 Years | 481 (32.8%) | $84,018 |
| 65+ Years | 478 (32.6%) | $34,972 |
| Total | 1,468 (100.0%) | $58,141 |
Poverty in Mingo Junction
Income Below Poverty by Sex and Age in Mingo Junction
With 18.4% poverty level for males and 30.4% for females among the residents of Mingo Junction, 5 year old males and 12 to 14 year old females are the most vulnerable to poverty, with 6 males (100.0%) and 147 females (100.0%) in their respective age groups living below the poverty level.
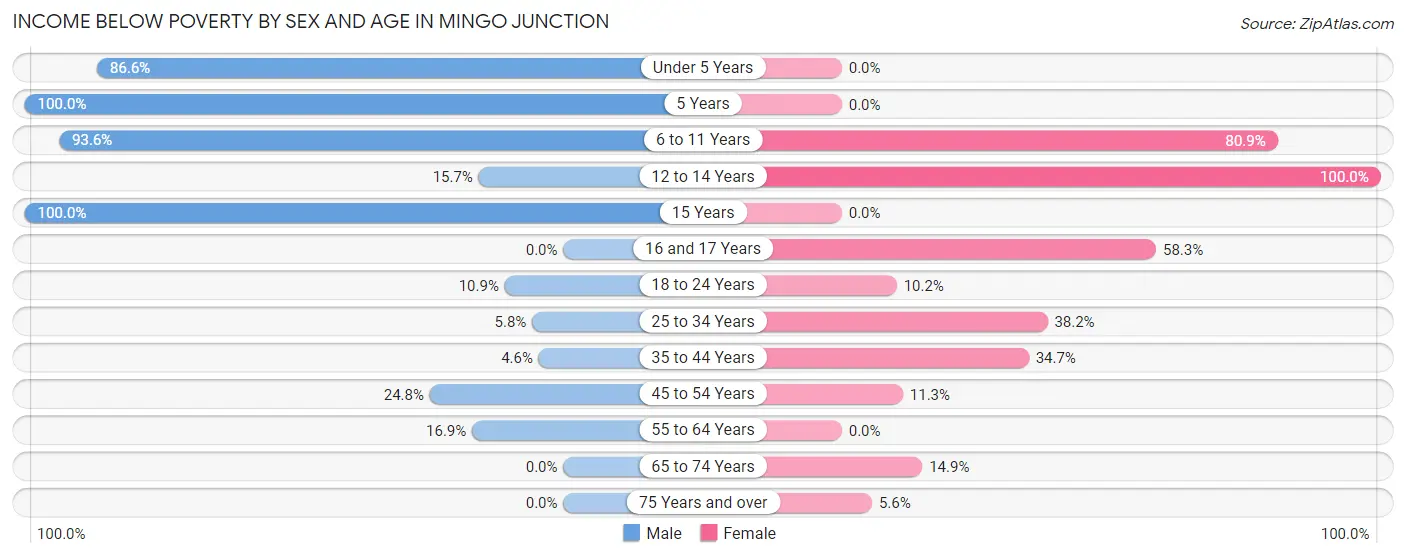
| Age Bracket | Male | Female |
| Under 5 Years | 58 (86.6%) | 0 (0.0%) |
| 5 Years | 6 (100.0%) | 0 (0.0%) |
| 6 to 11 Years | 88 (93.6%) | 93 (80.9%) |
| 12 to 14 Years | 11 (15.7%) | 147 (100.0%) |
| 15 Years | 20 (100.0%) | 0 (0.0%) |
| 16 and 17 Years | 0 (0.0%) | 35 (58.3%) |
| 18 to 24 Years | 16 (10.9%) | 21 (10.2%) |
| 25 to 34 Years | 18 (5.8%) | 71 (38.2%) |
| 35 to 44 Years | 9 (4.5%) | 119 (34.7%) |
| 45 to 54 Years | 60 (24.8%) | 17 (11.3%) |
| 55 to 64 Years | 41 (16.9%) | 0 (0.0%) |
| 65 to 74 Years | 0 (0.0%) | 33 (14.9%) |
| 75 Years and over | 0 (0.0%) | 7 (5.6%) |
| Total | 327 (18.4%) | 543 (30.4%) |
Income Above Poverty by Sex and Age in Mingo Junction
According to the poverty statistics in Mingo Junction, males aged 16 and 17 years and females aged under 5 years are the age groups that are most secure financially, with 100.0% of males and 100.0% of females in these age groups living above the poverty line.
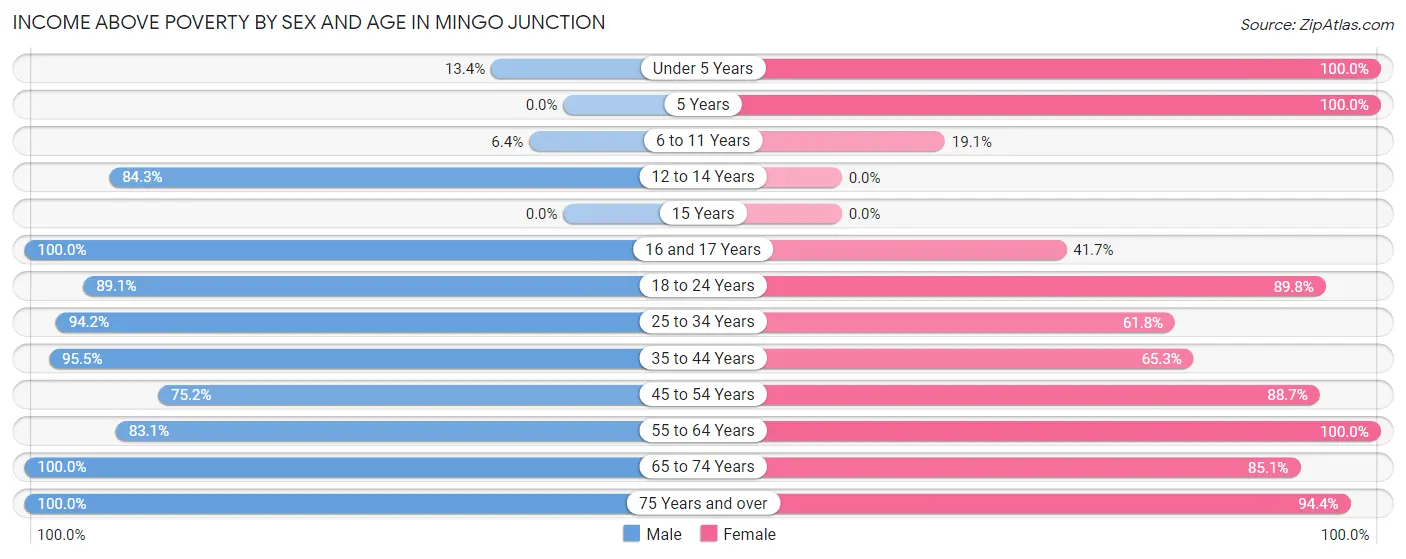
| Age Bracket | Male | Female |
| Under 5 Years | 9 (13.4%) | 23 (100.0%) |
| 5 Years | 0 (0.0%) | 19 (100.0%) |
| 6 to 11 Years | 6 (6.4%) | 22 (19.1%) |
| 12 to 14 Years | 59 (84.3%) | 0 (0.0%) |
| 15 Years | 0 (0.0%) | 0 (0.0%) |
| 16 and 17 Years | 37 (100.0%) | 25 (41.7%) |
| 18 to 24 Years | 131 (89.1%) | 185 (89.8%) |
| 25 to 34 Years | 293 (94.2%) | 115 (61.8%) |
| 35 to 44 Years | 189 (95.5%) | 224 (65.3%) |
| 45 to 54 Years | 182 (75.2%) | 133 (88.7%) |
| 55 to 64 Years | 201 (83.1%) | 193 (100.0%) |
| 65 to 74 Years | 210 (100.0%) | 188 (85.1%) |
| 75 Years and over | 133 (100.0%) | 118 (94.4%) |
| Total | 1,450 (81.6%) | 1,245 (69.6%) |
Income Below Poverty Among Married-Couple Families in Mingo Junction
The poverty statistics for married-couple families in Mingo Junction show that 7.9% or 57 of the total 719 families live below the poverty line. Families with 3 or 4 children have the highest poverty rate of 100.0%, comprising of 13 families. On the other hand, families with no children have the lowest poverty rate of 0.0%, which includes 0 families.
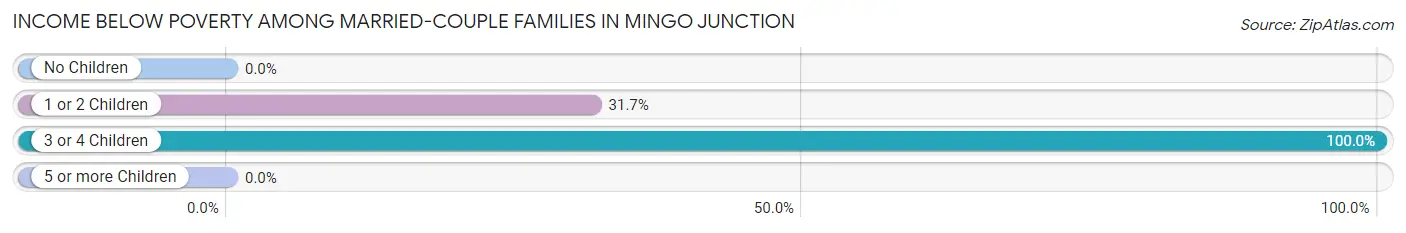
| Children | Above Poverty | Below Poverty |
| No Children | 567 (100.0%) | 0 (0.0%) |
| 1 or 2 Children | 95 (68.3%) | 44 (31.7%) |
| 3 or 4 Children | 0 (0.0%) | 13 (100.0%) |
| 5 or more Children | 0 (0.0%) | 0 (0.0%) |
| Total | 662 (92.1%) | 57 (7.9%) |
Income Below Poverty Among Single-Parent Households in Mingo Junction
According to the poverty data in Mingo Junction, 88.1% or 59 single-father households and 57.4% or 156 single-mother households are living below the poverty line. Among single-father households, those with 3 or 4 children have the highest poverty rate, with 18 households (100.0%) experiencing poverty. Likewise, among single-mother households, those with 3 or 4 children have the highest poverty rate, with 39 households (100.0%) falling below the poverty line.
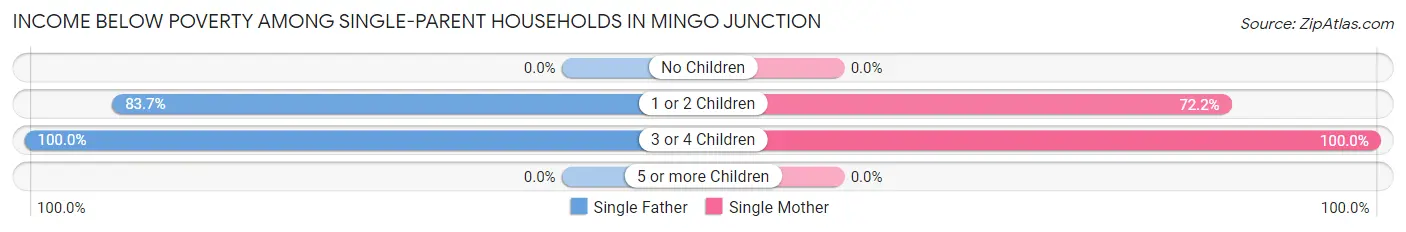
| Children | Single Father | Single Mother |
| No Children | 0 (0.0%) | 0 (0.0%) |
| 1 or 2 Children | 41 (83.7%) | 117 (72.2%) |
| 3 or 4 Children | 18 (100.0%) | 39 (100.0%) |
| 5 or more Children | 0 (0.0%) | 0 (0.0%) |
| Total | 59 (88.1%) | 156 (57.4%) |
Income Below Poverty Among Married-Couple vs Single-Parent Households in Mingo Junction
The poverty data for Mingo Junction shows that 57 of the married-couple family households (7.9%) and 215 of the single-parent households (63.4%) are living below the poverty level. Within the married-couple family households, those with 3 or 4 children have the highest poverty rate, with 13 households (100.0%) falling below the poverty line. Among the single-parent households, those with 3 or 4 children have the highest poverty rate, with 57 household (100.0%) living below poverty.
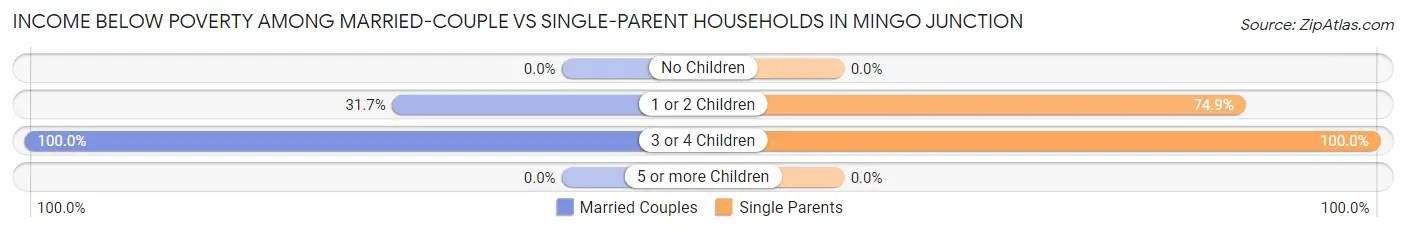
| Children | Married-Couple Families | Single-Parent Households |
| No Children | 0 (0.0%) | 0 (0.0%) |
| 1 or 2 Children | 44 (31.7%) | 158 (74.9%) |
| 3 or 4 Children | 13 (100.0%) | 57 (100.0%) |
| 5 or more Children | 0 (0.0%) | 0 (0.0%) |
| Total | 57 (7.9%) | 215 (63.4%) |
Race in Mingo Junction
The most populous races in Mingo Junction are White / Caucasian (3,406 | 95.5%), Two or more Races (149 | 4.2%), and Black / African American (9 | 0.3%).
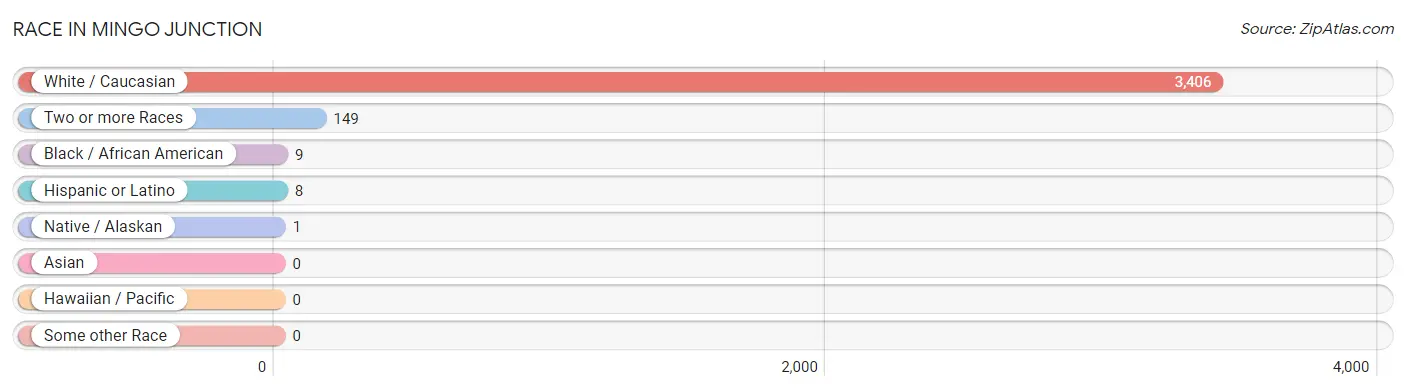
| Race | # Population | % Population |
| Asian | 0 | 0.0% |
| Black / African American | 9 | 0.3% |
| Hawaiian / Pacific | 0 | 0.0% |
| Hispanic or Latino | 8 | 0.2% |
| Native / Alaskan | 1 | 0.0% |
| White / Caucasian | 3,406 | 95.5% |
| Two or more Races | 149 | 4.2% |
| Some other Race | 0 | 0.0% |
| Total | 3,565 | 100.0% |
Ancestry in Mingo Junction
The most populous ancestries reported in Mingo Junction are Irish (711 | 19.9%), Italian (387 | 10.9%), English (360 | 10.1%), German (335 | 9.4%), and Polish (122 | 3.4%), together accounting for 53.7% of all Mingo Junction residents.
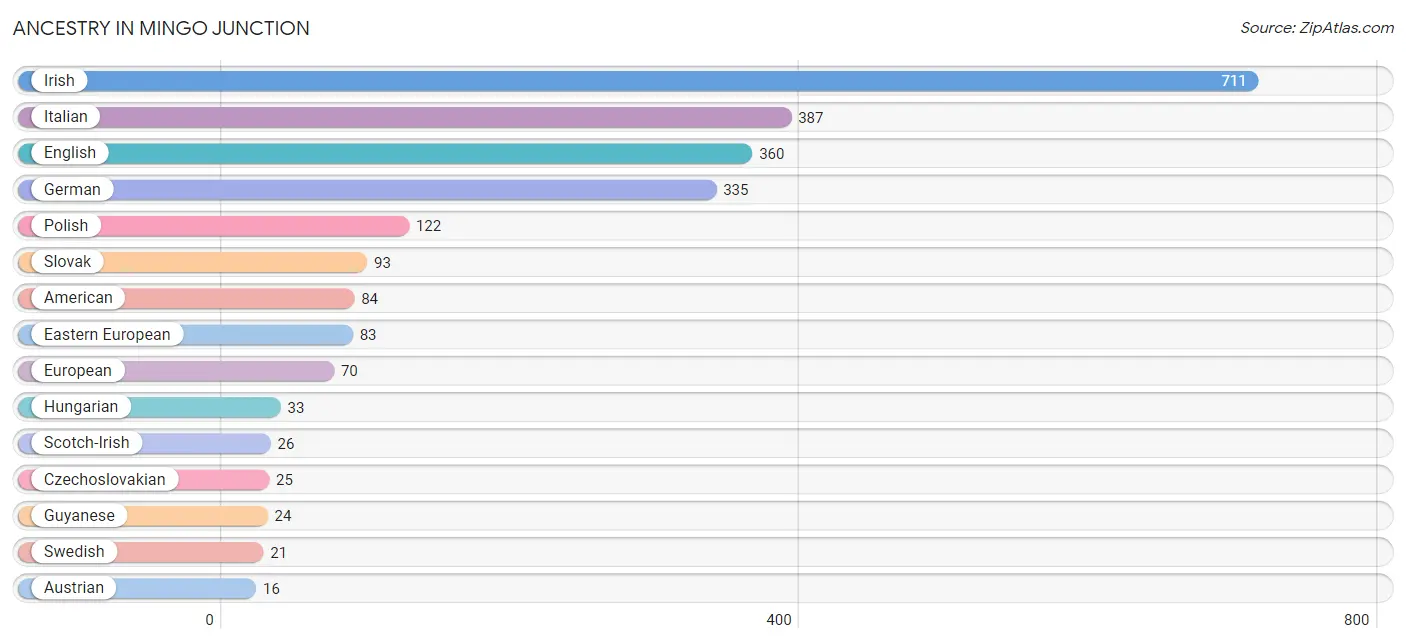
| Ancestry | # Population | % Population |
| American | 84 | 2.4% |
| Austrian | 16 | 0.4% |
| Bulgarian | 14 | 0.4% |
| Burmese | 13 | 0.4% |
| Cherokee | 4 | 0.1% |
| Czechoslovakian | 25 | 0.7% |
| Dutch | 15 | 0.4% |
| Eastern European | 83 | 2.3% |
| English | 360 | 10.1% |
| European | 70 | 2.0% |
| German | 335 | 9.4% |
| Guyanese | 24 | 0.7% |
| Hungarian | 33 | 0.9% |
| Irish | 711 | 19.9% |
| Italian | 387 | 10.9% |
| Mexican | 7 | 0.2% |
| Polish | 122 | 3.4% |
| Russian | 13 | 0.4% |
| Scotch-Irish | 26 | 0.7% |
| Serbian | 6 | 0.2% |
| Slovak | 93 | 2.6% |
| Spaniard | 1 | 0.0% |
| Swedish | 21 | 0.6% |
| Yaqui | 1 | 0.0% | View All 24 Rows |
Immigrants in Mingo Junction
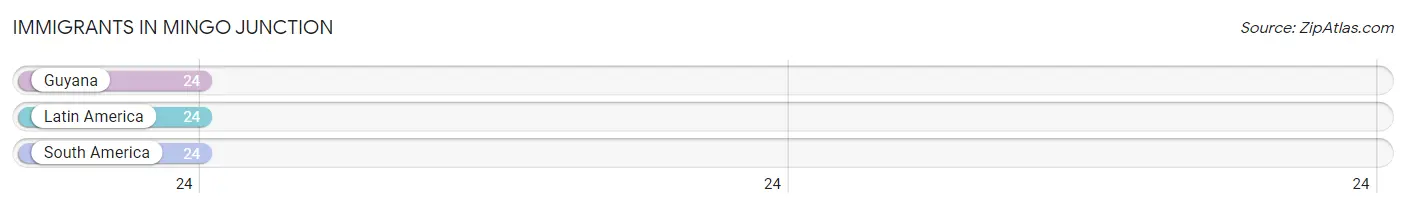
The most numerous immigrant groups reported in Mingo Junction came from Guyana (24 | 0.7%), Latin America (24 | 0.7%), and South America (24 | 0.7%), together accounting for 2.0% of all Mingo Junction residents.
| Immigration Origin | # Population | % Population |
| Guyana | 24 | 0.7% |
| Latin America | 24 | 0.7% |
| South America | 24 | 0.7% | View All 3 Rows |
Sex and Age in Mingo Junction
Sex and Age in Mingo Junction
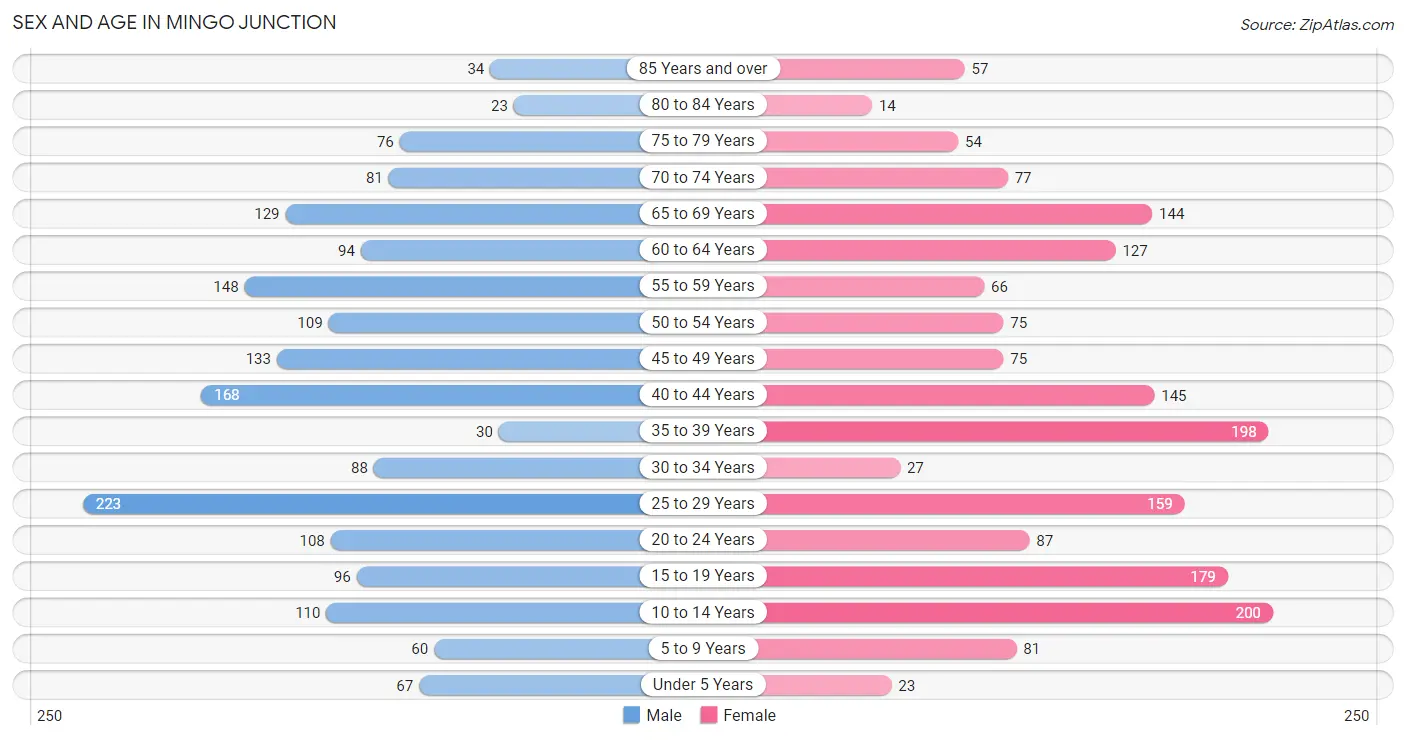
The most populous age groups in Mingo Junction are 25 to 29 Years (223 | 12.6%) for men and 10 to 14 Years (200 | 11.2%) for women.
| Age Bracket | Male | Female |
| Under 5 Years | 67 (3.8%) | 23 (1.3%) |
| 5 to 9 Years | 60 (3.4%) | 81 (4.5%) |
| 10 to 14 Years | 110 (6.2%) | 200 (11.2%) |
| 15 to 19 Years | 96 (5.4%) | 179 (10.0%) |
| 20 to 24 Years | 108 (6.1%) | 87 (4.9%) |
| 25 to 29 Years | 223 (12.6%) | 159 (8.9%) |
| 30 to 34 Years | 88 (5.0%) | 27 (1.5%) |
| 35 to 39 Years | 30 (1.7%) | 198 (11.1%) |
| 40 to 44 Years | 168 (9.5%) | 145 (8.1%) |
| 45 to 49 Years | 133 (7.5%) | 75 (4.2%) |
| 50 to 54 Years | 109 (6.1%) | 75 (4.2%) |
| 55 to 59 Years | 148 (8.3%) | 66 (3.7%) |
| 60 to 64 Years | 94 (5.3%) | 127 (7.1%) |
| 65 to 69 Years | 129 (7.3%) | 144 (8.1%) |
| 70 to 74 Years | 81 (4.6%) | 77 (4.3%) |
| 75 to 79 Years | 76 (4.3%) | 54 (3.0%) |
| 80 to 84 Years | 23 (1.3%) | 14 (0.8%) |
| 85 Years and over | 34 (1.9%) | 57 (3.2%) |
| Total | 1,777 (100.0%) | 1,788 (100.0%) |
Families and Households in Mingo Junction
Median Family Size in Mingo Junction
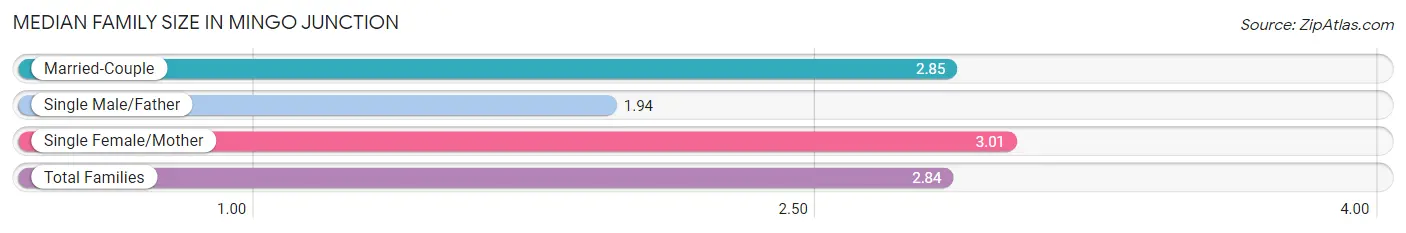
The median family size in Mingo Junction is 2.84 persons per family, with single female/mother families (272 | 25.7%) accounting for the largest median family size of 3.01 persons per family. On the other hand, single male/father families (67 | 6.3%) represent the smallest median family size with 1.94 persons per family.
| Family Type | # Families | Family Size |
| Married-Couple | 719 (68.0%) | 2.85 |
| Single Male/Father | 67 (6.3%) | 1.94 |
| Single Female/Mother | 272 (25.7%) | 3.01 |
| Total Families | 1,058 (100.0%) | 2.84 |
Median Household Size in Mingo Junction
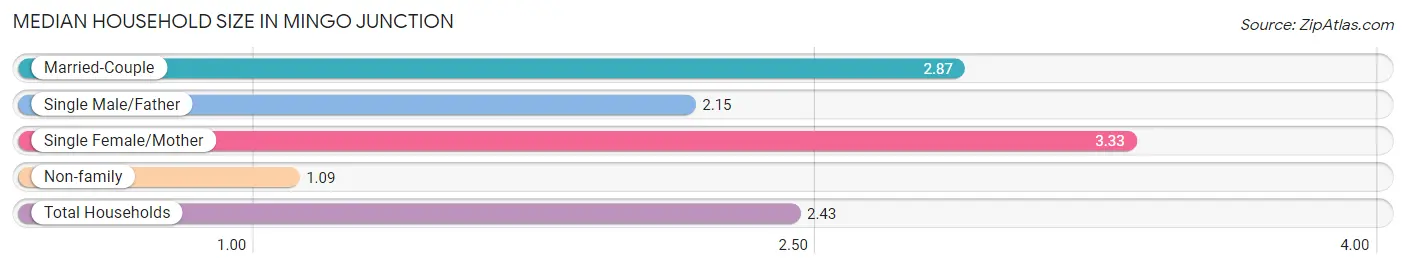
The median household size in Mingo Junction is 2.43 persons per household, with single female/mother households (272 | 18.5%) accounting for the largest median household size of 3.33 persons per household. non-family households (410 | 27.9%) represent the smallest median household size with 1.09 persons per household.
| Household Type | # Households | Household Size |
| Married-Couple | 719 (49.0%) | 2.87 |
| Single Male/Father | 67 (4.6%) | 2.15 |
| Single Female/Mother | 272 (18.5%) | 3.33 |
| Non-family | 410 (27.9%) | 1.09 |
| Total Households | 1,468 (100.0%) | 2.43 |
Household Size by Marriage Status in Mingo Junction
Out of a total of 1,468 households in Mingo Junction, 1,058 (72.1%) are family households, while 410 (27.9%) are nonfamily households. The most numerous type of family households are 2-person households, comprising 542, and the most common type of nonfamily households are 1-person households, comprising 370.
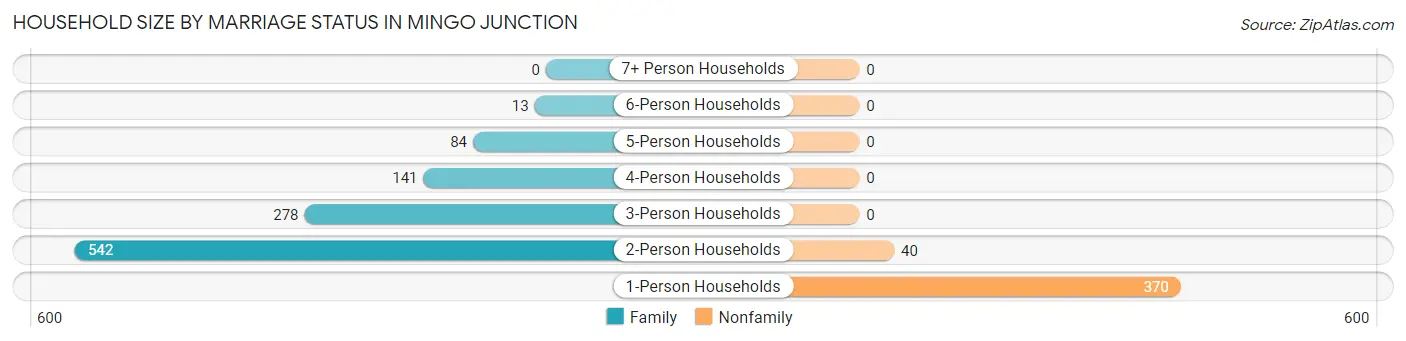
| Household Size | Family Households | Nonfamily Households |
| 1-Person Households | - | 370 (25.2%) |
| 2-Person Households | 542 (36.9%) | 40 (2.7%) |
| 3-Person Households | 278 (18.9%) | 0 (0.0%) |
| 4-Person Households | 141 (9.6%) | 0 (0.0%) |
| 5-Person Households | 84 (5.7%) | 0 (0.0%) |
| 6-Person Households | 13 (0.9%) | 0 (0.0%) |
| 7+ Person Households | 0 (0.0%) | 0 (0.0%) |
| Total | 1,058 (72.1%) | 410 (27.9%) |
Female Fertility in Mingo Junction
Fertility by Age in Mingo Junction
Average fertility rate in Mingo Junction is 76.0 births per 1,000 women. Women in the age bracket of 20 to 34 years have the highest fertility rate with 158.0 births per 1,000 women. Women in the age bracket of 20 to 34 years acount for 65.1% of all women with births.
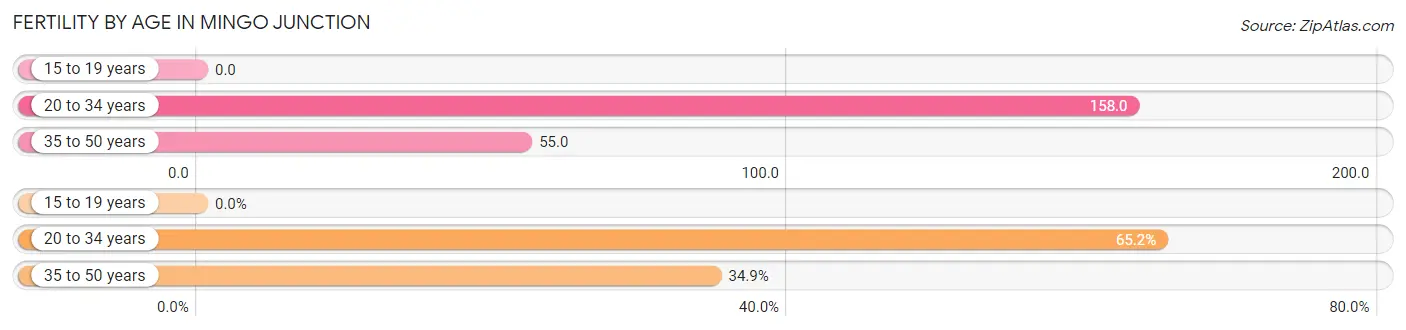
| Age Bracket | Women with Births | Births / 1,000 Women |
| 15 to 19 years | 0 (0.0%) | 0.0 |
| 20 to 34 years | 43 (65.1%) | 158.0 |
| 35 to 50 years | 23 (34.8%) | 55.0 |
| Total | 66 (100.0%) | 76.0 |
Fertility by Age by Marriage Status in Mingo Junction
34.8% of women with births (66) in Mingo Junction are married. The highest percentage of unmarried women with births falls into 20 to 34 years age bracket with 100.0% of them unmarried at the time of birth, while the lowest percentage of unmarried women with births belong to 35 to 50 years age bracket with 0.0% of them unmarried.
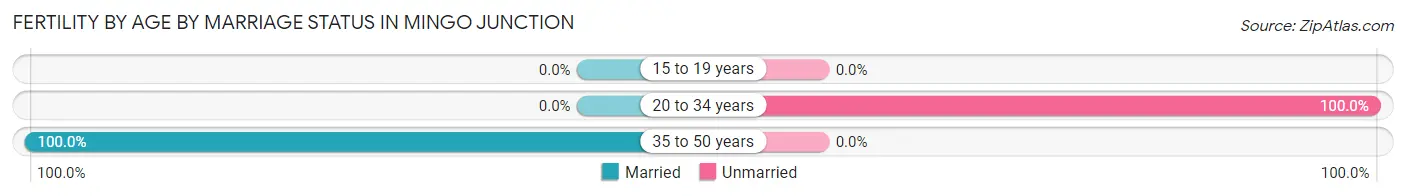
| Age Bracket | Married | Unmarried |
| 15 to 19 years | 0 (0.0%) | 0 (0.0%) |
| 20 to 34 years | 0 (0.0%) | 43 (100.0%) |
| 35 to 50 years | 23 (100.0%) | 0 (0.0%) |
| Total | 23 (34.8%) | 43 (65.1%) |
Fertility by Education in Mingo Junction
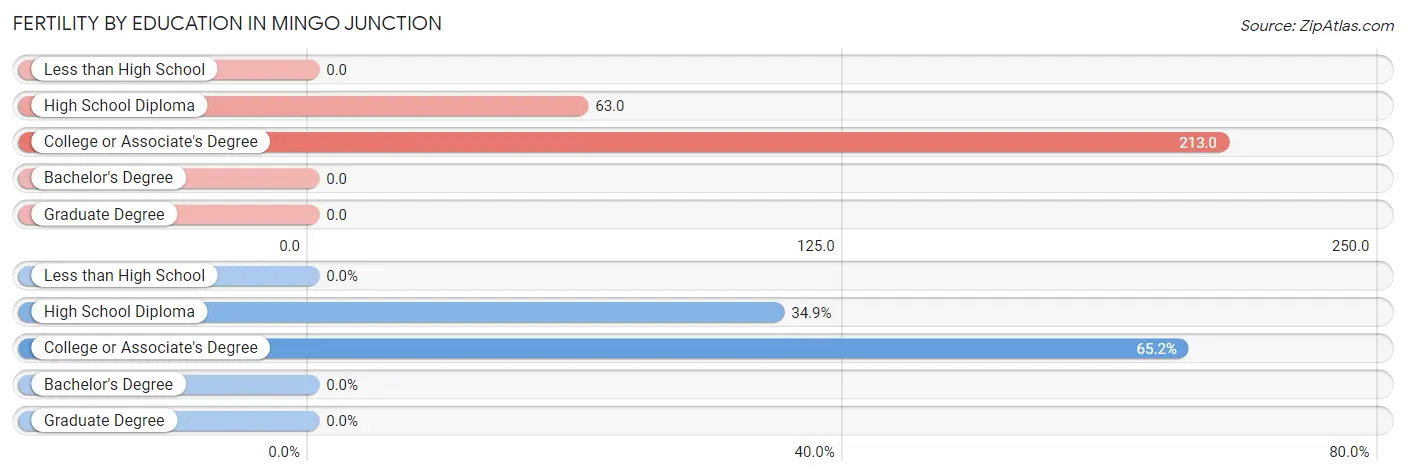
| Educational Attainment | Women with Births | Births / 1,000 Women |
| Less than High School | 0 (0.0%) | 0.0 |
| High School Diploma | 23 (34.8%) | 63.0 |
| College or Associate's Degree | 43 (65.1%) | 213.0 |
| Bachelor's Degree | 0 (0.0%) | 0.0 |
| Graduate Degree | 0 (0.0%) | 0.0 |
| Total | 66 (100.0%) | 76.0 |
Fertility by Education by Marriage Status in Mingo Junction
65.1% of women with births in Mingo Junction are unmarried. Women with the educational attainment of high school diploma are most likely to be married with 100.0% of them married at childbirth, while women with the educational attainment of college or associate's degree are least likely to be married with 100.0% of them unmarried at childbirth.
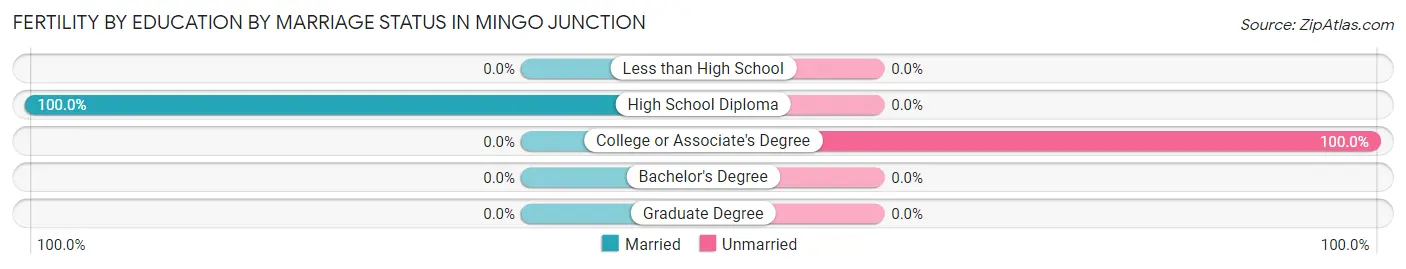
| Educational Attainment | Married | Unmarried |
| Less than High School | 0 (0.0%) | 0 (0.0%) |
| High School Diploma | 23 (100.0%) | 0 (0.0%) |
| College or Associate's Degree | 0 (0.0%) | 43 (100.0%) |
| Bachelor's Degree | 0 (0.0%) | 0 (0.0%) |
| Graduate Degree | 0 (0.0%) | 0 (0.0%) |
| Total | 23 (34.8%) | 43 (65.1%) |
Employment Characteristics in Mingo Junction
Employment by Class of Employer in Mingo Junction
Among the 1,673 employed individuals in Mingo Junction, private company employees (1,480 | 88.5%), state government employees (82 | 4.9%), and self-employed (not incorporated) (53 | 3.2%) make up the most common classes of employment.
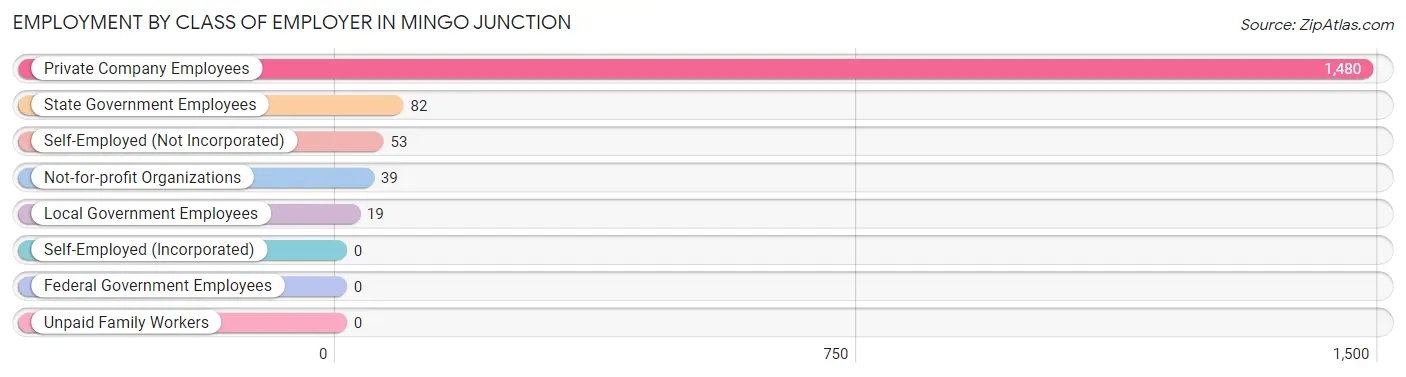
| Employer Class | # Employees | % Employees |
| Private Company Employees | 1,480 | 88.5% |
| Self-Employed (Incorporated) | 0 | 0.0% |
| Self-Employed (Not Incorporated) | 53 | 3.2% |
| Not-for-profit Organizations | 39 | 2.3% |
| Local Government Employees | 19 | 1.1% |
| State Government Employees | 82 | 4.9% |
| Federal Government Employees | 0 | 0.0% |
| Unpaid Family Workers | 0 | 0.0% |
| Total | 1,673 | 100.0% |
Employment Status by Age in Mingo Junction
According to the labor force statistics for Mingo Junction, out of the total population over 16 years of age (3,004), 60.2% or 1,808 individuals are in the labor force, with 4.5% or 81 of them unemployed. The age group with the highest labor force participation rate is 30 to 34 years, with 89.6% or 103 individuals in the labor force. Within the labor force, the 20 to 24 years age range has the highest percentage of unemployed individuals, with 20.5% or 27 of them being unemployed.
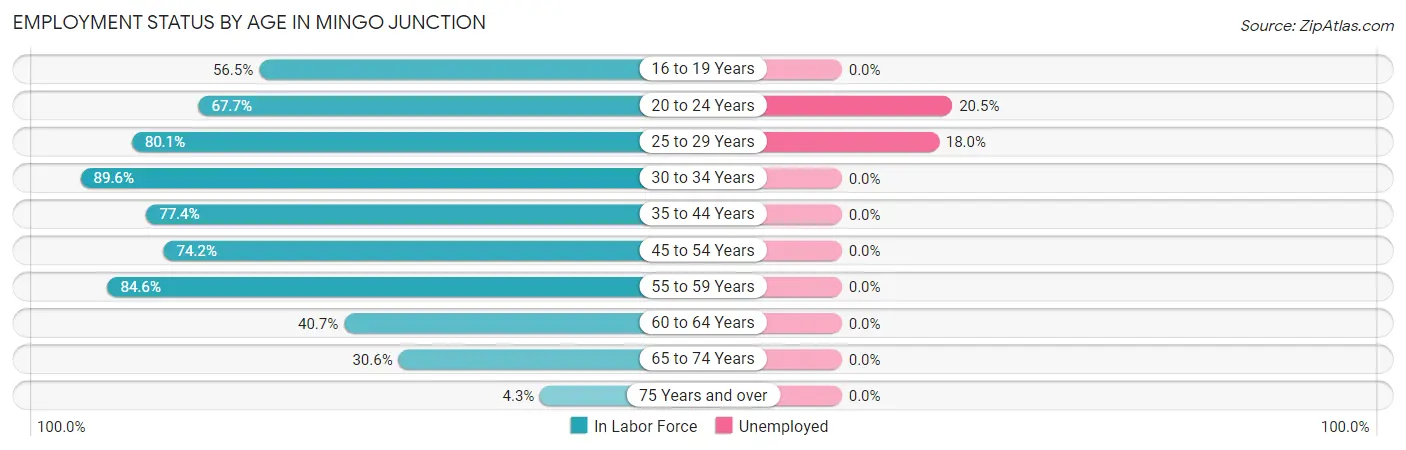
| Age Bracket | In Labor Force | Unemployed |
| 16 to 19 Years | 144 (56.5%) | 0 (0.0%) |
| 20 to 24 Years | 132 (67.7%) | 27 (20.5%) |
| 25 to 29 Years | 306 (80.1%) | 55 (18.0%) |
| 30 to 34 Years | 103 (89.6%) | 0 (0.0%) |
| 35 to 44 Years | 419 (77.4%) | 0 (0.0%) |
| 45 to 54 Years | 291 (74.2%) | 0 (0.0%) |
| 55 to 59 Years | 181 (84.6%) | 0 (0.0%) |
| 60 to 64 Years | 90 (40.7%) | 0 (0.0%) |
| 65 to 74 Years | 132 (30.6%) | 0 (0.0%) |
| 75 Years and over | 11 (4.3%) | 0 (0.0%) |
| Total | 1,808 (60.2%) | 81 (4.5%) |
Employment Status by Educational Attainment in Mingo Junction
According to labor force statistics for Mingo Junction, 74.5% of individuals (1,389) out of the total population between 25 and 64 years of age (1,865) are in the labor force, with 4.0% or 56 of them being unemployed. The group with the highest labor force participation rate are those with the educational attainment of bachelor's degree or higher, with 92.4% or 242 individuals in the labor force. Within the labor force, individuals with college / associate degree education have the highest percentage of unemployment, with 13.3% or 55 of them being unemployed.
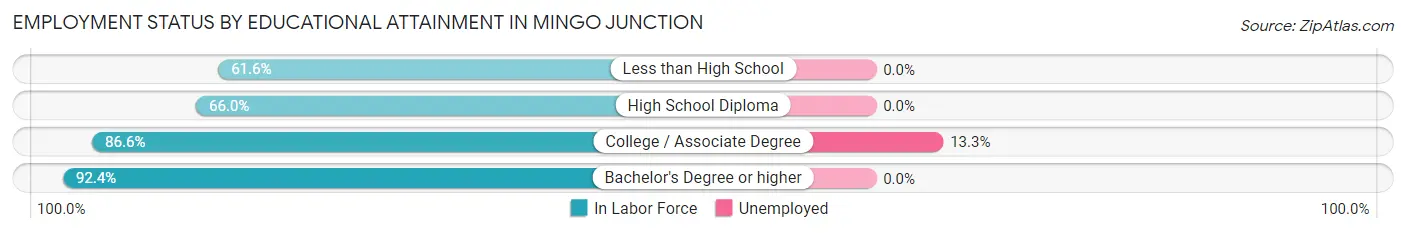
| Educational Attainment | In Labor Force | Unemployed |
| Less than High School | 109 (61.6%) | 0 (0.0%) |
| High School Diploma | 627 (66.0%) | 0 (0.0%) |
| College / Associate Degree | 412 (86.6%) | 63 (13.3%) |
| Bachelor's Degree or higher | 242 (92.4%) | 0 (0.0%) |
| Total | 1,389 (74.5%) | 75 (4.0%) |
Employment Occupations by Sex in Mingo Junction
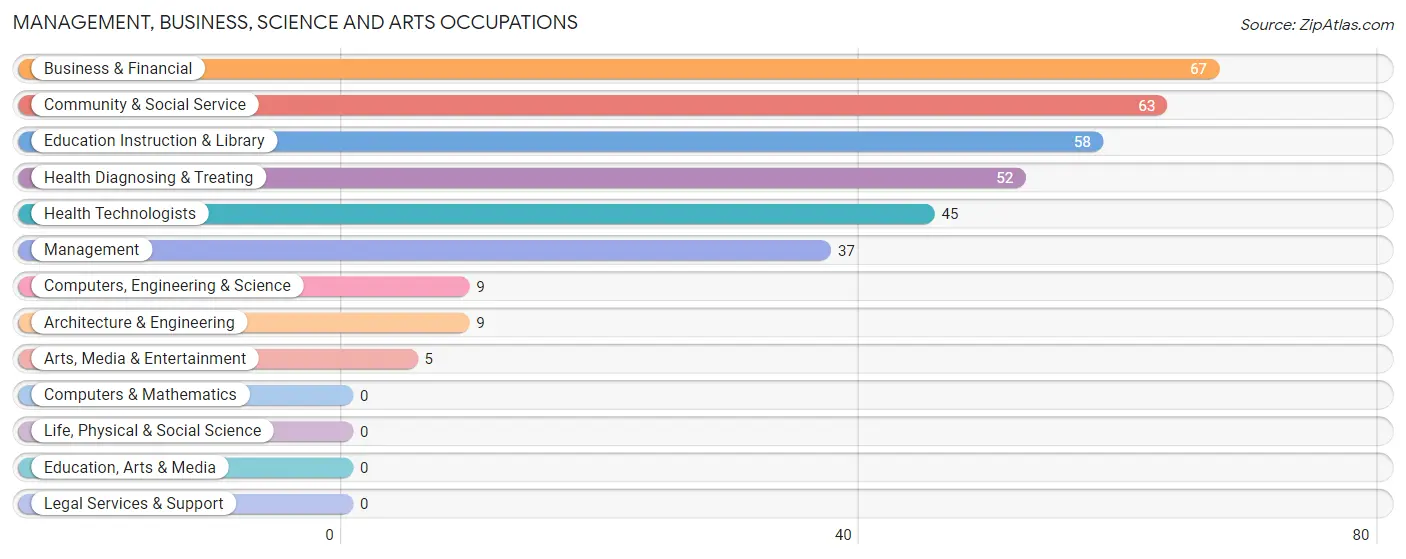
Management, Business, Science and Arts Occupations
The most common Management, Business, Science and Arts occupations in Mingo Junction are Business & Financial (67 | 3.9%), Community & Social Service (63 | 3.6%), Education Instruction & Library (58 | 3.4%), Health Diagnosing & Treating (52 | 3.0%), and Health Technologists (45 | 2.6%).
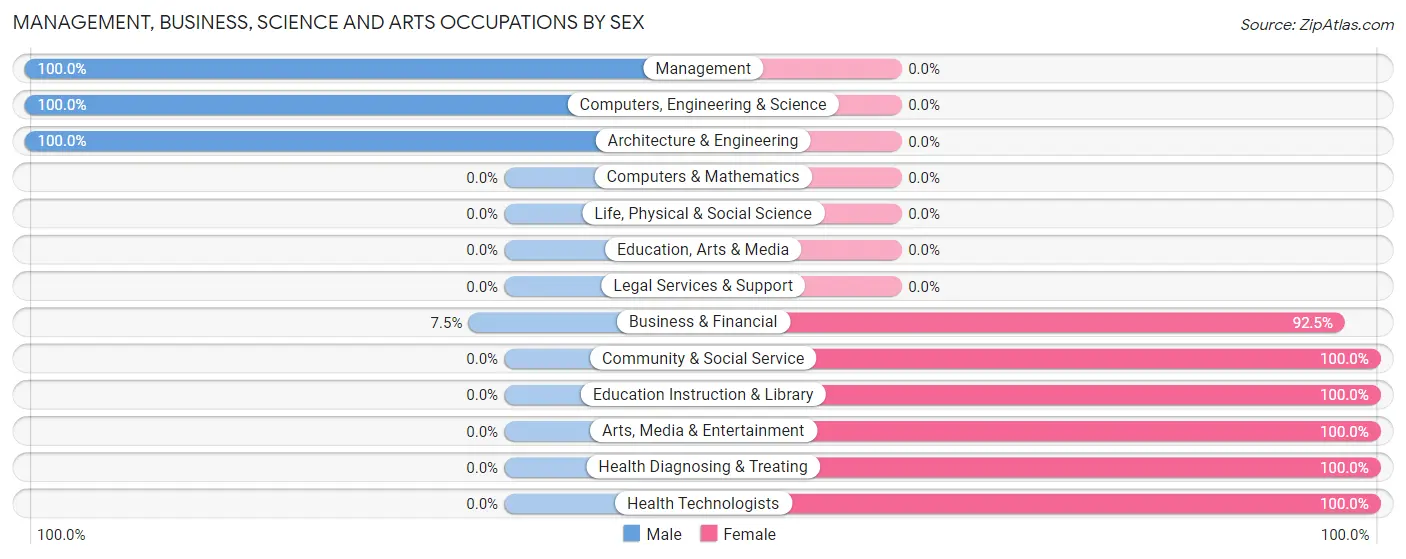
Management, Business, Science and Arts Occupations by Sex
Within the Management, Business, Science and Arts occupations in Mingo Junction, the most male-oriented occupations are Management (100.0%), Computers, Engineering & Science (100.0%), and Architecture & Engineering (100.0%), while the most female-oriented occupations are Community & Social Service (100.0%), Education Instruction & Library (100.0%), and Arts, Media & Entertainment (100.0%).
| Occupation | Male | Female |
| Management | 37 (100.0%) | 0 (0.0%) |
| Business & Financial | 5 (7.5%) | 62 (92.5%) |
| Computers, Engineering & Science | 9 (100.0%) | 0 (0.0%) |
| Computers & Mathematics | 0 (0.0%) | 0 (0.0%) |
| Architecture & Engineering | 9 (100.0%) | 0 (0.0%) |
| Life, Physical & Social Science | 0 (0.0%) | 0 (0.0%) |
| Community & Social Service | 0 (0.0%) | 63 (100.0%) |
| Education, Arts & Media | 0 (0.0%) | 0 (0.0%) |
| Legal Services & Support | 0 (0.0%) | 0 (0.0%) |
| Education Instruction & Library | 0 (0.0%) | 58 (100.0%) |
| Arts, Media & Entertainment | 0 (0.0%) | 5 (100.0%) |
| Health Diagnosing & Treating | 0 (0.0%) | 52 (100.0%) |
| Health Technologists | 0 (0.0%) | 45 (100.0%) |
| Total (Category) | 51 (22.4%) | 177 (77.6%) |
| Total (Overall) | 828 (47.9%) | 899 (52.1%) |
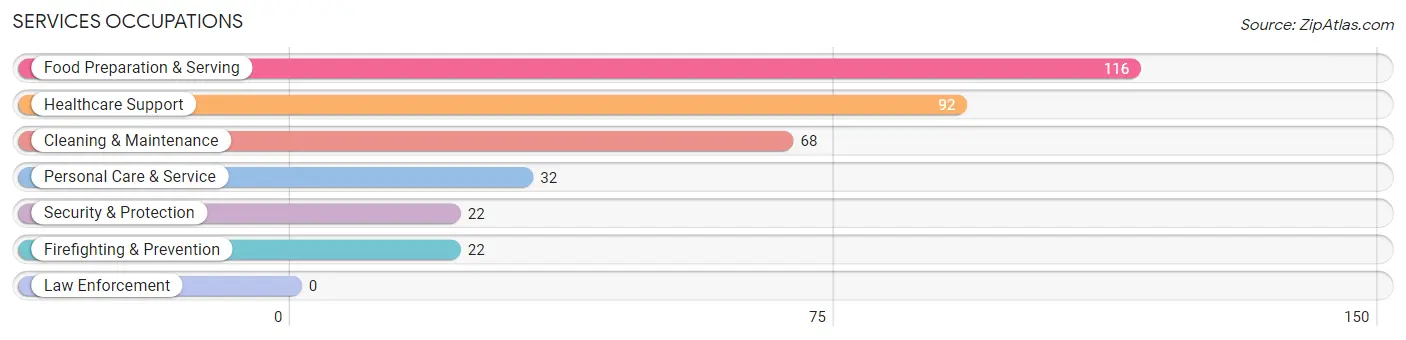
Services Occupations
The most common Services occupations in Mingo Junction are Food Preparation & Serving (116 | 6.7%), Healthcare Support (92 | 5.3%), Cleaning & Maintenance (68 | 3.9%), Personal Care & Service (32 | 1.8%), and Security & Protection (22 | 1.3%).
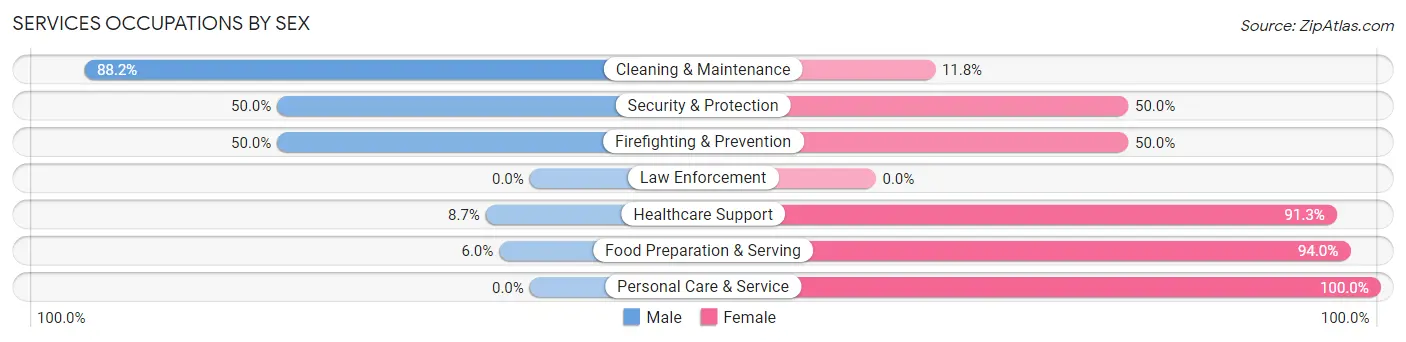
Services Occupations by Sex
Within the Services occupations in Mingo Junction, the most male-oriented occupations are Cleaning & Maintenance (88.2%), Security & Protection (50.0%), and Firefighting & Prevention (50.0%), while the most female-oriented occupations are Personal Care & Service (100.0%), Food Preparation & Serving (94.0%), and Healthcare Support (91.3%).
| Occupation | Male | Female |
| Healthcare Support | 8 (8.7%) | 84 (91.3%) |
| Security & Protection | 11 (50.0%) | 11 (50.0%) |
| Firefighting & Prevention | 11 (50.0%) | 11 (50.0%) |
| Law Enforcement | 0 (0.0%) | 0 (0.0%) |
| Food Preparation & Serving | 7 (6.0%) | 109 (94.0%) |
| Cleaning & Maintenance | 60 (88.2%) | 8 (11.8%) |
| Personal Care & Service | 0 (0.0%) | 32 (100.0%) |
| Total (Category) | 86 (26.1%) | 244 (73.9%) |
| Total (Overall) | 828 (47.9%) | 899 (52.1%) |
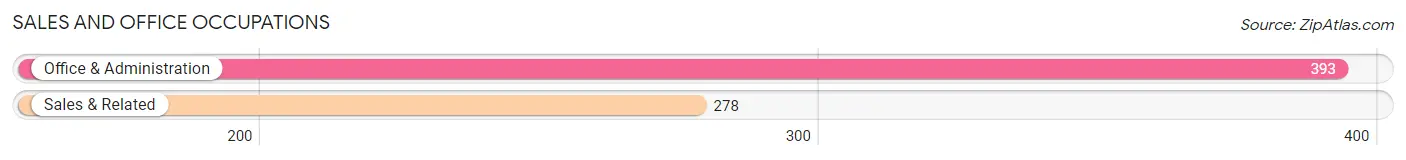
Sales and Office Occupations
The most common Sales and Office occupations in Mingo Junction are Office & Administration (393 | 22.8%), and Sales & Related (278 | 16.1%).
Sales and Office Occupations by Sex
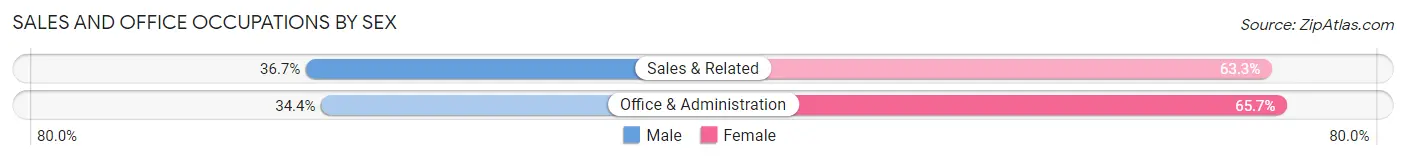
| Occupation | Male | Female |
| Sales & Related | 102 (36.7%) | 176 (63.3%) |
| Office & Administration | 135 (34.4%) | 258 (65.6%) |
| Total (Category) | 237 (35.3%) | 434 (64.7%) |
| Total (Overall) | 828 (47.9%) | 899 (52.1%) |
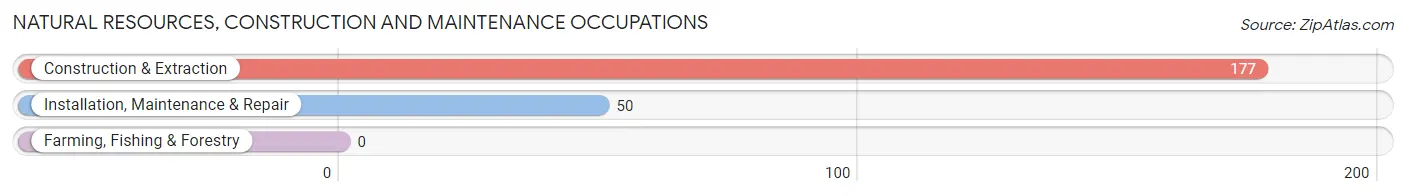
Natural Resources, Construction and Maintenance Occupations
The most common Natural Resources, Construction and Maintenance occupations in Mingo Junction are Construction & Extraction (177 | 10.2%), and Installation, Maintenance & Repair (50 | 2.9%).
Natural Resources, Construction and Maintenance Occupations by Sex
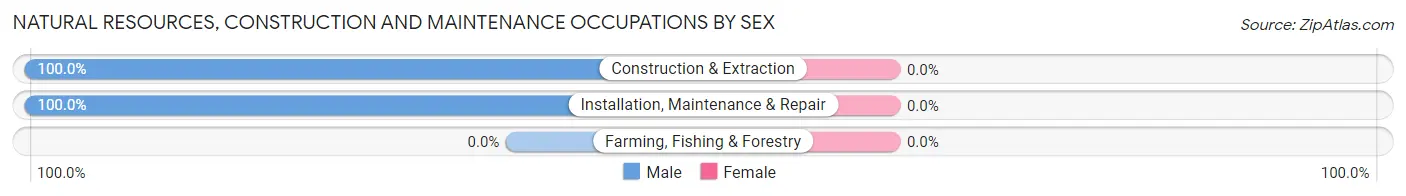
| Occupation | Male | Female |
| Farming, Fishing & Forestry | 0 (0.0%) | 0 (0.0%) |
| Construction & Extraction | 177 (100.0%) | 0 (0.0%) |
| Installation, Maintenance & Repair | 50 (100.0%) | 0 (0.0%) |
| Total (Category) | 227 (100.0%) | 0 (0.0%) |
| Total (Overall) | 828 (47.9%) | 899 (52.1%) |
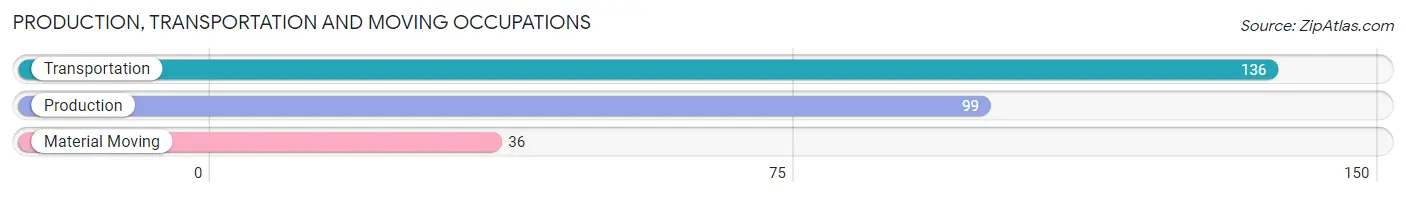
Production, Transportation and Moving Occupations
The most common Production, Transportation and Moving occupations in Mingo Junction are Transportation (136 | 7.9%), Production (99 | 5.7%), and Material Moving (36 | 2.1%).
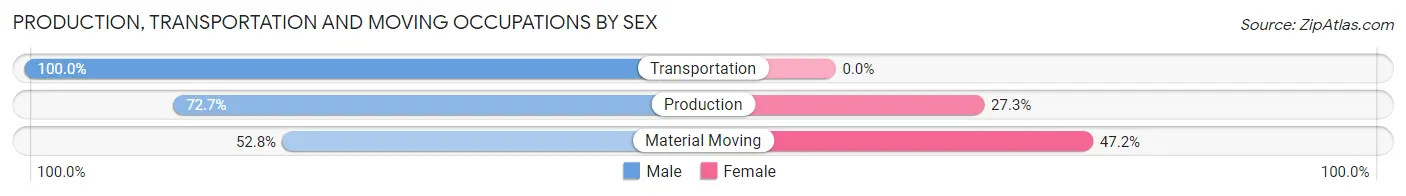
Production, Transportation and Moving Occupations by Sex
| Occupation | Male | Female |
| Production | 72 (72.7%) | 27 (27.3%) |
| Transportation | 136 (100.0%) | 0 (0.0%) |
| Material Moving | 19 (52.8%) | 17 (47.2%) |
| Total (Category) | 227 (83.8%) | 44 (16.2%) |
| Total (Overall) | 828 (47.9%) | 899 (52.1%) |
Employment Industries by Sex in Mingo Junction
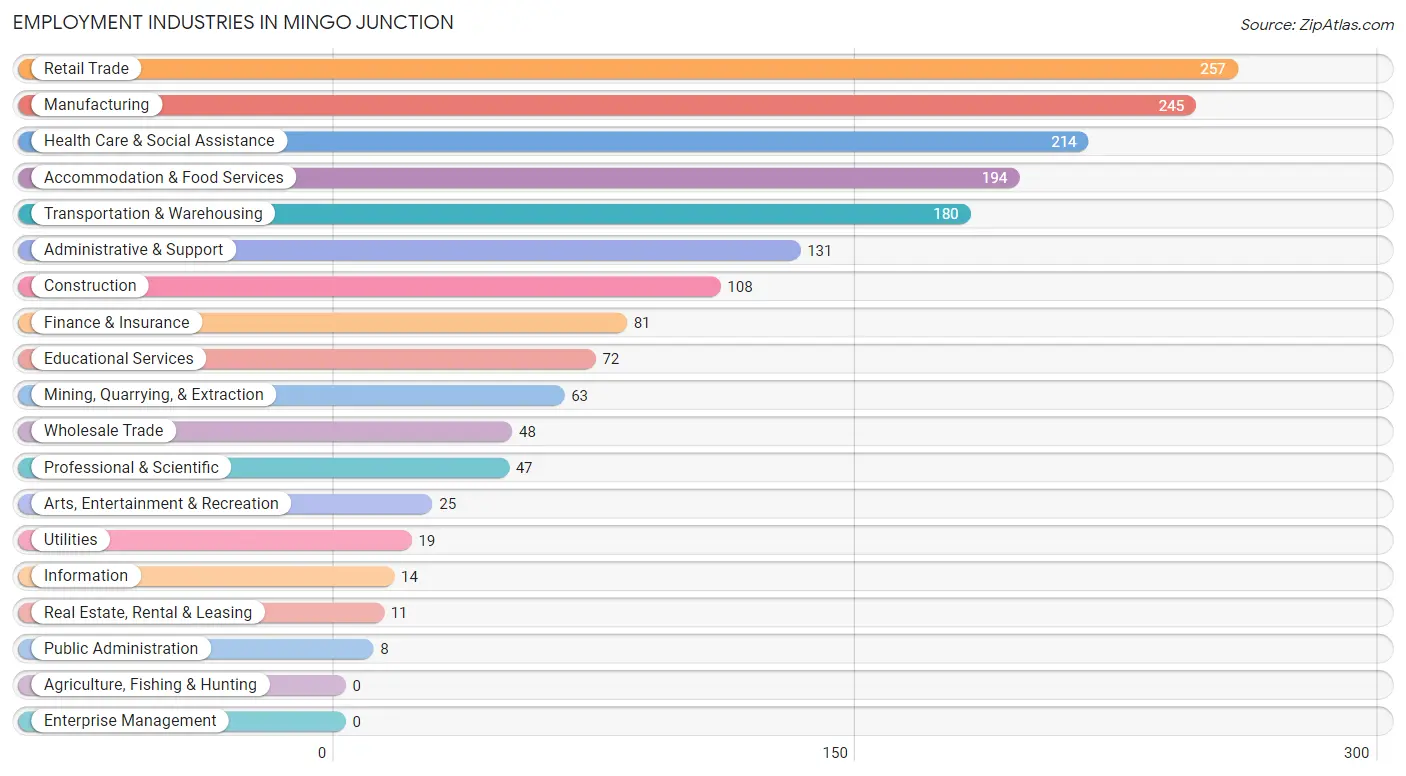
Employment Industries in Mingo Junction
The major employment industries in Mingo Junction include Retail Trade (257 | 14.9%), Manufacturing (245 | 14.2%), Health Care & Social Assistance (214 | 12.4%), Accommodation & Food Services (194 | 11.2%), and Transportation & Warehousing (180 | 10.4%).
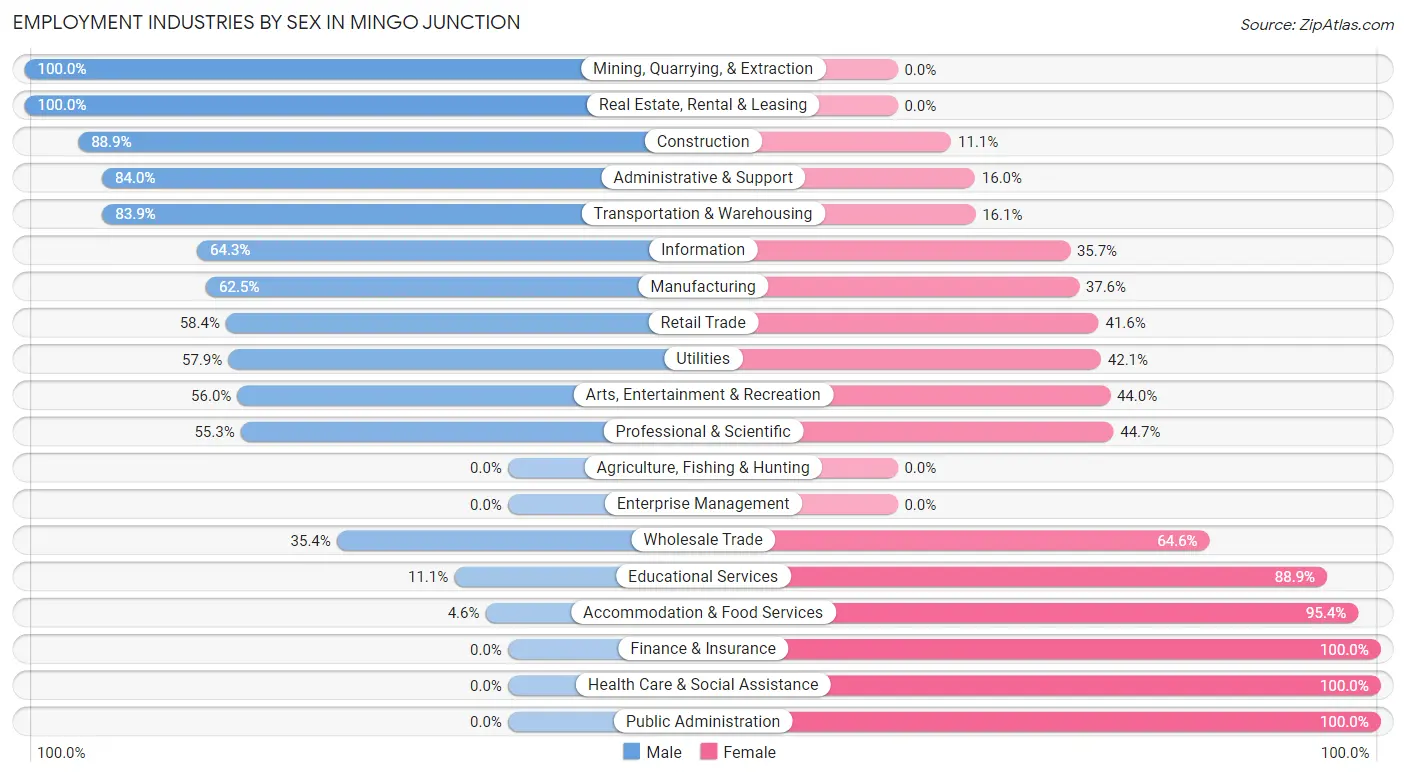
Employment Industries by Sex in Mingo Junction
The Mingo Junction industries that see more men than women are Mining, Quarrying, & Extraction (100.0%), Real Estate, Rental & Leasing (100.0%), and Construction (88.9%), whereas the industries that tend to have a higher number of women are Finance & Insurance (100.0%), Health Care & Social Assistance (100.0%), and Public Administration (100.0%).
| Industry | Male | Female |
| Agriculture, Fishing & Hunting | 0 (0.0%) | 0 (0.0%) |
| Mining, Quarrying, & Extraction | 63 (100.0%) | 0 (0.0%) |
| Construction | 96 (88.9%) | 12 (11.1%) |
| Manufacturing | 153 (62.5%) | 92 (37.6%) |
| Wholesale Trade | 17 (35.4%) | 31 (64.6%) |
| Retail Trade | 150 (58.4%) | 107 (41.6%) |
| Transportation & Warehousing | 151 (83.9%) | 29 (16.1%) |
| Utilities | 11 (57.9%) | 8 (42.1%) |
| Information | 9 (64.3%) | 5 (35.7%) |
| Finance & Insurance | 0 (0.0%) | 81 (100.0%) |
| Real Estate, Rental & Leasing | 11 (100.0%) | 0 (0.0%) |
| Professional & Scientific | 26 (55.3%) | 21 (44.7%) |
| Enterprise Management | 0 (0.0%) | 0 (0.0%) |
| Administrative & Support | 110 (84.0%) | 21 (16.0%) |
| Educational Services | 8 (11.1%) | 64 (88.9%) |
| Health Care & Social Assistance | 0 (0.0%) | 214 (100.0%) |
| Arts, Entertainment & Recreation | 14 (56.0%) | 11 (44.0%) |
| Accommodation & Food Services | 9 (4.6%) | 185 (95.4%) |
| Public Administration | 0 (0.0%) | 8 (100.0%) |
| Total | 828 (47.9%) | 899 (52.1%) |
Education in Mingo Junction
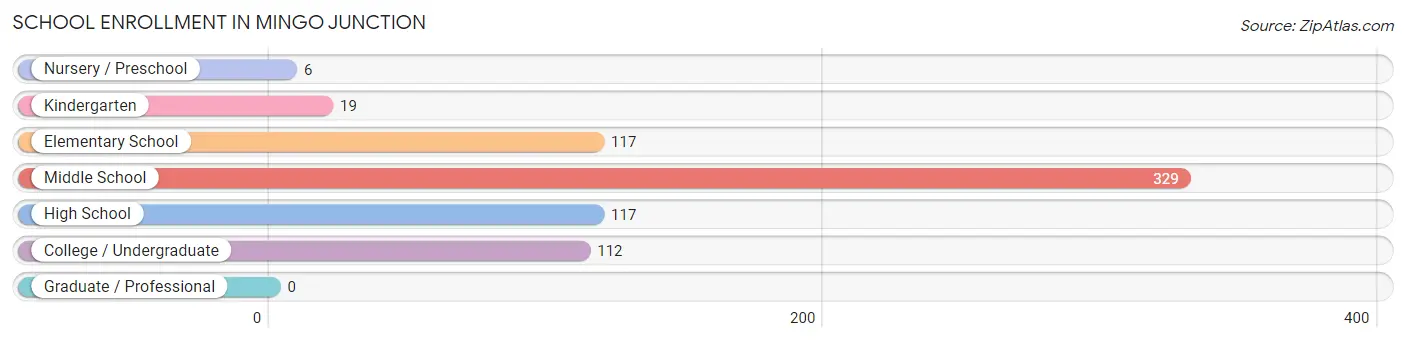
School Enrollment in Mingo Junction
The most common levels of schooling among the 700 students in Mingo Junction are middle school (329 | 47.0%), elementary school (117 | 16.7%), and high school (117 | 16.7%).
| School Level | # Students | % Students |
| Nursery / Preschool | 6 | 0.9% |
| Kindergarten | 19 | 2.7% |
| Elementary School | 117 | 16.7% |
| Middle School | 329 | 47.0% |
| High School | 117 | 16.7% |
| College / Undergraduate | 112 | 16.0% |
| Graduate / Professional | 0 | 0.0% |
| Total | 700 | 100.0% |
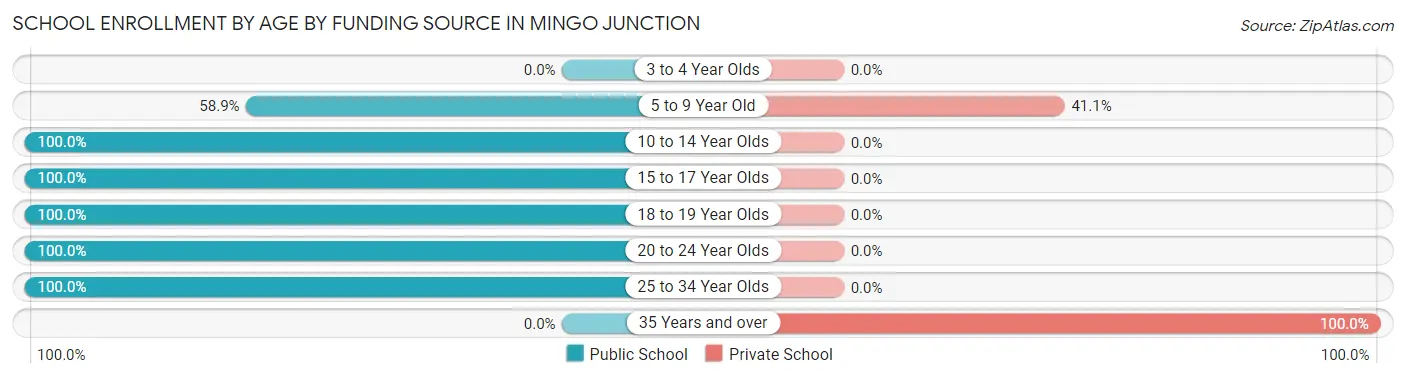
School Enrollment by Age by Funding Source in Mingo Junction
Out of a total of 700 students who are enrolled in schools in Mingo Junction, 66 (9.4%) attend a private institution, while the remaining 634 (90.6%) are enrolled in public schools. The age group of 35 years and over has the highest likelihood of being enrolled in private schools, with 8 (100.0% in the age bracket) enrolled. Conversely, the age group of 10 to 14 year olds has the lowest likelihood of being enrolled in a private school, with 310 (100.0% in the age bracket) attending a public institution.
| Age Bracket | Public School | Private School |
| 3 to 4 Year Olds | 0 (0.0%) | 0 (0.0%) |
| 5 to 9 Year Old | 83 (58.9%) | 58 (41.1%) |
| 10 to 14 Year Olds | 310 (100.0%) | 0 (0.0%) |
| 15 to 17 Year Olds | 117 (100.0%) | 0 (0.0%) |
| 18 to 19 Year Olds | 107 (100.0%) | 0 (0.0%) |
| 20 to 24 Year Olds | 8 (100.0%) | 0 (0.0%) |
| 25 to 34 Year Olds | 9 (100.0%) | 0 (0.0%) |
| 35 Years and over | 0 (0.0%) | 8 (100.0%) |
| Total | 634 (90.6%) | 66 (9.4%) |
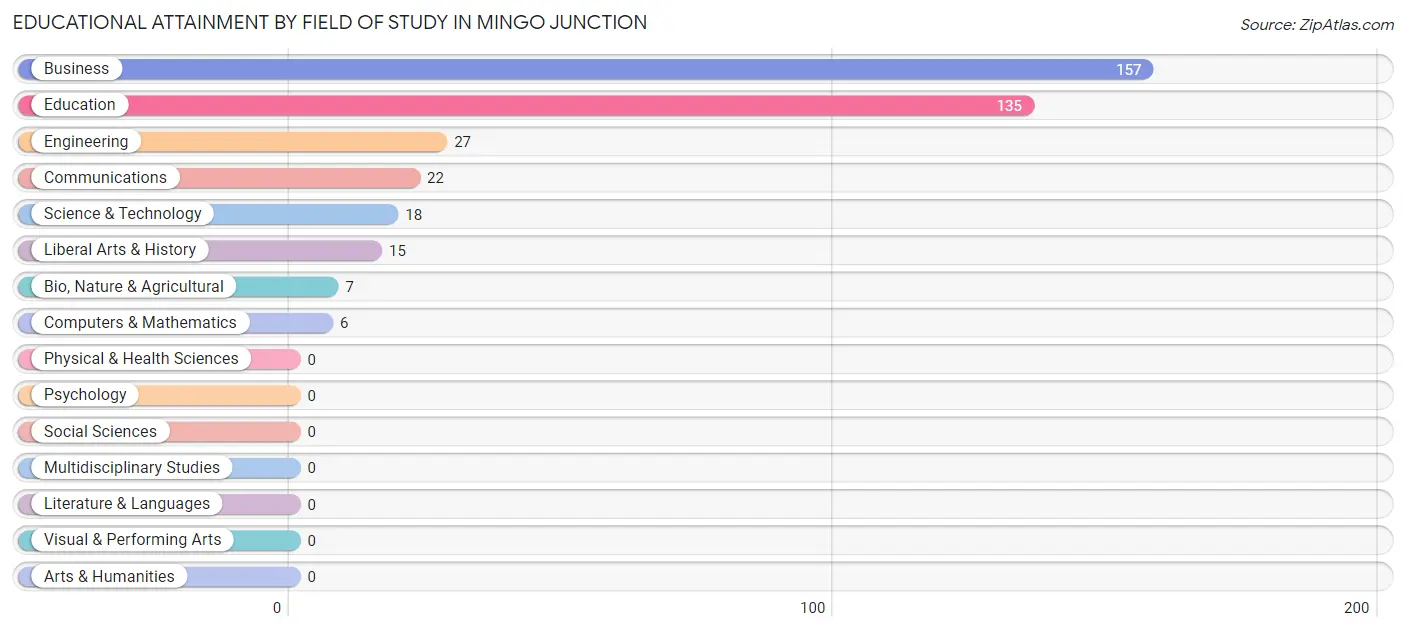
Educational Attainment by Field of Study in Mingo Junction
Business (157 | 40.6%), education (135 | 34.9%), engineering (27 | 7.0%), communications (22 | 5.7%), and science & technology (18 | 4.6%) are the most common fields of study among 387 individuals in Mingo Junction who have obtained a bachelor's degree or higher.
| Field of Study | # Graduates | % Graduates |
| Computers & Mathematics | 6 | 1.5% |
| Bio, Nature & Agricultural | 7 | 1.8% |
| Physical & Health Sciences | 0 | 0.0% |
| Psychology | 0 | 0.0% |
| Social Sciences | 0 | 0.0% |
| Engineering | 27 | 7.0% |
| Multidisciplinary Studies | 0 | 0.0% |
| Science & Technology | 18 | 4.6% |
| Business | 157 | 40.6% |
| Education | 135 | 34.9% |
| Literature & Languages | 0 | 0.0% |
| Liberal Arts & History | 15 | 3.9% |
| Visual & Performing Arts | 0 | 0.0% |
| Communications | 22 | 5.7% |
| Arts & Humanities | 0 | 0.0% |
| Total | 387 | 100.0% |
Transportation & Commute in Mingo Junction
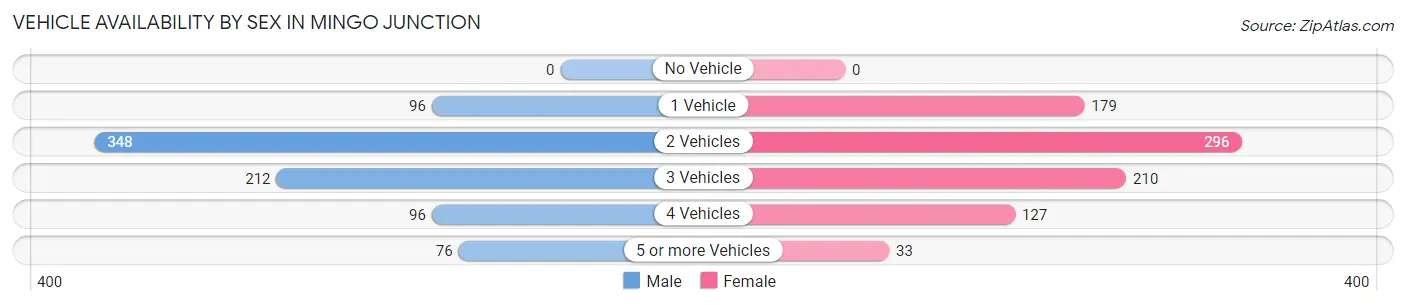
Vehicle Availability by Sex in Mingo Junction
The most prevalent vehicle ownership categories in Mingo Junction are males with 2 vehicles (348, accounting for 42.0%) and females with 2 vehicles (296, making up 41.2%).
| Vehicles Available | Male | Female |
| No Vehicle | 0 (0.0%) | 0 (0.0%) |
| 1 Vehicle | 96 (11.6%) | 179 (21.2%) |
| 2 Vehicles | 348 (42.0%) | 296 (35.0%) |
| 3 Vehicles | 212 (25.6%) | 210 (24.8%) |
| 4 Vehicles | 96 (11.6%) | 127 (15.0%) |
| 5 or more Vehicles | 76 (9.2%) | 33 (3.9%) |
| Total | 828 (100.0%) | 845 (100.0%) |
Commute Time in Mingo Junction
The most frequently occuring commute durations in Mingo Junction are 15 to 19 minutes (412 commuters, 25.1%), 20 to 24 minutes (276 commuters, 16.8%), and 10 to 14 minutes (267 commuters, 16.3%).
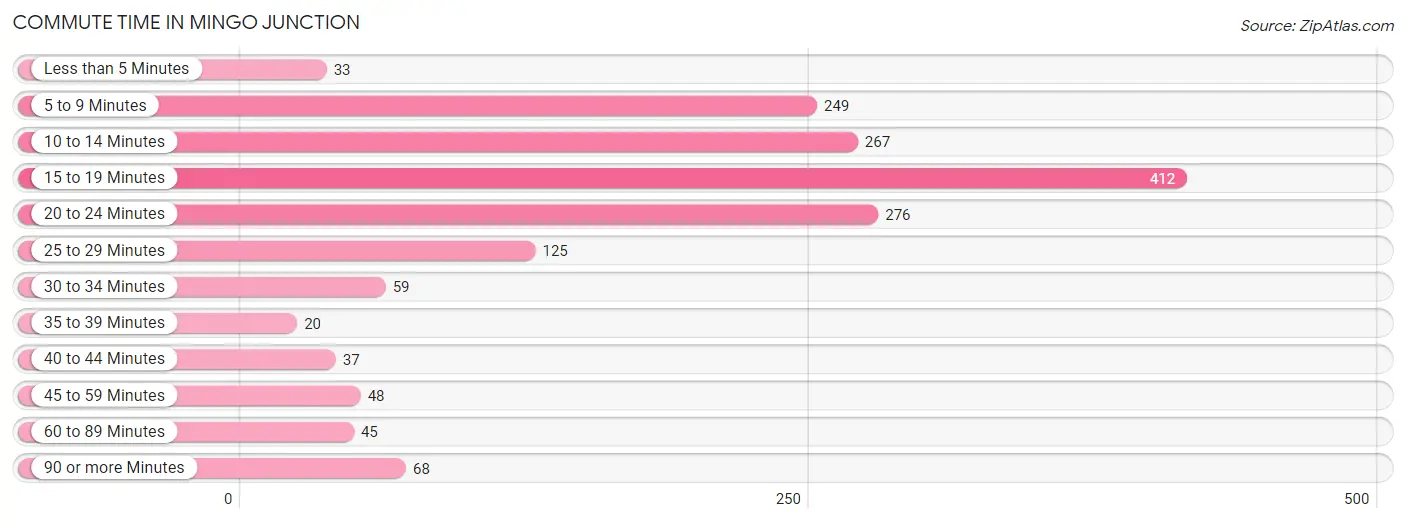
| Commute Time | # Commuters | % Commuters |
| Less than 5 Minutes | 33 | 2.0% |
| 5 to 9 Minutes | 249 | 15.2% |
| 10 to 14 Minutes | 267 | 16.3% |
| 15 to 19 Minutes | 412 | 25.1% |
| 20 to 24 Minutes | 276 | 16.8% |
| 25 to 29 Minutes | 125 | 7.6% |
| 30 to 34 Minutes | 59 | 3.6% |
| 35 to 39 Minutes | 20 | 1.2% |
| 40 to 44 Minutes | 37 | 2.3% |
| 45 to 59 Minutes | 48 | 2.9% |
| 60 to 89 Minutes | 45 | 2.8% |
| 90 or more Minutes | 68 | 4.2% |
Commute Time by Sex in Mingo Junction
The most common commute times in Mingo Junction are 15 to 19 minutes (191 commuters, 23.5%) for males and 15 to 19 minutes (221 commuters, 26.8%) for females.
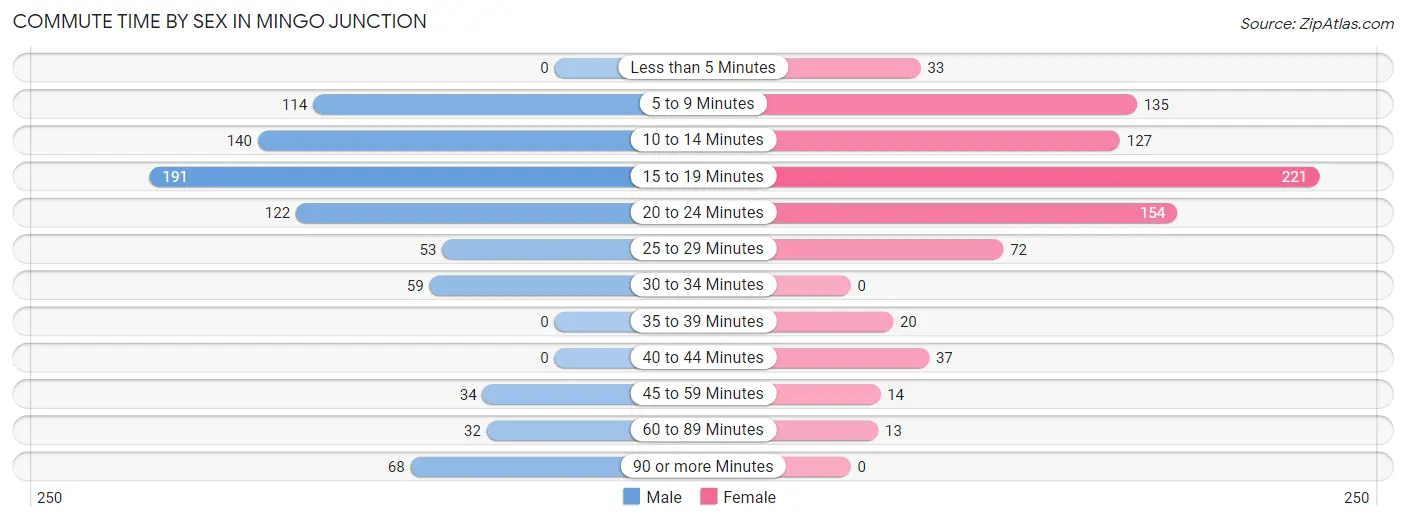
| Commute Time | Male | Female |
| Less than 5 Minutes | 0 (0.0%) | 33 (4.0%) |
| 5 to 9 Minutes | 114 (14.0%) | 135 (16.3%) |
| 10 to 14 Minutes | 140 (17.2%) | 127 (15.4%) |
| 15 to 19 Minutes | 191 (23.5%) | 221 (26.8%) |
| 20 to 24 Minutes | 122 (15.0%) | 154 (18.6%) |
| 25 to 29 Minutes | 53 (6.5%) | 72 (8.7%) |
| 30 to 34 Minutes | 59 (7.3%) | 0 (0.0%) |
| 35 to 39 Minutes | 0 (0.0%) | 20 (2.4%) |
| 40 to 44 Minutes | 0 (0.0%) | 37 (4.5%) |
| 45 to 59 Minutes | 34 (4.2%) | 14 (1.7%) |
| 60 to 89 Minutes | 32 (3.9%) | 13 (1.6%) |
| 90 or more Minutes | 68 (8.4%) | 0 (0.0%) |
Time of Departure to Work by Sex in Mingo Junction
The most frequent times of departure to work in Mingo Junction are 5:00 AM to 5:29 AM (147, 18.1%) for males and 8:00 AM to 8:29 AM (186, 22.5%) for females.
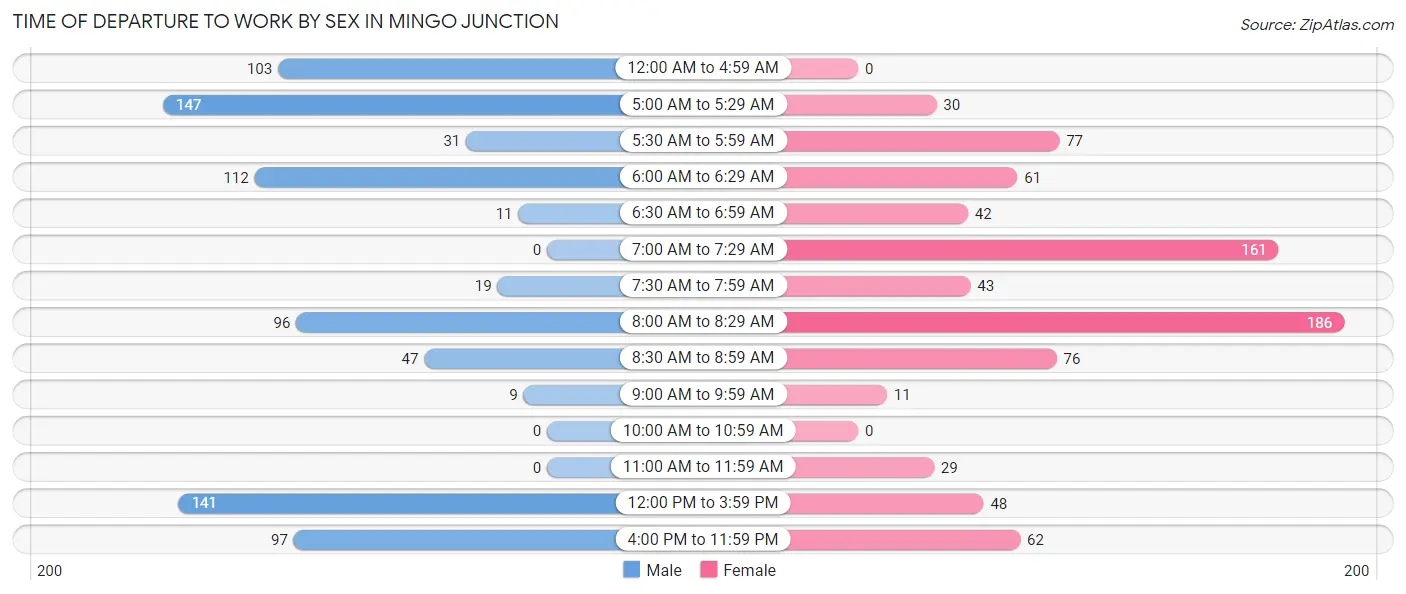
| Time of Departure | Male | Female |
| 12:00 AM to 4:59 AM | 103 (12.7%) | 0 (0.0%) |
| 5:00 AM to 5:29 AM | 147 (18.1%) | 30 (3.6%) |
| 5:30 AM to 5:59 AM | 31 (3.8%) | 77 (9.3%) |
| 6:00 AM to 6:29 AM | 112 (13.8%) | 61 (7.4%) |
| 6:30 AM to 6:59 AM | 11 (1.3%) | 42 (5.1%) |
| 7:00 AM to 7:29 AM | 0 (0.0%) | 161 (19.5%) |
| 7:30 AM to 7:59 AM | 19 (2.3%) | 43 (5.2%) |
| 8:00 AM to 8:29 AM | 96 (11.8%) | 186 (22.5%) |
| 8:30 AM to 8:59 AM | 47 (5.8%) | 76 (9.2%) |
| 9:00 AM to 9:59 AM | 9 (1.1%) | 11 (1.3%) |
| 10:00 AM to 10:59 AM | 0 (0.0%) | 0 (0.0%) |
| 11:00 AM to 11:59 AM | 0 (0.0%) | 29 (3.5%) |
| 12:00 PM to 3:59 PM | 141 (17.3%) | 48 (5.8%) |
| 4:00 PM to 11:59 PM | 97 (11.9%) | 62 (7.5%) |
| Total | 813 (100.0%) | 826 (100.0%) |
Housing Occupancy in Mingo Junction
Occupancy by Ownership in Mingo Junction
Of the total 1,468 dwellings in Mingo Junction, owner-occupied units account for 1,021 (69.6%), while renter-occupied units make up 447 (30.4%).
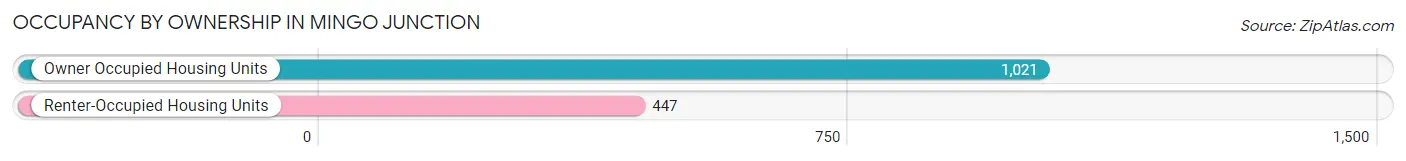
| Occupancy | # Housing Units | % Housing Units |
| Owner Occupied Housing Units | 1,021 | 69.6% |
| Renter-Occupied Housing Units | 447 | 30.4% |
| Total Occupied Housing Units | 1,468 | 100.0% |
Occupancy by Household Size in Mingo Junction
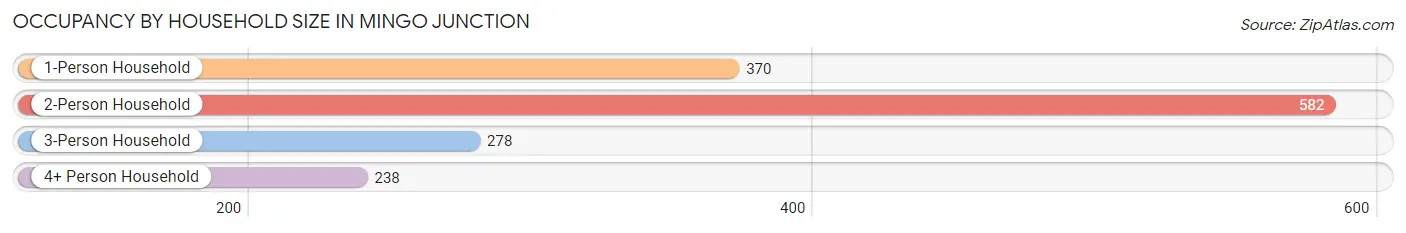
| Household Size | # Housing Units | % Housing Units |
| 1-Person Household | 370 | 25.2% |
| 2-Person Household | 582 | 39.7% |
| 3-Person Household | 278 | 18.9% |
| 4+ Person Household | 238 | 16.2% |
| Total Housing Units | 1,468 | 100.0% |
Occupancy by Ownership by Household Size in Mingo Junction
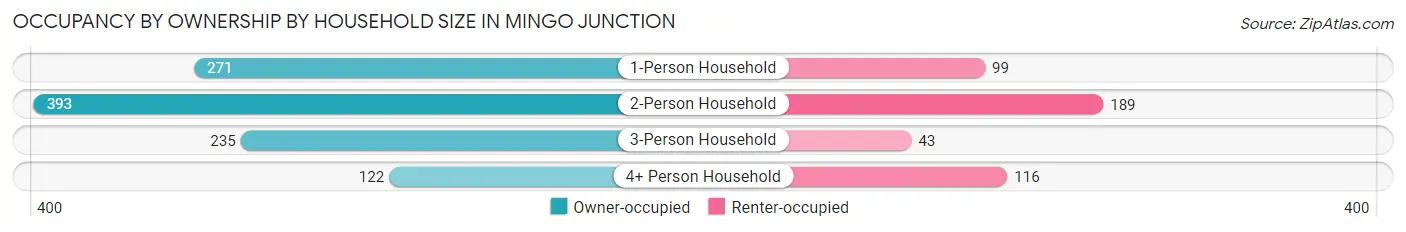
| Household Size | Owner-occupied | Renter-occupied |
| 1-Person Household | 271 (73.2%) | 99 (26.8%) |
| 2-Person Household | 393 (67.5%) | 189 (32.5%) |
| 3-Person Household | 235 (84.5%) | 43 (15.5%) |
| 4+ Person Household | 122 (51.3%) | 116 (48.7%) |
| Total Housing Units | 1,021 (69.6%) | 447 (30.4%) |
Occupancy by Educational Attainment in Mingo Junction
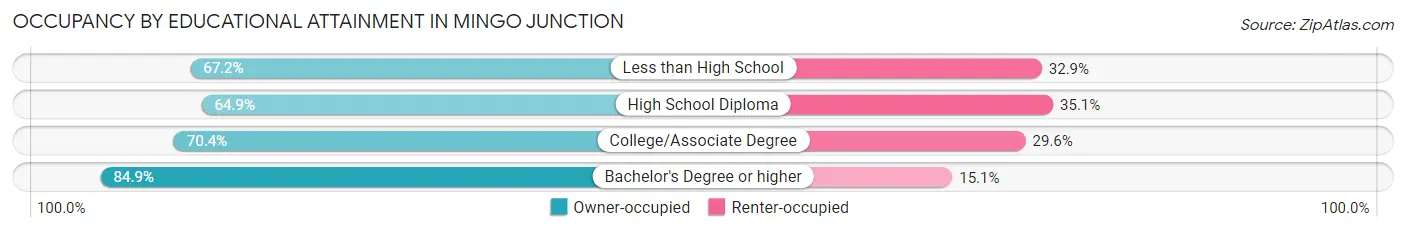
| Household Size | Owner-occupied | Renter-occupied |
| Less than High School | 92 (67.1%) | 45 (32.9%) |
| High School Diploma | 459 (64.9%) | 248 (35.1%) |
| College/Associate Degree | 290 (70.4%) | 122 (29.6%) |
| Bachelor's Degree or higher | 180 (84.9%) | 32 (15.1%) |
Occupancy by Age of Householder in Mingo Junction
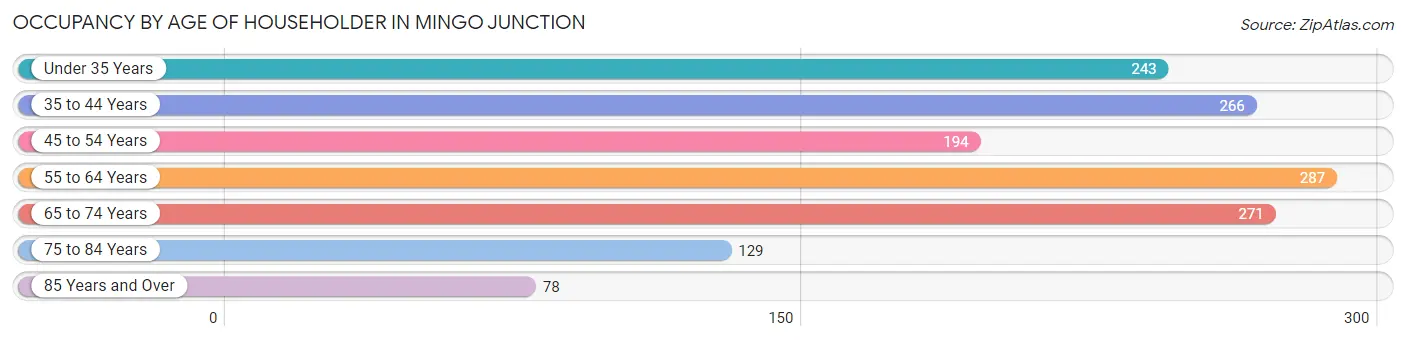
| Age Bracket | # Households | % Households |
| Under 35 Years | 243 | 16.6% |
| 35 to 44 Years | 266 | 18.1% |
| 45 to 54 Years | 194 | 13.2% |
| 55 to 64 Years | 287 | 19.6% |
| 65 to 74 Years | 271 | 18.5% |
| 75 to 84 Years | 129 | 8.8% |
| 85 Years and Over | 78 | 5.3% |
| Total | 1,468 | 100.0% |
Housing Finances in Mingo Junction
Median Income by Occupancy in Mingo Junction
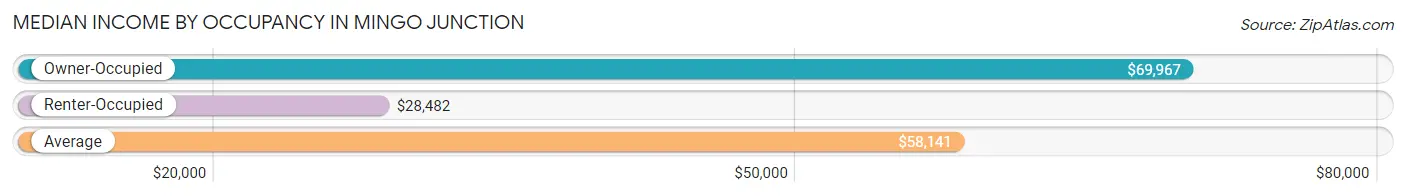
| Occupancy Type | # Households | Median Income |
| Owner-Occupied | 1,021 (69.6%) | $69,967 |
| Renter-Occupied | 447 (30.4%) | $28,482 |
| Average | 1,468 (100.0%) | $58,141 |
Occupancy by Householder Income Bracket in Mingo Junction
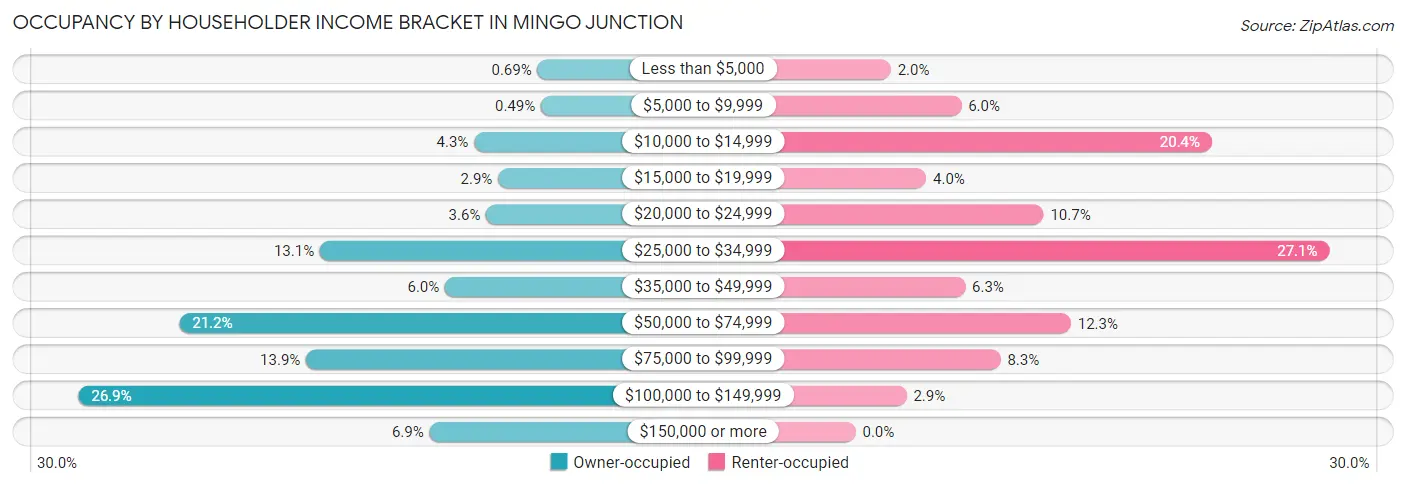
| Income Bracket | Owner-occupied | Renter-occupied |
| Less than $5,000 | 7 (0.7%) | 9 (2.0%) |
| $5,000 to $9,999 | 5 (0.5%) | 27 (6.0%) |
| $10,000 to $14,999 | 44 (4.3%) | 91 (20.4%) |
| $15,000 to $19,999 | 30 (2.9%) | 18 (4.0%) |
| $20,000 to $24,999 | 37 (3.6%) | 48 (10.7%) |
| $25,000 to $34,999 | 134 (13.1%) | 121 (27.1%) |
| $35,000 to $49,999 | 61 (6.0%) | 28 (6.3%) |
| $50,000 to $74,999 | 216 (21.2%) | 55 (12.3%) |
| $75,000 to $99,999 | 142 (13.9%) | 37 (8.3%) |
| $100,000 to $149,999 | 275 (26.9%) | 13 (2.9%) |
| $150,000 or more | 70 (6.9%) | 0 (0.0%) |
| Total | 1,021 (100.0%) | 447 (100.0%) |
Monthly Housing Cost Tiers in Mingo Junction
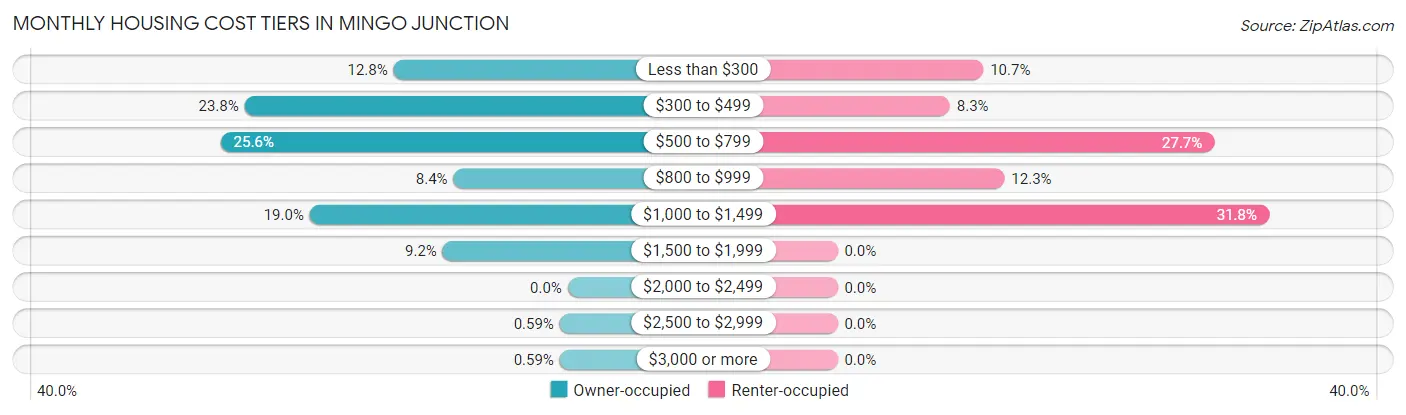
| Monthly Cost | Owner-occupied | Renter-occupied |
| Less than $300 | 131 (12.8%) | 48 (10.7%) |
| $300 to $499 | 243 (23.8%) | 37 (8.3%) |
| $500 to $799 | 261 (25.6%) | 124 (27.7%) |
| $800 to $999 | 86 (8.4%) | 55 (12.3%) |
| $1,000 to $1,499 | 194 (19.0%) | 142 (31.8%) |
| $1,500 to $1,999 | 94 (9.2%) | 0 (0.0%) |
| $2,000 to $2,499 | 0 (0.0%) | 0 (0.0%) |
| $2,500 to $2,999 | 6 (0.6%) | 0 (0.0%) |
| $3,000 or more | 6 (0.6%) | 0 (0.0%) |
| Total | 1,021 (100.0%) | 447 (100.0%) |
Physical Housing Characteristics in Mingo Junction
Housing Structures in Mingo Junction
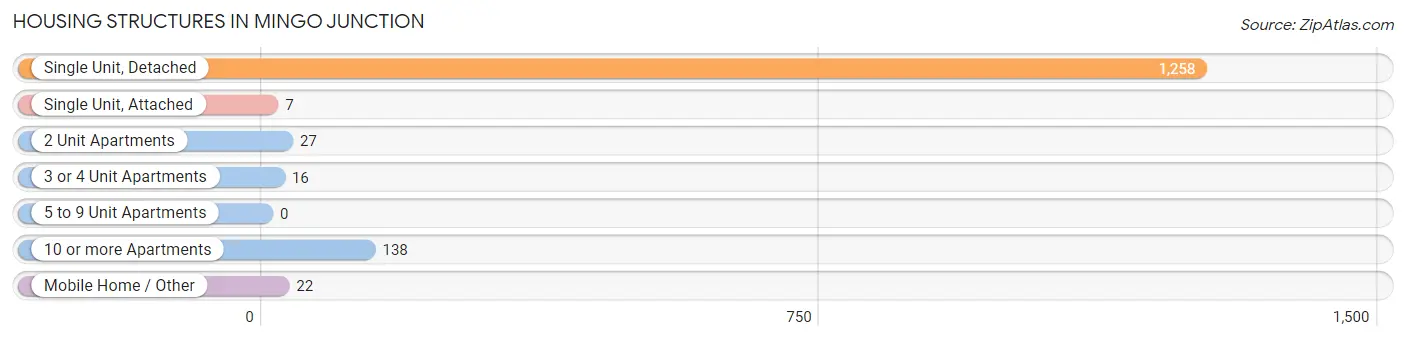
| Structure Type | # Housing Units | % Housing Units |
| Single Unit, Detached | 1,258 | 85.7% |
| Single Unit, Attached | 7 | 0.5% |
| 2 Unit Apartments | 27 | 1.8% |
| 3 or 4 Unit Apartments | 16 | 1.1% |
| 5 to 9 Unit Apartments | 0 | 0.0% |
| 10 or more Apartments | 138 | 9.4% |
| Mobile Home / Other | 22 | 1.5% |
| Total | 1,468 | 100.0% |
Housing Structures by Occupancy in Mingo Junction
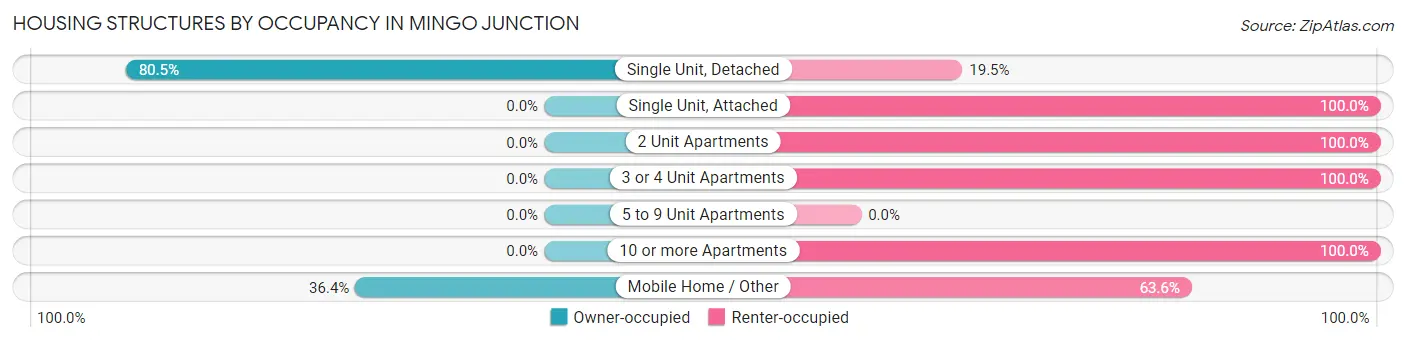
| Structure Type | Owner-occupied | Renter-occupied |
| Single Unit, Detached | 1,013 (80.5%) | 245 (19.5%) |
| Single Unit, Attached | 0 (0.0%) | 7 (100.0%) |
| 2 Unit Apartments | 0 (0.0%) | 27 (100.0%) |
| 3 or 4 Unit Apartments | 0 (0.0%) | 16 (100.0%) |
| 5 to 9 Unit Apartments | 0 (0.0%) | 0 (0.0%) |
| 10 or more Apartments | 0 (0.0%) | 138 (100.0%) |
| Mobile Home / Other | 8 (36.4%) | 14 (63.6%) |
| Total | 1,021 (69.6%) | 447 (30.4%) |
Housing Structures by Number of Rooms in Mingo Junction
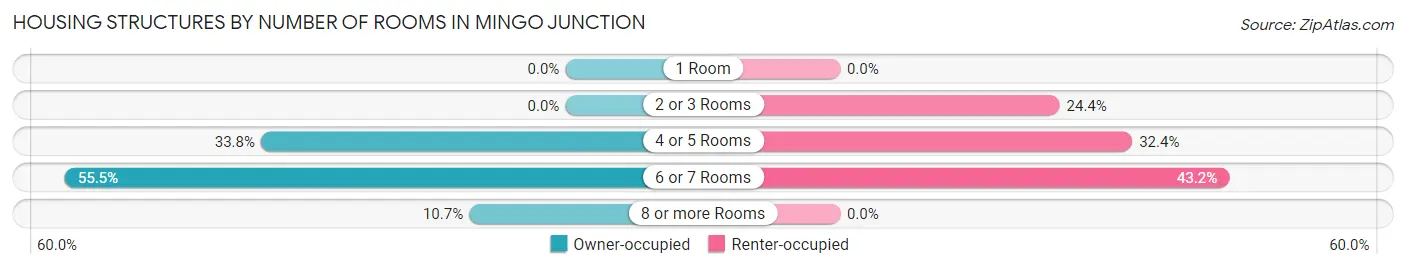
| Number of Rooms | Owner-occupied | Renter-occupied |
| 1 Room | 0 (0.0%) | 0 (0.0%) |
| 2 or 3 Rooms | 0 (0.0%) | 109 (24.4%) |
| 4 or 5 Rooms | 345 (33.8%) | 145 (32.4%) |
| 6 or 7 Rooms | 567 (55.5%) | 193 (43.2%) |
| 8 or more Rooms | 109 (10.7%) | 0 (0.0%) |
| Total | 1,021 (100.0%) | 447 (100.0%) |
Housing Structure by Heating Type in Mingo Junction
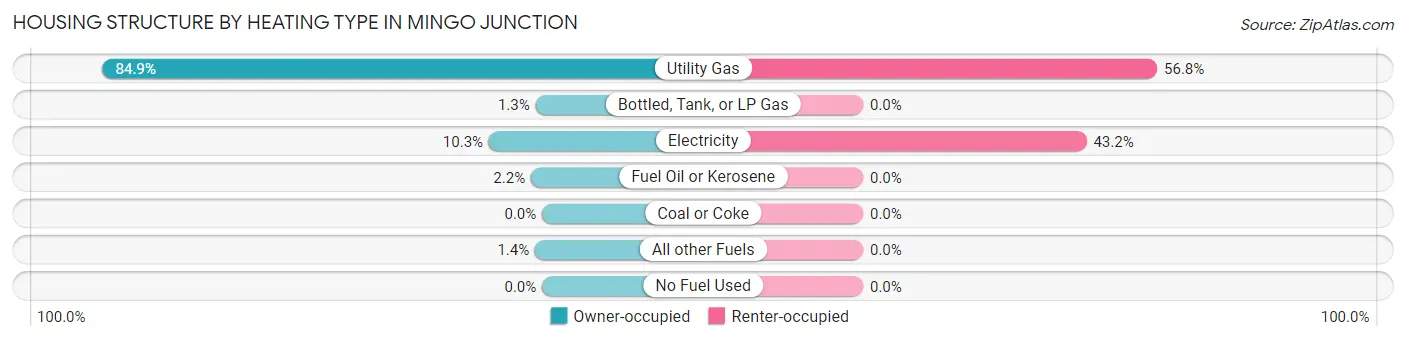
| Heating Type | Owner-occupied | Renter-occupied |
| Utility Gas | 867 (84.9%) | 254 (56.8%) |
| Bottled, Tank, or LP Gas | 13 (1.3%) | 0 (0.0%) |
| Electricity | 105 (10.3%) | 193 (43.2%) |
| Fuel Oil or Kerosene | 22 (2.1%) | 0 (0.0%) |
| Coal or Coke | 0 (0.0%) | 0 (0.0%) |
| All other Fuels | 14 (1.4%) | 0 (0.0%) |
| No Fuel Used | 0 (0.0%) | 0 (0.0%) |
| Total | 1,021 (100.0%) | 447 (100.0%) |
Household Vehicle Usage in Mingo Junction
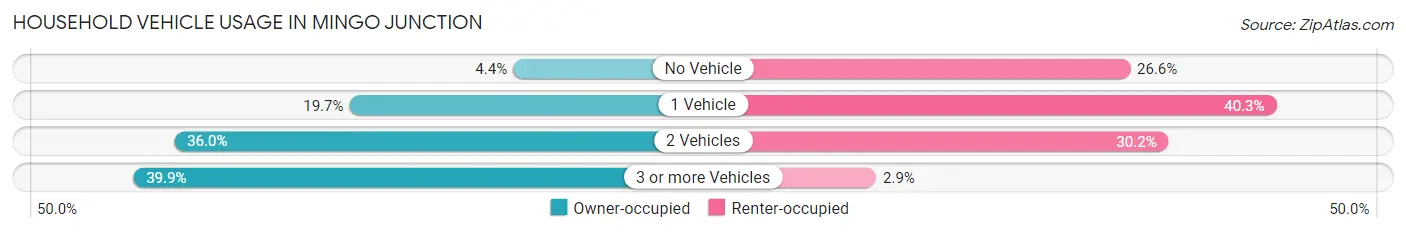
| Vehicles per Household | Owner-occupied | Renter-occupied |
| No Vehicle | 45 (4.4%) | 119 (26.6%) |
| 1 Vehicle | 201 (19.7%) | 180 (40.3%) |
| 2 Vehicles | 368 (36.0%) | 135 (30.2%) |
| 3 or more Vehicles | 407 (39.9%) | 13 (2.9%) |
| Total | 1,021 (100.0%) | 447 (100.0%) |
Real Estate & Mortgages in Mingo Junction
Real Estate and Mortgage Overview in Mingo Junction
| Characteristic | Without Mortgage | With Mortgage |
| Housing Units | 496 | 525 |
| Median Property Value | $90,800 | $103,800 |
| Median Household Income | $45,179 | $34 |
| Monthly Housing Costs | $390 | $6 |
| Real Estate Taxes | $669 | $52 |
Property Value by Mortgage Status in Mingo Junction
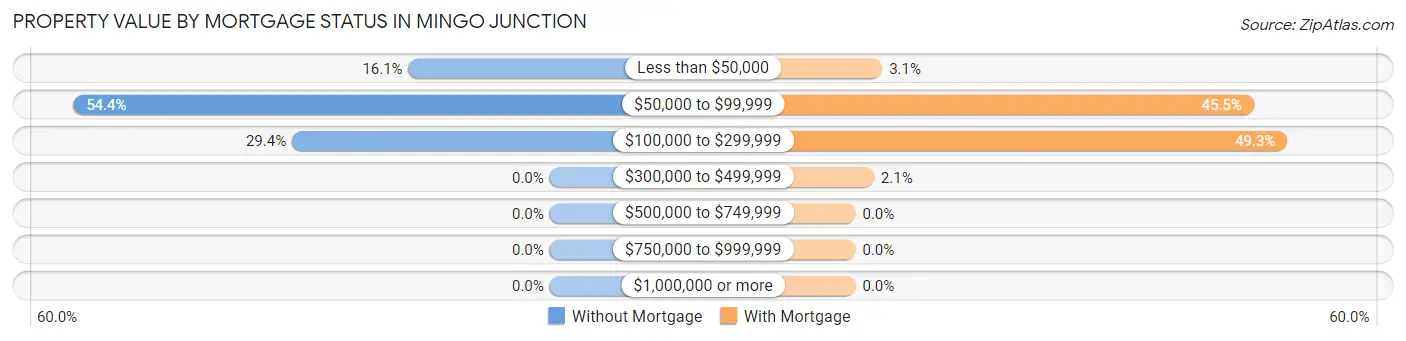
| Property Value | Without Mortgage | With Mortgage |
| Less than $50,000 | 80 (16.1%) | 16 (3.0%) |
| $50,000 to $99,999 | 270 (54.4%) | 239 (45.5%) |
| $100,000 to $299,999 | 146 (29.4%) | 259 (49.3%) |
| $300,000 to $499,999 | 0 (0.0%) | 11 (2.1%) |
| $500,000 to $749,999 | 0 (0.0%) | 0 (0.0%) |
| $750,000 to $999,999 | 0 (0.0%) | 0 (0.0%) |
| $1,000,000 or more | 0 (0.0%) | 0 (0.0%) |
| Total | 496 (100.0%) | 525 (100.0%) |
Household Income by Mortgage Status in Mingo Junction
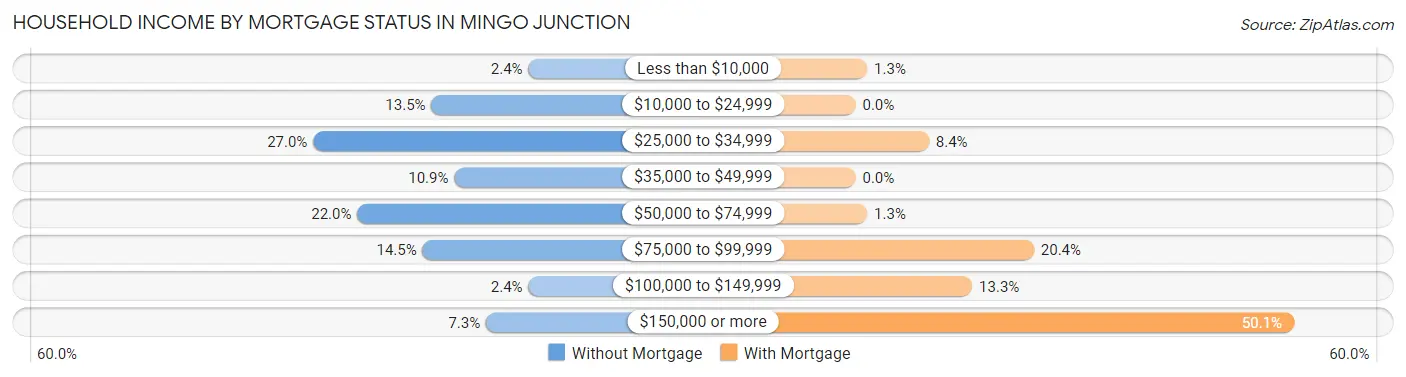
| Household Income | Without Mortgage | With Mortgage |
| Less than $10,000 | 12 (2.4%) | 7 (1.3%) |
| $10,000 to $24,999 | 67 (13.5%) | 0 (0.0%) |
| $25,000 to $34,999 | 134 (27.0%) | 44 (8.4%) |
| $35,000 to $49,999 | 54 (10.9%) | 0 (0.0%) |
| $50,000 to $74,999 | 109 (22.0%) | 7 (1.3%) |
| $75,000 to $99,999 | 72 (14.5%) | 107 (20.4%) |
| $100,000 to $149,999 | 12 (2.4%) | 70 (13.3%) |
| $150,000 or more | 36 (7.3%) | 263 (50.1%) |
| Total | 496 (100.0%) | 525 (100.0%) |
Property Value to Household Income Ratio in Mingo Junction
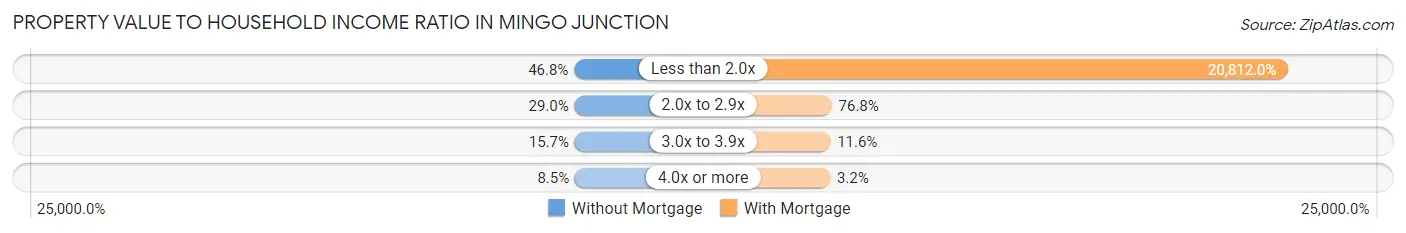
| Value-to-Income Ratio | Without Mortgage | With Mortgage |
| Less than 2.0x | 232 (46.8%) | 109,263 (20,812.0%) |
| 2.0x to 2.9x | 144 (29.0%) | 403 (76.8%) |
| 3.0x to 3.9x | 78 (15.7%) | 61 (11.6%) |
| 4.0x or more | 42 (8.5%) | 17 (3.2%) |
| Total | 496 (100.0%) | 525 (100.0%) |
Real Estate Taxes by Mortgage Status in Mingo Junction
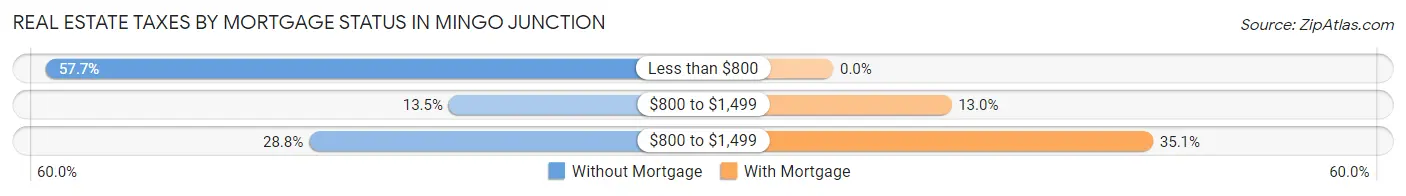
| Property Taxes | Without Mortgage | With Mortgage |
| Less than $800 | 286 (57.7%) | 0 (0.0%) |
| $800 to $1,499 | 67 (13.5%) | 68 (13.0%) |
| $800 to $1,499 | 143 (28.8%) | 184 (35.0%) |
| Total | 496 (100.0%) | 525 (100.0%) |
Health & Disability in Mingo Junction
Health Insurance Coverage by Age in Mingo Junction
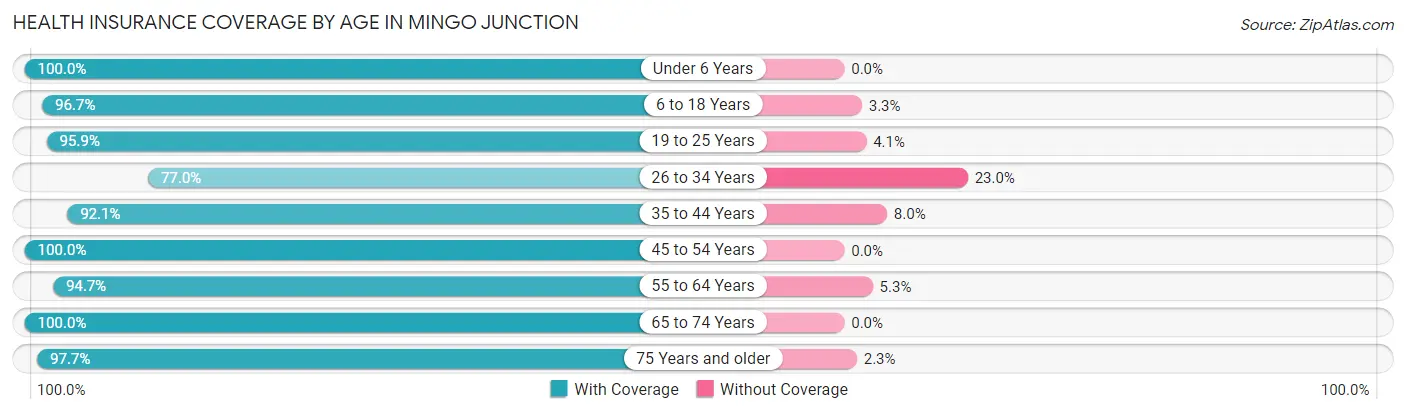
| Age Bracket | With Coverage | Without Coverage |
| Under 6 Years | 115 (100.0%) | 0 (0.0%) |
| 6 to 18 Years | 594 (96.7%) | 20 (3.3%) |
| 19 to 25 Years | 422 (95.9%) | 18 (4.1%) |
| 26 to 34 Years | 261 (77.0%) | 78 (23.0%) |
| 35 to 44 Years | 498 (92.0%) | 43 (8.0%) |
| 45 to 54 Years | 392 (100.0%) | 0 (0.0%) |
| 55 to 64 Years | 412 (94.7%) | 23 (5.3%) |
| 65 to 74 Years | 431 (100.0%) | 0 (0.0%) |
| 75 Years and older | 252 (97.7%) | 6 (2.3%) |
| Total | 3,377 (94.7%) | 188 (5.3%) |
Health Insurance Coverage by Citizenship Status in Mingo Junction
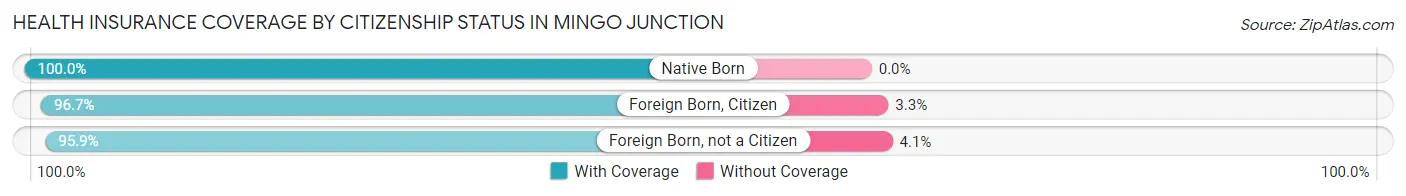
| Citizenship Status | With Coverage | Without Coverage |
| Native Born | 115 (100.0%) | 0 (0.0%) |
| Foreign Born, Citizen | 594 (96.7%) | 20 (3.3%) |
| Foreign Born, not a Citizen | 422 (95.9%) | 18 (4.1%) |
Health Insurance Coverage by Household Income in Mingo Junction
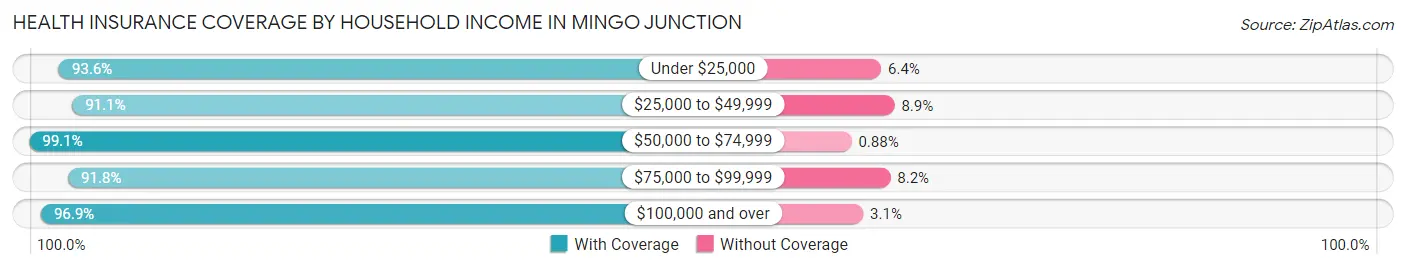
| Household Income | With Coverage | Without Coverage |
| Under $25,000 | 597 (93.6%) | 41 (6.4%) |
| $25,000 to $49,999 | 704 (91.1%) | 69 (8.9%) |
| $50,000 to $74,999 | 675 (99.1%) | 6 (0.9%) |
| $75,000 to $99,999 | 484 (91.8%) | 43 (8.2%) |
| $100,000 and over | 917 (96.9%) | 29 (3.1%) |
Public vs Private Health Insurance Coverage by Age in Mingo Junction
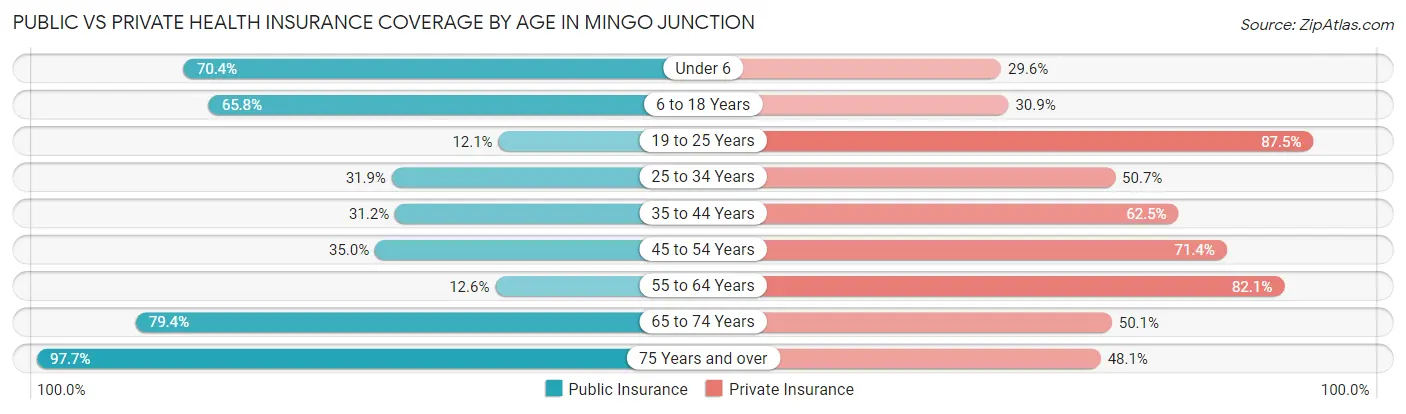
| Age Bracket | Public Insurance | Private Insurance |
| Under 6 | 81 (70.4%) | 34 (29.6%) |
| 6 to 18 Years | 404 (65.8%) | 190 (30.9%) |
| 19 to 25 Years | 53 (12.0%) | 385 (87.5%) |
| 25 to 34 Years | 108 (31.9%) | 172 (50.7%) |
| 35 to 44 Years | 169 (31.2%) | 338 (62.5%) |
| 45 to 54 Years | 137 (34.9%) | 280 (71.4%) |
| 55 to 64 Years | 55 (12.6%) | 357 (82.1%) |
| 65 to 74 Years | 342 (79.3%) | 216 (50.1%) |
| 75 Years and over | 252 (97.7%) | 124 (48.1%) |
| Total | 1,601 (44.9%) | 2,096 (58.8%) |
Disability Status by Sex by Age in Mingo Junction
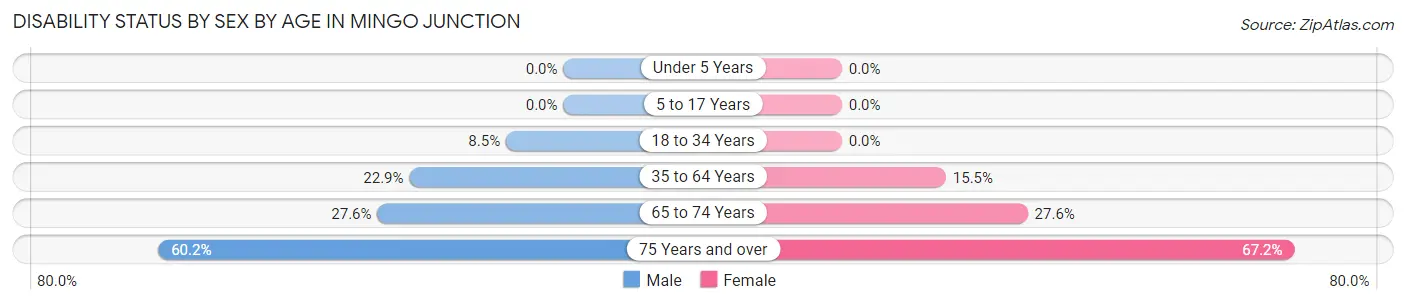
| Age Bracket | Male | Female |
| Under 5 Years | 0 (0.0%) | 0 (0.0%) |
| 5 to 17 Years | 0 (0.0%) | 0 (0.0%) |
| 18 to 34 Years | 39 (8.5%) | 0 (0.0%) |
| 35 to 64 Years | 156 (22.9%) | 106 (15.4%) |
| 65 to 74 Years | 58 (27.6%) | 61 (27.6%) |
| 75 Years and over | 80 (60.2%) | 84 (67.2%) |
Disability Class by Sex by Age in Mingo Junction
Disability Class: Hearing Difficulty
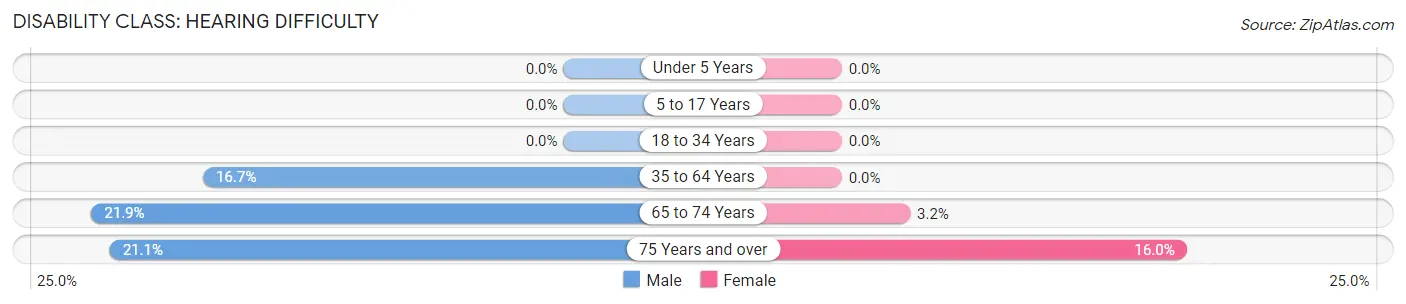
| Age Bracket | Male | Female |
| Under 5 Years | 0 (0.0%) | 0 (0.0%) |
| 5 to 17 Years | 0 (0.0%) | 0 (0.0%) |
| 18 to 34 Years | 0 (0.0%) | 0 (0.0%) |
| 35 to 64 Years | 114 (16.7%) | 0 (0.0%) |
| 65 to 74 Years | 46 (21.9%) | 7 (3.2%) |
| 75 Years and over | 28 (21.0%) | 20 (16.0%) |
Disability Class: Vision Difficulty
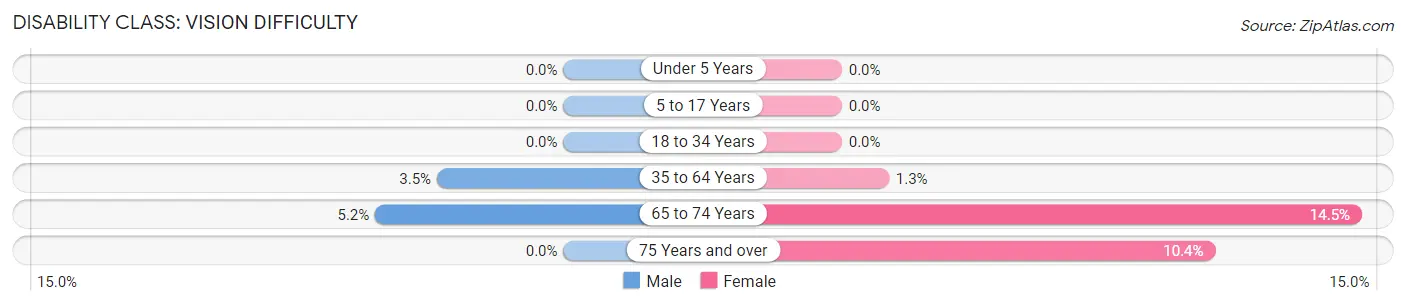
| Age Bracket | Male | Female |
| Under 5 Years | 0 (0.0%) | 0 (0.0%) |
| 5 to 17 Years | 0 (0.0%) | 0 (0.0%) |
| 18 to 34 Years | 0 (0.0%) | 0 (0.0%) |
| 35 to 64 Years | 24 (3.5%) | 9 (1.3%) |
| 65 to 74 Years | 11 (5.2%) | 32 (14.5%) |
| 75 Years and over | 0 (0.0%) | 13 (10.4%) |
Disability Class: Cognitive Difficulty
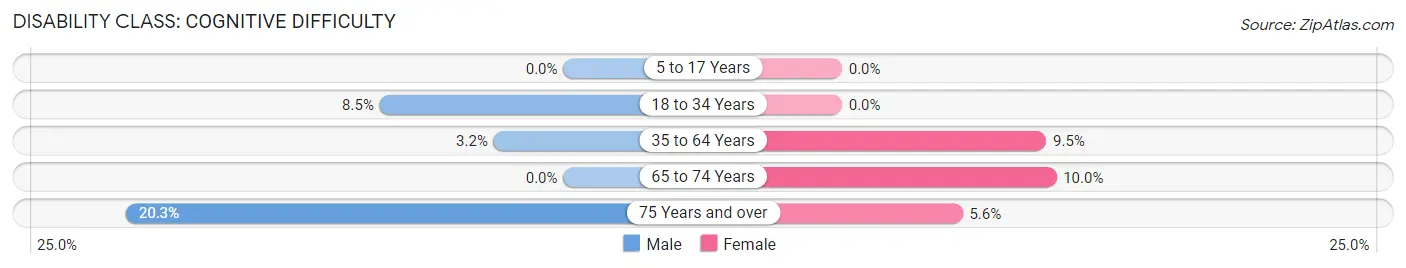
| Age Bracket | Male | Female |
| 5 to 17 Years | 0 (0.0%) | 0 (0.0%) |
| 18 to 34 Years | 39 (8.5%) | 0 (0.0%) |
| 35 to 64 Years | 22 (3.2%) | 65 (9.5%) |
| 65 to 74 Years | 0 (0.0%) | 22 (10.0%) |
| 75 Years and over | 27 (20.3%) | 7 (5.6%) |
Disability Class: Ambulatory Difficulty
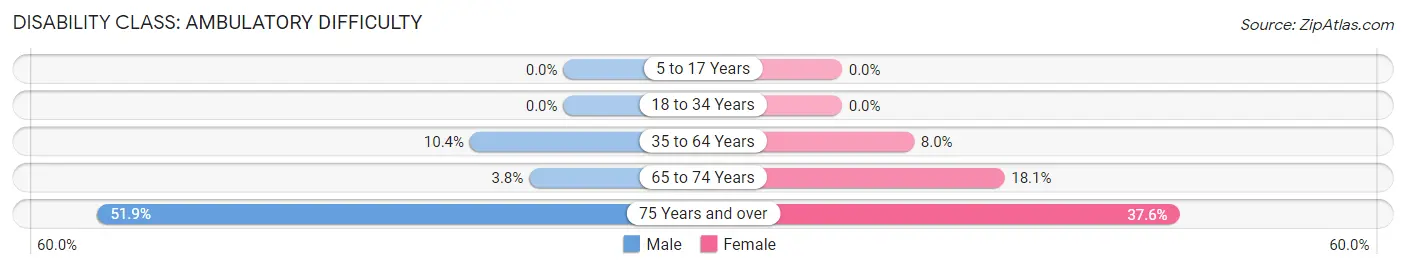
| Age Bracket | Male | Female |
| 5 to 17 Years | 0 (0.0%) | 0 (0.0%) |
| 18 to 34 Years | 0 (0.0%) | 0 (0.0%) |
| 35 to 64 Years | 71 (10.4%) | 55 (8.0%) |
| 65 to 74 Years | 8 (3.8%) | 40 (18.1%) |
| 75 Years and over | 69 (51.9%) | 47 (37.6%) |
Disability Class: Self-Care Difficulty
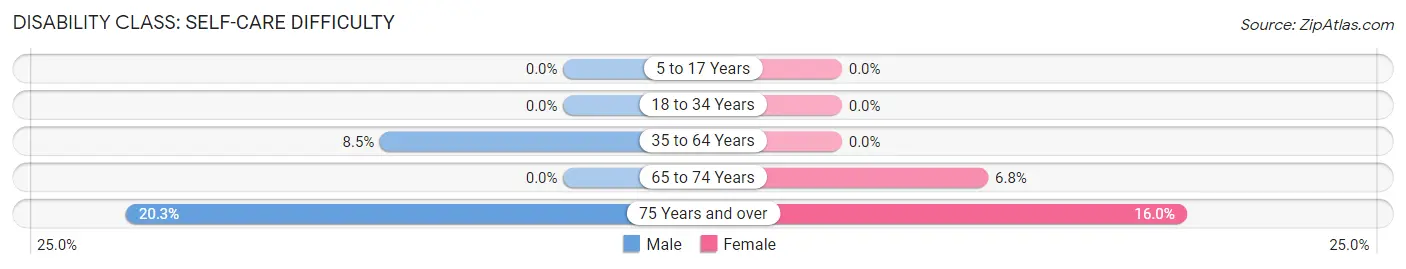
| Age Bracket | Male | Female |
| 5 to 17 Years | 0 (0.0%) | 0 (0.0%) |
| 18 to 34 Years | 0 (0.0%) | 0 (0.0%) |
| 35 to 64 Years | 58 (8.5%) | 0 (0.0%) |
| 65 to 74 Years | 0 (0.0%) | 15 (6.8%) |
| 75 Years and over | 27 (20.3%) | 20 (16.0%) |
Technology Access in Mingo Junction
Computing Device Access in Mingo Junction
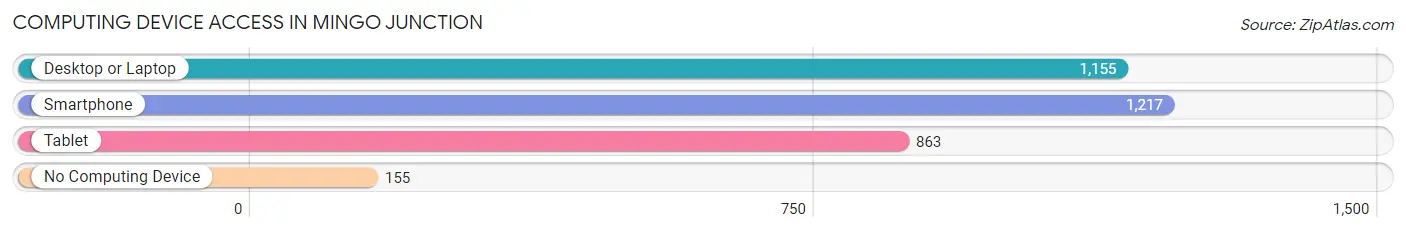
| Device Type | # Households | % Households |
| Desktop or Laptop | 1,155 | 78.7% |
| Smartphone | 1,217 | 82.9% |
| Tablet | 863 | 58.8% |
| No Computing Device | 155 | 10.6% |
| Total | 1,468 | 100.0% |
Internet Access in Mingo Junction
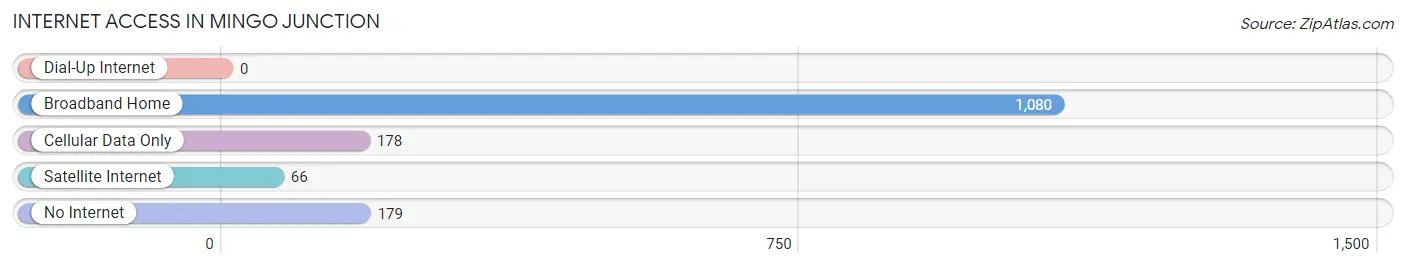
| Internet Type | # Households | % Households |
| Dial-Up Internet | 0 | 0.0% |
| Broadband Home | 1,080 | 73.6% |
| Cellular Data Only | 178 | 12.1% |
| Satellite Internet | 66 | 4.5% |
| No Internet | 179 | 12.2% |
| Total | 1,468 | 100.0% |
Mingo Junction Summary
Mingo Junction is a village located in Jefferson County, Ohio, United States. It is situated along the Ohio River, just south of Steubenville. The population was 3,454 at the 2010 census.
History
Mingo Junction was founded in 1854 by the Mingo Iron and Coal Company. The company was formed by a group of investors from Pittsburgh, Pennsylvania, who wanted to take advantage of the area's abundant natural resources. The village was named after the nearby Mingo Creek, which was named after the Mingo Native American tribe.
The village grew rapidly in the late 19th century, becoming an important industrial center. The Mingo Iron and Coal Company built a blast furnace and rolling mill, and the village became a major producer of steel. The village also had several glass factories, which produced bottles, jars, and other glass products.
In the early 20th century, the village's economy began to decline. The steel industry was hit hard by the Great Depression, and many of the factories closed. The glass industry also suffered, and the last glass factory closed in the 1950s.
Geography
Mingo Junction is located at 40°22′17″N 80°41′45″W (40.3714, -80.6958). According to the United States Census Bureau, the village has a total area of 1.3 square miles (3.4 km2), all land.
Economy
Mingo Junction's economy is largely based on manufacturing. The village is home to several factories, including a steel mill, a glass factory, and a plastics factory. The village also has several retail stores and restaurants.
Demographics
As of the census of 2010, there were 3,454 people, 1,521 households, and 890 families residing in the village. The population density was 2,637.7 people per square mile (1,017.2/km2). There were 1,717 housing units at an average density of 1,323.8 per square mile (510.3/km2). The racial makeup of the village was 97.2% White, 0.9% African American, 0.2% Native American, 0.2% Asian, 0.1% Pacific Islander, 0.3% from other races, and 1.1% from two or more races. Hispanic or Latino of any race were 0.9% of the population.
There were 1,521 households, out of which 24.2% had children under the age of 18 living with them, 38.2% were married couples living together, 15.3% had a female householder with no husband present, and 41.7% were non-families. 36.2% of all households were made up of individuals, and 17.2% had someone living alone who was 65 years of age or older. The average household size was 2.26 and the average family size was 2.93.
In the village, the population was spread out, with 21.2% under the age of 18, 8.2% from 18 to 24, 25.2% from 25 to 44, 25.2% from 45 to 64, and 20.2% who were 65 years of age or older. The median age was 41 years. For every 100 females, there were 90.2 males. For every 100 females age 18 and over, there were 86.2 males.
The median income for a household in the village was $27,917, and the median income for a family was $35,938. Males had a median income of $31,250 versus $20,938 for females. The per capita income for the village was $15,945. About 11.2% of families and 14.2% of the population were below the poverty line, including 20.2% of those under age 18 and 8.2% of those age 65 or over.
Common Questions
What is Per Capita Income in Mingo Junction?
Per Capita income in Mingo Junction is $29,148.
What is the Median Family Income in Mingo Junction?
Median Family Income in Mingo Junction is $67,784.
What is the Median Household income in Mingo Junction?
Median Household Income in Mingo Junction is $58,141.
What is Income or Wage Gap in Mingo Junction?
Income or Wage Gap in Mingo Junction is 49.7%.
Women in Mingo Junction earn 50.3 cents for every dollar earned by a man.
What is Inequality or Gini Index in Mingo Junction?
Inequality or Gini Index in Mingo Junction is 0.42.
What is the Total Population of Mingo Junction?
Total Population of Mingo Junction is 3,565.
What is the Total Male Population of Mingo Junction?
Total Male Population of Mingo Junction is 1,777.
What is the Total Female Population of Mingo Junction?
Total Female Population of Mingo Junction is 1,788.
What is the Ratio of Males per 100 Females in Mingo Junction?
There are 99.38 Males per 100 Females in Mingo Junction.
What is the Ratio of Females per 100 Males in Mingo Junction?
There are 100.62 Females per 100 Males in Mingo Junction.
What is the Median Population Age in Mingo Junction?
Median Population Age in Mingo Junction is 41.2 Years.
What is the Average Family Size in Mingo Junction
Average Family Size in Mingo Junction is 2.8 People.
What is the Average Household Size in Mingo Junction
Average Household Size in Mingo Junction is 2.4 People.
How Large is the Labor Force in Mingo Junction?
There are 1,808 People in the Labor Forcein in Mingo Junction.
What is the Percentage of People in the Labor Force in Mingo Junction?
60.2% of People are in the Labor Force in Mingo Junction.
What is the Unemployment Rate in Mingo Junction?
Unemployment Rate in Mingo Junction is 4.5%.