Millersport, OH Map & Demographics
Millersport Map
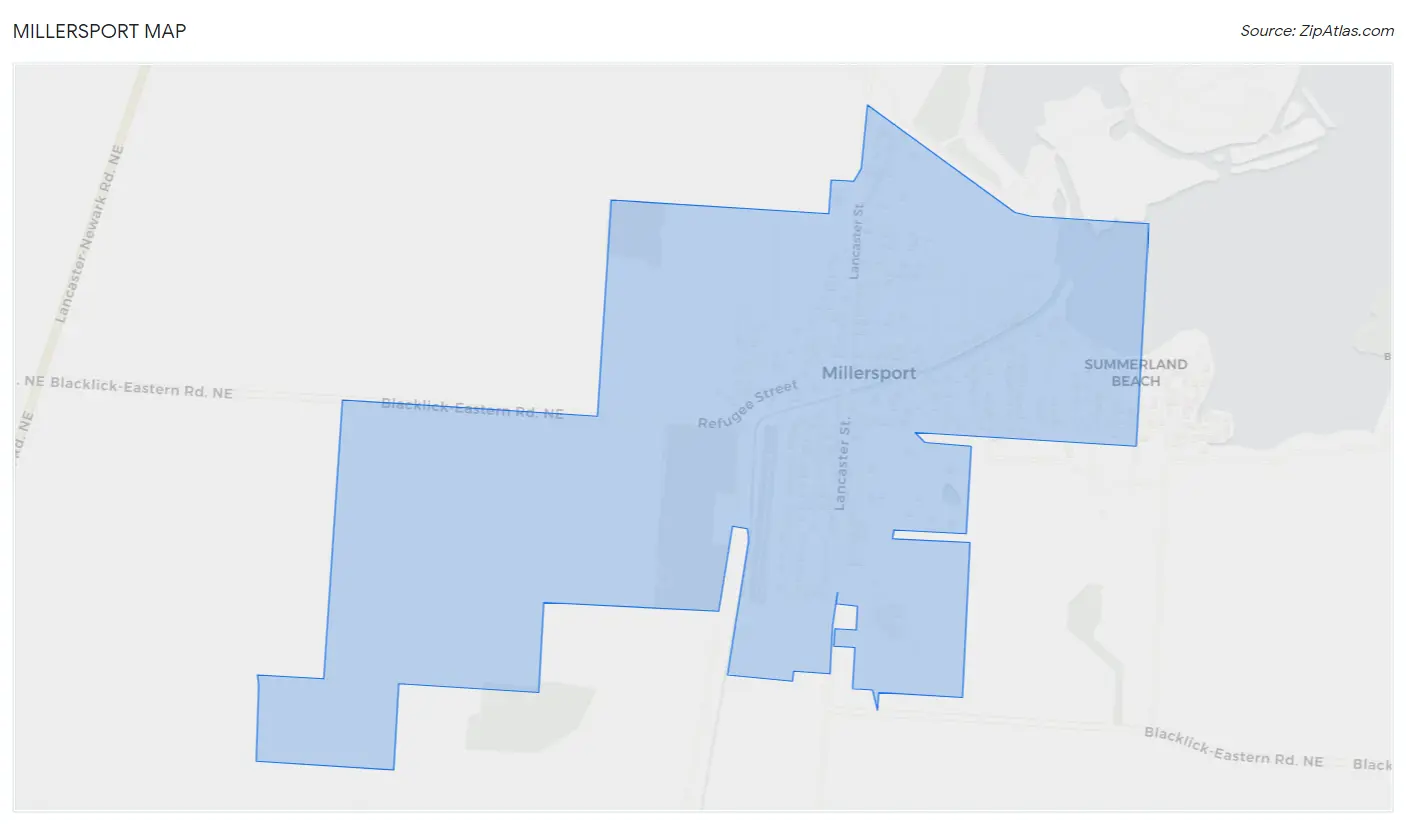
Millersport Overview
$35,176
PER CAPITA INCOME
$73,839
AVG FAMILY INCOME
$69,063
AVG HOUSEHOLD INCOME
69.0%
WAGE / INCOME GAP [ % ]
31.0¢/ $1
WAGE / INCOME GAP [ $ ]
0.42
INEQUALITY / GINI INDEX
974
TOTAL POPULATION
443
MALE POPULATION
531
FEMALE POPULATION
83.43
MALES / 100 FEMALES
119.86
FEMALES / 100 MALES
43.9
MEDIAN AGE
2.8
AVG FAMILY SIZE
2.3
AVG HOUSEHOLD SIZE
522
LABOR FORCE [ PEOPLE ]
64.5%
PERCENT IN LABOR FORCE
12.1%
UNEMPLOYMENT RATE
Millersport Zip Codes
Millersport Area Codes
Income in Millersport
Income Overview in Millersport
Per Capita Income in Millersport is $35,176, while median incomes of families and households are $73,839 and $69,063 respectively.
| Characteristic | Number | Measure |
| Per Capita Income | 974 | $35,176 |
| Median Family Income | 290 | $73,839 |
| Mean Family Income | 290 | $84,362 |
| Median Household Income | 420 | $69,063 |
| Mean Household Income | 420 | $79,383 |
| Income Deficit | 290 | $0 |
| Wage / Income Gap (%) | 974 | 69.03% |
| Wage / Income Gap ($) | 974 | 30.97¢ per $1 |
| Gini / Inequality Index | 974 | 0.42 |
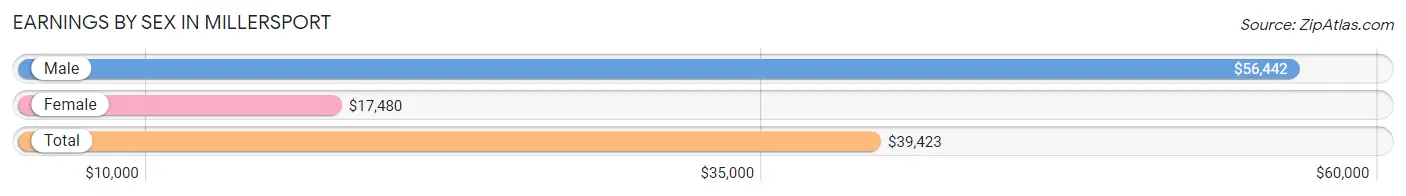
Earnings by Sex in Millersport
Average Earnings in Millersport are $39,423, $56,442 for men and $17,480 for women, a difference of 69.0%.
| Sex | Number | Average Earnings |
| Male | 261 (48.0%) | $56,442 |
| Female | 283 (52.0%) | $17,480 |
| Total | 544 (100.0%) | $39,423 |
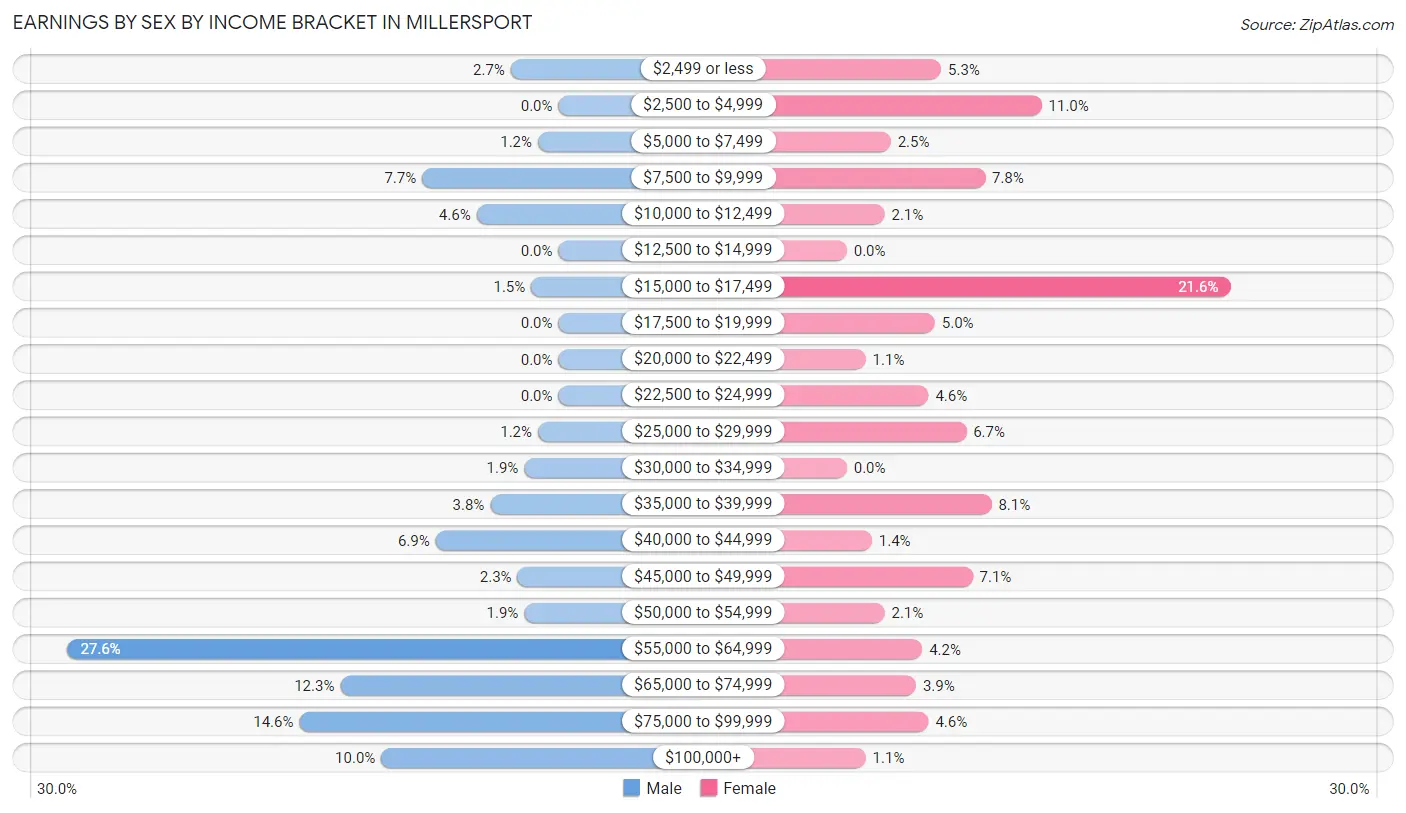
Earnings by Sex by Income Bracket in Millersport
The most common earnings brackets in Millersport are $55,000 to $64,999 for men (72 | 27.6%) and $15,000 to $17,499 for women (61 | 21.5%).
| Income | Male | Female |
| $2,499 or less | 7 (2.7%) | 15 (5.3%) |
| $2,500 to $4,999 | 0 (0.0%) | 31 (11.0%) |
| $5,000 to $7,499 | 3 (1.1%) | 7 (2.5%) |
| $7,500 to $9,999 | 20 (7.7%) | 22 (7.8%) |
| $10,000 to $12,499 | 12 (4.6%) | 6 (2.1%) |
| $12,500 to $14,999 | 0 (0.0%) | 0 (0.0%) |
| $15,000 to $17,499 | 4 (1.5%) | 61 (21.5%) |
| $17,500 to $19,999 | 0 (0.0%) | 14 (5.0%) |
| $20,000 to $22,499 | 0 (0.0%) | 3 (1.1%) |
| $22,500 to $24,999 | 0 (0.0%) | 13 (4.6%) |
| $25,000 to $29,999 | 3 (1.1%) | 19 (6.7%) |
| $30,000 to $34,999 | 5 (1.9%) | 0 (0.0%) |
| $35,000 to $39,999 | 10 (3.8%) | 23 (8.1%) |
| $40,000 to $44,999 | 18 (6.9%) | 4 (1.4%) |
| $45,000 to $49,999 | 6 (2.3%) | 20 (7.1%) |
| $50,000 to $54,999 | 5 (1.9%) | 6 (2.1%) |
| $55,000 to $64,999 | 72 (27.6%) | 12 (4.2%) |
| $65,000 to $74,999 | 32 (12.3%) | 11 (3.9%) |
| $75,000 to $99,999 | 38 (14.6%) | 13 (4.6%) |
| $100,000+ | 26 (10.0%) | 3 (1.1%) |
| Total | 261 (100.0%) | 283 (100.0%) |
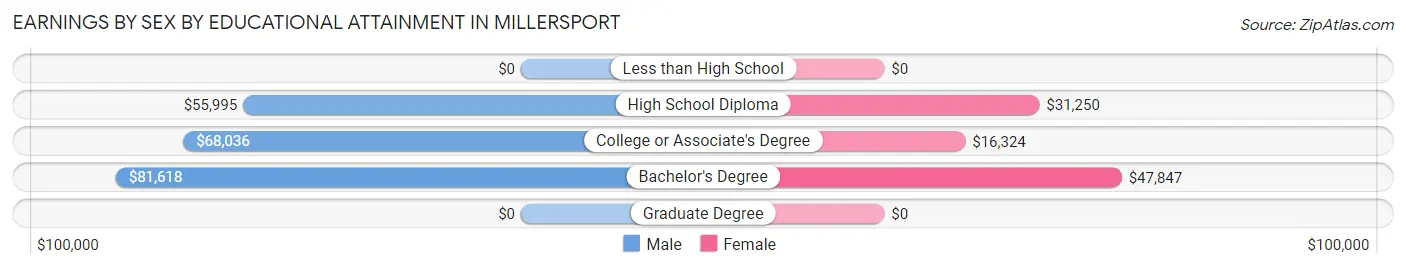
Earnings by Sex by Educational Attainment in Millersport
Average earnings in Millersport are $57,135 for men and $23,173 for women, a difference of 59.4%. Men with an educational attainment of bachelor's degree enjoy the highest average annual earnings of $81,618, while those with high school diploma education earn the least with $55,995. Women with an educational attainment of bachelor's degree earn the most with the average annual earnings of $47,847, while those with college or associate's degree education have the smallest earnings of $16,324.
| Educational Attainment | Male Income | Female Income |
| Less than High School | - | - |
| High School Diploma | $55,995 | $31,250 |
| College or Associate's Degree | $68,036 | $16,324 |
| Bachelor's Degree | $81,618 | $47,847 |
| Graduate Degree | - | - |
| Total | $57,135 | $23,173 |
Family Income in Millersport
Family Income Brackets in Millersport
According to the Millersport family income data, there are 110 families falling into the $50,000 to $74,999 income range, which is the most common income bracket and makes up 37.9% of all families.
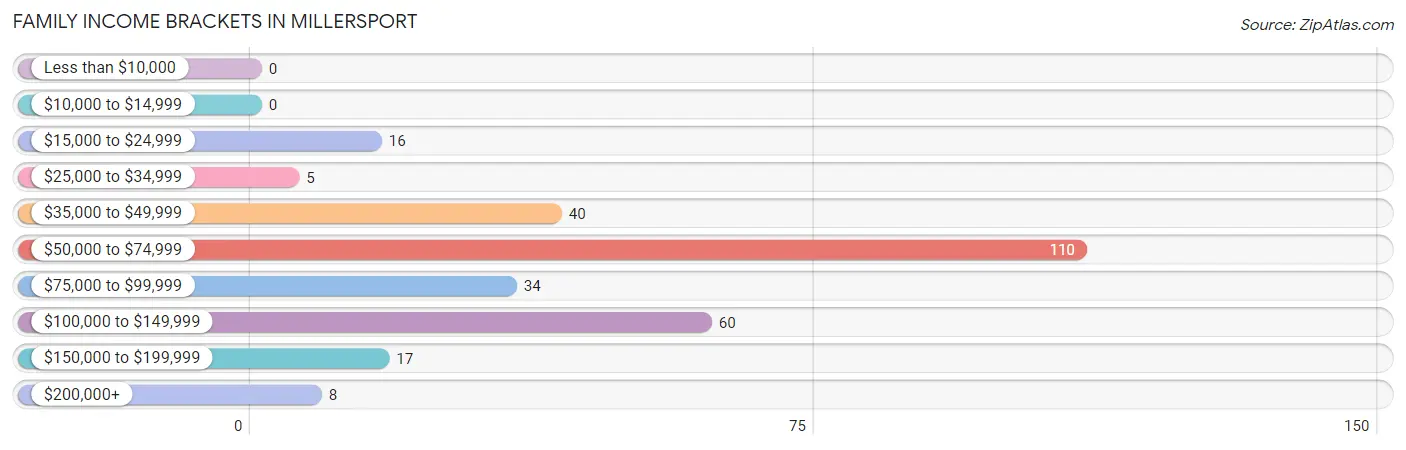
| Income Bracket | # Families | % Families |
| Less than $10,000 | 0 | 0.0% |
| $10,000 to $14,999 | 0 | 0.0% |
| $15,000 to $24,999 | 16 | 5.5% |
| $25,000 to $34,999 | 5 | 1.7% |
| $35,000 to $49,999 | 40 | 13.8% |
| $50,000 to $74,999 | 110 | 37.9% |
| $75,000 to $99,999 | 34 | 11.7% |
| $100,000 to $149,999 | 60 | 20.7% |
| $150,000 to $199,999 | 17 | 5.9% |
| $200,000+ | 8 | 2.8% |
Family Income by Famaliy Size in Millersport
2-person families (195 | 67.2%) account for the highest median family income in Millersport with $73,897 per family, while 2-person families (195 | 67.2%) have the highest median income of $36,948 per family member.
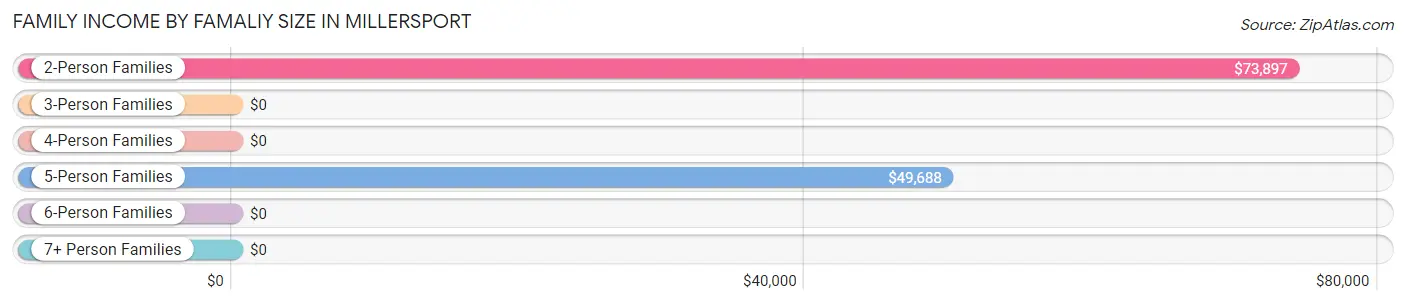
| Income Bracket | # Families | Median Income |
| 2-Person Families | 195 (67.2%) | $73,897 |
| 3-Person Families | 37 (12.8%) | $0 |
| 4-Person Families | 22 (7.6%) | $0 |
| 5-Person Families | 21 (7.2%) | $49,688 |
| 6-Person Families | 8 (2.8%) | $0 |
| 7+ Person Families | 7 (2.4%) | $0 |
| Total | 290 (100.0%) | $73,839 |
Family Income by Number of Earners in Millersport
The median family income in Millersport is $73,839, with families comprising 3+ earners (19) having the highest median family income of $129,063, while families with no earners (54) have the lowest median family income of $50,893, accounting for 6.6% and 18.6% of families, respectively.
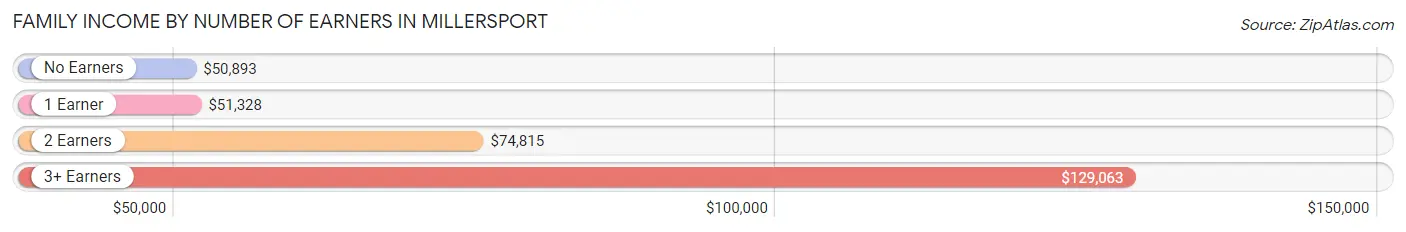
| Number of Earners | # Families | Median Income |
| No Earners | 54 (18.6%) | $50,893 |
| 1 Earner | 75 (25.9%) | $51,328 |
| 2 Earners | 142 (49.0%) | $74,815 |
| 3+ Earners | 19 (6.6%) | $129,063 |
| Total | 290 (100.0%) | $73,839 |
Household Income in Millersport
Household Income Brackets in Millersport
With 113 households falling in the category, the $50,000 to $74,999 income range is the most frequent in Millersport, accounting for 26.9% of all households. In contrast, only 14 households (3.3%) fall into the $200,000+ income bracket, making it the least populous group.
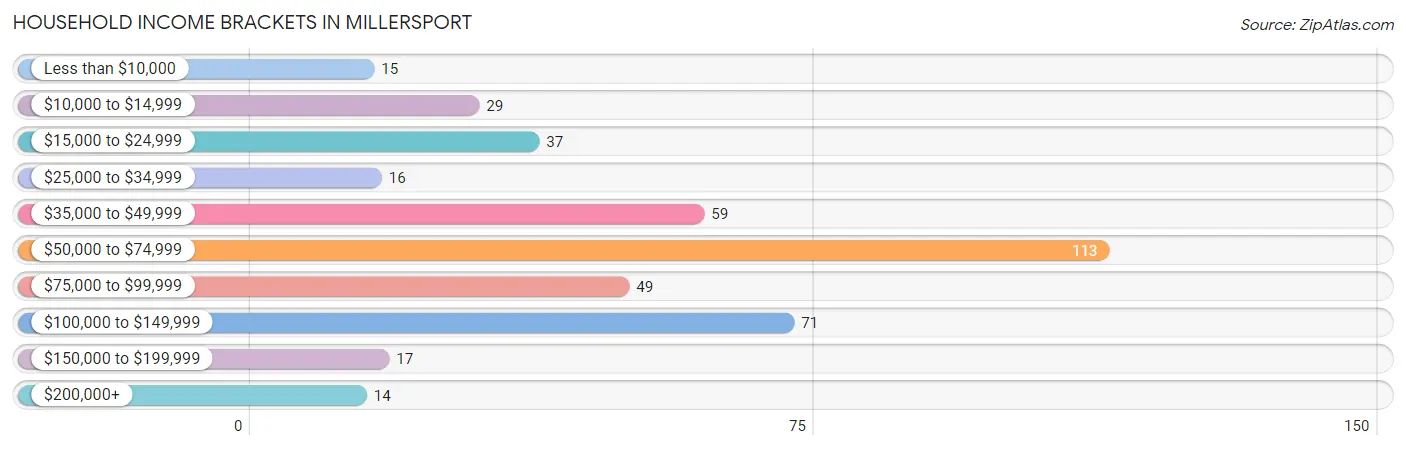
| Income Bracket | # Households | % Households |
| Less than $10,000 | 15 | 3.6% |
| $10,000 to $14,999 | 29 | 6.9% |
| $15,000 to $24,999 | 37 | 8.8% |
| $25,000 to $34,999 | 16 | 3.8% |
| $35,000 to $49,999 | 59 | 14.0% |
| $50,000 to $74,999 | 113 | 26.9% |
| $75,000 to $99,999 | 49 | 11.7% |
| $100,000 to $149,999 | 71 | 16.9% |
| $150,000 to $199,999 | 17 | 4.0% |
| $200,000+ | 14 | 3.3% |
Household Income by Householder Age in Millersport
The median household income in Millersport is $69,063, with the highest median household income of $80,625 found in the 25 to 44 years age bracket for the primary householder. A total of 116 households (27.6%) fall into this category. Meanwhile, the 15 to 24 years age bracket for the primary householder has the lowest median household income of $0, with 15 households (3.6%) in this group.
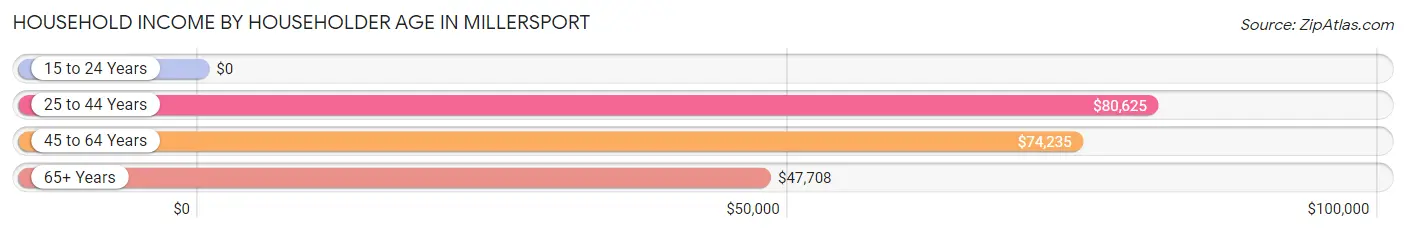
| Income Bracket | # Households | Median Income |
| 15 to 24 Years | 15 (3.6%) | $0 |
| 25 to 44 Years | 116 (27.6%) | $80,625 |
| 45 to 64 Years | 156 (37.1%) | $74,235 |
| 65+ Years | 133 (31.7%) | $47,708 |
| Total | 420 (100.0%) | $69,063 |
Poverty in Millersport
Income Below Poverty by Sex and Age in Millersport
With 7.5% poverty level for males and 11.8% for females among the residents of Millersport, under 5 year old males and 18 to 24 year old females are the most vulnerable to poverty, with 9 males (52.9%) and 17 females (31.5%) in their respective age groups living below the poverty level.
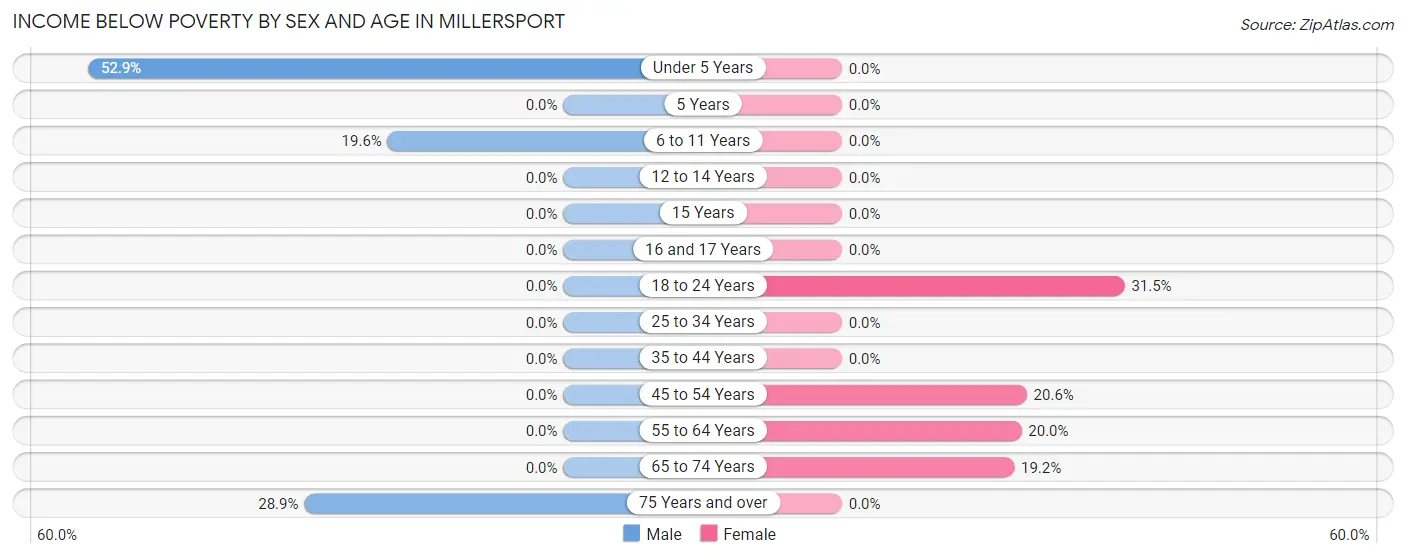
| Age Bracket | Male | Female |
| Under 5 Years | 9 (52.9%) | 0 (0.0%) |
| 5 Years | 0 (0.0%) | 0 (0.0%) |
| 6 to 11 Years | 9 (19.6%) | 0 (0.0%) |
| 12 to 14 Years | 0 (0.0%) | 0 (0.0%) |
| 15 Years | 0 (0.0%) | 0 (0.0%) |
| 16 and 17 Years | 0 (0.0%) | 0 (0.0%) |
| 18 to 24 Years | 0 (0.0%) | 17 (31.5%) |
| 25 to 34 Years | 0 (0.0%) | 0 (0.0%) |
| 35 to 44 Years | 0 (0.0%) | 0 (0.0%) |
| 45 to 54 Years | 0 (0.0%) | 7 (20.6%) |
| 55 to 64 Years | 0 (0.0%) | 24 (20.0%) |
| 65 to 74 Years | 0 (0.0%) | 14 (19.2%) |
| 75 Years and over | 15 (28.8%) | 0 (0.0%) |
| Total | 33 (7.5%) | 62 (11.8%) |
Income Above Poverty by Sex and Age in Millersport
According to the poverty statistics in Millersport, males aged 12 to 14 years and females aged under 5 years are the age groups that are most secure financially, with 100.0% of males and 100.0% of females in these age groups living above the poverty line.
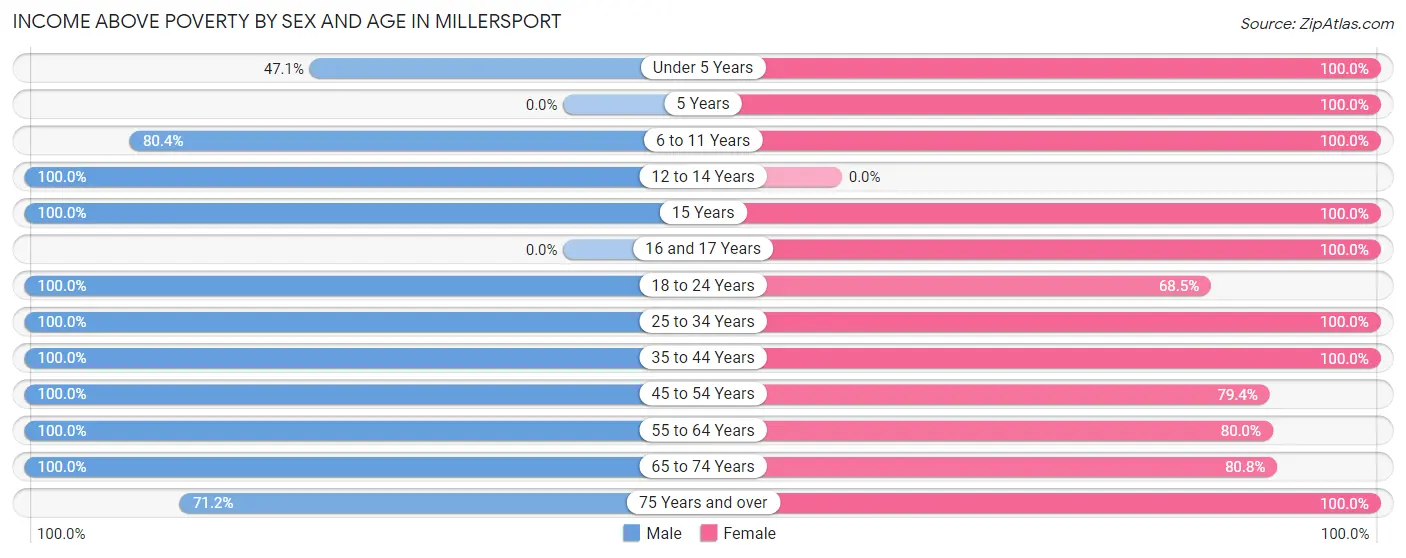
| Age Bracket | Male | Female |
| Under 5 Years | 8 (47.1%) | 19 (100.0%) |
| 5 Years | 0 (0.0%) | 20 (100.0%) |
| 6 to 11 Years | 37 (80.4%) | 27 (100.0%) |
| 12 to 14 Years | 14 (100.0%) | 0 (0.0%) |
| 15 Years | 4 (100.0%) | 9 (100.0%) |
| 16 and 17 Years | 0 (0.0%) | 8 (100.0%) |
| 18 to 24 Years | 36 (100.0%) | 37 (68.5%) |
| 25 to 34 Years | 58 (100.0%) | 64 (100.0%) |
| 35 to 44 Years | 47 (100.0%) | 56 (100.0%) |
| 45 to 54 Years | 11 (100.0%) | 27 (79.4%) |
| 55 to 64 Years | 112 (100.0%) | 96 (80.0%) |
| 65 to 74 Years | 41 (100.0%) | 59 (80.8%) |
| 75 Years and over | 37 (71.2%) | 43 (100.0%) |
| Total | 405 (92.5%) | 465 (88.2%) |
Income Below Poverty Among Married-Couple Families in Millersport
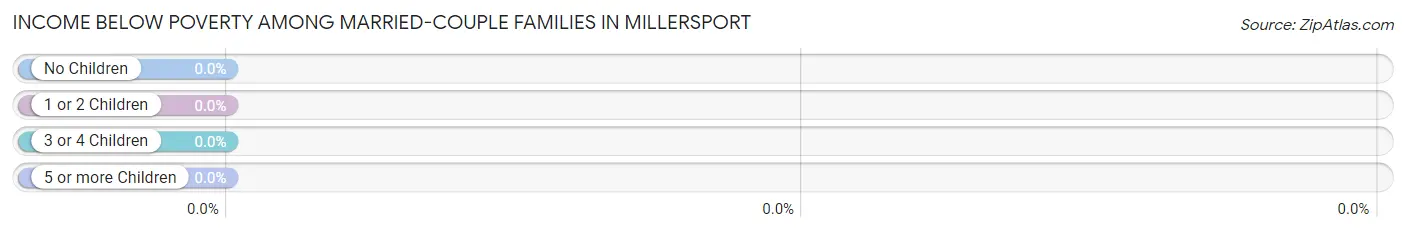
| Children | Above Poverty | Below Poverty |
| No Children | 173 (100.0%) | 0 (0.0%) |
| 1 or 2 Children | 24 (100.0%) | 0 (0.0%) |
| 3 or 4 Children | 25 (100.0%) | 0 (0.0%) |
| 5 or more Children | 0 (0.0%) | 0 (0.0%) |
| Total | 222 (100.0%) | 0 (0.0%) |
Income Below Poverty Among Single-Parent Households in Millersport
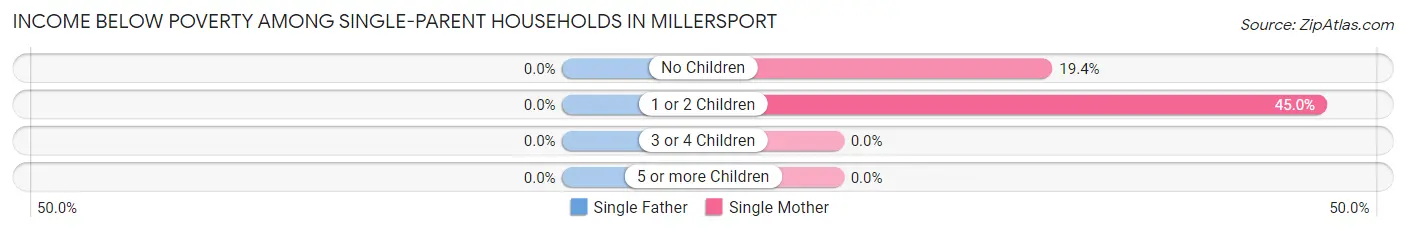
| Children | Single Father | Single Mother |
| No Children | 0 (0.0%) | 7 (19.4%) |
| 1 or 2 Children | 0 (0.0%) | 9 (45.0%) |
| 3 or 4 Children | 0 (0.0%) | 0 (0.0%) |
| 5 or more Children | 0 (0.0%) | 0 (0.0%) |
| Total | 0 (0.0%) | 16 (28.6%) |
Income Below Poverty Among Married-Couple vs Single-Parent Households in Millersport
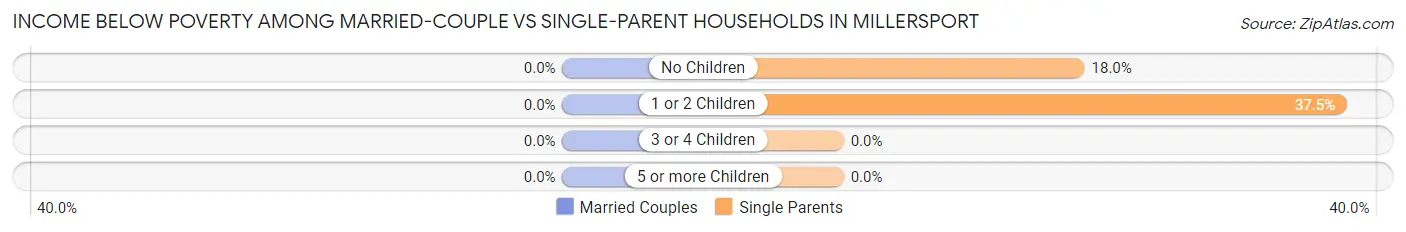
| Children | Married-Couple Families | Single-Parent Households |
| No Children | 0 (0.0%) | 7 (17.9%) |
| 1 or 2 Children | 0 (0.0%) | 9 (37.5%) |
| 3 or 4 Children | 0 (0.0%) | 0 (0.0%) |
| 5 or more Children | 0 (0.0%) | 0 (0.0%) |
| Total | 0 (0.0%) | 16 (23.5%) |
Race in Millersport
The most populous races in Millersport are White / Caucasian (936 | 96.1%), Two or more Races (30 | 3.1%), and Hispanic or Latino (24 | 2.5%).
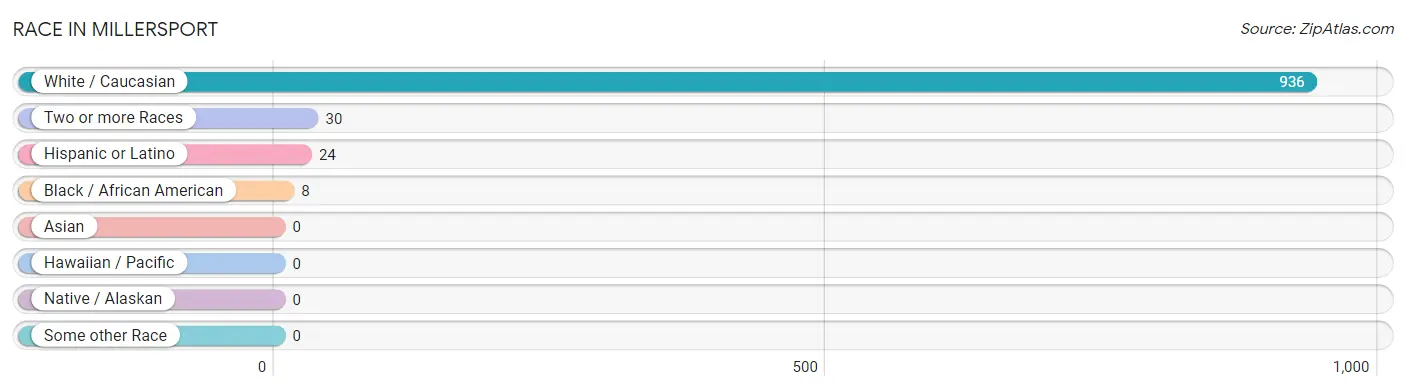
| Race | # Population | % Population |
| Asian | 0 | 0.0% |
| Black / African American | 8 | 0.8% |
| Hawaiian / Pacific | 0 | 0.0% |
| Hispanic or Latino | 24 | 2.5% |
| Native / Alaskan | 0 | 0.0% |
| White / Caucasian | 936 | 96.1% |
| Two or more Races | 30 | 3.1% |
| Some other Race | 0 | 0.0% |
| Total | 974 | 100.0% |
Ancestry in Millersport
The most populous ancestries reported in Millersport are German (238 | 24.4%), Irish (234 | 24.0%), English (219 | 22.5%), Danish (47 | 4.8%), and American (42 | 4.3%), together accounting for 80.1% of all Millersport residents.
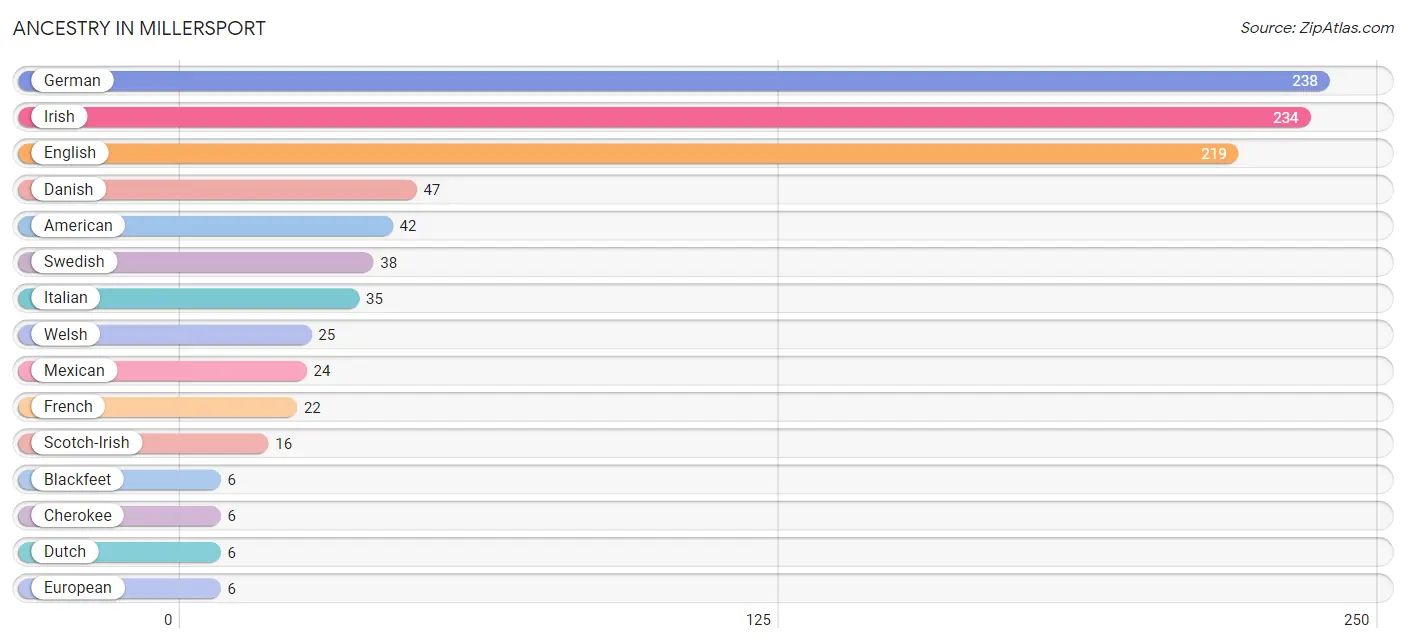
| Ancestry | # Population | % Population |
| American | 42 | 4.3% |
| Blackfeet | 6 | 0.6% |
| Cherokee | 6 | 0.6% |
| Danish | 47 | 4.8% |
| Dutch | 6 | 0.6% |
| English | 219 | 22.5% |
| European | 6 | 0.6% |
| French | 22 | 2.3% |
| German | 238 | 24.4% |
| Hungarian | 3 | 0.3% |
| Irish | 234 | 24.0% |
| Italian | 35 | 3.6% |
| Mexican | 24 | 2.5% |
| Scotch-Irish | 16 | 1.6% |
| Scottish | 4 | 0.4% |
| Slavic | 3 | 0.3% |
| Swedish | 38 | 3.9% |
| Welsh | 25 | 2.6% | View All 18 Rows |
Immigrants in Millersport

| Immigration Origin | # Population | % Population | View All 0 Rows |
Sex and Age in Millersport
Sex and Age in Millersport
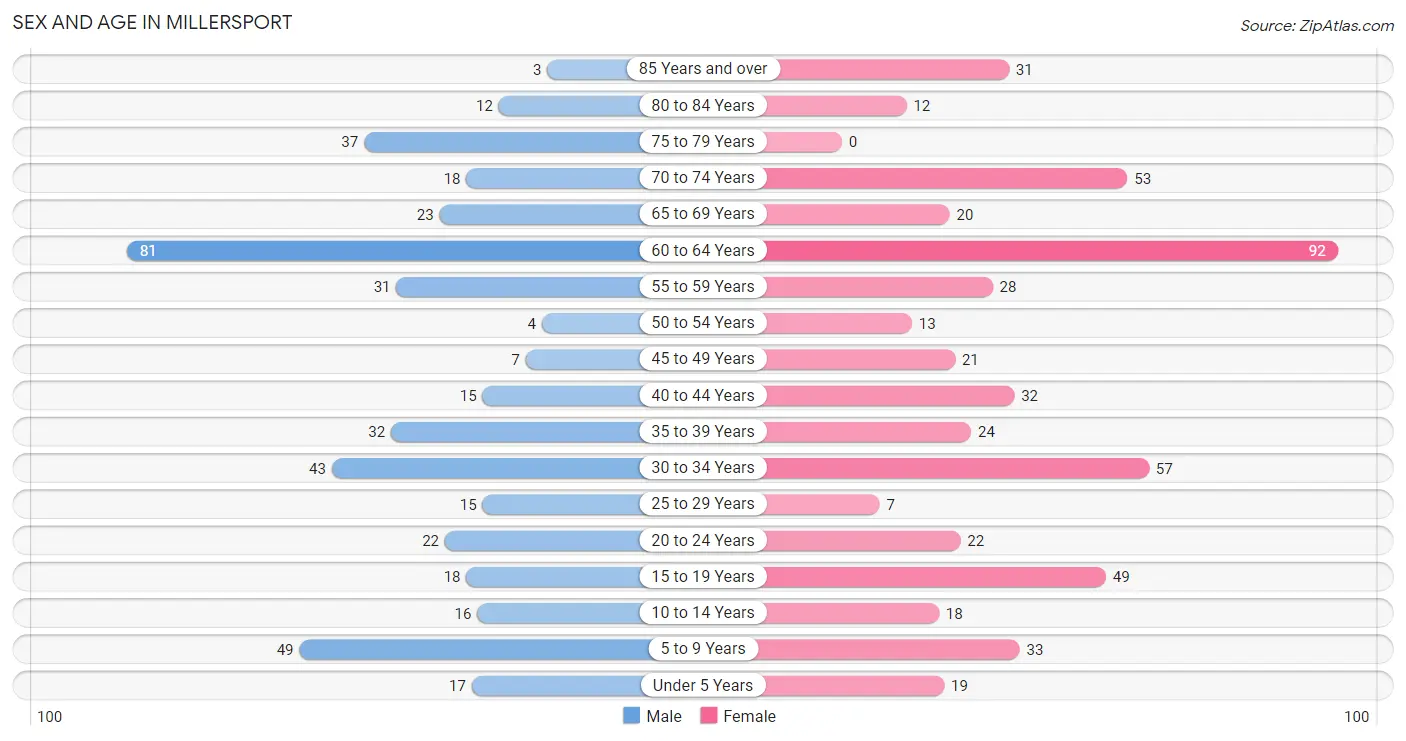
The most populous age groups in Millersport are 60 to 64 Years (81 | 18.3%) for men and 60 to 64 Years (92 | 17.3%) for women.
| Age Bracket | Male | Female |
| Under 5 Years | 17 (3.8%) | 19 (3.6%) |
| 5 to 9 Years | 49 (11.1%) | 33 (6.2%) |
| 10 to 14 Years | 16 (3.6%) | 18 (3.4%) |
| 15 to 19 Years | 18 (4.1%) | 49 (9.2%) |
| 20 to 24 Years | 22 (5.0%) | 22 (4.1%) |
| 25 to 29 Years | 15 (3.4%) | 7 (1.3%) |
| 30 to 34 Years | 43 (9.7%) | 57 (10.7%) |
| 35 to 39 Years | 32 (7.2%) | 24 (4.5%) |
| 40 to 44 Years | 15 (3.4%) | 32 (6.0%) |
| 45 to 49 Years | 7 (1.6%) | 21 (4.0%) |
| 50 to 54 Years | 4 (0.9%) | 13 (2.5%) |
| 55 to 59 Years | 31 (7.0%) | 28 (5.3%) |
| 60 to 64 Years | 81 (18.3%) | 92 (17.3%) |
| 65 to 69 Years | 23 (5.2%) | 20 (3.8%) |
| 70 to 74 Years | 18 (4.1%) | 53 (10.0%) |
| 75 to 79 Years | 37 (8.4%) | 0 (0.0%) |
| 80 to 84 Years | 12 (2.7%) | 12 (2.3%) |
| 85 Years and over | 3 (0.7%) | 31 (5.8%) |
| Total | 443 (100.0%) | 531 (100.0%) |
Families and Households in Millersport
Median Family Size in Millersport
The median family size in Millersport is 2.77 persons per family, with single male/father families (12 | 4.1%) accounting for the largest median family size of 3.33 persons per family. On the other hand, single female/mother families (56 | 19.3%) represent the smallest median family size with 2.39 persons per family.
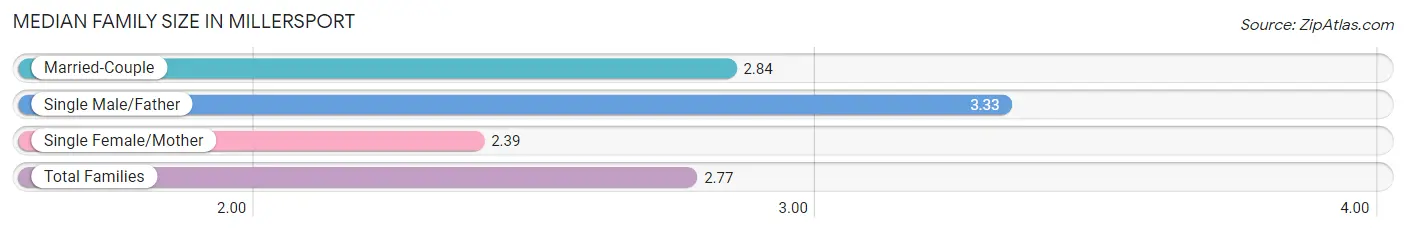
| Family Type | # Families | Family Size |
| Married-Couple | 222 (76.5%) | 2.84 |
| Single Male/Father | 12 (4.1%) | 3.33 |
| Single Female/Mother | 56 (19.3%) | 2.39 |
| Total Families | 290 (100.0%) | 2.77 |
Median Household Size in Millersport
The median household size in Millersport is 2.32 persons per household, with single male/father households (12 | 2.9%) accounting for the largest median household size of 3.33 persons per household. non-family households (130 | 30.9%) represent the smallest median household size with 1.24 persons per household.
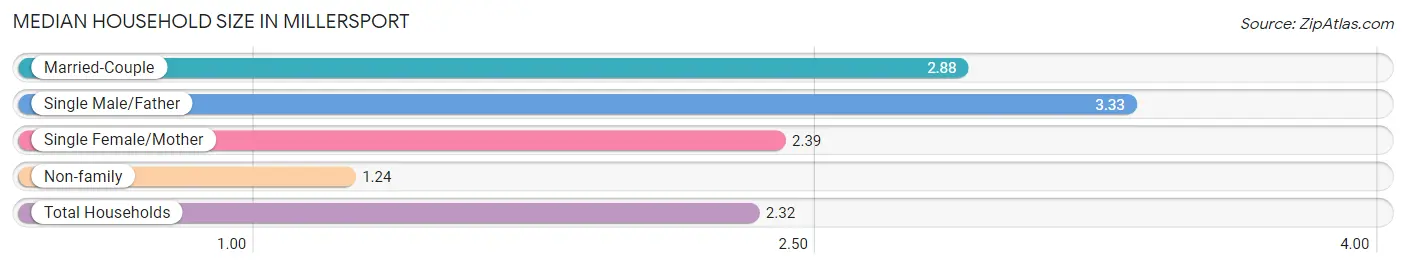
| Household Type | # Households | Household Size |
| Married-Couple | 222 (52.9%) | 2.88 |
| Single Male/Father | 12 (2.9%) | 3.33 |
| Single Female/Mother | 56 (13.3%) | 2.39 |
| Non-family | 130 (30.9%) | 1.24 |
| Total Households | 420 (100.0%) | 2.32 |
Household Size by Marriage Status in Millersport
Out of a total of 420 households in Millersport, 290 (69.1%) are family households, while 130 (30.9%) are nonfamily households. The most numerous type of family households are 2-person households, comprising 191, and the most common type of nonfamily households are 1-person households, comprising 102.
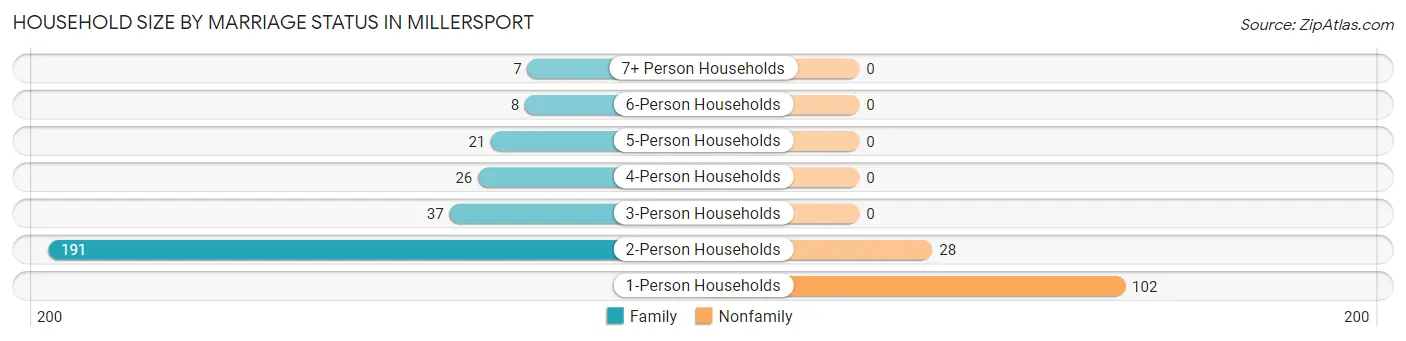
| Household Size | Family Households | Nonfamily Households |
| 1-Person Households | - | 102 (24.3%) |
| 2-Person Households | 191 (45.5%) | 28 (6.7%) |
| 3-Person Households | 37 (8.8%) | 0 (0.0%) |
| 4-Person Households | 26 (6.2%) | 0 (0.0%) |
| 5-Person Households | 21 (5.0%) | 0 (0.0%) |
| 6-Person Households | 8 (1.9%) | 0 (0.0%) |
| 7+ Person Households | 7 (1.7%) | 0 (0.0%) |
| Total | 290 (69.1%) | 130 (30.9%) |
Female Fertility in Millersport
Fertility by Age in Millersport
Average fertility rate in Millersport is 94.0 births per 1,000 women. Women in the age bracket of 35 to 50 years have the highest fertility rate with 143.0 births per 1,000 women. Women in the age bracket of 35 to 50 years acount for 55.0% of all women with births.
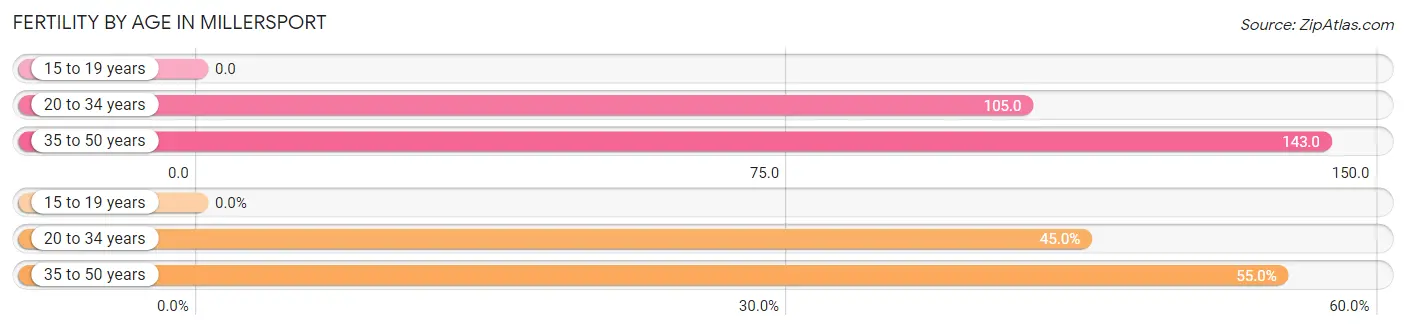
| Age Bracket | Women with Births | Births / 1,000 Women |
| 15 to 19 years | 0 (0.0%) | 0.0 |
| 20 to 34 years | 9 (45.0%) | 105.0 |
| 35 to 50 years | 11 (55.0%) | 143.0 |
| Total | 20 (100.0%) | 94.0 |
Fertility by Age by Marriage Status in Millersport
40.0% of women with births (20) in Millersport are married. The highest percentage of unmarried women with births falls into 20 to 34 years age bracket with 100.0% of them unmarried at the time of birth, while the lowest percentage of unmarried women with births belong to 35 to 50 years age bracket with 27.3% of them unmarried.
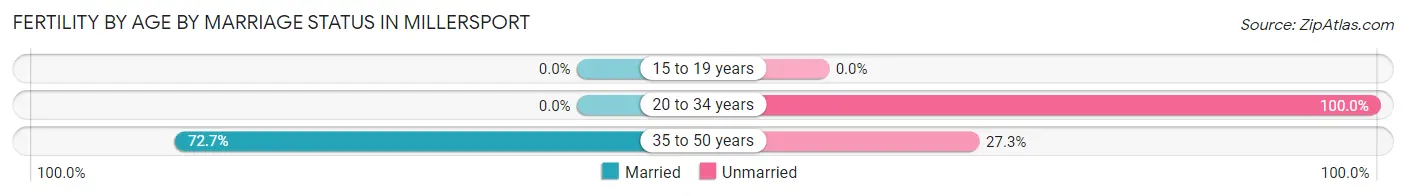
| Age Bracket | Married | Unmarried |
| 15 to 19 years | 0 (0.0%) | 0 (0.0%) |
| 20 to 34 years | 0 (0.0%) | 9 (100.0%) |
| 35 to 50 years | 8 (72.7%) | 3 (27.3%) |
| Total | 8 (40.0%) | 12 (60.0%) |
Fertility by Education in Millersport
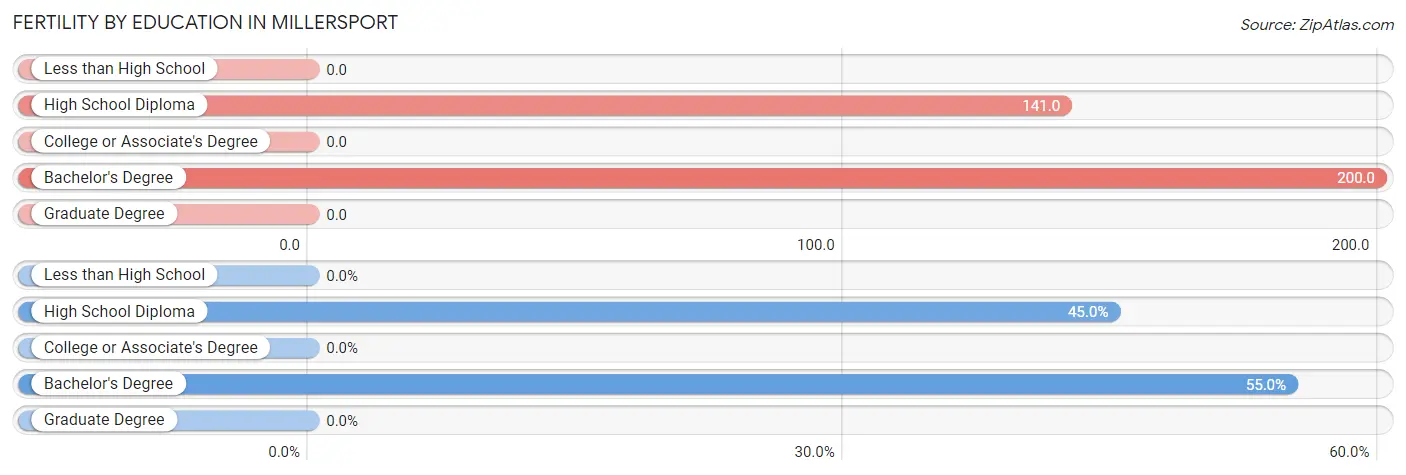
| Educational Attainment | Women with Births | Births / 1,000 Women |
| Less than High School | 0 (0.0%) | 0.0 |
| High School Diploma | 9 (45.0%) | 141.0 |
| College or Associate's Degree | 0 (0.0%) | 0.0 |
| Bachelor's Degree | 11 (55.0%) | 200.0 |
| Graduate Degree | 0 (0.0%) | 0.0 |
| Total | 20 (100.0%) | 94.0 |
Fertility by Education by Marriage Status in Millersport
60.0% of women with births in Millersport are unmarried. Women with the educational attainment of bachelor's degree are most likely to be married with 72.7% of them married at childbirth, while women with the educational attainment of high school diploma are least likely to be married with 100.0% of them unmarried at childbirth.
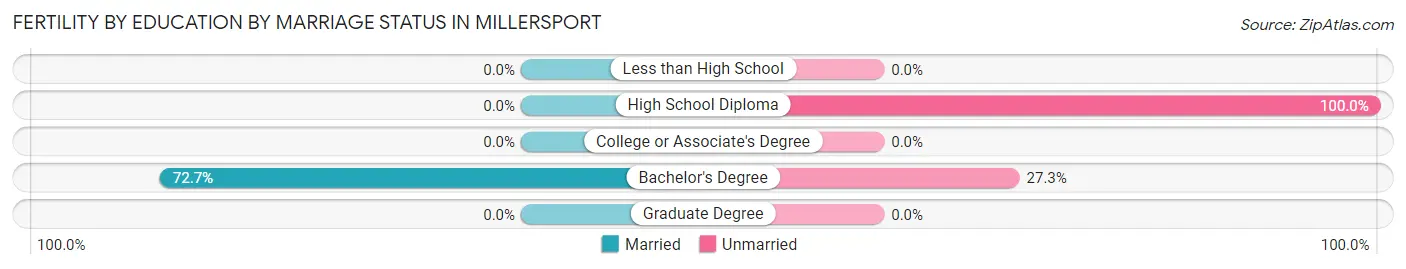
| Educational Attainment | Married | Unmarried |
| Less than High School | 0 (0.0%) | 0 (0.0%) |
| High School Diploma | 0 (0.0%) | 9 (100.0%) |
| College or Associate's Degree | 0 (0.0%) | 0 (0.0%) |
| Bachelor's Degree | 8 (72.7%) | 3 (27.3%) |
| Graduate Degree | 0 (0.0%) | 0 (0.0%) |
| Total | 8 (40.0%) | 12 (60.0%) |
Employment Characteristics in Millersport
Employment by Class of Employer in Millersport
Among the 454 employed individuals in Millersport, private company employees (295 | 65.0%), not-for-profit organizations (92 | 20.3%), and local government employees (28 | 6.2%) make up the most common classes of employment.
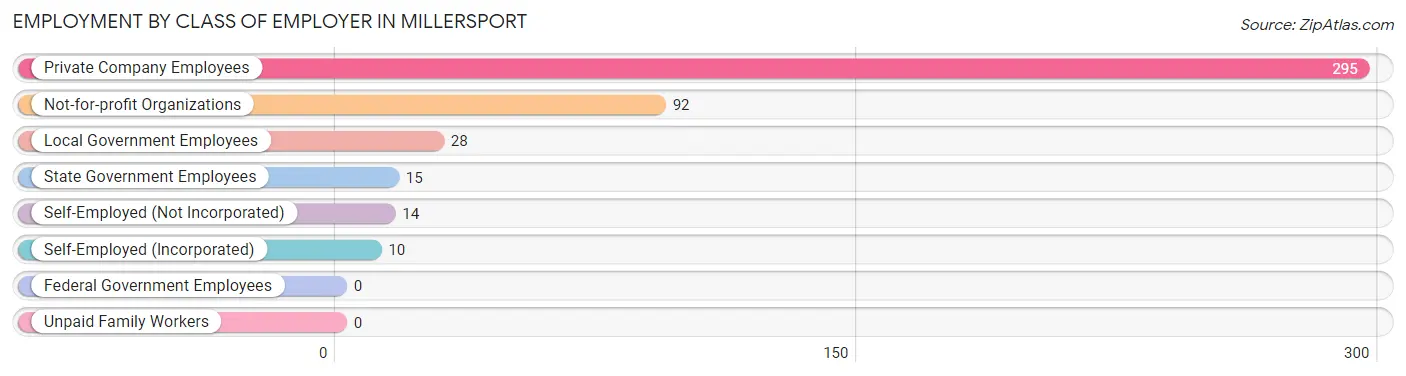
| Employer Class | # Employees | % Employees |
| Private Company Employees | 295 | 65.0% |
| Self-Employed (Incorporated) | 10 | 2.2% |
| Self-Employed (Not Incorporated) | 14 | 3.1% |
| Not-for-profit Organizations | 92 | 20.3% |
| Local Government Employees | 28 | 6.2% |
| State Government Employees | 15 | 3.3% |
| Federal Government Employees | 0 | 0.0% |
| Unpaid Family Workers | 0 | 0.0% |
| Total | 454 | 100.0% |
Employment Status by Age in Millersport
According to the labor force statistics for Millersport, out of the total population over 16 years of age (809), 64.5% or 522 individuals are in the labor force, with 12.1% or 63 of them unemployed. The age group with the highest labor force participation rate is 35 to 44 years, with 98.1% or 101 individuals in the labor force. Within the labor force, the 60 to 64 years age range has the highest percentage of unemployed individuals, with 37.4% or 49 of them being unemployed.
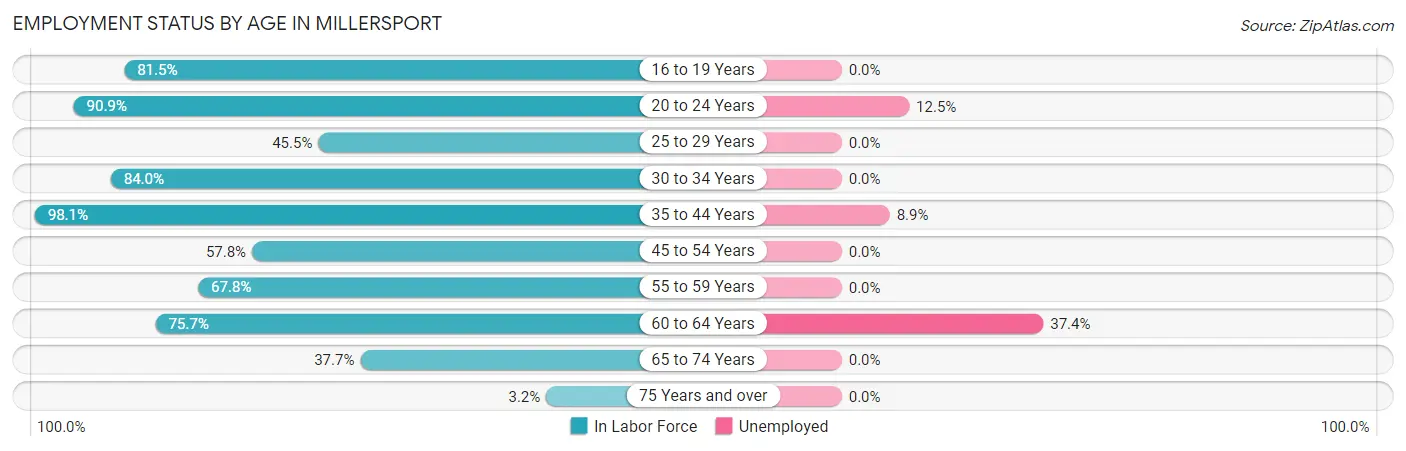
| Age Bracket | In Labor Force | Unemployed |
| 16 to 19 Years | 44 (81.5%) | 0 (0.0%) |
| 20 to 24 Years | 40 (90.9%) | 5 (12.5%) |
| 25 to 29 Years | 10 (45.5%) | 0 (0.0%) |
| 30 to 34 Years | 84 (84.0%) | 0 (0.0%) |
| 35 to 44 Years | 101 (98.1%) | 9 (8.9%) |
| 45 to 54 Years | 26 (57.8%) | 0 (0.0%) |
| 55 to 59 Years | 40 (67.8%) | 0 (0.0%) |
| 60 to 64 Years | 131 (75.7%) | 49 (37.4%) |
| 65 to 74 Years | 43 (37.7%) | 0 (0.0%) |
| 75 Years and over | 3 (3.2%) | 0 (0.0%) |
| Total | 522 (64.5%) | 63 (12.1%) |
Employment Status by Educational Attainment in Millersport
According to labor force statistics for Millersport, 78.1% of individuals (392) out of the total population between 25 and 64 years of age (502) are in the labor force, with 14.8% or 58 of them being unemployed. The group with the highest labor force participation rate are those with the educational attainment of bachelor's degree or higher, with 90.1% or 109 individuals in the labor force. Within the labor force, individuals with college / associate degree education have the highest percentage of unemployment, with 35.8% or 58 of them being unemployed.
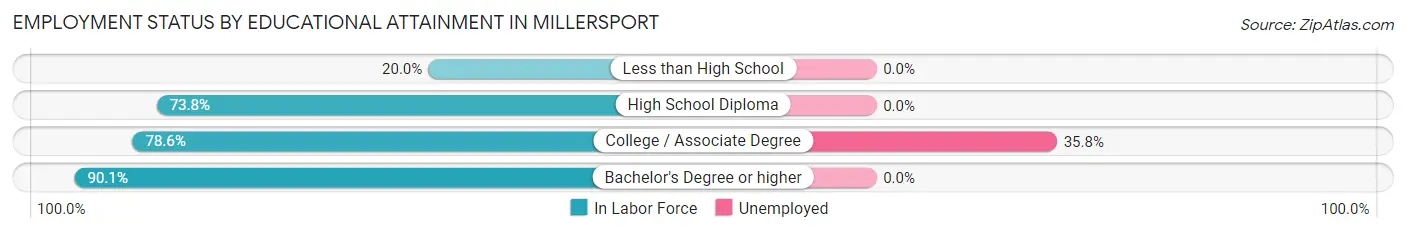
| Educational Attainment | In Labor Force | Unemployed |
| Less than High School | 3 (20.0%) | 0 (0.0%) |
| High School Diploma | 118 (73.8%) | 0 (0.0%) |
| College / Associate Degree | 162 (78.6%) | 74 (35.8%) |
| Bachelor's Degree or higher | 109 (90.1%) | 0 (0.0%) |
| Total | 392 (78.1%) | 74 (14.8%) |
Employment Occupations by Sex in Millersport
Management, Business, Science and Arts Occupations
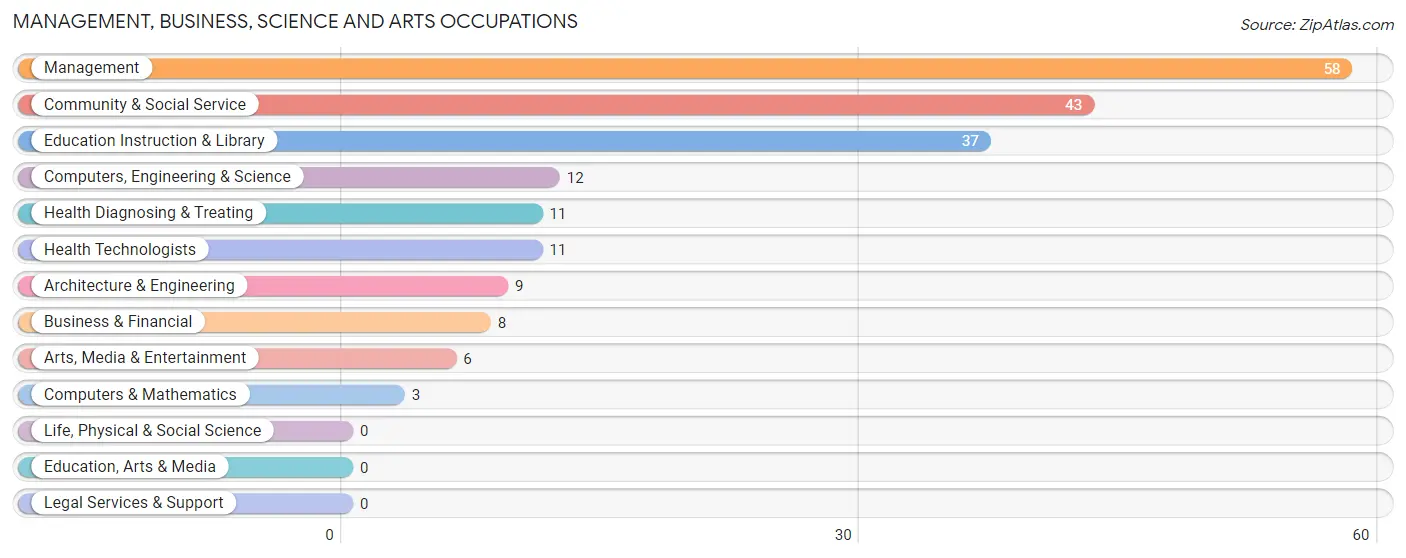
The most common Management, Business, Science and Arts occupations in Millersport are Management (58 | 12.6%), Community & Social Service (43 | 9.4%), Education Instruction & Library (37 | 8.1%), Computers, Engineering & Science (12 | 2.6%), and Health Diagnosing & Treating (11 | 2.4%).
Management, Business, Science and Arts Occupations by Sex
Within the Management, Business, Science and Arts occupations in Millersport, the most male-oriented occupations are Architecture & Engineering (100.0%), Management (82.8%), and Computers, Engineering & Science (75.0%), while the most female-oriented occupations are Business & Financial (100.0%), Computers & Mathematics (100.0%), and Community & Social Service (100.0%).
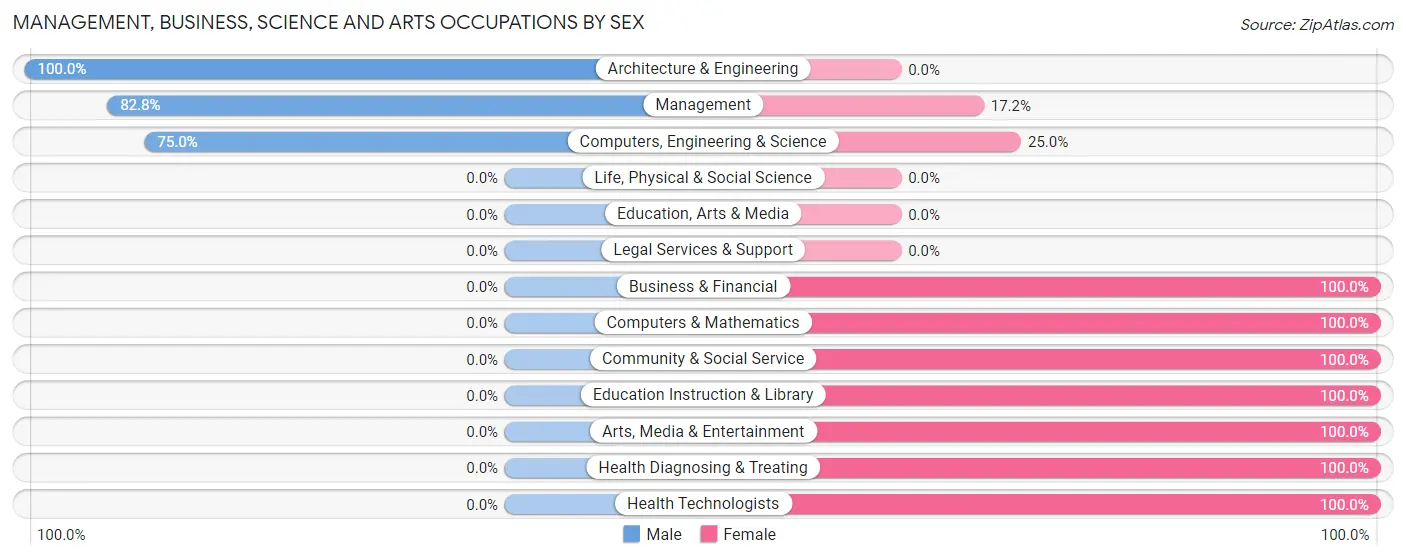
| Occupation | Male | Female |
| Management | 48 (82.8%) | 10 (17.2%) |
| Business & Financial | 0 (0.0%) | 8 (100.0%) |
| Computers, Engineering & Science | 9 (75.0%) | 3 (25.0%) |
| Computers & Mathematics | 0 (0.0%) | 3 (100.0%) |
| Architecture & Engineering | 9 (100.0%) | 0 (0.0%) |
| Life, Physical & Social Science | 0 (0.0%) | 0 (0.0%) |
| Community & Social Service | 0 (0.0%) | 43 (100.0%) |
| Education, Arts & Media | 0 (0.0%) | 0 (0.0%) |
| Legal Services & Support | 0 (0.0%) | 0 (0.0%) |
| Education Instruction & Library | 0 (0.0%) | 37 (100.0%) |
| Arts, Media & Entertainment | 0 (0.0%) | 6 (100.0%) |
| Health Diagnosing & Treating | 0 (0.0%) | 11 (100.0%) |
| Health Technologists | 0 (0.0%) | 11 (100.0%) |
| Total (Category) | 57 (43.2%) | 75 (56.8%) |
| Total (Overall) | 253 (55.1%) | 206 (44.9%) |
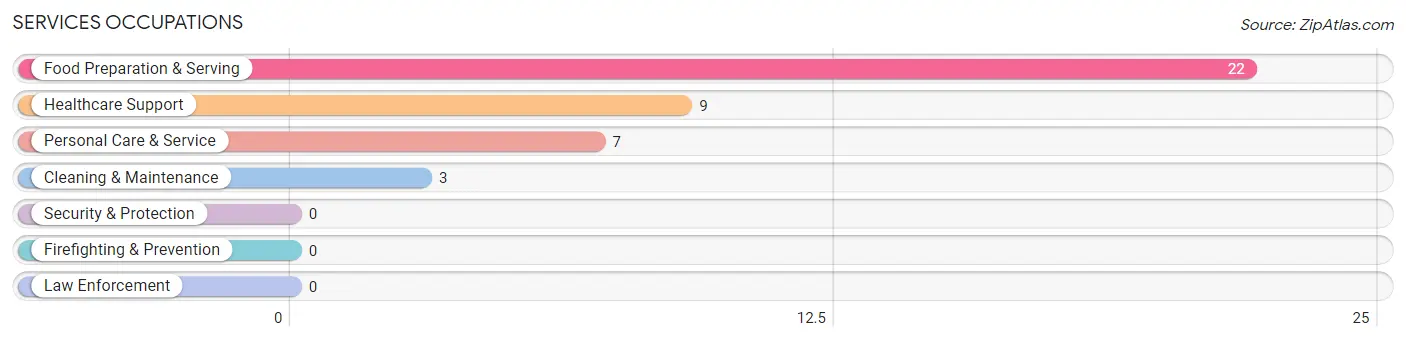
Services Occupations
The most common Services occupations in Millersport are Food Preparation & Serving (22 | 4.8%), Healthcare Support (9 | 2.0%), Personal Care & Service (7 | 1.5%), and Cleaning & Maintenance (3 | 0.6%).
Services Occupations by Sex
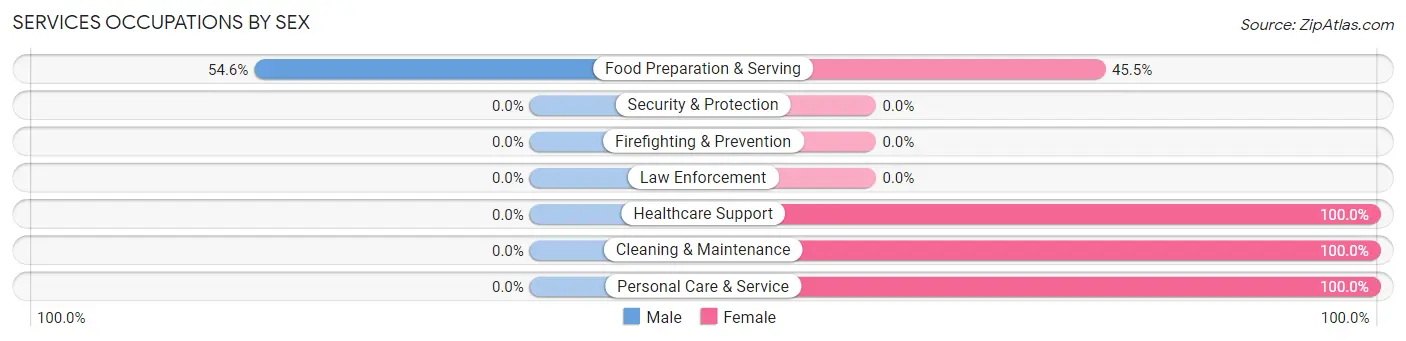
| Occupation | Male | Female |
| Healthcare Support | 0 (0.0%) | 9 (100.0%) |
| Security & Protection | 0 (0.0%) | 0 (0.0%) |
| Firefighting & Prevention | 0 (0.0%) | 0 (0.0%) |
| Law Enforcement | 0 (0.0%) | 0 (0.0%) |
| Food Preparation & Serving | 12 (54.5%) | 10 (45.5%) |
| Cleaning & Maintenance | 0 (0.0%) | 3 (100.0%) |
| Personal Care & Service | 0 (0.0%) | 7 (100.0%) |
| Total (Category) | 12 (29.3%) | 29 (70.7%) |
| Total (Overall) | 253 (55.1%) | 206 (44.9%) |
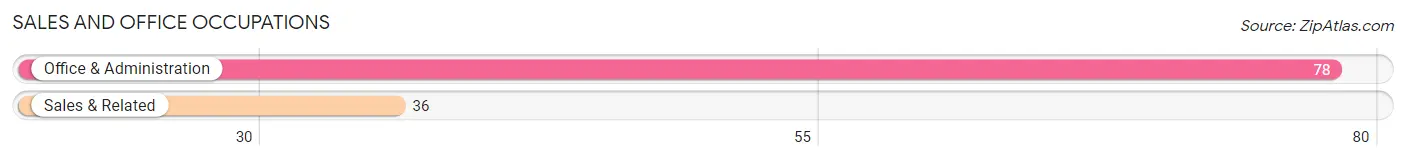
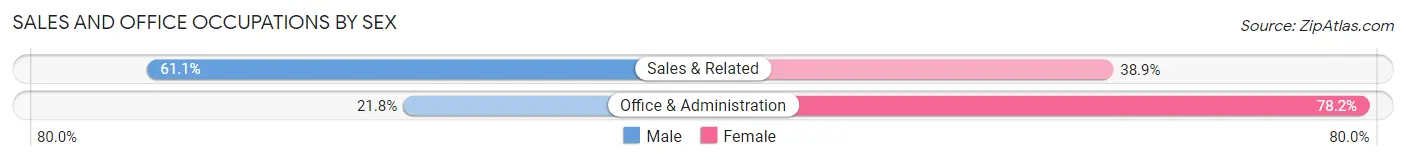
Sales and Office Occupations
The most common Sales and Office occupations in Millersport are Office & Administration (78 | 17.0%), and Sales & Related (36 | 7.8%).
Sales and Office Occupations by Sex
| Occupation | Male | Female |
| Sales & Related | 22 (61.1%) | 14 (38.9%) |
| Office & Administration | 17 (21.8%) | 61 (78.2%) |
| Total (Category) | 39 (34.2%) | 75 (65.8%) |
| Total (Overall) | 253 (55.1%) | 206 (44.9%) |
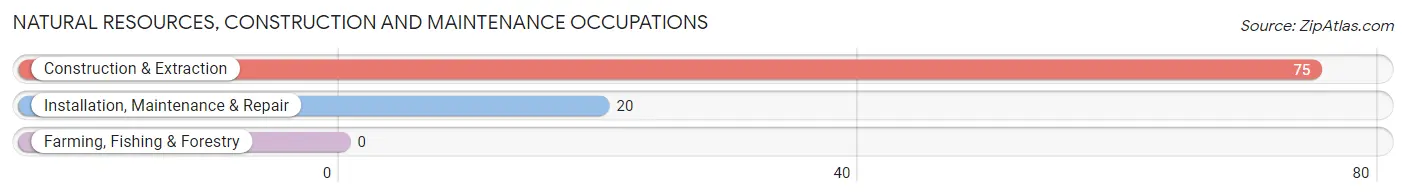
Natural Resources, Construction and Maintenance Occupations
The most common Natural Resources, Construction and Maintenance occupations in Millersport are Construction & Extraction (75 | 16.3%), and Installation, Maintenance & Repair (20 | 4.4%).
Natural Resources, Construction and Maintenance Occupations by Sex
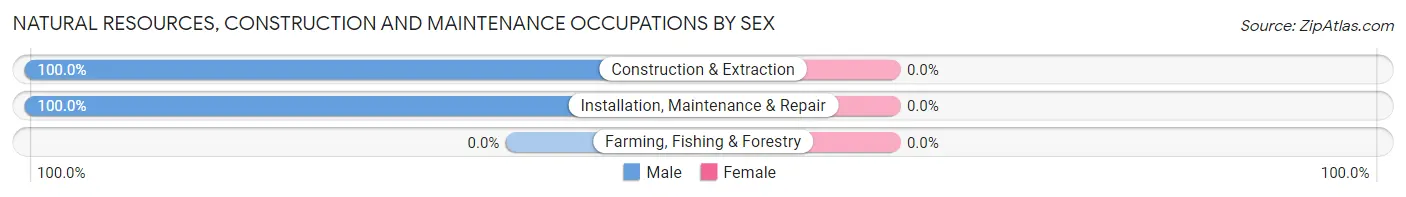
| Occupation | Male | Female |
| Farming, Fishing & Forestry | 0 (0.0%) | 0 (0.0%) |
| Construction & Extraction | 75 (100.0%) | 0 (0.0%) |
| Installation, Maintenance & Repair | 20 (100.0%) | 0 (0.0%) |
| Total (Category) | 95 (100.0%) | 0 (0.0%) |
| Total (Overall) | 253 (55.1%) | 206 (44.9%) |
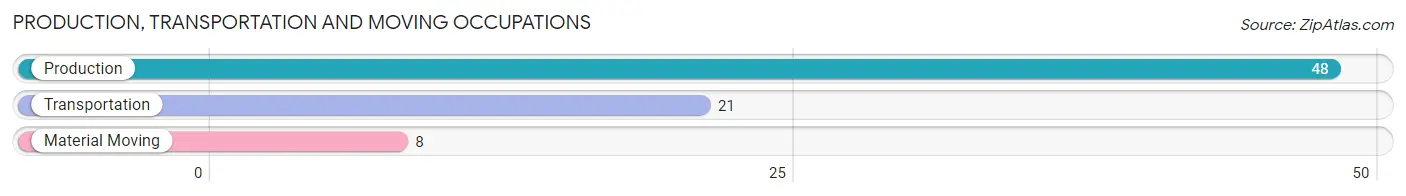
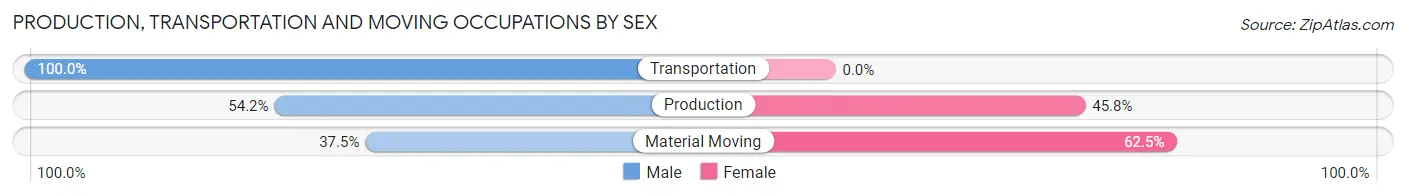
Production, Transportation and Moving Occupations
The most common Production, Transportation and Moving occupations in Millersport are Production (48 | 10.5%), Transportation (21 | 4.6%), and Material Moving (8 | 1.7%).
Production, Transportation and Moving Occupations by Sex
| Occupation | Male | Female |
| Production | 26 (54.2%) | 22 (45.8%) |
| Transportation | 21 (100.0%) | 0 (0.0%) |
| Material Moving | 3 (37.5%) | 5 (62.5%) |
| Total (Category) | 50 (64.9%) | 27 (35.1%) |
| Total (Overall) | 253 (55.1%) | 206 (44.9%) |
Employment Industries by Sex in Millersport
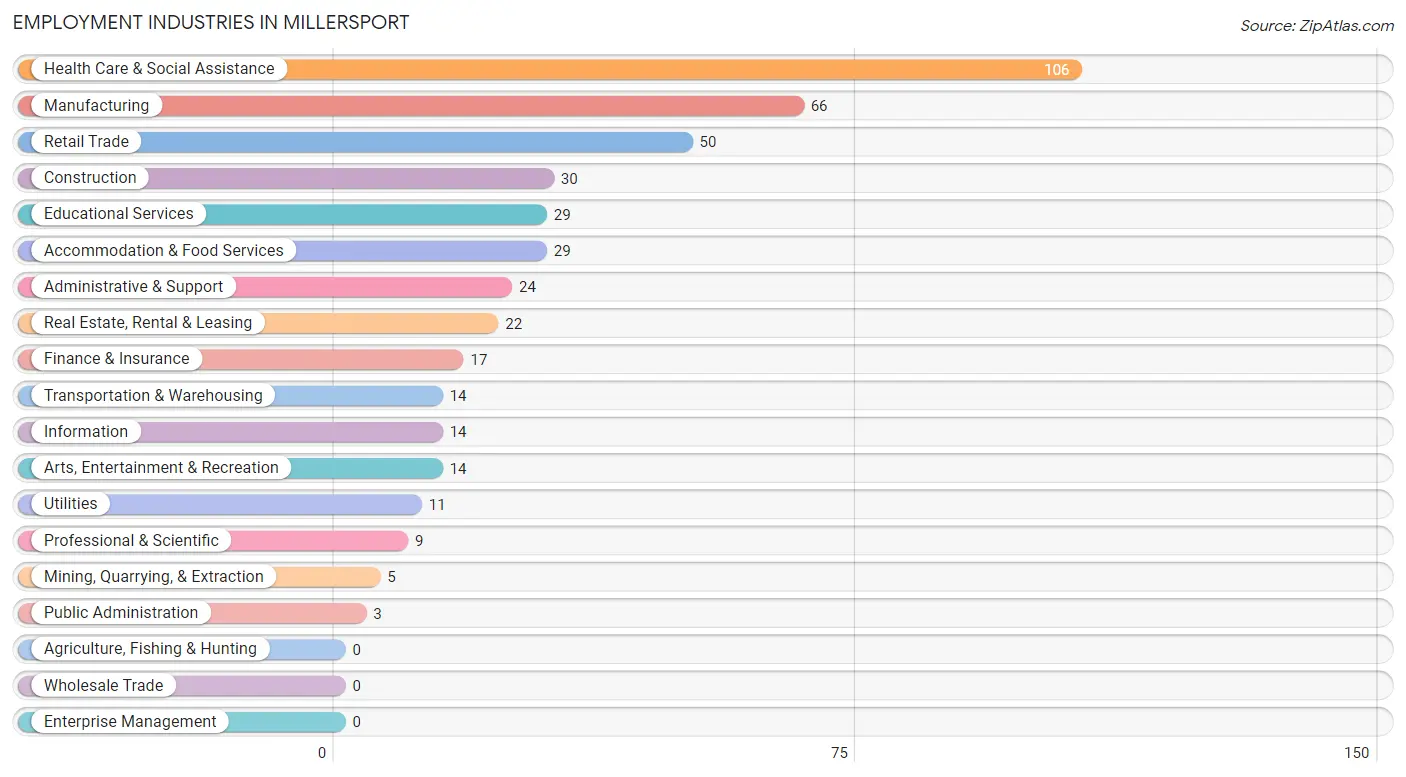
Employment Industries in Millersport
The major employment industries in Millersport include Health Care & Social Assistance (106 | 23.1%), Manufacturing (66 | 14.4%), Retail Trade (50 | 10.9%), Construction (30 | 6.5%), and Educational Services (29 | 6.3%).
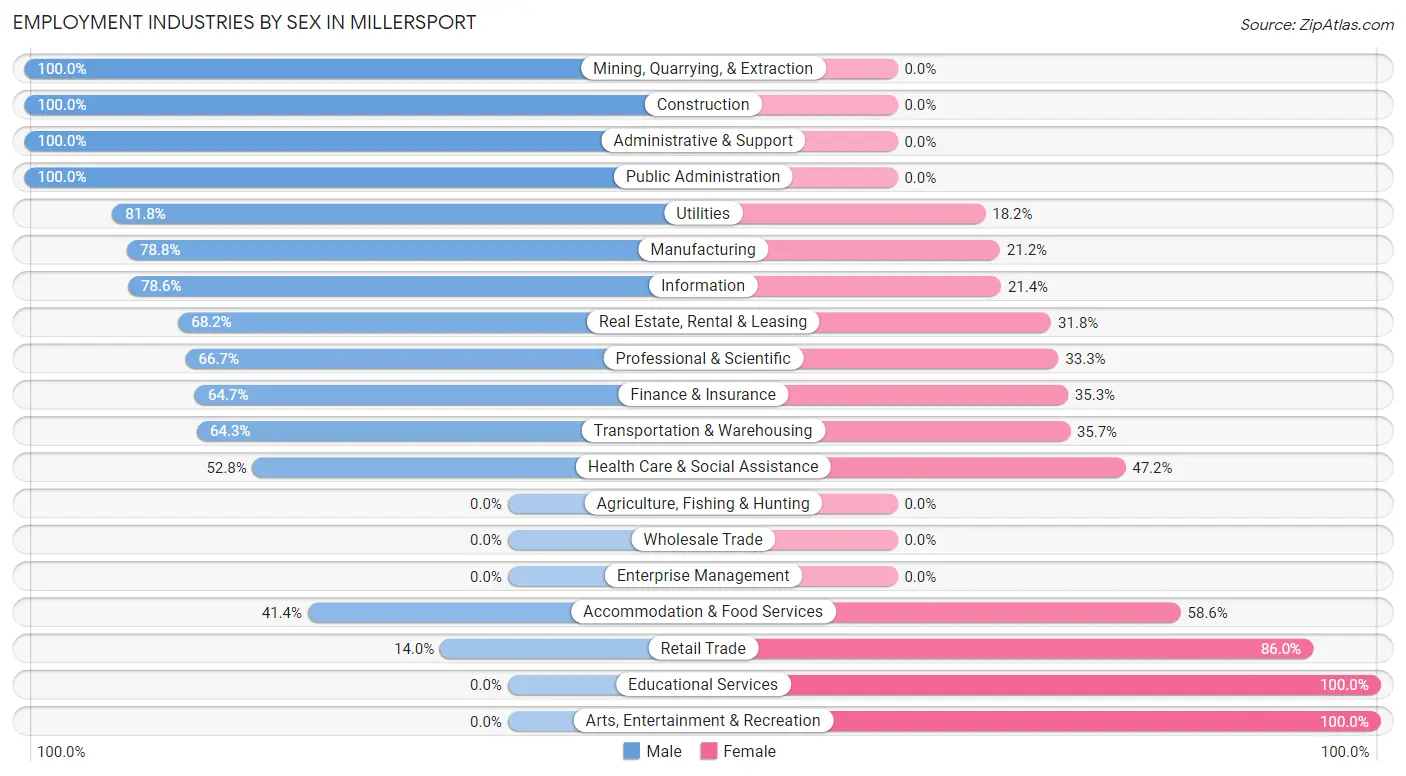
Employment Industries by Sex in Millersport
The Millersport industries that see more men than women are Mining, Quarrying, & Extraction (100.0%), Construction (100.0%), and Administrative & Support (100.0%), whereas the industries that tend to have a higher number of women are Educational Services (100.0%), Arts, Entertainment & Recreation (100.0%), and Retail Trade (86.0%).
| Industry | Male | Female |
| Agriculture, Fishing & Hunting | 0 (0.0%) | 0 (0.0%) |
| Mining, Quarrying, & Extraction | 5 (100.0%) | 0 (0.0%) |
| Construction | 30 (100.0%) | 0 (0.0%) |
| Manufacturing | 52 (78.8%) | 14 (21.2%) |
| Wholesale Trade | 0 (0.0%) | 0 (0.0%) |
| Retail Trade | 7 (14.0%) | 43 (86.0%) |
| Transportation & Warehousing | 9 (64.3%) | 5 (35.7%) |
| Utilities | 9 (81.8%) | 2 (18.2%) |
| Information | 11 (78.6%) | 3 (21.4%) |
| Finance & Insurance | 11 (64.7%) | 6 (35.3%) |
| Real Estate, Rental & Leasing | 15 (68.2%) | 7 (31.8%) |
| Professional & Scientific | 6 (66.7%) | 3 (33.3%) |
| Enterprise Management | 0 (0.0%) | 0 (0.0%) |
| Administrative & Support | 24 (100.0%) | 0 (0.0%) |
| Educational Services | 0 (0.0%) | 29 (100.0%) |
| Health Care & Social Assistance | 56 (52.8%) | 50 (47.2%) |
| Arts, Entertainment & Recreation | 0 (0.0%) | 14 (100.0%) |
| Accommodation & Food Services | 12 (41.4%) | 17 (58.6%) |
| Public Administration | 3 (100.0%) | 0 (0.0%) |
| Total | 253 (55.1%) | 206 (44.9%) |
Education in Millersport
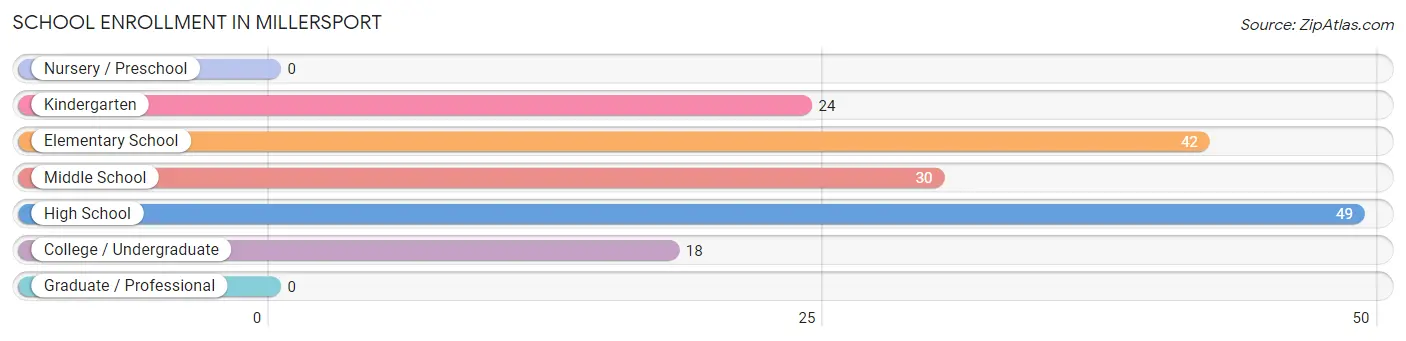
School Enrollment in Millersport
The most common levels of schooling among the 163 students in Millersport are high school (49 | 30.1%), elementary school (42 | 25.8%), and middle school (30 | 18.4%).
| School Level | # Students | % Students |
| Nursery / Preschool | 0 | 0.0% |
| Kindergarten | 24 | 14.7% |
| Elementary School | 42 | 25.8% |
| Middle School | 30 | 18.4% |
| High School | 49 | 30.1% |
| College / Undergraduate | 18 | 11.0% |
| Graduate / Professional | 0 | 0.0% |
| Total | 163 | 100.0% |
School Enrollment by Age by Funding Source in Millersport
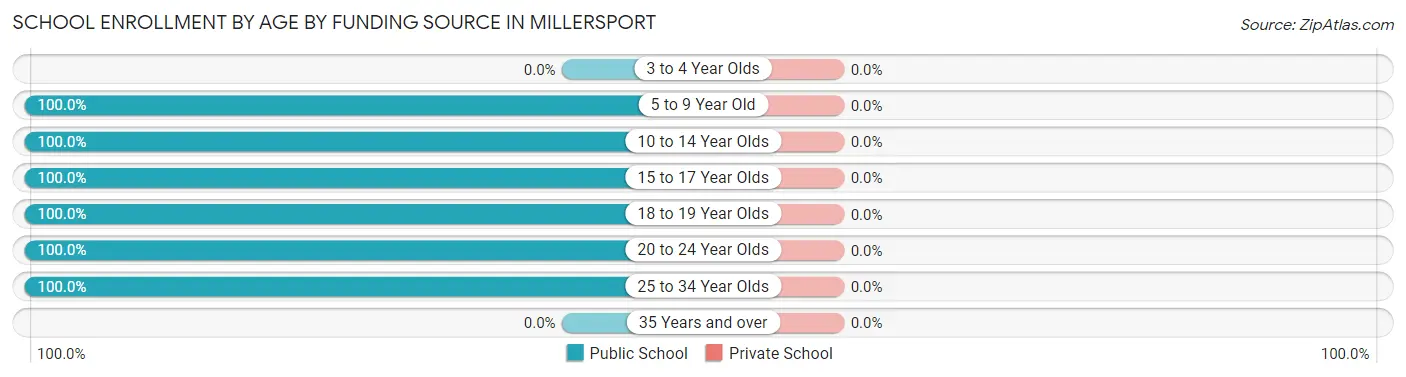
| Age Bracket | Public School | Private School |
| 3 to 4 Year Olds | 0 (0.0%) | 0 (0.0%) |
| 5 to 9 Year Old | 66 (100.0%) | 0 (0.0%) |
| 10 to 14 Year Olds | 34 (100.0%) | 0 (0.0%) |
| 15 to 17 Year Olds | 21 (100.0%) | 0 (0.0%) |
| 18 to 19 Year Olds | 31 (100.0%) | 0 (0.0%) |
| 20 to 24 Year Olds | 6 (100.0%) | 0 (0.0%) |
| 25 to 34 Year Olds | 5 (100.0%) | 0 (0.0%) |
| 35 Years and over | 0 (0.0%) | 0 (0.0%) |
| Total | 163 (100.0%) | 0 (0.0%) |
Educational Attainment by Field of Study in Millersport
Education (52 | 33.3%), liberal arts & history (30 | 19.2%), engineering (26 | 16.7%), business (14 | 9.0%), and science & technology (9 | 5.8%) are the most common fields of study among 156 individuals in Millersport who have obtained a bachelor's degree or higher.
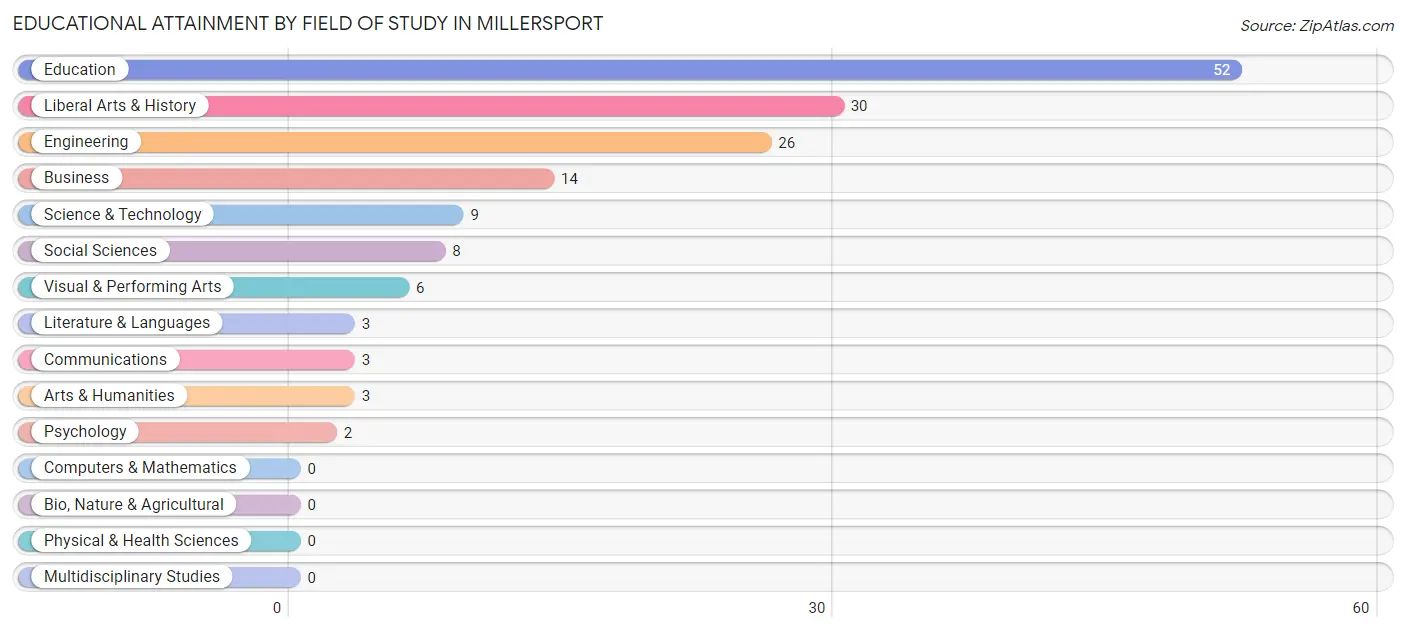
| Field of Study | # Graduates | % Graduates |
| Computers & Mathematics | 0 | 0.0% |
| Bio, Nature & Agricultural | 0 | 0.0% |
| Physical & Health Sciences | 0 | 0.0% |
| Psychology | 2 | 1.3% |
| Social Sciences | 8 | 5.1% |
| Engineering | 26 | 16.7% |
| Multidisciplinary Studies | 0 | 0.0% |
| Science & Technology | 9 | 5.8% |
| Business | 14 | 9.0% |
| Education | 52 | 33.3% |
| Literature & Languages | 3 | 1.9% |
| Liberal Arts & History | 30 | 19.2% |
| Visual & Performing Arts | 6 | 3.8% |
| Communications | 3 | 1.9% |
| Arts & Humanities | 3 | 1.9% |
| Total | 156 | 100.0% |
Transportation & Commute in Millersport
Vehicle Availability by Sex in Millersport
The most prevalent vehicle ownership categories in Millersport are males with 2 vehicles (161, accounting for 64.9%) and females with 2 vehicles (92, making up 78.2%).
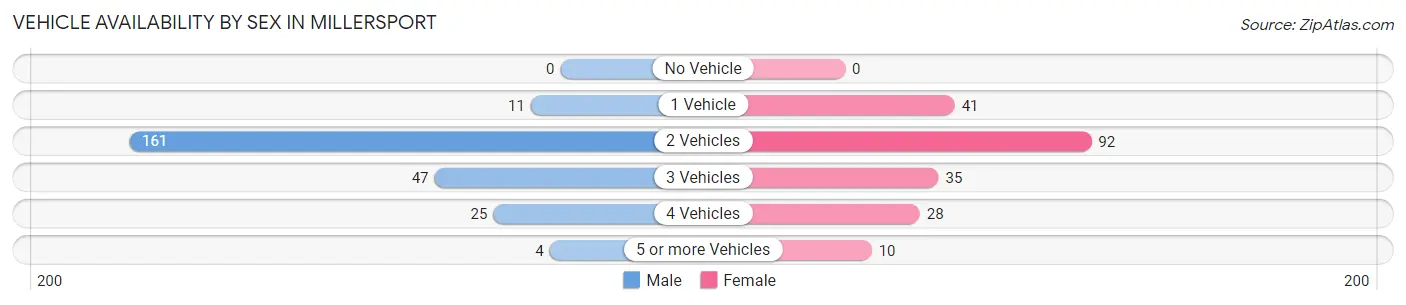
| Vehicles Available | Male | Female |
| No Vehicle | 0 (0.0%) | 0 (0.0%) |
| 1 Vehicle | 11 (4.4%) | 41 (19.9%) |
| 2 Vehicles | 161 (64.9%) | 92 (44.7%) |
| 3 Vehicles | 47 (19.0%) | 35 (17.0%) |
| 4 Vehicles | 25 (10.1%) | 28 (13.6%) |
| 5 or more Vehicles | 4 (1.6%) | 10 (4.9%) |
| Total | 248 (100.0%) | 206 (100.0%) |
Commute Time in Millersport
The most frequently occuring commute durations in Millersport are 30 to 34 minutes (81 commuters, 19.0%), 45 to 59 minutes (74 commuters, 17.3%), and 15 to 19 minutes (61 commuters, 14.3%).
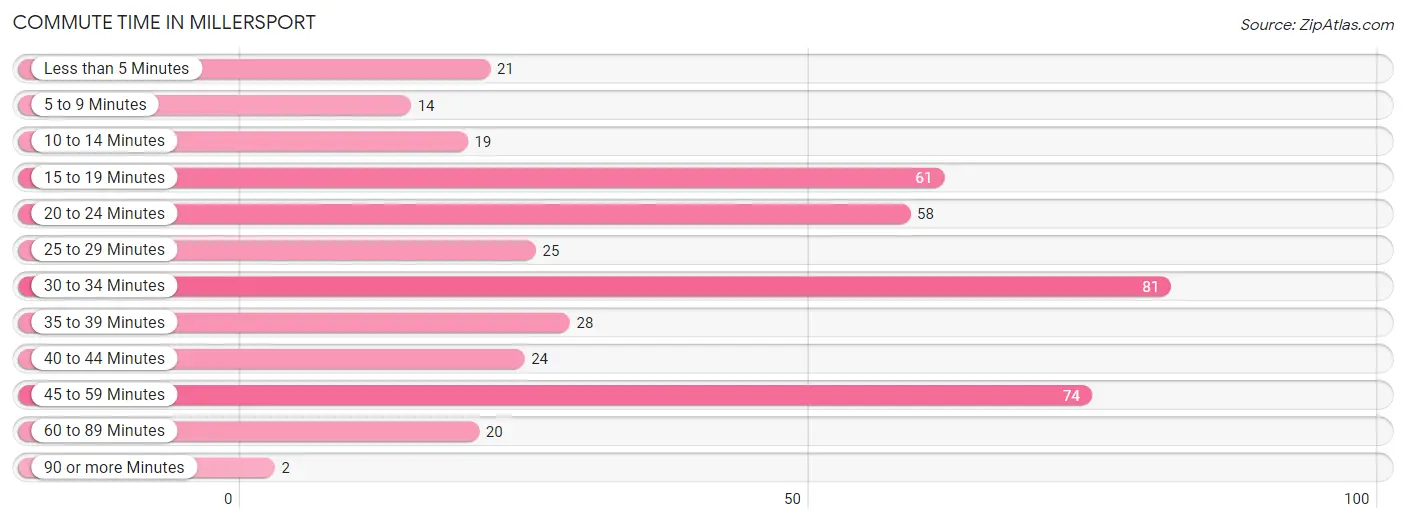
| Commute Time | # Commuters | % Commuters |
| Less than 5 Minutes | 21 | 4.9% |
| 5 to 9 Minutes | 14 | 3.3% |
| 10 to 14 Minutes | 19 | 4.4% |
| 15 to 19 Minutes | 61 | 14.3% |
| 20 to 24 Minutes | 58 | 13.6% |
| 25 to 29 Minutes | 25 | 5.9% |
| 30 to 34 Minutes | 81 | 19.0% |
| 35 to 39 Minutes | 28 | 6.6% |
| 40 to 44 Minutes | 24 | 5.6% |
| 45 to 59 Minutes | 74 | 17.3% |
| 60 to 89 Minutes | 20 | 4.7% |
| 90 or more Minutes | 2 | 0.5% |
Commute Time by Sex in Millersport
The most common commute times in Millersport are 30 to 34 minutes (62 commuters, 27.3%) for males and 15 to 19 minutes (52 commuters, 26.0%) for females.
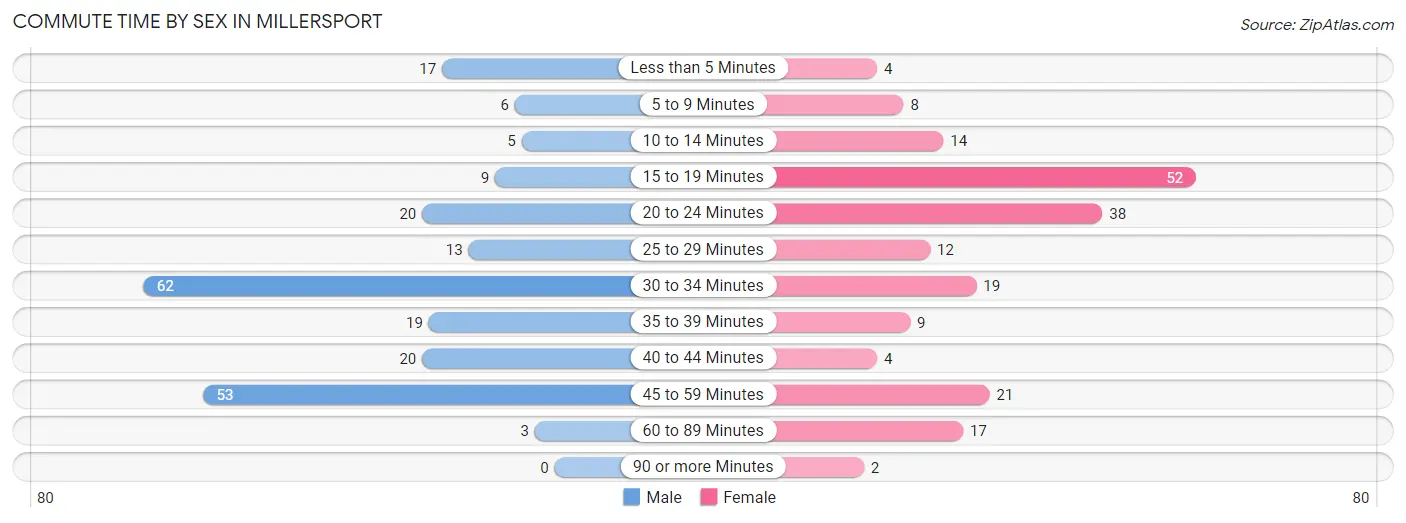
| Commute Time | Male | Female |
| Less than 5 Minutes | 17 (7.5%) | 4 (2.0%) |
| 5 to 9 Minutes | 6 (2.6%) | 8 (4.0%) |
| 10 to 14 Minutes | 5 (2.2%) | 14 (7.0%) |
| 15 to 19 Minutes | 9 (4.0%) | 52 (26.0%) |
| 20 to 24 Minutes | 20 (8.8%) | 38 (19.0%) |
| 25 to 29 Minutes | 13 (5.7%) | 12 (6.0%) |
| 30 to 34 Minutes | 62 (27.3%) | 19 (9.5%) |
| 35 to 39 Minutes | 19 (8.4%) | 9 (4.5%) |
| 40 to 44 Minutes | 20 (8.8%) | 4 (2.0%) |
| 45 to 59 Minutes | 53 (23.4%) | 21 (10.5%) |
| 60 to 89 Minutes | 3 (1.3%) | 17 (8.5%) |
| 90 or more Minutes | 0 (0.0%) | 2 (1.0%) |
Time of Departure to Work by Sex in Millersport
The most frequent times of departure to work in Millersport are 6:00 AM to 6:29 AM (85, 37.4%) for males and 6:00 AM to 6:29 AM (38, 19.0%) for females.
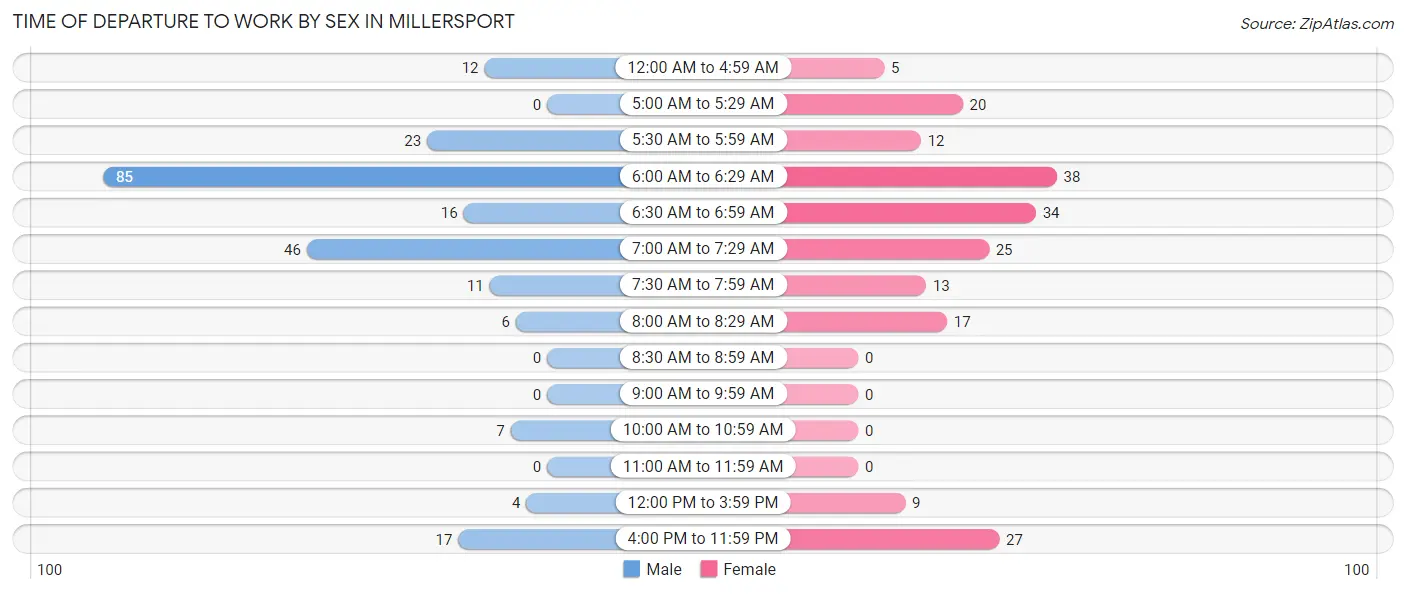
| Time of Departure | Male | Female |
| 12:00 AM to 4:59 AM | 12 (5.3%) | 5 (2.5%) |
| 5:00 AM to 5:29 AM | 0 (0.0%) | 20 (10.0%) |
| 5:30 AM to 5:59 AM | 23 (10.1%) | 12 (6.0%) |
| 6:00 AM to 6:29 AM | 85 (37.4%) | 38 (19.0%) |
| 6:30 AM to 6:59 AM | 16 (7.0%) | 34 (17.0%) |
| 7:00 AM to 7:29 AM | 46 (20.3%) | 25 (12.5%) |
| 7:30 AM to 7:59 AM | 11 (4.9%) | 13 (6.5%) |
| 8:00 AM to 8:29 AM | 6 (2.6%) | 17 (8.5%) |
| 8:30 AM to 8:59 AM | 0 (0.0%) | 0 (0.0%) |
| 9:00 AM to 9:59 AM | 0 (0.0%) | 0 (0.0%) |
| 10:00 AM to 10:59 AM | 7 (3.1%) | 0 (0.0%) |
| 11:00 AM to 11:59 AM | 0 (0.0%) | 0 (0.0%) |
| 12:00 PM to 3:59 PM | 4 (1.8%) | 9 (4.5%) |
| 4:00 PM to 11:59 PM | 17 (7.5%) | 27 (13.5%) |
| Total | 227 (100.0%) | 200 (100.0%) |
Housing Occupancy in Millersport
Occupancy by Ownership in Millersport
Of the total 420 dwellings in Millersport, owner-occupied units account for 327 (77.9%), while renter-occupied units make up 93 (22.1%).
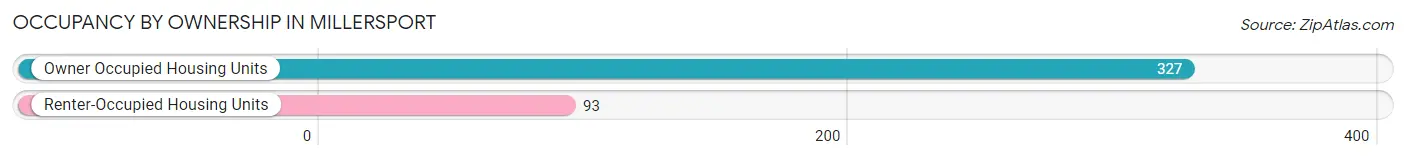
| Occupancy | # Housing Units | % Housing Units |
| Owner Occupied Housing Units | 327 | 77.9% |
| Renter-Occupied Housing Units | 93 | 22.1% |
| Total Occupied Housing Units | 420 | 100.0% |
Occupancy by Household Size in Millersport
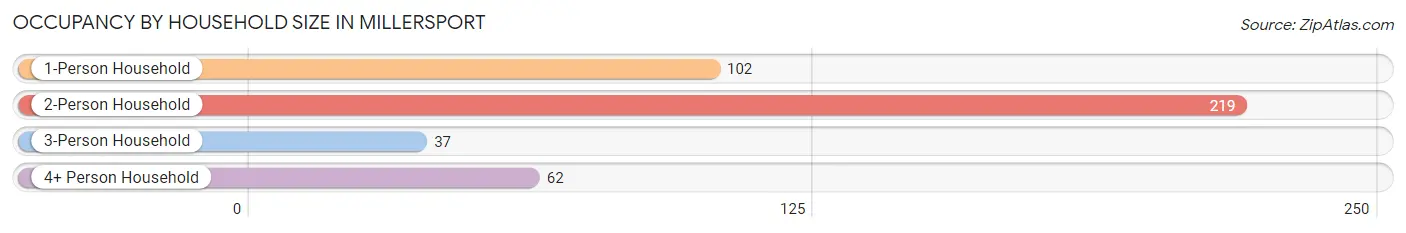
| Household Size | # Housing Units | % Housing Units |
| 1-Person Household | 102 | 24.3% |
| 2-Person Household | 219 | 52.1% |
| 3-Person Household | 37 | 8.8% |
| 4+ Person Household | 62 | 14.8% |
| Total Housing Units | 420 | 100.0% |
Occupancy by Ownership by Household Size in Millersport
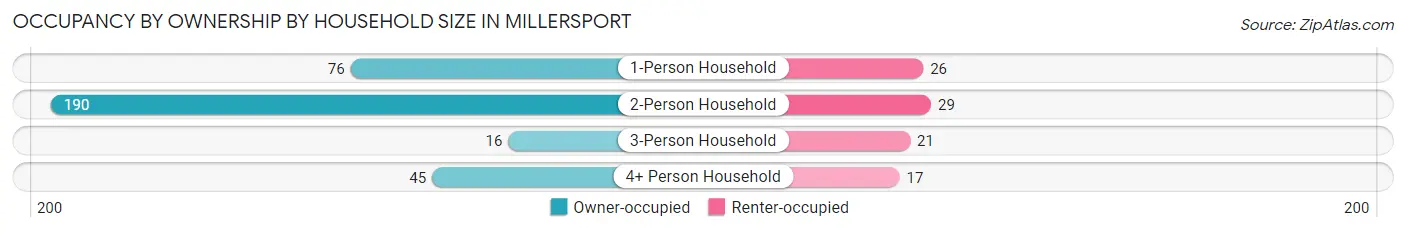
| Household Size | Owner-occupied | Renter-occupied |
| 1-Person Household | 76 (74.5%) | 26 (25.5%) |
| 2-Person Household | 190 (86.8%) | 29 (13.2%) |
| 3-Person Household | 16 (43.2%) | 21 (56.8%) |
| 4+ Person Household | 45 (72.6%) | 17 (27.4%) |
| Total Housing Units | 327 (77.9%) | 93 (22.1%) |
Occupancy by Educational Attainment in Millersport
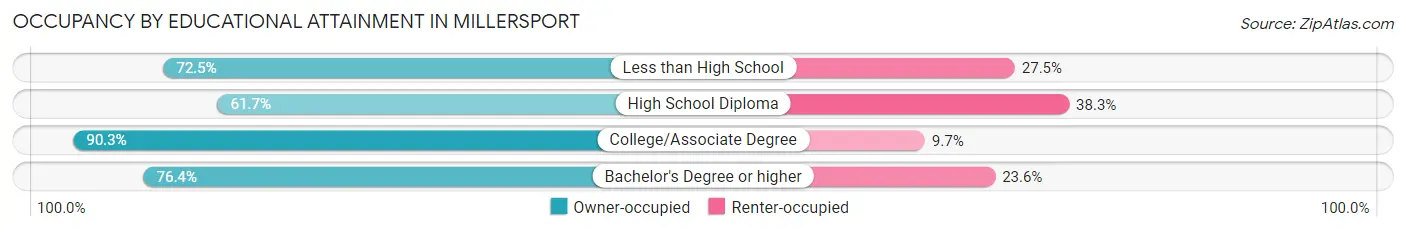
| Household Size | Owner-occupied | Renter-occupied |
| Less than High School | 29 (72.5%) | 11 (27.5%) |
| High School Diploma | 71 (61.7%) | 44 (38.3%) |
| College/Associate Degree | 159 (90.3%) | 17 (9.7%) |
| Bachelor's Degree or higher | 68 (76.4%) | 21 (23.6%) |
Occupancy by Age of Householder in Millersport
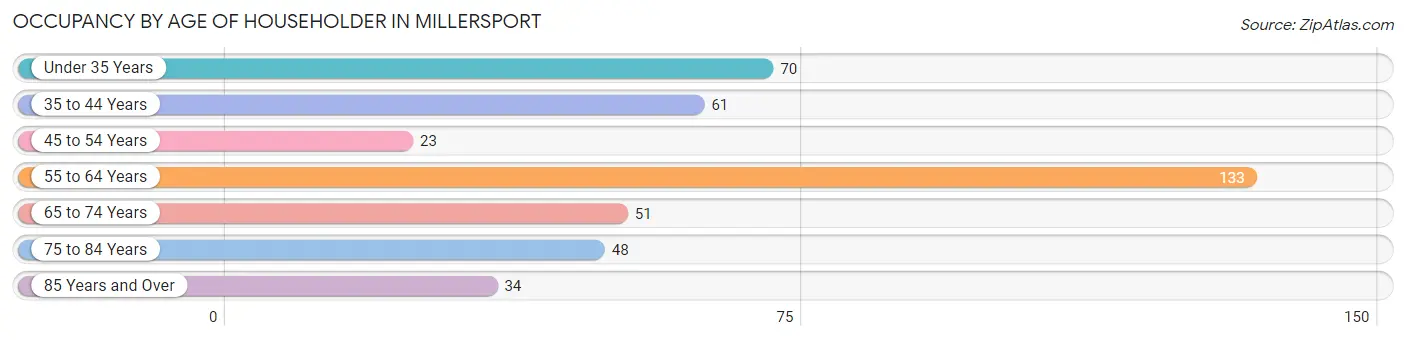
| Age Bracket | # Households | % Households |
| Under 35 Years | 70 | 16.7% |
| 35 to 44 Years | 61 | 14.5% |
| 45 to 54 Years | 23 | 5.5% |
| 55 to 64 Years | 133 | 31.7% |
| 65 to 74 Years | 51 | 12.1% |
| 75 to 84 Years | 48 | 11.4% |
| 85 Years and Over | 34 | 8.1% |
| Total | 420 | 100.0% |
Housing Finances in Millersport
Median Income by Occupancy in Millersport
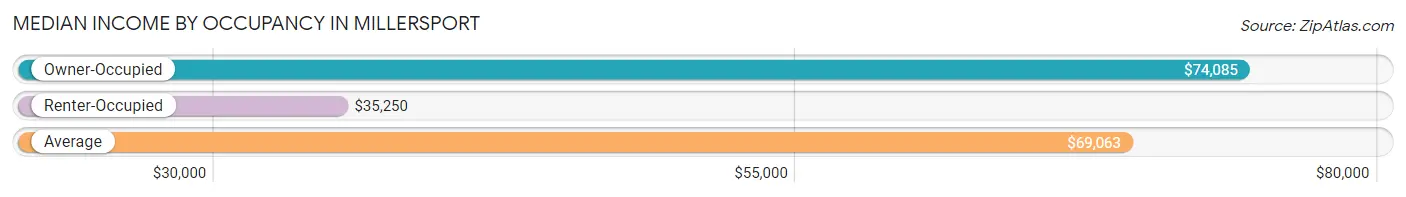
| Occupancy Type | # Households | Median Income |
| Owner-Occupied | 327 (77.9%) | $74,085 |
| Renter-Occupied | 93 (22.1%) | $35,250 |
| Average | 420 (100.0%) | $69,063 |
Occupancy by Householder Income Bracket in Millersport
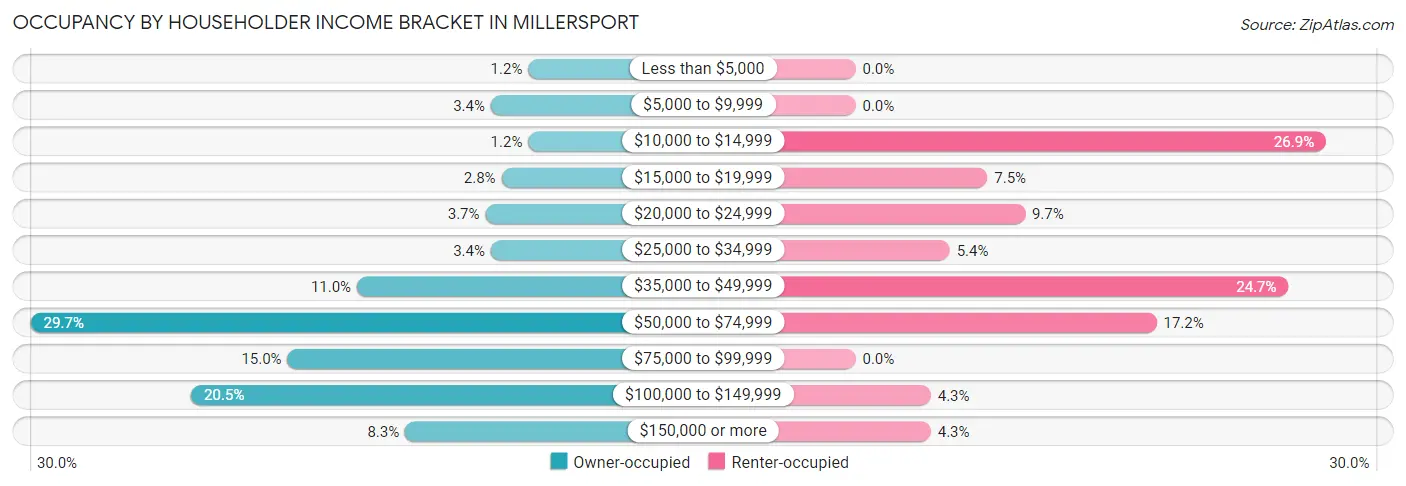
| Income Bracket | Owner-occupied | Renter-occupied |
| Less than $5,000 | 4 (1.2%) | 0 (0.0%) |
| $5,000 to $9,999 | 11 (3.4%) | 0 (0.0%) |
| $10,000 to $14,999 | 4 (1.2%) | 25 (26.9%) |
| $15,000 to $19,999 | 9 (2.8%) | 7 (7.5%) |
| $20,000 to $24,999 | 12 (3.7%) | 9 (9.7%) |
| $25,000 to $34,999 | 11 (3.4%) | 5 (5.4%) |
| $35,000 to $49,999 | 36 (11.0%) | 23 (24.7%) |
| $50,000 to $74,999 | 97 (29.7%) | 16 (17.2%) |
| $75,000 to $99,999 | 49 (15.0%) | 0 (0.0%) |
| $100,000 to $149,999 | 67 (20.5%) | 4 (4.3%) |
| $150,000 or more | 27 (8.3%) | 4 (4.3%) |
| Total | 327 (100.0%) | 93 (100.0%) |
Monthly Housing Cost Tiers in Millersport
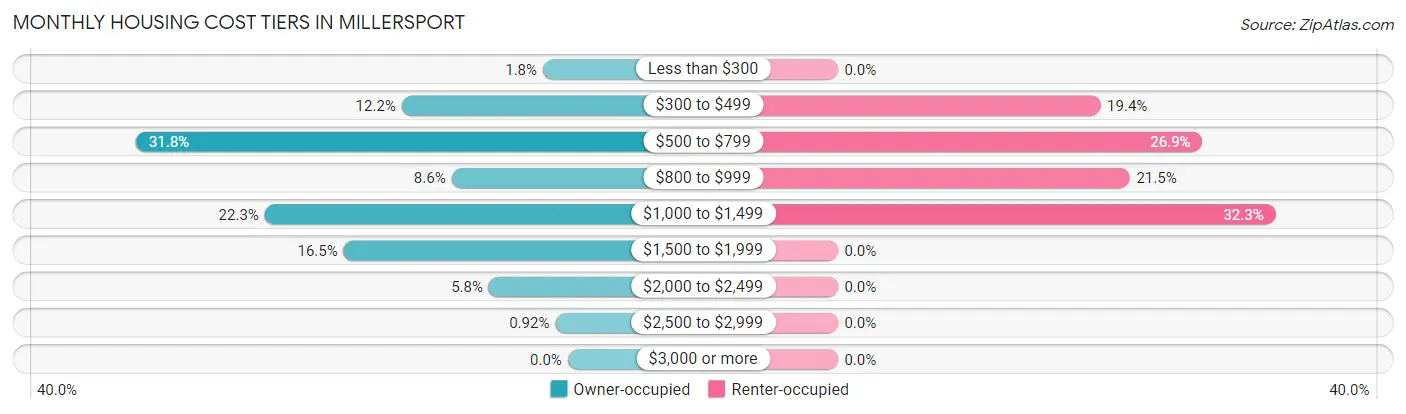
| Monthly Cost | Owner-occupied | Renter-occupied |
| Less than $300 | 6 (1.8%) | 0 (0.0%) |
| $300 to $499 | 40 (12.2%) | 18 (19.4%) |
| $500 to $799 | 104 (31.8%) | 25 (26.9%) |
| $800 to $999 | 28 (8.6%) | 20 (21.5%) |
| $1,000 to $1,499 | 73 (22.3%) | 30 (32.3%) |
| $1,500 to $1,999 | 54 (16.5%) | 0 (0.0%) |
| $2,000 to $2,499 | 19 (5.8%) | 0 (0.0%) |
| $2,500 to $2,999 | 3 (0.9%) | 0 (0.0%) |
| $3,000 or more | 0 (0.0%) | 0 (0.0%) |
| Total | 327 (100.0%) | 93 (100.0%) |
Physical Housing Characteristics in Millersport
Housing Structures in Millersport
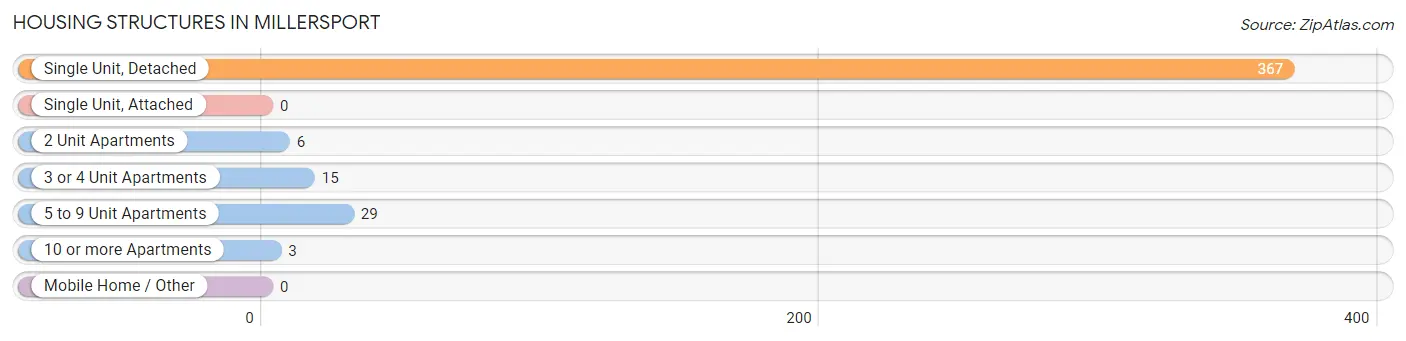
| Structure Type | # Housing Units | % Housing Units |
| Single Unit, Detached | 367 | 87.4% |
| Single Unit, Attached | 0 | 0.0% |
| 2 Unit Apartments | 6 | 1.4% |
| 3 or 4 Unit Apartments | 15 | 3.6% |
| 5 to 9 Unit Apartments | 29 | 6.9% |
| 10 or more Apartments | 3 | 0.7% |
| Mobile Home / Other | 0 | 0.0% |
| Total | 420 | 100.0% |
Housing Structures by Occupancy in Millersport
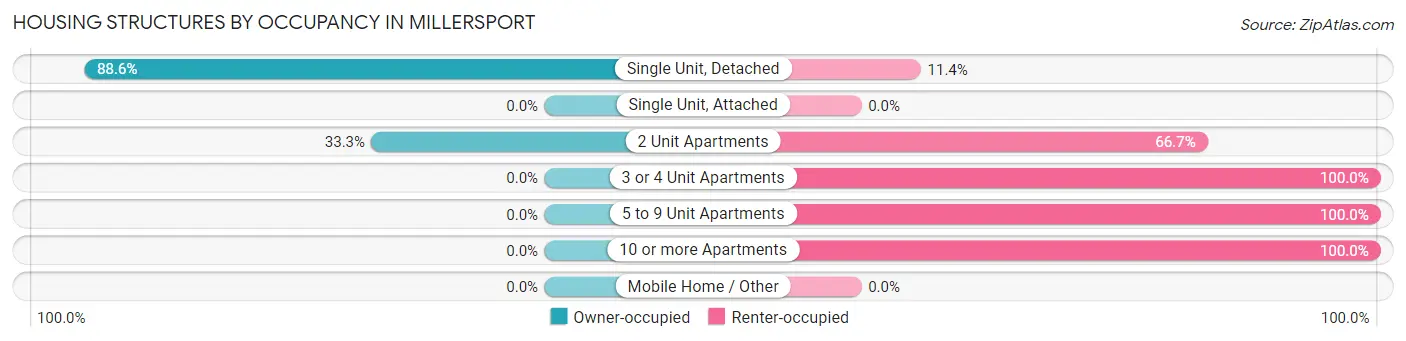
| Structure Type | Owner-occupied | Renter-occupied |
| Single Unit, Detached | 325 (88.6%) | 42 (11.4%) |
| Single Unit, Attached | 0 (0.0%) | 0 (0.0%) |
| 2 Unit Apartments | 2 (33.3%) | 4 (66.7%) |
| 3 or 4 Unit Apartments | 0 (0.0%) | 15 (100.0%) |
| 5 to 9 Unit Apartments | 0 (0.0%) | 29 (100.0%) |
| 10 or more Apartments | 0 (0.0%) | 3 (100.0%) |
| Mobile Home / Other | 0 (0.0%) | 0 (0.0%) |
| Total | 327 (77.9%) | 93 (22.1%) |
Housing Structures by Number of Rooms in Millersport
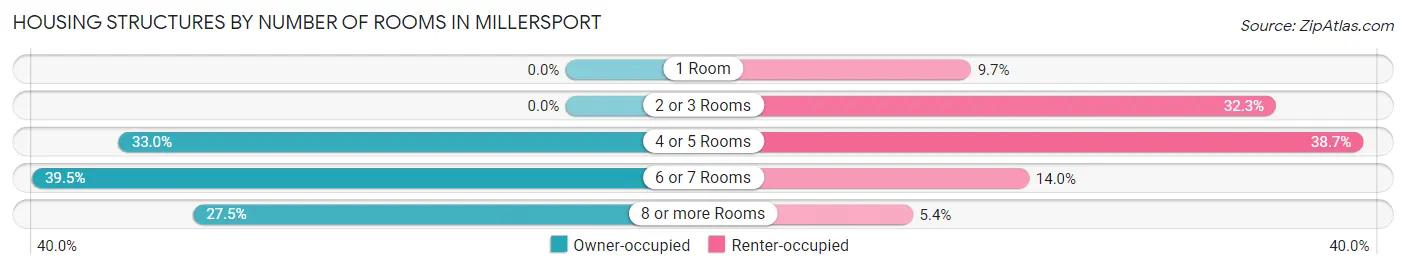
| Number of Rooms | Owner-occupied | Renter-occupied |
| 1 Room | 0 (0.0%) | 9 (9.7%) |
| 2 or 3 Rooms | 0 (0.0%) | 30 (32.3%) |
| 4 or 5 Rooms | 108 (33.0%) | 36 (38.7%) |
| 6 or 7 Rooms | 129 (39.5%) | 13 (14.0%) |
| 8 or more Rooms | 90 (27.5%) | 5 (5.4%) |
| Total | 327 (100.0%) | 93 (100.0%) |
Housing Structure by Heating Type in Millersport
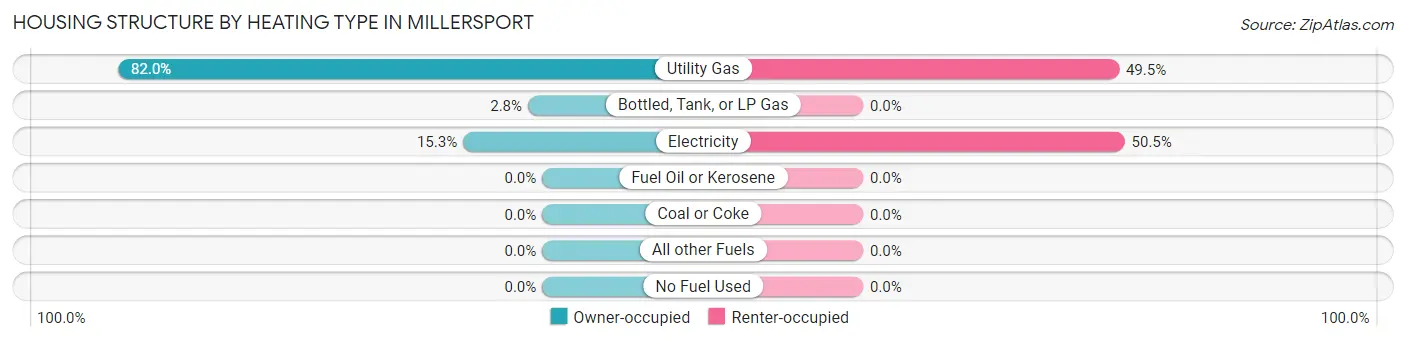
| Heating Type | Owner-occupied | Renter-occupied |
| Utility Gas | 268 (82.0%) | 46 (49.5%) |
| Bottled, Tank, or LP Gas | 9 (2.8%) | 0 (0.0%) |
| Electricity | 50 (15.3%) | 47 (50.5%) |
| Fuel Oil or Kerosene | 0 (0.0%) | 0 (0.0%) |
| Coal or Coke | 0 (0.0%) | 0 (0.0%) |
| All other Fuels | 0 (0.0%) | 0 (0.0%) |
| No Fuel Used | 0 (0.0%) | 0 (0.0%) |
| Total | 327 (100.0%) | 93 (100.0%) |
Household Vehicle Usage in Millersport
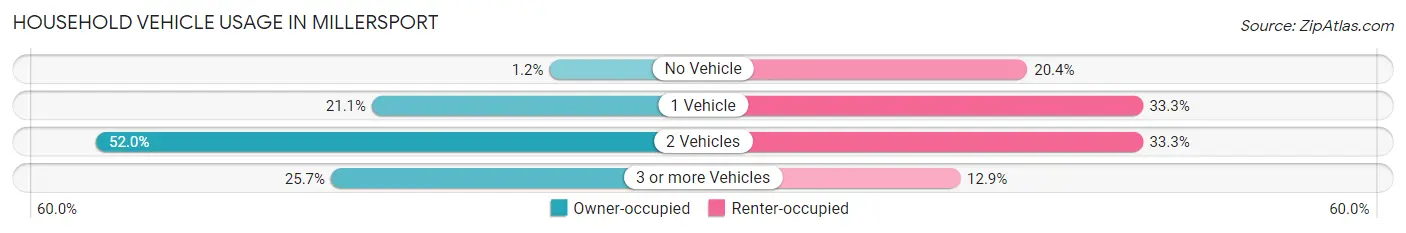
| Vehicles per Household | Owner-occupied | Renter-occupied |
| No Vehicle | 4 (1.2%) | 19 (20.4%) |
| 1 Vehicle | 69 (21.1%) | 31 (33.3%) |
| 2 Vehicles | 170 (52.0%) | 31 (33.3%) |
| 3 or more Vehicles | 84 (25.7%) | 12 (12.9%) |
| Total | 327 (100.0%) | 93 (100.0%) |
Real Estate & Mortgages in Millersport
Real Estate and Mortgage Overview in Millersport
| Characteristic | Without Mortgage | With Mortgage |
| Housing Units | 161 | 166 |
| Median Property Value | $202,000 | $231,400 |
| Median Household Income | $72,672 | $15 |
| Monthly Housing Costs | $606 | $0 |
| Real Estate Taxes | $2,831 | $0 |
Property Value by Mortgage Status in Millersport
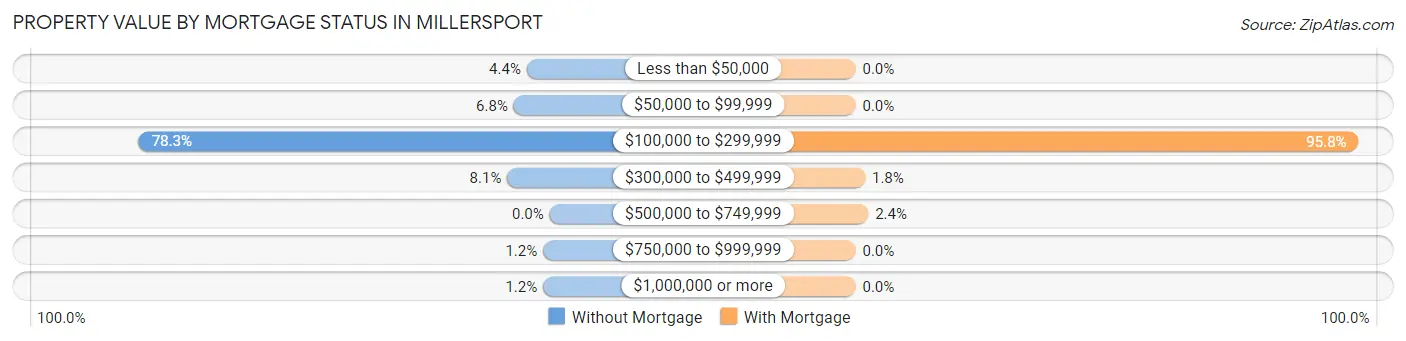
| Property Value | Without Mortgage | With Mortgage |
| Less than $50,000 | 7 (4.3%) | 0 (0.0%) |
| $50,000 to $99,999 | 11 (6.8%) | 0 (0.0%) |
| $100,000 to $299,999 | 126 (78.3%) | 159 (95.8%) |
| $300,000 to $499,999 | 13 (8.1%) | 3 (1.8%) |
| $500,000 to $749,999 | 0 (0.0%) | 4 (2.4%) |
| $750,000 to $999,999 | 2 (1.2%) | 0 (0.0%) |
| $1,000,000 or more | 2 (1.2%) | 0 (0.0%) |
| Total | 161 (100.0%) | 166 (100.0%) |
Household Income by Mortgage Status in Millersport
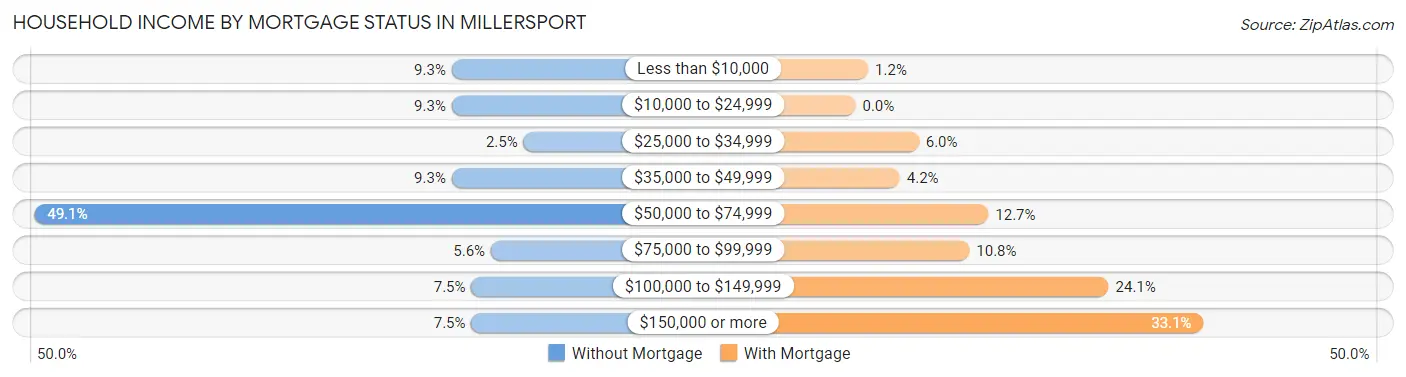
| Household Income | Without Mortgage | With Mortgage |
| Less than $10,000 | 15 (9.3%) | 2 (1.2%) |
| $10,000 to $24,999 | 15 (9.3%) | 0 (0.0%) |
| $25,000 to $34,999 | 4 (2.5%) | 10 (6.0%) |
| $35,000 to $49,999 | 15 (9.3%) | 7 (4.2%) |
| $50,000 to $74,999 | 79 (49.1%) | 21 (12.7%) |
| $75,000 to $99,999 | 9 (5.6%) | 18 (10.8%) |
| $100,000 to $149,999 | 12 (7.4%) | 40 (24.1%) |
| $150,000 or more | 12 (7.4%) | 55 (33.1%) |
| Total | 161 (100.0%) | 166 (100.0%) |
Property Value to Household Income Ratio in Millersport
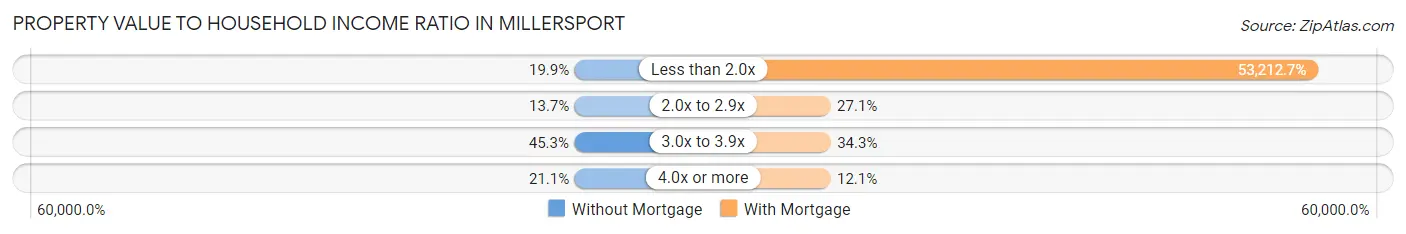
| Value-to-Income Ratio | Without Mortgage | With Mortgage |
| Less than 2.0x | 32 (19.9%) | 88,333 (53,212.6%) |
| 2.0x to 2.9x | 22 (13.7%) | 45 (27.1%) |
| 3.0x to 3.9x | 73 (45.3%) | 57 (34.3%) |
| 4.0x or more | 34 (21.1%) | 20 (12.0%) |
| Total | 161 (100.0%) | 166 (100.0%) |
Real Estate Taxes by Mortgage Status in Millersport
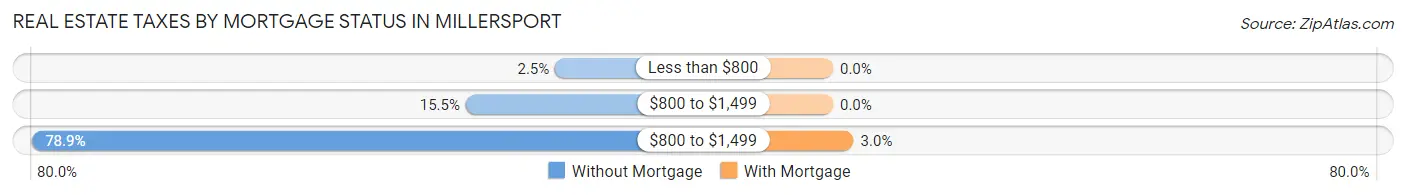
| Property Taxes | Without Mortgage | With Mortgage |
| Less than $800 | 4 (2.5%) | 0 (0.0%) |
| $800 to $1,499 | 25 (15.5%) | 0 (0.0%) |
| $800 to $1,499 | 127 (78.9%) | 5 (3.0%) |
| Total | 161 (100.0%) | 166 (100.0%) |
Health & Disability in Millersport
Health Insurance Coverage by Age in Millersport
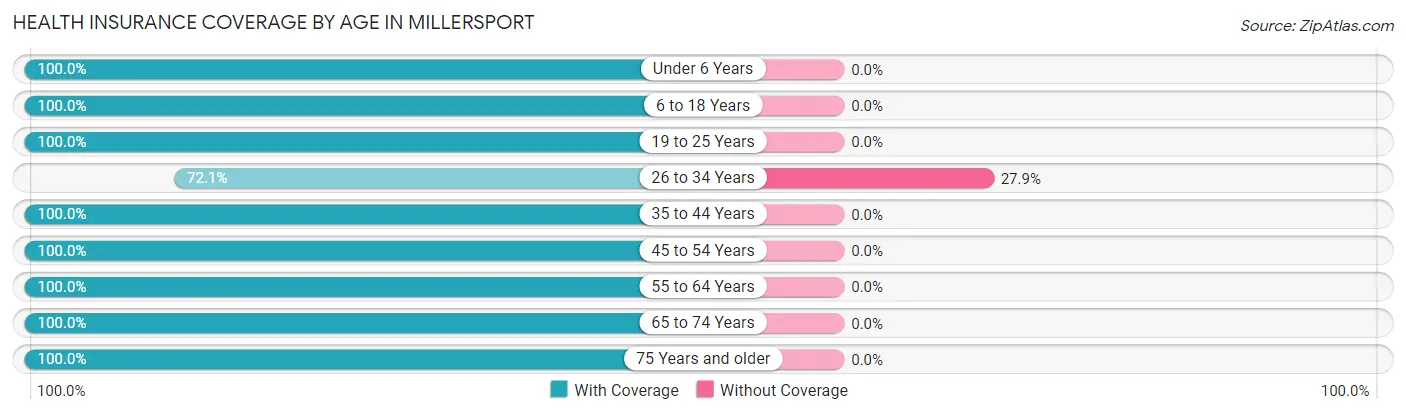
| Age Bracket | With Coverage | Without Coverage |
| Under 6 Years | 56 (100.0%) | 0 (0.0%) |
| 6 to 18 Years | 141 (100.0%) | 0 (0.0%) |
| 19 to 25 Years | 66 (100.0%) | 0 (0.0%) |
| 26 to 34 Years | 88 (72.1%) | 34 (27.9%) |
| 35 to 44 Years | 103 (100.0%) | 0 (0.0%) |
| 45 to 54 Years | 45 (100.0%) | 0 (0.0%) |
| 55 to 64 Years | 232 (100.0%) | 0 (0.0%) |
| 65 to 74 Years | 114 (100.0%) | 0 (0.0%) |
| 75 Years and older | 95 (100.0%) | 0 (0.0%) |
| Total | 940 (96.5%) | 34 (3.5%) |
Health Insurance Coverage by Citizenship Status in Millersport
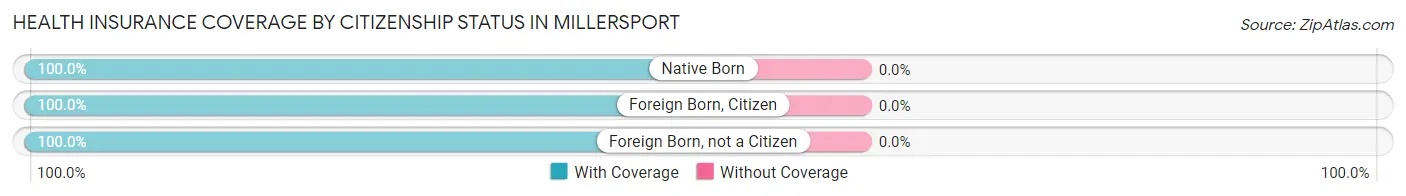
| Citizenship Status | With Coverage | Without Coverage |
| Native Born | 56 (100.0%) | 0 (0.0%) |
| Foreign Born, Citizen | 141 (100.0%) | 0 (0.0%) |
| Foreign Born, not a Citizen | 66 (100.0%) | 0 (0.0%) |
Health Insurance Coverage by Household Income in Millersport
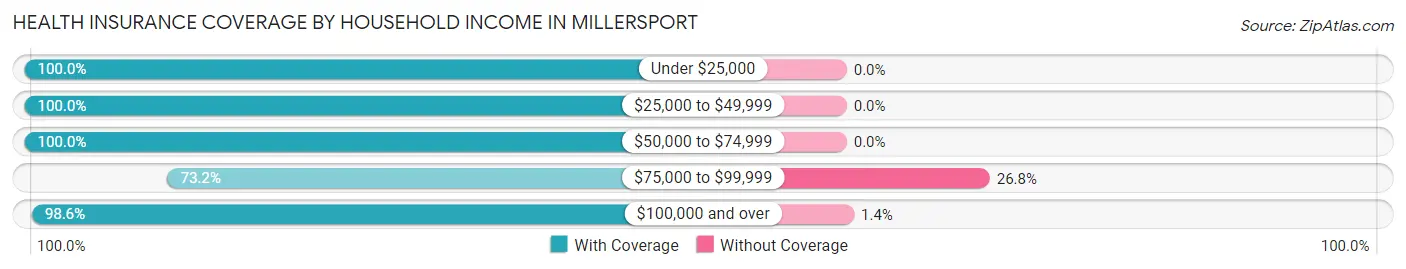
| Household Income | With Coverage | Without Coverage |
| Under $25,000 | 112 (100.0%) | 0 (0.0%) |
| $25,000 to $49,999 | 170 (100.0%) | 0 (0.0%) |
| $50,000 to $74,999 | 288 (100.0%) | 0 (0.0%) |
| $75,000 to $99,999 | 82 (73.2%) | 30 (26.8%) |
| $100,000 and over | 288 (98.6%) | 4 (1.4%) |
Public vs Private Health Insurance Coverage by Age in Millersport
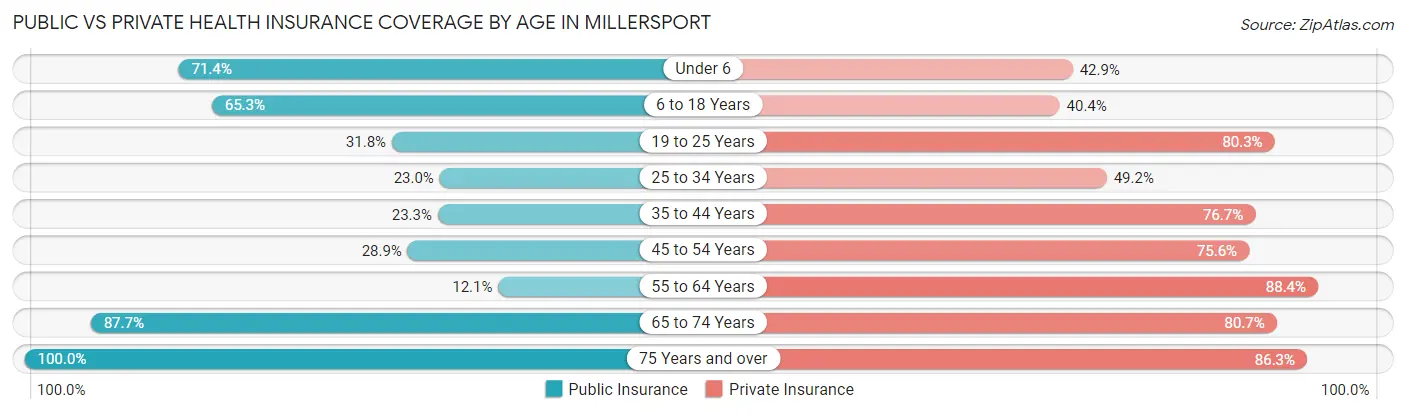
| Age Bracket | Public Insurance | Private Insurance |
| Under 6 | 40 (71.4%) | 24 (42.9%) |
| 6 to 18 Years | 92 (65.2%) | 57 (40.4%) |
| 19 to 25 Years | 21 (31.8%) | 53 (80.3%) |
| 25 to 34 Years | 28 (23.0%) | 60 (49.2%) |
| 35 to 44 Years | 24 (23.3%) | 79 (76.7%) |
| 45 to 54 Years | 13 (28.9%) | 34 (75.6%) |
| 55 to 64 Years | 28 (12.1%) | 205 (88.4%) |
| 65 to 74 Years | 100 (87.7%) | 92 (80.7%) |
| 75 Years and over | 95 (100.0%) | 82 (86.3%) |
| Total | 441 (45.3%) | 686 (70.4%) |
Disability Status by Sex by Age in Millersport
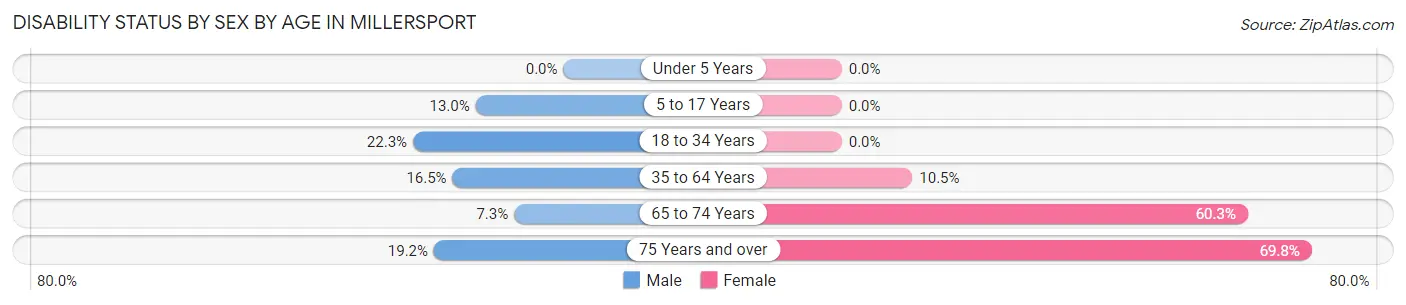
| Age Bracket | Male | Female |
| Under 5 Years | 0 (0.0%) | 0 (0.0%) |
| 5 to 17 Years | 9 (13.0%) | 0 (0.0%) |
| 18 to 34 Years | 21 (22.3%) | 0 (0.0%) |
| 35 to 64 Years | 28 (16.5%) | 22 (10.5%) |
| 65 to 74 Years | 3 (7.3%) | 44 (60.3%) |
| 75 Years and over | 10 (19.2%) | 30 (69.8%) |
Disability Class by Sex by Age in Millersport
Disability Class: Hearing Difficulty
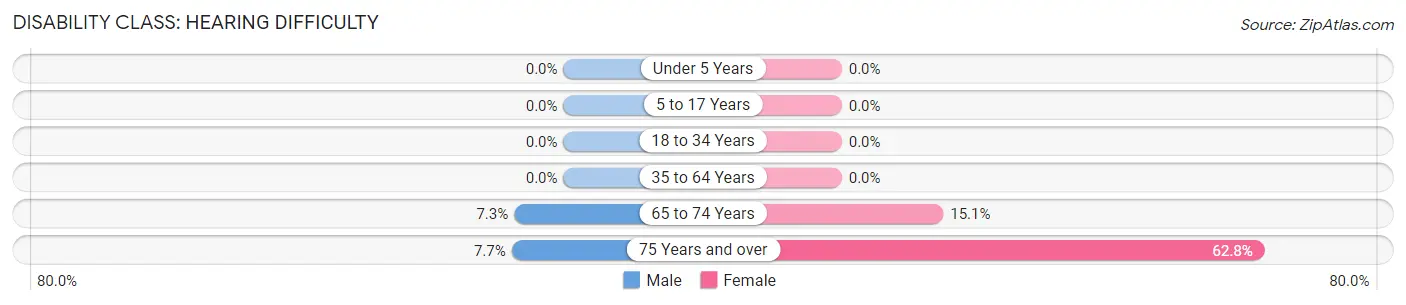
| Age Bracket | Male | Female |
| Under 5 Years | 0 (0.0%) | 0 (0.0%) |
| 5 to 17 Years | 0 (0.0%) | 0 (0.0%) |
| 18 to 34 Years | 0 (0.0%) | 0 (0.0%) |
| 35 to 64 Years | 0 (0.0%) | 0 (0.0%) |
| 65 to 74 Years | 3 (7.3%) | 11 (15.1%) |
| 75 Years and over | 4 (7.7%) | 27 (62.8%) |
Disability Class: Vision Difficulty
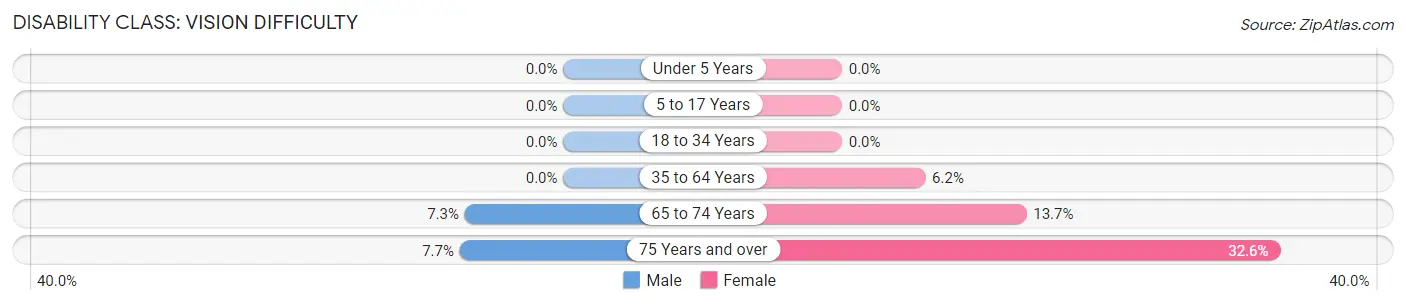
| Age Bracket | Male | Female |
| Under 5 Years | 0 (0.0%) | 0 (0.0%) |
| 5 to 17 Years | 0 (0.0%) | 0 (0.0%) |
| 18 to 34 Years | 0 (0.0%) | 0 (0.0%) |
| 35 to 64 Years | 0 (0.0%) | 13 (6.2%) |
| 65 to 74 Years | 3 (7.3%) | 10 (13.7%) |
| 75 Years and over | 4 (7.7%) | 14 (32.6%) |
Disability Class: Cognitive Difficulty
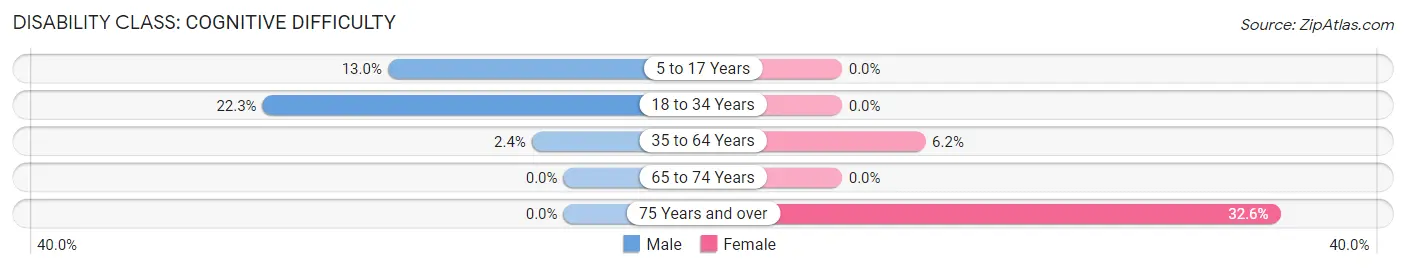
| Age Bracket | Male | Female |
| 5 to 17 Years | 9 (13.0%) | 0 (0.0%) |
| 18 to 34 Years | 21 (22.3%) | 0 (0.0%) |
| 35 to 64 Years | 4 (2.4%) | 13 (6.2%) |
| 65 to 74 Years | 0 (0.0%) | 0 (0.0%) |
| 75 Years and over | 0 (0.0%) | 14 (32.6%) |
Disability Class: Ambulatory Difficulty
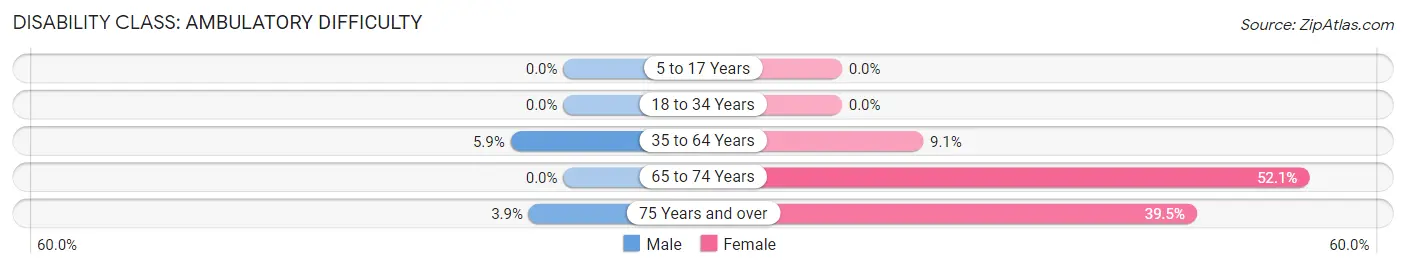
| Age Bracket | Male | Female |
| 5 to 17 Years | 0 (0.0%) | 0 (0.0%) |
| 18 to 34 Years | 0 (0.0%) | 0 (0.0%) |
| 35 to 64 Years | 10 (5.9%) | 19 (9.0%) |
| 65 to 74 Years | 0 (0.0%) | 38 (52.0%) |
| 75 Years and over | 2 (3.8%) | 17 (39.5%) |
Disability Class: Self-Care Difficulty
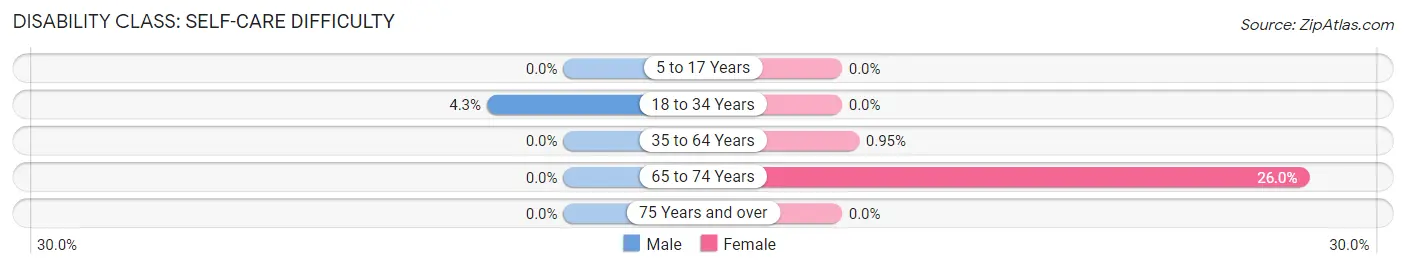
| Age Bracket | Male | Female |
| 5 to 17 Years | 0 (0.0%) | 0 (0.0%) |
| 18 to 34 Years | 4 (4.3%) | 0 (0.0%) |
| 35 to 64 Years | 0 (0.0%) | 2 (0.9%) |
| 65 to 74 Years | 0 (0.0%) | 19 (26.0%) |
| 75 Years and over | 0 (0.0%) | 0 (0.0%) |
Technology Access in Millersport
Computing Device Access in Millersport
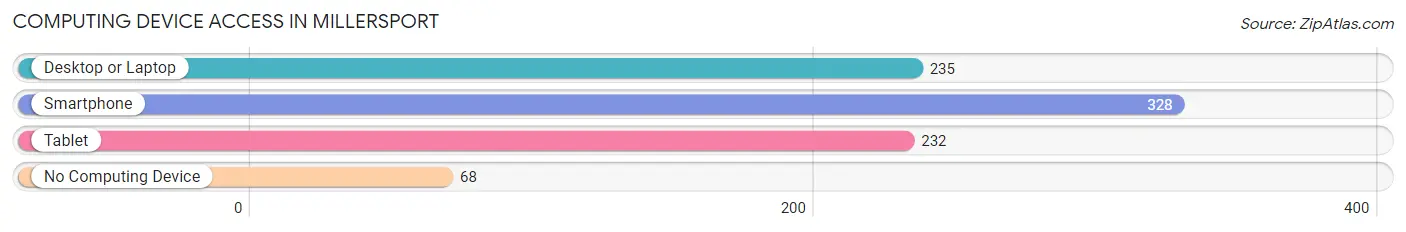
| Device Type | # Households | % Households |
| Desktop or Laptop | 235 | 55.9% |
| Smartphone | 328 | 78.1% |
| Tablet | 232 | 55.2% |
| No Computing Device | 68 | 16.2% |
| Total | 420 | 100.0% |
Internet Access in Millersport
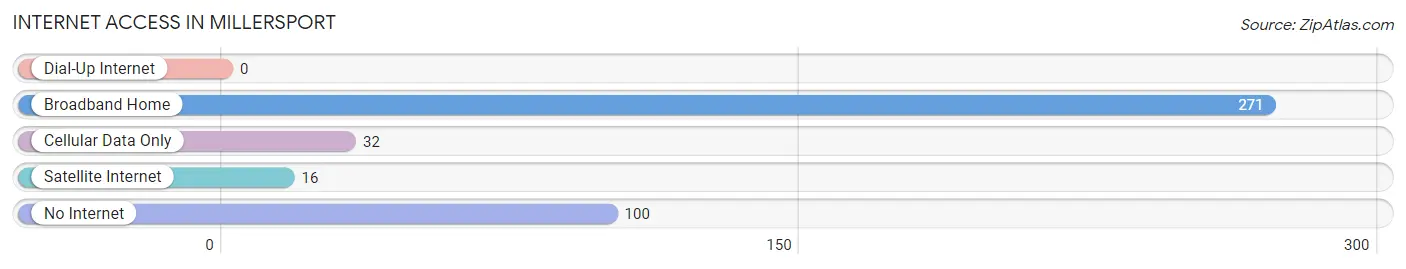
| Internet Type | # Households | % Households |
| Dial-Up Internet | 0 | 0.0% |
| Broadband Home | 271 | 64.5% |
| Cellular Data Only | 32 | 7.6% |
| Satellite Internet | 16 | 3.8% |
| No Internet | 100 | 23.8% |
| Total | 420 | 100.0% |
Millersport Summary
Millerport is a small village located in Fairfield County, Ohio. It is situated on the banks of the Walnut Creek, a tributary of the Scioto River. The village is located approximately 25 miles southeast of Columbus, the state capital. Millerport is part of the Lancaster Micropolitan Statistical Area. The village has a population of approximately 1,000 people, according to the 2010 census.
History
Millerport was founded in 1817 by John Miller, a Revolutionary War veteran. Miller purchased the land from the United States government and named the village after himself. The village was originally known as Miller's Port, but the name was eventually shortened to Millerport.
In the early 19th century, Millerport was a thriving agricultural community. The village was home to several mills, including a grist mill, a saw mill, and a woolen mill. The village also had a blacksmith shop, a general store, and a post office.
In the late 19th century, Millerport began to decline. The mills closed and the population began to dwindle. By the early 20th century, the village was nearly abandoned.
In the late 20th century, Millerport began to experience a resurgence. The village was designated a historic district in 1978 and several of the original buildings were restored. Today, Millerport is a popular tourist destination and is home to several small businesses.
Geography
Millerport is located in Fairfield County, Ohio. The village is situated on the banks of the Walnut Creek, a tributary of the Scioto River. The village is located approximately 25 miles southeast of Columbus, the state capital.
The village has a total area of 0.3 square miles, all of which is land. The terrain is mostly flat, with some rolling hills. The village is located in a temperate climate zone, with hot summers and cold winters.
Economy
Millerport is a small, rural village with a limited economy. The village is home to several small businesses, including a general store, a restaurant, and a bed and breakfast. The village also has a post office and a library.
The village is home to several farms, which produce a variety of crops, including corn, soybeans, and wheat. The village also has a small manufacturing sector, which produces a variety of products, including furniture and clothing.
Demographics
According to the 2010 census, Millerport has a population of 1,000 people. The village has a median household income of $41,250 and a median family income of $50,000. The village has a poverty rate of 11.7%.
The village is predominantly white, with 92.7% of the population identifying as such. The village also has a small Hispanic population, with 4.7% of the population identifying as such. The village also has a small African American population, with 1.7% of the population identifying as such.
Conclusion
Millerport is a small village located in Fairfield County, Ohio. The village was founded in 1817 and was once a thriving agricultural community. In the late 20th century, the village began to experience a resurgence and is now a popular tourist destination. Millerport has a population of 1,000 people and a median household income of $41,250. The village is predominantly white, with 92.7% of the population identifying as such. The village is home to several small businesses and farms, which produce a variety of crops and products.
Common Questions
What is Per Capita Income in Millersport?
Per Capita income in Millersport is $35,176.
What is the Median Family Income in Millersport?
Median Family Income in Millersport is $73,839.
What is the Median Household income in Millersport?
Median Household Income in Millersport is $69,063.
What is Income or Wage Gap in Millersport?
Income or Wage Gap in Millersport is 69.0%.
Women in Millersport earn 31.0 cents for every dollar earned by a man.
What is Inequality or Gini Index in Millersport?
Inequality or Gini Index in Millersport is 0.42.
What is the Total Population of Millersport?
Total Population of Millersport is 974.
What is the Total Male Population of Millersport?
Total Male Population of Millersport is 443.
What is the Total Female Population of Millersport?
Total Female Population of Millersport is 531.
What is the Ratio of Males per 100 Females in Millersport?
There are 83.43 Males per 100 Females in Millersport.
What is the Ratio of Females per 100 Males in Millersport?
There are 119.86 Females per 100 Males in Millersport.
What is the Median Population Age in Millersport?
Median Population Age in Millersport is 43.9 Years.
What is the Average Family Size in Millersport
Average Family Size in Millersport is 2.8 People.
What is the Average Household Size in Millersport
Average Household Size in Millersport is 2.3 People.
How Large is the Labor Force in Millersport?
There are 522 People in the Labor Forcein in Millersport.
What is the Percentage of People in the Labor Force in Millersport?
64.5% of People are in the Labor Force in Millersport.
What is the Unemployment Rate in Millersport?
Unemployment Rate in Millersport is 12.1%.