Midvale, OH Map & Demographics
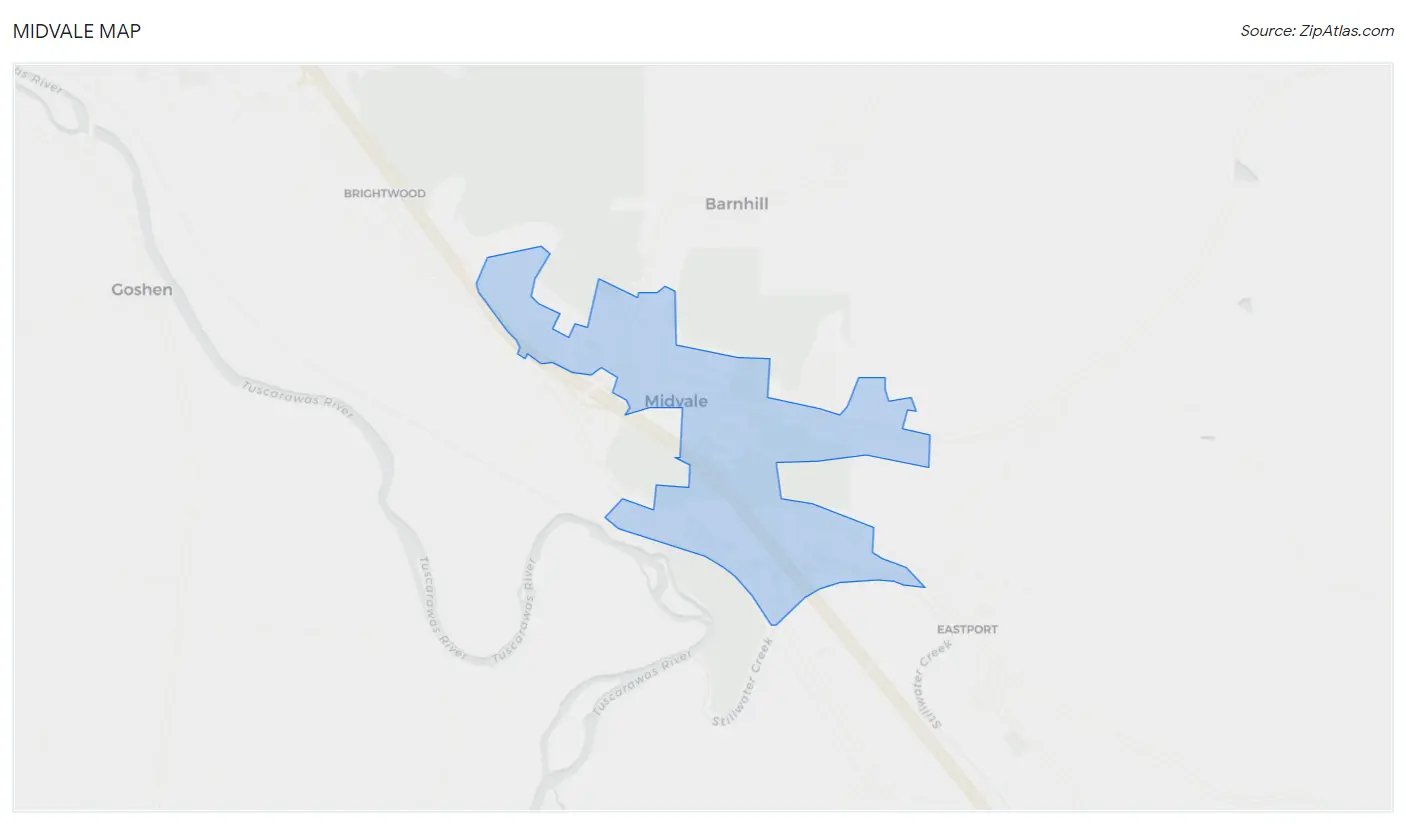
Midvale Map
Midvale Overview
$24,124
PER CAPITA INCOME
$62,059
AVG FAMILY INCOME
$61,635
AVG HOUSEHOLD INCOME
45.6%
WAGE / INCOME GAP [ % ]
54.4¢/ $1
WAGE / INCOME GAP [ $ ]
$9,392
FAMILY INCOME DEFICIT
0.29
INEQUALITY / GINI INDEX
868
TOTAL POPULATION
463
MALE POPULATION
405
FEMALE POPULATION
114.32
MALES / 100 FEMALES
87.47
FEMALES / 100 MALES
38.5
MEDIAN AGE
3.0
AVG FAMILY SIZE
2.8
AVG HOUSEHOLD SIZE
411
LABOR FORCE [ PEOPLE ]
61.8%
PERCENT IN LABOR FORCE
3.9%
UNEMPLOYMENT RATE
Midvale Zip Codes
Income in Midvale
Income Overview in Midvale
Per Capita Income in Midvale is $24,124, while median incomes of families and households are $62,059 and $61,635 respectively.
| Characteristic | Number | Measure |
| Per Capita Income | 868 | $24,124 |
| Median Family Income | 228 | $62,059 |
| Mean Family Income | 228 | $67,193 |
| Median Household Income | 311 | $61,635 |
| Mean Household Income | 311 | $65,924 |
| Income Deficit | 228 | $9,392 |
| Wage / Income Gap (%) | 868 | 45.60% |
| Wage / Income Gap ($) | 868 | 54.40¢ per $1 |
| Gini / Inequality Index | 868 | 0.29 |
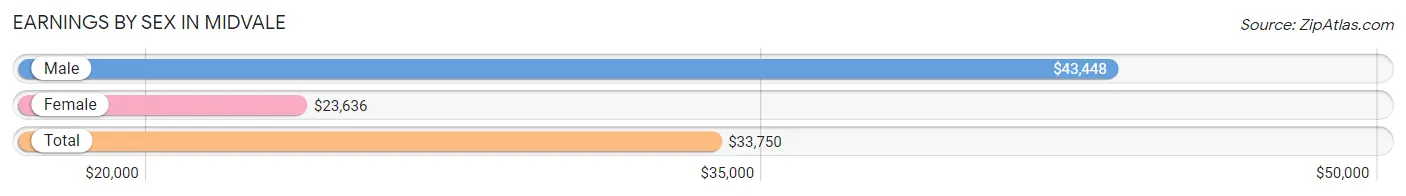
Earnings by Sex in Midvale
Average Earnings in Midvale are $33,750, $43,448 for men and $23,636 for women, a difference of 45.6%.
| Sex | Number | Average Earnings |
| Male | 220 (50.7%) | $43,448 |
| Female | 214 (49.3%) | $23,636 |
| Total | 434 (100.0%) | $33,750 |
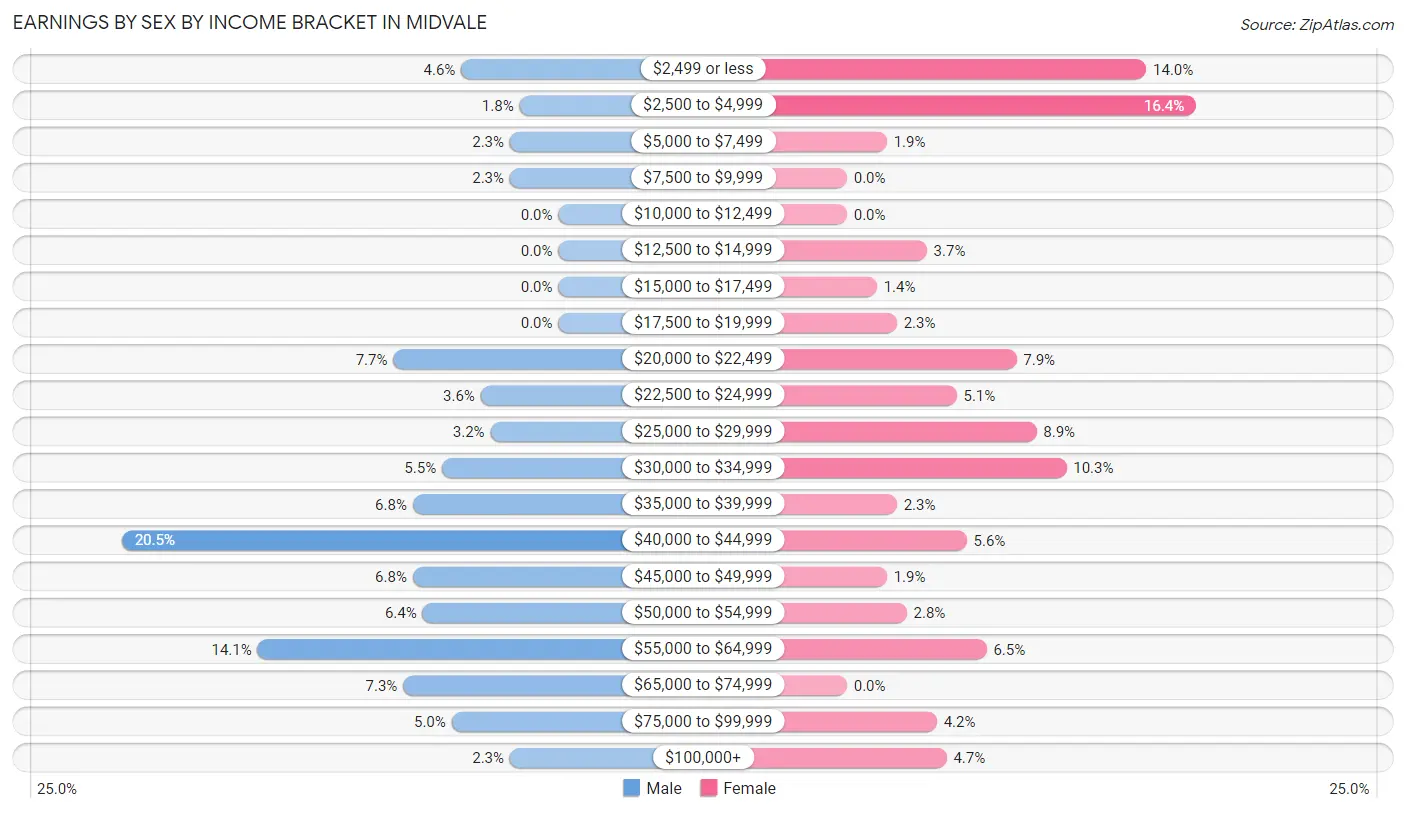
Earnings by Sex by Income Bracket in Midvale
The most common earnings brackets in Midvale are $40,000 to $44,999 for men (45 | 20.4%) and $2,500 to $4,999 for women (35 | 16.4%).
| Income | Male | Female |
| $2,499 or less | 10 (4.5%) | 30 (14.0%) |
| $2,500 to $4,999 | 4 (1.8%) | 35 (16.4%) |
| $5,000 to $7,499 | 5 (2.3%) | 4 (1.9%) |
| $7,500 to $9,999 | 5 (2.3%) | 0 (0.0%) |
| $10,000 to $12,499 | 0 (0.0%) | 0 (0.0%) |
| $12,500 to $14,999 | 0 (0.0%) | 8 (3.7%) |
| $15,000 to $17,499 | 0 (0.0%) | 3 (1.4%) |
| $17,500 to $19,999 | 0 (0.0%) | 5 (2.3%) |
| $20,000 to $22,499 | 17 (7.7%) | 17 (7.9%) |
| $22,500 to $24,999 | 8 (3.6%) | 11 (5.1%) |
| $25,000 to $29,999 | 7 (3.2%) | 19 (8.9%) |
| $30,000 to $34,999 | 12 (5.4%) | 22 (10.3%) |
| $35,000 to $39,999 | 15 (6.8%) | 5 (2.3%) |
| $40,000 to $44,999 | 45 (20.4%) | 12 (5.6%) |
| $45,000 to $49,999 | 15 (6.8%) | 4 (1.9%) |
| $50,000 to $54,999 | 14 (6.4%) | 6 (2.8%) |
| $55,000 to $64,999 | 31 (14.1%) | 14 (6.5%) |
| $65,000 to $74,999 | 16 (7.3%) | 0 (0.0%) |
| $75,000 to $99,999 | 11 (5.0%) | 9 (4.2%) |
| $100,000+ | 5 (2.3%) | 10 (4.7%) |
| Total | 220 (100.0%) | 214 (100.0%) |
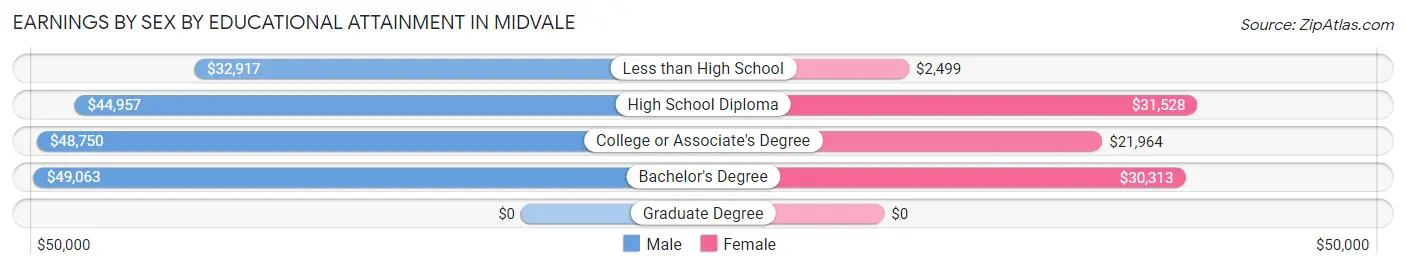
Earnings by Sex by Educational Attainment in Midvale
Average earnings in Midvale are $44,828 for men and $24,773 for women, a difference of 44.7%. Men with an educational attainment of bachelor's degree enjoy the highest average annual earnings of $49,063, while those with less than high school education earn the least with $32,917. Women with an educational attainment of high school diploma earn the most with the average annual earnings of $31,528, while those with less than high school education have the smallest earnings of $2,499.
| Educational Attainment | Male Income | Female Income |
| Less than High School | $32,917 | $2,499 |
| High School Diploma | $44,957 | $31,528 |
| College or Associate's Degree | $48,750 | $21,964 |
| Bachelor's Degree | $49,063 | $30,313 |
| Graduate Degree | - | - |
| Total | $44,828 | $24,773 |
Family Income in Midvale
Family Income Brackets in Midvale
According to the Midvale family income data, there are 78 families falling into the $50,000 to $74,999 income range, which is the most common income bracket and makes up 34.2% of all families.
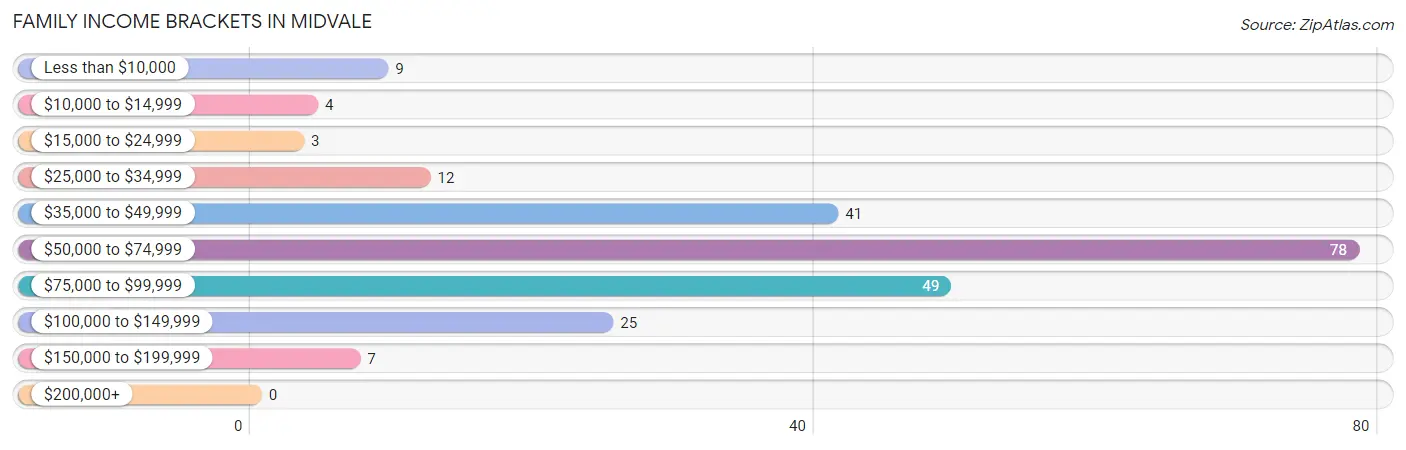
| Income Bracket | # Families | % Families |
| Less than $10,000 | 9 | 3.9% |
| $10,000 to $14,999 | 4 | 1.8% |
| $15,000 to $24,999 | 3 | 1.3% |
| $25,000 to $34,999 | 12 | 5.3% |
| $35,000 to $49,999 | 41 | 18.0% |
| $50,000 to $74,999 | 78 | 34.2% |
| $75,000 to $99,999 | 49 | 21.5% |
| $100,000 to $149,999 | 25 | 11.0% |
| $150,000 to $199,999 | 7 | 3.1% |
| $200,000+ | 0 | 0.0% |
Family Income by Famaliy Size in Midvale
3-person families (34 | 14.9%) account for the highest median family income in Midvale with $76,711 per family, while 2-person families (122 | 53.5%) have the highest median income of $29,584 per family member.
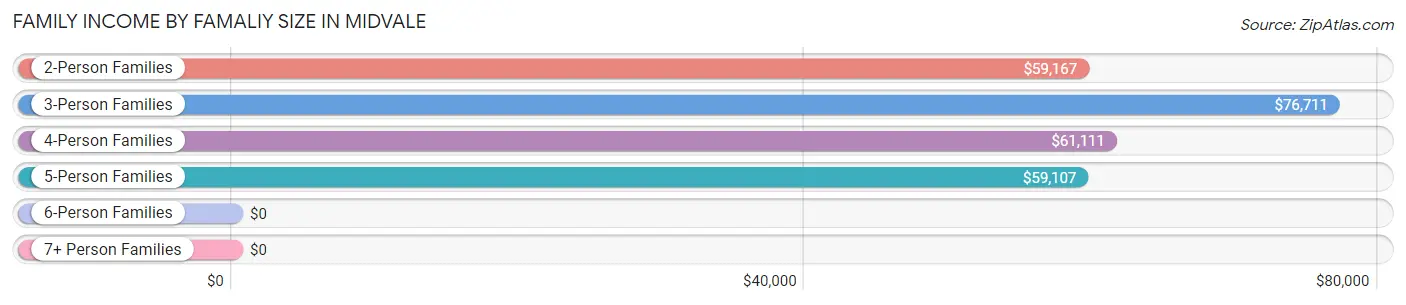
| Income Bracket | # Families | Median Income |
| 2-Person Families | 122 (53.5%) | $59,167 |
| 3-Person Families | 34 (14.9%) | $76,711 |
| 4-Person Families | 38 (16.7%) | $61,111 |
| 5-Person Families | 27 (11.8%) | $59,107 |
| 6-Person Families | 7 (3.1%) | $0 |
| 7+ Person Families | 0 (0.0%) | $0 |
| Total | 228 (100.0%) | $62,059 |
Family Income by Number of Earners in Midvale
The median family income in Midvale is $62,059, with families comprising 3+ earners (13) having the highest median family income of $82,321, while families with no earners (50) have the lowest median family income of $43,125, accounting for 5.7% and 21.9% of families, respectively.
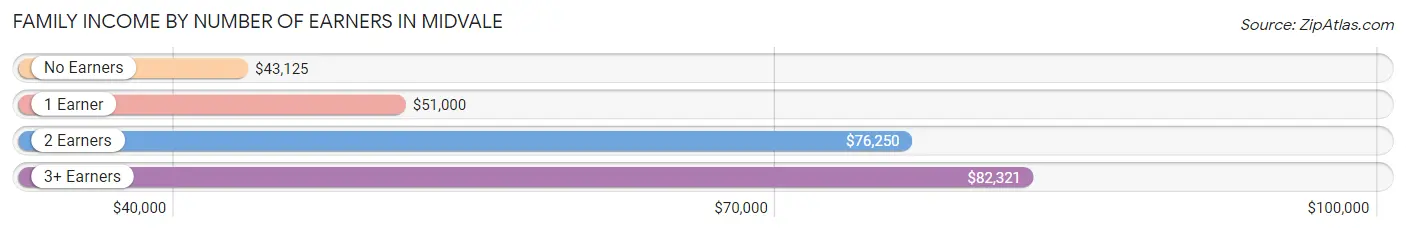
| Number of Earners | # Families | Median Income |
| No Earners | 50 (21.9%) | $43,125 |
| 1 Earner | 56 (24.6%) | $51,000 |
| 2 Earners | 109 (47.8%) | $76,250 |
| 3+ Earners | 13 (5.7%) | $82,321 |
| Total | 228 (100.0%) | $62,059 |
Household Income in Midvale
Household Income Brackets in Midvale
With 82 households falling in the category, the $50,000 to $74,999 income range is the most frequent in Midvale, accounting for 26.4% of all households.
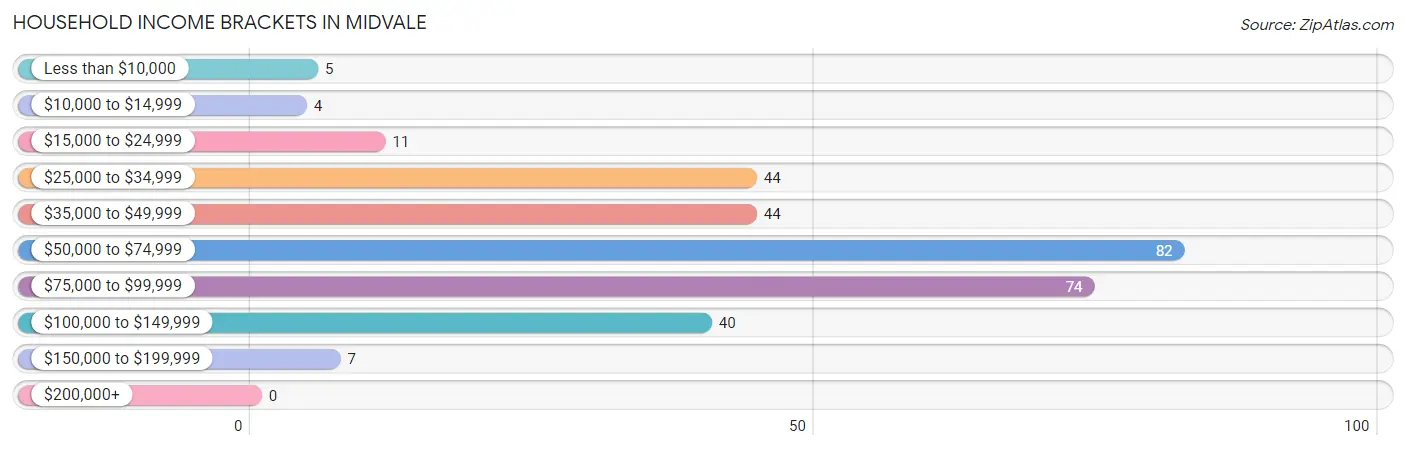
| Income Bracket | # Households | % Households |
| Less than $10,000 | 5 | 1.6% |
| $10,000 to $14,999 | 4 | 1.3% |
| $15,000 to $24,999 | 11 | 3.5% |
| $25,000 to $34,999 | 44 | 14.1% |
| $35,000 to $49,999 | 44 | 14.1% |
| $50,000 to $74,999 | 82 | 26.4% |
| $75,000 to $99,999 | 74 | 23.8% |
| $100,000 to $149,999 | 40 | 12.9% |
| $150,000 to $199,999 | 7 | 2.3% |
| $200,000+ | 0 | 0.0% |
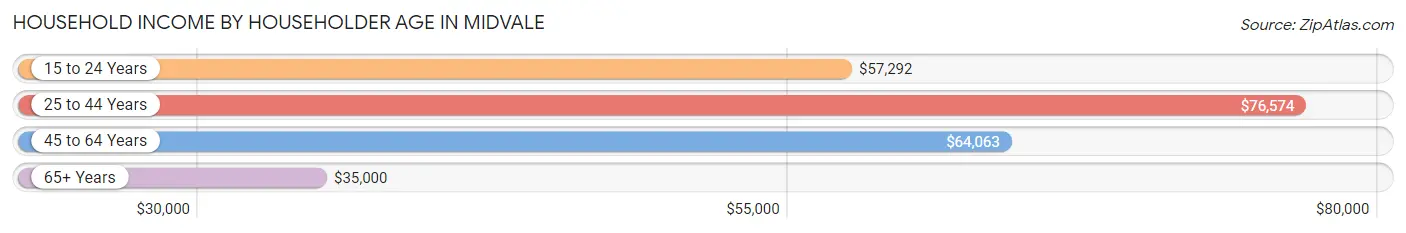
Household Income by Householder Age in Midvale
The median household income in Midvale is $61,635, with the highest median household income of $76,574 found in the 25 to 44 years age bracket for the primary householder. A total of 88 households (28.3%) fall into this category. Meanwhile, the 65+ years age bracket for the primary householder has the lowest median household income of $35,000, with 96 households (30.9%) in this group.
| Income Bracket | # Households | Median Income |
| 15 to 24 Years | 11 (3.5%) | $57,292 |
| 25 to 44 Years | 88 (28.3%) | $76,574 |
| 45 to 64 Years | 116 (37.3%) | $64,063 |
| 65+ Years | 96 (30.9%) | $35,000 |
| Total | 311 (100.0%) | $61,635 |
Poverty in Midvale
Income Below Poverty by Sex and Age in Midvale
With 5.8% poverty level for males and 6.7% for females among the residents of Midvale, 15 year old males and 15 year old females are the most vulnerable to poverty, with 8 males (80.0%) and 3 females (50.0%) in their respective age groups living below the poverty level.
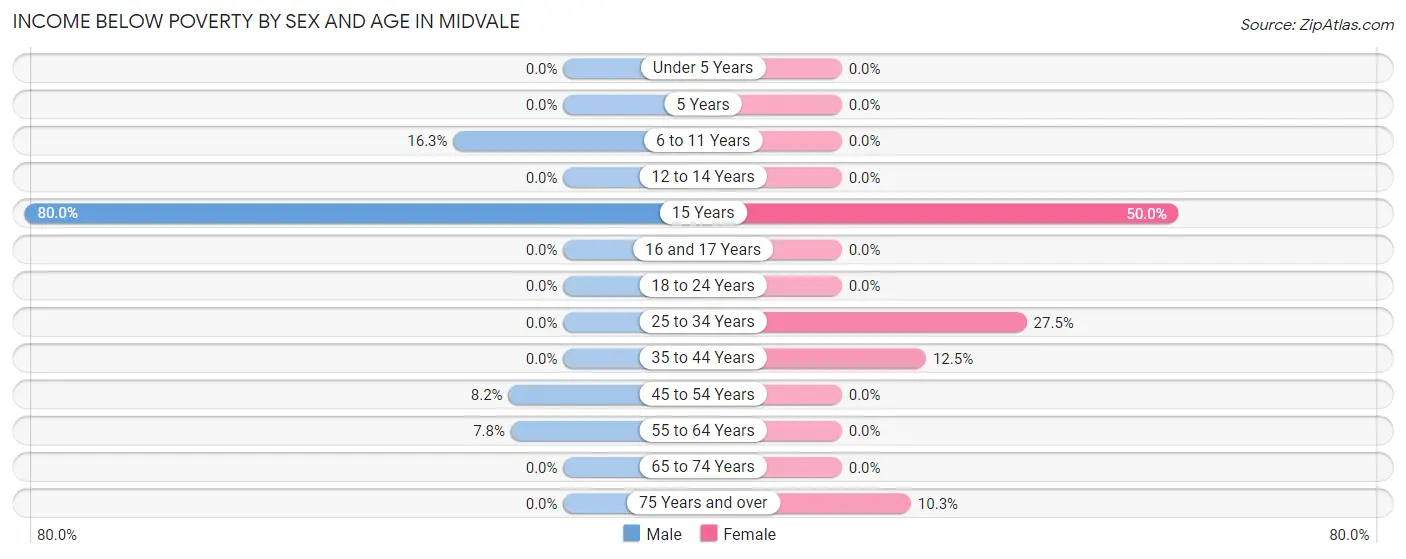
| Age Bracket | Male | Female |
| Under 5 Years | 0 (0.0%) | 0 (0.0%) |
| 5 Years | 0 (0.0%) | 0 (0.0%) |
| 6 to 11 Years | 8 (16.3%) | 0 (0.0%) |
| 12 to 14 Years | 0 (0.0%) | 0 (0.0%) |
| 15 Years | 8 (80.0%) | 3 (50.0%) |
| 16 and 17 Years | 0 (0.0%) | 0 (0.0%) |
| 18 to 24 Years | 0 (0.0%) | 0 (0.0%) |
| 25 to 34 Years | 0 (0.0%) | 14 (27.5%) |
| 35 to 44 Years | 0 (0.0%) | 6 (12.5%) |
| 45 to 54 Years | 4 (8.2%) | 0 (0.0%) |
| 55 to 64 Years | 5 (7.8%) | 0 (0.0%) |
| 65 to 74 Years | 0 (0.0%) | 0 (0.0%) |
| 75 Years and over | 0 (0.0%) | 4 (10.3%) |
| Total | 25 (5.8%) | 27 (6.7%) |
Income Above Poverty by Sex and Age in Midvale
According to the poverty statistics in Midvale, males aged under 5 years and females aged under 5 years are the age groups that are most secure financially, with 100.0% of males and 100.0% of females in these age groups living above the poverty line.
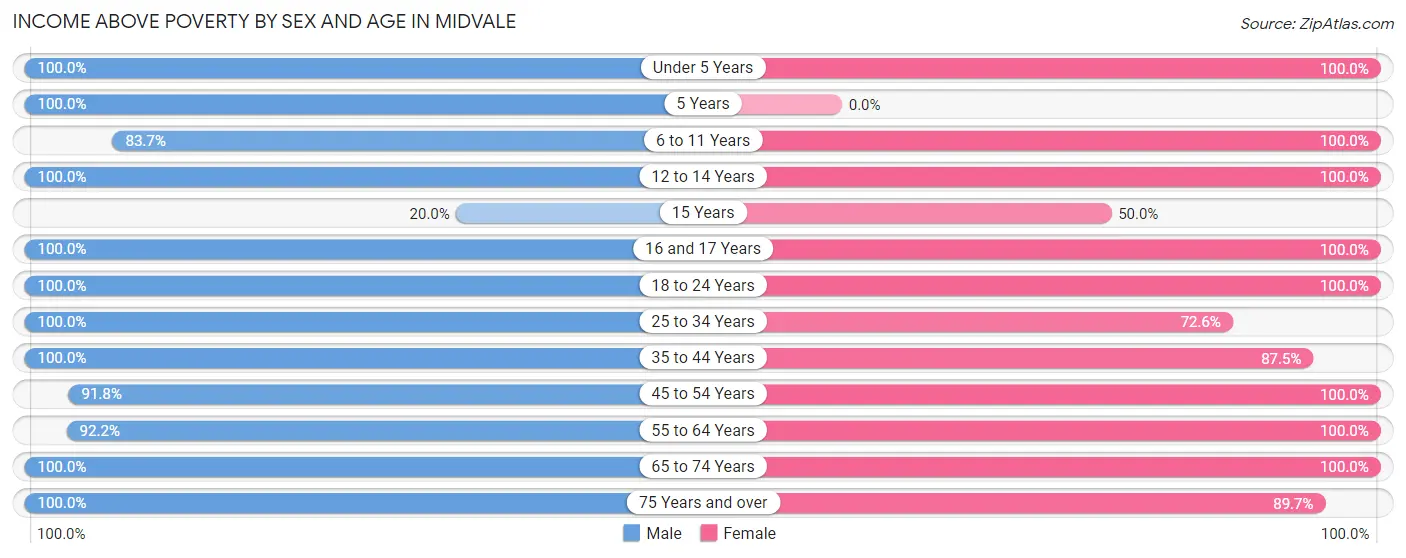
| Age Bracket | Male | Female |
| Under 5 Years | 9 (100.0%) | 27 (100.0%) |
| 5 Years | 4 (100.0%) | 0 (0.0%) |
| 6 to 11 Years | 41 (83.7%) | 16 (100.0%) |
| 12 to 14 Years | 20 (100.0%) | 27 (100.0%) |
| 15 Years | 2 (20.0%) | 3 (50.0%) |
| 16 and 17 Years | 32 (100.0%) | 12 (100.0%) |
| 18 to 24 Years | 42 (100.0%) | 35 (100.0%) |
| 25 to 34 Years | 39 (100.0%) | 37 (72.6%) |
| 35 to 44 Years | 54 (100.0%) | 42 (87.5%) |
| 45 to 54 Years | 45 (91.8%) | 42 (100.0%) |
| 55 to 64 Years | 59 (92.2%) | 56 (100.0%) |
| 65 to 74 Years | 43 (100.0%) | 43 (100.0%) |
| 75 Years and over | 16 (100.0%) | 35 (89.7%) |
| Total | 406 (94.2%) | 375 (93.3%) |
Income Below Poverty Among Married-Couple Families in Midvale
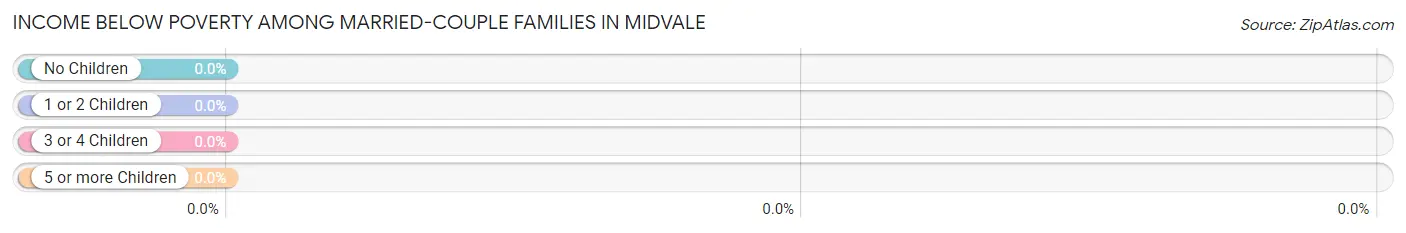
| Children | Above Poverty | Below Poverty |
| No Children | 83 (100.0%) | 0 (0.0%) |
| 1 or 2 Children | 58 (100.0%) | 0 (0.0%) |
| 3 or 4 Children | 21 (100.0%) | 0 (0.0%) |
| 5 or more Children | 0 (0.0%) | 0 (0.0%) |
| Total | 162 (100.0%) | 0 (0.0%) |
Income Below Poverty Among Single-Parent Households in Midvale
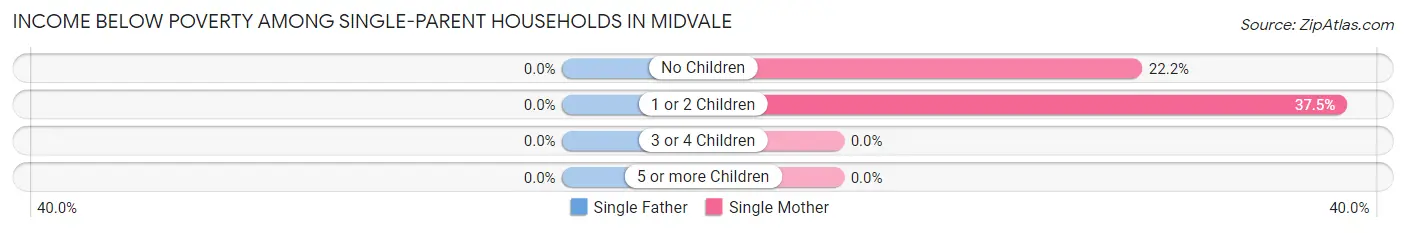
| Children | Single Father | Single Mother |
| No Children | 0 (0.0%) | 4 (22.2%) |
| 1 or 2 Children | 0 (0.0%) | 9 (37.5%) |
| 3 or 4 Children | 0 (0.0%) | 0 (0.0%) |
| 5 or more Children | 0 (0.0%) | 0 (0.0%) |
| Total | 0 (0.0%) | 13 (30.9%) |
Income Below Poverty Among Married-Couple vs Single-Parent Households in Midvale
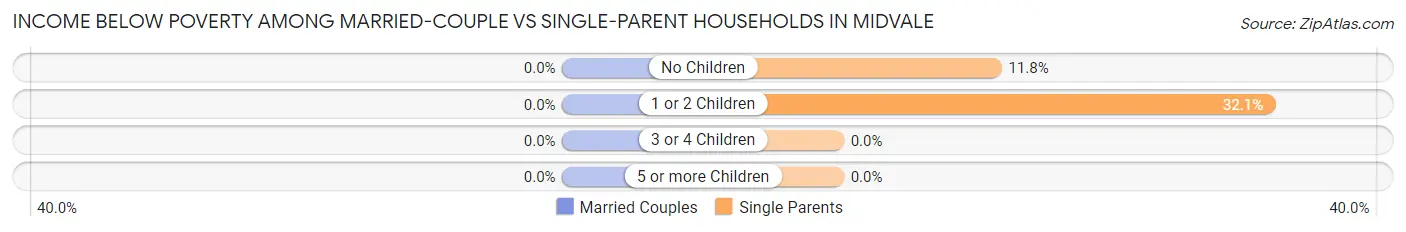
| Children | Married-Couple Families | Single-Parent Households |
| No Children | 0 (0.0%) | 4 (11.8%) |
| 1 or 2 Children | 0 (0.0%) | 9 (32.1%) |
| 3 or 4 Children | 0 (0.0%) | 0 (0.0%) |
| 5 or more Children | 0 (0.0%) | 0 (0.0%) |
| Total | 0 (0.0%) | 13 (19.7%) |
Race in Midvale
The most populous races in Midvale are White / Caucasian (862 | 99.3%), and Two or more Races (6 | 0.7%).
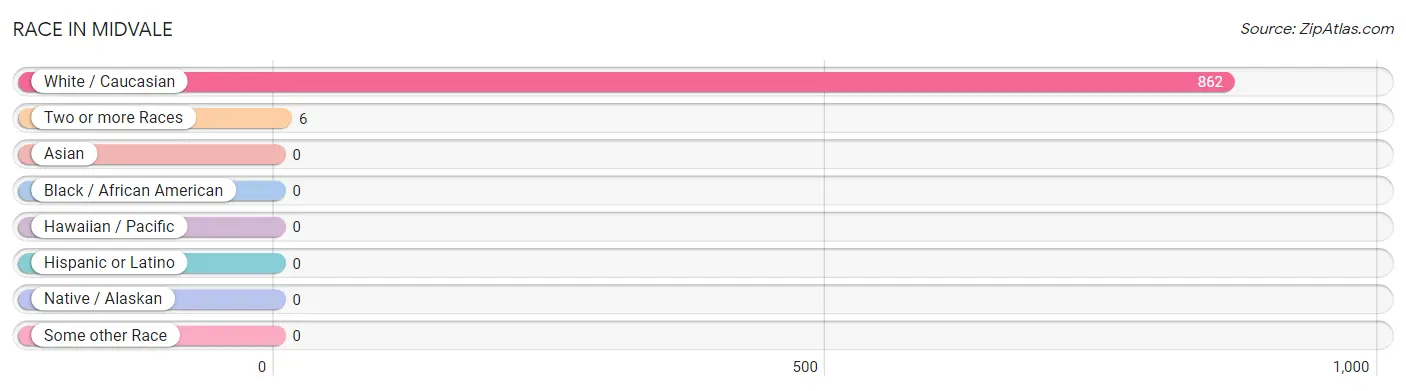
| Race | # Population | % Population |
| Asian | 0 | 0.0% |
| Black / African American | 0 | 0.0% |
| Hawaiian / Pacific | 0 | 0.0% |
| Hispanic or Latino | 0 | 0.0% |
| Native / Alaskan | 0 | 0.0% |
| White / Caucasian | 862 | 99.3% |
| Two or more Races | 6 | 0.7% |
| Some other Race | 0 | 0.0% |
| Total | 868 | 100.0% |
Ancestry in Midvale
The most populous ancestries reported in Midvale are German (162 | 18.7%), Irish (148 | 17.1%), Italian (65 | 7.5%), English (50 | 5.8%), and Dutch (25 | 2.9%), together accounting for 51.8% of all Midvale residents.
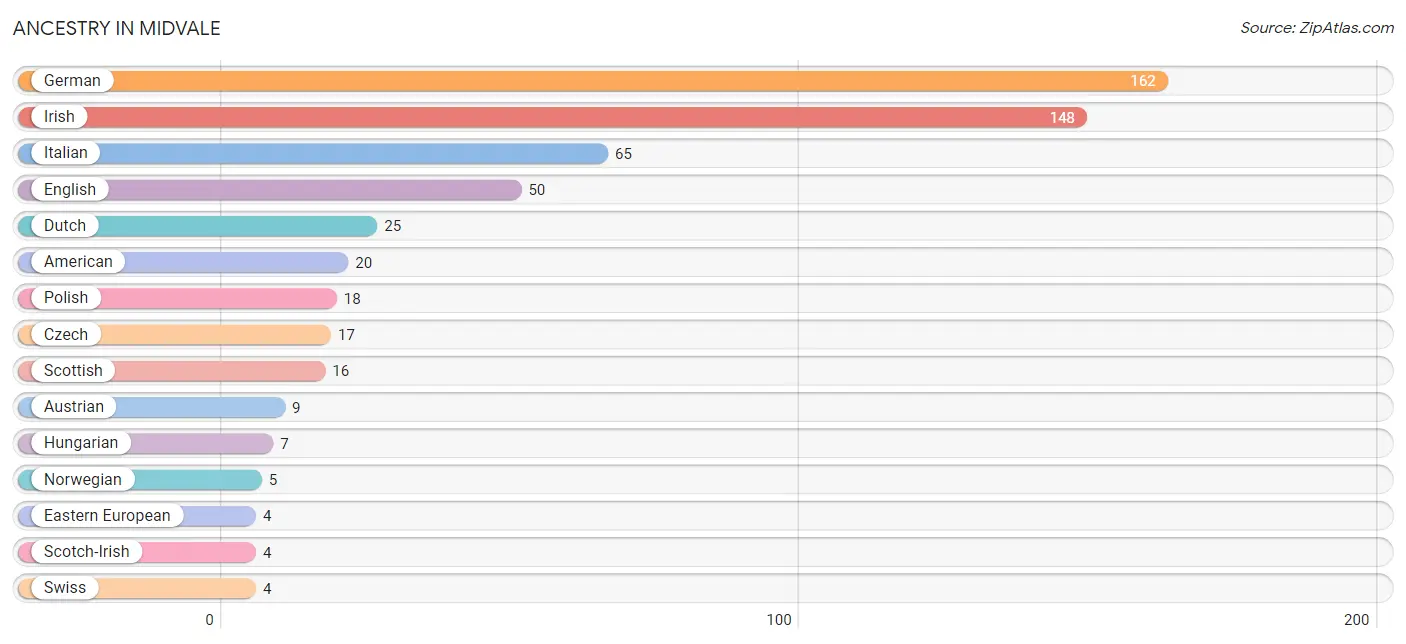
| Ancestry | # Population | % Population |
| American | 20 | 2.3% |
| Austrian | 9 | 1.0% |
| Blackfeet | 1 | 0.1% |
| Cherokee | 1 | 0.1% |
| Czech | 17 | 2.0% |
| Dutch | 25 | 2.9% |
| Eastern European | 4 | 0.5% |
| English | 50 | 5.8% |
| German | 162 | 18.7% |
| Hungarian | 7 | 0.8% |
| Irish | 148 | 17.1% |
| Italian | 65 | 7.5% |
| Native Hawaiian | 3 | 0.4% |
| Norwegian | 5 | 0.6% |
| Polish | 18 | 2.1% |
| Scotch-Irish | 4 | 0.5% |
| Scottish | 16 | 1.8% |
| Slovak | 1 | 0.1% |
| Swiss | 4 | 0.5% |
| Welsh | 4 | 0.5% | View All 20 Rows |
Immigrants in Midvale

| Immigration Origin | # Population | % Population | View All 0 Rows |
Sex and Age in Midvale
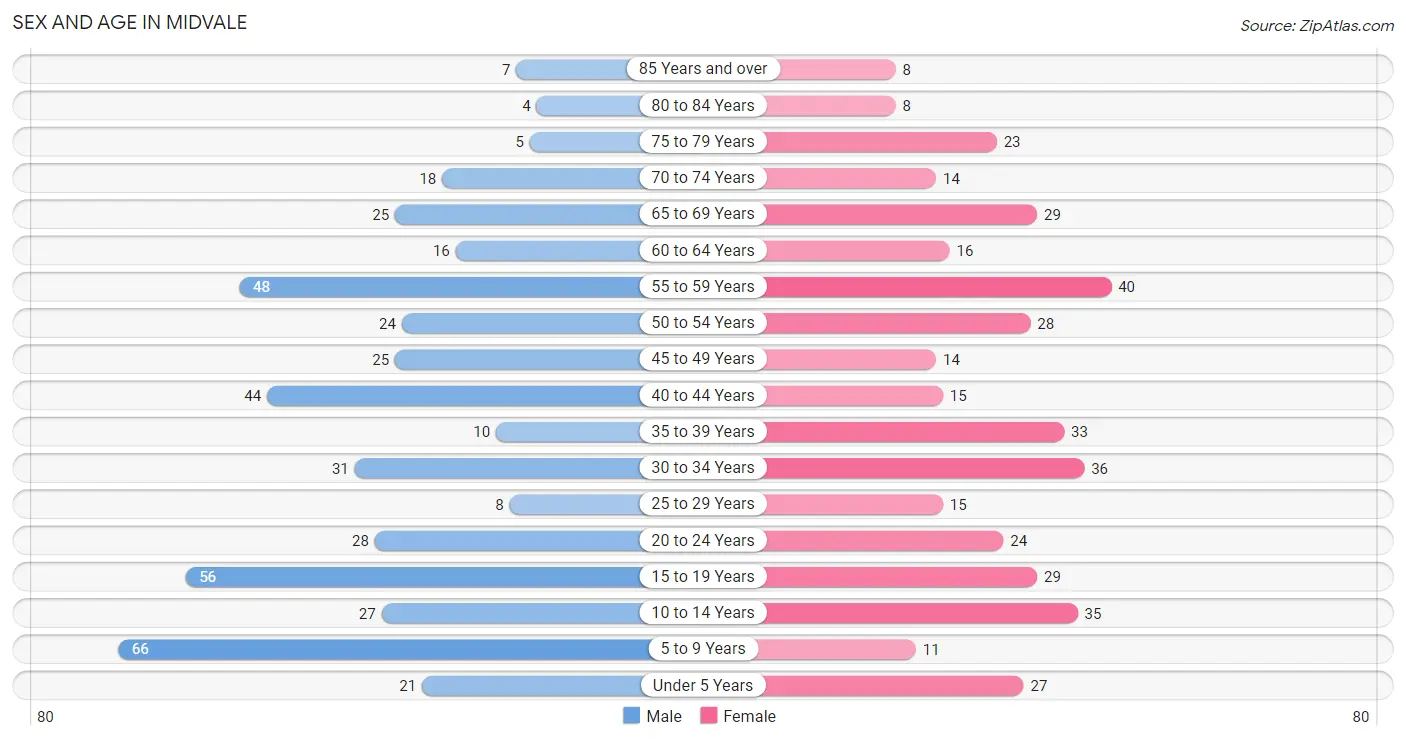
Sex and Age in Midvale
The most populous age groups in Midvale are 5 to 9 Years (66 | 14.2%) for men and 55 to 59 Years (40 | 9.9%) for women.
| Age Bracket | Male | Female |
| Under 5 Years | 21 (4.5%) | 27 (6.7%) |
| 5 to 9 Years | 66 (14.2%) | 11 (2.7%) |
| 10 to 14 Years | 27 (5.8%) | 35 (8.6%) |
| 15 to 19 Years | 56 (12.1%) | 29 (7.2%) |
| 20 to 24 Years | 28 (6.0%) | 24 (5.9%) |
| 25 to 29 Years | 8 (1.7%) | 15 (3.7%) |
| 30 to 34 Years | 31 (6.7%) | 36 (8.9%) |
| 35 to 39 Years | 10 (2.2%) | 33 (8.2%) |
| 40 to 44 Years | 44 (9.5%) | 15 (3.7%) |
| 45 to 49 Years | 25 (5.4%) | 14 (3.5%) |
| 50 to 54 Years | 24 (5.2%) | 28 (6.9%) |
| 55 to 59 Years | 48 (10.4%) | 40 (9.9%) |
| 60 to 64 Years | 16 (3.5%) | 16 (4.0%) |
| 65 to 69 Years | 25 (5.4%) | 29 (7.2%) |
| 70 to 74 Years | 18 (3.9%) | 14 (3.5%) |
| 75 to 79 Years | 5 (1.1%) | 23 (5.7%) |
| 80 to 84 Years | 4 (0.9%) | 8 (2.0%) |
| 85 Years and over | 7 (1.5%) | 8 (2.0%) |
| Total | 463 (100.0%) | 405 (100.0%) |
Families and Households in Midvale
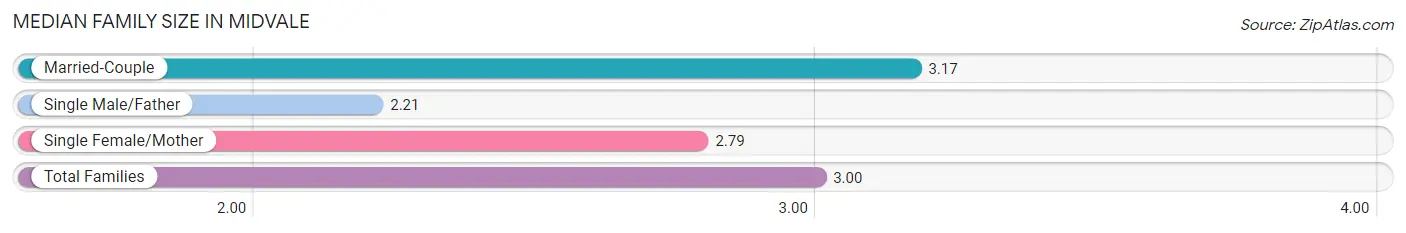
Median Family Size in Midvale
The median family size in Midvale is 3.00 persons per family, with married-couple families (162 | 71.1%) accounting for the largest median family size of 3.17 persons per family. On the other hand, single male/father families (24 | 10.5%) represent the smallest median family size with 2.21 persons per family.
| Family Type | # Families | Family Size |
| Married-Couple | 162 (71.1%) | 3.17 |
| Single Male/Father | 24 (10.5%) | 2.21 |
| Single Female/Mother | 42 (18.4%) | 2.79 |
| Total Families | 228 (100.0%) | 3.00 |
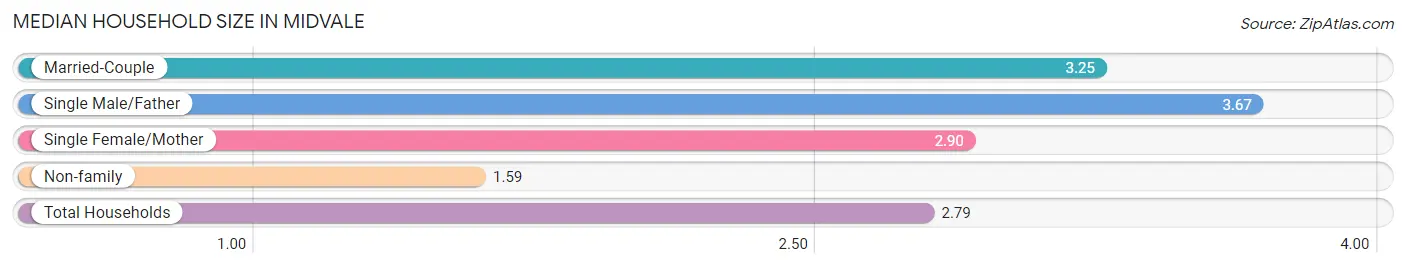
Median Household Size in Midvale
The median household size in Midvale is 2.79 persons per household, with single male/father households (24 | 7.7%) accounting for the largest median household size of 3.67 persons per household. non-family households (83 | 26.7%) represent the smallest median household size with 1.59 persons per household.
| Household Type | # Households | Household Size |
| Married-Couple | 162 (52.1%) | 3.25 |
| Single Male/Father | 24 (7.7%) | 3.67 |
| Single Female/Mother | 42 (13.5%) | 2.90 |
| Non-family | 83 (26.7%) | 1.59 |
| Total Households | 311 (100.0%) | 2.79 |
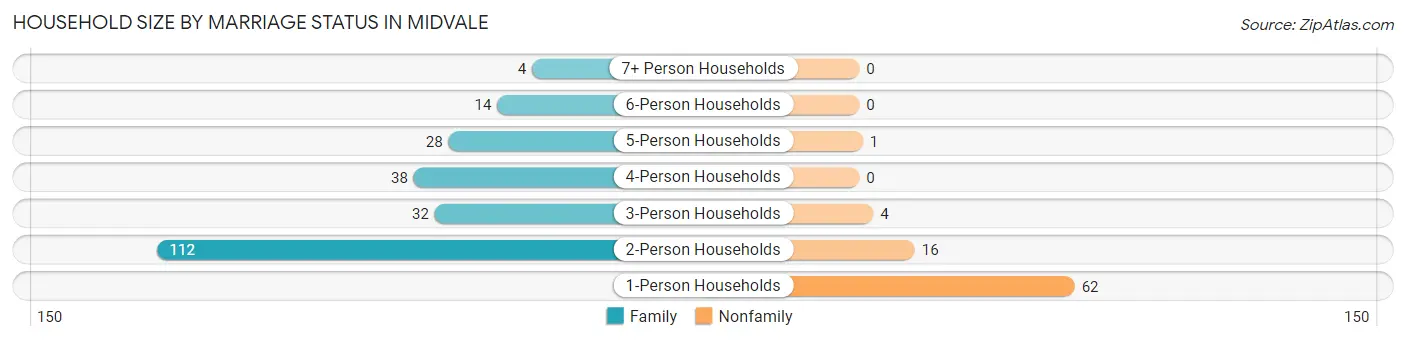
Household Size by Marriage Status in Midvale
Out of a total of 311 households in Midvale, 228 (73.3%) are family households, while 83 (26.7%) are nonfamily households. The most numerous type of family households are 2-person households, comprising 112, and the most common type of nonfamily households are 1-person households, comprising 62.
| Household Size | Family Households | Nonfamily Households |
| 1-Person Households | - | 62 (19.9%) |
| 2-Person Households | 112 (36.0%) | 16 (5.1%) |
| 3-Person Households | 32 (10.3%) | 4 (1.3%) |
| 4-Person Households | 38 (12.2%) | 0 (0.0%) |
| 5-Person Households | 28 (9.0%) | 1 (0.3%) |
| 6-Person Households | 14 (4.5%) | 0 (0.0%) |
| 7+ Person Households | 4 (1.3%) | 0 (0.0%) |
| Total | 228 (73.3%) | 83 (26.7%) |
Female Fertility in Midvale
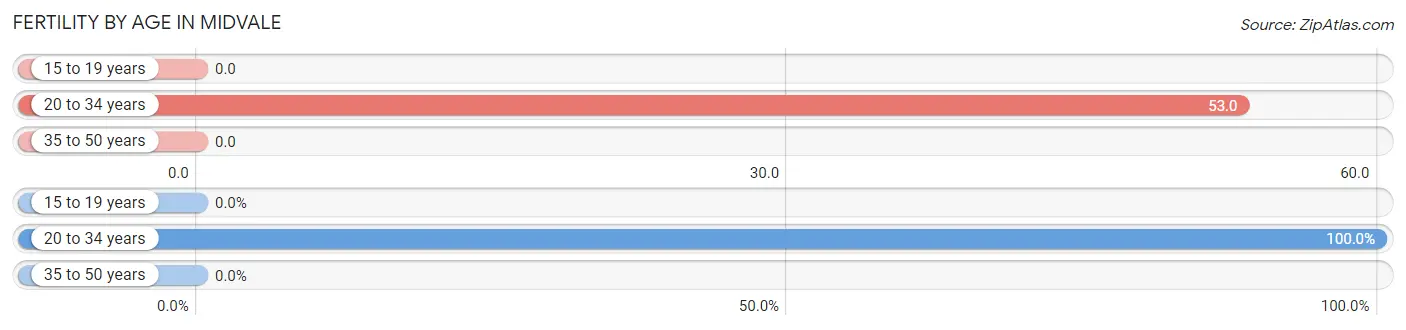
Fertility by Age in Midvale
Average fertility rate in Midvale is 22.0 births per 1,000 women. Women in the age bracket of 20 to 34 years have the highest fertility rate with 53.0 births per 1,000 women. Women in the age bracket of 20 to 34 years acount for 100.0% of all women with births.
| Age Bracket | Women with Births | Births / 1,000 Women |
| 15 to 19 years | 0 (0.0%) | 0.0 |
| 20 to 34 years | 4 (100.0%) | 53.0 |
| 35 to 50 years | 0 (0.0%) | 0.0 |
| Total | 4 (100.0%) | 22.0 |
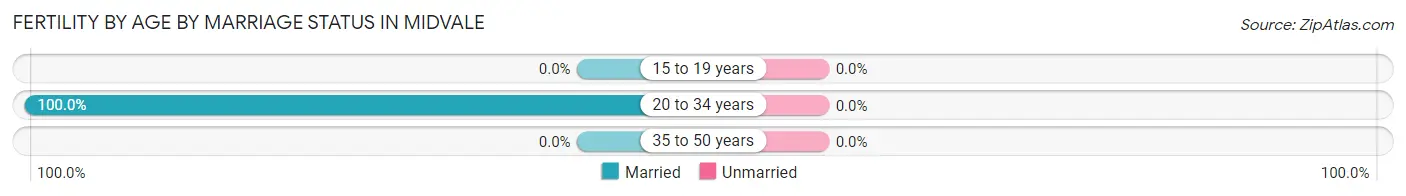
Fertility by Age by Marriage Status in Midvale
| Age Bracket | Married | Unmarried |
| 15 to 19 years | 0 (0.0%) | 0 (0.0%) |
| 20 to 34 years | 4 (100.0%) | 0 (0.0%) |
| 35 to 50 years | 0 (0.0%) | 0 (0.0%) |
| Total | 4 (100.0%) | 0 (0.0%) |
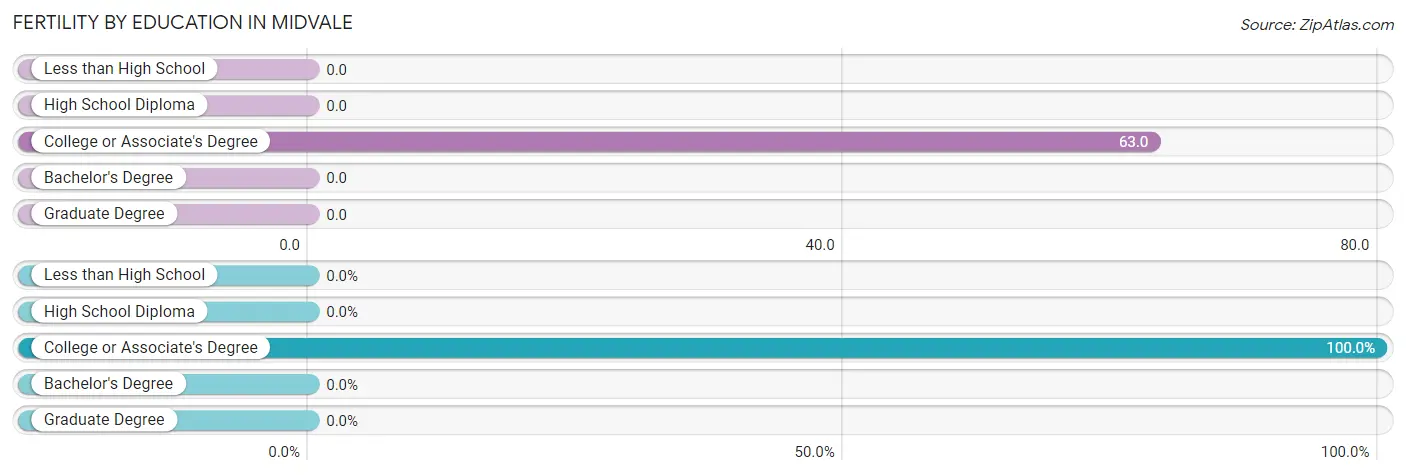
Fertility by Education in Midvale
| Educational Attainment | Women with Births | Births / 1,000 Women |
| Less than High School | 0 (0.0%) | 0.0 |
| High School Diploma | 0 (0.0%) | 0.0 |
| College or Associate's Degree | 4 (100.0%) | 63.0 |
| Bachelor's Degree | 0 (0.0%) | 0.0 |
| Graduate Degree | 0 (0.0%) | 0.0 |
| Total | 4 (100.0%) | 22.0 |
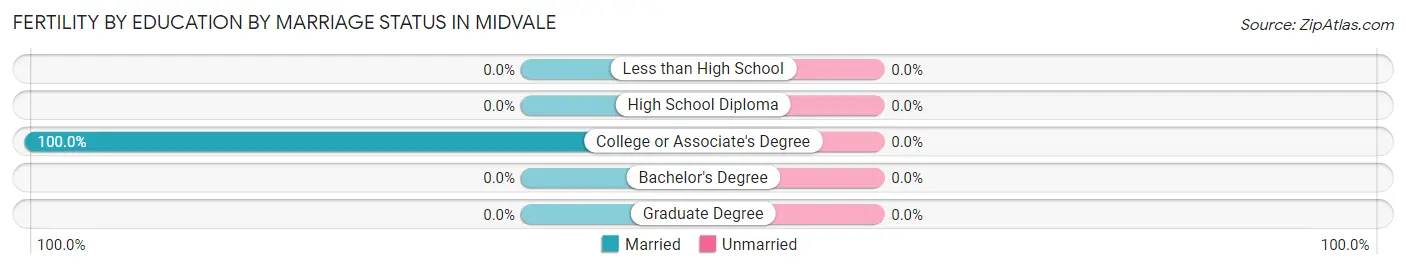
Fertility by Education by Marriage Status in Midvale
| Educational Attainment | Married | Unmarried |
| Less than High School | 0 (0.0%) | 0 (0.0%) |
| High School Diploma | 0 (0.0%) | 0 (0.0%) |
| College or Associate's Degree | 4 (100.0%) | 0 (0.0%) |
| Bachelor's Degree | 0 (0.0%) | 0 (0.0%) |
| Graduate Degree | 0 (0.0%) | 0 (0.0%) |
| Total | 4 (100.0%) | 0 (0.0%) |
Employment Characteristics in Midvale
Employment by Class of Employer in Midvale
Among the 361 employed individuals in Midvale, private company employees (309 | 85.6%), not-for-profit organizations (15 | 4.2%), and self-employed (not incorporated) (14 | 3.9%) make up the most common classes of employment.
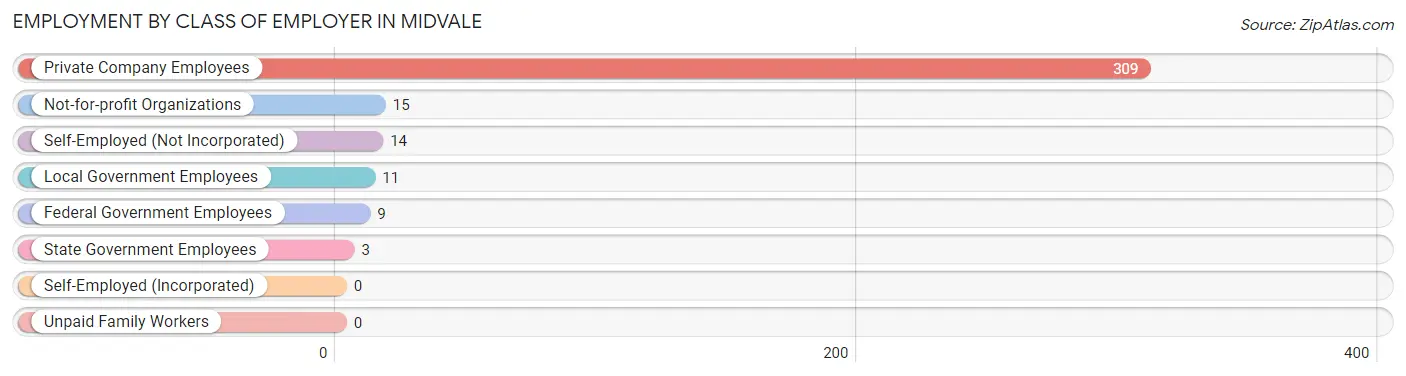
| Employer Class | # Employees | % Employees |
| Private Company Employees | 309 | 85.6% |
| Self-Employed (Incorporated) | 0 | 0.0% |
| Self-Employed (Not Incorporated) | 14 | 3.9% |
| Not-for-profit Organizations | 15 | 4.2% |
| Local Government Employees | 11 | 3.0% |
| State Government Employees | 3 | 0.8% |
| Federal Government Employees | 9 | 2.5% |
| Unpaid Family Workers | 0 | 0.0% |
| Total | 361 | 100.0% |
Employment Status by Age in Midvale
According to the labor force statistics for Midvale, out of the total population over 16 years of age (665), 61.8% or 411 individuals are in the labor force, with 3.9% or 16 of them unemployed. The age group with the highest labor force participation rate is 25 to 29 years, with 100.0% or 23 individuals in the labor force. Within the labor force, the 65 to 74 years age range has the highest percentage of unemployed individuals, with 28.6% or 4 of them being unemployed.
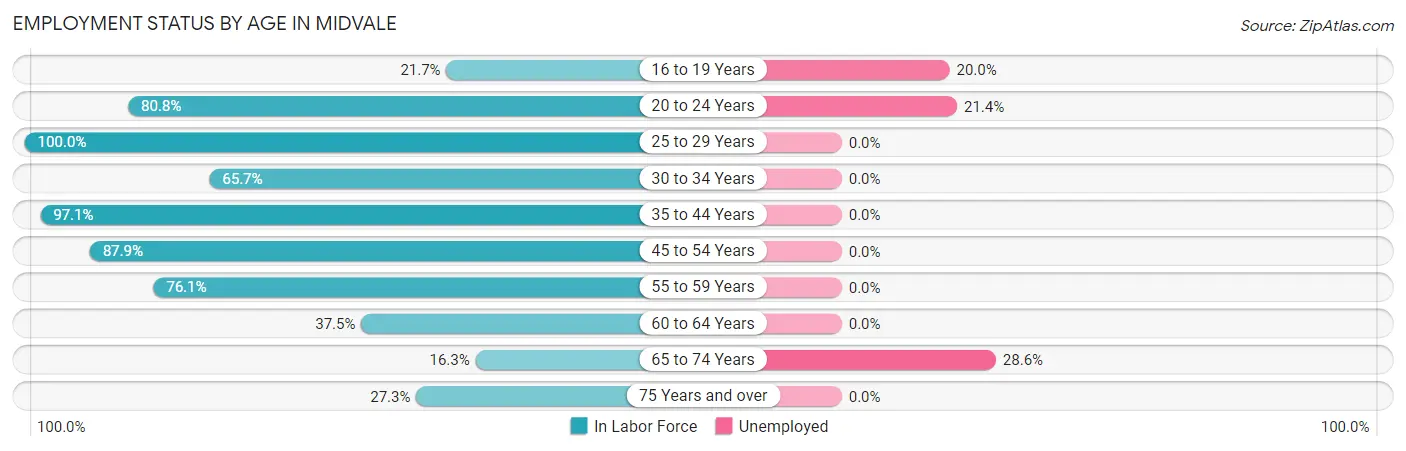
| Age Bracket | In Labor Force | Unemployed |
| 16 to 19 Years | 15 (21.7%) | 3 (20.0%) |
| 20 to 24 Years | 42 (80.8%) | 9 (21.4%) |
| 25 to 29 Years | 23 (100.0%) | 0 (0.0%) |
| 30 to 34 Years | 44 (65.7%) | 0 (0.0%) |
| 35 to 44 Years | 99 (97.1%) | 0 (0.0%) |
| 45 to 54 Years | 80 (87.9%) | 0 (0.0%) |
| 55 to 59 Years | 67 (76.1%) | 0 (0.0%) |
| 60 to 64 Years | 12 (37.5%) | 0 (0.0%) |
| 65 to 74 Years | 14 (16.3%) | 4 (28.6%) |
| 75 Years and over | 15 (27.3%) | 0 (0.0%) |
| Total | 411 (61.8%) | 16 (3.9%) |
Employment Status by Educational Attainment in Midvale
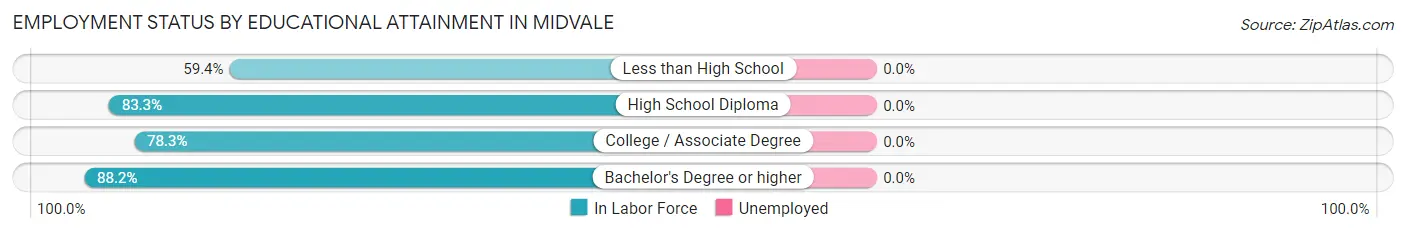
| Educational Attainment | In Labor Force | Unemployed |
| Less than High School | 19 (59.4%) | 0 (0.0%) |
| High School Diploma | 204 (83.3%) | 0 (0.0%) |
| College / Associate Degree | 72 (78.3%) | 0 (0.0%) |
| Bachelor's Degree or higher | 30 (88.2%) | 0 (0.0%) |
| Total | 325 (80.6%) | 0 (0.0%) |
Employment Occupations by Sex in Midvale
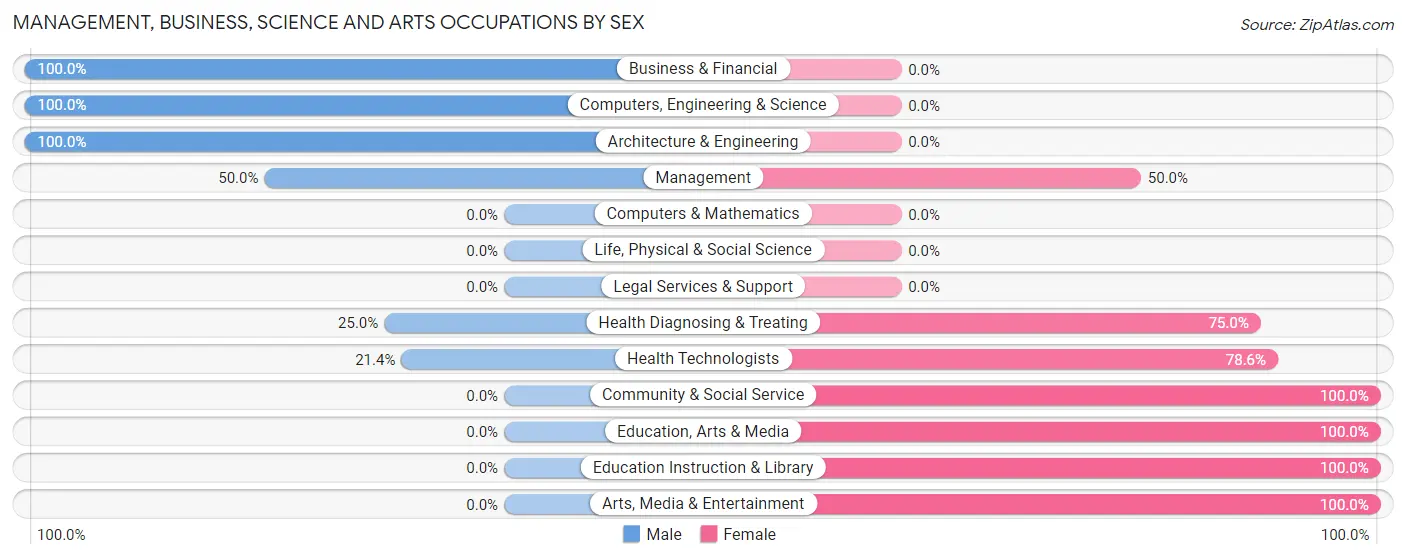
Management, Business, Science and Arts Occupations
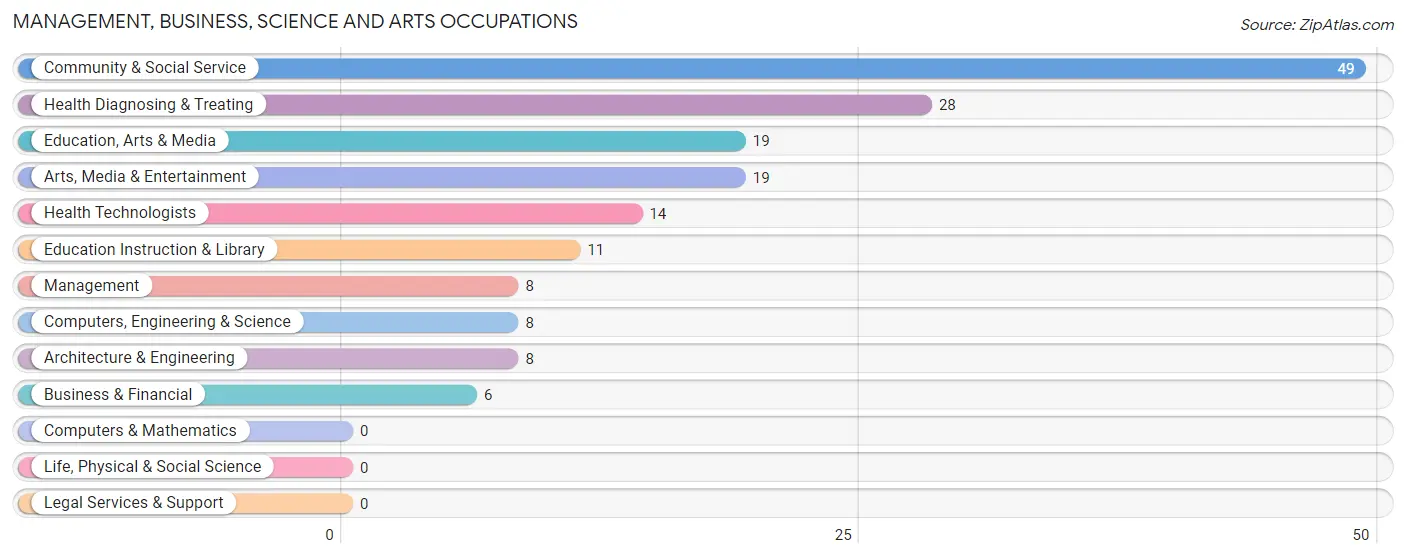
The most common Management, Business, Science and Arts occupations in Midvale are Community & Social Service (49 | 12.4%), Health Diagnosing & Treating (28 | 7.1%), Education, Arts & Media (19 | 4.8%), Arts, Media & Entertainment (19 | 4.8%), and Health Technologists (14 | 3.5%).
Management, Business, Science and Arts Occupations by Sex
Within the Management, Business, Science and Arts occupations in Midvale, the most male-oriented occupations are Business & Financial (100.0%), Computers, Engineering & Science (100.0%), and Architecture & Engineering (100.0%), while the most female-oriented occupations are Community & Social Service (100.0%), Education, Arts & Media (100.0%), and Education Instruction & Library (100.0%).
| Occupation | Male | Female |
| Management | 4 (50.0%) | 4 (50.0%) |
| Business & Financial | 6 (100.0%) | 0 (0.0%) |
| Computers, Engineering & Science | 8 (100.0%) | 0 (0.0%) |
| Computers & Mathematics | 0 (0.0%) | 0 (0.0%) |
| Architecture & Engineering | 8 (100.0%) | 0 (0.0%) |
| Life, Physical & Social Science | 0 (0.0%) | 0 (0.0%) |
| Community & Social Service | 0 (0.0%) | 49 (100.0%) |
| Education, Arts & Media | 0 (0.0%) | 19 (100.0%) |
| Legal Services & Support | 0 (0.0%) | 0 (0.0%) |
| Education Instruction & Library | 0 (0.0%) | 11 (100.0%) |
| Arts, Media & Entertainment | 0 (0.0%) | 19 (100.0%) |
| Health Diagnosing & Treating | 7 (25.0%) | 21 (75.0%) |
| Health Technologists | 3 (21.4%) | 11 (78.6%) |
| Total (Category) | 25 (25.3%) | 74 (74.8%) |
| Total (Overall) | 200 (50.6%) | 195 (49.4%) |
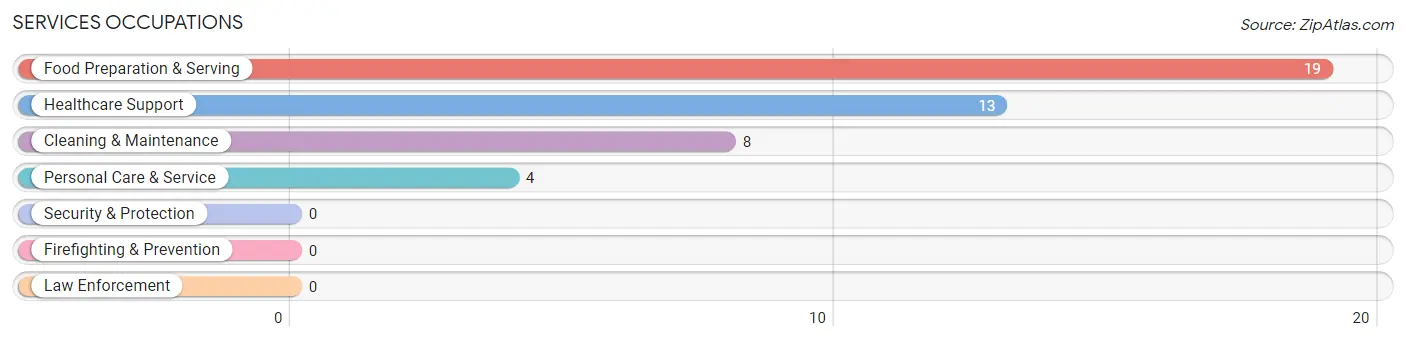
Services Occupations
The most common Services occupations in Midvale are Food Preparation & Serving (19 | 4.8%), Healthcare Support (13 | 3.3%), Cleaning & Maintenance (8 | 2.0%), and Personal Care & Service (4 | 1.0%).
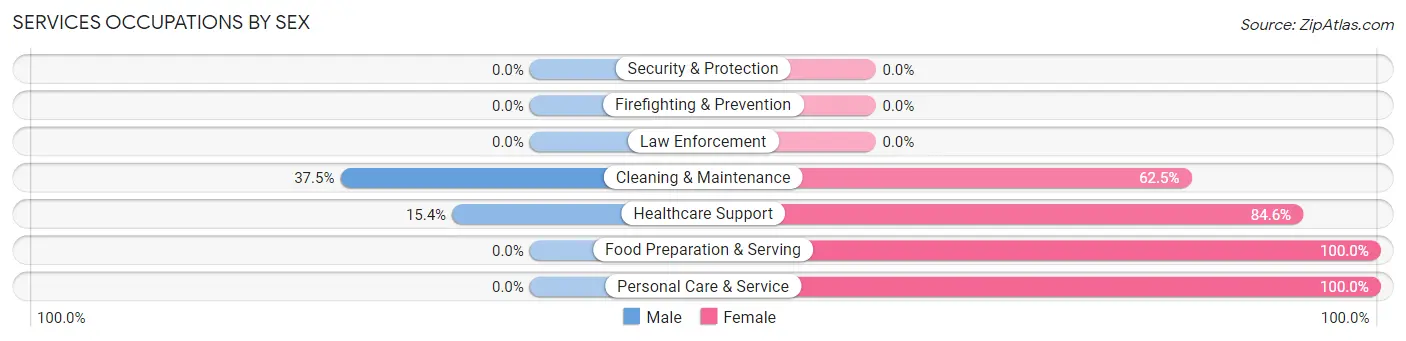
Services Occupations by Sex
Within the Services occupations in Midvale, the most male-oriented occupations are Cleaning & Maintenance (37.5%), and Healthcare Support (15.4%), while the most female-oriented occupations are Food Preparation & Serving (100.0%), Personal Care & Service (100.0%), and Healthcare Support (84.6%).
| Occupation | Male | Female |
| Healthcare Support | 2 (15.4%) | 11 (84.6%) |
| Security & Protection | 0 (0.0%) | 0 (0.0%) |
| Firefighting & Prevention | 0 (0.0%) | 0 (0.0%) |
| Law Enforcement | 0 (0.0%) | 0 (0.0%) |
| Food Preparation & Serving | 0 (0.0%) | 19 (100.0%) |
| Cleaning & Maintenance | 3 (37.5%) | 5 (62.5%) |
| Personal Care & Service | 0 (0.0%) | 4 (100.0%) |
| Total (Category) | 5 (11.4%) | 39 (88.6%) |
| Total (Overall) | 200 (50.6%) | 195 (49.4%) |
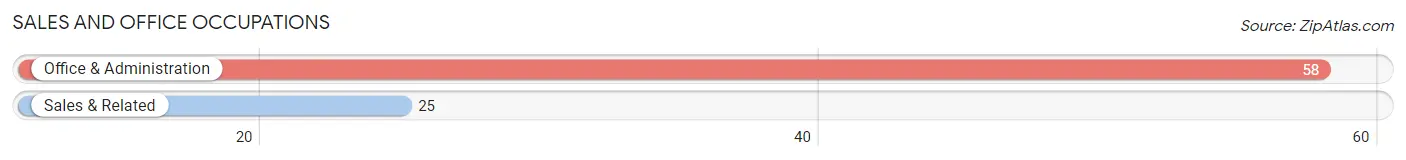
Sales and Office Occupations
The most common Sales and Office occupations in Midvale are Office & Administration (58 | 14.7%), and Sales & Related (25 | 6.3%).
Sales and Office Occupations by Sex
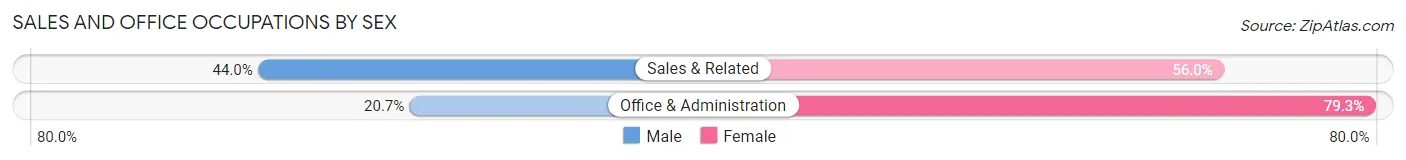
| Occupation | Male | Female |
| Sales & Related | 11 (44.0%) | 14 (56.0%) |
| Office & Administration | 12 (20.7%) | 46 (79.3%) |
| Total (Category) | 23 (27.7%) | 60 (72.3%) |
| Total (Overall) | 200 (50.6%) | 195 (49.4%) |
Natural Resources, Construction and Maintenance Occupations
The most common Natural Resources, Construction and Maintenance occupations in Midvale are Construction & Extraction (24 | 6.1%), and Installation, Maintenance & Repair (18 | 4.6%).
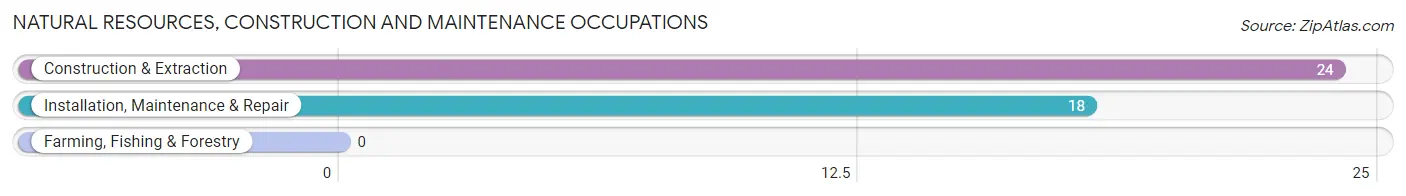
Natural Resources, Construction and Maintenance Occupations by Sex

| Occupation | Male | Female |
| Farming, Fishing & Forestry | 0 (0.0%) | 0 (0.0%) |
| Construction & Extraction | 24 (100.0%) | 0 (0.0%) |
| Installation, Maintenance & Repair | 18 (100.0%) | 0 (0.0%) |
| Total (Category) | 42 (100.0%) | 0 (0.0%) |
| Total (Overall) | 200 (50.6%) | 195 (49.4%) |
Production, Transportation and Moving Occupations
The most common Production, Transportation and Moving occupations in Midvale are Production (82 | 20.8%), Transportation (31 | 7.9%), and Material Moving (14 | 3.5%).
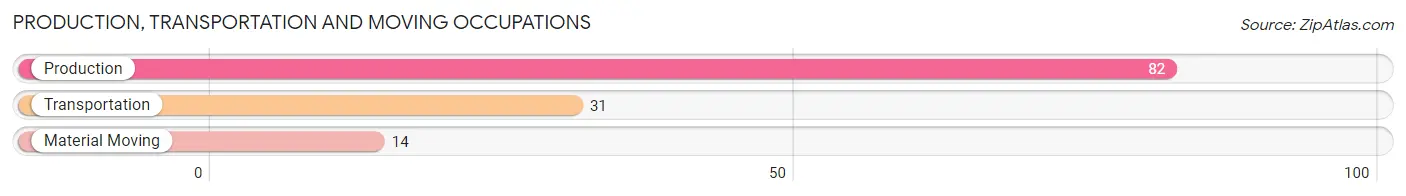
Production, Transportation and Moving Occupations by Sex
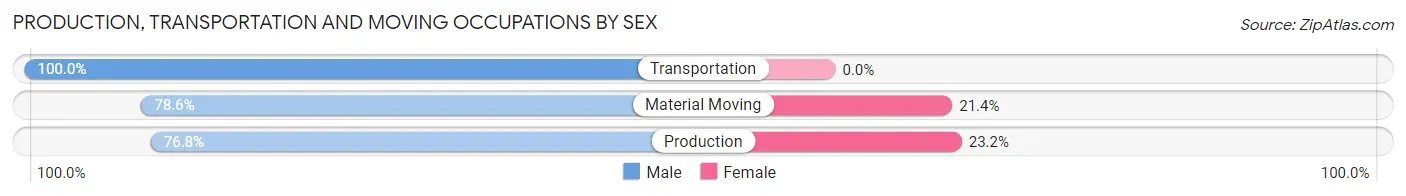
| Occupation | Male | Female |
| Production | 63 (76.8%) | 19 (23.2%) |
| Transportation | 31 (100.0%) | 0 (0.0%) |
| Material Moving | 11 (78.6%) | 3 (21.4%) |
| Total (Category) | 105 (82.7%) | 22 (17.3%) |
| Total (Overall) | 200 (50.6%) | 195 (49.4%) |
Employment Industries by Sex in Midvale
Employment Industries in Midvale
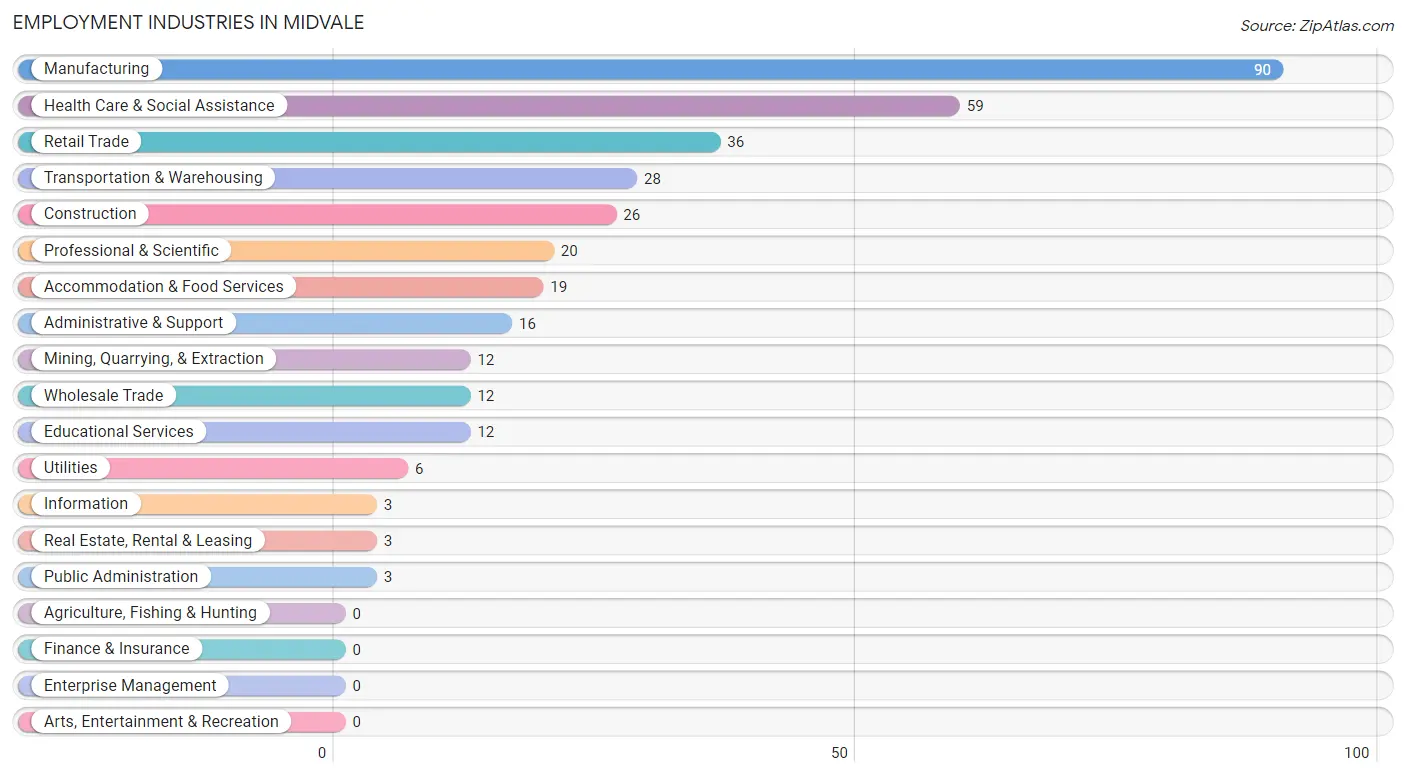
The major employment industries in Midvale include Manufacturing (90 | 22.8%), Health Care & Social Assistance (59 | 14.9%), Retail Trade (36 | 9.1%), Transportation & Warehousing (28 | 7.1%), and Construction (26 | 6.6%).
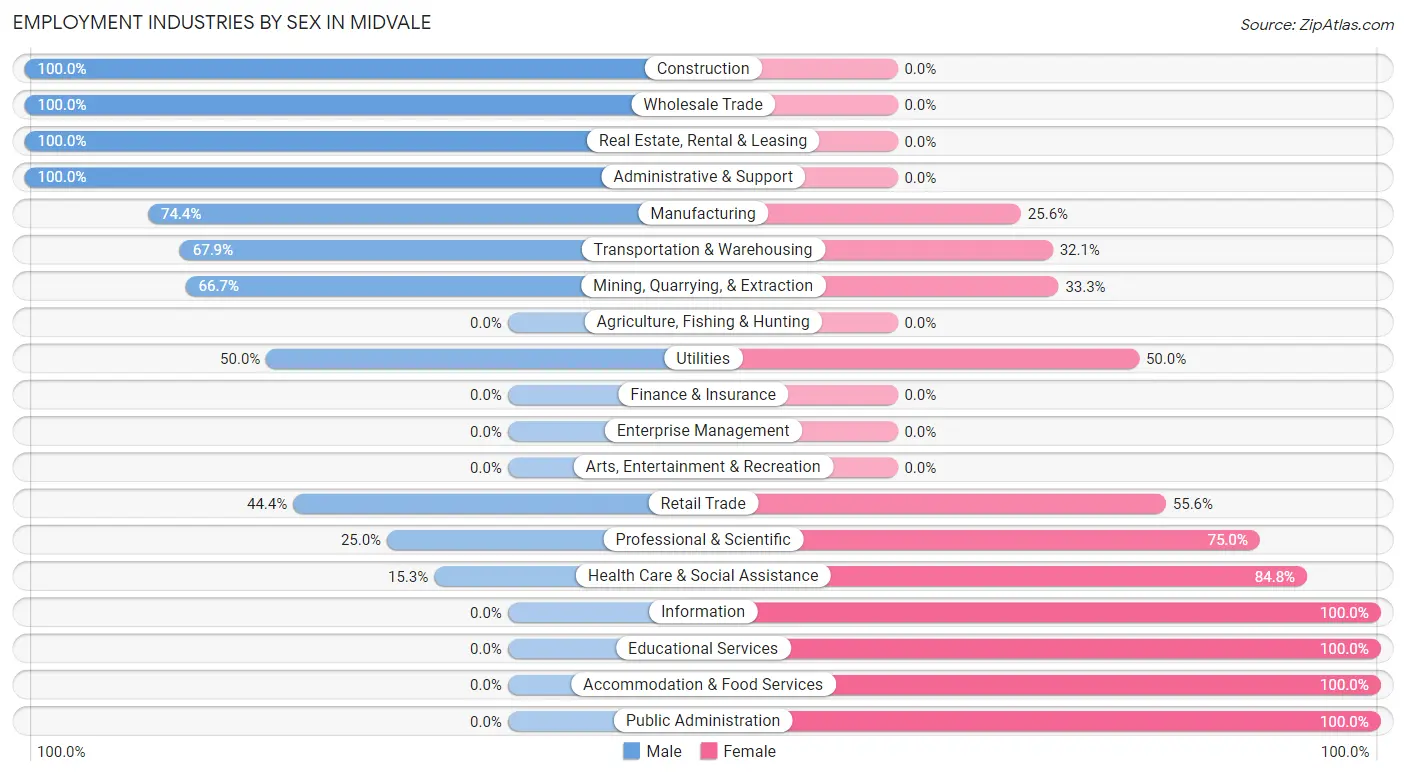
Employment Industries by Sex in Midvale
The Midvale industries that see more men than women are Construction (100.0%), Wholesale Trade (100.0%), and Real Estate, Rental & Leasing (100.0%), whereas the industries that tend to have a higher number of women are Information (100.0%), Educational Services (100.0%), and Accommodation & Food Services (100.0%).
| Industry | Male | Female |
| Agriculture, Fishing & Hunting | 0 (0.0%) | 0 (0.0%) |
| Mining, Quarrying, & Extraction | 8 (66.7%) | 4 (33.3%) |
| Construction | 26 (100.0%) | 0 (0.0%) |
| Manufacturing | 67 (74.4%) | 23 (25.6%) |
| Wholesale Trade | 12 (100.0%) | 0 (0.0%) |
| Retail Trade | 16 (44.4%) | 20 (55.6%) |
| Transportation & Warehousing | 19 (67.9%) | 9 (32.1%) |
| Utilities | 3 (50.0%) | 3 (50.0%) |
| Information | 0 (0.0%) | 3 (100.0%) |
| Finance & Insurance | 0 (0.0%) | 0 (0.0%) |
| Real Estate, Rental & Leasing | 3 (100.0%) | 0 (0.0%) |
| Professional & Scientific | 5 (25.0%) | 15 (75.0%) |
| Enterprise Management | 0 (0.0%) | 0 (0.0%) |
| Administrative & Support | 16 (100.0%) | 0 (0.0%) |
| Educational Services | 0 (0.0%) | 12 (100.0%) |
| Health Care & Social Assistance | 9 (15.2%) | 50 (84.8%) |
| Arts, Entertainment & Recreation | 0 (0.0%) | 0 (0.0%) |
| Accommodation & Food Services | 0 (0.0%) | 19 (100.0%) |
| Public Administration | 0 (0.0%) | 3 (100.0%) |
| Total | 200 (50.6%) | 195 (49.4%) |
Education in Midvale
School Enrollment in Midvale
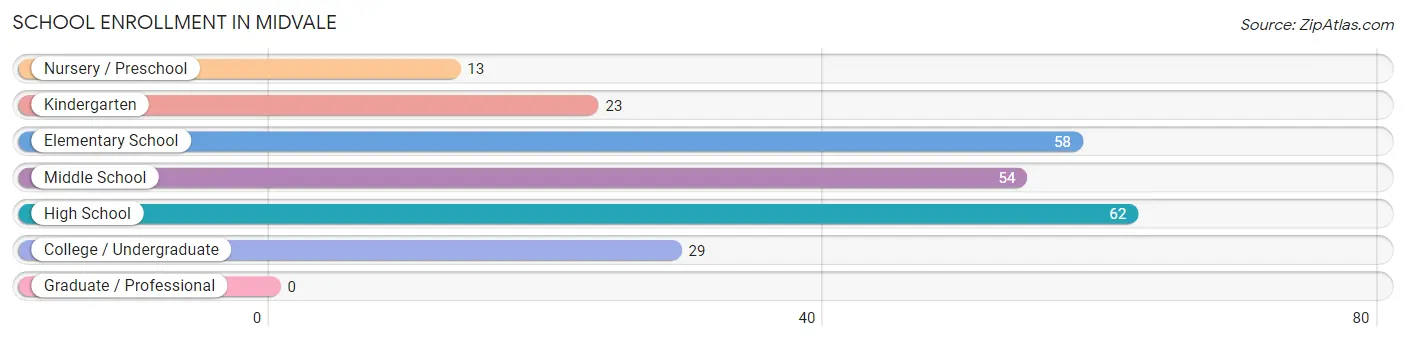
The most common levels of schooling among the 239 students in Midvale are high school (62 | 25.9%), elementary school (58 | 24.3%), and middle school (54 | 22.6%).
| School Level | # Students | % Students |
| Nursery / Preschool | 13 | 5.4% |
| Kindergarten | 23 | 9.6% |
| Elementary School | 58 | 24.3% |
| Middle School | 54 | 22.6% |
| High School | 62 | 25.9% |
| College / Undergraduate | 29 | 12.1% |
| Graduate / Professional | 0 | 0.0% |
| Total | 239 | 100.0% |
School Enrollment by Age by Funding Source in Midvale
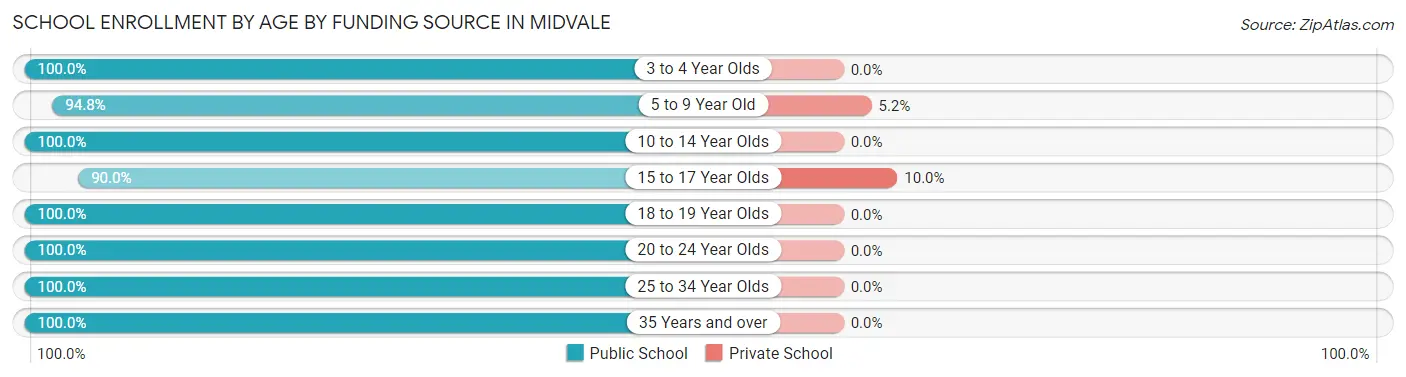
Out of a total of 239 students who are enrolled in schools in Midvale, 10 (4.2%) attend a private institution, while the remaining 229 (95.8%) are enrolled in public schools. The age group of 15 to 17 year olds has the highest likelihood of being enrolled in private schools, with 6 (10.0% in the age bracket) enrolled. Conversely, the age group of 3 to 4 year olds has the lowest likelihood of being enrolled in a private school, with 9 (100.0% in the age bracket) attending a public institution.
| Age Bracket | Public School | Private School |
| 3 to 4 Year Olds | 9 (100.0%) | 0 (0.0%) |
| 5 to 9 Year Old | 73 (94.8%) | 4 (5.2%) |
| 10 to 14 Year Olds | 62 (100.0%) | 0 (0.0%) |
| 15 to 17 Year Olds | 54 (90.0%) | 6 (10.0%) |
| 18 to 19 Year Olds | 2 (100.0%) | 0 (0.0%) |
| 20 to 24 Year Olds | 17 (100.0%) | 0 (0.0%) |
| 25 to 34 Year Olds | 5 (100.0%) | 0 (0.0%) |
| 35 Years and over | 7 (100.0%) | 0 (0.0%) |
| Total | 229 (95.8%) | 10 (4.2%) |
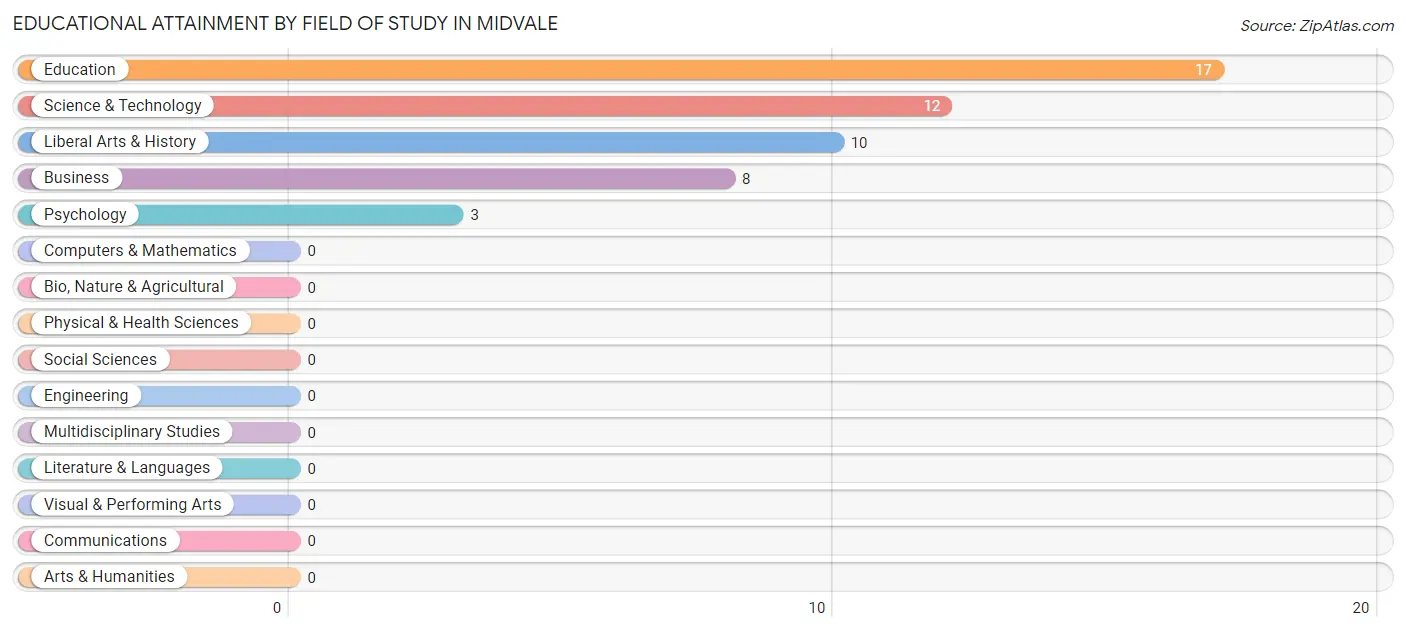
Educational Attainment by Field of Study in Midvale
Education (17 | 34.0%), science & technology (12 | 24.0%), liberal arts & history (10 | 20.0%), business (8 | 16.0%), and psychology (3 | 6.0%) are the most common fields of study among 50 individuals in Midvale who have obtained a bachelor's degree or higher.
| Field of Study | # Graduates | % Graduates |
| Computers & Mathematics | 0 | 0.0% |
| Bio, Nature & Agricultural | 0 | 0.0% |
| Physical & Health Sciences | 0 | 0.0% |
| Psychology | 3 | 6.0% |
| Social Sciences | 0 | 0.0% |
| Engineering | 0 | 0.0% |
| Multidisciplinary Studies | 0 | 0.0% |
| Science & Technology | 12 | 24.0% |
| Business | 8 | 16.0% |
| Education | 17 | 34.0% |
| Literature & Languages | 0 | 0.0% |
| Liberal Arts & History | 10 | 20.0% |
| Visual & Performing Arts | 0 | 0.0% |
| Communications | 0 | 0.0% |
| Arts & Humanities | 0 | 0.0% |
| Total | 50 | 100.0% |
Transportation & Commute in Midvale
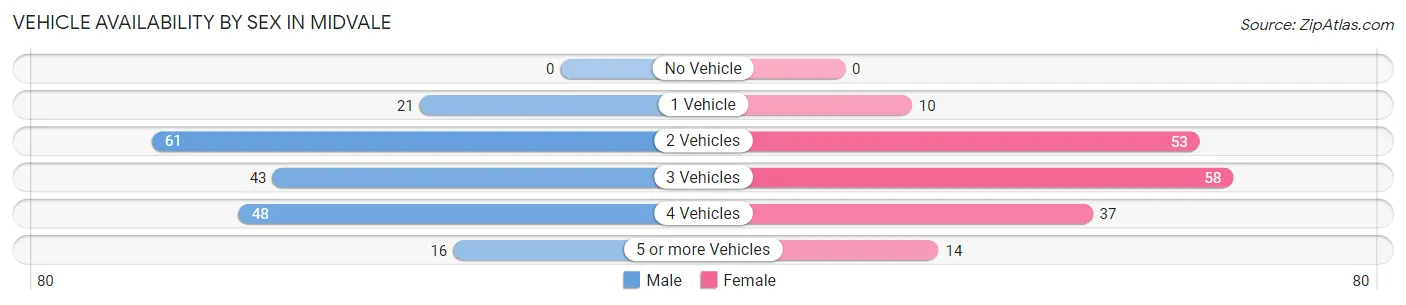
Vehicle Availability by Sex in Midvale
The most prevalent vehicle ownership categories in Midvale are males with 2 vehicles (61, accounting for 32.3%) and females with 2 vehicles (53, making up 35.5%).
| Vehicles Available | Male | Female |
| No Vehicle | 0 (0.0%) | 0 (0.0%) |
| 1 Vehicle | 21 (11.1%) | 10 (5.8%) |
| 2 Vehicles | 61 (32.3%) | 53 (30.8%) |
| 3 Vehicles | 43 (22.8%) | 58 (33.7%) |
| 4 Vehicles | 48 (25.4%) | 37 (21.5%) |
| 5 or more Vehicles | 16 (8.5%) | 14 (8.1%) |
| Total | 189 (100.0%) | 172 (100.0%) |
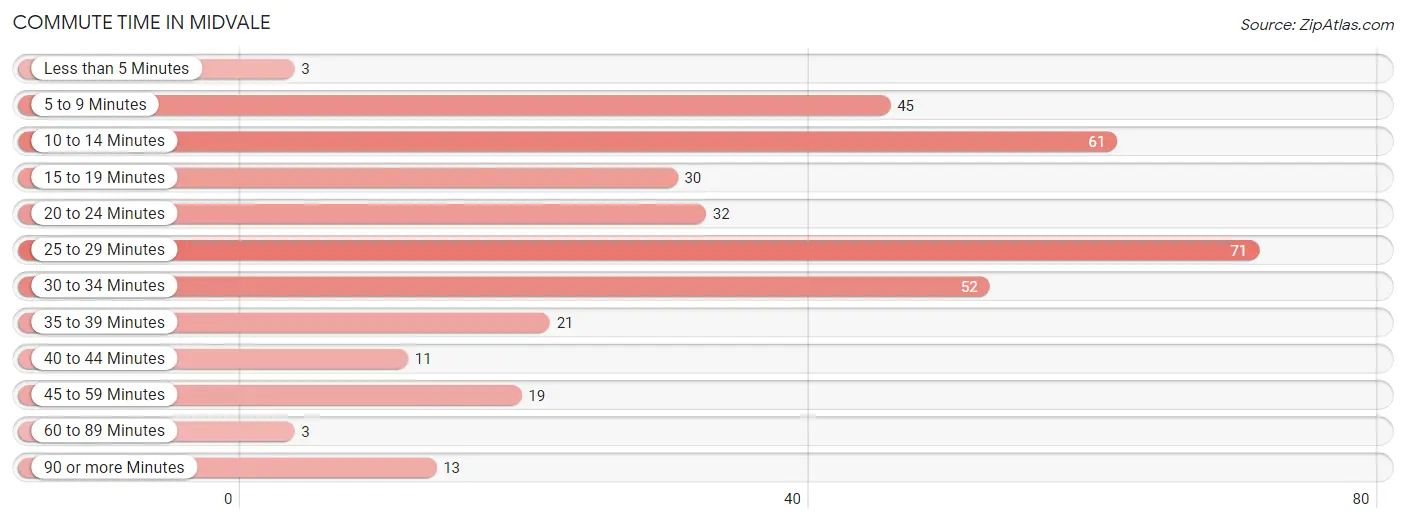
Commute Time in Midvale
The most frequently occuring commute durations in Midvale are 25 to 29 minutes (71 commuters, 19.7%), 10 to 14 minutes (61 commuters, 16.9%), and 30 to 34 minutes (52 commuters, 14.4%).
| Commute Time | # Commuters | % Commuters |
| Less than 5 Minutes | 3 | 0.8% |
| 5 to 9 Minutes | 45 | 12.5% |
| 10 to 14 Minutes | 61 | 16.9% |
| 15 to 19 Minutes | 30 | 8.3% |
| 20 to 24 Minutes | 32 | 8.9% |
| 25 to 29 Minutes | 71 | 19.7% |
| 30 to 34 Minutes | 52 | 14.4% |
| 35 to 39 Minutes | 21 | 5.8% |
| 40 to 44 Minutes | 11 | 3.0% |
| 45 to 59 Minutes | 19 | 5.3% |
| 60 to 89 Minutes | 3 | 0.8% |
| 90 or more Minutes | 13 | 3.6% |
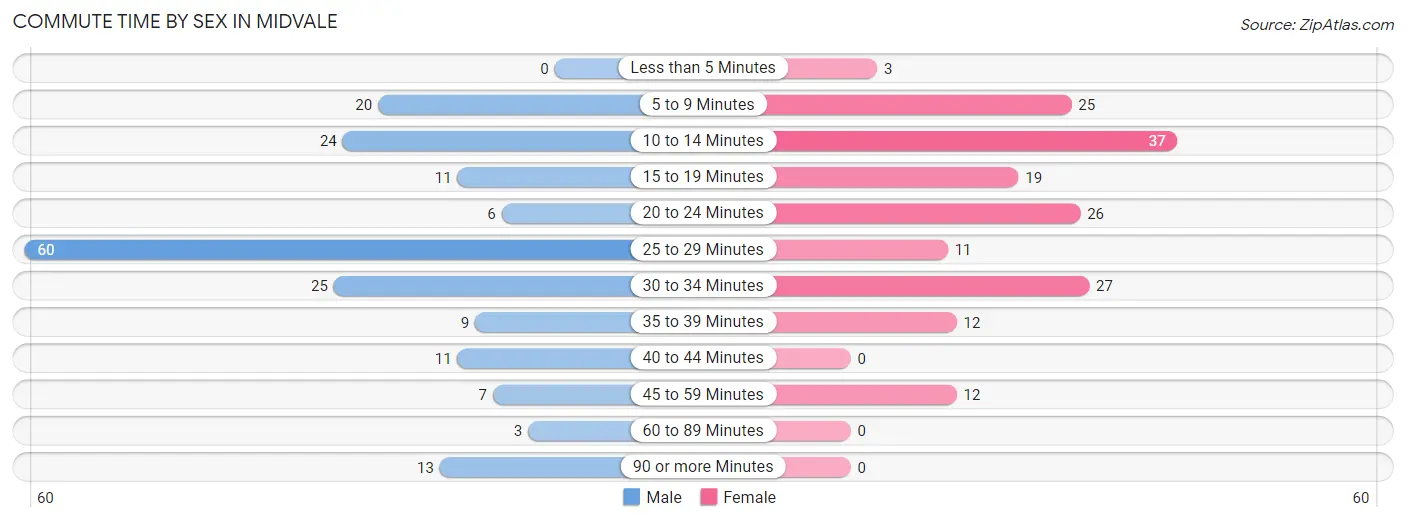
Commute Time by Sex in Midvale
The most common commute times in Midvale are 25 to 29 minutes (60 commuters, 31.8%) for males and 10 to 14 minutes (37 commuters, 21.5%) for females.
| Commute Time | Male | Female |
| Less than 5 Minutes | 0 (0.0%) | 3 (1.7%) |
| 5 to 9 Minutes | 20 (10.6%) | 25 (14.5%) |
| 10 to 14 Minutes | 24 (12.7%) | 37 (21.5%) |
| 15 to 19 Minutes | 11 (5.8%) | 19 (11.1%) |
| 20 to 24 Minutes | 6 (3.2%) | 26 (15.1%) |
| 25 to 29 Minutes | 60 (31.8%) | 11 (6.4%) |
| 30 to 34 Minutes | 25 (13.2%) | 27 (15.7%) |
| 35 to 39 Minutes | 9 (4.8%) | 12 (7.0%) |
| 40 to 44 Minutes | 11 (5.8%) | 0 (0.0%) |
| 45 to 59 Minutes | 7 (3.7%) | 12 (7.0%) |
| 60 to 89 Minutes | 3 (1.6%) | 0 (0.0%) |
| 90 or more Minutes | 13 (6.9%) | 0 (0.0%) |
Time of Departure to Work by Sex in Midvale
The most frequent times of departure to work in Midvale are 4:00 PM to 11:59 PM (42, 22.2%) for males and 4:00 PM to 11:59 PM (37, 21.5%) for females.
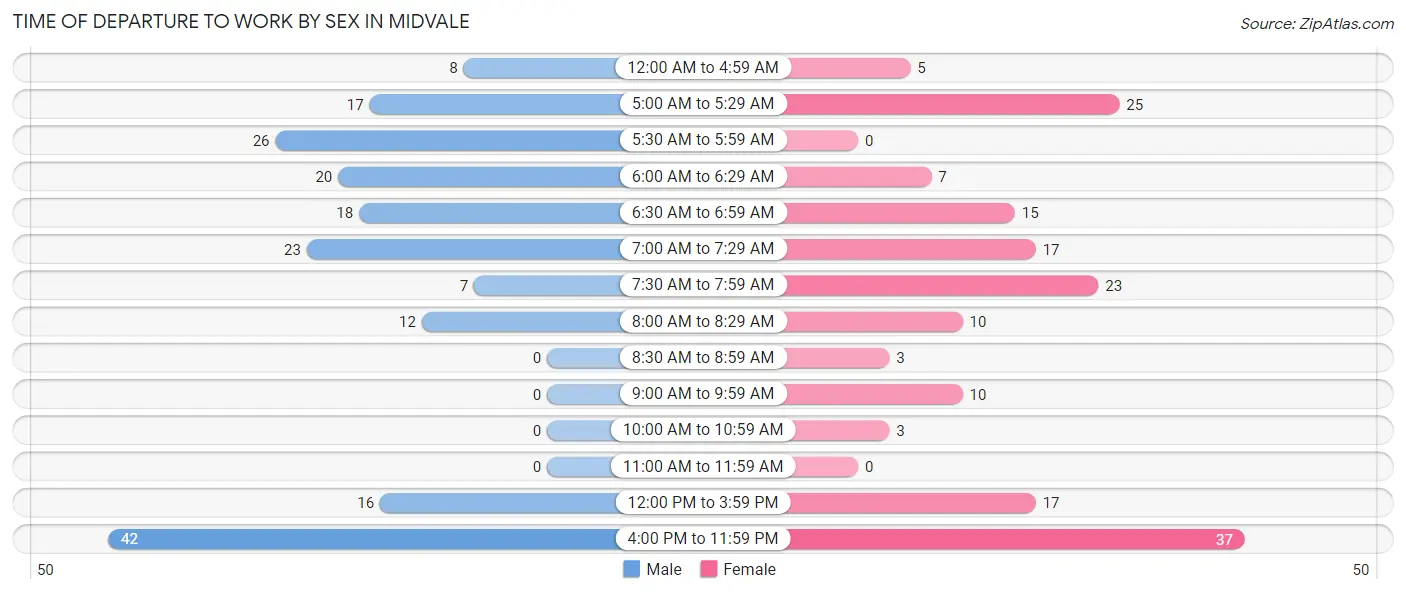
| Time of Departure | Male | Female |
| 12:00 AM to 4:59 AM | 8 (4.2%) | 5 (2.9%) |
| 5:00 AM to 5:29 AM | 17 (9.0%) | 25 (14.5%) |
| 5:30 AM to 5:59 AM | 26 (13.8%) | 0 (0.0%) |
| 6:00 AM to 6:29 AM | 20 (10.6%) | 7 (4.1%) |
| 6:30 AM to 6:59 AM | 18 (9.5%) | 15 (8.7%) |
| 7:00 AM to 7:29 AM | 23 (12.2%) | 17 (9.9%) |
| 7:30 AM to 7:59 AM | 7 (3.7%) | 23 (13.4%) |
| 8:00 AM to 8:29 AM | 12 (6.4%) | 10 (5.8%) |
| 8:30 AM to 8:59 AM | 0 (0.0%) | 3 (1.7%) |
| 9:00 AM to 9:59 AM | 0 (0.0%) | 10 (5.8%) |
| 10:00 AM to 10:59 AM | 0 (0.0%) | 3 (1.7%) |
| 11:00 AM to 11:59 AM | 0 (0.0%) | 0 (0.0%) |
| 12:00 PM to 3:59 PM | 16 (8.5%) | 17 (9.9%) |
| 4:00 PM to 11:59 PM | 42 (22.2%) | 37 (21.5%) |
| Total | 189 (100.0%) | 172 (100.0%) |
Housing Occupancy in Midvale
Occupancy by Ownership in Midvale
Of the total 311 dwellings in Midvale, owner-occupied units account for 260 (83.6%), while renter-occupied units make up 51 (16.4%).
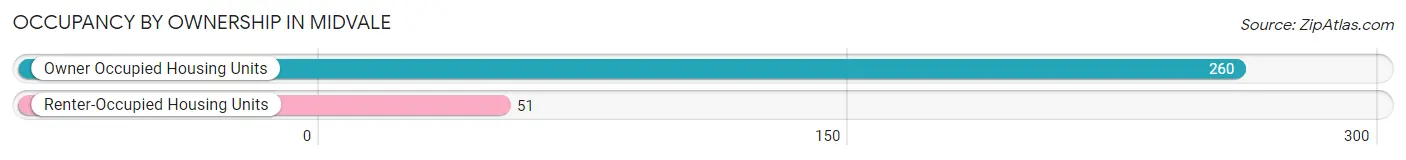
| Occupancy | # Housing Units | % Housing Units |
| Owner Occupied Housing Units | 260 | 83.6% |
| Renter-Occupied Housing Units | 51 | 16.4% |
| Total Occupied Housing Units | 311 | 100.0% |
Occupancy by Household Size in Midvale
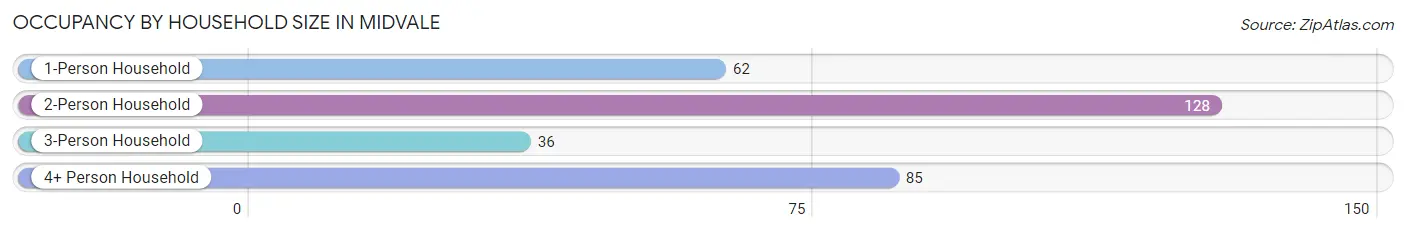
| Household Size | # Housing Units | % Housing Units |
| 1-Person Household | 62 | 19.9% |
| 2-Person Household | 128 | 41.2% |
| 3-Person Household | 36 | 11.6% |
| 4+ Person Household | 85 | 27.3% |
| Total Housing Units | 311 | 100.0% |
Occupancy by Ownership by Household Size in Midvale
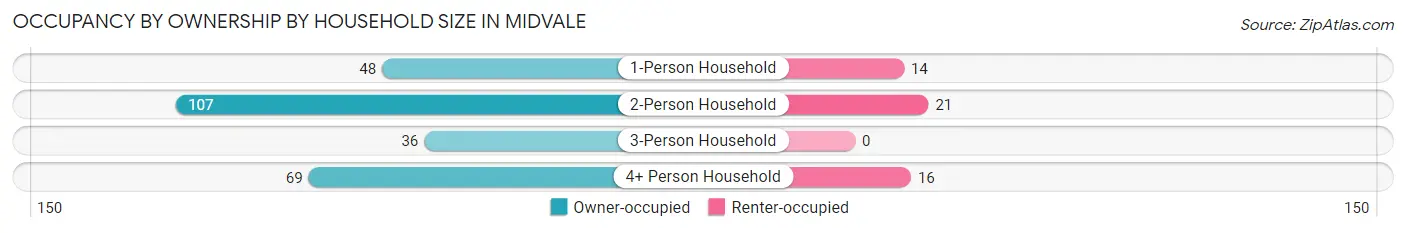
| Household Size | Owner-occupied | Renter-occupied |
| 1-Person Household | 48 (77.4%) | 14 (22.6%) |
| 2-Person Household | 107 (83.6%) | 21 (16.4%) |
| 3-Person Household | 36 (100.0%) | 0 (0.0%) |
| 4+ Person Household | 69 (81.2%) | 16 (18.8%) |
| Total Housing Units | 260 (83.6%) | 51 (16.4%) |
Occupancy by Educational Attainment in Midvale
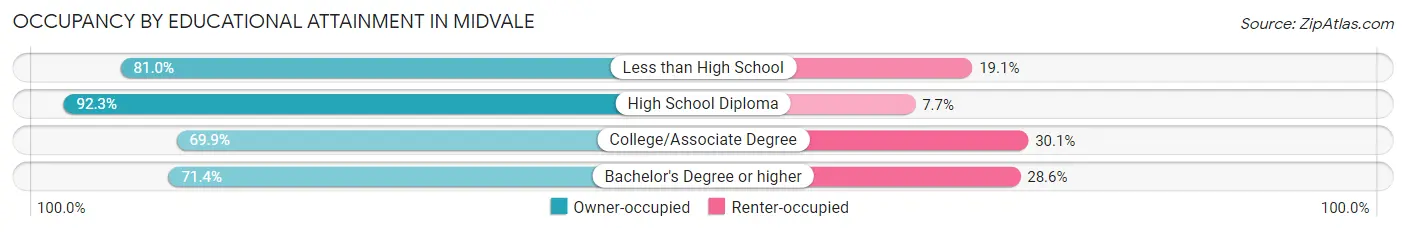
| Household Size | Owner-occupied | Renter-occupied |
| Less than High School | 34 (80.9%) | 8 (19.1%) |
| High School Diploma | 155 (92.3%) | 13 (7.7%) |
| College/Associate Degree | 51 (69.9%) | 22 (30.1%) |
| Bachelor's Degree or higher | 20 (71.4%) | 8 (28.6%) |
Occupancy by Age of Householder in Midvale
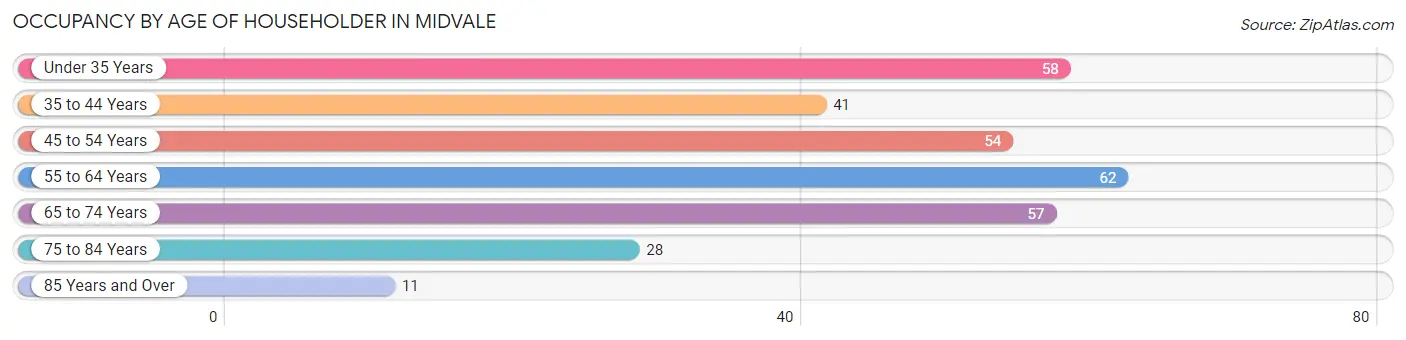
| Age Bracket | # Households | % Households |
| Under 35 Years | 58 | 18.6% |
| 35 to 44 Years | 41 | 13.2% |
| 45 to 54 Years | 54 | 17.4% |
| 55 to 64 Years | 62 | 19.9% |
| 65 to 74 Years | 57 | 18.3% |
| 75 to 84 Years | 28 | 9.0% |
| 85 Years and Over | 11 | 3.5% |
| Total | 311 | 100.0% |
Housing Finances in Midvale
Median Income by Occupancy in Midvale
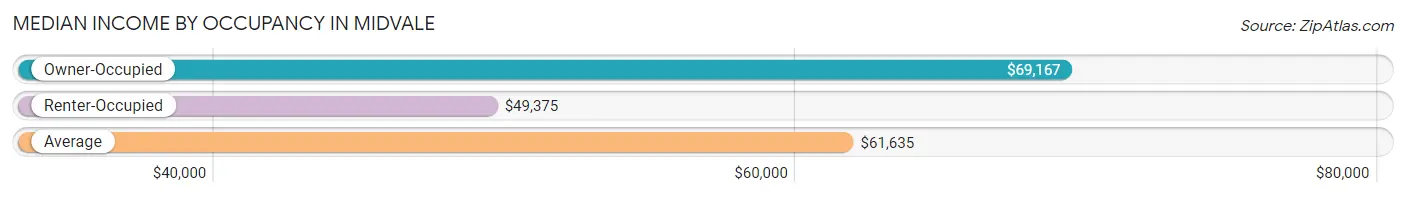
| Occupancy Type | # Households | Median Income |
| Owner-Occupied | 260 (83.6%) | $69,167 |
| Renter-Occupied | 51 (16.4%) | $49,375 |
| Average | 311 (100.0%) | $61,635 |
Occupancy by Householder Income Bracket in Midvale
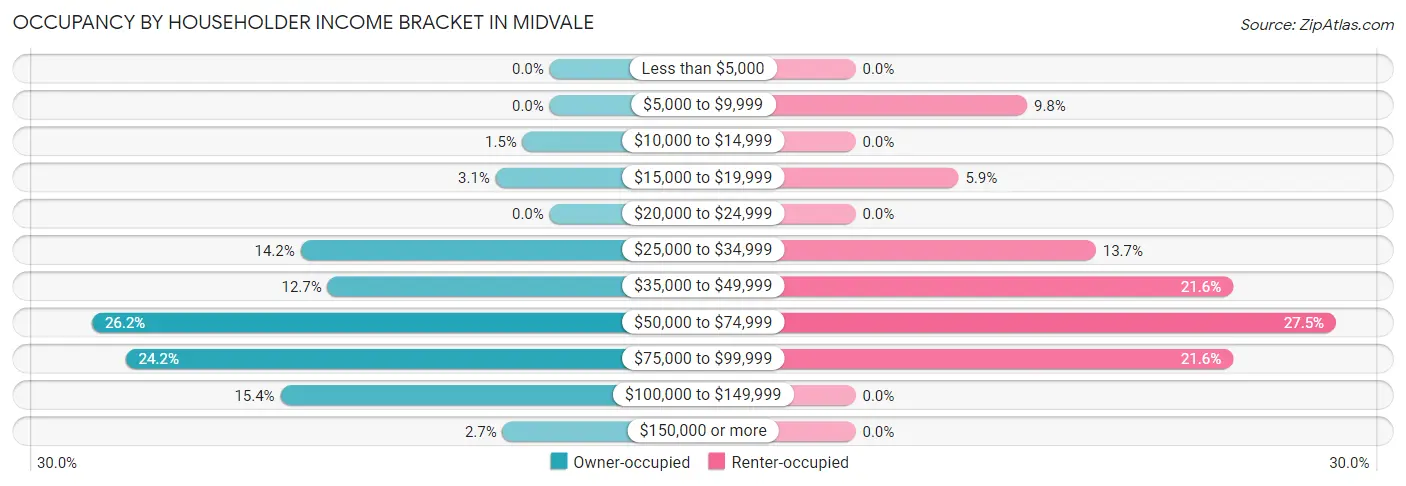
| Income Bracket | Owner-occupied | Renter-occupied |
| Less than $5,000 | 0 (0.0%) | 0 (0.0%) |
| $5,000 to $9,999 | 0 (0.0%) | 5 (9.8%) |
| $10,000 to $14,999 | 4 (1.5%) | 0 (0.0%) |
| $15,000 to $19,999 | 8 (3.1%) | 3 (5.9%) |
| $20,000 to $24,999 | 0 (0.0%) | 0 (0.0%) |
| $25,000 to $34,999 | 37 (14.2%) | 7 (13.7%) |
| $35,000 to $49,999 | 33 (12.7%) | 11 (21.6%) |
| $50,000 to $74,999 | 68 (26.2%) | 14 (27.5%) |
| $75,000 to $99,999 | 63 (24.2%) | 11 (21.6%) |
| $100,000 to $149,999 | 40 (15.4%) | 0 (0.0%) |
| $150,000 or more | 7 (2.7%) | 0 (0.0%) |
| Total | 260 (100.0%) | 51 (100.0%) |
Monthly Housing Cost Tiers in Midvale
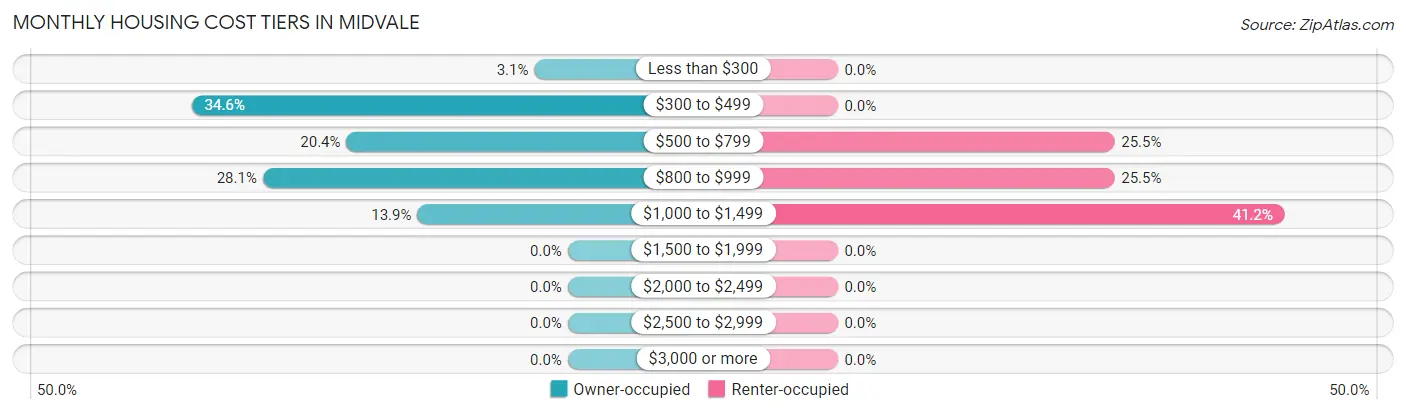
| Monthly Cost | Owner-occupied | Renter-occupied |
| Less than $300 | 8 (3.1%) | 0 (0.0%) |
| $300 to $499 | 90 (34.6%) | 0 (0.0%) |
| $500 to $799 | 53 (20.4%) | 13 (25.5%) |
| $800 to $999 | 73 (28.1%) | 13 (25.5%) |
| $1,000 to $1,499 | 36 (13.9%) | 21 (41.2%) |
| $1,500 to $1,999 | 0 (0.0%) | 0 (0.0%) |
| $2,000 to $2,499 | 0 (0.0%) | 0 (0.0%) |
| $2,500 to $2,999 | 0 (0.0%) | 0 (0.0%) |
| $3,000 or more | 0 (0.0%) | 0 (0.0%) |
| Total | 260 (100.0%) | 51 (100.0%) |
Physical Housing Characteristics in Midvale
Housing Structures in Midvale
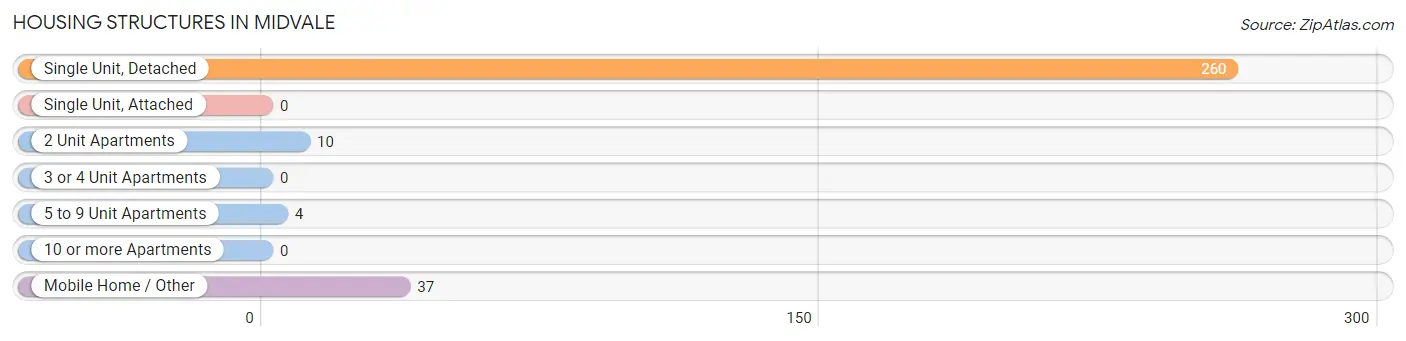
| Structure Type | # Housing Units | % Housing Units |
| Single Unit, Detached | 260 | 83.6% |
| Single Unit, Attached | 0 | 0.0% |
| 2 Unit Apartments | 10 | 3.2% |
| 3 or 4 Unit Apartments | 0 | 0.0% |
| 5 to 9 Unit Apartments | 4 | 1.3% |
| 10 or more Apartments | 0 | 0.0% |
| Mobile Home / Other | 37 | 11.9% |
| Total | 311 | 100.0% |
Housing Structures by Occupancy in Midvale
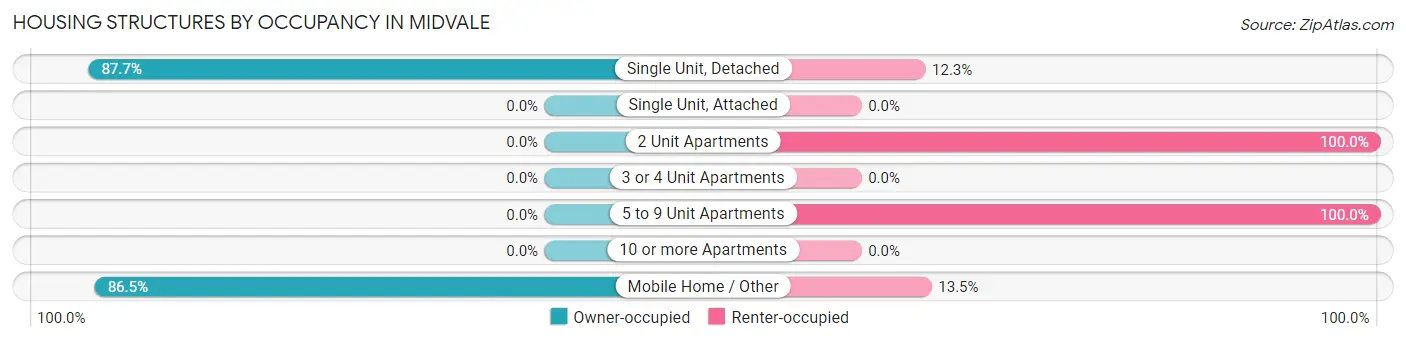
| Structure Type | Owner-occupied | Renter-occupied |
| Single Unit, Detached | 228 (87.7%) | 32 (12.3%) |
| Single Unit, Attached | 0 (0.0%) | 0 (0.0%) |
| 2 Unit Apartments | 0 (0.0%) | 10 (100.0%) |
| 3 or 4 Unit Apartments | 0 (0.0%) | 0 (0.0%) |
| 5 to 9 Unit Apartments | 0 (0.0%) | 4 (100.0%) |
| 10 or more Apartments | 0 (0.0%) | 0 (0.0%) |
| Mobile Home / Other | 32 (86.5%) | 5 (13.5%) |
| Total | 260 (83.6%) | 51 (16.4%) |
Housing Structures by Number of Rooms in Midvale
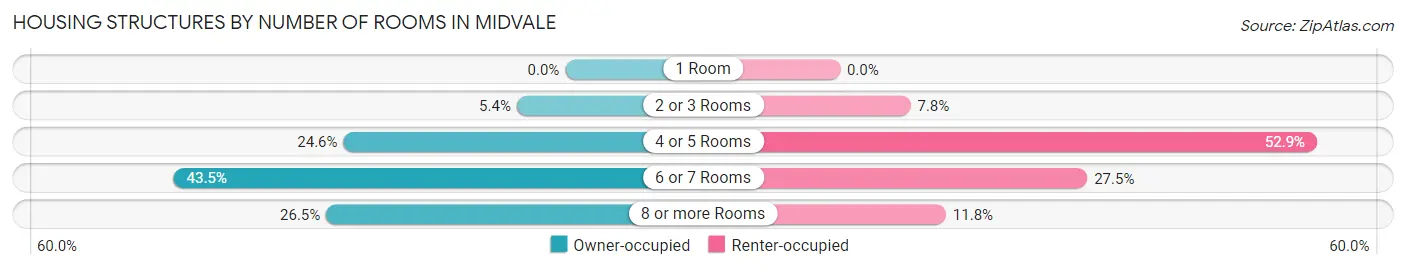
| Number of Rooms | Owner-occupied | Renter-occupied |
| 1 Room | 0 (0.0%) | 0 (0.0%) |
| 2 or 3 Rooms | 14 (5.4%) | 4 (7.8%) |
| 4 or 5 Rooms | 64 (24.6%) | 27 (52.9%) |
| 6 or 7 Rooms | 113 (43.5%) | 14 (27.5%) |
| 8 or more Rooms | 69 (26.5%) | 6 (11.8%) |
| Total | 260 (100.0%) | 51 (100.0%) |
Housing Structure by Heating Type in Midvale
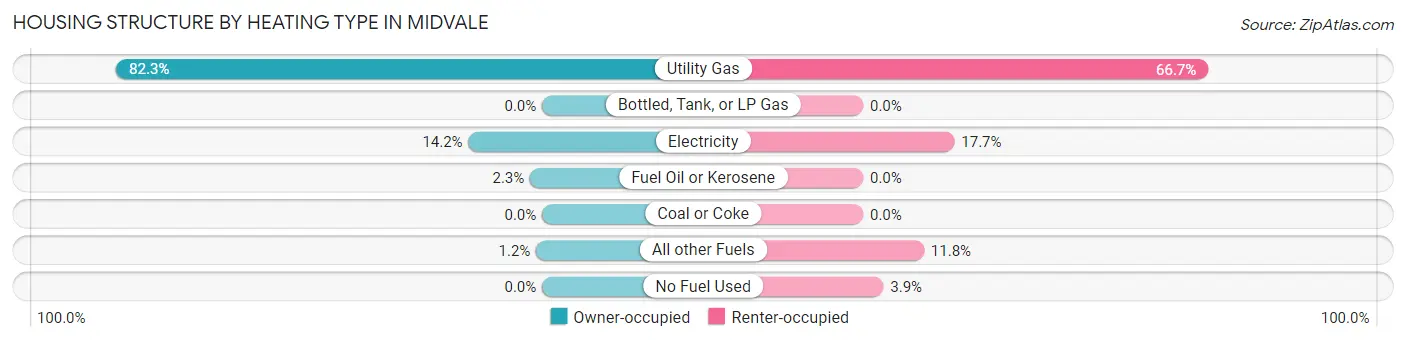
| Heating Type | Owner-occupied | Renter-occupied |
| Utility Gas | 214 (82.3%) | 34 (66.7%) |
| Bottled, Tank, or LP Gas | 0 (0.0%) | 0 (0.0%) |
| Electricity | 37 (14.2%) | 9 (17.6%) |
| Fuel Oil or Kerosene | 6 (2.3%) | 0 (0.0%) |
| Coal or Coke | 0 (0.0%) | 0 (0.0%) |
| All other Fuels | 3 (1.1%) | 6 (11.8%) |
| No Fuel Used | 0 (0.0%) | 2 (3.9%) |
| Total | 260 (100.0%) | 51 (100.0%) |
Household Vehicle Usage in Midvale
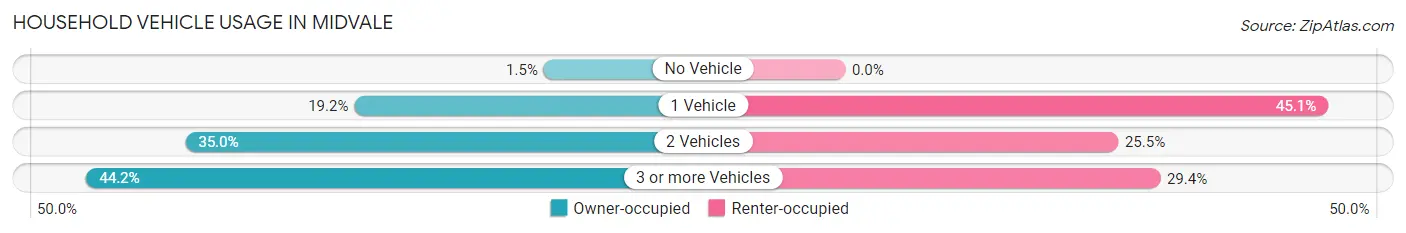
| Vehicles per Household | Owner-occupied | Renter-occupied |
| No Vehicle | 4 (1.5%) | 0 (0.0%) |
| 1 Vehicle | 50 (19.2%) | 23 (45.1%) |
| 2 Vehicles | 91 (35.0%) | 13 (25.5%) |
| 3 or more Vehicles | 115 (44.2%) | 15 (29.4%) |
| Total | 260 (100.0%) | 51 (100.0%) |
Real Estate & Mortgages in Midvale
Real Estate and Mortgage Overview in Midvale
| Characteristic | Without Mortgage | With Mortgage |
| Housing Units | 131 | 129 |
| Median Property Value | $103,000 | $102,000 |
| Median Household Income | $54,688 | $7 |
| Monthly Housing Costs | $435 | $0 |
| Real Estate Taxes | $1,067 | $5 |
Property Value by Mortgage Status in Midvale
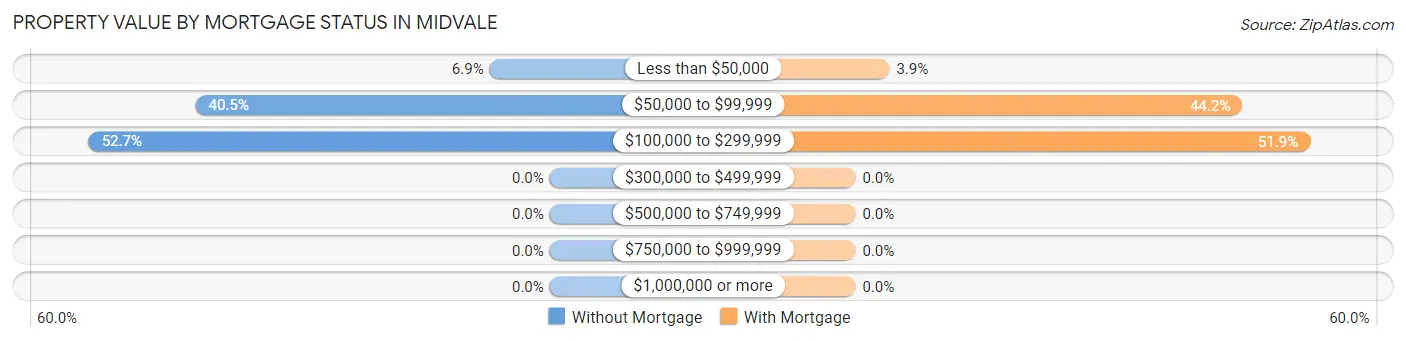
| Property Value | Without Mortgage | With Mortgage |
| Less than $50,000 | 9 (6.9%) | 5 (3.9%) |
| $50,000 to $99,999 | 53 (40.5%) | 57 (44.2%) |
| $100,000 to $299,999 | 69 (52.7%) | 67 (51.9%) |
| $300,000 to $499,999 | 0 (0.0%) | 0 (0.0%) |
| $500,000 to $749,999 | 0 (0.0%) | 0 (0.0%) |
| $750,000 to $999,999 | 0 (0.0%) | 0 (0.0%) |
| $1,000,000 or more | 0 (0.0%) | 0 (0.0%) |
| Total | 131 (100.0%) | 129 (100.0%) |
Household Income by Mortgage Status in Midvale
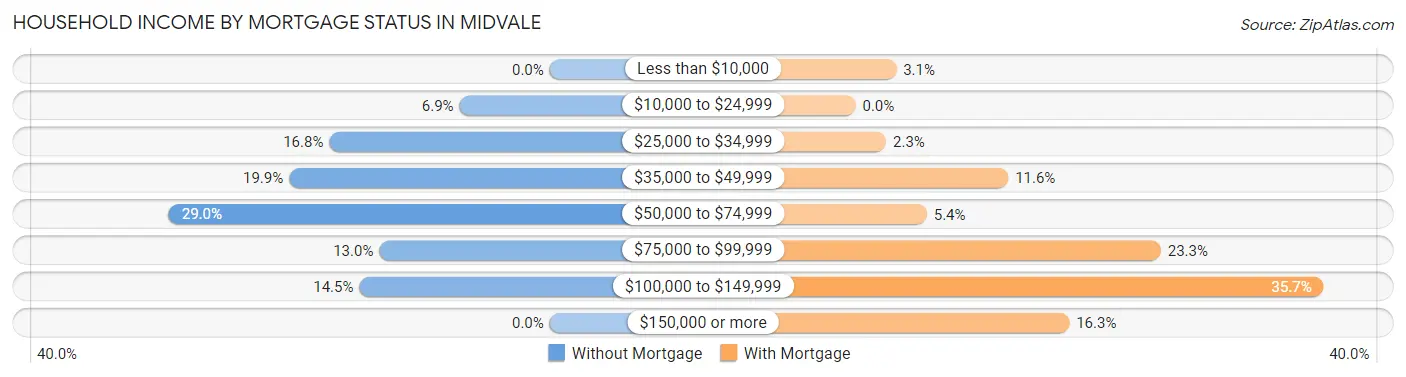
| Household Income | Without Mortgage | With Mortgage |
| Less than $10,000 | 0 (0.0%) | 4 (3.1%) |
| $10,000 to $24,999 | 9 (6.9%) | 0 (0.0%) |
| $25,000 to $34,999 | 22 (16.8%) | 3 (2.3%) |
| $35,000 to $49,999 | 26 (19.9%) | 15 (11.6%) |
| $50,000 to $74,999 | 38 (29.0%) | 7 (5.4%) |
| $75,000 to $99,999 | 17 (13.0%) | 30 (23.3%) |
| $100,000 to $149,999 | 19 (14.5%) | 46 (35.7%) |
| $150,000 or more | 0 (0.0%) | 21 (16.3%) |
| Total | 131 (100.0%) | 129 (100.0%) |
Property Value to Household Income Ratio in Midvale
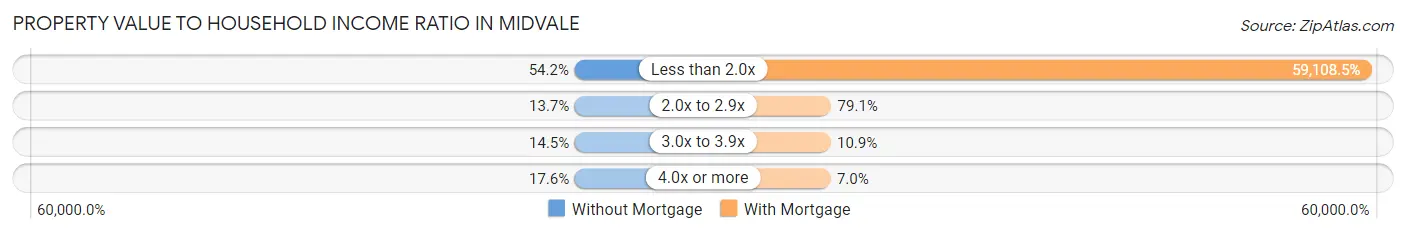
| Value-to-Income Ratio | Without Mortgage | With Mortgage |
| Less than 2.0x | 71 (54.2%) | 76,250 (59,108.5%) |
| 2.0x to 2.9x | 18 (13.7%) | 102 (79.1%) |
| 3.0x to 3.9x | 19 (14.5%) | 14 (10.8%) |
| 4.0x or more | 23 (17.6%) | 9 (7.0%) |
| Total | 131 (100.0%) | 129 (100.0%) |
Real Estate Taxes by Mortgage Status in Midvale
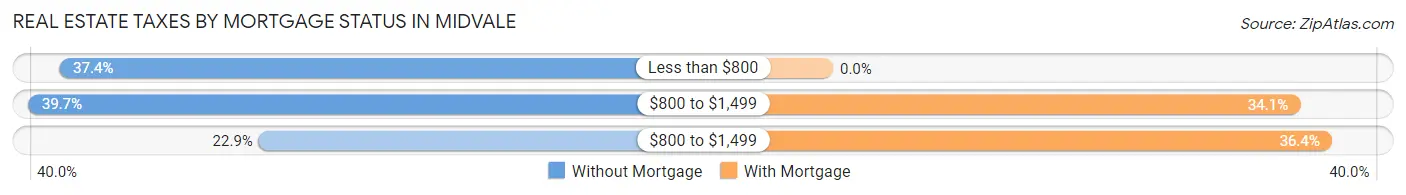
| Property Taxes | Without Mortgage | With Mortgage |
| Less than $800 | 49 (37.4%) | 0 (0.0%) |
| $800 to $1,499 | 52 (39.7%) | 44 (34.1%) |
| $800 to $1,499 | 30 (22.9%) | 47 (36.4%) |
| Total | 131 (100.0%) | 129 (100.0%) |
Health & Disability in Midvale
Health Insurance Coverage by Age in Midvale
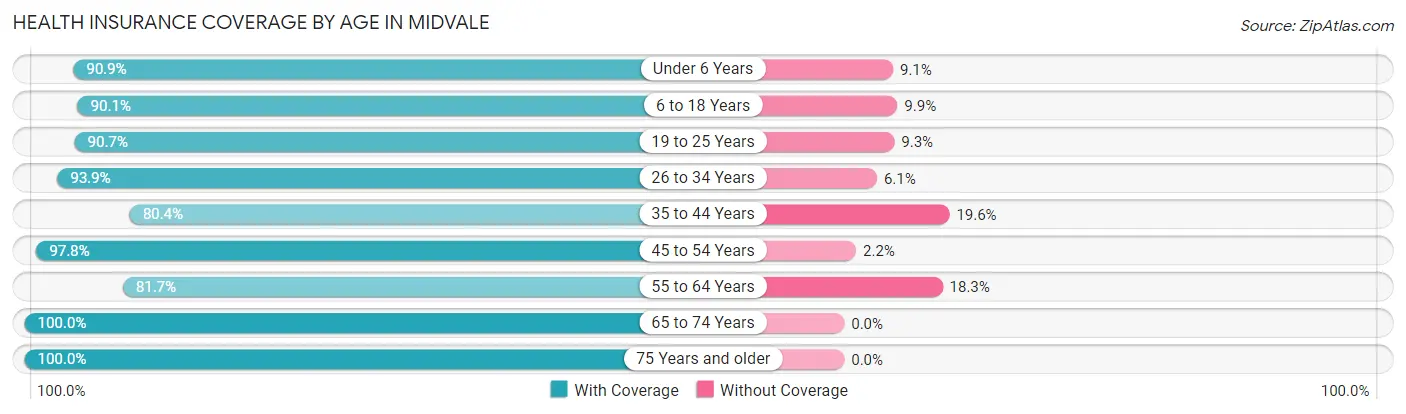
| Age Bracket | With Coverage | Without Coverage |
| Under 6 Years | 50 (90.9%) | 5 (9.1%) |
| 6 to 18 Years | 182 (90.1%) | 20 (9.9%) |
| 19 to 25 Years | 68 (90.7%) | 7 (9.3%) |
| 26 to 34 Years | 77 (93.9%) | 5 (6.1%) |
| 35 to 44 Years | 82 (80.4%) | 20 (19.6%) |
| 45 to 54 Years | 89 (97.8%) | 2 (2.2%) |
| 55 to 64 Years | 98 (81.7%) | 22 (18.3%) |
| 65 to 74 Years | 86 (100.0%) | 0 (0.0%) |
| 75 Years and older | 55 (100.0%) | 0 (0.0%) |
| Total | 787 (90.7%) | 81 (9.3%) |
Health Insurance Coverage by Citizenship Status in Midvale
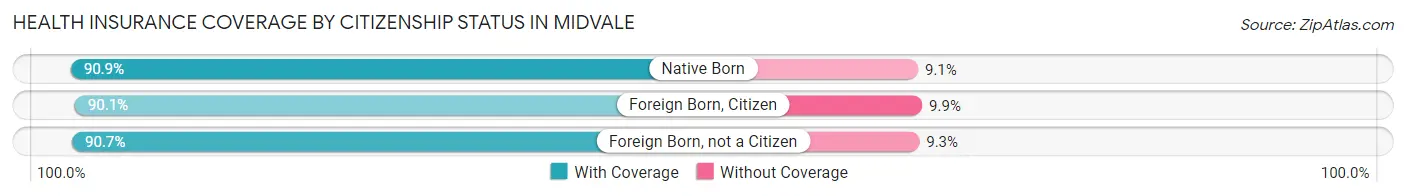
| Citizenship Status | With Coverage | Without Coverage |
| Native Born | 50 (90.9%) | 5 (9.1%) |
| Foreign Born, Citizen | 182 (90.1%) | 20 (9.9%) |
| Foreign Born, not a Citizen | 68 (90.7%) | 7 (9.3%) |
Health Insurance Coverage by Household Income in Midvale
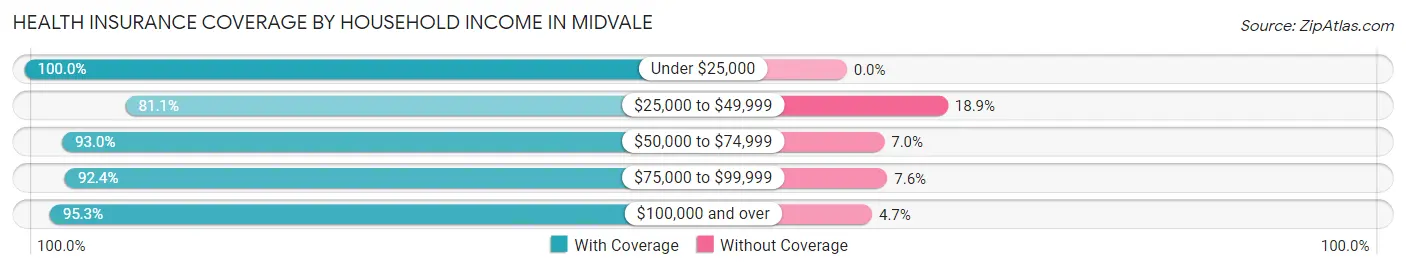
| Household Income | With Coverage | Without Coverage |
| Under $25,000 | 32 (100.0%) | 0 (0.0%) |
| $25,000 to $49,999 | 167 (81.1%) | 39 (18.9%) |
| $50,000 to $74,999 | 159 (93.0%) | 12 (7.0%) |
| $75,000 to $99,999 | 268 (92.4%) | 22 (7.6%) |
| $100,000 and over | 161 (95.3%) | 8 (4.7%) |
Public vs Private Health Insurance Coverage by Age in Midvale
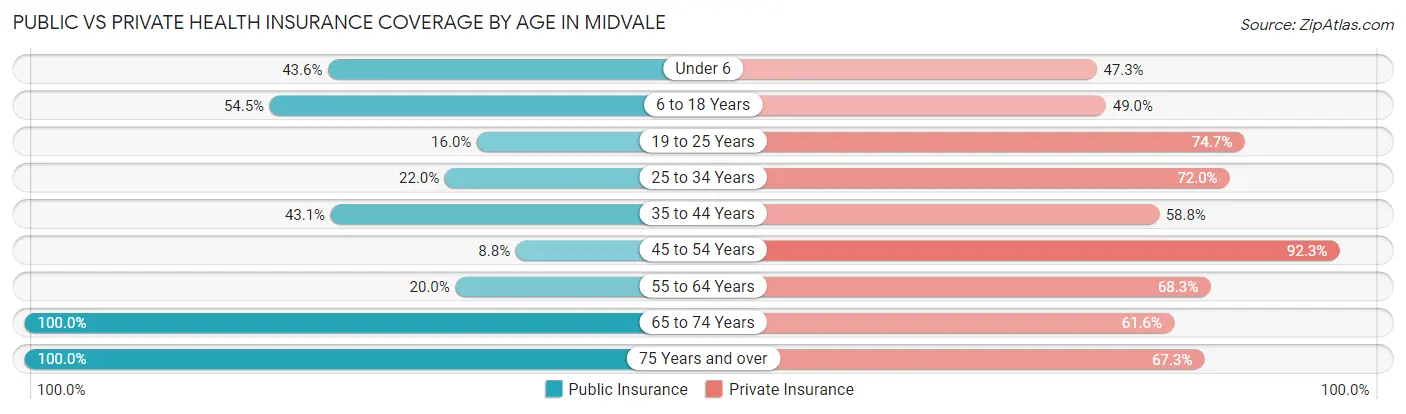
| Age Bracket | Public Insurance | Private Insurance |
| Under 6 | 24 (43.6%) | 26 (47.3%) |
| 6 to 18 Years | 110 (54.5%) | 99 (49.0%) |
| 19 to 25 Years | 12 (16.0%) | 56 (74.7%) |
| 25 to 34 Years | 18 (22.0%) | 59 (72.0%) |
| 35 to 44 Years | 44 (43.1%) | 60 (58.8%) |
| 45 to 54 Years | 8 (8.8%) | 84 (92.3%) |
| 55 to 64 Years | 24 (20.0%) | 82 (68.3%) |
| 65 to 74 Years | 86 (100.0%) | 53 (61.6%) |
| 75 Years and over | 55 (100.0%) | 37 (67.3%) |
| Total | 381 (43.9%) | 556 (64.1%) |
Disability Status by Sex by Age in Midvale
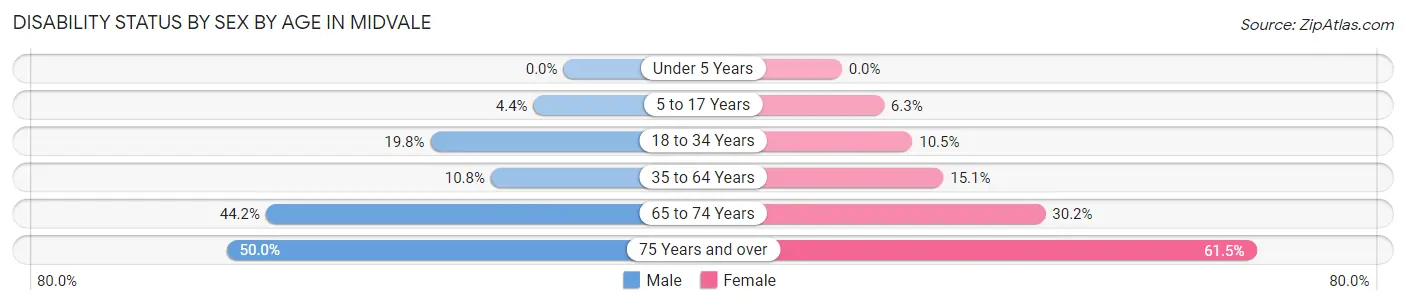
| Age Bracket | Male | Female |
| Under 5 Years | 0 (0.0%) | 0 (0.0%) |
| 5 to 17 Years | 6 (4.4%) | 4 (6.2%) |
| 18 to 34 Years | 16 (19.8%) | 9 (10.5%) |
| 35 to 64 Years | 18 (10.8%) | 22 (15.1%) |
| 65 to 74 Years | 19 (44.2%) | 13 (30.2%) |
| 75 Years and over | 8 (50.0%) | 24 (61.5%) |
Disability Class by Sex by Age in Midvale
Disability Class: Hearing Difficulty
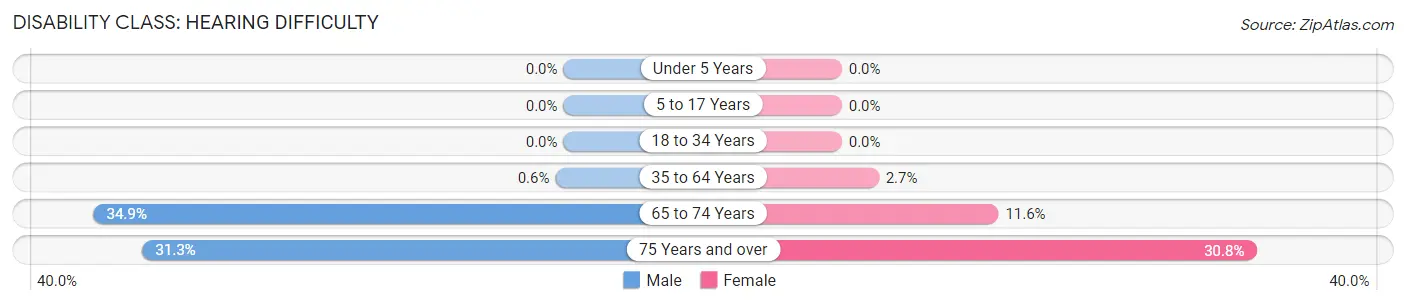
| Age Bracket | Male | Female |
| Under 5 Years | 0 (0.0%) | 0 (0.0%) |
| 5 to 17 Years | 0 (0.0%) | 0 (0.0%) |
| 18 to 34 Years | 0 (0.0%) | 0 (0.0%) |
| 35 to 64 Years | 1 (0.6%) | 4 (2.7%) |
| 65 to 74 Years | 15 (34.9%) | 5 (11.6%) |
| 75 Years and over | 5 (31.2%) | 12 (30.8%) |
Disability Class: Vision Difficulty
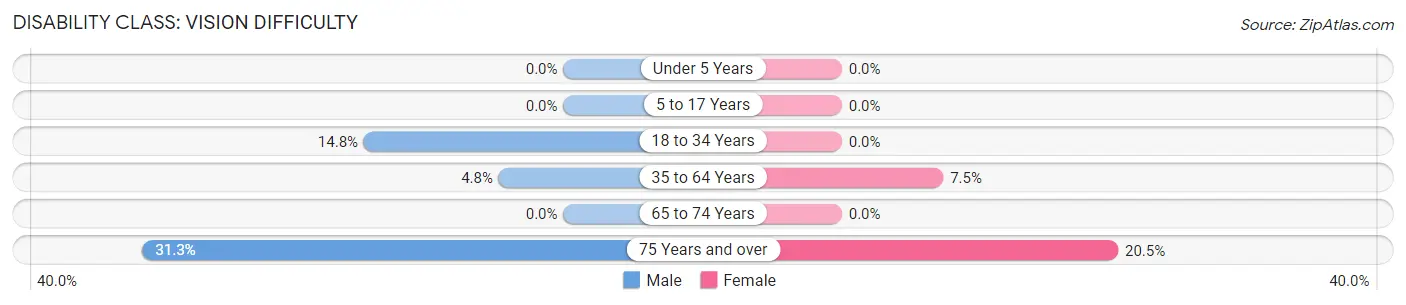
| Age Bracket | Male | Female |
| Under 5 Years | 0 (0.0%) | 0 (0.0%) |
| 5 to 17 Years | 0 (0.0%) | 0 (0.0%) |
| 18 to 34 Years | 12 (14.8%) | 0 (0.0%) |
| 35 to 64 Years | 8 (4.8%) | 11 (7.5%) |
| 65 to 74 Years | 0 (0.0%) | 0 (0.0%) |
| 75 Years and over | 5 (31.2%) | 8 (20.5%) |
Disability Class: Cognitive Difficulty
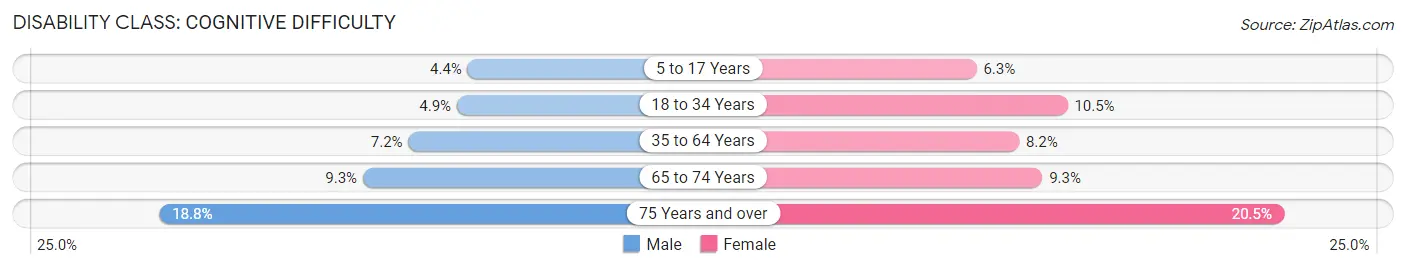
| Age Bracket | Male | Female |
| 5 to 17 Years | 6 (4.4%) | 4 (6.2%) |
| 18 to 34 Years | 4 (4.9%) | 9 (10.5%) |
| 35 to 64 Years | 12 (7.2%) | 12 (8.2%) |
| 65 to 74 Years | 4 (9.3%) | 4 (9.3%) |
| 75 Years and over | 3 (18.8%) | 8 (20.5%) |
Disability Class: Ambulatory Difficulty
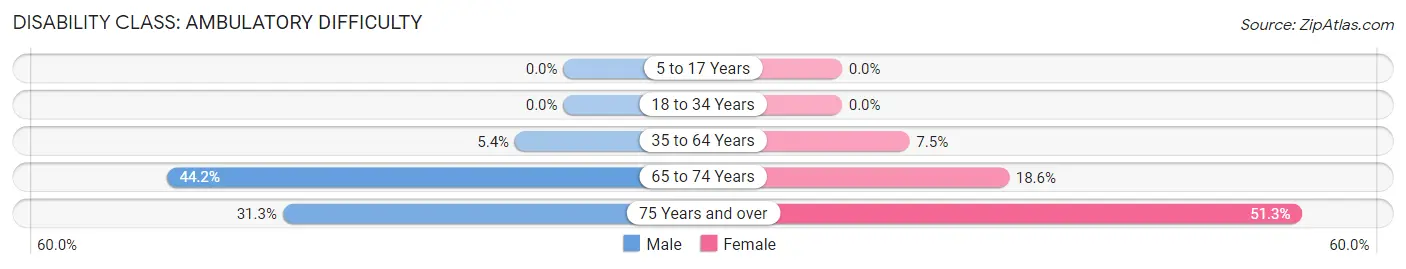
| Age Bracket | Male | Female |
| 5 to 17 Years | 0 (0.0%) | 0 (0.0%) |
| 18 to 34 Years | 0 (0.0%) | 0 (0.0%) |
| 35 to 64 Years | 9 (5.4%) | 11 (7.5%) |
| 65 to 74 Years | 19 (44.2%) | 8 (18.6%) |
| 75 Years and over | 5 (31.2%) | 20 (51.3%) |
Disability Class: Self-Care Difficulty
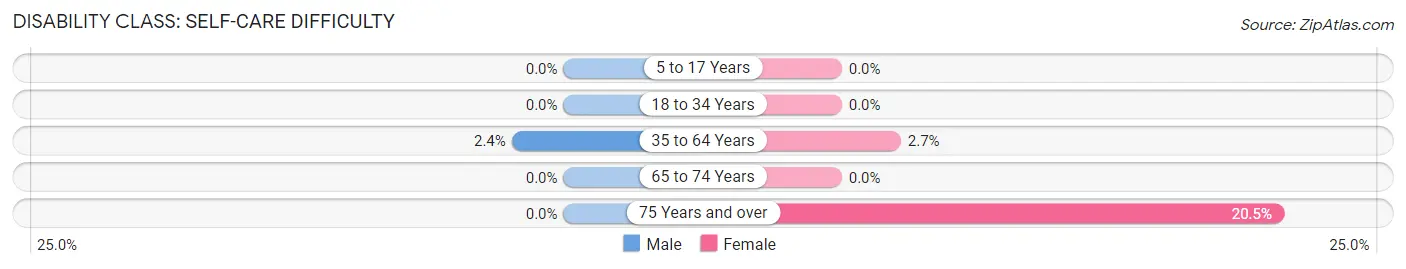
| Age Bracket | Male | Female |
| 5 to 17 Years | 0 (0.0%) | 0 (0.0%) |
| 18 to 34 Years | 0 (0.0%) | 0 (0.0%) |
| 35 to 64 Years | 4 (2.4%) | 4 (2.7%) |
| 65 to 74 Years | 0 (0.0%) | 0 (0.0%) |
| 75 Years and over | 0 (0.0%) | 8 (20.5%) |
Technology Access in Midvale
Computing Device Access in Midvale
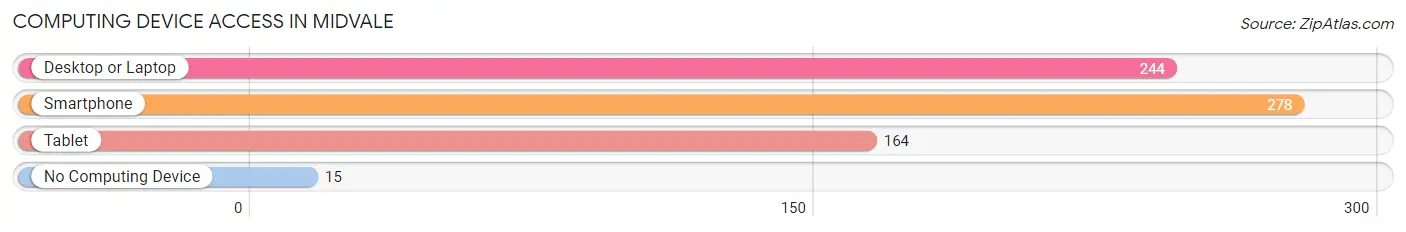
| Device Type | # Households | % Households |
| Desktop or Laptop | 244 | 78.5% |
| Smartphone | 278 | 89.4% |
| Tablet | 164 | 52.7% |
| No Computing Device | 15 | 4.8% |
| Total | 311 | 100.0% |
Internet Access in Midvale
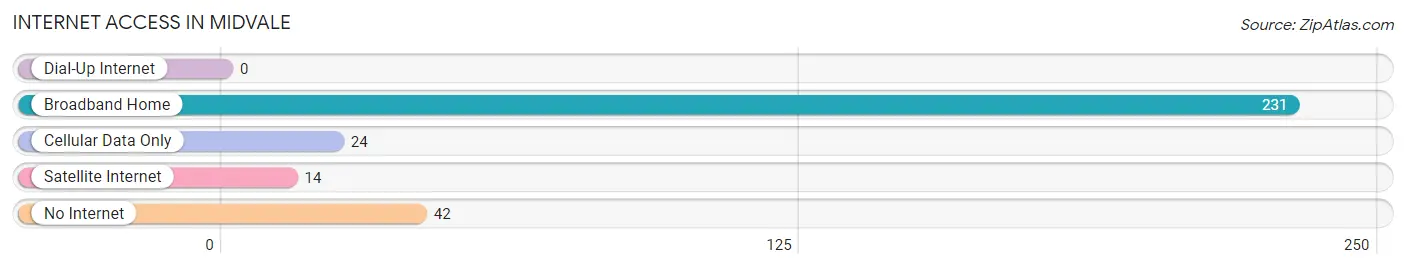
| Internet Type | # Households | % Households |
| Dial-Up Internet | 0 | 0.0% |
| Broadband Home | 231 | 74.3% |
| Cellular Data Only | 24 | 7.7% |
| Satellite Internet | 14 | 4.5% |
| No Internet | 42 | 13.5% |
| Total | 311 | 100.0% |
Midvale Summary
Midvale, Ohio is a small village located in Tuscarawas County, Ohio. It is situated on the Tuscarawas River, approximately 25 miles south of Canton and 40 miles east of Akron. The village has a population of approximately 1,000 people and covers an area of 0.6 square miles.
History
Midvale was founded in 1817 by a group of settlers from Pennsylvania. The village was originally known as “Midway” due to its location between two other settlements, but the name was changed to Midvale in 1820. The village was incorporated in 1867.
In the early days, Midvale was a farming community, with the main crops being wheat, corn, and oats. The village also had a sawmill, gristmill, and a woolen mill. In the late 1800s, the village began to grow and develop, with the construction of a railroad line and the opening of several businesses.
Geography
Midvale is located in the Appalachian Plateau region of Ohio. The village is situated on the Tuscarawas River, which flows through the village and provides a source of recreation for the residents. The village is surrounded by rolling hills and wooded areas, providing a scenic backdrop.
The climate in Midvale is typical of the Midwest, with hot summers and cold winters. The average temperature in the summer is around 75 degrees Fahrenheit, while the average temperature in the winter is around 30 degrees Fahrenheit.
Economy
The economy of Midvale is largely based on agriculture and manufacturing. The village is home to several small businesses, including a grocery store, a hardware store, and a restaurant. The village also has a few small manufacturing companies, which produce a variety of products, including furniture, clothing, and automotive parts.
The village is also home to a few small farms, which produce a variety of crops, including corn, wheat, and soybeans. The village also has a few small wineries, which produce a variety of wines.
Demographics
As of the 2010 census, the population of Midvale was 1,000 people. The racial makeup of the village was 97.2% White, 0.7% African American, 0.2% Native American, 0.2% Asian, and 1.7% from other races. The median household income was $37,500, and the median age was 43.
Conclusion
Midvale, Ohio is a small village located in Tuscarawas County, Ohio. It is situated on the Tuscarawas River, approximately 25 miles south of Canton and 40 miles east of Akron. The village has a population of approximately 1,000 people and covers an area of 0.6 square miles. The economy of Midvale is largely based on agriculture and manufacturing, and the village is home to several small businesses. The racial makeup of the village is 97.2% White, 0.7% African American, 0.2% Native American, 0.2% Asian, and 1.7% from other races. The median household income was $37,500, and the median age was 43.
Common Questions
What is Per Capita Income in Midvale?
Per Capita income in Midvale is $24,124.
What is the Median Family Income in Midvale?
Median Family Income in Midvale is $62,059.
What is the Median Household income in Midvale?
Median Household Income in Midvale is $61,635.
What is Income or Wage Gap in Midvale?
Income or Wage Gap in Midvale is 45.6%.
Women in Midvale earn 54.4 cents for every dollar earned by a man.
What is Family Income Deficit in Midvale?
Family Income Deficit in Midvale is $9,392.
Families that are below poverty line in Midvale earn $9,392 less on average than the poverty threshold level.
What is Inequality or Gini Index in Midvale?
Inequality or Gini Index in Midvale is 0.29.
What is the Total Population of Midvale?
Total Population of Midvale is 868.
What is the Total Male Population of Midvale?
Total Male Population of Midvale is 463.
What is the Total Female Population of Midvale?
Total Female Population of Midvale is 405.
What is the Ratio of Males per 100 Females in Midvale?
There are 114.32 Males per 100 Females in Midvale.
What is the Ratio of Females per 100 Males in Midvale?
There are 87.47 Females per 100 Males in Midvale.
What is the Median Population Age in Midvale?
Median Population Age in Midvale is 38.5 Years.
What is the Average Family Size in Midvale
Average Family Size in Midvale is 3.0 People.
What is the Average Household Size in Midvale
Average Household Size in Midvale is 2.8 People.
How Large is the Labor Force in Midvale?
There are 411 People in the Labor Forcein in Midvale.
What is the Percentage of People in the Labor Force in Midvale?
61.8% of People are in the Labor Force in Midvale.
What is the Unemployment Rate in Midvale?
Unemployment Rate in Midvale is 3.9%.