Middleport, OH Map & Demographics
Middleport Map
Middleport Overview
$23,218
PER CAPITA INCOME
$47,917
AVG FAMILY INCOME
$36,343
AVG HOUSEHOLD INCOME
15.4%
WAGE / INCOME GAP [ % ]
84.6¢/ $1
WAGE / INCOME GAP [ $ ]
0.46
INEQUALITY / GINI INDEX
2,053
TOTAL POPULATION
1,067
MALE POPULATION
986
FEMALE POPULATION
108.22
MALES / 100 FEMALES
92.41
FEMALES / 100 MALES
42.5
MEDIAN AGE
2.9
AVG FAMILY SIZE
2.1
AVG HOUSEHOLD SIZE
866
LABOR FORCE [ PEOPLE ]
51.9%
PERCENT IN LABOR FORCE
2.7%
UNEMPLOYMENT RATE
Middleport Zip Codes
Middleport Area Codes
Income in Middleport
Income Overview in Middleport
Per Capita Income in Middleport is $23,218, while median incomes of families and households are $47,917 and $36,343 respectively.
| Characteristic | Number | Measure |
| Per Capita Income | 2,053 | $23,218 |
| Median Family Income | 480 | $47,917 |
| Mean Family Income | 480 | $67,339 |
| Median Household Income | 934 | $36,343 |
| Mean Household Income | 934 | $48,141 |
| Income Deficit | 480 | $0 |
| Wage / Income Gap (%) | 2,053 | 15.37% |
| Wage / Income Gap ($) | 2,053 | 84.63¢ per $1 |
| Gini / Inequality Index | 2,053 | 0.46 |
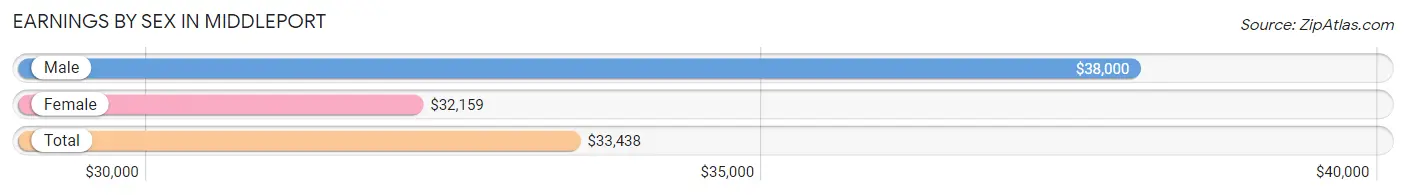
Earnings by Sex in Middleport
Average Earnings in Middleport are $33,438, $38,000 for men and $32,159 for women, a difference of 15.4%.
| Sex | Number | Average Earnings |
| Male | 478 (52.1%) | $38,000 |
| Female | 439 (47.9%) | $32,159 |
| Total | 917 (100.0%) | $33,438 |
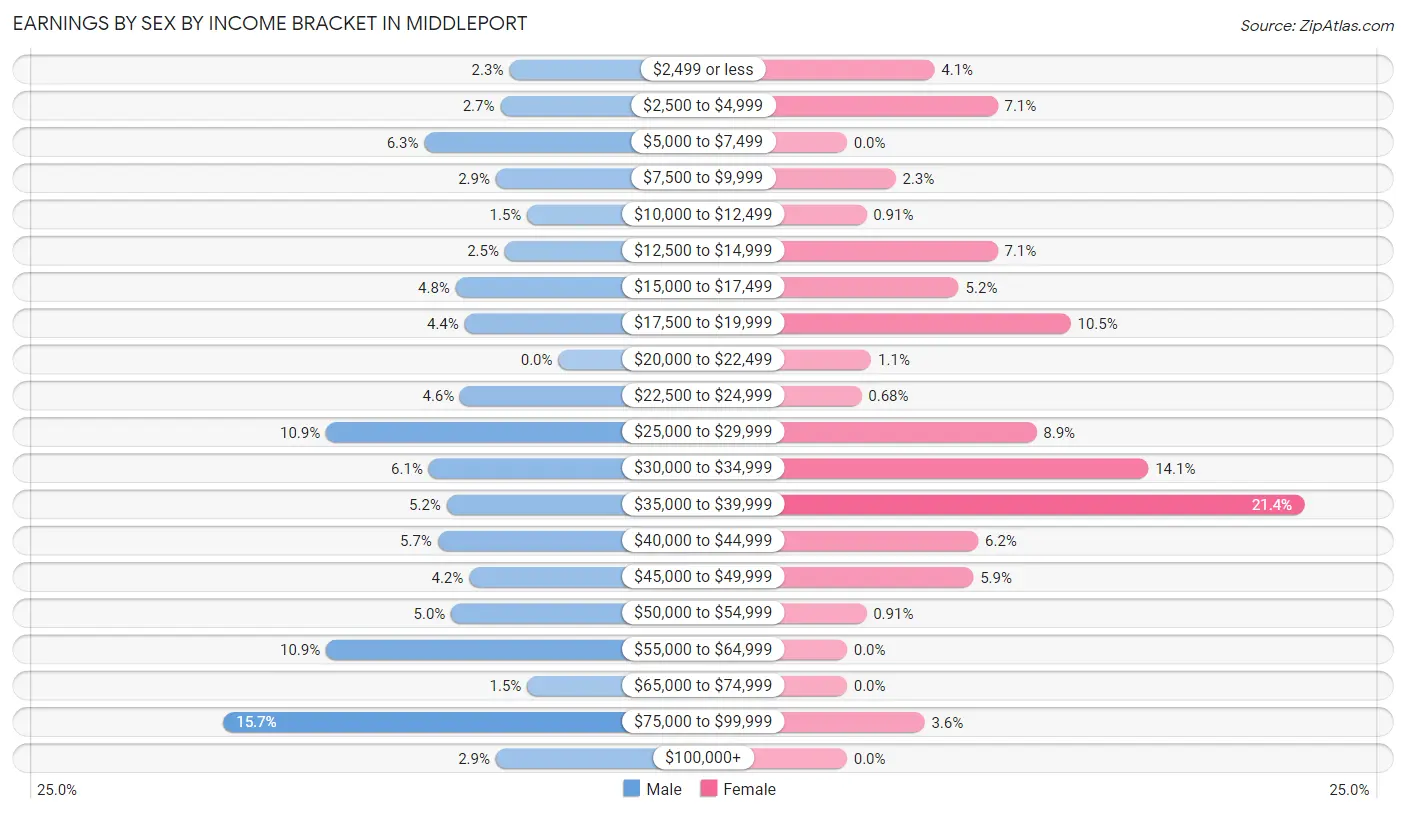
Earnings by Sex by Income Bracket in Middleport
The most common earnings brackets in Middleport are $75,000 to $99,999 for men (75 | 15.7%) and $35,000 to $39,999 for women (94 | 21.4%).
| Income | Male | Female |
| $2,499 or less | 11 (2.3%) | 18 (4.1%) |
| $2,500 to $4,999 | 13 (2.7%) | 31 (7.1%) |
| $5,000 to $7,499 | 30 (6.3%) | 0 (0.0%) |
| $7,500 to $9,999 | 14 (2.9%) | 10 (2.3%) |
| $10,000 to $12,499 | 7 (1.5%) | 4 (0.9%) |
| $12,500 to $14,999 | 12 (2.5%) | 31 (7.1%) |
| $15,000 to $17,499 | 23 (4.8%) | 23 (5.2%) |
| $17,500 to $19,999 | 21 (4.4%) | 46 (10.5%) |
| $20,000 to $22,499 | 0 (0.0%) | 5 (1.1%) |
| $22,500 to $24,999 | 22 (4.6%) | 3 (0.7%) |
| $25,000 to $29,999 | 52 (10.9%) | 39 (8.9%) |
| $30,000 to $34,999 | 29 (6.1%) | 62 (14.1%) |
| $35,000 to $39,999 | 25 (5.2%) | 94 (21.4%) |
| $40,000 to $44,999 | 27 (5.7%) | 27 (6.1%) |
| $45,000 to $49,999 | 20 (4.2%) | 26 (5.9%) |
| $50,000 to $54,999 | 24 (5.0%) | 4 (0.9%) |
| $55,000 to $64,999 | 52 (10.9%) | 0 (0.0%) |
| $65,000 to $74,999 | 7 (1.5%) | 0 (0.0%) |
| $75,000 to $99,999 | 75 (15.7%) | 16 (3.6%) |
| $100,000+ | 14 (2.9%) | 0 (0.0%) |
| Total | 478 (100.0%) | 439 (100.0%) |
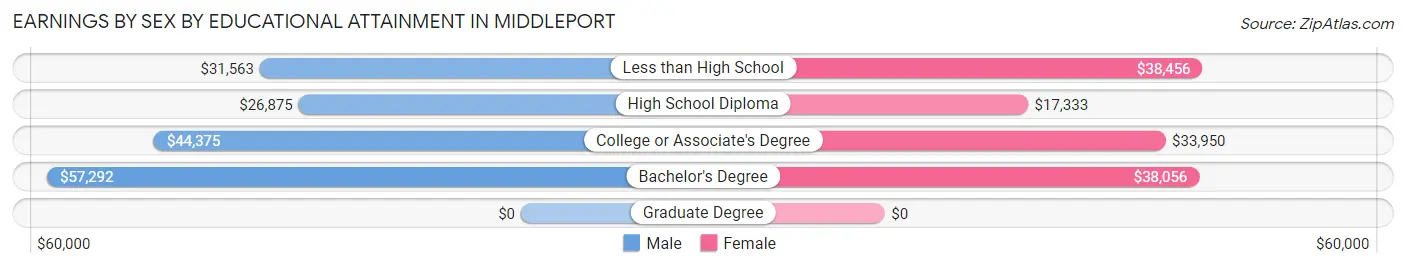
Earnings by Sex by Educational Attainment in Middleport
Average earnings in Middleport are $38,529 for men and $29,000 for women, a difference of 24.7%. Men with an educational attainment of bachelor's degree enjoy the highest average annual earnings of $57,292, while those with high school diploma education earn the least with $26,875. Women with an educational attainment of less than high school earn the most with the average annual earnings of $38,456, while those with high school diploma education have the smallest earnings of $17,333.
| Educational Attainment | Male Income | Female Income |
| Less than High School | $31,563 | $38,456 |
| High School Diploma | $26,875 | $17,333 |
| College or Associate's Degree | $44,375 | $33,950 |
| Bachelor's Degree | $57,292 | $38,056 |
| Graduate Degree | - | - |
| Total | $38,529 | $29,000 |
Family Income in Middleport
Family Income Brackets in Middleport
According to the Middleport family income data, there are 146 families falling into the $35,000 to $49,999 income range, which is the most common income bracket and makes up 30.4% of all families.
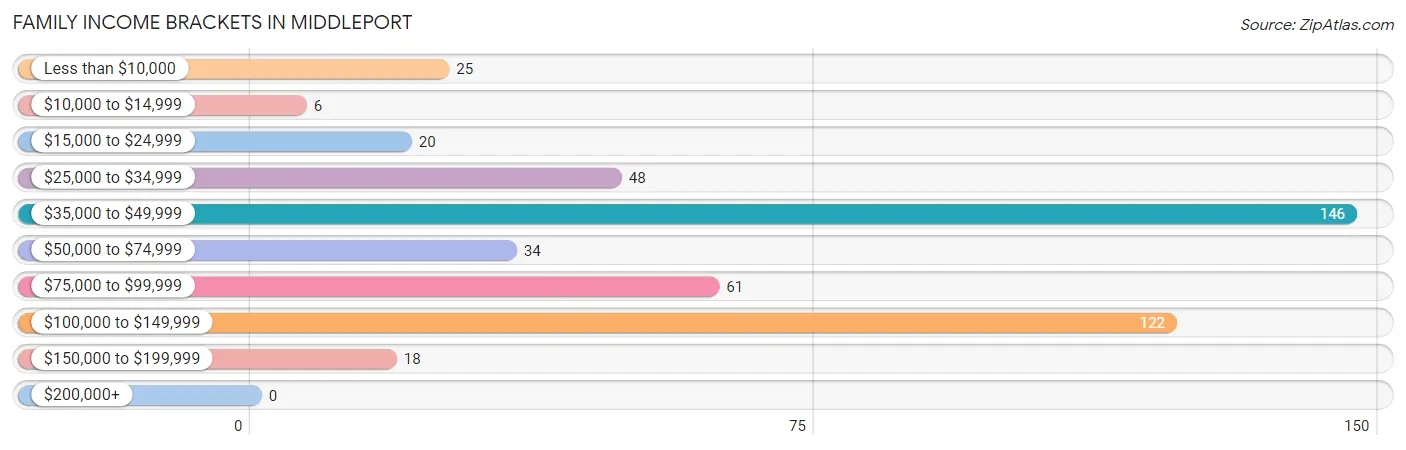
| Income Bracket | # Families | % Families |
| Less than $10,000 | 25 | 5.2% |
| $10,000 to $14,999 | 6 | 1.3% |
| $15,000 to $24,999 | 20 | 4.2% |
| $25,000 to $34,999 | 48 | 10.0% |
| $35,000 to $49,999 | 146 | 30.4% |
| $50,000 to $74,999 | 34 | 7.1% |
| $75,000 to $99,999 | 61 | 12.7% |
| $100,000 to $149,999 | 122 | 25.4% |
| $150,000 to $199,999 | 18 | 3.8% |
| $200,000+ | 0 | 0.0% |
Family Income by Famaliy Size in Middleport
3-person families (72 | 15.0%) account for the highest median family income in Middleport with $79,167 per family, while 3-person families (72 | 15.0%) have the highest median income of $26,389 per family member.
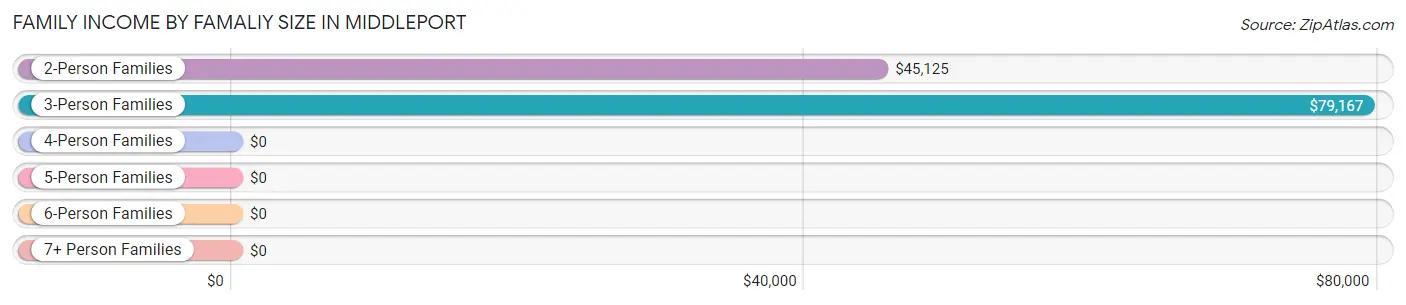
| Income Bracket | # Families | Median Income |
| 2-Person Families | 321 (66.9%) | $45,125 |
| 3-Person Families | 72 (15.0%) | $79,167 |
| 4-Person Families | 70 (14.6%) | $0 |
| 5-Person Families | 6 (1.3%) | $0 |
| 6-Person Families | 6 (1.3%) | $0 |
| 7+ Person Families | 5 (1.0%) | $0 |
| Total | 480 (100.0%) | $47,917 |
Family Income by Number of Earners in Middleport
The median family income in Middleport is $47,917, with families comprising 3+ earners (24) having the highest median family income of $116,875, while families with no earners (67) have the lowest median family income of $25,250, accounting for 5.0% and 14.0% of families, respectively.
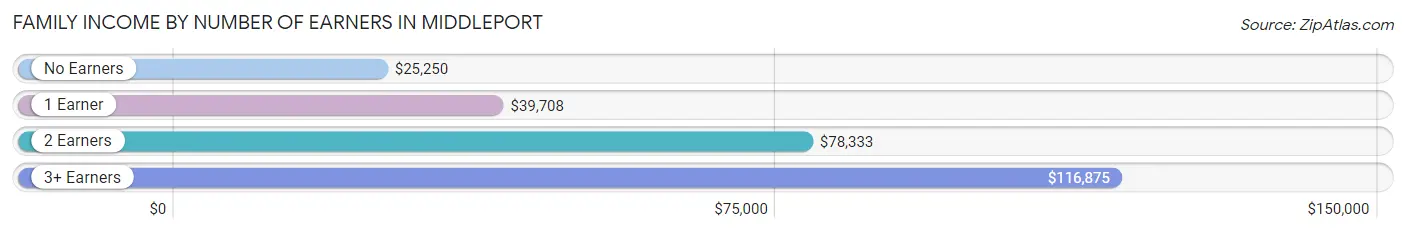
| Number of Earners | # Families | Median Income |
| No Earners | 67 (14.0%) | $25,250 |
| 1 Earner | 223 (46.5%) | $39,708 |
| 2 Earners | 166 (34.6%) | $78,333 |
| 3+ Earners | 24 (5.0%) | $116,875 |
| Total | 480 (100.0%) | $47,917 |
Household Income in Middleport
Household Income Brackets in Middleport
With 177 households falling in the category, the $35,000 to $49,999 income range is the most frequent in Middleport, accounting for 19.0% of all households.
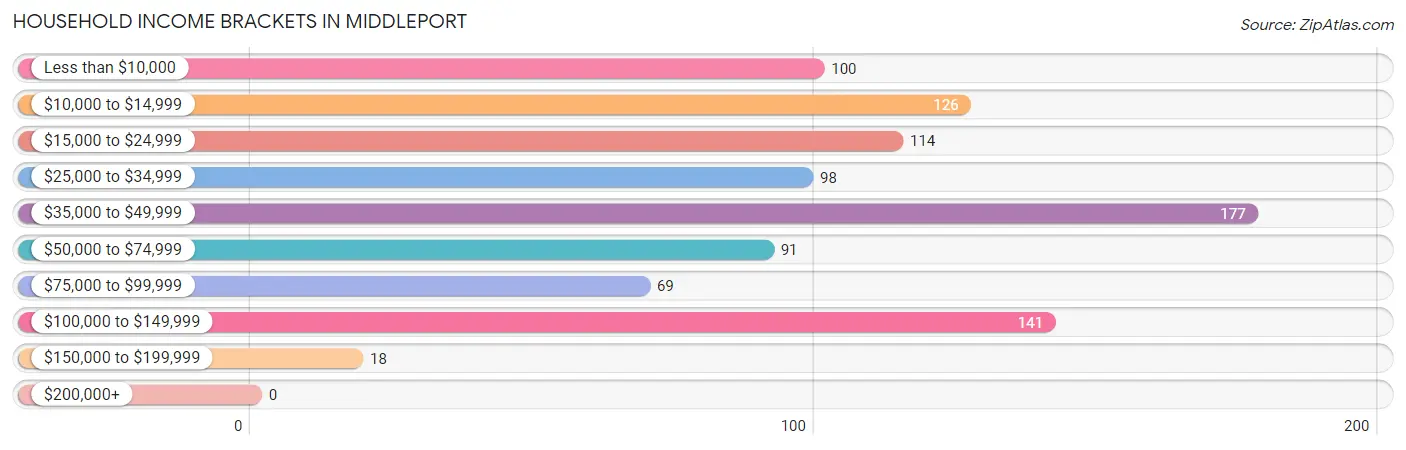
| Income Bracket | # Households | % Households |
| Less than $10,000 | 100 | 10.7% |
| $10,000 to $14,999 | 126 | 13.5% |
| $15,000 to $24,999 | 114 | 12.2% |
| $25,000 to $34,999 | 98 | 10.5% |
| $35,000 to $49,999 | 177 | 19.0% |
| $50,000 to $74,999 | 91 | 9.7% |
| $75,000 to $99,999 | 69 | 7.4% |
| $100,000 to $149,999 | 141 | 15.1% |
| $150,000 to $199,999 | 18 | 1.9% |
| $200,000+ | 0 | 0.0% |
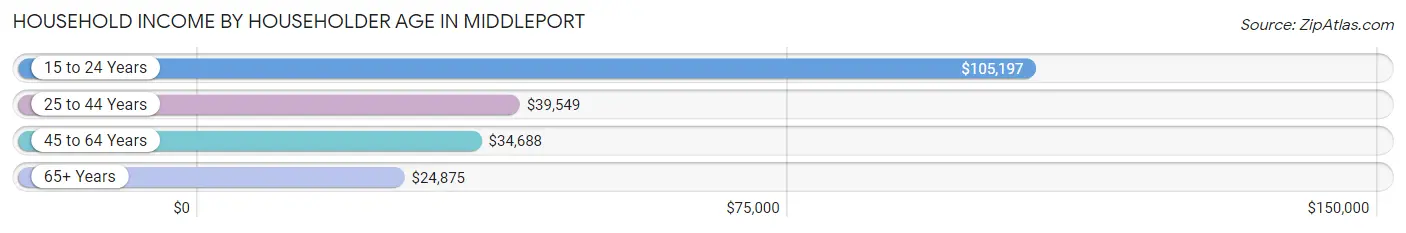
Household Income by Householder Age in Middleport
The median household income in Middleport is $36,343, with the highest median household income of $105,197 found in the 15 to 24 years age bracket for the primary householder. A total of 35 households (3.7%) fall into this category. Meanwhile, the 65+ years age bracket for the primary householder has the lowest median household income of $24,875, with 265 households (28.4%) in this group.
| Income Bracket | # Households | Median Income |
| 15 to 24 Years | 35 (3.7%) | $105,197 |
| 25 to 44 Years | 257 (27.5%) | $39,549 |
| 45 to 64 Years | 377 (40.4%) | $34,688 |
| 65+ Years | 265 (28.4%) | $24,875 |
| Total | 934 (100.0%) | $36,343 |
Poverty in Middleport
Income Below Poverty by Sex and Age in Middleport
With 22.6% poverty level for males and 20.8% for females among the residents of Middleport, 16 and 17 year old males and 5 year old females are the most vulnerable to poverty, with 16 males (100.0%) and 5 females (100.0%) in their respective age groups living below the poverty level.
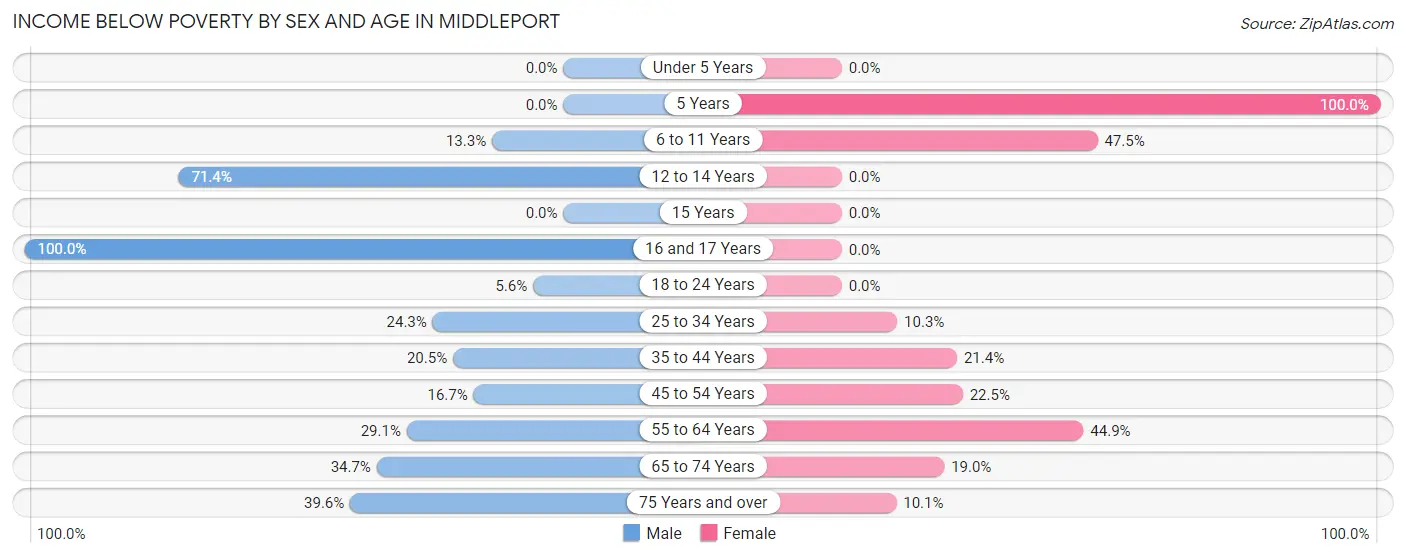
| Age Bracket | Male | Female |
| Under 5 Years | 0 (0.0%) | 0 (0.0%) |
| 5 Years | 0 (0.0%) | 5 (100.0%) |
| 6 to 11 Years | 20 (13.3%) | 28 (47.5%) |
| 12 to 14 Years | 15 (71.4%) | 0 (0.0%) |
| 15 Years | 0 (0.0%) | 0 (0.0%) |
| 16 and 17 Years | 16 (100.0%) | 0 (0.0%) |
| 18 to 24 Years | 4 (5.6%) | 0 (0.0%) |
| 25 to 34 Years | 25 (24.3%) | 11 (10.3%) |
| 35 to 44 Years | 25 (20.5%) | 34 (21.4%) |
| 45 to 54 Years | 22 (16.7%) | 22 (22.5%) |
| 55 to 64 Years | 50 (29.1%) | 61 (44.9%) |
| 65 to 74 Years | 35 (34.6%) | 23 (19.0%) |
| 75 Years and over | 19 (39.6%) | 9 (10.1%) |
| Total | 231 (22.6%) | 193 (20.8%) |
Income Above Poverty by Sex and Age in Middleport
According to the poverty statistics in Middleport, males aged under 5 years and females aged under 5 years are the age groups that are most secure financially, with 100.0% of males and 100.0% of females in these age groups living above the poverty line.
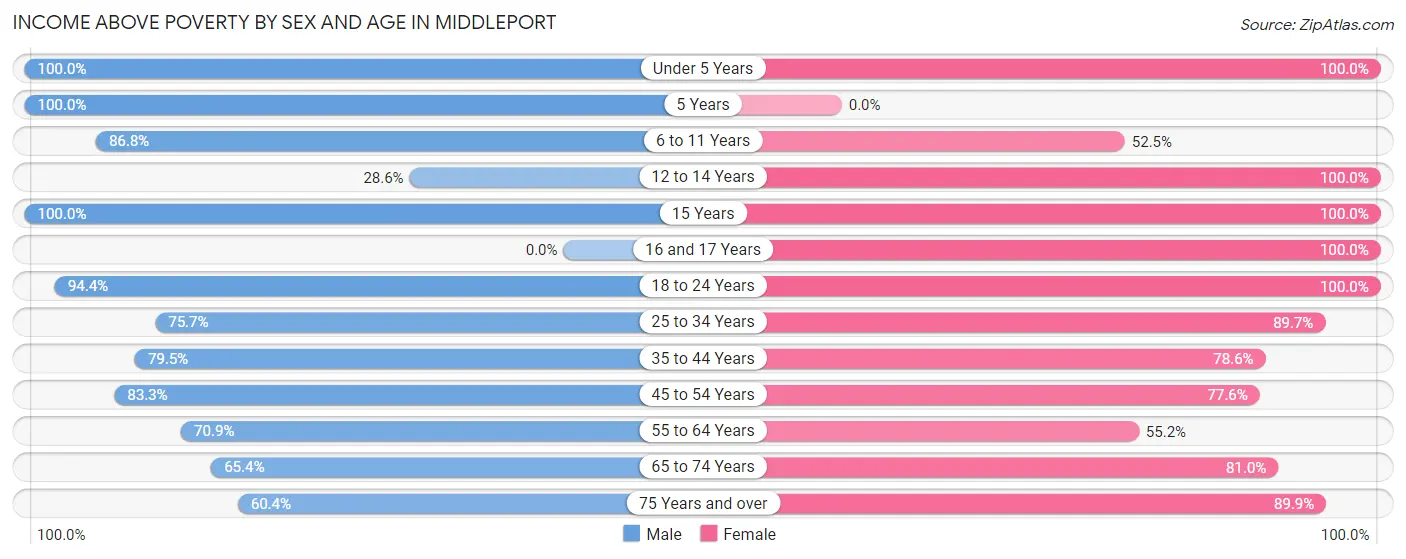
| Age Bracket | Male | Female |
| Under 5 Years | 51 (100.0%) | 41 (100.0%) |
| 5 Years | 3 (100.0%) | 0 (0.0%) |
| 6 to 11 Years | 131 (86.8%) | 31 (52.5%) |
| 12 to 14 Years | 6 (28.6%) | 21 (100.0%) |
| 15 Years | 30 (100.0%) | 3 (100.0%) |
| 16 and 17 Years | 0 (0.0%) | 39 (100.0%) |
| 18 to 24 Years | 67 (94.4%) | 49 (100.0%) |
| 25 to 34 Years | 78 (75.7%) | 96 (89.7%) |
| 35 to 44 Years | 97 (79.5%) | 125 (78.6%) |
| 45 to 54 Years | 110 (83.3%) | 76 (77.5%) |
| 55 to 64 Years | 122 (70.9%) | 75 (55.1%) |
| 65 to 74 Years | 66 (65.3%) | 98 (81.0%) |
| 75 Years and over | 29 (60.4%) | 80 (89.9%) |
| Total | 790 (77.4%) | 734 (79.2%) |
Income Below Poverty Among Married-Couple Families in Middleport
The poverty statistics for married-couple families in Middleport show that 6.7% or 19 of the total 283 families live below the poverty line. Families with no children have the highest poverty rate of 8.8%, comprising of 19 families. On the other hand, families with 1 or 2 children have the lowest poverty rate of 0.0%, which includes 0 families.
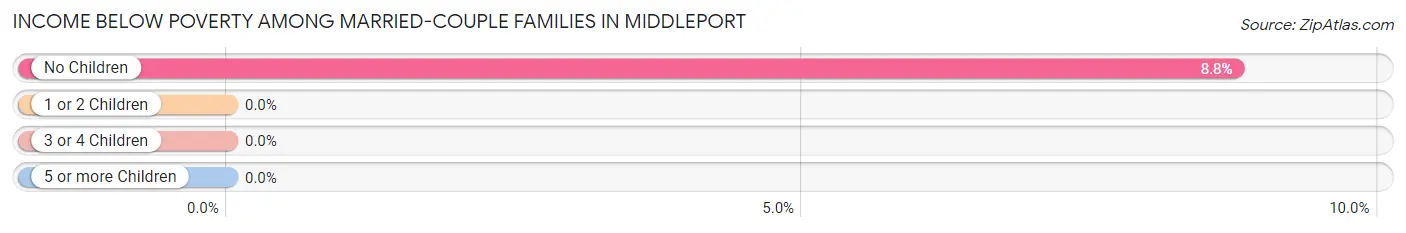
| Children | Above Poverty | Below Poverty |
| No Children | 198 (91.2%) | 19 (8.8%) |
| 1 or 2 Children | 54 (100.0%) | 0 (0.0%) |
| 3 or 4 Children | 12 (100.0%) | 0 (0.0%) |
| 5 or more Children | 0 (0.0%) | 0 (0.0%) |
| Total | 264 (93.3%) | 19 (6.7%) |
Income Below Poverty Among Single-Parent Households in Middleport
According to the poverty data in Middleport, 15.0% or 9 single-father households and 12.4% or 17 single-mother households are living below the poverty line. Among single-father households, those with 5 or more children have the highest poverty rate, with 5 households (100.0%) experiencing poverty. Likewise, among single-mother households, those with no children have the highest poverty rate, with 8 households (23.5%) falling below the poverty line.
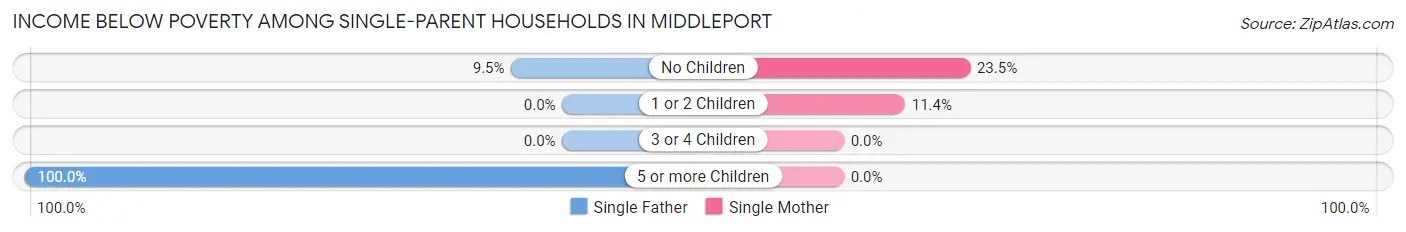
| Children | Single Father | Single Mother |
| No Children | 4 (9.5%) | 8 (23.5%) |
| 1 or 2 Children | 0 (0.0%) | 9 (11.4%) |
| 3 or 4 Children | 0 (0.0%) | 0 (0.0%) |
| 5 or more Children | 5 (100.0%) | 0 (0.0%) |
| Total | 9 (15.0%) | 17 (12.4%) |
Income Below Poverty Among Married-Couple vs Single-Parent Households in Middleport
The poverty data for Middleport shows that 19 of the married-couple family households (6.7%) and 26 of the single-parent households (13.2%) are living below the poverty level. Within the married-couple family households, those with no children have the highest poverty rate, with 19 households (8.8%) falling below the poverty line. Among the single-parent households, those with 5 or more children have the highest poverty rate, with 5 household (100.0%) living below poverty.
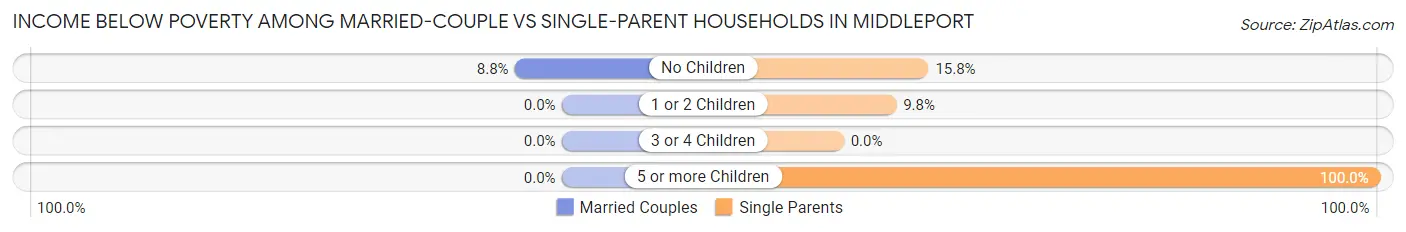
| Children | Married-Couple Families | Single-Parent Households |
| No Children | 19 (8.8%) | 12 (15.8%) |
| 1 or 2 Children | 0 (0.0%) | 9 (9.8%) |
| 3 or 4 Children | 0 (0.0%) | 0 (0.0%) |
| 5 or more Children | 0 (0.0%) | 5 (100.0%) |
| Total | 19 (6.7%) | 26 (13.2%) |
Race in Middleport
The most populous races in Middleport are White / Caucasian (1,856 | 90.4%), Two or more Races (152 | 7.4%), and Black / African American (45 | 2.2%).
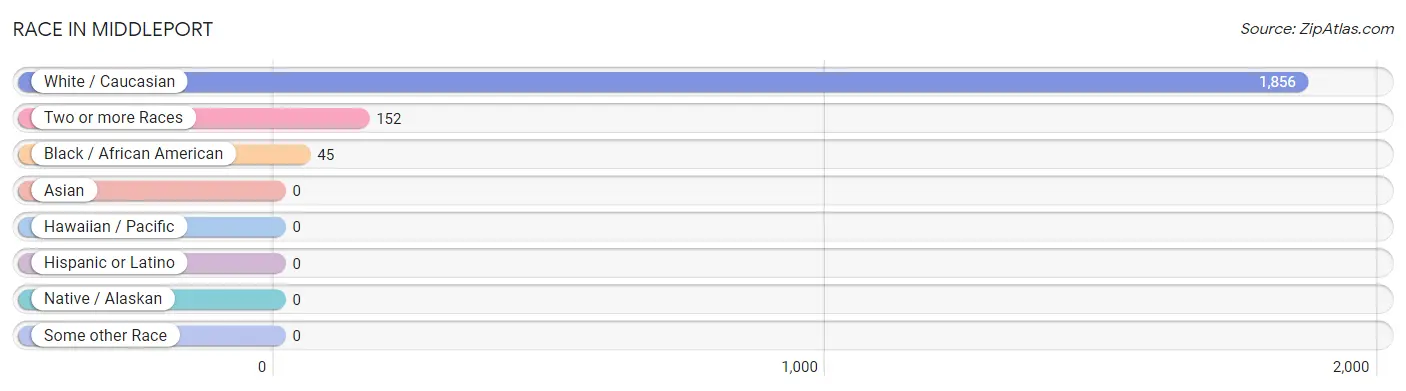
| Race | # Population | % Population |
| Asian | 0 | 0.0% |
| Black / African American | 45 | 2.2% |
| Hawaiian / Pacific | 0 | 0.0% |
| Hispanic or Latino | 0 | 0.0% |
| Native / Alaskan | 0 | 0.0% |
| White / Caucasian | 1,856 | 90.4% |
| Two or more Races | 152 | 7.4% |
| Some other Race | 0 | 0.0% |
| Total | 2,053 | 100.0% |
Ancestry in Middleport
The most populous ancestries reported in Middleport are German (236 | 11.5%), English (143 | 7.0%), Irish (116 | 5.7%), Italian (110 | 5.4%), and American (99 | 4.8%), together accounting for 34.3% of all Middleport residents.
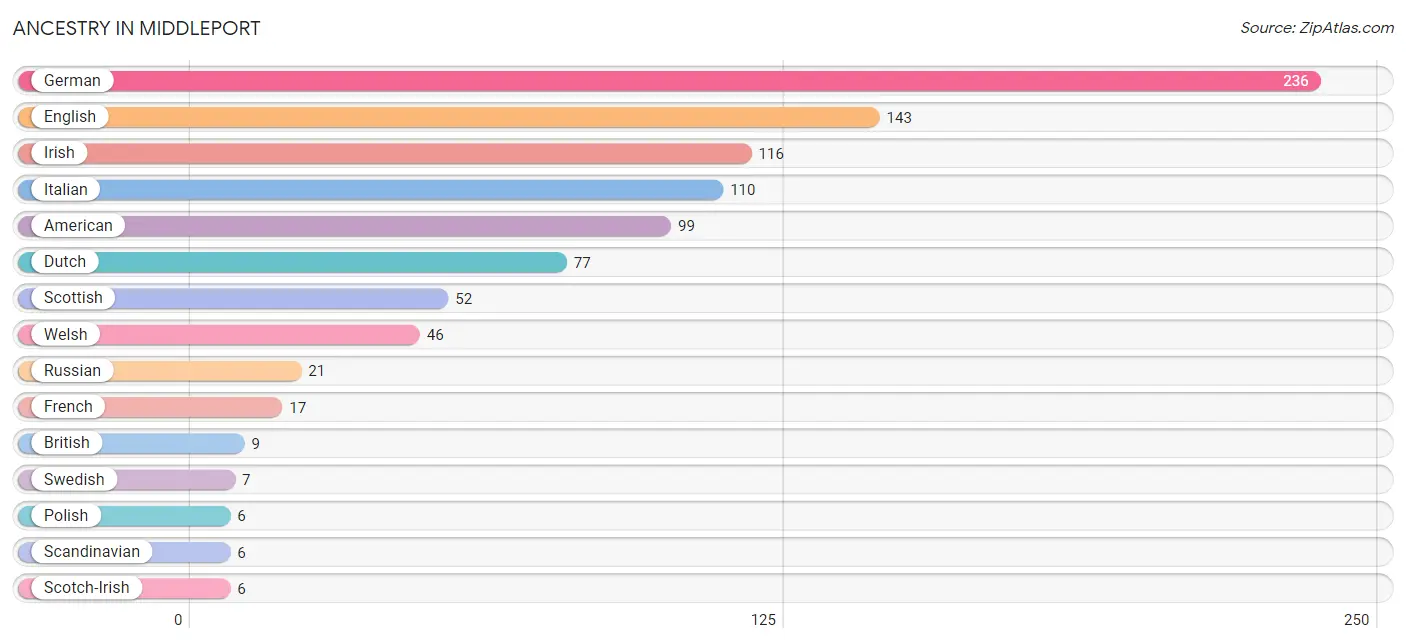
| Ancestry | # Population | % Population |
| American | 99 | 4.8% |
| British | 9 | 0.4% |
| Czech | 5 | 0.2% |
| Dutch | 77 | 3.7% |
| English | 143 | 7.0% |
| French | 17 | 0.8% |
| German | 236 | 11.5% |
| Irish | 116 | 5.7% |
| Italian | 110 | 5.4% |
| Pennsylvania German | 4 | 0.2% |
| Polish | 6 | 0.3% |
| Russian | 21 | 1.0% |
| Scandinavian | 6 | 0.3% |
| Scotch-Irish | 6 | 0.3% |
| Scottish | 52 | 2.5% |
| Swedish | 7 | 0.3% |
| Ukrainian | 6 | 0.3% |
| Welsh | 46 | 2.2% | View All 18 Rows |
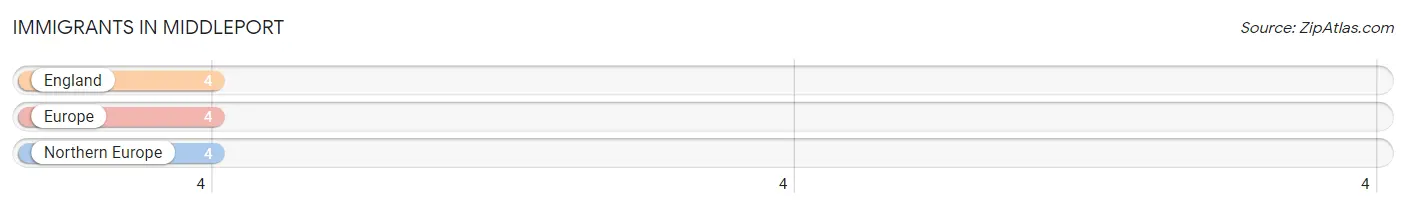
Immigrants in Middleport
The most numerous immigrant groups reported in Middleport came from England (4 | 0.2%), Europe (4 | 0.2%), and Northern Europe (4 | 0.2%), together accounting for 0.6% of all Middleport residents.
| Immigration Origin | # Population | % Population |
| England | 4 | 0.2% |
| Europe | 4 | 0.2% |
| Northern Europe | 4 | 0.2% | View All 3 Rows |
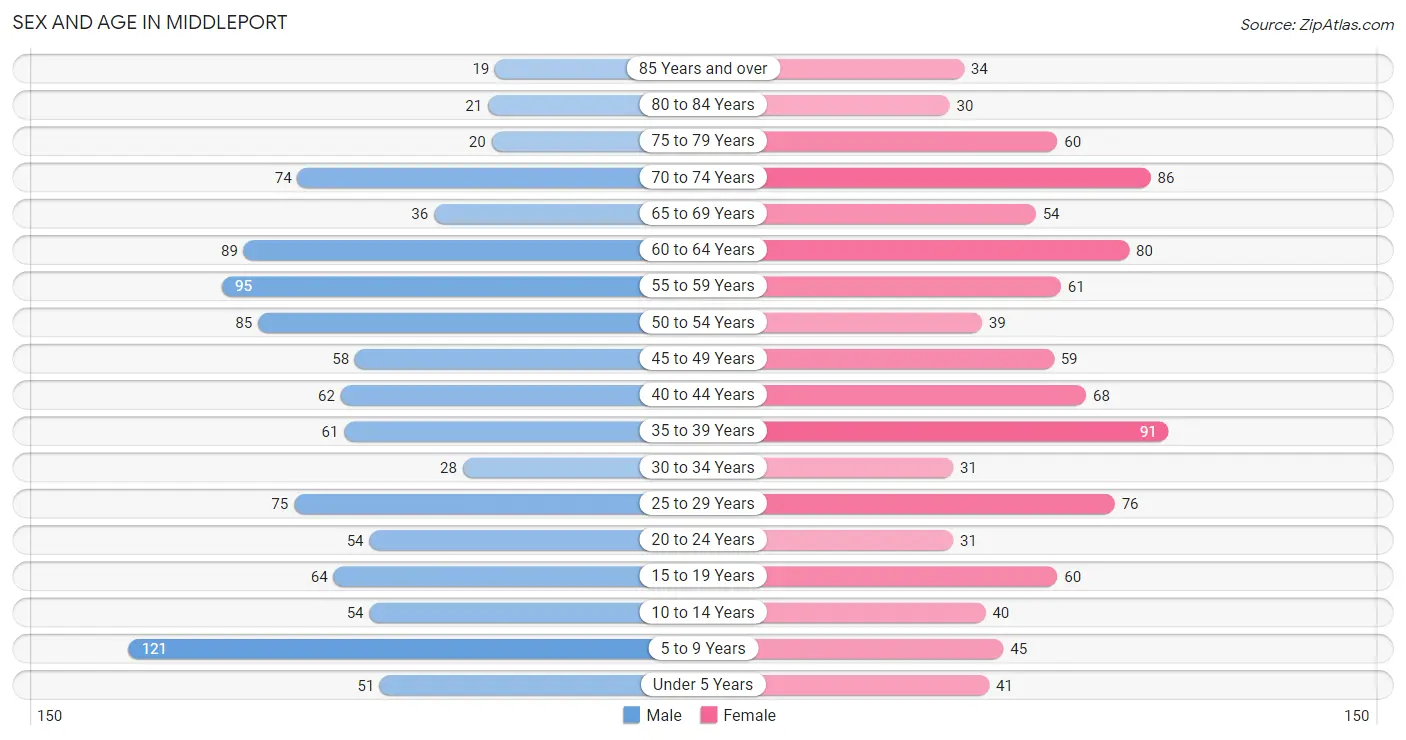
Sex and Age in Middleport
Sex and Age in Middleport
The most populous age groups in Middleport are 5 to 9 Years (121 | 11.3%) for men and 35 to 39 Years (91 | 9.2%) for women.
| Age Bracket | Male | Female |
| Under 5 Years | 51 (4.8%) | 41 (4.2%) |
| 5 to 9 Years | 121 (11.3%) | 45 (4.6%) |
| 10 to 14 Years | 54 (5.1%) | 40 (4.1%) |
| 15 to 19 Years | 64 (6.0%) | 60 (6.1%) |
| 20 to 24 Years | 54 (5.1%) | 31 (3.1%) |
| 25 to 29 Years | 75 (7.0%) | 76 (7.7%) |
| 30 to 34 Years | 28 (2.6%) | 31 (3.1%) |
| 35 to 39 Years | 61 (5.7%) | 91 (9.2%) |
| 40 to 44 Years | 62 (5.8%) | 68 (6.9%) |
| 45 to 49 Years | 58 (5.4%) | 59 (6.0%) |
| 50 to 54 Years | 85 (8.0%) | 39 (4.0%) |
| 55 to 59 Years | 95 (8.9%) | 61 (6.2%) |
| 60 to 64 Years | 89 (8.3%) | 80 (8.1%) |
| 65 to 69 Years | 36 (3.4%) | 54 (5.5%) |
| 70 to 74 Years | 74 (6.9%) | 86 (8.7%) |
| 75 to 79 Years | 20 (1.9%) | 60 (6.1%) |
| 80 to 84 Years | 21 (2.0%) | 30 (3.0%) |
| 85 Years and over | 19 (1.8%) | 34 (3.5%) |
| Total | 1,067 (100.0%) | 986 (100.0%) |
Families and Households in Middleport
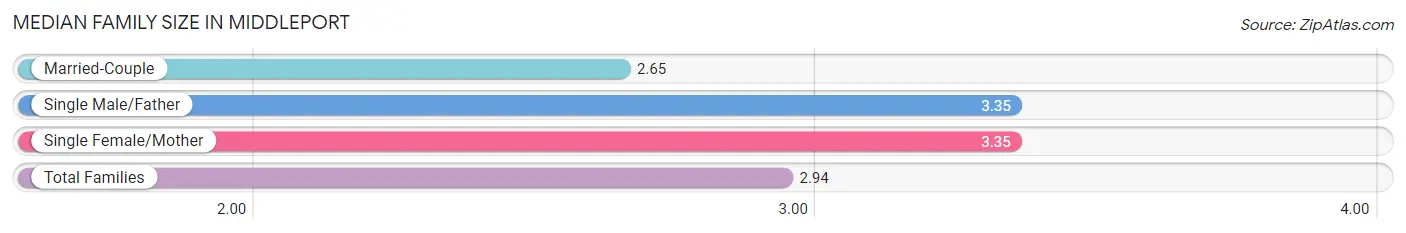
Median Family Size in Middleport
The median family size in Middleport is 2.94 persons per family, with single male/father families (60 | 12.5%) accounting for the largest median family size of 3.35 persons per family. On the other hand, married-couple families (283 | 59.0%) represent the smallest median family size with 2.65 persons per family.
| Family Type | # Families | Family Size |
| Married-Couple | 283 (59.0%) | 2.65 |
| Single Male/Father | 60 (12.5%) | 3.35 |
| Single Female/Mother | 137 (28.5%) | 3.35 |
| Total Families | 480 (100.0%) | 2.94 |
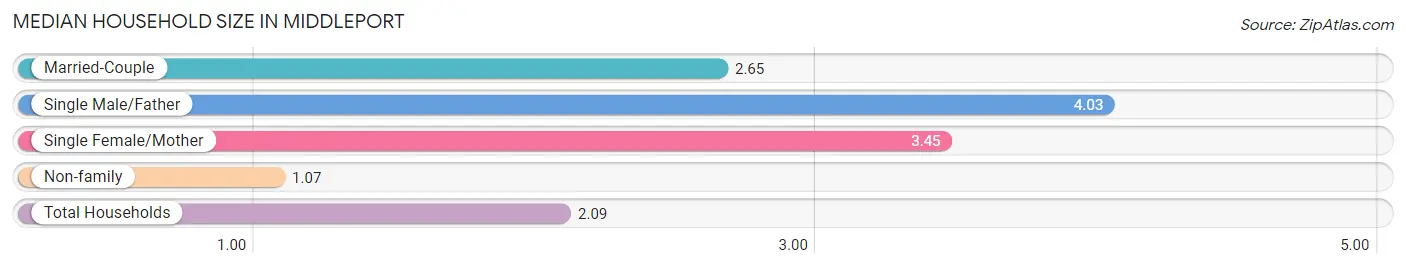
Median Household Size in Middleport
The median household size in Middleport is 2.09 persons per household, with single male/father households (60 | 6.4%) accounting for the largest median household size of 4.03 persons per household. non-family households (454 | 48.6%) represent the smallest median household size with 1.07 persons per household.
| Household Type | # Households | Household Size |
| Married-Couple | 283 (30.3%) | 2.65 |
| Single Male/Father | 60 (6.4%) | 4.03 |
| Single Female/Mother | 137 (14.7%) | 3.45 |
| Non-family | 454 (48.6%) | 1.07 |
| Total Households | 934 (100.0%) | 2.09 |
Household Size by Marriage Status in Middleport
Out of a total of 934 households in Middleport, 480 (51.4%) are family households, while 454 (48.6%) are nonfamily households. The most numerous type of family households are 2-person households, comprising 272, and the most common type of nonfamily households are 1-person households, comprising 427.
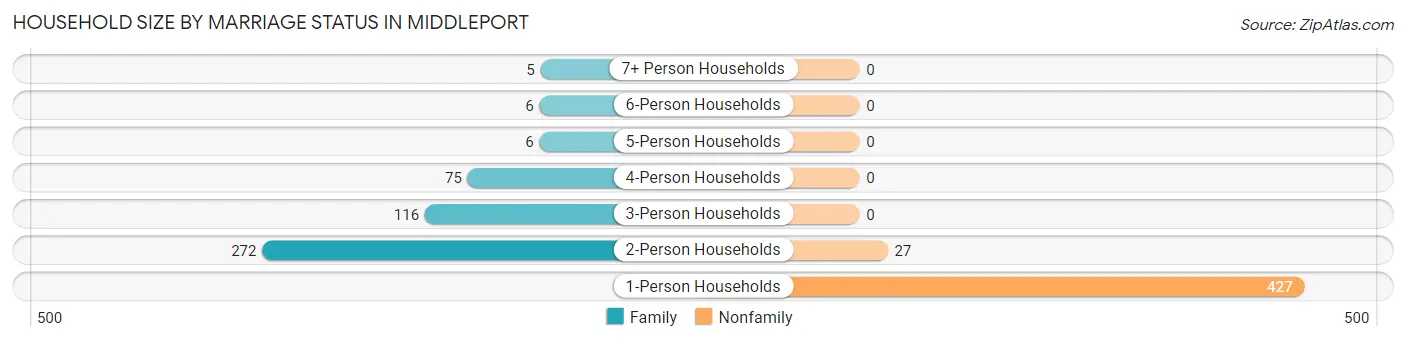
| Household Size | Family Households | Nonfamily Households |
| 1-Person Households | - | 427 (45.7%) |
| 2-Person Households | 272 (29.1%) | 27 (2.9%) |
| 3-Person Households | 116 (12.4%) | 0 (0.0%) |
| 4-Person Households | 75 (8.0%) | 0 (0.0%) |
| 5-Person Households | 6 (0.6%) | 0 (0.0%) |
| 6-Person Households | 6 (0.6%) | 0 (0.0%) |
| 7+ Person Households | 5 (0.5%) | 0 (0.0%) |
| Total | 480 (51.4%) | 454 (48.6%) |
Female Fertility in Middleport
Fertility by Age in Middleport
Average fertility rate in Middleport is 33.0 births per 1,000 women. Women in the age bracket of 20 to 34 years have the highest fertility rate with 101.0 births per 1,000 women. Women in the age bracket of 20 to 34 years acount for 100.0% of all women with births.
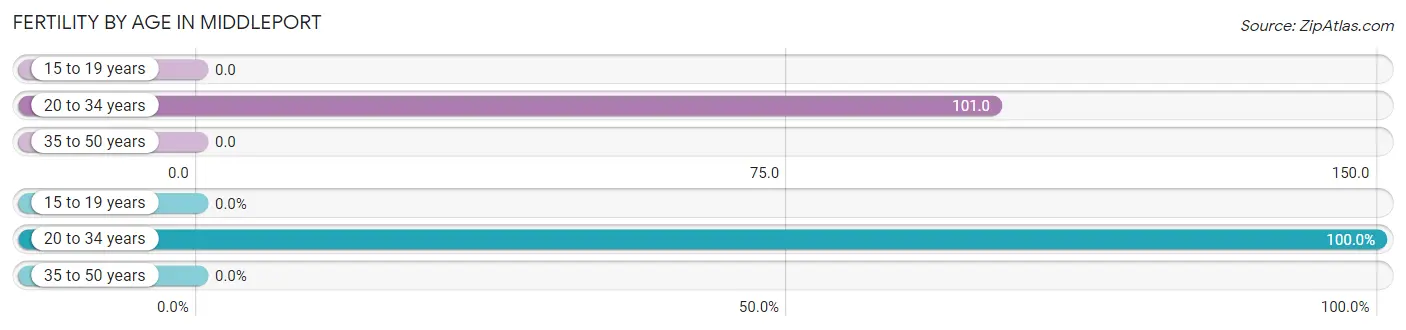
| Age Bracket | Women with Births | Births / 1,000 Women |
| 15 to 19 years | 0 (0.0%) | 0.0 |
| 20 to 34 years | 14 (100.0%) | 101.0 |
| 35 to 50 years | 0 (0.0%) | 0.0 |
| Total | 14 (100.0%) | 33.0 |
Fertility by Age by Marriage Status in Middleport
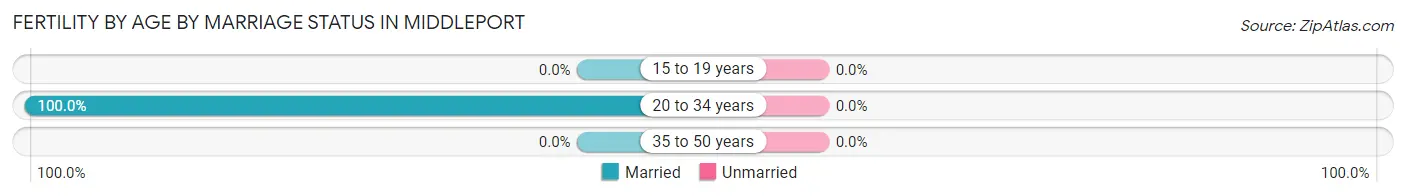
| Age Bracket | Married | Unmarried |
| 15 to 19 years | 0 (0.0%) | 0 (0.0%) |
| 20 to 34 years | 14 (100.0%) | 0 (0.0%) |
| 35 to 50 years | 0 (0.0%) | 0 (0.0%) |
| Total | 14 (100.0%) | 0 (0.0%) |
Fertility by Education in Middleport
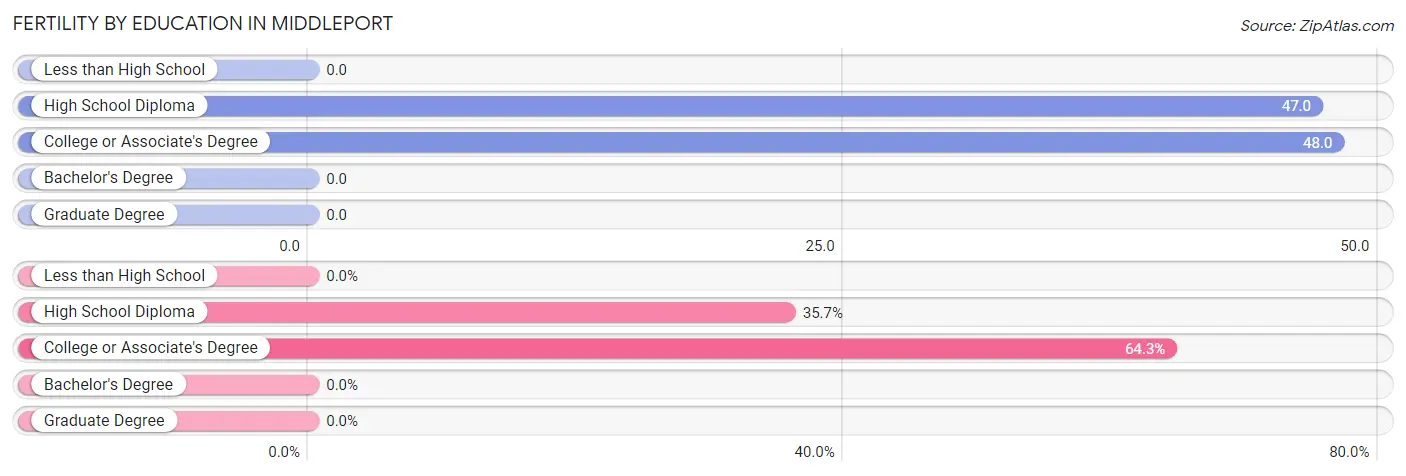
| Educational Attainment | Women with Births | Births / 1,000 Women |
| Less than High School | 0 (0.0%) | 0.0 |
| High School Diploma | 5 (35.7%) | 47.0 |
| College or Associate's Degree | 9 (64.3%) | 48.0 |
| Bachelor's Degree | 0 (0.0%) | 0.0 |
| Graduate Degree | 0 (0.0%) | 0.0 |
| Total | 14 (100.0%) | 33.0 |
Fertility by Education by Marriage Status in Middleport
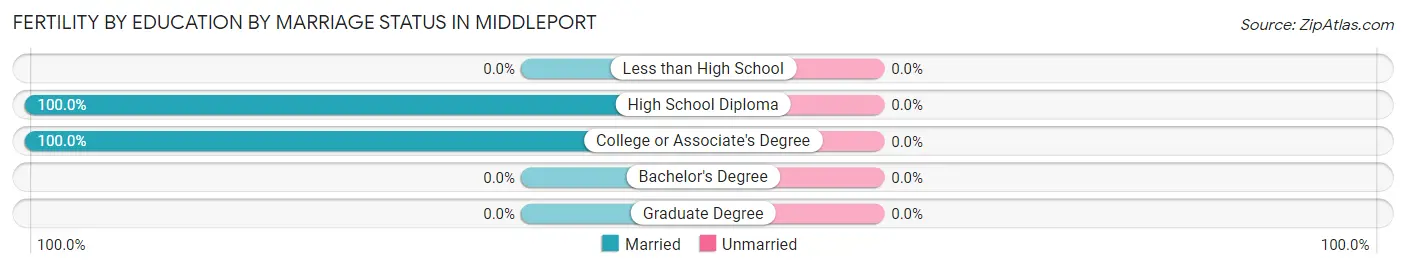
| Educational Attainment | Married | Unmarried |
| Less than High School | 0 (0.0%) | 0 (0.0%) |
| High School Diploma | 5 (100.0%) | 0 (0.0%) |
| College or Associate's Degree | 9 (100.0%) | 0 (0.0%) |
| Bachelor's Degree | 0 (0.0%) | 0 (0.0%) |
| Graduate Degree | 0 (0.0%) | 0 (0.0%) |
| Total | 14 (100.0%) | 0 (0.0%) |
Employment Characteristics in Middleport
Employment by Class of Employer in Middleport
Among the 822 employed individuals in Middleport, private company employees (608 | 74.0%), not-for-profit organizations (75 | 9.1%), and local government employees (53 | 6.5%) make up the most common classes of employment.
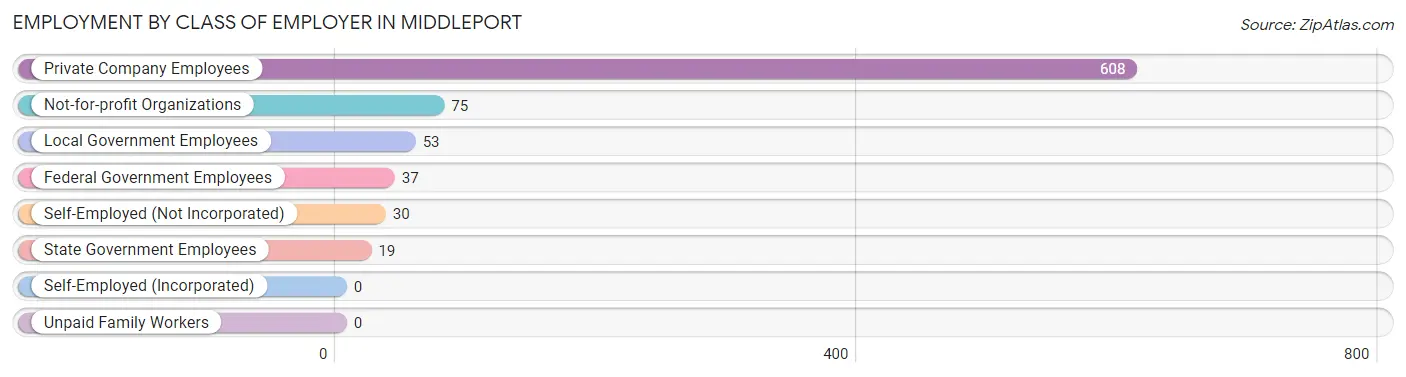
| Employer Class | # Employees | % Employees |
| Private Company Employees | 608 | 74.0% |
| Self-Employed (Incorporated) | 0 | 0.0% |
| Self-Employed (Not Incorporated) | 30 | 3.6% |
| Not-for-profit Organizations | 75 | 9.1% |
| Local Government Employees | 53 | 6.5% |
| State Government Employees | 19 | 2.3% |
| Federal Government Employees | 37 | 4.5% |
| Unpaid Family Workers | 0 | 0.0% |
| Total | 822 | 100.0% |
Employment Status by Age in Middleport
According to the labor force statistics for Middleport, out of the total population over 16 years of age (1,668), 51.9% or 866 individuals are in the labor force, with 2.7% or 23 of them unemployed. The age group with the highest labor force participation rate is 20 to 24 years, with 100.0% or 85 individuals in the labor force. Within the labor force, the 20 to 24 years age range has the highest percentage of unemployed individuals, with 12.9% or 11 of them being unemployed.
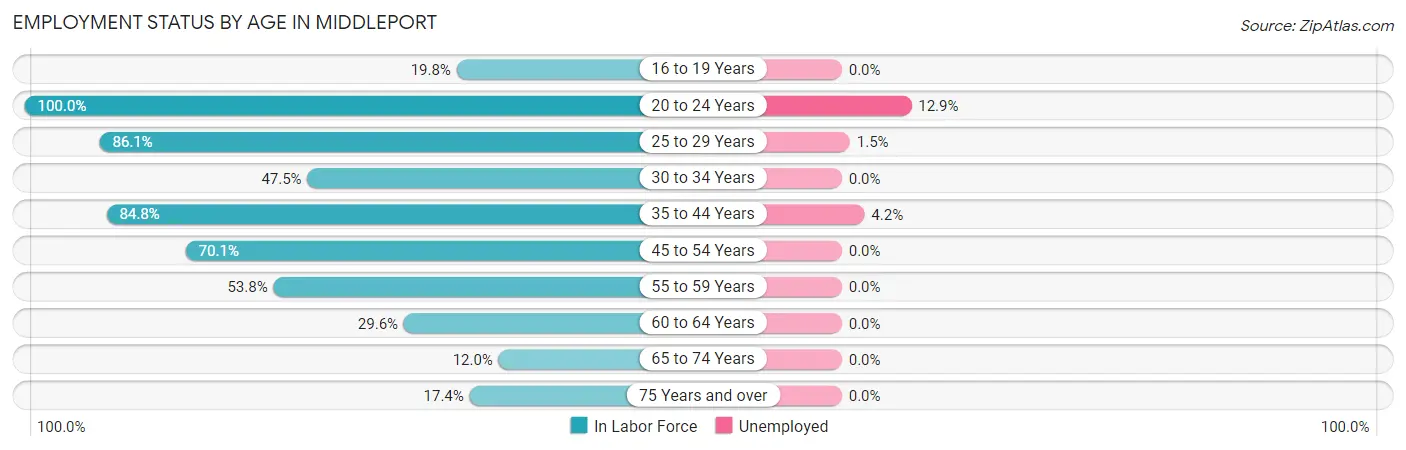
| Age Bracket | In Labor Force | Unemployed |
| 16 to 19 Years | 18 (19.8%) | 0 (0.0%) |
| 20 to 24 Years | 85 (100.0%) | 11 (12.9%) |
| 25 to 29 Years | 130 (86.1%) | 2 (1.5%) |
| 30 to 34 Years | 28 (47.5%) | 0 (0.0%) |
| 35 to 44 Years | 239 (84.8%) | 10 (4.2%) |
| 45 to 54 Years | 169 (70.1%) | 0 (0.0%) |
| 55 to 59 Years | 84 (53.8%) | 0 (0.0%) |
| 60 to 64 Years | 50 (29.6%) | 0 (0.0%) |
| 65 to 74 Years | 30 (12.0%) | 0 (0.0%) |
| 75 Years and over | 32 (17.4%) | 0 (0.0%) |
| Total | 866 (51.9%) | 23 (2.7%) |
Employment Status by Educational Attainment in Middleport
According to labor force statistics for Middleport, 66.2% of individuals (700) out of the total population between 25 and 64 years of age (1,058) are in the labor force, with 1.7% or 12 of them being unemployed. The group with the highest labor force participation rate are those with the educational attainment of bachelor's degree or higher, with 91.0% or 111 individuals in the labor force. Within the labor force, individuals with less than high school education have the highest percentage of unemployment, with 3.6% or 2 of them being unemployed.
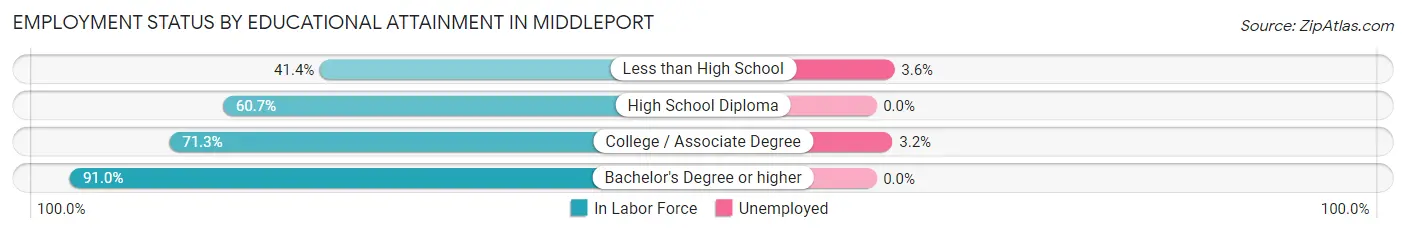
| Educational Attainment | In Labor Force | Unemployed |
| Less than High School | 55 (41.4%) | 5 (3.6%) |
| High School Diploma | 221 (60.7%) | 0 (0.0%) |
| College / Associate Degree | 313 (71.3%) | 14 (3.2%) |
| Bachelor's Degree or higher | 111 (91.0%) | 0 (0.0%) |
| Total | 700 (66.2%) | 18 (1.7%) |
Employment Occupations by Sex in Middleport
Management, Business, Science and Arts Occupations
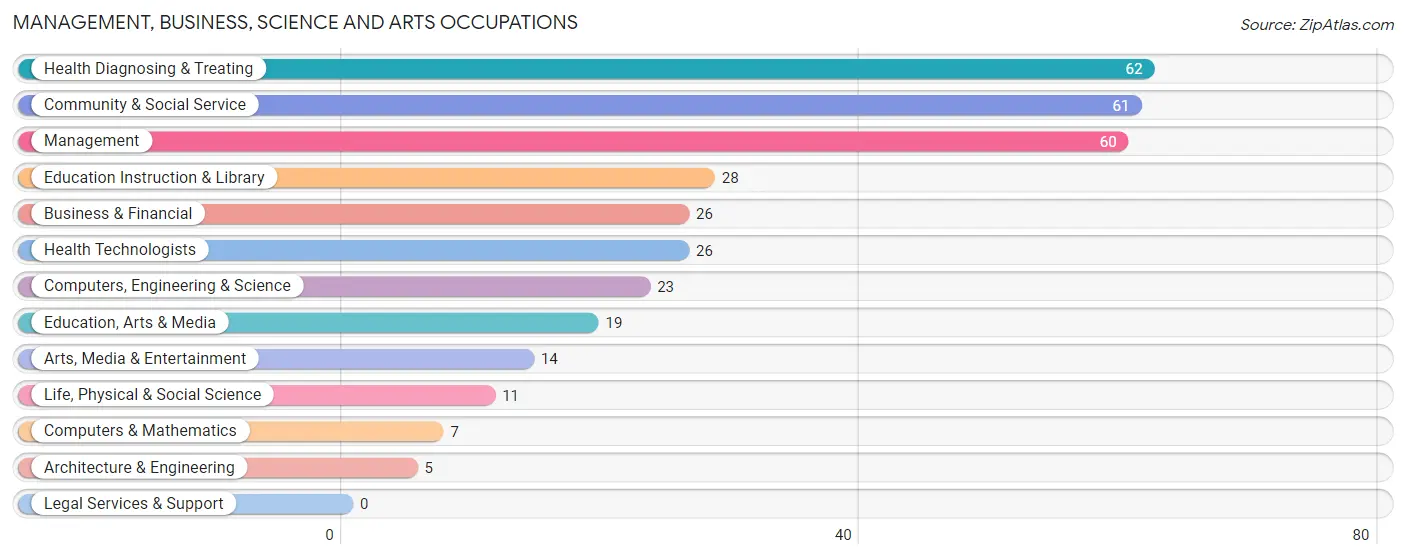
The most common Management, Business, Science and Arts occupations in Middleport are Health Diagnosing & Treating (62 | 7.4%), Community & Social Service (61 | 7.2%), Management (60 | 7.1%), Education Instruction & Library (28 | 3.3%), and Business & Financial (26 | 3.1%).
Management, Business, Science and Arts Occupations by Sex
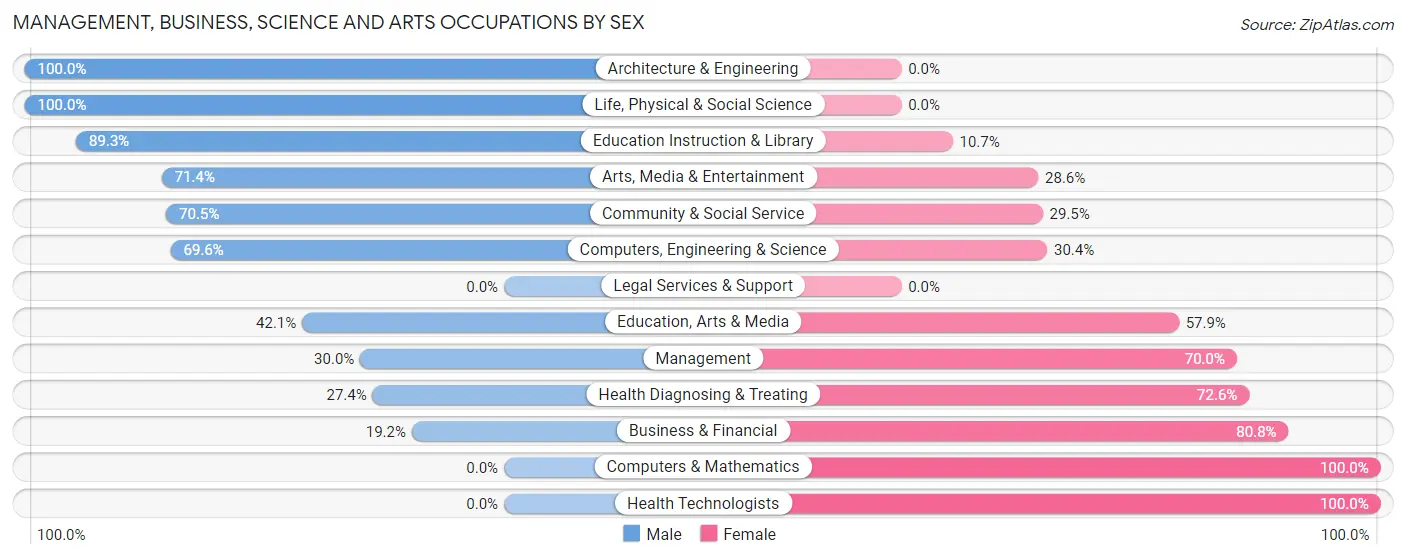
Within the Management, Business, Science and Arts occupations in Middleport, the most male-oriented occupations are Architecture & Engineering (100.0%), Life, Physical & Social Science (100.0%), and Education Instruction & Library (89.3%), while the most female-oriented occupations are Computers & Mathematics (100.0%), Health Technologists (100.0%), and Business & Financial (80.8%).
| Occupation | Male | Female |
| Management | 18 (30.0%) | 42 (70.0%) |
| Business & Financial | 5 (19.2%) | 21 (80.8%) |
| Computers, Engineering & Science | 16 (69.6%) | 7 (30.4%) |
| Computers & Mathematics | 0 (0.0%) | 7 (100.0%) |
| Architecture & Engineering | 5 (100.0%) | 0 (0.0%) |
| Life, Physical & Social Science | 11 (100.0%) | 0 (0.0%) |
| Community & Social Service | 43 (70.5%) | 18 (29.5%) |
| Education, Arts & Media | 8 (42.1%) | 11 (57.9%) |
| Legal Services & Support | 0 (0.0%) | 0 (0.0%) |
| Education Instruction & Library | 25 (89.3%) | 3 (10.7%) |
| Arts, Media & Entertainment | 10 (71.4%) | 4 (28.6%) |
| Health Diagnosing & Treating | 17 (27.4%) | 45 (72.6%) |
| Health Technologists | 0 (0.0%) | 26 (100.0%) |
| Total (Category) | 99 (42.7%) | 133 (57.3%) |
| Total (Overall) | 430 (51.1%) | 412 (48.9%) |
Services Occupations
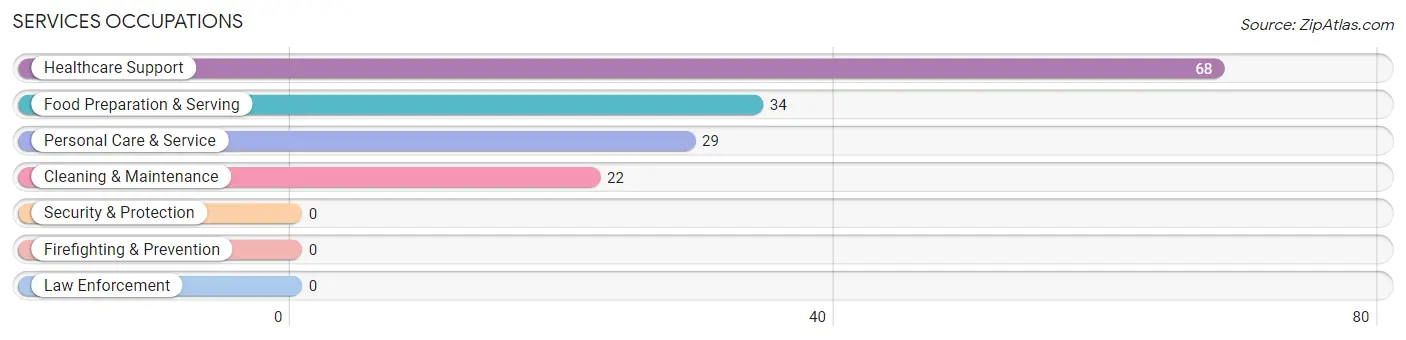
The most common Services occupations in Middleport are Healthcare Support (68 | 8.1%), Food Preparation & Serving (34 | 4.0%), Personal Care & Service (29 | 3.4%), and Cleaning & Maintenance (22 | 2.6%).
Services Occupations by Sex
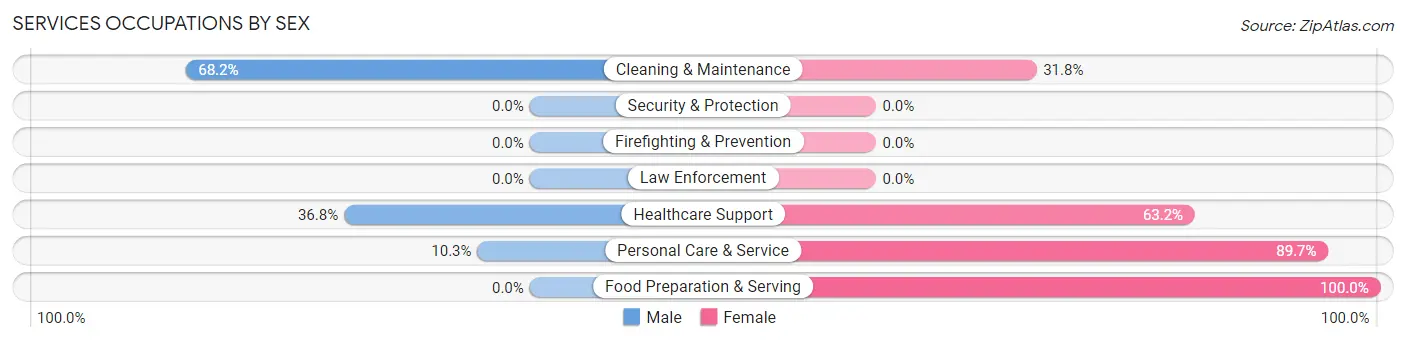
Within the Services occupations in Middleport, the most male-oriented occupations are Cleaning & Maintenance (68.2%), Healthcare Support (36.8%), and Personal Care & Service (10.3%), while the most female-oriented occupations are Food Preparation & Serving (100.0%), Personal Care & Service (89.7%), and Healthcare Support (63.2%).
| Occupation | Male | Female |
| Healthcare Support | 25 (36.8%) | 43 (63.2%) |
| Security & Protection | 0 (0.0%) | 0 (0.0%) |
| Firefighting & Prevention | 0 (0.0%) | 0 (0.0%) |
| Law Enforcement | 0 (0.0%) | 0 (0.0%) |
| Food Preparation & Serving | 0 (0.0%) | 34 (100.0%) |
| Cleaning & Maintenance | 15 (68.2%) | 7 (31.8%) |
| Personal Care & Service | 3 (10.3%) | 26 (89.7%) |
| Total (Category) | 43 (28.1%) | 110 (71.9%) |
| Total (Overall) | 430 (51.1%) | 412 (48.9%) |
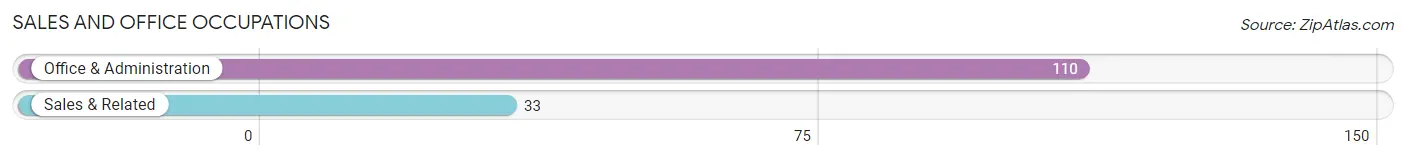
Sales and Office Occupations
The most common Sales and Office occupations in Middleport are Office & Administration (110 | 13.1%), and Sales & Related (33 | 3.9%).
Sales and Office Occupations by Sex
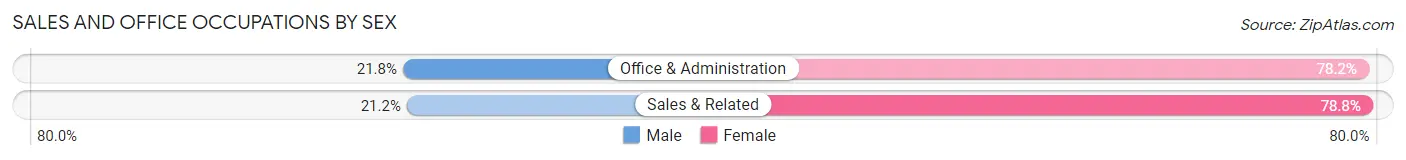
| Occupation | Male | Female |
| Sales & Related | 7 (21.2%) | 26 (78.8%) |
| Office & Administration | 24 (21.8%) | 86 (78.2%) |
| Total (Category) | 31 (21.7%) | 112 (78.3%) |
| Total (Overall) | 430 (51.1%) | 412 (48.9%) |
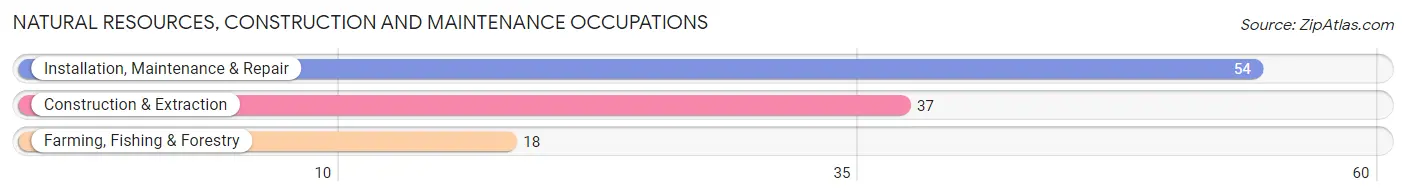
Natural Resources, Construction and Maintenance Occupations
The most common Natural Resources, Construction and Maintenance occupations in Middleport are Installation, Maintenance & Repair (54 | 6.4%), Construction & Extraction (37 | 4.4%), and Farming, Fishing & Forestry (18 | 2.1%).
Natural Resources, Construction and Maintenance Occupations by Sex
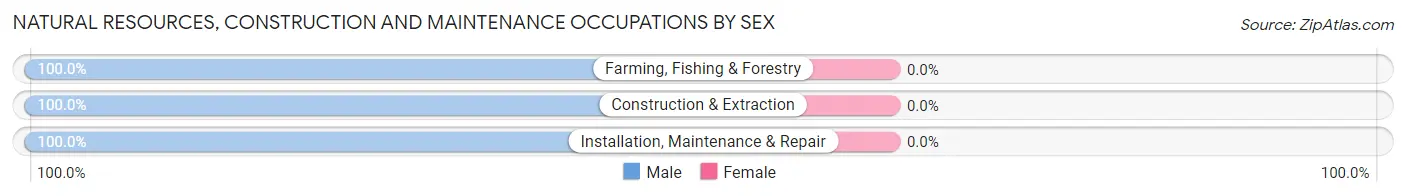
| Occupation | Male | Female |
| Farming, Fishing & Forestry | 18 (100.0%) | 0 (0.0%) |
| Construction & Extraction | 37 (100.0%) | 0 (0.0%) |
| Installation, Maintenance & Repair | 54 (100.0%) | 0 (0.0%) |
| Total (Category) | 109 (100.0%) | 0 (0.0%) |
| Total (Overall) | 430 (51.1%) | 412 (48.9%) |
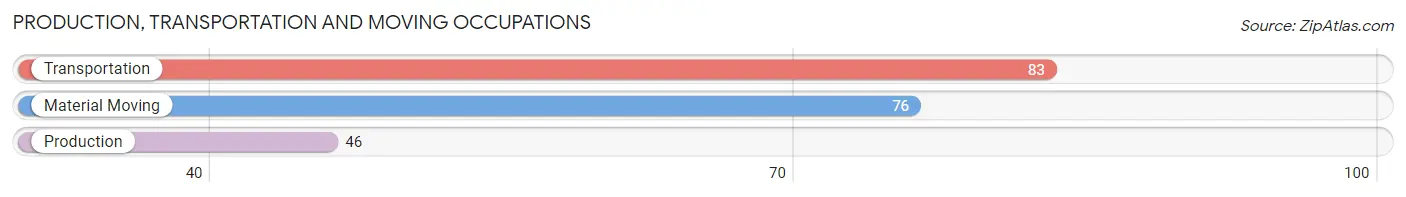
Production, Transportation and Moving Occupations
The most common Production, Transportation and Moving occupations in Middleport are Transportation (83 | 9.9%), Material Moving (76 | 9.0%), and Production (46 | 5.5%).
Production, Transportation and Moving Occupations by Sex
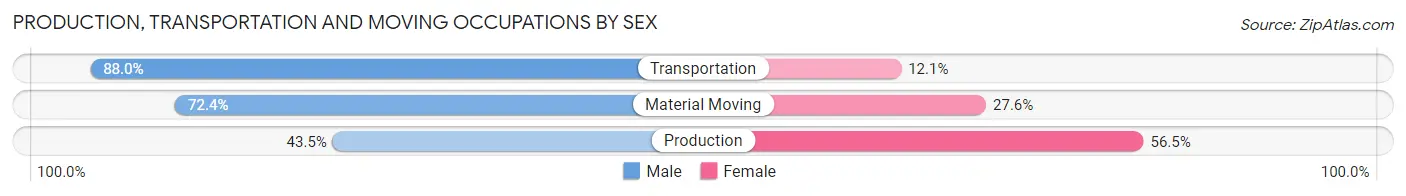
| Occupation | Male | Female |
| Production | 20 (43.5%) | 26 (56.5%) |
| Transportation | 73 (87.9%) | 10 (12.0%) |
| Material Moving | 55 (72.4%) | 21 (27.6%) |
| Total (Category) | 148 (72.2%) | 57 (27.8%) |
| Total (Overall) | 430 (51.1%) | 412 (48.9%) |
Employment Industries by Sex in Middleport
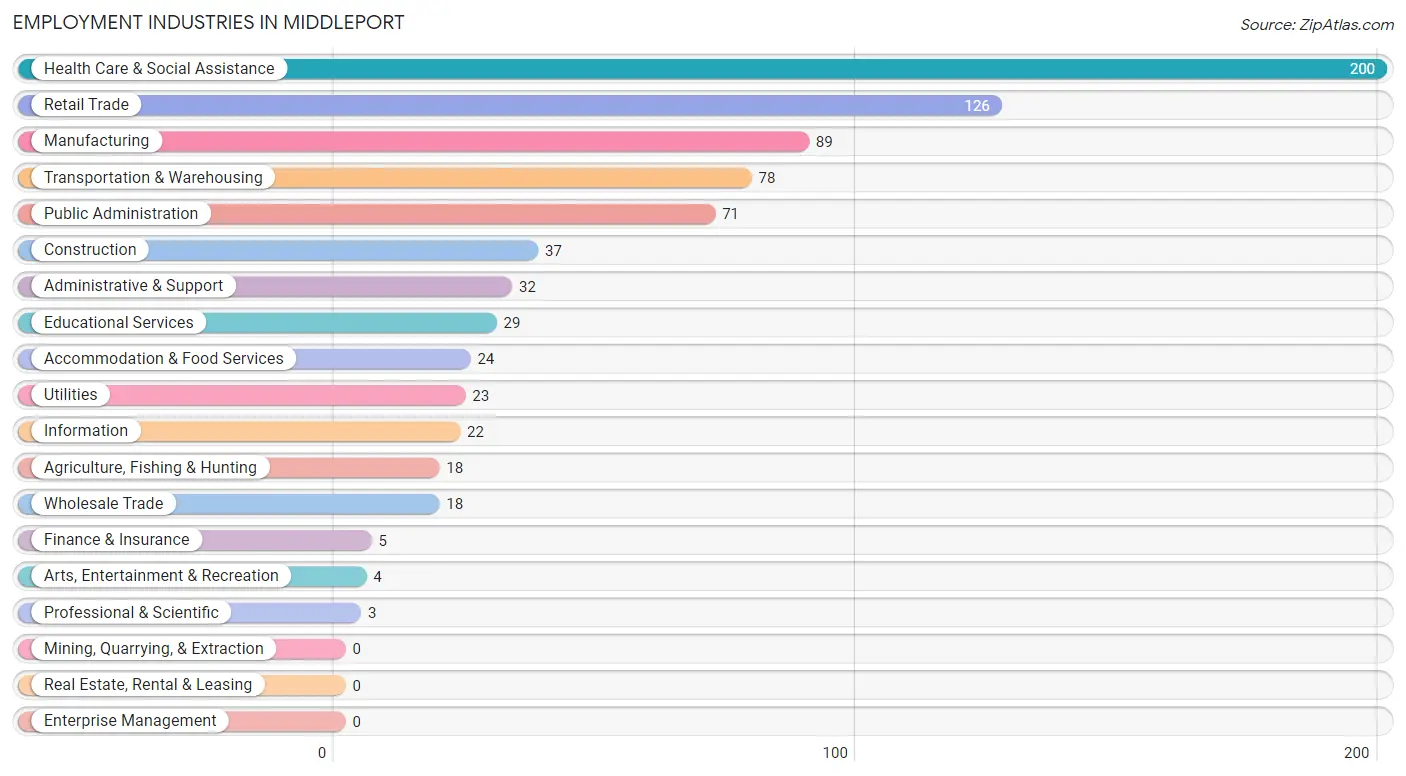
Employment Industries in Middleport
The major employment industries in Middleport include Health Care & Social Assistance (200 | 23.7%), Retail Trade (126 | 15.0%), Manufacturing (89 | 10.6%), Transportation & Warehousing (78 | 9.3%), and Public Administration (71 | 8.4%).
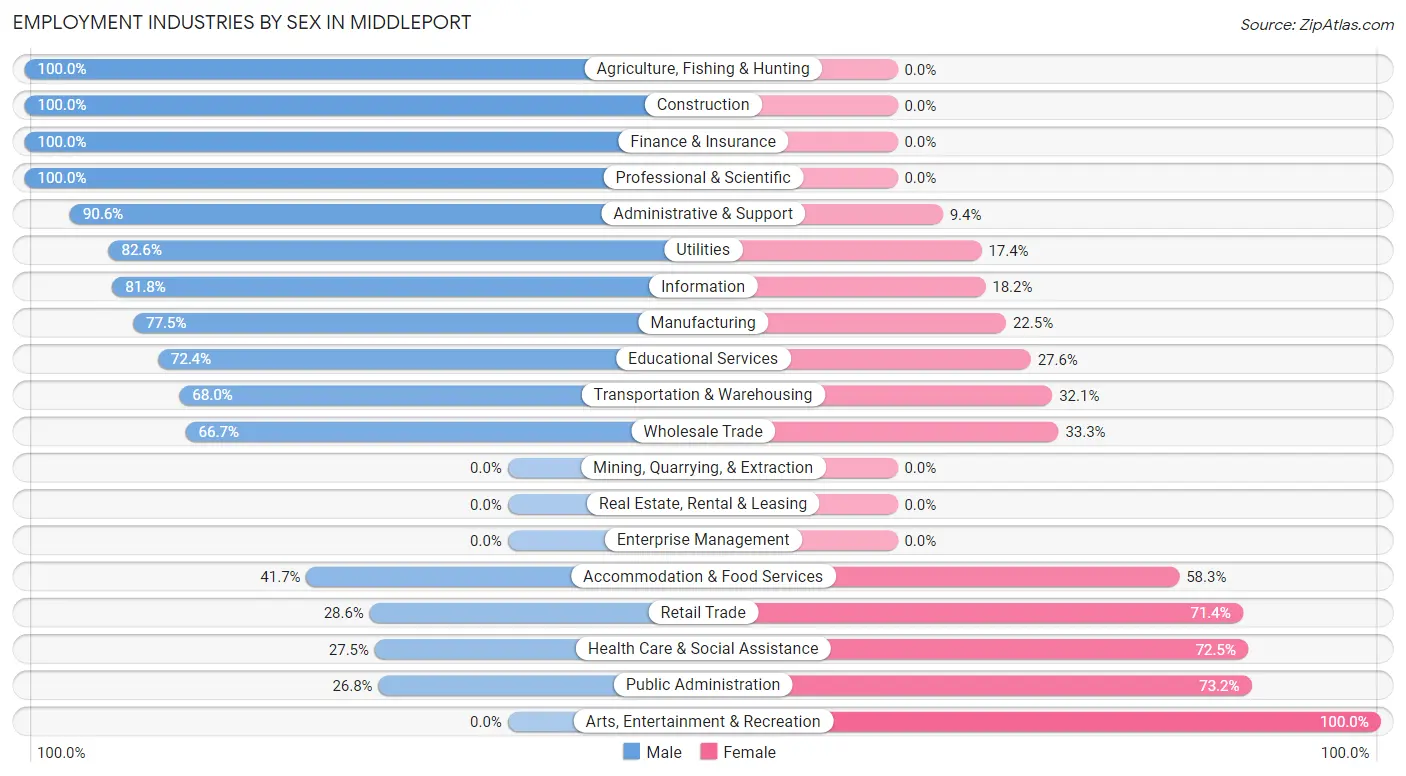
Employment Industries by Sex in Middleport
The Middleport industries that see more men than women are Agriculture, Fishing & Hunting (100.0%), Construction (100.0%), and Finance & Insurance (100.0%), whereas the industries that tend to have a higher number of women are Arts, Entertainment & Recreation (100.0%), Public Administration (73.2%), and Health Care & Social Assistance (72.5%).
| Industry | Male | Female |
| Agriculture, Fishing & Hunting | 18 (100.0%) | 0 (0.0%) |
| Mining, Quarrying, & Extraction | 0 (0.0%) | 0 (0.0%) |
| Construction | 37 (100.0%) | 0 (0.0%) |
| Manufacturing | 69 (77.5%) | 20 (22.5%) |
| Wholesale Trade | 12 (66.7%) | 6 (33.3%) |
| Retail Trade | 36 (28.6%) | 90 (71.4%) |
| Transportation & Warehousing | 53 (67.9%) | 25 (32.1%) |
| Utilities | 19 (82.6%) | 4 (17.4%) |
| Information | 18 (81.8%) | 4 (18.2%) |
| Finance & Insurance | 5 (100.0%) | 0 (0.0%) |
| Real Estate, Rental & Leasing | 0 (0.0%) | 0 (0.0%) |
| Professional & Scientific | 3 (100.0%) | 0 (0.0%) |
| Enterprise Management | 0 (0.0%) | 0 (0.0%) |
| Administrative & Support | 29 (90.6%) | 3 (9.4%) |
| Educational Services | 21 (72.4%) | 8 (27.6%) |
| Health Care & Social Assistance | 55 (27.5%) | 145 (72.5%) |
| Arts, Entertainment & Recreation | 0 (0.0%) | 4 (100.0%) |
| Accommodation & Food Services | 10 (41.7%) | 14 (58.3%) |
| Public Administration | 19 (26.8%) | 52 (73.2%) |
| Total | 430 (51.1%) | 412 (48.9%) |
Education in Middleport
School Enrollment in Middleport
The most common levels of schooling among the 433 students in Middleport are elementary school (124 | 28.6%), high school (120 | 27.7%), and middle school (53 | 12.2%).
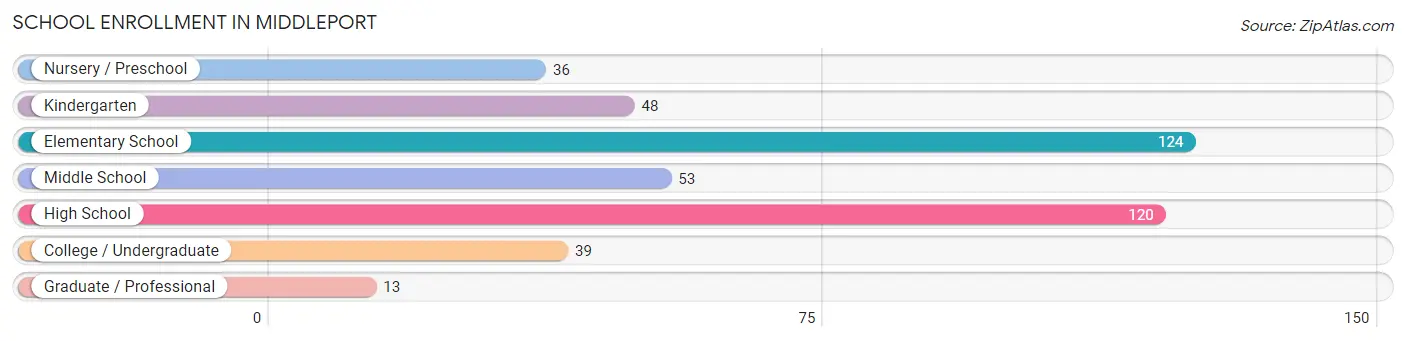
| School Level | # Students | % Students |
| Nursery / Preschool | 36 | 8.3% |
| Kindergarten | 48 | 11.1% |
| Elementary School | 124 | 28.6% |
| Middle School | 53 | 12.2% |
| High School | 120 | 27.7% |
| College / Undergraduate | 39 | 9.0% |
| Graduate / Professional | 13 | 3.0% |
| Total | 433 | 100.0% |
School Enrollment by Age by Funding Source in Middleport
Out of a total of 433 students who are enrolled in schools in Middleport, 32 (7.4%) attend a private institution, while the remaining 401 (92.6%) are enrolled in public schools. The age group of 25 to 34 year olds has the highest likelihood of being enrolled in private schools, with 13 (54.2% in the age bracket) enrolled. Conversely, the age group of 3 to 4 year olds has the lowest likelihood of being enrolled in a private school, with 31 (100.0% in the age bracket) attending a public institution.
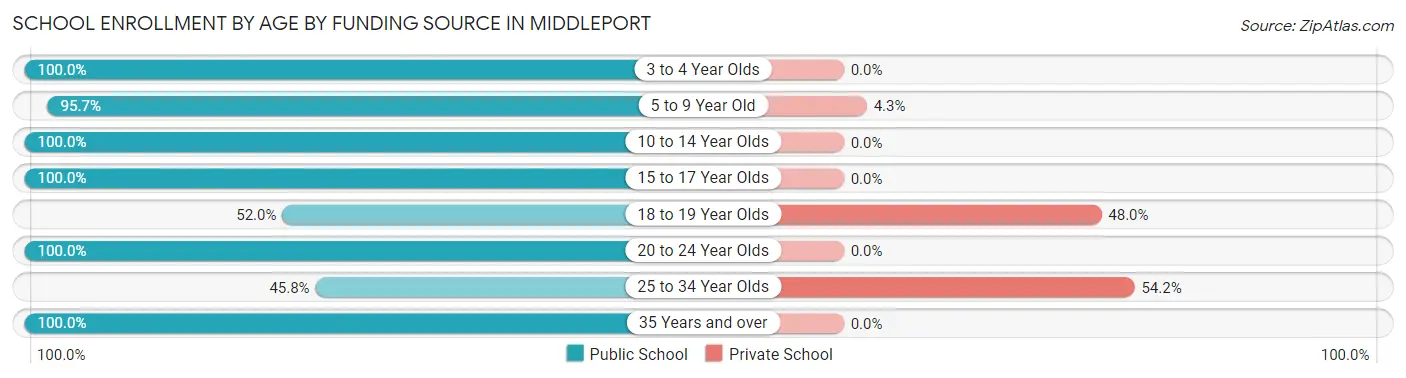
| Age Bracket | Public School | Private School |
| 3 to 4 Year Olds | 31 (100.0%) | 0 (0.0%) |
| 5 to 9 Year Old | 156 (95.7%) | 7 (4.3%) |
| 10 to 14 Year Olds | 88 (100.0%) | 0 (0.0%) |
| 15 to 17 Year Olds | 82 (100.0%) | 0 (0.0%) |
| 18 to 19 Year Olds | 13 (52.0%) | 12 (48.0%) |
| 20 to 24 Year Olds | 7 (100.0%) | 0 (0.0%) |
| 25 to 34 Year Olds | 11 (45.8%) | 13 (54.2%) |
| 35 Years and over | 13 (100.0%) | 0 (0.0%) |
| Total | 401 (92.6%) | 32 (7.4%) |
Educational Attainment by Field of Study in Middleport
Education (39 | 19.8%), arts & humanities (32 | 16.2%), business (29 | 14.7%), liberal arts & history (24 | 12.2%), and multidisciplinary studies (18 | 9.1%) are the most common fields of study among 197 individuals in Middleport who have obtained a bachelor's degree or higher.
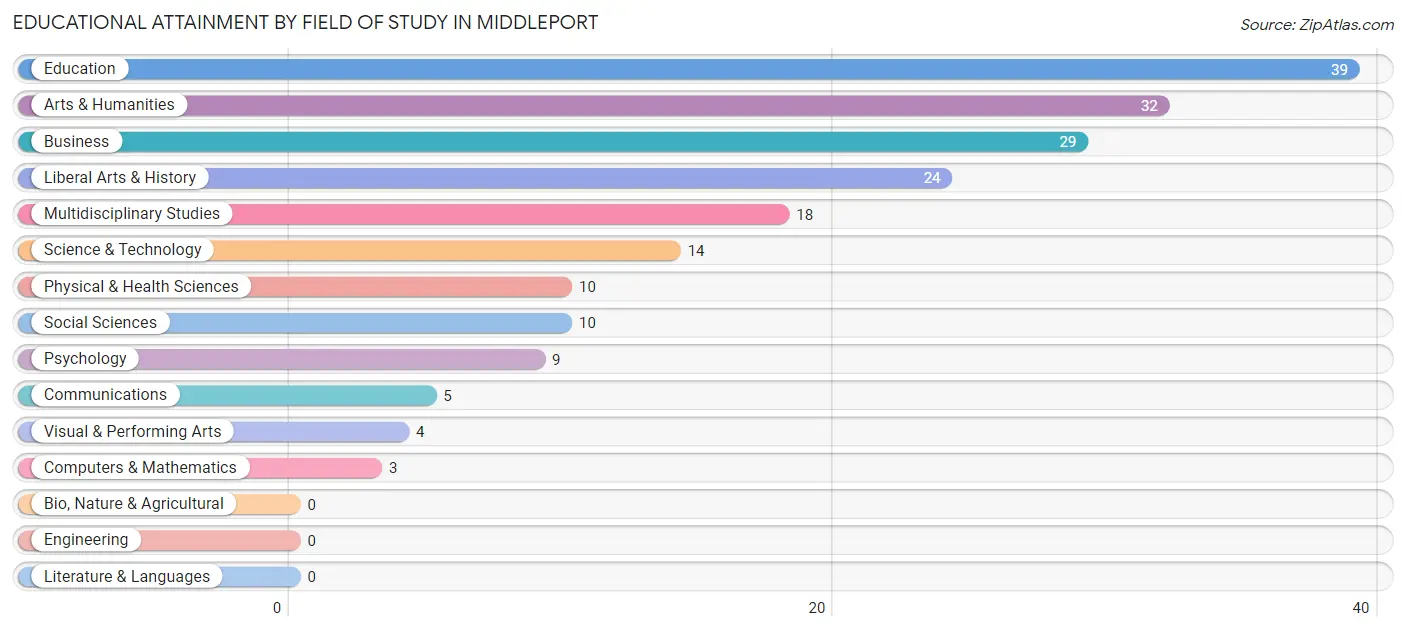
| Field of Study | # Graduates | % Graduates |
| Computers & Mathematics | 3 | 1.5% |
| Bio, Nature & Agricultural | 0 | 0.0% |
| Physical & Health Sciences | 10 | 5.1% |
| Psychology | 9 | 4.6% |
| Social Sciences | 10 | 5.1% |
| Engineering | 0 | 0.0% |
| Multidisciplinary Studies | 18 | 9.1% |
| Science & Technology | 14 | 7.1% |
| Business | 29 | 14.7% |
| Education | 39 | 19.8% |
| Literature & Languages | 0 | 0.0% |
| Liberal Arts & History | 24 | 12.2% |
| Visual & Performing Arts | 4 | 2.0% |
| Communications | 5 | 2.5% |
| Arts & Humanities | 32 | 16.2% |
| Total | 197 | 100.0% |
Transportation & Commute in Middleport
Vehicle Availability by Sex in Middleport
The most prevalent vehicle ownership categories in Middleport are males with 2 vehicles (207, accounting for 48.1%) and females with 2 vehicles (161, making up 52.8%).
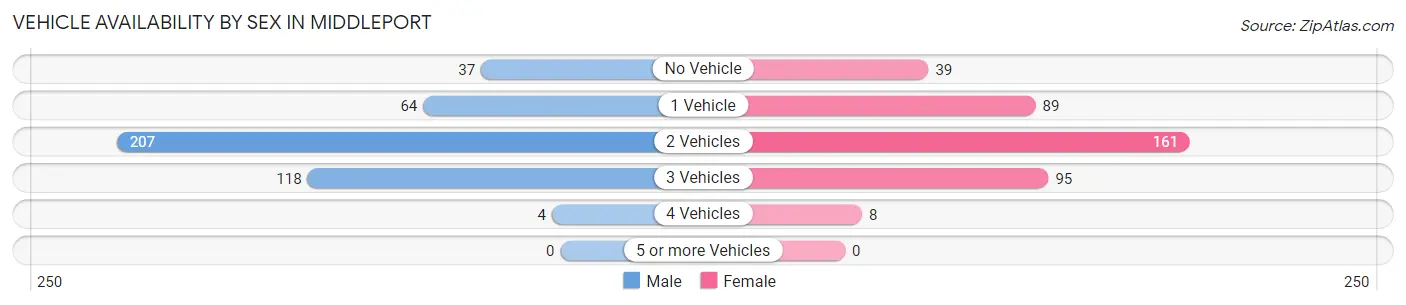
| Vehicles Available | Male | Female |
| No Vehicle | 37 (8.6%) | 39 (10.0%) |
| 1 Vehicle | 64 (14.9%) | 89 (22.7%) |
| 2 Vehicles | 207 (48.1%) | 161 (41.1%) |
| 3 Vehicles | 118 (27.4%) | 95 (24.2%) |
| 4 Vehicles | 4 (0.9%) | 8 (2.0%) |
| 5 or more Vehicles | 0 (0.0%) | 0 (0.0%) |
| Total | 430 (100.0%) | 392 (100.0%) |
Commute Time in Middleport
The most frequently occuring commute durations in Middleport are 5 to 9 minutes (145 commuters, 18.2%), 30 to 34 minutes (136 commuters, 17.1%), and 20 to 24 minutes (101 commuters, 12.7%).
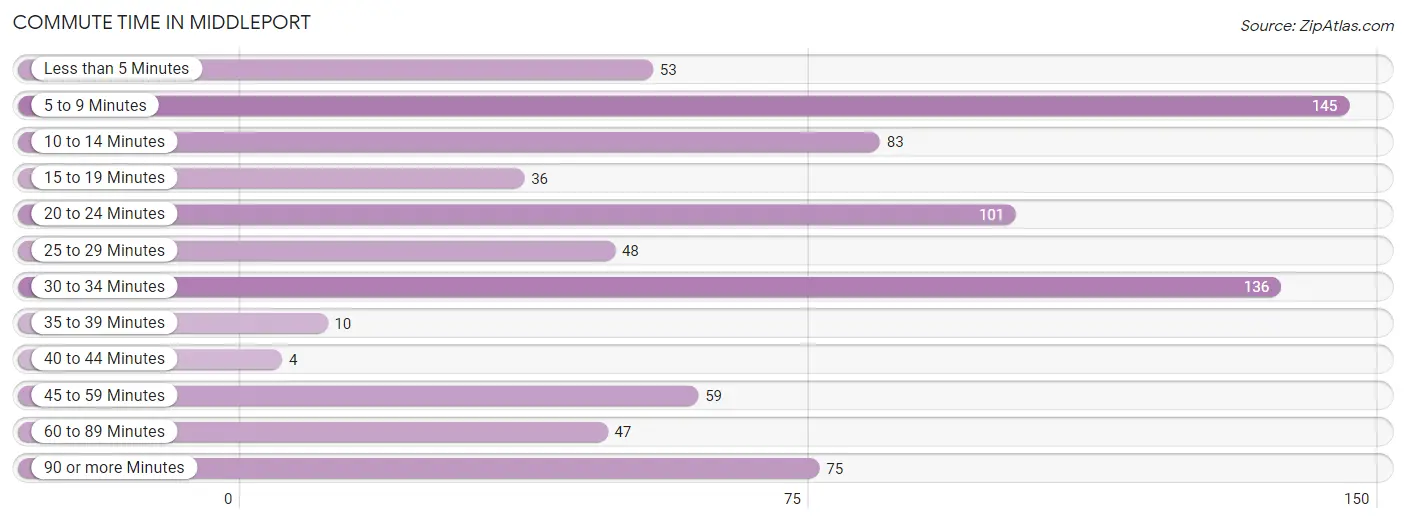
| Commute Time | # Commuters | % Commuters |
| Less than 5 Minutes | 53 | 6.7% |
| 5 to 9 Minutes | 145 | 18.2% |
| 10 to 14 Minutes | 83 | 10.4% |
| 15 to 19 Minutes | 36 | 4.5% |
| 20 to 24 Minutes | 101 | 12.7% |
| 25 to 29 Minutes | 48 | 6.0% |
| 30 to 34 Minutes | 136 | 17.1% |
| 35 to 39 Minutes | 10 | 1.3% |
| 40 to 44 Minutes | 4 | 0.5% |
| 45 to 59 Minutes | 59 | 7.4% |
| 60 to 89 Minutes | 47 | 5.9% |
| 90 or more Minutes | 75 | 9.4% |
Commute Time by Sex in Middleport
The most common commute times in Middleport are 30 to 34 minutes (87 commuters, 20.9%) for males and 5 to 9 minutes (114 commuters, 30.0%) for females.
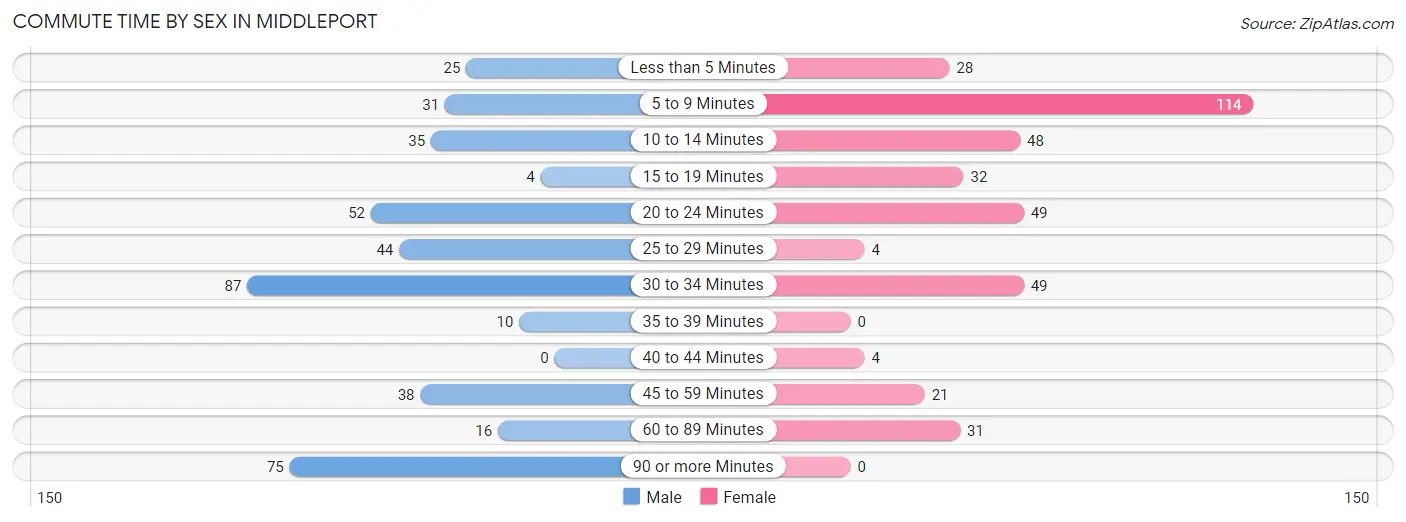
| Commute Time | Male | Female |
| Less than 5 Minutes | 25 (6.0%) | 28 (7.4%) |
| 5 to 9 Minutes | 31 (7.4%) | 114 (30.0%) |
| 10 to 14 Minutes | 35 (8.4%) | 48 (12.6%) |
| 15 to 19 Minutes | 4 (1.0%) | 32 (8.4%) |
| 20 to 24 Minutes | 52 (12.5%) | 49 (12.9%) |
| 25 to 29 Minutes | 44 (10.5%) | 4 (1.1%) |
| 30 to 34 Minutes | 87 (20.9%) | 49 (12.9%) |
| 35 to 39 Minutes | 10 (2.4%) | 0 (0.0%) |
| 40 to 44 Minutes | 0 (0.0%) | 4 (1.1%) |
| 45 to 59 Minutes | 38 (9.1%) | 21 (5.5%) |
| 60 to 89 Minutes | 16 (3.8%) | 31 (8.2%) |
| 90 or more Minutes | 75 (18.0%) | 0 (0.0%) |
Time of Departure to Work by Sex in Middleport
The most frequent times of departure to work in Middleport are 7:30 AM to 7:59 AM (76, 18.2%) for males and 7:00 AM to 7:29 AM (109, 28.7%) for females.
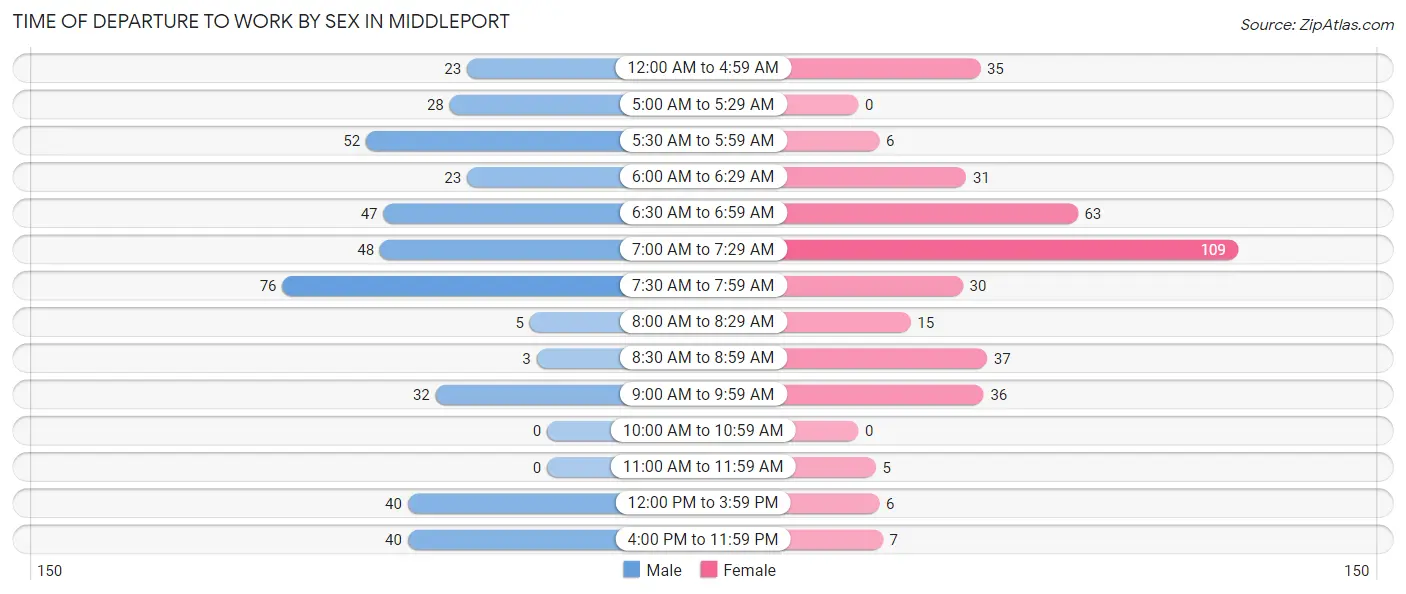
| Time of Departure | Male | Female |
| 12:00 AM to 4:59 AM | 23 (5.5%) | 35 (9.2%) |
| 5:00 AM to 5:29 AM | 28 (6.7%) | 0 (0.0%) |
| 5:30 AM to 5:59 AM | 52 (12.5%) | 6 (1.6%) |
| 6:00 AM to 6:29 AM | 23 (5.5%) | 31 (8.2%) |
| 6:30 AM to 6:59 AM | 47 (11.3%) | 63 (16.6%) |
| 7:00 AM to 7:29 AM | 48 (11.5%) | 109 (28.7%) |
| 7:30 AM to 7:59 AM | 76 (18.2%) | 30 (7.9%) |
| 8:00 AM to 8:29 AM | 5 (1.2%) | 15 (4.0%) |
| 8:30 AM to 8:59 AM | 3 (0.7%) | 37 (9.7%) |
| 9:00 AM to 9:59 AM | 32 (7.7%) | 36 (9.5%) |
| 10:00 AM to 10:59 AM | 0 (0.0%) | 0 (0.0%) |
| 11:00 AM to 11:59 AM | 0 (0.0%) | 5 (1.3%) |
| 12:00 PM to 3:59 PM | 40 (9.6%) | 6 (1.6%) |
| 4:00 PM to 11:59 PM | 40 (9.6%) | 7 (1.8%) |
| Total | 417 (100.0%) | 380 (100.0%) |
Housing Occupancy in Middleport
Occupancy by Ownership in Middleport
Of the total 934 dwellings in Middleport, owner-occupied units account for 559 (59.9%), while renter-occupied units make up 375 (40.2%).
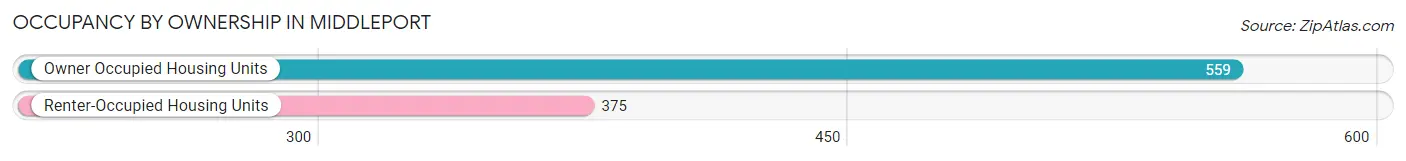
| Occupancy | # Housing Units | % Housing Units |
| Owner Occupied Housing Units | 559 | 59.9% |
| Renter-Occupied Housing Units | 375 | 40.2% |
| Total Occupied Housing Units | 934 | 100.0% |
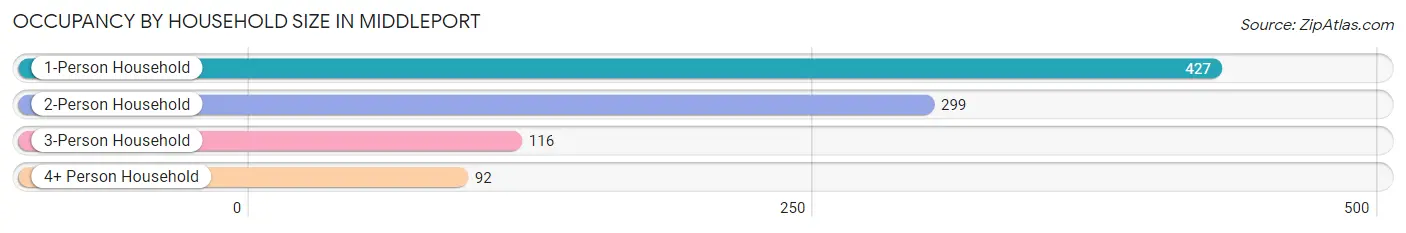
Occupancy by Household Size in Middleport
| Household Size | # Housing Units | % Housing Units |
| 1-Person Household | 427 | 45.7% |
| 2-Person Household | 299 | 32.0% |
| 3-Person Household | 116 | 12.4% |
| 4+ Person Household | 92 | 9.9% |
| Total Housing Units | 934 | 100.0% |
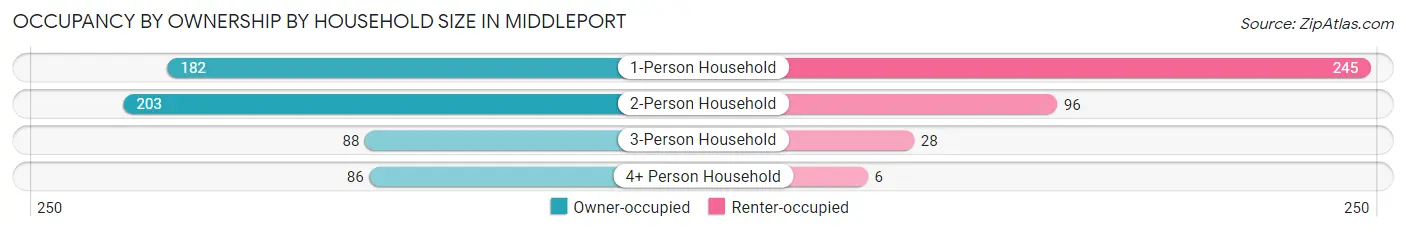
Occupancy by Ownership by Household Size in Middleport
| Household Size | Owner-occupied | Renter-occupied |
| 1-Person Household | 182 (42.6%) | 245 (57.4%) |
| 2-Person Household | 203 (67.9%) | 96 (32.1%) |
| 3-Person Household | 88 (75.9%) | 28 (24.1%) |
| 4+ Person Household | 86 (93.5%) | 6 (6.5%) |
| Total Housing Units | 559 (59.9%) | 375 (40.2%) |
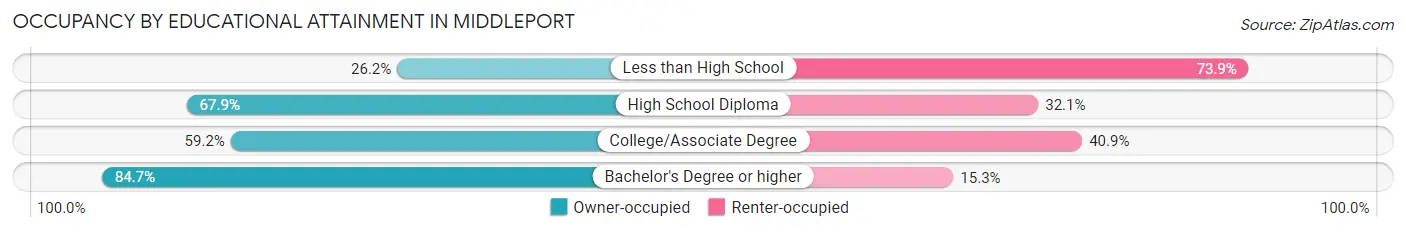
Occupancy by Educational Attainment in Middleport
| Household Size | Owner-occupied | Renter-occupied |
| Less than High School | 34 (26.2%) | 96 (73.9%) |
| High School Diploma | 190 (67.9%) | 90 (32.1%) |
| College/Associate Degree | 252 (59.2%) | 174 (40.8%) |
| Bachelor's Degree or higher | 83 (84.7%) | 15 (15.3%) |
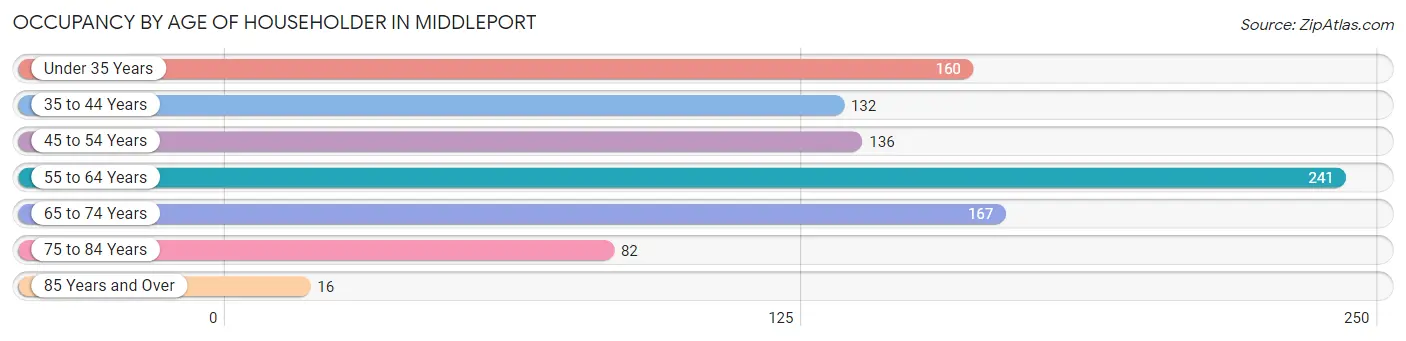
Occupancy by Age of Householder in Middleport
| Age Bracket | # Households | % Households |
| Under 35 Years | 160 | 17.1% |
| 35 to 44 Years | 132 | 14.1% |
| 45 to 54 Years | 136 | 14.6% |
| 55 to 64 Years | 241 | 25.8% |
| 65 to 74 Years | 167 | 17.9% |
| 75 to 84 Years | 82 | 8.8% |
| 85 Years and Over | 16 | 1.7% |
| Total | 934 | 100.0% |
Housing Finances in Middleport
Median Income by Occupancy in Middleport
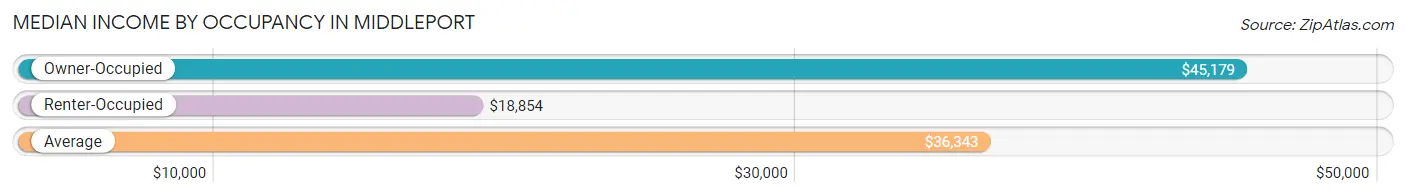
| Occupancy Type | # Households | Median Income |
| Owner-Occupied | 559 (59.9%) | $45,179 |
| Renter-Occupied | 375 (40.2%) | $18,854 |
| Average | 934 (100.0%) | $36,343 |
Occupancy by Householder Income Bracket in Middleport
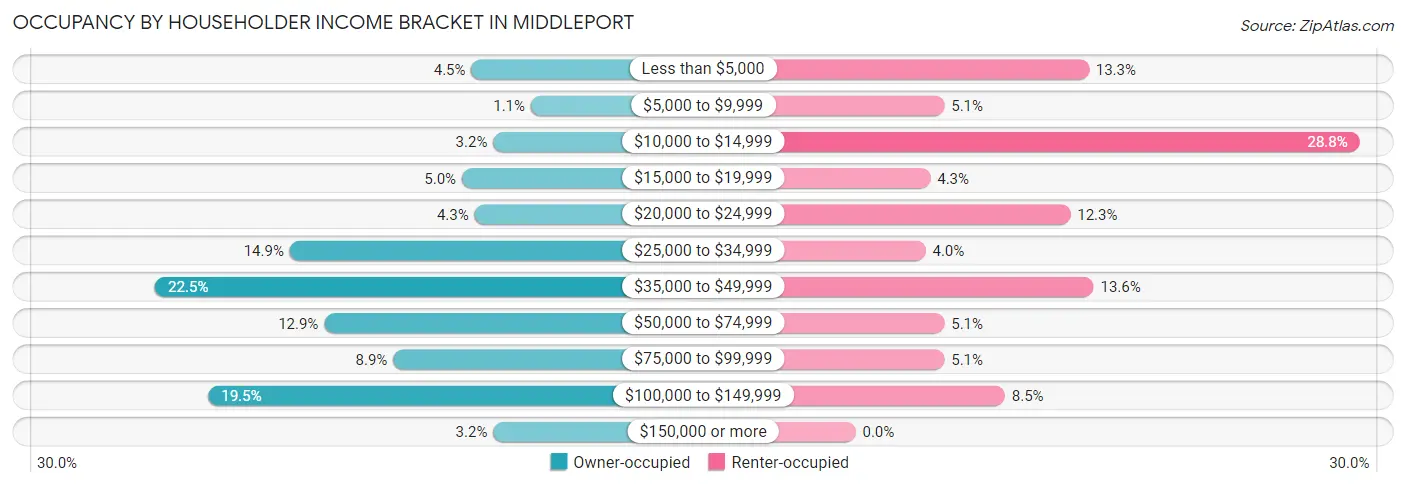
| Income Bracket | Owner-occupied | Renter-occupied |
| Less than $5,000 | 25 (4.5%) | 50 (13.3%) |
| $5,000 to $9,999 | 6 (1.1%) | 19 (5.1%) |
| $10,000 to $14,999 | 18 (3.2%) | 108 (28.8%) |
| $15,000 to $19,999 | 28 (5.0%) | 16 (4.3%) |
| $20,000 to $24,999 | 24 (4.3%) | 46 (12.3%) |
| $25,000 to $34,999 | 83 (14.8%) | 15 (4.0%) |
| $35,000 to $49,999 | 126 (22.5%) | 51 (13.6%) |
| $50,000 to $74,999 | 72 (12.9%) | 19 (5.1%) |
| $75,000 to $99,999 | 50 (8.9%) | 19 (5.1%) |
| $100,000 to $149,999 | 109 (19.5%) | 32 (8.5%) |
| $150,000 or more | 18 (3.2%) | 0 (0.0%) |
| Total | 559 (100.0%) | 375 (100.0%) |
Monthly Housing Cost Tiers in Middleport
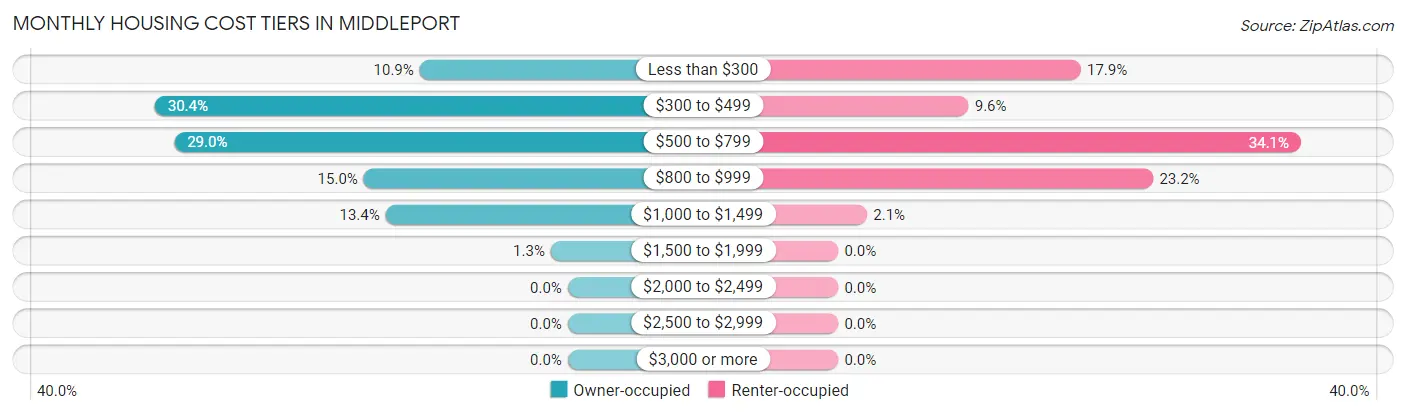
| Monthly Cost | Owner-occupied | Renter-occupied |
| Less than $300 | 61 (10.9%) | 67 (17.9%) |
| $300 to $499 | 170 (30.4%) | 36 (9.6%) |
| $500 to $799 | 162 (29.0%) | 128 (34.1%) |
| $800 to $999 | 84 (15.0%) | 87 (23.2%) |
| $1,000 to $1,499 | 75 (13.4%) | 8 (2.1%) |
| $1,500 to $1,999 | 7 (1.3%) | 0 (0.0%) |
| $2,000 to $2,499 | 0 (0.0%) | 0 (0.0%) |
| $2,500 to $2,999 | 0 (0.0%) | 0 (0.0%) |
| $3,000 or more | 0 (0.0%) | 0 (0.0%) |
| Total | 559 (100.0%) | 375 (100.0%) |
Physical Housing Characteristics in Middleport
Housing Structures in Middleport
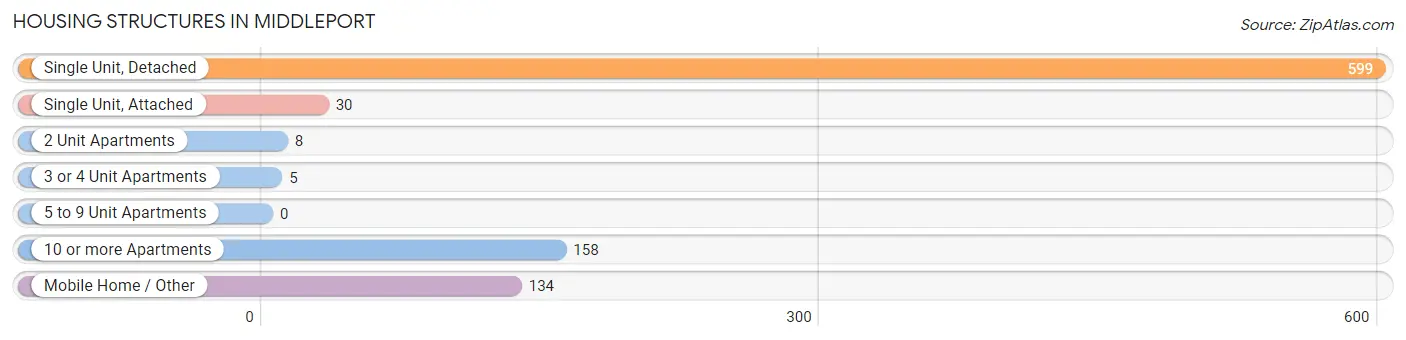
| Structure Type | # Housing Units | % Housing Units |
| Single Unit, Detached | 599 | 64.1% |
| Single Unit, Attached | 30 | 3.2% |
| 2 Unit Apartments | 8 | 0.9% |
| 3 or 4 Unit Apartments | 5 | 0.5% |
| 5 to 9 Unit Apartments | 0 | 0.0% |
| 10 or more Apartments | 158 | 16.9% |
| Mobile Home / Other | 134 | 14.3% |
| Total | 934 | 100.0% |
Housing Structures by Occupancy in Middleport
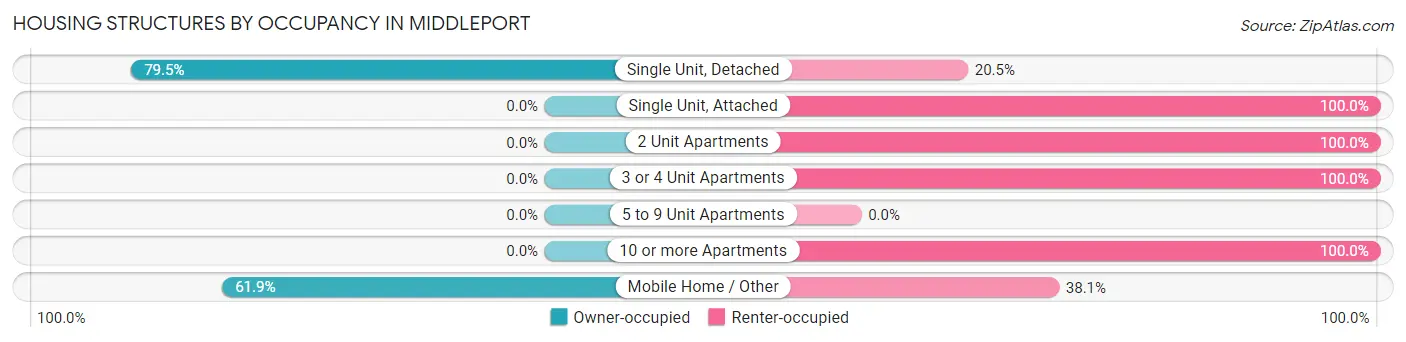
| Structure Type | Owner-occupied | Renter-occupied |
| Single Unit, Detached | 476 (79.5%) | 123 (20.5%) |
| Single Unit, Attached | 0 (0.0%) | 30 (100.0%) |
| 2 Unit Apartments | 0 (0.0%) | 8 (100.0%) |
| 3 or 4 Unit Apartments | 0 (0.0%) | 5 (100.0%) |
| 5 to 9 Unit Apartments | 0 (0.0%) | 0 (0.0%) |
| 10 or more Apartments | 0 (0.0%) | 158 (100.0%) |
| Mobile Home / Other | 83 (61.9%) | 51 (38.1%) |
| Total | 559 (59.9%) | 375 (40.2%) |
Housing Structures by Number of Rooms in Middleport
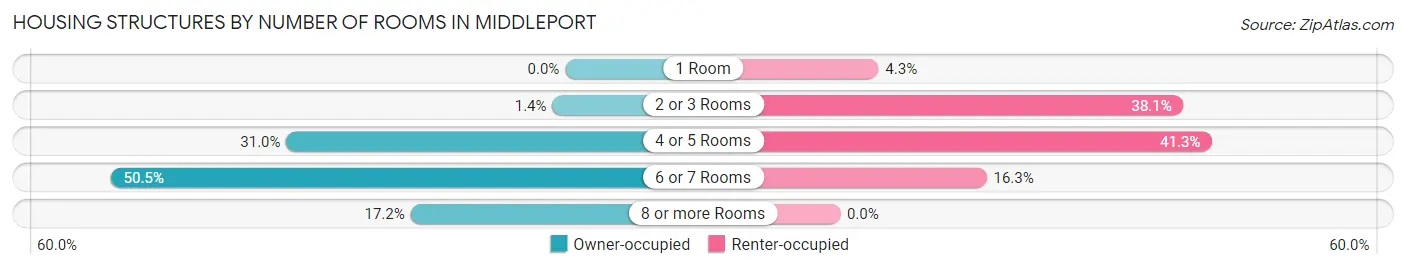
| Number of Rooms | Owner-occupied | Renter-occupied |
| 1 Room | 0 (0.0%) | 16 (4.3%) |
| 2 or 3 Rooms | 8 (1.4%) | 143 (38.1%) |
| 4 or 5 Rooms | 173 (30.9%) | 155 (41.3%) |
| 6 or 7 Rooms | 282 (50.4%) | 61 (16.3%) |
| 8 or more Rooms | 96 (17.2%) | 0 (0.0%) |
| Total | 559 (100.0%) | 375 (100.0%) |
Housing Structure by Heating Type in Middleport
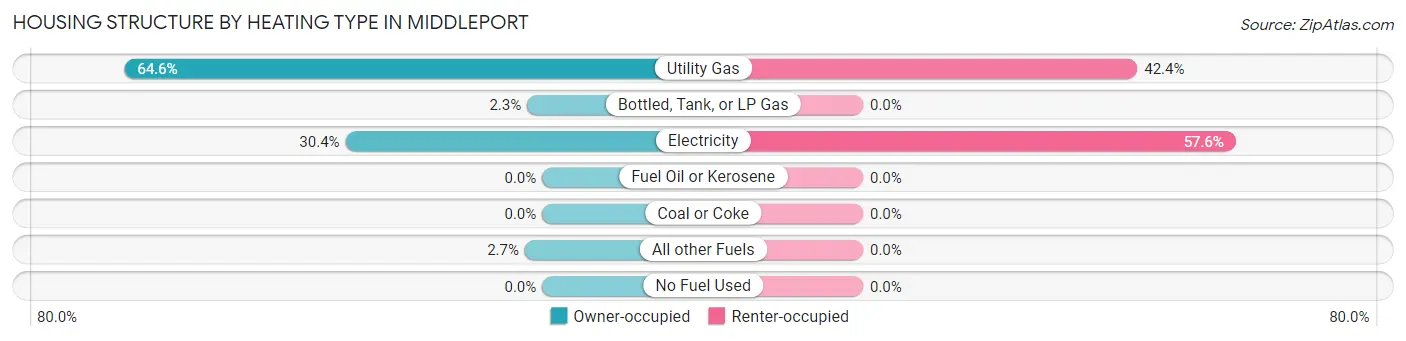
| Heating Type | Owner-occupied | Renter-occupied |
| Utility Gas | 361 (64.6%) | 159 (42.4%) |
| Bottled, Tank, or LP Gas | 13 (2.3%) | 0 (0.0%) |
| Electricity | 170 (30.4%) | 216 (57.6%) |
| Fuel Oil or Kerosene | 0 (0.0%) | 0 (0.0%) |
| Coal or Coke | 0 (0.0%) | 0 (0.0%) |
| All other Fuels | 15 (2.7%) | 0 (0.0%) |
| No Fuel Used | 0 (0.0%) | 0 (0.0%) |
| Total | 559 (100.0%) | 375 (100.0%) |
Household Vehicle Usage in Middleport
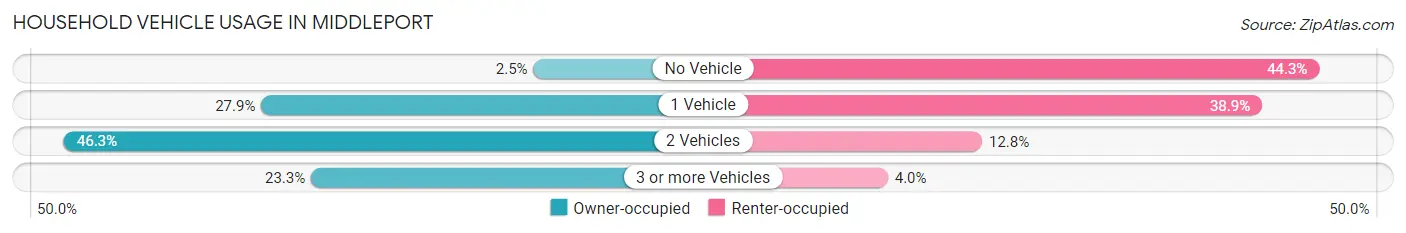
| Vehicles per Household | Owner-occupied | Renter-occupied |
| No Vehicle | 14 (2.5%) | 166 (44.3%) |
| 1 Vehicle | 156 (27.9%) | 146 (38.9%) |
| 2 Vehicles | 259 (46.3%) | 48 (12.8%) |
| 3 or more Vehicles | 130 (23.3%) | 15 (4.0%) |
| Total | 559 (100.0%) | 375 (100.0%) |
Real Estate & Mortgages in Middleport
Real Estate and Mortgage Overview in Middleport
| Characteristic | Without Mortgage | With Mortgage |
| Housing Units | 314 | 245 |
| Median Property Value | $73,800 | $85,000 |
| Median Household Income | $47,955 | $7 |
| Monthly Housing Costs | $443 | $0 |
| Real Estate Taxes | $633 | $0 |
Property Value by Mortgage Status in Middleport
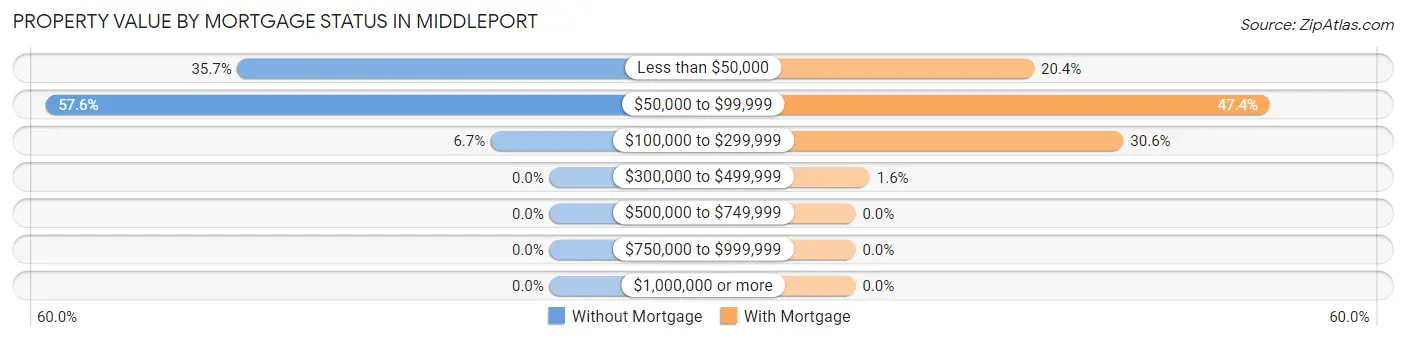
| Property Value | Without Mortgage | With Mortgage |
| Less than $50,000 | 112 (35.7%) | 50 (20.4%) |
| $50,000 to $99,999 | 181 (57.6%) | 116 (47.3%) |
| $100,000 to $299,999 | 21 (6.7%) | 75 (30.6%) |
| $300,000 to $499,999 | 0 (0.0%) | 4 (1.6%) |
| $500,000 to $749,999 | 0 (0.0%) | 0 (0.0%) |
| $750,000 to $999,999 | 0 (0.0%) | 0 (0.0%) |
| $1,000,000 or more | 0 (0.0%) | 0 (0.0%) |
| Total | 314 (100.0%) | 245 (100.0%) |
Household Income by Mortgage Status in Middleport
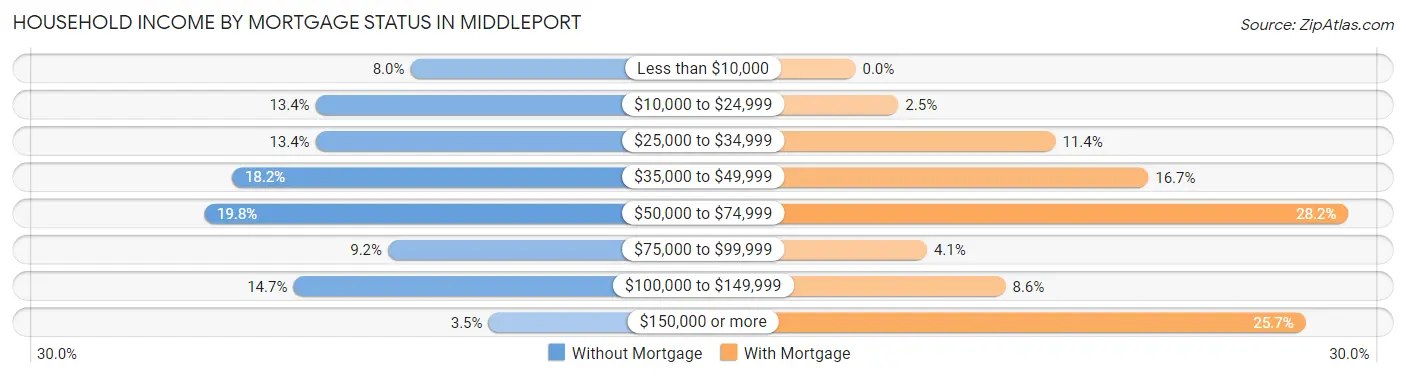
| Household Income | Without Mortgage | With Mortgage |
| Less than $10,000 | 25 (8.0%) | 0 (0.0%) |
| $10,000 to $24,999 | 42 (13.4%) | 6 (2.5%) |
| $25,000 to $34,999 | 42 (13.4%) | 28 (11.4%) |
| $35,000 to $49,999 | 57 (18.1%) | 41 (16.7%) |
| $50,000 to $74,999 | 62 (19.8%) | 69 (28.2%) |
| $75,000 to $99,999 | 29 (9.2%) | 10 (4.1%) |
| $100,000 to $149,999 | 46 (14.6%) | 21 (8.6%) |
| $150,000 or more | 11 (3.5%) | 63 (25.7%) |
| Total | 314 (100.0%) | 245 (100.0%) |
Property Value to Household Income Ratio in Middleport
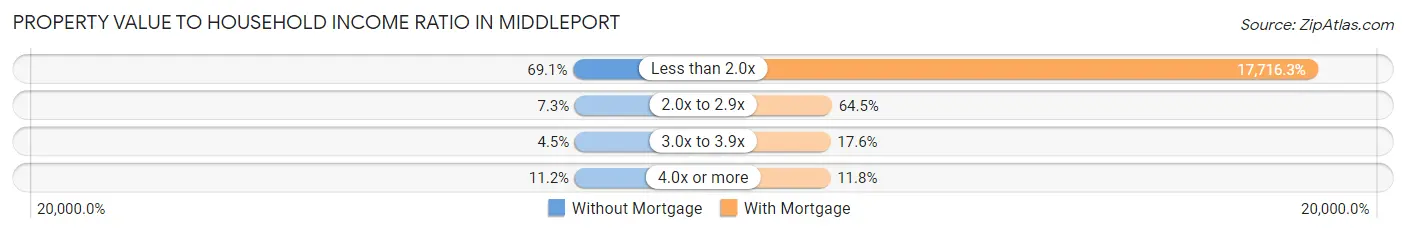
| Value-to-Income Ratio | Without Mortgage | With Mortgage |
| Less than 2.0x | 217 (69.1%) | 43,405 (17,716.3%) |
| 2.0x to 2.9x | 23 (7.3%) | 158 (64.5%) |
| 3.0x to 3.9x | 14 (4.5%) | 43 (17.5%) |
| 4.0x or more | 35 (11.2%) | 29 (11.8%) |
| Total | 314 (100.0%) | 245 (100.0%) |
Real Estate Taxes by Mortgage Status in Middleport
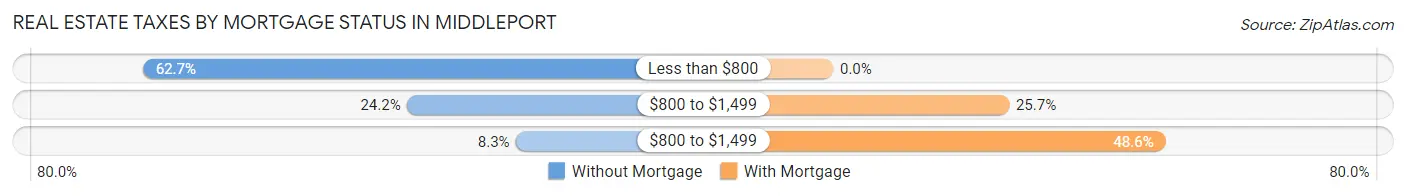
| Property Taxes | Without Mortgage | With Mortgage |
| Less than $800 | 197 (62.7%) | 0 (0.0%) |
| $800 to $1,499 | 76 (24.2%) | 63 (25.7%) |
| $800 to $1,499 | 26 (8.3%) | 119 (48.6%) |
| Total | 314 (100.0%) | 245 (100.0%) |
Health & Disability in Middleport
Health Insurance Coverage by Age in Middleport
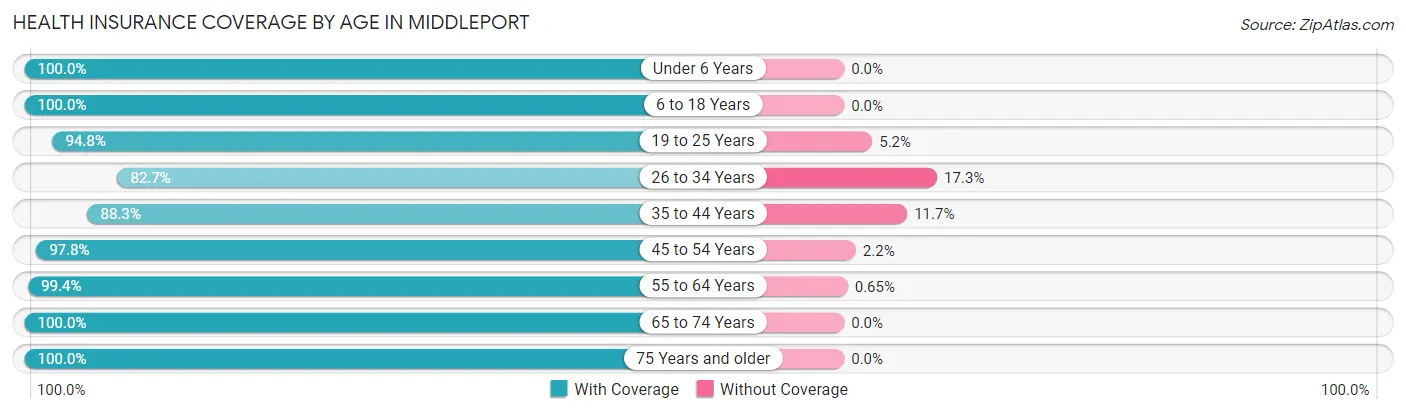
| Age Bracket | With Coverage | Without Coverage |
| Under 6 Years | 100 (100.0%) | 0 (0.0%) |
| 6 to 18 Years | 357 (100.0%) | 0 (0.0%) |
| 19 to 25 Years | 127 (94.8%) | 7 (5.2%) |
| 26 to 34 Years | 148 (82.7%) | 31 (17.3%) |
| 35 to 44 Years | 248 (88.3%) | 33 (11.7%) |
| 45 to 54 Years | 225 (97.8%) | 5 (2.2%) |
| 55 to 64 Years | 306 (99.4%) | 2 (0.6%) |
| 65 to 74 Years | 222 (100.0%) | 0 (0.0%) |
| 75 Years and older | 137 (100.0%) | 0 (0.0%) |
| Total | 1,870 (96.0%) | 78 (4.0%) |
Health Insurance Coverage by Citizenship Status in Middleport
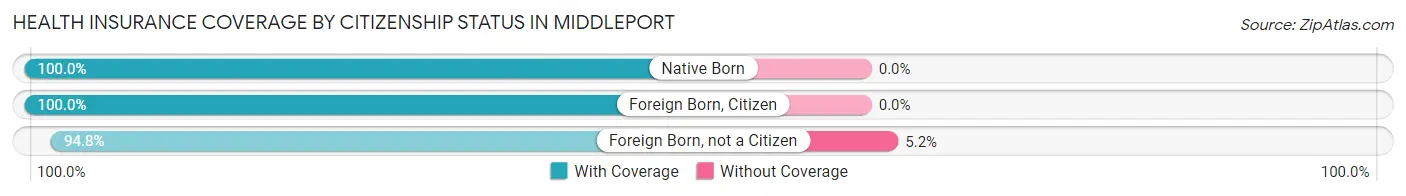
| Citizenship Status | With Coverage | Without Coverage |
| Native Born | 100 (100.0%) | 0 (0.0%) |
| Foreign Born, Citizen | 357 (100.0%) | 0 (0.0%) |
| Foreign Born, not a Citizen | 127 (94.8%) | 7 (5.2%) |
Health Insurance Coverage by Household Income in Middleport
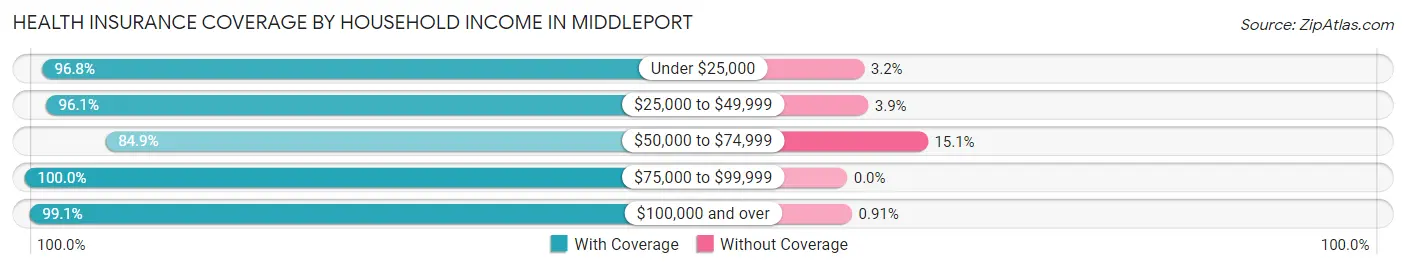
| Household Income | With Coverage | Without Coverage |
| Under $25,000 | 395 (96.8%) | 13 (3.2%) |
| $25,000 to $49,999 | 658 (96.1%) | 27 (3.9%) |
| $50,000 to $74,999 | 191 (84.9%) | 34 (15.1%) |
| $75,000 to $99,999 | 191 (100.0%) | 0 (0.0%) |
| $100,000 and over | 435 (99.1%) | 4 (0.9%) |
Public vs Private Health Insurance Coverage by Age in Middleport
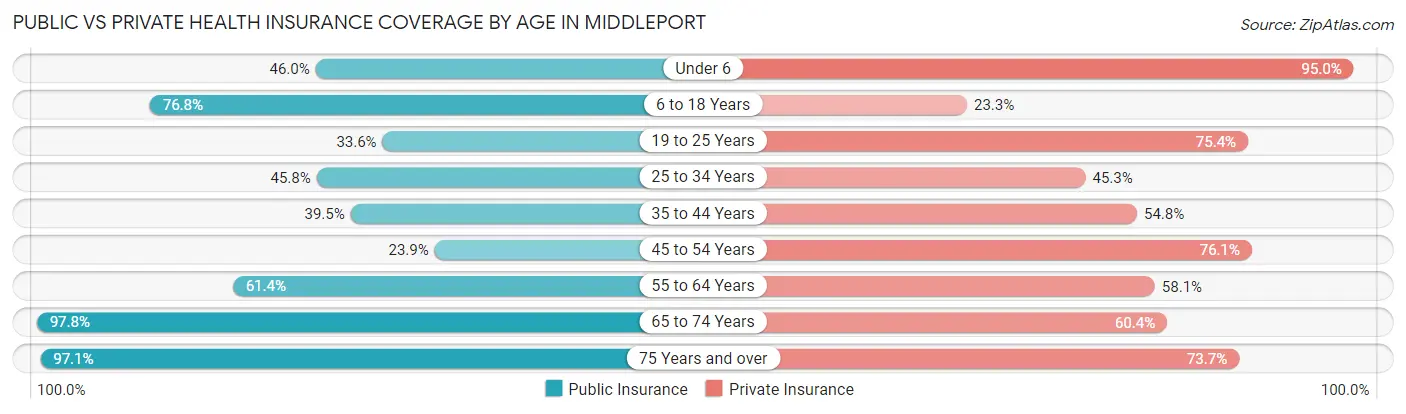
| Age Bracket | Public Insurance | Private Insurance |
| Under 6 | 46 (46.0%) | 95 (95.0%) |
| 6 to 18 Years | 274 (76.7%) | 83 (23.3%) |
| 19 to 25 Years | 45 (33.6%) | 101 (75.4%) |
| 25 to 34 Years | 82 (45.8%) | 81 (45.3%) |
| 35 to 44 Years | 111 (39.5%) | 154 (54.8%) |
| 45 to 54 Years | 55 (23.9%) | 175 (76.1%) |
| 55 to 64 Years | 189 (61.4%) | 179 (58.1%) |
| 65 to 74 Years | 217 (97.8%) | 134 (60.4%) |
| 75 Years and over | 133 (97.1%) | 101 (73.7%) |
| Total | 1,152 (59.1%) | 1,103 (56.6%) |
Disability Status by Sex by Age in Middleport
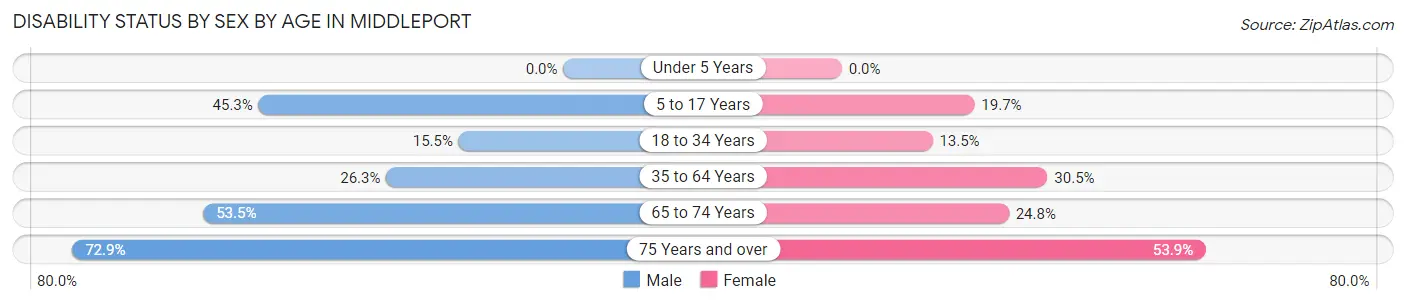
| Age Bracket | Male | Female |
| Under 5 Years | 0 (0.0%) | 0 (0.0%) |
| 5 to 17 Years | 100 (45.3%) | 25 (19.7%) |
| 18 to 34 Years | 27 (15.5%) | 21 (13.5%) |
| 35 to 64 Years | 112 (26.3%) | 120 (30.5%) |
| 65 to 74 Years | 54 (53.5%) | 30 (24.8%) |
| 75 Years and over | 35 (72.9%) | 48 (53.9%) |
Disability Class by Sex by Age in Middleport
Disability Class: Hearing Difficulty
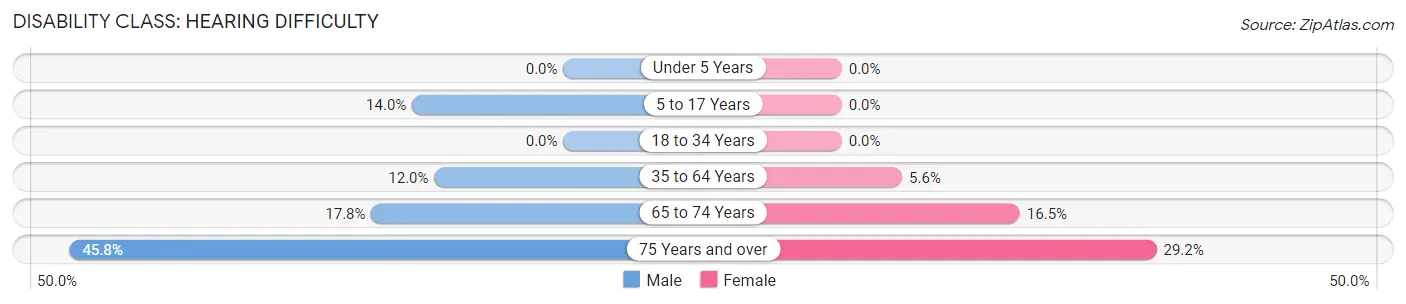
| Age Bracket | Male | Female |
| Under 5 Years | 0 (0.0%) | 0 (0.0%) |
| 5 to 17 Years | 31 (14.0%) | 0 (0.0%) |
| 18 to 34 Years | 0 (0.0%) | 0 (0.0%) |
| 35 to 64 Years | 51 (12.0%) | 22 (5.6%) |
| 65 to 74 Years | 18 (17.8%) | 20 (16.5%) |
| 75 Years and over | 22 (45.8%) | 26 (29.2%) |
Disability Class: Vision Difficulty
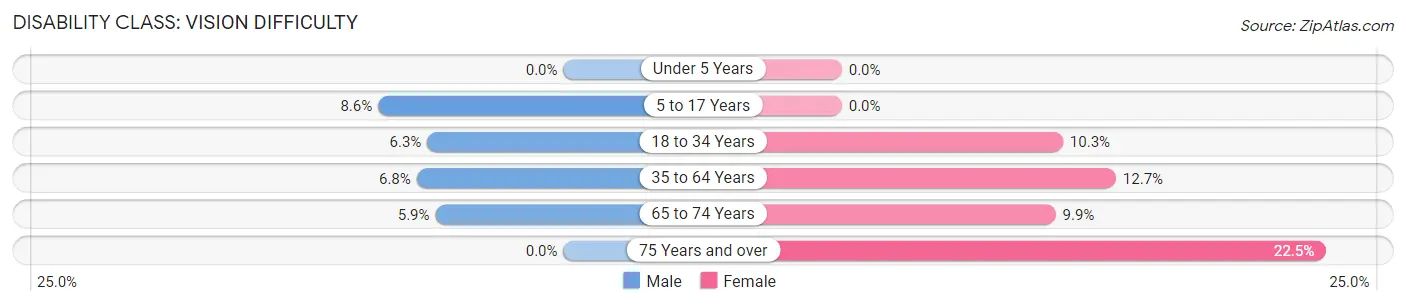
| Age Bracket | Male | Female |
| Under 5 Years | 0 (0.0%) | 0 (0.0%) |
| 5 to 17 Years | 19 (8.6%) | 0 (0.0%) |
| 18 to 34 Years | 11 (6.3%) | 16 (10.3%) |
| 35 to 64 Years | 29 (6.8%) | 50 (12.7%) |
| 65 to 74 Years | 6 (5.9%) | 12 (9.9%) |
| 75 Years and over | 0 (0.0%) | 20 (22.5%) |
Disability Class: Cognitive Difficulty
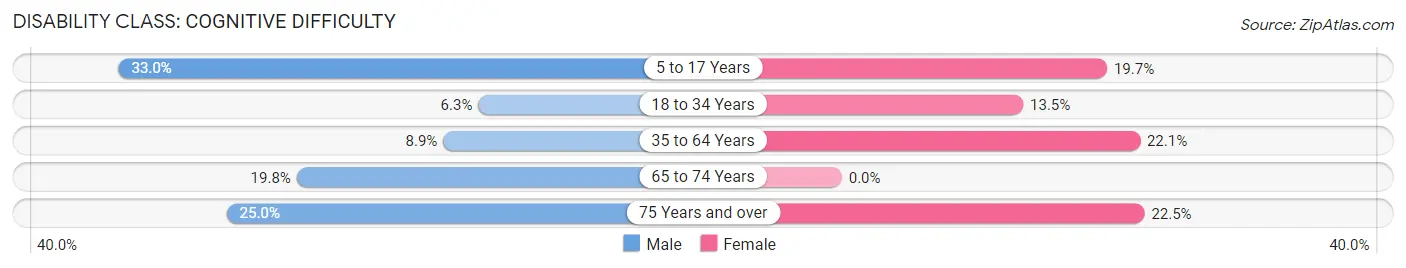
| Age Bracket | Male | Female |
| 5 to 17 Years | 73 (33.0%) | 25 (19.7%) |
| 18 to 34 Years | 11 (6.3%) | 21 (13.5%) |
| 35 to 64 Years | 38 (8.9%) | 87 (22.1%) |
| 65 to 74 Years | 20 (19.8%) | 0 (0.0%) |
| 75 Years and over | 12 (25.0%) | 20 (22.5%) |
Disability Class: Ambulatory Difficulty
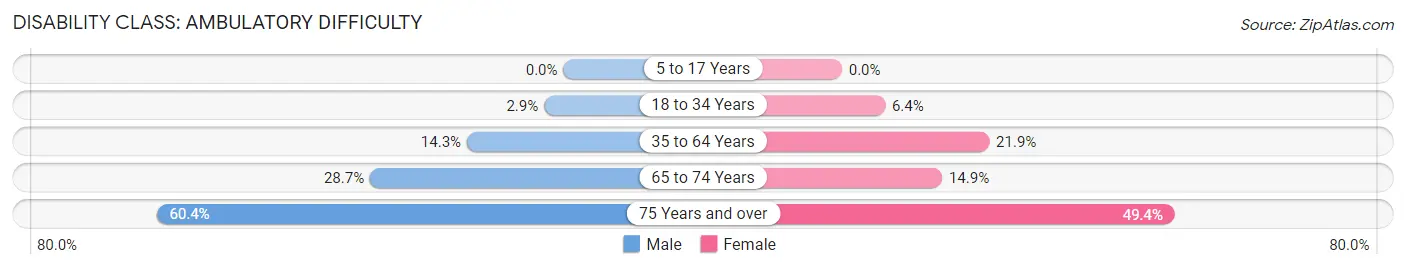
| Age Bracket | Male | Female |
| 5 to 17 Years | 0 (0.0%) | 0 (0.0%) |
| 18 to 34 Years | 5 (2.9%) | 10 (6.4%) |
| 35 to 64 Years | 61 (14.3%) | 86 (21.9%) |
| 65 to 74 Years | 29 (28.7%) | 18 (14.9%) |
| 75 Years and over | 29 (60.4%) | 44 (49.4%) |
Disability Class: Self-Care Difficulty
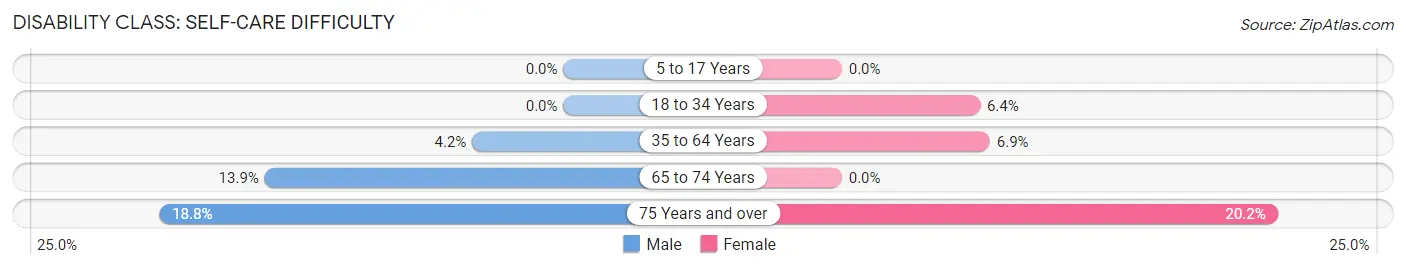
| Age Bracket | Male | Female |
| 5 to 17 Years | 0 (0.0%) | 0 (0.0%) |
| 18 to 34 Years | 0 (0.0%) | 10 (6.4%) |
| 35 to 64 Years | 18 (4.2%) | 27 (6.9%) |
| 65 to 74 Years | 14 (13.9%) | 0 (0.0%) |
| 75 Years and over | 9 (18.8%) | 18 (20.2%) |
Technology Access in Middleport
Computing Device Access in Middleport
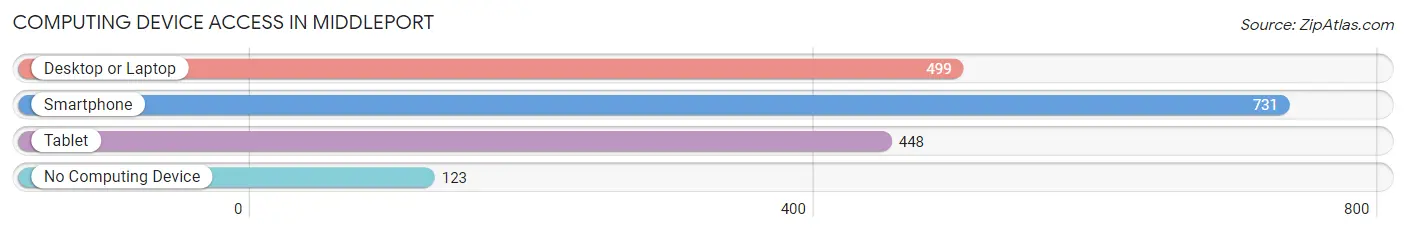
| Device Type | # Households | % Households |
| Desktop or Laptop | 499 | 53.4% |
| Smartphone | 731 | 78.3% |
| Tablet | 448 | 48.0% |
| No Computing Device | 123 | 13.2% |
| Total | 934 | 100.0% |
Internet Access in Middleport
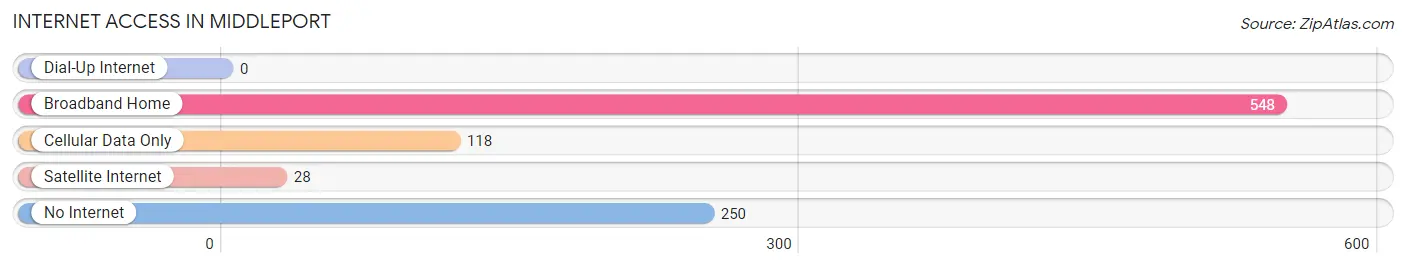
| Internet Type | # Households | % Households |
| Dial-Up Internet | 0 | 0.0% |
| Broadband Home | 548 | 58.7% |
| Cellular Data Only | 118 | 12.6% |
| Satellite Internet | 28 | 3.0% |
| No Internet | 250 | 26.8% |
| Total | 934 | 100.0% |
Middleport Summary
History
The small village of Middleport, Ohio is located in Meigs County, Ohio, and is situated along the Ohio River. The village was founded in 1817 by a group of settlers from Pennsylvania, and was originally known as “Middleport” due to its location between the larger towns of Pomeroy and Gallipolis. The village was officially incorporated in 1837, and has since grown to a population of approximately 1,800 people.
Middleport has a rich history of industry and commerce, and was once home to several factories and mills. The first industry to be established in the village was a sawmill, which was built in 1820. This was followed by a gristmill in 1825, and a woolen mill in 1835. The village also had a number of other businesses, including a tannery, a blacksmith shop, and a general store.
In the late 19th century, Middleport was home to several coal mines, which provided employment for many of the village’s residents. The coal industry was a major source of income for the village, and the mines were in operation until the early 20th century.
The village also had a thriving agricultural industry, and was home to several farms. The farms produced a variety of crops, including corn, wheat, oats, and hay. The village also had a number of dairies, which provided milk and other dairy products to the local population.
Geography
Middleport is located in the southeastern corner of Meigs County, Ohio, and is situated along the Ohio River. The village is located approximately 25 miles south of Athens, Ohio, and is approximately 50 miles southeast of Columbus, Ohio. The village is situated on a flat plain, and is surrounded by rolling hills and forests.
The village is located in a humid continental climate zone, and experiences hot, humid summers and cold, snowy winters. The average annual temperature is approximately 50 degrees Fahrenheit, and the average annual precipitation is approximately 40 inches.
Economy
The economy of Middleport is largely based on agriculture and tourism. The village is home to several farms, which produce a variety of crops, including corn, wheat, oats, and hay. The village also has a number of dairies, which provide milk and other dairy products to the local population.
The village is also home to several small businesses, including restaurants, retail stores, and service providers. The village also has a number of bed and breakfasts, which attract tourists from all over the region.
Demographics
As of the 2010 census, the population of Middleport was 1,817 people. The population is predominantly white, with approximately 95% of the population identifying as white. The median household income is approximately $37,000, and the median home value is approximately $90,000. The village has a poverty rate of approximately 15%, and the unemployment rate is approximately 5%.
Common Questions
What is Per Capita Income in Middleport?
Per Capita income in Middleport is $23,218.
What is the Median Family Income in Middleport?
Median Family Income in Middleport is $47,917.
What is the Median Household income in Middleport?
Median Household Income in Middleport is $36,343.
What is Income or Wage Gap in Middleport?
Income or Wage Gap in Middleport is 15.4%.
Women in Middleport earn 84.6 cents for every dollar earned by a man.
What is Inequality or Gini Index in Middleport?
Inequality or Gini Index in Middleport is 0.46.
What is the Total Population of Middleport?
Total Population of Middleport is 2,053.
What is the Total Male Population of Middleport?
Total Male Population of Middleport is 1,067.
What is the Total Female Population of Middleport?
Total Female Population of Middleport is 986.
What is the Ratio of Males per 100 Females in Middleport?
There are 108.22 Males per 100 Females in Middleport.
What is the Ratio of Females per 100 Males in Middleport?
There are 92.41 Females per 100 Males in Middleport.
What is the Median Population Age in Middleport?
Median Population Age in Middleport is 42.5 Years.
What is the Average Family Size in Middleport
Average Family Size in Middleport is 2.9 People.
What is the Average Household Size in Middleport
Average Household Size in Middleport is 2.1 People.
How Large is the Labor Force in Middleport?
There are 866 People in the Labor Forcein in Middleport.
What is the Percentage of People in the Labor Force in Middleport?
51.9% of People are in the Labor Force in Middleport.
What is the Unemployment Rate in Middleport?
Unemployment Rate in Middleport is 2.7%.