Maumee, OH Map & Demographics
Maumee Map
Maumee Overview
$42,888
PER CAPITA INCOME
$98,676
AVG FAMILY INCOME
$79,203
AVG HOUSEHOLD INCOME
21.1%
WAGE / INCOME GAP [ % ]
78.9¢/ $1
WAGE / INCOME GAP [ $ ]
$10,512
FAMILY INCOME DEFICIT
0.41
INEQUALITY / GINI INDEX
13,824
TOTAL POPULATION
6,764
MALE POPULATION
7,060
FEMALE POPULATION
95.81
MALES / 100 FEMALES
104.38
FEMALES / 100 MALES
40.2
MEDIAN AGE
3.0
AVG FAMILY SIZE
2.3
AVG HOUSEHOLD SIZE
7,671
LABOR FORCE [ PEOPLE ]
69.2%
PERCENT IN LABOR FORCE
2.5%
UNEMPLOYMENT RATE
Maumee Zip Codes
Maumee Area Codes
Income in Maumee
Income Overview in Maumee
Per Capita Income in Maumee is $42,888, while median incomes of families and households are $98,676 and $79,203 respectively.
| Characteristic | Number | Measure |
| Per Capita Income | 13,824 | $42,888 |
| Median Family Income | 3,602 | $98,676 |
| Mean Family Income | 3,602 | $122,120 |
| Median Household Income | 5,906 | $79,203 |
| Mean Household Income | 5,906 | $99,646 |
| Income Deficit | 3,602 | $10,512 |
| Wage / Income Gap (%) | 13,824 | 21.11% |
| Wage / Income Gap ($) | 13,824 | 78.89¢ per $1 |
| Gini / Inequality Index | 13,824 | 0.41 |
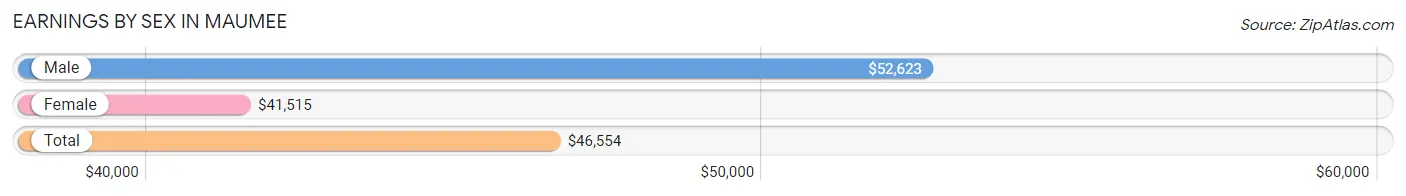
Earnings by Sex in Maumee
Average Earnings in Maumee are $46,554, $52,623 for men and $41,515 for women, a difference of 21.1%.
| Sex | Number | Average Earnings |
| Male | 4,044 (51.0%) | $52,623 |
| Female | 3,892 (49.0%) | $41,515 |
| Total | 7,936 (100.0%) | $46,554 |
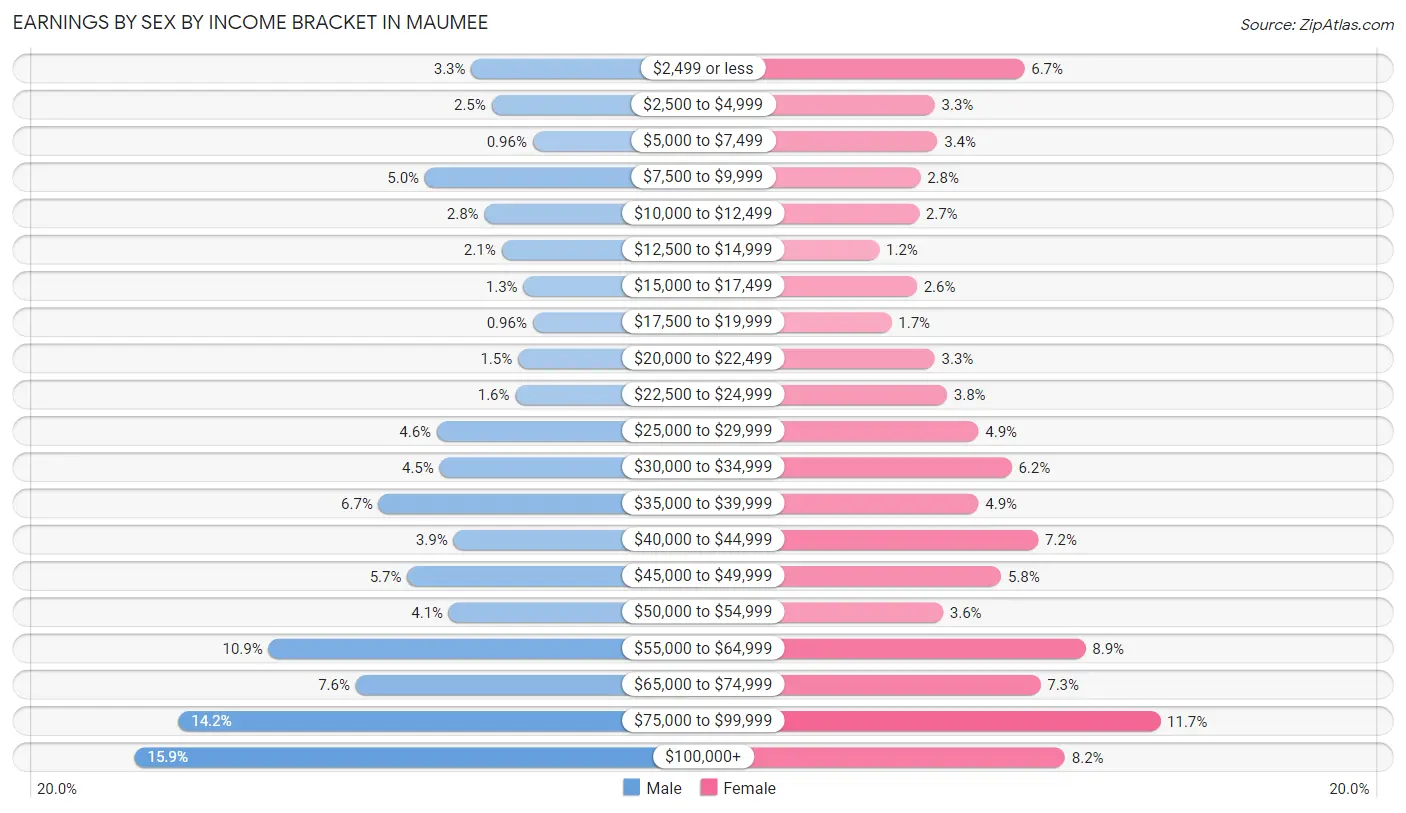
Earnings by Sex by Income Bracket in Maumee
The most common earnings brackets in Maumee are $100,000+ for men (642 | 15.9%) and $75,000 to $99,999 for women (457 | 11.7%).
| Income | Male | Female |
| $2,499 or less | 132 (3.3%) | 259 (6.7%) |
| $2,500 to $4,999 | 101 (2.5%) | 128 (3.3%) |
| $5,000 to $7,499 | 39 (1.0%) | 132 (3.4%) |
| $7,500 to $9,999 | 202 (5.0%) | 107 (2.8%) |
| $10,000 to $12,499 | 112 (2.8%) | 105 (2.7%) |
| $12,500 to $14,999 | 86 (2.1%) | 47 (1.2%) |
| $15,000 to $17,499 | 53 (1.3%) | 102 (2.6%) |
| $17,500 to $19,999 | 39 (1.0%) | 65 (1.7%) |
| $20,000 to $22,499 | 61 (1.5%) | 128 (3.3%) |
| $22,500 to $24,999 | 65 (1.6%) | 146 (3.7%) |
| $25,000 to $29,999 | 184 (4.5%) | 192 (4.9%) |
| $30,000 to $34,999 | 180 (4.4%) | 240 (6.2%) |
| $35,000 to $39,999 | 272 (6.7%) | 192 (4.9%) |
| $40,000 to $44,999 | 159 (3.9%) | 279 (7.2%) |
| $45,000 to $49,999 | 229 (5.7%) | 225 (5.8%) |
| $50,000 to $54,999 | 166 (4.1%) | 140 (3.6%) |
| $55,000 to $64,999 | 439 (10.9%) | 348 (8.9%) |
| $65,000 to $74,999 | 307 (7.6%) | 282 (7.2%) |
| $75,000 to $99,999 | 576 (14.2%) | 457 (11.7%) |
| $100,000+ | 642 (15.9%) | 318 (8.2%) |
| Total | 4,044 (100.0%) | 3,892 (100.0%) |
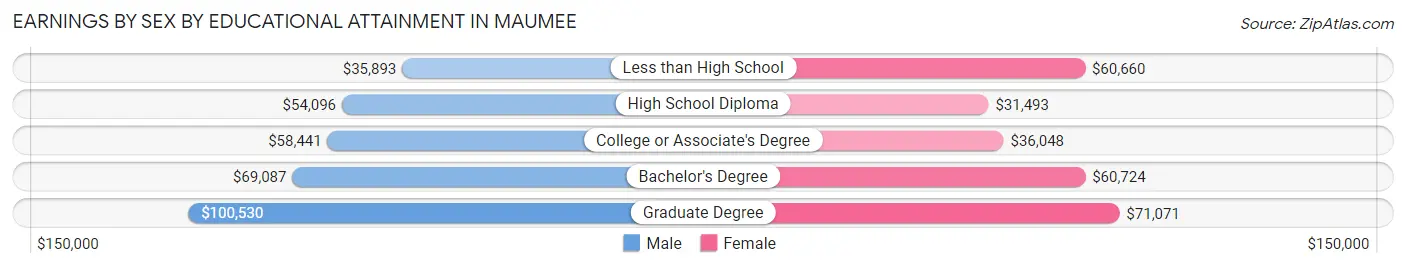
Earnings by Sex by Educational Attainment in Maumee
Average earnings in Maumee are $60,028 for men and $45,923 for women, a difference of 23.5%. Men with an educational attainment of graduate degree enjoy the highest average annual earnings of $100,530, while those with less than high school education earn the least with $35,893. Women with an educational attainment of graduate degree earn the most with the average annual earnings of $71,071, while those with high school diploma education have the smallest earnings of $31,493.
| Educational Attainment | Male Income | Female Income |
| Less than High School | $35,893 | $60,660 |
| High School Diploma | $54,096 | $31,493 |
| College or Associate's Degree | $58,441 | $36,048 |
| Bachelor's Degree | $69,087 | $60,724 |
| Graduate Degree | $100,530 | $71,071 |
| Total | $60,028 | $45,923 |
Family Income in Maumee
Family Income Brackets in Maumee
According to the Maumee family income data, there are 958 families falling into the $100,000 to $149,999 income range, which is the most common income bracket and makes up 26.6% of all families. Conversely, the less than $10,000 income bracket is the least frequent group with only 32 families (0.9%) belonging to this category.
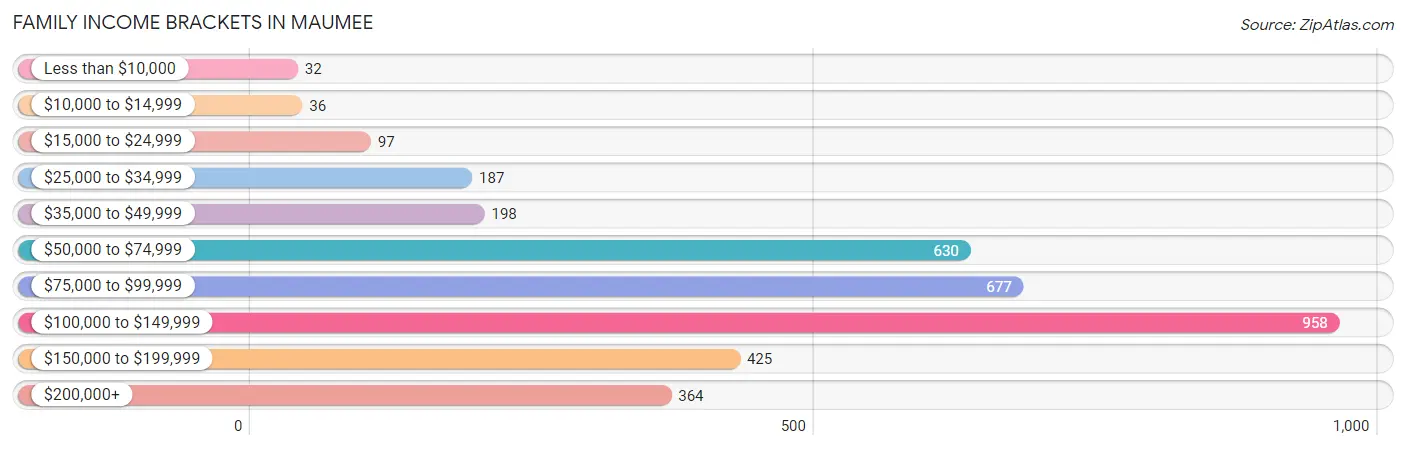
| Income Bracket | # Families | % Families |
| Less than $10,000 | 32 | 0.9% |
| $10,000 to $14,999 | 36 | 1.0% |
| $15,000 to $24,999 | 97 | 2.7% |
| $25,000 to $34,999 | 187 | 5.2% |
| $35,000 to $49,999 | 198 | 5.5% |
| $50,000 to $74,999 | 630 | 17.5% |
| $75,000 to $99,999 | 677 | 18.8% |
| $100,000 to $149,999 | 958 | 26.6% |
| $150,000 to $199,999 | 425 | 11.8% |
| $200,000+ | 364 | 10.1% |
Family Income by Famaliy Size in Maumee
4-person families (686 | 19.0%) account for the highest median family income in Maumee with $128,712 per family, while 3-person families (757 | 21.0%) have the highest median income of $42,656 per family member.
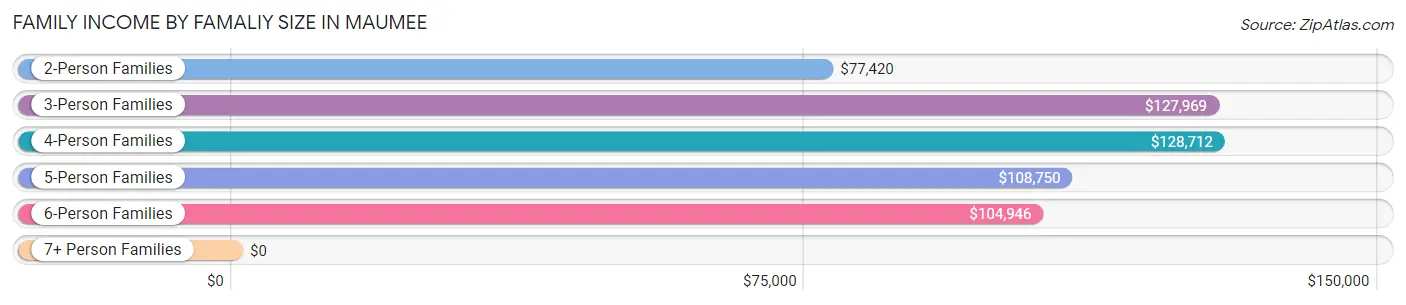
| Income Bracket | # Families | Median Income |
| 2-Person Families | 1,807 (50.2%) | $77,420 |
| 3-Person Families | 757 (21.0%) | $127,969 |
| 4-Person Families | 686 (19.0%) | $128,712 |
| 5-Person Families | 162 (4.5%) | $108,750 |
| 6-Person Families | 169 (4.7%) | $104,946 |
| 7+ Person Families | 21 (0.6%) | $0 |
| Total | 3,602 (100.0%) | $98,676 |
Family Income by Number of Earners in Maumee
The median family income in Maumee is $98,676, with families comprising 3+ earners (535) having the highest median family income of $163,523, while families with no earners (590) have the lowest median family income of $52,500, accounting for 14.8% and 16.4% of families, respectively.
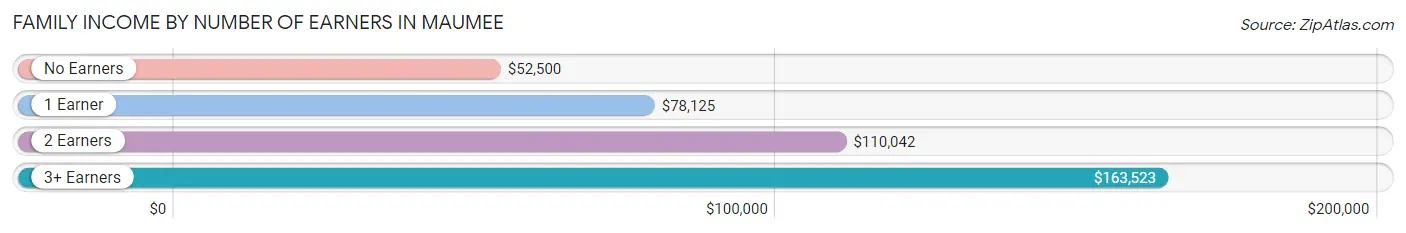
| Number of Earners | # Families | Median Income |
| No Earners | 590 (16.4%) | $52,500 |
| 1 Earner | 838 (23.3%) | $78,125 |
| 2 Earners | 1,639 (45.5%) | $110,042 |
| 3+ Earners | 535 (14.8%) | $163,523 |
| Total | 3,602 (100.0%) | $98,676 |
Household Income in Maumee
Household Income Brackets in Maumee
With 1,264 households falling in the category, the $100,000 to $149,999 income range is the most frequent in Maumee, accounting for 21.4% of all households. In contrast, only 130 households (2.2%) fall into the $10,000 to $14,999 income bracket, making it the least populous group.
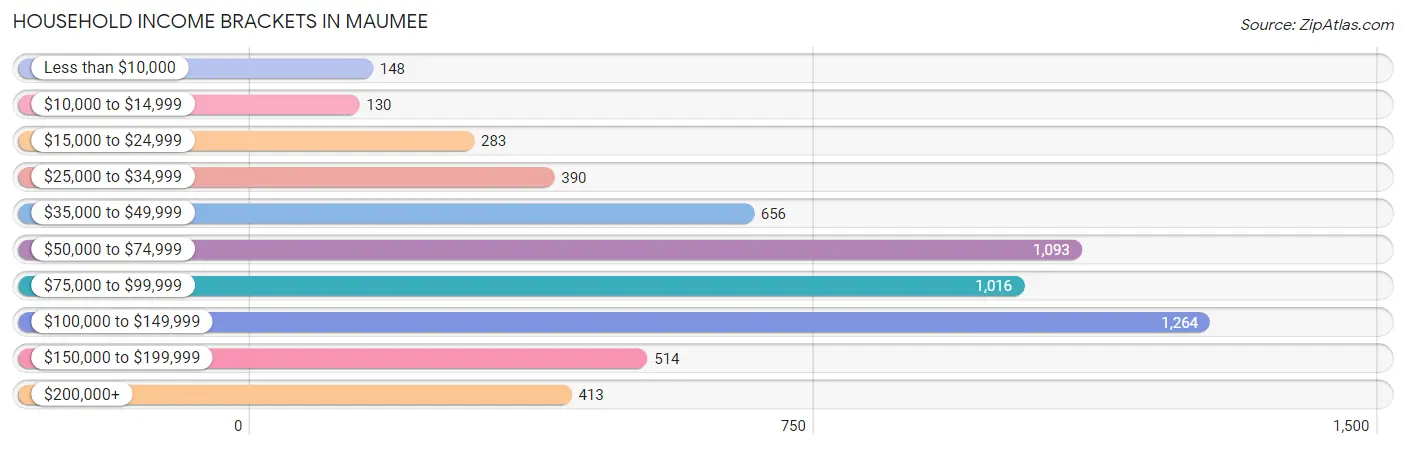
| Income Bracket | # Households | % Households |
| Less than $10,000 | 148 | 2.5% |
| $10,000 to $14,999 | 130 | 2.2% |
| $15,000 to $24,999 | 283 | 4.8% |
| $25,000 to $34,999 | 390 | 6.6% |
| $35,000 to $49,999 | 656 | 11.1% |
| $50,000 to $74,999 | 1,093 | 18.5% |
| $75,000 to $99,999 | 1,016 | 17.2% |
| $100,000 to $149,999 | 1,264 | 21.4% |
| $150,000 to $199,999 | 514 | 8.7% |
| $200,000+ | 413 | 7.0% |
Household Income by Householder Age in Maumee
The median household income in Maumee is $79,203, with the highest median household income of $104,419 found in the 45 to 64 years age bracket for the primary householder. A total of 2,313 households (39.2%) fall into this category. Meanwhile, the 65+ years age bracket for the primary householder has the lowest median household income of $53,703, with 1,659 households (28.1%) in this group.
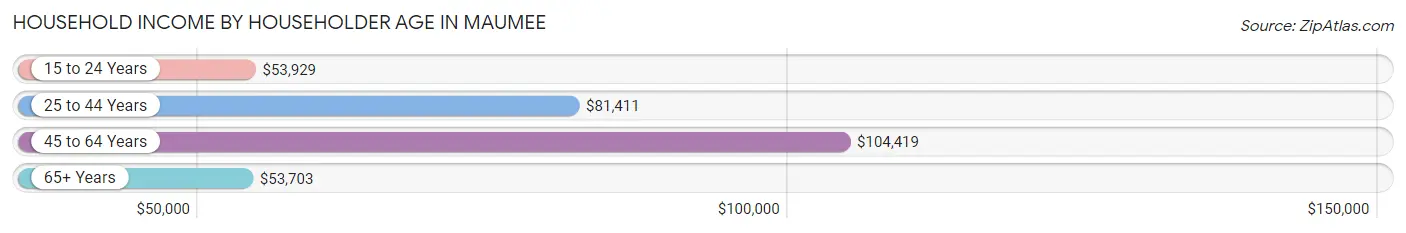
| Income Bracket | # Households | Median Income |
| 15 to 24 Years | 132 (2.2%) | $53,929 |
| 25 to 44 Years | 1,802 (30.5%) | $81,411 |
| 45 to 64 Years | 2,313 (39.2%) | $104,419 |
| 65+ Years | 1,659 (28.1%) | $53,703 |
| Total | 5,906 (100.0%) | $79,203 |
Poverty in Maumee
Income Below Poverty by Sex and Age in Maumee
With 4.3% poverty level for males and 6.1% for females among the residents of Maumee, 16 and 17 year old males and 5 year old females are the most vulnerable to poverty, with 11 males (8.4%) and 16 females (40.0%) in their respective age groups living below the poverty level.
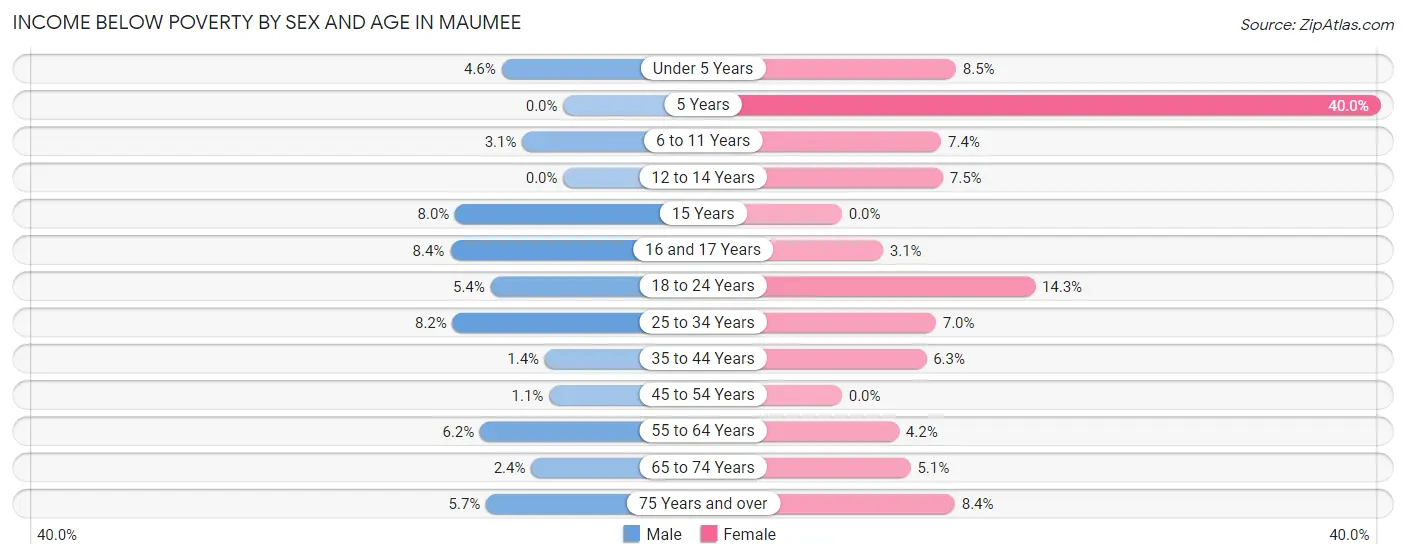
| Age Bracket | Male | Female |
| Under 5 Years | 25 (4.6%) | 36 (8.5%) |
| 5 Years | 0 (0.0%) | 16 (40.0%) |
| 6 to 11 Years | 9 (3.0%) | 32 (7.4%) |
| 12 to 14 Years | 0 (0.0%) | 18 (7.5%) |
| 15 Years | 11 (8.0%) | 0 (0.0%) |
| 16 and 17 Years | 11 (8.4%) | 4 (3.0%) |
| 18 to 24 Years | 34 (5.4%) | 70 (14.3%) |
| 25 to 34 Years | 85 (8.2%) | 69 (7.0%) |
| 35 to 44 Years | 10 (1.4%) | 48 (6.3%) |
| 45 to 54 Years | 9 (1.1%) | 0 (0.0%) |
| 55 to 64 Years | 56 (6.2%) | 44 (4.2%) |
| 65 to 74 Years | 15 (2.4%) | 45 (5.1%) |
| 75 Years and over | 25 (5.7%) | 47 (8.4%) |
| Total | 290 (4.3%) | 429 (6.1%) |
Income Above Poverty by Sex and Age in Maumee
According to the poverty statistics in Maumee, males aged 5 years and females aged 15 years are the age groups that are most secure financially, with 100.0% of males and 100.0% of females in these age groups living above the poverty line.
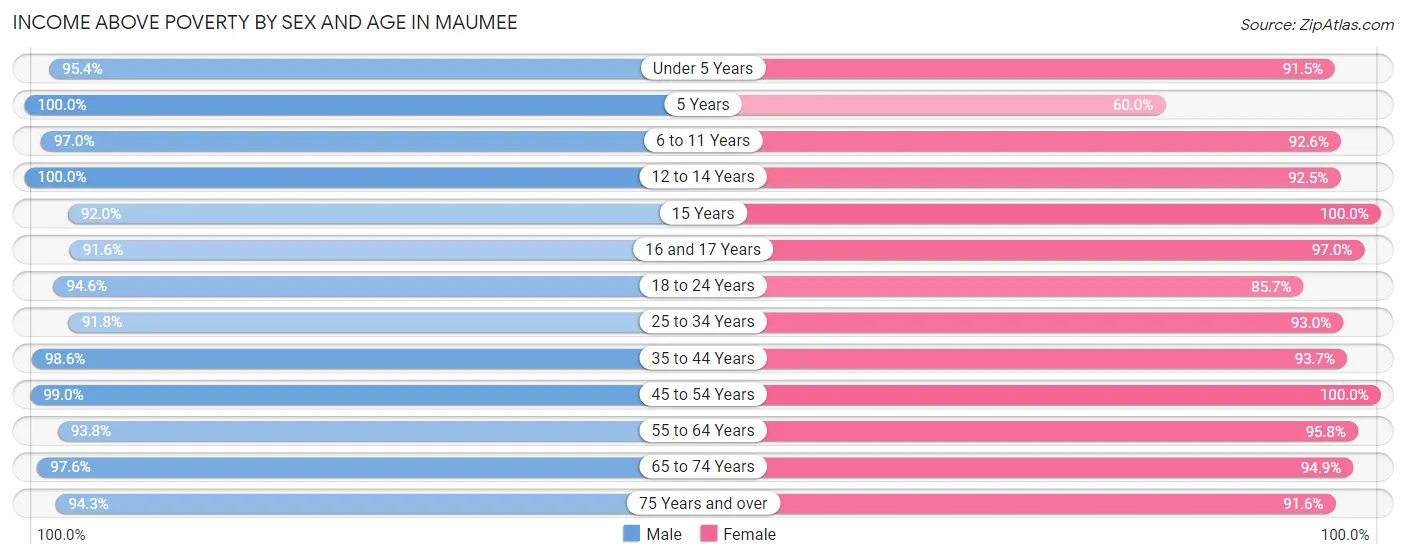
| Age Bracket | Male | Female |
| Under 5 Years | 520 (95.4%) | 389 (91.5%) |
| 5 Years | 44 (100.0%) | 24 (60.0%) |
| 6 to 11 Years | 286 (97.0%) | 402 (92.6%) |
| 12 to 14 Years | 333 (100.0%) | 222 (92.5%) |
| 15 Years | 126 (92.0%) | 166 (100.0%) |
| 16 and 17 Years | 120 (91.6%) | 127 (97.0%) |
| 18 to 24 Years | 596 (94.6%) | 418 (85.7%) |
| 25 to 34 Years | 949 (91.8%) | 920 (93.0%) |
| 35 to 44 Years | 722 (98.6%) | 717 (93.7%) |
| 45 to 54 Years | 845 (99.0%) | 879 (100.0%) |
| 55 to 64 Years | 850 (93.8%) | 993 (95.8%) |
| 65 to 74 Years | 615 (97.6%) | 838 (94.9%) |
| 75 Years and over | 411 (94.3%) | 513 (91.6%) |
| Total | 6,417 (95.7%) | 6,608 (93.9%) |
Income Below Poverty Among Married-Couple Families in Maumee
The poverty statistics for married-couple families in Maumee show that 1.6% or 47 of the total 2,906 families live below the poverty line. Families with 3 or 4 children have the highest poverty rate of 1.9%, comprising of 5 families. On the other hand, families with 1 or 2 children have the lowest poverty rate of 1.1%, which includes 10 families.
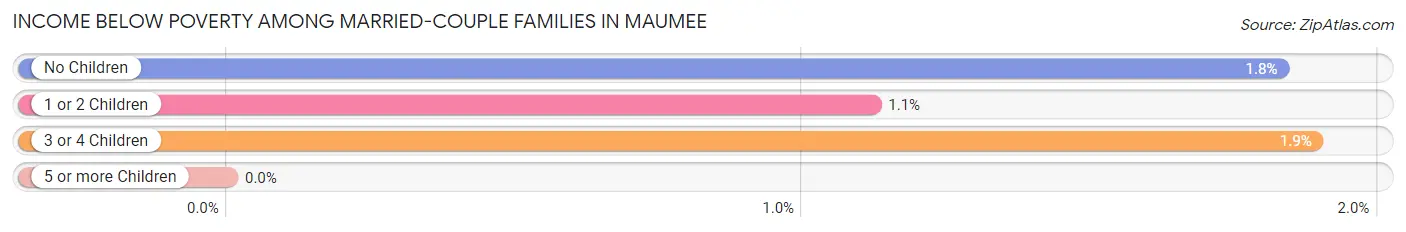
| Children | Above Poverty | Below Poverty |
| No Children | 1,718 (98.2%) | 32 (1.8%) |
| 1 or 2 Children | 882 (98.9%) | 10 (1.1%) |
| 3 or 4 Children | 259 (98.1%) | 5 (1.9%) |
| 5 or more Children | 0 (0.0%) | 0 (0.0%) |
| Total | 2,859 (98.4%) | 47 (1.6%) |
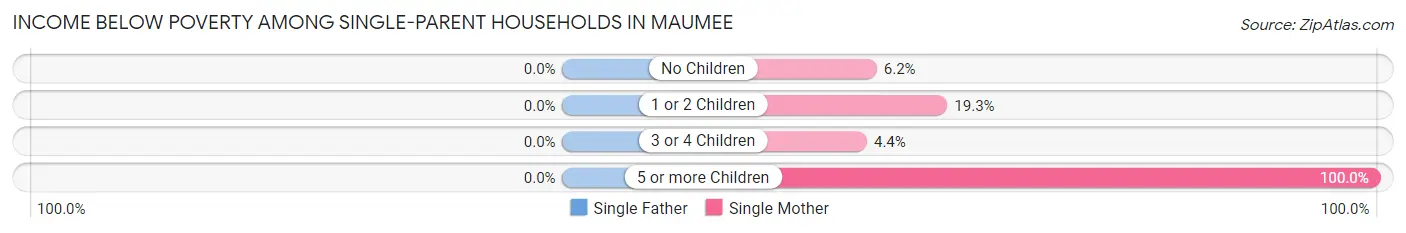
Income Below Poverty Among Single-Parent Households in Maumee
| Children | Single Father | Single Mother |
| No Children | 0 (0.0%) | 16 (6.2%) |
| 1 or 2 Children | 0 (0.0%) | 40 (19.3%) |
| 3 or 4 Children | 0 (0.0%) | 1 (4.3%) |
| 5 or more Children | 0 (0.0%) | 9 (100.0%) |
| Total | 0 (0.0%) | 66 (13.3%) |
Income Below Poverty Among Married-Couple vs Single-Parent Households in Maumee
The poverty data for Maumee shows that 47 of the married-couple family households (1.6%) and 66 of the single-parent households (9.5%) are living below the poverty level. Within the married-couple family households, those with 3 or 4 children have the highest poverty rate, with 5 households (1.9%) falling below the poverty line. Among the single-parent households, those with 5 or more children have the highest poverty rate, with 9 household (100.0%) living below poverty.
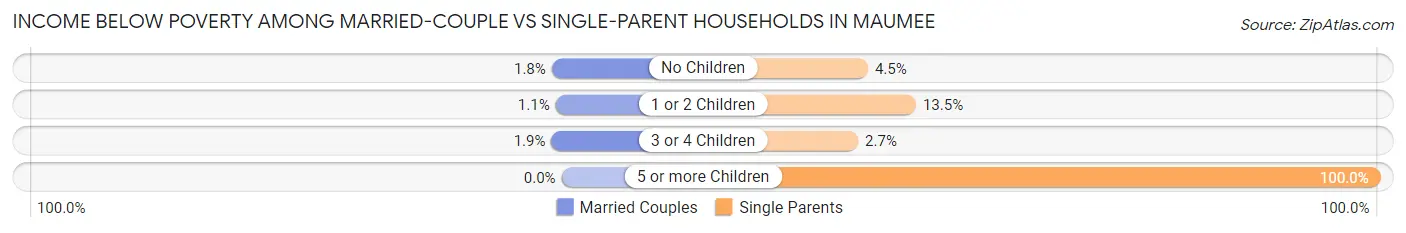
| Children | Married-Couple Families | Single-Parent Households |
| No Children | 32 (1.8%) | 16 (4.5%) |
| 1 or 2 Children | 10 (1.1%) | 40 (13.5%) |
| 3 or 4 Children | 5 (1.9%) | 1 (2.7%) |
| 5 or more Children | 0 (0.0%) | 9 (100.0%) |
| Total | 47 (1.6%) | 66 (9.5%) |
Race in Maumee
The most populous races in Maumee are White / Caucasian (12,530 | 90.6%), Hispanic or Latino (878 | 6.4%), and Two or more Races (677 | 4.9%).
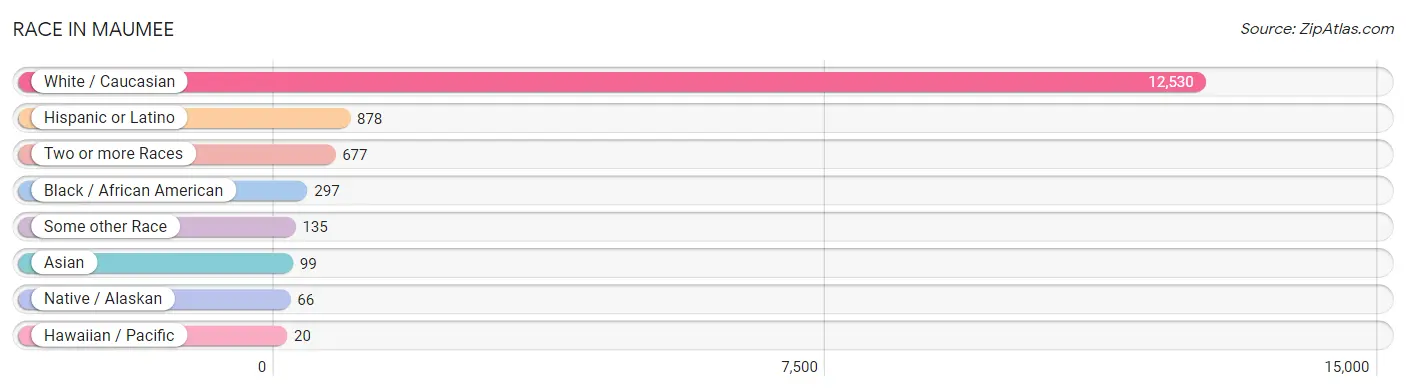
| Race | # Population | % Population |
| Asian | 99 | 0.7% |
| Black / African American | 297 | 2.1% |
| Hawaiian / Pacific | 20 | 0.1% |
| Hispanic or Latino | 878 | 6.4% |
| Native / Alaskan | 66 | 0.5% |
| White / Caucasian | 12,530 | 90.6% |
| Two or more Races | 677 | 4.9% |
| Some other Race | 135 | 1.0% |
| Total | 13,824 | 100.0% |
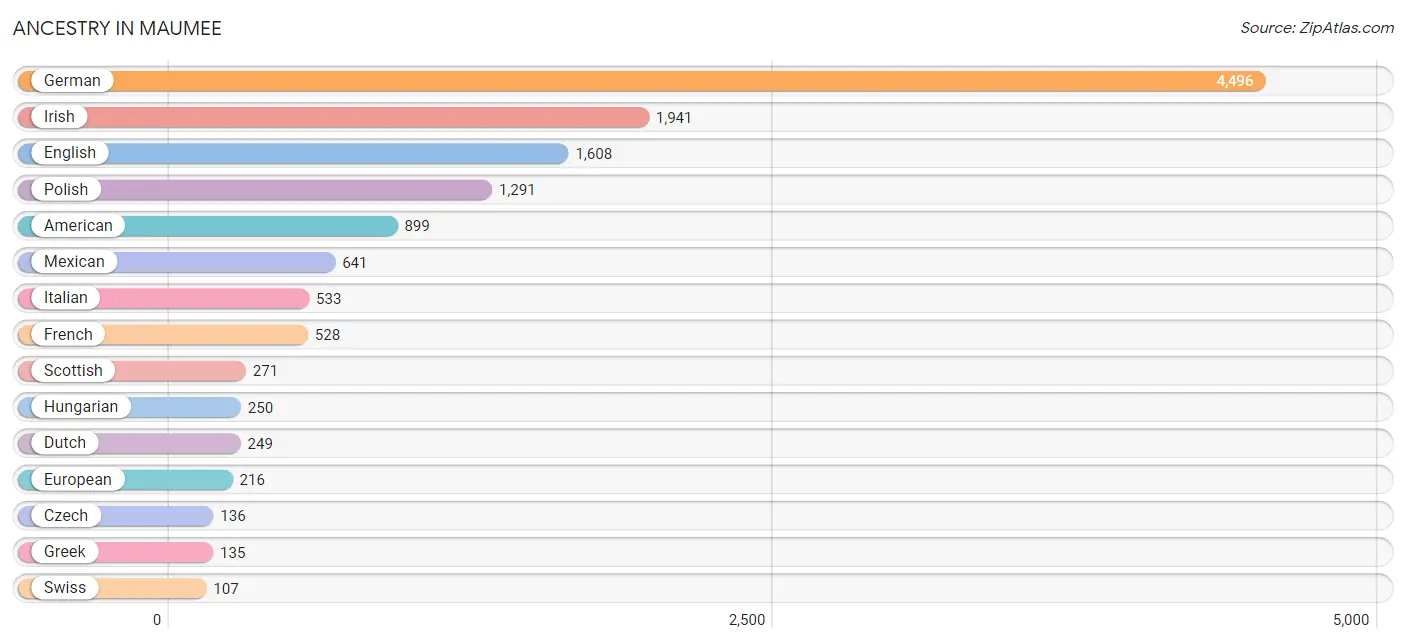
Ancestry in Maumee
The most populous ancestries reported in Maumee are German (4,496 | 32.5%), Irish (1,941 | 14.0%), English (1,608 | 11.6%), Polish (1,291 | 9.3%), and American (899 | 6.5%), together accounting for 74.0% of all Maumee residents.
| Ancestry | # Population | % Population |
| African | 33 | 0.2% |
| Alsatian | 25 | 0.2% |
| American | 899 | 6.5% |
| Arab | 74 | 0.5% |
| Argentinean | 13 | 0.1% |
| Armenian | 8 | 0.1% |
| Austrian | 25 | 0.2% |
| Belgian | 91 | 0.7% |
| Bhutanese | 7 | 0.1% |
| Blackfeet | 4 | 0.0% |
| British | 93 | 0.7% |
| Bulgarian | 7 | 0.1% |
| Burmese | 90 | 0.6% |
| Canadian | 32 | 0.2% |
| Central American | 23 | 0.2% |
| Cherokee | 58 | 0.4% |
| Croatian | 5 | 0.0% |
| Cuban | 16 | 0.1% |
| Czech | 136 | 1.0% |
| Czechoslovakian | 18 | 0.1% |
| Dutch | 249 | 1.8% |
| Eastern European | 64 | 0.5% |
| Egyptian | 6 | 0.0% |
| English | 1,608 | 11.6% |
| Ethiopian | 14 | 0.1% |
| European | 216 | 1.6% |
| Finnish | 55 | 0.4% |
| French | 528 | 3.8% |
| French Canadian | 63 | 0.5% |
| German | 4,496 | 32.5% |
| Greek | 135 | 1.0% |
| Guatemalan | 23 | 0.2% |
| Hungarian | 250 | 1.8% |
| Indian (Asian) | 30 | 0.2% |
| Irish | 1,941 | 14.0% |
| Iroquois | 10 | 0.1% |
| Israeli | 4 | 0.0% |
| Italian | 533 | 3.9% |
| Korean | 39 | 0.3% |
| Lebanese | 70 | 0.5% |
| Lithuanian | 7 | 0.1% |
| Luxembourger | 4 | 0.0% |
| Menominee | 9 | 0.1% |
| Mexican | 641 | 4.6% |
| Mexican American Indian | 16 | 0.1% |
| Northern European | 22 | 0.2% |
| Norwegian | 84 | 0.6% |
| Palestinian | 4 | 0.0% |
| Peruvian | 7 | 0.1% |
| Polish | 1,291 | 9.3% |
| Puerto Rican | 78 | 0.6% |
| Romanian | 81 | 0.6% |
| Russian | 24 | 0.2% |
| Scandinavian | 77 | 0.6% |
| Scotch-Irish | 87 | 0.6% |
| Scottish | 271 | 2.0% |
| Serbian | 4 | 0.0% |
| Slovene | 6 | 0.0% |
| South American | 20 | 0.1% |
| Spaniard | 85 | 0.6% |
| Subsaharan African | 47 | 0.3% |
| Swedish | 92 | 0.7% |
| Swiss | 107 | 0.8% |
| Thai | 7 | 0.1% |
| Ukrainian | 46 | 0.3% |
| Welsh | 85 | 0.6% | View All 66 Rows |
Immigrants in Maumee
The most numerous immigrant groups reported in Maumee came from Asia (118 | 0.9%), Eastern Asia (71 | 0.5%), Canada (66 | 0.5%), Europe (61 | 0.4%), and Korea (50 | 0.4%), together accounting for 2.6% of all Maumee residents.
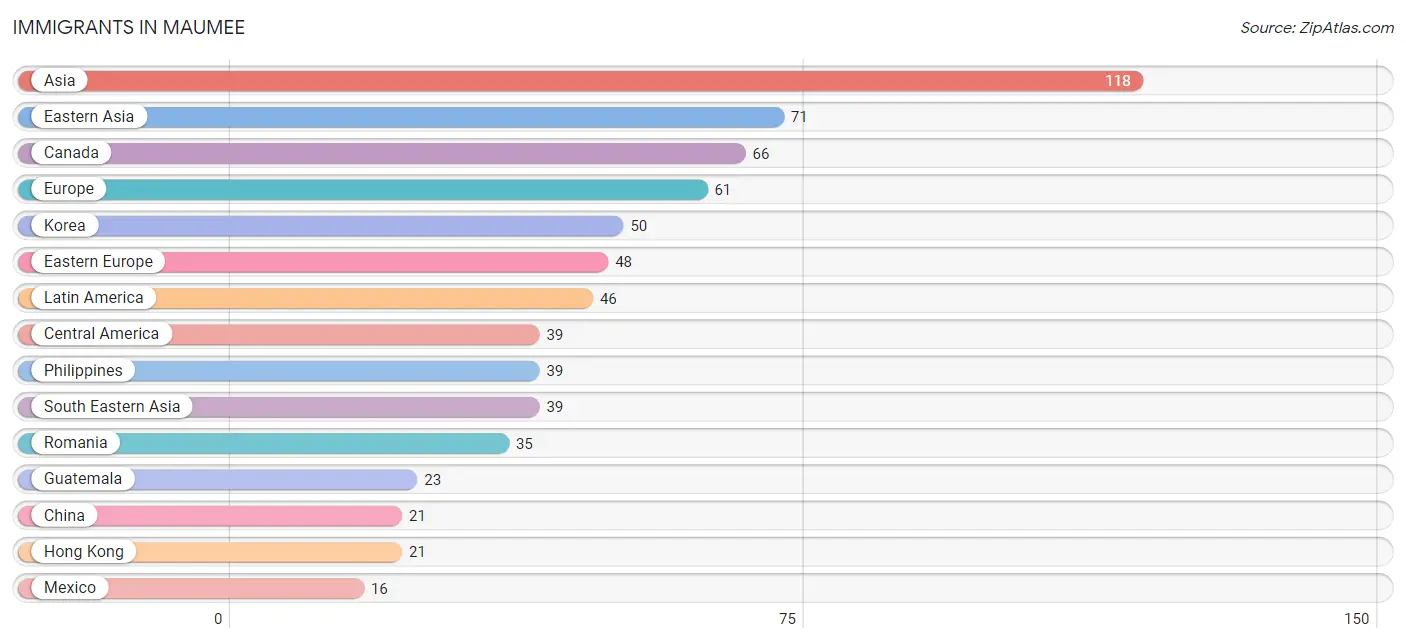
| Immigration Origin | # Population | % Population |
| Africa | 14 | 0.1% |
| Asia | 118 | 0.9% |
| Canada | 66 | 0.5% |
| Central America | 39 | 0.3% |
| China | 21 | 0.2% |
| Eastern Africa | 14 | 0.1% |
| Eastern Asia | 71 | 0.5% |
| Eastern Europe | 48 | 0.4% |
| England | 4 | 0.0% |
| Ethiopia | 14 | 0.1% |
| Europe | 61 | 0.4% |
| Guatemala | 23 | 0.2% |
| Hong Kong | 21 | 0.2% |
| Israel | 4 | 0.0% |
| Korea | 50 | 0.4% |
| Latin America | 46 | 0.3% |
| Mexico | 16 | 0.1% |
| Northern Europe | 13 | 0.1% |
| Peru | 7 | 0.1% |
| Philippines | 39 | 0.3% |
| Romania | 35 | 0.3% |
| Russia | 6 | 0.0% |
| Scotland | 9 | 0.1% |
| South America | 7 | 0.1% |
| South Eastern Asia | 39 | 0.3% |
| Ukraine | 7 | 0.1% |
| Western Asia | 4 | 0.0% | View All 27 Rows |
Sex and Age in Maumee
Sex and Age in Maumee
The most populous age groups in Maumee are Under 5 Years (557 | 8.2%) for men and 60 to 64 Years (569 | 8.1%) for women.
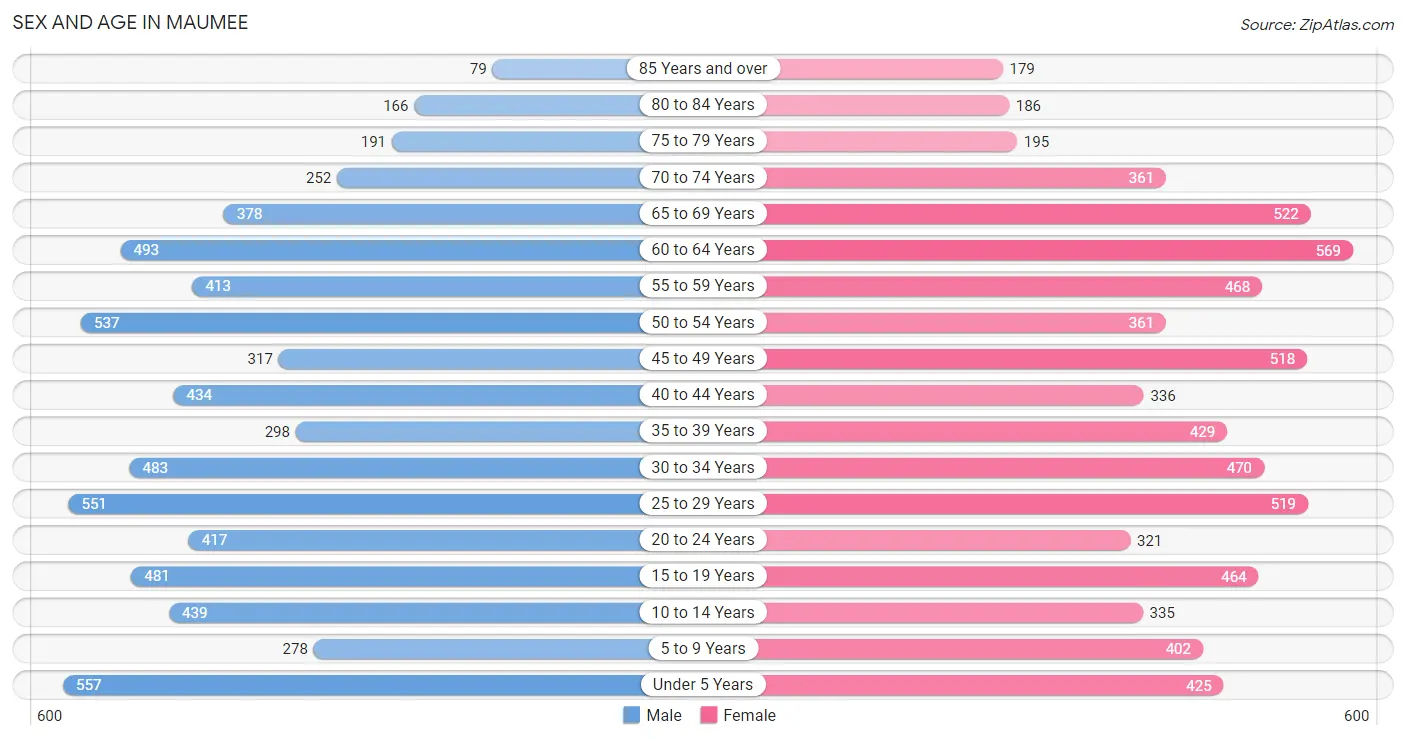
| Age Bracket | Male | Female |
| Under 5 Years | 557 (8.2%) | 425 (6.0%) |
| 5 to 9 Years | 278 (4.1%) | 402 (5.7%) |
| 10 to 14 Years | 439 (6.5%) | 335 (4.8%) |
| 15 to 19 Years | 481 (7.1%) | 464 (6.6%) |
| 20 to 24 Years | 417 (6.2%) | 321 (4.5%) |
| 25 to 29 Years | 551 (8.2%) | 519 (7.3%) |
| 30 to 34 Years | 483 (7.1%) | 470 (6.7%) |
| 35 to 39 Years | 298 (4.4%) | 429 (6.1%) |
| 40 to 44 Years | 434 (6.4%) | 336 (4.8%) |
| 45 to 49 Years | 317 (4.7%) | 518 (7.3%) |
| 50 to 54 Years | 537 (7.9%) | 361 (5.1%) |
| 55 to 59 Years | 413 (6.1%) | 468 (6.6%) |
| 60 to 64 Years | 493 (7.3%) | 569 (8.1%) |
| 65 to 69 Years | 378 (5.6%) | 522 (7.4%) |
| 70 to 74 Years | 252 (3.7%) | 361 (5.1%) |
| 75 to 79 Years | 191 (2.8%) | 195 (2.8%) |
| 80 to 84 Years | 166 (2.5%) | 186 (2.6%) |
| 85 Years and over | 79 (1.2%) | 179 (2.5%) |
| Total | 6,764 (100.0%) | 7,060 (100.0%) |
Families and Households in Maumee
Median Family Size in Maumee
The median family size in Maumee is 3.03 persons per family, with married-couple families (2,906 | 80.7%) accounting for the largest median family size of 3.1 persons per family. On the other hand, single female/mother families (498 | 13.8%) represent the smallest median family size with 2.68 persons per family.
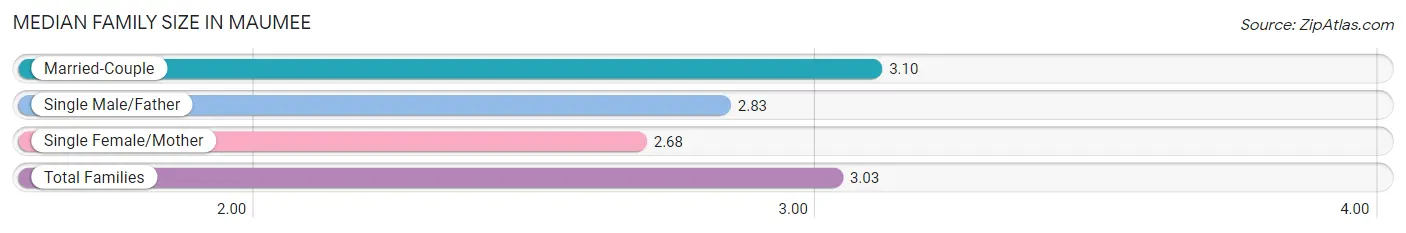
| Family Type | # Families | Family Size |
| Married-Couple | 2,906 (80.7%) | 3.10 |
| Single Male/Father | 198 (5.5%) | 2.83 |
| Single Female/Mother | 498 (13.8%) | 2.68 |
| Total Families | 3,602 (100.0%) | 3.03 |
Median Household Size in Maumee
The median household size in Maumee is 2.34 persons per household, with single male/father households (198 | 3.4%) accounting for the largest median household size of 3.34 persons per household. non-family households (2,304 | 39.0%) represent the smallest median household size with 1.13 persons per household.
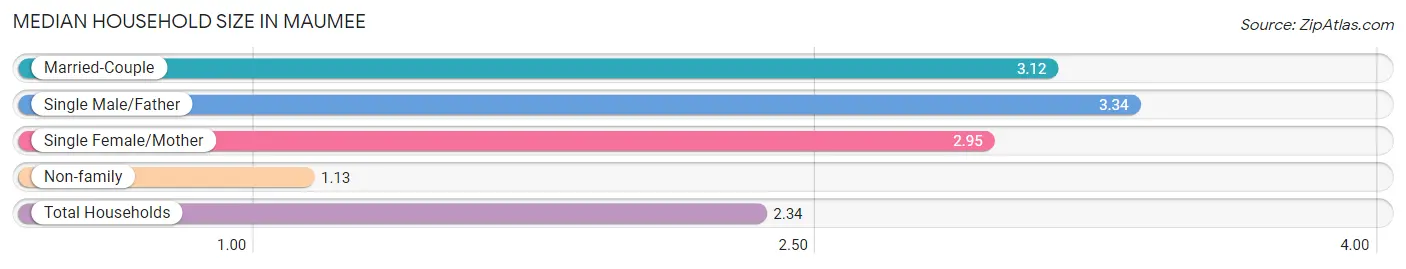
| Household Type | # Households | Household Size |
| Married-Couple | 2,906 (49.2%) | 3.12 |
| Single Male/Father | 198 (3.4%) | 3.34 |
| Single Female/Mother | 498 (8.4%) | 2.95 |
| Non-family | 2,304 (39.0%) | 1.13 |
| Total Households | 5,906 (100.0%) | 2.34 |
Household Size by Marriage Status in Maumee
Out of a total of 5,906 households in Maumee, 3,602 (61.0%) are family households, while 2,304 (39.0%) are nonfamily households. The most numerous type of family households are 2-person households, comprising 1,722, and the most common type of nonfamily households are 1-person households, comprising 1,970.
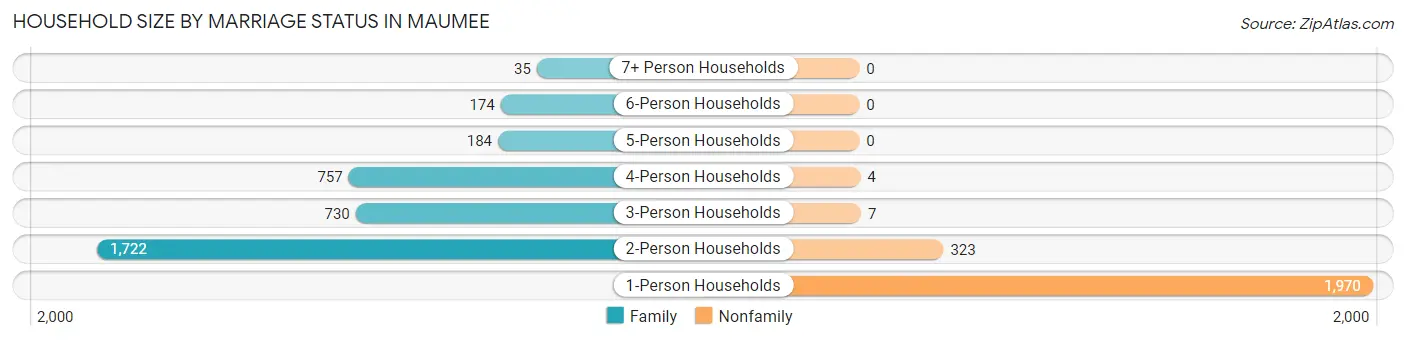
| Household Size | Family Households | Nonfamily Households |
| 1-Person Households | - | 1,970 (33.4%) |
| 2-Person Households | 1,722 (29.2%) | 323 (5.5%) |
| 3-Person Households | 730 (12.4%) | 7 (0.1%) |
| 4-Person Households | 757 (12.8%) | 4 (0.1%) |
| 5-Person Households | 184 (3.1%) | 0 (0.0%) |
| 6-Person Households | 174 (2.9%) | 0 (0.0%) |
| 7+ Person Households | 35 (0.6%) | 0 (0.0%) |
| Total | 3,602 (61.0%) | 2,304 (39.0%) |
Female Fertility in Maumee
Fertility by Age in Maumee
Average fertility rate in Maumee is 48.0 births per 1,000 women. Women in the age bracket of 20 to 34 years have the highest fertility rate with 84.0 births per 1,000 women. Women in the age bracket of 20 to 34 years acount for 72.9% of all women with births.
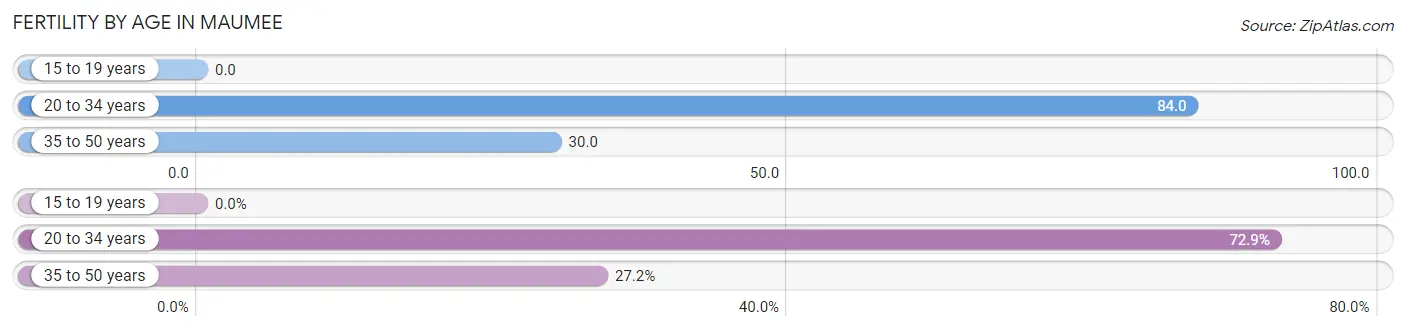
| Age Bracket | Women with Births | Births / 1,000 Women |
| 15 to 19 years | 0 (0.0%) | 0.0 |
| 20 to 34 years | 110 (72.9%) | 84.0 |
| 35 to 50 years | 41 (27.2%) | 30.0 |
| Total | 151 (100.0%) | 48.0 |
Fertility by Age by Marriage Status in Maumee
80.1% of women with births (151) in Maumee are married. The highest percentage of unmarried women with births falls into 20 to 34 years age bracket with 26.4% of them unmarried at the time of birth, while the lowest percentage of unmarried women with births belong to 35 to 50 years age bracket with 2.4% of them unmarried.
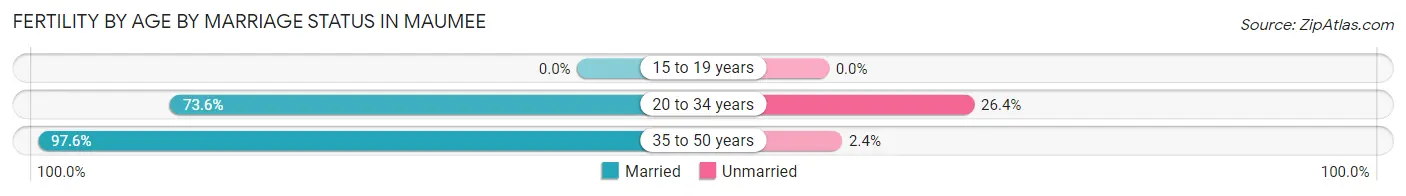
| Age Bracket | Married | Unmarried |
| 15 to 19 years | 0 (0.0%) | 0 (0.0%) |
| 20 to 34 years | 81 (73.6%) | 29 (26.4%) |
| 35 to 50 years | 40 (97.6%) | 1 (2.4%) |
| Total | 121 (80.1%) | 30 (19.9%) |
Fertility by Education in Maumee
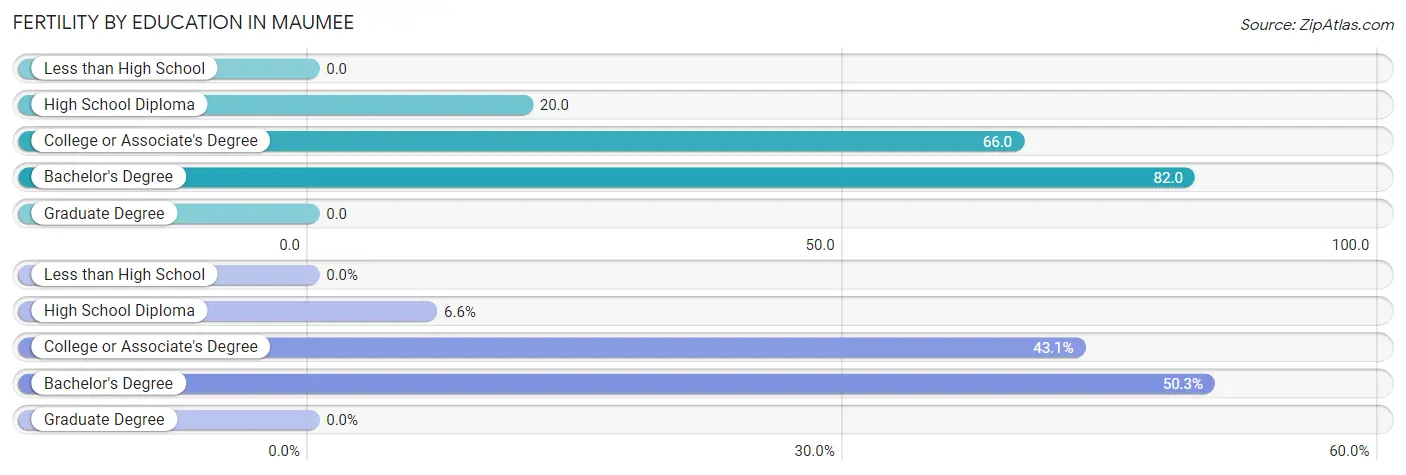
| Educational Attainment | Women with Births | Births / 1,000 Women |
| Less than High School | 0 (0.0%) | 0.0 |
| High School Diploma | 10 (6.6%) | 20.0 |
| College or Associate's Degree | 65 (43.0%) | 66.0 |
| Bachelor's Degree | 76 (50.3%) | 82.0 |
| Graduate Degree | 0 (0.0%) | 0.0 |
| Total | 151 (100.0%) | 48.0 |
Fertility by Education by Marriage Status in Maumee
19.9% of women with births in Maumee are unmarried. Women with the educational attainment of high school diploma are most likely to be married with 100.0% of them married at childbirth, while women with the educational attainment of bachelor's degree are least likely to be married with 23.7% of them unmarried at childbirth.
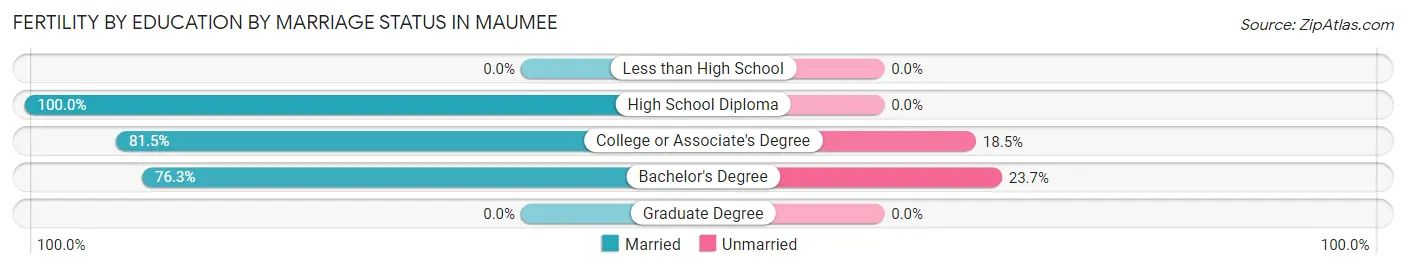
| Educational Attainment | Married | Unmarried |
| Less than High School | 0 (0.0%) | 0 (0.0%) |
| High School Diploma | 10 (100.0%) | 0 (0.0%) |
| College or Associate's Degree | 53 (81.5%) | 12 (18.5%) |
| Bachelor's Degree | 58 (76.3%) | 18 (23.7%) |
| Graduate Degree | 0 (0.0%) | 0 (0.0%) |
| Total | 121 (80.1%) | 30 (19.9%) |
Employment Characteristics in Maumee
Employment by Class of Employer in Maumee
Among the 7,337 employed individuals in Maumee, private company employees (5,030 | 68.6%), not-for-profit organizations (911 | 12.4%), and local government employees (618 | 8.4%) make up the most common classes of employment.
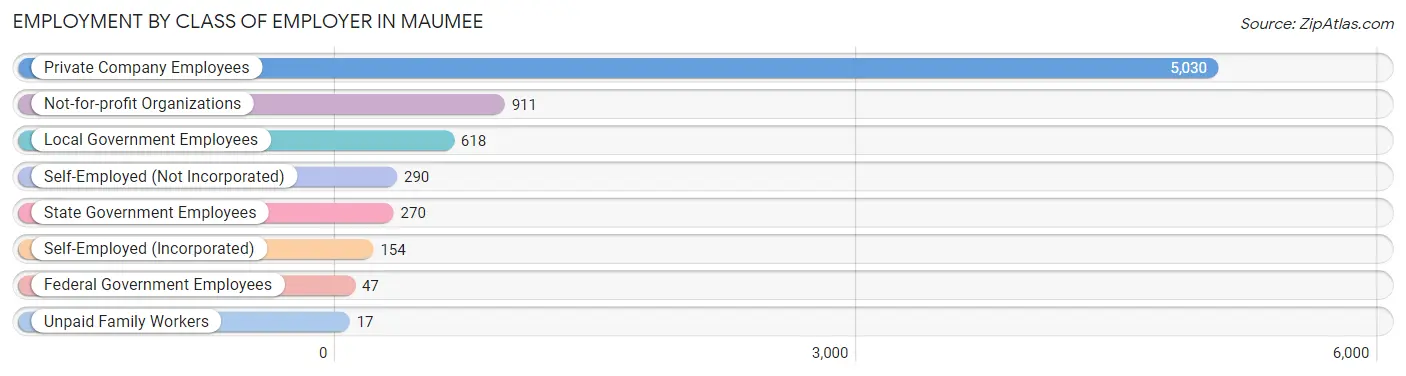
| Employer Class | # Employees | % Employees |
| Private Company Employees | 5,030 | 68.6% |
| Self-Employed (Incorporated) | 154 | 2.1% |
| Self-Employed (Not Incorporated) | 290 | 4.0% |
| Not-for-profit Organizations | 911 | 12.4% |
| Local Government Employees | 618 | 8.4% |
| State Government Employees | 270 | 3.7% |
| Federal Government Employees | 47 | 0.6% |
| Unpaid Family Workers | 17 | 0.2% |
| Total | 7,337 | 100.0% |
Employment Status by Age in Maumee
According to the labor force statistics for Maumee, out of the total population over 16 years of age (11,085), 69.2% or 7,671 individuals are in the labor force, with 2.5% or 192 of them unemployed. The age group with the highest labor force participation rate is 25 to 29 years, with 93.0% or 995 individuals in the labor force. Within the labor force, the 65 to 74 years age range has the highest percentage of unemployed individuals, with 7.4% or 31 of them being unemployed.
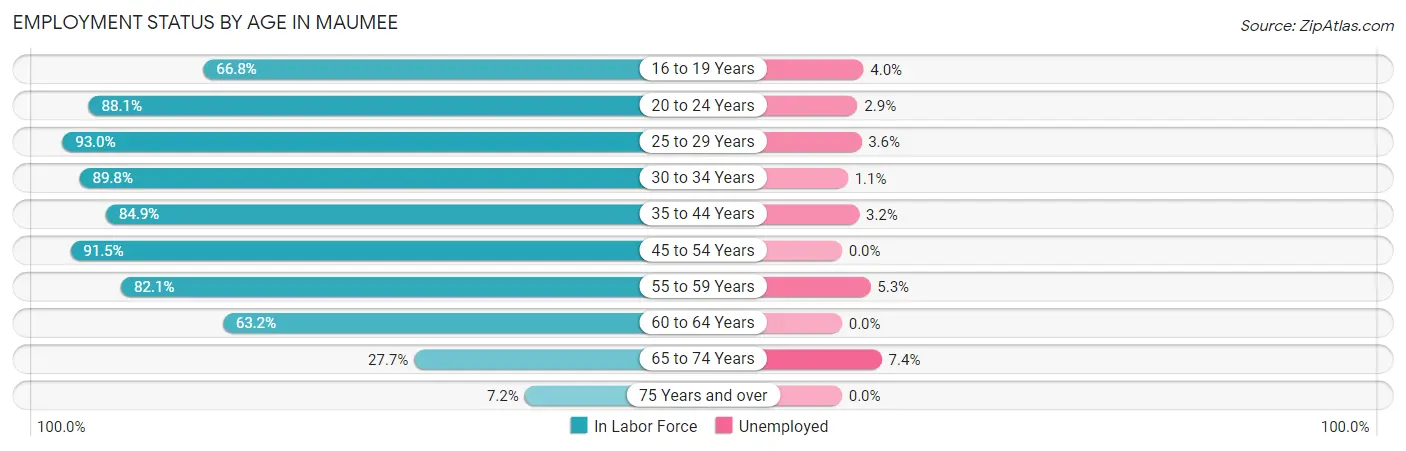
| Age Bracket | In Labor Force | Unemployed |
| 16 to 19 Years | 429 (66.8%) | 17 (4.0%) |
| 20 to 24 Years | 650 (88.1%) | 19 (2.9%) |
| 25 to 29 Years | 995 (93.0%) | 36 (3.6%) |
| 30 to 34 Years | 856 (89.8%) | 9 (1.1%) |
| 35 to 44 Years | 1,271 (84.9%) | 41 (3.2%) |
| 45 to 54 Years | 1,586 (91.5%) | 0 (0.0%) |
| 55 to 59 Years | 723 (82.1%) | 38 (5.3%) |
| 60 to 64 Years | 671 (63.2%) | 0 (0.0%) |
| 65 to 74 Years | 419 (27.7%) | 31 (7.4%) |
| 75 Years and over | 72 (7.2%) | 0 (0.0%) |
| Total | 7,671 (69.2%) | 192 (2.5%) |
Employment Status by Educational Attainment in Maumee
According to labor force statistics for Maumee, 84.8% of individuals (6,102) out of the total population between 25 and 64 years of age (7,196) are in the labor force, with 2.0% or 122 of them being unemployed. The group with the highest labor force participation rate are those with the educational attainment of less than high school, with 93.5% or 187 individuals in the labor force. Within the labor force, individuals with less than high school education have the highest percentage of unemployment, with 11.2% or 21 of them being unemployed.
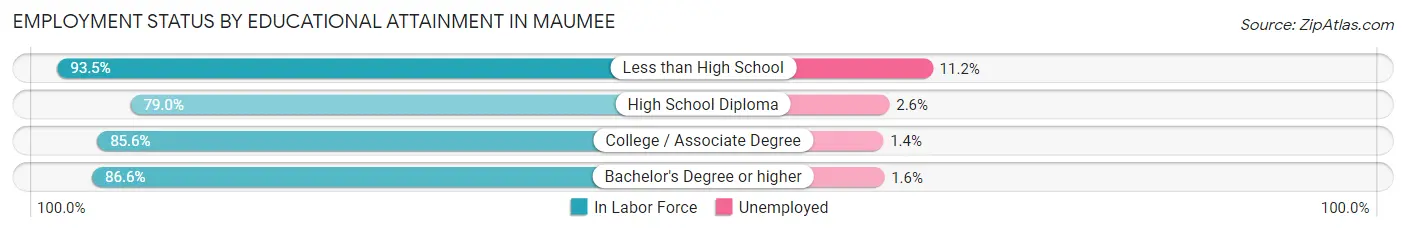
| Educational Attainment | In Labor Force | Unemployed |
| Less than High School | 187 (93.5%) | 22 (11.2%) |
| High School Diploma | 1,211 (79.0%) | 40 (2.6%) |
| College / Associate Degree | 2,210 (85.6%) | 36 (1.4%) |
| Bachelor's Degree or higher | 2,495 (86.6%) | 46 (1.6%) |
| Total | 6,102 (84.8%) | 144 (2.0%) |
Employment Occupations by Sex in Maumee
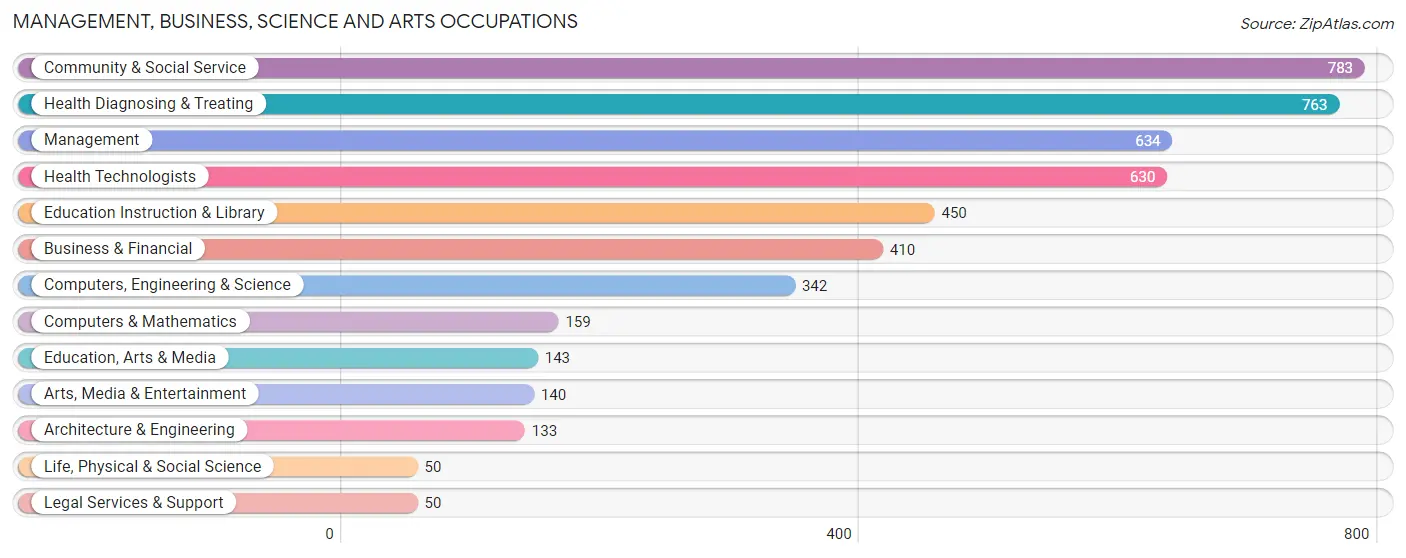
Management, Business, Science and Arts Occupations
The most common Management, Business, Science and Arts occupations in Maumee are Community & Social Service (783 | 10.5%), Health Diagnosing & Treating (763 | 10.2%), Management (634 | 8.5%), Health Technologists (630 | 8.4%), and Education Instruction & Library (450 | 6.0%).
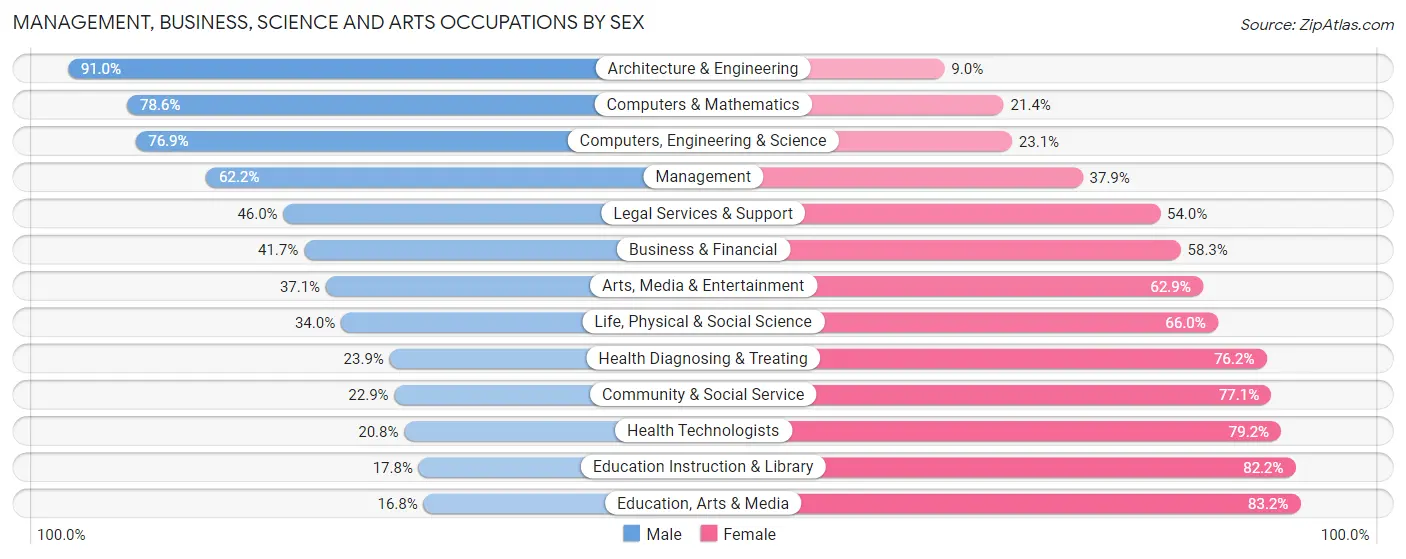
Management, Business, Science and Arts Occupations by Sex
Within the Management, Business, Science and Arts occupations in Maumee, the most male-oriented occupations are Architecture & Engineering (91.0%), Computers & Mathematics (78.6%), and Computers, Engineering & Science (76.9%), while the most female-oriented occupations are Education, Arts & Media (83.2%), Education Instruction & Library (82.2%), and Health Technologists (79.2%).
| Occupation | Male | Female |
| Management | 394 (62.2%) | 240 (37.9%) |
| Business & Financial | 171 (41.7%) | 239 (58.3%) |
| Computers, Engineering & Science | 263 (76.9%) | 79 (23.1%) |
| Computers & Mathematics | 125 (78.6%) | 34 (21.4%) |
| Architecture & Engineering | 121 (91.0%) | 12 (9.0%) |
| Life, Physical & Social Science | 17 (34.0%) | 33 (66.0%) |
| Community & Social Service | 179 (22.9%) | 604 (77.1%) |
| Education, Arts & Media | 24 (16.8%) | 119 (83.2%) |
| Legal Services & Support | 23 (46.0%) | 27 (54.0%) |
| Education Instruction & Library | 80 (17.8%) | 370 (82.2%) |
| Arts, Media & Entertainment | 52 (37.1%) | 88 (62.9%) |
| Health Diagnosing & Treating | 182 (23.8%) | 581 (76.1%) |
| Health Technologists | 131 (20.8%) | 499 (79.2%) |
| Total (Category) | 1,189 (40.6%) | 1,743 (59.5%) |
| Total (Overall) | 3,853 (51.5%) | 3,627 (48.5%) |
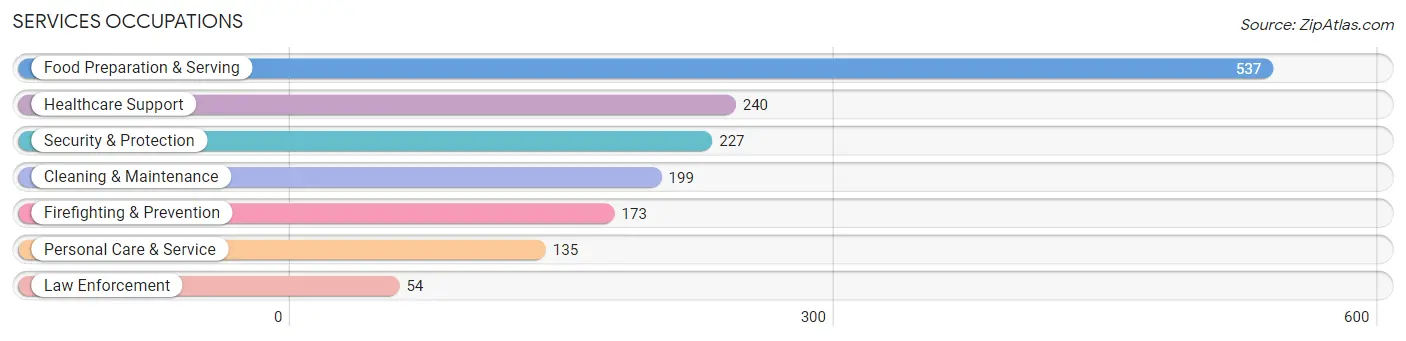
Services Occupations
The most common Services occupations in Maumee are Food Preparation & Serving (537 | 7.2%), Healthcare Support (240 | 3.2%), Security & Protection (227 | 3.0%), Cleaning & Maintenance (199 | 2.7%), and Firefighting & Prevention (173 | 2.3%).
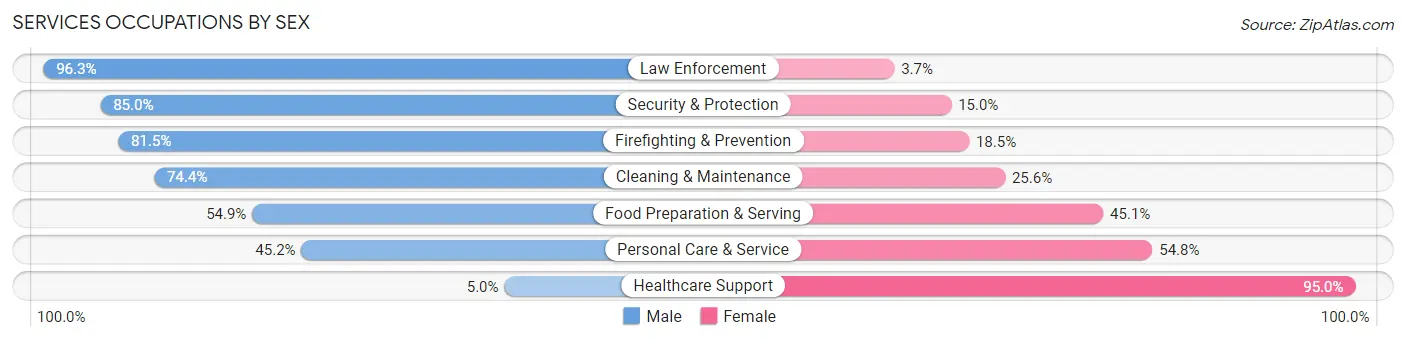
Services Occupations by Sex
Within the Services occupations in Maumee, the most male-oriented occupations are Law Enforcement (96.3%), Security & Protection (85.0%), and Firefighting & Prevention (81.5%), while the most female-oriented occupations are Healthcare Support (95.0%), Personal Care & Service (54.8%), and Food Preparation & Serving (45.1%).
| Occupation | Male | Female |
| Healthcare Support | 12 (5.0%) | 228 (95.0%) |
| Security & Protection | 193 (85.0%) | 34 (15.0%) |
| Firefighting & Prevention | 141 (81.5%) | 32 (18.5%) |
| Law Enforcement | 52 (96.3%) | 2 (3.7%) |
| Food Preparation & Serving | 295 (54.9%) | 242 (45.1%) |
| Cleaning & Maintenance | 148 (74.4%) | 51 (25.6%) |
| Personal Care & Service | 61 (45.2%) | 74 (54.8%) |
| Total (Category) | 709 (53.0%) | 629 (47.0%) |
| Total (Overall) | 3,853 (51.5%) | 3,627 (48.5%) |
Sales and Office Occupations
The most common Sales and Office occupations in Maumee are Office & Administration (851 | 11.4%), and Sales & Related (605 | 8.1%).
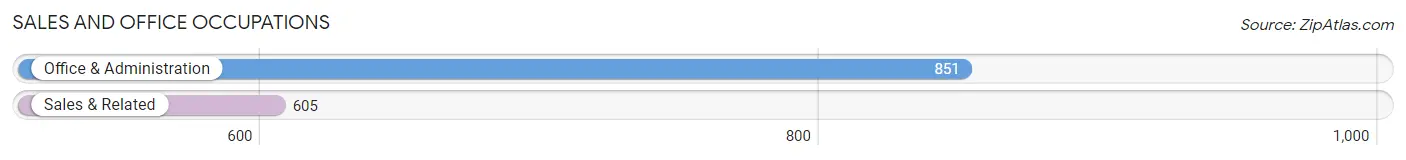
Sales and Office Occupations by Sex
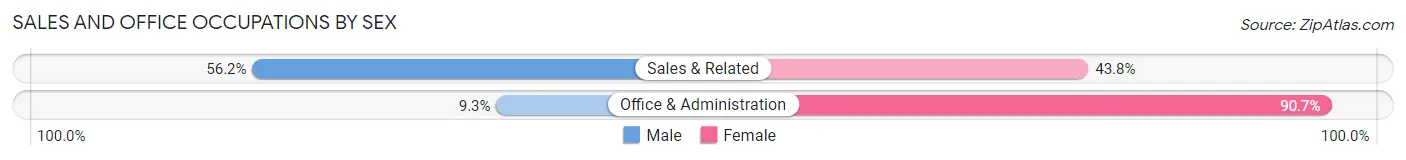
| Occupation | Male | Female |
| Sales & Related | 340 (56.2%) | 265 (43.8%) |
| Office & Administration | 79 (9.3%) | 772 (90.7%) |
| Total (Category) | 419 (28.8%) | 1,037 (71.2%) |
| Total (Overall) | 3,853 (51.5%) | 3,627 (48.5%) |
Natural Resources, Construction and Maintenance Occupations
The most common Natural Resources, Construction and Maintenance occupations in Maumee are Construction & Extraction (264 | 3.5%), Installation, Maintenance & Repair (241 | 3.2%), and Farming, Fishing & Forestry (3 | 0.0%).
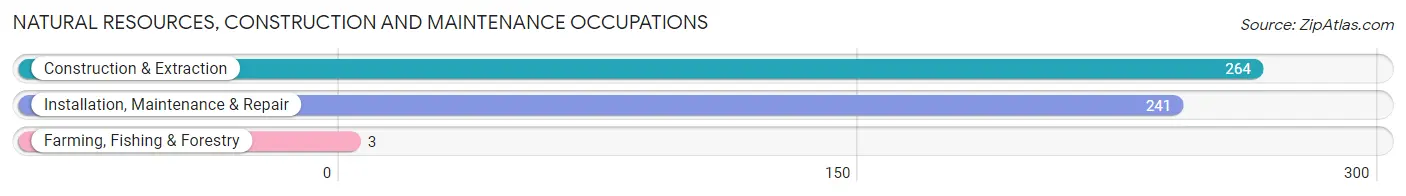
Natural Resources, Construction and Maintenance Occupations by Sex
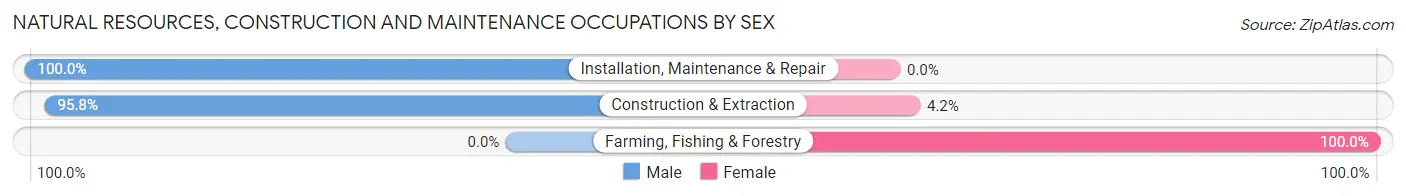
| Occupation | Male | Female |
| Farming, Fishing & Forestry | 0 (0.0%) | 3 (100.0%) |
| Construction & Extraction | 253 (95.8%) | 11 (4.2%) |
| Installation, Maintenance & Repair | 241 (100.0%) | 0 (0.0%) |
| Total (Category) | 494 (97.2%) | 14 (2.8%) |
| Total (Overall) | 3,853 (51.5%) | 3,627 (48.5%) |
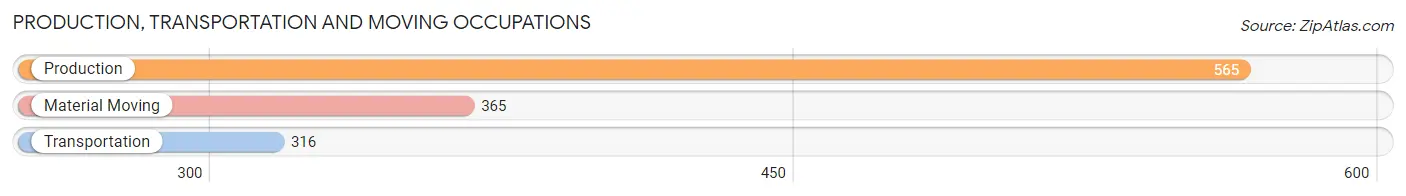
Production, Transportation and Moving Occupations
The most common Production, Transportation and Moving occupations in Maumee are Production (565 | 7.5%), Material Moving (365 | 4.9%), and Transportation (316 | 4.2%).
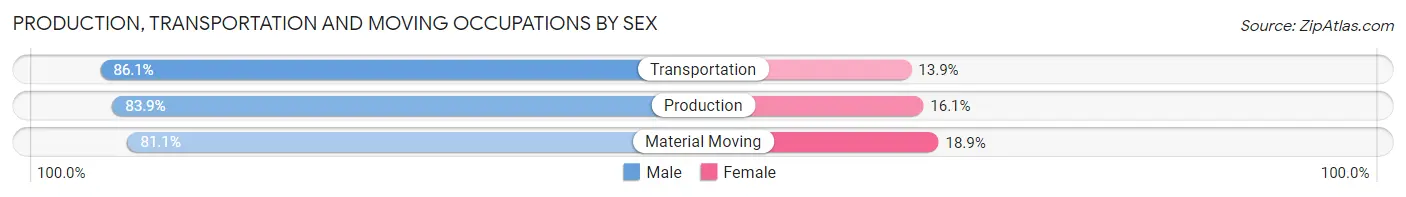
Production, Transportation and Moving Occupations by Sex
| Occupation | Male | Female |
| Production | 474 (83.9%) | 91 (16.1%) |
| Transportation | 272 (86.1%) | 44 (13.9%) |
| Material Moving | 296 (81.1%) | 69 (18.9%) |
| Total (Category) | 1,042 (83.6%) | 204 (16.4%) |
| Total (Overall) | 3,853 (51.5%) | 3,627 (48.5%) |
Employment Industries by Sex in Maumee
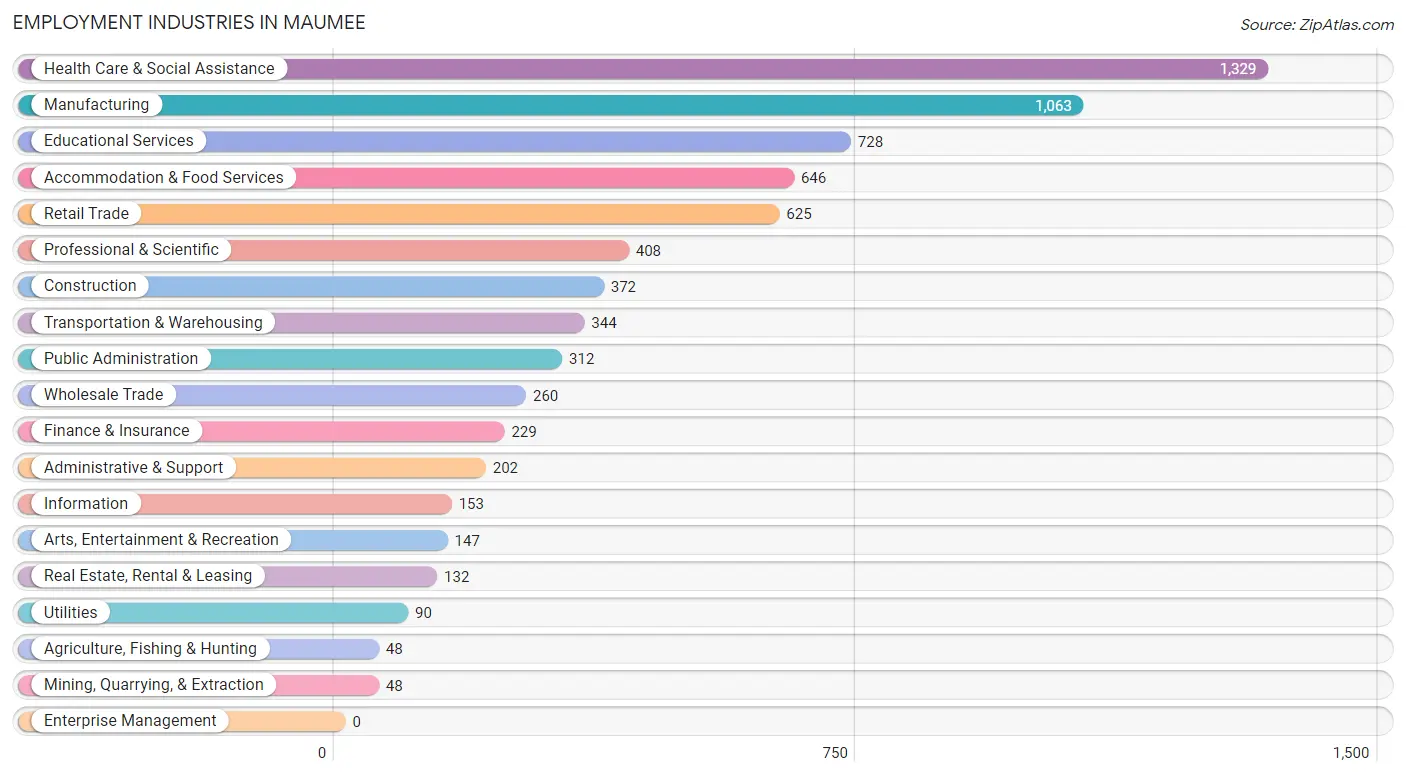
Employment Industries in Maumee
The major employment industries in Maumee include Health Care & Social Assistance (1,329 | 17.8%), Manufacturing (1,063 | 14.2%), Educational Services (728 | 9.7%), Accommodation & Food Services (646 | 8.6%), and Retail Trade (625 | 8.4%).
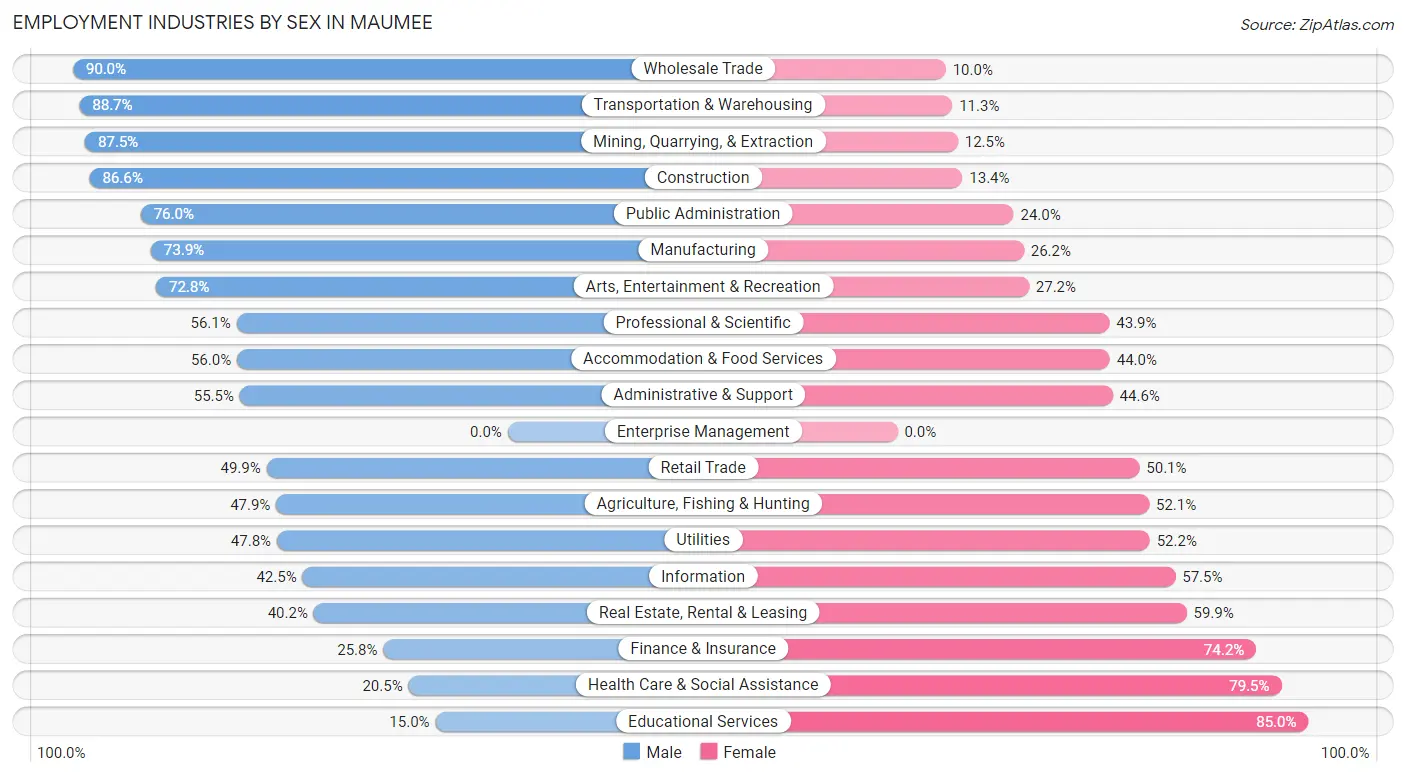
Employment Industries by Sex in Maumee
The Maumee industries that see more men than women are Wholesale Trade (90.0%), Transportation & Warehousing (88.7%), and Mining, Quarrying, & Extraction (87.5%), whereas the industries that tend to have a higher number of women are Educational Services (85.0%), Health Care & Social Assistance (79.5%), and Finance & Insurance (74.2%).
| Industry | Male | Female |
| Agriculture, Fishing & Hunting | 23 (47.9%) | 25 (52.1%) |
| Mining, Quarrying, & Extraction | 42 (87.5%) | 6 (12.5%) |
| Construction | 322 (86.6%) | 50 (13.4%) |
| Manufacturing | 785 (73.9%) | 278 (26.2%) |
| Wholesale Trade | 234 (90.0%) | 26 (10.0%) |
| Retail Trade | 312 (49.9%) | 313 (50.1%) |
| Transportation & Warehousing | 305 (88.7%) | 39 (11.3%) |
| Utilities | 43 (47.8%) | 47 (52.2%) |
| Information | 65 (42.5%) | 88 (57.5%) |
| Finance & Insurance | 59 (25.8%) | 170 (74.2%) |
| Real Estate, Rental & Leasing | 53 (40.2%) | 79 (59.9%) |
| Professional & Scientific | 229 (56.1%) | 179 (43.9%) |
| Enterprise Management | 0 (0.0%) | 0 (0.0%) |
| Administrative & Support | 112 (55.4%) | 90 (44.6%) |
| Educational Services | 109 (15.0%) | 619 (85.0%) |
| Health Care & Social Assistance | 273 (20.5%) | 1,056 (79.5%) |
| Arts, Entertainment & Recreation | 107 (72.8%) | 40 (27.2%) |
| Accommodation & Food Services | 362 (56.0%) | 284 (44.0%) |
| Public Administration | 237 (76.0%) | 75 (24.0%) |
| Total | 3,853 (51.5%) | 3,627 (48.5%) |
Education in Maumee
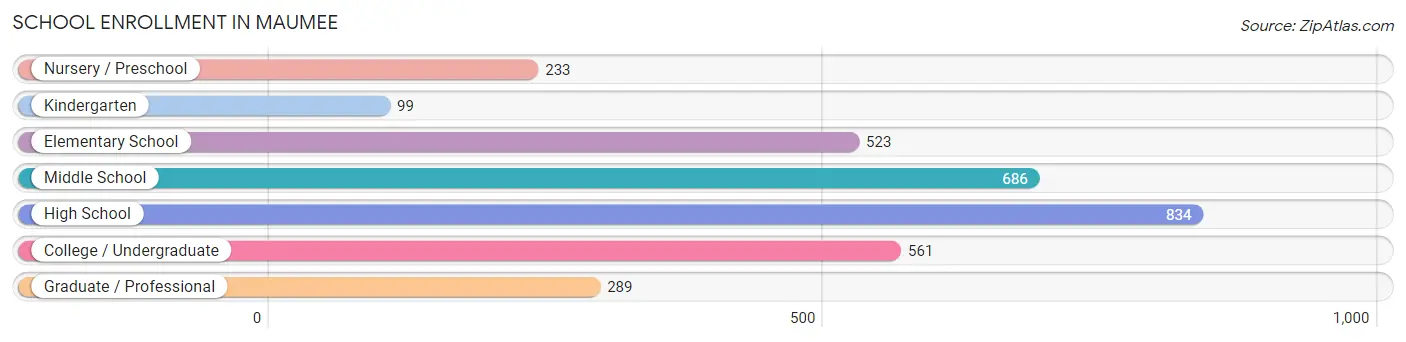
School Enrollment in Maumee
The most common levels of schooling among the 3,225 students in Maumee are high school (834 | 25.9%), middle school (686 | 21.3%), and college / undergraduate (561 | 17.4%).
| School Level | # Students | % Students |
| Nursery / Preschool | 233 | 7.2% |
| Kindergarten | 99 | 3.1% |
| Elementary School | 523 | 16.2% |
| Middle School | 686 | 21.3% |
| High School | 834 | 25.9% |
| College / Undergraduate | 561 | 17.4% |
| Graduate / Professional | 289 | 9.0% |
| Total | 3,225 | 100.0% |
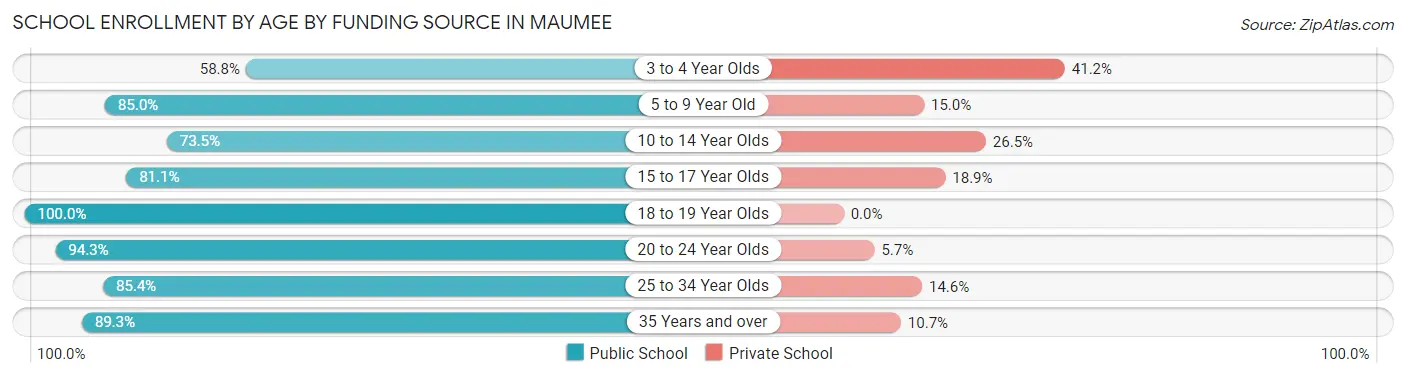
School Enrollment by Age by Funding Source in Maumee
Out of a total of 3,225 students who are enrolled in schools in Maumee, 568 (17.6%) attend a private institution, while the remaining 2,657 (82.4%) are enrolled in public schools. The age group of 3 to 4 year olds has the highest likelihood of being enrolled in private schools, with 96 (41.2% in the age bracket) enrolled. Conversely, the age group of 18 to 19 year olds has the lowest likelihood of being enrolled in a private school, with 316 (100.0% in the age bracket) attending a public institution.
| Age Bracket | Public School | Private School |
| 3 to 4 Year Olds | 137 (58.8%) | 96 (41.2%) |
| 5 to 9 Year Old | 517 (85.0%) | 91 (15.0%) |
| 10 to 14 Year Olds | 541 (73.5%) | 195 (26.5%) |
| 15 to 17 Year Olds | 458 (81.1%) | 107 (18.9%) |
| 18 to 19 Year Olds | 316 (100.0%) | 0 (0.0%) |
| 20 to 24 Year Olds | 279 (94.3%) | 17 (5.7%) |
| 25 to 34 Year Olds | 234 (85.4%) | 40 (14.6%) |
| 35 Years and over | 176 (89.3%) | 21 (10.7%) |
| Total | 2,657 (82.4%) | 568 (17.6%) |
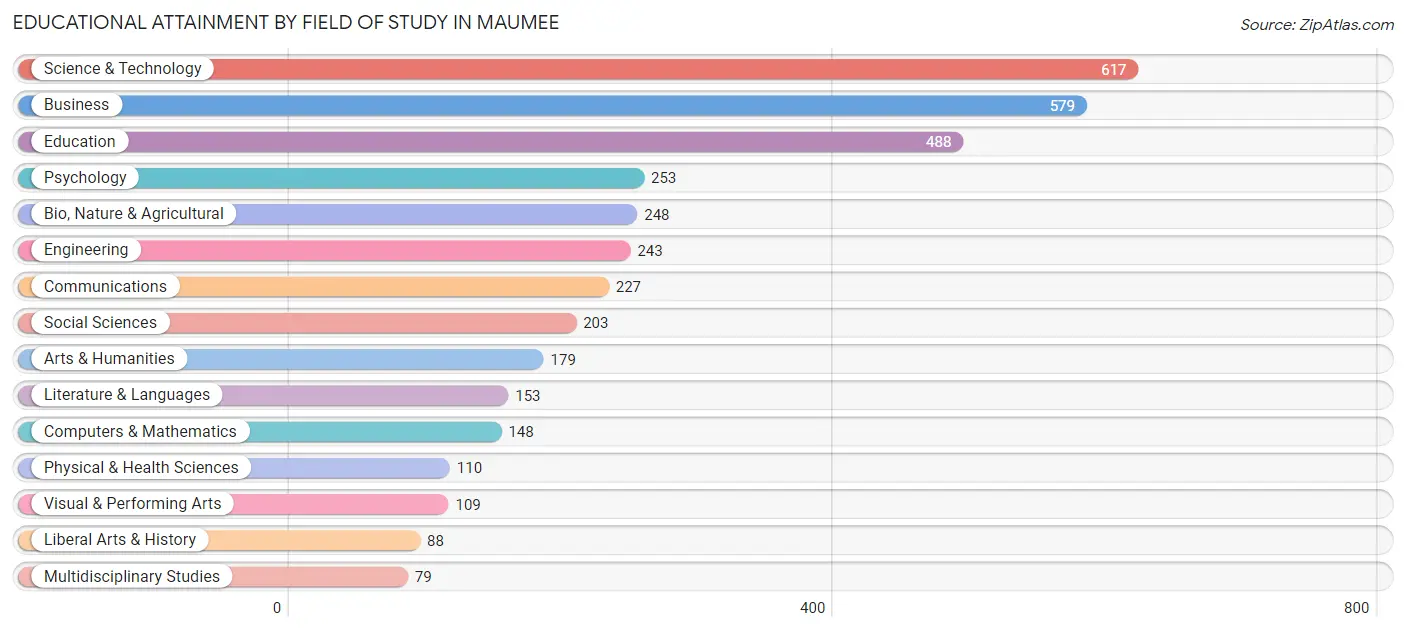
Educational Attainment by Field of Study in Maumee
Science & technology (617 | 16.6%), business (579 | 15.5%), education (488 | 13.1%), psychology (253 | 6.8%), and bio, nature & agricultural (248 | 6.7%) are the most common fields of study among 3,724 individuals in Maumee who have obtained a bachelor's degree or higher.
| Field of Study | # Graduates | % Graduates |
| Computers & Mathematics | 148 | 4.0% |
| Bio, Nature & Agricultural | 248 | 6.7% |
| Physical & Health Sciences | 110 | 2.9% |
| Psychology | 253 | 6.8% |
| Social Sciences | 203 | 5.4% |
| Engineering | 243 | 6.5% |
| Multidisciplinary Studies | 79 | 2.1% |
| Science & Technology | 617 | 16.6% |
| Business | 579 | 15.5% |
| Education | 488 | 13.1% |
| Literature & Languages | 153 | 4.1% |
| Liberal Arts & History | 88 | 2.4% |
| Visual & Performing Arts | 109 | 2.9% |
| Communications | 227 | 6.1% |
| Arts & Humanities | 179 | 4.8% |
| Total | 3,724 | 100.0% |
Transportation & Commute in Maumee
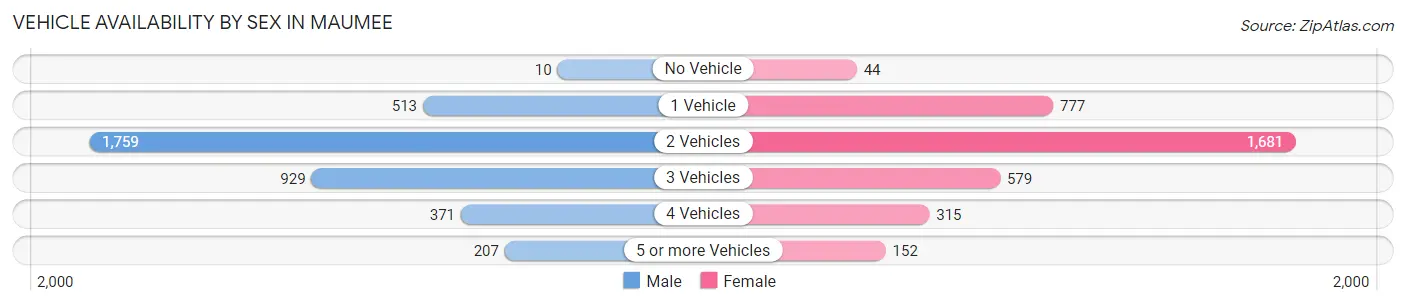
Vehicle Availability by Sex in Maumee
The most prevalent vehicle ownership categories in Maumee are males with 2 vehicles (1,759, accounting for 46.4%) and females with 2 vehicles (1,681, making up 49.6%).
| Vehicles Available | Male | Female |
| No Vehicle | 10 (0.3%) | 44 (1.2%) |
| 1 Vehicle | 513 (13.5%) | 777 (21.9%) |
| 2 Vehicles | 1,759 (46.4%) | 1,681 (47.4%) |
| 3 Vehicles | 929 (24.5%) | 579 (16.3%) |
| 4 Vehicles | 371 (9.8%) | 315 (8.9%) |
| 5 or more Vehicles | 207 (5.5%) | 152 (4.3%) |
| Total | 3,789 (100.0%) | 3,548 (100.0%) |
Commute Time in Maumee
The most frequently occuring commute durations in Maumee are 15 to 19 minutes (1,525 commuters, 22.1%), 20 to 24 minutes (1,154 commuters, 16.7%), and 10 to 14 minutes (1,066 commuters, 15.4%).
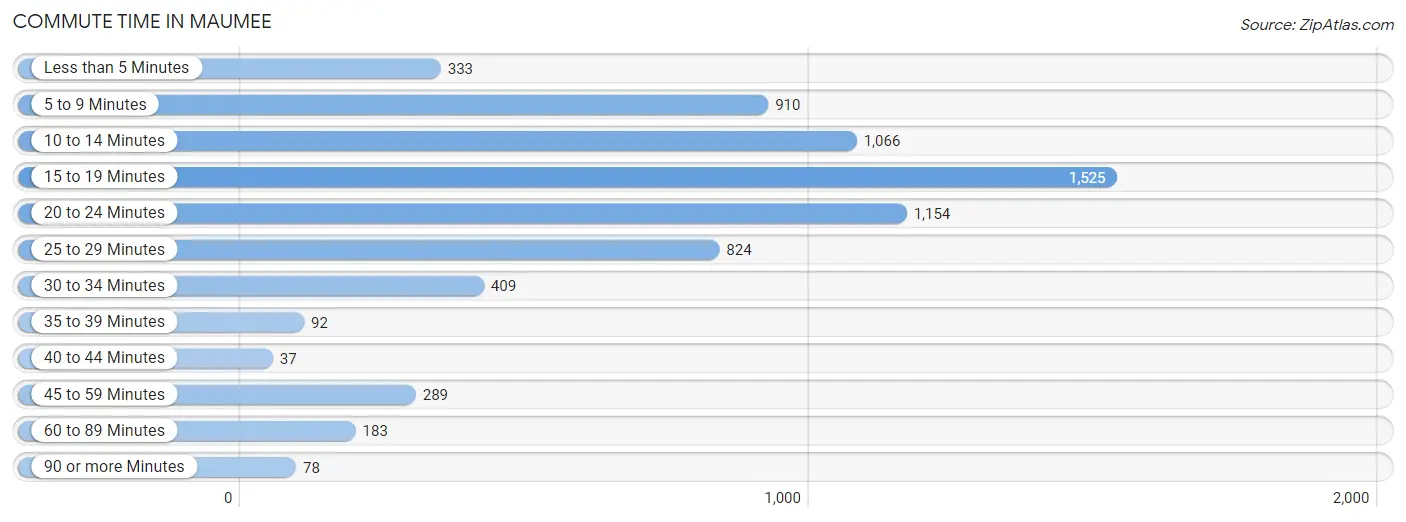
| Commute Time | # Commuters | % Commuters |
| Less than 5 Minutes | 333 | 4.8% |
| 5 to 9 Minutes | 910 | 13.2% |
| 10 to 14 Minutes | 1,066 | 15.4% |
| 15 to 19 Minutes | 1,525 | 22.1% |
| 20 to 24 Minutes | 1,154 | 16.7% |
| 25 to 29 Minutes | 824 | 11.9% |
| 30 to 34 Minutes | 409 | 5.9% |
| 35 to 39 Minutes | 92 | 1.3% |
| 40 to 44 Minutes | 37 | 0.5% |
| 45 to 59 Minutes | 289 | 4.2% |
| 60 to 89 Minutes | 183 | 2.6% |
| 90 or more Minutes | 78 | 1.1% |
Commute Time by Sex in Maumee
The most common commute times in Maumee are 15 to 19 minutes (816 commuters, 22.6%) for males and 15 to 19 minutes (709 commuters, 21.5%) for females.
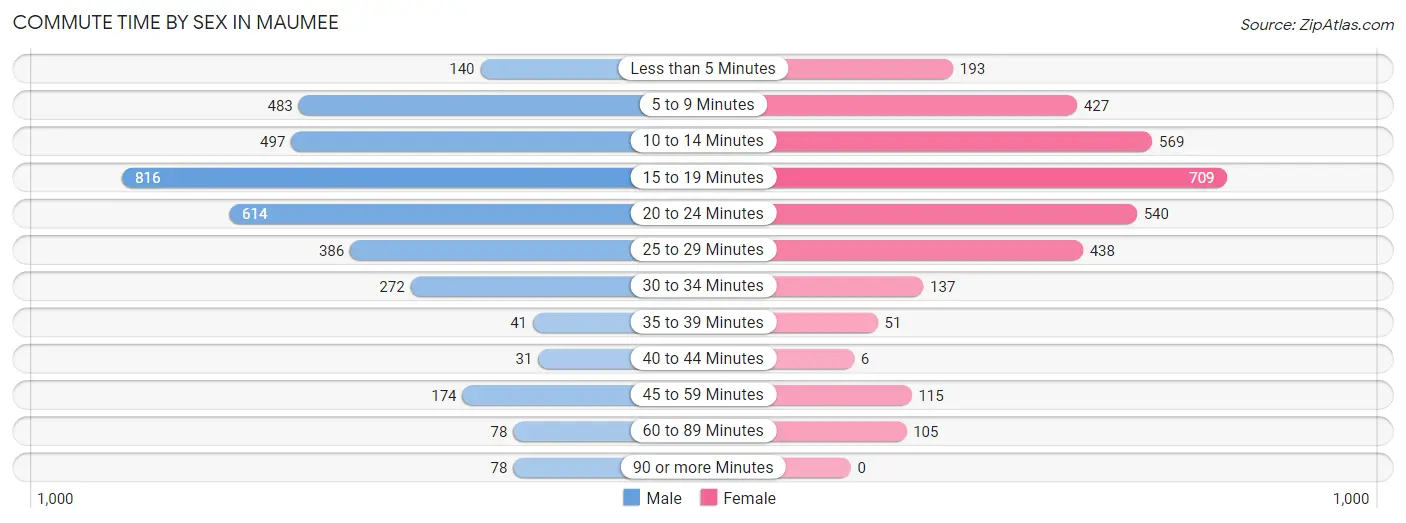
| Commute Time | Male | Female |
| Less than 5 Minutes | 140 (3.9%) | 193 (5.9%) |
| 5 to 9 Minutes | 483 (13.4%) | 427 (13.0%) |
| 10 to 14 Minutes | 497 (13.8%) | 569 (17.3%) |
| 15 to 19 Minutes | 816 (22.6%) | 709 (21.5%) |
| 20 to 24 Minutes | 614 (17.0%) | 540 (16.4%) |
| 25 to 29 Minutes | 386 (10.7%) | 438 (13.3%) |
| 30 to 34 Minutes | 272 (7.5%) | 137 (4.2%) |
| 35 to 39 Minutes | 41 (1.1%) | 51 (1.5%) |
| 40 to 44 Minutes | 31 (0.9%) | 6 (0.2%) |
| 45 to 59 Minutes | 174 (4.8%) | 115 (3.5%) |
| 60 to 89 Minutes | 78 (2.2%) | 105 (3.2%) |
| 90 or more Minutes | 78 (2.2%) | 0 (0.0%) |
Time of Departure to Work by Sex in Maumee
The most frequent times of departure to work in Maumee are 7:30 AM to 7:59 AM (603, 16.7%) for males and 7:30 AM to 7:59 AM (558, 17.0%) for females.
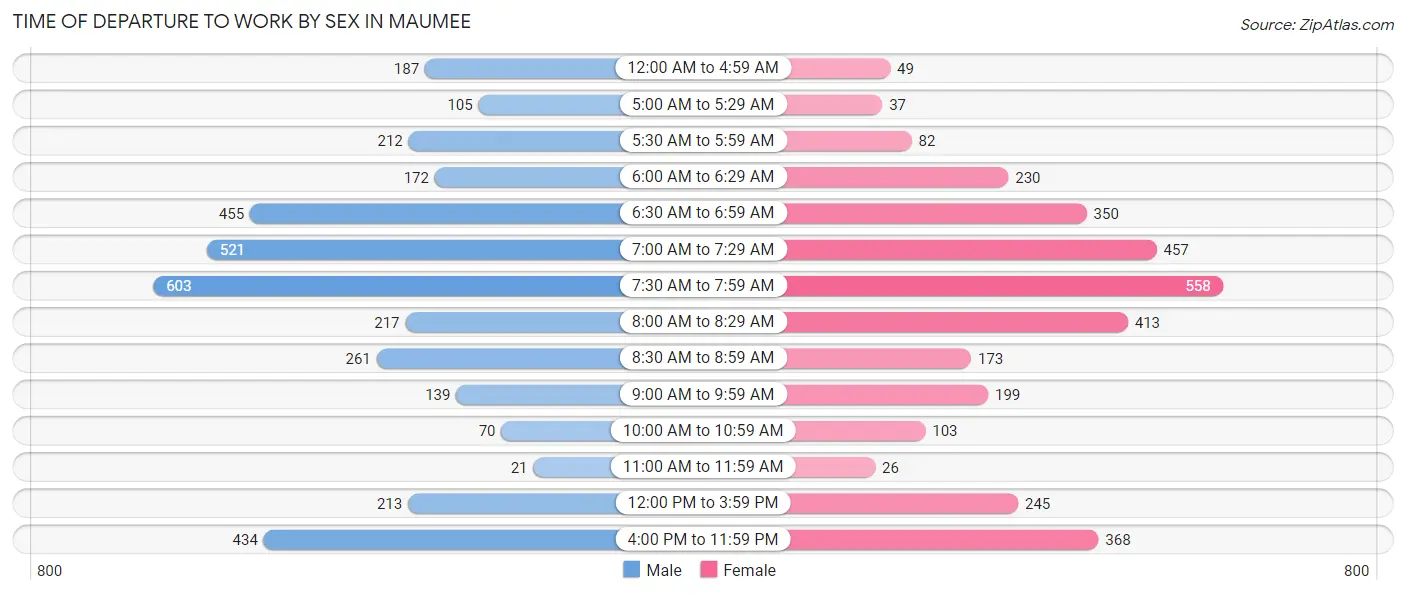
| Time of Departure | Male | Female |
| 12:00 AM to 4:59 AM | 187 (5.2%) | 49 (1.5%) |
| 5:00 AM to 5:29 AM | 105 (2.9%) | 37 (1.1%) |
| 5:30 AM to 5:59 AM | 212 (5.9%) | 82 (2.5%) |
| 6:00 AM to 6:29 AM | 172 (4.8%) | 230 (7.0%) |
| 6:30 AM to 6:59 AM | 455 (12.6%) | 350 (10.6%) |
| 7:00 AM to 7:29 AM | 521 (14.4%) | 457 (13.9%) |
| 7:30 AM to 7:59 AM | 603 (16.7%) | 558 (17.0%) |
| 8:00 AM to 8:29 AM | 217 (6.0%) | 413 (12.6%) |
| 8:30 AM to 8:59 AM | 261 (7.2%) | 173 (5.3%) |
| 9:00 AM to 9:59 AM | 139 (3.8%) | 199 (6.0%) |
| 10:00 AM to 10:59 AM | 70 (1.9%) | 103 (3.1%) |
| 11:00 AM to 11:59 AM | 21 (0.6%) | 26 (0.8%) |
| 12:00 PM to 3:59 PM | 213 (5.9%) | 245 (7.4%) |
| 4:00 PM to 11:59 PM | 434 (12.0%) | 368 (11.2%) |
| Total | 3,610 (100.0%) | 3,290 (100.0%) |
Housing Occupancy in Maumee
Occupancy by Ownership in Maumee
Of the total 5,906 dwellings in Maumee, owner-occupied units account for 4,446 (75.3%), while renter-occupied units make up 1,460 (24.7%).
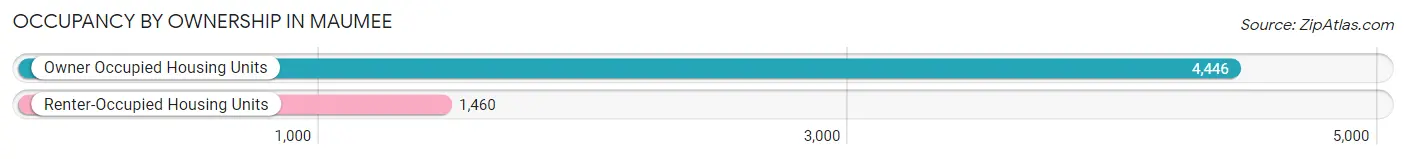
| Occupancy | # Housing Units | % Housing Units |
| Owner Occupied Housing Units | 4,446 | 75.3% |
| Renter-Occupied Housing Units | 1,460 | 24.7% |
| Total Occupied Housing Units | 5,906 | 100.0% |
Occupancy by Household Size in Maumee
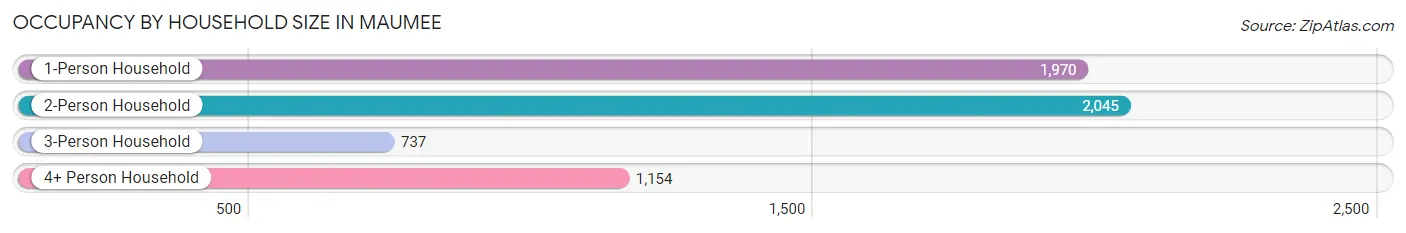
| Household Size | # Housing Units | % Housing Units |
| 1-Person Household | 1,970 | 33.4% |
| 2-Person Household | 2,045 | 34.6% |
| 3-Person Household | 737 | 12.5% |
| 4+ Person Household | 1,154 | 19.5% |
| Total Housing Units | 5,906 | 100.0% |
Occupancy by Ownership by Household Size in Maumee
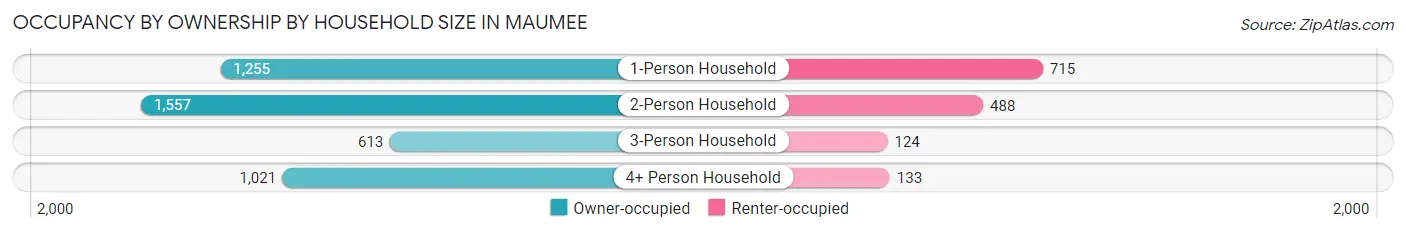
| Household Size | Owner-occupied | Renter-occupied |
| 1-Person Household | 1,255 (63.7%) | 715 (36.3%) |
| 2-Person Household | 1,557 (76.1%) | 488 (23.9%) |
| 3-Person Household | 613 (83.2%) | 124 (16.8%) |
| 4+ Person Household | 1,021 (88.5%) | 133 (11.5%) |
| Total Housing Units | 4,446 (75.3%) | 1,460 (24.7%) |
Occupancy by Educational Attainment in Maumee
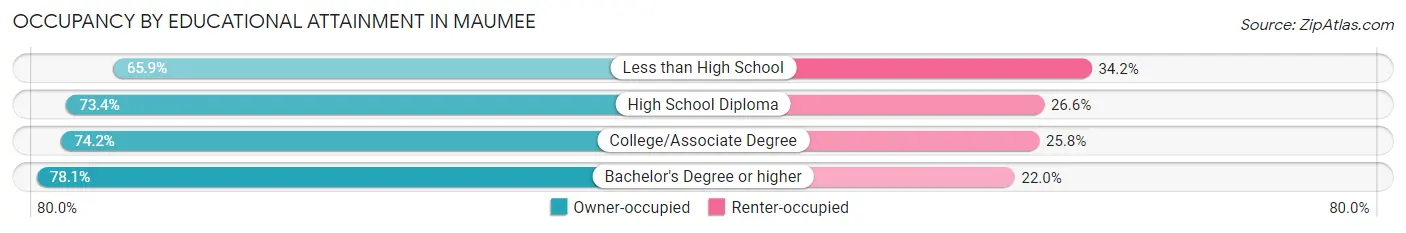
| Household Size | Owner-occupied | Renter-occupied |
| Less than High School | 108 (65.8%) | 56 (34.2%) |
| High School Diploma | 896 (73.4%) | 325 (26.6%) |
| College/Associate Degree | 1,650 (74.2%) | 575 (25.8%) |
| Bachelor's Degree or higher | 1,792 (78.0%) | 504 (22.0%) |
Occupancy by Age of Householder in Maumee
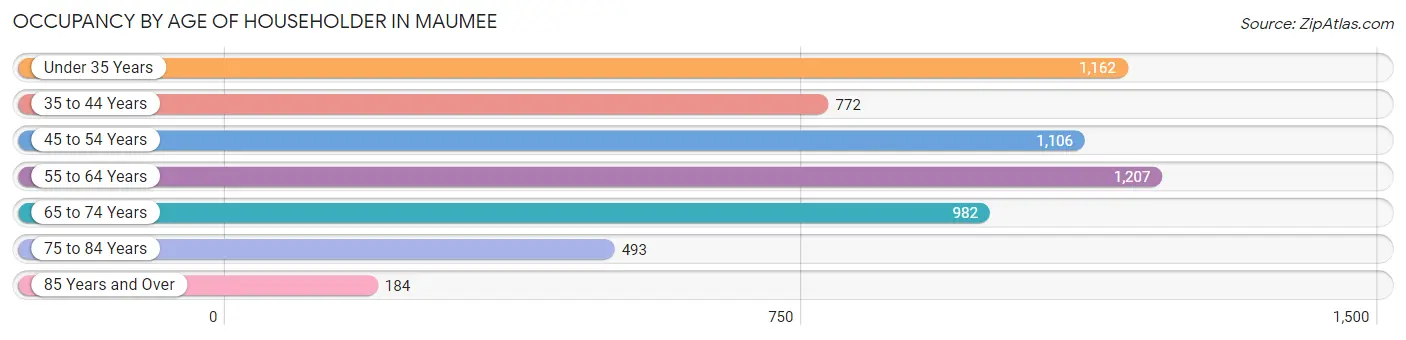
| Age Bracket | # Households | % Households |
| Under 35 Years | 1,162 | 19.7% |
| 35 to 44 Years | 772 | 13.1% |
| 45 to 54 Years | 1,106 | 18.7% |
| 55 to 64 Years | 1,207 | 20.4% |
| 65 to 74 Years | 982 | 16.6% |
| 75 to 84 Years | 493 | 8.4% |
| 85 Years and Over | 184 | 3.1% |
| Total | 5,906 | 100.0% |
Housing Finances in Maumee
Median Income by Occupancy in Maumee
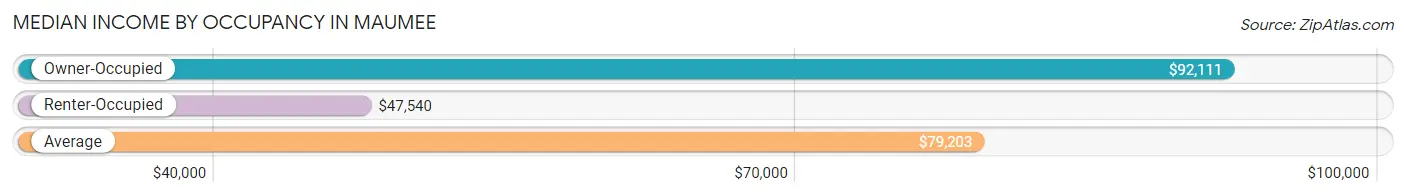
| Occupancy Type | # Households | Median Income |
| Owner-Occupied | 4,446 (75.3%) | $92,111 |
| Renter-Occupied | 1,460 (24.7%) | $47,540 |
| Average | 5,906 (100.0%) | $79,203 |
Occupancy by Householder Income Bracket in Maumee
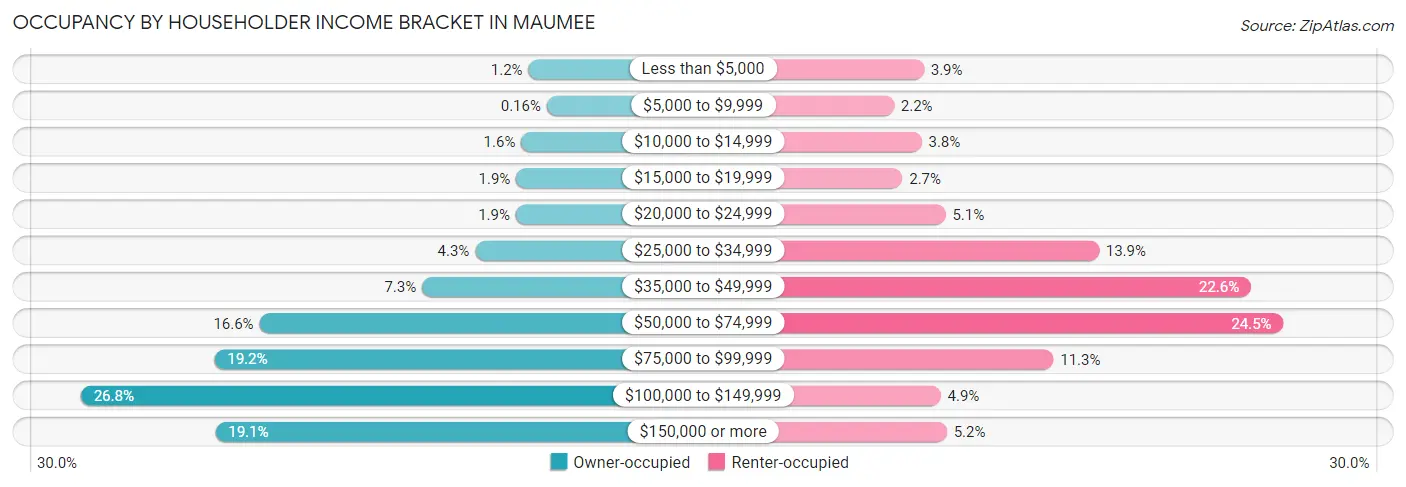
| Income Bracket | Owner-occupied | Renter-occupied |
| Less than $5,000 | 54 (1.2%) | 57 (3.9%) |
| $5,000 to $9,999 | 7 (0.2%) | 32 (2.2%) |
| $10,000 to $14,999 | 72 (1.6%) | 55 (3.8%) |
| $15,000 to $19,999 | 85 (1.9%) | 39 (2.7%) |
| $20,000 to $24,999 | 86 (1.9%) | 75 (5.1%) |
| $25,000 to $34,999 | 189 (4.3%) | 203 (13.9%) |
| $35,000 to $49,999 | 324 (7.3%) | 330 (22.6%) |
| $50,000 to $74,999 | 737 (16.6%) | 357 (24.4%) |
| $75,000 to $99,999 | 852 (19.2%) | 165 (11.3%) |
| $100,000 to $149,999 | 1,191 (26.8%) | 71 (4.9%) |
| $150,000 or more | 849 (19.1%) | 76 (5.2%) |
| Total | 4,446 (100.0%) | 1,460 (100.0%) |
Monthly Housing Cost Tiers in Maumee
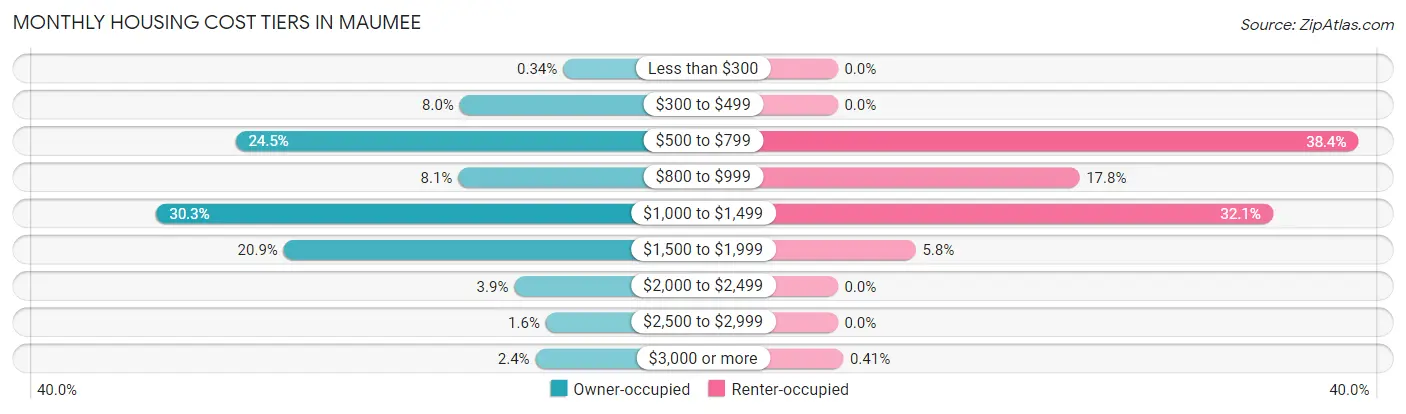
| Monthly Cost | Owner-occupied | Renter-occupied |
| Less than $300 | 15 (0.3%) | 0 (0.0%) |
| $300 to $499 | 354 (8.0%) | 0 (0.0%) |
| $500 to $799 | 1,088 (24.5%) | 560 (38.4%) |
| $800 to $999 | 359 (8.1%) | 260 (17.8%) |
| $1,000 to $1,499 | 1,347 (30.3%) | 468 (32.1%) |
| $1,500 to $1,999 | 930 (20.9%) | 84 (5.8%) |
| $2,000 to $2,499 | 175 (3.9%) | 0 (0.0%) |
| $2,500 to $2,999 | 72 (1.6%) | 0 (0.0%) |
| $3,000 or more | 106 (2.4%) | 6 (0.4%) |
| Total | 4,446 (100.0%) | 1,460 (100.0%) |
Physical Housing Characteristics in Maumee
Housing Structures in Maumee
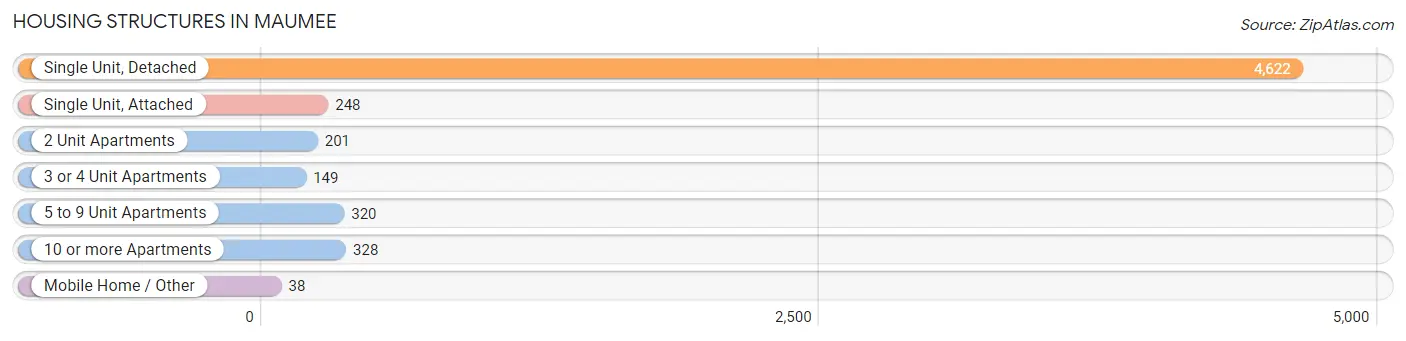
| Structure Type | # Housing Units | % Housing Units |
| Single Unit, Detached | 4,622 | 78.3% |
| Single Unit, Attached | 248 | 4.2% |
| 2 Unit Apartments | 201 | 3.4% |
| 3 or 4 Unit Apartments | 149 | 2.5% |
| 5 to 9 Unit Apartments | 320 | 5.4% |
| 10 or more Apartments | 328 | 5.6% |
| Mobile Home / Other | 38 | 0.6% |
| Total | 5,906 | 100.0% |
Housing Structures by Occupancy in Maumee
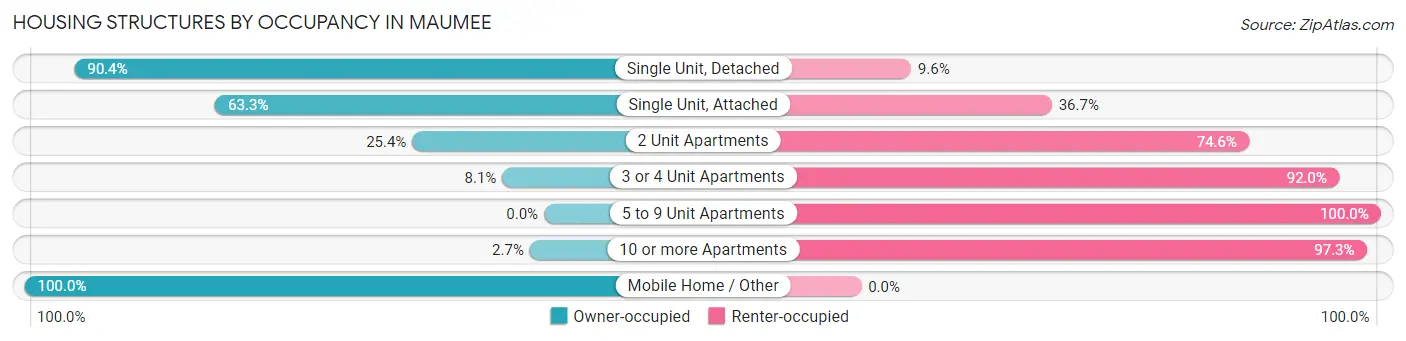
| Structure Type | Owner-occupied | Renter-occupied |
| Single Unit, Detached | 4,179 (90.4%) | 443 (9.6%) |
| Single Unit, Attached | 157 (63.3%) | 91 (36.7%) |
| 2 Unit Apartments | 51 (25.4%) | 150 (74.6%) |
| 3 or 4 Unit Apartments | 12 (8.1%) | 137 (91.9%) |
| 5 to 9 Unit Apartments | 0 (0.0%) | 320 (100.0%) |
| 10 or more Apartments | 9 (2.7%) | 319 (97.3%) |
| Mobile Home / Other | 38 (100.0%) | 0 (0.0%) |
| Total | 4,446 (75.3%) | 1,460 (24.7%) |
Housing Structures by Number of Rooms in Maumee
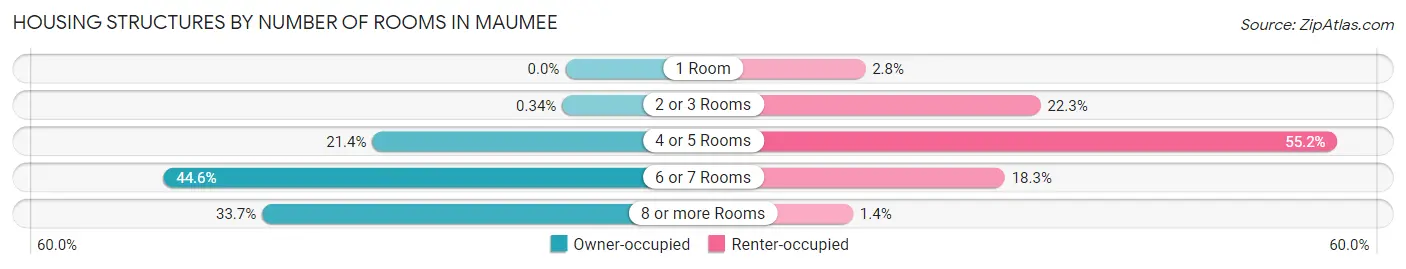
| Number of Rooms | Owner-occupied | Renter-occupied |
| 1 Room | 0 (0.0%) | 41 (2.8%) |
| 2 or 3 Rooms | 15 (0.3%) | 325 (22.3%) |
| 4 or 5 Rooms | 952 (21.4%) | 806 (55.2%) |
| 6 or 7 Rooms | 1,983 (44.6%) | 267 (18.3%) |
| 8 or more Rooms | 1,496 (33.7%) | 21 (1.4%) |
| Total | 4,446 (100.0%) | 1,460 (100.0%) |
Housing Structure by Heating Type in Maumee
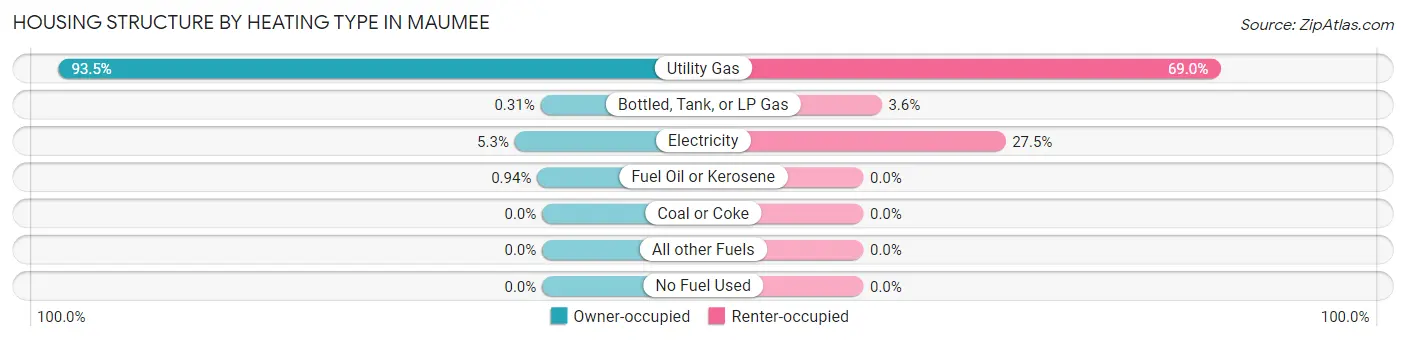
| Heating Type | Owner-occupied | Renter-occupied |
| Utility Gas | 4,155 (93.4%) | 1,007 (69.0%) |
| Bottled, Tank, or LP Gas | 14 (0.3%) | 52 (3.6%) |
| Electricity | 235 (5.3%) | 401 (27.5%) |
| Fuel Oil or Kerosene | 42 (0.9%) | 0 (0.0%) |
| Coal or Coke | 0 (0.0%) | 0 (0.0%) |
| All other Fuels | 0 (0.0%) | 0 (0.0%) |
| No Fuel Used | 0 (0.0%) | 0 (0.0%) |
| Total | 4,446 (100.0%) | 1,460 (100.0%) |
Household Vehicle Usage in Maumee
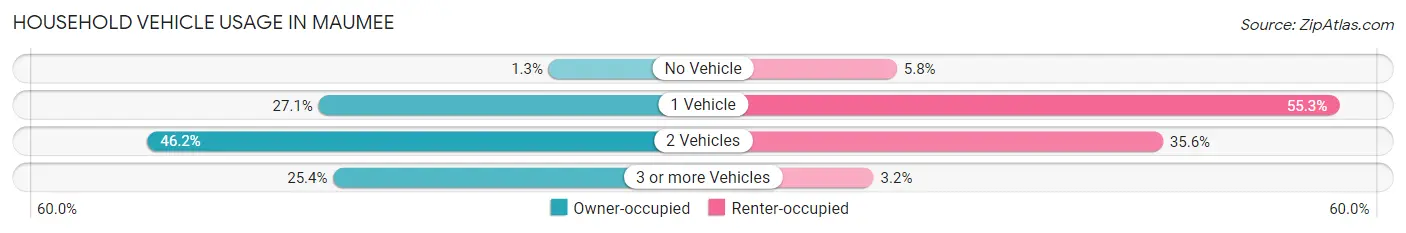
| Vehicles per Household | Owner-occupied | Renter-occupied |
| No Vehicle | 57 (1.3%) | 85 (5.8%) |
| 1 Vehicle | 1,203 (27.1%) | 808 (55.3%) |
| 2 Vehicles | 2,056 (46.2%) | 520 (35.6%) |
| 3 or more Vehicles | 1,130 (25.4%) | 47 (3.2%) |
| Total | 4,446 (100.0%) | 1,460 (100.0%) |
Real Estate & Mortgages in Maumee
Real Estate and Mortgage Overview in Maumee
| Characteristic | Without Mortgage | With Mortgage |
| Housing Units | 1,484 | 2,962 |
| Median Property Value | $157,300 | $173,300 |
| Median Household Income | $77,136 | $571 |
| Monthly Housing Costs | $612 | $69 |
| Real Estate Taxes | $3,341 | $152 |
Property Value by Mortgage Status in Maumee
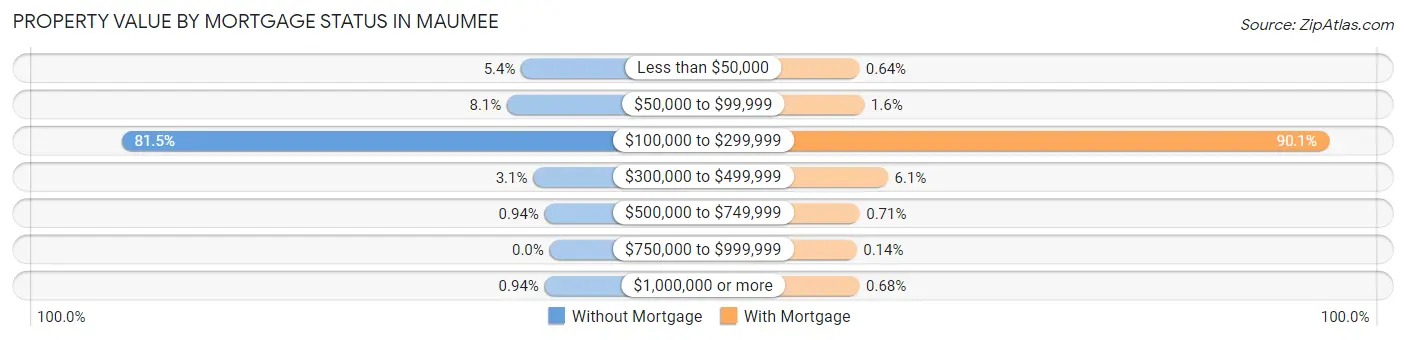
| Property Value | Without Mortgage | With Mortgage |
| Less than $50,000 | 80 (5.4%) | 19 (0.6%) |
| $50,000 to $99,999 | 120 (8.1%) | 47 (1.6%) |
| $100,000 to $299,999 | 1,210 (81.5%) | 2,670 (90.1%) |
| $300,000 to $499,999 | 46 (3.1%) | 181 (6.1%) |
| $500,000 to $749,999 | 14 (0.9%) | 21 (0.7%) |
| $750,000 to $999,999 | 0 (0.0%) | 4 (0.1%) |
| $1,000,000 or more | 14 (0.9%) | 20 (0.7%) |
| Total | 1,484 (100.0%) | 2,962 (100.0%) |
Household Income by Mortgage Status in Maumee
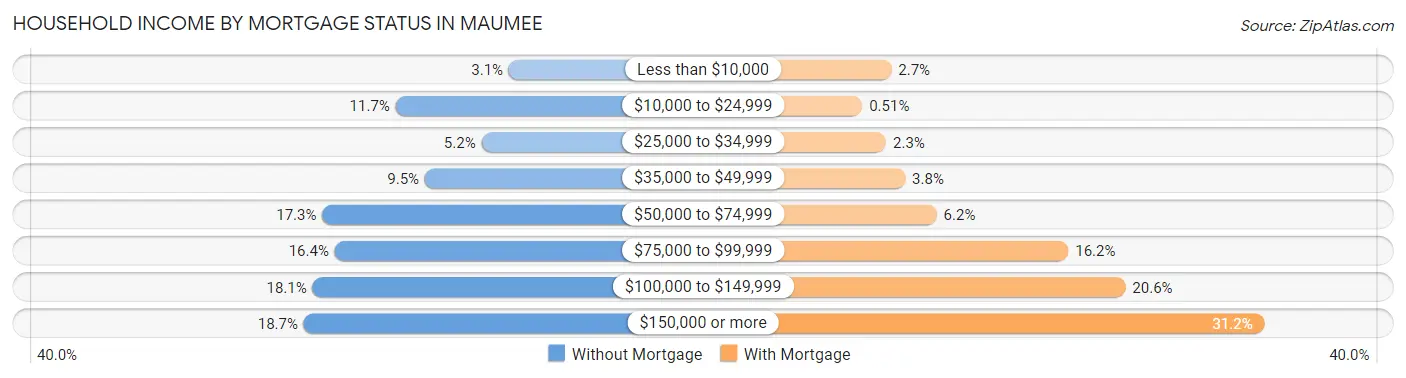
| Household Income | Without Mortgage | With Mortgage |
| Less than $10,000 | 46 (3.1%) | 81 (2.7%) |
| $10,000 to $24,999 | 174 (11.7%) | 15 (0.5%) |
| $25,000 to $34,999 | 77 (5.2%) | 69 (2.3%) |
| $35,000 to $49,999 | 141 (9.5%) | 112 (3.8%) |
| $50,000 to $74,999 | 257 (17.3%) | 183 (6.2%) |
| $75,000 to $99,999 | 243 (16.4%) | 480 (16.2%) |
| $100,000 to $149,999 | 268 (18.1%) | 609 (20.6%) |
| $150,000 or more | 278 (18.7%) | 923 (31.2%) |
| Total | 1,484 (100.0%) | 2,962 (100.0%) |
Property Value to Household Income Ratio in Maumee
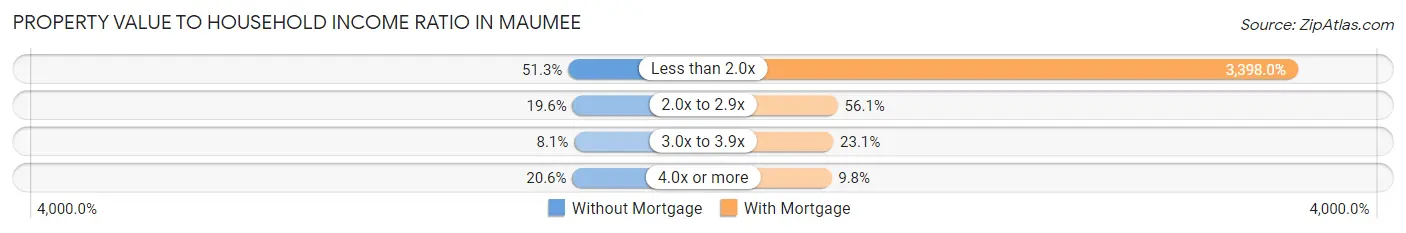
| Value-to-Income Ratio | Without Mortgage | With Mortgage |
| Less than 2.0x | 761 (51.3%) | 100,650 (3,398.0%) |
| 2.0x to 2.9x | 291 (19.6%) | 1,661 (56.1%) |
| 3.0x to 3.9x | 120 (8.1%) | 684 (23.1%) |
| 4.0x or more | 306 (20.6%) | 290 (9.8%) |
| Total | 1,484 (100.0%) | 2,962 (100.0%) |
Real Estate Taxes by Mortgage Status in Maumee
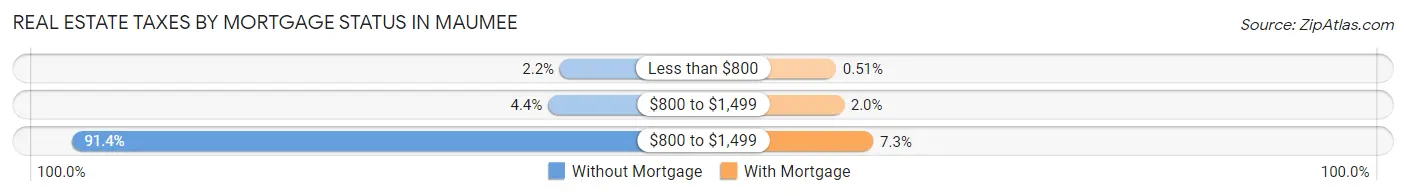
| Property Taxes | Without Mortgage | With Mortgage |
| Less than $800 | 33 (2.2%) | 15 (0.5%) |
| $800 to $1,499 | 65 (4.4%) | 58 (2.0%) |
| $800 to $1,499 | 1,357 (91.4%) | 217 (7.3%) |
| Total | 1,484 (100.0%) | 2,962 (100.0%) |
Health & Disability in Maumee
Health Insurance Coverage by Age in Maumee
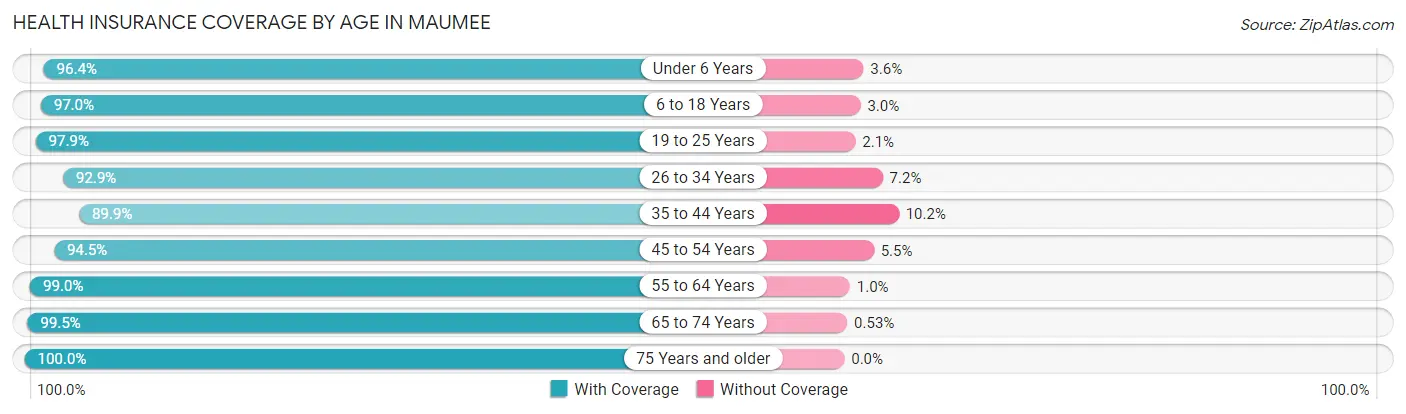
| Age Bracket | With Coverage | Without Coverage |
| Under 6 Years | 1,028 (96.4%) | 38 (3.6%) |
| 6 to 18 Years | 2,152 (97.0%) | 67 (3.0%) |
| 19 to 25 Years | 950 (97.9%) | 20 (2.1%) |
| 26 to 34 Years | 1,752 (92.8%) | 135 (7.1%) |
| 35 to 44 Years | 1,345 (89.8%) | 152 (10.2%) |
| 45 to 54 Years | 1,638 (94.5%) | 95 (5.5%) |
| 55 to 64 Years | 1,923 (99.0%) | 20 (1.0%) |
| 65 to 74 Years | 1,505 (99.5%) | 8 (0.5%) |
| 75 Years and older | 996 (100.0%) | 0 (0.0%) |
| Total | 13,289 (96.1%) | 535 (3.9%) |
Health Insurance Coverage by Citizenship Status in Maumee
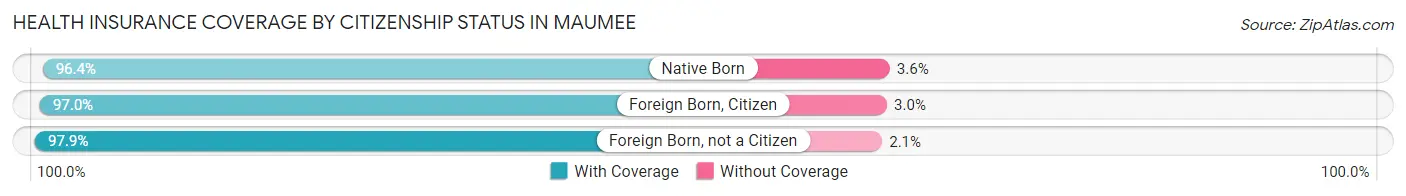
| Citizenship Status | With Coverage | Without Coverage |
| Native Born | 1,028 (96.4%) | 38 (3.6%) |
| Foreign Born, Citizen | 2,152 (97.0%) | 67 (3.0%) |
| Foreign Born, not a Citizen | 950 (97.9%) | 20 (2.1%) |
Health Insurance Coverage by Household Income in Maumee
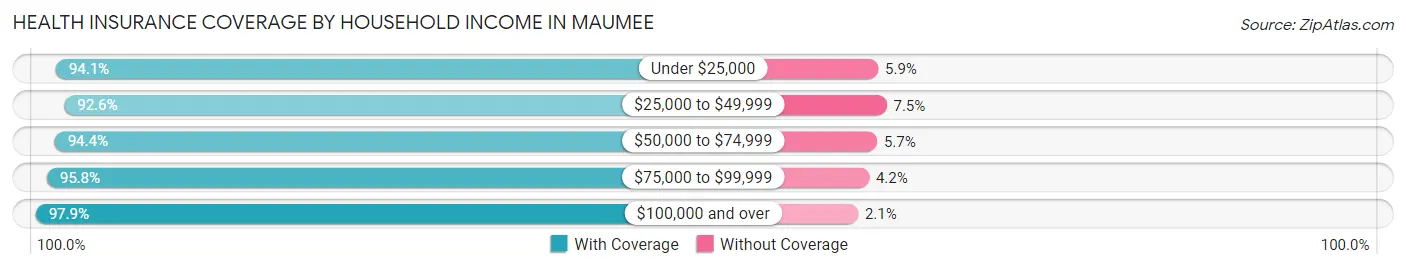
| Household Income | With Coverage | Without Coverage |
| Under $25,000 | 818 (94.1%) | 51 (5.9%) |
| $25,000 to $49,999 | 1,429 (92.5%) | 115 (7.4%) |
| $50,000 to $74,999 | 2,238 (94.4%) | 134 (5.7%) |
| $75,000 to $99,999 | 2,145 (95.8%) | 93 (4.2%) |
| $100,000 and over | 6,659 (97.9%) | 142 (2.1%) |
Public vs Private Health Insurance Coverage by Age in Maumee
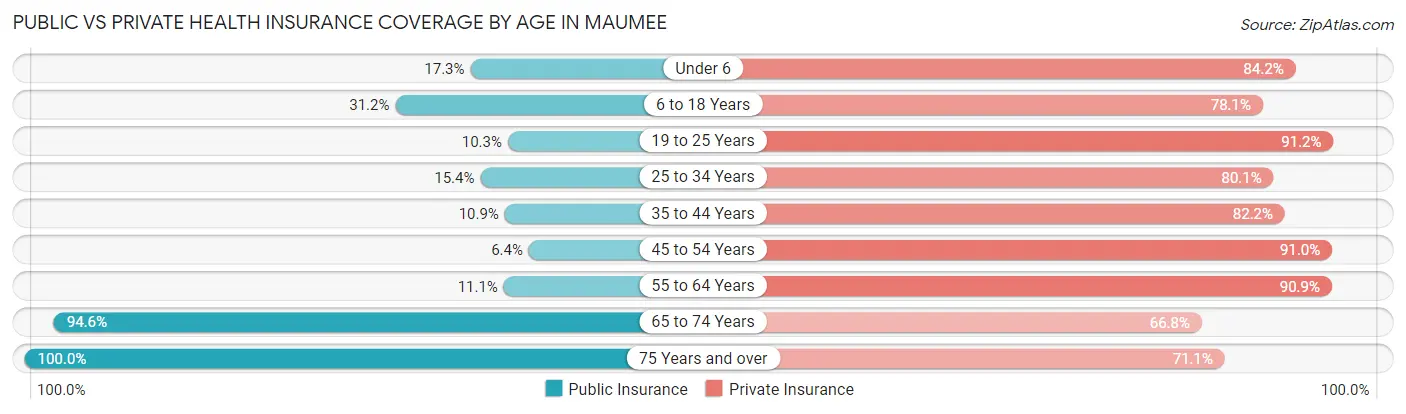
| Age Bracket | Public Insurance | Private Insurance |
| Under 6 | 184 (17.3%) | 898 (84.2%) |
| 6 to 18 Years | 692 (31.2%) | 1,734 (78.1%) |
| 19 to 25 Years | 100 (10.3%) | 885 (91.2%) |
| 25 to 34 Years | 291 (15.4%) | 1,512 (80.1%) |
| 35 to 44 Years | 163 (10.9%) | 1,231 (82.2%) |
| 45 to 54 Years | 111 (6.4%) | 1,577 (91.0%) |
| 55 to 64 Years | 215 (11.1%) | 1,767 (90.9%) |
| 65 to 74 Years | 1,431 (94.6%) | 1,011 (66.8%) |
| 75 Years and over | 996 (100.0%) | 708 (71.1%) |
| Total | 4,183 (30.3%) | 11,323 (81.9%) |
Disability Status by Sex by Age in Maumee
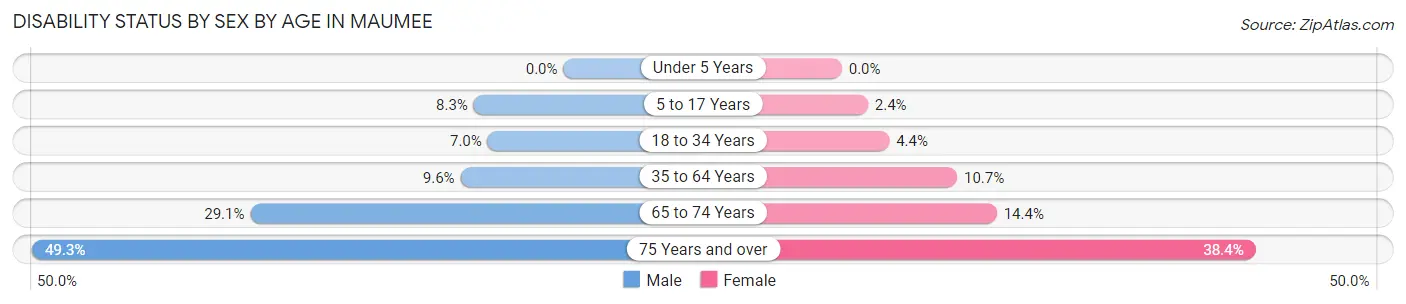
| Age Bracket | Male | Female |
| Under 5 Years | 0 (0.0%) | 0 (0.0%) |
| 5 to 17 Years | 82 (8.3%) | 25 (2.4%) |
| 18 to 34 Years | 117 (7.0%) | 65 (4.4%) |
| 35 to 64 Years | 238 (9.6%) | 287 (10.7%) |
| 65 to 74 Years | 183 (29.0%) | 127 (14.4%) |
| 75 Years and over | 215 (49.3%) | 215 (38.4%) |
Disability Class by Sex by Age in Maumee
Disability Class: Hearing Difficulty
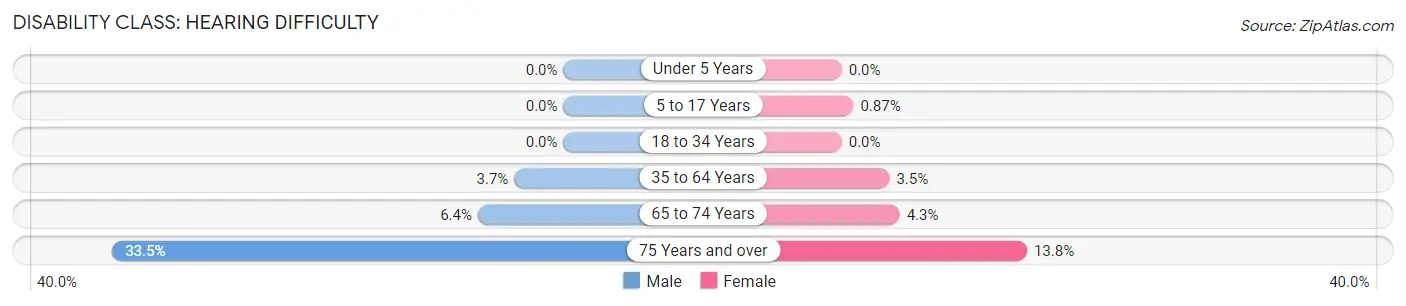
| Age Bracket | Male | Female |
| Under 5 Years | 0 (0.0%) | 0 (0.0%) |
| 5 to 17 Years | 0 (0.0%) | 9 (0.9%) |
| 18 to 34 Years | 0 (0.0%) | 0 (0.0%) |
| 35 to 64 Years | 91 (3.6%) | 95 (3.5%) |
| 65 to 74 Years | 40 (6.4%) | 38 (4.3%) |
| 75 Years and over | 146 (33.5%) | 77 (13.8%) |
Disability Class: Vision Difficulty
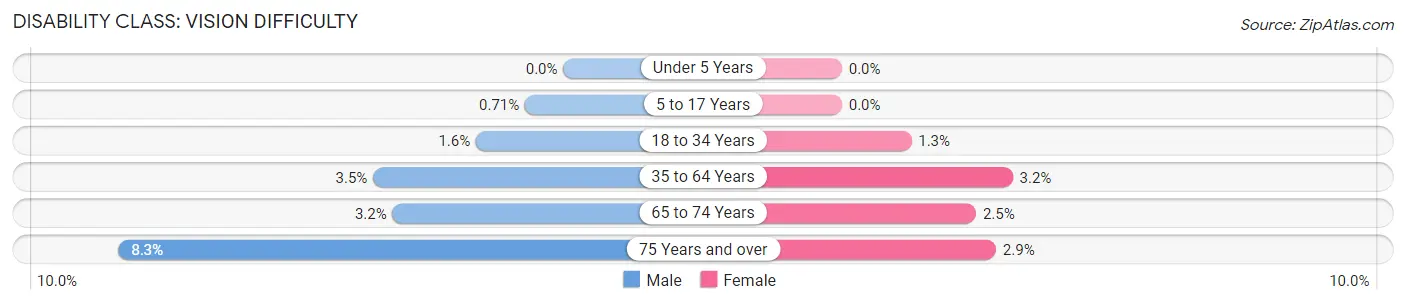
| Age Bracket | Male | Female |
| Under 5 Years | 0 (0.0%) | 0 (0.0%) |
| 5 to 17 Years | 7 (0.7%) | 0 (0.0%) |
| 18 to 34 Years | 27 (1.6%) | 19 (1.3%) |
| 35 to 64 Years | 88 (3.5%) | 85 (3.2%) |
| 65 to 74 Years | 20 (3.2%) | 22 (2.5%) |
| 75 Years and over | 36 (8.3%) | 16 (2.9%) |
Disability Class: Cognitive Difficulty
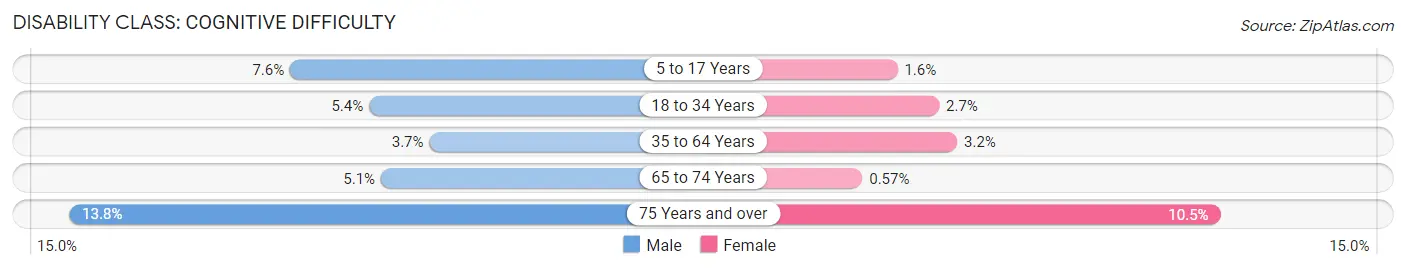
| Age Bracket | Male | Female |
| 5 to 17 Years | 75 (7.6%) | 16 (1.5%) |
| 18 to 34 Years | 90 (5.4%) | 40 (2.7%) |
| 35 to 64 Years | 93 (3.7%) | 86 (3.2%) |
| 65 to 74 Years | 32 (5.1%) | 5 (0.6%) |
| 75 Years and over | 60 (13.8%) | 59 (10.5%) |
Disability Class: Ambulatory Difficulty
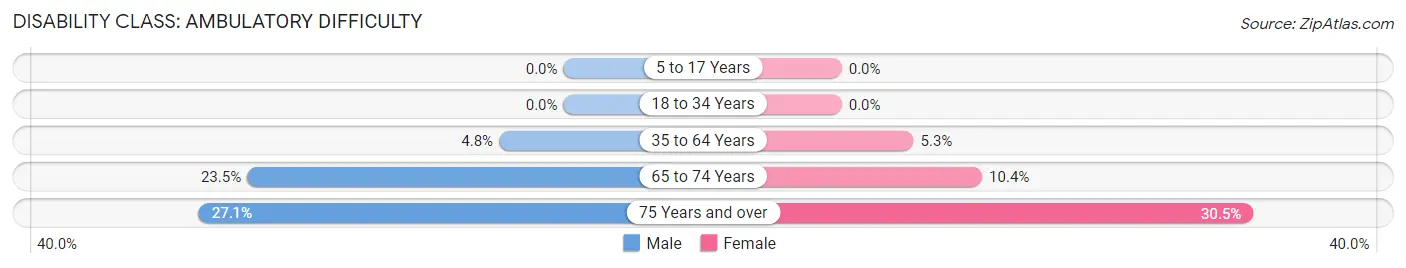
| Age Bracket | Male | Female |
| 5 to 17 Years | 0 (0.0%) | 0 (0.0%) |
| 18 to 34 Years | 0 (0.0%) | 0 (0.0%) |
| 35 to 64 Years | 119 (4.8%) | 143 (5.3%) |
| 65 to 74 Years | 148 (23.5%) | 92 (10.4%) |
| 75 Years and over | 118 (27.1%) | 171 (30.5%) |
Disability Class: Self-Care Difficulty
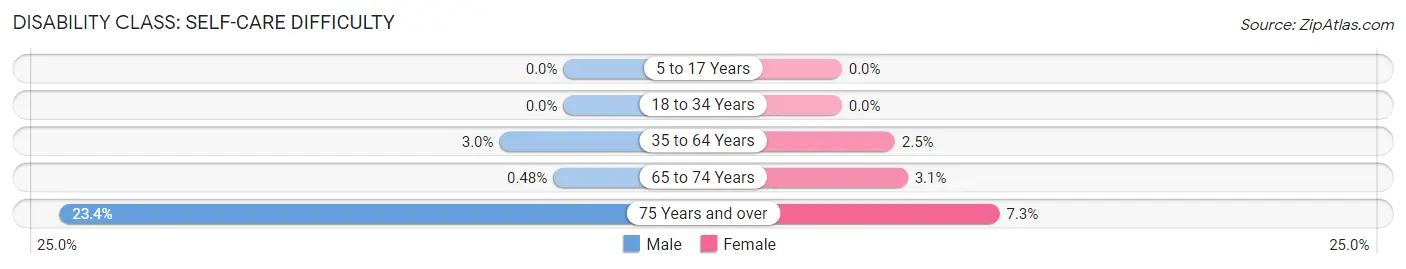
| Age Bracket | Male | Female |
| 5 to 17 Years | 0 (0.0%) | 0 (0.0%) |
| 18 to 34 Years | 0 (0.0%) | 0 (0.0%) |
| 35 to 64 Years | 74 (3.0%) | 66 (2.5%) |
| 65 to 74 Years | 3 (0.5%) | 27 (3.1%) |
| 75 Years and over | 102 (23.4%) | 41 (7.3%) |
Technology Access in Maumee
Computing Device Access in Maumee
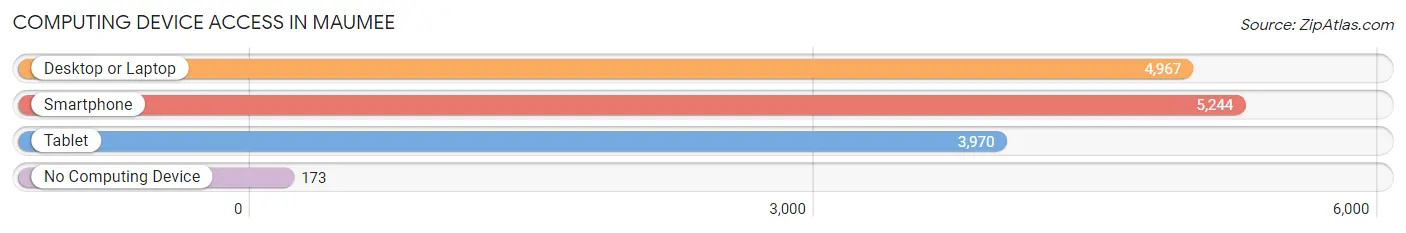
| Device Type | # Households | % Households |
| Desktop or Laptop | 4,967 | 84.1% |
| Smartphone | 5,244 | 88.8% |
| Tablet | 3,970 | 67.2% |
| No Computing Device | 173 | 2.9% |
| Total | 5,906 | 100.0% |
Internet Access in Maumee
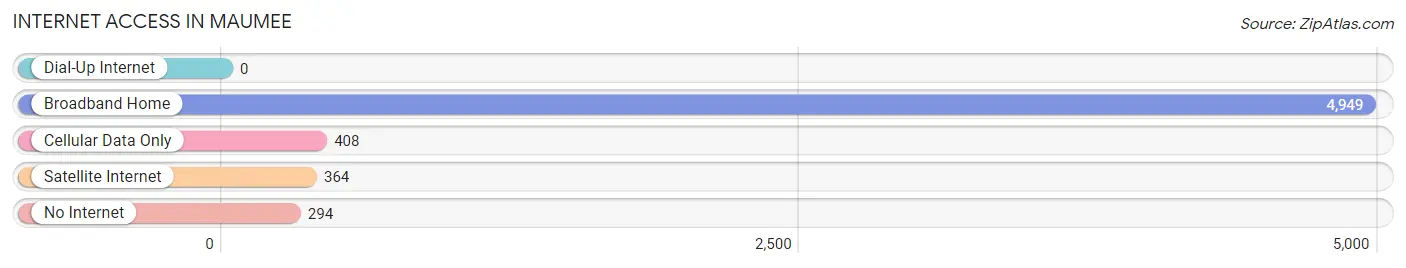
| Internet Type | # Households | % Households |
| Dial-Up Internet | 0 | 0.0% |
| Broadband Home | 4,949 | 83.8% |
| Cellular Data Only | 408 | 6.9% |
| Satellite Internet | 364 | 6.2% |
| No Internet | 294 | 5.0% |
| Total | 5,906 | 100.0% |
Maumee Summary
Maumee, Ohio is a city located in Lucas County, Ohio, United States. It is situated on the Maumee River, which is a tributary of Lake Erie. The city is located about 10 miles southwest of Toledo, Ohio. As of the 2010 census, the city had a population of 14,286.
History
The area that is now Maumee was originally inhabited by the Odawa people, who were part of the Anishinaabe people. The first European settlers arrived in the area in the late 1700s. The area was first surveyed in 1817 and was named after the Maumee River. The city was officially incorporated in 1837.
In the mid-1800s, Maumee was a major port city on the Maumee River. It was a major hub for the transportation of goods and people. The city was also a major center for the production of agricultural products, such as wheat, corn, and oats.
In the late 1800s, the city began to experience a period of industrialization. The city was home to several factories, including a glass factory, a paper mill, and a foundry. The city also became a major center for the production of agricultural equipment.
In the early 1900s, the city experienced a period of growth and development. The city was home to several large businesses, including a brewery, a flour mill, and a furniture factory. The city also became a major center for the production of automobiles.
Geography
Maumee is located at 41°35'N 83°37'W (41.5833, -83.6167). The city is situated on the Maumee River, which is a tributary of Lake Erie. The city is located about 10 miles southwest of Toledo, Ohio.
The city has a total area of 8.2 square miles, of which 8.1 square miles is land and 0.1 square miles is water. The city is located in a humid continental climate zone, with hot summers and cold winters.
Economy
Maumee's economy is largely based on manufacturing and retail. The city is home to several large manufacturing companies, including Dana Corporation, Owens Corning, and Whirlpool Corporation. The city is also home to several large retail stores, including Walmart, Target, and Kohl's.
The city is also home to several large healthcare providers, including ProMedica, Mercy Health, and St. Luke's Hospital. The city is also home to several educational institutions, including the University of Toledo, Owens Community College, and the Maumee Valley Country Day School.
Demographics
As of the 2010 census, the city had a population of 14,286. The racial makeup of the city was 87.3% White, 8.2% African American, 0.5% Native American, 1.2% Asian, 0.1% Pacific Islander, 0.7% from other races, and 2.2% from two or more races. Hispanic or Latino of any race were 2.7% of the population.
The median income for a household in the city was $50,945, and the median income for a family was $60,945. The per capita income for the city was $25,945. About 8.2% of families and 10.2% of the population were below the poverty line, including 14.2% of those under age 18 and 6.2% of those age 65 or over.
Common Questions
What is Per Capita Income in Maumee?
Per Capita income in Maumee is $42,888.
What is the Median Family Income in Maumee?
Median Family Income in Maumee is $98,676.
What is the Median Household income in Maumee?
Median Household Income in Maumee is $79,203.
What is Income or Wage Gap in Maumee?
Income or Wage Gap in Maumee is 21.1%.
Women in Maumee earn 78.9 cents for every dollar earned by a man.
What is Family Income Deficit in Maumee?
Family Income Deficit in Maumee is $10,512.
Families that are below poverty line in Maumee earn $10,512 less on average than the poverty threshold level.
What is Inequality or Gini Index in Maumee?
Inequality or Gini Index in Maumee is 0.41.
What is the Total Population of Maumee?
Total Population of Maumee is 13,824.
What is the Total Male Population of Maumee?
Total Male Population of Maumee is 6,764.
What is the Total Female Population of Maumee?
Total Female Population of Maumee is 7,060.
What is the Ratio of Males per 100 Females in Maumee?
There are 95.81 Males per 100 Females in Maumee.
What is the Ratio of Females per 100 Males in Maumee?
There are 104.38 Females per 100 Males in Maumee.
What is the Median Population Age in Maumee?
Median Population Age in Maumee is 40.2 Years.
What is the Average Family Size in Maumee
Average Family Size in Maumee is 3.0 People.
What is the Average Household Size in Maumee
Average Household Size in Maumee is 2.3 People.
How Large is the Labor Force in Maumee?
There are 7,671 People in the Labor Forcein in Maumee.
What is the Percentage of People in the Labor Force in Maumee?
69.2% of People are in the Labor Force in Maumee.
What is the Unemployment Rate in Maumee?
Unemployment Rate in Maumee is 2.5%.