Lynchburg, OH Map & Demographics
Lynchburg Map
Lynchburg Overview
$27,746
PER CAPITA INCOME
$53,958
AVG FAMILY INCOME
$56,250
AVG HOUSEHOLD INCOME
45.3%
WAGE / INCOME GAP [ % ]
54.7¢/ $1
WAGE / INCOME GAP [ $ ]
0.35
INEQUALITY / GINI INDEX
1,443
TOTAL POPULATION
765
MALE POPULATION
678
FEMALE POPULATION
112.83
MALES / 100 FEMALES
88.63
FEMALES / 100 MALES
32.7
MEDIAN AGE
2.9
AVG FAMILY SIZE
2.5
AVG HOUSEHOLD SIZE
796
LABOR FORCE [ PEOPLE ]
68.9%
PERCENT IN LABOR FORCE
4.3%
UNEMPLOYMENT RATE
Lynchburg Zip Codes
Lynchburg Area Codes
Income in Lynchburg
Income Overview in Lynchburg
Per Capita Income in Lynchburg is $27,746, while median incomes of families and households are $53,958 and $56,250 respectively.
| Characteristic | Number | Measure |
| Per Capita Income | 1,443 | $27,746 |
| Median Family Income | 363 | $53,958 |
| Mean Family Income | 363 | $68,756 |
| Median Household Income | 585 | $56,250 |
| Mean Household Income | 585 | $62,629 |
| Income Deficit | 363 | $0 |
| Wage / Income Gap (%) | 1,443 | 45.32% |
| Wage / Income Gap ($) | 1,443 | 54.68¢ per $1 |
| Gini / Inequality Index | 1,443 | 0.35 |
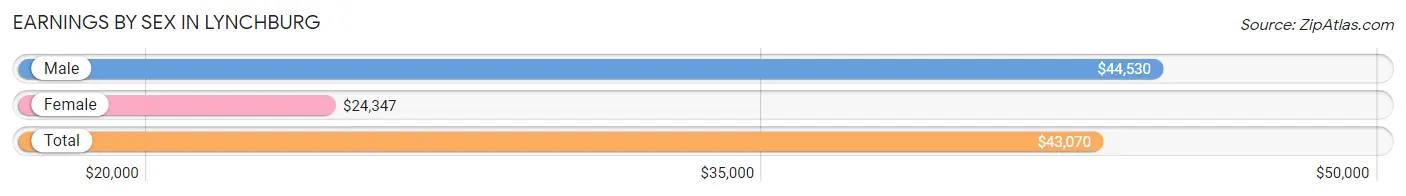
Earnings by Sex in Lynchburg
Average Earnings in Lynchburg are $43,070, $44,530 for men and $24,347 for women, a difference of 45.3%.
| Sex | Number | Average Earnings |
| Male | 496 (59.3%) | $44,530 |
| Female | 341 (40.7%) | $24,347 |
| Total | 837 (100.0%) | $43,070 |
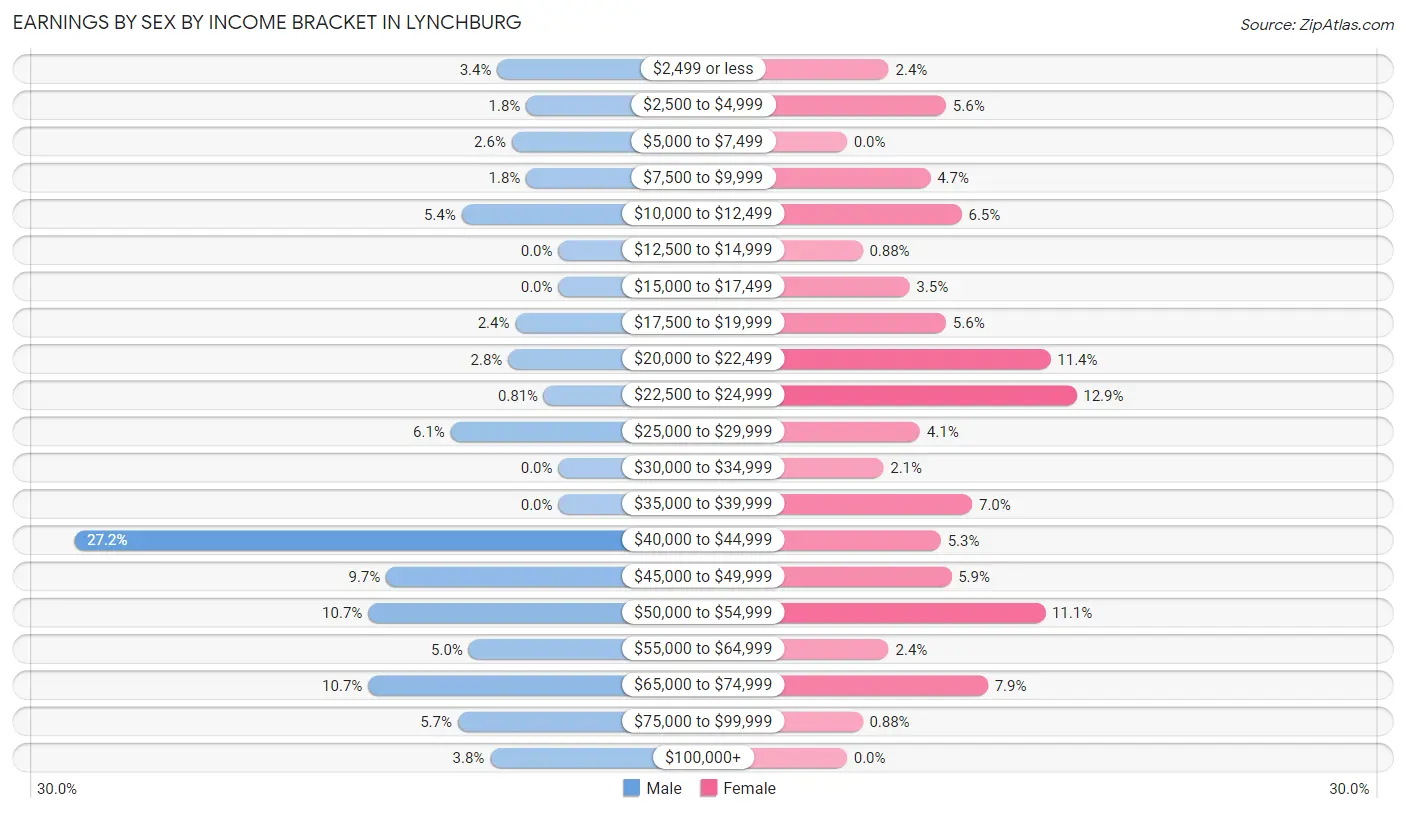
Earnings by Sex by Income Bracket in Lynchburg
The most common earnings brackets in Lynchburg are $40,000 to $44,999 for men (135 | 27.2%) and $22,500 to $24,999 for women (44 | 12.9%).
| Income | Male | Female |
| $2,499 or less | 17 (3.4%) | 8 (2.4%) |
| $2,500 to $4,999 | 9 (1.8%) | 19 (5.6%) |
| $5,000 to $7,499 | 13 (2.6%) | 0 (0.0%) |
| $7,500 to $9,999 | 9 (1.8%) | 16 (4.7%) |
| $10,000 to $12,499 | 27 (5.4%) | 22 (6.5%) |
| $12,500 to $14,999 | 0 (0.0%) | 3 (0.9%) |
| $15,000 to $17,499 | 0 (0.0%) | 12 (3.5%) |
| $17,500 to $19,999 | 12 (2.4%) | 19 (5.6%) |
| $20,000 to $22,499 | 14 (2.8%) | 39 (11.4%) |
| $22,500 to $24,999 | 4 (0.8%) | 44 (12.9%) |
| $25,000 to $29,999 | 30 (6.0%) | 14 (4.1%) |
| $30,000 to $34,999 | 0 (0.0%) | 7 (2.1%) |
| $35,000 to $39,999 | 0 (0.0%) | 24 (7.0%) |
| $40,000 to $44,999 | 135 (27.2%) | 18 (5.3%) |
| $45,000 to $49,999 | 48 (9.7%) | 20 (5.9%) |
| $50,000 to $54,999 | 53 (10.7%) | 38 (11.1%) |
| $55,000 to $64,999 | 25 (5.0%) | 8 (2.4%) |
| $65,000 to $74,999 | 53 (10.7%) | 27 (7.9%) |
| $75,000 to $99,999 | 28 (5.7%) | 3 (0.9%) |
| $100,000+ | 19 (3.8%) | 0 (0.0%) |
| Total | 496 (100.0%) | 341 (100.0%) |
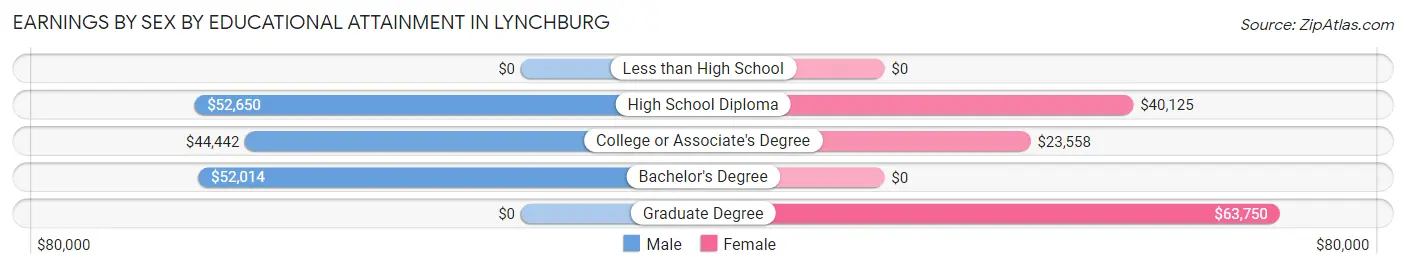
Earnings by Sex by Educational Attainment in Lynchburg
Average earnings in Lynchburg are $45,804 for men and $37,552 for women, a difference of 18.0%. Men with an educational attainment of high school diploma enjoy the highest average annual earnings of $52,650, while those with college or associate's degree education earn the least with $44,442. Women with an educational attainment of graduate degree earn the most with the average annual earnings of $63,750, while those with college or associate's degree education have the smallest earnings of $23,558.
| Educational Attainment | Male Income | Female Income |
| Less than High School | - | - |
| High School Diploma | $52,650 | $40,125 |
| College or Associate's Degree | $44,442 | $23,558 |
| Bachelor's Degree | $52,014 | $0 |
| Graduate Degree | - | - |
| Total | $45,804 | $37,552 |
Family Income in Lynchburg
Family Income Brackets in Lynchburg
According to the Lynchburg family income data, there are 92 families falling into the $50,000 to $74,999 income range, which is the most common income bracket and makes up 25.3% of all families.
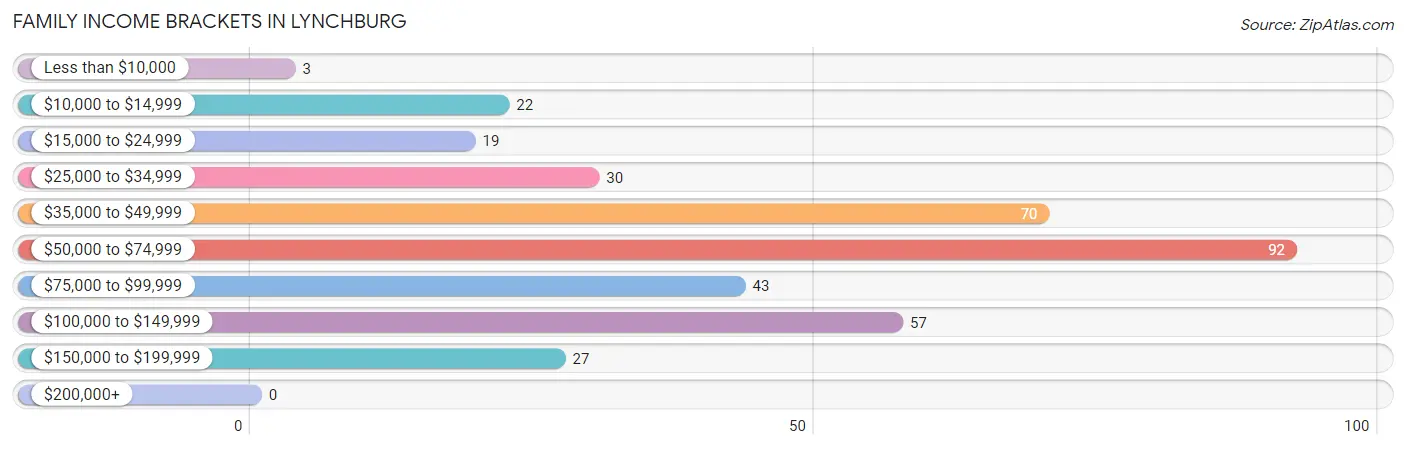
| Income Bracket | # Families | % Families |
| Less than $10,000 | 3 | 0.8% |
| $10,000 to $14,999 | 22 | 6.1% |
| $15,000 to $24,999 | 19 | 5.2% |
| $25,000 to $34,999 | 30 | 8.3% |
| $35,000 to $49,999 | 70 | 19.3% |
| $50,000 to $74,999 | 92 | 25.3% |
| $75,000 to $99,999 | 43 | 11.8% |
| $100,000 to $149,999 | 57 | 15.7% |
| $150,000 to $199,999 | 27 | 7.4% |
| $200,000+ | 0 | 0.0% |
Family Income by Famaliy Size in Lynchburg
4-person families (30 | 8.3%) account for the highest median family income in Lynchburg with $65,833 per family, while 2-person families (205 | 56.5%) have the highest median income of $25,656 per family member.
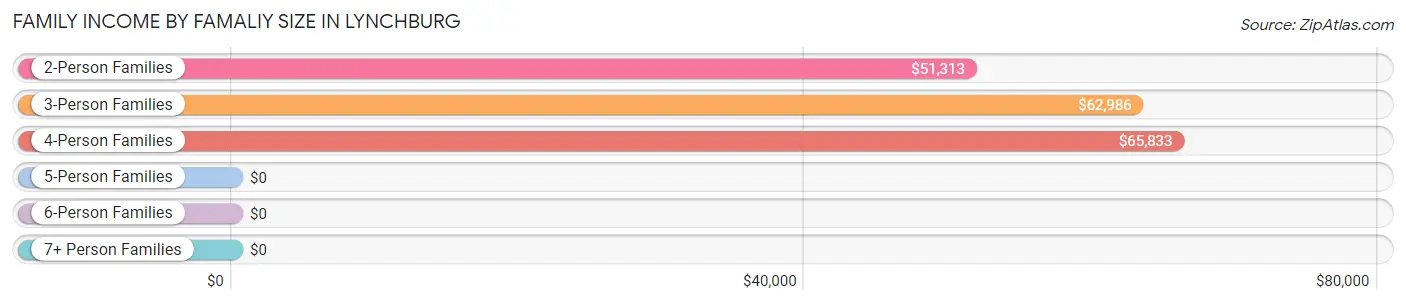
| Income Bracket | # Families | Median Income |
| 2-Person Families | 205 (56.5%) | $51,313 |
| 3-Person Families | 89 (24.5%) | $62,986 |
| 4-Person Families | 30 (8.3%) | $65,833 |
| 5-Person Families | 29 (8.0%) | $0 |
| 6-Person Families | 0 (0.0%) | $0 |
| 7+ Person Families | 10 (2.8%) | $0 |
| Total | 363 (100.0%) | $53,958 |
Family Income by Number of Earners in Lynchburg
The median family income in Lynchburg is $53,958, with families comprising 3+ earners (30) having the highest median family income of $130,625, while families with 1 earner (131) have the lowest median family income of $44,036, accounting for 8.3% and 36.1% of families, respectively.
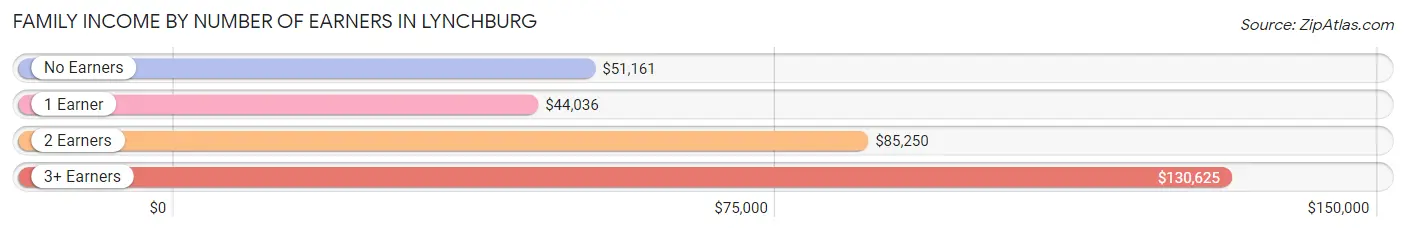
| Number of Earners | # Families | Median Income |
| No Earners | 47 (13.0%) | $51,161 |
| 1 Earner | 131 (36.1%) | $44,036 |
| 2 Earners | 155 (42.7%) | $85,250 |
| 3+ Earners | 30 (8.3%) | $130,625 |
| Total | 363 (100.0%) | $53,958 |
Household Income in Lynchburg
Household Income Brackets in Lynchburg
With 182 households falling in the category, the $50,000 to $74,999 income range is the most frequent in Lynchburg, accounting for 31.1% of all households.
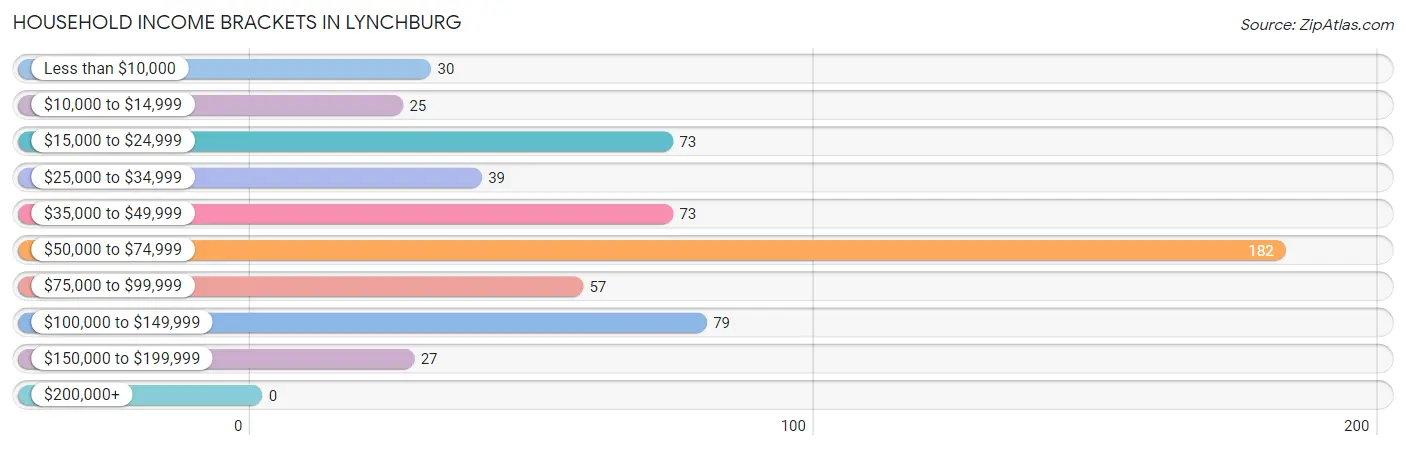
| Income Bracket | # Households | % Households |
| Less than $10,000 | 30 | 5.1% |
| $10,000 to $14,999 | 25 | 4.3% |
| $15,000 to $24,999 | 73 | 12.5% |
| $25,000 to $34,999 | 39 | 6.7% |
| $35,000 to $49,999 | 73 | 12.5% |
| $50,000 to $74,999 | 182 | 31.1% |
| $75,000 to $99,999 | 57 | 9.7% |
| $100,000 to $149,999 | 79 | 13.5% |
| $150,000 to $199,999 | 27 | 4.6% |
| $200,000+ | 0 | 0.0% |
Household Income by Householder Age in Lynchburg
The median household income in Lynchburg is $56,250, with the highest median household income of $70,536 found in the 25 to 44 years age bracket for the primary householder. A total of 180 households (30.8%) fall into this category. Meanwhile, the 65+ years age bracket for the primary householder has the lowest median household income of $0, with 111 households (19.0%) in this group.
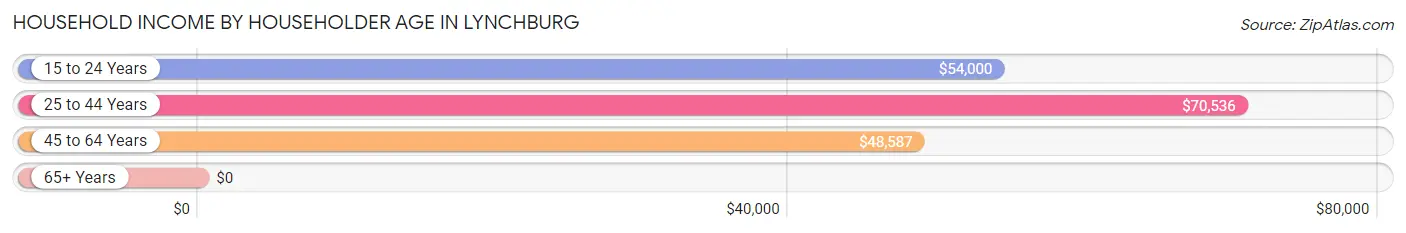
| Income Bracket | # Households | Median Income |
| 15 to 24 Years | 52 (8.9%) | $54,000 |
| 25 to 44 Years | 180 (30.8%) | $70,536 |
| 45 to 64 Years | 242 (41.4%) | $48,587 |
| 65+ Years | 111 (19.0%) | $0 |
| Total | 585 (100.0%) | $56,250 |
Poverty in Lynchburg
Income Below Poverty by Sex and Age in Lynchburg
With 10.6% poverty level for males and 16.5% for females among the residents of Lynchburg, 45 to 54 year old males and under 5 year old females are the most vulnerable to poverty, with 27 males (31.8%) and 31 females (50.8%) in their respective age groups living below the poverty level.
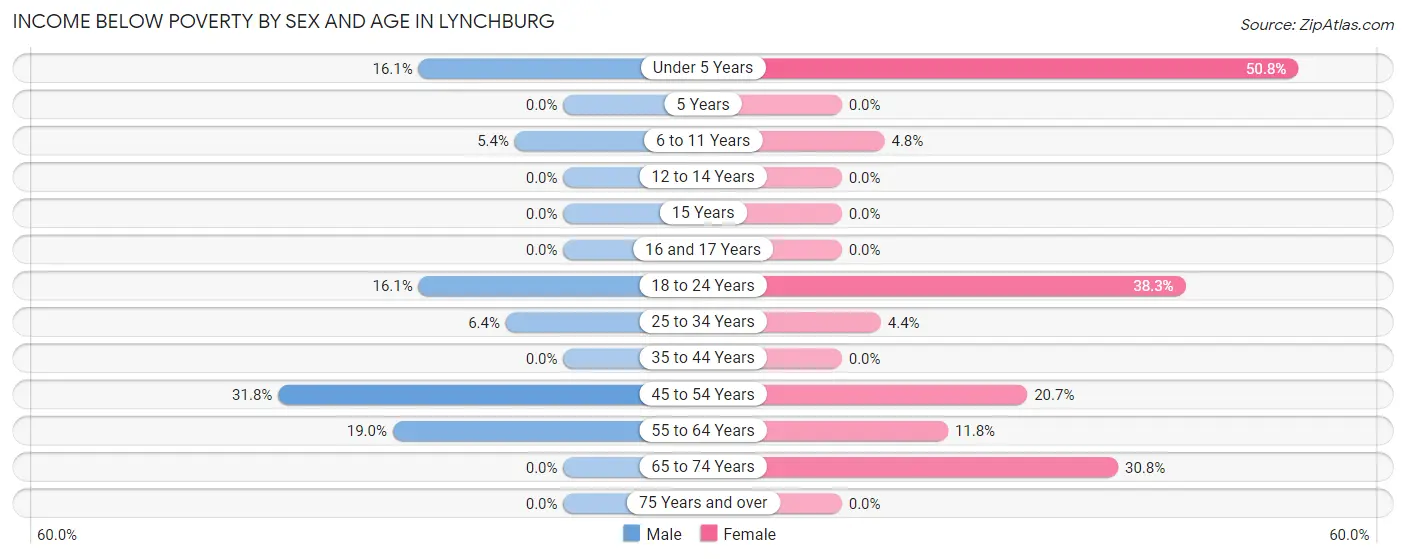
| Age Bracket | Male | Female |
| Under 5 Years | 10 (16.1%) | 31 (50.8%) |
| 5 Years | 0 (0.0%) | 0 (0.0%) |
| 6 to 11 Years | 4 (5.4%) | 3 (4.8%) |
| 12 to 14 Years | 0 (0.0%) | 0 (0.0%) |
| 15 Years | 0 (0.0%) | 0 (0.0%) |
| 16 and 17 Years | 0 (0.0%) | 0 (0.0%) |
| 18 to 24 Years | 10 (16.1%) | 31 (38.3%) |
| 25 to 34 Years | 15 (6.4%) | 3 (4.3%) |
| 35 to 44 Years | 0 (0.0%) | 0 (0.0%) |
| 45 to 54 Years | 27 (31.8%) | 19 (20.6%) |
| 55 to 64 Years | 15 (19.0%) | 13 (11.8%) |
| 65 to 74 Years | 0 (0.0%) | 12 (30.8%) |
| 75 Years and over | 0 (0.0%) | 0 (0.0%) |
| Total | 81 (10.6%) | 112 (16.5%) |
Income Above Poverty by Sex and Age in Lynchburg
According to the poverty statistics in Lynchburg, males aged 12 to 14 years and females aged 5 years are the age groups that are most secure financially, with 100.0% of males and 100.0% of females in these age groups living above the poverty line.
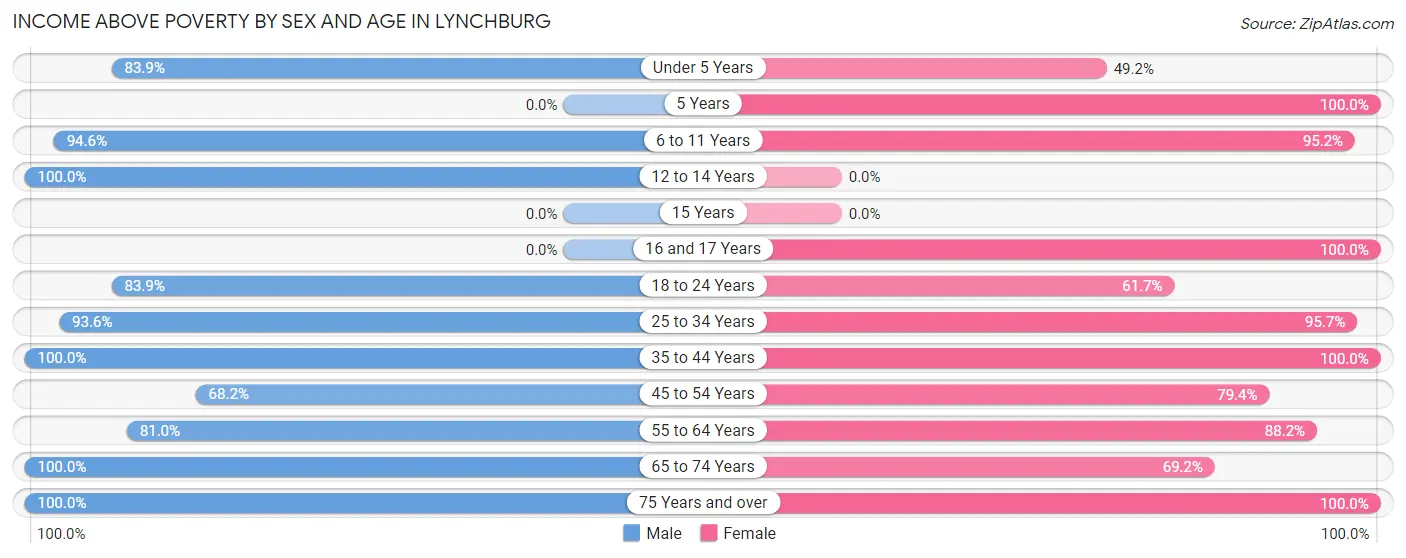
| Age Bracket | Male | Female |
| Under 5 Years | 52 (83.9%) | 30 (49.2%) |
| 5 Years | 0 (0.0%) | 10 (100.0%) |
| 6 to 11 Years | 70 (94.6%) | 60 (95.2%) |
| 12 to 14 Years | 18 (100.0%) | 0 (0.0%) |
| 15 Years | 0 (0.0%) | 0 (0.0%) |
| 16 and 17 Years | 0 (0.0%) | 23 (100.0%) |
| 18 to 24 Years | 52 (83.9%) | 50 (61.7%) |
| 25 to 34 Years | 219 (93.6%) | 66 (95.7%) |
| 35 to 44 Years | 59 (100.0%) | 82 (100.0%) |
| 45 to 54 Years | 58 (68.2%) | 73 (79.3%) |
| 55 to 64 Years | 64 (81.0%) | 97 (88.2%) |
| 65 to 74 Years | 62 (100.0%) | 27 (69.2%) |
| 75 Years and over | 30 (100.0%) | 48 (100.0%) |
| Total | 684 (89.4%) | 566 (83.5%) |
Income Below Poverty Among Married-Couple Families in Lynchburg
The poverty statistics for married-couple families in Lynchburg show that 10.4% or 28 of the total 268 families live below the poverty line. Families with 1 or 2 children have the highest poverty rate of 18.2%, comprising of 12 families. On the other hand, families with 3 or 4 children have the lowest poverty rate of 0.0%, which includes 0 families.
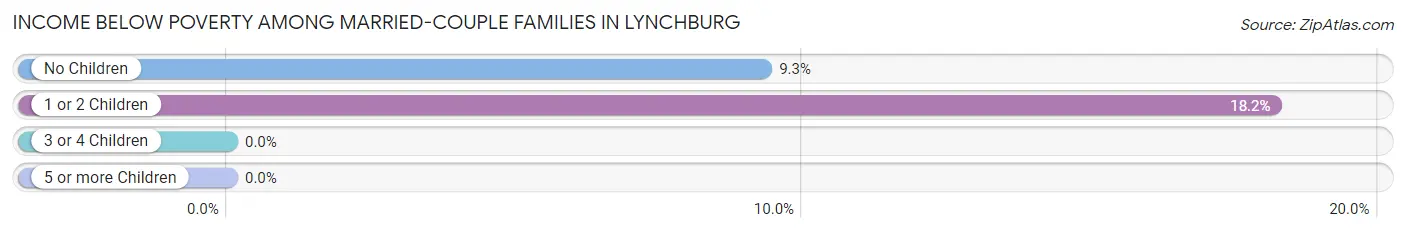
| Children | Above Poverty | Below Poverty |
| No Children | 156 (90.7%) | 16 (9.3%) |
| 1 or 2 Children | 54 (81.8%) | 12 (18.2%) |
| 3 or 4 Children | 20 (100.0%) | 0 (0.0%) |
| 5 or more Children | 10 (100.0%) | 0 (0.0%) |
| Total | 240 (89.5%) | 28 (10.4%) |
Income Below Poverty Among Single-Parent Households in Lynchburg
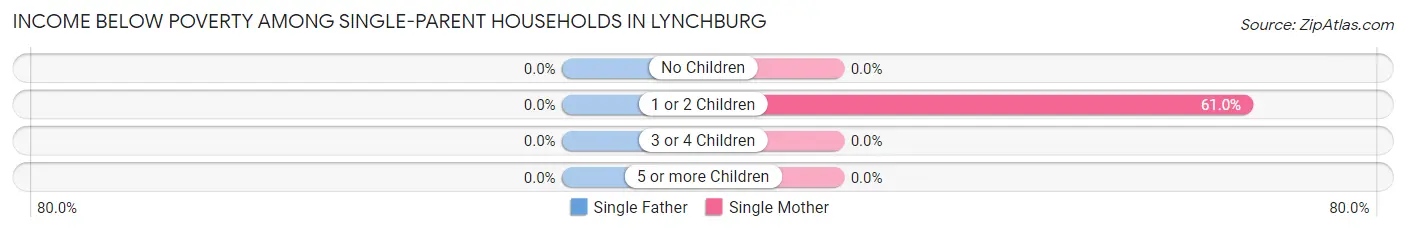
| Children | Single Father | Single Mother |
| No Children | 0 (0.0%) | 0 (0.0%) |
| 1 or 2 Children | 0 (0.0%) | 25 (61.0%) |
| 3 or 4 Children | 0 (0.0%) | 0 (0.0%) |
| 5 or more Children | 0 (0.0%) | 0 (0.0%) |
| Total | 0 (0.0%) | 25 (32.5%) |
Income Below Poverty Among Married-Couple vs Single-Parent Households in Lynchburg
The poverty data for Lynchburg shows that 28 of the married-couple family households (10.4%) and 25 of the single-parent households (26.3%) are living below the poverty level. Within the married-couple family households, those with 1 or 2 children have the highest poverty rate, with 12 households (18.2%) falling below the poverty line. Among the single-parent households, those with 1 or 2 children have the highest poverty rate, with 25 household (42.4%) living below poverty.
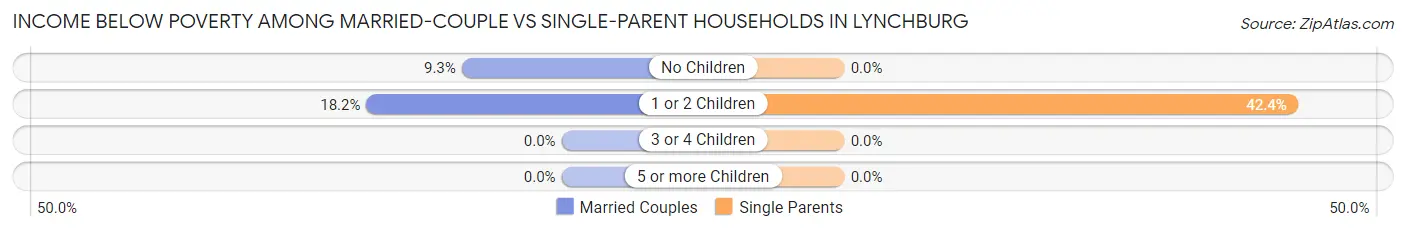
| Children | Married-Couple Families | Single-Parent Households |
| No Children | 16 (9.3%) | 0 (0.0%) |
| 1 or 2 Children | 12 (18.2%) | 25 (42.4%) |
| 3 or 4 Children | 0 (0.0%) | 0 (0.0%) |
| 5 or more Children | 0 (0.0%) | 0 (0.0%) |
| Total | 28 (10.4%) | 25 (26.3%) |
Race in Lynchburg
The most populous races in Lynchburg are White / Caucasian (1,418 | 98.3%), Hispanic or Latino (37 | 2.6%), and Some other Race (18 | 1.3%).
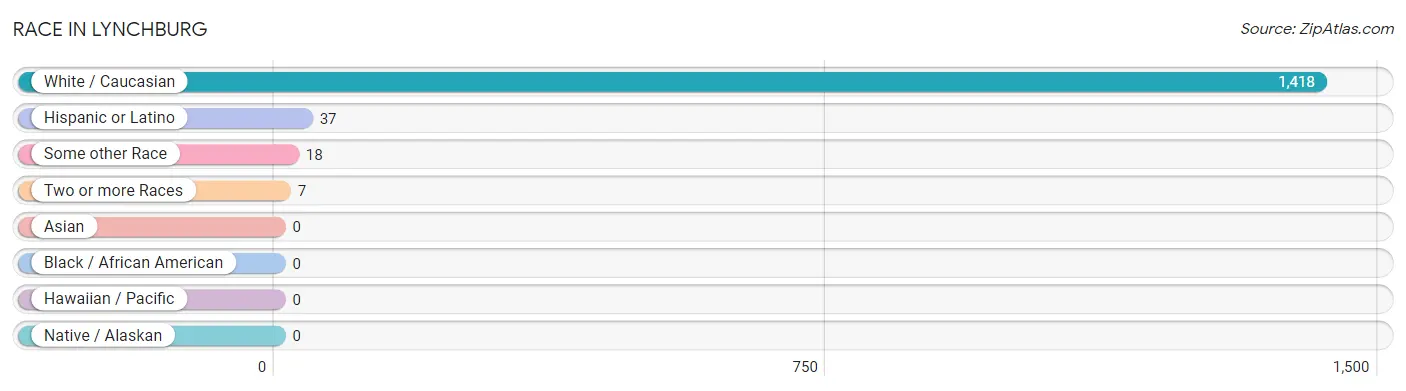
| Race | # Population | % Population |
| Asian | 0 | 0.0% |
| Black / African American | 0 | 0.0% |
| Hawaiian / Pacific | 0 | 0.0% |
| Hispanic or Latino | 37 | 2.6% |
| Native / Alaskan | 0 | 0.0% |
| White / Caucasian | 1,418 | 98.3% |
| Two or more Races | 7 | 0.5% |
| Some other Race | 18 | 1.3% |
| Total | 1,443 | 100.0% |
Ancestry in Lynchburg
The most populous ancestries reported in Lynchburg are German (326 | 22.6%), Irish (259 | 17.9%), English (155 | 10.7%), Italian (85 | 5.9%), and French (56 | 3.9%), together accounting for 61.0% of all Lynchburg residents.
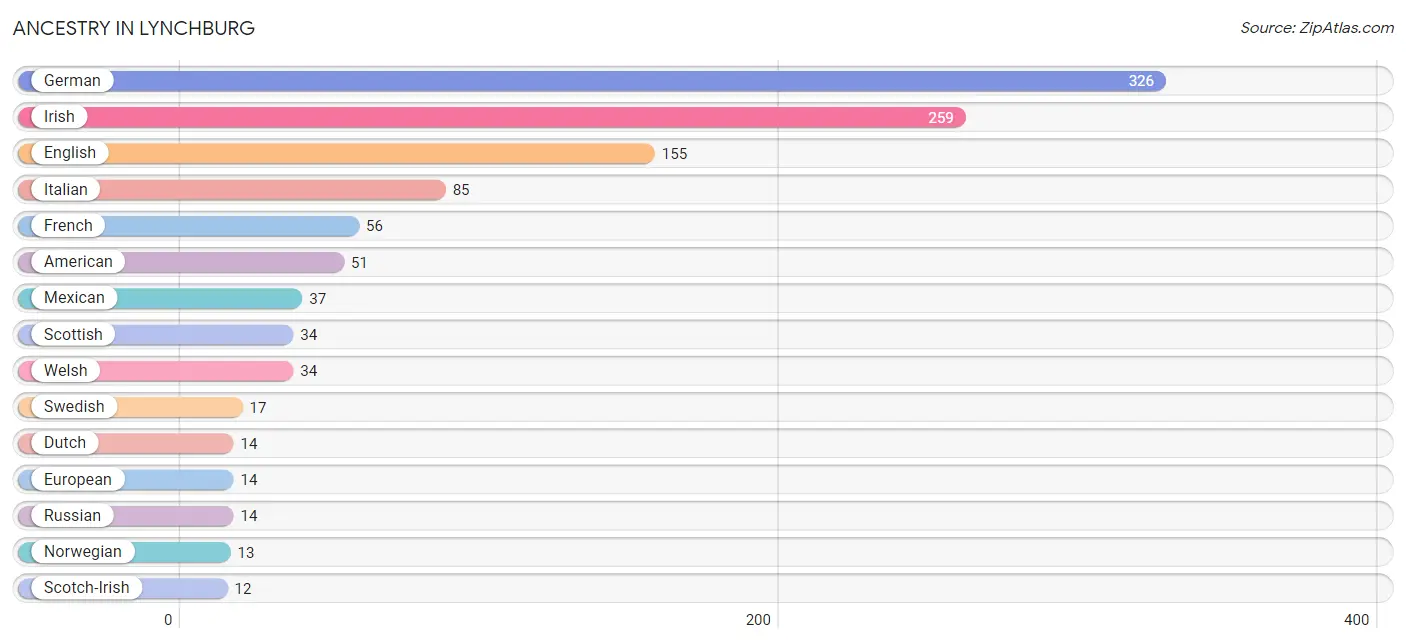
| Ancestry | # Population | % Population |
| American | 51 | 3.5% |
| Belgian | 3 | 0.2% |
| Dutch | 14 | 1.0% |
| English | 155 | 10.7% |
| European | 14 | 1.0% |
| French | 56 | 3.9% |
| German | 326 | 22.6% |
| Greek | 7 | 0.5% |
| Irish | 259 | 17.9% |
| Italian | 85 | 5.9% |
| Mexican | 37 | 2.6% |
| Norwegian | 13 | 0.9% |
| Russian | 14 | 1.0% |
| Scotch-Irish | 12 | 0.8% |
| Scottish | 34 | 2.4% |
| Swedish | 17 | 1.2% |
| Welsh | 34 | 2.4% | View All 17 Rows |
Immigrants in Lynchburg

| Immigration Origin | # Population | % Population | View All 0 Rows |
Sex and Age in Lynchburg
Sex and Age in Lynchburg
The most populous age groups in Lynchburg are 25 to 29 Years (143 | 18.7%) for men and 20 to 24 Years (81 | 11.9%) for women.
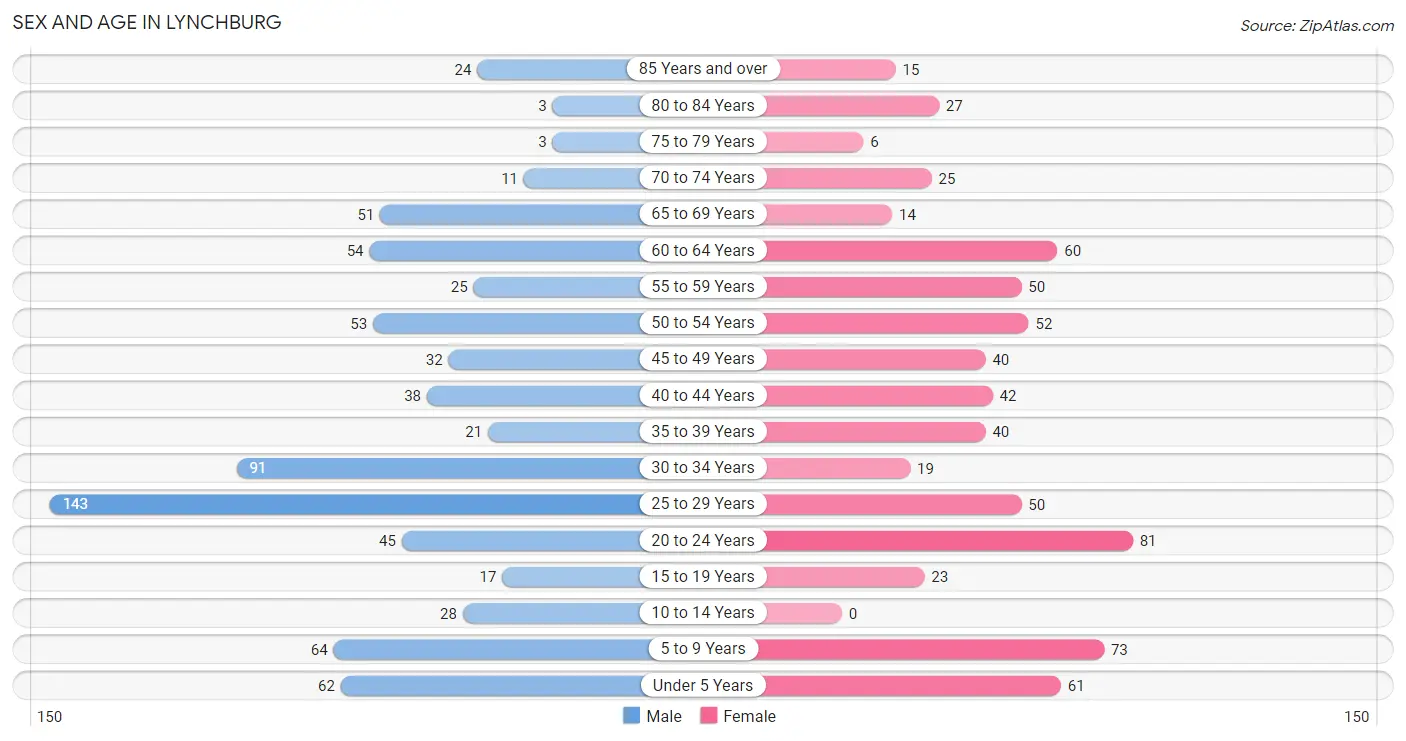
| Age Bracket | Male | Female |
| Under 5 Years | 62 (8.1%) | 61 (9.0%) |
| 5 to 9 Years | 64 (8.4%) | 73 (10.8%) |
| 10 to 14 Years | 28 (3.7%) | 0 (0.0%) |
| 15 to 19 Years | 17 (2.2%) | 23 (3.4%) |
| 20 to 24 Years | 45 (5.9%) | 81 (11.9%) |
| 25 to 29 Years | 143 (18.7%) | 50 (7.4%) |
| 30 to 34 Years | 91 (11.9%) | 19 (2.8%) |
| 35 to 39 Years | 21 (2.8%) | 40 (5.9%) |
| 40 to 44 Years | 38 (5.0%) | 42 (6.2%) |
| 45 to 49 Years | 32 (4.2%) | 40 (5.9%) |
| 50 to 54 Years | 53 (6.9%) | 52 (7.7%) |
| 55 to 59 Years | 25 (3.3%) | 50 (7.4%) |
| 60 to 64 Years | 54 (7.1%) | 60 (8.8%) |
| 65 to 69 Years | 51 (6.7%) | 14 (2.1%) |
| 70 to 74 Years | 11 (1.4%) | 25 (3.7%) |
| 75 to 79 Years | 3 (0.4%) | 6 (0.9%) |
| 80 to 84 Years | 3 (0.4%) | 27 (4.0%) |
| 85 Years and over | 24 (3.1%) | 15 (2.2%) |
| Total | 765 (100.0%) | 678 (100.0%) |
Families and Households in Lynchburg
Median Family Size in Lynchburg
The median family size in Lynchburg is 2.90 persons per family, with married-couple families (268 | 73.8%) accounting for the largest median family size of 3.11 persons per family. On the other hand, single female/mother families (77 | 21.2%) represent the smallest median family size with 2.23 persons per family.
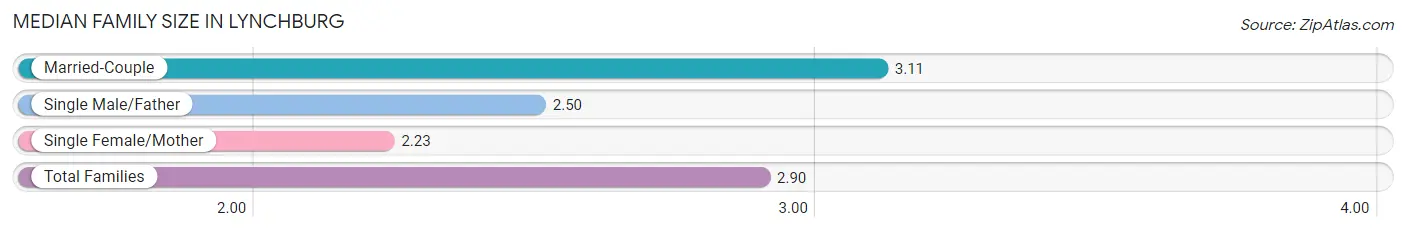
| Family Type | # Families | Family Size |
| Married-Couple | 268 (73.8%) | 3.11 |
| Single Male/Father | 18 (5.0%) | 2.50 |
| Single Female/Mother | 77 (21.2%) | 2.23 |
| Total Families | 363 (100.0%) | 2.90 |
Median Household Size in Lynchburg
The median household size in Lynchburg is 2.47 persons per household, with single male/father households (18 | 3.1%) accounting for the largest median household size of 3.22 persons per household. non-family households (222 | 38.0%) represent the smallest median household size with 1.58 persons per household.
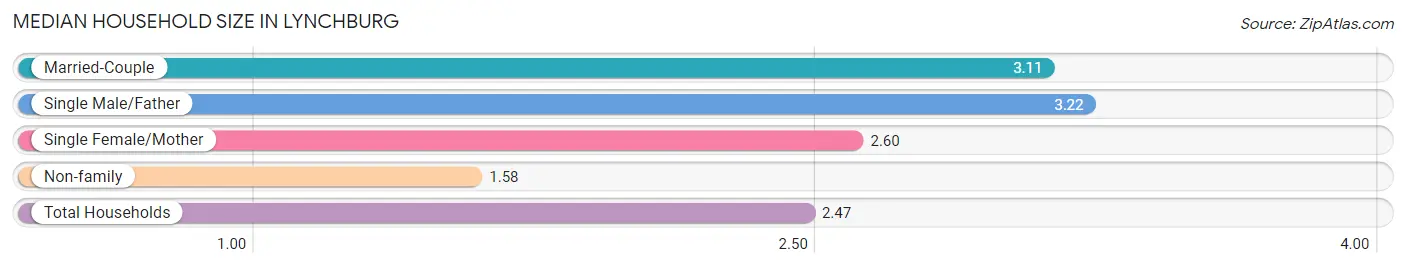
| Household Type | # Households | Household Size |
| Married-Couple | 268 (45.8%) | 3.11 |
| Single Male/Father | 18 (3.1%) | 3.22 |
| Single Female/Mother | 77 (13.2%) | 2.60 |
| Non-family | 222 (38.0%) | 1.58 |
| Total Households | 585 (100.0%) | 2.47 |
Household Size by Marriage Status in Lynchburg
Out of a total of 585 households in Lynchburg, 363 (62.1%) are family households, while 222 (38.0%) are nonfamily households. The most numerous type of family households are 2-person households, comprising 168, and the most common type of nonfamily households are 1-person households, comprising 181.
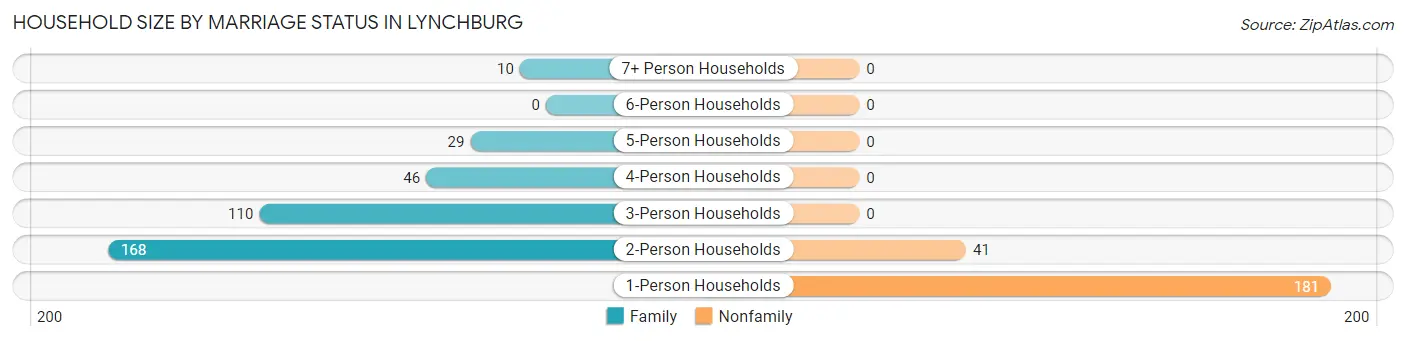
| Household Size | Family Households | Nonfamily Households |
| 1-Person Households | - | 181 (30.9%) |
| 2-Person Households | 168 (28.7%) | 41 (7.0%) |
| 3-Person Households | 110 (18.8%) | 0 (0.0%) |
| 4-Person Households | 46 (7.9%) | 0 (0.0%) |
| 5-Person Households | 29 (5.0%) | 0 (0.0%) |
| 6-Person Households | 0 (0.0%) | 0 (0.0%) |
| 7+ Person Households | 10 (1.7%) | 0 (0.0%) |
| Total | 363 (62.1%) | 222 (38.0%) |
Female Fertility in Lynchburg
Fertility by Age in Lynchburg
Average fertility rate in Lynchburg is 156.0 births per 1,000 women. Women in the age bracket of 20 to 34 years have the highest fertility rate with 307.0 births per 1,000 women. Women in the age bracket of 20 to 34 years acount for 100.0% of all women with births.
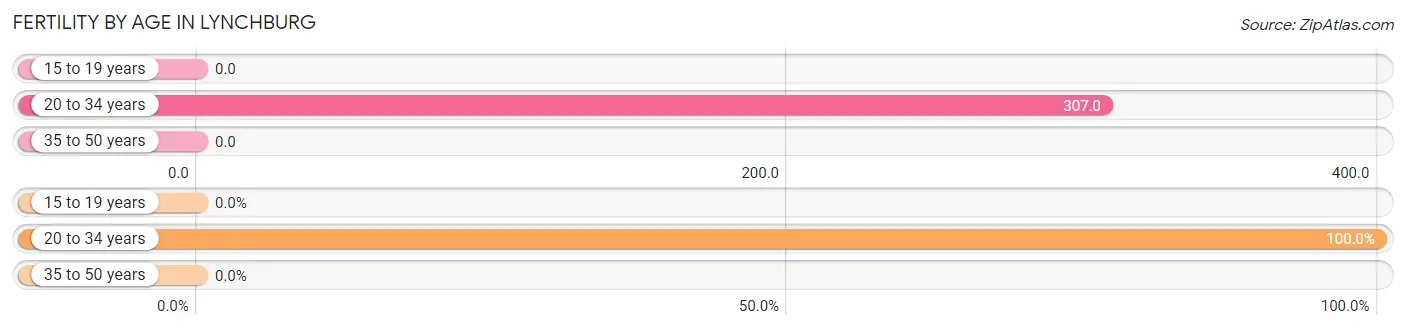
| Age Bracket | Women with Births | Births / 1,000 Women |
| 15 to 19 years | 0 (0.0%) | 0.0 |
| 20 to 34 years | 46 (100.0%) | 307.0 |
| 35 to 50 years | 0 (0.0%) | 0.0 |
| Total | 46 (100.0%) | 156.0 |
Fertility by Age by Marriage Status in Lynchburg
52.2% of women with births (46) in Lynchburg are married. The highest percentage of unmarried women with births falls into 20 to 34 years age bracket with 47.8% of them unmarried at the time of birth, while the lowest percentage of unmarried women with births belong to 20 to 34 years age bracket with 47.8% of them unmarried.
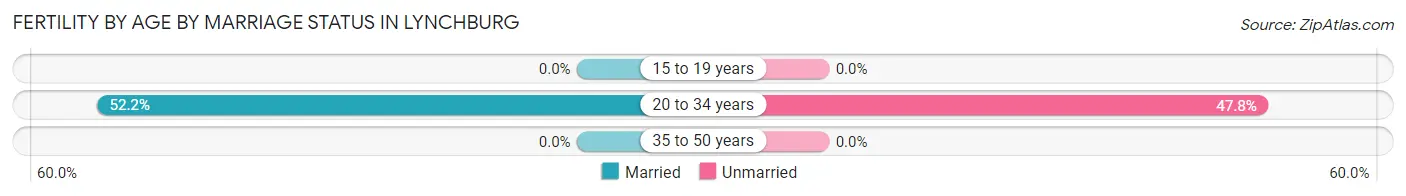
| Age Bracket | Married | Unmarried |
| 15 to 19 years | 0 (0.0%) | 0 (0.0%) |
| 20 to 34 years | 24 (52.2%) | 22 (47.8%) |
| 35 to 50 years | 0 (0.0%) | 0 (0.0%) |
| Total | 24 (52.2%) | 22 (47.8%) |
Fertility by Education in Lynchburg
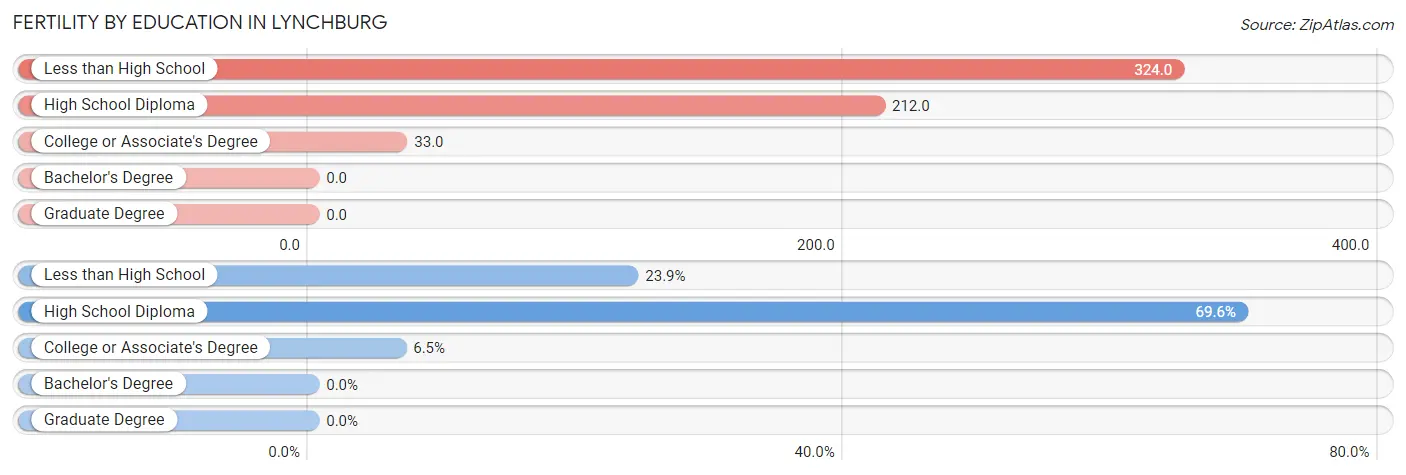
| Educational Attainment | Women with Births | Births / 1,000 Women |
| Less than High School | 11 (23.9%) | 324.0 |
| High School Diploma | 32 (69.6%) | 212.0 |
| College or Associate's Degree | 3 (6.5%) | 33.0 |
| Bachelor's Degree | 0 (0.0%) | 0.0 |
| Graduate Degree | 0 (0.0%) | 0.0 |
| Total | 46 (100.0%) | 156.0 |
Fertility by Education by Marriage Status in Lynchburg
47.8% of women with births in Lynchburg are unmarried. Women with the educational attainment of less than high school are most likely to be married with 100.0% of them married at childbirth, while women with the educational attainment of high school diploma are least likely to be married with 68.8% of them unmarried at childbirth.
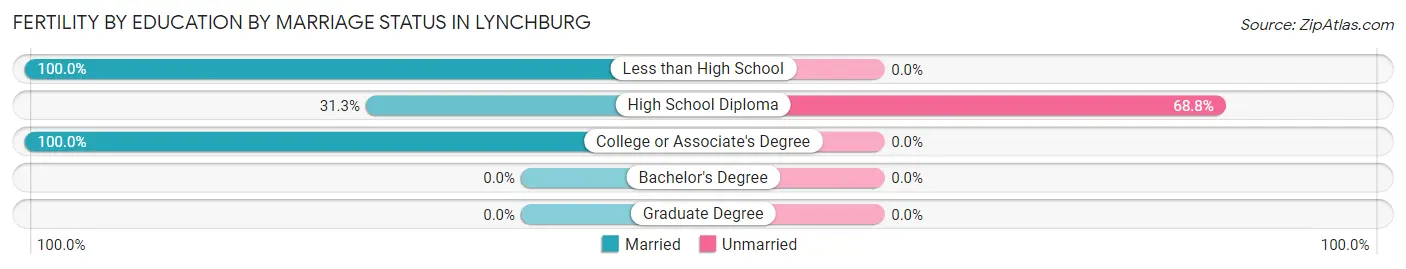
| Educational Attainment | Married | Unmarried |
| Less than High School | 11 (100.0%) | 0 (0.0%) |
| High School Diploma | 10 (31.2%) | 22 (68.8%) |
| College or Associate's Degree | 3 (100.0%) | 0 (0.0%) |
| Bachelor's Degree | 0 (0.0%) | 0 (0.0%) |
| Graduate Degree | 0 (0.0%) | 0 (0.0%) |
| Total | 24 (52.2%) | 22 (47.8%) |
Employment Characteristics in Lynchburg
Employment by Class of Employer in Lynchburg
Among the 731 employed individuals in Lynchburg, private company employees (631 | 86.3%), not-for-profit organizations (35 | 4.8%), and local government employees (24 | 3.3%) make up the most common classes of employment.
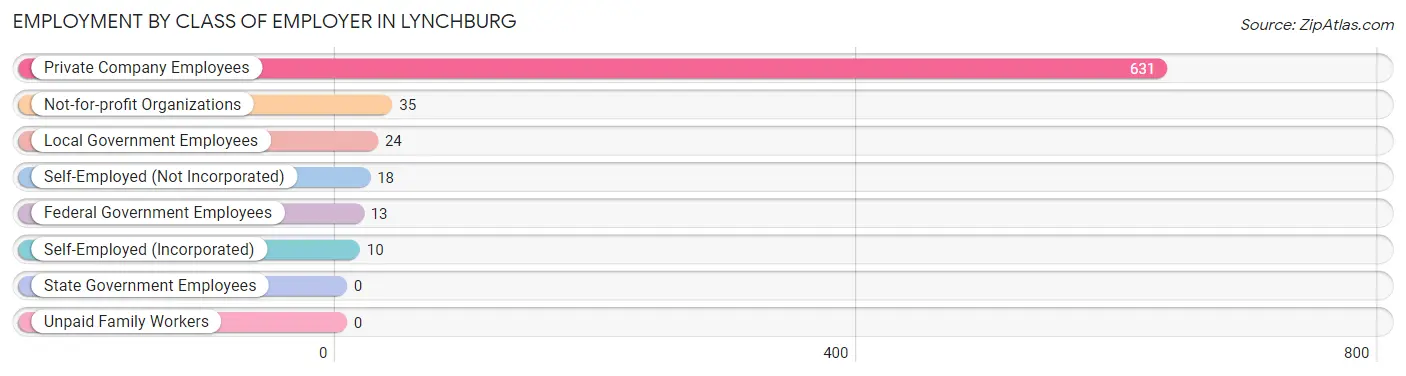
| Employer Class | # Employees | % Employees |
| Private Company Employees | 631 | 86.3% |
| Self-Employed (Incorporated) | 10 | 1.4% |
| Self-Employed (Not Incorporated) | 18 | 2.5% |
| Not-for-profit Organizations | 35 | 4.8% |
| Local Government Employees | 24 | 3.3% |
| State Government Employees | 0 | 0.0% |
| Federal Government Employees | 13 | 1.8% |
| Unpaid Family Workers | 0 | 0.0% |
| Total | 731 | 100.0% |
Employment Status by Age in Lynchburg
According to the labor force statistics for Lynchburg, out of the total population over 16 years of age (1,155), 68.9% or 796 individuals are in the labor force, with 4.3% or 34 of them unemployed. The age group with the highest labor force participation rate is 25 to 29 years, with 96.9% or 187 individuals in the labor force. Within the labor force, the 35 to 44 years age range has the highest percentage of unemployed individuals, with 14.5% or 19 of them being unemployed.
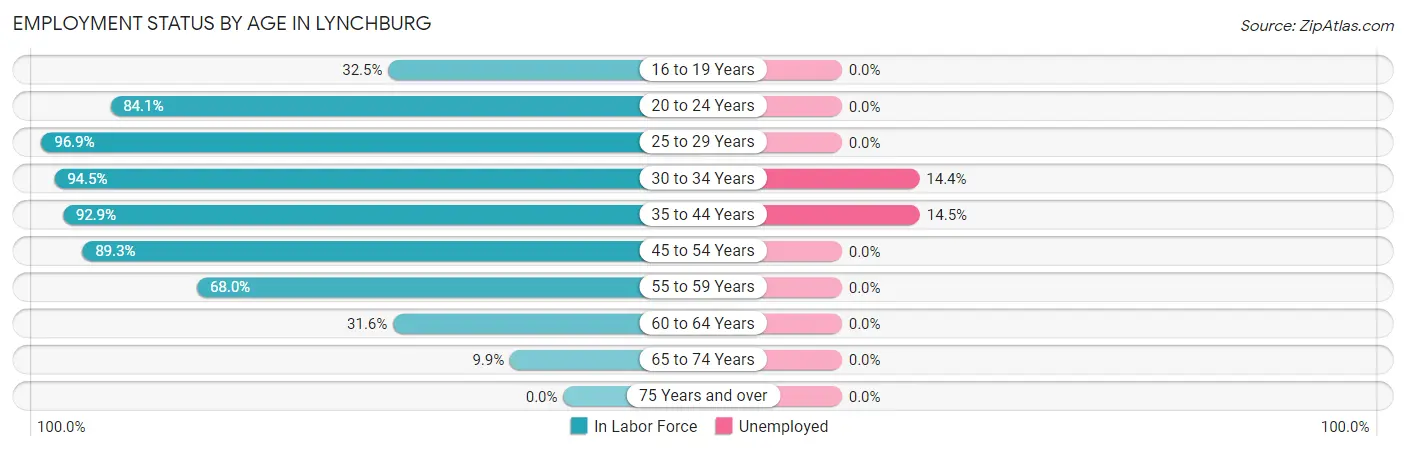
| Age Bracket | In Labor Force | Unemployed |
| 16 to 19 Years | 13 (32.5%) | 0 (0.0%) |
| 20 to 24 Years | 106 (84.1%) | 0 (0.0%) |
| 25 to 29 Years | 187 (96.9%) | 0 (0.0%) |
| 30 to 34 Years | 104 (94.5%) | 15 (14.4%) |
| 35 to 44 Years | 131 (92.9%) | 19 (14.5%) |
| 45 to 54 Years | 158 (89.3%) | 0 (0.0%) |
| 55 to 59 Years | 51 (68.0%) | 0 (0.0%) |
| 60 to 64 Years | 36 (31.6%) | 0 (0.0%) |
| 65 to 74 Years | 10 (9.9%) | 0 (0.0%) |
| 75 Years and over | 0 (0.0%) | 0 (0.0%) |
| Total | 796 (68.9%) | 34 (4.3%) |
Employment Status by Educational Attainment in Lynchburg
According to labor force statistics for Lynchburg, 82.3% of individuals (667) out of the total population between 25 and 64 years of age (810) are in the labor force, with 5.1% or 34 of them being unemployed. The group with the highest labor force participation rate are those with the educational attainment of less than high school, with 100.0% or 32 individuals in the labor force. Within the labor force, individuals with high school diploma education have the highest percentage of unemployment, with 9.5% or 25 of them being unemployed.
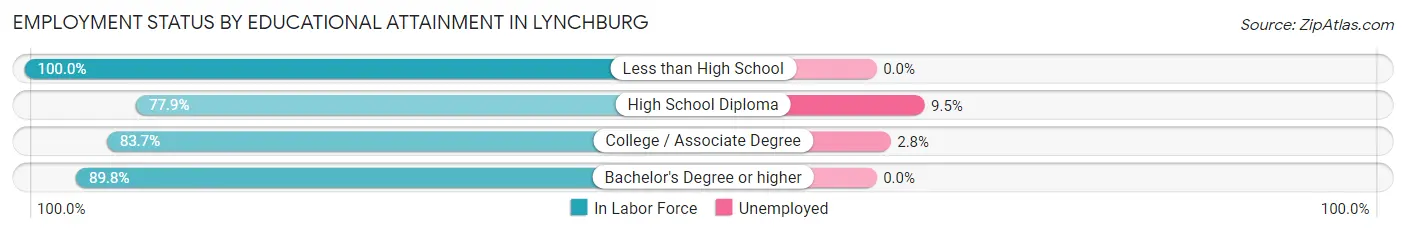
| Educational Attainment | In Labor Force | Unemployed |
| Less than High School | 32 (100.0%) | 0 (0.0%) |
| High School Diploma | 264 (77.9%) | 32 (9.5%) |
| College / Associate Degree | 318 (83.7%) | 11 (2.8%) |
| Bachelor's Degree or higher | 53 (89.8%) | 0 (0.0%) |
| Total | 667 (82.3%) | 41 (5.1%) |
Employment Occupations by Sex in Lynchburg
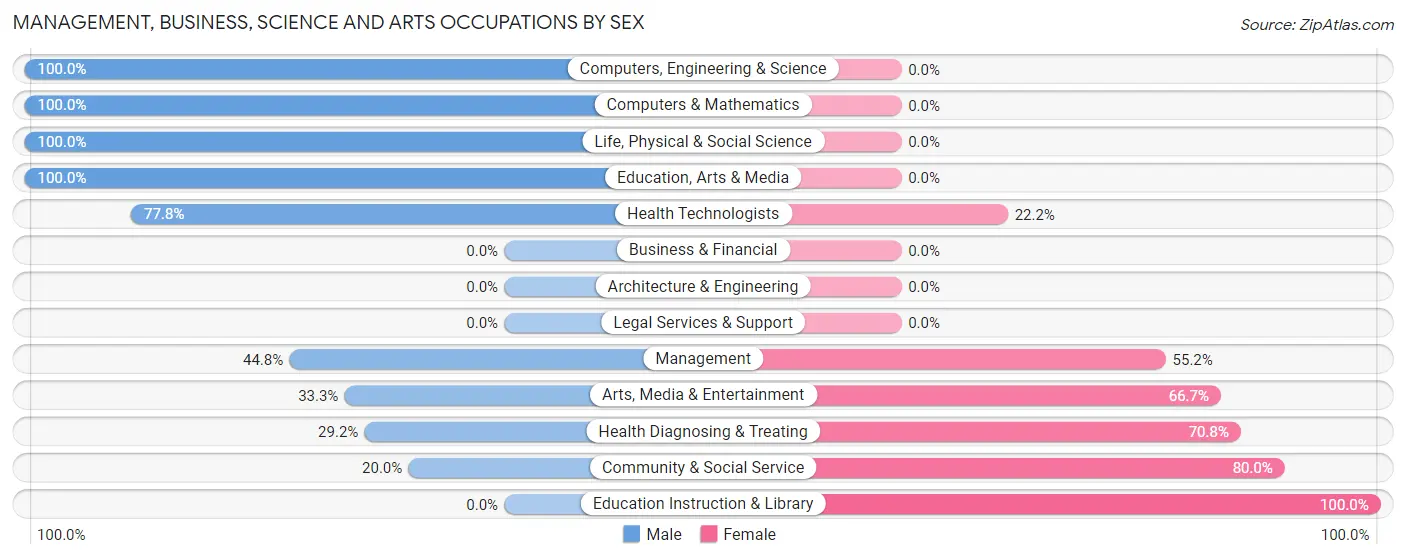
Management, Business, Science and Arts Occupations
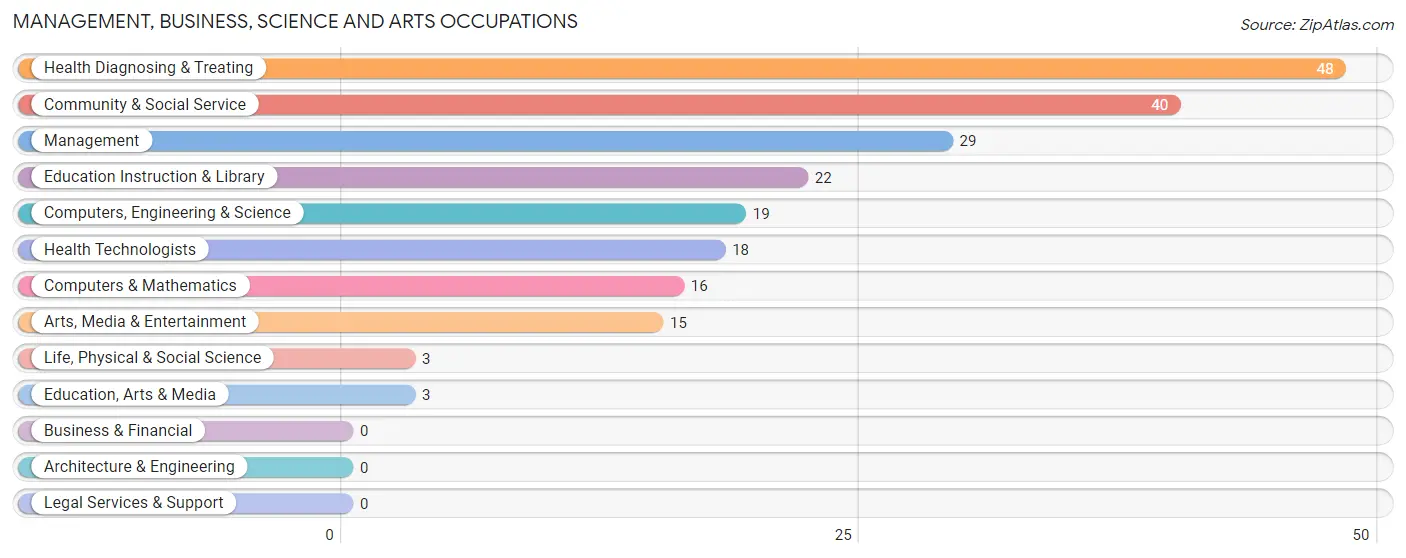
The most common Management, Business, Science and Arts occupations in Lynchburg are Health Diagnosing & Treating (48 | 6.3%), Community & Social Service (40 | 5.2%), Management (29 | 3.8%), Education Instruction & Library (22 | 2.9%), and Computers, Engineering & Science (19 | 2.5%).
Management, Business, Science and Arts Occupations by Sex
Within the Management, Business, Science and Arts occupations in Lynchburg, the most male-oriented occupations are Computers, Engineering & Science (100.0%), Computers & Mathematics (100.0%), and Life, Physical & Social Science (100.0%), while the most female-oriented occupations are Education Instruction & Library (100.0%), Community & Social Service (80.0%), and Health Diagnosing & Treating (70.8%).
| Occupation | Male | Female |
| Management | 13 (44.8%) | 16 (55.2%) |
| Business & Financial | 0 (0.0%) | 0 (0.0%) |
| Computers, Engineering & Science | 19 (100.0%) | 0 (0.0%) |
| Computers & Mathematics | 16 (100.0%) | 0 (0.0%) |
| Architecture & Engineering | 0 (0.0%) | 0 (0.0%) |
| Life, Physical & Social Science | 3 (100.0%) | 0 (0.0%) |
| Community & Social Service | 8 (20.0%) | 32 (80.0%) |
| Education, Arts & Media | 3 (100.0%) | 0 (0.0%) |
| Legal Services & Support | 0 (0.0%) | 0 (0.0%) |
| Education Instruction & Library | 0 (0.0%) | 22 (100.0%) |
| Arts, Media & Entertainment | 5 (33.3%) | 10 (66.7%) |
| Health Diagnosing & Treating | 14 (29.2%) | 34 (70.8%) |
| Health Technologists | 14 (77.8%) | 4 (22.2%) |
| Total (Category) | 54 (39.7%) | 82 (60.3%) |
| Total (Overall) | 445 (58.4%) | 317 (41.6%) |
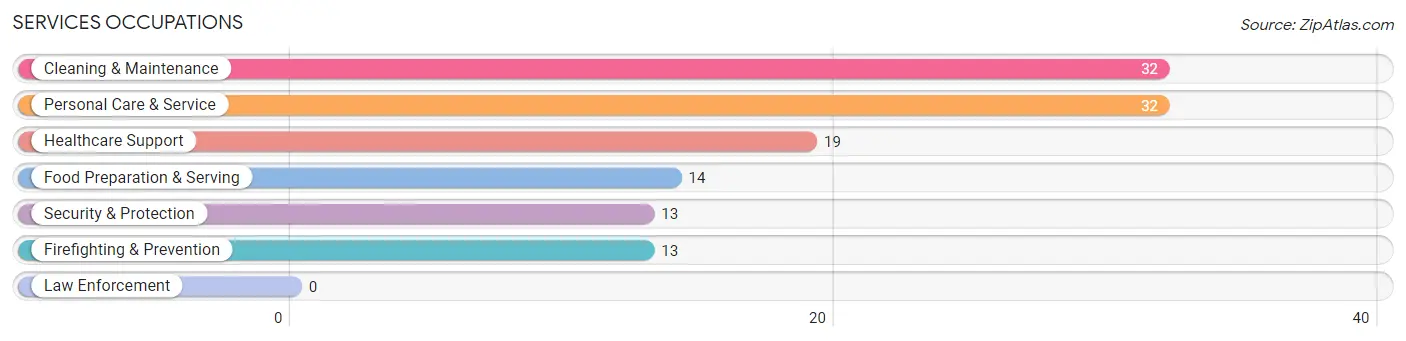
Services Occupations
The most common Services occupations in Lynchburg are Cleaning & Maintenance (32 | 4.2%), Personal Care & Service (32 | 4.2%), Healthcare Support (19 | 2.5%), Food Preparation & Serving (14 | 1.8%), and Security & Protection (13 | 1.7%).
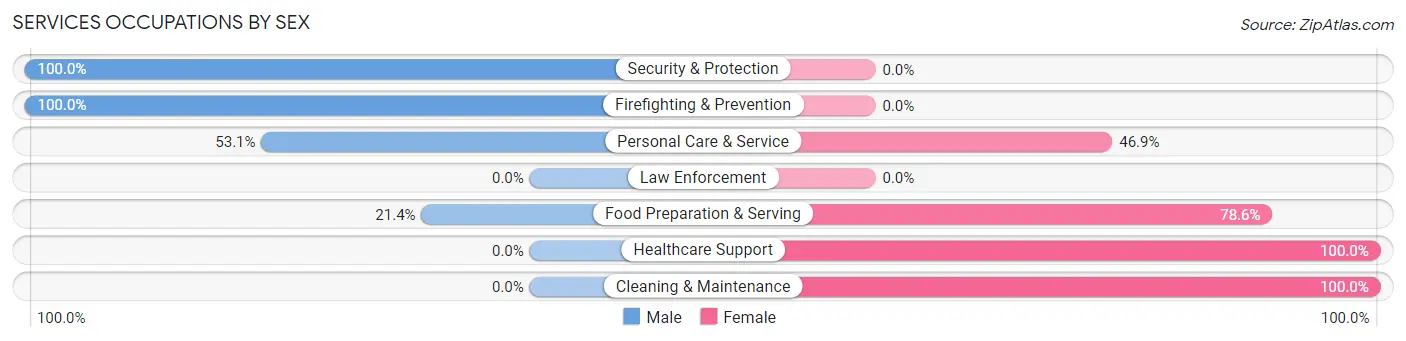
Services Occupations by Sex
Within the Services occupations in Lynchburg, the most male-oriented occupations are Security & Protection (100.0%), Firefighting & Prevention (100.0%), and Personal Care & Service (53.1%), while the most female-oriented occupations are Healthcare Support (100.0%), Cleaning & Maintenance (100.0%), and Food Preparation & Serving (78.6%).
| Occupation | Male | Female |
| Healthcare Support | 0 (0.0%) | 19 (100.0%) |
| Security & Protection | 13 (100.0%) | 0 (0.0%) |
| Firefighting & Prevention | 13 (100.0%) | 0 (0.0%) |
| Law Enforcement | 0 (0.0%) | 0 (0.0%) |
| Food Preparation & Serving | 3 (21.4%) | 11 (78.6%) |
| Cleaning & Maintenance | 0 (0.0%) | 32 (100.0%) |
| Personal Care & Service | 17 (53.1%) | 15 (46.9%) |
| Total (Category) | 33 (30.0%) | 77 (70.0%) |
| Total (Overall) | 445 (58.4%) | 317 (41.6%) |
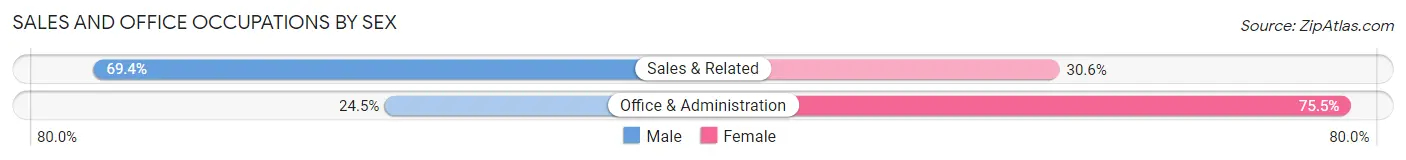
Sales and Office Occupations
The most common Sales and Office occupations in Lynchburg are Office & Administration (53 | 7.0%), and Sales & Related (49 | 6.4%).

Sales and Office Occupations by Sex
| Occupation | Male | Female |
| Sales & Related | 34 (69.4%) | 15 (30.6%) |
| Office & Administration | 13 (24.5%) | 40 (75.5%) |
| Total (Category) | 47 (46.1%) | 55 (53.9%) |
| Total (Overall) | 445 (58.4%) | 317 (41.6%) |
Natural Resources, Construction and Maintenance Occupations
The most common Natural Resources, Construction and Maintenance occupations in Lynchburg are Construction & Extraction (42 | 5.5%), Farming, Fishing & Forestry (12 | 1.6%), and Installation, Maintenance & Repair (11 | 1.4%).
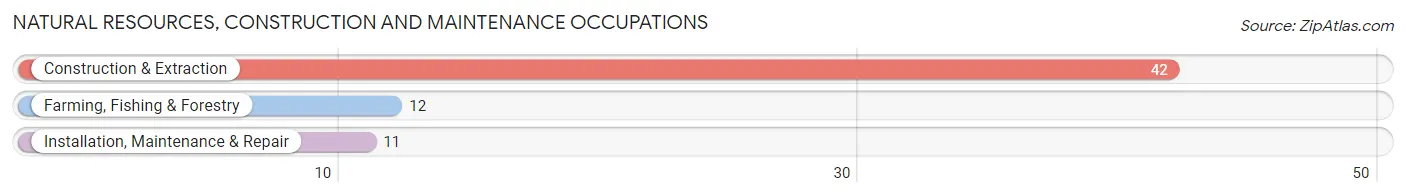
Natural Resources, Construction and Maintenance Occupations by Sex
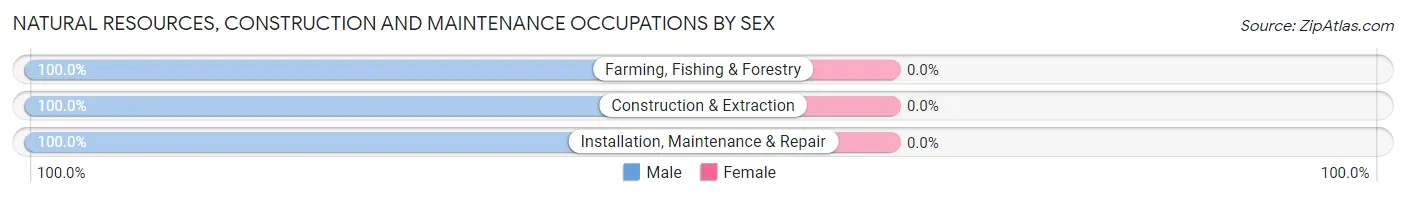
| Occupation | Male | Female |
| Farming, Fishing & Forestry | 12 (100.0%) | 0 (0.0%) |
| Construction & Extraction | 42 (100.0%) | 0 (0.0%) |
| Installation, Maintenance & Repair | 11 (100.0%) | 0 (0.0%) |
| Total (Category) | 65 (100.0%) | 0 (0.0%) |
| Total (Overall) | 445 (58.4%) | 317 (41.6%) |
Production, Transportation and Moving Occupations
The most common Production, Transportation and Moving occupations in Lynchburg are Production (165 | 21.6%), Transportation (149 | 19.6%), and Material Moving (35 | 4.6%).
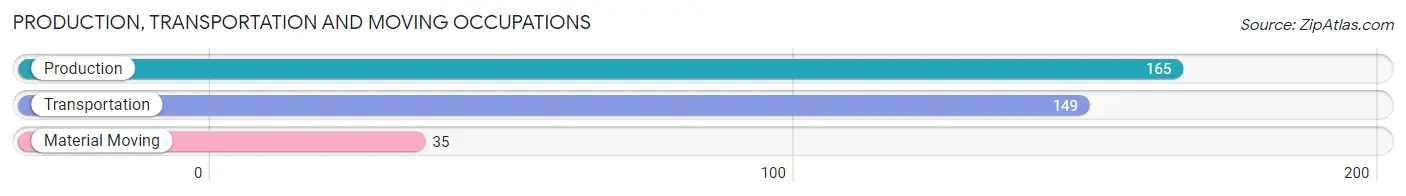
Production, Transportation and Moving Occupations by Sex
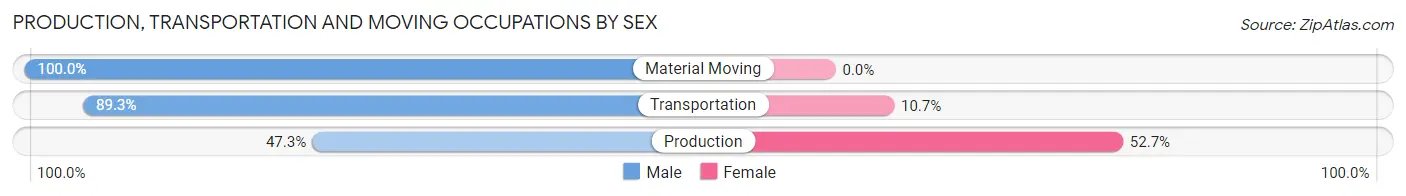
| Occupation | Male | Female |
| Production | 78 (47.3%) | 87 (52.7%) |
| Transportation | 133 (89.3%) | 16 (10.7%) |
| Material Moving | 35 (100.0%) | 0 (0.0%) |
| Total (Category) | 246 (70.5%) | 103 (29.5%) |
| Total (Overall) | 445 (58.4%) | 317 (41.6%) |
Employment Industries by Sex in Lynchburg
Employment Industries in Lynchburg
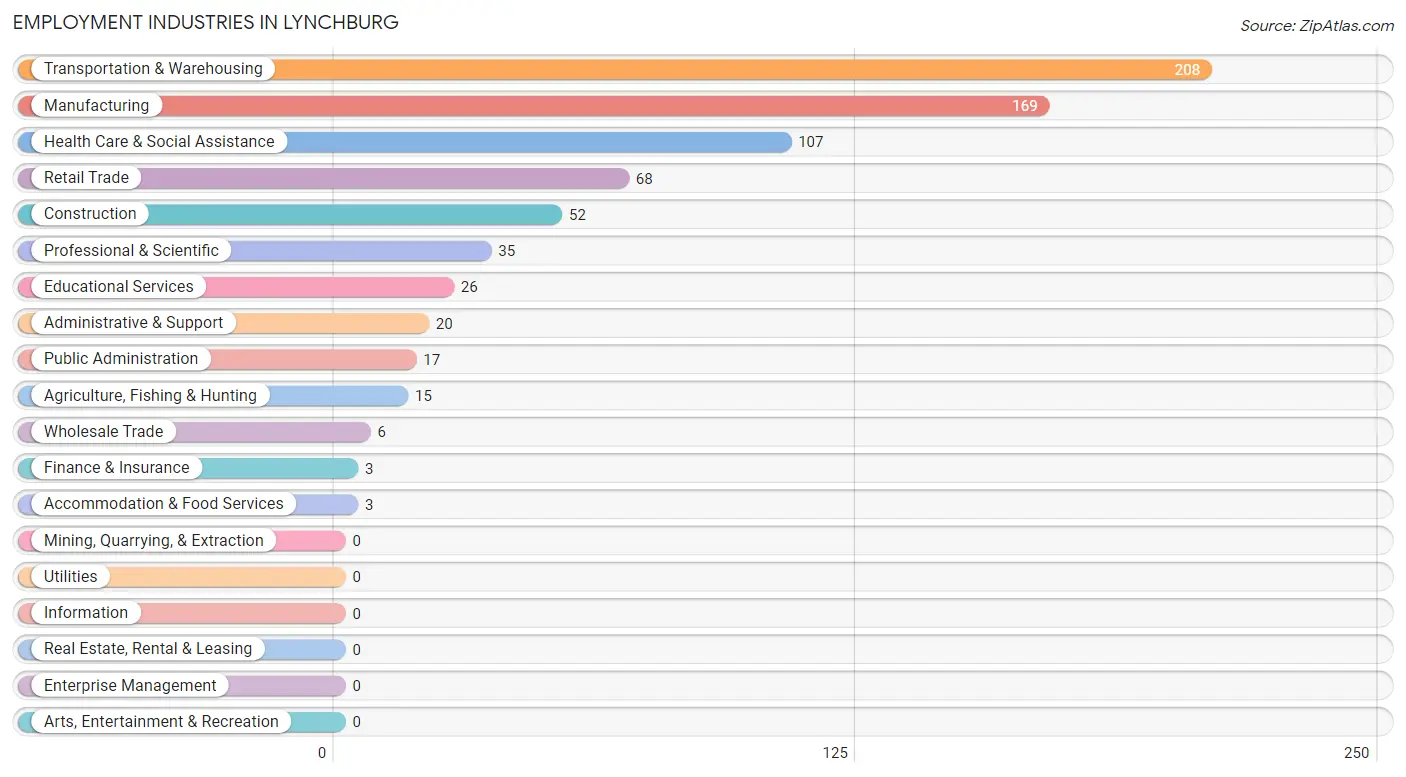
The major employment industries in Lynchburg include Transportation & Warehousing (208 | 27.3%), Manufacturing (169 | 22.2%), Health Care & Social Assistance (107 | 14.0%), Retail Trade (68 | 8.9%), and Construction (52 | 6.8%).
Employment Industries by Sex in Lynchburg
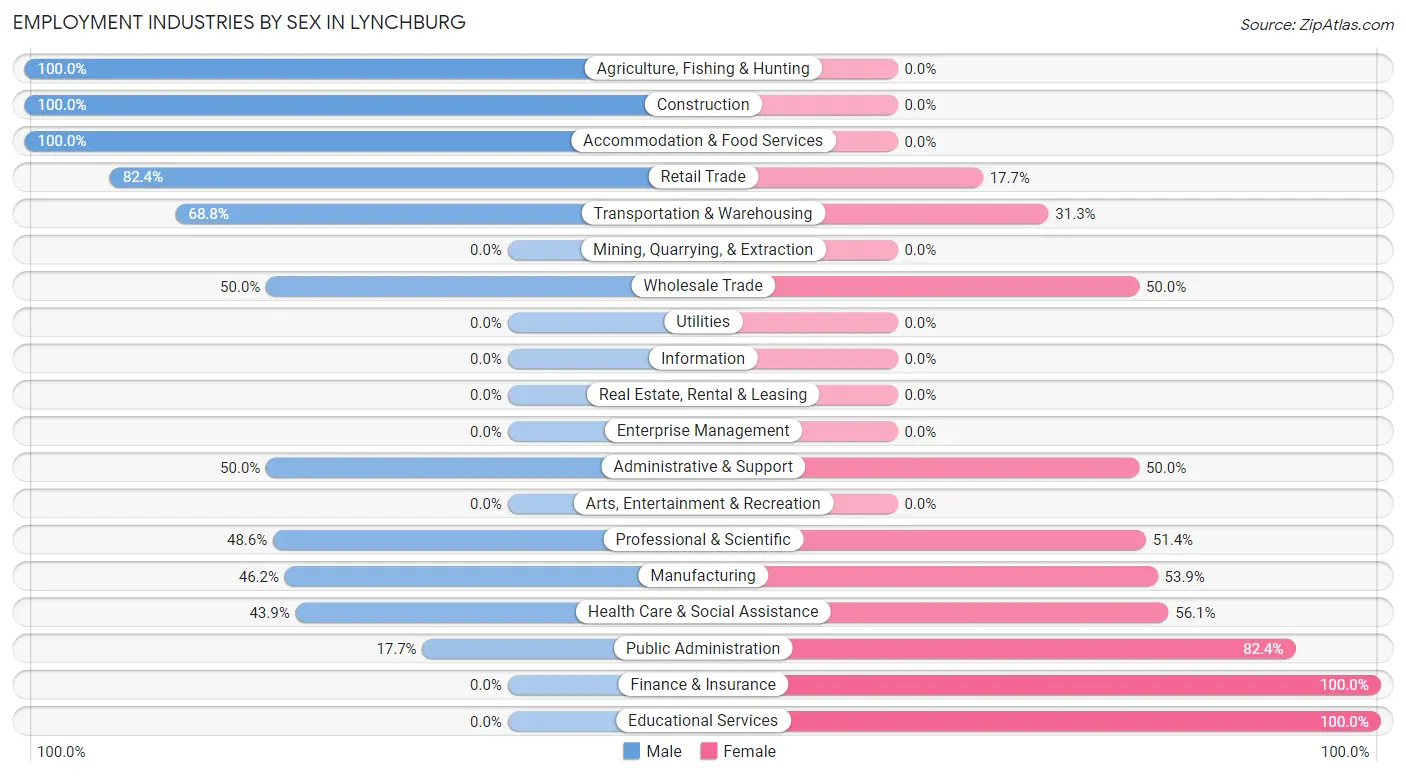
The Lynchburg industries that see more men than women are Agriculture, Fishing & Hunting (100.0%), Construction (100.0%), and Accommodation & Food Services (100.0%), whereas the industries that tend to have a higher number of women are Finance & Insurance (100.0%), Educational Services (100.0%), and Public Administration (82.4%).
| Industry | Male | Female |
| Agriculture, Fishing & Hunting | 15 (100.0%) | 0 (0.0%) |
| Mining, Quarrying, & Extraction | 0 (0.0%) | 0 (0.0%) |
| Construction | 52 (100.0%) | 0 (0.0%) |
| Manufacturing | 78 (46.2%) | 91 (53.8%) |
| Wholesale Trade | 3 (50.0%) | 3 (50.0%) |
| Retail Trade | 56 (82.4%) | 12 (17.6%) |
| Transportation & Warehousing | 143 (68.8%) | 65 (31.2%) |
| Utilities | 0 (0.0%) | 0 (0.0%) |
| Information | 0 (0.0%) | 0 (0.0%) |
| Finance & Insurance | 0 (0.0%) | 3 (100.0%) |
| Real Estate, Rental & Leasing | 0 (0.0%) | 0 (0.0%) |
| Professional & Scientific | 17 (48.6%) | 18 (51.4%) |
| Enterprise Management | 0 (0.0%) | 0 (0.0%) |
| Administrative & Support | 10 (50.0%) | 10 (50.0%) |
| Educational Services | 0 (0.0%) | 26 (100.0%) |
| Health Care & Social Assistance | 47 (43.9%) | 60 (56.1%) |
| Arts, Entertainment & Recreation | 0 (0.0%) | 0 (0.0%) |
| Accommodation & Food Services | 3 (100.0%) | 0 (0.0%) |
| Public Administration | 3 (17.6%) | 14 (82.4%) |
| Total | 445 (58.4%) | 317 (41.6%) |
Education in Lynchburg
School Enrollment in Lynchburg
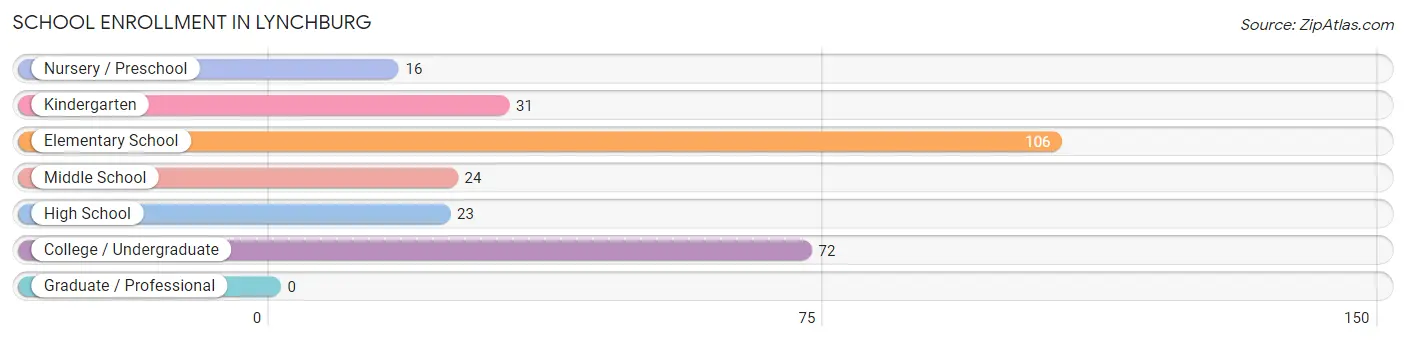
The most common levels of schooling among the 272 students in Lynchburg are elementary school (106 | 39.0%), college / undergraduate (72 | 26.5%), and kindergarten (31 | 11.4%).
| School Level | # Students | % Students |
| Nursery / Preschool | 16 | 5.9% |
| Kindergarten | 31 | 11.4% |
| Elementary School | 106 | 39.0% |
| Middle School | 24 | 8.8% |
| High School | 23 | 8.5% |
| College / Undergraduate | 72 | 26.5% |
| Graduate / Professional | 0 | 0.0% |
| Total | 272 | 100.0% |
School Enrollment by Age by Funding Source in Lynchburg
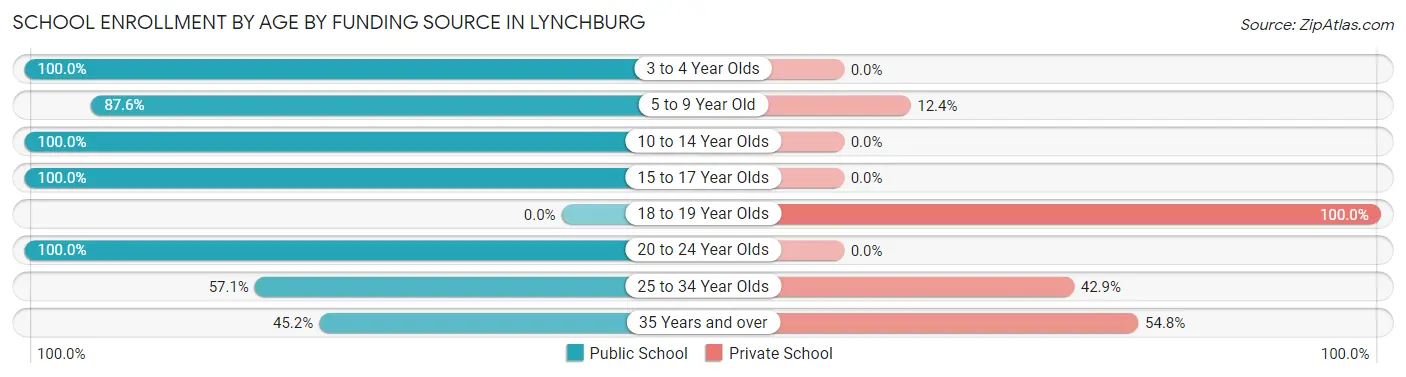
Out of a total of 272 students who are enrolled in schools in Lynchburg, 40 (14.7%) attend a private institution, while the remaining 232 (85.3%) are enrolled in public schools. The age group of 18 to 19 year olds has the highest likelihood of being enrolled in private schools, with 3 (100.0% in the age bracket) enrolled. Conversely, the age group of 3 to 4 year olds has the lowest likelihood of being enrolled in a private school, with 12 (100.0% in the age bracket) attending a public institution.
| Age Bracket | Public School | Private School |
| 3 to 4 Year Olds | 12 (100.0%) | 0 (0.0%) |
| 5 to 9 Year Old | 120 (87.6%) | 17 (12.4%) |
| 10 to 14 Year Olds | 28 (100.0%) | 0 (0.0%) |
| 15 to 17 Year Olds | 23 (100.0%) | 0 (0.0%) |
| 18 to 19 Year Olds | 0 (0.0%) | 3 (100.0%) |
| 20 to 24 Year Olds | 31 (100.0%) | 0 (0.0%) |
| 25 to 34 Year Olds | 4 (57.1%) | 3 (42.9%) |
| 35 Years and over | 14 (45.2%) | 17 (54.8%) |
| Total | 232 (85.3%) | 40 (14.7%) |
Educational Attainment by Field of Study in Lynchburg
Business (15 | 23.1%), science & technology (14 | 21.5%), liberal arts & history (12 | 18.5%), education (10 | 15.4%), and computers & mathematics (8 | 12.3%) are the most common fields of study among 65 individuals in Lynchburg who have obtained a bachelor's degree or higher.
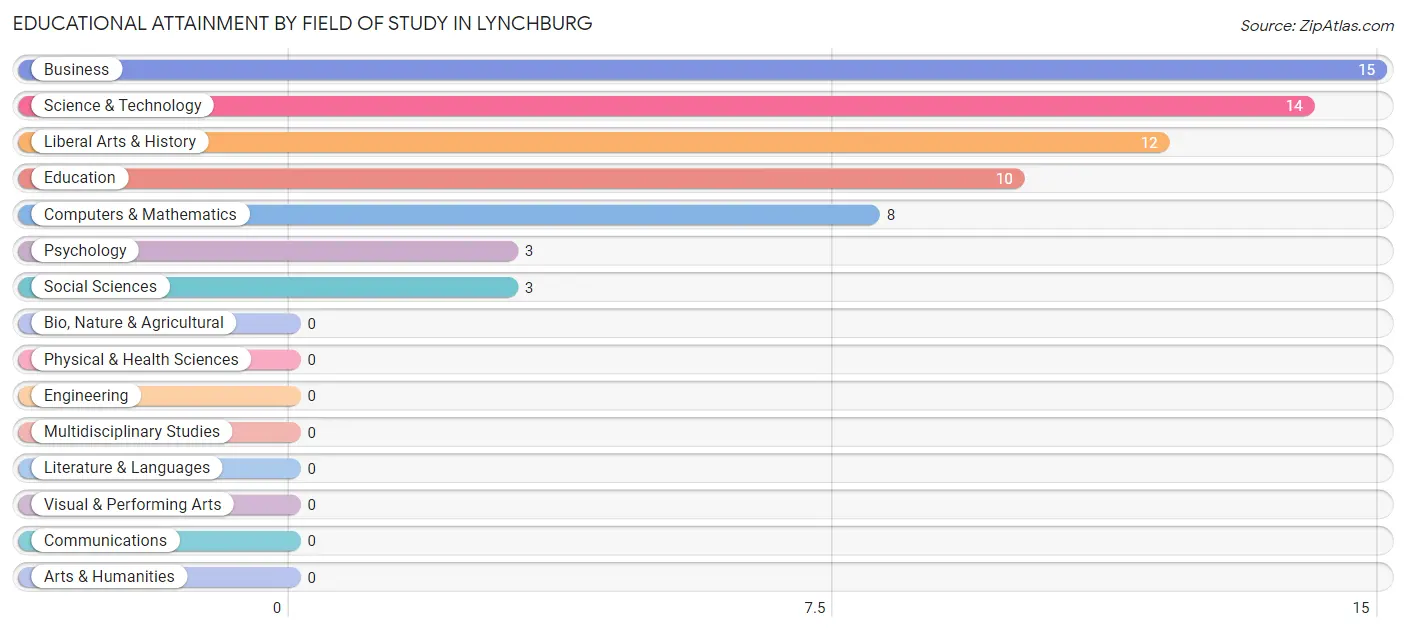
| Field of Study | # Graduates | % Graduates |
| Computers & Mathematics | 8 | 12.3% |
| Bio, Nature & Agricultural | 0 | 0.0% |
| Physical & Health Sciences | 0 | 0.0% |
| Psychology | 3 | 4.6% |
| Social Sciences | 3 | 4.6% |
| Engineering | 0 | 0.0% |
| Multidisciplinary Studies | 0 | 0.0% |
| Science & Technology | 14 | 21.5% |
| Business | 15 | 23.1% |
| Education | 10 | 15.4% |
| Literature & Languages | 0 | 0.0% |
| Liberal Arts & History | 12 | 18.5% |
| Visual & Performing Arts | 0 | 0.0% |
| Communications | 0 | 0.0% |
| Arts & Humanities | 0 | 0.0% |
| Total | 65 | 100.0% |
Transportation & Commute in Lynchburg
Vehicle Availability by Sex in Lynchburg
The most prevalent vehicle ownership categories in Lynchburg are males with 2 vehicles (234, accounting for 53.2%) and females with 2 vehicles (163, making up 80.4%).
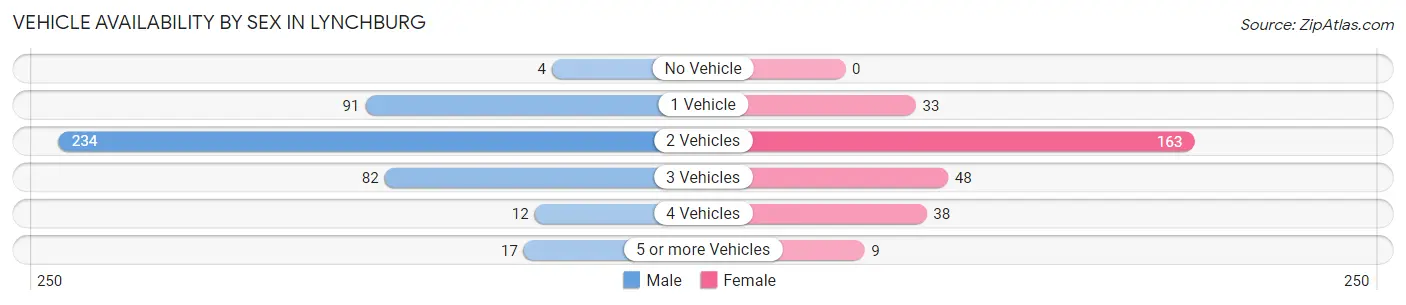
| Vehicles Available | Male | Female |
| No Vehicle | 4 (0.9%) | 0 (0.0%) |
| 1 Vehicle | 91 (20.7%) | 33 (11.3%) |
| 2 Vehicles | 234 (53.2%) | 163 (56.0%) |
| 3 Vehicles | 82 (18.6%) | 48 (16.5%) |
| 4 Vehicles | 12 (2.7%) | 38 (13.1%) |
| 5 or more Vehicles | 17 (3.9%) | 9 (3.1%) |
| Total | 440 (100.0%) | 291 (100.0%) |
Commute Time in Lynchburg
The most frequently occuring commute durations in Lynchburg are 40 to 44 minutes (119 commuters, 16.6%), 60 to 89 minutes (111 commuters, 15.5%), and 20 to 24 minutes (100 commuters, 14.0%).
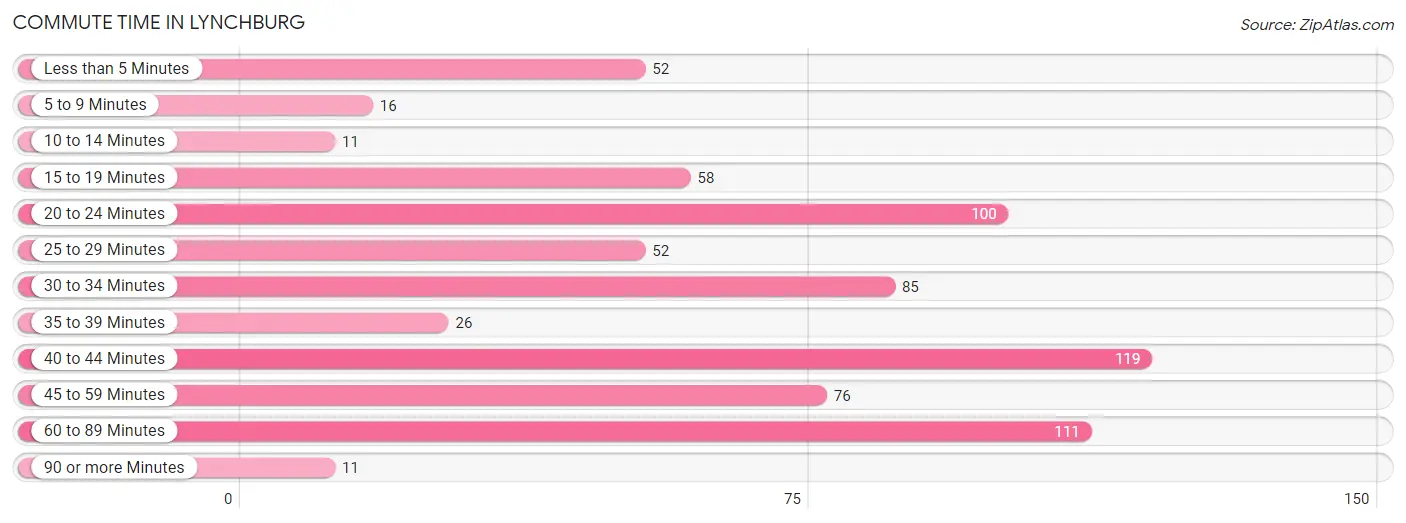
| Commute Time | # Commuters | % Commuters |
| Less than 5 Minutes | 52 | 7.2% |
| 5 to 9 Minutes | 16 | 2.2% |
| 10 to 14 Minutes | 11 | 1.5% |
| 15 to 19 Minutes | 58 | 8.1% |
| 20 to 24 Minutes | 100 | 14.0% |
| 25 to 29 Minutes | 52 | 7.2% |
| 30 to 34 Minutes | 85 | 11.8% |
| 35 to 39 Minutes | 26 | 3.6% |
| 40 to 44 Minutes | 119 | 16.6% |
| 45 to 59 Minutes | 76 | 10.6% |
| 60 to 89 Minutes | 111 | 15.5% |
| 90 or more Minutes | 11 | 1.5% |
Commute Time by Sex in Lynchburg
The most common commute times in Lynchburg are 40 to 44 minutes (119 commuters, 27.9%) for males and 20 to 24 minutes (56 commuters, 19.2%) for females.
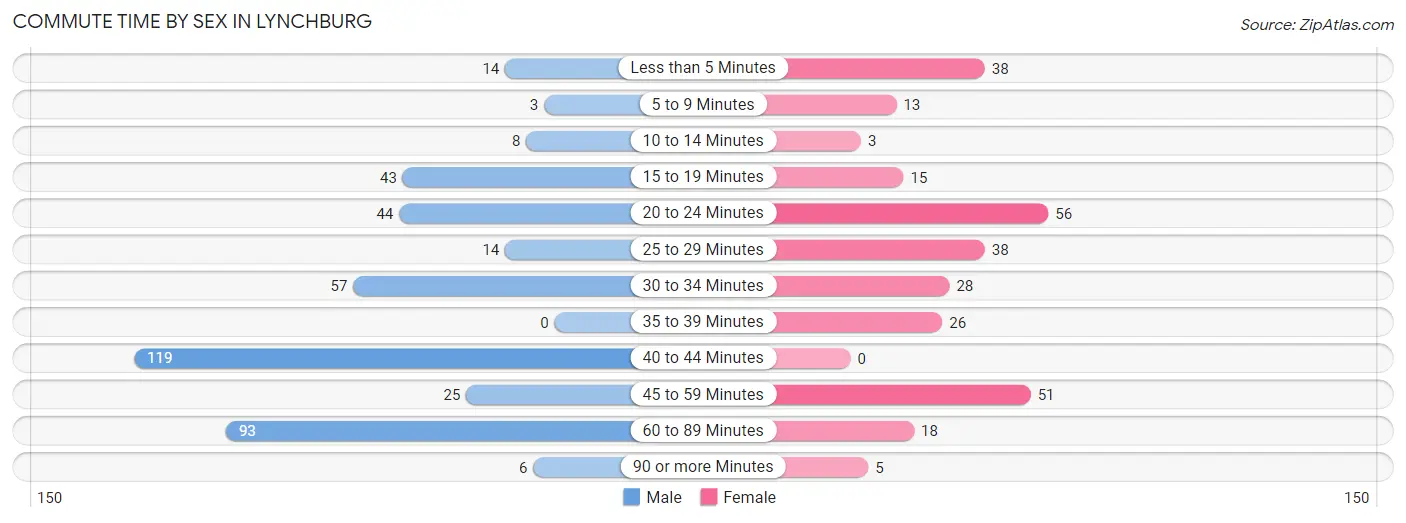
| Commute Time | Male | Female |
| Less than 5 Minutes | 14 (3.3%) | 38 (13.1%) |
| 5 to 9 Minutes | 3 (0.7%) | 13 (4.5%) |
| 10 to 14 Minutes | 8 (1.9%) | 3 (1.0%) |
| 15 to 19 Minutes | 43 (10.1%) | 15 (5.1%) |
| 20 to 24 Minutes | 44 (10.3%) | 56 (19.2%) |
| 25 to 29 Minutes | 14 (3.3%) | 38 (13.1%) |
| 30 to 34 Minutes | 57 (13.4%) | 28 (9.6%) |
| 35 to 39 Minutes | 0 (0.0%) | 26 (8.9%) |
| 40 to 44 Minutes | 119 (27.9%) | 0 (0.0%) |
| 45 to 59 Minutes | 25 (5.9%) | 51 (17.5%) |
| 60 to 89 Minutes | 93 (21.8%) | 18 (6.2%) |
| 90 or more Minutes | 6 (1.4%) | 5 (1.7%) |
Time of Departure to Work by Sex in Lynchburg
The most frequent times of departure to work in Lynchburg are 12:00 PM to 3:59 PM (140, 32.9%) for males and 7:00 AM to 7:29 AM (75, 25.8%) for females.
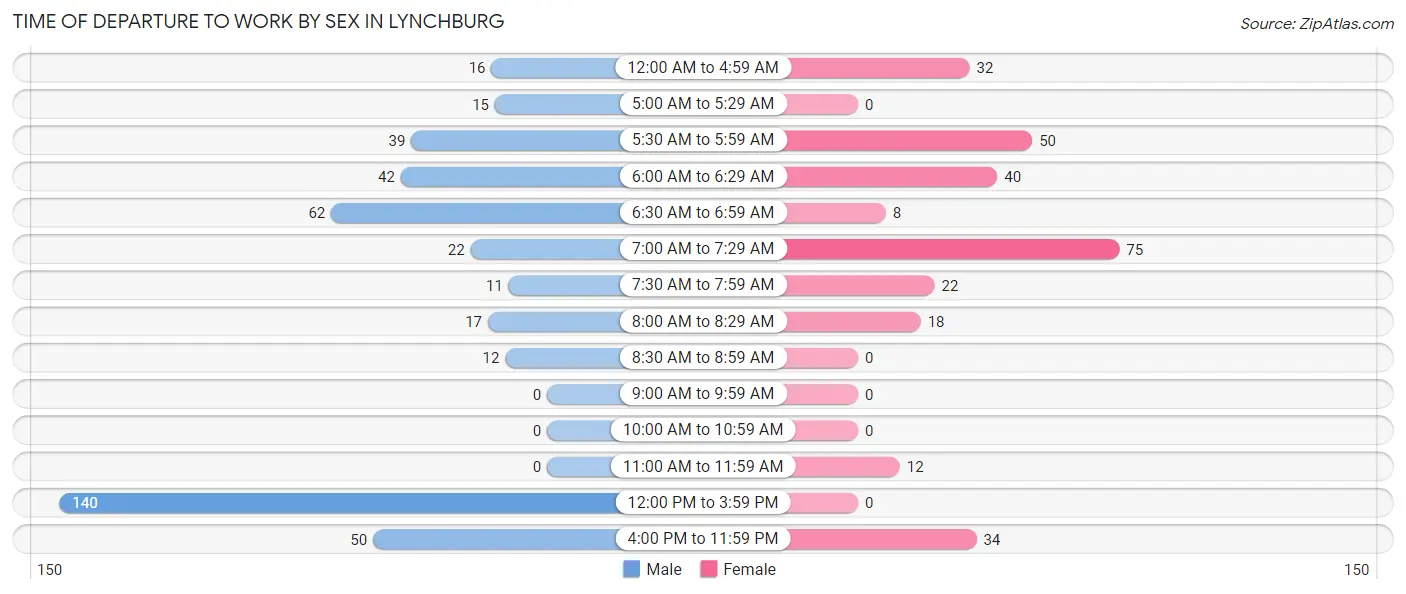
| Time of Departure | Male | Female |
| 12:00 AM to 4:59 AM | 16 (3.8%) | 32 (11.0%) |
| 5:00 AM to 5:29 AM | 15 (3.5%) | 0 (0.0%) |
| 5:30 AM to 5:59 AM | 39 (9.1%) | 50 (17.2%) |
| 6:00 AM to 6:29 AM | 42 (9.9%) | 40 (13.8%) |
| 6:30 AM to 6:59 AM | 62 (14.5%) | 8 (2.8%) |
| 7:00 AM to 7:29 AM | 22 (5.2%) | 75 (25.8%) |
| 7:30 AM to 7:59 AM | 11 (2.6%) | 22 (7.6%) |
| 8:00 AM to 8:29 AM | 17 (4.0%) | 18 (6.2%) |
| 8:30 AM to 8:59 AM | 12 (2.8%) | 0 (0.0%) |
| 9:00 AM to 9:59 AM | 0 (0.0%) | 0 (0.0%) |
| 10:00 AM to 10:59 AM | 0 (0.0%) | 0 (0.0%) |
| 11:00 AM to 11:59 AM | 0 (0.0%) | 12 (4.1%) |
| 12:00 PM to 3:59 PM | 140 (32.9%) | 0 (0.0%) |
| 4:00 PM to 11:59 PM | 50 (11.7%) | 34 (11.7%) |
| Total | 426 (100.0%) | 291 (100.0%) |
Housing Occupancy in Lynchburg
Occupancy by Ownership in Lynchburg
Of the total 585 dwellings in Lynchburg, owner-occupied units account for 365 (62.4%), while renter-occupied units make up 220 (37.6%).
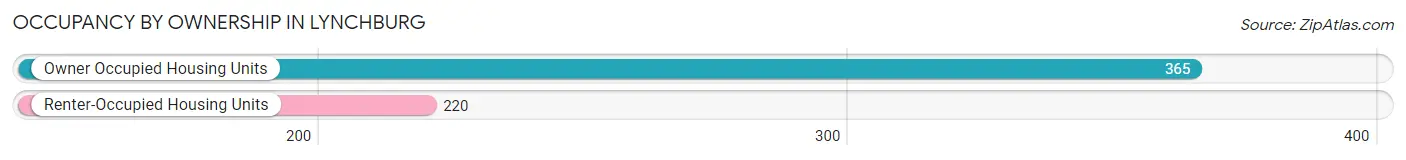
| Occupancy | # Housing Units | % Housing Units |
| Owner Occupied Housing Units | 365 | 62.4% |
| Renter-Occupied Housing Units | 220 | 37.6% |
| Total Occupied Housing Units | 585 | 100.0% |
Occupancy by Household Size in Lynchburg
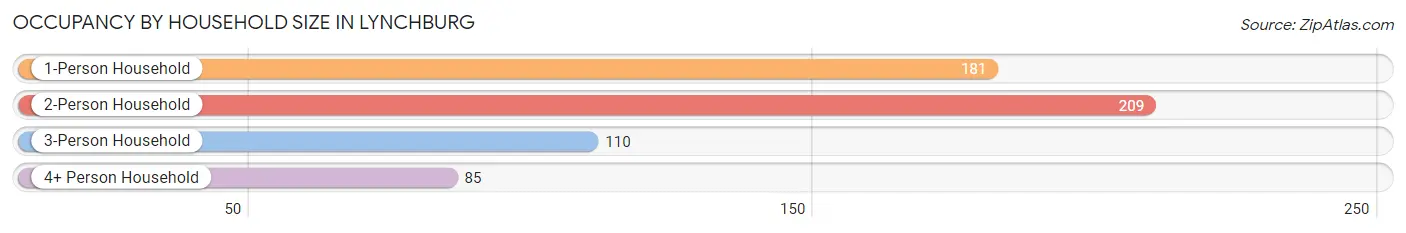
| Household Size | # Housing Units | % Housing Units |
| 1-Person Household | 181 | 30.9% |
| 2-Person Household | 209 | 35.7% |
| 3-Person Household | 110 | 18.8% |
| 4+ Person Household | 85 | 14.5% |
| Total Housing Units | 585 | 100.0% |
Occupancy by Ownership by Household Size in Lynchburg
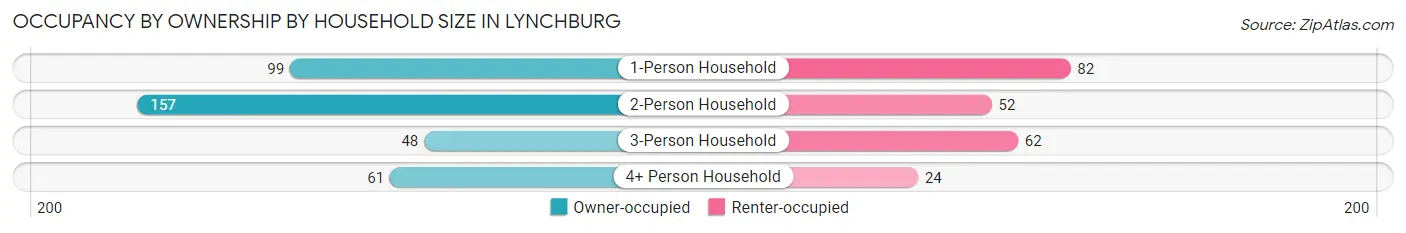
| Household Size | Owner-occupied | Renter-occupied |
| 1-Person Household | 99 (54.7%) | 82 (45.3%) |
| 2-Person Household | 157 (75.1%) | 52 (24.9%) |
| 3-Person Household | 48 (43.6%) | 62 (56.4%) |
| 4+ Person Household | 61 (71.8%) | 24 (28.2%) |
| Total Housing Units | 365 (62.4%) | 220 (37.6%) |
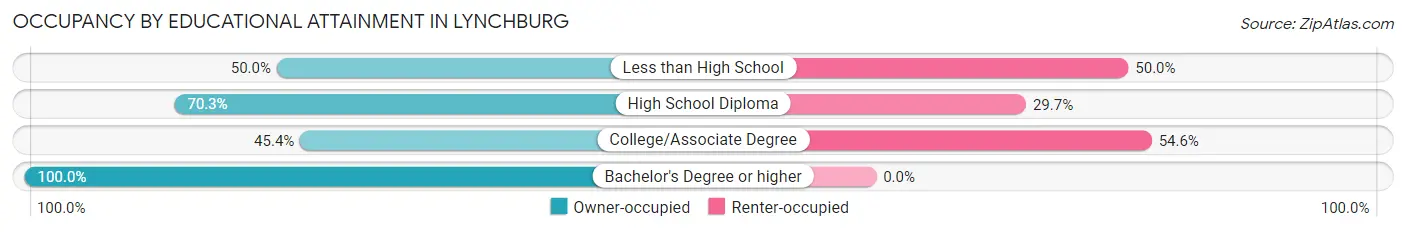
Occupancy by Educational Attainment in Lynchburg
| Household Size | Owner-occupied | Renter-occupied |
| Less than High School | 18 (50.0%) | 18 (50.0%) |
| High School Diploma | 213 (70.3%) | 90 (29.7%) |
| College/Associate Degree | 93 (45.4%) | 112 (54.6%) |
| Bachelor's Degree or higher | 41 (100.0%) | 0 (0.0%) |
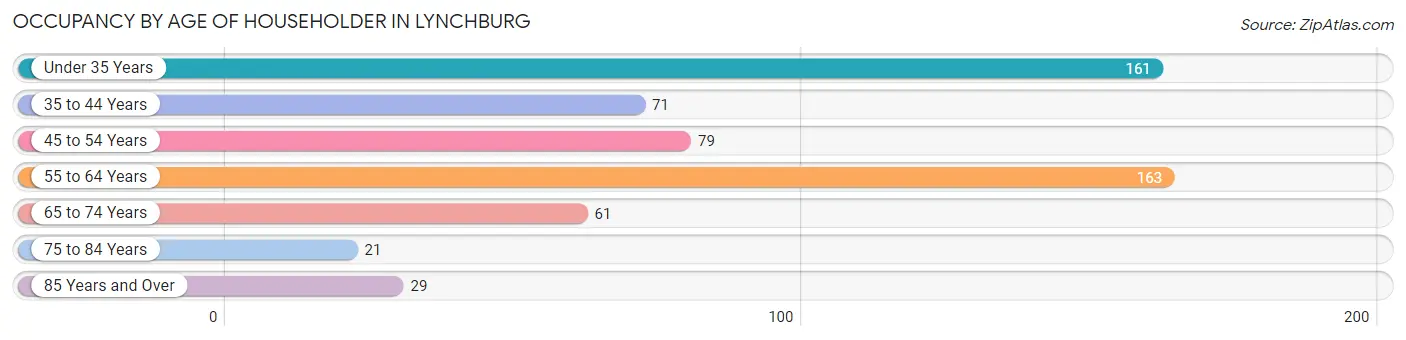
Occupancy by Age of Householder in Lynchburg
| Age Bracket | # Households | % Households |
| Under 35 Years | 161 | 27.5% |
| 35 to 44 Years | 71 | 12.1% |
| 45 to 54 Years | 79 | 13.5% |
| 55 to 64 Years | 163 | 27.9% |
| 65 to 74 Years | 61 | 10.4% |
| 75 to 84 Years | 21 | 3.6% |
| 85 Years and Over | 29 | 5.0% |
| Total | 585 | 100.0% |
Housing Finances in Lynchburg
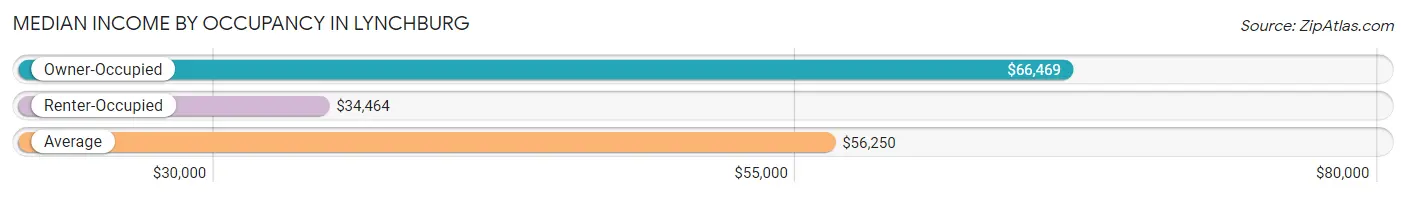
Median Income by Occupancy in Lynchburg
| Occupancy Type | # Households | Median Income |
| Owner-Occupied | 365 (62.4%) | $66,469 |
| Renter-Occupied | 220 (37.6%) | $34,464 |
| Average | 585 (100.0%) | $56,250 |
Occupancy by Householder Income Bracket in Lynchburg

| Income Bracket | Owner-occupied | Renter-occupied |
| Less than $5,000 | 0 (0.0%) | 15 (6.8%) |
| $5,000 to $9,999 | 15 (4.1%) | 0 (0.0%) |
| $10,000 to $14,999 | 0 (0.0%) | 25 (11.4%) |
| $15,000 to $19,999 | 20 (5.5%) | 16 (7.3%) |
| $20,000 to $24,999 | 3 (0.8%) | 34 (15.4%) |
| $25,000 to $34,999 | 16 (4.4%) | 23 (10.4%) |
| $35,000 to $49,999 | 35 (9.6%) | 38 (17.3%) |
| $50,000 to $74,999 | 128 (35.1%) | 54 (24.5%) |
| $75,000 to $99,999 | 42 (11.5%) | 15 (6.8%) |
| $100,000 to $149,999 | 79 (21.6%) | 0 (0.0%) |
| $150,000 or more | 27 (7.4%) | 0 (0.0%) |
| Total | 365 (100.0%) | 220 (100.0%) |
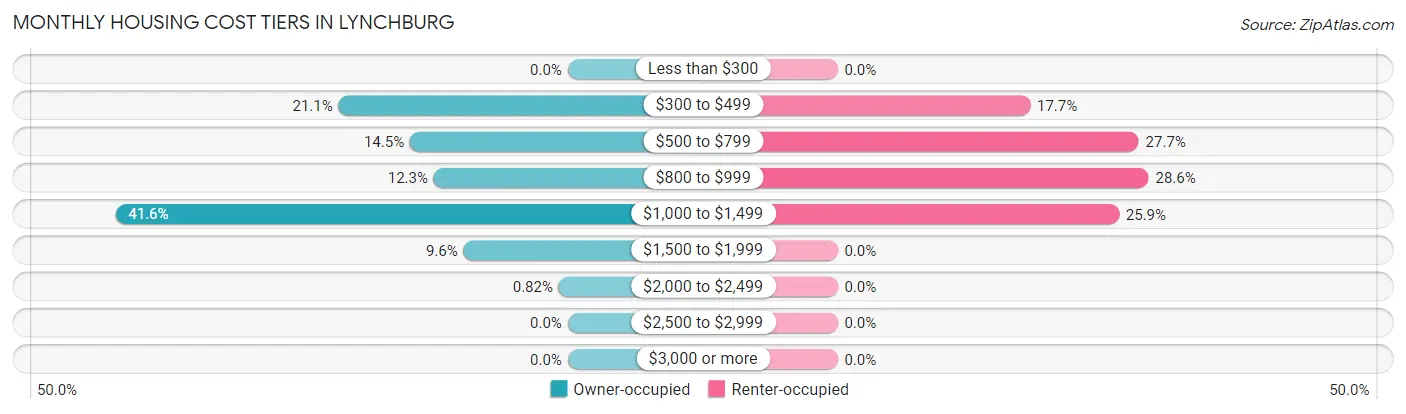
Monthly Housing Cost Tiers in Lynchburg
| Monthly Cost | Owner-occupied | Renter-occupied |
| Less than $300 | 0 (0.0%) | 0 (0.0%) |
| $300 to $499 | 77 (21.1%) | 39 (17.7%) |
| $500 to $799 | 53 (14.5%) | 61 (27.7%) |
| $800 to $999 | 45 (12.3%) | 63 (28.6%) |
| $1,000 to $1,499 | 152 (41.6%) | 57 (25.9%) |
| $1,500 to $1,999 | 35 (9.6%) | 0 (0.0%) |
| $2,000 to $2,499 | 3 (0.8%) | 0 (0.0%) |
| $2,500 to $2,999 | 0 (0.0%) | 0 (0.0%) |
| $3,000 or more | 0 (0.0%) | 0 (0.0%) |
| Total | 365 (100.0%) | 220 (100.0%) |
Physical Housing Characteristics in Lynchburg
Housing Structures in Lynchburg
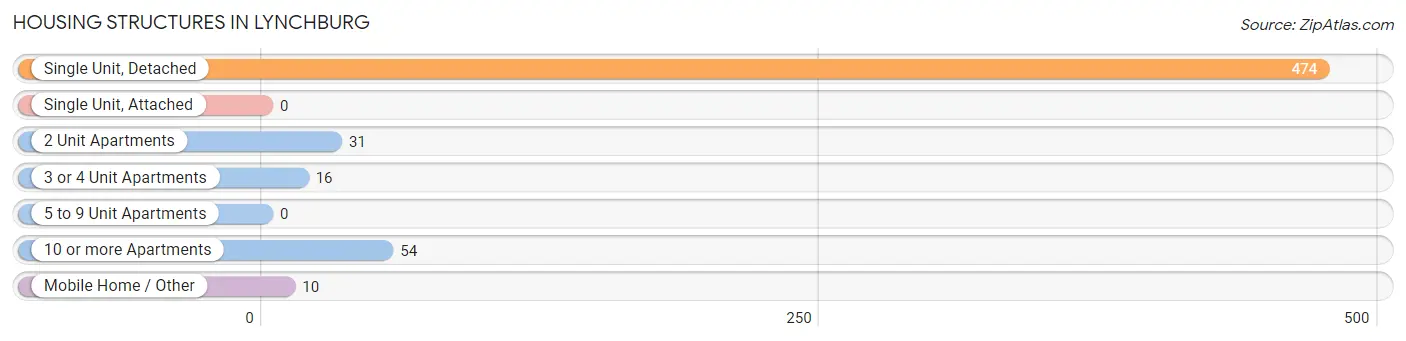
| Structure Type | # Housing Units | % Housing Units |
| Single Unit, Detached | 474 | 81.0% |
| Single Unit, Attached | 0 | 0.0% |
| 2 Unit Apartments | 31 | 5.3% |
| 3 or 4 Unit Apartments | 16 | 2.7% |
| 5 to 9 Unit Apartments | 0 | 0.0% |
| 10 or more Apartments | 54 | 9.2% |
| Mobile Home / Other | 10 | 1.7% |
| Total | 585 | 100.0% |
Housing Structures by Occupancy in Lynchburg
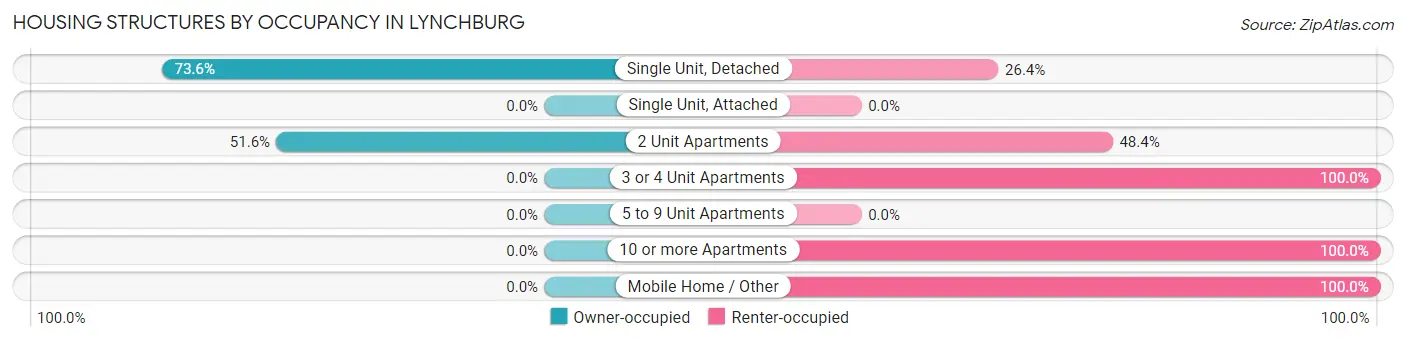
| Structure Type | Owner-occupied | Renter-occupied |
| Single Unit, Detached | 349 (73.6%) | 125 (26.4%) |
| Single Unit, Attached | 0 (0.0%) | 0 (0.0%) |
| 2 Unit Apartments | 16 (51.6%) | 15 (48.4%) |
| 3 or 4 Unit Apartments | 0 (0.0%) | 16 (100.0%) |
| 5 to 9 Unit Apartments | 0 (0.0%) | 0 (0.0%) |
| 10 or more Apartments | 0 (0.0%) | 54 (100.0%) |
| Mobile Home / Other | 0 (0.0%) | 10 (100.0%) |
| Total | 365 (62.4%) | 220 (37.6%) |
Housing Structures by Number of Rooms in Lynchburg
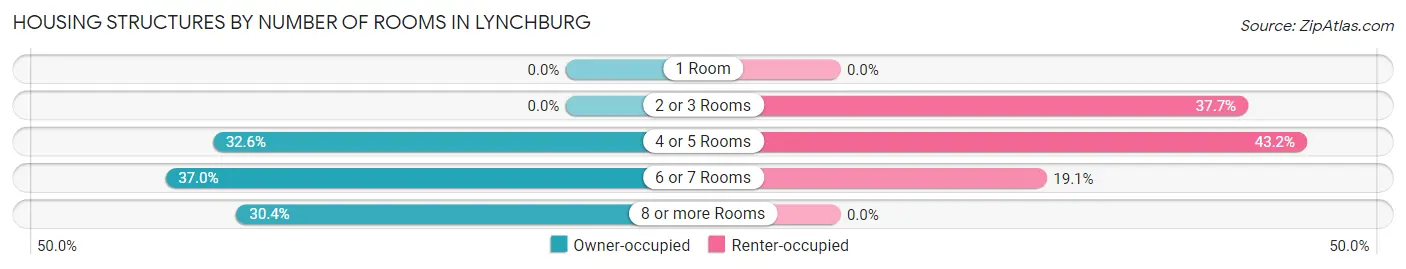
| Number of Rooms | Owner-occupied | Renter-occupied |
| 1 Room | 0 (0.0%) | 0 (0.0%) |
| 2 or 3 Rooms | 0 (0.0%) | 83 (37.7%) |
| 4 or 5 Rooms | 119 (32.6%) | 95 (43.2%) |
| 6 or 7 Rooms | 135 (37.0%) | 42 (19.1%) |
| 8 or more Rooms | 111 (30.4%) | 0 (0.0%) |
| Total | 365 (100.0%) | 220 (100.0%) |
Housing Structure by Heating Type in Lynchburg
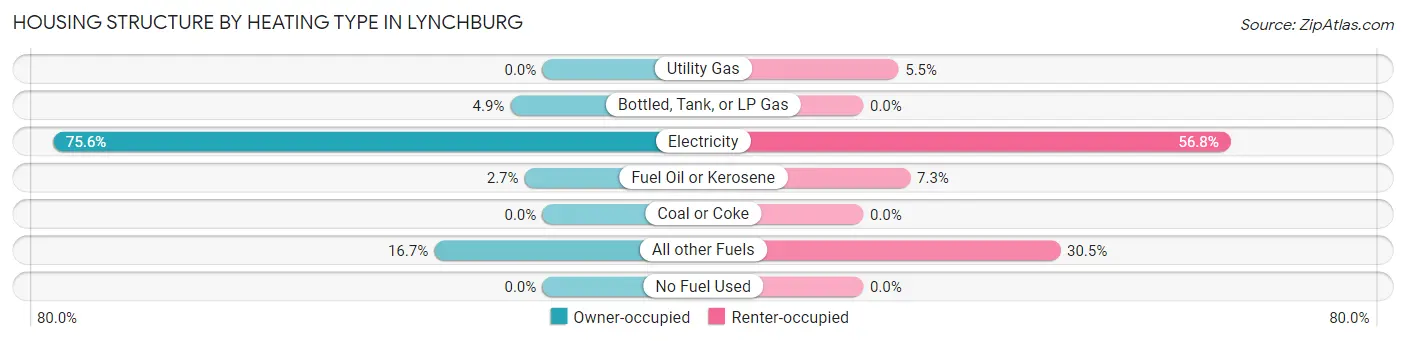
| Heating Type | Owner-occupied | Renter-occupied |
| Utility Gas | 0 (0.0%) | 12 (5.4%) |
| Bottled, Tank, or LP Gas | 18 (4.9%) | 0 (0.0%) |
| Electricity | 276 (75.6%) | 125 (56.8%) |
| Fuel Oil or Kerosene | 10 (2.7%) | 16 (7.3%) |
| Coal or Coke | 0 (0.0%) | 0 (0.0%) |
| All other Fuels | 61 (16.7%) | 67 (30.4%) |
| No Fuel Used | 0 (0.0%) | 0 (0.0%) |
| Total | 365 (100.0%) | 220 (100.0%) |
Household Vehicle Usage in Lynchburg
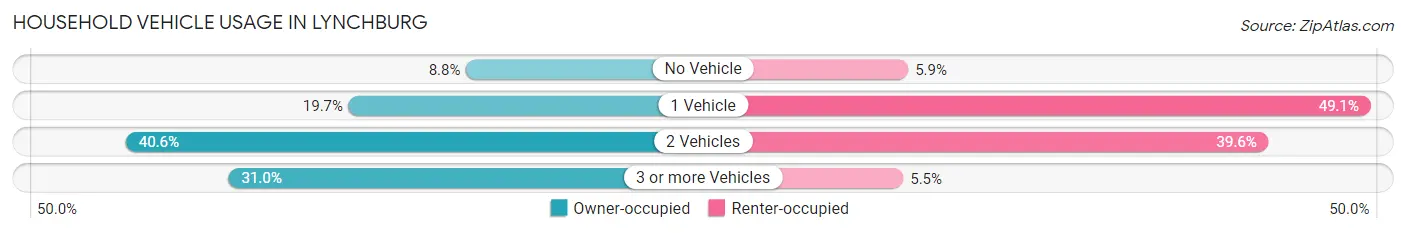
| Vehicles per Household | Owner-occupied | Renter-occupied |
| No Vehicle | 32 (8.8%) | 13 (5.9%) |
| 1 Vehicle | 72 (19.7%) | 108 (49.1%) |
| 2 Vehicles | 148 (40.6%) | 87 (39.6%) |
| 3 or more Vehicles | 113 (31.0%) | 12 (5.4%) |
| Total | 365 (100.0%) | 220 (100.0%) |
Real Estate & Mortgages in Lynchburg
Real Estate and Mortgage Overview in Lynchburg
| Characteristic | Without Mortgage | With Mortgage |
| Housing Units | 101 | 264 |
| Median Property Value | $151,100 | $128,100 |
| Median Household Income | $50,208 | $27 |
| Monthly Housing Costs | $459 | $0 |
| Real Estate Taxes | $1,500 | $0 |
Property Value by Mortgage Status in Lynchburg
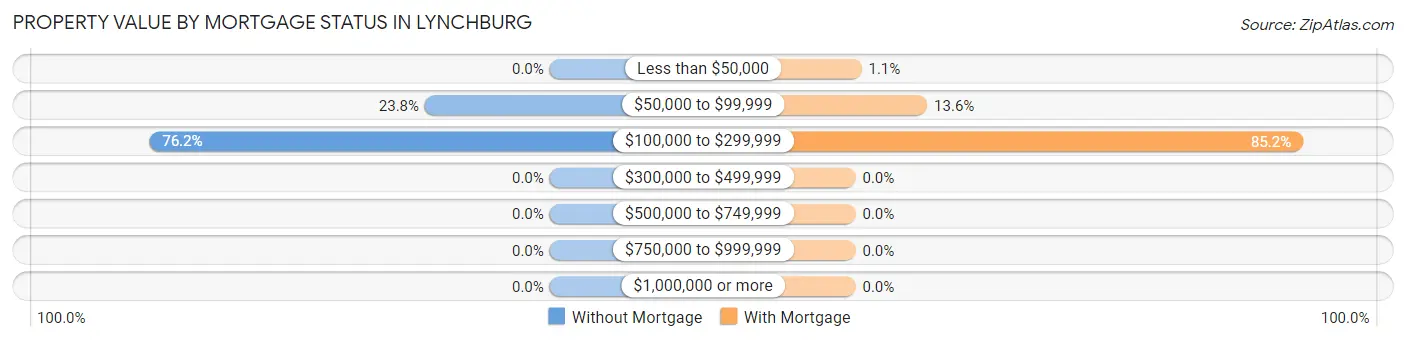
| Property Value | Without Mortgage | With Mortgage |
| Less than $50,000 | 0 (0.0%) | 3 (1.1%) |
| $50,000 to $99,999 | 24 (23.8%) | 36 (13.6%) |
| $100,000 to $299,999 | 77 (76.2%) | 225 (85.2%) |
| $300,000 to $499,999 | 0 (0.0%) | 0 (0.0%) |
| $500,000 to $749,999 | 0 (0.0%) | 0 (0.0%) |
| $750,000 to $999,999 | 0 (0.0%) | 0 (0.0%) |
| $1,000,000 or more | 0 (0.0%) | 0 (0.0%) |
| Total | 101 (100.0%) | 264 (100.0%) |
Household Income by Mortgage Status in Lynchburg
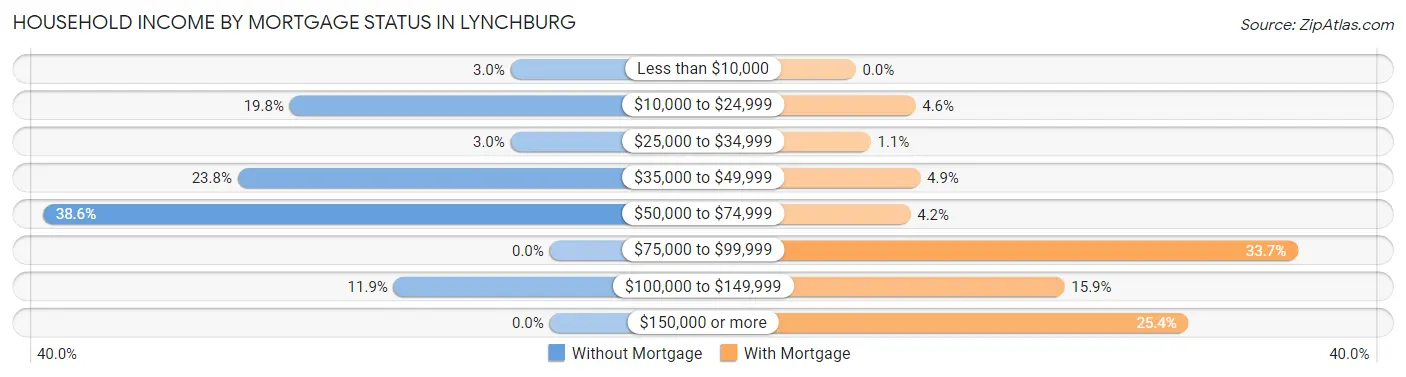
| Household Income | Without Mortgage | With Mortgage |
| Less than $10,000 | 3 (3.0%) | 0 (0.0%) |
| $10,000 to $24,999 | 20 (19.8%) | 12 (4.5%) |
| $25,000 to $34,999 | 3 (3.0%) | 3 (1.1%) |
| $35,000 to $49,999 | 24 (23.8%) | 13 (4.9%) |
| $50,000 to $74,999 | 39 (38.6%) | 11 (4.2%) |
| $75,000 to $99,999 | 0 (0.0%) | 89 (33.7%) |
| $100,000 to $149,999 | 12 (11.9%) | 42 (15.9%) |
| $150,000 or more | 0 (0.0%) | 67 (25.4%) |
| Total | 101 (100.0%) | 264 (100.0%) |
Property Value to Household Income Ratio in Lynchburg
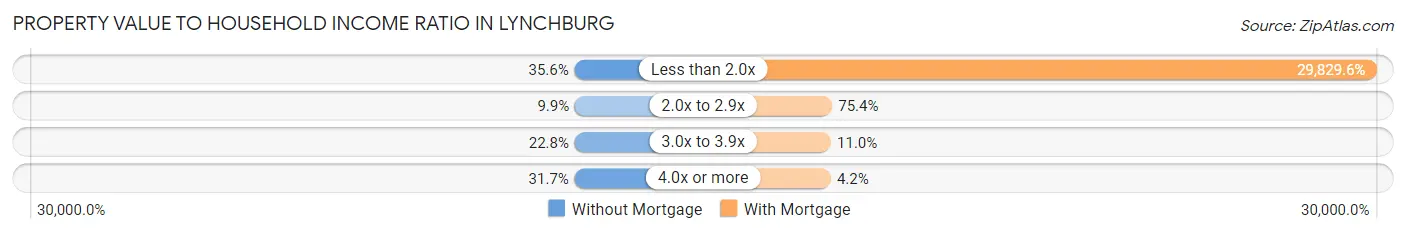
| Value-to-Income Ratio | Without Mortgage | With Mortgage |
| Less than 2.0x | 36 (35.6%) | 78,750 (29,829.6%) |
| 2.0x to 2.9x | 10 (9.9%) | 199 (75.4%) |
| 3.0x to 3.9x | 23 (22.8%) | 29 (11.0%) |
| 4.0x or more | 32 (31.7%) | 11 (4.2%) |
| Total | 101 (100.0%) | 264 (100.0%) |
Real Estate Taxes by Mortgage Status in Lynchburg
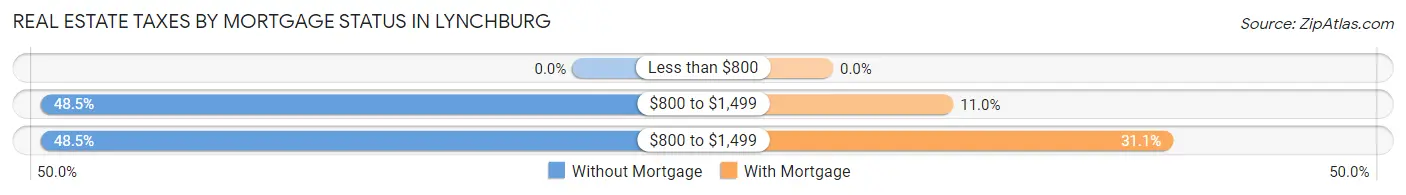
| Property Taxes | Without Mortgage | With Mortgage |
| Less than $800 | 0 (0.0%) | 0 (0.0%) |
| $800 to $1,499 | 49 (48.5%) | 29 (11.0%) |
| $800 to $1,499 | 49 (48.5%) | 82 (31.1%) |
| Total | 101 (100.0%) | 264 (100.0%) |
Health & Disability in Lynchburg
Health Insurance Coverage by Age in Lynchburg
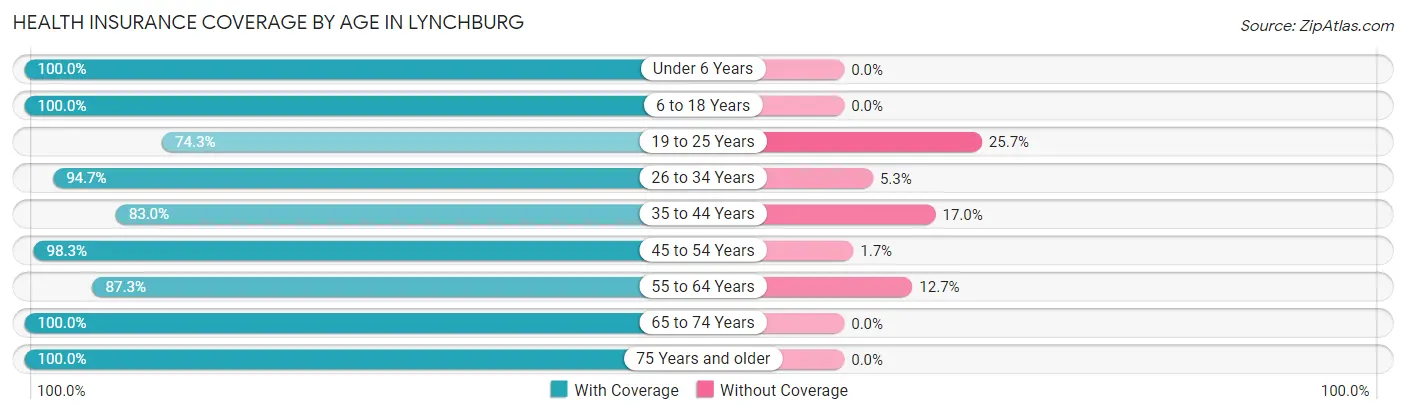
| Age Bracket | With Coverage | Without Coverage |
| Under 6 Years | 133 (100.0%) | 0 (0.0%) |
| 6 to 18 Years | 191 (100.0%) | 0 (0.0%) |
| 19 to 25 Years | 113 (74.3%) | 39 (25.7%) |
| 26 to 34 Years | 266 (94.7%) | 15 (5.3%) |
| 35 to 44 Years | 117 (83.0%) | 24 (17.0%) |
| 45 to 54 Years | 174 (98.3%) | 3 (1.7%) |
| 55 to 64 Years | 165 (87.3%) | 24 (12.7%) |
| 65 to 74 Years | 101 (100.0%) | 0 (0.0%) |
| 75 Years and older | 78 (100.0%) | 0 (0.0%) |
| Total | 1,338 (92.7%) | 105 (7.3%) |
Health Insurance Coverage by Citizenship Status in Lynchburg
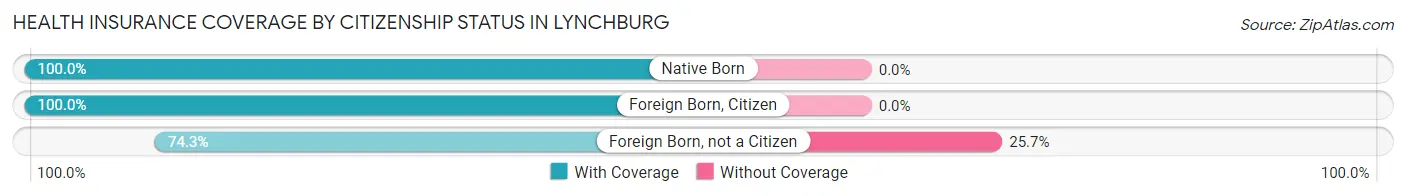
| Citizenship Status | With Coverage | Without Coverage |
| Native Born | 133 (100.0%) | 0 (0.0%) |
| Foreign Born, Citizen | 191 (100.0%) | 0 (0.0%) |
| Foreign Born, not a Citizen | 113 (74.3%) | 39 (25.7%) |
Health Insurance Coverage by Household Income in Lynchburg
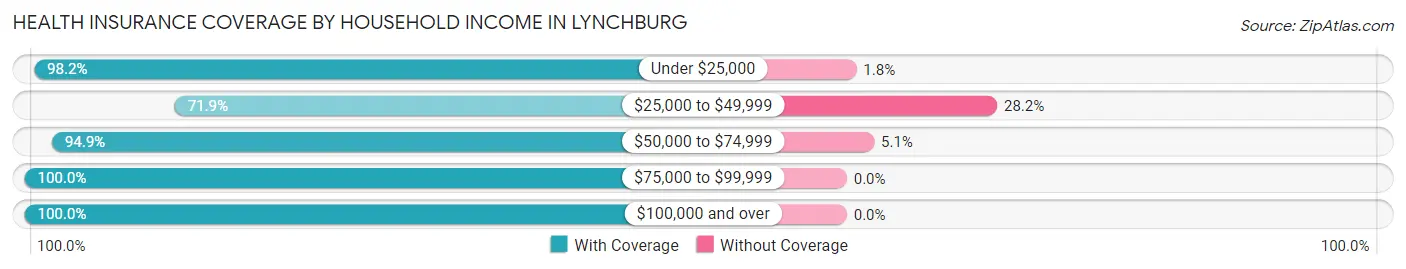
| Household Income | With Coverage | Without Coverage |
| Under $25,000 | 164 (98.2%) | 3 (1.8%) |
| $25,000 to $49,999 | 194 (71.9%) | 76 (28.1%) |
| $50,000 to $74,999 | 482 (94.9%) | 26 (5.1%) |
| $75,000 to $99,999 | 179 (100.0%) | 0 (0.0%) |
| $100,000 and over | 319 (100.0%) | 0 (0.0%) |
Public vs Private Health Insurance Coverage by Age in Lynchburg
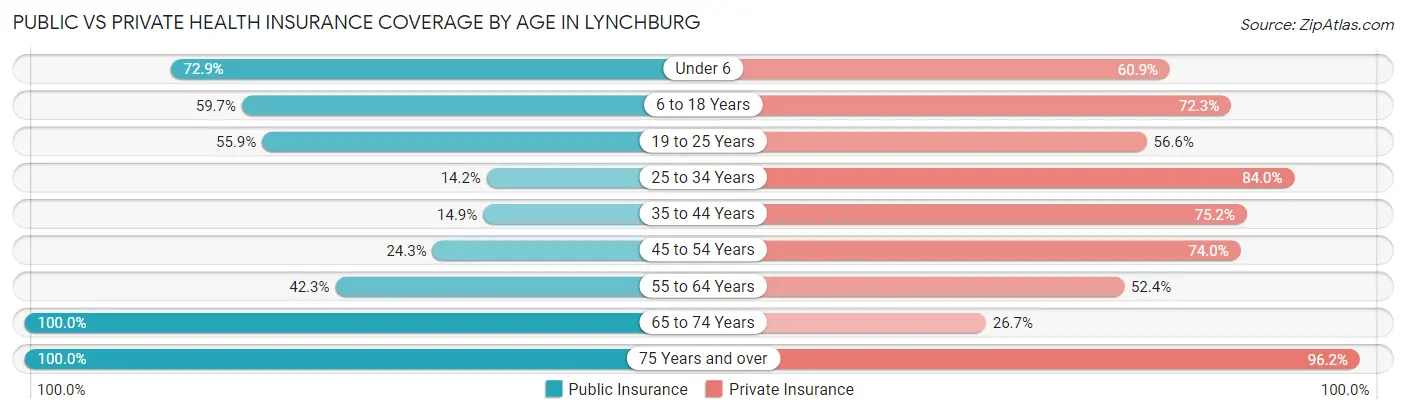
| Age Bracket | Public Insurance | Private Insurance |
| Under 6 | 97 (72.9%) | 81 (60.9%) |
| 6 to 18 Years | 114 (59.7%) | 138 (72.3%) |
| 19 to 25 Years | 85 (55.9%) | 86 (56.6%) |
| 25 to 34 Years | 40 (14.2%) | 236 (84.0%) |
| 35 to 44 Years | 21 (14.9%) | 106 (75.2%) |
| 45 to 54 Years | 43 (24.3%) | 131 (74.0%) |
| 55 to 64 Years | 80 (42.3%) | 99 (52.4%) |
| 65 to 74 Years | 101 (100.0%) | 27 (26.7%) |
| 75 Years and over | 78 (100.0%) | 75 (96.2%) |
| Total | 659 (45.7%) | 979 (67.8%) |
Disability Status by Sex by Age in Lynchburg
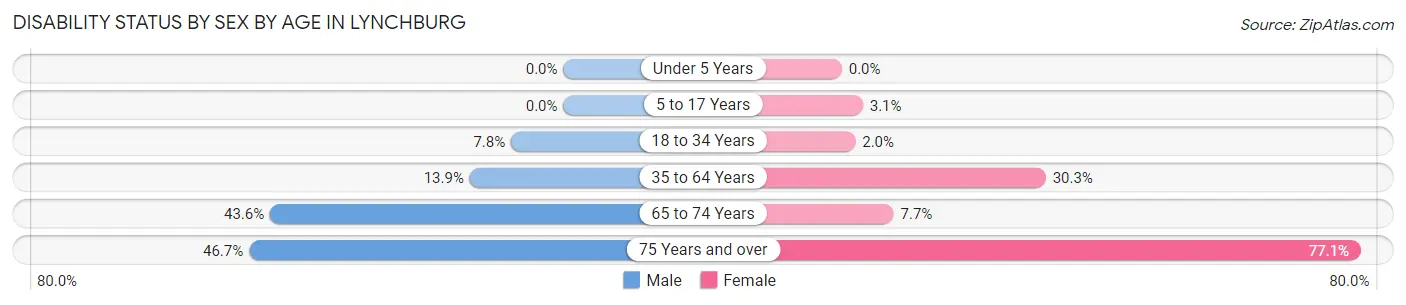
| Age Bracket | Male | Female |
| Under 5 Years | 0 (0.0%) | 0 (0.0%) |
| 5 to 17 Years | 0 (0.0%) | 3 (3.1%) |
| 18 to 34 Years | 23 (7.8%) | 3 (2.0%) |
| 35 to 64 Years | 31 (13.9%) | 86 (30.3%) |
| 65 to 74 Years | 27 (43.5%) | 3 (7.7%) |
| 75 Years and over | 14 (46.7%) | 37 (77.1%) |
Disability Class by Sex by Age in Lynchburg
Disability Class: Hearing Difficulty
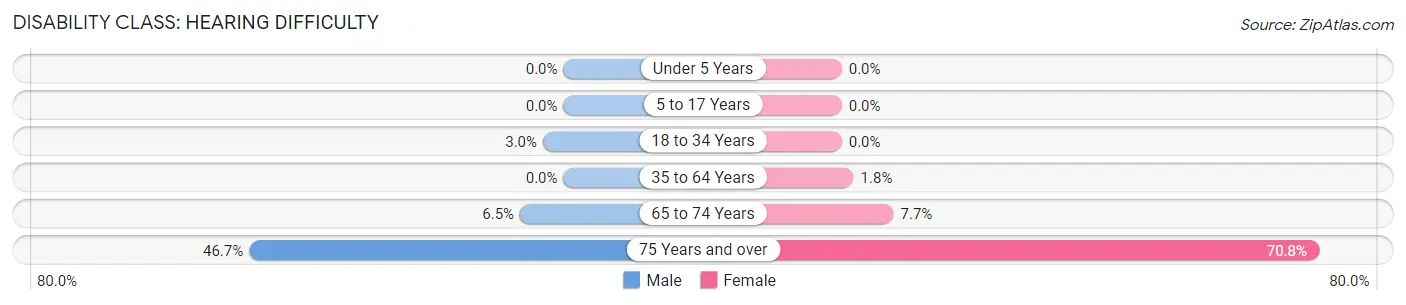
| Age Bracket | Male | Female |
| Under 5 Years | 0 (0.0%) | 0 (0.0%) |
| 5 to 17 Years | 0 (0.0%) | 0 (0.0%) |
| 18 to 34 Years | 9 (3.0%) | 0 (0.0%) |
| 35 to 64 Years | 0 (0.0%) | 5 (1.8%) |
| 65 to 74 Years | 4 (6.5%) | 3 (7.7%) |
| 75 Years and over | 14 (46.7%) | 34 (70.8%) |
Disability Class: Vision Difficulty
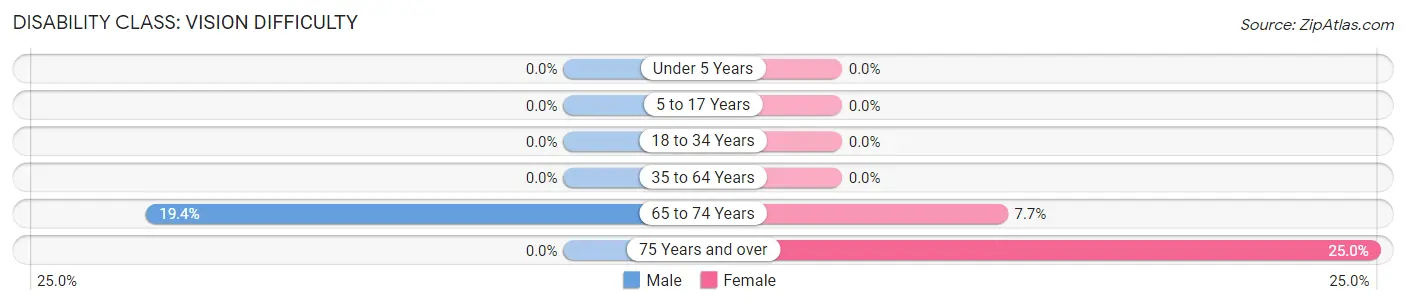
| Age Bracket | Male | Female |
| Under 5 Years | 0 (0.0%) | 0 (0.0%) |
| 5 to 17 Years | 0 (0.0%) | 0 (0.0%) |
| 18 to 34 Years | 0 (0.0%) | 0 (0.0%) |
| 35 to 64 Years | 0 (0.0%) | 0 (0.0%) |
| 65 to 74 Years | 12 (19.4%) | 3 (7.7%) |
| 75 Years and over | 0 (0.0%) | 12 (25.0%) |
Disability Class: Cognitive Difficulty
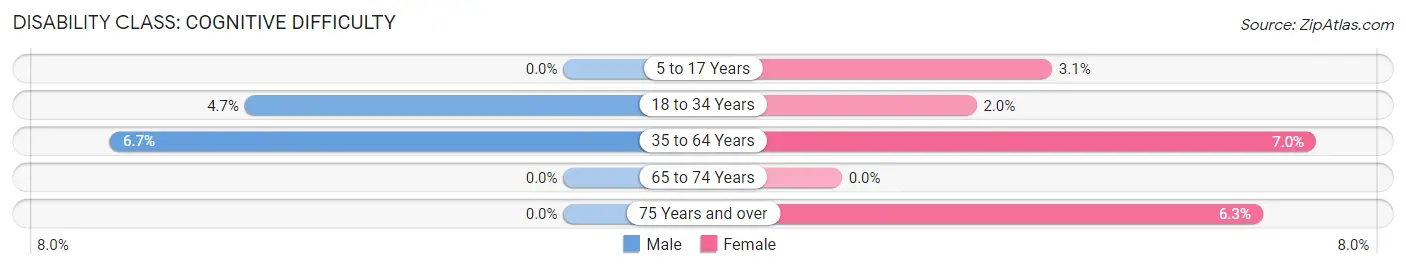
| Age Bracket | Male | Female |
| 5 to 17 Years | 0 (0.0%) | 3 (3.1%) |
| 18 to 34 Years | 14 (4.7%) | 3 (2.0%) |
| 35 to 64 Years | 15 (6.7%) | 20 (7.0%) |
| 65 to 74 Years | 0 (0.0%) | 0 (0.0%) |
| 75 Years and over | 0 (0.0%) | 3 (6.2%) |
Disability Class: Ambulatory Difficulty
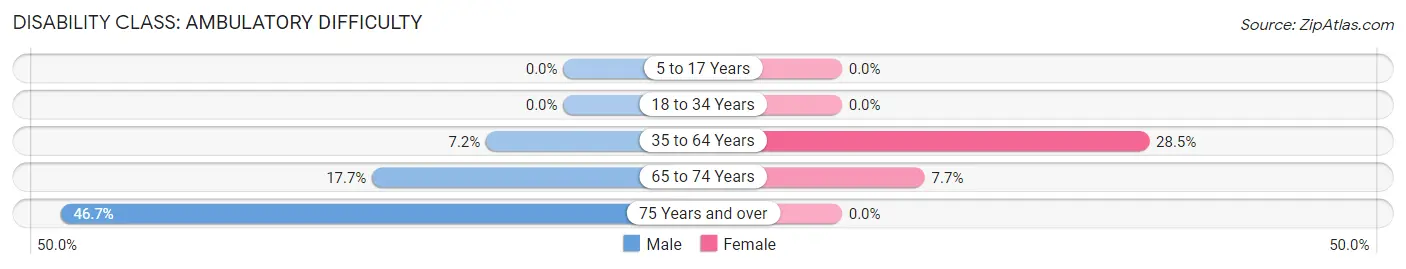
| Age Bracket | Male | Female |
| 5 to 17 Years | 0 (0.0%) | 0 (0.0%) |
| 18 to 34 Years | 0 (0.0%) | 0 (0.0%) |
| 35 to 64 Years | 16 (7.2%) | 81 (28.5%) |
| 65 to 74 Years | 11 (17.7%) | 3 (7.7%) |
| 75 Years and over | 14 (46.7%) | 0 (0.0%) |
Disability Class: Self-Care Difficulty
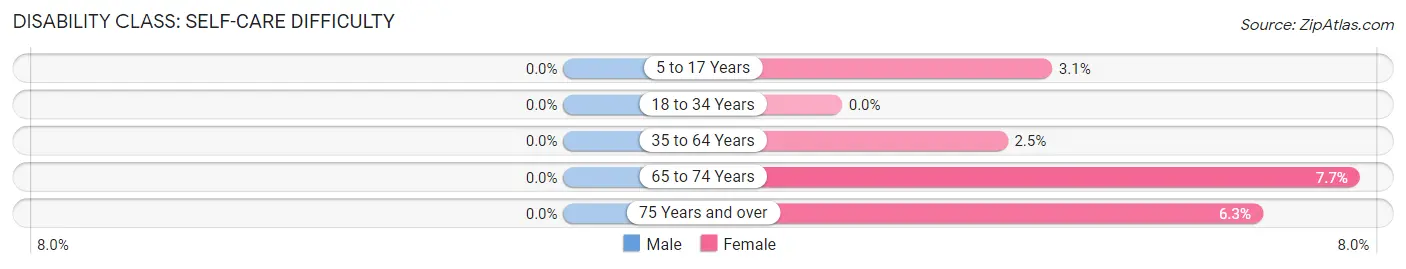
| Age Bracket | Male | Female |
| 5 to 17 Years | 0 (0.0%) | 3 (3.1%) |
| 18 to 34 Years | 0 (0.0%) | 0 (0.0%) |
| 35 to 64 Years | 0 (0.0%) | 7 (2.5%) |
| 65 to 74 Years | 0 (0.0%) | 3 (7.7%) |
| 75 Years and over | 0 (0.0%) | 3 (6.2%) |
Technology Access in Lynchburg
Computing Device Access in Lynchburg
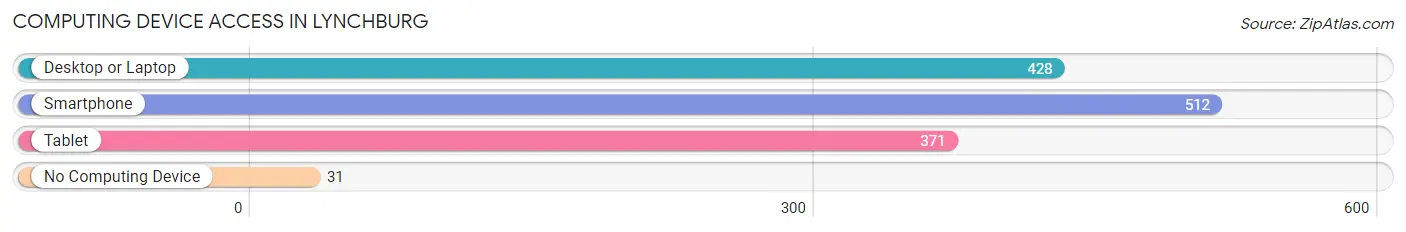
| Device Type | # Households | % Households |
| Desktop or Laptop | 428 | 73.2% |
| Smartphone | 512 | 87.5% |
| Tablet | 371 | 63.4% |
| No Computing Device | 31 | 5.3% |
| Total | 585 | 100.0% |
Internet Access in Lynchburg
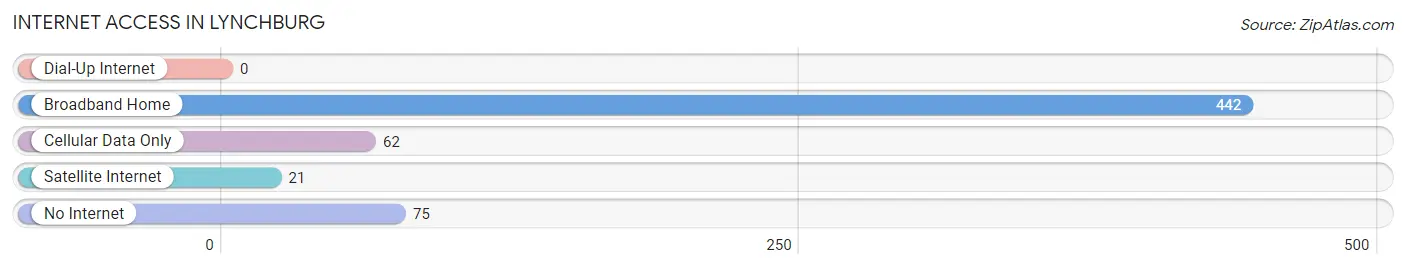
| Internet Type | # Households | % Households |
| Dial-Up Internet | 0 | 0.0% |
| Broadband Home | 442 | 75.6% |
| Cellular Data Only | 62 | 10.6% |
| Satellite Internet | 21 | 3.6% |
| No Internet | 75 | 12.8% |
| Total | 585 | 100.0% |
Lynchburg Summary
Lynchburg, Ohio is a small village located in Highland County, Ohio. It is situated in the foothills of the Appalachian Mountains, and is part of the Cincinnati metropolitan area. The village has a population of approximately 1,000 people, and is known for its rural charm and small-town atmosphere.
History
The area that is now Lynchburg was first settled in the early 1800s by a group of German immigrants. The village was originally known as “New Vienna”, and was founded in 1817. The name was changed to Lynchburg in 1820, in honor of the Lynch family, who were among the first settlers.
The village was incorporated in 1845, and the first post office was established in 1846. The village grew slowly, but steadily, and by the late 1800s, it had become a thriving agricultural community. The village was home to several mills, a blacksmith shop, a general store, and a variety of other businesses.
Geography
Lynchburg is located in the foothills of the Appalachian Mountains, and is part of the Cincinnati metropolitan area. The village is situated on the banks of the Little Miami River, and is surrounded by rolling hills and lush forests. The village is located approximately 30 miles east of Cincinnati, and is accessible via State Route 28.
Economy
The economy of Lynchburg is largely based on agriculture and tourism. The village is home to several farms, which produce a variety of crops, including corn, soybeans, and wheat. The village is also home to several wineries, which produce a variety of wines.
The village is also home to several small businesses, including restaurants, antique shops, and art galleries. The village is also home to a variety of outdoor recreation opportunities, including hiking, fishing, and camping.
Demographics
As of the 2010 census, the population of Lynchburg was 1,000 people. The racial makeup of the village was 97.2% White, 0.7% African American, 0.2% Native American, 0.2% Asian, 0.2% from other races, and 1.7% from two or more races. Hispanic or Latino of any race were 0.7% of the population.
The median income for a household in the village was $41,250, and the median income for a family was $50,000. The per capita income for the village was $20,845. About 8.2% of families and 10.2% of the population were below the poverty line, including 14.3% of those under age 18 and 6.7% of those age 65 or over.
Conclusion
Lynchburg, Ohio is a small village located in Highland County, Ohio. It is situated in the foothills of the Appalachian Mountains, and is part of the Cincinnati metropolitan area. The village has a population of approximately 1,000 people, and is known for its rural charm and small-town atmosphere. The economy of Lynchburg is largely based on agriculture and tourism, and the village is home to several farms, wineries, restaurants, antique shops, and art galleries. The racial makeup of the village is predominantly White, with a small percentage of African American, Native American, and Asian residents. The median income for a household in the village is $41,250, and the per capita income is $20,845.
Common Questions
What is Per Capita Income in Lynchburg?
Per Capita income in Lynchburg is $27,746.
What is the Median Family Income in Lynchburg?
Median Family Income in Lynchburg is $53,958.
What is the Median Household income in Lynchburg?
Median Household Income in Lynchburg is $56,250.
What is Income or Wage Gap in Lynchburg?
Income or Wage Gap in Lynchburg is 45.3%.
Women in Lynchburg earn 54.7 cents for every dollar earned by a man.
What is Inequality or Gini Index in Lynchburg?
Inequality or Gini Index in Lynchburg is 0.35.
What is the Total Population of Lynchburg?
Total Population of Lynchburg is 1,443.
What is the Total Male Population of Lynchburg?
Total Male Population of Lynchburg is 765.
What is the Total Female Population of Lynchburg?
Total Female Population of Lynchburg is 678.
What is the Ratio of Males per 100 Females in Lynchburg?
There are 112.83 Males per 100 Females in Lynchburg.
What is the Ratio of Females per 100 Males in Lynchburg?
There are 88.63 Females per 100 Males in Lynchburg.
What is the Median Population Age in Lynchburg?
Median Population Age in Lynchburg is 32.7 Years.
What is the Average Family Size in Lynchburg
Average Family Size in Lynchburg is 2.9 People.
What is the Average Household Size in Lynchburg
Average Household Size in Lynchburg is 2.5 People.
How Large is the Labor Force in Lynchburg?
There are 796 People in the Labor Forcein in Lynchburg.
What is the Percentage of People in the Labor Force in Lynchburg?
68.9% of People are in the Labor Force in Lynchburg.
What is the Unemployment Rate in Lynchburg?
Unemployment Rate in Lynchburg is 4.3%.