Lowell, OH Map & Demographics
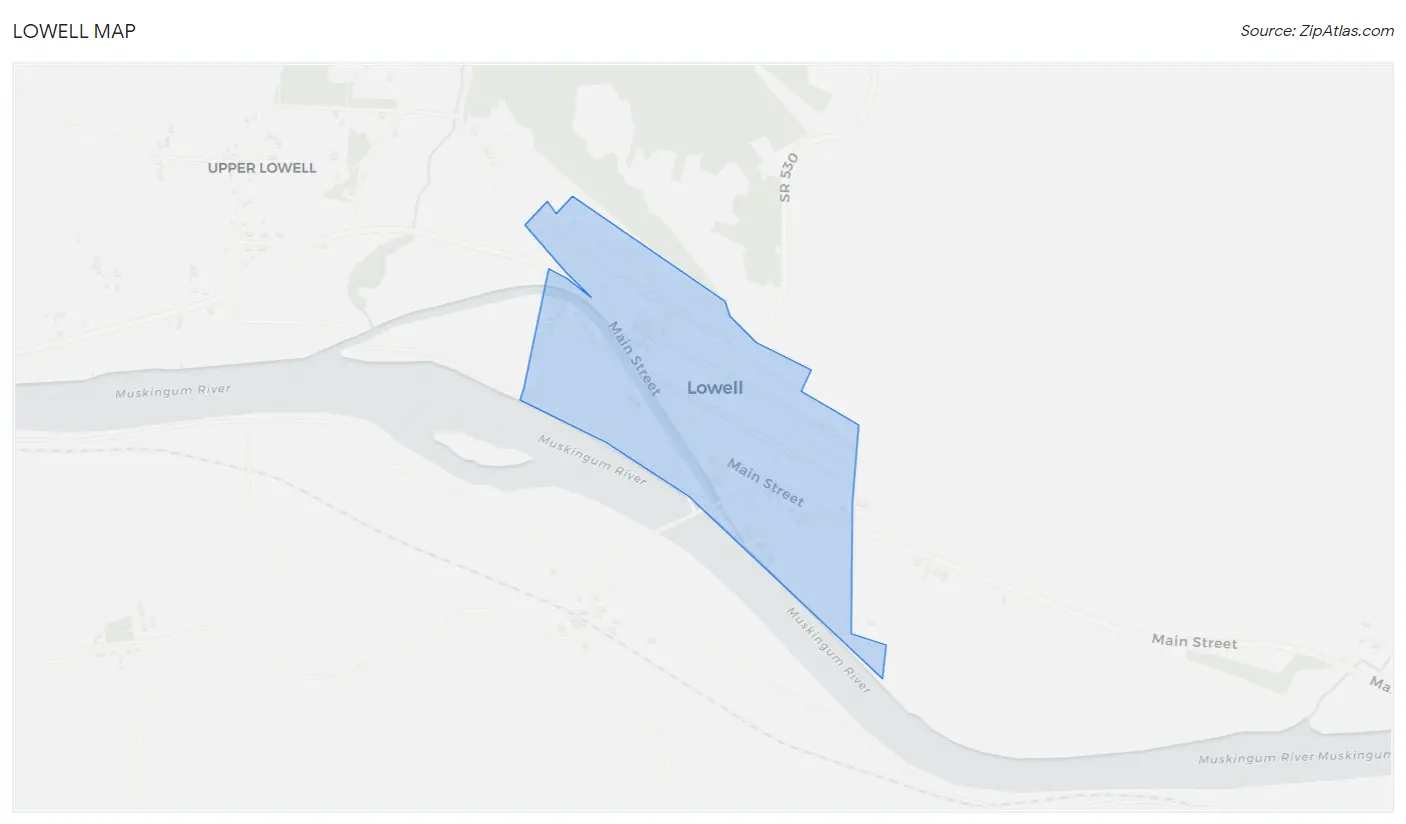
Lowell Map
Lowell Overview
$21,554
PER CAPITA INCOME
$43,750
AVG FAMILY INCOME
$40,417
AVG HOUSEHOLD INCOME
20.1%
WAGE / INCOME GAP [ % ]
79.9¢/ $1
WAGE / INCOME GAP [ $ ]
0.38
INEQUALITY / GINI INDEX
506
TOTAL POPULATION
240
MALE POPULATION
266
FEMALE POPULATION
90.23
MALES / 100 FEMALES
110.83
FEMALES / 100 MALES
38.0
MEDIAN AGE
2.7
AVG FAMILY SIZE
2.4
AVG HOUSEHOLD SIZE
230
LABOR FORCE [ PEOPLE ]
57.1%
PERCENT IN LABOR FORCE
7.0%
UNEMPLOYMENT RATE
Lowell Zip Codes
Lowell Area Codes
Income in Lowell
Income Overview in Lowell
Per Capita Income in Lowell is $21,554, while median incomes of families and households are $43,750 and $40,417 respectively.
| Characteristic | Number | Measure |
| Per Capita Income | 506 | $21,554 |
| Median Family Income | 151 | $43,750 |
| Mean Family Income | 151 | $52,454 |
| Median Household Income | 215 | $40,417 |
| Mean Household Income | 215 | $49,856 |
| Income Deficit | 151 | $0 |
| Wage / Income Gap (%) | 506 | 20.10% |
| Wage / Income Gap ($) | 506 | 79.90¢ per $1 |
| Gini / Inequality Index | 506 | 0.38 |
Earnings by Sex in Lowell
Average Earnings in Lowell are $35,000, $37,321 for men and $29,821 for women, a difference of 20.1%.
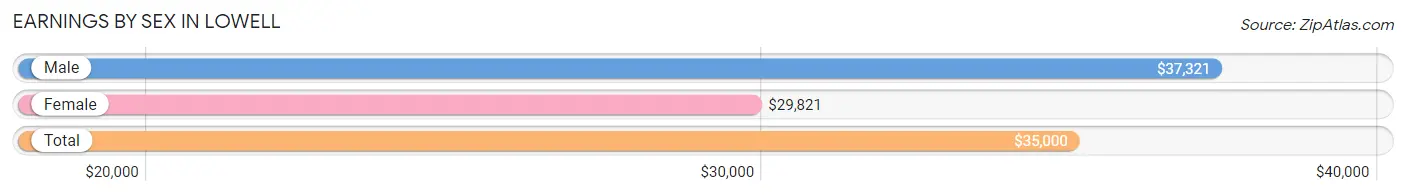
| Sex | Number | Average Earnings |
| Male | 103 (46.4%) | $37,321 |
| Female | 119 (53.6%) | $29,821 |
| Total | 222 (100.0%) | $35,000 |
Earnings by Sex by Income Bracket in Lowell
The most common earnings brackets in Lowell are $40,000 to $44,999 for men (18 | 17.5%) and $35,000 to $39,999 for women (23 | 19.3%).
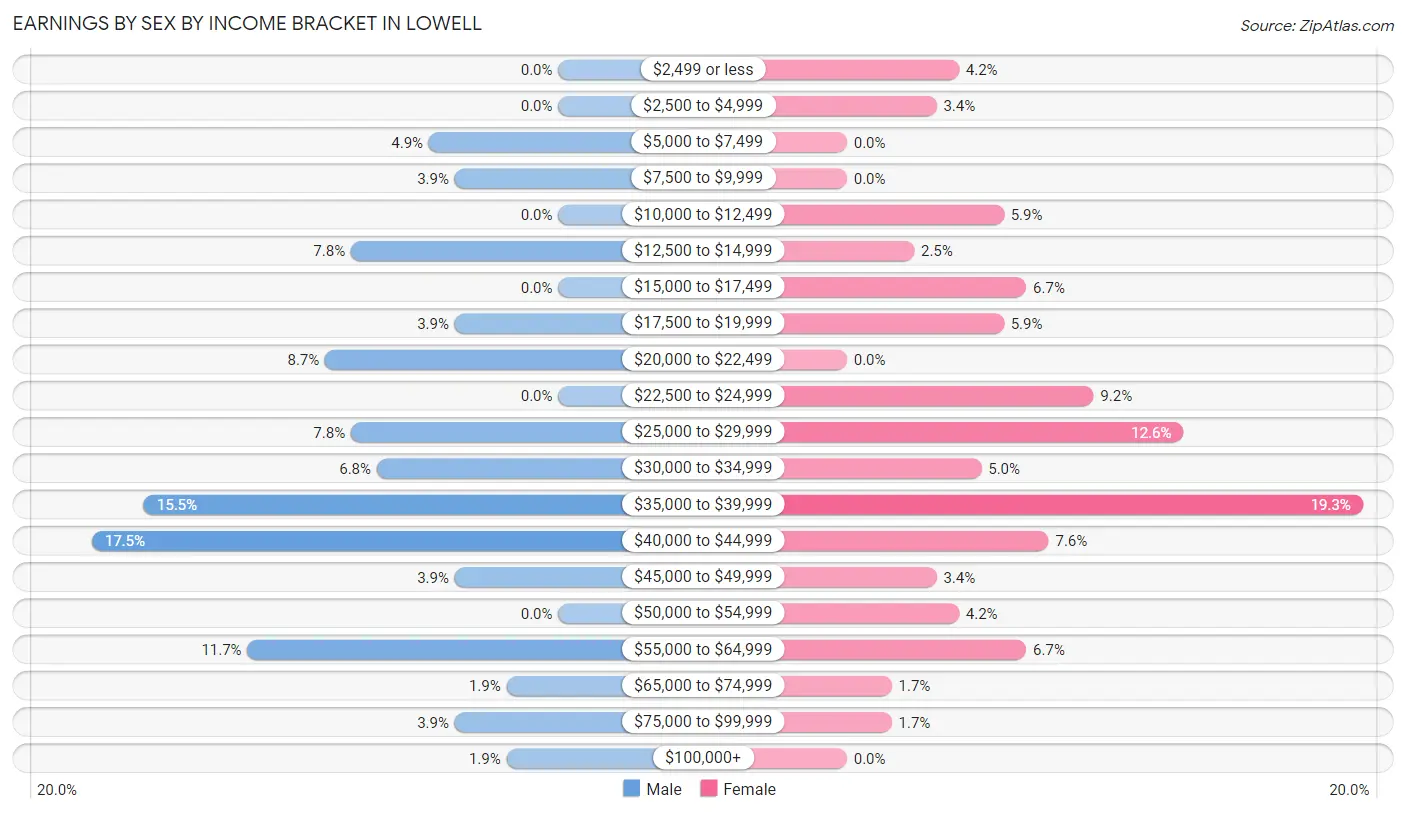
| Income | Male | Female |
| $2,499 or less | 0 (0.0%) | 5 (4.2%) |
| $2,500 to $4,999 | 0 (0.0%) | 4 (3.4%) |
| $5,000 to $7,499 | 5 (4.9%) | 0 (0.0%) |
| $7,500 to $9,999 | 4 (3.9%) | 0 (0.0%) |
| $10,000 to $12,499 | 0 (0.0%) | 7 (5.9%) |
| $12,500 to $14,999 | 8 (7.8%) | 3 (2.5%) |
| $15,000 to $17,499 | 0 (0.0%) | 8 (6.7%) |
| $17,500 to $19,999 | 4 (3.9%) | 7 (5.9%) |
| $20,000 to $22,499 | 9 (8.7%) | 0 (0.0%) |
| $22,500 to $24,999 | 0 (0.0%) | 11 (9.2%) |
| $25,000 to $29,999 | 8 (7.8%) | 15 (12.6%) |
| $30,000 to $34,999 | 7 (6.8%) | 6 (5.0%) |
| $35,000 to $39,999 | 16 (15.5%) | 23 (19.3%) |
| $40,000 to $44,999 | 18 (17.5%) | 9 (7.6%) |
| $45,000 to $49,999 | 4 (3.9%) | 4 (3.4%) |
| $50,000 to $54,999 | 0 (0.0%) | 5 (4.2%) |
| $55,000 to $64,999 | 12 (11.7%) | 8 (6.7%) |
| $65,000 to $74,999 | 2 (1.9%) | 2 (1.7%) |
| $75,000 to $99,999 | 4 (3.9%) | 2 (1.7%) |
| $100,000+ | 2 (1.9%) | 0 (0.0%) |
| Total | 103 (100.0%) | 119 (100.0%) |
Earnings by Sex by Educational Attainment in Lowell
Average earnings in Lowell are $39,722 for men and $33,542 for women, a difference of 15.6%. Men with an educational attainment of bachelor's degree enjoy the highest average annual earnings of $58,750, while those with high school diploma education earn the least with $25,833. Women with an educational attainment of graduate degree earn the most with the average annual earnings of $43,750, while those with high school diploma education have the smallest earnings of $26,250.
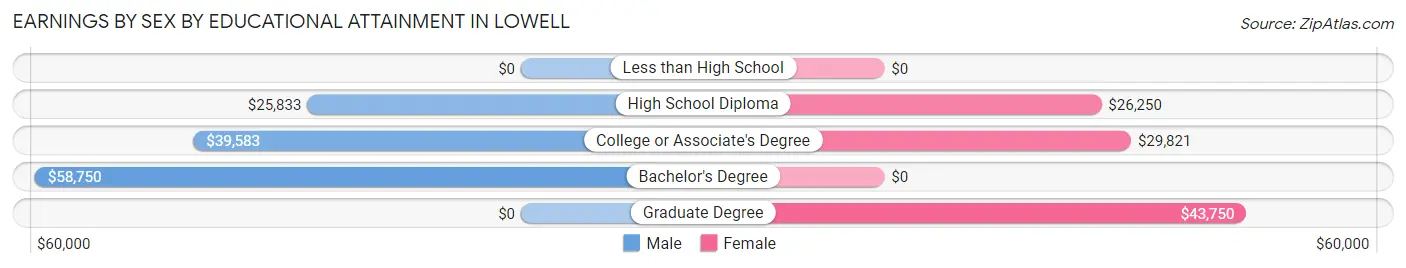
| Educational Attainment | Male Income | Female Income |
| Less than High School | - | - |
| High School Diploma | $25,833 | $26,250 |
| College or Associate's Degree | $39,583 | $29,821 |
| Bachelor's Degree | $58,750 | $0 |
| Graduate Degree | - | - |
| Total | $39,722 | $33,542 |
Family Income in Lowell
Family Income Brackets in Lowell
According to the Lowell family income data, there are 37 families falling into the $35,000 to $49,999 income range, which is the most common income bracket and makes up 24.5% of all families.
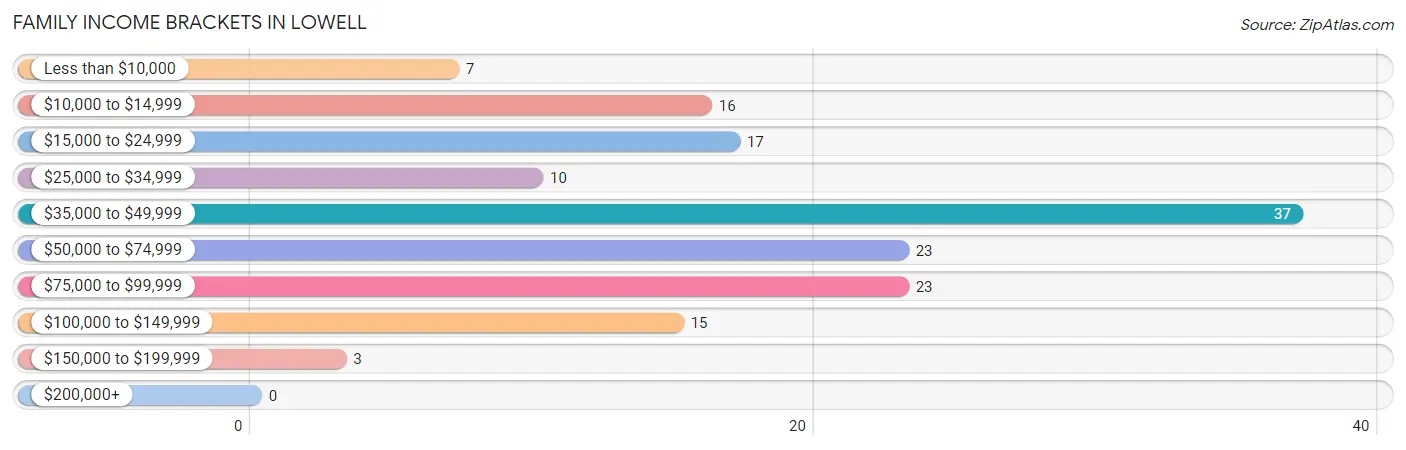
| Income Bracket | # Families | % Families |
| Less than $10,000 | 7 | 4.6% |
| $10,000 to $14,999 | 16 | 10.6% |
| $15,000 to $24,999 | 17 | 11.3% |
| $25,000 to $34,999 | 10 | 6.6% |
| $35,000 to $49,999 | 37 | 24.5% |
| $50,000 to $74,999 | 23 | 15.2% |
| $75,000 to $99,999 | 23 | 15.2% |
| $100,000 to $149,999 | 15 | 9.9% |
| $150,000 to $199,999 | 3 | 2.0% |
| $200,000+ | 0 | 0.0% |
Family Income by Famaliy Size in Lowell
3-person families (34 | 22.5%) account for the highest median family income in Lowell with $58,333 per family, while 2-person families (99 | 65.6%) have the highest median income of $21,612 per family member.
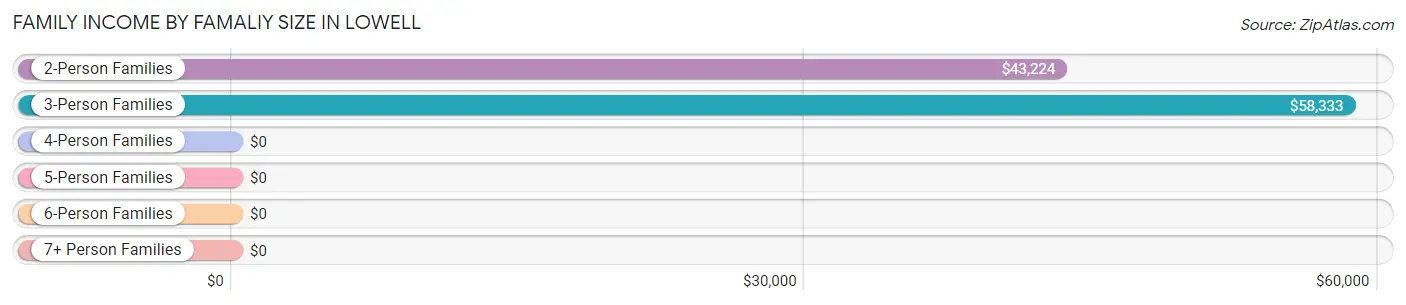
| Income Bracket | # Families | Median Income |
| 2-Person Families | 99 (65.6%) | $43,224 |
| 3-Person Families | 34 (22.5%) | $58,333 |
| 4-Person Families | 4 (2.6%) | $0 |
| 5-Person Families | 9 (6.0%) | $0 |
| 6-Person Families | 5 (3.3%) | $0 |
| 7+ Person Families | 0 (0.0%) | $0 |
| Total | 151 (100.0%) | $43,750 |
Family Income by Number of Earners in Lowell
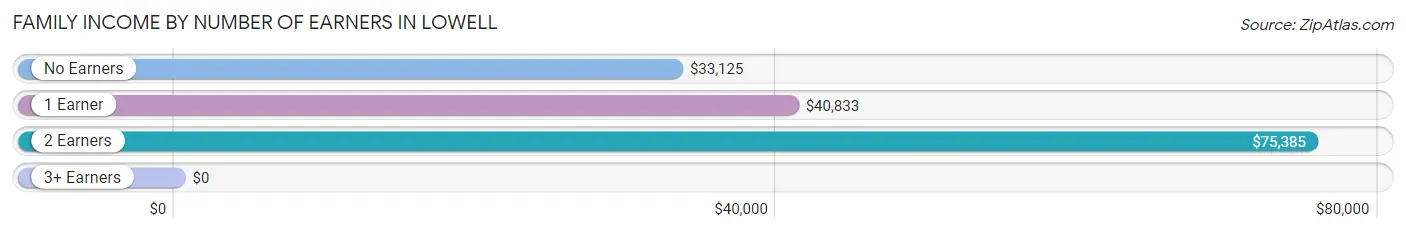
| Number of Earners | # Families | Median Income |
| No Earners | 49 (32.5%) | $33,125 |
| 1 Earner | 32 (21.2%) | $40,833 |
| 2 Earners | 64 (42.4%) | $75,385 |
| 3+ Earners | 6 (4.0%) | $0 |
| Total | 151 (100.0%) | $43,750 |
Household Income in Lowell
Household Income Brackets in Lowell
With 49 households falling in the category, the $15,000 to $24,999 income range is the most frequent in Lowell, accounting for 22.8% of all households.
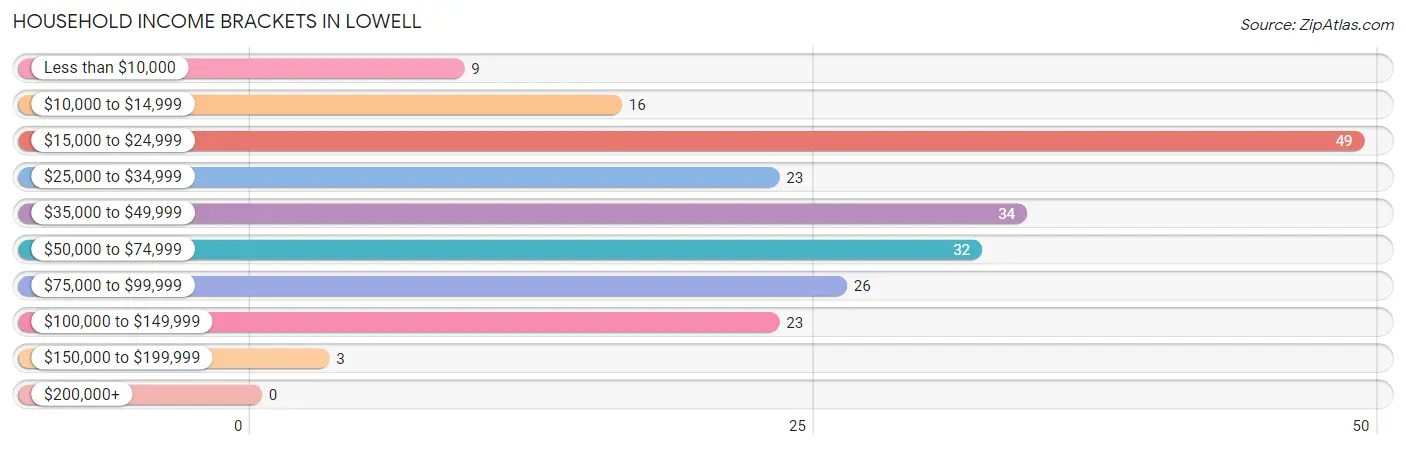
| Income Bracket | # Households | % Households |
| Less than $10,000 | 9 | 4.2% |
| $10,000 to $14,999 | 16 | 7.4% |
| $15,000 to $24,999 | 49 | 22.8% |
| $25,000 to $34,999 | 23 | 10.7% |
| $35,000 to $49,999 | 34 | 15.8% |
| $50,000 to $74,999 | 32 | 14.9% |
| $75,000 to $99,999 | 26 | 12.1% |
| $100,000 to $149,999 | 23 | 10.7% |
| $150,000 to $199,999 | 3 | 1.4% |
| $200,000+ | 0 | 0.0% |
Household Income by Householder Age in Lowell
The median household income in Lowell is $40,417, with the highest median household income of $65,938 found in the 45 to 64 years age bracket for the primary householder. A total of 58 households (27.0%) fall into this category. Meanwhile, the 65+ years age bracket for the primary householder has the lowest median household income of $27,250, with 73 households (34.0%) in this group.
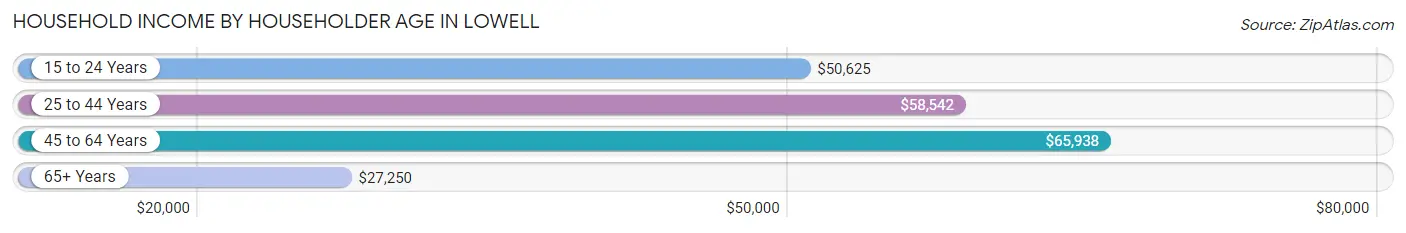
| Income Bracket | # Households | Median Income |
| 15 to 24 Years | 9 (4.2%) | $50,625 |
| 25 to 44 Years | 75 (34.9%) | $58,542 |
| 45 to 64 Years | 58 (27.0%) | $65,938 |
| 65+ Years | 73 (34.0%) | $27,250 |
| Total | 215 (100.0%) | $40,417 |
Poverty in Lowell
Income Below Poverty by Sex and Age in Lowell
With 26.5% poverty level for males and 20.7% for females among the residents of Lowell, 5 year old males and 5 year old females are the most vulnerable to poverty, with 4 males (100.0%) and 7 females (100.0%) in their respective age groups living below the poverty level.
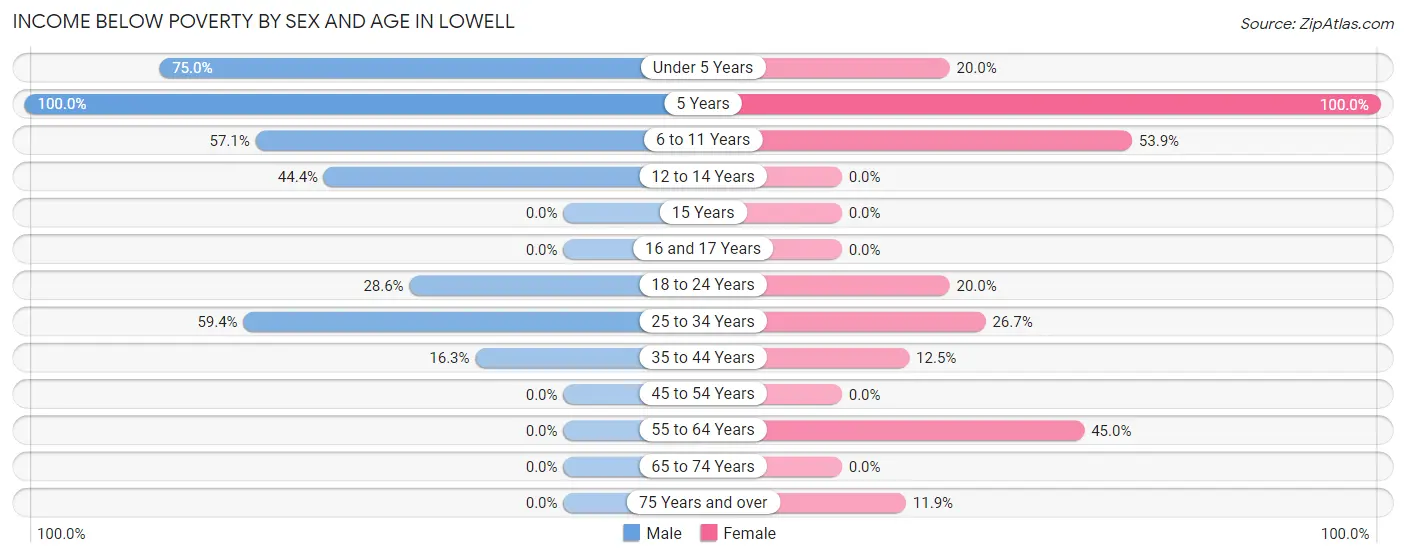
| Age Bracket | Male | Female |
| Under 5 Years | 9 (75.0%) | 3 (20.0%) |
| 5 Years | 4 (100.0%) | 7 (100.0%) |
| 6 to 11 Years | 12 (57.1%) | 7 (53.8%) |
| 12 to 14 Years | 4 (44.4%) | 0 (0.0%) |
| 15 Years | 0 (0.0%) | 0 (0.0%) |
| 16 and 17 Years | 0 (0.0%) | 0 (0.0%) |
| 18 to 24 Years | 6 (28.6%) | 7 (20.0%) |
| 25 to 34 Years | 19 (59.4%) | 12 (26.7%) |
| 35 to 44 Years | 8 (16.3%) | 5 (12.5%) |
| 45 to 54 Years | 0 (0.0%) | 0 (0.0%) |
| 55 to 64 Years | 0 (0.0%) | 9 (45.0%) |
| 65 to 74 Years | 0 (0.0%) | 0 (0.0%) |
| 75 Years and over | 0 (0.0%) | 5 (11.9%) |
| Total | 62 (26.5%) | 55 (20.7%) |
Income Above Poverty by Sex and Age in Lowell
According to the poverty statistics in Lowell, males aged 15 years and females aged 12 to 14 years are the age groups that are most secure financially, with 100.0% of males and 100.0% of females in these age groups living above the poverty line.
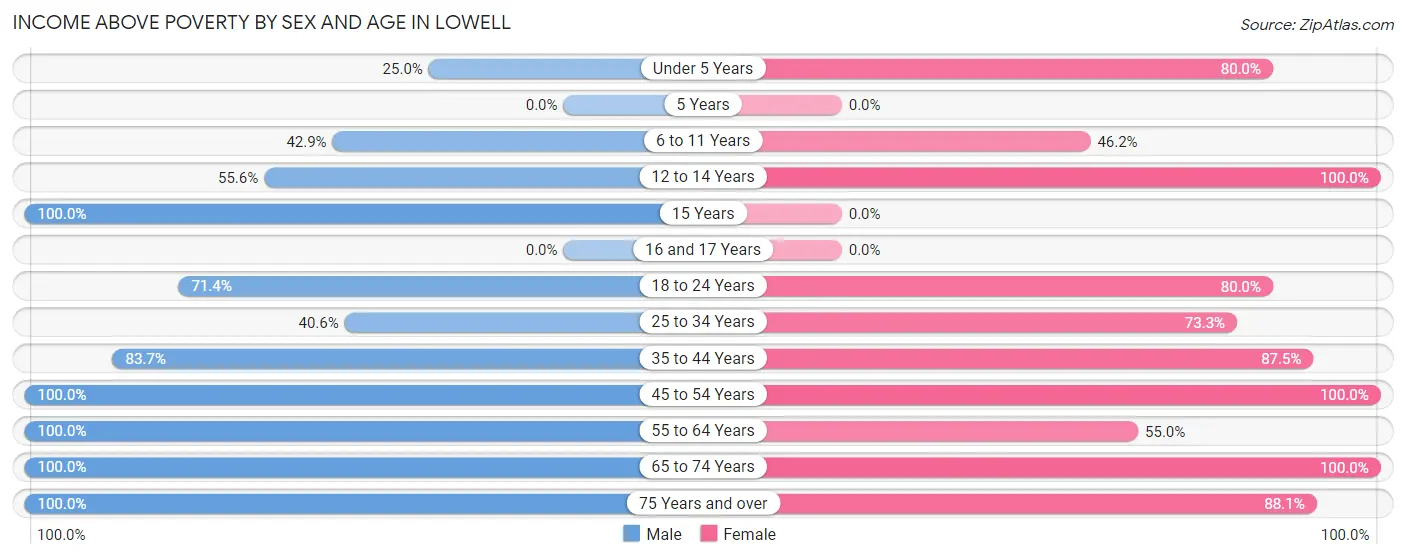
| Age Bracket | Male | Female |
| Under 5 Years | 3 (25.0%) | 12 (80.0%) |
| 5 Years | 0 (0.0%) | 0 (0.0%) |
| 6 to 11 Years | 9 (42.9%) | 6 (46.2%) |
| 12 to 14 Years | 5 (55.6%) | 11 (100.0%) |
| 15 Years | 5 (100.0%) | 0 (0.0%) |
| 16 and 17 Years | 0 (0.0%) | 0 (0.0%) |
| 18 to 24 Years | 15 (71.4%) | 28 (80.0%) |
| 25 to 34 Years | 13 (40.6%) | 33 (73.3%) |
| 35 to 44 Years | 41 (83.7%) | 35 (87.5%) |
| 45 to 54 Years | 22 (100.0%) | 19 (100.0%) |
| 55 to 64 Years | 16 (100.0%) | 11 (55.0%) |
| 65 to 74 Years | 10 (100.0%) | 19 (100.0%) |
| 75 Years and over | 33 (100.0%) | 37 (88.1%) |
| Total | 172 (73.5%) | 211 (79.3%) |
Income Below Poverty Among Married-Couple Families in Lowell
The poverty statistics for married-couple families in Lowell show that 9.6% or 9 of the total 94 families live below the poverty line. Families with 3 or 4 children have the highest poverty rate of 64.3%, comprising of 9 families. On the other hand, families with no children have the lowest poverty rate of 0.0%, which includes 0 families.
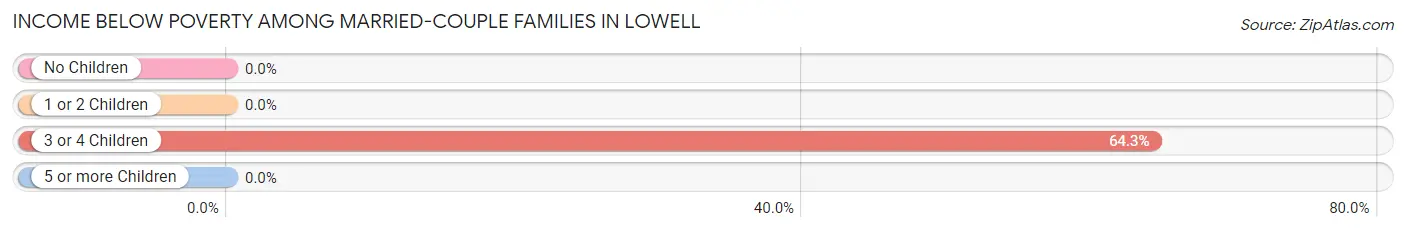
| Children | Above Poverty | Below Poverty |
| No Children | 56 (100.0%) | 0 (0.0%) |
| 1 or 2 Children | 24 (100.0%) | 0 (0.0%) |
| 3 or 4 Children | 5 (35.7%) | 9 (64.3%) |
| 5 or more Children | 0 (0.0%) | 0 (0.0%) |
| Total | 85 (90.4%) | 9 (9.6%) |
Income Below Poverty Among Single-Parent Households in Lowell
According to the poverty data in Lowell, 36.4% or 8 single-father households and 34.3% or 12 single-mother households are living below the poverty line. Among single-father households, those with 1 or 2 children have the highest poverty rate, with 8 households (61.5%) experiencing poverty. Likewise, among single-mother households, those with no children have the highest poverty rate, with 9 households (36.0%) falling below the poverty line.
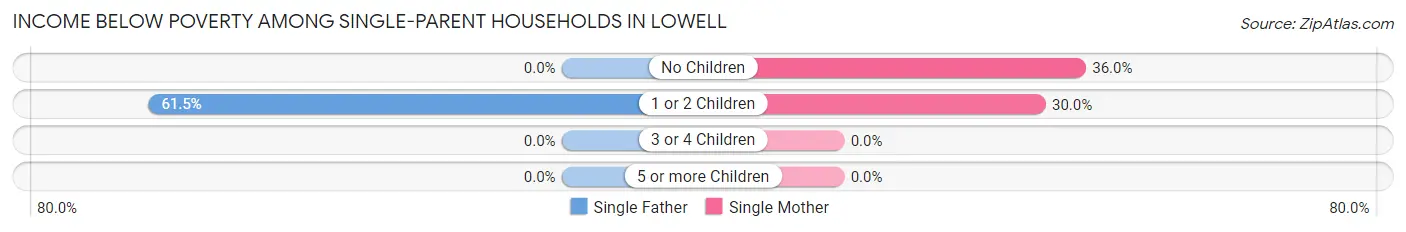
| Children | Single Father | Single Mother |
| No Children | 0 (0.0%) | 9 (36.0%) |
| 1 or 2 Children | 8 (61.5%) | 3 (30.0%) |
| 3 or 4 Children | 0 (0.0%) | 0 (0.0%) |
| 5 or more Children | 0 (0.0%) | 0 (0.0%) |
| Total | 8 (36.4%) | 12 (34.3%) |
Income Below Poverty Among Married-Couple vs Single-Parent Households in Lowell
The poverty data for Lowell shows that 9 of the married-couple family households (9.6%) and 20 of the single-parent households (35.1%) are living below the poverty level. Within the married-couple family households, those with 3 or 4 children have the highest poverty rate, with 9 households (64.3%) falling below the poverty line. Among the single-parent households, those with 1 or 2 children have the highest poverty rate, with 11 household (47.8%) living below poverty.
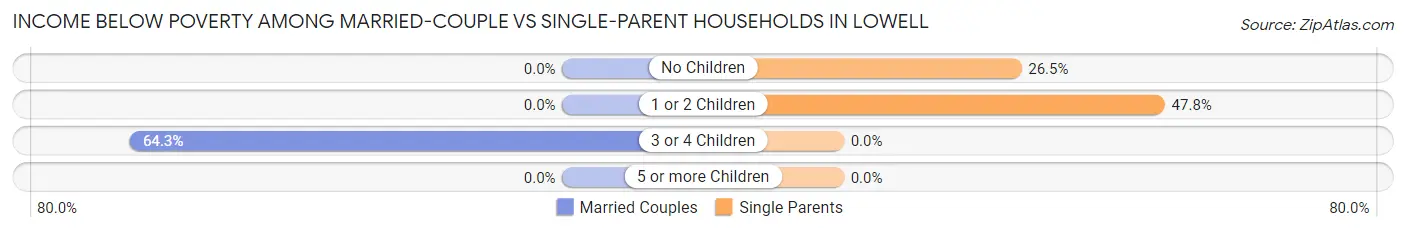
| Children | Married-Couple Families | Single-Parent Households |
| No Children | 0 (0.0%) | 9 (26.5%) |
| 1 or 2 Children | 0 (0.0%) | 11 (47.8%) |
| 3 or 4 Children | 9 (64.3%) | 0 (0.0%) |
| 5 or more Children | 0 (0.0%) | 0 (0.0%) |
| Total | 9 (9.6%) | 20 (35.1%) |
Race in Lowell
The most populous races in Lowell are White / Caucasian (490 | 96.8%), Asian (12 | 2.4%), and Two or more Races (4 | 0.8%).
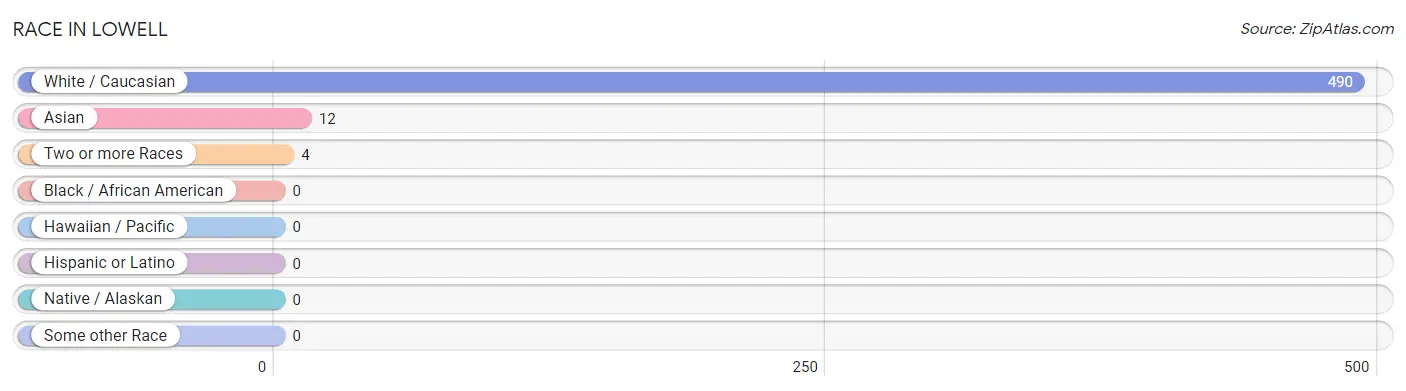
| Race | # Population | % Population |
| Asian | 12 | 2.4% |
| Black / African American | 0 | 0.0% |
| Hawaiian / Pacific | 0 | 0.0% |
| Hispanic or Latino | 0 | 0.0% |
| Native / Alaskan | 0 | 0.0% |
| White / Caucasian | 490 | 96.8% |
| Two or more Races | 4 | 0.8% |
| Some other Race | 0 | 0.0% |
| Total | 506 | 100.0% |
Ancestry in Lowell
The most populous ancestries reported in Lowell are German (163 | 32.2%), American (48 | 9.5%), English (39 | 7.7%), Irish (38 | 7.5%), and Dutch (18 | 3.6%), together accounting for 60.5% of all Lowell residents.
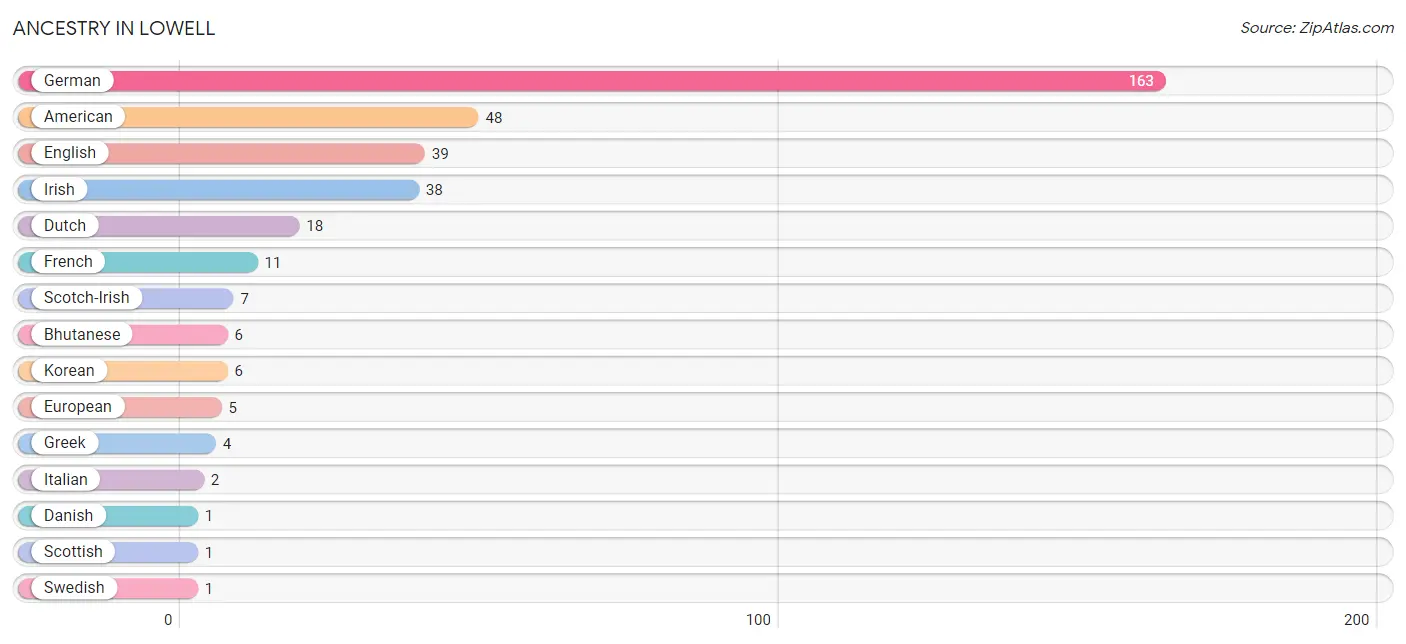
| Ancestry | # Population | % Population |
| American | 48 | 9.5% |
| Bhutanese | 6 | 1.2% |
| Danish | 1 | 0.2% |
| Dutch | 18 | 3.6% |
| English | 39 | 7.7% |
| European | 5 | 1.0% |
| French | 11 | 2.2% |
| German | 163 | 32.2% |
| Greek | 4 | 0.8% |
| Irish | 38 | 7.5% |
| Italian | 2 | 0.4% |
| Korean | 6 | 1.2% |
| Scotch-Irish | 7 | 1.4% |
| Scottish | 1 | 0.2% |
| Swedish | 1 | 0.2% | View All 15 Rows |
Immigrants in Lowell
The most numerous immigrant groups reported in Lowell came from Asia (6 | 1.2%), Philippines (6 | 1.2%), and South Eastern Asia (6 | 1.2%), together accounting for 3.6% of all Lowell residents.
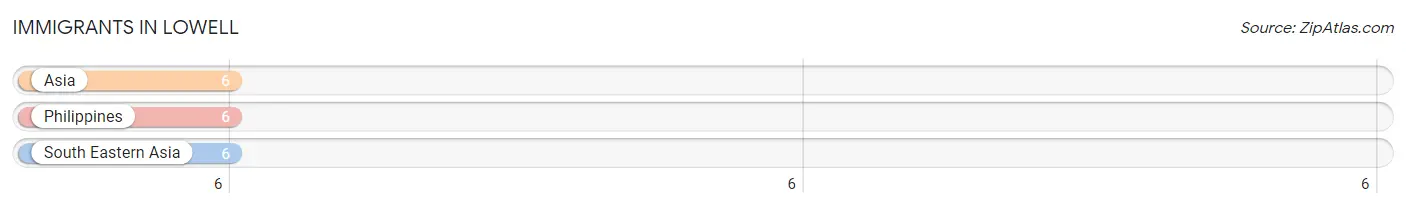
| Immigration Origin | # Population | % Population |
| Asia | 6 | 1.2% |
| Philippines | 6 | 1.2% |
| South Eastern Asia | 6 | 1.2% | View All 3 Rows |
Sex and Age in Lowell
Sex and Age in Lowell
The most populous age groups in Lowell are 40 to 44 Years (34 | 14.2%) for men and 20 to 24 Years (25 | 9.4%) for women.
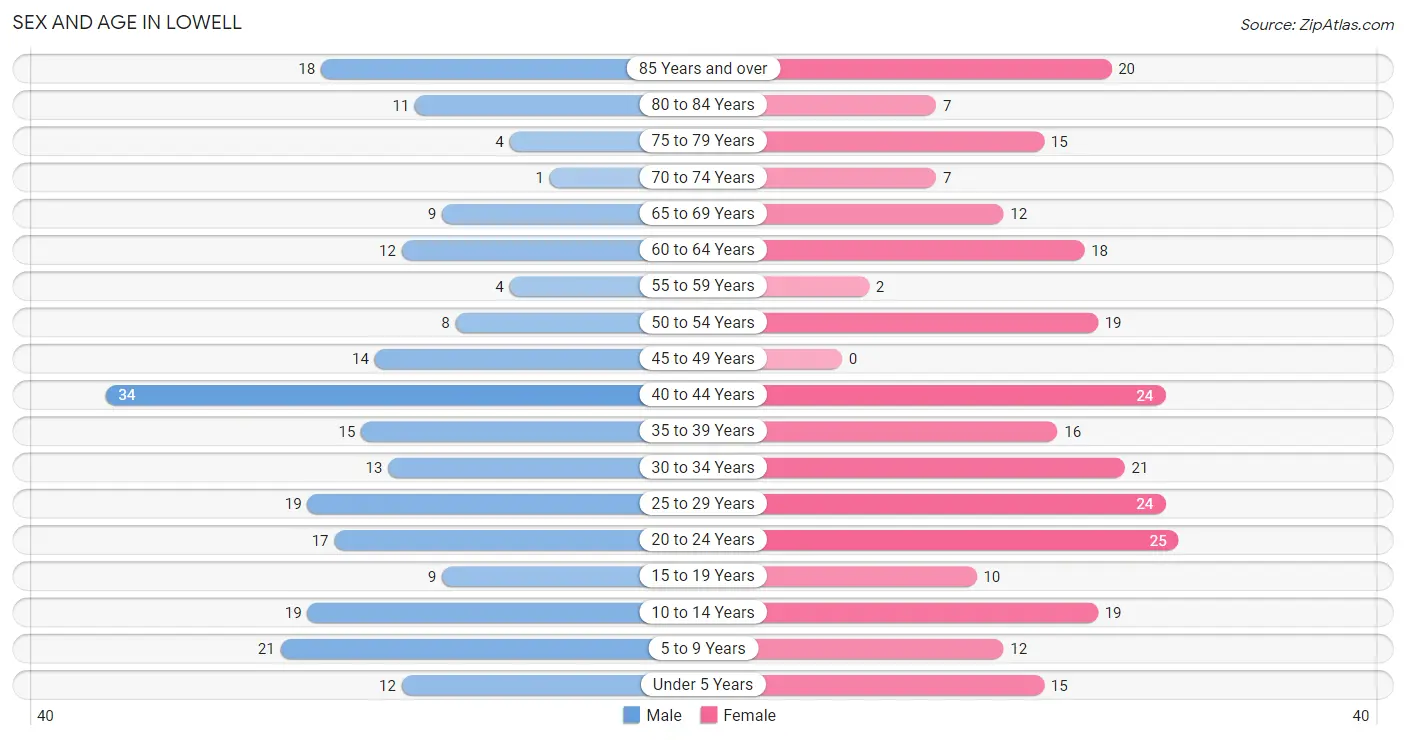
| Age Bracket | Male | Female |
| Under 5 Years | 12 (5.0%) | 15 (5.6%) |
| 5 to 9 Years | 21 (8.7%) | 12 (4.5%) |
| 10 to 14 Years | 19 (7.9%) | 19 (7.1%) |
| 15 to 19 Years | 9 (3.7%) | 10 (3.8%) |
| 20 to 24 Years | 17 (7.1%) | 25 (9.4%) |
| 25 to 29 Years | 19 (7.9%) | 24 (9.0%) |
| 30 to 34 Years | 13 (5.4%) | 21 (7.9%) |
| 35 to 39 Years | 15 (6.2%) | 16 (6.0%) |
| 40 to 44 Years | 34 (14.2%) | 24 (9.0%) |
| 45 to 49 Years | 14 (5.8%) | 0 (0.0%) |
| 50 to 54 Years | 8 (3.3%) | 19 (7.1%) |
| 55 to 59 Years | 4 (1.7%) | 2 (0.7%) |
| 60 to 64 Years | 12 (5.0%) | 18 (6.8%) |
| 65 to 69 Years | 9 (3.7%) | 12 (4.5%) |
| 70 to 74 Years | 1 (0.4%) | 7 (2.6%) |
| 75 to 79 Years | 4 (1.7%) | 15 (5.6%) |
| 80 to 84 Years | 11 (4.6%) | 7 (2.6%) |
| 85 Years and over | 18 (7.5%) | 20 (7.5%) |
| Total | 240 (100.0%) | 266 (100.0%) |
Families and Households in Lowell
Median Family Size in Lowell
The median family size in Lowell is 2.66 persons per family, with married-couple families (94 | 62.3%) accounting for the largest median family size of 2.87 persons per family. On the other hand, single male/father families (22 | 14.6%) represent the smallest median family size with 1.91 persons per family.
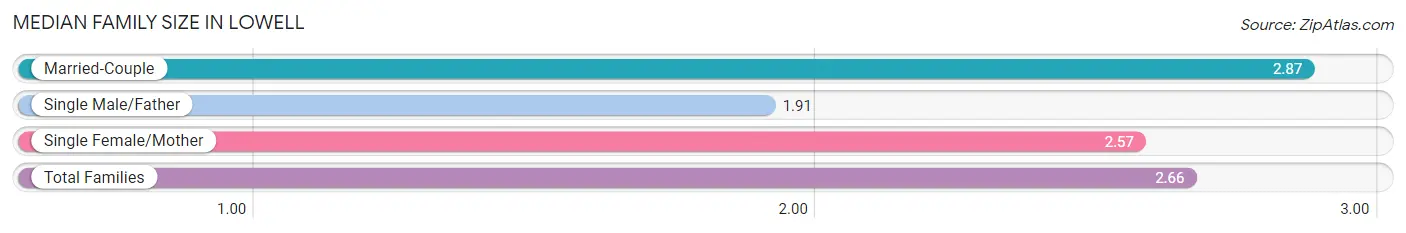
| Family Type | # Families | Family Size |
| Married-Couple | 94 (62.3%) | 2.87 |
| Single Male/Father | 22 (14.6%) | 1.91 |
| Single Female/Mother | 35 (23.2%) | 2.57 |
| Total Families | 151 (100.0%) | 2.66 |
Median Household Size in Lowell
The median household size in Lowell is 2.35 persons per household, with single male/father households (22 | 10.2%) accounting for the largest median household size of 3.05 persons per household. non-family households (64 | 29.8%) represent the smallest median household size with 1.08 persons per household.
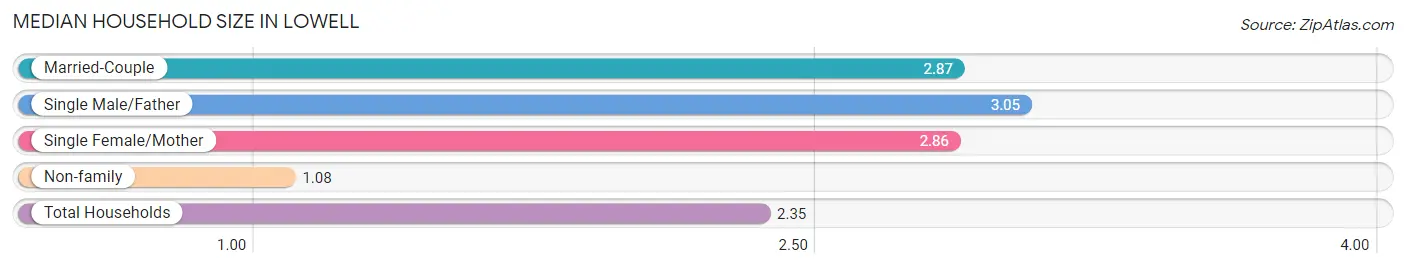
| Household Type | # Households | Household Size |
| Married-Couple | 94 (43.7%) | 2.87 |
| Single Male/Father | 22 (10.2%) | 3.05 |
| Single Female/Mother | 35 (16.3%) | 2.86 |
| Non-family | 64 (29.8%) | 1.08 |
| Total Households | 215 (100.0%) | 2.35 |
Household Size by Marriage Status in Lowell
Out of a total of 215 households in Lowell, 151 (70.2%) are family households, while 64 (29.8%) are nonfamily households. The most numerous type of family households are 2-person households, comprising 74, and the most common type of nonfamily households are 1-person households, comprising 59.
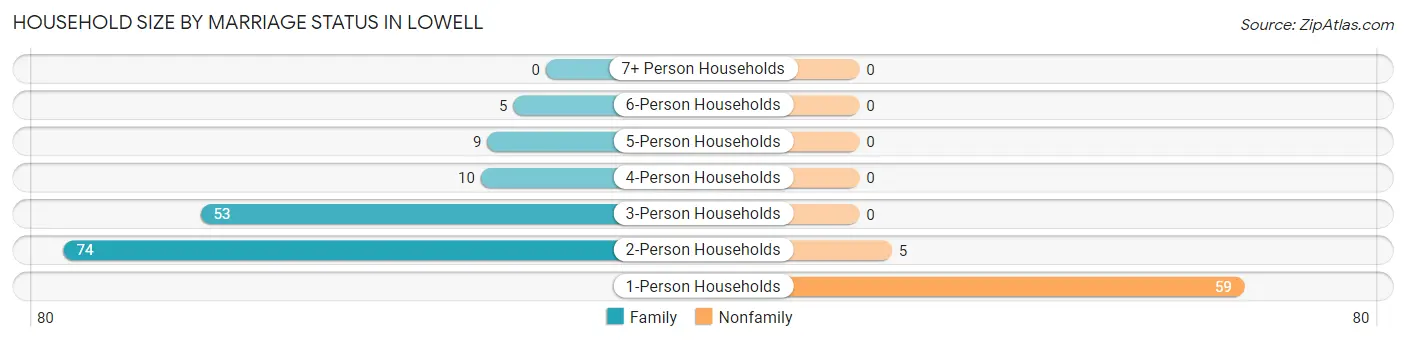
| Household Size | Family Households | Nonfamily Households |
| 1-Person Households | - | 59 (27.4%) |
| 2-Person Households | 74 (34.4%) | 5 (2.3%) |
| 3-Person Households | 53 (24.6%) | 0 (0.0%) |
| 4-Person Households | 10 (4.6%) | 0 (0.0%) |
| 5-Person Households | 9 (4.2%) | 0 (0.0%) |
| 6-Person Households | 5 (2.3%) | 0 (0.0%) |
| 7+ Person Households | 0 (0.0%) | 0 (0.0%) |
| Total | 151 (70.2%) | 64 (29.8%) |
Female Fertility in Lowell
Fertility by Age in Lowell
Average fertility rate in Lowell is 57.0 births per 1,000 women. Women in the age bracket of 20 to 34 years have the highest fertility rate with 100.0 births per 1,000 women. Women in the age bracket of 20 to 34 years acount for 100.0% of all women with births.
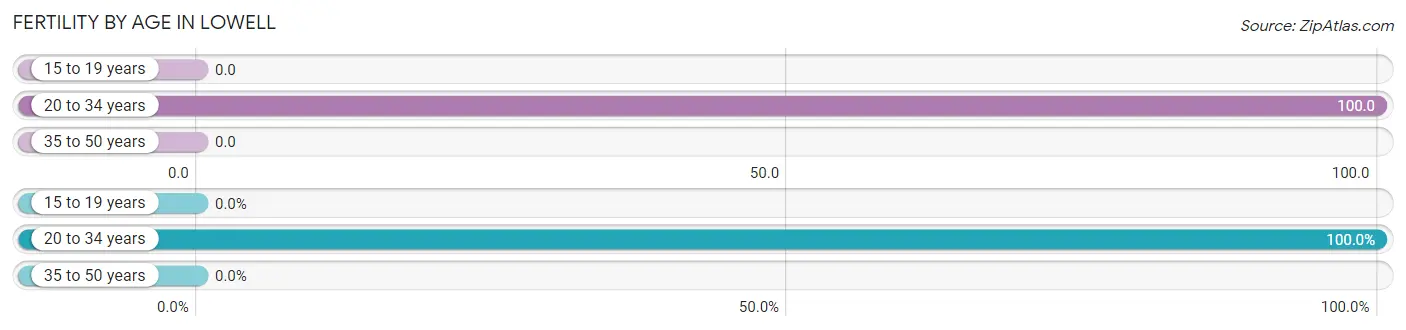
| Age Bracket | Women with Births | Births / 1,000 Women |
| 15 to 19 years | 0 (0.0%) | 0.0 |
| 20 to 34 years | 7 (100.0%) | 100.0 |
| 35 to 50 years | 0 (0.0%) | 0.0 |
| Total | 7 (100.0%) | 57.0 |
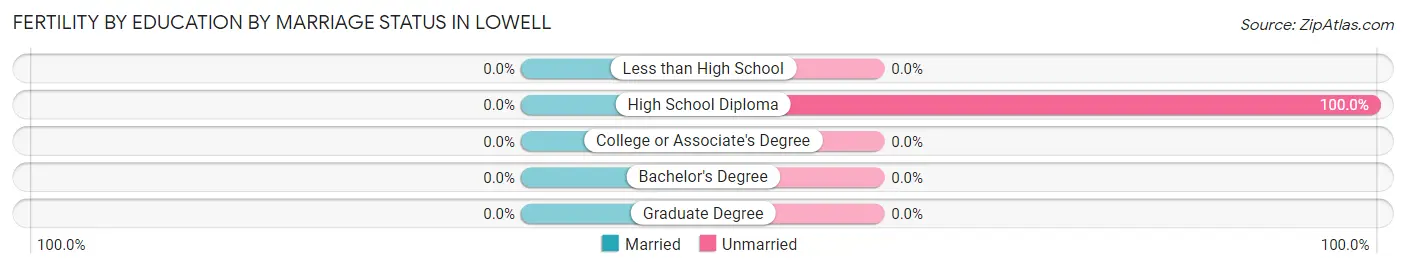
Fertility by Age by Marriage Status in Lowell
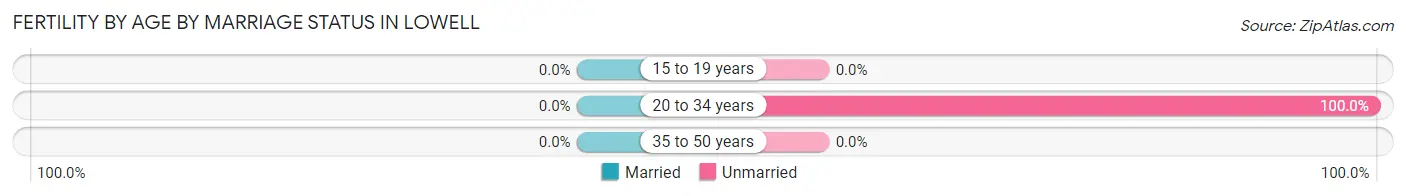
| Age Bracket | Married | Unmarried |
| 15 to 19 years | 0 (0.0%) | 0 (0.0%) |
| 20 to 34 years | 0 (0.0%) | 7 (100.0%) |
| 35 to 50 years | 0 (0.0%) | 0 (0.0%) |
| Total | 0 (0.0%) | 7 (100.0%) |
Fertility by Education in Lowell
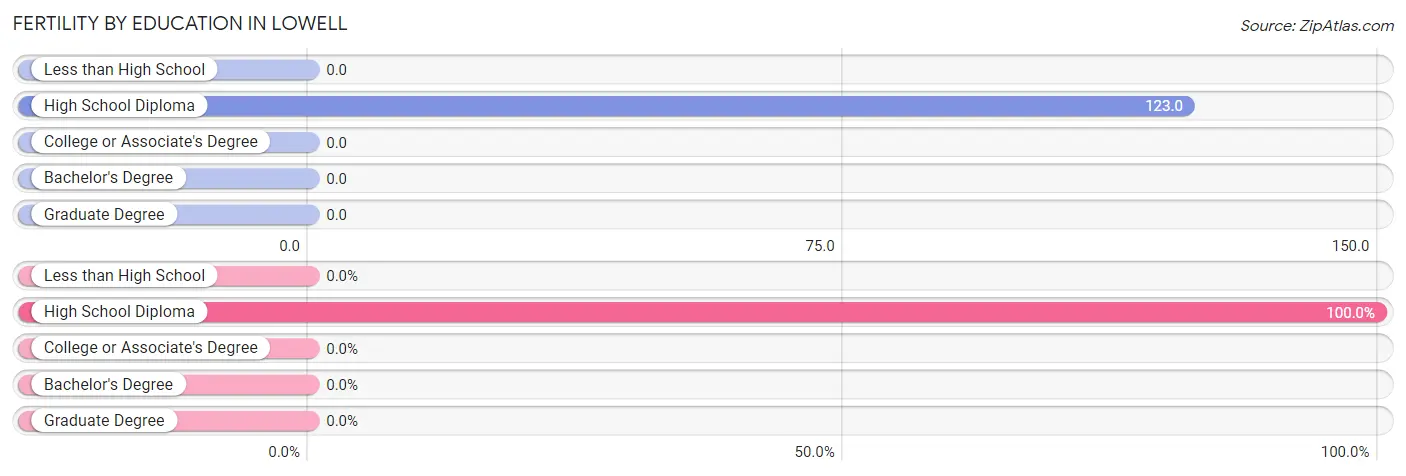
| Educational Attainment | Women with Births | Births / 1,000 Women |
| Less than High School | 0 (0.0%) | 0.0 |
| High School Diploma | 7 (100.0%) | 123.0 |
| College or Associate's Degree | 0 (0.0%) | 0.0 |
| Bachelor's Degree | 0 (0.0%) | 0.0 |
| Graduate Degree | 0 (0.0%) | 0.0 |
| Total | 7 (100.0%) | 57.0 |
Fertility by Education by Marriage Status in Lowell
| Educational Attainment | Married | Unmarried |
| Less than High School | 0 (0.0%) | 0 (0.0%) |
| High School Diploma | 0 (0.0%) | 7 (100.0%) |
| College or Associate's Degree | 0 (0.0%) | 0 (0.0%) |
| Bachelor's Degree | 0 (0.0%) | 0 (0.0%) |
| Graduate Degree | 0 (0.0%) | 0 (0.0%) |
| Total | 0 (0.0%) | 7 (100.0%) |
Employment Characteristics in Lowell
Employment by Class of Employer in Lowell
Among the 214 employed individuals in Lowell, private company employees (134 | 62.6%), not-for-profit organizations (27 | 12.6%), and self-employed (not incorporated) (18 | 8.4%) make up the most common classes of employment.
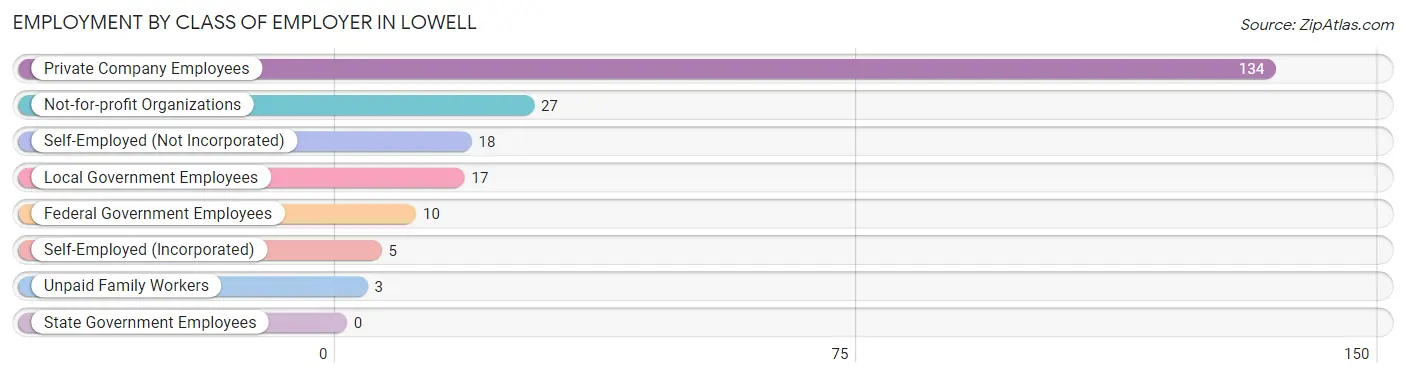
| Employer Class | # Employees | % Employees |
| Private Company Employees | 134 | 62.6% |
| Self-Employed (Incorporated) | 5 | 2.3% |
| Self-Employed (Not Incorporated) | 18 | 8.4% |
| Not-for-profit Organizations | 27 | 12.6% |
| Local Government Employees | 17 | 7.9% |
| State Government Employees | 0 | 0.0% |
| Federal Government Employees | 10 | 4.7% |
| Unpaid Family Workers | 3 | 1.4% |
| Total | 214 | 100.0% |
Employment Status by Age in Lowell
According to the labor force statistics for Lowell, out of the total population over 16 years of age (403), 57.1% or 230 individuals are in the labor force, with 7.0% or 16 of them unemployed. The age group with the highest labor force participation rate is 25 to 29 years, with 100.0% or 43 individuals in the labor force. Within the labor force, the 25 to 29 years age range has the highest percentage of unemployed individuals, with 25.6% or 11 of them being unemployed.
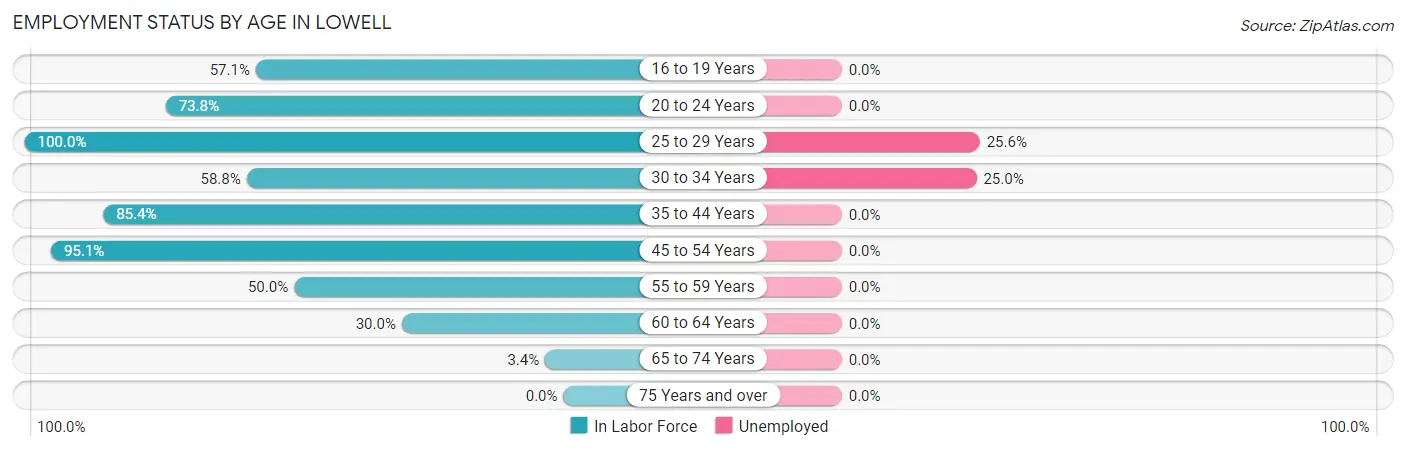
| Age Bracket | In Labor Force | Unemployed |
| 16 to 19 Years | 8 (57.1%) | 0 (0.0%) |
| 20 to 24 Years | 31 (73.8%) | 0 (0.0%) |
| 25 to 29 Years | 43 (100.0%) | 11 (25.6%) |
| 30 to 34 Years | 20 (58.8%) | 5 (25.0%) |
| 35 to 44 Years | 76 (85.4%) | 0 (0.0%) |
| 45 to 54 Years | 39 (95.1%) | 0 (0.0%) |
| 55 to 59 Years | 3 (50.0%) | 0 (0.0%) |
| 60 to 64 Years | 9 (30.0%) | 0 (0.0%) |
| 65 to 74 Years | 1 (3.4%) | 0 (0.0%) |
| 75 Years and over | 0 (0.0%) | 0 (0.0%) |
| Total | 230 (57.1%) | 16 (7.0%) |
Employment Status by Educational Attainment in Lowell
According to labor force statistics for Lowell, 78.2% of individuals (190) out of the total population between 25 and 64 years of age (243) are in the labor force, with 8.4% or 16 of them being unemployed. The group with the highest labor force participation rate are those with the educational attainment of less than high school, with 100.0% or 6 individuals in the labor force. Within the labor force, individuals with high school diploma education have the highest percentage of unemployment, with 21.1% or 16 of them being unemployed.
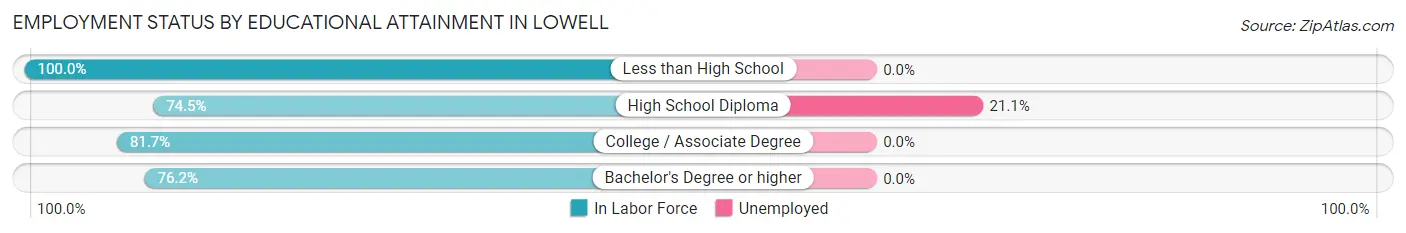
| Educational Attainment | In Labor Force | Unemployed |
| Less than High School | 6 (100.0%) | 0 (0.0%) |
| High School Diploma | 76 (74.5%) | 22 (21.1%) |
| College / Associate Degree | 76 (81.7%) | 0 (0.0%) |
| Bachelor's Degree or higher | 32 (76.2%) | 0 (0.0%) |
| Total | 190 (78.2%) | 20 (8.4%) |
Employment Occupations by Sex in Lowell
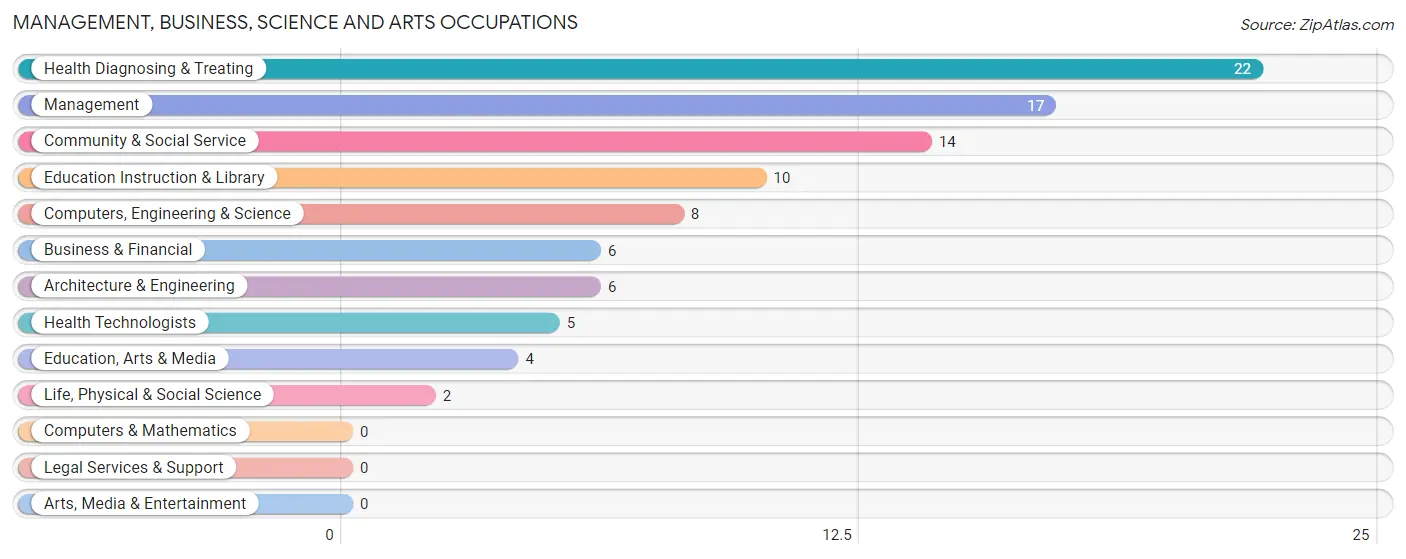
Management, Business, Science and Arts Occupations
The most common Management, Business, Science and Arts occupations in Lowell are Health Diagnosing & Treating (22 | 10.3%), Management (17 | 7.9%), Community & Social Service (14 | 6.5%), Education Instruction & Library (10 | 4.7%), and Computers, Engineering & Science (8 | 3.7%).
Management, Business, Science and Arts Occupations by Sex
Within the Management, Business, Science and Arts occupations in Lowell, the most male-oriented occupations are Computers, Engineering & Science (100.0%), Architecture & Engineering (100.0%), and Life, Physical & Social Science (100.0%), while the most female-oriented occupations are Business & Financial (100.0%), Education, Arts & Media (100.0%), and Community & Social Service (78.6%).
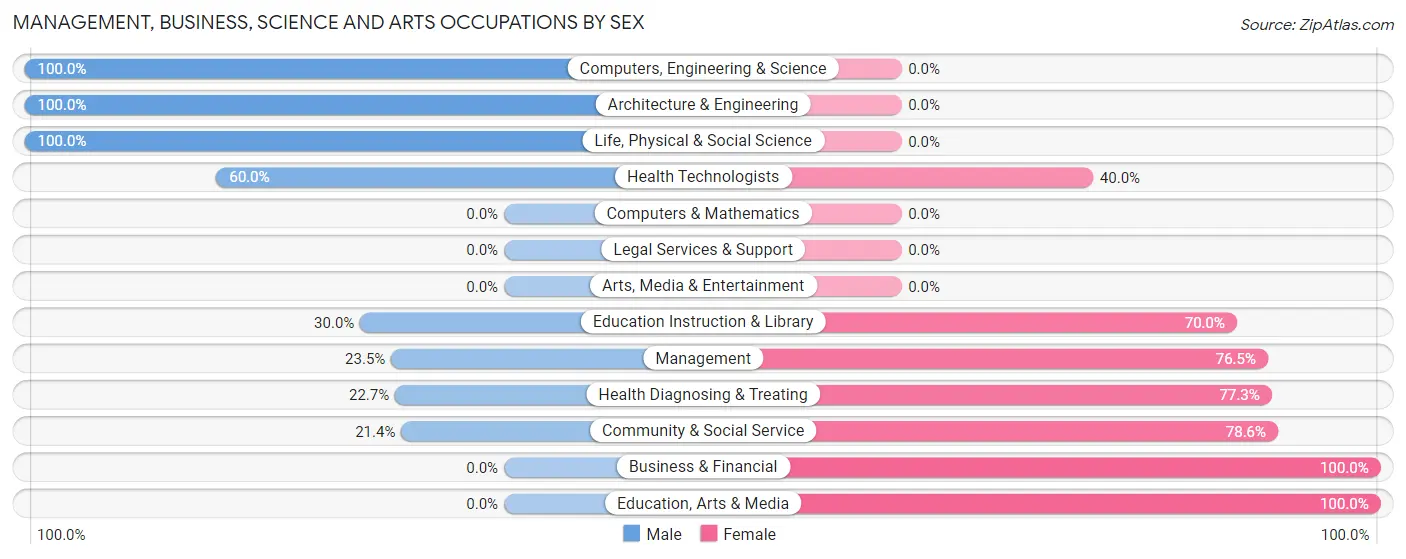
| Occupation | Male | Female |
| Management | 4 (23.5%) | 13 (76.5%) |
| Business & Financial | 0 (0.0%) | 6 (100.0%) |
| Computers, Engineering & Science | 8 (100.0%) | 0 (0.0%) |
| Computers & Mathematics | 0 (0.0%) | 0 (0.0%) |
| Architecture & Engineering | 6 (100.0%) | 0 (0.0%) |
| Life, Physical & Social Science | 2 (100.0%) | 0 (0.0%) |
| Community & Social Service | 3 (21.4%) | 11 (78.6%) |
| Education, Arts & Media | 0 (0.0%) | 4 (100.0%) |
| Legal Services & Support | 0 (0.0%) | 0 (0.0%) |
| Education Instruction & Library | 3 (30.0%) | 7 (70.0%) |
| Arts, Media & Entertainment | 0 (0.0%) | 0 (0.0%) |
| Health Diagnosing & Treating | 5 (22.7%) | 17 (77.3%) |
| Health Technologists | 3 (60.0%) | 2 (40.0%) |
| Total (Category) | 20 (29.8%) | 47 (70.2%) |
| Total (Overall) | 98 (45.8%) | 116 (54.2%) |
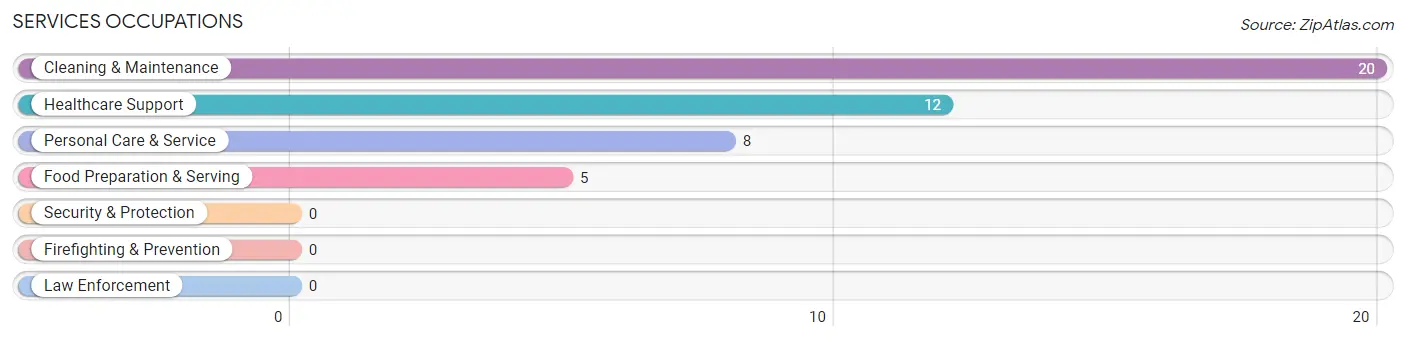
Services Occupations
The most common Services occupations in Lowell are Cleaning & Maintenance (20 | 9.3%), Healthcare Support (12 | 5.6%), Personal Care & Service (8 | 3.7%), and Food Preparation & Serving (5 | 2.3%).
Services Occupations by Sex
Within the Services occupations in Lowell, the most male-oriented occupations are Food Preparation & Serving (100.0%), and Cleaning & Maintenance (20.0%), while the most female-oriented occupations are Healthcare Support (100.0%), Personal Care & Service (100.0%), and Cleaning & Maintenance (80.0%).
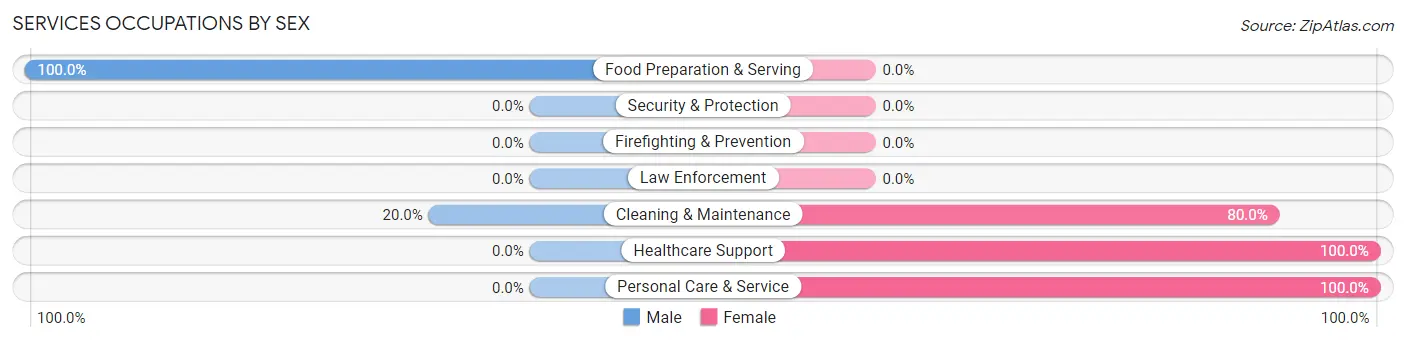
| Occupation | Male | Female |
| Healthcare Support | 0 (0.0%) | 12 (100.0%) |
| Security & Protection | 0 (0.0%) | 0 (0.0%) |
| Firefighting & Prevention | 0 (0.0%) | 0 (0.0%) |
| Law Enforcement | 0 (0.0%) | 0 (0.0%) |
| Food Preparation & Serving | 5 (100.0%) | 0 (0.0%) |
| Cleaning & Maintenance | 4 (20.0%) | 16 (80.0%) |
| Personal Care & Service | 0 (0.0%) | 8 (100.0%) |
| Total (Category) | 9 (20.0%) | 36 (80.0%) |
| Total (Overall) | 98 (45.8%) | 116 (54.2%) |
Sales and Office Occupations
The most common Sales and Office occupations in Lowell are Office & Administration (29 | 13.6%), and Sales & Related (12 | 5.6%).

Sales and Office Occupations by Sex
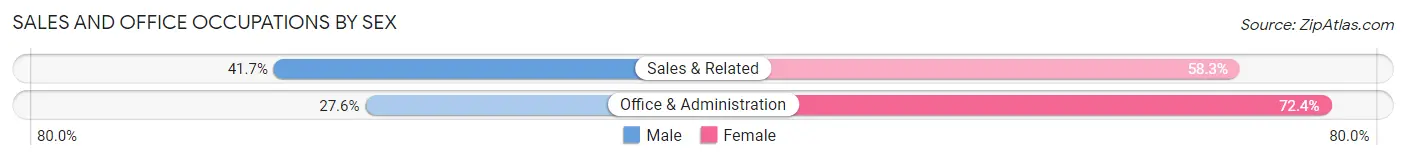
| Occupation | Male | Female |
| Sales & Related | 5 (41.7%) | 7 (58.3%) |
| Office & Administration | 8 (27.6%) | 21 (72.4%) |
| Total (Category) | 13 (31.7%) | 28 (68.3%) |
| Total (Overall) | 98 (45.8%) | 116 (54.2%) |
Natural Resources, Construction and Maintenance Occupations
The most common Natural Resources, Construction and Maintenance occupations in Lowell are Construction & Extraction (18 | 8.4%), and Installation, Maintenance & Repair (6 | 2.8%).
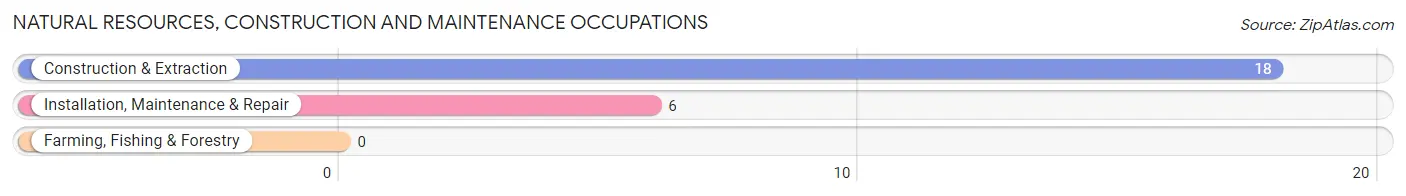
Natural Resources, Construction and Maintenance Occupations by Sex
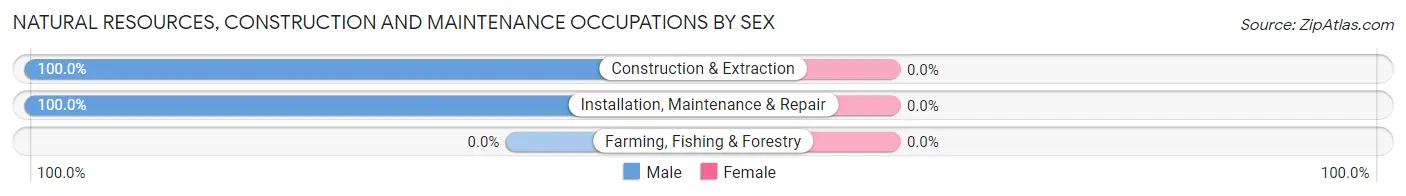
| Occupation | Male | Female |
| Farming, Fishing & Forestry | 0 (0.0%) | 0 (0.0%) |
| Construction & Extraction | 18 (100.0%) | 0 (0.0%) |
| Installation, Maintenance & Repair | 6 (100.0%) | 0 (0.0%) |
| Total (Category) | 24 (100.0%) | 0 (0.0%) |
| Total (Overall) | 98 (45.8%) | 116 (54.2%) |
Production, Transportation and Moving Occupations
The most common Production, Transportation and Moving occupations in Lowell are Production (18 | 8.4%), Transportation (14 | 6.5%), and Material Moving (5 | 2.3%).
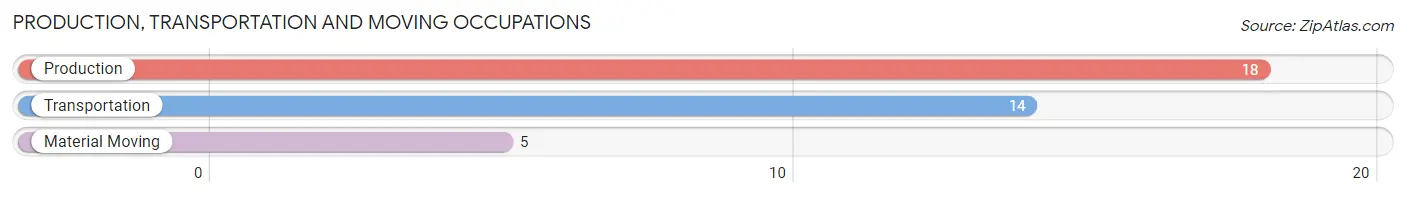
Production, Transportation and Moving Occupations by Sex
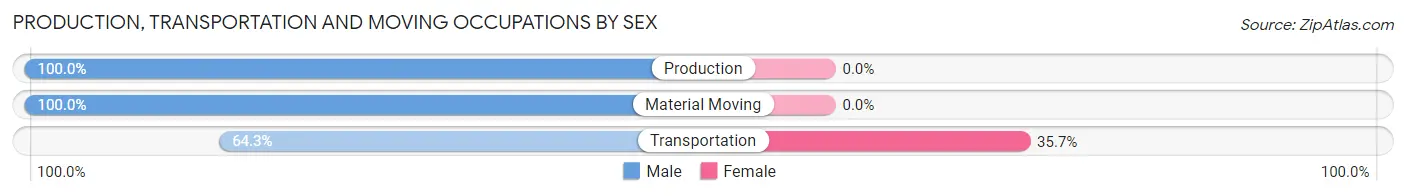
| Occupation | Male | Female |
| Production | 18 (100.0%) | 0 (0.0%) |
| Transportation | 9 (64.3%) | 5 (35.7%) |
| Material Moving | 5 (100.0%) | 0 (0.0%) |
| Total (Category) | 32 (86.5%) | 5 (13.5%) |
| Total (Overall) | 98 (45.8%) | 116 (54.2%) |
Employment Industries by Sex in Lowell
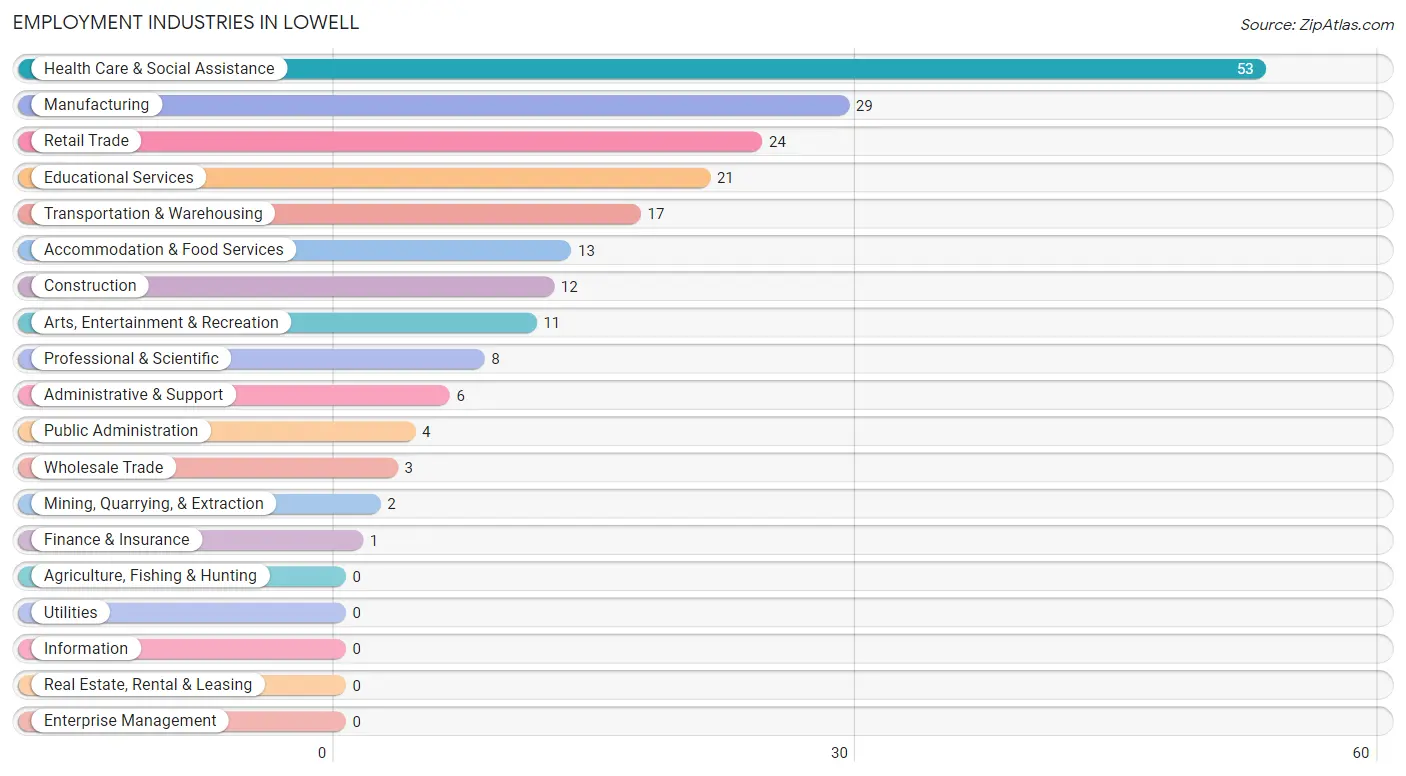
Employment Industries in Lowell
The major employment industries in Lowell include Health Care & Social Assistance (53 | 24.8%), Manufacturing (29 | 13.6%), Retail Trade (24 | 11.2%), Educational Services (21 | 9.8%), and Transportation & Warehousing (17 | 7.9%).
Employment Industries by Sex in Lowell
The Lowell industries that see more men than women are Mining, Quarrying, & Extraction (100.0%), Construction (100.0%), and Manufacturing (100.0%), whereas the industries that tend to have a higher number of women are Wholesale Trade (100.0%), Finance & Insurance (100.0%), and Arts, Entertainment & Recreation (100.0%).
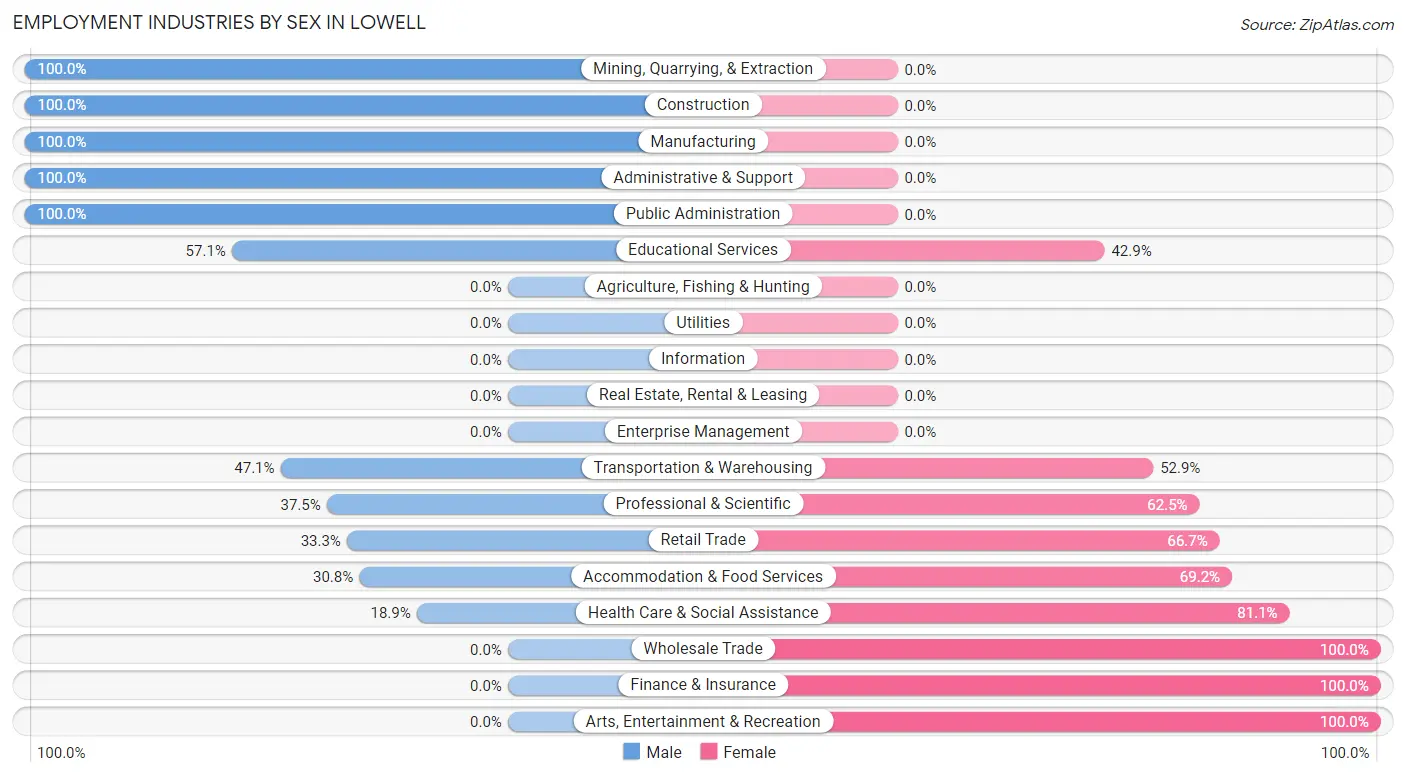
| Industry | Male | Female |
| Agriculture, Fishing & Hunting | 0 (0.0%) | 0 (0.0%) |
| Mining, Quarrying, & Extraction | 2 (100.0%) | 0 (0.0%) |
| Construction | 12 (100.0%) | 0 (0.0%) |
| Manufacturing | 29 (100.0%) | 0 (0.0%) |
| Wholesale Trade | 0 (0.0%) | 3 (100.0%) |
| Retail Trade | 8 (33.3%) | 16 (66.7%) |
| Transportation & Warehousing | 8 (47.1%) | 9 (52.9%) |
| Utilities | 0 (0.0%) | 0 (0.0%) |
| Information | 0 (0.0%) | 0 (0.0%) |
| Finance & Insurance | 0 (0.0%) | 1 (100.0%) |
| Real Estate, Rental & Leasing | 0 (0.0%) | 0 (0.0%) |
| Professional & Scientific | 3 (37.5%) | 5 (62.5%) |
| Enterprise Management | 0 (0.0%) | 0 (0.0%) |
| Administrative & Support | 6 (100.0%) | 0 (0.0%) |
| Educational Services | 12 (57.1%) | 9 (42.9%) |
| Health Care & Social Assistance | 10 (18.9%) | 43 (81.1%) |
| Arts, Entertainment & Recreation | 0 (0.0%) | 11 (100.0%) |
| Accommodation & Food Services | 4 (30.8%) | 9 (69.2%) |
| Public Administration | 4 (100.0%) | 0 (0.0%) |
| Total | 98 (45.8%) | 116 (54.2%) |
Education in Lowell
School Enrollment in Lowell
The most common levels of schooling among the 118 students in Lowell are middle school (27 | 22.9%), high school (26 | 22.0%), and elementary school (22 | 18.6%).
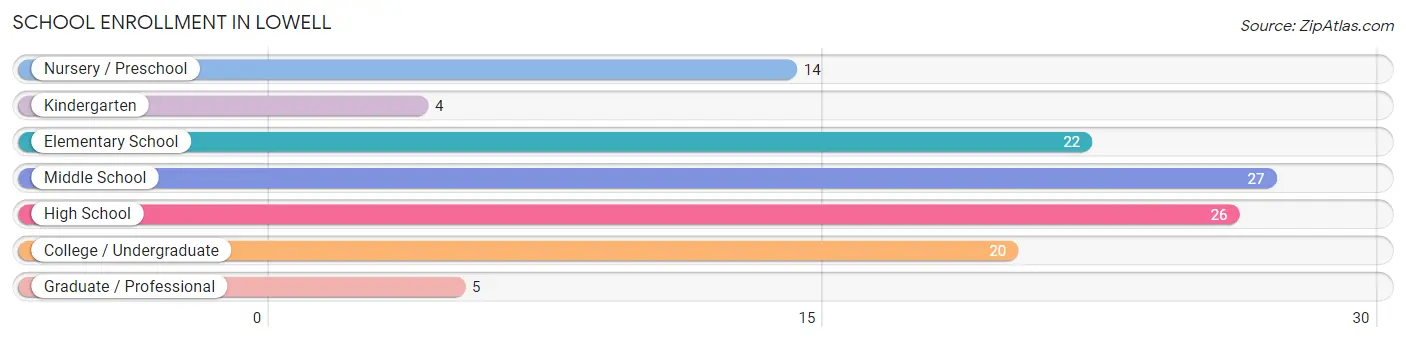
| School Level | # Students | % Students |
| Nursery / Preschool | 14 | 11.9% |
| Kindergarten | 4 | 3.4% |
| Elementary School | 22 | 18.6% |
| Middle School | 27 | 22.9% |
| High School | 26 | 22.0% |
| College / Undergraduate | 20 | 17.0% |
| Graduate / Professional | 5 | 4.2% |
| Total | 118 | 100.0% |
School Enrollment by Age by Funding Source in Lowell
Out of a total of 118 students who are enrolled in schools in Lowell, 13 (11.0%) attend a private institution, while the remaining 105 (89.0%) are enrolled in public schools. The age group of 35 years and over has the highest likelihood of being enrolled in private schools, with 3 (100.0% in the age bracket) enrolled. Conversely, the age group of 3 to 4 year olds has the lowest likelihood of being enrolled in a private school, with 7 (100.0% in the age bracket) attending a public institution.
| Age Bracket | Public School | Private School |
| 3 to 4 Year Olds | 7 (100.0%) | 0 (0.0%) |
| 5 to 9 Year Old | 33 (100.0%) | 0 (0.0%) |
| 10 to 14 Year Olds | 38 (100.0%) | 0 (0.0%) |
| 15 to 17 Year Olds | 5 (100.0%) | 0 (0.0%) |
| 18 to 19 Year Olds | 6 (60.0%) | 4 (40.0%) |
| 20 to 24 Year Olds | 8 (57.1%) | 6 (42.9%) |
| 25 to 34 Year Olds | 8 (100.0%) | 0 (0.0%) |
| 35 Years and over | 0 (0.0%) | 3 (100.0%) |
| Total | 105 (89.0%) | 13 (11.0%) |
Educational Attainment by Field of Study in Lowell
Business (16 | 34.8%), education (10 | 21.7%), science & technology (9 | 19.6%), engineering (4 | 8.7%), and computers & mathematics (2 | 4.3%) are the most common fields of study among 46 individuals in Lowell who have obtained a bachelor's degree or higher.
| Field of Study | # Graduates | % Graduates |
| Computers & Mathematics | 2 | 4.3% |
| Bio, Nature & Agricultural | 2 | 4.3% |
| Physical & Health Sciences | 0 | 0.0% |
| Psychology | 0 | 0.0% |
| Social Sciences | 2 | 4.3% |
| Engineering | 4 | 8.7% |
| Multidisciplinary Studies | 0 | 0.0% |
| Science & Technology | 9 | 19.6% |
| Business | 16 | 34.8% |
| Education | 10 | 21.7% |
| Literature & Languages | 0 | 0.0% |
| Liberal Arts & History | 0 | 0.0% |
| Visual & Performing Arts | 0 | 0.0% |
| Communications | 0 | 0.0% |
| Arts & Humanities | 1 | 2.2% |
| Total | 46 | 100.0% |
Transportation & Commute in Lowell
Vehicle Availability by Sex in Lowell
The most prevalent vehicle ownership categories in Lowell are males with 2 vehicles (43, accounting for 43.9%) and females with 2 vehicles (51, making up 37.1%).
| Vehicles Available | Male | Female |
| No Vehicle | 7 (7.1%) | 5 (4.3%) |
| 1 Vehicle | 22 (22.5%) | 26 (22.4%) |
| 2 Vehicles | 43 (43.9%) | 51 (44.0%) |
| 3 Vehicles | 26 (26.5%) | 32 (27.6%) |
| 4 Vehicles | 0 (0.0%) | 2 (1.7%) |
| 5 or more Vehicles | 0 (0.0%) | 0 (0.0%) |
| Total | 98 (100.0%) | 116 (100.0%) |
Commute Time in Lowell
The most frequently occuring commute durations in Lowell are 20 to 24 minutes (67 commuters, 31.5%), 15 to 19 minutes (34 commuters, 16.0%), and 5 to 9 minutes (26 commuters, 12.2%).
| Commute Time | # Commuters | % Commuters |
| Less than 5 Minutes | 9 | 4.2% |
| 5 to 9 Minutes | 26 | 12.2% |
| 10 to 14 Minutes | 5 | 2.4% |
| 15 to 19 Minutes | 34 | 16.0% |
| 20 to 24 Minutes | 67 | 31.5% |
| 25 to 29 Minutes | 21 | 9.9% |
| 30 to 34 Minutes | 15 | 7.0% |
| 35 to 39 Minutes | 4 | 1.9% |
| 40 to 44 Minutes | 14 | 6.6% |
| 45 to 59 Minutes | 6 | 2.8% |
| 60 to 89 Minutes | 4 | 1.9% |
| 90 or more Minutes | 8 | 3.8% |
Commute Time by Sex in Lowell
The most common commute times in Lowell are 20 to 24 minutes (22 commuters, 22.7%) for males and 20 to 24 minutes (45 commuters, 38.8%) for females.
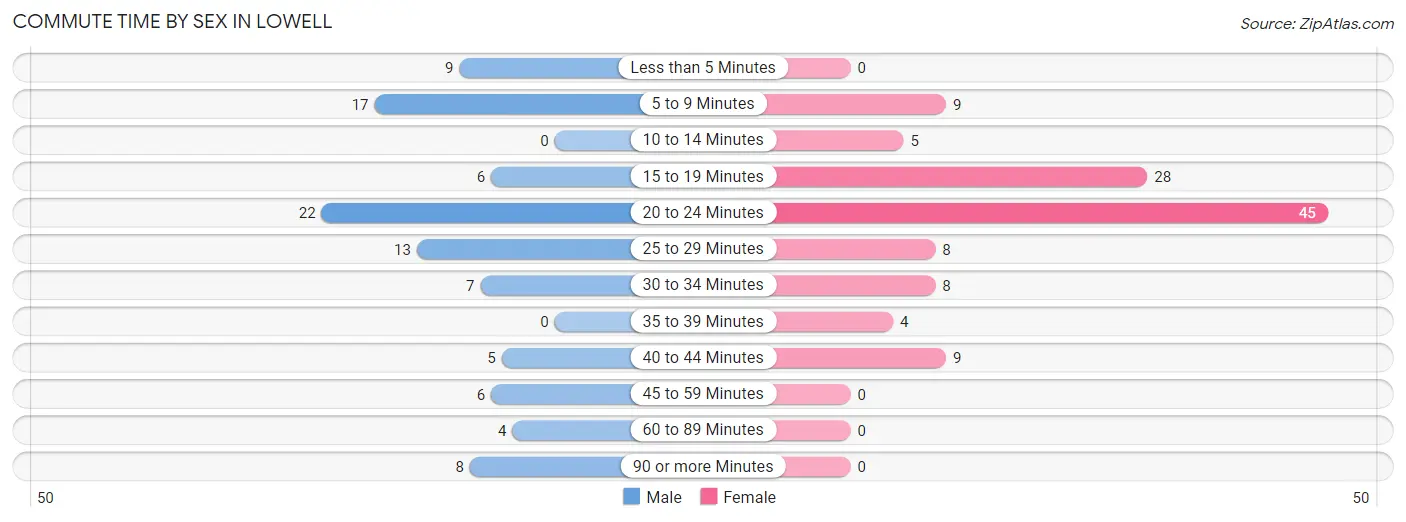
| Commute Time | Male | Female |
| Less than 5 Minutes | 9 (9.3%) | 0 (0.0%) |
| 5 to 9 Minutes | 17 (17.5%) | 9 (7.8%) |
| 10 to 14 Minutes | 0 (0.0%) | 5 (4.3%) |
| 15 to 19 Minutes | 6 (6.2%) | 28 (24.1%) |
| 20 to 24 Minutes | 22 (22.7%) | 45 (38.8%) |
| 25 to 29 Minutes | 13 (13.4%) | 8 (6.9%) |
| 30 to 34 Minutes | 7 (7.2%) | 8 (6.9%) |
| 35 to 39 Minutes | 0 (0.0%) | 4 (3.5%) |
| 40 to 44 Minutes | 5 (5.1%) | 9 (7.8%) |
| 45 to 59 Minutes | 6 (6.2%) | 0 (0.0%) |
| 60 to 89 Minutes | 4 (4.1%) | 0 (0.0%) |
| 90 or more Minutes | 8 (8.3%) | 0 (0.0%) |
Time of Departure to Work by Sex in Lowell
The most frequent times of departure to work in Lowell are 7:00 AM to 7:29 AM (23, 23.7%) for males and 8:00 AM to 8:29 AM (26, 22.4%) for females.
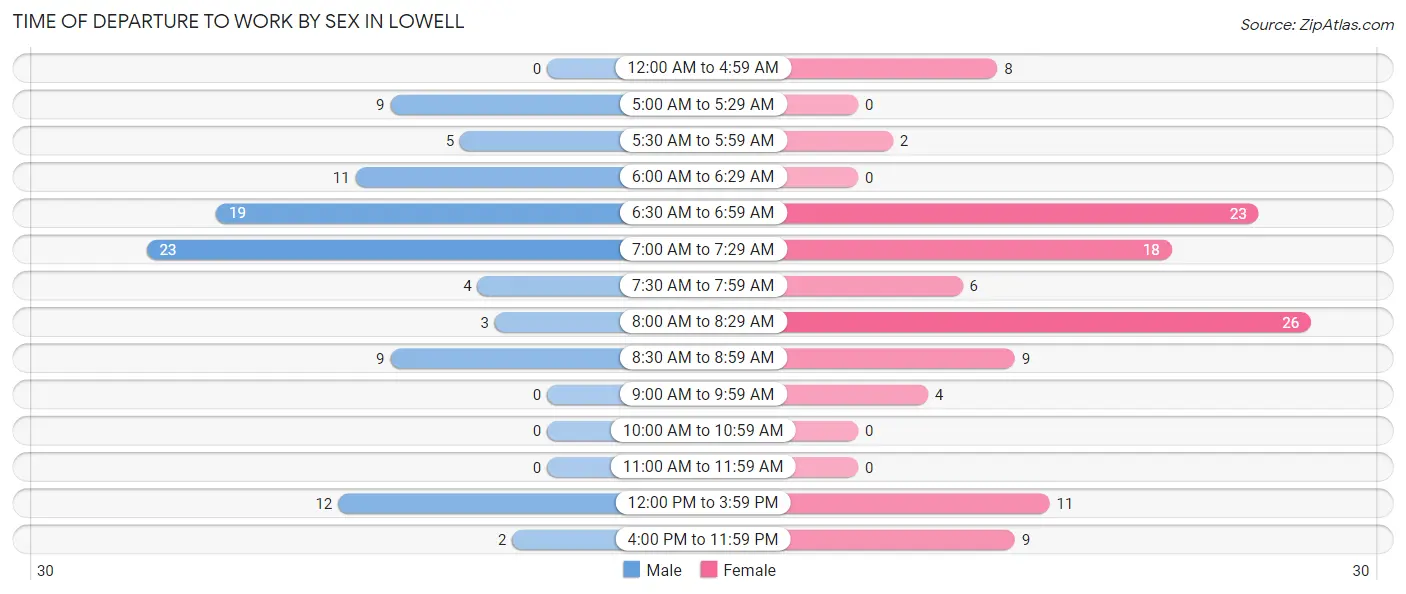
| Time of Departure | Male | Female |
| 12:00 AM to 4:59 AM | 0 (0.0%) | 8 (6.9%) |
| 5:00 AM to 5:29 AM | 9 (9.3%) | 0 (0.0%) |
| 5:30 AM to 5:59 AM | 5 (5.1%) | 2 (1.7%) |
| 6:00 AM to 6:29 AM | 11 (11.3%) | 0 (0.0%) |
| 6:30 AM to 6:59 AM | 19 (19.6%) | 23 (19.8%) |
| 7:00 AM to 7:29 AM | 23 (23.7%) | 18 (15.5%) |
| 7:30 AM to 7:59 AM | 4 (4.1%) | 6 (5.2%) |
| 8:00 AM to 8:29 AM | 3 (3.1%) | 26 (22.4%) |
| 8:30 AM to 8:59 AM | 9 (9.3%) | 9 (7.8%) |
| 9:00 AM to 9:59 AM | 0 (0.0%) | 4 (3.5%) |
| 10:00 AM to 10:59 AM | 0 (0.0%) | 0 (0.0%) |
| 11:00 AM to 11:59 AM | 0 (0.0%) | 0 (0.0%) |
| 12:00 PM to 3:59 PM | 12 (12.4%) | 11 (9.5%) |
| 4:00 PM to 11:59 PM | 2 (2.1%) | 9 (7.8%) |
| Total | 97 (100.0%) | 116 (100.0%) |
Housing Occupancy in Lowell
Occupancy by Ownership in Lowell
Of the total 215 dwellings in Lowell, owner-occupied units account for 162 (75.3%), while renter-occupied units make up 53 (24.6%).
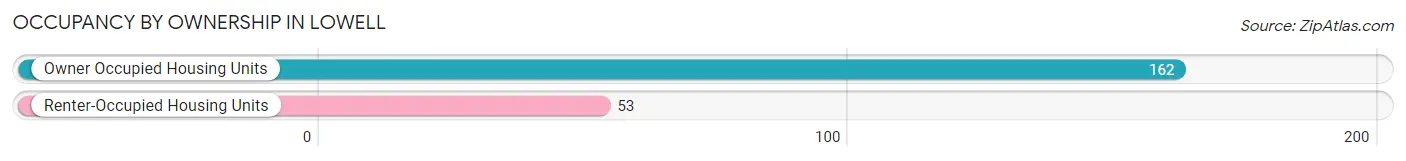
| Occupancy | # Housing Units | % Housing Units |
| Owner Occupied Housing Units | 162 | 75.3% |
| Renter-Occupied Housing Units | 53 | 24.6% |
| Total Occupied Housing Units | 215 | 100.0% |
Occupancy by Household Size in Lowell
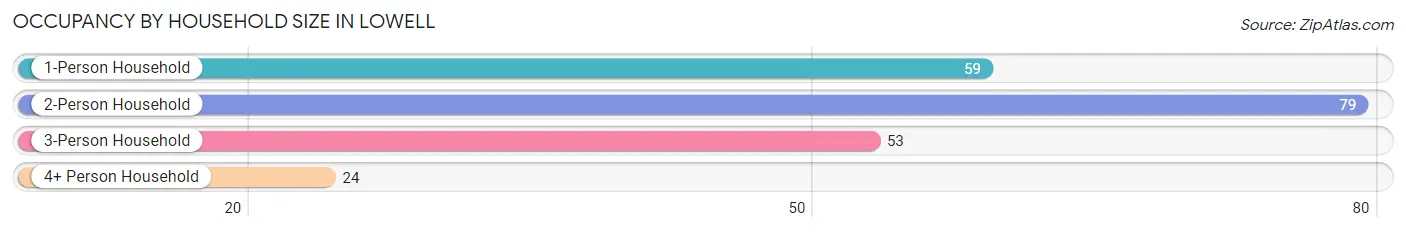
| Household Size | # Housing Units | % Housing Units |
| 1-Person Household | 59 | 27.4% |
| 2-Person Household | 79 | 36.7% |
| 3-Person Household | 53 | 24.6% |
| 4+ Person Household | 24 | 11.2% |
| Total Housing Units | 215 | 100.0% |
Occupancy by Ownership by Household Size in Lowell
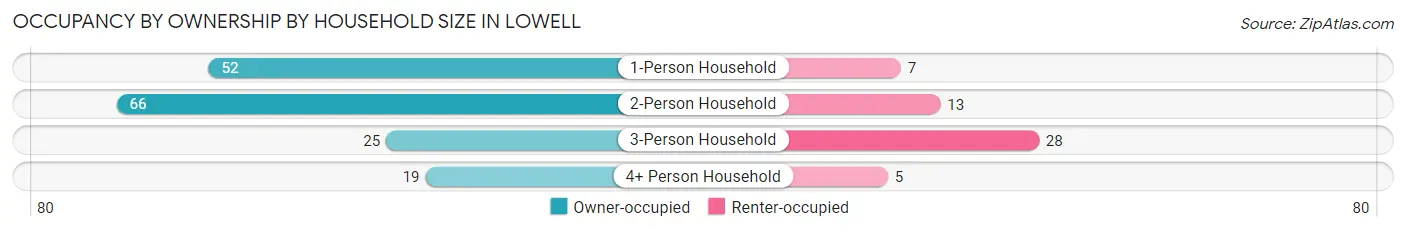
| Household Size | Owner-occupied | Renter-occupied |
| 1-Person Household | 52 (88.1%) | 7 (11.9%) |
| 2-Person Household | 66 (83.5%) | 13 (16.5%) |
| 3-Person Household | 25 (47.2%) | 28 (52.8%) |
| 4+ Person Household | 19 (79.2%) | 5 (20.8%) |
| Total Housing Units | 162 (75.3%) | 53 (24.6%) |
Occupancy by Educational Attainment in Lowell
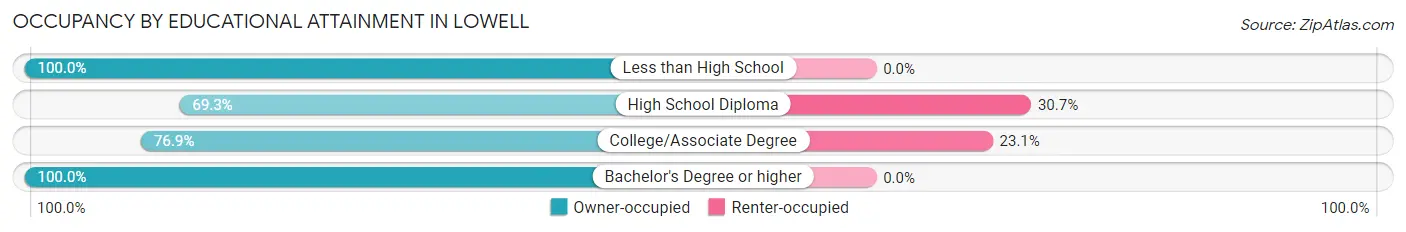
| Household Size | Owner-occupied | Renter-occupied |
| Less than High School | 5 (100.0%) | 0 (0.0%) |
| High School Diploma | 79 (69.3%) | 35 (30.7%) |
| College/Associate Degree | 60 (76.9%) | 18 (23.1%) |
| Bachelor's Degree or higher | 18 (100.0%) | 0 (0.0%) |
Occupancy by Age of Householder in Lowell
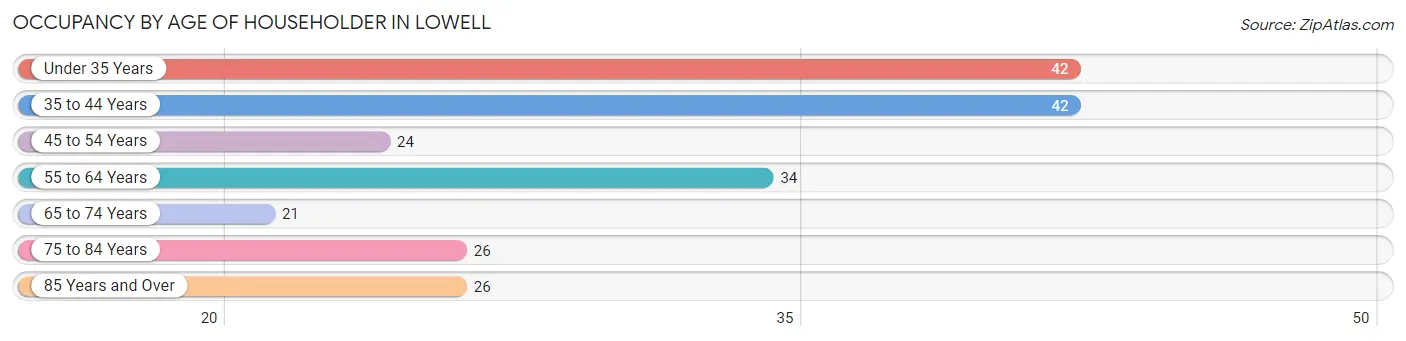
| Age Bracket | # Households | % Households |
| Under 35 Years | 42 | 19.5% |
| 35 to 44 Years | 42 | 19.5% |
| 45 to 54 Years | 24 | 11.2% |
| 55 to 64 Years | 34 | 15.8% |
| 65 to 74 Years | 21 | 9.8% |
| 75 to 84 Years | 26 | 12.1% |
| 85 Years and Over | 26 | 12.1% |
| Total | 215 | 100.0% |
Housing Finances in Lowell
Median Income by Occupancy in Lowell
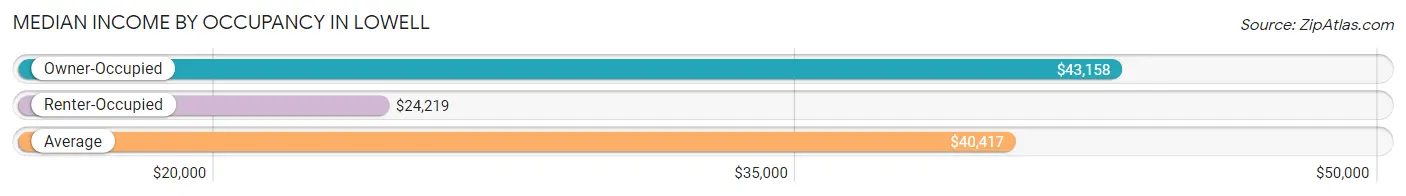
| Occupancy Type | # Households | Median Income |
| Owner-Occupied | 162 (75.3%) | $43,158 |
| Renter-Occupied | 53 (24.6%) | $24,219 |
| Average | 215 (100.0%) | $40,417 |
Occupancy by Householder Income Bracket in Lowell
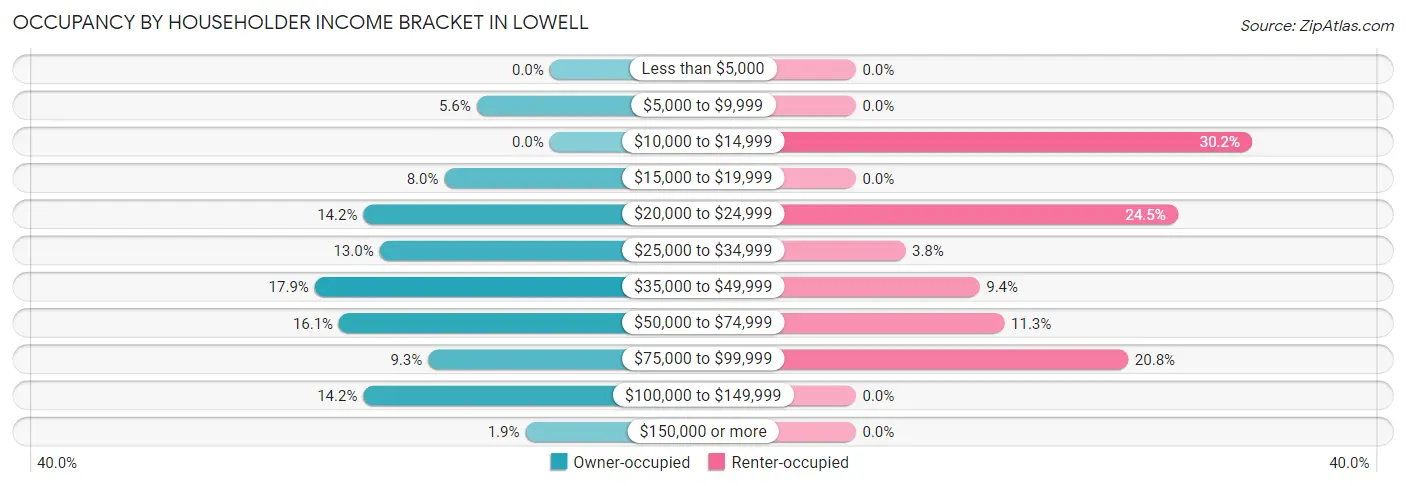
| Income Bracket | Owner-occupied | Renter-occupied |
| Less than $5,000 | 0 (0.0%) | 0 (0.0%) |
| $5,000 to $9,999 | 9 (5.6%) | 0 (0.0%) |
| $10,000 to $14,999 | 0 (0.0%) | 16 (30.2%) |
| $15,000 to $19,999 | 13 (8.0%) | 0 (0.0%) |
| $20,000 to $24,999 | 23 (14.2%) | 13 (24.5%) |
| $25,000 to $34,999 | 21 (13.0%) | 2 (3.8%) |
| $35,000 to $49,999 | 29 (17.9%) | 5 (9.4%) |
| $50,000 to $74,999 | 26 (16.1%) | 6 (11.3%) |
| $75,000 to $99,999 | 15 (9.3%) | 11 (20.7%) |
| $100,000 to $149,999 | 23 (14.2%) | 0 (0.0%) |
| $150,000 or more | 3 (1.8%) | 0 (0.0%) |
| Total | 162 (100.0%) | 53 (100.0%) |
Monthly Housing Cost Tiers in Lowell
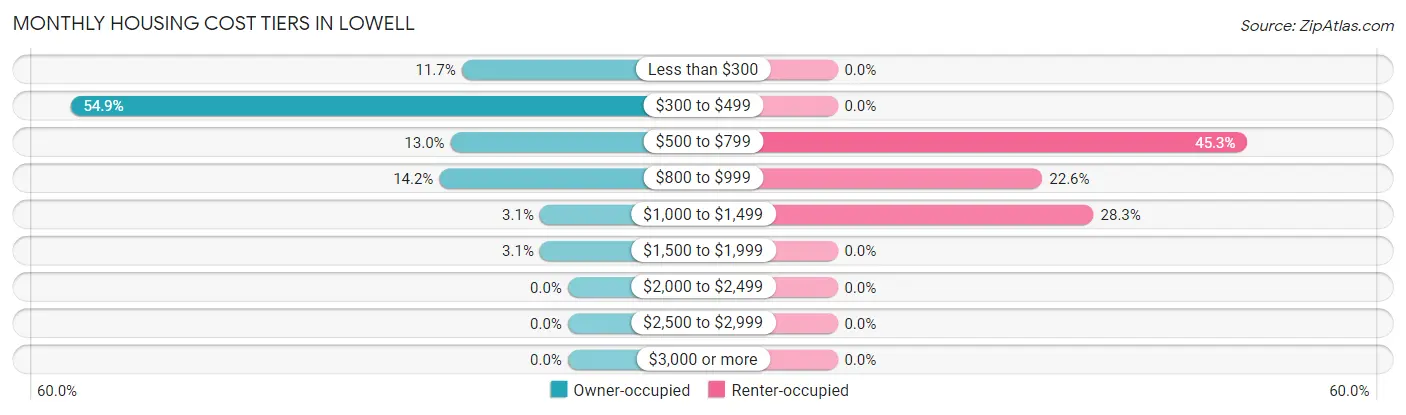
| Monthly Cost | Owner-occupied | Renter-occupied |
| Less than $300 | 19 (11.7%) | 0 (0.0%) |
| $300 to $499 | 89 (54.9%) | 0 (0.0%) |
| $500 to $799 | 21 (13.0%) | 24 (45.3%) |
| $800 to $999 | 23 (14.2%) | 12 (22.6%) |
| $1,000 to $1,499 | 5 (3.1%) | 15 (28.3%) |
| $1,500 to $1,999 | 5 (3.1%) | 0 (0.0%) |
| $2,000 to $2,499 | 0 (0.0%) | 0 (0.0%) |
| $2,500 to $2,999 | 0 (0.0%) | 0 (0.0%) |
| $3,000 or more | 0 (0.0%) | 0 (0.0%) |
| Total | 162 (100.0%) | 53 (100.0%) |
Physical Housing Characteristics in Lowell
Housing Structures in Lowell
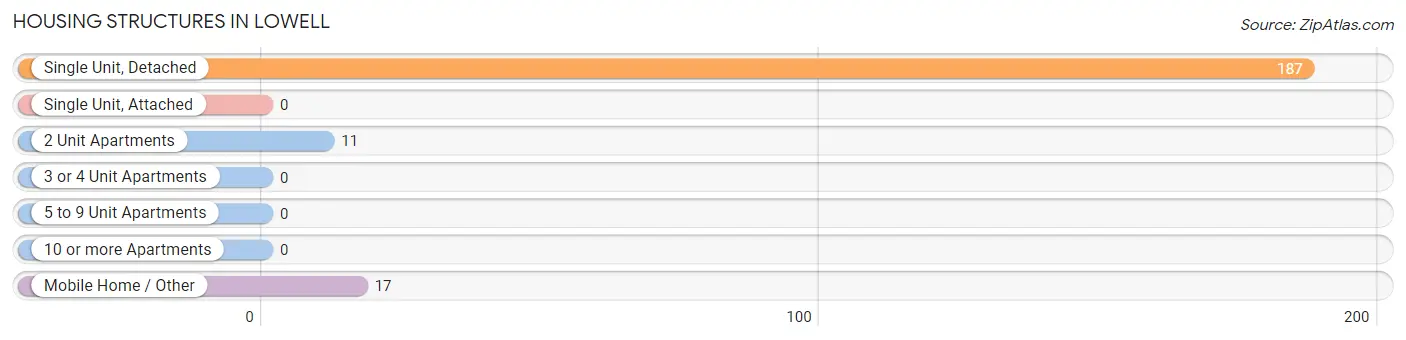
| Structure Type | # Housing Units | % Housing Units |
| Single Unit, Detached | 187 | 87.0% |
| Single Unit, Attached | 0 | 0.0% |
| 2 Unit Apartments | 11 | 5.1% |
| 3 or 4 Unit Apartments | 0 | 0.0% |
| 5 to 9 Unit Apartments | 0 | 0.0% |
| 10 or more Apartments | 0 | 0.0% |
| Mobile Home / Other | 17 | 7.9% |
| Total | 215 | 100.0% |
Housing Structures by Occupancy in Lowell
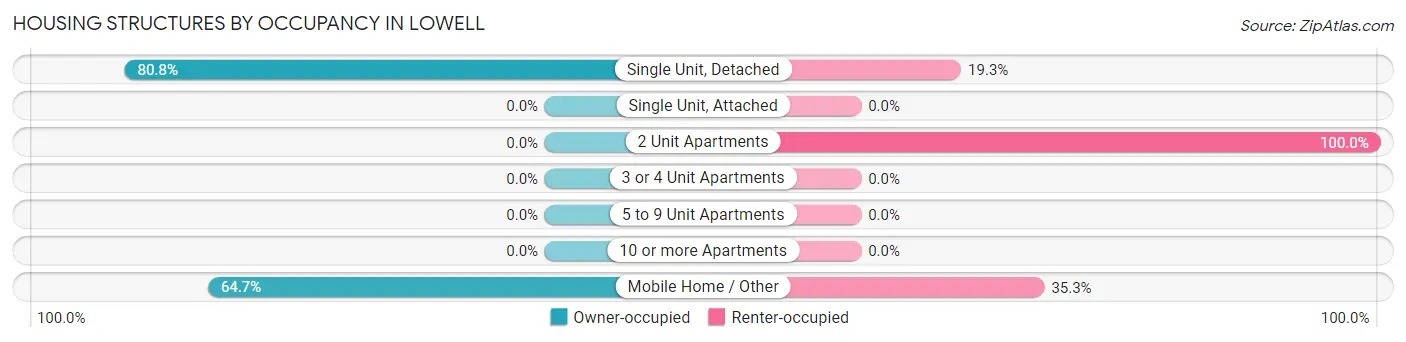
| Structure Type | Owner-occupied | Renter-occupied |
| Single Unit, Detached | 151 (80.7%) | 36 (19.3%) |
| Single Unit, Attached | 0 (0.0%) | 0 (0.0%) |
| 2 Unit Apartments | 0 (0.0%) | 11 (100.0%) |
| 3 or 4 Unit Apartments | 0 (0.0%) | 0 (0.0%) |
| 5 to 9 Unit Apartments | 0 (0.0%) | 0 (0.0%) |
| 10 or more Apartments | 0 (0.0%) | 0 (0.0%) |
| Mobile Home / Other | 11 (64.7%) | 6 (35.3%) |
| Total | 162 (75.3%) | 53 (24.6%) |
Housing Structures by Number of Rooms in Lowell
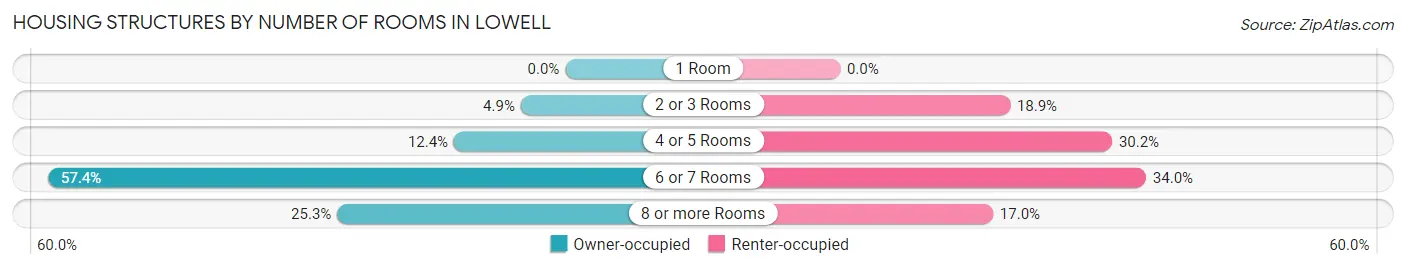
| Number of Rooms | Owner-occupied | Renter-occupied |
| 1 Room | 0 (0.0%) | 0 (0.0%) |
| 2 or 3 Rooms | 8 (4.9%) | 10 (18.9%) |
| 4 or 5 Rooms | 20 (12.3%) | 16 (30.2%) |
| 6 or 7 Rooms | 93 (57.4%) | 18 (34.0%) |
| 8 or more Rooms | 41 (25.3%) | 9 (17.0%) |
| Total | 162 (100.0%) | 53 (100.0%) |
Housing Structure by Heating Type in Lowell
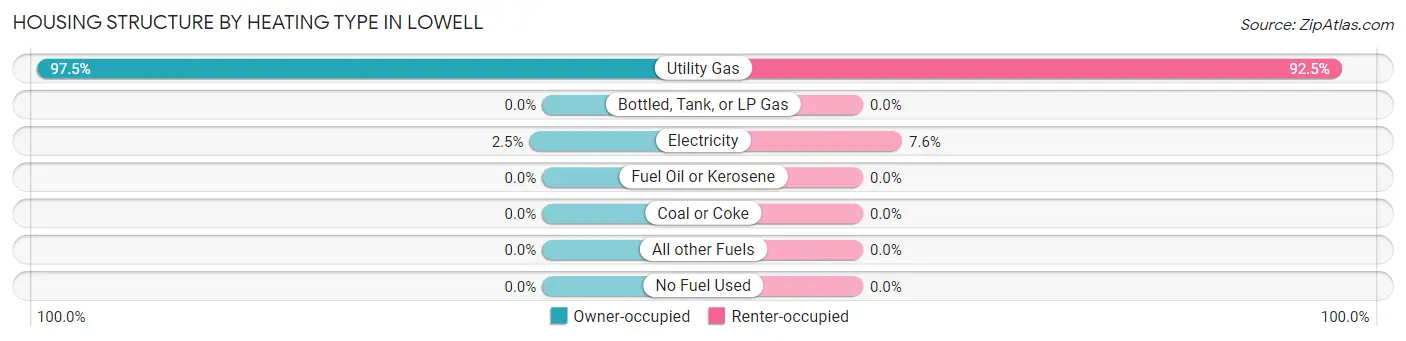
| Heating Type | Owner-occupied | Renter-occupied |
| Utility Gas | 158 (97.5%) | 49 (92.4%) |
| Bottled, Tank, or LP Gas | 0 (0.0%) | 0 (0.0%) |
| Electricity | 4 (2.5%) | 4 (7.5%) |
| Fuel Oil or Kerosene | 0 (0.0%) | 0 (0.0%) |
| Coal or Coke | 0 (0.0%) | 0 (0.0%) |
| All other Fuels | 0 (0.0%) | 0 (0.0%) |
| No Fuel Used | 0 (0.0%) | 0 (0.0%) |
| Total | 162 (100.0%) | 53 (100.0%) |
Household Vehicle Usage in Lowell
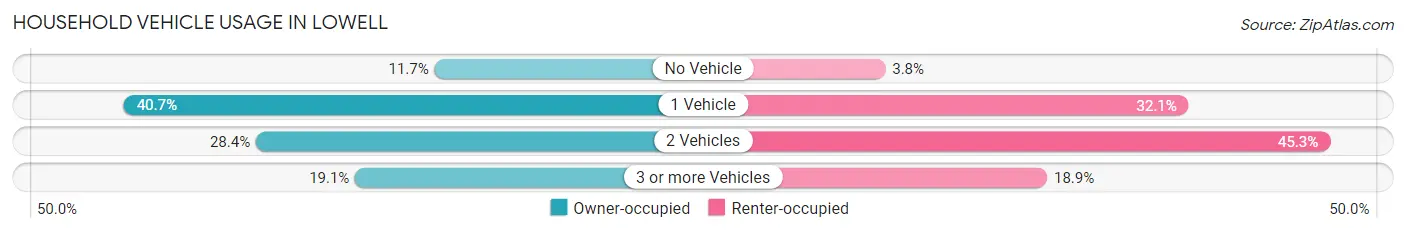
| Vehicles per Household | Owner-occupied | Renter-occupied |
| No Vehicle | 19 (11.7%) | 2 (3.8%) |
| 1 Vehicle | 66 (40.7%) | 17 (32.1%) |
| 2 Vehicles | 46 (28.4%) | 24 (45.3%) |
| 3 or more Vehicles | 31 (19.1%) | 10 (18.9%) |
| Total | 162 (100.0%) | 53 (100.0%) |
Real Estate & Mortgages in Lowell
Real Estate and Mortgage Overview in Lowell
| Characteristic | Without Mortgage | With Mortgage |
| Housing Units | 120 | 42 |
| Median Property Value | $91,800 | $91,700 |
| Median Household Income | $38,214 | $2 |
| Monthly Housing Costs | $395 | $0 |
| Real Estate Taxes | $619 | $0 |
Property Value by Mortgage Status in Lowell
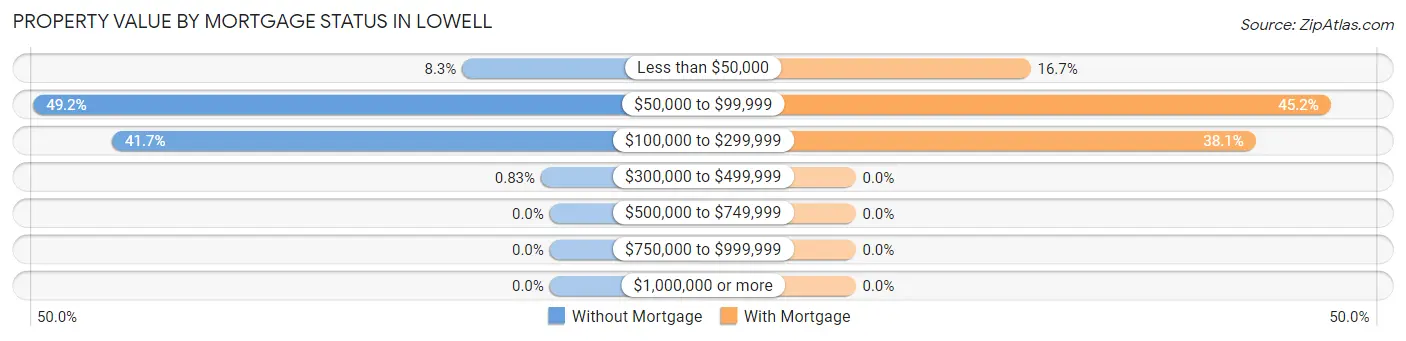
| Property Value | Without Mortgage | With Mortgage |
| Less than $50,000 | 10 (8.3%) | 7 (16.7%) |
| $50,000 to $99,999 | 59 (49.2%) | 19 (45.2%) |
| $100,000 to $299,999 | 50 (41.7%) | 16 (38.1%) |
| $300,000 to $499,999 | 1 (0.8%) | 0 (0.0%) |
| $500,000 to $749,999 | 0 (0.0%) | 0 (0.0%) |
| $750,000 to $999,999 | 0 (0.0%) | 0 (0.0%) |
| $1,000,000 or more | 0 (0.0%) | 0 (0.0%) |
| Total | 120 (100.0%) | 42 (100.0%) |
Household Income by Mortgage Status in Lowell
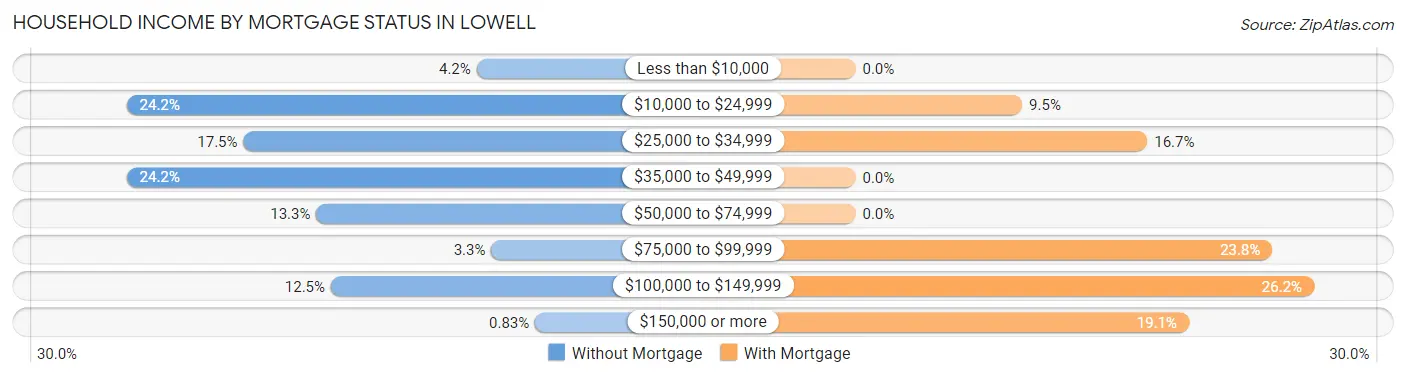
| Household Income | Without Mortgage | With Mortgage |
| Less than $10,000 | 5 (4.2%) | 0 (0.0%) |
| $10,000 to $24,999 | 29 (24.2%) | 4 (9.5%) |
| $25,000 to $34,999 | 21 (17.5%) | 7 (16.7%) |
| $35,000 to $49,999 | 29 (24.2%) | 0 (0.0%) |
| $50,000 to $74,999 | 16 (13.3%) | 0 (0.0%) |
| $75,000 to $99,999 | 4 (3.3%) | 10 (23.8%) |
| $100,000 to $149,999 | 15 (12.5%) | 11 (26.2%) |
| $150,000 or more | 1 (0.8%) | 8 (19.1%) |
| Total | 120 (100.0%) | 42 (100.0%) |
Property Value to Household Income Ratio in Lowell
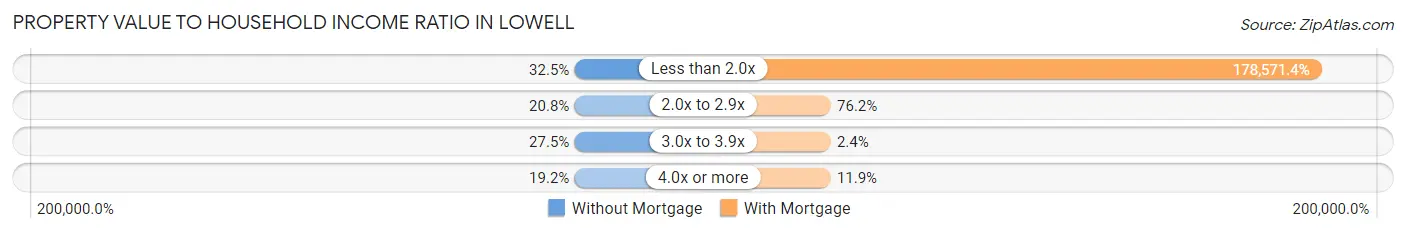
| Value-to-Income Ratio | Without Mortgage | With Mortgage |
| Less than 2.0x | 39 (32.5%) | 75,000 (178,571.4%) |
| 2.0x to 2.9x | 25 (20.8%) | 32 (76.2%) |
| 3.0x to 3.9x | 33 (27.5%) | 1 (2.4%) |
| 4.0x or more | 23 (19.2%) | 5 (11.9%) |
| Total | 120 (100.0%) | 42 (100.0%) |
Real Estate Taxes by Mortgage Status in Lowell
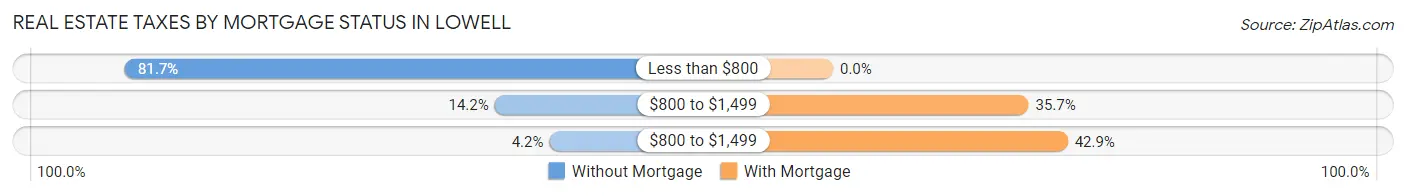
| Property Taxes | Without Mortgage | With Mortgage |
| Less than $800 | 98 (81.7%) | 0 (0.0%) |
| $800 to $1,499 | 17 (14.2%) | 15 (35.7%) |
| $800 to $1,499 | 5 (4.2%) | 18 (42.9%) |
| Total | 120 (100.0%) | 42 (100.0%) |
Health & Disability in Lowell
Health Insurance Coverage by Age in Lowell
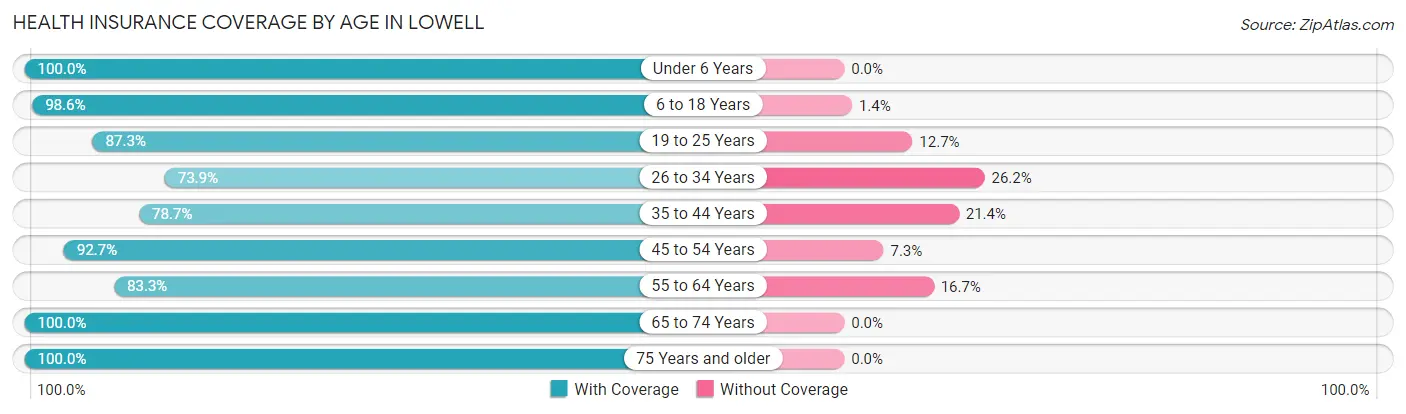
| Age Bracket | With Coverage | Without Coverage |
| Under 6 Years | 38 (100.0%) | 0 (0.0%) |
| 6 to 18 Years | 69 (98.6%) | 1 (1.4%) |
| 19 to 25 Years | 55 (87.3%) | 8 (12.7%) |
| 26 to 34 Years | 48 (73.9%) | 17 (26.2%) |
| 35 to 44 Years | 70 (78.6%) | 19 (21.3%) |
| 45 to 54 Years | 38 (92.7%) | 3 (7.3%) |
| 55 to 64 Years | 30 (83.3%) | 6 (16.7%) |
| 65 to 74 Years | 29 (100.0%) | 0 (0.0%) |
| 75 Years and older | 75 (100.0%) | 0 (0.0%) |
| Total | 452 (89.3%) | 54 (10.7%) |
Health Insurance Coverage by Citizenship Status in Lowell
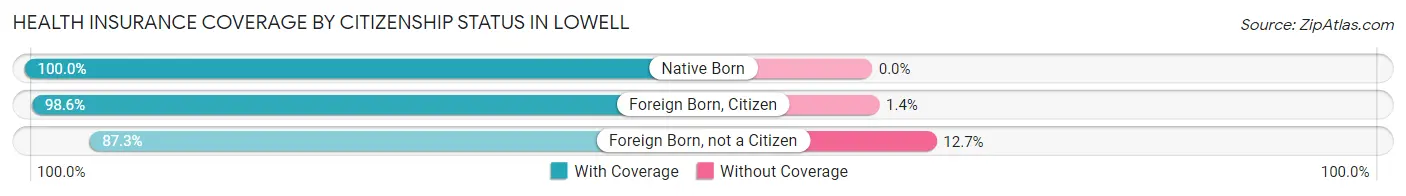
| Citizenship Status | With Coverage | Without Coverage |
| Native Born | 38 (100.0%) | 0 (0.0%) |
| Foreign Born, Citizen | 69 (98.6%) | 1 (1.4%) |
| Foreign Born, not a Citizen | 55 (87.3%) | 8 (12.7%) |
Health Insurance Coverage by Household Income in Lowell
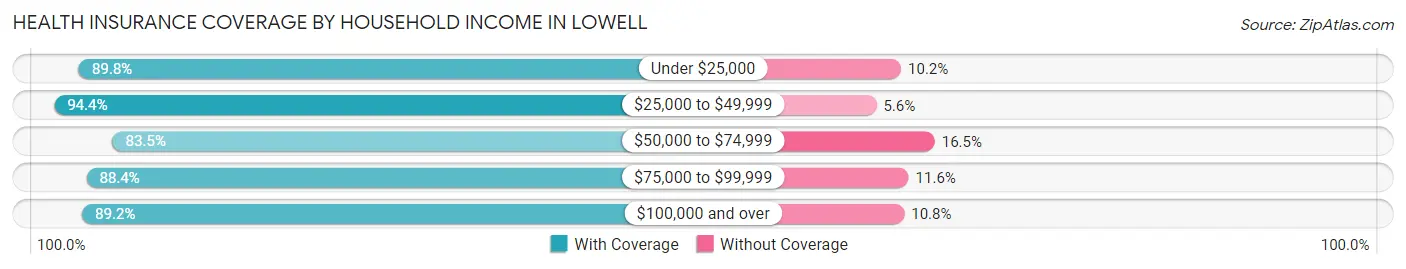
| Household Income | With Coverage | Without Coverage |
| Under $25,000 | 150 (89.8%) | 17 (10.2%) |
| $25,000 to $49,999 | 102 (94.4%) | 6 (5.6%) |
| $50,000 to $74,999 | 81 (83.5%) | 16 (16.5%) |
| $75,000 to $99,999 | 61 (88.4%) | 8 (11.6%) |
| $100,000 and over | 58 (89.2%) | 7 (10.8%) |
Public vs Private Health Insurance Coverage by Age in Lowell
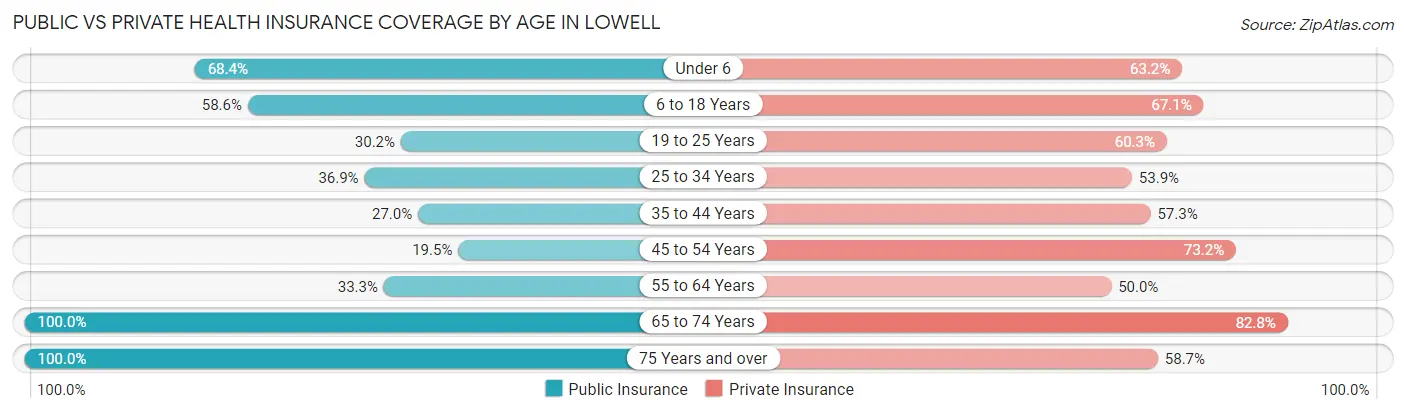
| Age Bracket | Public Insurance | Private Insurance |
| Under 6 | 26 (68.4%) | 24 (63.2%) |
| 6 to 18 Years | 41 (58.6%) | 47 (67.1%) |
| 19 to 25 Years | 19 (30.2%) | 38 (60.3%) |
| 25 to 34 Years | 24 (36.9%) | 35 (53.8%) |
| 35 to 44 Years | 24 (27.0%) | 51 (57.3%) |
| 45 to 54 Years | 8 (19.5%) | 30 (73.2%) |
| 55 to 64 Years | 12 (33.3%) | 18 (50.0%) |
| 65 to 74 Years | 29 (100.0%) | 24 (82.8%) |
| 75 Years and over | 75 (100.0%) | 44 (58.7%) |
| Total | 258 (51.0%) | 311 (61.5%) |
Disability Status by Sex by Age in Lowell
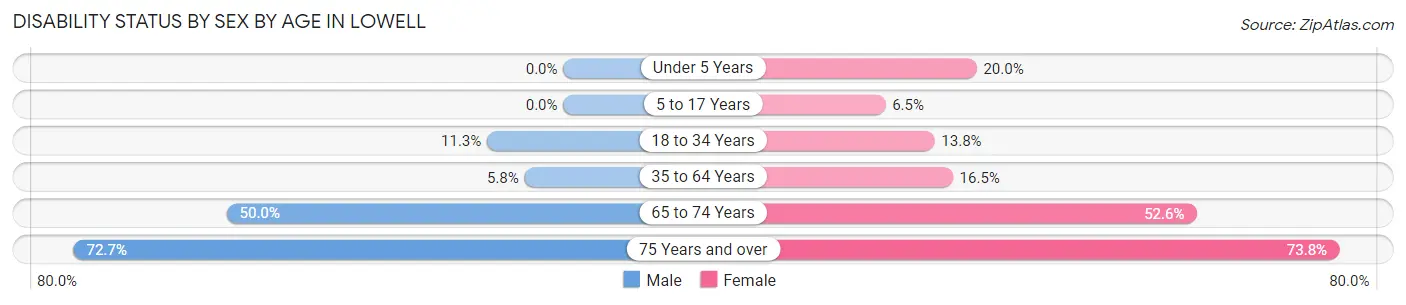
| Age Bracket | Male | Female |
| Under 5 Years | 0 (0.0%) | 3 (20.0%) |
| 5 to 17 Years | 0 (0.0%) | 2 (6.5%) |
| 18 to 34 Years | 6 (11.3%) | 11 (13.8%) |
| 35 to 64 Years | 5 (5.8%) | 13 (16.5%) |
| 65 to 74 Years | 5 (50.0%) | 10 (52.6%) |
| 75 Years and over | 24 (72.7%) | 31 (73.8%) |
Disability Class by Sex by Age in Lowell
Disability Class: Hearing Difficulty
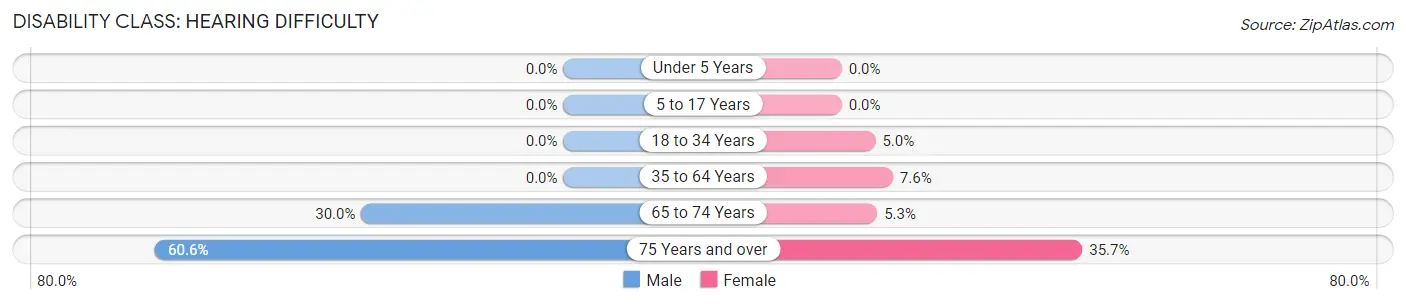
| Age Bracket | Male | Female |
| Under 5 Years | 0 (0.0%) | 0 (0.0%) |
| 5 to 17 Years | 0 (0.0%) | 0 (0.0%) |
| 18 to 34 Years | 0 (0.0%) | 4 (5.0%) |
| 35 to 64 Years | 0 (0.0%) | 6 (7.6%) |
| 65 to 74 Years | 3 (30.0%) | 1 (5.3%) |
| 75 Years and over | 20 (60.6%) | 15 (35.7%) |
Disability Class: Vision Difficulty
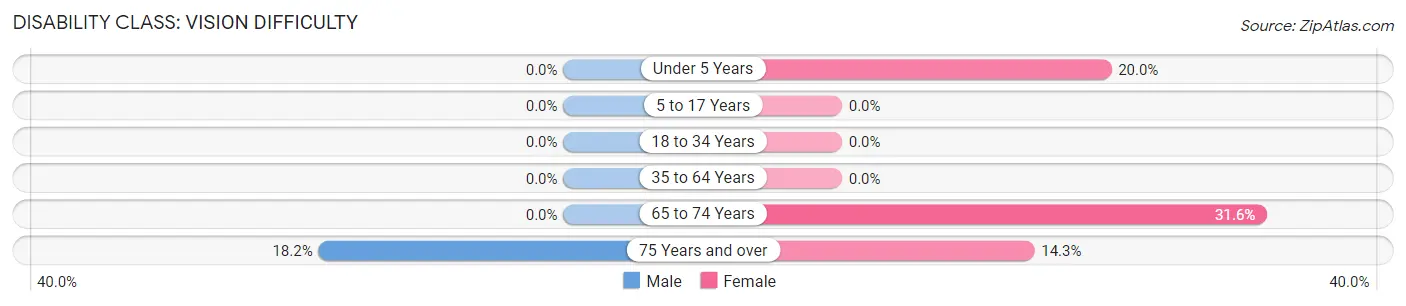
| Age Bracket | Male | Female |
| Under 5 Years | 0 (0.0%) | 3 (20.0%) |
| 5 to 17 Years | 0 (0.0%) | 0 (0.0%) |
| 18 to 34 Years | 0 (0.0%) | 0 (0.0%) |
| 35 to 64 Years | 0 (0.0%) | 0 (0.0%) |
| 65 to 74 Years | 0 (0.0%) | 6 (31.6%) |
| 75 Years and over | 6 (18.2%) | 6 (14.3%) |
Disability Class: Cognitive Difficulty
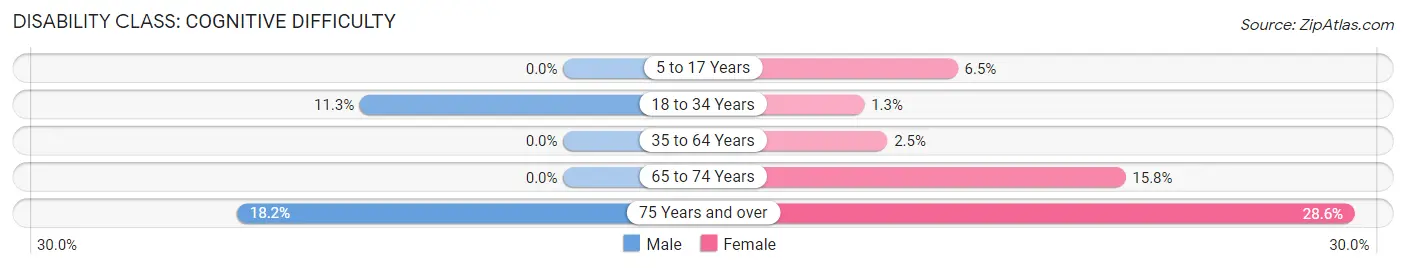
| Age Bracket | Male | Female |
| 5 to 17 Years | 0 (0.0%) | 2 (6.5%) |
| 18 to 34 Years | 6 (11.3%) | 1 (1.3%) |
| 35 to 64 Years | 0 (0.0%) | 2 (2.5%) |
| 65 to 74 Years | 0 (0.0%) | 3 (15.8%) |
| 75 Years and over | 6 (18.2%) | 12 (28.6%) |
Disability Class: Ambulatory Difficulty
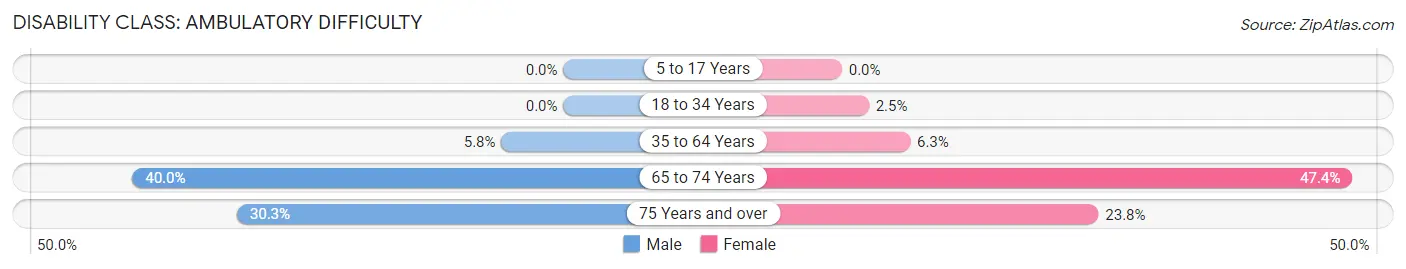
| Age Bracket | Male | Female |
| 5 to 17 Years | 0 (0.0%) | 0 (0.0%) |
| 18 to 34 Years | 0 (0.0%) | 2 (2.5%) |
| 35 to 64 Years | 5 (5.8%) | 5 (6.3%) |
| 65 to 74 Years | 4 (40.0%) | 9 (47.4%) |
| 75 Years and over | 10 (30.3%) | 10 (23.8%) |
Disability Class: Self-Care Difficulty
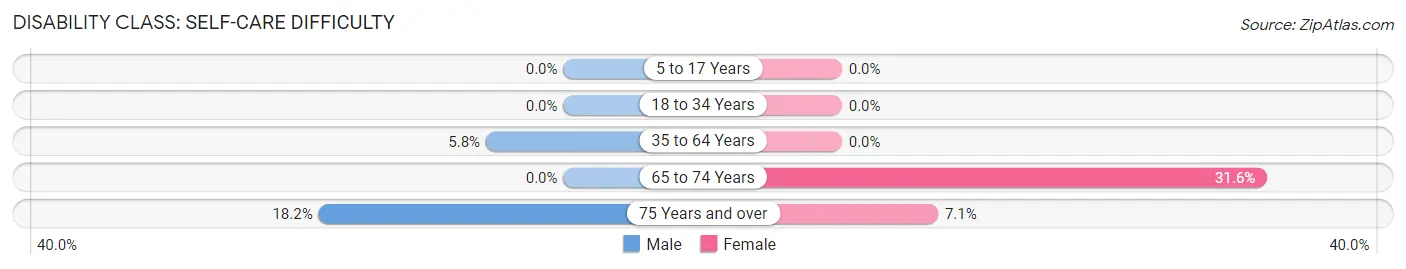
| Age Bracket | Male | Female |
| 5 to 17 Years | 0 (0.0%) | 0 (0.0%) |
| 18 to 34 Years | 0 (0.0%) | 0 (0.0%) |
| 35 to 64 Years | 5 (5.8%) | 0 (0.0%) |
| 65 to 74 Years | 0 (0.0%) | 6 (31.6%) |
| 75 Years and over | 6 (18.2%) | 3 (7.1%) |
Technology Access in Lowell
Computing Device Access in Lowell
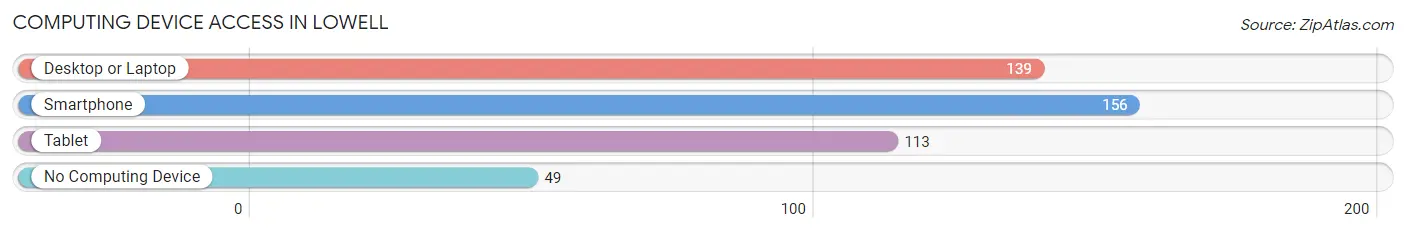
| Device Type | # Households | % Households |
| Desktop or Laptop | 139 | 64.6% |
| Smartphone | 156 | 72.6% |
| Tablet | 113 | 52.6% |
| No Computing Device | 49 | 22.8% |
| Total | 215 | 100.0% |
Internet Access in Lowell
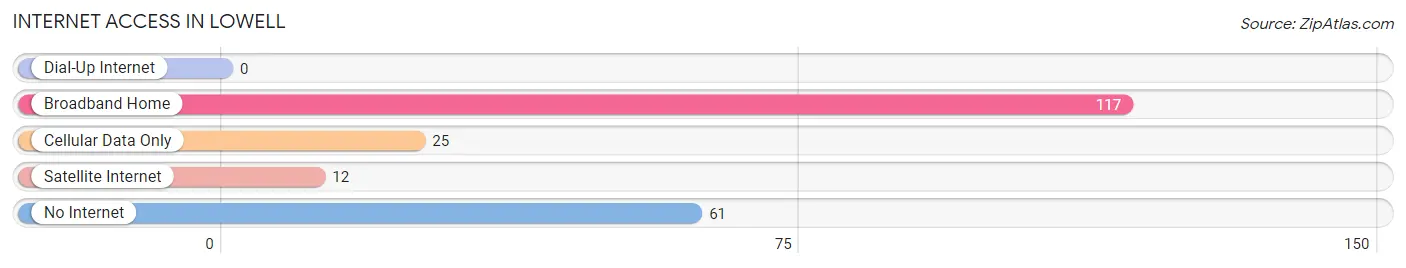
| Internet Type | # Households | % Households |
| Dial-Up Internet | 0 | 0.0% |
| Broadband Home | 117 | 54.4% |
| Cellular Data Only | 25 | 11.6% |
| Satellite Internet | 12 | 5.6% |
| No Internet | 61 | 28.4% |
| Total | 215 | 100.0% |
Lowell Summary
Lowell, Ohio is a small village located in the northeastern part of the state, in Washington County. It is situated on the banks of the Little Muskingum River, and is surrounded by rolling hills and lush forests. The village has a population of just over 1,000 people, and is part of the Marietta-Belpre Metropolitan Statistical Area.
History
Lowell was founded in 1817 by a group of settlers from Pennsylvania. The village was named after the nearby Lowell Township, which was named after the poet James Russell Lowell. The village was originally a farming community, and the first settlers built a grist mill and a saw mill on the banks of the Little Muskingum River. The village grew slowly, and by the mid-1800s, it had become a small trading center for the surrounding area.
In the late 1800s, the village began to experience a period of growth. The railroad arrived in 1881, and the village was incorporated in 1883. The railroad brought new businesses and industries to the area, and the village began to grow. By the early 1900s, Lowell had become a thriving community, with a variety of businesses and industries.
Geography
Lowell is located in the northeastern part of Ohio, in Washington County. It is situated on the banks of the Little Muskingum River, and is surrounded by rolling hills and lush forests. The village is located approximately 25 miles south of Marietta, and about 50 miles east of Columbus.
The village has a total area of 0.7 square miles, all of which is land. The village is located at an elevation of 845 feet above sea level. The climate in Lowell is humid continental, with hot summers and cold winters.
Economy
Lowell’s economy is largely based on agriculture and tourism. The village is home to several small businesses, including a grocery store, a hardware store, and a few restaurants. The village also has a few small manufacturing companies, including a furniture factory and a plastics factory.
The village is also home to a number of tourist attractions, including the Lowell Historic District, the Lowell Covered Bridge, and the Little Muskingum River. The village also hosts a number of festivals and events throughout the year, including the Lowell Summer Festival and the Lowell Fall Festival.
Demographics
As of the 2010 census, Lowell had a population of 1,072 people. The racial makeup of the village was 97.2% White, 0.7% African American, 0.2% Native American, 0.2% Asian, 0.2% from other races, and 1.7% from two or more races. Hispanic or Latino of any race were 0.7% of the population.
The median income for a household in the village was $37,500, and the median income for a family was $45,000. The per capita income for the village was $18,845. About 11.2% of families and 14.2% of the population were below the poverty line, including 18.2% of those under age 18 and 8.3% of those age 65 or over.
Common Questions
What is Per Capita Income in Lowell?
Per Capita income in Lowell is $21,554.
What is the Median Family Income in Lowell?
Median Family Income in Lowell is $43,750.
What is the Median Household income in Lowell?
Median Household Income in Lowell is $40,417.
What is Income or Wage Gap in Lowell?
Income or Wage Gap in Lowell is 20.1%.
Women in Lowell earn 79.9 cents for every dollar earned by a man.
What is Inequality or Gini Index in Lowell?
Inequality or Gini Index in Lowell is 0.38.
What is the Total Population of Lowell?
Total Population of Lowell is 506.
What is the Total Male Population of Lowell?
Total Male Population of Lowell is 240.
What is the Total Female Population of Lowell?
Total Female Population of Lowell is 266.
What is the Ratio of Males per 100 Females in Lowell?
There are 90.23 Males per 100 Females in Lowell.
What is the Ratio of Females per 100 Males in Lowell?
There are 110.83 Females per 100 Males in Lowell.
What is the Median Population Age in Lowell?
Median Population Age in Lowell is 38.0 Years.
What is the Average Family Size in Lowell
Average Family Size in Lowell is 2.7 People.
What is the Average Household Size in Lowell
Average Household Size in Lowell is 2.4 People.
How Large is the Labor Force in Lowell?
There are 230 People in the Labor Forcein in Lowell.
What is the Percentage of People in the Labor Force in Lowell?
57.1% of People are in the Labor Force in Lowell.
What is the Unemployment Rate in Lowell?
Unemployment Rate in Lowell is 7.0%.