Loudonville, OH Map & Demographics
Loudonville Map
Loudonville Overview
$29,767
PER CAPITA INCOME
$69,130
AVG FAMILY INCOME
$51,557
AVG HOUSEHOLD INCOME
42.7%
WAGE / INCOME GAP [ % ]
57.3¢/ $1
WAGE / INCOME GAP [ $ ]
0.43
INEQUALITY / GINI INDEX
2,898
TOTAL POPULATION
1,500
MALE POPULATION
1,398
FEMALE POPULATION
107.30
MALES / 100 FEMALES
93.20
FEMALES / 100 MALES
39.6
MEDIAN AGE
3.0
AVG FAMILY SIZE
2.5
AVG HOUSEHOLD SIZE
1,392
LABOR FORCE [ PEOPLE ]
57.9%
PERCENT IN LABOR FORCE
5.1%
UNEMPLOYMENT RATE
Loudonville Zip Codes
Income in Loudonville
Income Overview in Loudonville
Per Capita Income in Loudonville is $29,767, while median incomes of families and households are $69,130 and $51,557 respectively.
| Characteristic | Number | Measure |
| Per Capita Income | 2,898 | $29,767 |
| Median Family Income | 670 | $69,130 |
| Mean Family Income | 670 | $78,767 |
| Median Household Income | 1,129 | $51,557 |
| Mean Household Income | 1,129 | $72,785 |
| Income Deficit | 670 | $0 |
| Wage / Income Gap (%) | 2,898 | 42.74% |
| Wage / Income Gap ($) | 2,898 | 57.26¢ per $1 |
| Gini / Inequality Index | 2,898 | 0.43 |
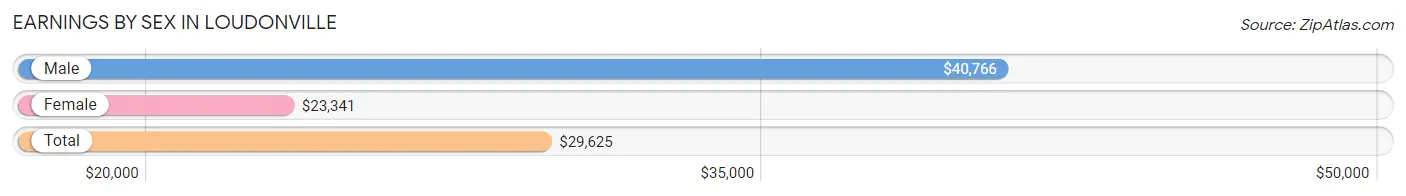
Earnings by Sex in Loudonville
Average Earnings in Loudonville are $29,625, $40,766 for men and $23,341 for women, a difference of 42.7%.
| Sex | Number | Average Earnings |
| Male | 749 (51.7%) | $40,766 |
| Female | 701 (48.3%) | $23,341 |
| Total | 1,450 (100.0%) | $29,625 |
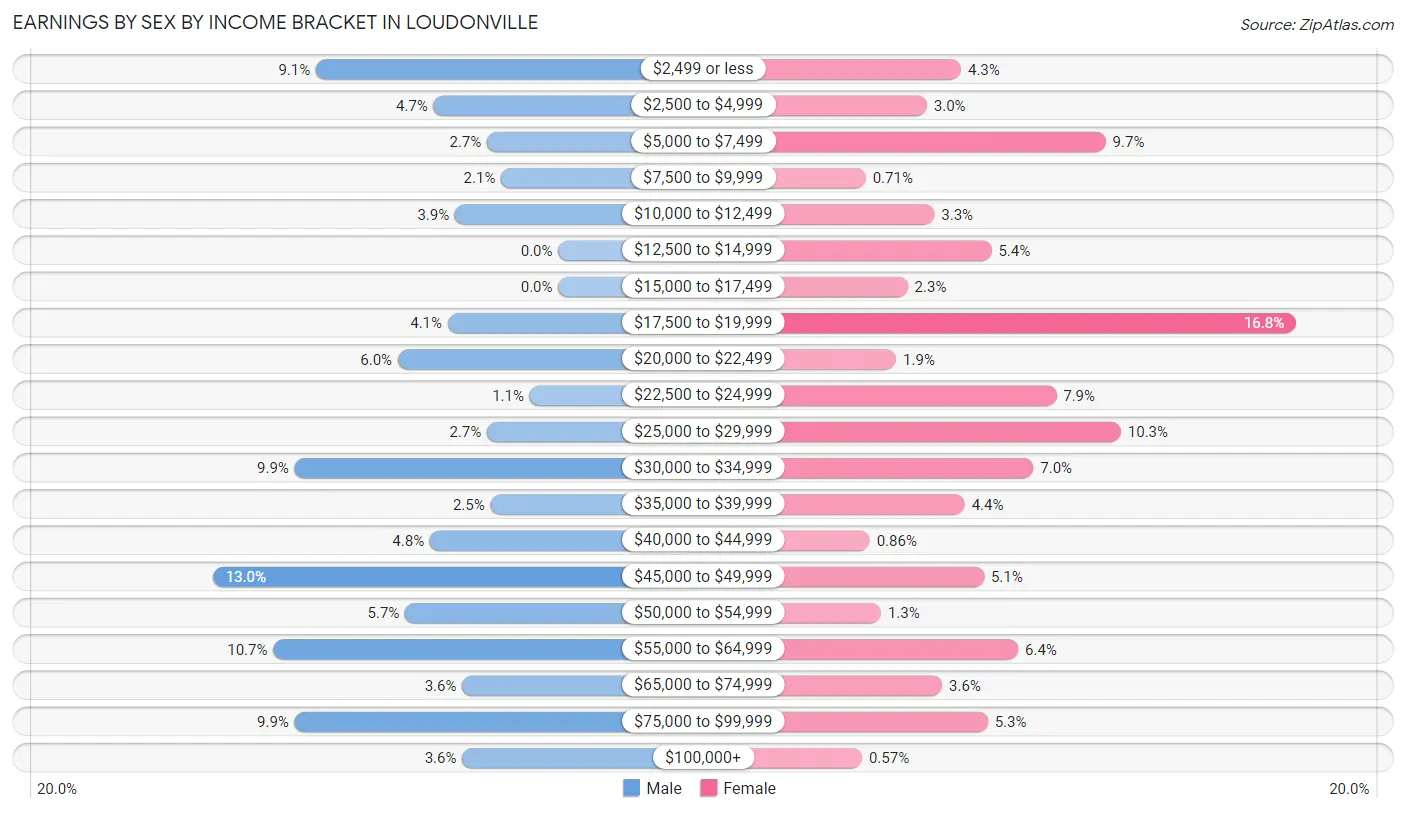
Earnings by Sex by Income Bracket in Loudonville
The most common earnings brackets in Loudonville are $45,000 to $49,999 for men (97 | 13.0%) and $17,500 to $19,999 for women (118 | 16.8%).
| Income | Male | Female |
| $2,499 or less | 68 (9.1%) | 30 (4.3%) |
| $2,500 to $4,999 | 35 (4.7%) | 21 (3.0%) |
| $5,000 to $7,499 | 20 (2.7%) | 68 (9.7%) |
| $7,500 to $9,999 | 16 (2.1%) | 5 (0.7%) |
| $10,000 to $12,499 | 29 (3.9%) | 23 (3.3%) |
| $12,500 to $14,999 | 0 (0.0%) | 38 (5.4%) |
| $15,000 to $17,499 | 0 (0.0%) | 16 (2.3%) |
| $17,500 to $19,999 | 31 (4.1%) | 118 (16.8%) |
| $20,000 to $22,499 | 45 (6.0%) | 13 (1.8%) |
| $22,500 to $24,999 | 8 (1.1%) | 55 (7.9%) |
| $25,000 to $29,999 | 20 (2.7%) | 72 (10.3%) |
| $30,000 to $34,999 | 74 (9.9%) | 49 (7.0%) |
| $35,000 to $39,999 | 19 (2.5%) | 31 (4.4%) |
| $40,000 to $44,999 | 36 (4.8%) | 6 (0.9%) |
| $45,000 to $49,999 | 97 (13.0%) | 36 (5.1%) |
| $50,000 to $54,999 | 43 (5.7%) | 9 (1.3%) |
| $55,000 to $64,999 | 80 (10.7%) | 45 (6.4%) |
| $65,000 to $74,999 | 27 (3.6%) | 25 (3.6%) |
| $75,000 to $99,999 | 74 (9.9%) | 37 (5.3%) |
| $100,000+ | 27 (3.6%) | 4 (0.6%) |
| Total | 749 (100.0%) | 701 (100.0%) |
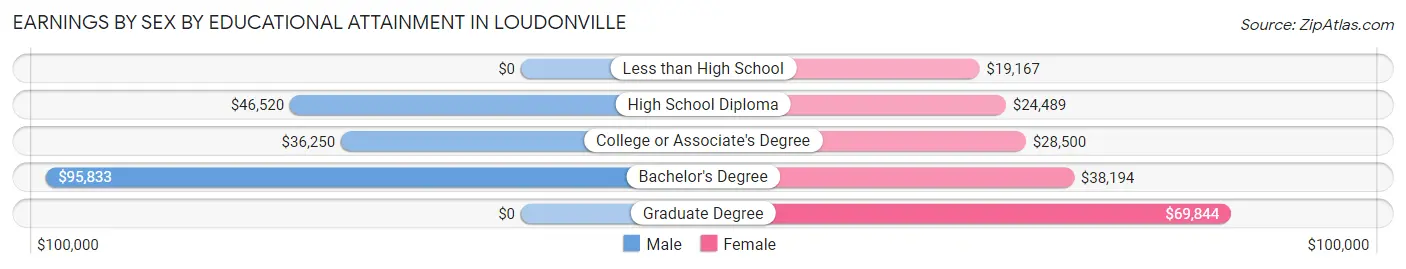
Earnings by Sex by Educational Attainment in Loudonville
Average earnings in Loudonville are $45,337 for men and $26,719 for women, a difference of 41.1%. Men with an educational attainment of bachelor's degree enjoy the highest average annual earnings of $95,833, while those with college or associate's degree education earn the least with $36,250. Women with an educational attainment of graduate degree earn the most with the average annual earnings of $69,844, while those with less than high school education have the smallest earnings of $19,167.
| Educational Attainment | Male Income | Female Income |
| Less than High School | - | - |
| High School Diploma | $46,520 | $24,489 |
| College or Associate's Degree | $36,250 | $28,500 |
| Bachelor's Degree | $95,833 | $38,194 |
| Graduate Degree | - | - |
| Total | $45,337 | $26,719 |
Family Income in Loudonville
Family Income Brackets in Loudonville
According to the Loudonville family income data, there are 189 families falling into the $50,000 to $74,999 income range, which is the most common income bracket and makes up 28.2% of all families.
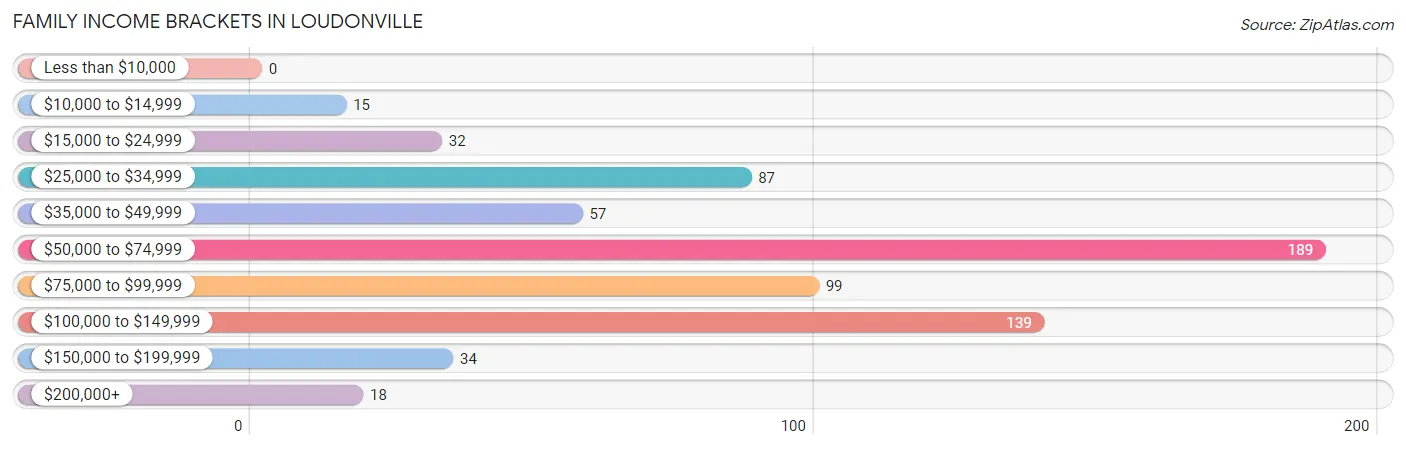
| Income Bracket | # Families | % Families |
| Less than $10,000 | 0 | 0.0% |
| $10,000 to $14,999 | 15 | 2.2% |
| $15,000 to $24,999 | 32 | 4.8% |
| $25,000 to $34,999 | 87 | 13.0% |
| $35,000 to $49,999 | 57 | 8.5% |
| $50,000 to $74,999 | 189 | 28.2% |
| $75,000 to $99,999 | 99 | 14.8% |
| $100,000 to $149,999 | 139 | 20.7% |
| $150,000 to $199,999 | 34 | 5.1% |
| $200,000+ | 18 | 2.7% |
Family Income by Famaliy Size in Loudonville
3-person families (130 | 19.4%) account for the highest median family income in Loudonville with $84,000 per family, while 2-person families (409 | 61.0%) have the highest median income of $34,430 per family member.
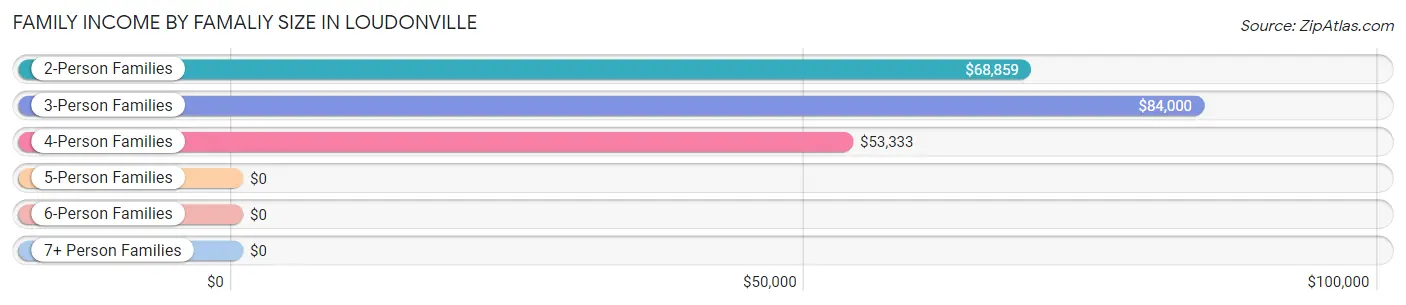
| Income Bracket | # Families | Median Income |
| 2-Person Families | 409 (61.0%) | $68,859 |
| 3-Person Families | 130 (19.4%) | $84,000 |
| 4-Person Families | 62 (9.2%) | $53,333 |
| 5-Person Families | 52 (7.8%) | $0 |
| 6-Person Families | 0 (0.0%) | $0 |
| 7+ Person Families | 17 (2.5%) | $0 |
| Total | 670 (100.0%) | $69,130 |
Family Income by Number of Earners in Loudonville
The median family income in Loudonville is $69,130, with families comprising 3+ earners (34) having the highest median family income of $131,250, while families with no earners (114) have the lowest median family income of $51,000, accounting for 5.1% and 17.0% of families, respectively.
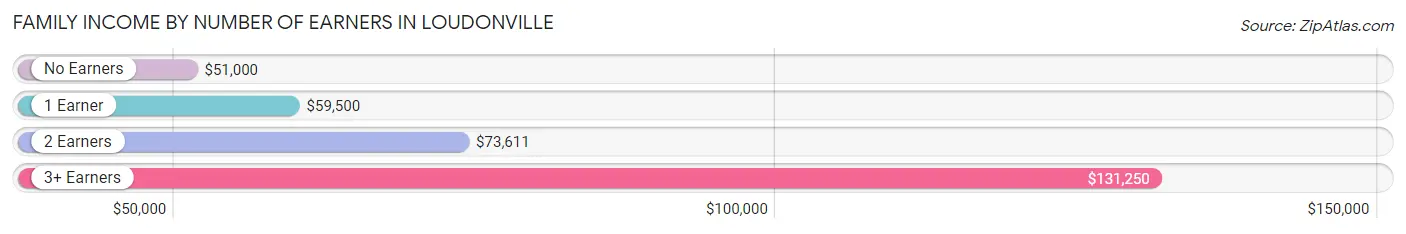
| Number of Earners | # Families | Median Income |
| No Earners | 114 (17.0%) | $51,000 |
| 1 Earner | 216 (32.2%) | $59,500 |
| 2 Earners | 306 (45.7%) | $73,611 |
| 3+ Earners | 34 (5.1%) | $131,250 |
| Total | 670 (100.0%) | $69,130 |
Household Income in Loudonville
Household Income Brackets in Loudonville
With 263 households falling in the category, the $25,000 to $34,999 income range is the most frequent in Loudonville, accounting for 23.3% of all households. In contrast, only 11 households (1.0%) fall into the less than $10,000 income bracket, making it the least populous group.
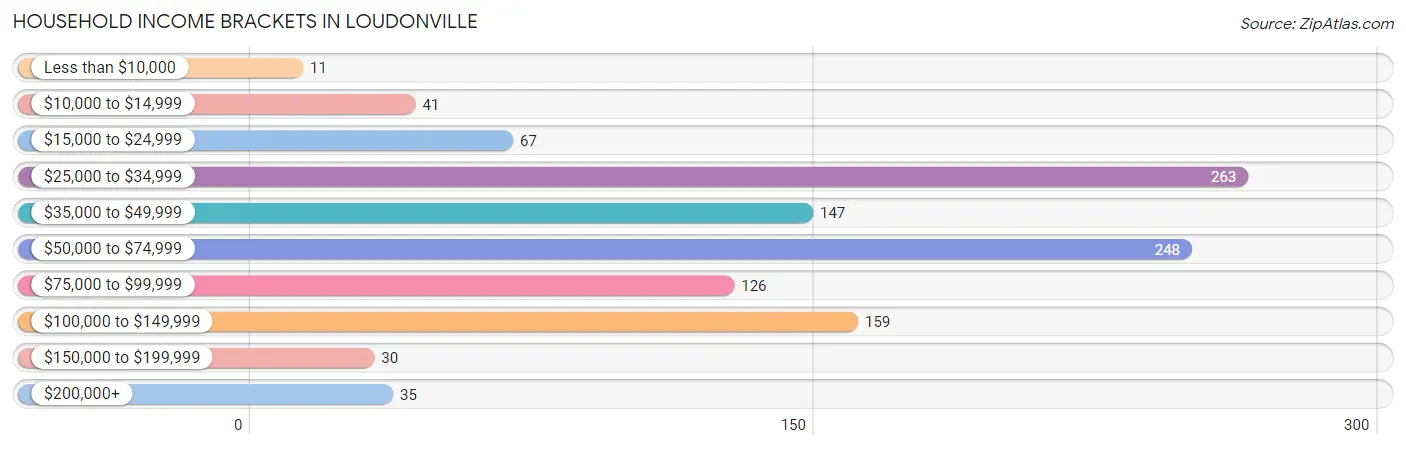
| Income Bracket | # Households | % Households |
| Less than $10,000 | 11 | 1.0% |
| $10,000 to $14,999 | 41 | 3.6% |
| $15,000 to $24,999 | 67 | 5.9% |
| $25,000 to $34,999 | 263 | 23.3% |
| $35,000 to $49,999 | 147 | 13.0% |
| $50,000 to $74,999 | 248 | 22.0% |
| $75,000 to $99,999 | 126 | 11.2% |
| $100,000 to $149,999 | 159 | 14.1% |
| $150,000 to $199,999 | 30 | 2.7% |
| $200,000+ | 35 | 3.1% |
Household Income by Householder Age in Loudonville
The median household income in Loudonville is $51,557, with the highest median household income of $72,700 found in the 45 to 64 years age bracket for the primary householder. A total of 438 households (38.8%) fall into this category. Meanwhile, the 15 to 24 years age bracket for the primary householder has the lowest median household income of $0, with 43 households (3.8%) in this group.
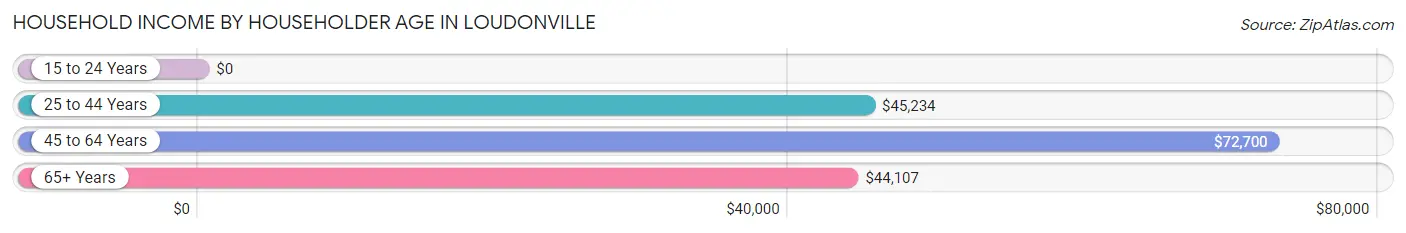
| Income Bracket | # Households | Median Income |
| 15 to 24 Years | 43 (3.8%) | $0 |
| 25 to 44 Years | 311 (27.6%) | $45,234 |
| 45 to 64 Years | 438 (38.8%) | $72,700 |
| 65+ Years | 337 (29.8%) | $44,107 |
| Total | 1,129 (100.0%) | $51,557 |
Poverty in Loudonville
Income Below Poverty by Sex and Age in Loudonville
With 14.1% poverty level for males and 16.8% for females among the residents of Loudonville, 18 to 24 year old males and 12 to 14 year old females are the most vulnerable to poverty, with 45 males (42.4%) and 36 females (73.5%) in their respective age groups living below the poverty level.
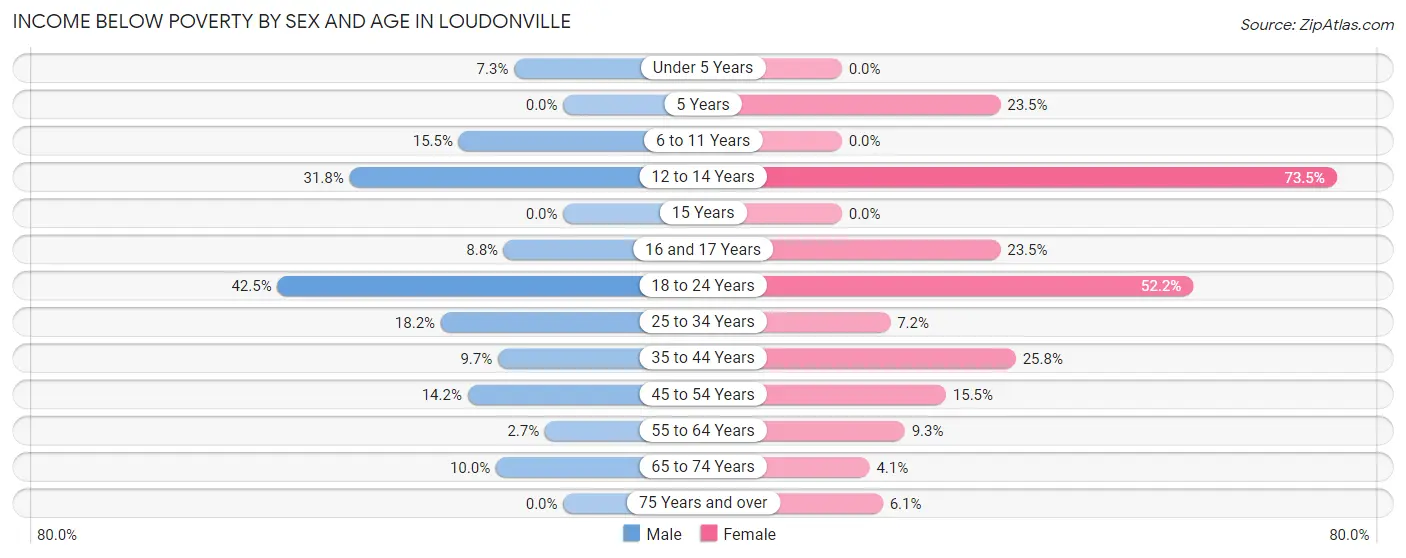
| Age Bracket | Male | Female |
| Under 5 Years | 7 (7.3%) | 0 (0.0%) |
| 5 Years | 0 (0.0%) | 4 (23.5%) |
| 6 to 11 Years | 16 (15.5%) | 0 (0.0%) |
| 12 to 14 Years | 20 (31.8%) | 36 (73.5%) |
| 15 Years | 0 (0.0%) | 0 (0.0%) |
| 16 and 17 Years | 6 (8.8%) | 24 (23.5%) |
| 18 to 24 Years | 45 (42.4%) | 48 (52.2%) |
| 25 to 34 Years | 48 (18.2%) | 12 (7.2%) |
| 35 to 44 Years | 13 (9.7%) | 31 (25.8%) |
| 45 to 54 Years | 25 (14.2%) | 36 (15.4%) |
| 55 to 64 Years | 5 (2.7%) | 17 (9.3%) |
| 65 to 74 Years | 13 (10.0%) | 6 (4.1%) |
| 75 Years and over | 0 (0.0%) | 9 (6.1%) |
| Total | 198 (14.1%) | 223 (16.8%) |
Income Above Poverty by Sex and Age in Loudonville
According to the poverty statistics in Loudonville, males aged 5 years and females aged under 5 years are the age groups that are most secure financially, with 100.0% of males and 100.0% of females in these age groups living above the poverty line.
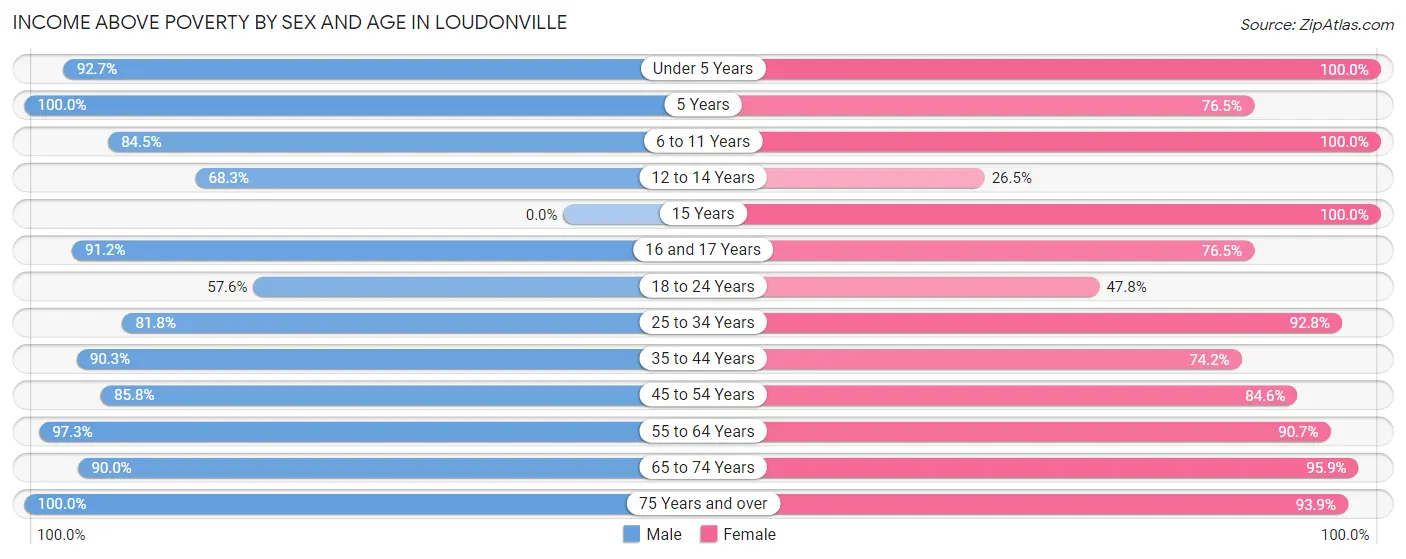
| Age Bracket | Male | Female |
| Under 5 Years | 89 (92.7%) | 43 (100.0%) |
| 5 Years | 5 (100.0%) | 13 (76.5%) |
| 6 to 11 Years | 87 (84.5%) | 18 (100.0%) |
| 12 to 14 Years | 43 (68.2%) | 13 (26.5%) |
| 15 Years | 0 (0.0%) | 13 (100.0%) |
| 16 and 17 Years | 62 (91.2%) | 78 (76.5%) |
| 18 to 24 Years | 61 (57.6%) | 44 (47.8%) |
| 25 to 34 Years | 216 (81.8%) | 155 (92.8%) |
| 35 to 44 Years | 121 (90.3%) | 89 (74.2%) |
| 45 to 54 Years | 151 (85.8%) | 197 (84.6%) |
| 55 to 64 Years | 179 (97.3%) | 165 (90.7%) |
| 65 to 74 Years | 117 (90.0%) | 140 (95.9%) |
| 75 Years and over | 77 (100.0%) | 139 (93.9%) |
| Total | 1,208 (85.9%) | 1,107 (83.2%) |
Income Below Poverty Among Married-Couple Families in Loudonville
The poverty statistics for married-couple families in Loudonville show that 3.7% or 18 of the total 480 families live below the poverty line. Families with 3 or 4 children have the highest poverty rate of 78.9%, comprising of 15 families. On the other hand, families with 1 or 2 children have the lowest poverty rate of 0.0%, which includes 0 families.
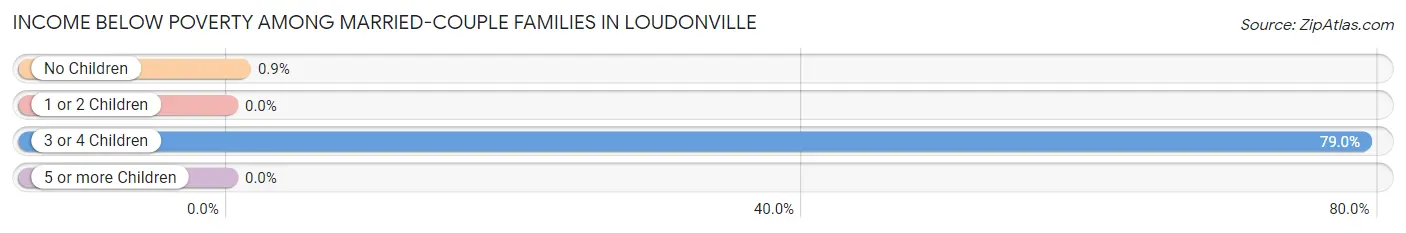
| Children | Above Poverty | Below Poverty |
| No Children | 331 (99.1%) | 3 (0.9%) |
| 1 or 2 Children | 110 (100.0%) | 0 (0.0%) |
| 3 or 4 Children | 4 (21.0%) | 15 (78.9%) |
| 5 or more Children | 17 (100.0%) | 0 (0.0%) |
| Total | 462 (96.3%) | 18 (3.7%) |
Income Below Poverty Among Single-Parent Households in Loudonville
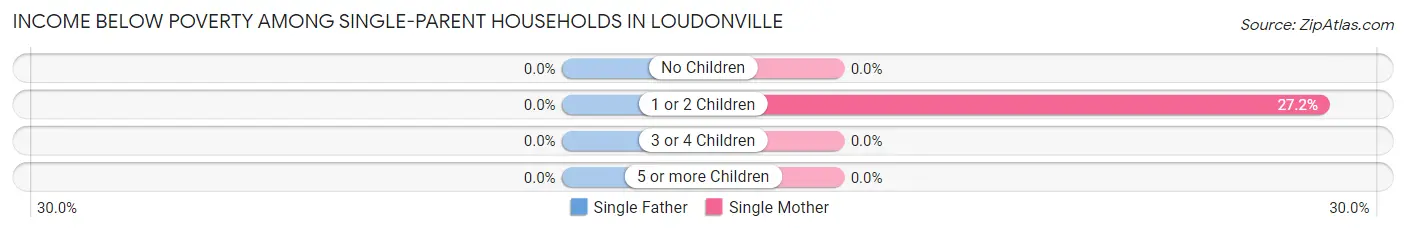
| Children | Single Father | Single Mother |
| No Children | 0 (0.0%) | 0 (0.0%) |
| 1 or 2 Children | 0 (0.0%) | 22 (27.2%) |
| 3 or 4 Children | 0 (0.0%) | 0 (0.0%) |
| 5 or more Children | 0 (0.0%) | 0 (0.0%) |
| Total | 0 (0.0%) | 22 (18.2%) |
Income Below Poverty Among Married-Couple vs Single-Parent Households in Loudonville
The poverty data for Loudonville shows that 18 of the married-couple family households (3.7%) and 22 of the single-parent households (11.6%) are living below the poverty level. Within the married-couple family households, those with 3 or 4 children have the highest poverty rate, with 15 households (78.9%) falling below the poverty line. Among the single-parent households, those with 1 or 2 children have the highest poverty rate, with 22 household (16.9%) living below poverty.
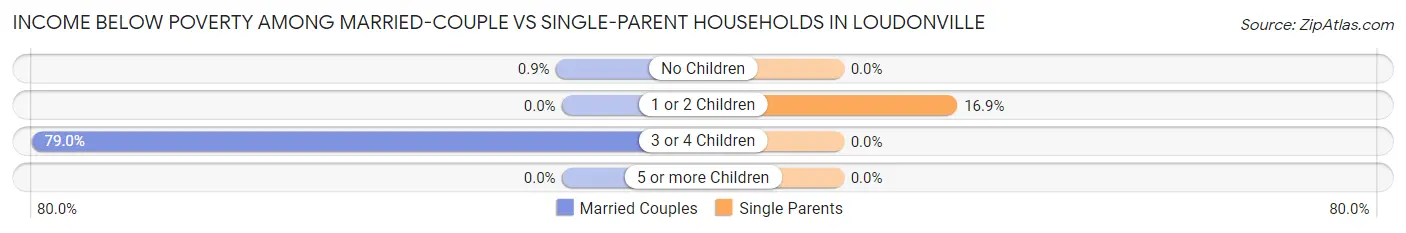
| Children | Married-Couple Families | Single-Parent Households |
| No Children | 3 (0.9%) | 0 (0.0%) |
| 1 or 2 Children | 0 (0.0%) | 22 (16.9%) |
| 3 or 4 Children | 15 (78.9%) | 0 (0.0%) |
| 5 or more Children | 0 (0.0%) | 0 (0.0%) |
| Total | 18 (3.7%) | 22 (11.6%) |
Race in Loudonville
The most populous races in Loudonville are White / Caucasian (2,861 | 98.7%), Hispanic or Latino (143 | 4.9%), and Two or more Races (25 | 0.9%).
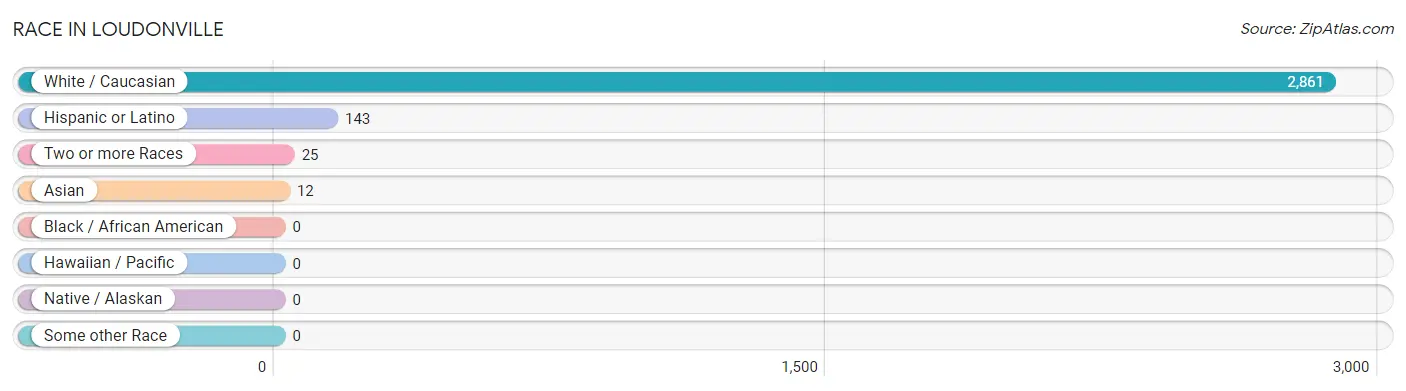
| Race | # Population | % Population |
| Asian | 12 | 0.4% |
| Black / African American | 0 | 0.0% |
| Hawaiian / Pacific | 0 | 0.0% |
| Hispanic or Latino | 143 | 4.9% |
| Native / Alaskan | 0 | 0.0% |
| White / Caucasian | 2,861 | 98.7% |
| Two or more Races | 25 | 0.9% |
| Some other Race | 0 | 0.0% |
| Total | 2,898 | 100.0% |
Ancestry in Loudonville
The most populous ancestries reported in Loudonville are German (800 | 27.6%), Irish (330 | 11.4%), American (244 | 8.4%), English (198 | 6.8%), and Mexican (143 | 4.9%), together accounting for 59.2% of all Loudonville residents.
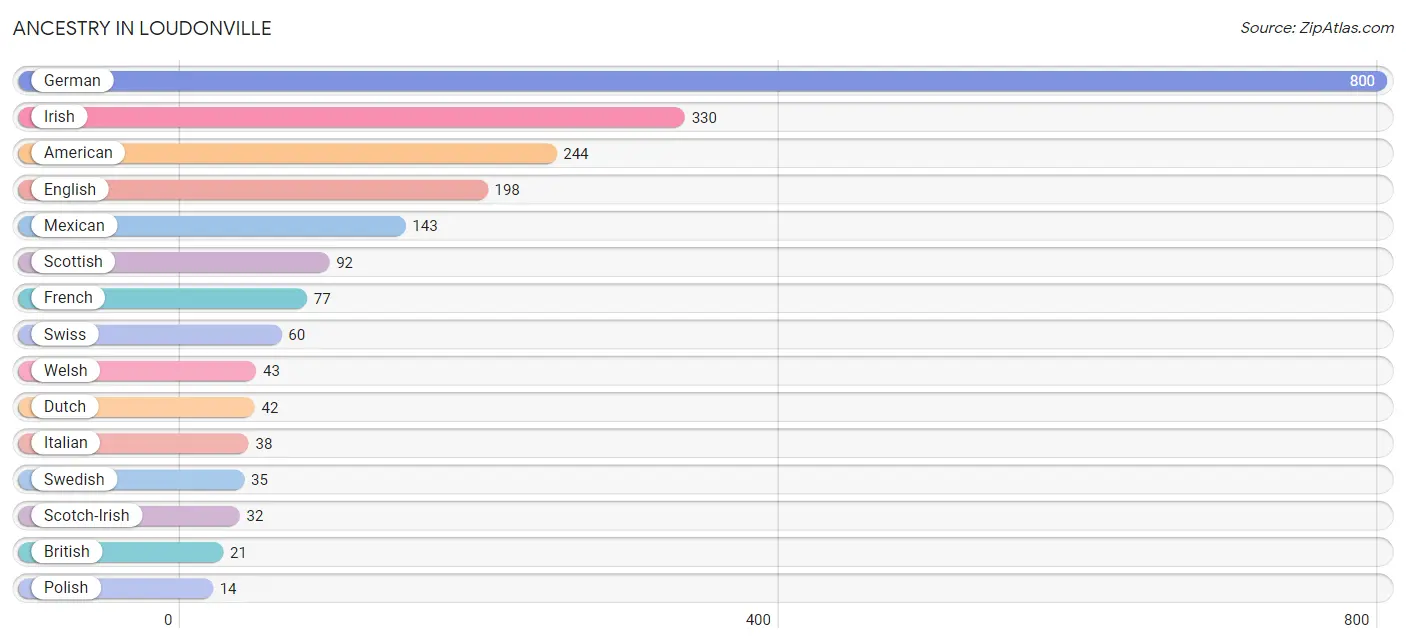
| Ancestry | # Population | % Population |
| American | 244 | 8.4% |
| British | 21 | 0.7% |
| Dutch | 42 | 1.5% |
| Eastern European | 12 | 0.4% |
| English | 198 | 6.8% |
| European | 9 | 0.3% |
| French | 77 | 2.7% |
| German | 800 | 27.6% |
| Irish | 330 | 11.4% |
| Italian | 38 | 1.3% |
| Korean | 12 | 0.4% |
| Mexican | 143 | 4.9% |
| Northern European | 10 | 0.4% |
| Polish | 14 | 0.5% |
| Scotch-Irish | 32 | 1.1% |
| Scottish | 92 | 3.2% |
| Slovak | 5 | 0.2% |
| Swedish | 35 | 1.2% |
| Swiss | 60 | 2.1% |
| Welsh | 43 | 1.5% | View All 20 Rows |
Immigrants in Loudonville
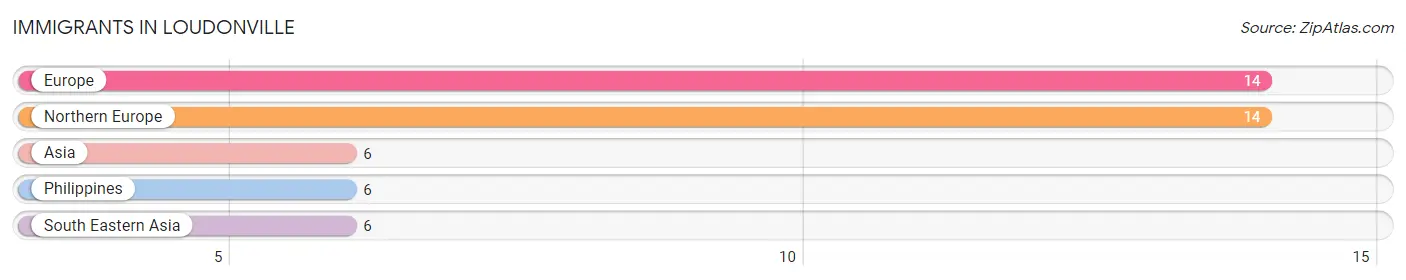
The most numerous immigrant groups reported in Loudonville came from Europe (14 | 0.5%), Northern Europe (14 | 0.5%), Asia (6 | 0.2%), Philippines (6 | 0.2%), and South Eastern Asia (6 | 0.2%), together accounting for 1.6% of all Loudonville residents.
| Immigration Origin | # Population | % Population |
| Asia | 6 | 0.2% |
| Europe | 14 | 0.5% |
| Northern Europe | 14 | 0.5% |
| Philippines | 6 | 0.2% |
| South Eastern Asia | 6 | 0.2% | View All 5 Rows |
Sex and Age in Loudonville
Sex and Age in Loudonville
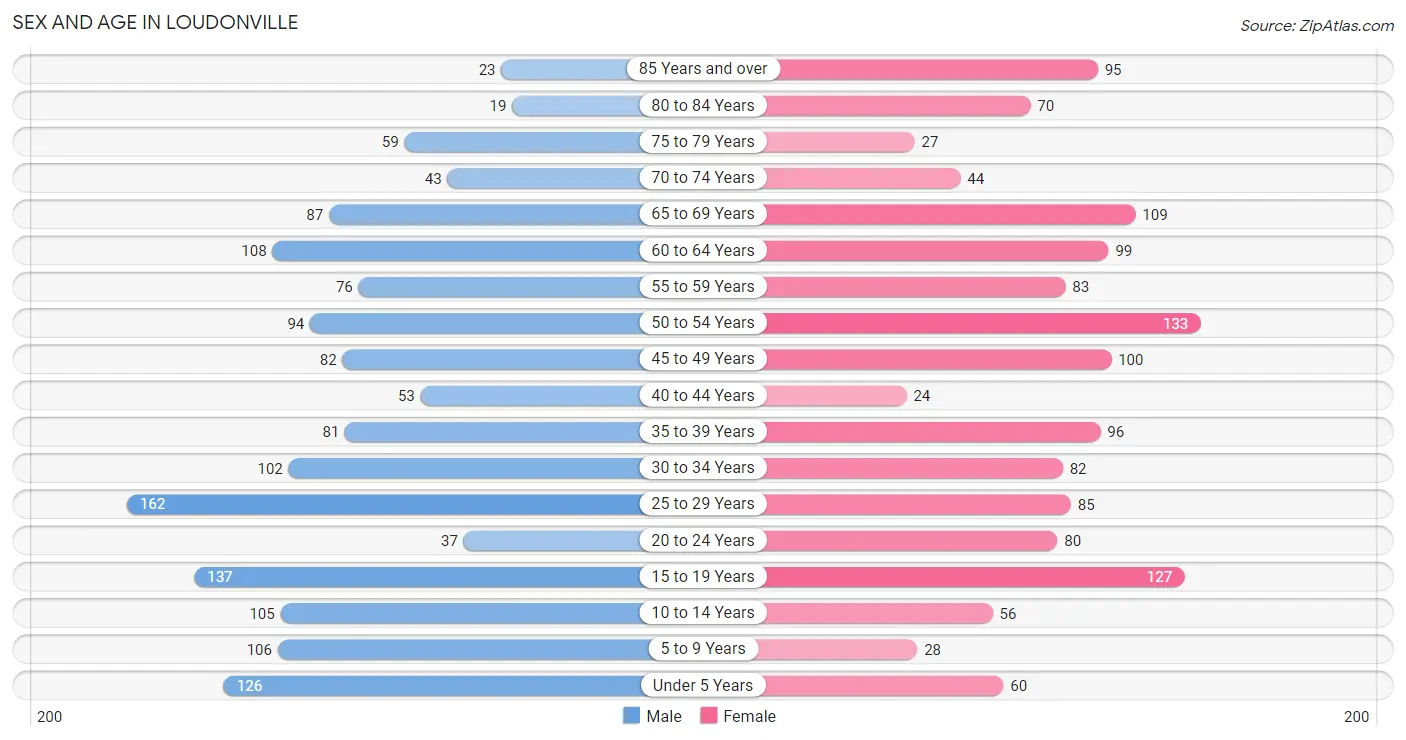
The most populous age groups in Loudonville are 25 to 29 Years (162 | 10.8%) for men and 50 to 54 Years (133 | 9.5%) for women.
| Age Bracket | Male | Female |
| Under 5 Years | 126 (8.4%) | 60 (4.3%) |
| 5 to 9 Years | 106 (7.1%) | 28 (2.0%) |
| 10 to 14 Years | 105 (7.0%) | 56 (4.0%) |
| 15 to 19 Years | 137 (9.1%) | 127 (9.1%) |
| 20 to 24 Years | 37 (2.5%) | 80 (5.7%) |
| 25 to 29 Years | 162 (10.8%) | 85 (6.1%) |
| 30 to 34 Years | 102 (6.8%) | 82 (5.9%) |
| 35 to 39 Years | 81 (5.4%) | 96 (6.9%) |
| 40 to 44 Years | 53 (3.5%) | 24 (1.7%) |
| 45 to 49 Years | 82 (5.5%) | 100 (7.1%) |
| 50 to 54 Years | 94 (6.3%) | 133 (9.5%) |
| 55 to 59 Years | 76 (5.1%) | 83 (5.9%) |
| 60 to 64 Years | 108 (7.2%) | 99 (7.1%) |
| 65 to 69 Years | 87 (5.8%) | 109 (7.8%) |
| 70 to 74 Years | 43 (2.9%) | 44 (3.2%) |
| 75 to 79 Years | 59 (3.9%) | 27 (1.9%) |
| 80 to 84 Years | 19 (1.3%) | 70 (5.0%) |
| 85 Years and over | 23 (1.5%) | 95 (6.8%) |
| Total | 1,500 (100.0%) | 1,398 (100.0%) |
Families and Households in Loudonville
Median Family Size in Loudonville
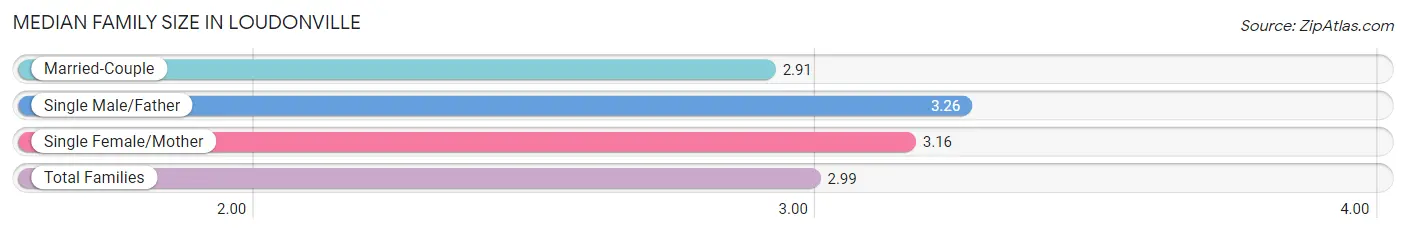
The median family size in Loudonville is 2.99 persons per family, with single male/father families (69 | 10.3%) accounting for the largest median family size of 3.26 persons per family. On the other hand, married-couple families (480 | 71.6%) represent the smallest median family size with 2.91 persons per family.
| Family Type | # Families | Family Size |
| Married-Couple | 480 (71.6%) | 2.91 |
| Single Male/Father | 69 (10.3%) | 3.26 |
| Single Female/Mother | 121 (18.1%) | 3.16 |
| Total Families | 670 (100.0%) | 2.99 |
Median Household Size in Loudonville
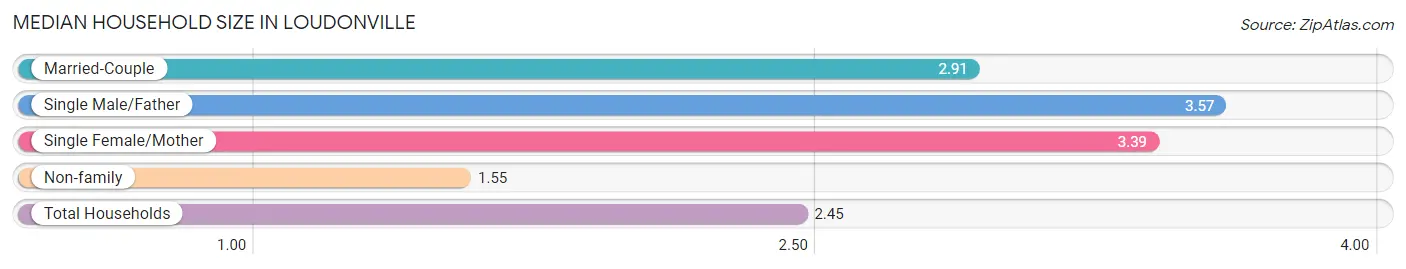
The median household size in Loudonville is 2.45 persons per household, with single male/father households (69 | 6.1%) accounting for the largest median household size of 3.57 persons per household. non-family households (459 | 40.7%) represent the smallest median household size with 1.55 persons per household.
| Household Type | # Households | Household Size |
| Married-Couple | 480 (42.5%) | 2.91 |
| Single Male/Father | 69 (6.1%) | 3.57 |
| Single Female/Mother | 121 (10.7%) | 3.39 |
| Non-family | 459 (40.7%) | 1.55 |
| Total Households | 1,129 (100.0%) | 2.45 |
Household Size by Marriage Status in Loudonville
Out of a total of 1,129 households in Loudonville, 670 (59.3%) are family households, while 459 (40.7%) are nonfamily households. The most numerous type of family households are 2-person households, comprising 387, and the most common type of nonfamily households are 1-person households, comprising 342.
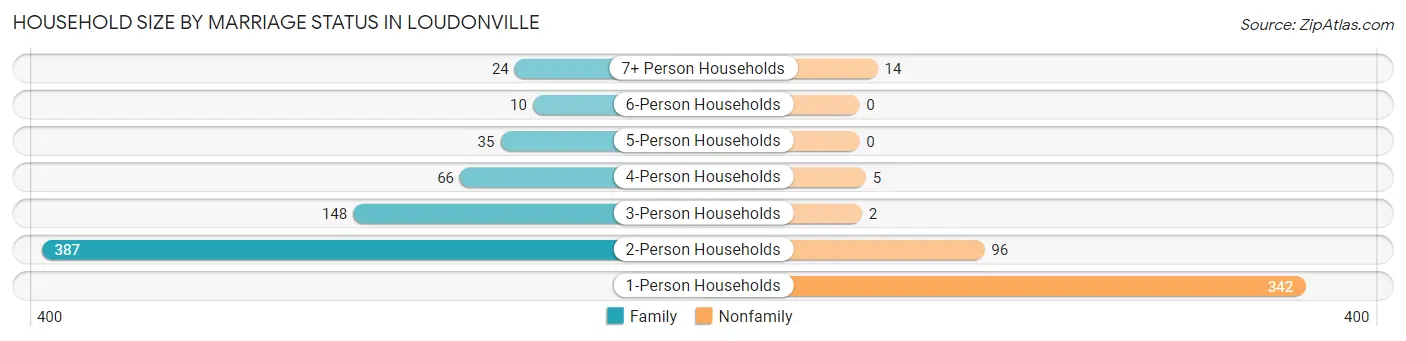
| Household Size | Family Households | Nonfamily Households |
| 1-Person Households | - | 342 (30.3%) |
| 2-Person Households | 387 (34.3%) | 96 (8.5%) |
| 3-Person Households | 148 (13.1%) | 2 (0.2%) |
| 4-Person Households | 66 (5.9%) | 5 (0.4%) |
| 5-Person Households | 35 (3.1%) | 0 (0.0%) |
| 6-Person Households | 10 (0.9%) | 0 (0.0%) |
| 7+ Person Households | 24 (2.1%) | 14 (1.2%) |
| Total | 670 (59.3%) | 459 (40.7%) |
Female Fertility in Loudonville
Fertility by Age in Loudonville
Average fertility rate in Loudonville is 58.0 births per 1,000 women. Women in the age bracket of 20 to 34 years have the highest fertility rate with 146.0 births per 1,000 women. Women in the age bracket of 20 to 34 years acount for 100.0% of all women with births.
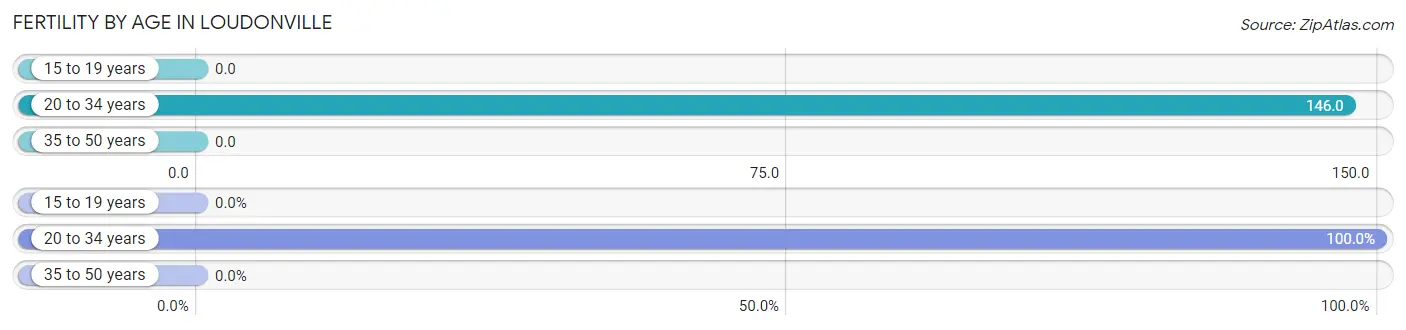
| Age Bracket | Women with Births | Births / 1,000 Women |
| 15 to 19 years | 0 (0.0%) | 0.0 |
| 20 to 34 years | 36 (100.0%) | 146.0 |
| 35 to 50 years | 0 (0.0%) | 0.0 |
| Total | 36 (100.0%) | 58.0 |
Fertility by Age by Marriage Status in Loudonville
86.1% of women with births (36) in Loudonville are married. The highest percentage of unmarried women with births falls into 20 to 34 years age bracket with 13.9% of them unmarried at the time of birth, while the lowest percentage of unmarried women with births belong to 20 to 34 years age bracket with 13.9% of them unmarried.
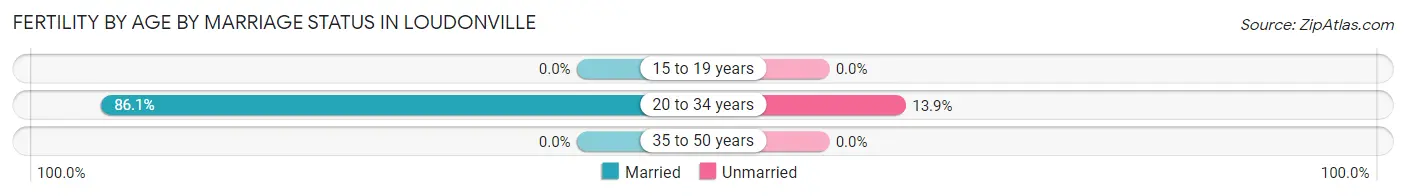
| Age Bracket | Married | Unmarried |
| 15 to 19 years | 0 (0.0%) | 0 (0.0%) |
| 20 to 34 years | 31 (86.1%) | 5 (13.9%) |
| 35 to 50 years | 0 (0.0%) | 0 (0.0%) |
| Total | 31 (86.1%) | 5 (13.9%) |
Fertility by Education in Loudonville
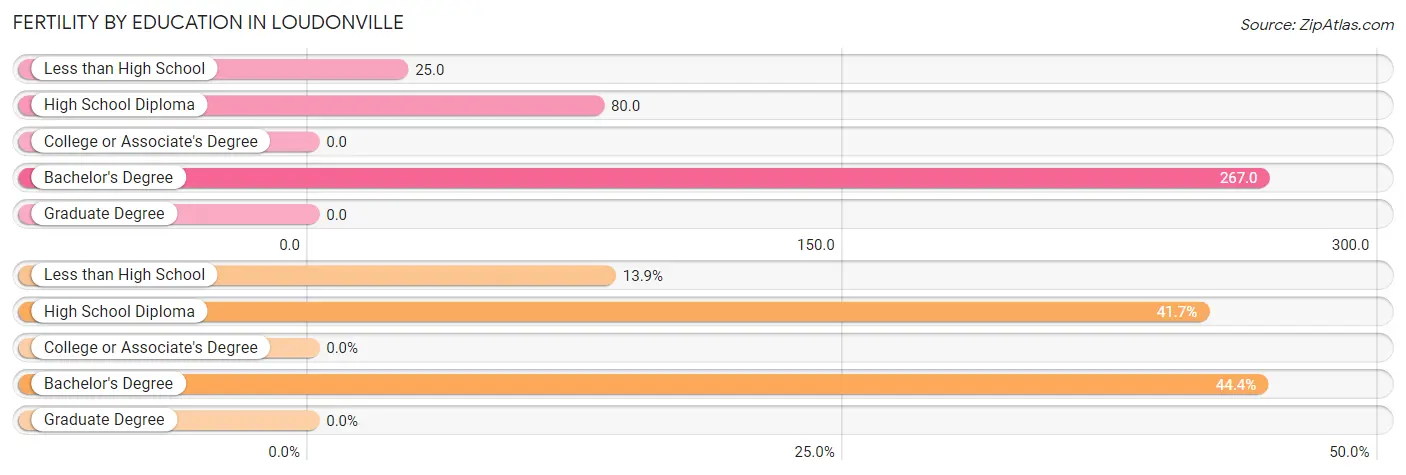
| Educational Attainment | Women with Births | Births / 1,000 Women |
| Less than High School | 5 (13.9%) | 25.0 |
| High School Diploma | 15 (41.7%) | 80.0 |
| College or Associate's Degree | 0 (0.0%) | 0.0 |
| Bachelor's Degree | 16 (44.4%) | 267.0 |
| Graduate Degree | 0 (0.0%) | 0.0 |
| Total | 36 (100.0%) | 58.0 |
Fertility by Education by Marriage Status in Loudonville
13.9% of women with births in Loudonville are unmarried. Women with the educational attainment of high school diploma are most likely to be married with 100.0% of them married at childbirth, while women with the educational attainment of less than high school are least likely to be married with 100.0% of them unmarried at childbirth.
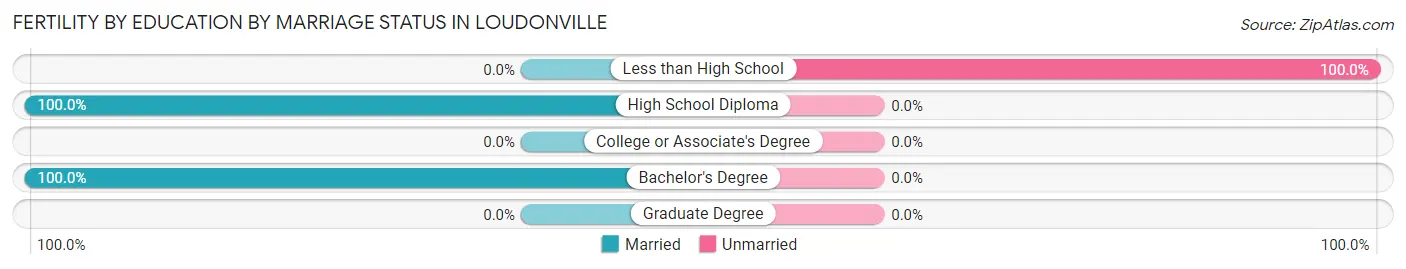
| Educational Attainment | Married | Unmarried |
| Less than High School | 0 (0.0%) | 5 (100.0%) |
| High School Diploma | 15 (100.0%) | 0 (0.0%) |
| College or Associate's Degree | 0 (0.0%) | 0 (0.0%) |
| Bachelor's Degree | 16 (100.0%) | 0 (0.0%) |
| Graduate Degree | 0 (0.0%) | 0 (0.0%) |
| Total | 31 (86.1%) | 5 (13.9%) |
Employment Characteristics in Loudonville
Employment by Class of Employer in Loudonville
Among the 1,303 employed individuals in Loudonville, private company employees (1,050 | 80.6%), local government employees (76 | 5.8%), and not-for-profit organizations (72 | 5.5%) make up the most common classes of employment.
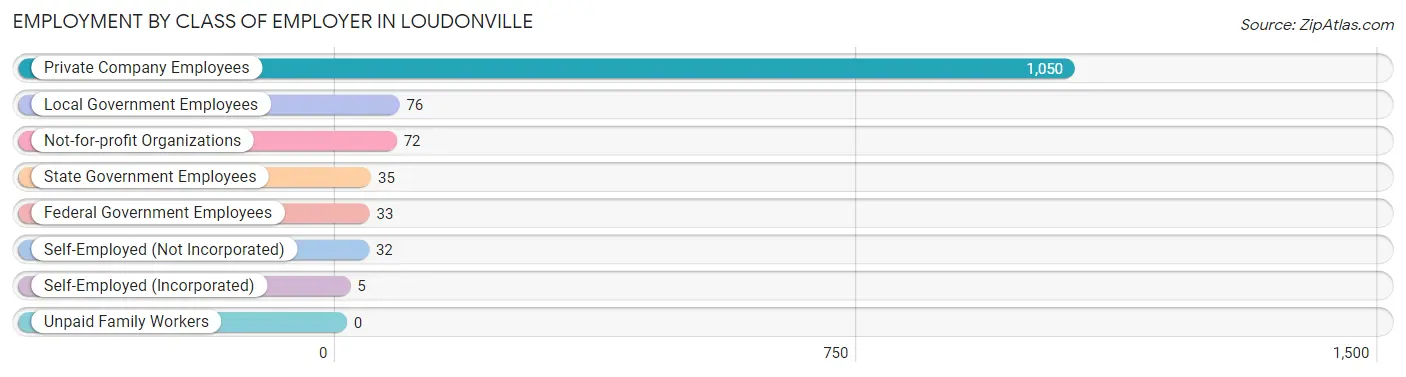
| Employer Class | # Employees | % Employees |
| Private Company Employees | 1,050 | 80.6% |
| Self-Employed (Incorporated) | 5 | 0.4% |
| Self-Employed (Not Incorporated) | 32 | 2.5% |
| Not-for-profit Organizations | 72 | 5.5% |
| Local Government Employees | 76 | 5.8% |
| State Government Employees | 35 | 2.7% |
| Federal Government Employees | 33 | 2.5% |
| Unpaid Family Workers | 0 | 0.0% |
| Total | 1,303 | 100.0% |
Employment Status by Age in Loudonville
According to the labor force statistics for Loudonville, out of the total population over 16 years of age (2,404), 57.9% or 1,392 individuals are in the labor force, with 5.1% or 71 of them unemployed. The age group with the highest labor force participation rate is 35 to 44 years, with 84.6% or 215 individuals in the labor force. Within the labor force, the 16 to 19 years age range has the highest percentage of unemployed individuals, with 30.6% or 45 of them being unemployed.
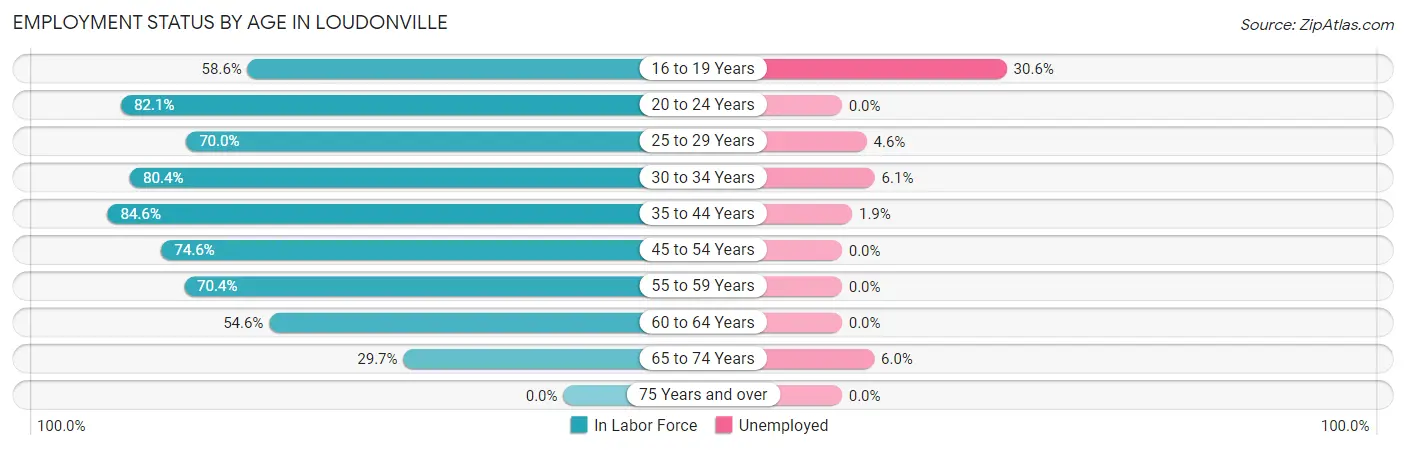
| Age Bracket | In Labor Force | Unemployed |
| 16 to 19 Years | 147 (58.6%) | 45 (30.6%) |
| 20 to 24 Years | 96 (82.1%) | 0 (0.0%) |
| 25 to 29 Years | 173 (70.0%) | 8 (4.6%) |
| 30 to 34 Years | 148 (80.4%) | 9 (6.1%) |
| 35 to 44 Years | 215 (84.6%) | 4 (1.9%) |
| 45 to 54 Years | 305 (74.6%) | 0 (0.0%) |
| 55 to 59 Years | 112 (70.4%) | 0 (0.0%) |
| 60 to 64 Years | 113 (54.6%) | 0 (0.0%) |
| 65 to 74 Years | 84 (29.7%) | 5 (6.0%) |
| 75 Years and over | 0 (0.0%) | 0 (0.0%) |
| Total | 1,392 (57.9%) | 71 (5.1%) |
Employment Status by Educational Attainment in Loudonville
According to labor force statistics for Loudonville, 73.0% of individuals (1,066) out of the total population between 25 and 64 years of age (1,460) are in the labor force, with 2.0% or 21 of them being unemployed. The group with the highest labor force participation rate are those with the educational attainment of college / associate degree, with 86.9% or 425 individuals in the labor force. Within the labor force, individuals with college / associate degree education have the highest percentage of unemployment, with 2.8% or 12 of them being unemployed.

| Educational Attainment | In Labor Force | Unemployed |
| Less than High School | 105 (60.7%) | 0 (0.0%) |
| High School Diploma | 401 (63.0%) | 14 (2.2%) |
| College / Associate Degree | 425 (86.9%) | 14 (2.8%) |
| Bachelor's Degree or higher | 135 (83.9%) | 0 (0.0%) |
| Total | 1,066 (73.0%) | 29 (2.0%) |
Employment Occupations by Sex in Loudonville
Management, Business, Science and Arts Occupations
The most common Management, Business, Science and Arts occupations in Loudonville are Management (74 | 5.6%), Community & Social Service (72 | 5.4%), Education Instruction & Library (49 | 3.7%), Health Diagnosing & Treating (47 | 3.6%), and Computers, Engineering & Science (35 | 2.6%).
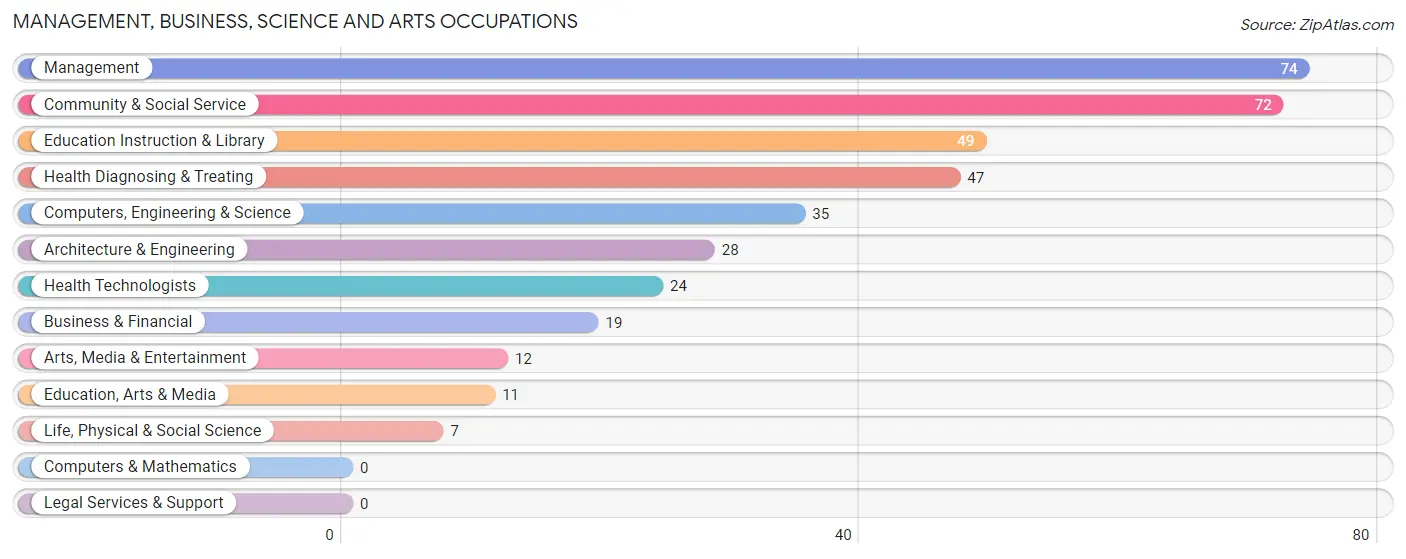
Management, Business, Science and Arts Occupations by Sex
Within the Management, Business, Science and Arts occupations in Loudonville, the most male-oriented occupations are Business & Financial (78.9%), Management (64.9%), and Arts, Media & Entertainment (50.0%), while the most female-oriented occupations are Life, Physical & Social Science (100.0%), Education Instruction & Library (79.6%), and Health Diagnosing & Treating (76.6%).
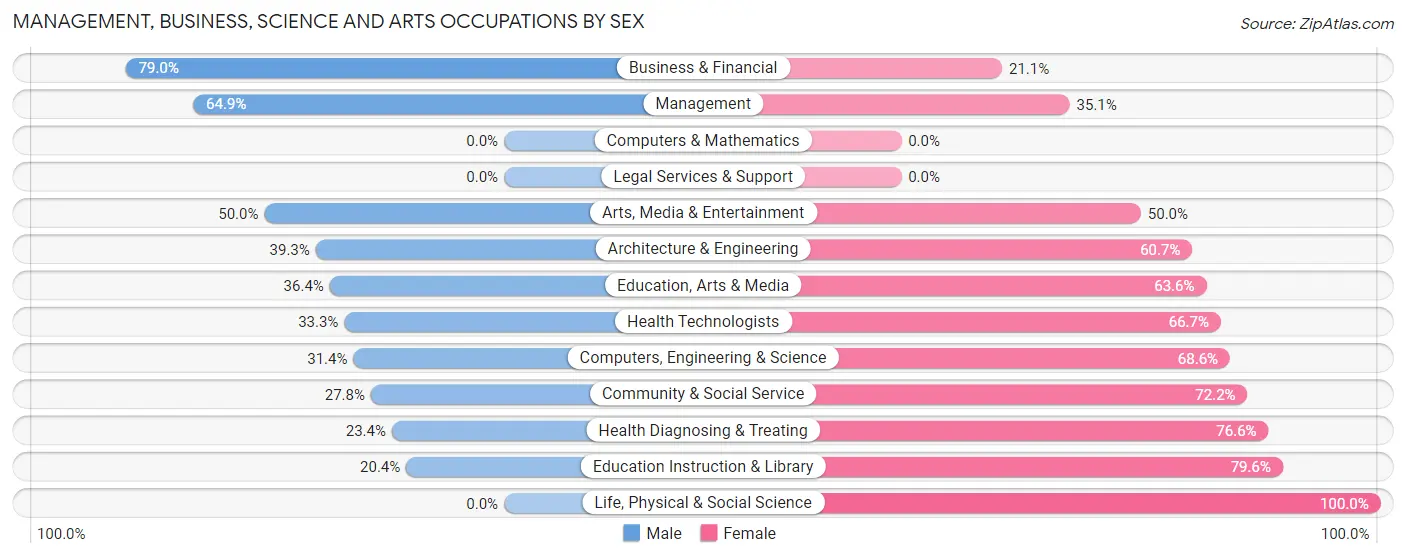
| Occupation | Male | Female |
| Management | 48 (64.9%) | 26 (35.1%) |
| Business & Financial | 15 (78.9%) | 4 (21.0%) |
| Computers, Engineering & Science | 11 (31.4%) | 24 (68.6%) |
| Computers & Mathematics | 0 (0.0%) | 0 (0.0%) |
| Architecture & Engineering | 11 (39.3%) | 17 (60.7%) |
| Life, Physical & Social Science | 0 (0.0%) | 7 (100.0%) |
| Community & Social Service | 20 (27.8%) | 52 (72.2%) |
| Education, Arts & Media | 4 (36.4%) | 7 (63.6%) |
| Legal Services & Support | 0 (0.0%) | 0 (0.0%) |
| Education Instruction & Library | 10 (20.4%) | 39 (79.6%) |
| Arts, Media & Entertainment | 6 (50.0%) | 6 (50.0%) |
| Health Diagnosing & Treating | 11 (23.4%) | 36 (76.6%) |
| Health Technologists | 8 (33.3%) | 16 (66.7%) |
| Total (Category) | 105 (42.5%) | 142 (57.5%) |
| Total (Overall) | 664 (50.2%) | 658 (49.8%) |
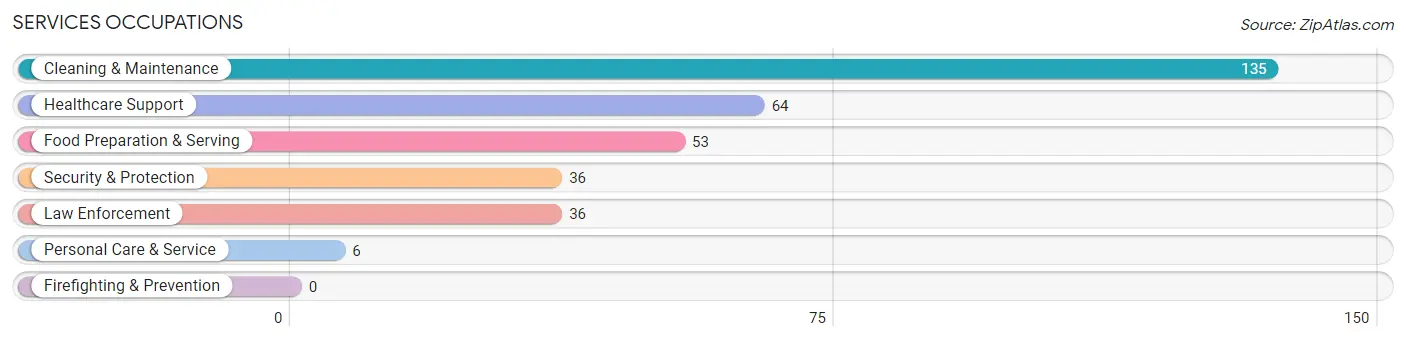
Services Occupations
The most common Services occupations in Loudonville are Cleaning & Maintenance (135 | 10.2%), Healthcare Support (64 | 4.8%), Food Preparation & Serving (53 | 4.0%), Security & Protection (36 | 2.7%), and Law Enforcement (36 | 2.7%).
Services Occupations by Sex
Within the Services occupations in Loudonville, the most male-oriented occupations are Security & Protection (100.0%), Law Enforcement (100.0%), and Food Preparation & Serving (43.4%), while the most female-oriented occupations are Healthcare Support (100.0%), Personal Care & Service (100.0%), and Cleaning & Maintenance (91.1%).
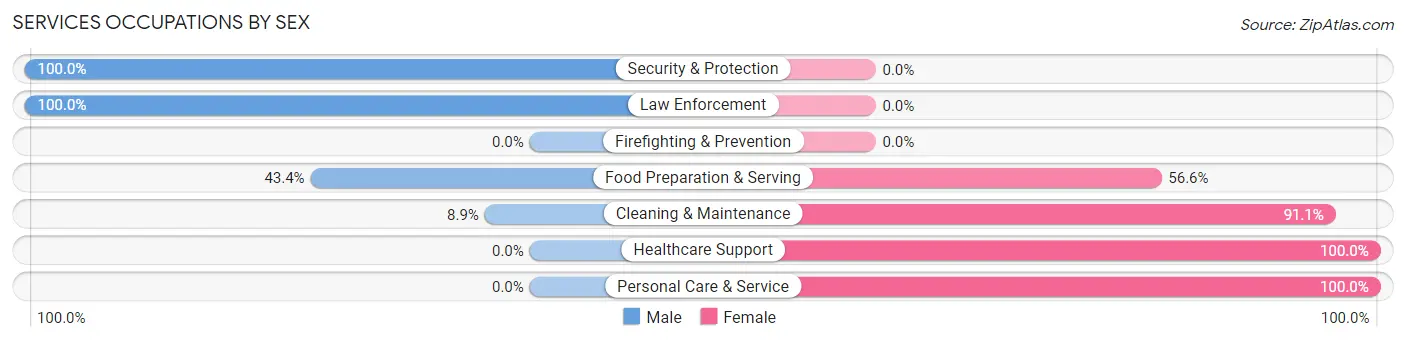
| Occupation | Male | Female |
| Healthcare Support | 0 (0.0%) | 64 (100.0%) |
| Security & Protection | 36 (100.0%) | 0 (0.0%) |
| Firefighting & Prevention | 0 (0.0%) | 0 (0.0%) |
| Law Enforcement | 36 (100.0%) | 0 (0.0%) |
| Food Preparation & Serving | 23 (43.4%) | 30 (56.6%) |
| Cleaning & Maintenance | 12 (8.9%) | 123 (91.1%) |
| Personal Care & Service | 0 (0.0%) | 6 (100.0%) |
| Total (Category) | 71 (24.1%) | 223 (75.8%) |
| Total (Overall) | 664 (50.2%) | 658 (49.8%) |
Sales and Office Occupations
The most common Sales and Office occupations in Loudonville are Office & Administration (204 | 15.4%), and Sales & Related (100 | 7.6%).

Sales and Office Occupations by Sex

| Occupation | Male | Female |
| Sales & Related | 52 (52.0%) | 48 (48.0%) |
| Office & Administration | 93 (45.6%) | 111 (54.4%) |
| Total (Category) | 145 (47.7%) | 159 (52.3%) |
| Total (Overall) | 664 (50.2%) | 658 (49.8%) |
Natural Resources, Construction and Maintenance Occupations
The most common Natural Resources, Construction and Maintenance occupations in Loudonville are Installation, Maintenance & Repair (63 | 4.8%), Construction & Extraction (48 | 3.6%), and Farming, Fishing & Forestry (7 | 0.5%).

Natural Resources, Construction and Maintenance Occupations by Sex

| Occupation | Male | Female |
| Farming, Fishing & Forestry | 0 (0.0%) | 7 (100.0%) |
| Construction & Extraction | 42 (87.5%) | 6 (12.5%) |
| Installation, Maintenance & Repair | 63 (100.0%) | 0 (0.0%) |
| Total (Category) | 105 (89.0%) | 13 (11.0%) |
| Total (Overall) | 664 (50.2%) | 658 (49.8%) |
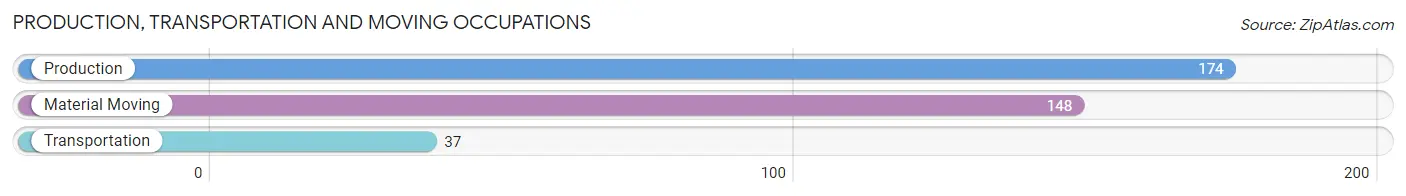
Production, Transportation and Moving Occupations
The most common Production, Transportation and Moving occupations in Loudonville are Production (174 | 13.2%), Material Moving (148 | 11.2%), and Transportation (37 | 2.8%).
Production, Transportation and Moving Occupations by Sex
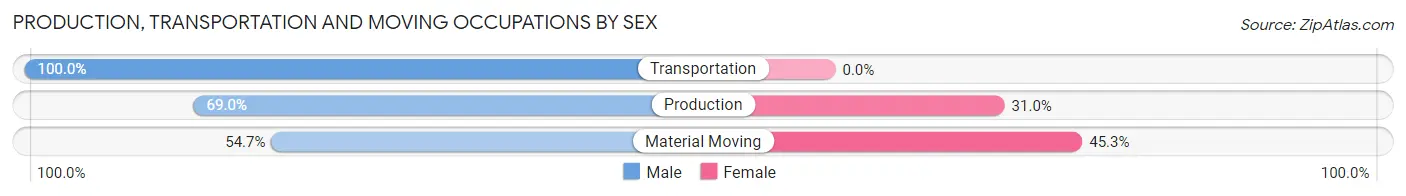
| Occupation | Male | Female |
| Production | 120 (69.0%) | 54 (31.0%) |
| Transportation | 37 (100.0%) | 0 (0.0%) |
| Material Moving | 81 (54.7%) | 67 (45.3%) |
| Total (Category) | 238 (66.3%) | 121 (33.7%) |
| Total (Overall) | 664 (50.2%) | 658 (49.8%) |
Employment Industries by Sex in Loudonville
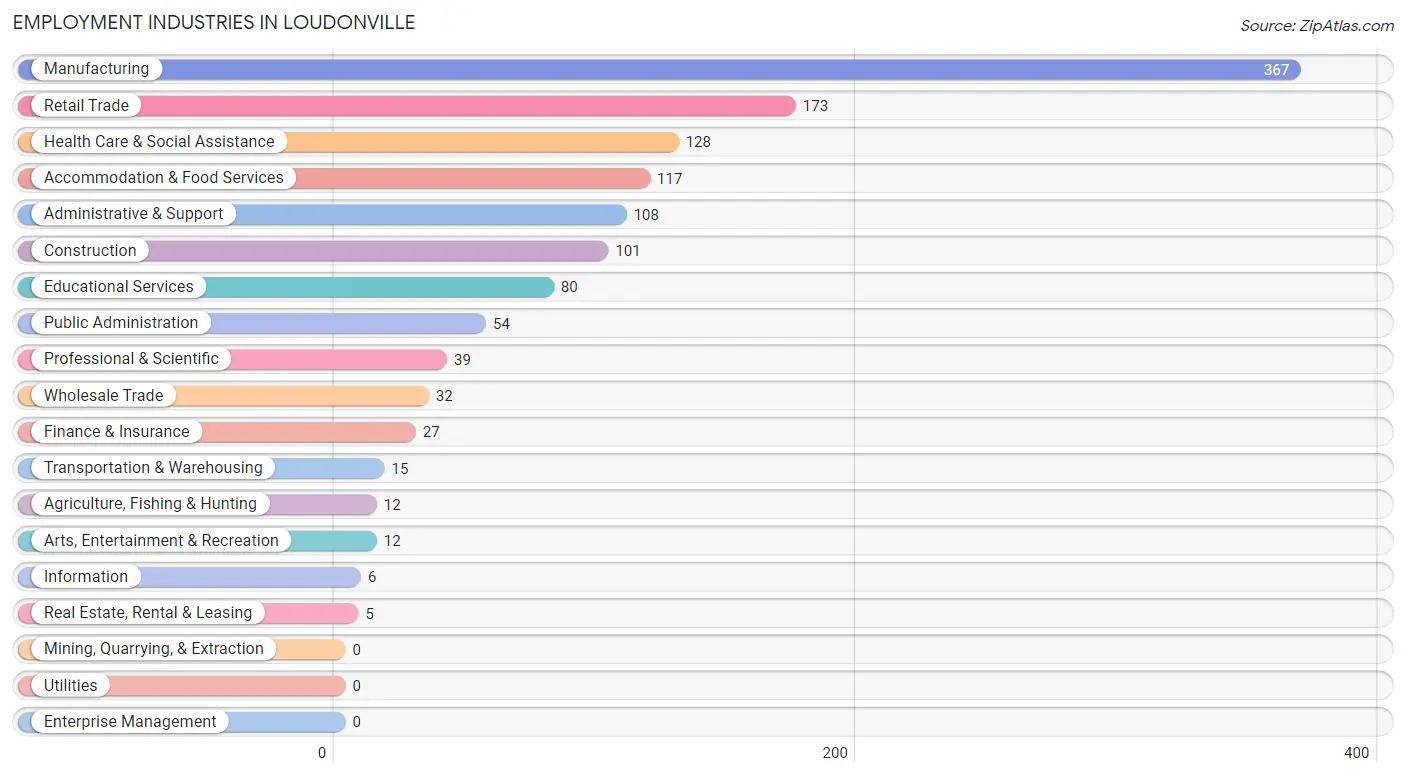
Employment Industries in Loudonville
The major employment industries in Loudonville include Manufacturing (367 | 27.8%), Retail Trade (173 | 13.1%), Health Care & Social Assistance (128 | 9.7%), Accommodation & Food Services (117 | 8.8%), and Administrative & Support (108 | 8.2%).
Employment Industries by Sex in Loudonville
The Loudonville industries that see more men than women are Transportation & Warehousing (100.0%), Arts, Entertainment & Recreation (100.0%), and Construction (94.1%), whereas the industries that tend to have a higher number of women are Agriculture, Fishing & Hunting (100.0%), Information (100.0%), and Real Estate, Rental & Leasing (100.0%).
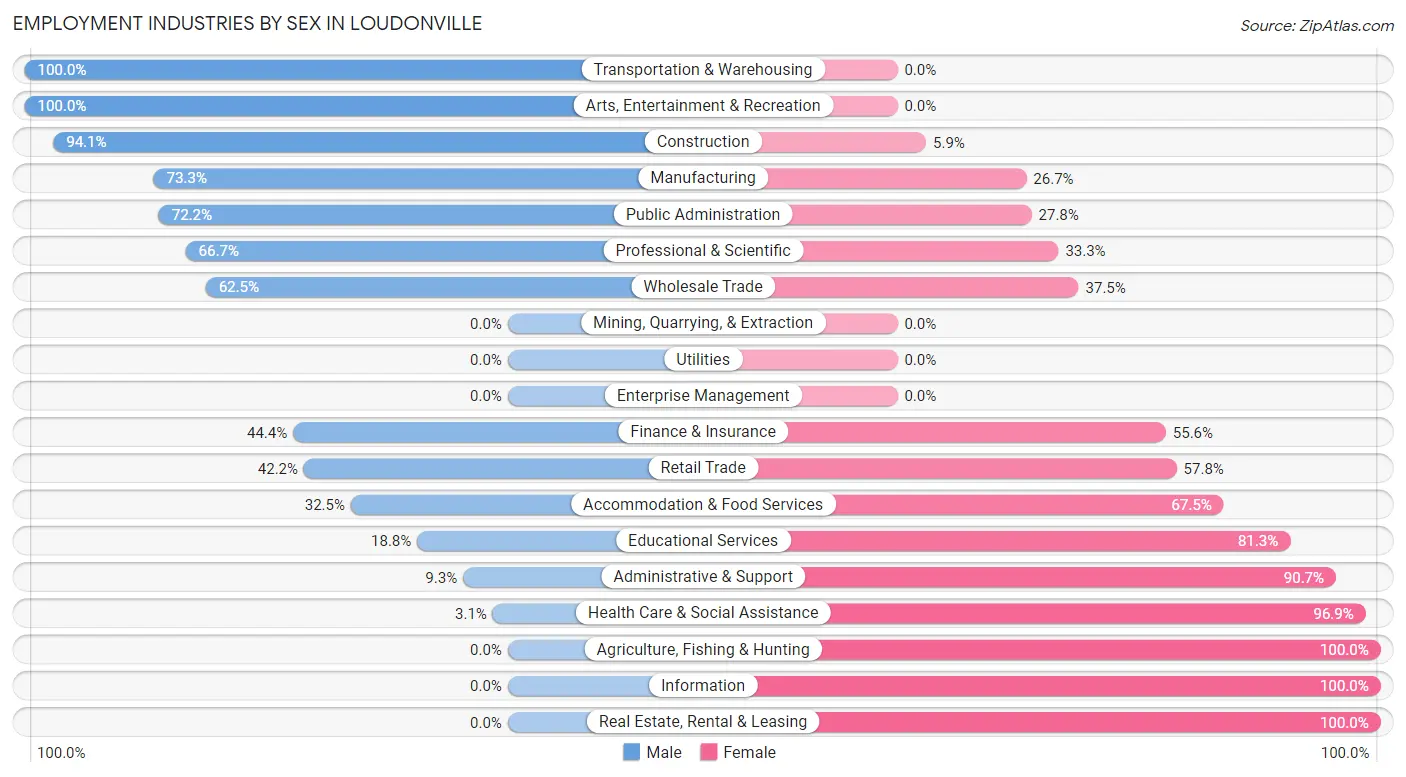
| Industry | Male | Female |
| Agriculture, Fishing & Hunting | 0 (0.0%) | 12 (100.0%) |
| Mining, Quarrying, & Extraction | 0 (0.0%) | 0 (0.0%) |
| Construction | 95 (94.1%) | 6 (5.9%) |
| Manufacturing | 269 (73.3%) | 98 (26.7%) |
| Wholesale Trade | 20 (62.5%) | 12 (37.5%) |
| Retail Trade | 73 (42.2%) | 100 (57.8%) |
| Transportation & Warehousing | 15 (100.0%) | 0 (0.0%) |
| Utilities | 0 (0.0%) | 0 (0.0%) |
| Information | 0 (0.0%) | 6 (100.0%) |
| Finance & Insurance | 12 (44.4%) | 15 (55.6%) |
| Real Estate, Rental & Leasing | 0 (0.0%) | 5 (100.0%) |
| Professional & Scientific | 26 (66.7%) | 13 (33.3%) |
| Enterprise Management | 0 (0.0%) | 0 (0.0%) |
| Administrative & Support | 10 (9.3%) | 98 (90.7%) |
| Educational Services | 15 (18.8%) | 65 (81.2%) |
| Health Care & Social Assistance | 4 (3.1%) | 124 (96.9%) |
| Arts, Entertainment & Recreation | 12 (100.0%) | 0 (0.0%) |
| Accommodation & Food Services | 38 (32.5%) | 79 (67.5%) |
| Public Administration | 39 (72.2%) | 15 (27.8%) |
| Total | 664 (50.2%) | 658 (49.8%) |
Education in Loudonville
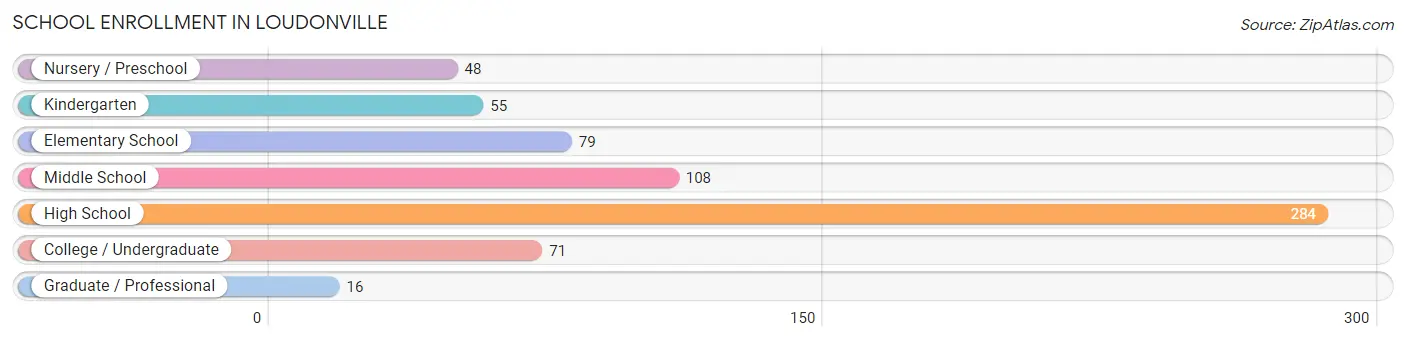
School Enrollment in Loudonville
The most common levels of schooling among the 661 students in Loudonville are high school (284 | 43.0%), middle school (108 | 16.3%), and elementary school (79 | 11.9%).
| School Level | # Students | % Students |
| Nursery / Preschool | 48 | 7.3% |
| Kindergarten | 55 | 8.3% |
| Elementary School | 79 | 11.9% |
| Middle School | 108 | 16.3% |
| High School | 284 | 43.0% |
| College / Undergraduate | 71 | 10.7% |
| Graduate / Professional | 16 | 2.4% |
| Total | 661 | 100.0% |
School Enrollment by Age by Funding Source in Loudonville
Out of a total of 661 students who are enrolled in schools in Loudonville, 57 (8.6%) attend a private institution, while the remaining 604 (91.4%) are enrolled in public schools. The age group of 18 to 19 year olds has the highest likelihood of being enrolled in private schools, with 32 (49.2% in the age bracket) enrolled. Conversely, the age group of 3 to 4 year olds has the lowest likelihood of being enrolled in a private school, with 48 (100.0% in the age bracket) attending a public institution.
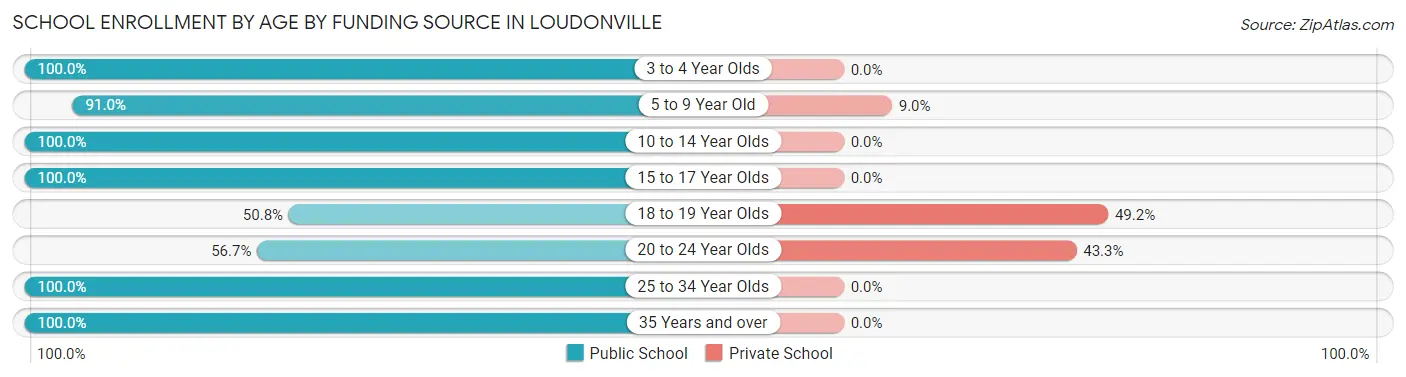
| Age Bracket | Public School | Private School |
| 3 to 4 Year Olds | 48 (100.0%) | 0 (0.0%) |
| 5 to 9 Year Old | 122 (91.0%) | 12 (9.0%) |
| 10 to 14 Year Olds | 158 (100.0%) | 0 (0.0%) |
| 15 to 17 Year Olds | 183 (100.0%) | 0 (0.0%) |
| 18 to 19 Year Olds | 33 (50.8%) | 32 (49.2%) |
| 20 to 24 Year Olds | 17 (56.7%) | 13 (43.3%) |
| 25 to 34 Year Olds | 16 (100.0%) | 0 (0.0%) |
| 35 Years and over | 27 (100.0%) | 0 (0.0%) |
| Total | 604 (91.4%) | 57 (8.6%) |
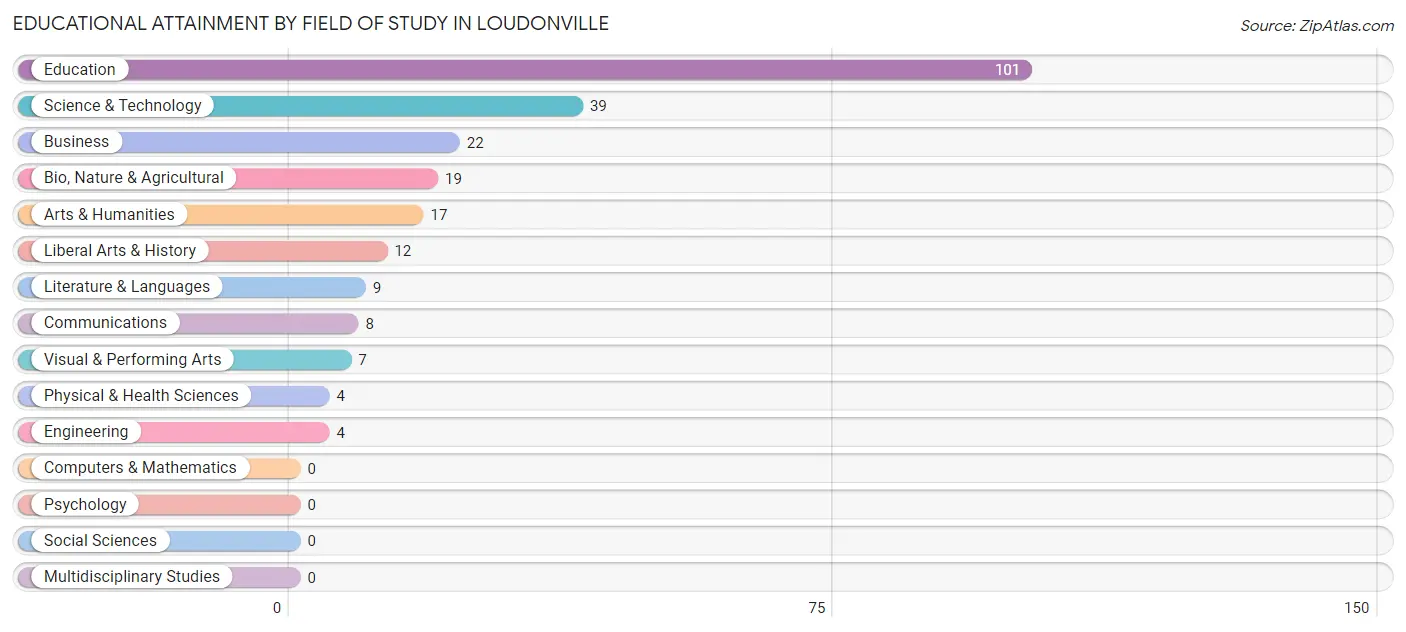
Educational Attainment by Field of Study in Loudonville
Education (101 | 41.7%), science & technology (39 | 16.1%), business (22 | 9.1%), bio, nature & agricultural (19 | 7.9%), and arts & humanities (17 | 7.0%) are the most common fields of study among 242 individuals in Loudonville who have obtained a bachelor's degree or higher.
| Field of Study | # Graduates | % Graduates |
| Computers & Mathematics | 0 | 0.0% |
| Bio, Nature & Agricultural | 19 | 7.9% |
| Physical & Health Sciences | 4 | 1.7% |
| Psychology | 0 | 0.0% |
| Social Sciences | 0 | 0.0% |
| Engineering | 4 | 1.7% |
| Multidisciplinary Studies | 0 | 0.0% |
| Science & Technology | 39 | 16.1% |
| Business | 22 | 9.1% |
| Education | 101 | 41.7% |
| Literature & Languages | 9 | 3.7% |
| Liberal Arts & History | 12 | 5.0% |
| Visual & Performing Arts | 7 | 2.9% |
| Communications | 8 | 3.3% |
| Arts & Humanities | 17 | 7.0% |
| Total | 242 | 100.0% |
Transportation & Commute in Loudonville
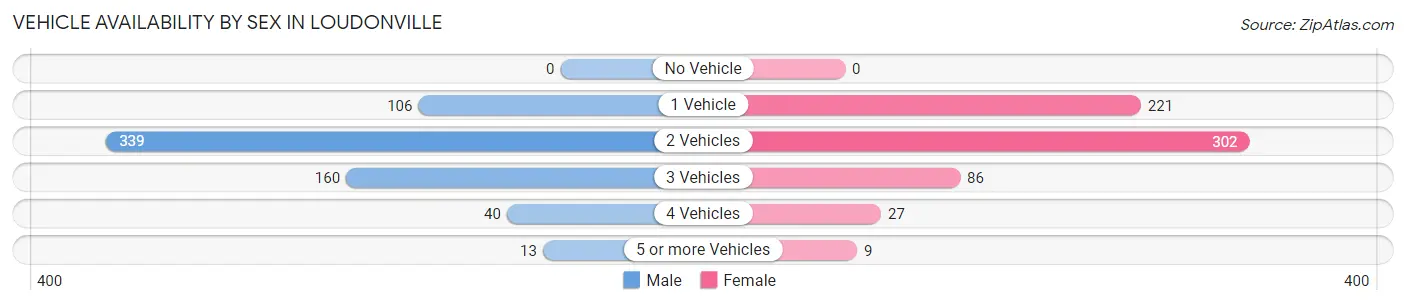
Vehicle Availability by Sex in Loudonville
The most prevalent vehicle ownership categories in Loudonville are males with 2 vehicles (339, accounting for 51.5%) and females with 2 vehicles (302, making up 52.6%).
| Vehicles Available | Male | Female |
| No Vehicle | 0 (0.0%) | 0 (0.0%) |
| 1 Vehicle | 106 (16.1%) | 221 (34.3%) |
| 2 Vehicles | 339 (51.5%) | 302 (46.8%) |
| 3 Vehicles | 160 (24.3%) | 86 (13.3%) |
| 4 Vehicles | 40 (6.1%) | 27 (4.2%) |
| 5 or more Vehicles | 13 (2.0%) | 9 (1.4%) |
| Total | 658 (100.0%) | 645 (100.0%) |
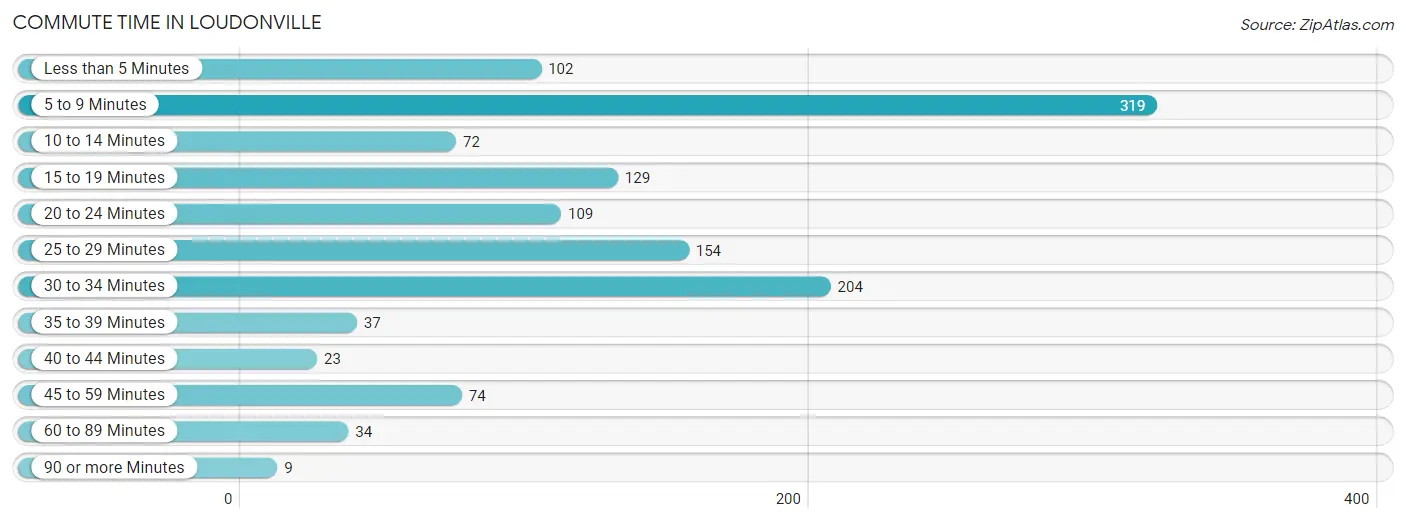
Commute Time in Loudonville
The most frequently occuring commute durations in Loudonville are 5 to 9 minutes (319 commuters, 25.2%), 30 to 34 minutes (204 commuters, 16.1%), and 25 to 29 minutes (154 commuters, 12.2%).
| Commute Time | # Commuters | % Commuters |
| Less than 5 Minutes | 102 | 8.1% |
| 5 to 9 Minutes | 319 | 25.2% |
| 10 to 14 Minutes | 72 | 5.7% |
| 15 to 19 Minutes | 129 | 10.2% |
| 20 to 24 Minutes | 109 | 8.6% |
| 25 to 29 Minutes | 154 | 12.2% |
| 30 to 34 Minutes | 204 | 16.1% |
| 35 to 39 Minutes | 37 | 2.9% |
| 40 to 44 Minutes | 23 | 1.8% |
| 45 to 59 Minutes | 74 | 5.9% |
| 60 to 89 Minutes | 34 | 2.7% |
| 90 or more Minutes | 9 | 0.7% |
Commute Time by Sex in Loudonville
The most common commute times in Loudonville are 5 to 9 minutes (129 commuters, 20.0%) for males and 5 to 9 minutes (190 commuters, 30.6%) for females.
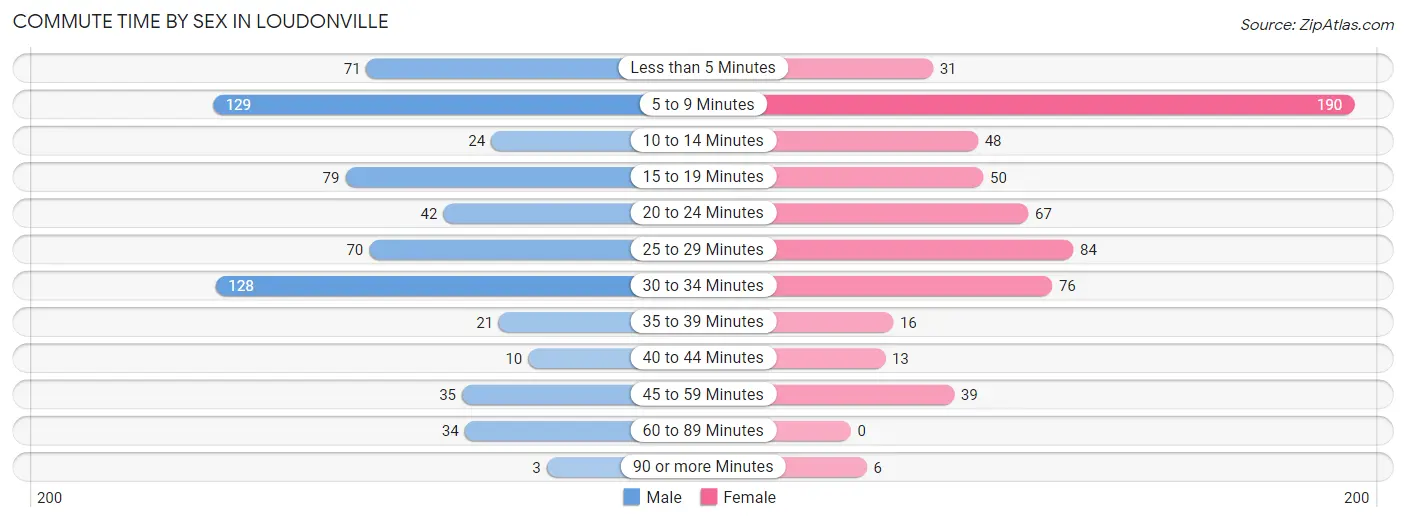
| Commute Time | Male | Female |
| Less than 5 Minutes | 71 (11.0%) | 31 (5.0%) |
| 5 to 9 Minutes | 129 (20.0%) | 190 (30.6%) |
| 10 to 14 Minutes | 24 (3.7%) | 48 (7.7%) |
| 15 to 19 Minutes | 79 (12.2%) | 50 (8.1%) |
| 20 to 24 Minutes | 42 (6.5%) | 67 (10.8%) |
| 25 to 29 Minutes | 70 (10.8%) | 84 (13.6%) |
| 30 to 34 Minutes | 128 (19.8%) | 76 (12.3%) |
| 35 to 39 Minutes | 21 (3.3%) | 16 (2.6%) |
| 40 to 44 Minutes | 10 (1.5%) | 13 (2.1%) |
| 45 to 59 Minutes | 35 (5.4%) | 39 (6.3%) |
| 60 to 89 Minutes | 34 (5.3%) | 0 (0.0%) |
| 90 or more Minutes | 3 (0.5%) | 6 (1.0%) |
Time of Departure to Work by Sex in Loudonville
The most frequent times of departure to work in Loudonville are 12:00 PM to 3:59 PM (153, 23.7%) for males and 5:30 AM to 5:59 AM (117, 18.9%) for females.
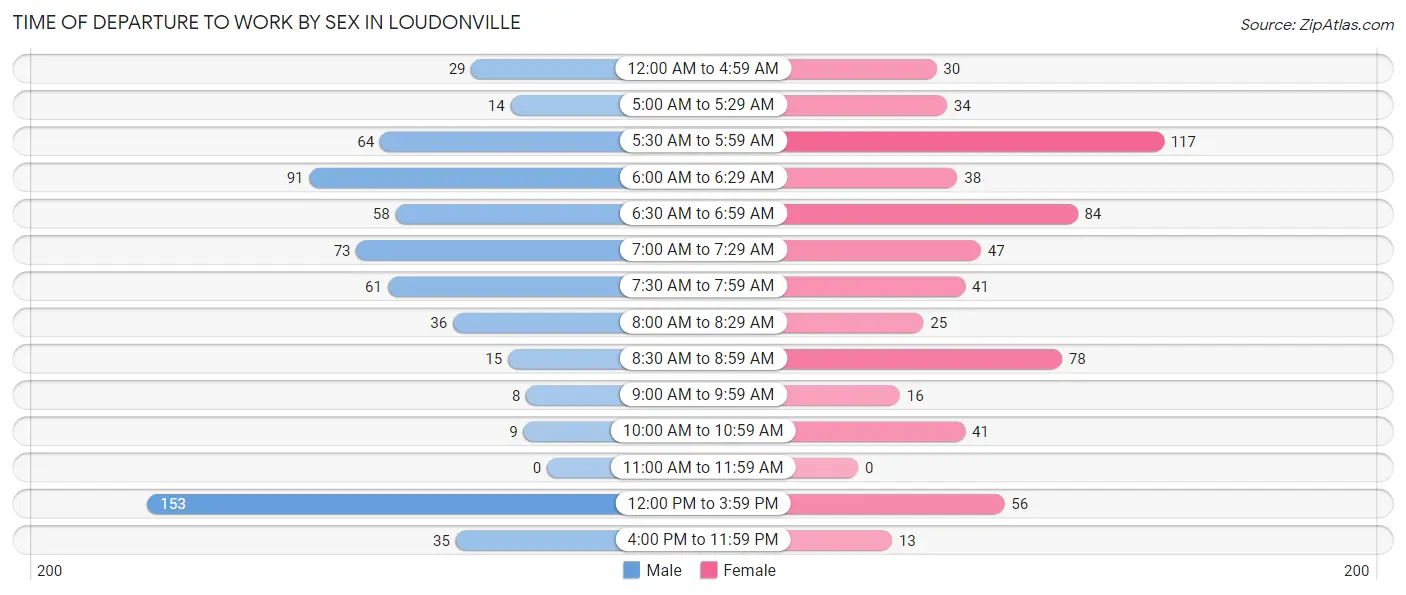
| Time of Departure | Male | Female |
| 12:00 AM to 4:59 AM | 29 (4.5%) | 30 (4.8%) |
| 5:00 AM to 5:29 AM | 14 (2.2%) | 34 (5.5%) |
| 5:30 AM to 5:59 AM | 64 (9.9%) | 117 (18.9%) |
| 6:00 AM to 6:29 AM | 91 (14.1%) | 38 (6.1%) |
| 6:30 AM to 6:59 AM | 58 (9.0%) | 84 (13.6%) |
| 7:00 AM to 7:29 AM | 73 (11.3%) | 47 (7.6%) |
| 7:30 AM to 7:59 AM | 61 (9.4%) | 41 (6.6%) |
| 8:00 AM to 8:29 AM | 36 (5.6%) | 25 (4.0%) |
| 8:30 AM to 8:59 AM | 15 (2.3%) | 78 (12.6%) |
| 9:00 AM to 9:59 AM | 8 (1.2%) | 16 (2.6%) |
| 10:00 AM to 10:59 AM | 9 (1.4%) | 41 (6.6%) |
| 11:00 AM to 11:59 AM | 0 (0.0%) | 0 (0.0%) |
| 12:00 PM to 3:59 PM | 153 (23.7%) | 56 (9.0%) |
| 4:00 PM to 11:59 PM | 35 (5.4%) | 13 (2.1%) |
| Total | 646 (100.0%) | 620 (100.0%) |
Housing Occupancy in Loudonville
Occupancy by Ownership in Loudonville
Of the total 1,129 dwellings in Loudonville, owner-occupied units account for 724 (64.1%), while renter-occupied units make up 405 (35.9%).
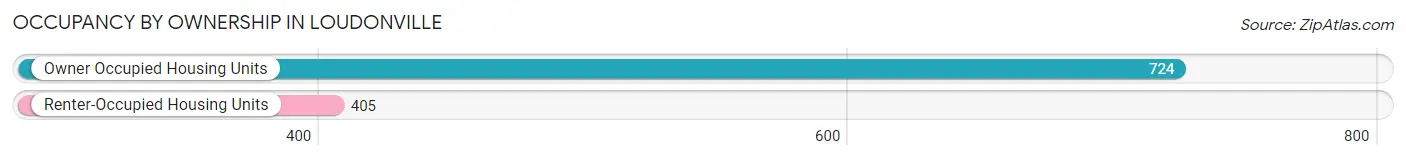
| Occupancy | # Housing Units | % Housing Units |
| Owner Occupied Housing Units | 724 | 64.1% |
| Renter-Occupied Housing Units | 405 | 35.9% |
| Total Occupied Housing Units | 1,129 | 100.0% |
Occupancy by Household Size in Loudonville
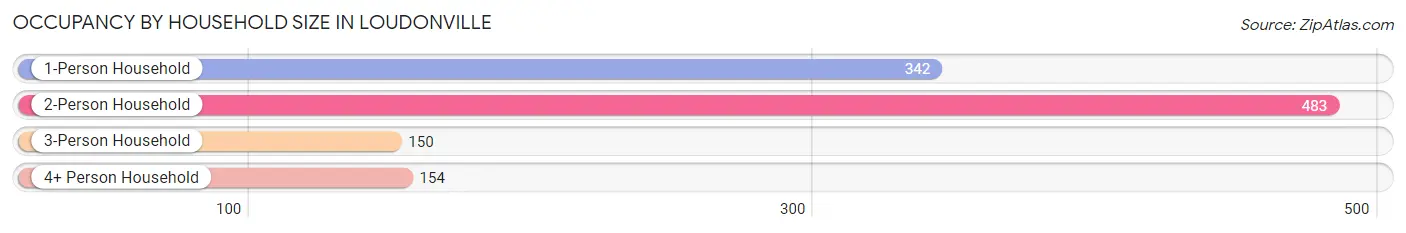
| Household Size | # Housing Units | % Housing Units |
| 1-Person Household | 342 | 30.3% |
| 2-Person Household | 483 | 42.8% |
| 3-Person Household | 150 | 13.3% |
| 4+ Person Household | 154 | 13.6% |
| Total Housing Units | 1,129 | 100.0% |
Occupancy by Ownership by Household Size in Loudonville
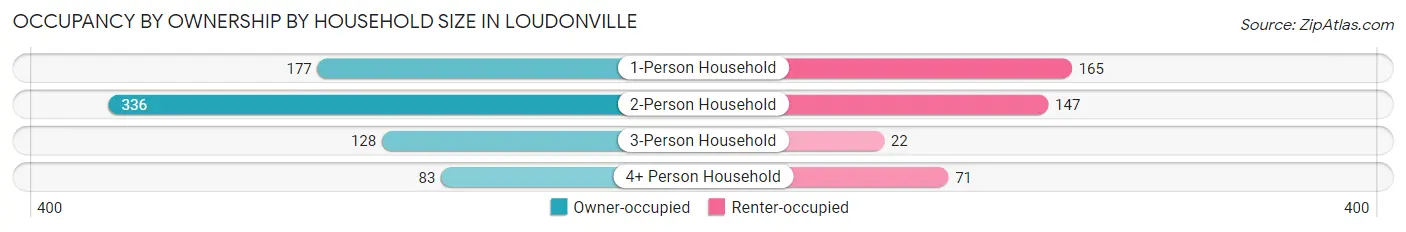
| Household Size | Owner-occupied | Renter-occupied |
| 1-Person Household | 177 (51.7%) | 165 (48.2%) |
| 2-Person Household | 336 (69.6%) | 147 (30.4%) |
| 3-Person Household | 128 (85.3%) | 22 (14.7%) |
| 4+ Person Household | 83 (53.9%) | 71 (46.1%) |
| Total Housing Units | 724 (64.1%) | 405 (35.9%) |
Occupancy by Educational Attainment in Loudonville
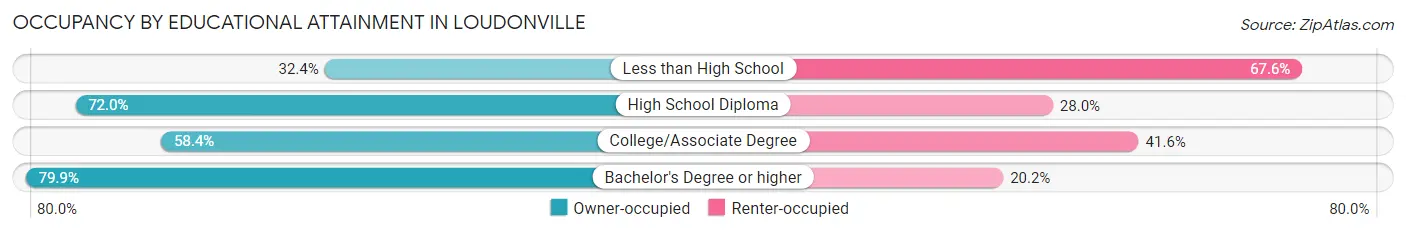
| Household Size | Owner-occupied | Renter-occupied |
| Less than High School | 36 (32.4%) | 75 (67.6%) |
| High School Diploma | 344 (72.0%) | 134 (28.0%) |
| College/Associate Degree | 237 (58.4%) | 169 (41.6%) |
| Bachelor's Degree or higher | 107 (79.8%) | 27 (20.2%) |
Occupancy by Age of Householder in Loudonville
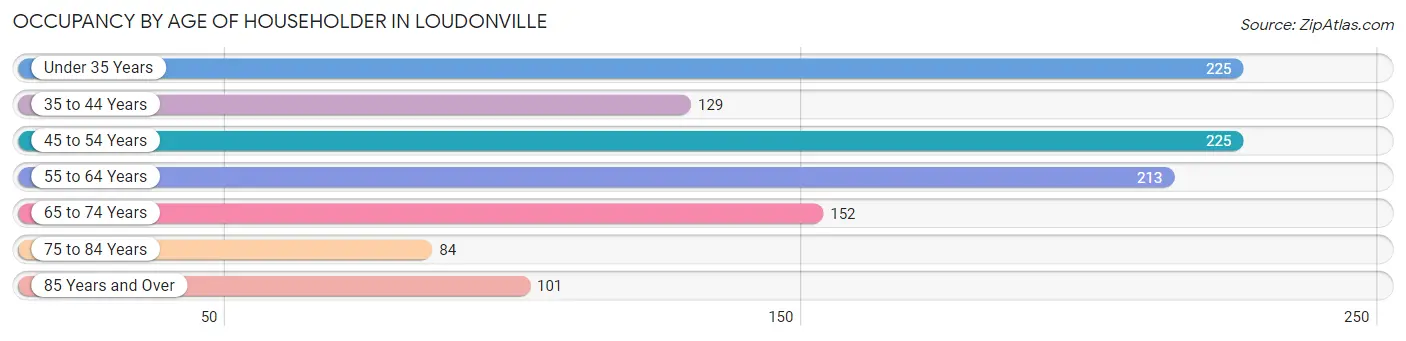
| Age Bracket | # Households | % Households |
| Under 35 Years | 225 | 19.9% |
| 35 to 44 Years | 129 | 11.4% |
| 45 to 54 Years | 225 | 19.9% |
| 55 to 64 Years | 213 | 18.9% |
| 65 to 74 Years | 152 | 13.5% |
| 75 to 84 Years | 84 | 7.4% |
| 85 Years and Over | 101 | 8.9% |
| Total | 1,129 | 100.0% |
Housing Finances in Loudonville
Median Income by Occupancy in Loudonville
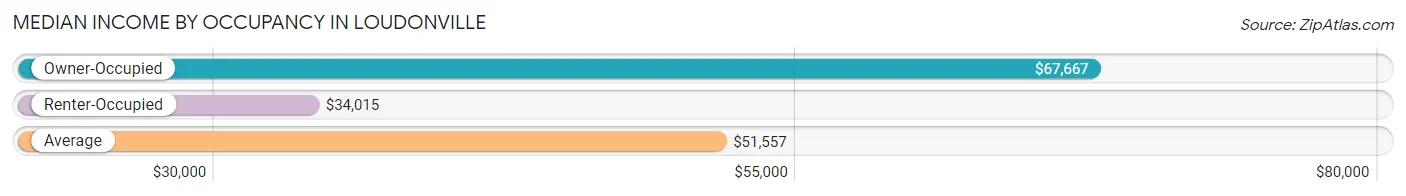
| Occupancy Type | # Households | Median Income |
| Owner-Occupied | 724 (64.1%) | $67,667 |
| Renter-Occupied | 405 (35.9%) | $34,015 |
| Average | 1,129 (100.0%) | $51,557 |
Occupancy by Householder Income Bracket in Loudonville
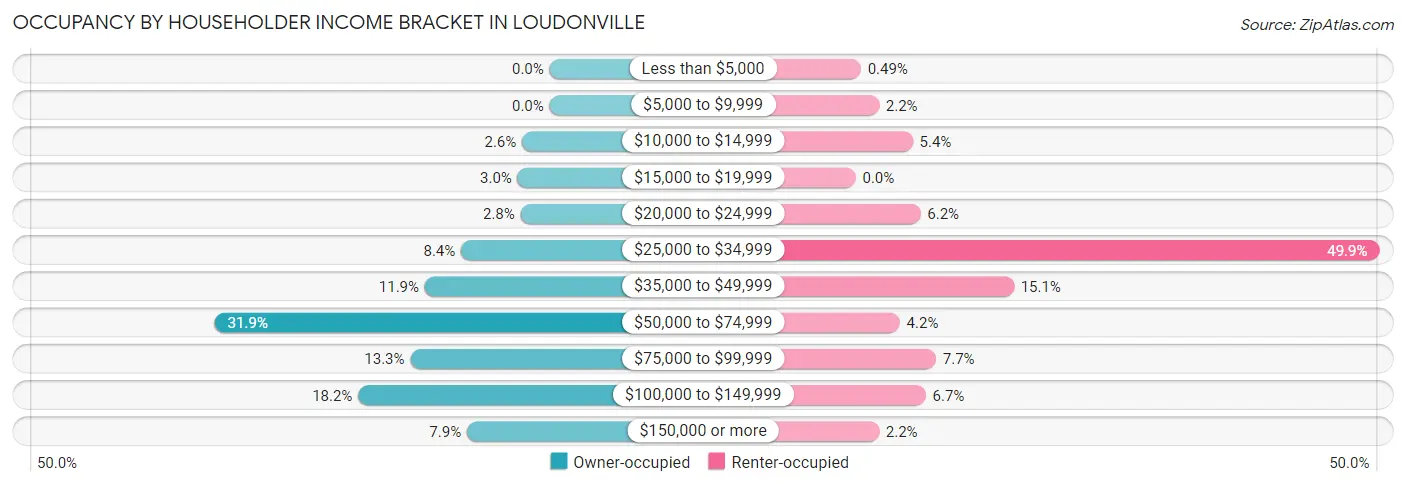
| Income Bracket | Owner-occupied | Renter-occupied |
| Less than $5,000 | 0 (0.0%) | 2 (0.5%) |
| $5,000 to $9,999 | 0 (0.0%) | 9 (2.2%) |
| $10,000 to $14,999 | 19 (2.6%) | 22 (5.4%) |
| $15,000 to $19,999 | 22 (3.0%) | 0 (0.0%) |
| $20,000 to $24,999 | 20 (2.8%) | 25 (6.2%) |
| $25,000 to $34,999 | 61 (8.4%) | 202 (49.9%) |
| $35,000 to $49,999 | 86 (11.9%) | 61 (15.1%) |
| $50,000 to $74,999 | 231 (31.9%) | 17 (4.2%) |
| $75,000 to $99,999 | 96 (13.3%) | 31 (7.6%) |
| $100,000 to $149,999 | 132 (18.2%) | 27 (6.7%) |
| $150,000 or more | 57 (7.9%) | 9 (2.2%) |
| Total | 724 (100.0%) | 405 (100.0%) |
Monthly Housing Cost Tiers in Loudonville
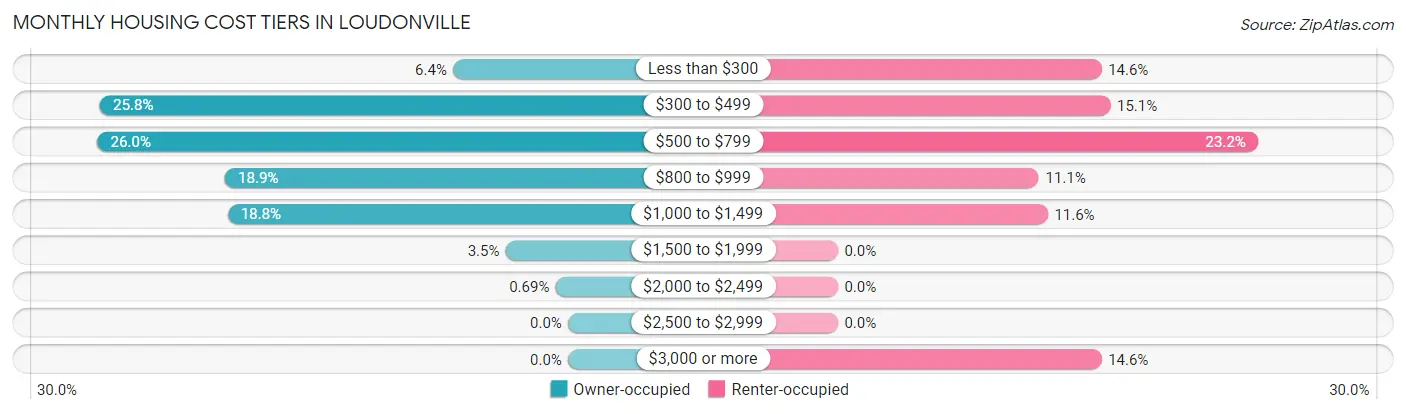
| Monthly Cost | Owner-occupied | Renter-occupied |
| Less than $300 | 46 (6.4%) | 59 (14.6%) |
| $300 to $499 | 187 (25.8%) | 61 (15.1%) |
| $500 to $799 | 188 (26.0%) | 94 (23.2%) |
| $800 to $999 | 137 (18.9%) | 45 (11.1%) |
| $1,000 to $1,499 | 136 (18.8%) | 47 (11.6%) |
| $1,500 to $1,999 | 25 (3.5%) | 0 (0.0%) |
| $2,000 to $2,499 | 5 (0.7%) | 0 (0.0%) |
| $2,500 to $2,999 | 0 (0.0%) | 0 (0.0%) |
| $3,000 or more | 0 (0.0%) | 59 (14.6%) |
| Total | 724 (100.0%) | 405 (100.0%) |
Physical Housing Characteristics in Loudonville
Housing Structures in Loudonville
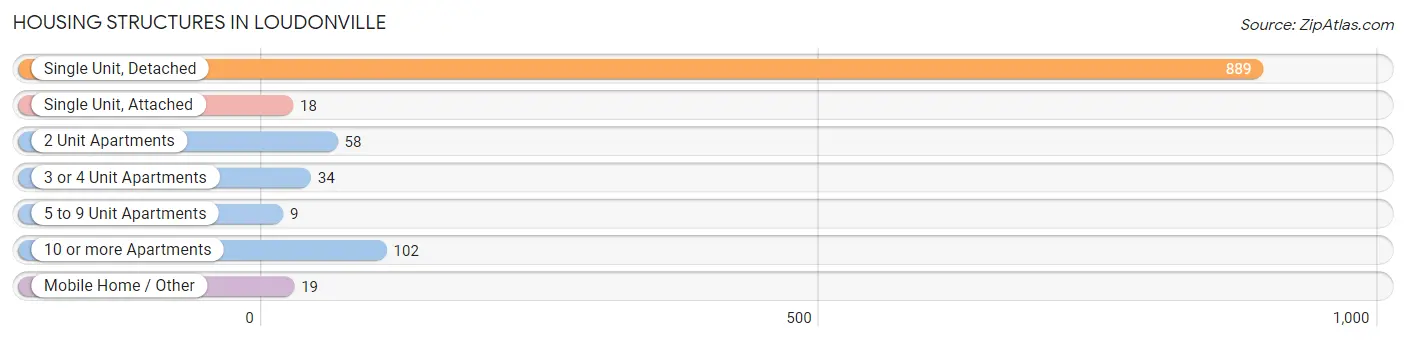
| Structure Type | # Housing Units | % Housing Units |
| Single Unit, Detached | 889 | 78.7% |
| Single Unit, Attached | 18 | 1.6% |
| 2 Unit Apartments | 58 | 5.1% |
| 3 or 4 Unit Apartments | 34 | 3.0% |
| 5 to 9 Unit Apartments | 9 | 0.8% |
| 10 or more Apartments | 102 | 9.0% |
| Mobile Home / Other | 19 | 1.7% |
| Total | 1,129 | 100.0% |
Housing Structures by Occupancy in Loudonville
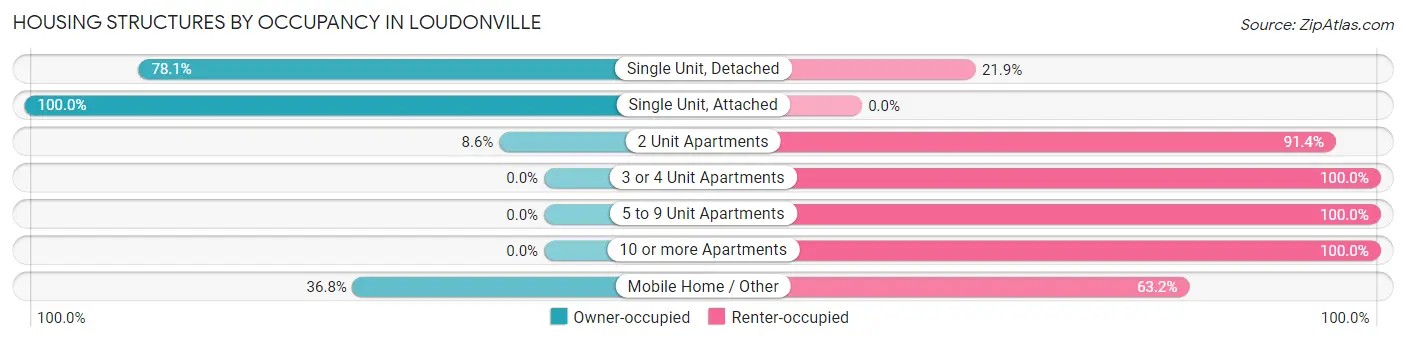
| Structure Type | Owner-occupied | Renter-occupied |
| Single Unit, Detached | 694 (78.1%) | 195 (21.9%) |
| Single Unit, Attached | 18 (100.0%) | 0 (0.0%) |
| 2 Unit Apartments | 5 (8.6%) | 53 (91.4%) |
| 3 or 4 Unit Apartments | 0 (0.0%) | 34 (100.0%) |
| 5 to 9 Unit Apartments | 0 (0.0%) | 9 (100.0%) |
| 10 or more Apartments | 0 (0.0%) | 102 (100.0%) |
| Mobile Home / Other | 7 (36.8%) | 12 (63.2%) |
| Total | 724 (64.1%) | 405 (35.9%) |
Housing Structures by Number of Rooms in Loudonville
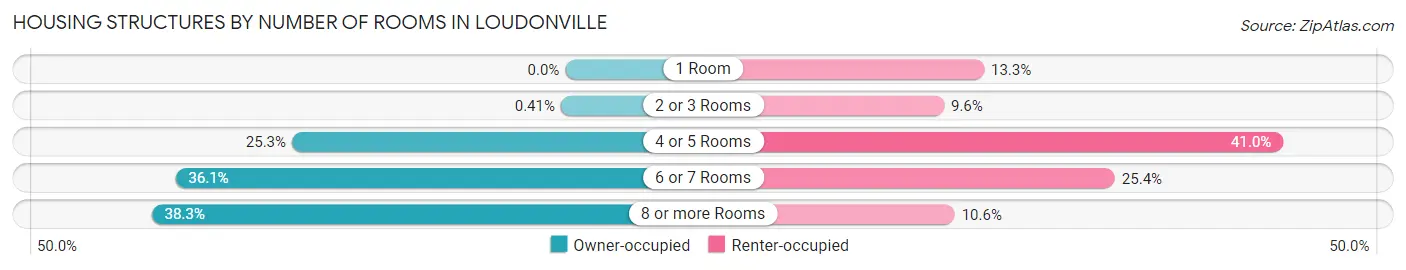
| Number of Rooms | Owner-occupied | Renter-occupied |
| 1 Room | 0 (0.0%) | 54 (13.3%) |
| 2 or 3 Rooms | 3 (0.4%) | 39 (9.6%) |
| 4 or 5 Rooms | 183 (25.3%) | 166 (41.0%) |
| 6 or 7 Rooms | 261 (36.0%) | 103 (25.4%) |
| 8 or more Rooms | 277 (38.3%) | 43 (10.6%) |
| Total | 724 (100.0%) | 405 (100.0%) |
Housing Structure by Heating Type in Loudonville
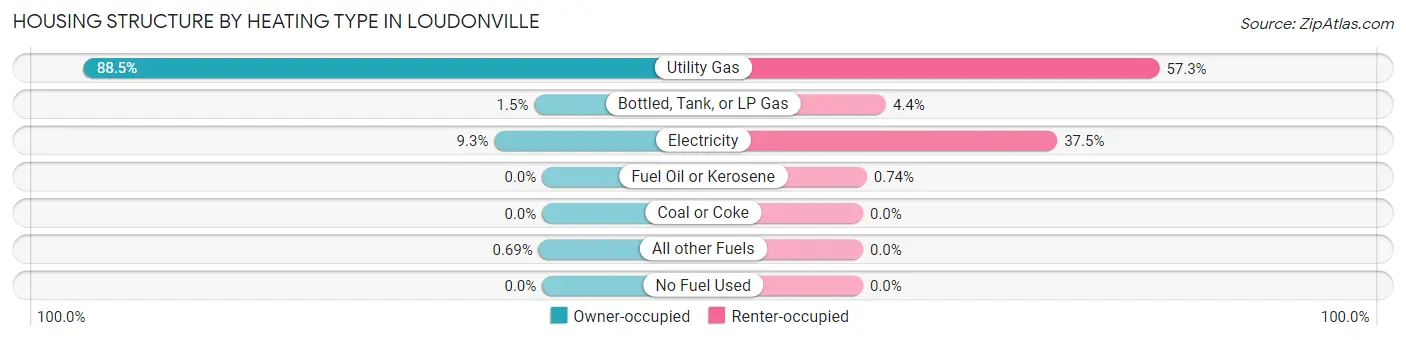
| Heating Type | Owner-occupied | Renter-occupied |
| Utility Gas | 641 (88.5%) | 232 (57.3%) |
| Bottled, Tank, or LP Gas | 11 (1.5%) | 18 (4.4%) |
| Electricity | 67 (9.2%) | 152 (37.5%) |
| Fuel Oil or Kerosene | 0 (0.0%) | 3 (0.7%) |
| Coal or Coke | 0 (0.0%) | 0 (0.0%) |
| All other Fuels | 5 (0.7%) | 0 (0.0%) |
| No Fuel Used | 0 (0.0%) | 0 (0.0%) |
| Total | 724 (100.0%) | 405 (100.0%) |
Household Vehicle Usage in Loudonville
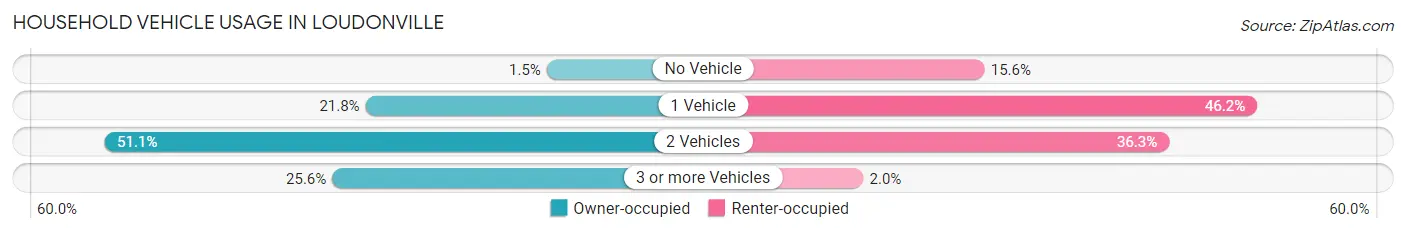
| Vehicles per Household | Owner-occupied | Renter-occupied |
| No Vehicle | 11 (1.5%) | 63 (15.6%) |
| 1 Vehicle | 158 (21.8%) | 187 (46.2%) |
| 2 Vehicles | 370 (51.1%) | 147 (36.3%) |
| 3 or more Vehicles | 185 (25.6%) | 8 (2.0%) |
| Total | 724 (100.0%) | 405 (100.0%) |
Real Estate & Mortgages in Loudonville
Real Estate and Mortgage Overview in Loudonville
| Characteristic | Without Mortgage | With Mortgage |
| Housing Units | 313 | 411 |
| Median Property Value | $135,900 | $118,300 |
| Median Household Income | $65,568 | $28 |
| Monthly Housing Costs | $402 | $0 |
| Real Estate Taxes | $1,369 | $7 |
Property Value by Mortgage Status in Loudonville
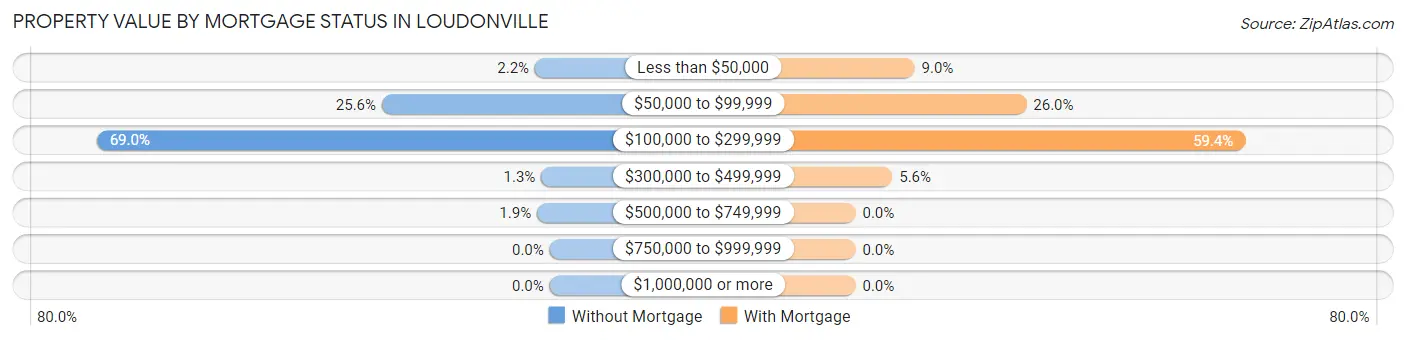
| Property Value | Without Mortgage | With Mortgage |
| Less than $50,000 | 7 (2.2%) | 37 (9.0%) |
| $50,000 to $99,999 | 80 (25.6%) | 107 (26.0%) |
| $100,000 to $299,999 | 216 (69.0%) | 244 (59.4%) |
| $300,000 to $499,999 | 4 (1.3%) | 23 (5.6%) |
| $500,000 to $749,999 | 6 (1.9%) | 0 (0.0%) |
| $750,000 to $999,999 | 0 (0.0%) | 0 (0.0%) |
| $1,000,000 or more | 0 (0.0%) | 0 (0.0%) |
| Total | 313 (100.0%) | 411 (100.0%) |
Household Income by Mortgage Status in Loudonville
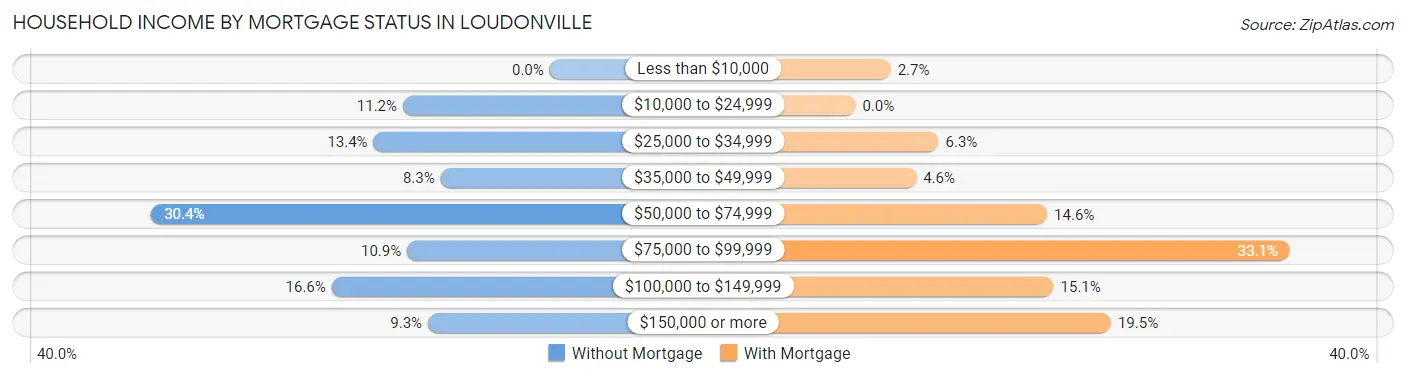
| Household Income | Without Mortgage | With Mortgage |
| Less than $10,000 | 0 (0.0%) | 11 (2.7%) |
| $10,000 to $24,999 | 35 (11.2%) | 0 (0.0%) |
| $25,000 to $34,999 | 42 (13.4%) | 26 (6.3%) |
| $35,000 to $49,999 | 26 (8.3%) | 19 (4.6%) |
| $50,000 to $74,999 | 95 (30.3%) | 60 (14.6%) |
| $75,000 to $99,999 | 34 (10.9%) | 136 (33.1%) |
| $100,000 to $149,999 | 52 (16.6%) | 62 (15.1%) |
| $150,000 or more | 29 (9.3%) | 80 (19.5%) |
| Total | 313 (100.0%) | 411 (100.0%) |
Property Value to Household Income Ratio in Loudonville
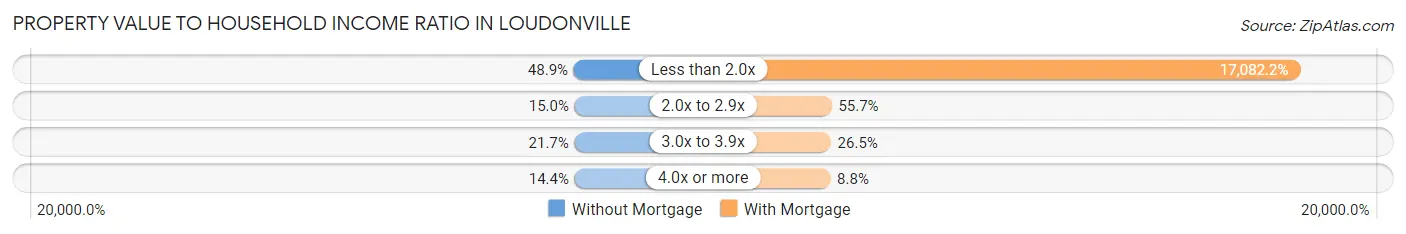
| Value-to-Income Ratio | Without Mortgage | With Mortgage |
| Less than 2.0x | 153 (48.9%) | 70,208 (17,082.2%) |
| 2.0x to 2.9x | 47 (15.0%) | 229 (55.7%) |
| 3.0x to 3.9x | 68 (21.7%) | 109 (26.5%) |
| 4.0x or more | 45 (14.4%) | 36 (8.8%) |
| Total | 313 (100.0%) | 411 (100.0%) |
Real Estate Taxes by Mortgage Status in Loudonville
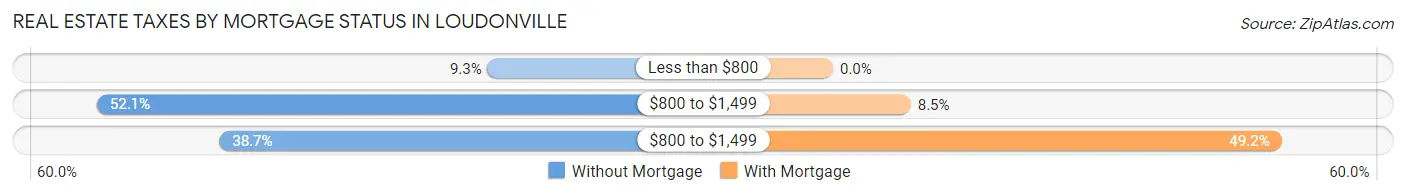
| Property Taxes | Without Mortgage | With Mortgage |
| Less than $800 | 29 (9.3%) | 0 (0.0%) |
| $800 to $1,499 | 163 (52.1%) | 35 (8.5%) |
| $800 to $1,499 | 121 (38.7%) | 202 (49.1%) |
| Total | 313 (100.0%) | 411 (100.0%) |
Health & Disability in Loudonville
Health Insurance Coverage by Age in Loudonville
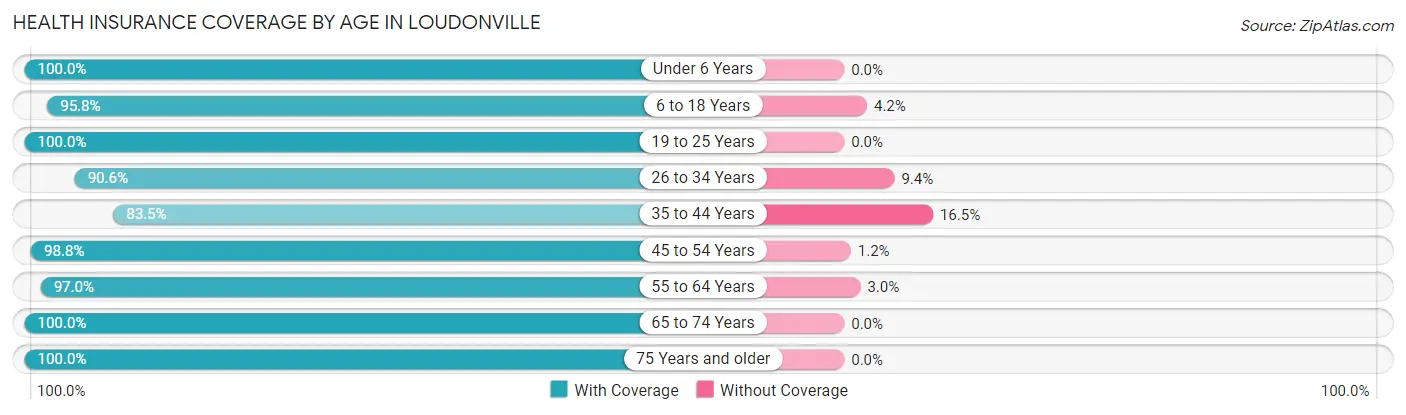
| Age Bracket | With Coverage | Without Coverage |
| Under 6 Years | 225 (100.0%) | 0 (0.0%) |
| 6 to 18 Years | 452 (95.8%) | 20 (4.2%) |
| 19 to 25 Years | 222 (100.0%) | 0 (0.0%) |
| 26 to 34 Years | 339 (90.6%) | 35 (9.4%) |
| 35 to 44 Years | 212 (83.5%) | 42 (16.5%) |
| 45 to 54 Years | 404 (98.8%) | 5 (1.2%) |
| 55 to 64 Years | 355 (97.0%) | 11 (3.0%) |
| 65 to 74 Years | 276 (100.0%) | 0 (0.0%) |
| 75 Years and older | 225 (100.0%) | 0 (0.0%) |
| Total | 2,710 (96.0%) | 113 (4.0%) |
Health Insurance Coverage by Citizenship Status in Loudonville

| Citizenship Status | With Coverage | Without Coverage |
| Native Born | 225 (100.0%) | 0 (0.0%) |
| Foreign Born, Citizen | 452 (95.8%) | 20 (4.2%) |
| Foreign Born, not a Citizen | 222 (100.0%) | 0 (0.0%) |
Health Insurance Coverage by Household Income in Loudonville
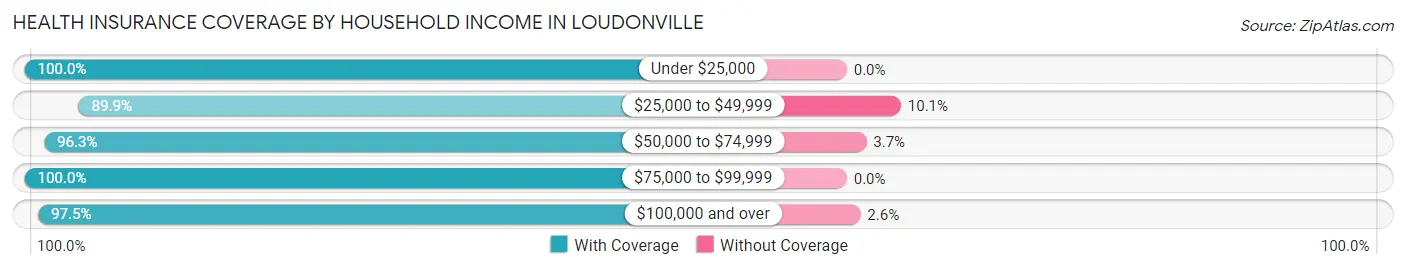
| Household Income | With Coverage | Without Coverage |
| Under $25,000 | 266 (100.0%) | 0 (0.0%) |
| $25,000 to $49,999 | 612 (89.9%) | 69 (10.1%) |
| $50,000 to $74,999 | 684 (96.3%) | 26 (3.7%) |
| $75,000 to $99,999 | 401 (100.0%) | 0 (0.0%) |
| $100,000 and over | 687 (97.5%) | 18 (2.5%) |
Public vs Private Health Insurance Coverage by Age in Loudonville
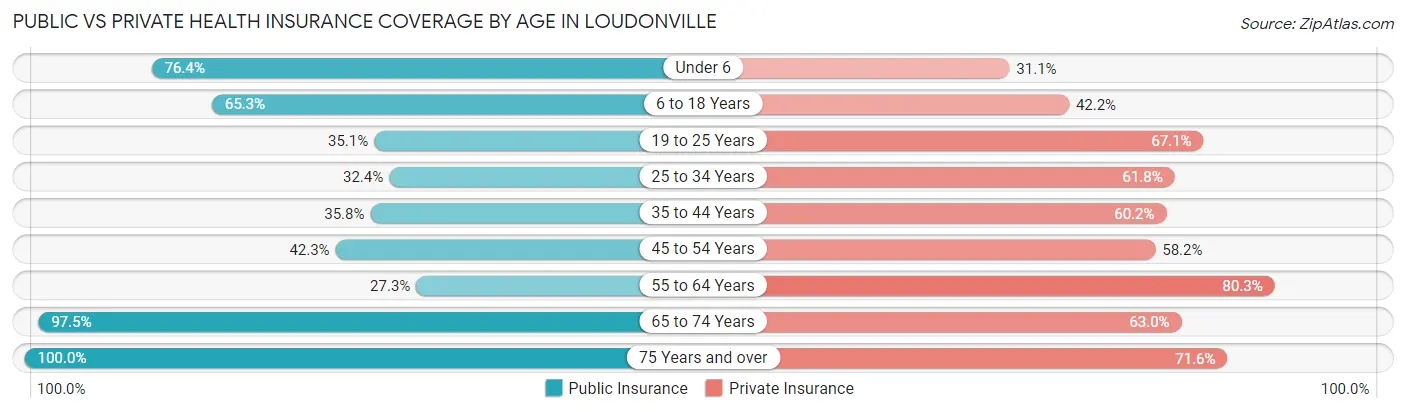
| Age Bracket | Public Insurance | Private Insurance |
| Under 6 | 172 (76.4%) | 70 (31.1%) |
| 6 to 18 Years | 308 (65.2%) | 199 (42.2%) |
| 19 to 25 Years | 78 (35.1%) | 149 (67.1%) |
| 25 to 34 Years | 121 (32.4%) | 231 (61.8%) |
| 35 to 44 Years | 91 (35.8%) | 153 (60.2%) |
| 45 to 54 Years | 173 (42.3%) | 238 (58.2%) |
| 55 to 64 Years | 100 (27.3%) | 294 (80.3%) |
| 65 to 74 Years | 269 (97.5%) | 174 (63.0%) |
| 75 Years and over | 225 (100.0%) | 161 (71.6%) |
| Total | 1,537 (54.4%) | 1,669 (59.1%) |
Disability Status by Sex by Age in Loudonville
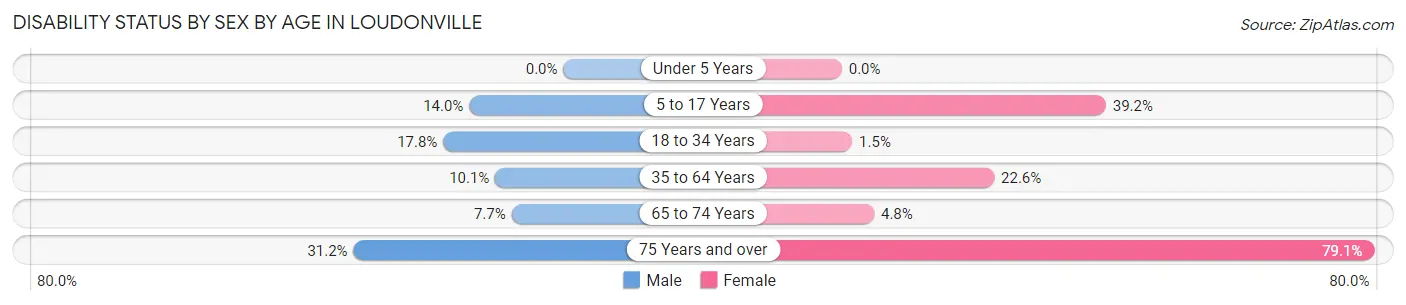
| Age Bracket | Male | Female |
| Under 5 Years | 0 (0.0%) | 0 (0.0%) |
| 5 to 17 Years | 39 (14.0%) | 78 (39.2%) |
| 18 to 34 Years | 66 (17.8%) | 4 (1.5%) |
| 35 to 64 Years | 50 (10.1%) | 121 (22.6%) |
| 65 to 74 Years | 10 (7.7%) | 7 (4.8%) |
| 75 Years and over | 24 (31.2%) | 117 (79.0%) |
Disability Class by Sex by Age in Loudonville
Disability Class: Hearing Difficulty
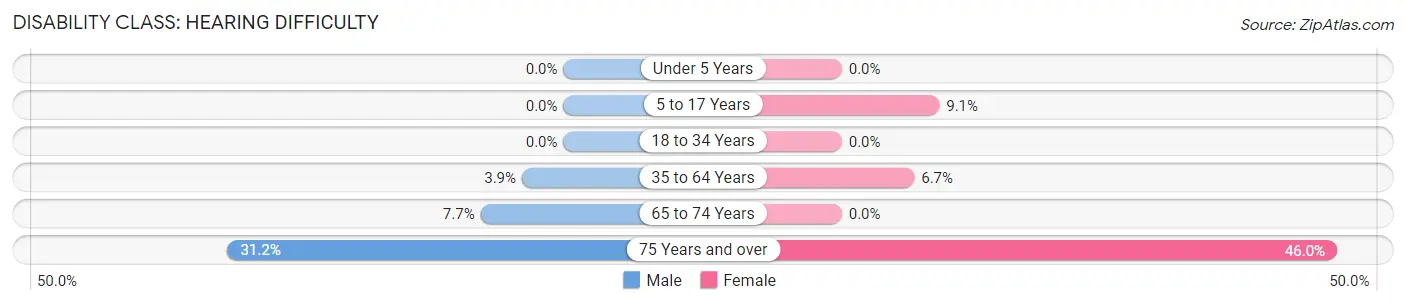
| Age Bracket | Male | Female |
| Under 5 Years | 0 (0.0%) | 0 (0.0%) |
| 5 to 17 Years | 0 (0.0%) | 18 (9.0%) |
| 18 to 34 Years | 0 (0.0%) | 0 (0.0%) |
| 35 to 64 Years | 19 (3.8%) | 36 (6.7%) |
| 65 to 74 Years | 10 (7.7%) | 0 (0.0%) |
| 75 Years and over | 24 (31.2%) | 68 (46.0%) |
Disability Class: Vision Difficulty
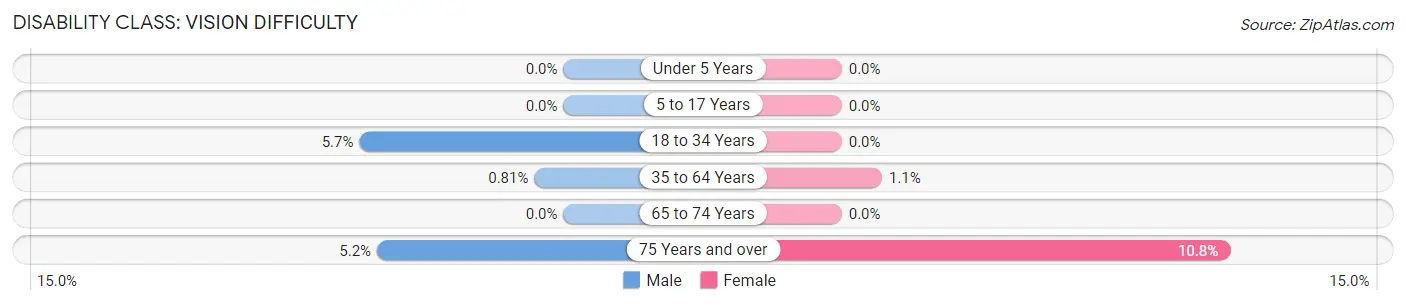
| Age Bracket | Male | Female |
| Under 5 Years | 0 (0.0%) | 0 (0.0%) |
| 5 to 17 Years | 0 (0.0%) | 0 (0.0%) |
| 18 to 34 Years | 21 (5.7%) | 0 (0.0%) |
| 35 to 64 Years | 4 (0.8%) | 6 (1.1%) |
| 65 to 74 Years | 0 (0.0%) | 0 (0.0%) |
| 75 Years and over | 4 (5.2%) | 16 (10.8%) |
Disability Class: Cognitive Difficulty
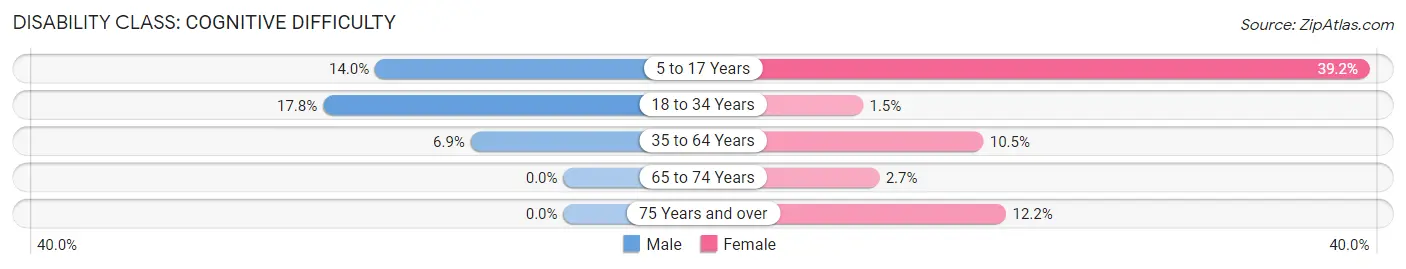
| Age Bracket | Male | Female |
| 5 to 17 Years | 39 (14.0%) | 78 (39.2%) |
| 18 to 34 Years | 66 (17.8%) | 4 (1.5%) |
| 35 to 64 Years | 34 (6.9%) | 56 (10.5%) |
| 65 to 74 Years | 0 (0.0%) | 4 (2.7%) |
| 75 Years and over | 0 (0.0%) | 18 (12.2%) |
Disability Class: Ambulatory Difficulty
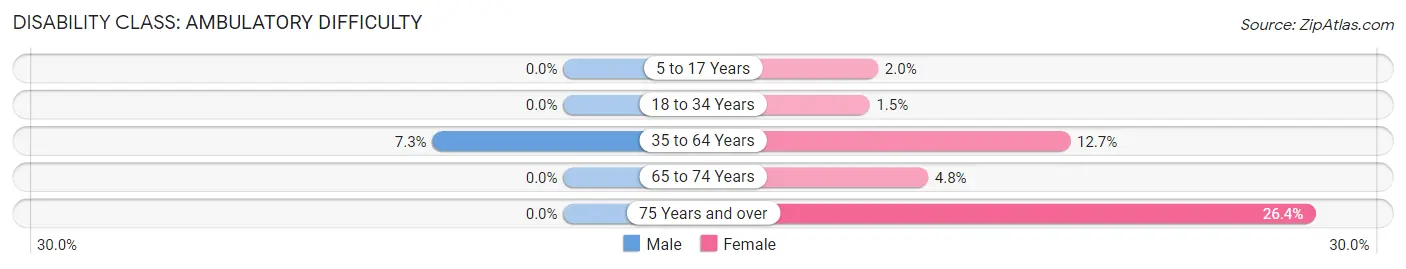
| Age Bracket | Male | Female |
| 5 to 17 Years | 0 (0.0%) | 4 (2.0%) |
| 18 to 34 Years | 0 (0.0%) | 4 (1.5%) |
| 35 to 64 Years | 36 (7.3%) | 68 (12.7%) |
| 65 to 74 Years | 0 (0.0%) | 7 (4.8%) |
| 75 Years and over | 0 (0.0%) | 39 (26.4%) |
Disability Class: Self-Care Difficulty
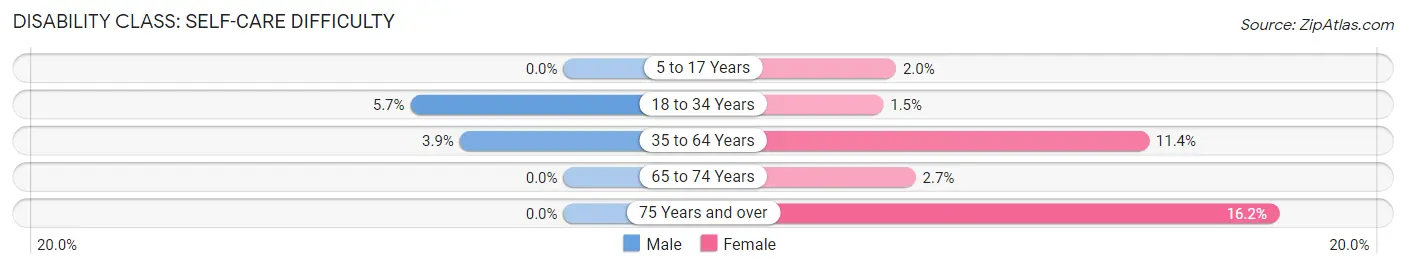
| Age Bracket | Male | Female |
| 5 to 17 Years | 0 (0.0%) | 4 (2.0%) |
| 18 to 34 Years | 21 (5.7%) | 4 (1.5%) |
| 35 to 64 Years | 19 (3.8%) | 61 (11.4%) |
| 65 to 74 Years | 0 (0.0%) | 4 (2.7%) |
| 75 Years and over | 0 (0.0%) | 24 (16.2%) |
Technology Access in Loudonville
Computing Device Access in Loudonville
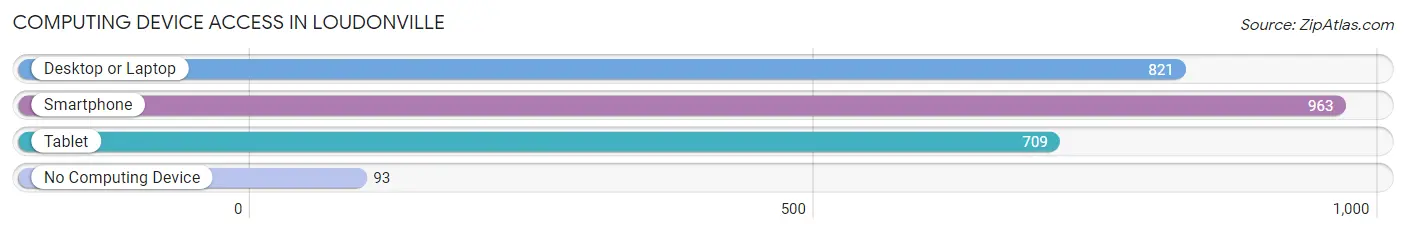
| Device Type | # Households | % Households |
| Desktop or Laptop | 821 | 72.7% |
| Smartphone | 963 | 85.3% |
| Tablet | 709 | 62.8% |
| No Computing Device | 93 | 8.2% |
| Total | 1,129 | 100.0% |
Internet Access in Loudonville
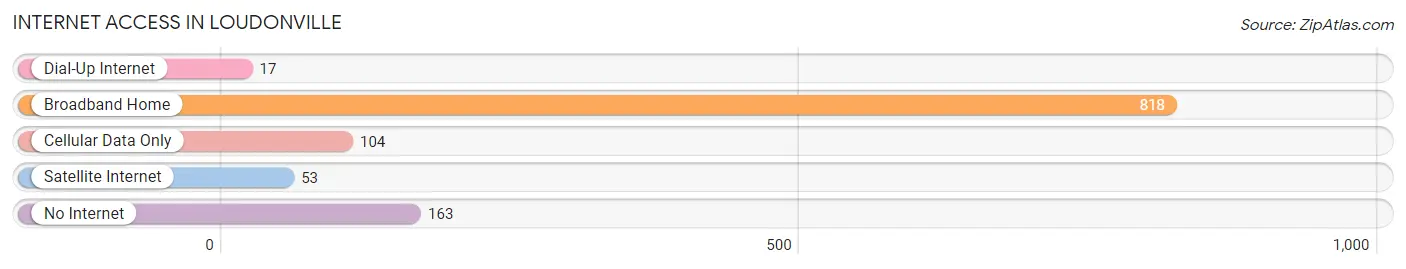
| Internet Type | # Households | % Households |
| Dial-Up Internet | 17 | 1.5% |
| Broadband Home | 818 | 72.5% |
| Cellular Data Only | 104 | 9.2% |
| Satellite Internet | 53 | 4.7% |
| No Internet | 163 | 14.4% |
| Total | 1,129 | 100.0% |
Loudonville Summary
Loudonville, Ohio is a small village located in the heart of Ashland County, Ohio. It is situated on the Mohican River, which is a tributary of the Walhonding River. The village is located approximately 60 miles southwest of Cleveland and 40 miles northeast of Columbus. The village has a population of approximately 2,000 people and is part of the Loudonville-Perrysville Exempted Village School District.
History
Loudonville was founded in 1815 by John Loudon, a Revolutionary War veteran. He purchased the land from the Wyandot Indians and named the village after himself. The village was incorporated in 1837 and has remained a small, rural community ever since.
The village was an important stop on the Underground Railroad, with many of the local residents helping to hide and transport escaped slaves. The village was also home to the first public library in Ashland County, which was established in 1853.
Geography
Loudonville is located in the Mohican Valley, which is part of the Appalachian Plateau. The village is situated on the Mohican River, which is a tributary of the Walhonding River. The village is surrounded by rolling hills and forests, and is located approximately 60 miles southwest of Cleveland and 40 miles northeast of Columbus.
The village has a total area of 1.2 square miles, all of which is land. The village is located in the Eastern Time Zone and observes Daylight Saving Time.
Economy
The economy of Loudonville is largely based on agriculture and tourism. The village is home to several small businesses, including a grocery store, a hardware store, and a few restaurants. The village is also home to several small manufacturing companies, including a furniture manufacturer and a plastics manufacturer.
The village is also home to several tourist attractions, including the Mohican State Park, the Mohican Wilderness, and the Mohican-Memorial State Forest. These attractions draw visitors from all over the country, and help to support the local economy.
Demographics
As of the 2010 census, the population of Loudonville was 2,015. The racial makeup of the village was 97.3% White, 0.7% African American, 0.3% Native American, 0.2% Asian, 0.1% Pacific Islander, 0.3% from other races, and 1.2% from two or more races. Hispanic or Latino of any race were 1.2% of the population.
The median income for a household in the village was $41,250, and the median income for a family was $50,000. The per capita income for the village was $20,845. About 8.3% of families and 10.2% of the population were below the poverty line, including 14.3% of those under age 18 and 5.2% of those age 65 or over.
Common Questions
What is Per Capita Income in Loudonville?
Per Capita income in Loudonville is $29,767.
What is the Median Family Income in Loudonville?
Median Family Income in Loudonville is $69,130.
What is the Median Household income in Loudonville?
Median Household Income in Loudonville is $51,557.
What is Income or Wage Gap in Loudonville?
Income or Wage Gap in Loudonville is 42.7%.
Women in Loudonville earn 57.3 cents for every dollar earned by a man.
What is Inequality or Gini Index in Loudonville?
Inequality or Gini Index in Loudonville is 0.43.
What is the Total Population of Loudonville?
Total Population of Loudonville is 2,898.
What is the Total Male Population of Loudonville?
Total Male Population of Loudonville is 1,500.
What is the Total Female Population of Loudonville?
Total Female Population of Loudonville is 1,398.
What is the Ratio of Males per 100 Females in Loudonville?
There are 107.30 Males per 100 Females in Loudonville.
What is the Ratio of Females per 100 Males in Loudonville?
There are 93.20 Females per 100 Males in Loudonville.
What is the Median Population Age in Loudonville?
Median Population Age in Loudonville is 39.6 Years.
What is the Average Family Size in Loudonville
Average Family Size in Loudonville is 3.0 People.
What is the Average Household Size in Loudonville
Average Household Size in Loudonville is 2.5 People.
How Large is the Labor Force in Loudonville?
There are 1,392 People in the Labor Forcein in Loudonville.
What is the Percentage of People in the Labor Force in Loudonville?
57.9% of People are in the Labor Force in Loudonville.
What is the Unemployment Rate in Loudonville?
Unemployment Rate in Loudonville is 5.1%.