Lore City, OH Map & Demographics
Lore City Map
Lore City Overview
$19,939
PER CAPITA INCOME
$49,375
AVG FAMILY INCOME
$51,875
AVG HOUSEHOLD INCOME
0.32
INEQUALITY / GINI INDEX
353
TOTAL POPULATION
171
MALE POPULATION
182
FEMALE POPULATION
93.96
MALES / 100 FEMALES
106.43
FEMALES / 100 MALES
28.4
MEDIAN AGE
2.9
AVG FAMILY SIZE
2.5
AVG HOUSEHOLD SIZE
148
LABOR FORCE [ PEOPLE ]
59.0%
PERCENT IN LABOR FORCE
2.7%
UNEMPLOYMENT RATE
Lore City Zip Codes
Lore City Area Codes
Income in Lore City
Income Overview in Lore City
Per Capita Income in Lore City is $19,939, while median incomes of families and households are $49,375 and $51,875 respectively.
| Characteristic | Number | Measure |
| Per Capita Income | 353 | $19,939 |
| Median Family Income | 84 | $49,375 |
| Mean Family Income | 84 | $51,419 |
| Median Household Income | 141 | $51,875 |
| Mean Household Income | 141 | $50,262 |
| Income Deficit | 84 | $0 |
| Wage / Income Gap (%) | 353 | 0.00% |
| Wage / Income Gap ($) | 353 | 100.00¢ per $1 |
| Gini / Inequality Index | 353 | 0.32 |
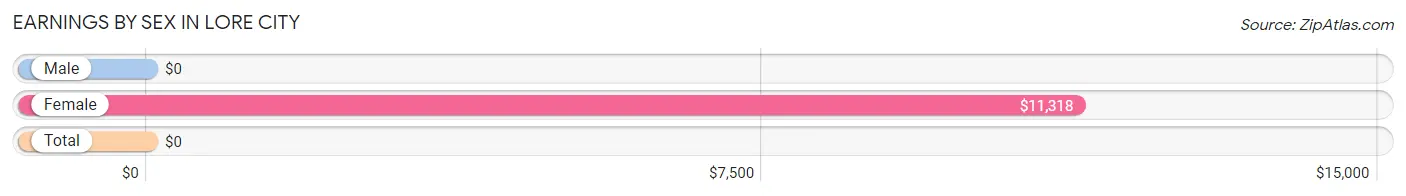
Earnings by Sex in Lore City
| Sex | Number | Average Earnings |
| Male | 102 (61.1%) | $0 |
| Female | 65 (38.9%) | $11,318 |
| Total | 167 (100.0%) | $0 |
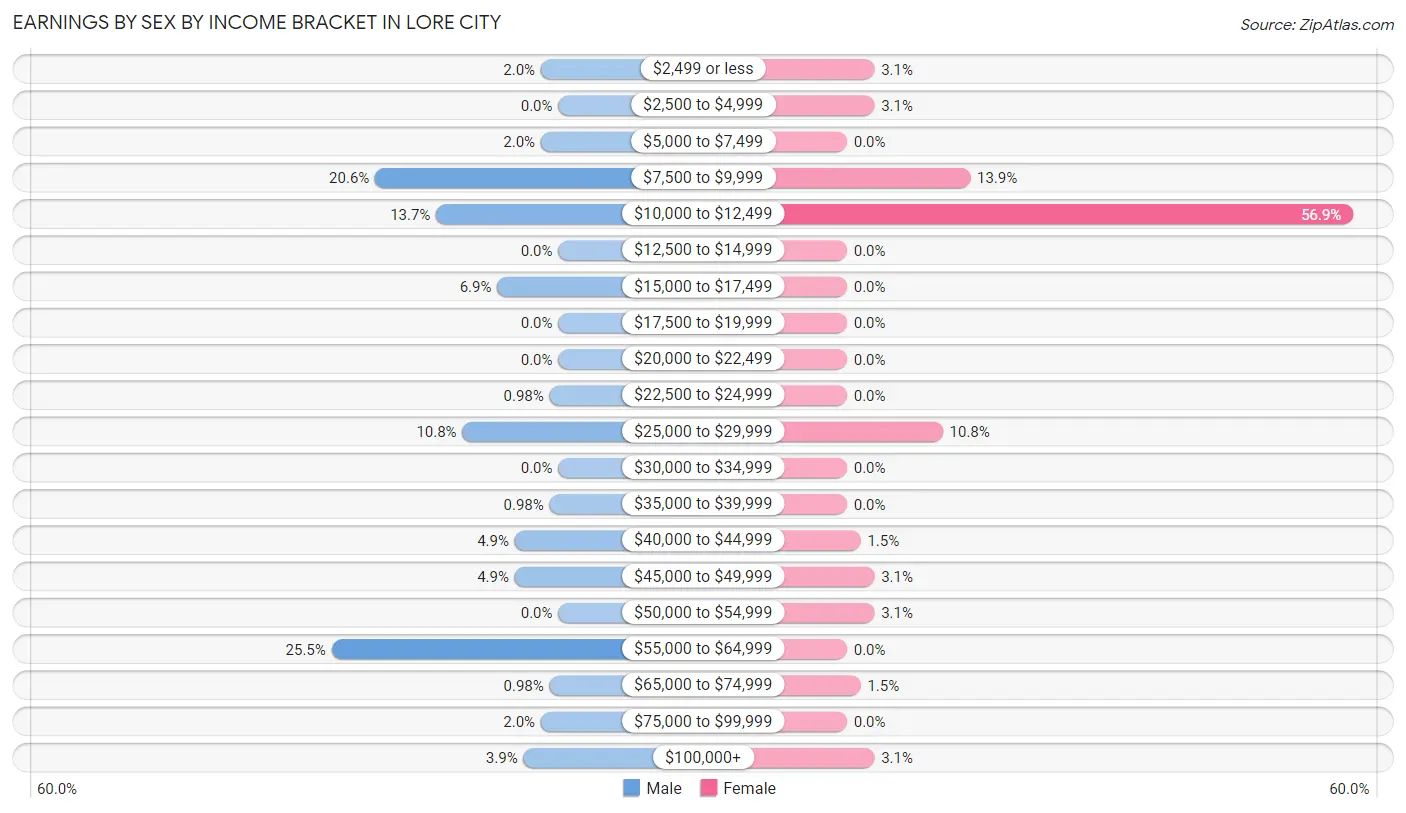
Earnings by Sex by Income Bracket in Lore City
The most common earnings brackets in Lore City are $55,000 to $64,999 for men (26 | 25.5%) and $10,000 to $12,499 for women (37 | 56.9%).
| Income | Male | Female |
| $2,499 or less | 2 (2.0%) | 2 (3.1%) |
| $2,500 to $4,999 | 0 (0.0%) | 2 (3.1%) |
| $5,000 to $7,499 | 2 (2.0%) | 0 (0.0%) |
| $7,500 to $9,999 | 21 (20.6%) | 9 (13.9%) |
| $10,000 to $12,499 | 14 (13.7%) | 37 (56.9%) |
| $12,500 to $14,999 | 0 (0.0%) | 0 (0.0%) |
| $15,000 to $17,499 | 7 (6.9%) | 0 (0.0%) |
| $17,500 to $19,999 | 0 (0.0%) | 0 (0.0%) |
| $20,000 to $22,499 | 0 (0.0%) | 0 (0.0%) |
| $22,500 to $24,999 | 1 (1.0%) | 0 (0.0%) |
| $25,000 to $29,999 | 11 (10.8%) | 7 (10.8%) |
| $30,000 to $34,999 | 0 (0.0%) | 0 (0.0%) |
| $35,000 to $39,999 | 1 (1.0%) | 0 (0.0%) |
| $40,000 to $44,999 | 5 (4.9%) | 1 (1.5%) |
| $45,000 to $49,999 | 5 (4.9%) | 2 (3.1%) |
| $50,000 to $54,999 | 0 (0.0%) | 2 (3.1%) |
| $55,000 to $64,999 | 26 (25.5%) | 0 (0.0%) |
| $65,000 to $74,999 | 1 (1.0%) | 1 (1.5%) |
| $75,000 to $99,999 | 2 (2.0%) | 0 (0.0%) |
| $100,000+ | 4 (3.9%) | 2 (3.1%) |
| Total | 102 (100.0%) | 65 (100.0%) |
Earnings by Sex by Educational Attainment in Lore City
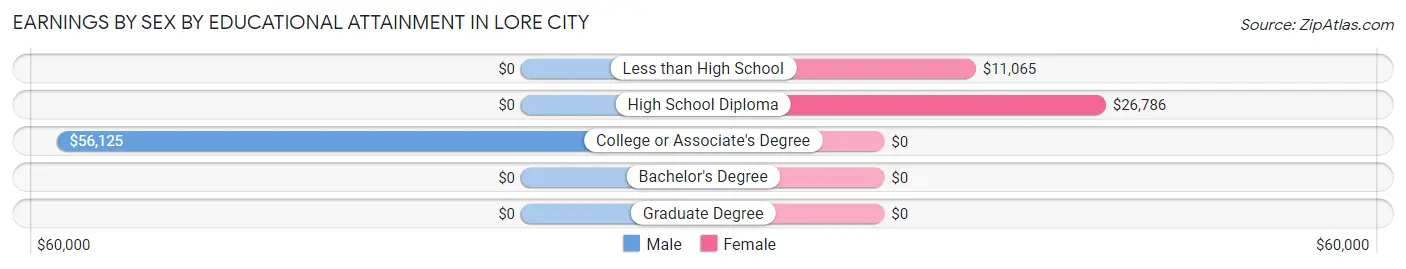
| Educational Attainment | Male Income | Female Income |
| Less than High School | - | - |
| High School Diploma | - | - |
| College or Associate's Degree | $56,125 | $0 |
| Bachelor's Degree | - | - |
| Graduate Degree | - | - |
| Total | - | - |
Family Income in Lore City
Family Income Brackets in Lore City
According to the Lore City family income data, there are 31 families falling into the $50,000 to $74,999 income range, which is the most common income bracket and makes up 36.9% of all families.
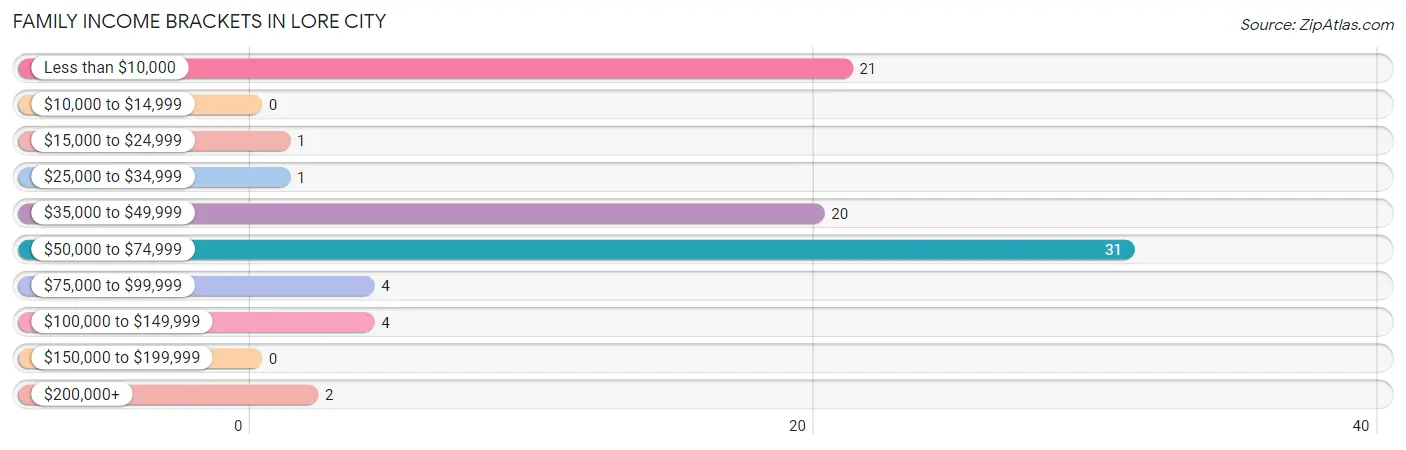
| Income Bracket | # Families | % Families |
| Less than $10,000 | 21 | 25.0% |
| $10,000 to $14,999 | 0 | 0.0% |
| $15,000 to $24,999 | 1 | 1.2% |
| $25,000 to $34,999 | 1 | 1.2% |
| $35,000 to $49,999 | 20 | 23.8% |
| $50,000 to $74,999 | 31 | 36.9% |
| $75,000 to $99,999 | 4 | 4.8% |
| $100,000 to $149,999 | 4 | 4.8% |
| $150,000 to $199,999 | 0 | 0.0% |
| $200,000+ | 2 | 2.4% |
Family Income by Famaliy Size in Lore City
2-person families (31 | 36.9%) account for the highest median family income in Lore City with $56,250 per family, while 2-person families (31 | 36.9%) have the highest median income of $28,125 per family member.
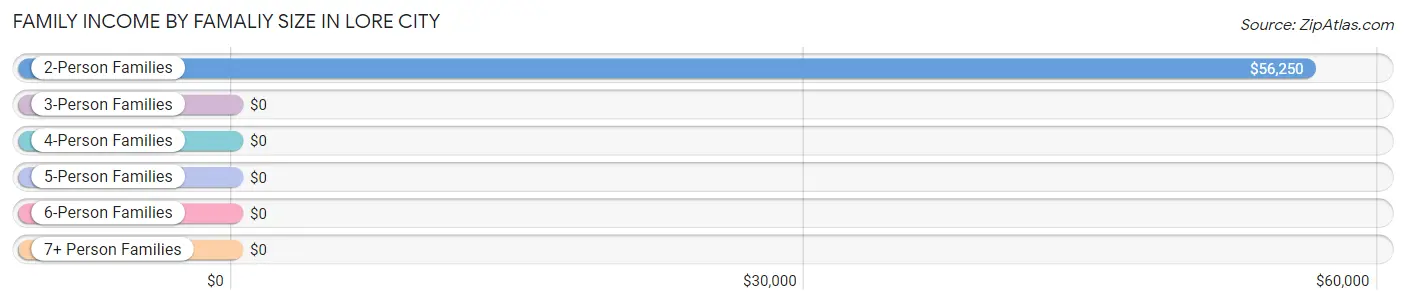
| Income Bracket | # Families | Median Income |
| 2-Person Families | 31 (36.9%) | $56,250 |
| 3-Person Families | 35 (41.7%) | $0 |
| 4-Person Families | 14 (16.7%) | $0 |
| 5-Person Families | 4 (4.8%) | $0 |
| 6-Person Families | 0 (0.0%) | $0 |
| 7+ Person Families | 0 (0.0%) | $0 |
| Total | 84 (100.0%) | $49,375 |
Family Income by Number of Earners in Lore City
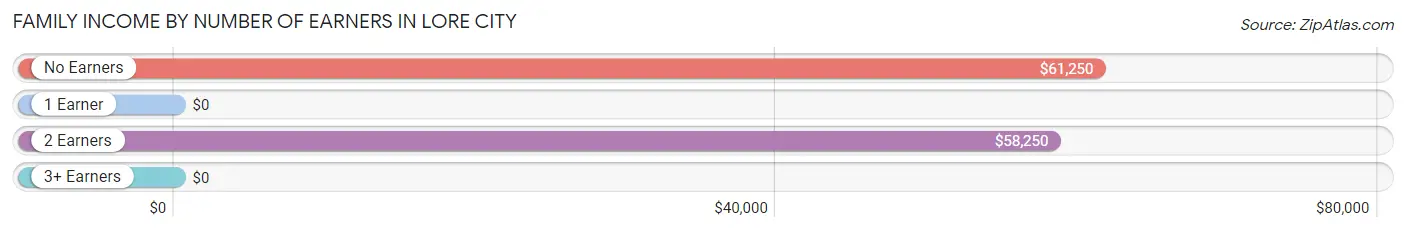
| Number of Earners | # Families | Median Income |
| No Earners | 8 (9.5%) | $61,250 |
| 1 Earner | 52 (61.9%) | $0 |
| 2 Earners | 22 (26.2%) | $58,250 |
| 3+ Earners | 2 (2.4%) | $0 |
| Total | 84 (100.0%) | $49,375 |
Household Income in Lore City
Household Income Brackets in Lore City
With 60 households falling in the category, the $50,000 to $74,999 income range is the most frequent in Lore City, accounting for 42.5% of all households.
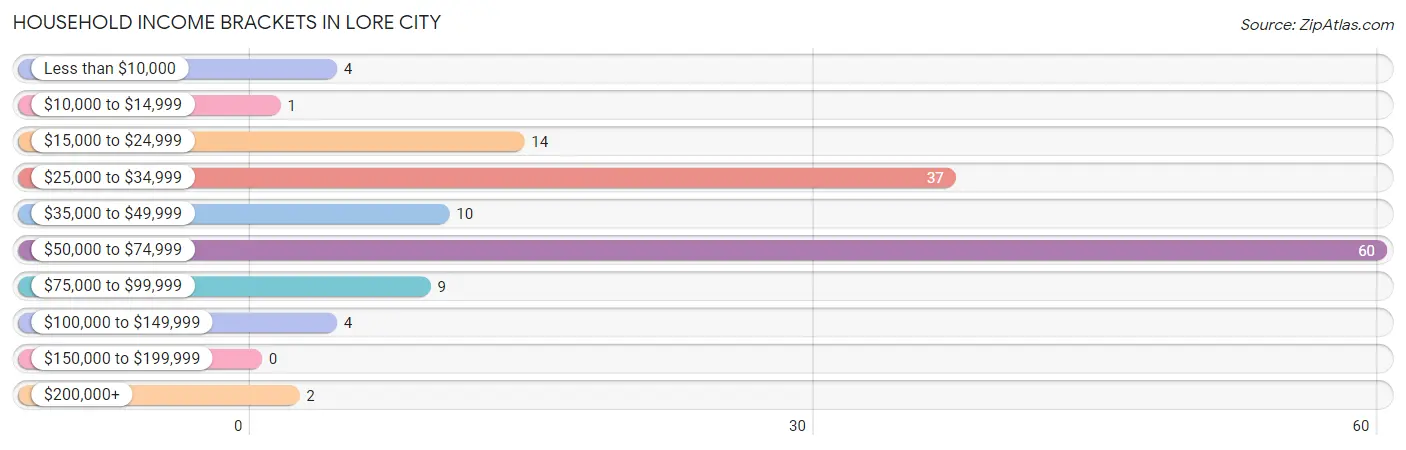
| Income Bracket | # Households | % Households |
| Less than $10,000 | 4 | 2.8% |
| $10,000 to $14,999 | 1 | 0.7% |
| $15,000 to $24,999 | 14 | 9.9% |
| $25,000 to $34,999 | 37 | 26.2% |
| $35,000 to $49,999 | 10 | 7.1% |
| $50,000 to $74,999 | 60 | 42.6% |
| $75,000 to $99,999 | 9 | 6.4% |
| $100,000 to $149,999 | 4 | 2.8% |
| $150,000 to $199,999 | 0 | 0.0% |
| $200,000+ | 2 | 1.4% |
Household Income by Householder Age in Lore City
The median household income in Lore City is $51,875, with the highest median household income of $55,592 found in the 25 to 44 years age bracket for the primary householder. A total of 67 households (47.5%) fall into this category.
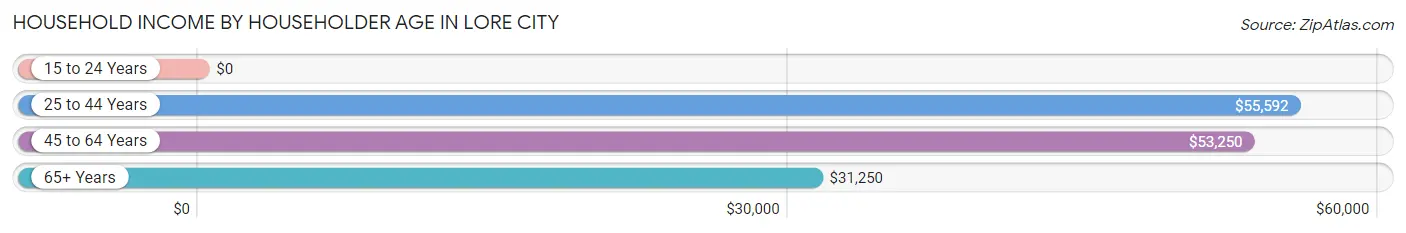
| Income Bracket | # Households | Median Income |
| 15 to 24 Years | 0 (0.0%) | $0 |
| 25 to 44 Years | 67 (47.5%) | $55,592 |
| 45 to 64 Years | 41 (29.1%) | $53,250 |
| 65+ Years | 33 (23.4%) | $31,250 |
| Total | 141 (100.0%) | $51,875 |
Poverty in Lore City
Income Below Poverty by Sex and Age in Lore City
With 20.5% poverty level for males and 36.8% for females among the residents of Lore City, 65 to 74 year old males and under 5 year old females are the most vulnerable to poverty, with 3 males (50.0%) and 44 females (80.0%) in their respective age groups living below the poverty level.
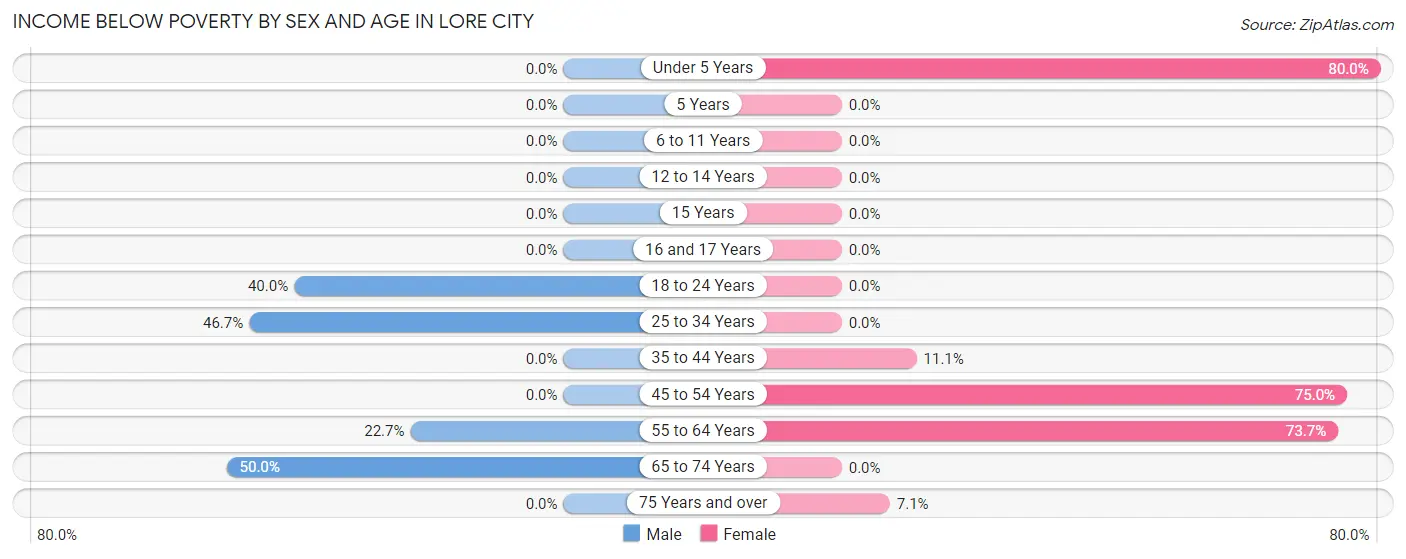
| Age Bracket | Male | Female |
| Under 5 Years | 0 (0.0%) | 44 (80.0%) |
| 5 Years | 0 (0.0%) | 0 (0.0%) |
| 6 to 11 Years | 0 (0.0%) | 0 (0.0%) |
| 12 to 14 Years | 0 (0.0%) | 0 (0.0%) |
| 15 Years | 0 (0.0%) | 0 (0.0%) |
| 16 and 17 Years | 0 (0.0%) | 0 (0.0%) |
| 18 to 24 Years | 6 (40.0%) | 0 (0.0%) |
| 25 to 34 Years | 21 (46.7%) | 0 (0.0%) |
| 35 to 44 Years | 0 (0.0%) | 2 (11.1%) |
| 45 to 54 Years | 0 (0.0%) | 6 (75.0%) |
| 55 to 64 Years | 5 (22.7%) | 14 (73.7%) |
| 65 to 74 Years | 3 (50.0%) | 0 (0.0%) |
| 75 Years and over | 0 (0.0%) | 1 (7.1%) |
| Total | 35 (20.5%) | 67 (36.8%) |
Income Above Poverty by Sex and Age in Lore City
According to the poverty statistics in Lore City, males aged under 5 years and females aged 6 to 11 years are the age groups that are most secure financially, with 100.0% of males and 100.0% of females in these age groups living above the poverty line.
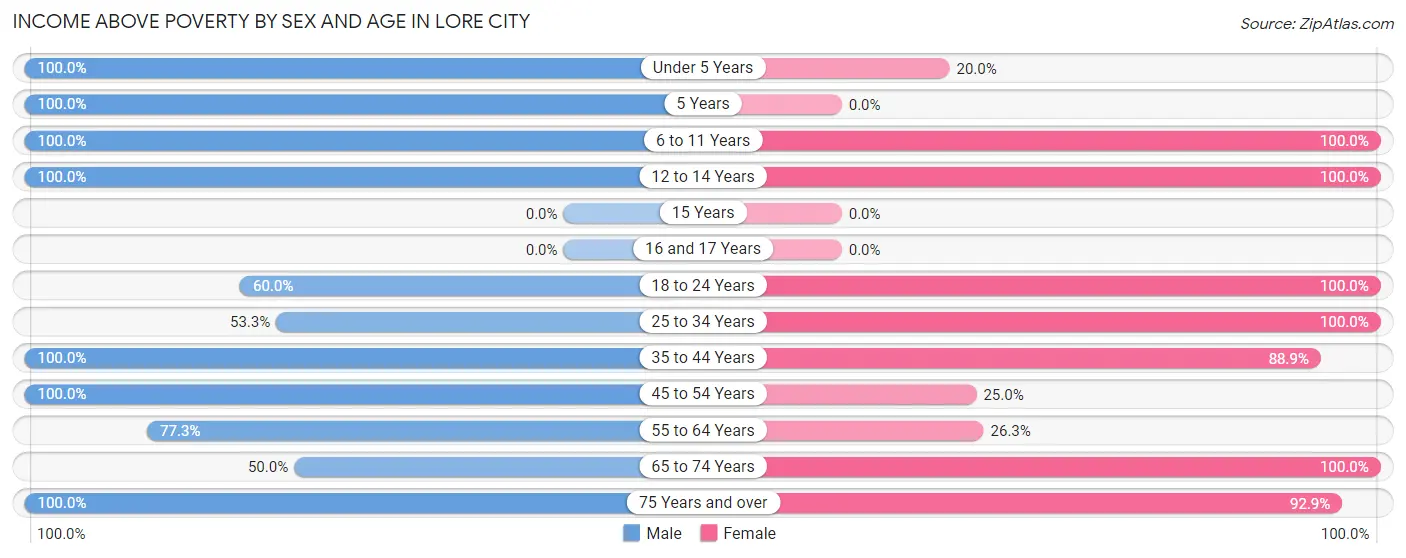
| Age Bracket | Male | Female |
| Under 5 Years | 4 (100.0%) | 11 (20.0%) |
| 5 Years | 14 (100.0%) | 0 (0.0%) |
| 6 to 11 Years | 20 (100.0%) | 2 (100.0%) |
| 12 to 14 Years | 2 (100.0%) | 5 (100.0%) |
| 15 Years | 0 (0.0%) | 0 (0.0%) |
| 16 and 17 Years | 0 (0.0%) | 0 (0.0%) |
| 18 to 24 Years | 9 (60.0%) | 9 (100.0%) |
| 25 to 34 Years | 24 (53.3%) | 38 (100.0%) |
| 35 to 44 Years | 19 (100.0%) | 16 (88.9%) |
| 45 to 54 Years | 15 (100.0%) | 2 (25.0%) |
| 55 to 64 Years | 17 (77.3%) | 5 (26.3%) |
| 65 to 74 Years | 3 (50.0%) | 14 (100.0%) |
| 75 Years and over | 9 (100.0%) | 13 (92.9%) |
| Total | 136 (79.5%) | 115 (63.2%) |
Income Below Poverty Among Married-Couple Families in Lore City
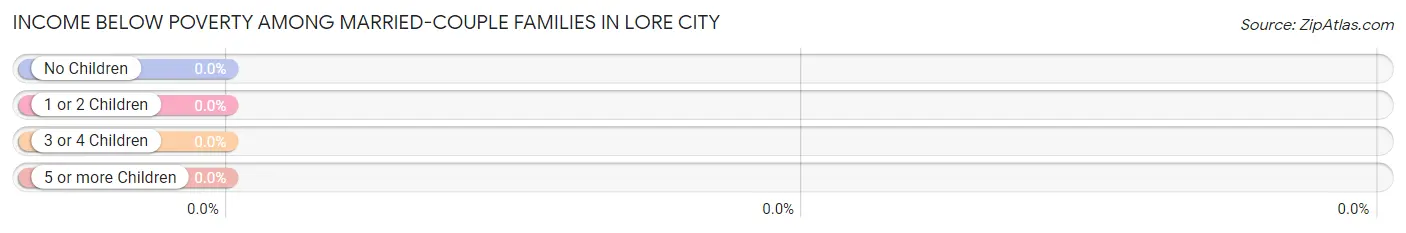
| Children | Above Poverty | Below Poverty |
| No Children | 16 (100.0%) | 0 (0.0%) |
| 1 or 2 Children | 16 (100.0%) | 0 (0.0%) |
| 3 or 4 Children | 2 (100.0%) | 0 (0.0%) |
| 5 or more Children | 0 (0.0%) | 0 (0.0%) |
| Total | 34 (100.0%) | 0 (0.0%) |
Income Below Poverty Among Single-Parent Households in Lore City
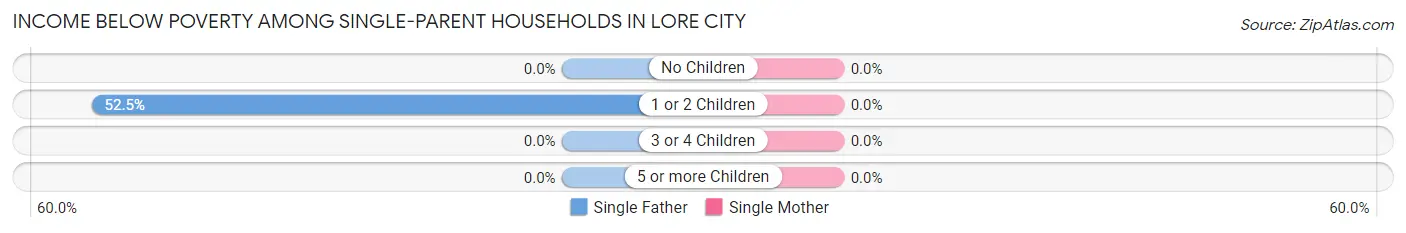
| Children | Single Father | Single Mother |
| No Children | 0 (0.0%) | 0 (0.0%) |
| 1 or 2 Children | 21 (52.5%) | 0 (0.0%) |
| 3 or 4 Children | 0 (0.0%) | 0 (0.0%) |
| 5 or more Children | 0 (0.0%) | 0 (0.0%) |
| Total | 21 (42.9%) | 0 (0.0%) |
Income Below Poverty Among Married-Couple vs Single-Parent Households in Lore City
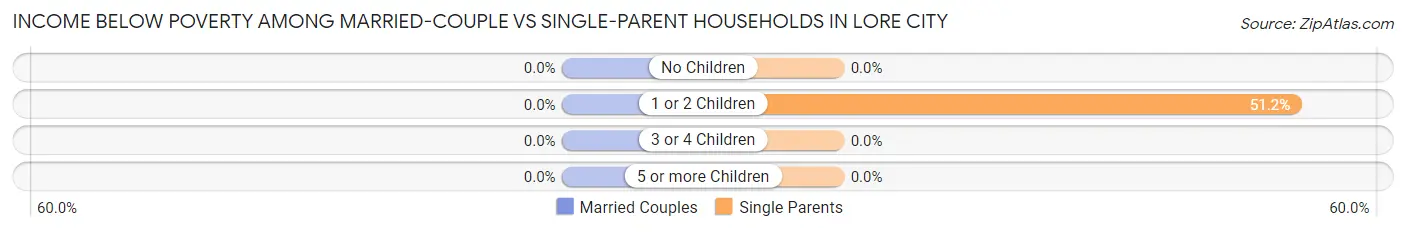
| Children | Married-Couple Families | Single-Parent Households |
| No Children | 0 (0.0%) | 0 (0.0%) |
| 1 or 2 Children | 0 (0.0%) | 21 (51.2%) |
| 3 or 4 Children | 0 (0.0%) | 0 (0.0%) |
| 5 or more Children | 0 (0.0%) | 0 (0.0%) |
| Total | 0 (0.0%) | 21 (42.0%) |
Race in Lore City
The most populous races in Lore City are White / Caucasian (329 | 93.2%), Two or more Races (15 | 4.3%), and Black / African American (9 | 2.5%).
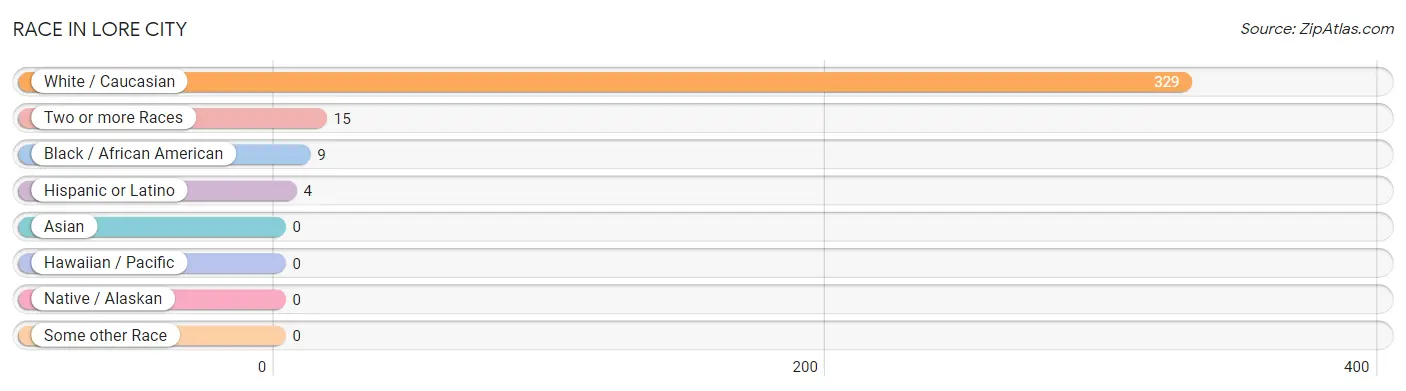
| Race | # Population | % Population |
| Asian | 0 | 0.0% |
| Black / African American | 9 | 2.5% |
| Hawaiian / Pacific | 0 | 0.0% |
| Hispanic or Latino | 4 | 1.1% |
| Native / Alaskan | 0 | 0.0% |
| White / Caucasian | 329 | 93.2% |
| Two or more Races | 15 | 4.3% |
| Some other Race | 0 | 0.0% |
| Total | 353 | 100.0% |
Ancestry in Lore City
The most populous ancestries reported in Lore City are German (114 | 32.3%), English (71 | 20.1%), Irish (48 | 13.6%), Italian (14 | 4.0%), and Polish (12 | 3.4%), together accounting for 73.4% of all Lore City residents.
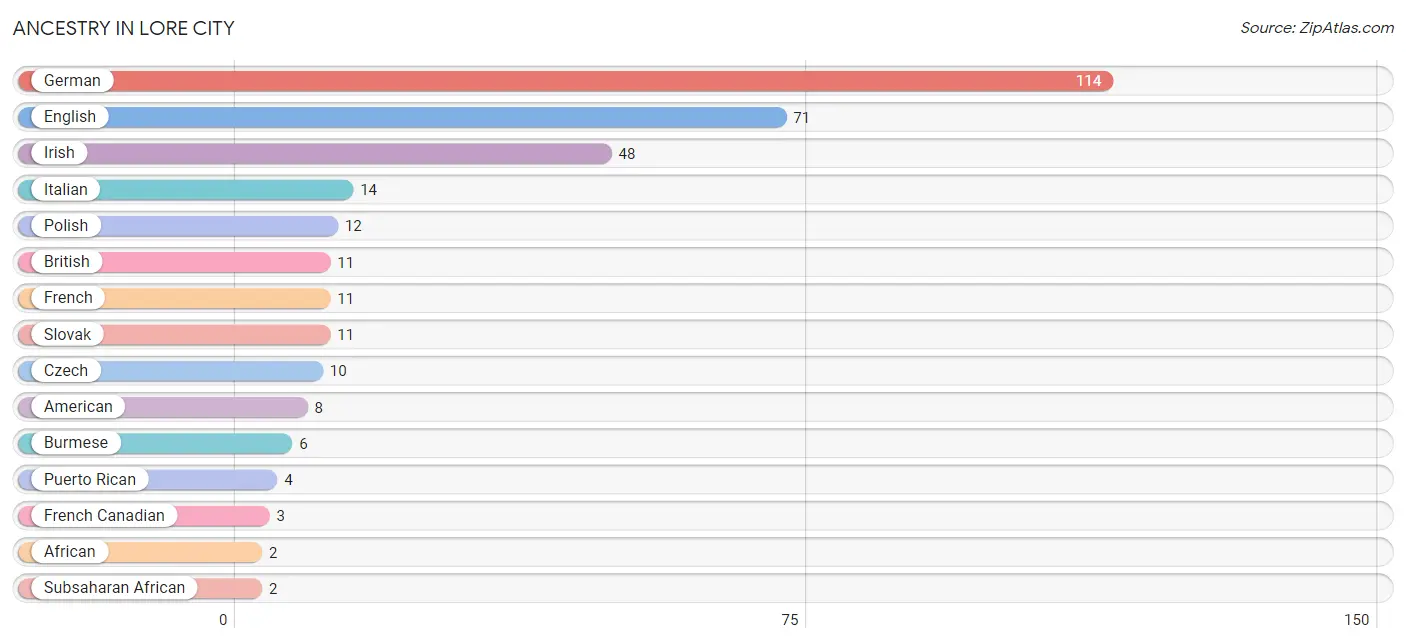
| Ancestry | # Population | % Population |
| African | 2 | 0.6% |
| American | 8 | 2.3% |
| British | 11 | 3.1% |
| Burmese | 6 | 1.7% |
| Czech | 10 | 2.8% |
| Dutch | 1 | 0.3% |
| English | 71 | 20.1% |
| European | 1 | 0.3% |
| French | 11 | 3.1% |
| French Canadian | 3 | 0.9% |
| German | 114 | 32.3% |
| Irish | 48 | 13.6% |
| Italian | 14 | 4.0% |
| Polish | 12 | 3.4% |
| Puerto Rican | 4 | 1.1% |
| Slovak | 11 | 3.1% |
| Subsaharan African | 2 | 0.6% |
| Ukrainian | 1 | 0.3% | View All 18 Rows |
Immigrants in Lore City

| Immigration Origin | # Population | % Population | View All 0 Rows |
Sex and Age in Lore City
Sex and Age in Lore City
The most populous age groups in Lore City are 5 to 9 Years (34 | 19.9%) for men and Under 5 Years (55 | 30.2%) for women.
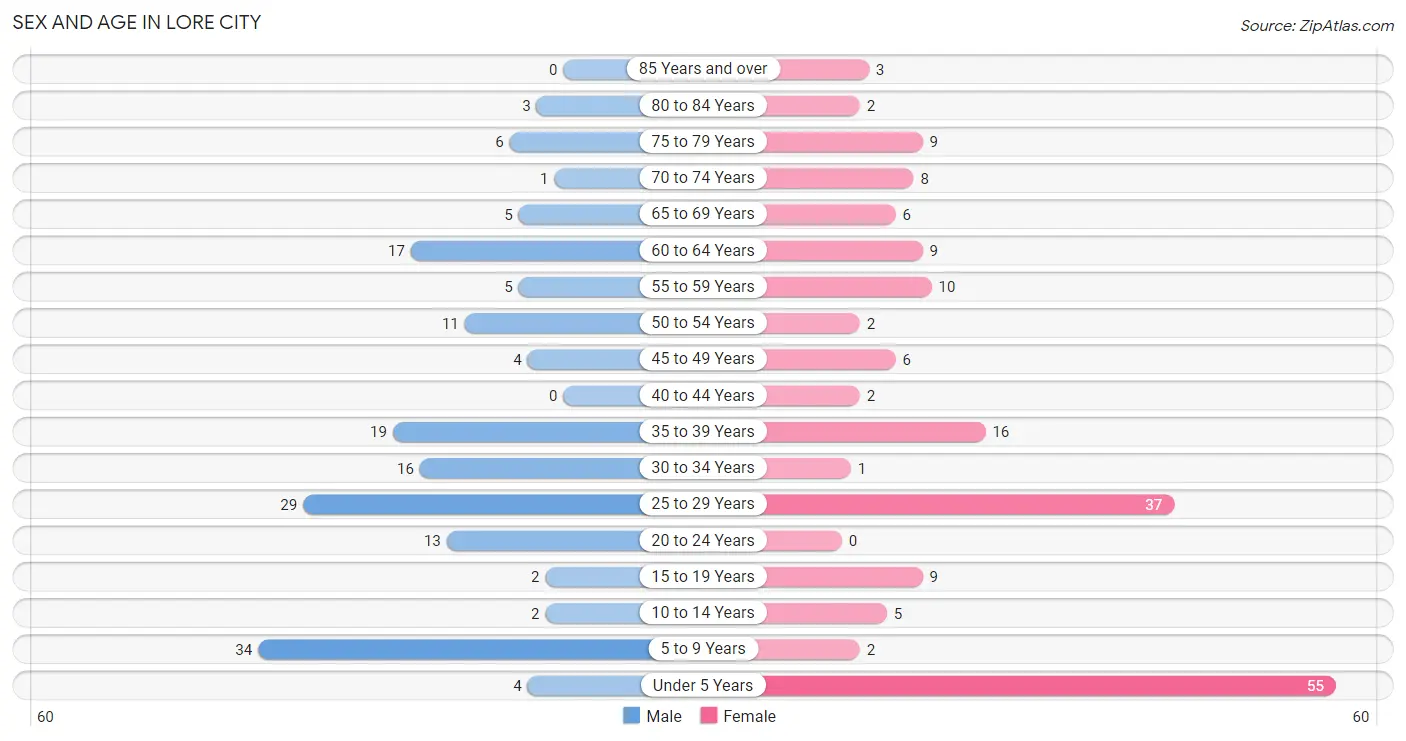
| Age Bracket | Male | Female |
| Under 5 Years | 4 (2.3%) | 55 (30.2%) |
| 5 to 9 Years | 34 (19.9%) | 2 (1.1%) |
| 10 to 14 Years | 2 (1.2%) | 5 (2.8%) |
| 15 to 19 Years | 2 (1.2%) | 9 (5.0%) |
| 20 to 24 Years | 13 (7.6%) | 0 (0.0%) |
| 25 to 29 Years | 29 (17.0%) | 37 (20.3%) |
| 30 to 34 Years | 16 (9.4%) | 1 (0.5%) |
| 35 to 39 Years | 19 (11.1%) | 16 (8.8%) |
| 40 to 44 Years | 0 (0.0%) | 2 (1.1%) |
| 45 to 49 Years | 4 (2.3%) | 6 (3.3%) |
| 50 to 54 Years | 11 (6.4%) | 2 (1.1%) |
| 55 to 59 Years | 5 (2.9%) | 10 (5.5%) |
| 60 to 64 Years | 17 (9.9%) | 9 (5.0%) |
| 65 to 69 Years | 5 (2.9%) | 6 (3.3%) |
| 70 to 74 Years | 1 (0.6%) | 8 (4.4%) |
| 75 to 79 Years | 6 (3.5%) | 9 (5.0%) |
| 80 to 84 Years | 3 (1.8%) | 2 (1.1%) |
| 85 Years and over | 0 (0.0%) | 3 (1.7%) |
| Total | 171 (100.0%) | 182 (100.0%) |
Families and Households in Lore City
Median Family Size in Lore City
The median family size in Lore City is 2.85 persons per family, with single female/mother families (1 | 1.2%) accounting for the largest median family size of 4 persons per family. On the other hand, single male/father families (49 | 58.3%) represent the smallest median family size with 2.67 persons per family.
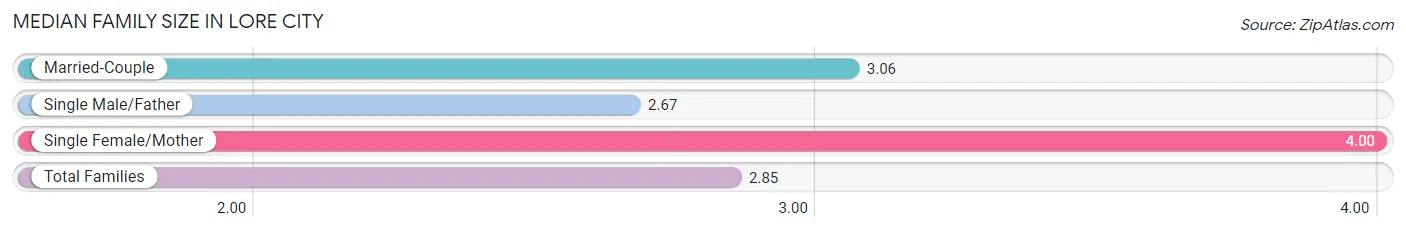
| Family Type | # Families | Family Size |
| Married-Couple | 34 (40.5%) | 3.06 |
| Single Male/Father | 49 (58.3%) | 2.67 |
| Single Female/Mother | 1 (1.2%) | 4.00 |
| Total Families | 84 (100.0%) | 2.85 |
Median Household Size in Lore City
The median household size in Lore City is 2.50 persons per household, with single female/mother households (1 | 0.7%) accounting for the largest median household size of 4 persons per household. non-family households (57 | 40.4%) represent the smallest median household size with 1.14 persons per household.
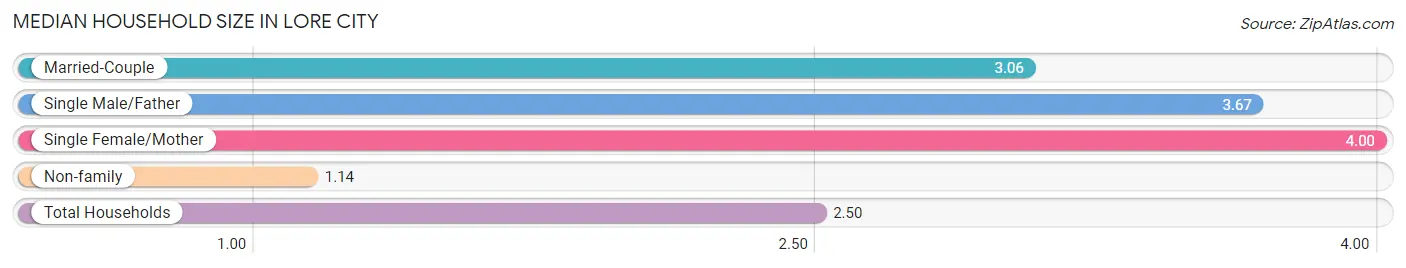
| Household Type | # Households | Household Size |
| Married-Couple | 34 (24.1%) | 3.06 |
| Single Male/Father | 49 (34.7%) | 3.67 |
| Single Female/Mother | 1 (0.7%) | 4.00 |
| Non-family | 57 (40.4%) | 1.14 |
| Total Households | 141 (100.0%) | 2.50 |
Household Size by Marriage Status in Lore City
Out of a total of 141 households in Lore City, 84 (59.6%) are family households, while 57 (40.4%) are nonfamily households. The most numerous type of family households are 4-person households, comprising 40, and the most common type of nonfamily households are 1-person households, comprising 46.
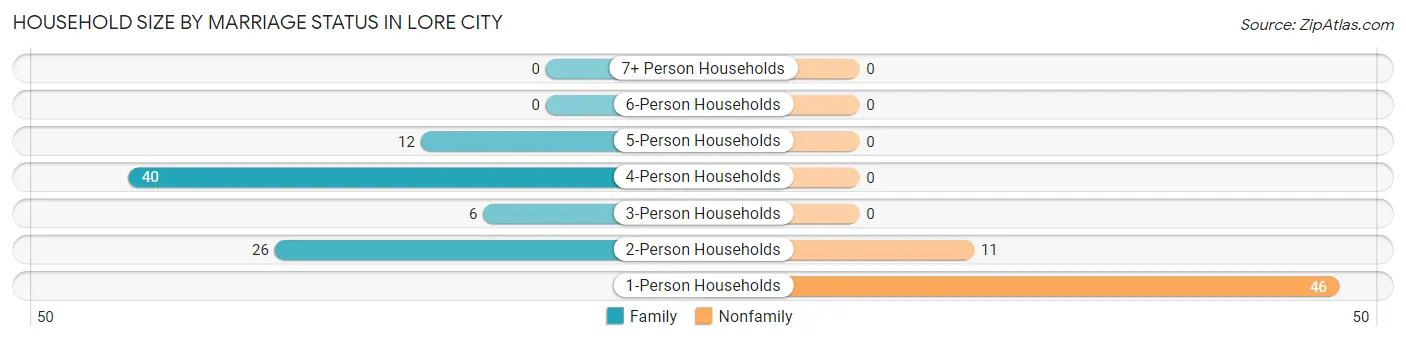
| Household Size | Family Households | Nonfamily Households |
| 1-Person Households | - | 46 (32.6%) |
| 2-Person Households | 26 (18.4%) | 11 (7.8%) |
| 3-Person Households | 6 (4.3%) | 0 (0.0%) |
| 4-Person Households | 40 (28.4%) | 0 (0.0%) |
| 5-Person Households | 12 (8.5%) | 0 (0.0%) |
| 6-Person Households | 0 (0.0%) | 0 (0.0%) |
| 7+ Person Households | 0 (0.0%) | 0 (0.0%) |
| Total | 84 (59.6%) | 57 (40.4%) |
Female Fertility in Lore City
Fertility by Age in Lore City
| Age Bracket | Women with Births | Births / 1,000 Women |
| 15 to 19 years | 0 (0.0%) | 0.0 |
| 20 to 34 years | 0 (0.0%) | 0.0 |
| 35 to 50 years | 0 (0.0%) | 0.0 |
| Total | 0 (0.0%) | 0.0 |
Fertility by Age by Marriage Status in Lore City
| Age Bracket | Married | Unmarried |
| 15 to 19 years | 0 (0.0%) | 0 (0.0%) |
| 20 to 34 years | 0 (0.0%) | 0 (0.0%) |
| 35 to 50 years | 0 (0.0%) | 0 (0.0%) |
| Total | 0 (0.0%) | 0 (0.0%) |
Fertility by Education in Lore City
| Educational Attainment | Women with Births | Births / 1,000 Women |
| Less than High School | 0 (0.0%) | 0.0 |
| High School Diploma | 0 (0.0%) | 0.0 |
| College or Associate's Degree | 0 (0.0%) | 0.0 |
| Bachelor's Degree | 0 (0.0%) | 0.0 |
| Graduate Degree | 0 (0.0%) | 0.0 |
| Total | 0 (0.0%) | 0.0 |
Fertility by Education by Marriage Status in Lore City
| Educational Attainment | Married | Unmarried |
| Less than High School | 0 (0.0%) | 0 (0.0%) |
| High School Diploma | 0 (0.0%) | 0 (0.0%) |
| College or Associate's Degree | 0 (0.0%) | 0 (0.0%) |
| Bachelor's Degree | 0 (0.0%) | 0 (0.0%) |
| Graduate Degree | 0 (0.0%) | 0 (0.0%) |
| Total | 0 (0.0%) | 0 (0.0%) |
Employment Characteristics in Lore City
Employment by Class of Employer in Lore City
Among the 144 employed individuals in Lore City, private company employees (97 | 67.4%), unpaid family workers (21 | 14.6%), and local government employees (11 | 7.6%) make up the most common classes of employment.
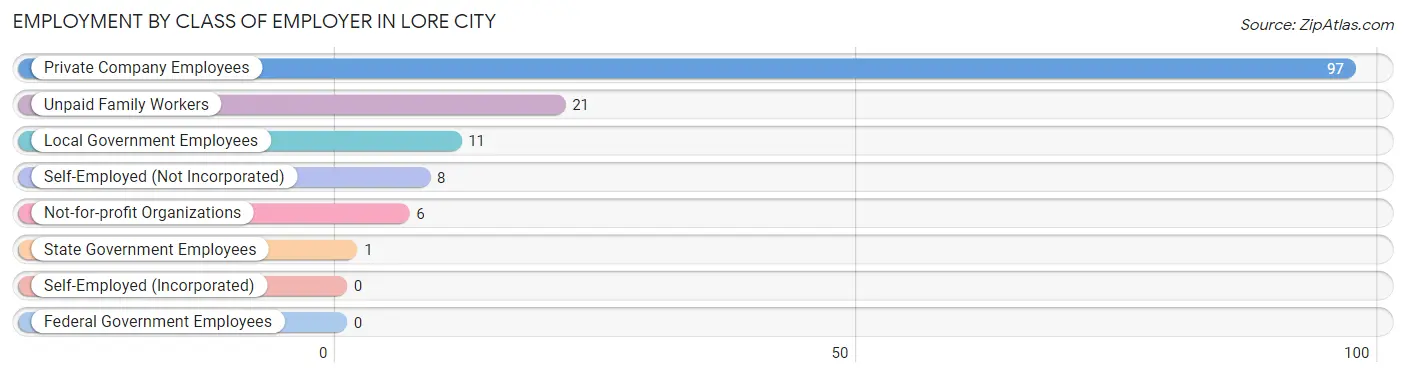
| Employer Class | # Employees | % Employees |
| Private Company Employees | 97 | 67.4% |
| Self-Employed (Incorporated) | 0 | 0.0% |
| Self-Employed (Not Incorporated) | 8 | 5.6% |
| Not-for-profit Organizations | 6 | 4.2% |
| Local Government Employees | 11 | 7.6% |
| State Government Employees | 1 | 0.7% |
| Federal Government Employees | 0 | 0.0% |
| Unpaid Family Workers | 21 | 14.6% |
| Total | 144 | 100.0% |
Employment Status by Age in Lore City
According to the labor force statistics for Lore City, out of the total population over 16 years of age (251), 59.0% or 148 individuals are in the labor force, with 2.7% or 4 of them unemployed. The age group with the highest labor force participation rate is 20 to 24 years, with 100.0% or 13 individuals in the labor force. Within the labor force, the 60 to 64 years age range has the highest percentage of unemployed individuals, with 22.2% or 2 of them being unemployed.
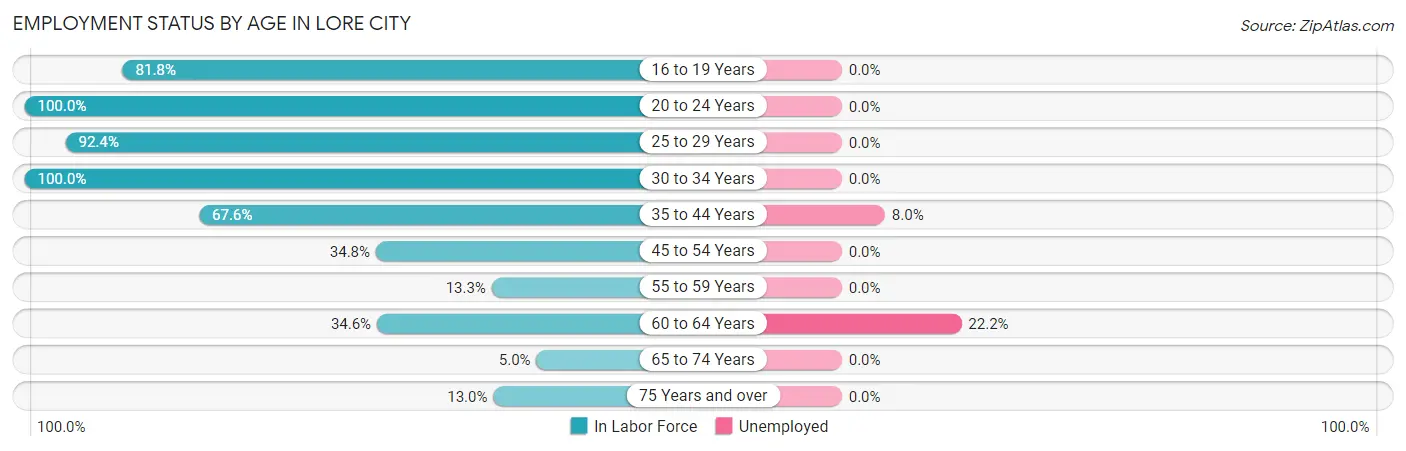
| Age Bracket | In Labor Force | Unemployed |
| 16 to 19 Years | 9 (81.8%) | 0 (0.0%) |
| 20 to 24 Years | 13 (100.0%) | 0 (0.0%) |
| 25 to 29 Years | 61 (92.4%) | 0 (0.0%) |
| 30 to 34 Years | 17 (100.0%) | 0 (0.0%) |
| 35 to 44 Years | 25 (67.6%) | 2 (8.0%) |
| 45 to 54 Years | 8 (34.8%) | 0 (0.0%) |
| 55 to 59 Years | 2 (13.3%) | 0 (0.0%) |
| 60 to 64 Years | 9 (34.6%) | 2 (22.2%) |
| 65 to 74 Years | 1 (5.0%) | 0 (0.0%) |
| 75 Years and over | 3 (13.0%) | 0 (0.0%) |
| Total | 148 (59.0%) | 4 (2.7%) |
Employment Status by Educational Attainment in Lore City
According to labor force statistics for Lore City, 66.3% of individuals (122) out of the total population between 25 and 64 years of age (184) are in the labor force, with 3.3% or 4 of them being unemployed. The group with the highest labor force participation rate are those with the educational attainment of bachelor's degree or higher, with 100.0% or 15 individuals in the labor force. Within the labor force, individuals with high school diploma education have the highest percentage of unemployment, with 10.5% or 4 of them being unemployed.
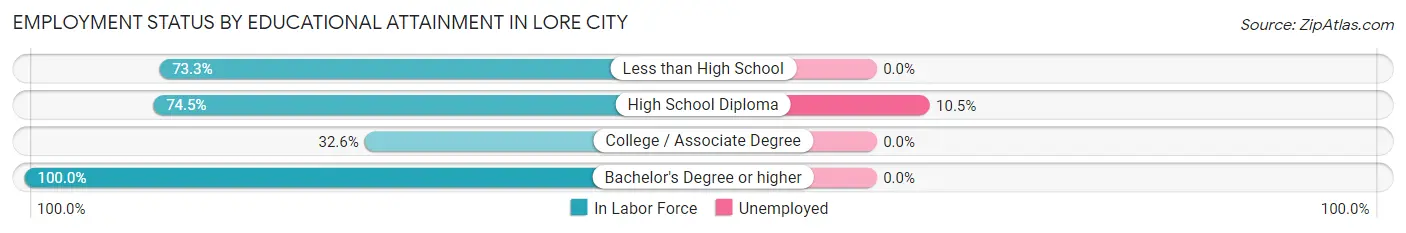
| Educational Attainment | In Labor Force | Unemployed |
| Less than High School | 55 (73.3%) | 0 (0.0%) |
| High School Diploma | 38 (74.5%) | 5 (10.5%) |
| College / Associate Degree | 14 (32.6%) | 0 (0.0%) |
| Bachelor's Degree or higher | 15 (100.0%) | 0 (0.0%) |
| Total | 122 (66.3%) | 6 (3.3%) |
Employment Occupations by Sex in Lore City
Management, Business, Science and Arts Occupations
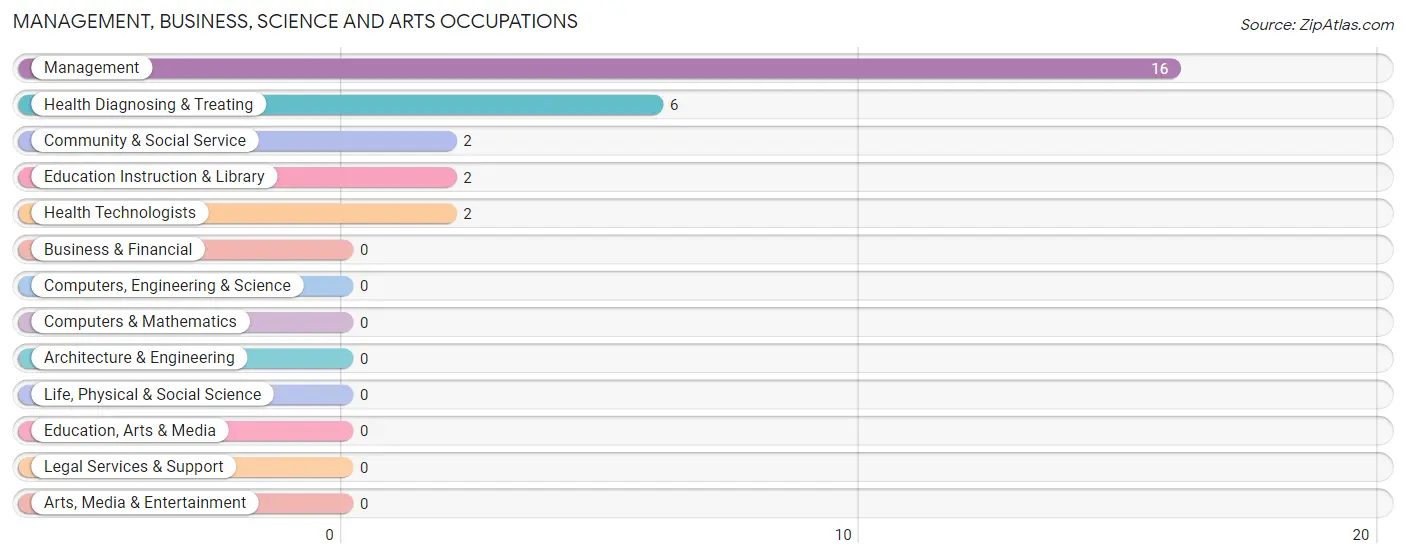
The most common Management, Business, Science and Arts occupations in Lore City are Management (16 | 11.1%), Health Diagnosing & Treating (6 | 4.2%), Community & Social Service (2 | 1.4%), Education Instruction & Library (2 | 1.4%), and Health Technologists (2 | 1.4%).
Management, Business, Science and Arts Occupations by Sex
Within the Management, Business, Science and Arts occupations in Lore City, the most male-oriented occupations are Health Technologists (100.0%), Management (75.0%), and Health Diagnosing & Treating (66.7%), while the most female-oriented occupations are Community & Social Service (50.0%), Education Instruction & Library (50.0%), and Health Diagnosing & Treating (33.3%).
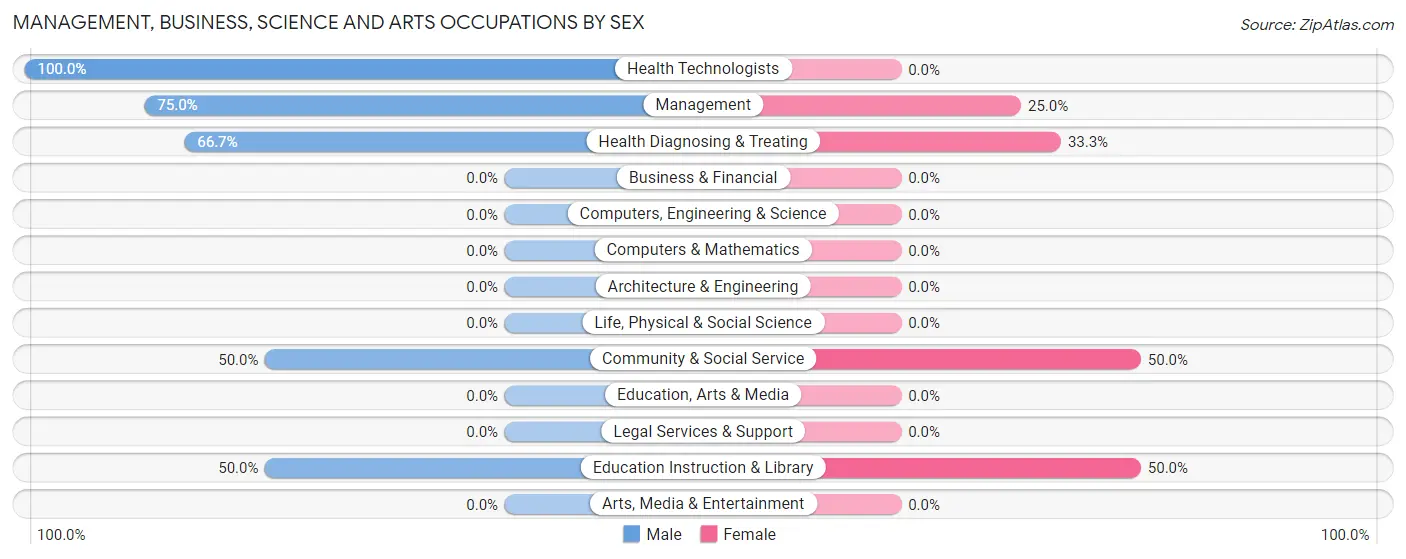
| Occupation | Male | Female |
| Management | 12 (75.0%) | 4 (25.0%) |
| Business & Financial | 0 (0.0%) | 0 (0.0%) |
| Computers, Engineering & Science | 0 (0.0%) | 0 (0.0%) |
| Computers & Mathematics | 0 (0.0%) | 0 (0.0%) |
| Architecture & Engineering | 0 (0.0%) | 0 (0.0%) |
| Life, Physical & Social Science | 0 (0.0%) | 0 (0.0%) |
| Community & Social Service | 1 (50.0%) | 1 (50.0%) |
| Education, Arts & Media | 0 (0.0%) | 0 (0.0%) |
| Legal Services & Support | 0 (0.0%) | 0 (0.0%) |
| Education Instruction & Library | 1 (50.0%) | 1 (50.0%) |
| Arts, Media & Entertainment | 0 (0.0%) | 0 (0.0%) |
| Health Diagnosing & Treating | 4 (66.7%) | 2 (33.3%) |
| Health Technologists | 2 (100.0%) | 0 (0.0%) |
| Total (Category) | 17 (70.8%) | 7 (29.2%) |
| Total (Overall) | 93 (64.6%) | 51 (35.4%) |
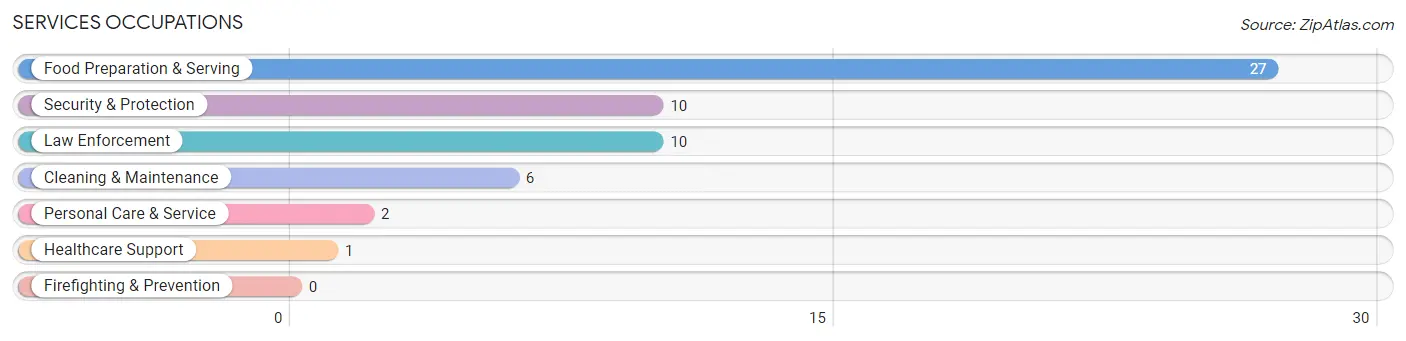
Services Occupations
The most common Services occupations in Lore City are Food Preparation & Serving (27 | 18.8%), Security & Protection (10 | 6.9%), Law Enforcement (10 | 6.9%), Cleaning & Maintenance (6 | 4.2%), and Personal Care & Service (2 | 1.4%).
Services Occupations by Sex
Within the Services occupations in Lore City, the most male-oriented occupations are Security & Protection (100.0%), Law Enforcement (100.0%), and Personal Care & Service (100.0%), while the most female-oriented occupations are Healthcare Support (100.0%), Food Preparation & Serving (100.0%), and Cleaning & Maintenance (33.3%).
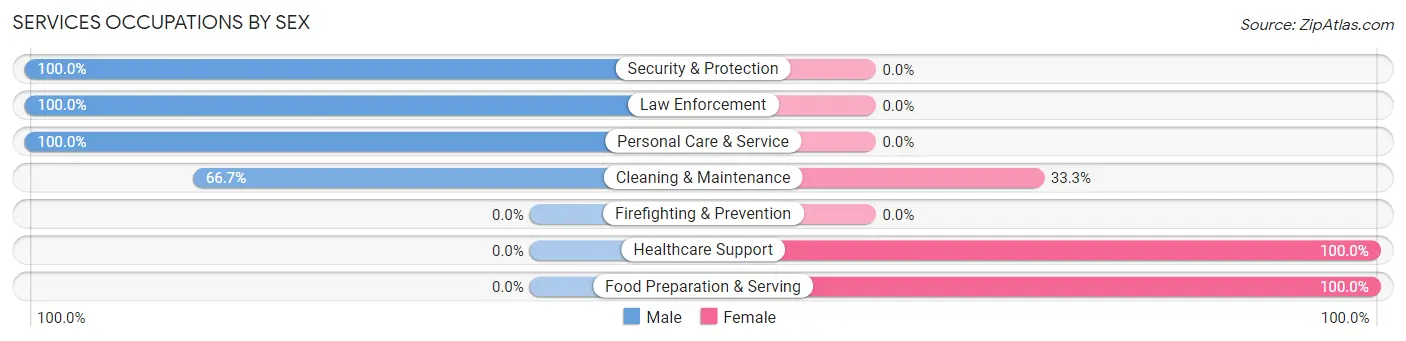
| Occupation | Male | Female |
| Healthcare Support | 0 (0.0%) | 1 (100.0%) |
| Security & Protection | 10 (100.0%) | 0 (0.0%) |
| Firefighting & Prevention | 0 (0.0%) | 0 (0.0%) |
| Law Enforcement | 10 (100.0%) | 0 (0.0%) |
| Food Preparation & Serving | 0 (0.0%) | 27 (100.0%) |
| Cleaning & Maintenance | 4 (66.7%) | 2 (33.3%) |
| Personal Care & Service | 2 (100.0%) | 0 (0.0%) |
| Total (Category) | 16 (34.8%) | 30 (65.2%) |
| Total (Overall) | 93 (64.6%) | 51 (35.4%) |
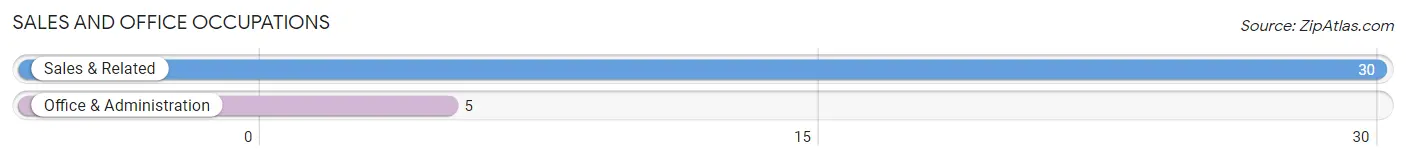
Sales and Office Occupations
The most common Sales and Office occupations in Lore City are Sales & Related (30 | 20.8%), and Office & Administration (5 | 3.5%).
Sales and Office Occupations by Sex
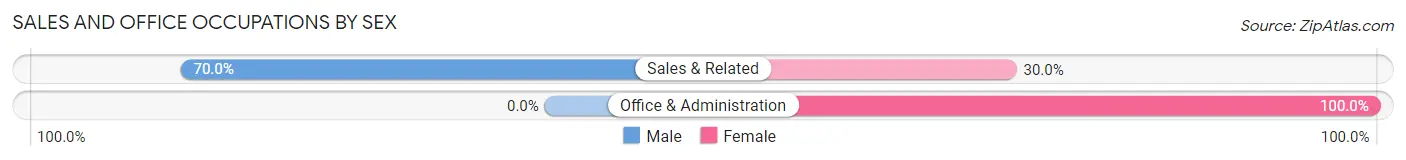
| Occupation | Male | Female |
| Sales & Related | 21 (70.0%) | 9 (30.0%) |
| Office & Administration | 0 (0.0%) | 5 (100.0%) |
| Total (Category) | 21 (60.0%) | 14 (40.0%) |
| Total (Overall) | 93 (64.6%) | 51 (35.4%) |
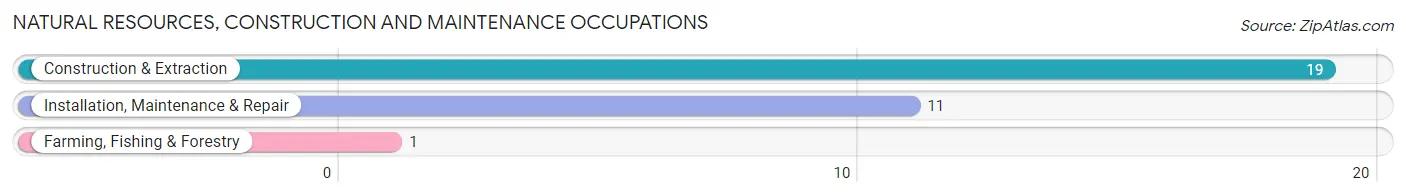
Natural Resources, Construction and Maintenance Occupations
The most common Natural Resources, Construction and Maintenance occupations in Lore City are Construction & Extraction (19 | 13.2%), Installation, Maintenance & Repair (11 | 7.6%), and Farming, Fishing & Forestry (1 | 0.7%).
Natural Resources, Construction and Maintenance Occupations by Sex
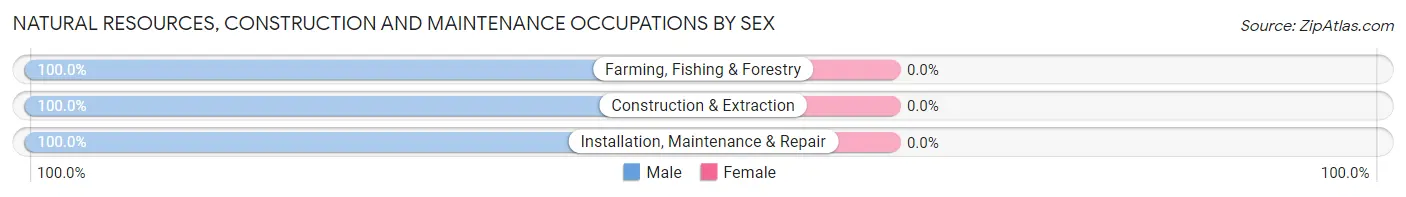
| Occupation | Male | Female |
| Farming, Fishing & Forestry | 1 (100.0%) | 0 (0.0%) |
| Construction & Extraction | 19 (100.0%) | 0 (0.0%) |
| Installation, Maintenance & Repair | 11 (100.0%) | 0 (0.0%) |
| Total (Category) | 31 (100.0%) | 0 (0.0%) |
| Total (Overall) | 93 (64.6%) | 51 (35.4%) |
Production, Transportation and Moving Occupations
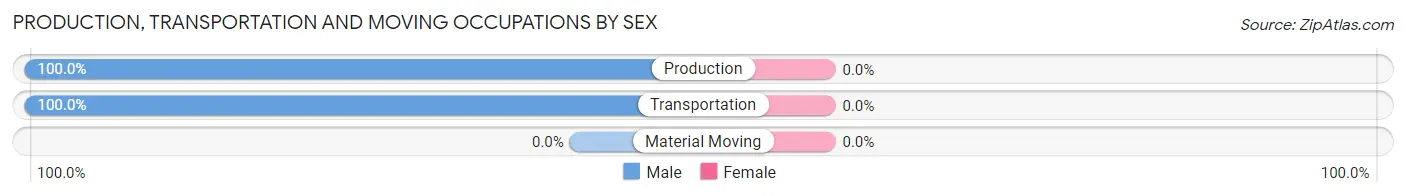
The most common Production, Transportation and Moving occupations in Lore City are Production (6 | 4.2%), and Transportation (2 | 1.4%).
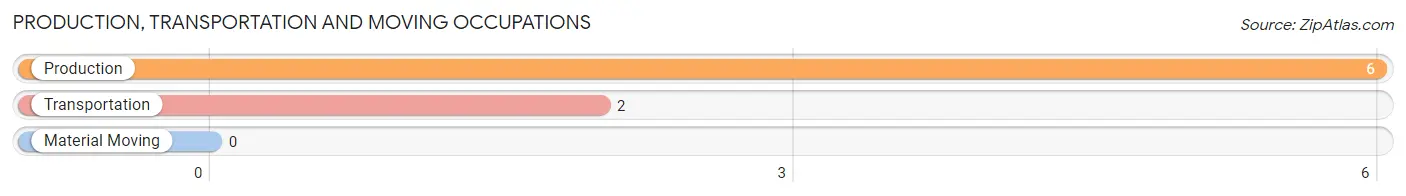
Production, Transportation and Moving Occupations by Sex
| Occupation | Male | Female |
| Production | 6 (100.0%) | 0 (0.0%) |
| Transportation | 2 (100.0%) | 0 (0.0%) |
| Material Moving | 0 (0.0%) | 0 (0.0%) |
| Total (Category) | 8 (100.0%) | 0 (0.0%) |
| Total (Overall) | 93 (64.6%) | 51 (35.4%) |
Employment Industries by Sex in Lore City
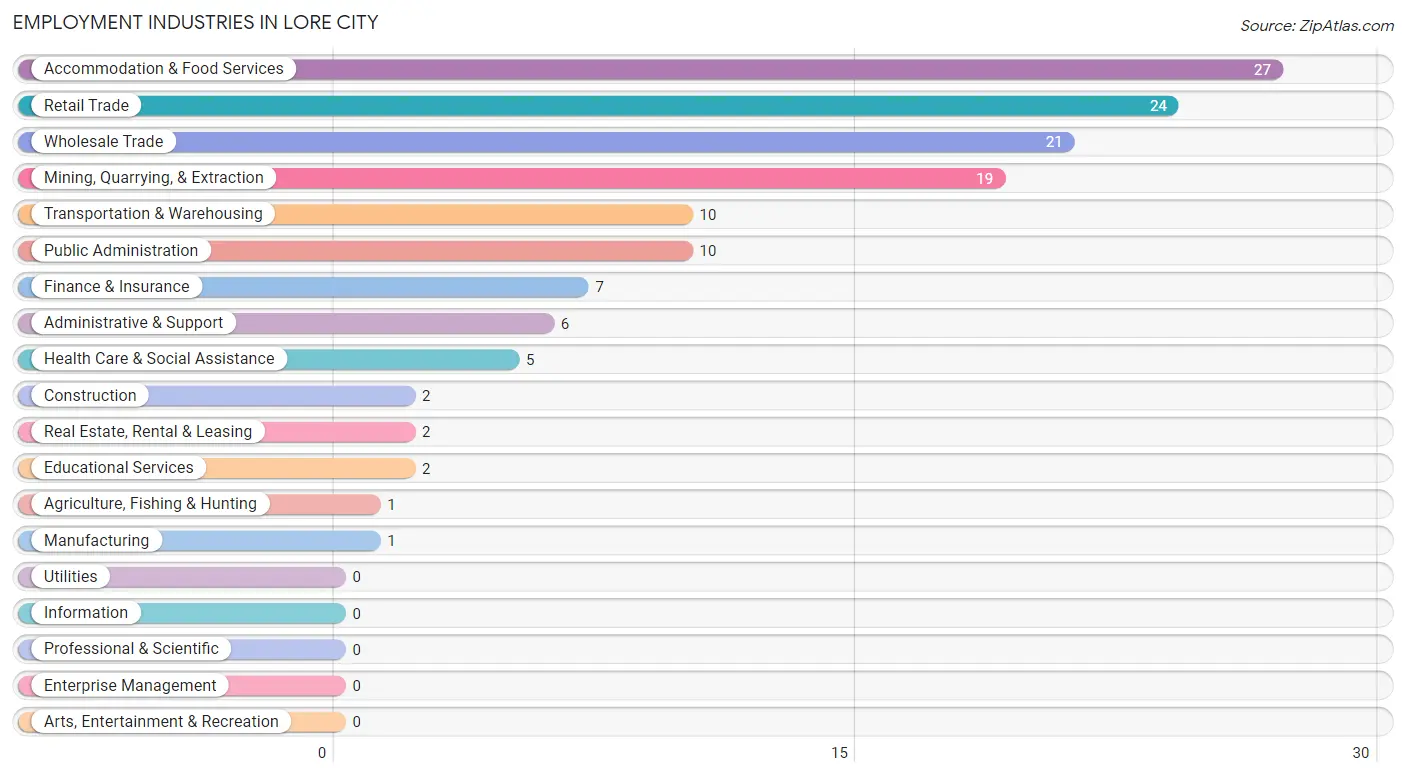
Employment Industries in Lore City
The major employment industries in Lore City include Accommodation & Food Services (27 | 18.8%), Retail Trade (24 | 16.7%), Wholesale Trade (21 | 14.6%), Mining, Quarrying, & Extraction (19 | 13.2%), and Transportation & Warehousing (10 | 6.9%).
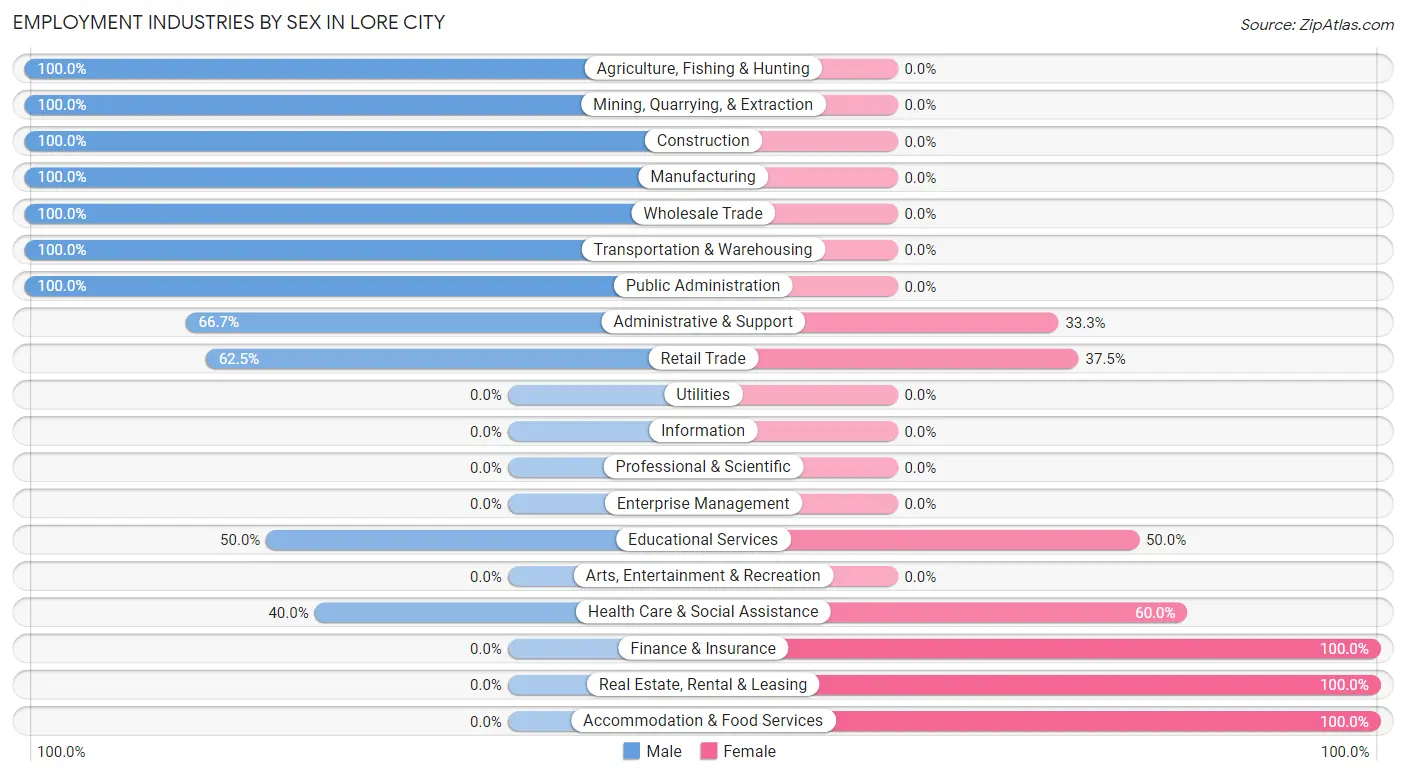
Employment Industries by Sex in Lore City
The Lore City industries that see more men than women are Agriculture, Fishing & Hunting (100.0%), Mining, Quarrying, & Extraction (100.0%), and Construction (100.0%), whereas the industries that tend to have a higher number of women are Finance & Insurance (100.0%), Real Estate, Rental & Leasing (100.0%), and Accommodation & Food Services (100.0%).
| Industry | Male | Female |
| Agriculture, Fishing & Hunting | 1 (100.0%) | 0 (0.0%) |
| Mining, Quarrying, & Extraction | 19 (100.0%) | 0 (0.0%) |
| Construction | 2 (100.0%) | 0 (0.0%) |
| Manufacturing | 1 (100.0%) | 0 (0.0%) |
| Wholesale Trade | 21 (100.0%) | 0 (0.0%) |
| Retail Trade | 15 (62.5%) | 9 (37.5%) |
| Transportation & Warehousing | 10 (100.0%) | 0 (0.0%) |
| Utilities | 0 (0.0%) | 0 (0.0%) |
| Information | 0 (0.0%) | 0 (0.0%) |
| Finance & Insurance | 0 (0.0%) | 7 (100.0%) |
| Real Estate, Rental & Leasing | 0 (0.0%) | 2 (100.0%) |
| Professional & Scientific | 0 (0.0%) | 0 (0.0%) |
| Enterprise Management | 0 (0.0%) | 0 (0.0%) |
| Administrative & Support | 4 (66.7%) | 2 (33.3%) |
| Educational Services | 1 (50.0%) | 1 (50.0%) |
| Health Care & Social Assistance | 2 (40.0%) | 3 (60.0%) |
| Arts, Entertainment & Recreation | 0 (0.0%) | 0 (0.0%) |
| Accommodation & Food Services | 0 (0.0%) | 27 (100.0%) |
| Public Administration | 10 (100.0%) | 0 (0.0%) |
| Total | 93 (64.6%) | 51 (35.4%) |
Education in Lore City
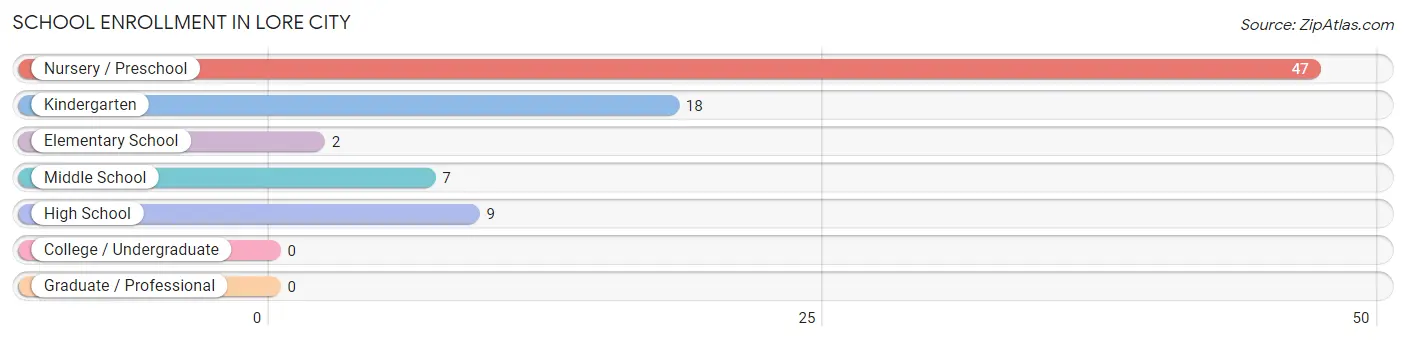
School Enrollment in Lore City
The most common levels of schooling among the 83 students in Lore City are nursery / preschool (47 | 56.6%), kindergarten (18 | 21.7%), and high school (9 | 10.8%).
| School Level | # Students | % Students |
| Nursery / Preschool | 47 | 56.6% |
| Kindergarten | 18 | 21.7% |
| Elementary School | 2 | 2.4% |
| Middle School | 7 | 8.4% |
| High School | 9 | 10.8% |
| College / Undergraduate | 0 | 0.0% |
| Graduate / Professional | 0 | 0.0% |
| Total | 83 | 100.0% |
School Enrollment by Age by Funding Source in Lore City
Out of a total of 83 students who are enrolled in schools in Lore City, 24 (28.9%) attend a private institution, while the remaining 59 (71.1%) are enrolled in public schools. The age group of 3 to 4 year olds has the highest likelihood of being enrolled in private schools, with 22 (66.7% in the age bracket) enrolled. Conversely, the age group of 10 to 14 year olds has the lowest likelihood of being enrolled in a private school, with 7 (100.0% in the age bracket) attending a public institution.
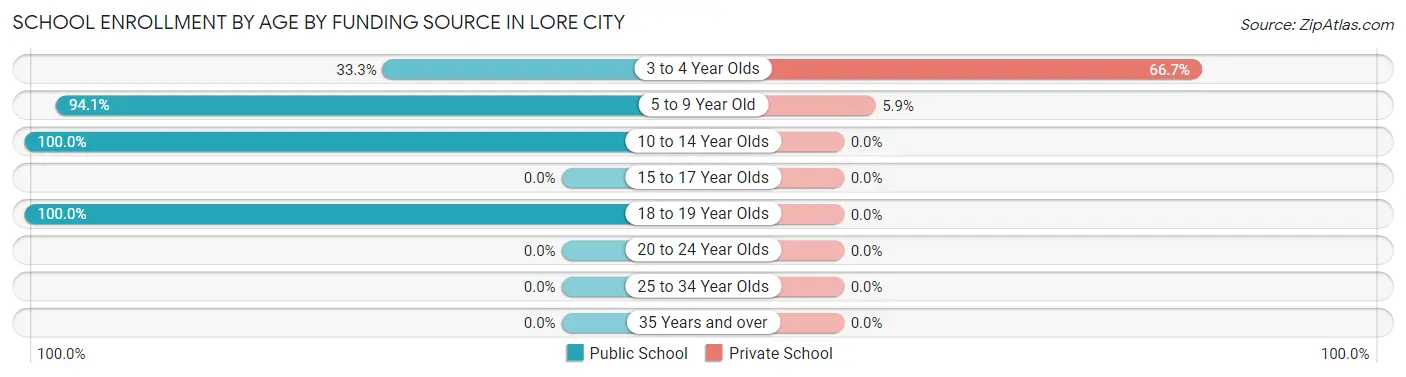
| Age Bracket | Public School | Private School |
| 3 to 4 Year Olds | 11 (33.3%) | 22 (66.7%) |
| 5 to 9 Year Old | 32 (94.1%) | 2 (5.9%) |
| 10 to 14 Year Olds | 7 (100.0%) | 0 (0.0%) |
| 15 to 17 Year Olds | 0 (0.0%) | 0 (0.0%) |
| 18 to 19 Year Olds | 9 (100.0%) | 0 (0.0%) |
| 20 to 24 Year Olds | 0 (0.0%) | 0 (0.0%) |
| 25 to 34 Year Olds | 0 (0.0%) | 0 (0.0%) |
| 35 Years and over | 0 (0.0%) | 0 (0.0%) |
| Total | 59 (71.1%) | 24 (28.9%) |
Educational Attainment by Field of Study in Lore City
Social sciences (9 | 31.0%), business (9 | 31.0%), education (4 | 13.8%), science & technology (3 | 10.3%), and computers & mathematics (2 | 6.9%) are the most common fields of study among 29 individuals in Lore City who have obtained a bachelor's degree or higher.
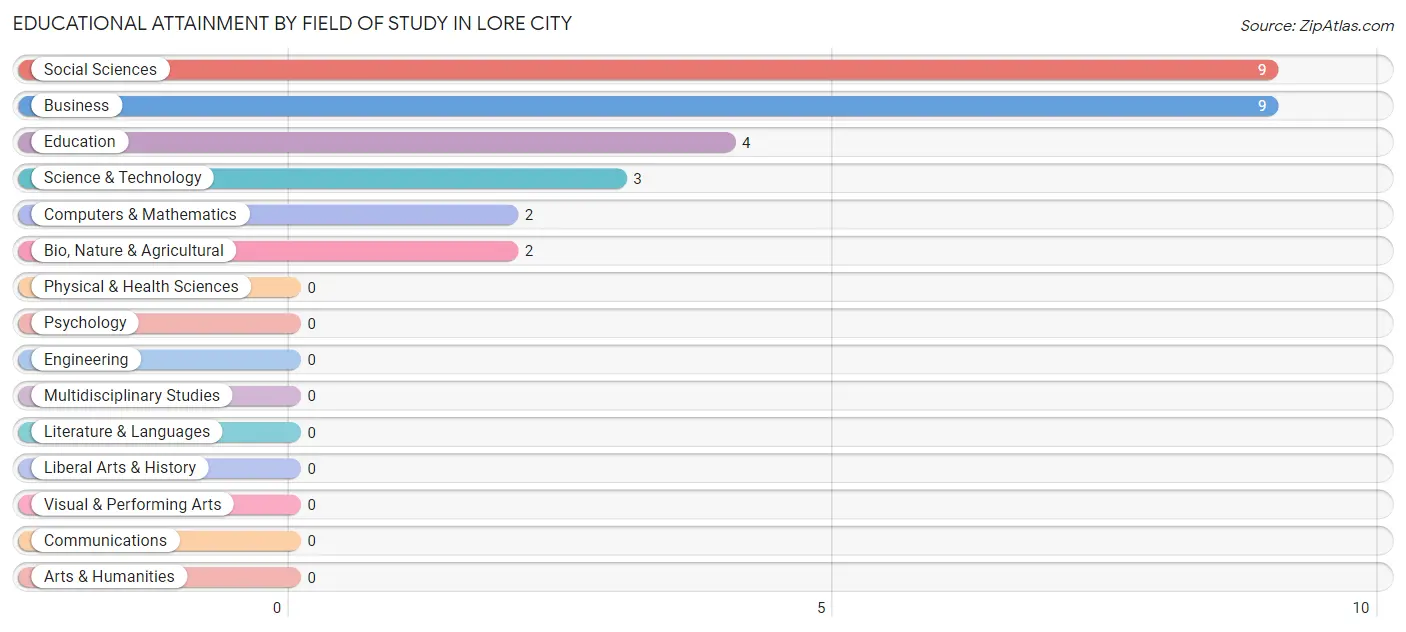
| Field of Study | # Graduates | % Graduates |
| Computers & Mathematics | 2 | 6.9% |
| Bio, Nature & Agricultural | 2 | 6.9% |
| Physical & Health Sciences | 0 | 0.0% |
| Psychology | 0 | 0.0% |
| Social Sciences | 9 | 31.0% |
| Engineering | 0 | 0.0% |
| Multidisciplinary Studies | 0 | 0.0% |
| Science & Technology | 3 | 10.3% |
| Business | 9 | 31.0% |
| Education | 4 | 13.8% |
| Literature & Languages | 0 | 0.0% |
| Liberal Arts & History | 0 | 0.0% |
| Visual & Performing Arts | 0 | 0.0% |
| Communications | 0 | 0.0% |
| Arts & Humanities | 0 | 0.0% |
| Total | 29 | 100.0% |
Transportation & Commute in Lore City
Vehicle Availability by Sex in Lore City
The most prevalent vehicle ownership categories in Lore City are males with 2 vehicles (47, accounting for 50.5%) and females with 2 vehicles (38, making up 92.2%).
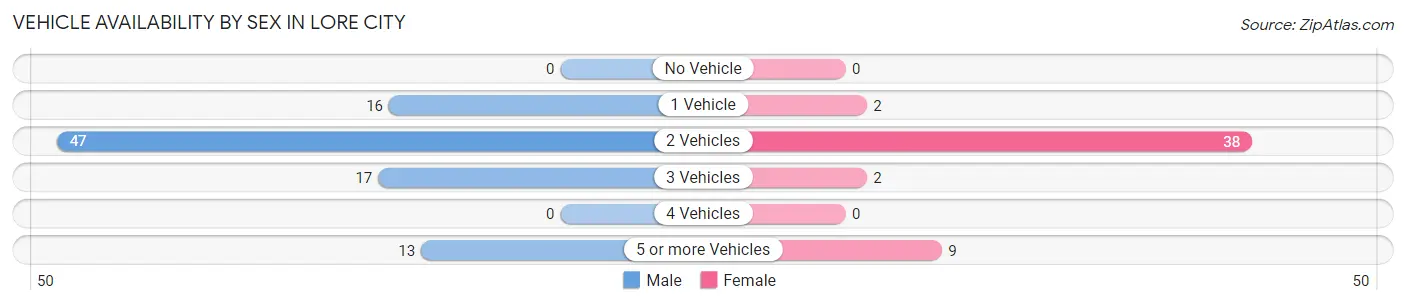
| Vehicles Available | Male | Female |
| No Vehicle | 0 (0.0%) | 0 (0.0%) |
| 1 Vehicle | 16 (17.2%) | 2 (3.9%) |
| 2 Vehicles | 47 (50.5%) | 38 (74.5%) |
| 3 Vehicles | 17 (18.3%) | 2 (3.9%) |
| 4 Vehicles | 0 (0.0%) | 0 (0.0%) |
| 5 or more Vehicles | 13 (14.0%) | 9 (17.6%) |
| Total | 93 (100.0%) | 51 (100.0%) |
Commute Time in Lore City
The most frequently occuring commute durations in Lore City are 15 to 19 minutes (63 commuters, 54.3%), 10 to 14 minutes (22 commuters, 19.0%), and 20 to 24 minutes (17 commuters, 14.7%).
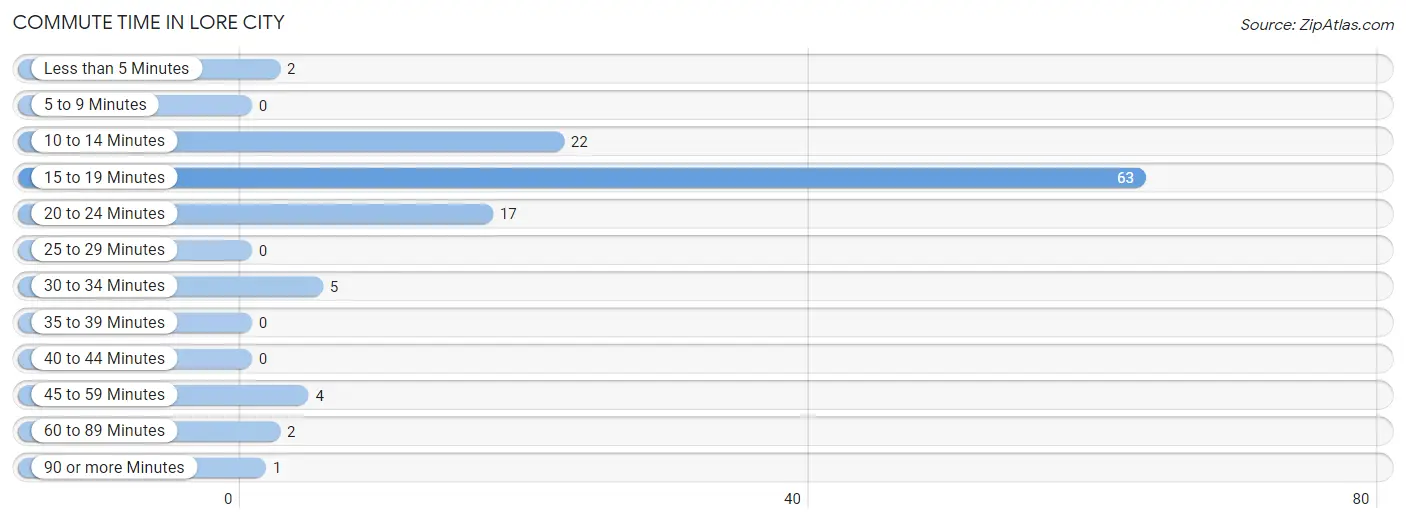
| Commute Time | # Commuters | % Commuters |
| Less than 5 Minutes | 2 | 1.7% |
| 5 to 9 Minutes | 0 | 0.0% |
| 10 to 14 Minutes | 22 | 19.0% |
| 15 to 19 Minutes | 63 | 54.3% |
| 20 to 24 Minutes | 17 | 14.7% |
| 25 to 29 Minutes | 0 | 0.0% |
| 30 to 34 Minutes | 5 | 4.3% |
| 35 to 39 Minutes | 0 | 0.0% |
| 40 to 44 Minutes | 0 | 0.0% |
| 45 to 59 Minutes | 4 | 3.5% |
| 60 to 89 Minutes | 2 | 1.7% |
| 90 or more Minutes | 1 | 0.9% |
Commute Time by Sex in Lore City
The most common commute times in Lore City are 15 to 19 minutes (25 commuters, 37.3%) for males and 15 to 19 minutes (38 commuters, 77.5%) for females.
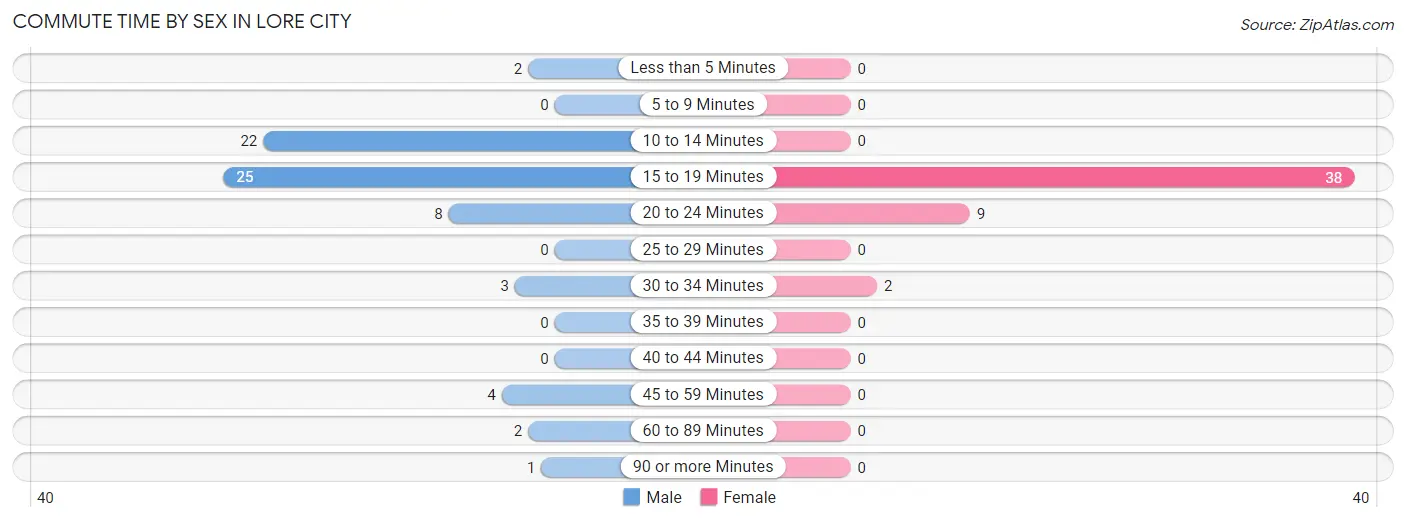
| Commute Time | Male | Female |
| Less than 5 Minutes | 2 (3.0%) | 0 (0.0%) |
| 5 to 9 Minutes | 0 (0.0%) | 0 (0.0%) |
| 10 to 14 Minutes | 22 (32.8%) | 0 (0.0%) |
| 15 to 19 Minutes | 25 (37.3%) | 38 (77.5%) |
| 20 to 24 Minutes | 8 (11.9%) | 9 (18.4%) |
| 25 to 29 Minutes | 0 (0.0%) | 0 (0.0%) |
| 30 to 34 Minutes | 3 (4.5%) | 2 (4.1%) |
| 35 to 39 Minutes | 0 (0.0%) | 0 (0.0%) |
| 40 to 44 Minutes | 0 (0.0%) | 0 (0.0%) |
| 45 to 59 Minutes | 4 (6.0%) | 0 (0.0%) |
| 60 to 89 Minutes | 2 (3.0%) | 0 (0.0%) |
| 90 or more Minutes | 1 (1.5%) | 0 (0.0%) |
Time of Departure to Work by Sex in Lore City
The most frequent times of departure to work in Lore City are 6:00 AM to 6:29 AM (21, 31.3%) for males and 10:00 AM to 10:59 AM (27, 55.1%) for females.
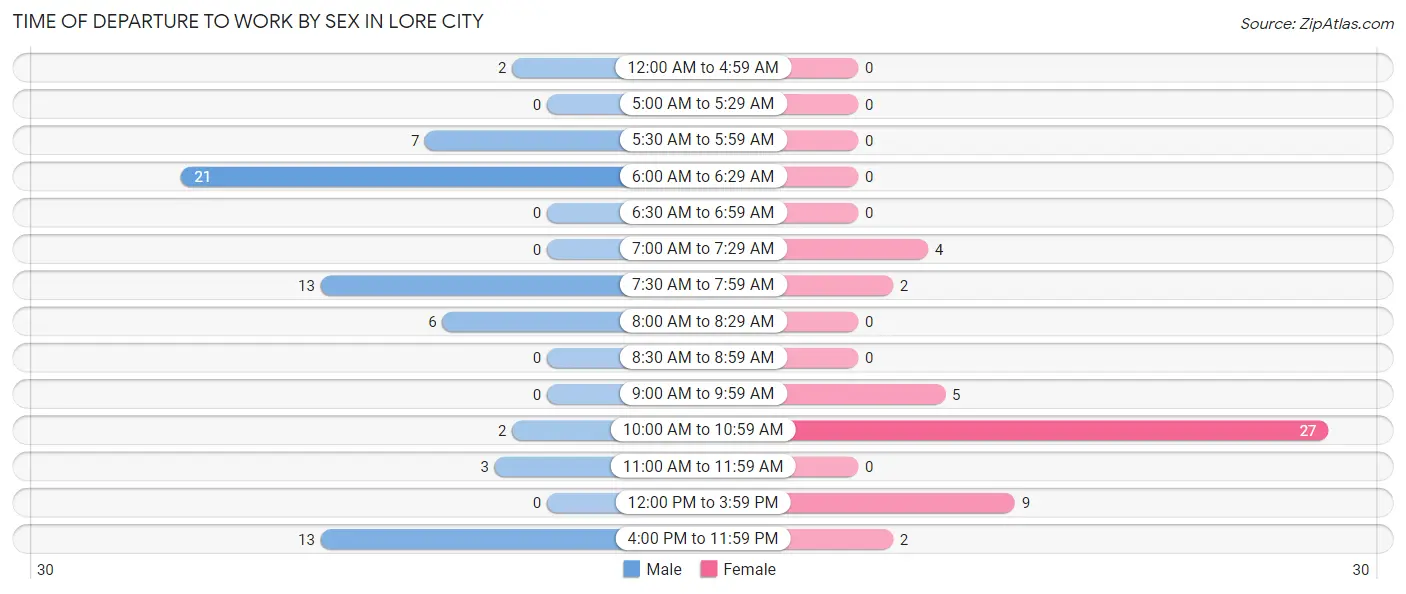
| Time of Departure | Male | Female |
| 12:00 AM to 4:59 AM | 2 (3.0%) | 0 (0.0%) |
| 5:00 AM to 5:29 AM | 0 (0.0%) | 0 (0.0%) |
| 5:30 AM to 5:59 AM | 7 (10.4%) | 0 (0.0%) |
| 6:00 AM to 6:29 AM | 21 (31.3%) | 0 (0.0%) |
| 6:30 AM to 6:59 AM | 0 (0.0%) | 0 (0.0%) |
| 7:00 AM to 7:29 AM | 0 (0.0%) | 4 (8.2%) |
| 7:30 AM to 7:59 AM | 13 (19.4%) | 2 (4.1%) |
| 8:00 AM to 8:29 AM | 6 (9.0%) | 0 (0.0%) |
| 8:30 AM to 8:59 AM | 0 (0.0%) | 0 (0.0%) |
| 9:00 AM to 9:59 AM | 0 (0.0%) | 5 (10.2%) |
| 10:00 AM to 10:59 AM | 2 (3.0%) | 27 (55.1%) |
| 11:00 AM to 11:59 AM | 3 (4.5%) | 0 (0.0%) |
| 12:00 PM to 3:59 PM | 0 (0.0%) | 9 (18.4%) |
| 4:00 PM to 11:59 PM | 13 (19.4%) | 2 (4.1%) |
| Total | 67 (100.0%) | 49 (100.0%) |
Housing Occupancy in Lore City
Occupancy by Ownership in Lore City
Of the total 141 dwellings in Lore City, owner-occupied units account for 84 (59.6%), while renter-occupied units make up 57 (40.4%).
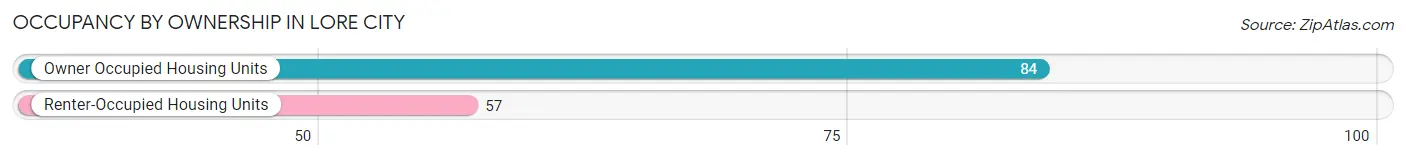
| Occupancy | # Housing Units | % Housing Units |
| Owner Occupied Housing Units | 84 | 59.6% |
| Renter-Occupied Housing Units | 57 | 40.4% |
| Total Occupied Housing Units | 141 | 100.0% |
Occupancy by Household Size in Lore City
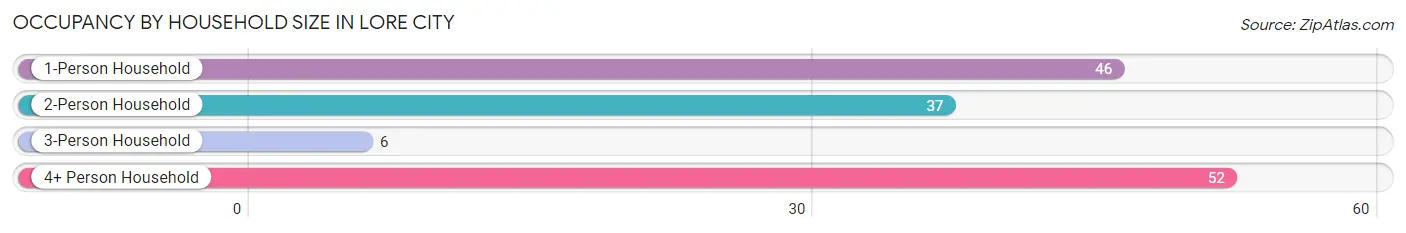
| Household Size | # Housing Units | % Housing Units |
| 1-Person Household | 46 | 32.6% |
| 2-Person Household | 37 | 26.2% |
| 3-Person Household | 6 | 4.3% |
| 4+ Person Household | 52 | 36.9% |
| Total Housing Units | 141 | 100.0% |
Occupancy by Ownership by Household Size in Lore City
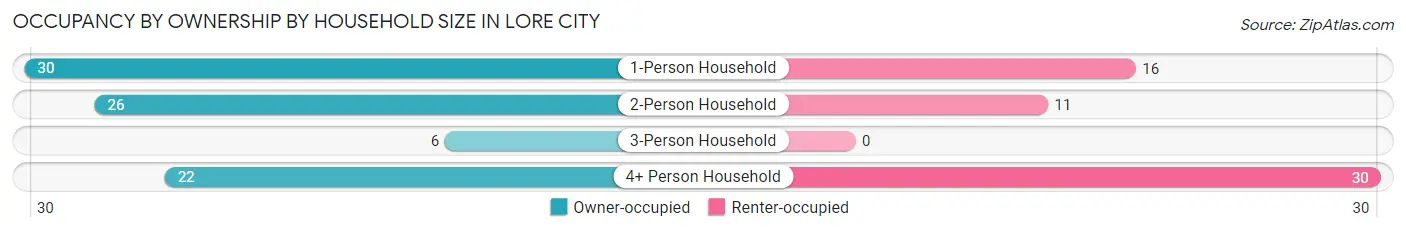
| Household Size | Owner-occupied | Renter-occupied |
| 1-Person Household | 30 (65.2%) | 16 (34.8%) |
| 2-Person Household | 26 (70.3%) | 11 (29.7%) |
| 3-Person Household | 6 (100.0%) | 0 (0.0%) |
| 4+ Person Household | 22 (42.3%) | 30 (57.7%) |
| Total Housing Units | 84 (59.6%) | 57 (40.4%) |
Occupancy by Educational Attainment in Lore City
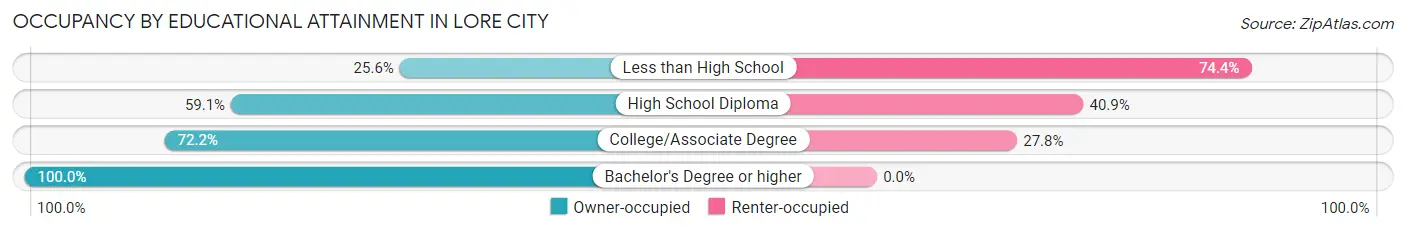
| Household Size | Owner-occupied | Renter-occupied |
| Less than High School | 10 (25.6%) | 29 (74.4%) |
| High School Diploma | 26 (59.1%) | 18 (40.9%) |
| College/Associate Degree | 26 (72.2%) | 10 (27.8%) |
| Bachelor's Degree or higher | 22 (100.0%) | 0 (0.0%) |
Occupancy by Age of Householder in Lore City
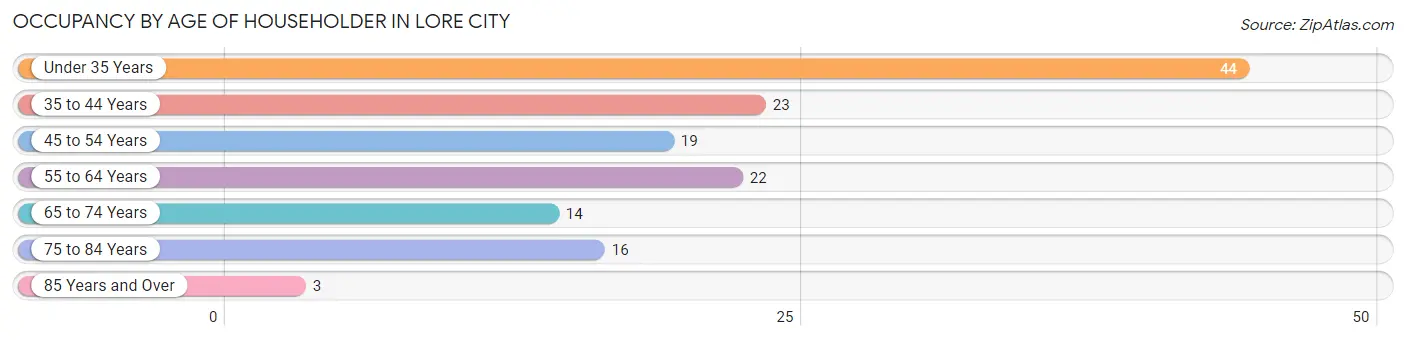
| Age Bracket | # Households | % Households |
| Under 35 Years | 44 | 31.2% |
| 35 to 44 Years | 23 | 16.3% |
| 45 to 54 Years | 19 | 13.5% |
| 55 to 64 Years | 22 | 15.6% |
| 65 to 74 Years | 14 | 9.9% |
| 75 to 84 Years | 16 | 11.4% |
| 85 Years and Over | 3 | 2.1% |
| Total | 141 | 100.0% |
Housing Finances in Lore City
Median Income by Occupancy in Lore City
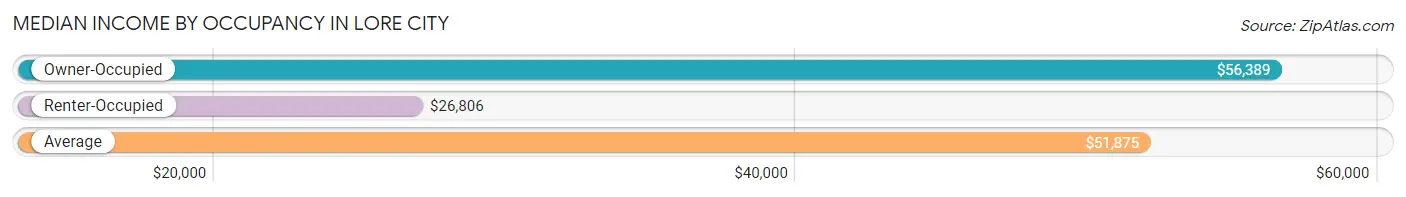
| Occupancy Type | # Households | Median Income |
| Owner-Occupied | 84 (59.6%) | $56,389 |
| Renter-Occupied | 57 (40.4%) | $26,806 |
| Average | 141 (100.0%) | $51,875 |
Occupancy by Householder Income Bracket in Lore City
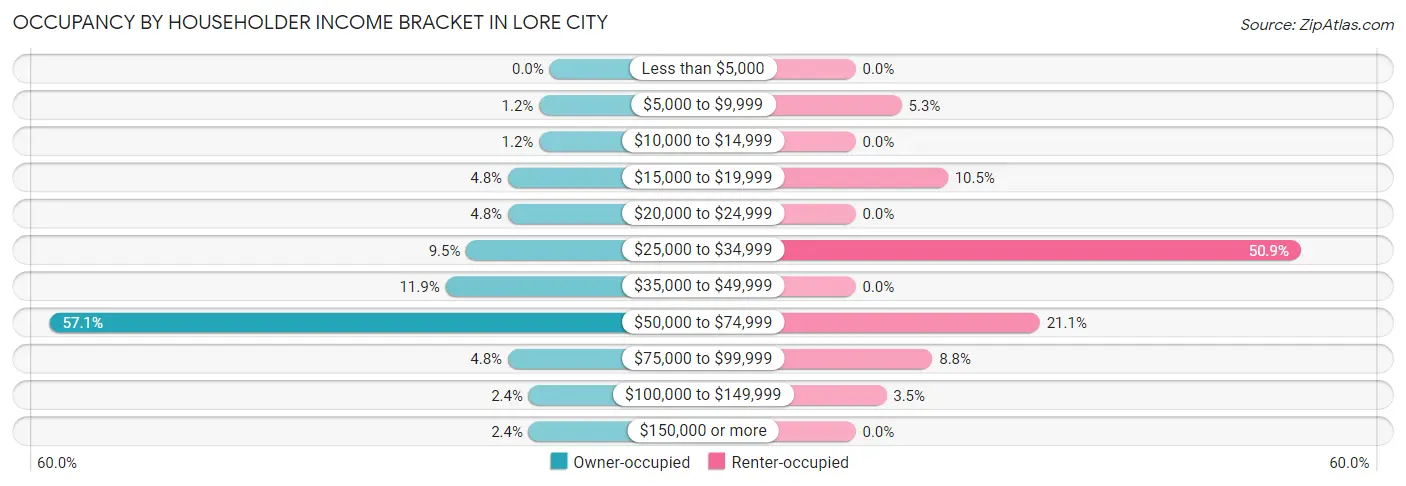
| Income Bracket | Owner-occupied | Renter-occupied |
| Less than $5,000 | 0 (0.0%) | 0 (0.0%) |
| $5,000 to $9,999 | 1 (1.2%) | 3 (5.3%) |
| $10,000 to $14,999 | 1 (1.2%) | 0 (0.0%) |
| $15,000 to $19,999 | 4 (4.8%) | 6 (10.5%) |
| $20,000 to $24,999 | 4 (4.8%) | 0 (0.0%) |
| $25,000 to $34,999 | 8 (9.5%) | 29 (50.9%) |
| $35,000 to $49,999 | 10 (11.9%) | 0 (0.0%) |
| $50,000 to $74,999 | 48 (57.1%) | 12 (21.0%) |
| $75,000 to $99,999 | 4 (4.8%) | 5 (8.8%) |
| $100,000 to $149,999 | 2 (2.4%) | 2 (3.5%) |
| $150,000 or more | 2 (2.4%) | 0 (0.0%) |
| Total | 84 (100.0%) | 57 (100.0%) |
Monthly Housing Cost Tiers in Lore City
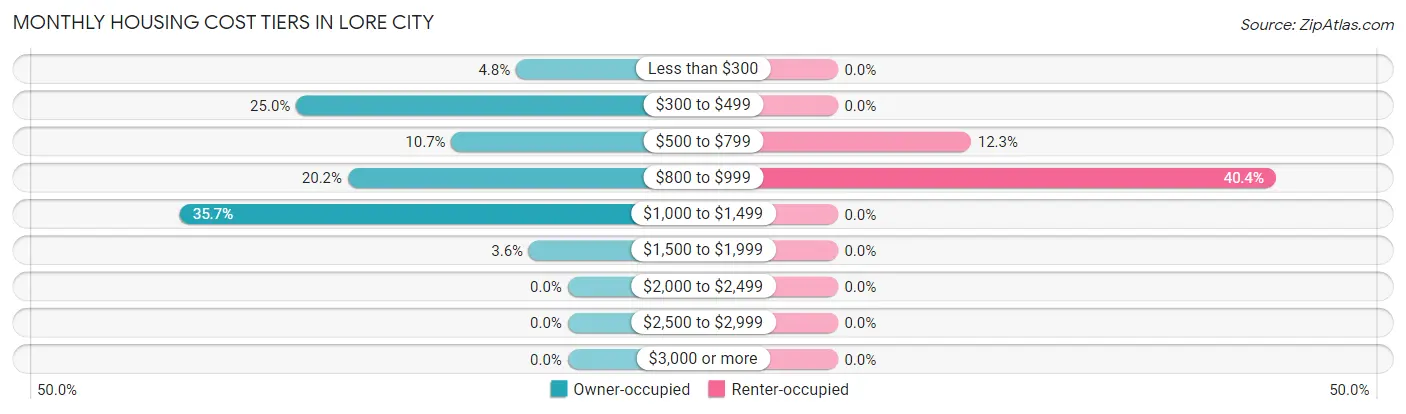
| Monthly Cost | Owner-occupied | Renter-occupied |
| Less than $300 | 4 (4.8%) | 0 (0.0%) |
| $300 to $499 | 21 (25.0%) | 0 (0.0%) |
| $500 to $799 | 9 (10.7%) | 7 (12.3%) |
| $800 to $999 | 17 (20.2%) | 23 (40.4%) |
| $1,000 to $1,499 | 30 (35.7%) | 0 (0.0%) |
| $1,500 to $1,999 | 3 (3.6%) | 0 (0.0%) |
| $2,000 to $2,499 | 0 (0.0%) | 0 (0.0%) |
| $2,500 to $2,999 | 0 (0.0%) | 0 (0.0%) |
| $3,000 or more | 0 (0.0%) | 0 (0.0%) |
| Total | 84 (100.0%) | 57 (100.0%) |
Physical Housing Characteristics in Lore City
Housing Structures in Lore City
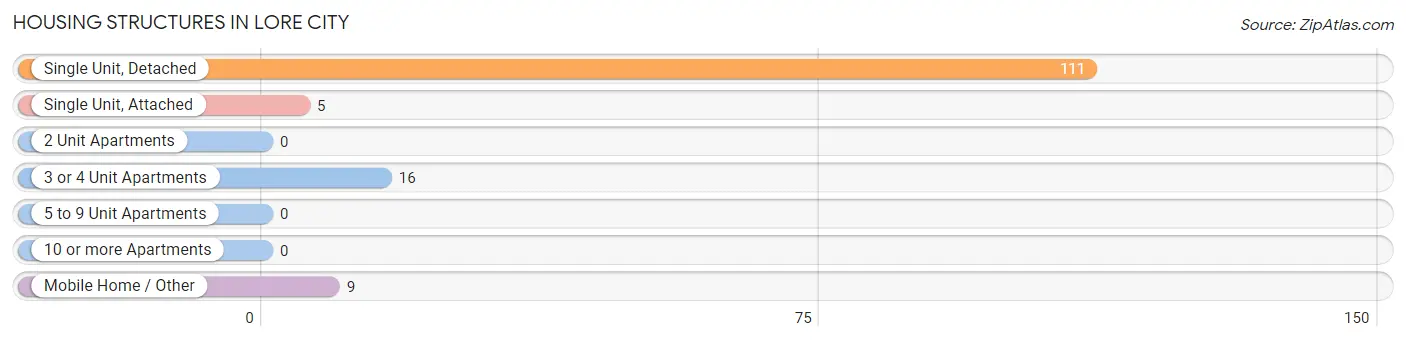
| Structure Type | # Housing Units | % Housing Units |
| Single Unit, Detached | 111 | 78.7% |
| Single Unit, Attached | 5 | 3.5% |
| 2 Unit Apartments | 0 | 0.0% |
| 3 or 4 Unit Apartments | 16 | 11.4% |
| 5 to 9 Unit Apartments | 0 | 0.0% |
| 10 or more Apartments | 0 | 0.0% |
| Mobile Home / Other | 9 | 6.4% |
| Total | 141 | 100.0% |
Housing Structures by Occupancy in Lore City
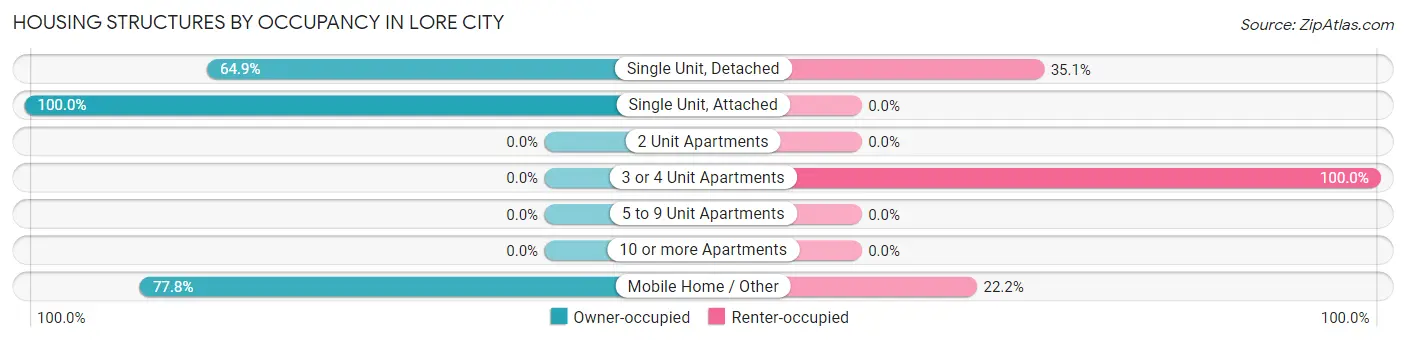
| Structure Type | Owner-occupied | Renter-occupied |
| Single Unit, Detached | 72 (64.9%) | 39 (35.1%) |
| Single Unit, Attached | 5 (100.0%) | 0 (0.0%) |
| 2 Unit Apartments | 0 (0.0%) | 0 (0.0%) |
| 3 or 4 Unit Apartments | 0 (0.0%) | 16 (100.0%) |
| 5 to 9 Unit Apartments | 0 (0.0%) | 0 (0.0%) |
| 10 or more Apartments | 0 (0.0%) | 0 (0.0%) |
| Mobile Home / Other | 7 (77.8%) | 2 (22.2%) |
| Total | 84 (59.6%) | 57 (40.4%) |
Housing Structures by Number of Rooms in Lore City
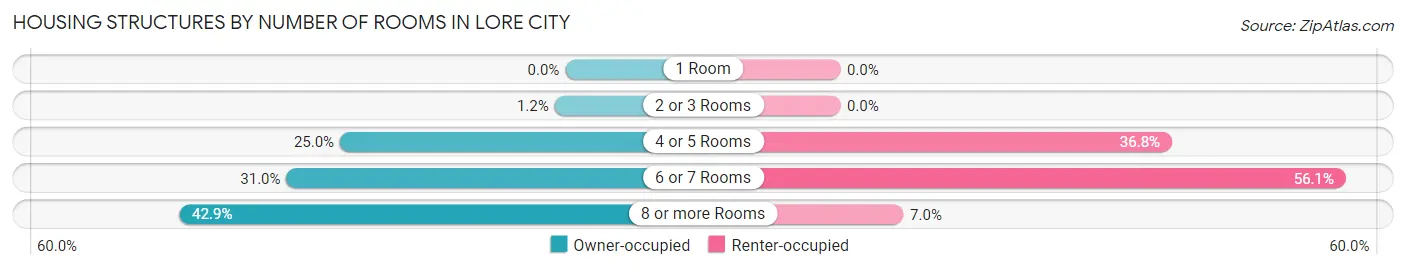
| Number of Rooms | Owner-occupied | Renter-occupied |
| 1 Room | 0 (0.0%) | 0 (0.0%) |
| 2 or 3 Rooms | 1 (1.2%) | 0 (0.0%) |
| 4 or 5 Rooms | 21 (25.0%) | 21 (36.8%) |
| 6 or 7 Rooms | 26 (30.9%) | 32 (56.1%) |
| 8 or more Rooms | 36 (42.9%) | 4 (7.0%) |
| Total | 84 (100.0%) | 57 (100.0%) |
Housing Structure by Heating Type in Lore City
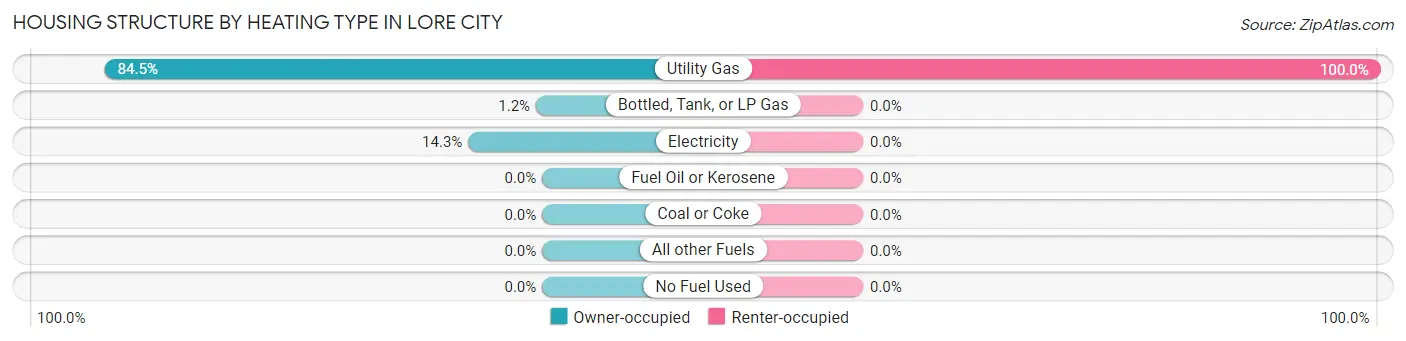
| Heating Type | Owner-occupied | Renter-occupied |
| Utility Gas | 71 (84.5%) | 57 (100.0%) |
| Bottled, Tank, or LP Gas | 1 (1.2%) | 0 (0.0%) |
| Electricity | 12 (14.3%) | 0 (0.0%) |
| Fuel Oil or Kerosene | 0 (0.0%) | 0 (0.0%) |
| Coal or Coke | 0 (0.0%) | 0 (0.0%) |
| All other Fuels | 0 (0.0%) | 0 (0.0%) |
| No Fuel Used | 0 (0.0%) | 0 (0.0%) |
| Total | 84 (100.0%) | 57 (100.0%) |
Household Vehicle Usage in Lore City
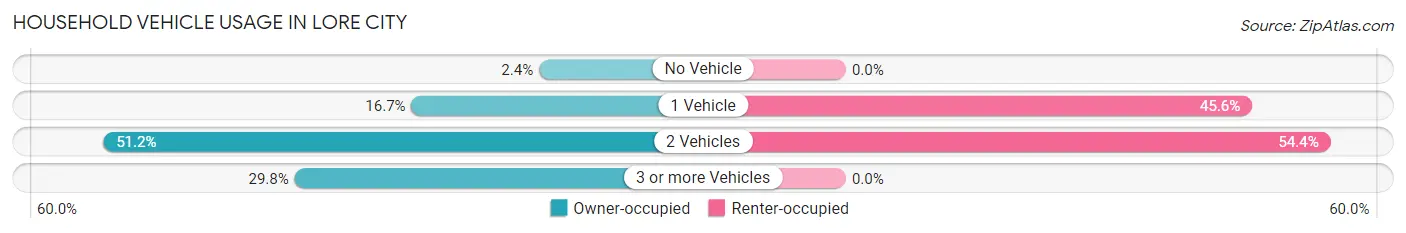
| Vehicles per Household | Owner-occupied | Renter-occupied |
| No Vehicle | 2 (2.4%) | 0 (0.0%) |
| 1 Vehicle | 14 (16.7%) | 26 (45.6%) |
| 2 Vehicles | 43 (51.2%) | 31 (54.4%) |
| 3 or more Vehicles | 25 (29.8%) | 0 (0.0%) |
| Total | 84 (100.0%) | 57 (100.0%) |
Real Estate & Mortgages in Lore City
Real Estate and Mortgage Overview in Lore City
| Characteristic | Without Mortgage | With Mortgage |
| Housing Units | 31 | 53 |
| Median Property Value | $112,500 | $76,300 |
| Median Household Income | - | - |
| Monthly Housing Costs | $381 | $0 |
| Real Estate Taxes | $671 | $0 |
Property Value by Mortgage Status in Lore City
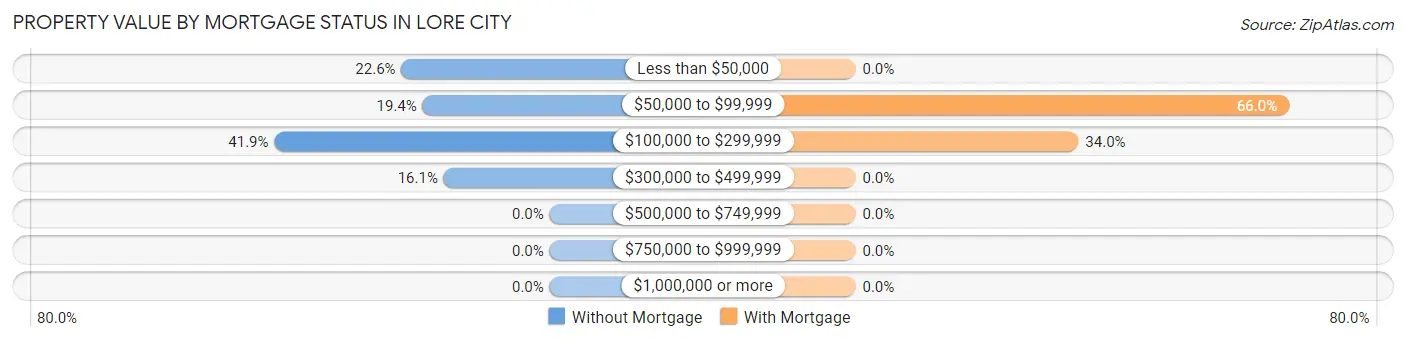
| Property Value | Without Mortgage | With Mortgage |
| Less than $50,000 | 7 (22.6%) | 0 (0.0%) |
| $50,000 to $99,999 | 6 (19.4%) | 35 (66.0%) |
| $100,000 to $299,999 | 13 (41.9%) | 18 (34.0%) |
| $300,000 to $499,999 | 5 (16.1%) | 0 (0.0%) |
| $500,000 to $749,999 | 0 (0.0%) | 0 (0.0%) |
| $750,000 to $999,999 | 0 (0.0%) | 0 (0.0%) |
| $1,000,000 or more | 0 (0.0%) | 0 (0.0%) |
| Total | 31 (100.0%) | 53 (100.0%) |
Household Income by Mortgage Status in Lore City
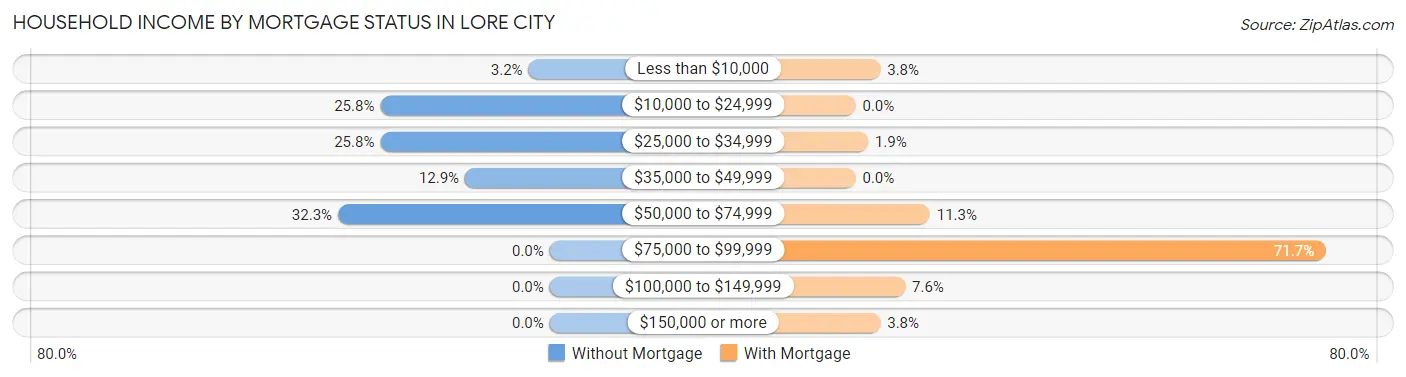
| Household Income | Without Mortgage | With Mortgage |
| Less than $10,000 | 1 (3.2%) | 2 (3.8%) |
| $10,000 to $24,999 | 8 (25.8%) | 0 (0.0%) |
| $25,000 to $34,999 | 8 (25.8%) | 1 (1.9%) |
| $35,000 to $49,999 | 4 (12.9%) | 0 (0.0%) |
| $50,000 to $74,999 | 10 (32.3%) | 6 (11.3%) |
| $75,000 to $99,999 | 0 (0.0%) | 38 (71.7%) |
| $100,000 to $149,999 | 0 (0.0%) | 4 (7.5%) |
| $150,000 or more | 0 (0.0%) | 2 (3.8%) |
| Total | 31 (100.0%) | 53 (100.0%) |
Property Value to Household Income Ratio in Lore City
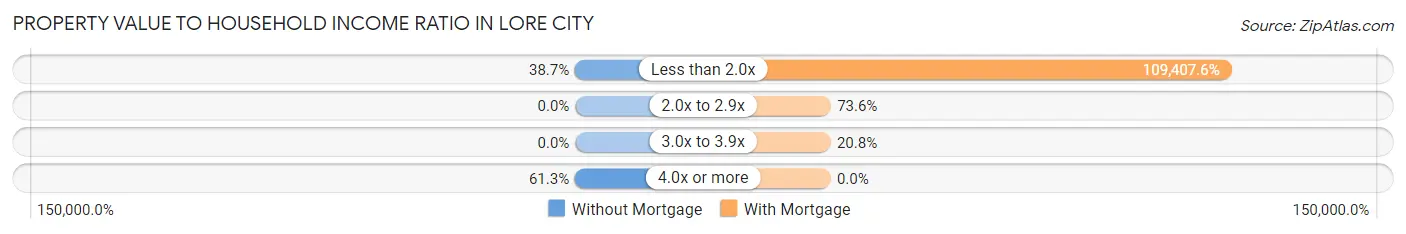
| Value-to-Income Ratio | Without Mortgage | With Mortgage |
| Less than 2.0x | 12 (38.7%) | 57,986 (109,407.5%) |
| 2.0x to 2.9x | 0 (0.0%) | 39 (73.6%) |
| 3.0x to 3.9x | 0 (0.0%) | 11 (20.7%) |
| 4.0x or more | 19 (61.3%) | 0 (0.0%) |
| Total | 31 (100.0%) | 53 (100.0%) |
Real Estate Taxes by Mortgage Status in Lore City
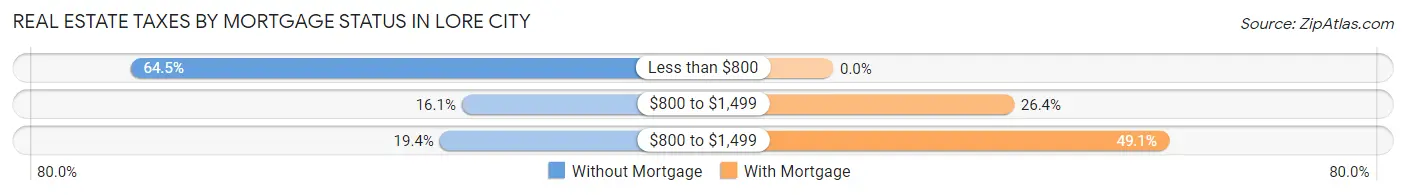
| Property Taxes | Without Mortgage | With Mortgage |
| Less than $800 | 20 (64.5%) | 0 (0.0%) |
| $800 to $1,499 | 5 (16.1%) | 14 (26.4%) |
| $800 to $1,499 | 6 (19.4%) | 26 (49.1%) |
| Total | 31 (100.0%) | 53 (100.0%) |
Health & Disability in Lore City
Health Insurance Coverage by Age in Lore City
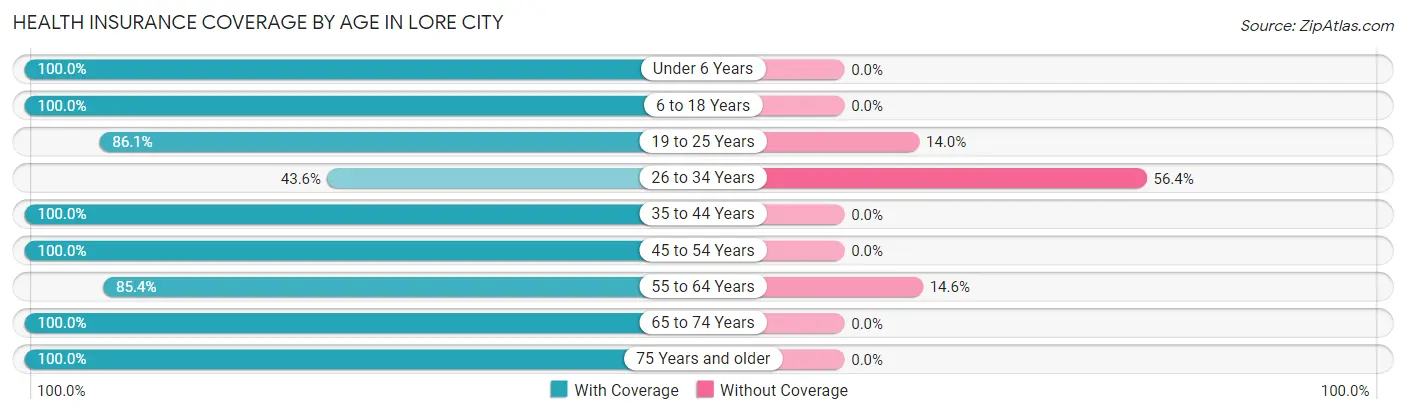
| Age Bracket | With Coverage | Without Coverage |
| Under 6 Years | 73 (100.0%) | 0 (0.0%) |
| 6 to 18 Years | 38 (100.0%) | 0 (0.0%) |
| 19 to 25 Years | 37 (86.1%) | 6 (14.0%) |
| 26 to 34 Years | 24 (43.6%) | 31 (56.4%) |
| 35 to 44 Years | 37 (100.0%) | 0 (0.0%) |
| 45 to 54 Years | 23 (100.0%) | 0 (0.0%) |
| 55 to 64 Years | 35 (85.4%) | 6 (14.6%) |
| 65 to 74 Years | 20 (100.0%) | 0 (0.0%) |
| 75 Years and older | 23 (100.0%) | 0 (0.0%) |
| Total | 310 (87.8%) | 43 (12.2%) |
Health Insurance Coverage by Citizenship Status in Lore City
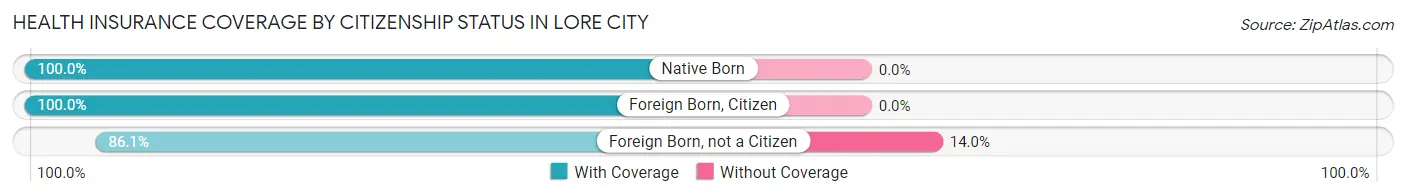
| Citizenship Status | With Coverage | Without Coverage |
| Native Born | 73 (100.0%) | 0 (0.0%) |
| Foreign Born, Citizen | 38 (100.0%) | 0 (0.0%) |
| Foreign Born, not a Citizen | 37 (86.1%) | 6 (14.0%) |
Health Insurance Coverage by Household Income in Lore City
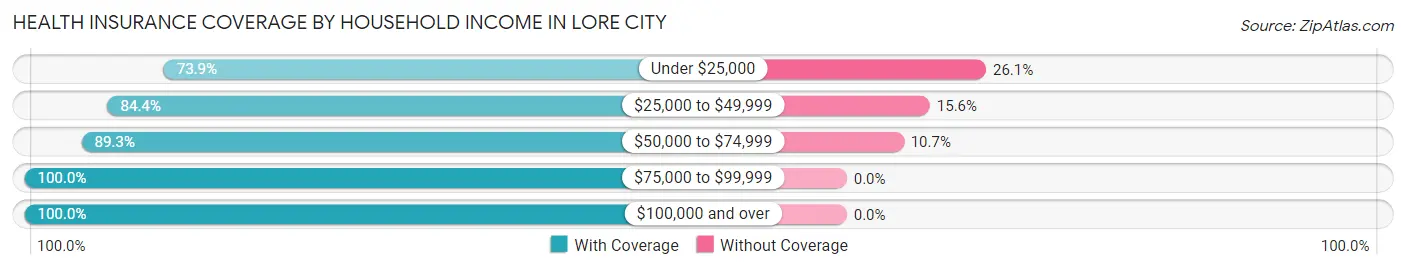
| Household Income | With Coverage | Without Coverage |
| Under $25,000 | 17 (73.9%) | 6 (26.1%) |
| $25,000 to $49,999 | 114 (84.4%) | 21 (15.6%) |
| $50,000 to $74,999 | 134 (89.3%) | 16 (10.7%) |
| $75,000 to $99,999 | 26 (100.0%) | 0 (0.0%) |
| $100,000 and over | 19 (100.0%) | 0 (0.0%) |
Public vs Private Health Insurance Coverage by Age in Lore City
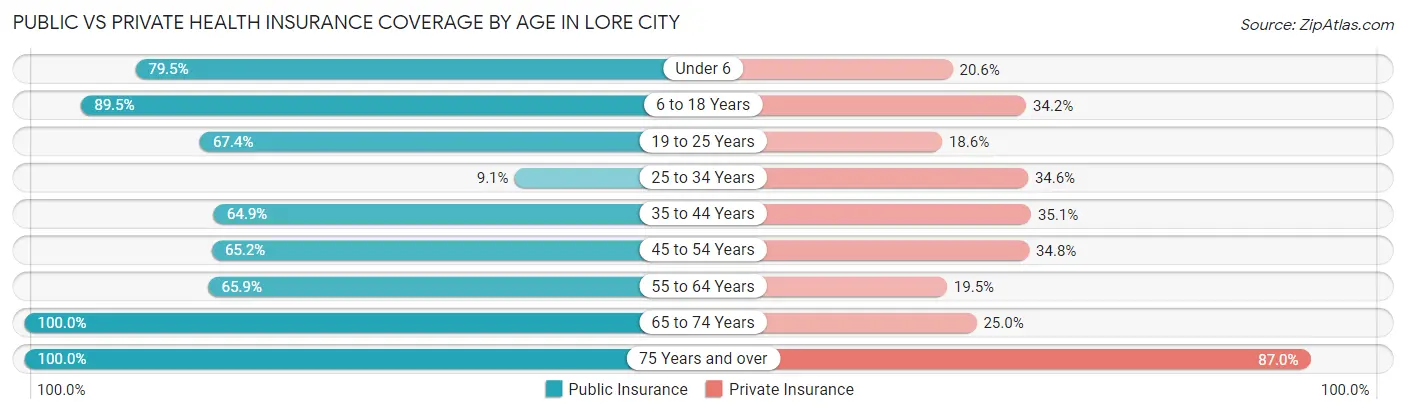
| Age Bracket | Public Insurance | Private Insurance |
| Under 6 | 58 (79.4%) | 15 (20.5%) |
| 6 to 18 Years | 34 (89.5%) | 13 (34.2%) |
| 19 to 25 Years | 29 (67.4%) | 8 (18.6%) |
| 25 to 34 Years | 5 (9.1%) | 19 (34.5%) |
| 35 to 44 Years | 24 (64.9%) | 13 (35.1%) |
| 45 to 54 Years | 15 (65.2%) | 8 (34.8%) |
| 55 to 64 Years | 27 (65.8%) | 8 (19.5%) |
| 65 to 74 Years | 20 (100.0%) | 5 (25.0%) |
| 75 Years and over | 23 (100.0%) | 20 (87.0%) |
| Total | 235 (66.6%) | 109 (30.9%) |
Disability Status by Sex by Age in Lore City
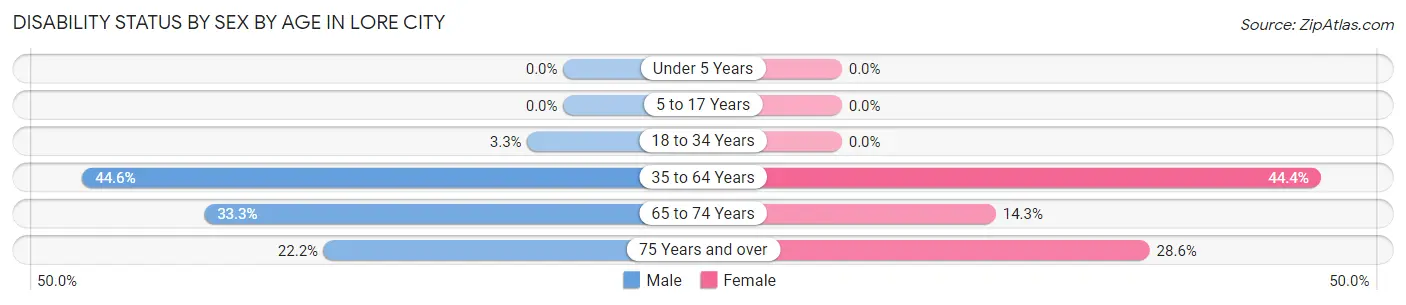
| Age Bracket | Male | Female |
| Under 5 Years | 0 (0.0%) | 0 (0.0%) |
| 5 to 17 Years | 0 (0.0%) | 0 (0.0%) |
| 18 to 34 Years | 2 (3.3%) | 0 (0.0%) |
| 35 to 64 Years | 25 (44.6%) | 20 (44.4%) |
| 65 to 74 Years | 2 (33.3%) | 2 (14.3%) |
| 75 Years and over | 2 (22.2%) | 4 (28.6%) |
Disability Class by Sex by Age in Lore City
Disability Class: Hearing Difficulty
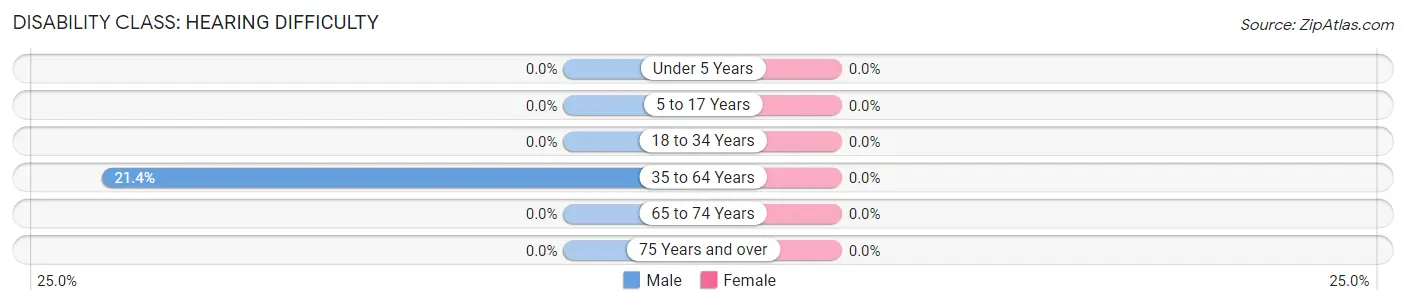
| Age Bracket | Male | Female |
| Under 5 Years | 0 (0.0%) | 0 (0.0%) |
| 5 to 17 Years | 0 (0.0%) | 0 (0.0%) |
| 18 to 34 Years | 0 (0.0%) | 0 (0.0%) |
| 35 to 64 Years | 12 (21.4%) | 0 (0.0%) |
| 65 to 74 Years | 0 (0.0%) | 0 (0.0%) |
| 75 Years and over | 0 (0.0%) | 0 (0.0%) |
Disability Class: Vision Difficulty
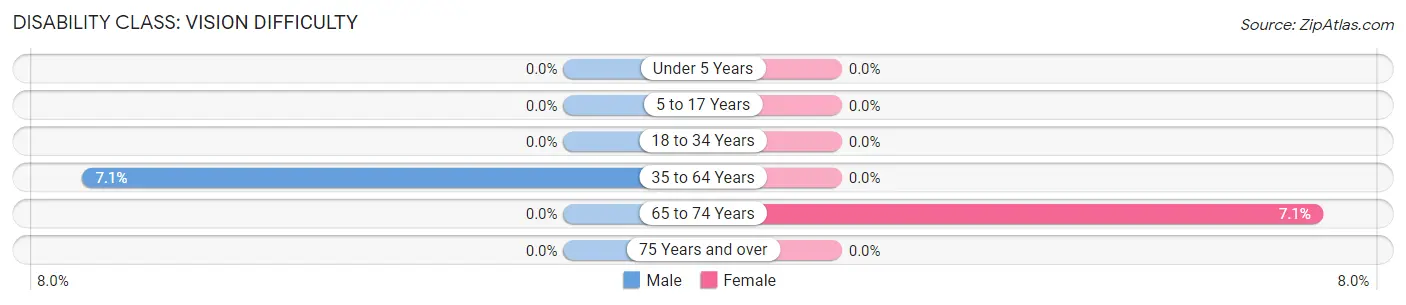
| Age Bracket | Male | Female |
| Under 5 Years | 0 (0.0%) | 0 (0.0%) |
| 5 to 17 Years | 0 (0.0%) | 0 (0.0%) |
| 18 to 34 Years | 0 (0.0%) | 0 (0.0%) |
| 35 to 64 Years | 4 (7.1%) | 0 (0.0%) |
| 65 to 74 Years | 0 (0.0%) | 1 (7.1%) |
| 75 Years and over | 0 (0.0%) | 0 (0.0%) |
Disability Class: Cognitive Difficulty
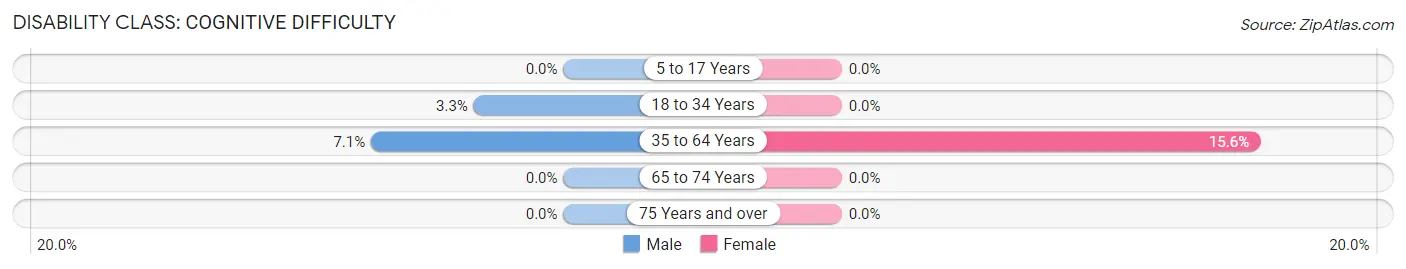
| Age Bracket | Male | Female |
| 5 to 17 Years | 0 (0.0%) | 0 (0.0%) |
| 18 to 34 Years | 2 (3.3%) | 0 (0.0%) |
| 35 to 64 Years | 4 (7.1%) | 7 (15.6%) |
| 65 to 74 Years | 0 (0.0%) | 0 (0.0%) |
| 75 Years and over | 0 (0.0%) | 0 (0.0%) |
Disability Class: Ambulatory Difficulty
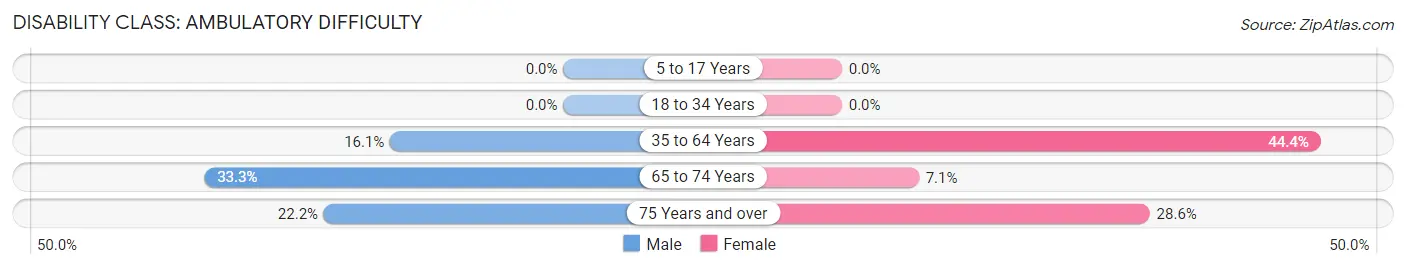
| Age Bracket | Male | Female |
| 5 to 17 Years | 0 (0.0%) | 0 (0.0%) |
| 18 to 34 Years | 0 (0.0%) | 0 (0.0%) |
| 35 to 64 Years | 9 (16.1%) | 20 (44.4%) |
| 65 to 74 Years | 2 (33.3%) | 1 (7.1%) |
| 75 Years and over | 2 (22.2%) | 4 (28.6%) |
Disability Class: Self-Care Difficulty
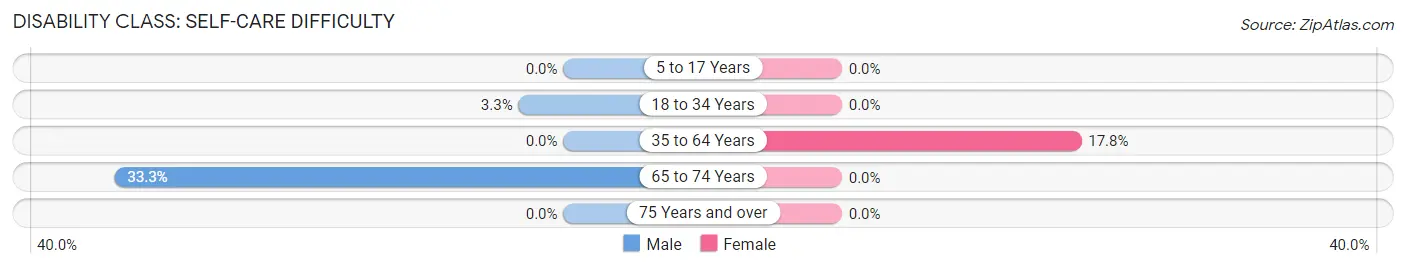
| Age Bracket | Male | Female |
| 5 to 17 Years | 0 (0.0%) | 0 (0.0%) |
| 18 to 34 Years | 2 (3.3%) | 0 (0.0%) |
| 35 to 64 Years | 0 (0.0%) | 8 (17.8%) |
| 65 to 74 Years | 2 (33.3%) | 0 (0.0%) |
| 75 Years and over | 0 (0.0%) | 0 (0.0%) |
Technology Access in Lore City
Computing Device Access in Lore City
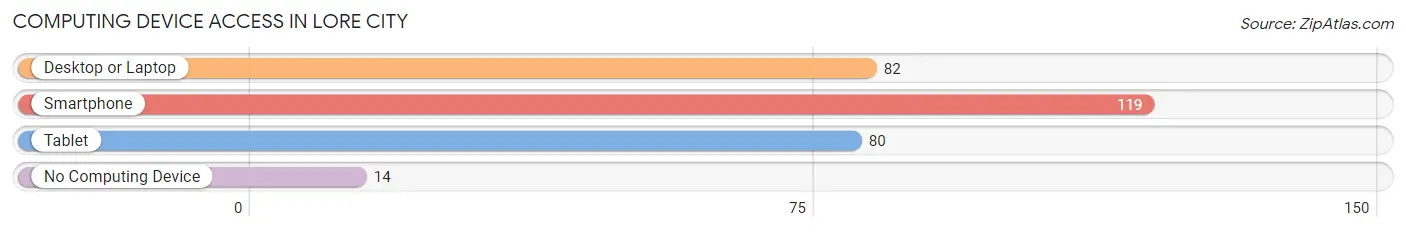
| Device Type | # Households | % Households |
| Desktop or Laptop | 82 | 58.2% |
| Smartphone | 119 | 84.4% |
| Tablet | 80 | 56.7% |
| No Computing Device | 14 | 9.9% |
| Total | 141 | 100.0% |
Internet Access in Lore City
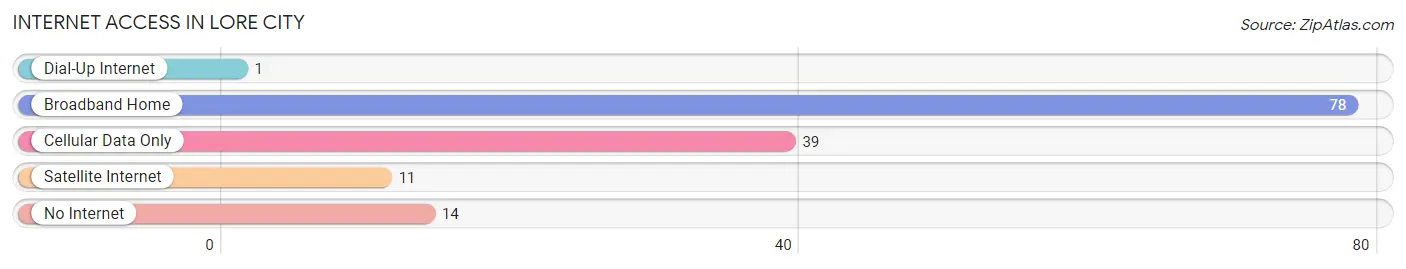
| Internet Type | # Households | % Households |
| Dial-Up Internet | 1 | 0.7% |
| Broadband Home | 78 | 55.3% |
| Cellular Data Only | 39 | 27.7% |
| Satellite Internet | 11 | 7.8% |
| No Internet | 14 | 9.9% |
| Total | 141 | 100.0% |
Lore City Summary
Lore City is a village located in Guernsey County, Ohio, United States. The population was 545 at the 2010 census. It is part of the Cambridge Micropolitan Statistical Area.
History
Lore City was founded in 1817 by John Lore, a Revolutionary War veteran. Lore City was originally known as Lore's Station, and was a stop on the National Road. The village was incorporated in 1867.
Geography
Lore City is located at 39 51 45 North 81 30 45 West 39 862445 81 512599
According to the United States Census Bureau, the village has a total area of 0.3 square miles (0.8 km2), all land.
Demographics
As of the census of 2000, there were 545 people, 213 households, and 152 families residing in the village. The population density was 1,845.2 people per square mile (717.2/km2). There were 229 housing units at an average density of 776.3 per square mile (301.2/km2). The racial makeup of the village was 98.90% White, 0.18% African American, 0.18% Native American, 0.18% Asian, and 0.55% from two or more races. Hispanic or Latino of any race were 0.18% of the population.
There were 213 households, out of which 33.2% had children under the age of 18 living with them, 54.5% were married couples living together, 11.7% had a female householder with no husband present, and 28.2% were non-families. 24.4% of all households were made up of individuals, and 11.7% had someone living alone who was 65 years of age or older. The average household size was 2.56 and the average family size was 3.03.
In the village, the population was spread out, with 26.2% under the age of 18, 8.3% from 18 to 24, 28.2% from 25 to 44, 22.2% from 45 to 64, and 15.1% who were 65 years of age or older. The median age was 37 years. For every 100 females, there were 97.3 males. For every 100 females age 18 and over, there were 94.2 males.
The median income for a household in the village was $30,000, and the median income for a family was $35,000. Males had a median income of $30,000 versus $20,000 for females. The per capita income for the village was $14,845. About 8.3% of families and 11.2% of the population were below the poverty line, including 14.3% of those under age 18 and 8.3% of those age 65 or over.
Economy
Lore City is home to several small businesses, including a grocery store, a hardware store, a restaurant, and a gas station. The village is also home to a number of manufacturing companies, including a plastics manufacturer, a metal fabricator, and a machine shop. The village is also home to a number of farms, which produce a variety of crops, including corn, soybeans, and hay. The village is also home to a number of churches, including the Lore City United Methodist Church, the Lore City Church of Christ, and the Lore City Church of the Nazarene.
Common Questions
What is Per Capita Income in Lore City?
Per Capita income in Lore City is $19,939.
What is the Median Family Income in Lore City?
Median Family Income in Lore City is $49,375.
What is the Median Household income in Lore City?
Median Household Income in Lore City is $51,875.
What is Inequality or Gini Index in Lore City?
Inequality or Gini Index in Lore City is 0.32.
What is the Total Population of Lore City?
Total Population of Lore City is 353.
What is the Total Male Population of Lore City?
Total Male Population of Lore City is 171.
What is the Total Female Population of Lore City?
Total Female Population of Lore City is 182.
What is the Ratio of Males per 100 Females in Lore City?
There are 93.96 Males per 100 Females in Lore City.
What is the Ratio of Females per 100 Males in Lore City?
There are 106.43 Females per 100 Males in Lore City.
What is the Median Population Age in Lore City?
Median Population Age in Lore City is 28.4 Years.
What is the Average Family Size in Lore City
Average Family Size in Lore City is 2.9 People.
What is the Average Household Size in Lore City
Average Household Size in Lore City is 2.5 People.
How Large is the Labor Force in Lore City?
There are 148 People in the Labor Forcein in Lore City.
What is the Percentage of People in the Labor Force in Lore City?
59.0% of People are in the Labor Force in Lore City.
What is the Unemployment Rate in Lore City?
Unemployment Rate in Lore City is 2.7%.