Logan, OH Map & Demographics
Logan Map
Logan Overview
$25,928
PER CAPITA INCOME
$51,043
AVG FAMILY INCOME
$46,762
AVG HOUSEHOLD INCOME
38.4%
WAGE / INCOME GAP [ % ]
61.6¢/ $1
WAGE / INCOME GAP [ $ ]
$11,632
FAMILY INCOME DEFICIT
0.43
INEQUALITY / GINI INDEX
7,168
TOTAL POPULATION
3,829
MALE POPULATION
3,339
FEMALE POPULATION
114.68
MALES / 100 FEMALES
87.20
FEMALES / 100 MALES
37.2
MEDIAN AGE
2.8
AVG FAMILY SIZE
2.5
AVG HOUSEHOLD SIZE
3,097
LABOR FORCE [ PEOPLE ]
56.2%
PERCENT IN LABOR FORCE
3.0%
UNEMPLOYMENT RATE
Logan Zip Codes
Logan Area Codes
Income in Logan
Income Overview in Logan
Per Capita Income in Logan is $25,928, while median incomes of families and households are $51,043 and $46,762 respectively.
| Characteristic | Number | Measure |
| Per Capita Income | 7,168 | $25,928 |
| Median Family Income | 1,919 | $51,043 |
| Mean Family Income | 1,919 | $68,885 |
| Median Household Income | 2,804 | $46,762 |
| Mean Household Income | 2,804 | $62,286 |
| Income Deficit | 1,919 | $11,632 |
| Wage / Income Gap (%) | 7,168 | 38.38% |
| Wage / Income Gap ($) | 7,168 | 61.62¢ per $1 |
| Gini / Inequality Index | 7,168 | 0.43 |
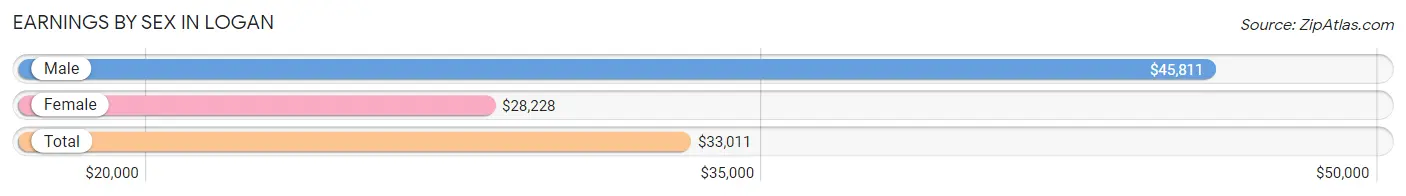
Earnings by Sex in Logan
Average Earnings in Logan are $33,011, $45,811 for men and $28,228 for women, a difference of 38.4%.
| Sex | Number | Average Earnings |
| Male | 1,742 (55.7%) | $45,811 |
| Female | 1,386 (44.3%) | $28,228 |
| Total | 3,128 (100.0%) | $33,011 |
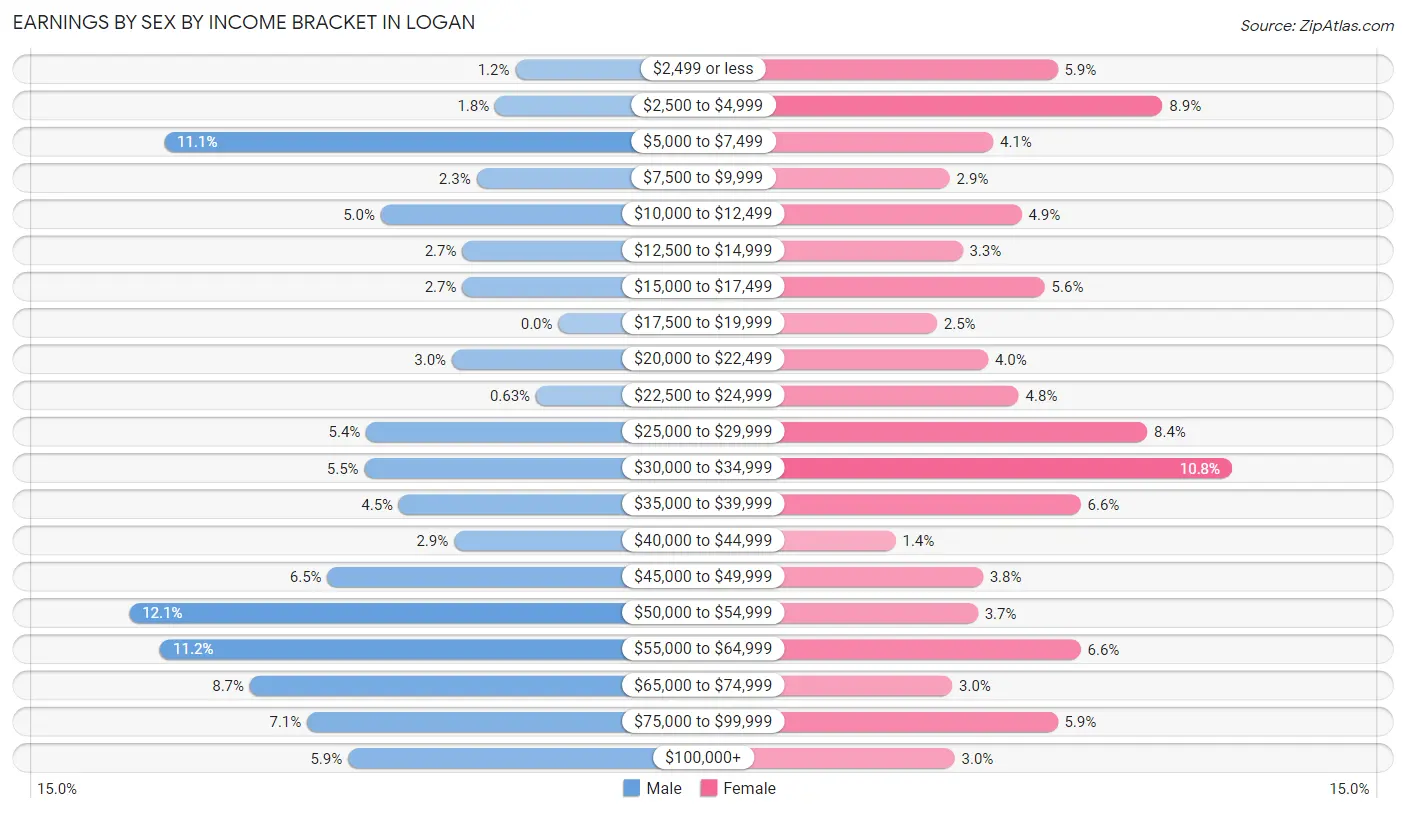
Earnings by Sex by Income Bracket in Logan
The most common earnings brackets in Logan are $50,000 to $54,999 for men (210 | 12.1%) and $30,000 to $34,999 for women (150 | 10.8%).
| Income | Male | Female |
| $2,499 or less | 21 (1.2%) | 82 (5.9%) |
| $2,500 to $4,999 | 31 (1.8%) | 123 (8.9%) |
| $5,000 to $7,499 | 193 (11.1%) | 57 (4.1%) |
| $7,500 to $9,999 | 40 (2.3%) | 40 (2.9%) |
| $10,000 to $12,499 | 87 (5.0%) | 68 (4.9%) |
| $12,500 to $14,999 | 47 (2.7%) | 45 (3.3%) |
| $15,000 to $17,499 | 47 (2.7%) | 77 (5.6%) |
| $17,500 to $19,999 | 0 (0.0%) | 35 (2.5%) |
| $20,000 to $22,499 | 52 (3.0%) | 55 (4.0%) |
| $22,500 to $24,999 | 11 (0.6%) | 67 (4.8%) |
| $25,000 to $29,999 | 94 (5.4%) | 117 (8.4%) |
| $30,000 to $34,999 | 95 (5.4%) | 150 (10.8%) |
| $35,000 to $39,999 | 78 (4.5%) | 91 (6.6%) |
| $40,000 to $44,999 | 51 (2.9%) | 19 (1.4%) |
| $45,000 to $49,999 | 113 (6.5%) | 53 (3.8%) |
| $50,000 to $54,999 | 210 (12.1%) | 51 (3.7%) |
| $55,000 to $64,999 | 195 (11.2%) | 91 (6.6%) |
| $65,000 to $74,999 | 151 (8.7%) | 41 (3.0%) |
| $75,000 to $99,999 | 123 (7.1%) | 82 (5.9%) |
| $100,000+ | 103 (5.9%) | 42 (3.0%) |
| Total | 1,742 (100.0%) | 1,386 (100.0%) |
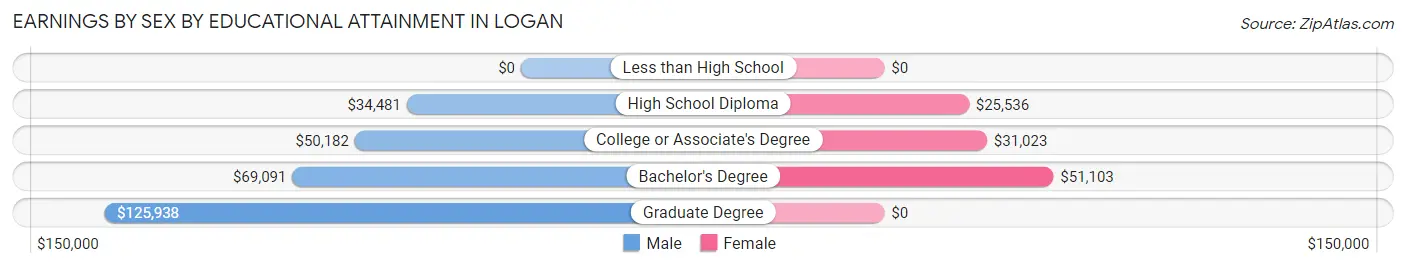
Earnings by Sex by Educational Attainment in Logan
Average earnings in Logan are $48,750 for men and $31,142 for women, a difference of 36.1%. Men with an educational attainment of graduate degree enjoy the highest average annual earnings of $125,938, while those with high school diploma education earn the least with $34,481. Women with an educational attainment of bachelor's degree earn the most with the average annual earnings of $51,103, while those with high school diploma education have the smallest earnings of $25,536.
| Educational Attainment | Male Income | Female Income |
| Less than High School | - | - |
| High School Diploma | $34,481 | $25,536 |
| College or Associate's Degree | $50,182 | $31,023 |
| Bachelor's Degree | $69,091 | $51,103 |
| Graduate Degree | $125,938 | $0 |
| Total | $48,750 | $31,142 |
Family Income in Logan
Family Income Brackets in Logan
According to the Logan family income data, there are 409 families falling into the $25,000 to $34,999 income range, which is the most common income bracket and makes up 21.3% of all families. Conversely, the $150,000 to $199,999 income bracket is the least frequent group with only 19 families (1.0%) belonging to this category.
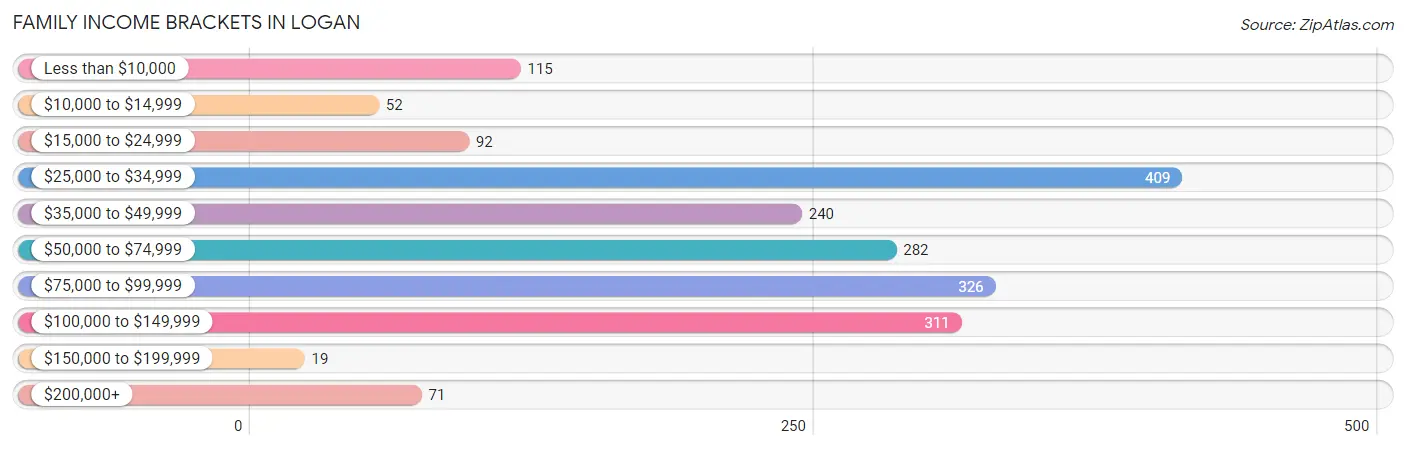
| Income Bracket | # Families | % Families |
| Less than $10,000 | 115 | 6.0% |
| $10,000 to $14,999 | 52 | 2.7% |
| $15,000 to $24,999 | 92 | 4.8% |
| $25,000 to $34,999 | 409 | 21.3% |
| $35,000 to $49,999 | 240 | 12.5% |
| $50,000 to $74,999 | 282 | 14.7% |
| $75,000 to $99,999 | 326 | 17.0% |
| $100,000 to $149,999 | 311 | 16.2% |
| $150,000 to $199,999 | 19 | 1.0% |
| $200,000+ | 71 | 3.7% |
Family Income by Famaliy Size in Logan
5-person families (205 | 10.7%) account for the highest median family income in Logan with $94,491 per family, while 2-person families (1,035 | 53.9%) have the highest median income of $24,812 per family member.
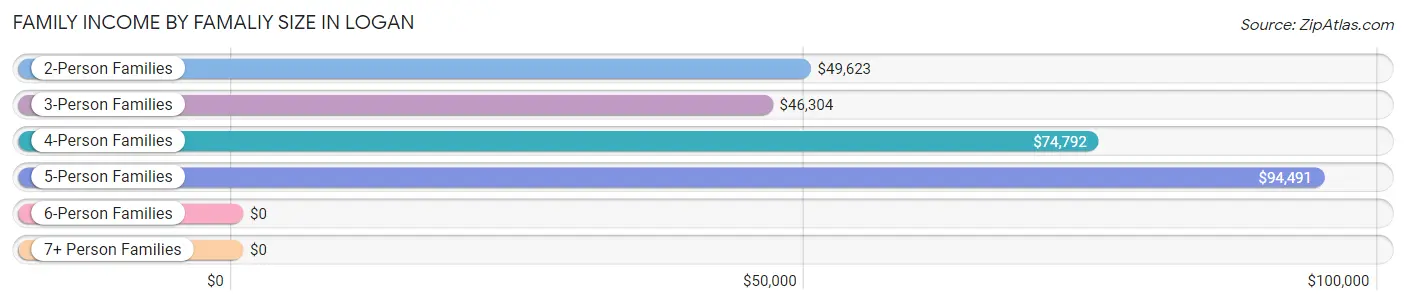
| Income Bracket | # Families | Median Income |
| 2-Person Families | 1,035 (53.9%) | $49,623 |
| 3-Person Families | 338 (17.6%) | $46,304 |
| 4-Person Families | 274 (14.3%) | $74,792 |
| 5-Person Families | 205 (10.7%) | $94,491 |
| 6-Person Families | 48 (2.5%) | $0 |
| 7+ Person Families | 19 (1.0%) | $0 |
| Total | 1,919 (100.0%) | $51,043 |
Family Income by Number of Earners in Logan
The median family income in Logan is $51,043, with families comprising 3+ earners (175) having the highest median family income of $96,094, while families with no earners (439) have the lowest median family income of $30,341, accounting for 9.1% and 22.9% of families, respectively.
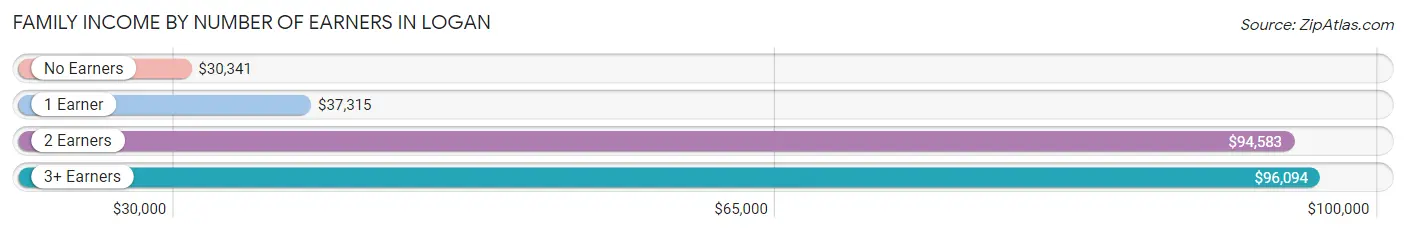
| Number of Earners | # Families | Median Income |
| No Earners | 439 (22.9%) | $30,341 |
| 1 Earner | 854 (44.5%) | $37,315 |
| 2 Earners | 451 (23.5%) | $94,583 |
| 3+ Earners | 175 (9.1%) | $96,094 |
| Total | 1,919 (100.0%) | $51,043 |
Household Income in Logan
Household Income Brackets in Logan
With 468 households falling in the category, the $35,000 to $49,999 income range is the most frequent in Logan, accounting for 16.7% of all households. In contrast, only 20 households (0.7%) fall into the $150,000 to $199,999 income bracket, making it the least populous group.
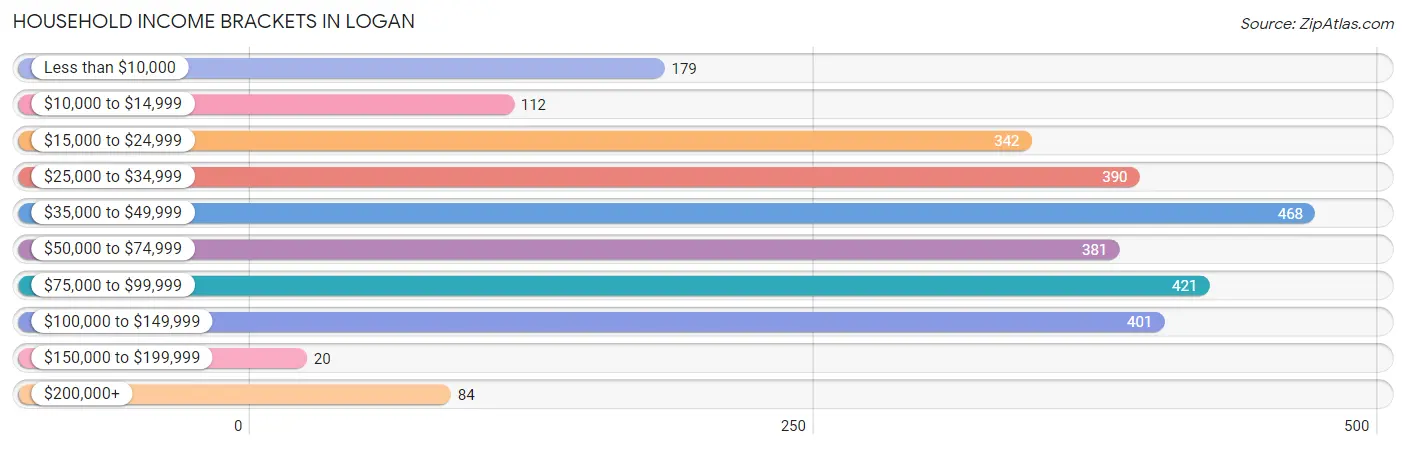
| Income Bracket | # Households | % Households |
| Less than $10,000 | 179 | 6.4% |
| $10,000 to $14,999 | 112 | 4.0% |
| $15,000 to $24,999 | 342 | 12.2% |
| $25,000 to $34,999 | 390 | 13.9% |
| $35,000 to $49,999 | 468 | 16.7% |
| $50,000 to $74,999 | 381 | 13.6% |
| $75,000 to $99,999 | 421 | 15.0% |
| $100,000 to $149,999 | 401 | 14.3% |
| $150,000 to $199,999 | 20 | 0.7% |
| $200,000+ | 84 | 3.0% |
Household Income by Householder Age in Logan
The median household income in Logan is $46,762, with the highest median household income of $51,455 found in the 25 to 44 years age bracket for the primary householder. A total of 1,026 households (36.6%) fall into this category. Meanwhile, the 15 to 24 years age bracket for the primary householder has the lowest median household income of $0, with 199 households (7.1%) in this group.
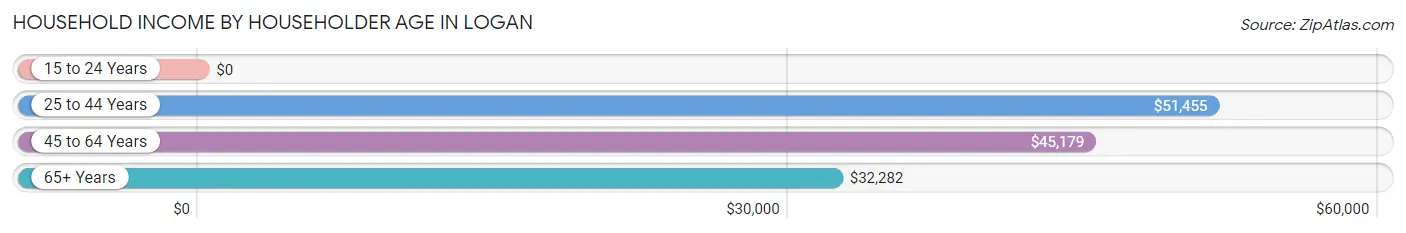
| Income Bracket | # Households | Median Income |
| 15 to 24 Years | 199 (7.1%) | $0 |
| 25 to 44 Years | 1,026 (36.6%) | $51,455 |
| 45 to 64 Years | 819 (29.2%) | $45,179 |
| 65+ Years | 760 (27.1%) | $32,282 |
| Total | 2,804 (100.0%) | $46,762 |
Poverty in Logan
Income Below Poverty by Sex and Age in Logan
With 26.2% poverty level for males and 25.1% for females among the residents of Logan, 15 year old males and 6 to 11 year old females are the most vulnerable to poverty, with 50 males (52.1%) and 130 females (46.8%) in their respective age groups living below the poverty level.
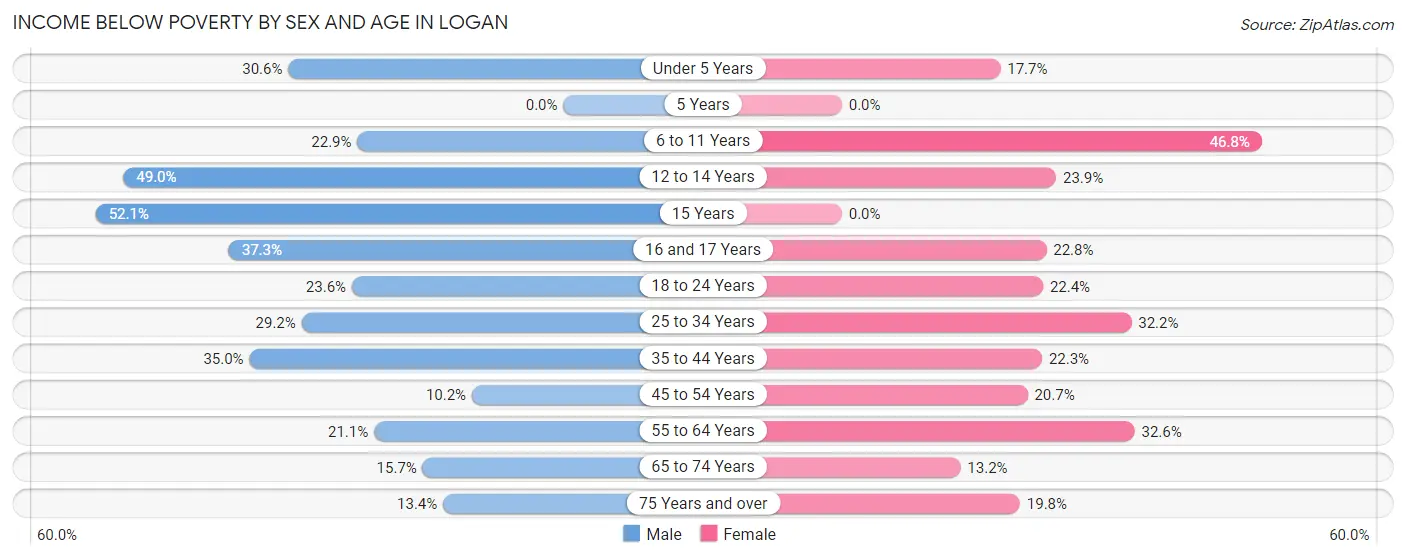
| Age Bracket | Male | Female |
| Under 5 Years | 87 (30.6%) | 21 (17.6%) |
| 5 Years | 0 (0.0%) | 0 (0.0%) |
| 6 to 11 Years | 78 (22.9%) | 130 (46.8%) |
| 12 to 14 Years | 98 (49.0%) | 47 (23.9%) |
| 15 Years | 50 (52.1%) | 0 (0.0%) |
| 16 and 17 Years | 19 (37.2%) | 23 (22.8%) |
| 18 to 24 Years | 65 (23.5%) | 69 (22.4%) |
| 25 to 34 Years | 202 (29.1%) | 108 (32.2%) |
| 35 to 44 Years | 165 (35.0%) | 107 (22.3%) |
| 45 to 54 Years | 29 (10.2%) | 55 (20.7%) |
| 55 to 64 Years | 105 (21.1%) | 148 (32.6%) |
| 65 to 74 Years | 42 (15.7%) | 51 (13.2%) |
| 75 Years and over | 32 (13.4%) | 47 (19.8%) |
| Total | 972 (26.2%) | 806 (25.1%) |
Income Above Poverty by Sex and Age in Logan
According to the poverty statistics in Logan, males aged 5 years and females aged 5 years are the age groups that are most secure financially, with 100.0% of males and 100.0% of females in these age groups living above the poverty line.
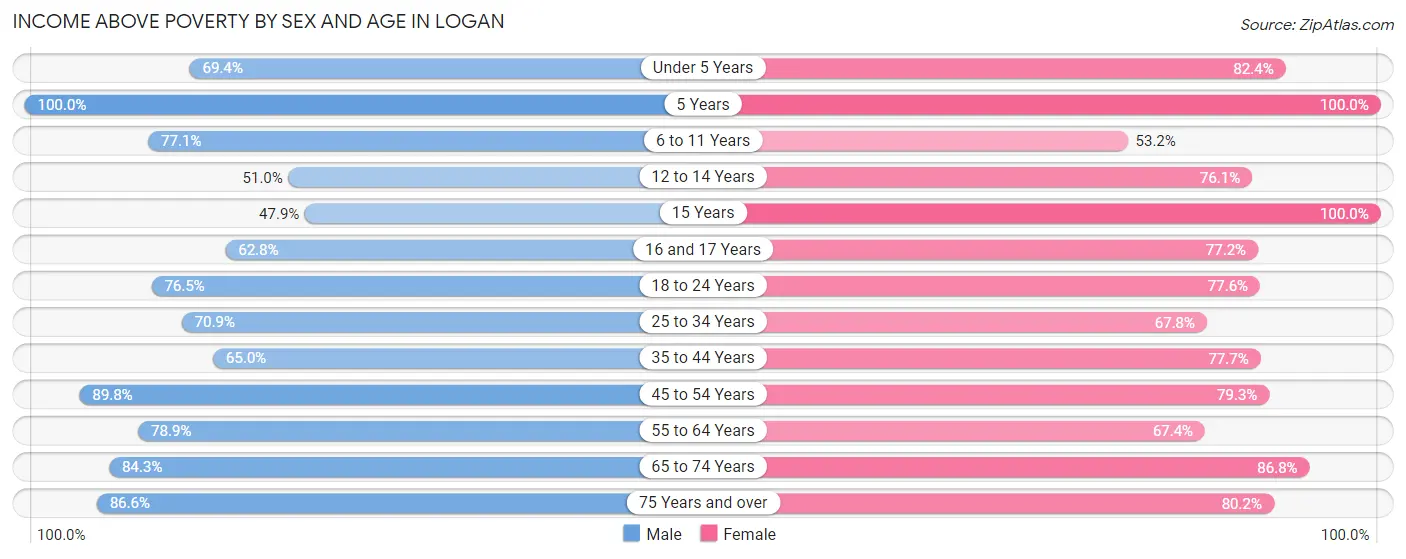
| Age Bracket | Male | Female |
| Under 5 Years | 197 (69.4%) | 98 (82.4%) |
| 5 Years | 9 (100.0%) | 16 (100.0%) |
| 6 to 11 Years | 262 (77.1%) | 148 (53.2%) |
| 12 to 14 Years | 102 (51.0%) | 150 (76.1%) |
| 15 Years | 46 (47.9%) | 34 (100.0%) |
| 16 and 17 Years | 32 (62.7%) | 78 (77.2%) |
| 18 to 24 Years | 211 (76.4%) | 239 (77.6%) |
| 25 to 34 Years | 491 (70.9%) | 227 (67.8%) |
| 35 to 44 Years | 307 (65.0%) | 373 (77.7%) |
| 45 to 54 Years | 256 (89.8%) | 211 (79.3%) |
| 55 to 64 Years | 393 (78.9%) | 306 (67.4%) |
| 65 to 74 Years | 226 (84.3%) | 335 (86.8%) |
| 75 Years and over | 207 (86.6%) | 190 (80.2%) |
| Total | 2,739 (73.8%) | 2,405 (74.9%) |
Income Below Poverty Among Married-Couple Families in Logan
The poverty statistics for married-couple families in Logan show that 8.7% or 100 of the total 1,145 families live below the poverty line. Families with 3 or 4 children have the highest poverty rate of 27.3%, comprising of 39 families. On the other hand, families with 5 or more children have the lowest poverty rate of 0.0%, which includes 0 families.
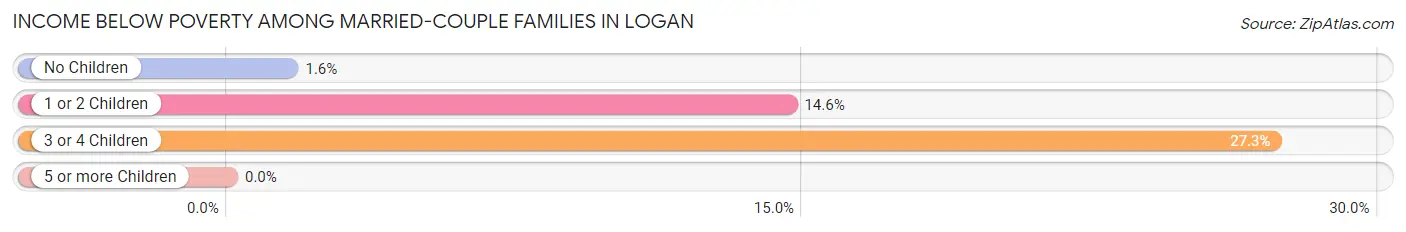
| Children | Above Poverty | Below Poverty |
| No Children | 624 (98.4%) | 10 (1.6%) |
| 1 or 2 Children | 298 (85.4%) | 51 (14.6%) |
| 3 or 4 Children | 104 (72.7%) | 39 (27.3%) |
| 5 or more Children | 19 (100.0%) | 0 (0.0%) |
| Total | 1,045 (91.3%) | 100 (8.7%) |
Income Below Poverty Among Single-Parent Households in Logan
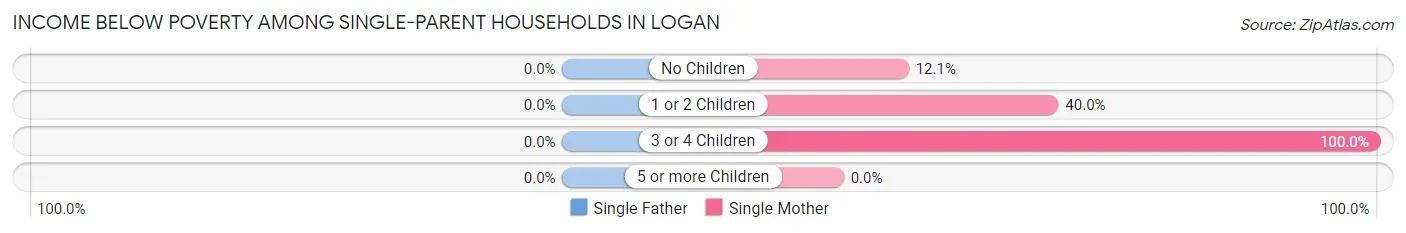
| Children | Single Father | Single Mother |
| No Children | 0 (0.0%) | 12 (12.1%) |
| 1 or 2 Children | 0 (0.0%) | 136 (40.0%) |
| 3 or 4 Children | 0 (0.0%) | 61 (100.0%) |
| 5 or more Children | 0 (0.0%) | 0 (0.0%) |
| Total | 0 (0.0%) | 209 (41.8%) |
Income Below Poverty Among Married-Couple vs Single-Parent Households in Logan
The poverty data for Logan shows that 100 of the married-couple family households (8.7%) and 209 of the single-parent households (27.0%) are living below the poverty level. Within the married-couple family households, those with 3 or 4 children have the highest poverty rate, with 39 households (27.3%) falling below the poverty line. Among the single-parent households, those with 3 or 4 children have the highest poverty rate, with 61 household (100.0%) living below poverty.
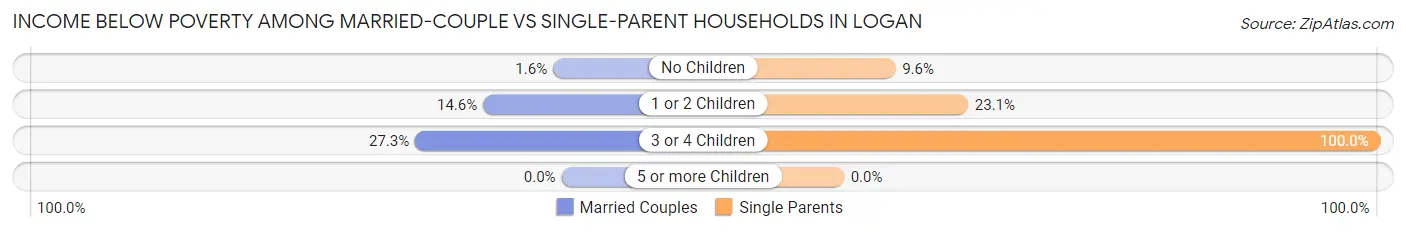
| Children | Married-Couple Families | Single-Parent Households |
| No Children | 10 (1.6%) | 12 (9.6%) |
| 1 or 2 Children | 51 (14.6%) | 136 (23.1%) |
| 3 or 4 Children | 39 (27.3%) | 61 (100.0%) |
| 5 or more Children | 0 (0.0%) | 0 (0.0%) |
| Total | 100 (8.7%) | 209 (27.0%) |
Race in Logan
The most populous races in Logan are White / Caucasian (6,566 | 91.6%), Two or more Races (294 | 4.1%), and Hispanic or Latino (255 | 3.6%).
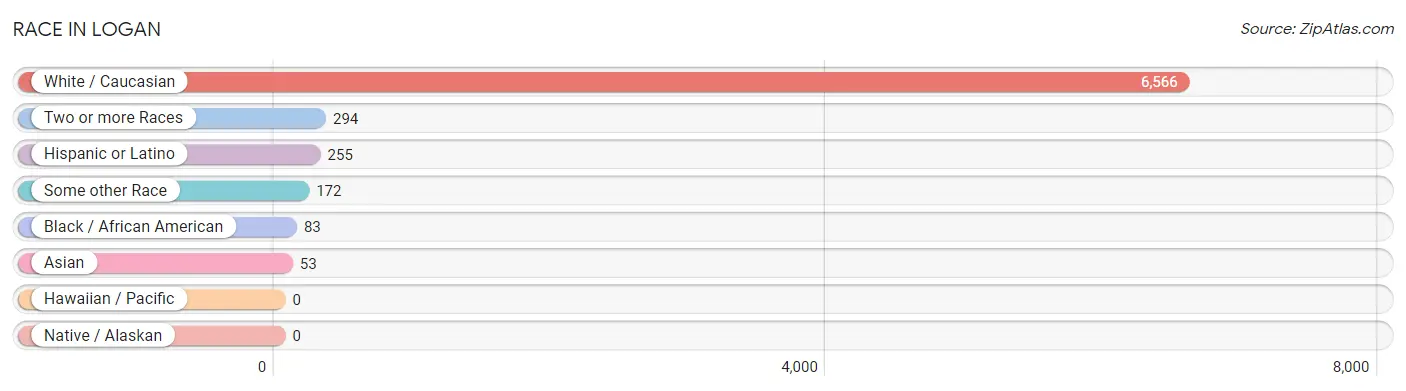
| Race | # Population | % Population |
| Asian | 53 | 0.7% |
| Black / African American | 83 | 1.2% |
| Hawaiian / Pacific | 0 | 0.0% |
| Hispanic or Latino | 255 | 3.6% |
| Native / Alaskan | 0 | 0.0% |
| White / Caucasian | 6,566 | 91.6% |
| Two or more Races | 294 | 4.1% |
| Some other Race | 172 | 2.4% |
| Total | 7,168 | 100.0% |
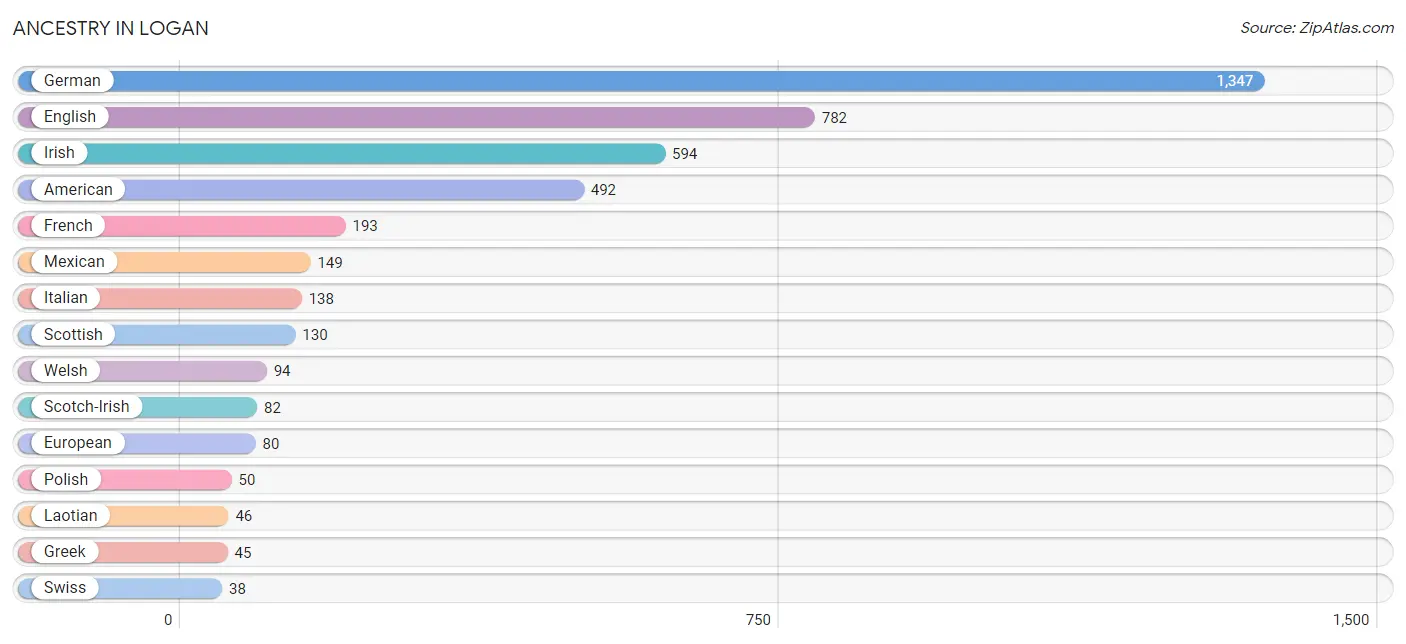
Ancestry in Logan
The most populous ancestries reported in Logan are German (1,347 | 18.8%), English (782 | 10.9%), Irish (594 | 8.3%), American (492 | 6.9%), and French (193 | 2.7%), together accounting for 47.5% of all Logan residents.
| Ancestry | # Population | % Population |
| African | 9 | 0.1% |
| American | 492 | 6.9% |
| Apache | 7 | 0.1% |
| Austrian | 15 | 0.2% |
| Blackfeet | 31 | 0.4% |
| British | 27 | 0.4% |
| Burmese | 18 | 0.3% |
| Cambodian | 35 | 0.5% |
| Cherokee | 7 | 0.1% |
| Czech | 21 | 0.3% |
| Dutch | 25 | 0.4% |
| Eastern European | 29 | 0.4% |
| English | 782 | 10.9% |
| European | 80 | 1.1% |
| Finnish | 24 | 0.3% |
| French | 193 | 2.7% |
| German | 1,347 | 18.8% |
| Greek | 45 | 0.6% |
| Irish | 594 | 8.3% |
| Italian | 138 | 1.9% |
| Laotian | 46 | 0.6% |
| Mexican | 149 | 2.1% |
| Polish | 50 | 0.7% |
| Romanian | 10 | 0.1% |
| Scotch-Irish | 82 | 1.1% |
| Scottish | 130 | 1.8% |
| Subsaharan African | 9 | 0.1% |
| Swedish | 15 | 0.2% |
| Swiss | 38 | 0.5% |
| Thai | 8 | 0.1% |
| Welsh | 94 | 1.3% | View All 31 Rows |
Immigrants in Logan
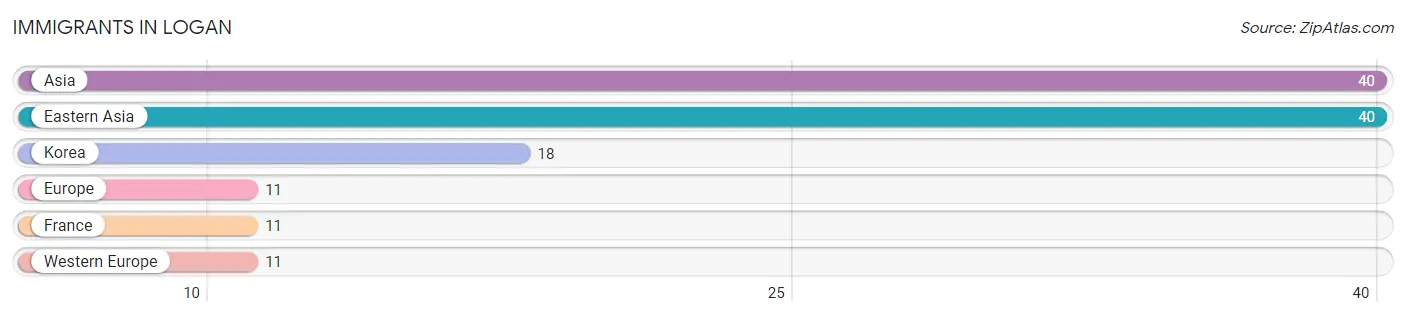
The most numerous immigrant groups reported in Logan came from Asia (40 | 0.6%), Eastern Asia (40 | 0.6%), Korea (18 | 0.3%), Europe (11 | 0.2%), and France (11 | 0.2%), together accounting for 1.7% of all Logan residents.
| Immigration Origin | # Population | % Population |
| Asia | 40 | 0.6% |
| Eastern Asia | 40 | 0.6% |
| Europe | 11 | 0.2% |
| France | 11 | 0.2% |
| Korea | 18 | 0.3% |
| Western Europe | 11 | 0.2% | View All 6 Rows |
Sex and Age in Logan
Sex and Age in Logan
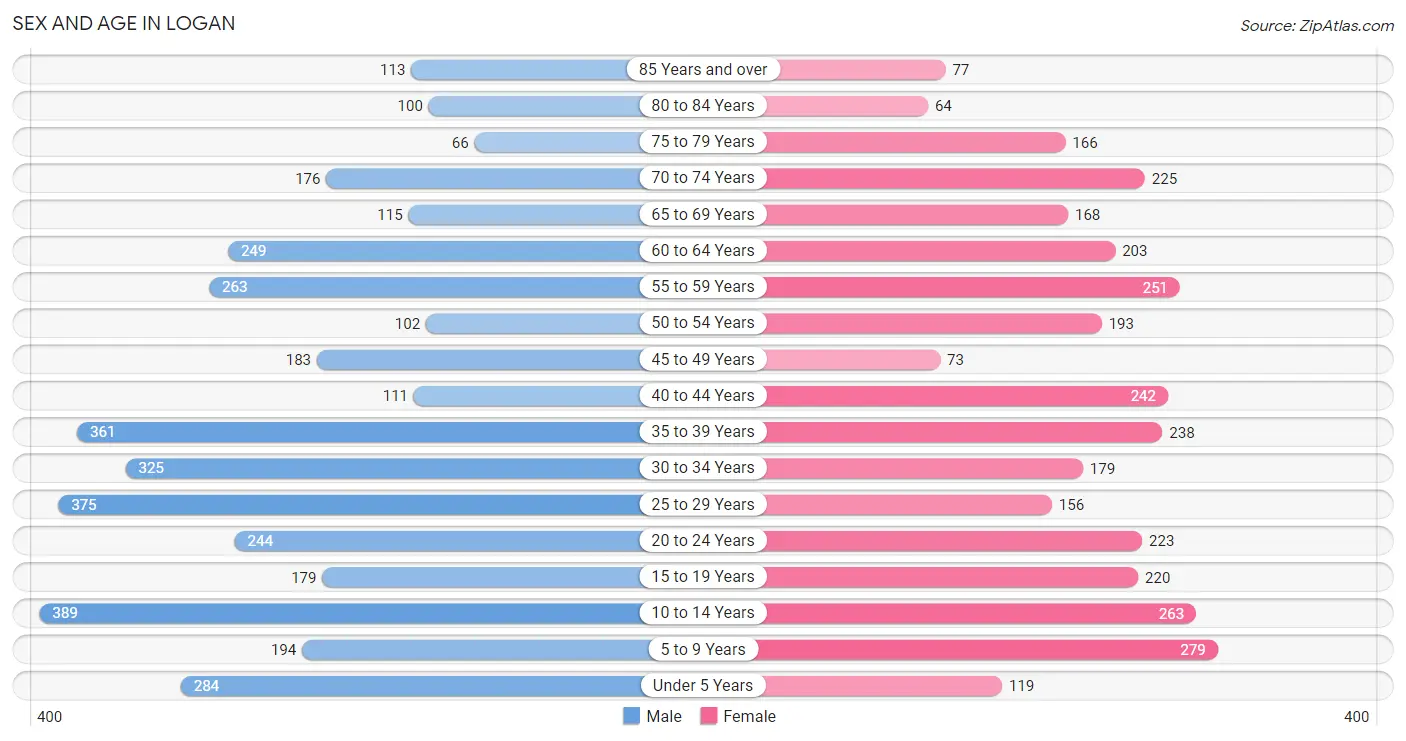
The most populous age groups in Logan are 10 to 14 Years (389 | 10.2%) for men and 5 to 9 Years (279 | 8.4%) for women.
| Age Bracket | Male | Female |
| Under 5 Years | 284 (7.4%) | 119 (3.6%) |
| 5 to 9 Years | 194 (5.1%) | 279 (8.4%) |
| 10 to 14 Years | 389 (10.2%) | 263 (7.9%) |
| 15 to 19 Years | 179 (4.7%) | 220 (6.6%) |
| 20 to 24 Years | 244 (6.4%) | 223 (6.7%) |
| 25 to 29 Years | 375 (9.8%) | 156 (4.7%) |
| 30 to 34 Years | 325 (8.5%) | 179 (5.4%) |
| 35 to 39 Years | 361 (9.4%) | 238 (7.1%) |
| 40 to 44 Years | 111 (2.9%) | 242 (7.2%) |
| 45 to 49 Years | 183 (4.8%) | 73 (2.2%) |
| 50 to 54 Years | 102 (2.7%) | 193 (5.8%) |
| 55 to 59 Years | 263 (6.9%) | 251 (7.5%) |
| 60 to 64 Years | 249 (6.5%) | 203 (6.1%) |
| 65 to 69 Years | 115 (3.0%) | 168 (5.0%) |
| 70 to 74 Years | 176 (4.6%) | 225 (6.7%) |
| 75 to 79 Years | 66 (1.7%) | 166 (5.0%) |
| 80 to 84 Years | 100 (2.6%) | 64 (1.9%) |
| 85 Years and over | 113 (2.9%) | 77 (2.3%) |
| Total | 3,829 (100.0%) | 3,339 (100.0%) |
Families and Households in Logan
Median Family Size in Logan
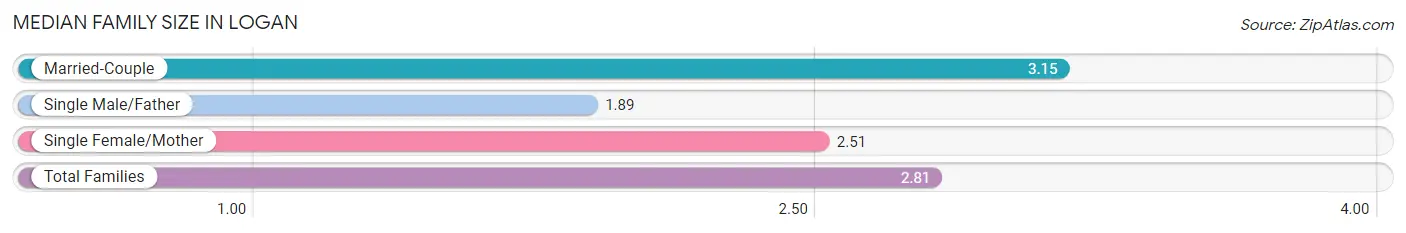
The median family size in Logan is 2.81 persons per family, with married-couple families (1,145 | 59.7%) accounting for the largest median family size of 3.15 persons per family. On the other hand, single male/father families (274 | 14.3%) represent the smallest median family size with 1.89 persons per family.
| Family Type | # Families | Family Size |
| Married-Couple | 1,145 (59.7%) | 3.15 |
| Single Male/Father | 274 (14.3%) | 1.89 |
| Single Female/Mother | 500 (26.1%) | 2.51 |
| Total Families | 1,919 (100.0%) | 2.81 |
Median Household Size in Logan
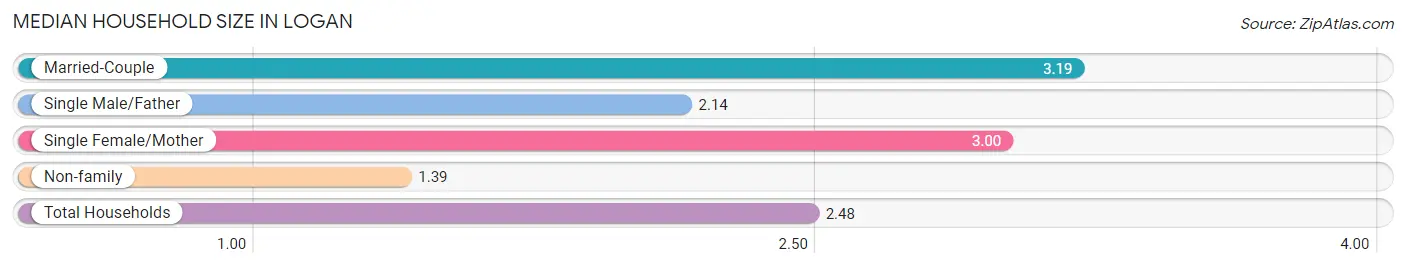
The median household size in Logan is 2.48 persons per household, with married-couple households (1,145 | 40.8%) accounting for the largest median household size of 3.19 persons per household. non-family households (885 | 31.6%) represent the smallest median household size with 1.39 persons per household.
| Household Type | # Households | Household Size |
| Married-Couple | 1,145 (40.8%) | 3.19 |
| Single Male/Father | 274 (9.8%) | 2.14 |
| Single Female/Mother | 500 (17.8%) | 3.00 |
| Non-family | 885 (31.6%) | 1.39 |
| Total Households | 2,804 (100.0%) | 2.48 |
Household Size by Marriage Status in Logan
Out of a total of 2,804 households in Logan, 1,919 (68.4%) are family households, while 885 (31.6%) are nonfamily households. The most numerous type of family households are 2-person households, comprising 883, and the most common type of nonfamily households are 1-person households, comprising 634.
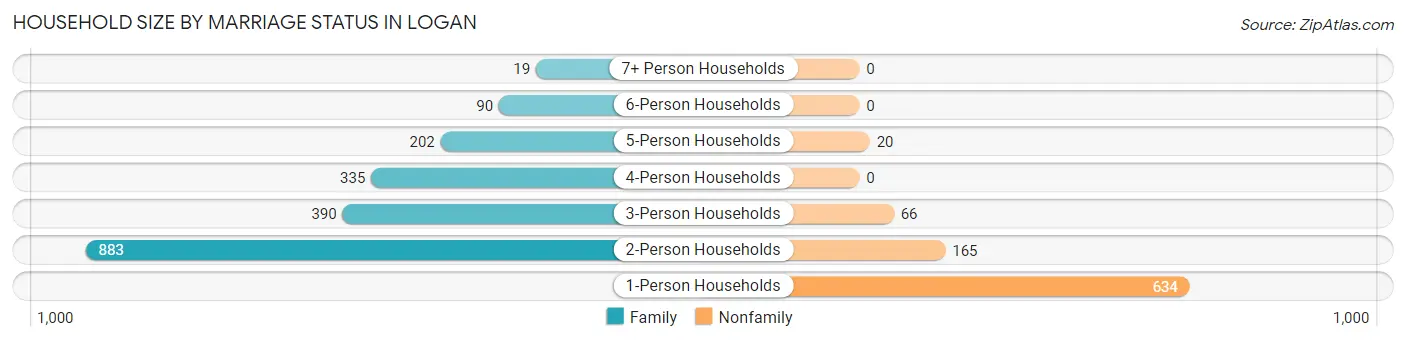
| Household Size | Family Households | Nonfamily Households |
| 1-Person Households | - | 634 (22.6%) |
| 2-Person Households | 883 (31.5%) | 165 (5.9%) |
| 3-Person Households | 390 (13.9%) | 66 (2.4%) |
| 4-Person Households | 335 (11.9%) | 0 (0.0%) |
| 5-Person Households | 202 (7.2%) | 20 (0.7%) |
| 6-Person Households | 90 (3.2%) | 0 (0.0%) |
| 7+ Person Households | 19 (0.7%) | 0 (0.0%) |
| Total | 1,919 (68.4%) | 885 (31.6%) |
Female Fertility in Logan
Fertility by Age in Logan
Average fertility rate in Logan is 56.0 births per 1,000 women. Women in the age bracket of 20 to 34 years have the highest fertility rate with 134.0 births per 1,000 women. Women in the age bracket of 20 to 34 years acount for 100.0% of all women with births.
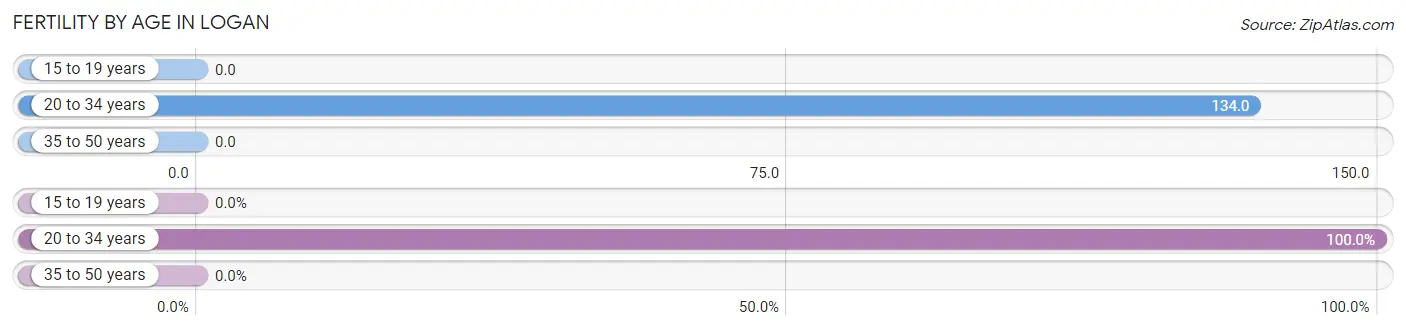
| Age Bracket | Women with Births | Births / 1,000 Women |
| 15 to 19 years | 0 (0.0%) | 0.0 |
| 20 to 34 years | 75 (100.0%) | 134.0 |
| 35 to 50 years | 0 (0.0%) | 0.0 |
| Total | 75 (100.0%) | 56.0 |
Fertility by Age by Marriage Status in Logan
12.0% of women with births (75) in Logan are married. The highest percentage of unmarried women with births falls into 20 to 34 years age bracket with 88.0% of them unmarried at the time of birth, while the lowest percentage of unmarried women with births belong to 20 to 34 years age bracket with 88.0% of them unmarried.
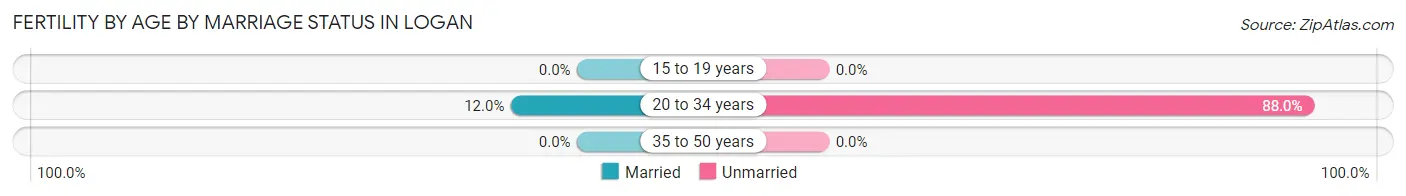
| Age Bracket | Married | Unmarried |
| 15 to 19 years | 0 (0.0%) | 0 (0.0%) |
| 20 to 34 years | 9 (12.0%) | 66 (88.0%) |
| 35 to 50 years | 0 (0.0%) | 0 (0.0%) |
| Total | 9 (12.0%) | 66 (88.0%) |
Fertility by Education in Logan
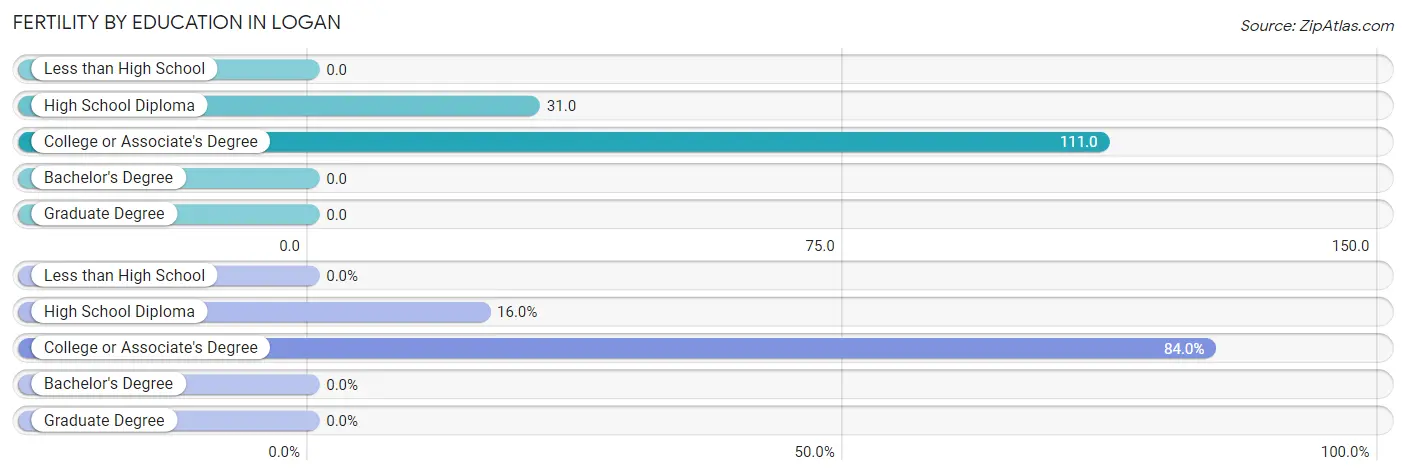
| Educational Attainment | Women with Births | Births / 1,000 Women |
| Less than High School | 0 (0.0%) | 0.0 |
| High School Diploma | 12 (16.0%) | 31.0 |
| College or Associate's Degree | 63 (84.0%) | 111.0 |
| Bachelor's Degree | 0 (0.0%) | 0.0 |
| Graduate Degree | 0 (0.0%) | 0.0 |
| Total | 75 (100.0%) | 56.0 |
Fertility by Education by Marriage Status in Logan
88.0% of women with births in Logan are unmarried. Women with the educational attainment of high school diploma are most likely to be married with 75.0% of them married at childbirth, while women with the educational attainment of college or associate's degree are least likely to be married with 100.0% of them unmarried at childbirth.
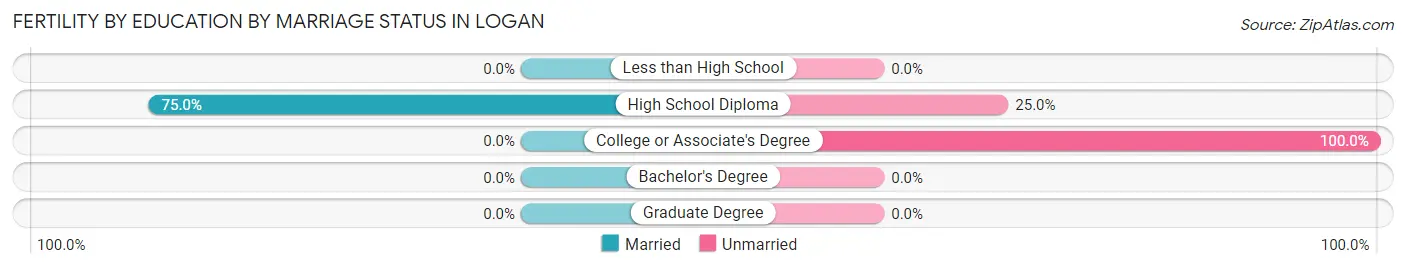
| Educational Attainment | Married | Unmarried |
| Less than High School | 0 (0.0%) | 0 (0.0%) |
| High School Diploma | 9 (75.0%) | 3 (25.0%) |
| College or Associate's Degree | 0 (0.0%) | 63 (100.0%) |
| Bachelor's Degree | 0 (0.0%) | 0 (0.0%) |
| Graduate Degree | 0 (0.0%) | 0 (0.0%) |
| Total | 9 (12.0%) | 66 (88.0%) |
Employment Characteristics in Logan
Employment by Class of Employer in Logan
Among the 2,945 employed individuals in Logan, private company employees (2,165 | 73.5%), local government employees (279 | 9.5%), and not-for-profit organizations (270 | 9.2%) make up the most common classes of employment.
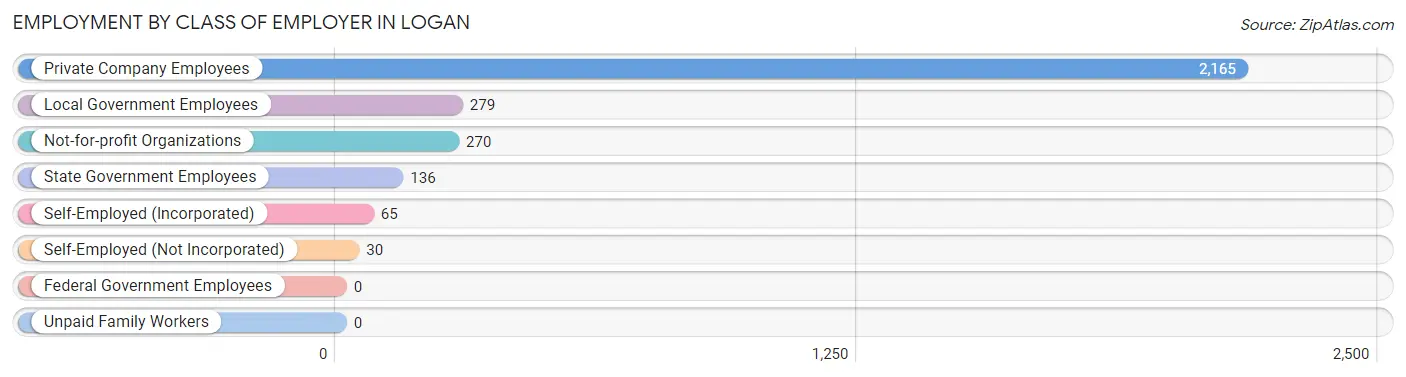
| Employer Class | # Employees | % Employees |
| Private Company Employees | 2,165 | 73.5% |
| Self-Employed (Incorporated) | 65 | 2.2% |
| Self-Employed (Not Incorporated) | 30 | 1.0% |
| Not-for-profit Organizations | 270 | 9.2% |
| Local Government Employees | 279 | 9.5% |
| State Government Employees | 136 | 4.6% |
| Federal Government Employees | 0 | 0.0% |
| Unpaid Family Workers | 0 | 0.0% |
| Total | 2,945 | 100.0% |
Employment Status by Age in Logan
According to the labor force statistics for Logan, out of the total population over 16 years of age (5,510), 56.2% or 3,097 individuals are in the labor force, with 3.0% or 93 of them unemployed. The age group with the highest labor force participation rate is 30 to 34 years, with 91.7% or 462 individuals in the labor force. Within the labor force, the 45 to 54 years age range has the highest percentage of unemployed individuals, with 12.1% or 50 of them being unemployed.
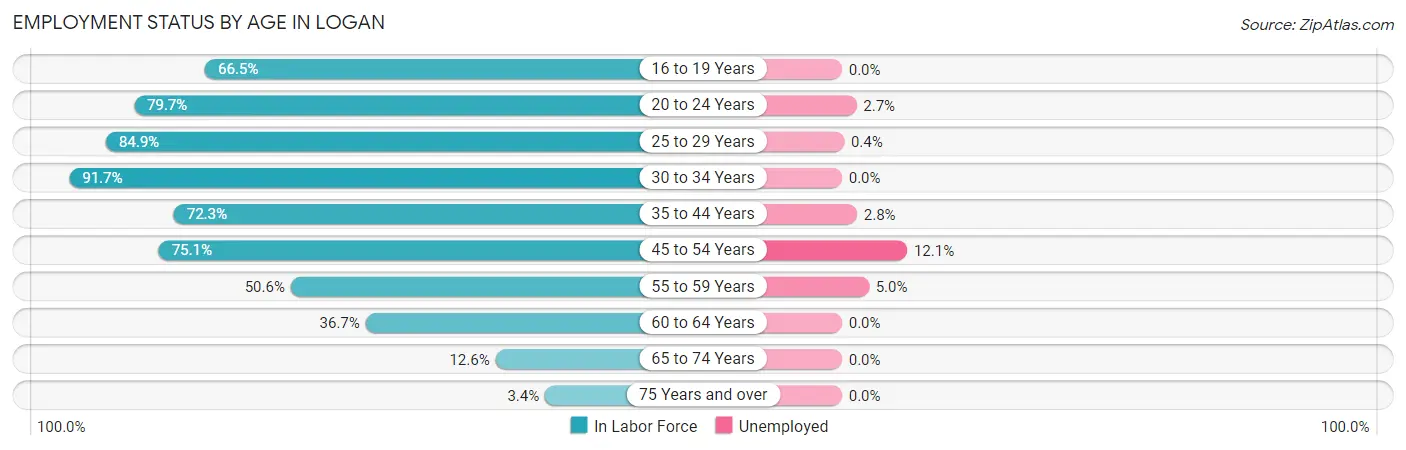
| Age Bracket | In Labor Force | Unemployed |
| 16 to 19 Years | 179 (66.5%) | 0 (0.0%) |
| 20 to 24 Years | 372 (79.7%) | 10 (2.7%) |
| 25 to 29 Years | 451 (84.9%) | 2 (0.4%) |
| 30 to 34 Years | 462 (91.7%) | 0 (0.0%) |
| 35 to 44 Years | 688 (72.3%) | 19 (2.8%) |
| 45 to 54 Years | 414 (75.1%) | 50 (12.1%) |
| 55 to 59 Years | 260 (50.6%) | 13 (5.0%) |
| 60 to 64 Years | 166 (36.7%) | 0 (0.0%) |
| 65 to 74 Years | 86 (12.6%) | 0 (0.0%) |
| 75 Years and over | 20 (3.4%) | 0 (0.0%) |
| Total | 3,097 (56.2%) | 93 (3.0%) |
Employment Status by Educational Attainment in Logan
According to labor force statistics for Logan, 69.7% of individuals (2,442) out of the total population between 25 and 64 years of age (3,504) are in the labor force, with 3.4% or 83 of them being unemployed. The group with the highest labor force participation rate are those with the educational attainment of bachelor's degree or higher, with 81.8% or 377 individuals in the labor force. Within the labor force, individuals with less than high school education have the highest percentage of unemployment, with 12.9% or 8 of them being unemployed.
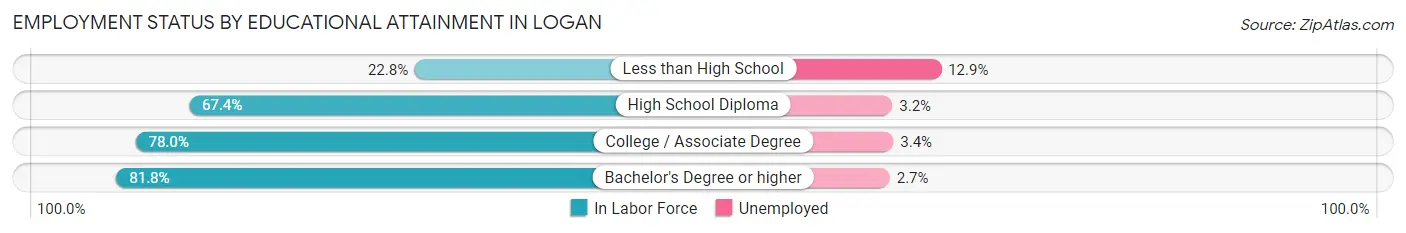
| Educational Attainment | In Labor Force | Unemployed |
| Less than High School | 62 (22.8%) | 35 (12.9%) |
| High School Diploma | 1,008 (67.4%) | 48 (3.2%) |
| College / Associate Degree | 995 (78.0%) | 43 (3.4%) |
| Bachelor's Degree or higher | 377 (81.8%) | 12 (2.7%) |
| Total | 2,442 (69.7%) | 119 (3.4%) |
Employment Occupations by Sex in Logan
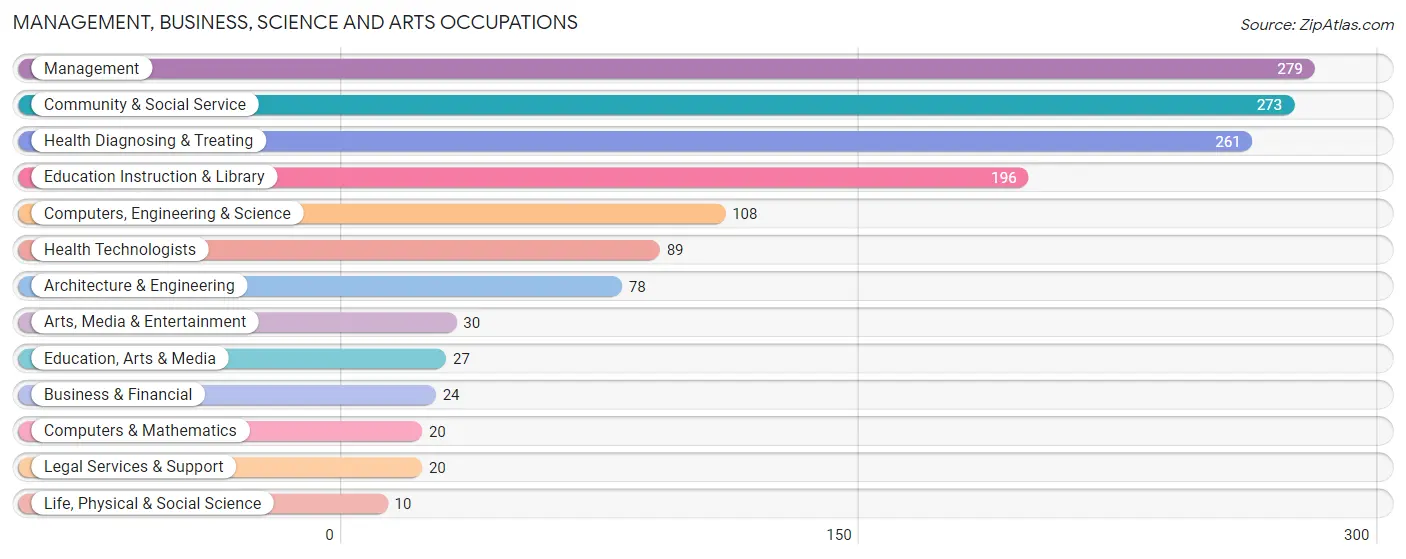
Management, Business, Science and Arts Occupations
The most common Management, Business, Science and Arts occupations in Logan are Management (279 | 9.3%), Community & Social Service (273 | 9.1%), Health Diagnosing & Treating (261 | 8.7%), Education Instruction & Library (196 | 6.5%), and Computers, Engineering & Science (108 | 3.6%).
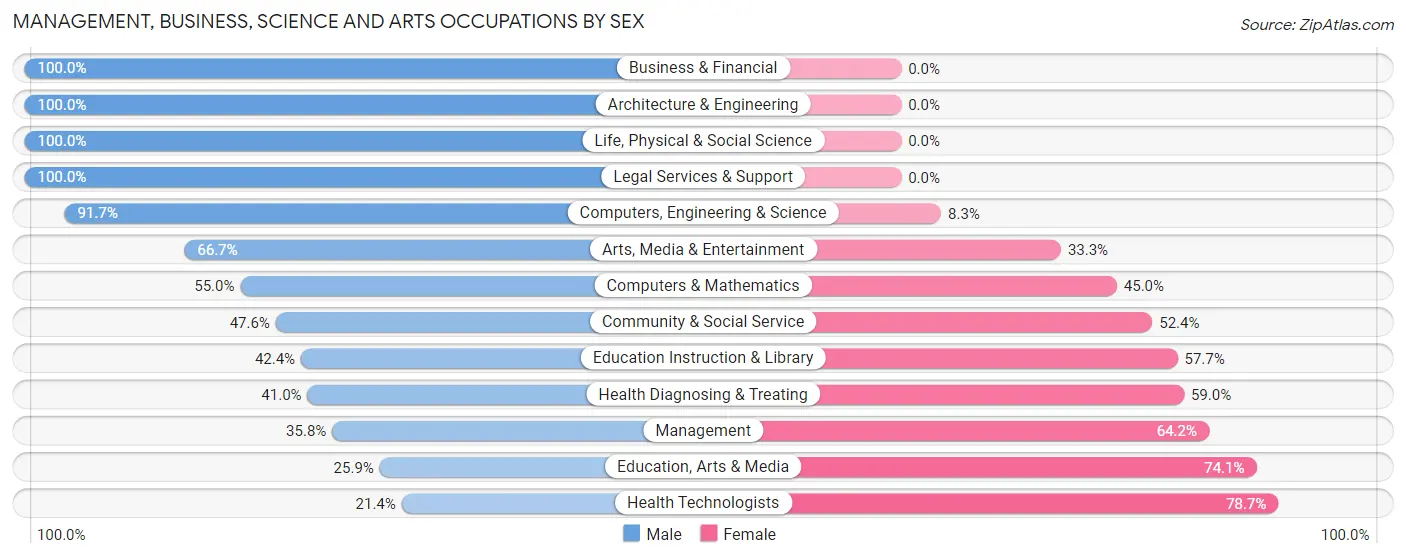
Management, Business, Science and Arts Occupations by Sex
Within the Management, Business, Science and Arts occupations in Logan, the most male-oriented occupations are Business & Financial (100.0%), Architecture & Engineering (100.0%), and Life, Physical & Social Science (100.0%), while the most female-oriented occupations are Health Technologists (78.6%), Education, Arts & Media (74.1%), and Management (64.2%).
| Occupation | Male | Female |
| Management | 100 (35.8%) | 179 (64.2%) |
| Business & Financial | 24 (100.0%) | 0 (0.0%) |
| Computers, Engineering & Science | 99 (91.7%) | 9 (8.3%) |
| Computers & Mathematics | 11 (55.0%) | 9 (45.0%) |
| Architecture & Engineering | 78 (100.0%) | 0 (0.0%) |
| Life, Physical & Social Science | 10 (100.0%) | 0 (0.0%) |
| Community & Social Service | 130 (47.6%) | 143 (52.4%) |
| Education, Arts & Media | 7 (25.9%) | 20 (74.1%) |
| Legal Services & Support | 20 (100.0%) | 0 (0.0%) |
| Education Instruction & Library | 83 (42.3%) | 113 (57.7%) |
| Arts, Media & Entertainment | 20 (66.7%) | 10 (33.3%) |
| Health Diagnosing & Treating | 107 (41.0%) | 154 (59.0%) |
| Health Technologists | 19 (21.3%) | 70 (78.6%) |
| Total (Category) | 460 (48.7%) | 485 (51.3%) |
| Total (Overall) | 1,688 (56.2%) | 1,316 (43.8%) |
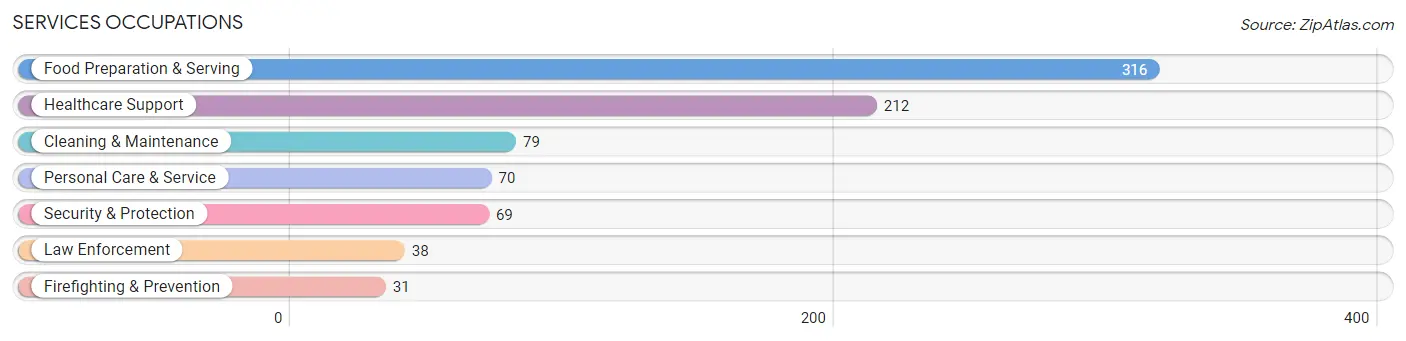
Services Occupations
The most common Services occupations in Logan are Food Preparation & Serving (316 | 10.5%), Healthcare Support (212 | 7.1%), Cleaning & Maintenance (79 | 2.6%), Personal Care & Service (70 | 2.3%), and Security & Protection (69 | 2.3%).
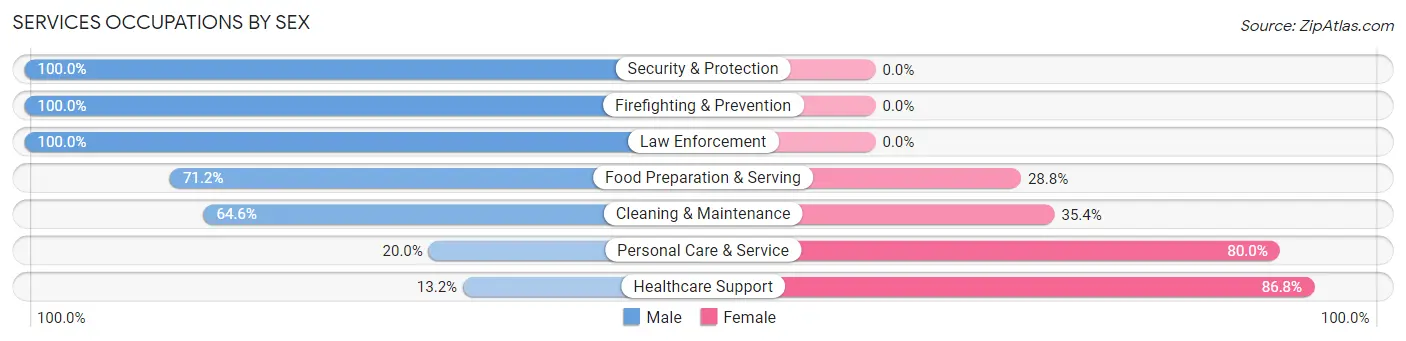
Services Occupations by Sex
Within the Services occupations in Logan, the most male-oriented occupations are Security & Protection (100.0%), Firefighting & Prevention (100.0%), and Law Enforcement (100.0%), while the most female-oriented occupations are Healthcare Support (86.8%), Personal Care & Service (80.0%), and Cleaning & Maintenance (35.4%).
| Occupation | Male | Female |
| Healthcare Support | 28 (13.2%) | 184 (86.8%) |
| Security & Protection | 69 (100.0%) | 0 (0.0%) |
| Firefighting & Prevention | 31 (100.0%) | 0 (0.0%) |
| Law Enforcement | 38 (100.0%) | 0 (0.0%) |
| Food Preparation & Serving | 225 (71.2%) | 91 (28.8%) |
| Cleaning & Maintenance | 51 (64.6%) | 28 (35.4%) |
| Personal Care & Service | 14 (20.0%) | 56 (80.0%) |
| Total (Category) | 387 (51.9%) | 359 (48.1%) |
| Total (Overall) | 1,688 (56.2%) | 1,316 (43.8%) |
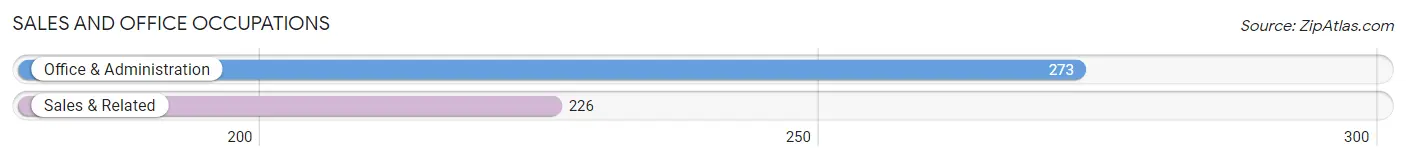
Sales and Office Occupations
The most common Sales and Office occupations in Logan are Office & Administration (273 | 9.1%), and Sales & Related (226 | 7.5%).
Sales and Office Occupations by Sex
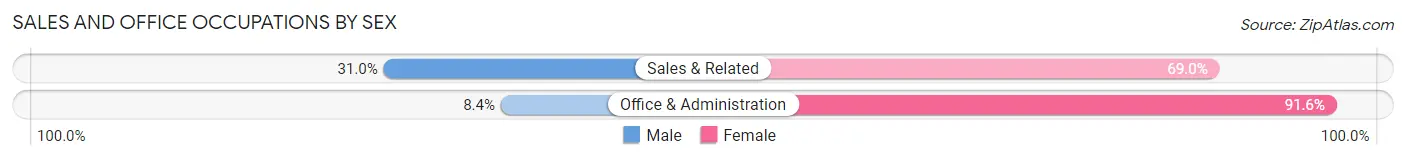
| Occupation | Male | Female |
| Sales & Related | 70 (31.0%) | 156 (69.0%) |
| Office & Administration | 23 (8.4%) | 250 (91.6%) |
| Total (Category) | 93 (18.6%) | 406 (81.4%) |
| Total (Overall) | 1,688 (56.2%) | 1,316 (43.8%) |
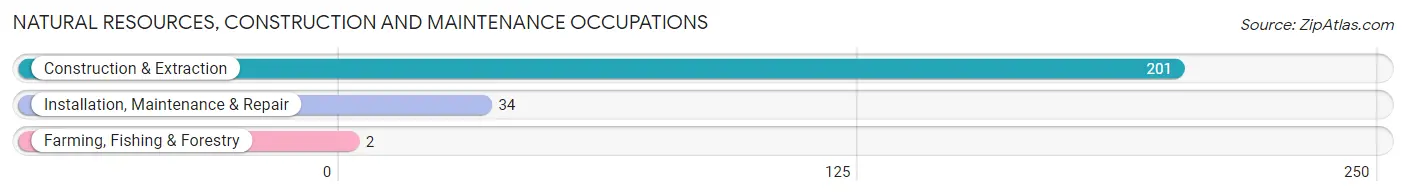
Natural Resources, Construction and Maintenance Occupations
The most common Natural Resources, Construction and Maintenance occupations in Logan are Construction & Extraction (201 | 6.7%), Installation, Maintenance & Repair (34 | 1.1%), and Farming, Fishing & Forestry (2 | 0.1%).
Natural Resources, Construction and Maintenance Occupations by Sex
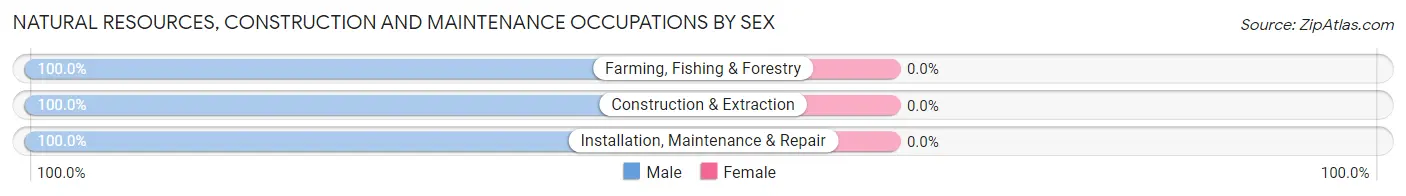
| Occupation | Male | Female |
| Farming, Fishing & Forestry | 2 (100.0%) | 0 (0.0%) |
| Construction & Extraction | 201 (100.0%) | 0 (0.0%) |
| Installation, Maintenance & Repair | 34 (100.0%) | 0 (0.0%) |
| Total (Category) | 237 (100.0%) | 0 (0.0%) |
| Total (Overall) | 1,688 (56.2%) | 1,316 (43.8%) |
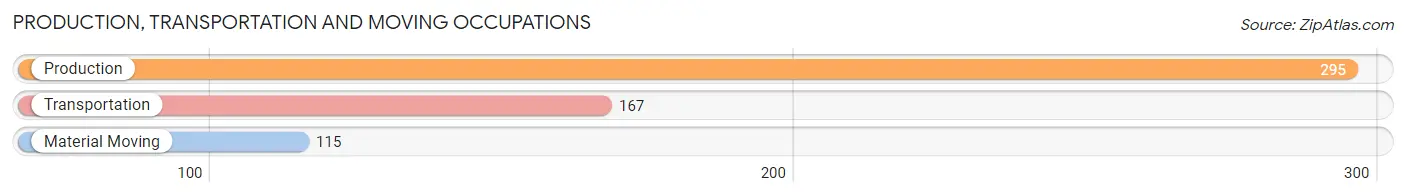
Production, Transportation and Moving Occupations
The most common Production, Transportation and Moving occupations in Logan are Production (295 | 9.8%), Transportation (167 | 5.6%), and Material Moving (115 | 3.8%).
Production, Transportation and Moving Occupations by Sex
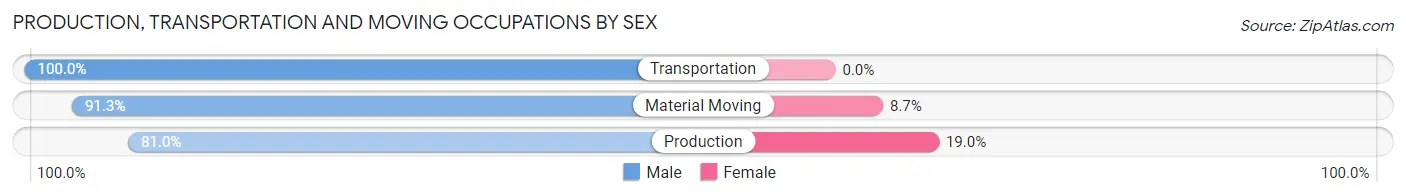
| Occupation | Male | Female |
| Production | 239 (81.0%) | 56 (19.0%) |
| Transportation | 167 (100.0%) | 0 (0.0%) |
| Material Moving | 105 (91.3%) | 10 (8.7%) |
| Total (Category) | 511 (88.6%) | 66 (11.4%) |
| Total (Overall) | 1,688 (56.2%) | 1,316 (43.8%) |
Employment Industries by Sex in Logan
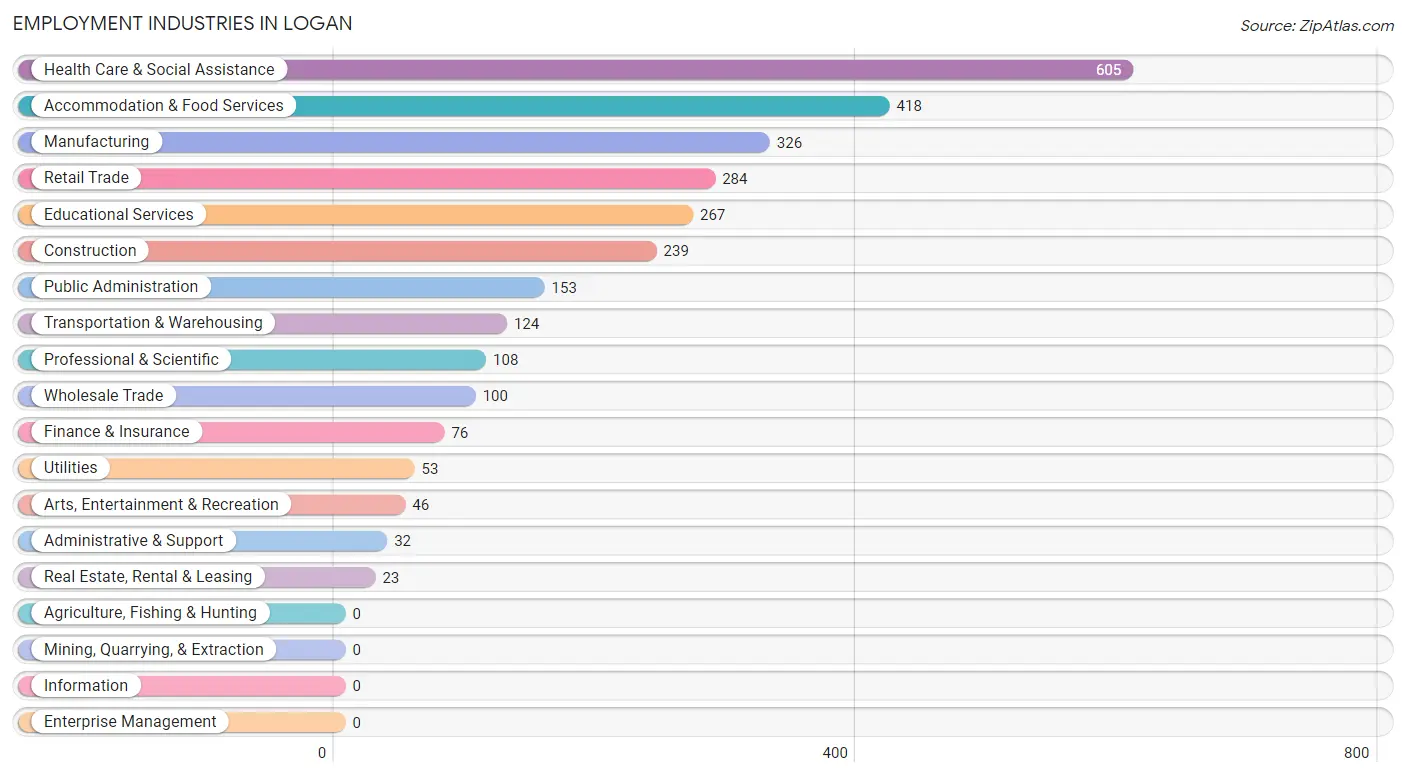
Employment Industries in Logan
The major employment industries in Logan include Health Care & Social Assistance (605 | 20.1%), Accommodation & Food Services (418 | 13.9%), Manufacturing (326 | 10.8%), Retail Trade (284 | 9.5%), and Educational Services (267 | 8.9%).
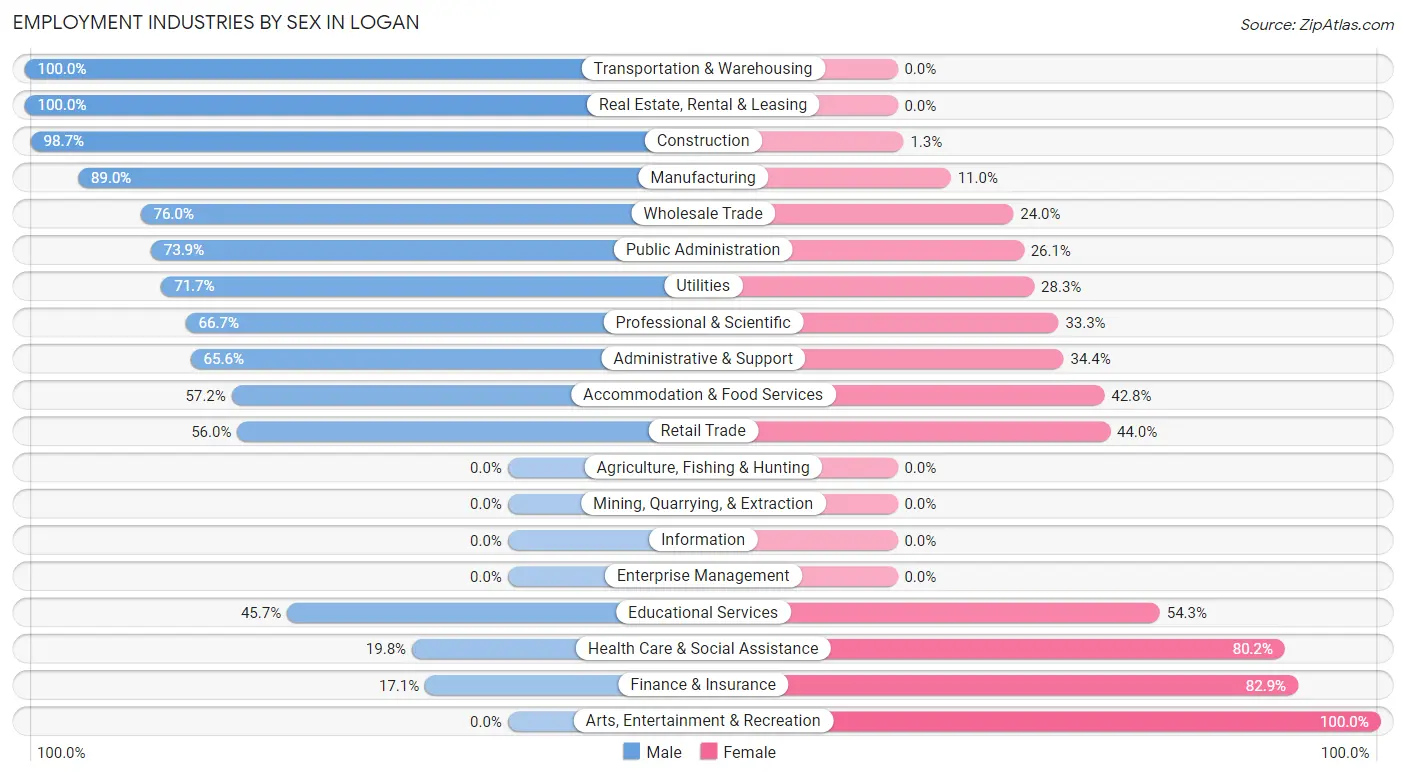
Employment Industries by Sex in Logan
The Logan industries that see more men than women are Transportation & Warehousing (100.0%), Real Estate, Rental & Leasing (100.0%), and Construction (98.7%), whereas the industries that tend to have a higher number of women are Arts, Entertainment & Recreation (100.0%), Finance & Insurance (82.9%), and Health Care & Social Assistance (80.2%).
| Industry | Male | Female |
| Agriculture, Fishing & Hunting | 0 (0.0%) | 0 (0.0%) |
| Mining, Quarrying, & Extraction | 0 (0.0%) | 0 (0.0%) |
| Construction | 236 (98.7%) | 3 (1.3%) |
| Manufacturing | 290 (89.0%) | 36 (11.0%) |
| Wholesale Trade | 76 (76.0%) | 24 (24.0%) |
| Retail Trade | 159 (56.0%) | 125 (44.0%) |
| Transportation & Warehousing | 124 (100.0%) | 0 (0.0%) |
| Utilities | 38 (71.7%) | 15 (28.3%) |
| Information | 0 (0.0%) | 0 (0.0%) |
| Finance & Insurance | 13 (17.1%) | 63 (82.9%) |
| Real Estate, Rental & Leasing | 23 (100.0%) | 0 (0.0%) |
| Professional & Scientific | 72 (66.7%) | 36 (33.3%) |
| Enterprise Management | 0 (0.0%) | 0 (0.0%) |
| Administrative & Support | 21 (65.6%) | 11 (34.4%) |
| Educational Services | 122 (45.7%) | 145 (54.3%) |
| Health Care & Social Assistance | 120 (19.8%) | 485 (80.2%) |
| Arts, Entertainment & Recreation | 0 (0.0%) | 46 (100.0%) |
| Accommodation & Food Services | 239 (57.2%) | 179 (42.8%) |
| Public Administration | 113 (73.9%) | 40 (26.1%) |
| Total | 1,688 (56.2%) | 1,316 (43.8%) |
Education in Logan
School Enrollment in Logan
The most common levels of schooling among the 1,775 students in Logan are middle school (537 | 30.2%), high school (405 | 22.8%), and college / undergraduate (327 | 18.4%).
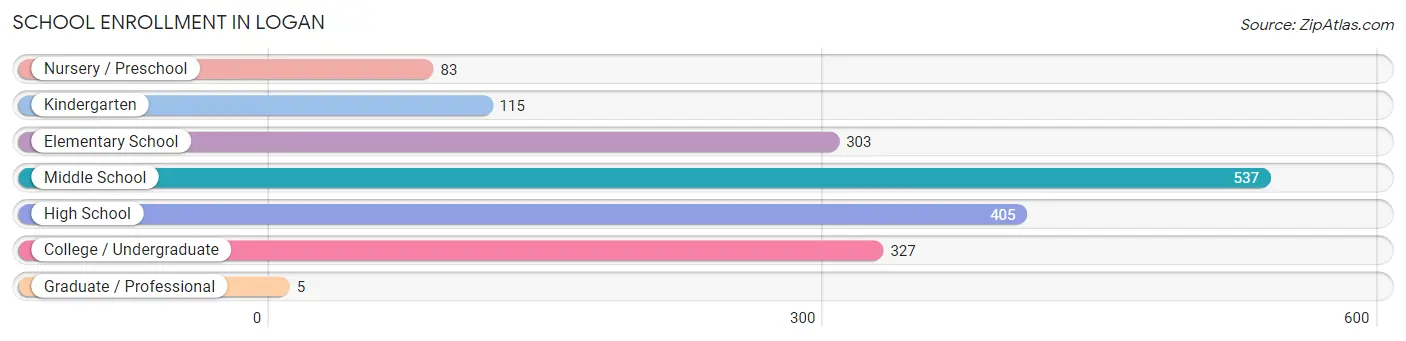
| School Level | # Students | % Students |
| Nursery / Preschool | 83 | 4.7% |
| Kindergarten | 115 | 6.5% |
| Elementary School | 303 | 17.1% |
| Middle School | 537 | 30.2% |
| High School | 405 | 22.8% |
| College / Undergraduate | 327 | 18.4% |
| Graduate / Professional | 5 | 0.3% |
| Total | 1,775 | 100.0% |
School Enrollment by Age by Funding Source in Logan
Out of a total of 1,775 students who are enrolled in schools in Logan, 167 (9.4%) attend a private institution, while the remaining 1,608 (90.6%) are enrolled in public schools. The age group of 20 to 24 year olds has the highest likelihood of being enrolled in private schools, with 23 (25.8% in the age bracket) enrolled. Conversely, the age group of 25 to 34 year olds has the lowest likelihood of being enrolled in a private school, with 71 (100.0% in the age bracket) attending a public institution.
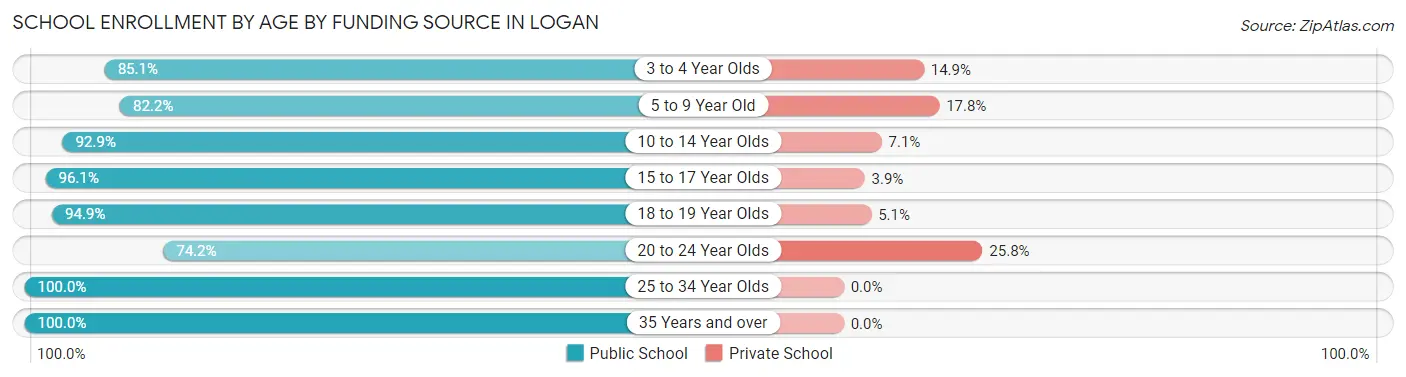
| Age Bracket | Public School | Private School |
| 3 to 4 Year Olds | 57 (85.1%) | 10 (14.9%) |
| 5 to 9 Year Old | 328 (82.2%) | 71 (17.8%) |
| 10 to 14 Year Olds | 606 (92.9%) | 46 (7.1%) |
| 15 to 17 Year Olds | 271 (96.1%) | 11 (3.9%) |
| 18 to 19 Year Olds | 111 (94.9%) | 6 (5.1%) |
| 20 to 24 Year Olds | 66 (74.2%) | 23 (25.8%) |
| 25 to 34 Year Olds | 71 (100.0%) | 0 (0.0%) |
| 35 Years and over | 98 (100.0%) | 0 (0.0%) |
| Total | 1,608 (90.6%) | 167 (9.4%) |
Educational Attainment by Field of Study in Logan
Education (190 | 26.8%), business (86 | 12.1%), communications (73 | 10.3%), science & technology (65 | 9.2%), and liberal arts & history (48 | 6.8%) are the most common fields of study among 709 individuals in Logan who have obtained a bachelor's degree or higher.
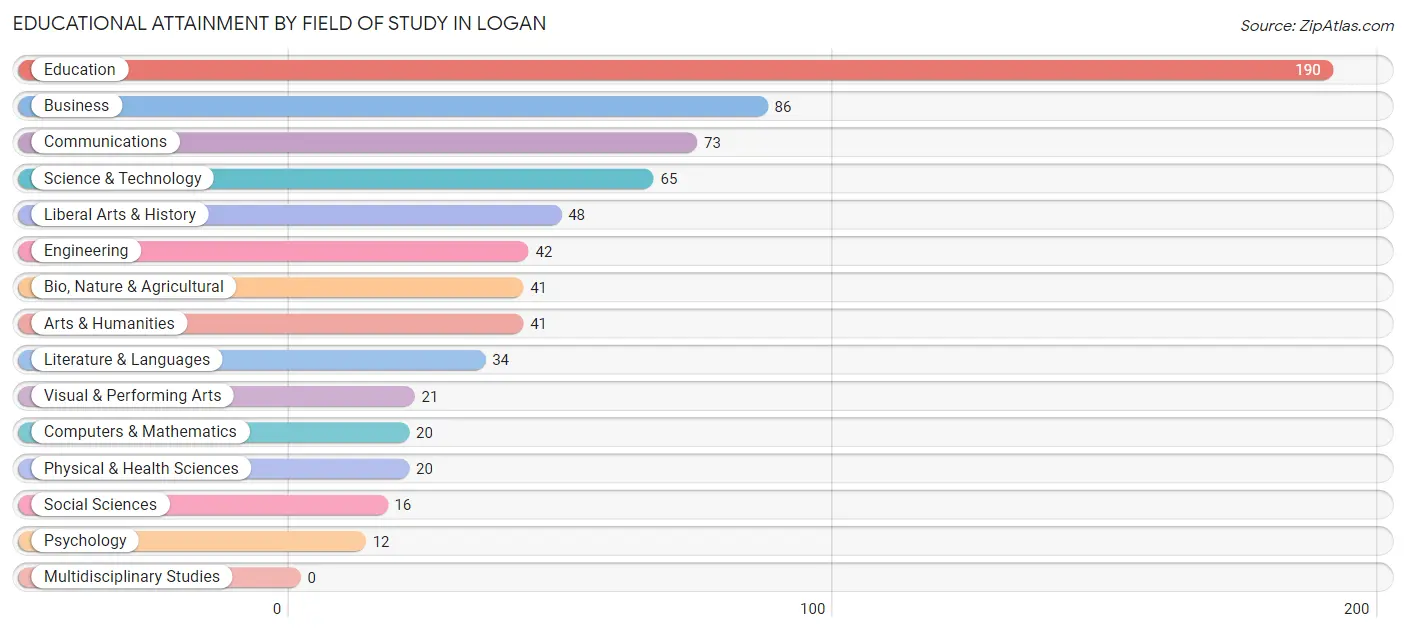
| Field of Study | # Graduates | % Graduates |
| Computers & Mathematics | 20 | 2.8% |
| Bio, Nature & Agricultural | 41 | 5.8% |
| Physical & Health Sciences | 20 | 2.8% |
| Psychology | 12 | 1.7% |
| Social Sciences | 16 | 2.3% |
| Engineering | 42 | 5.9% |
| Multidisciplinary Studies | 0 | 0.0% |
| Science & Technology | 65 | 9.2% |
| Business | 86 | 12.1% |
| Education | 190 | 26.8% |
| Literature & Languages | 34 | 4.8% |
| Liberal Arts & History | 48 | 6.8% |
| Visual & Performing Arts | 21 | 3.0% |
| Communications | 73 | 10.3% |
| Arts & Humanities | 41 | 5.8% |
| Total | 709 | 100.0% |
Transportation & Commute in Logan
Vehicle Availability by Sex in Logan
The most prevalent vehicle ownership categories in Logan are males with 2 vehicles (594, accounting for 36.0%) and females with 2 vehicles (484, making up 45.9%).
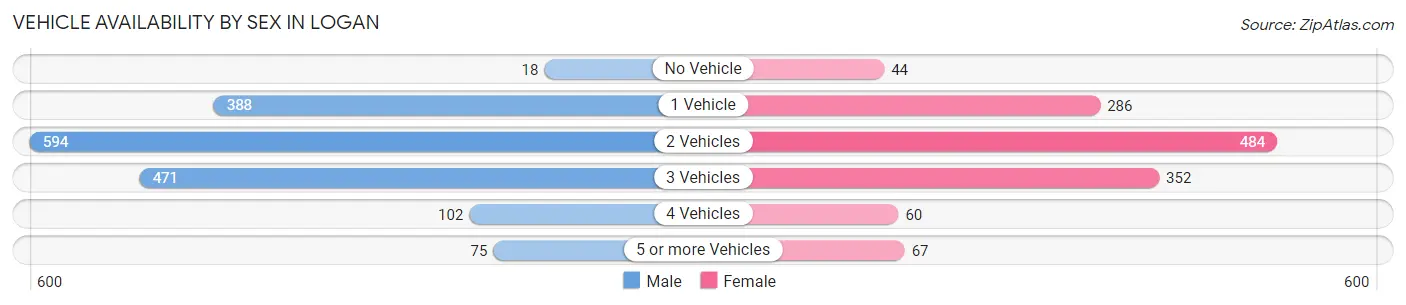
| Vehicles Available | Male | Female |
| No Vehicle | 18 (1.1%) | 44 (3.4%) |
| 1 Vehicle | 388 (23.5%) | 286 (22.1%) |
| 2 Vehicles | 594 (36.0%) | 484 (37.4%) |
| 3 Vehicles | 471 (28.6%) | 352 (27.2%) |
| 4 Vehicles | 102 (6.2%) | 60 (4.6%) |
| 5 or more Vehicles | 75 (4.5%) | 67 (5.2%) |
| Total | 1,648 (100.0%) | 1,293 (100.0%) |
Commute Time in Logan
The most frequently occuring commute durations in Logan are 10 to 14 minutes (614 commuters, 22.0%), 5 to 9 minutes (526 commuters, 18.8%), and 60 to 89 minutes (394 commuters, 14.1%).
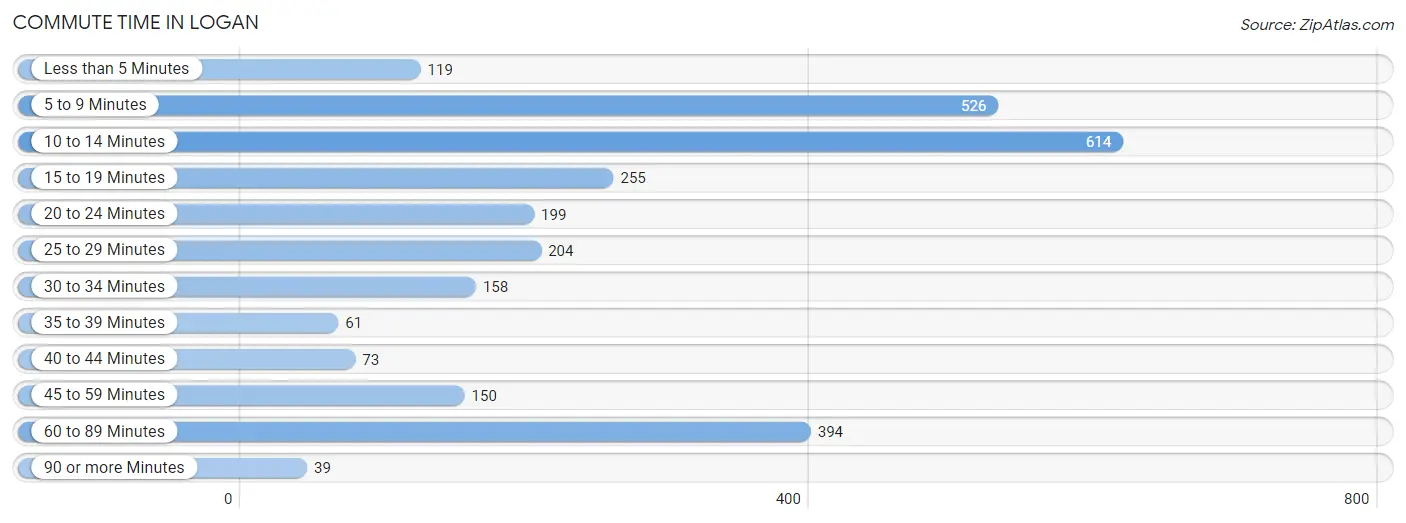
| Commute Time | # Commuters | % Commuters |
| Less than 5 Minutes | 119 | 4.3% |
| 5 to 9 Minutes | 526 | 18.8% |
| 10 to 14 Minutes | 614 | 22.0% |
| 15 to 19 Minutes | 255 | 9.1% |
| 20 to 24 Minutes | 199 | 7.1% |
| 25 to 29 Minutes | 204 | 7.3% |
| 30 to 34 Minutes | 158 | 5.7% |
| 35 to 39 Minutes | 61 | 2.2% |
| 40 to 44 Minutes | 73 | 2.6% |
| 45 to 59 Minutes | 150 | 5.4% |
| 60 to 89 Minutes | 394 | 14.1% |
| 90 or more Minutes | 39 | 1.4% |
Commute Time by Sex in Logan
The most common commute times in Logan are 10 to 14 minutes (333 commuters, 21.4%) for males and 10 to 14 minutes (281 commuters, 22.7%) for females.
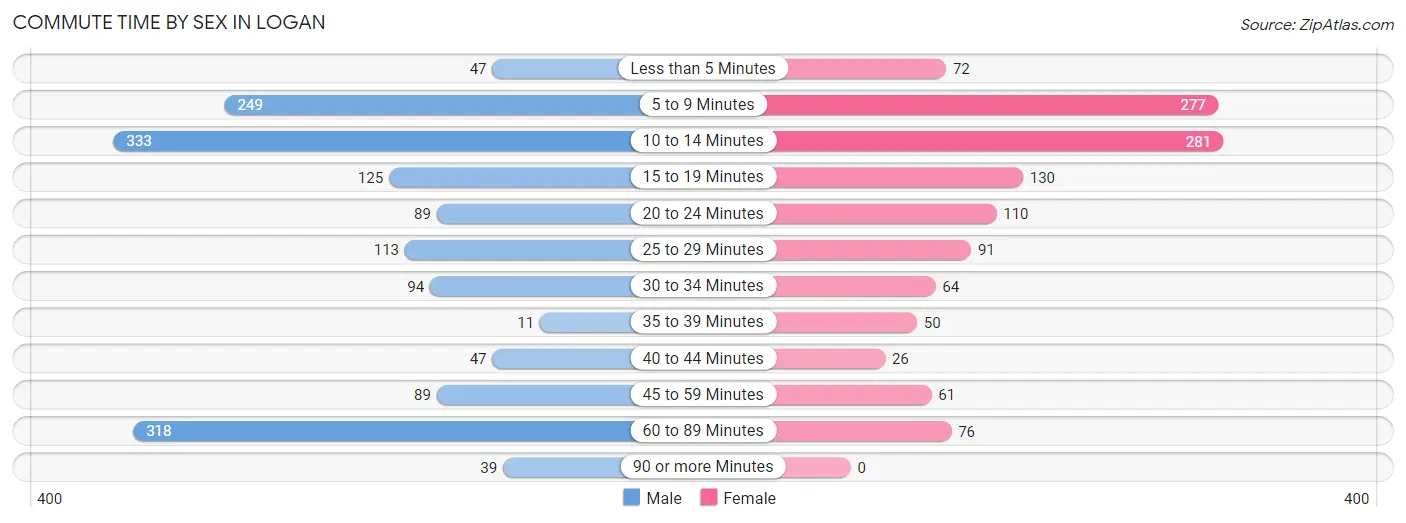
| Commute Time | Male | Female |
| Less than 5 Minutes | 47 (3.0%) | 72 (5.8%) |
| 5 to 9 Minutes | 249 (16.0%) | 277 (22.4%) |
| 10 to 14 Minutes | 333 (21.4%) | 281 (22.7%) |
| 15 to 19 Minutes | 125 (8.0%) | 130 (10.5%) |
| 20 to 24 Minutes | 89 (5.7%) | 110 (8.9%) |
| 25 to 29 Minutes | 113 (7.3%) | 91 (7.3%) |
| 30 to 34 Minutes | 94 (6.0%) | 64 (5.2%) |
| 35 to 39 Minutes | 11 (0.7%) | 50 (4.0%) |
| 40 to 44 Minutes | 47 (3.0%) | 26 (2.1%) |
| 45 to 59 Minutes | 89 (5.7%) | 61 (4.9%) |
| 60 to 89 Minutes | 318 (20.5%) | 76 (6.1%) |
| 90 or more Minutes | 39 (2.5%) | 0 (0.0%) |
Time of Departure to Work by Sex in Logan
The most frequent times of departure to work in Logan are 7:00 AM to 7:29 AM (391, 25.2%) for males and 8:30 AM to 8:59 AM (202, 16.3%) for females.
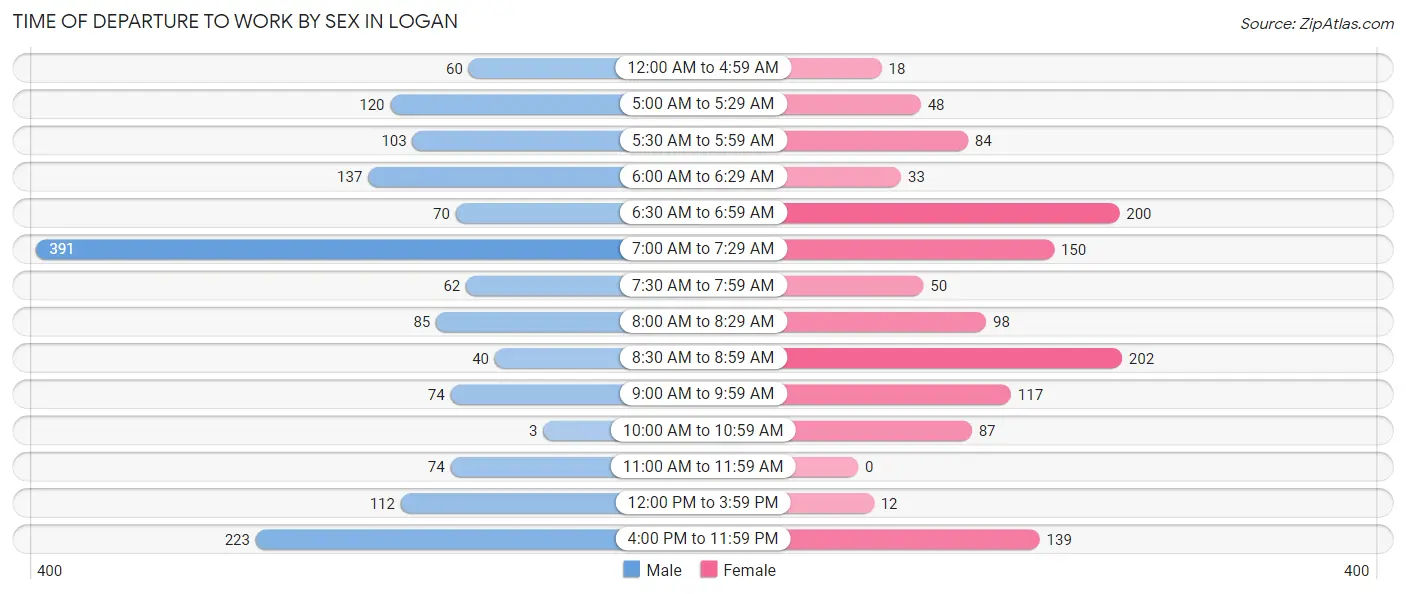
| Time of Departure | Male | Female |
| 12:00 AM to 4:59 AM | 60 (3.9%) | 18 (1.5%) |
| 5:00 AM to 5:29 AM | 120 (7.7%) | 48 (3.9%) |
| 5:30 AM to 5:59 AM | 103 (6.6%) | 84 (6.8%) |
| 6:00 AM to 6:29 AM | 137 (8.8%) | 33 (2.7%) |
| 6:30 AM to 6:59 AM | 70 (4.5%) | 200 (16.2%) |
| 7:00 AM to 7:29 AM | 391 (25.2%) | 150 (12.1%) |
| 7:30 AM to 7:59 AM | 62 (4.0%) | 50 (4.0%) |
| 8:00 AM to 8:29 AM | 85 (5.5%) | 98 (7.9%) |
| 8:30 AM to 8:59 AM | 40 (2.6%) | 202 (16.3%) |
| 9:00 AM to 9:59 AM | 74 (4.8%) | 117 (9.5%) |
| 10:00 AM to 10:59 AM | 3 (0.2%) | 87 (7.0%) |
| 11:00 AM to 11:59 AM | 74 (4.8%) | 0 (0.0%) |
| 12:00 PM to 3:59 PM | 112 (7.2%) | 12 (1.0%) |
| 4:00 PM to 11:59 PM | 223 (14.3%) | 139 (11.2%) |
| Total | 1,554 (100.0%) | 1,238 (100.0%) |
Housing Occupancy in Logan
Occupancy by Ownership in Logan
Of the total 2,804 dwellings in Logan, owner-occupied units account for 1,688 (60.2%), while renter-occupied units make up 1,116 (39.8%).
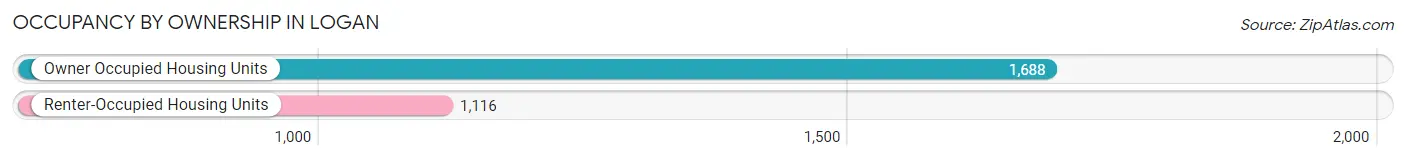
| Occupancy | # Housing Units | % Housing Units |
| Owner Occupied Housing Units | 1,688 | 60.2% |
| Renter-Occupied Housing Units | 1,116 | 39.8% |
| Total Occupied Housing Units | 2,804 | 100.0% |
Occupancy by Household Size in Logan
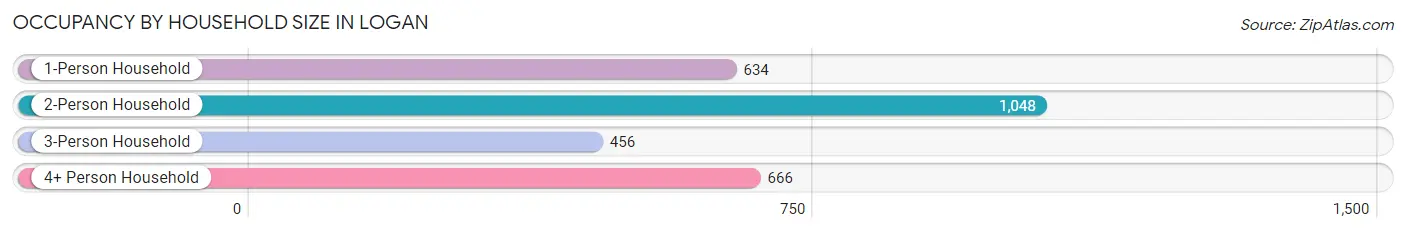
| Household Size | # Housing Units | % Housing Units |
| 1-Person Household | 634 | 22.6% |
| 2-Person Household | 1,048 | 37.4% |
| 3-Person Household | 456 | 16.3% |
| 4+ Person Household | 666 | 23.7% |
| Total Housing Units | 2,804 | 100.0% |
Occupancy by Ownership by Household Size in Logan
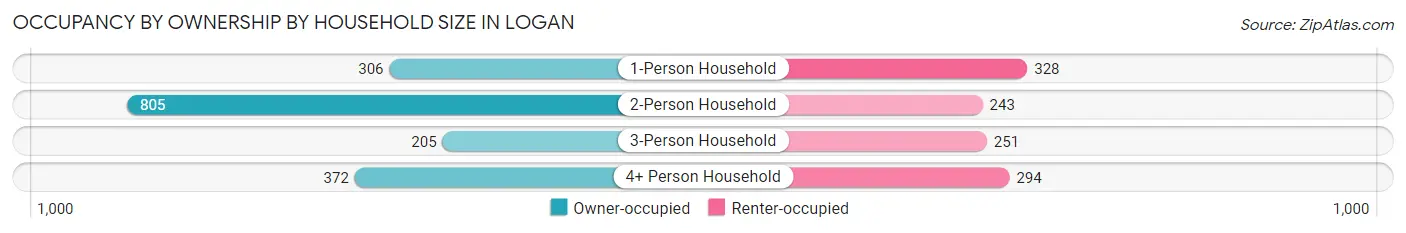
| Household Size | Owner-occupied | Renter-occupied |
| 1-Person Household | 306 (48.3%) | 328 (51.7%) |
| 2-Person Household | 805 (76.8%) | 243 (23.2%) |
| 3-Person Household | 205 (45.0%) | 251 (55.0%) |
| 4+ Person Household | 372 (55.9%) | 294 (44.1%) |
| Total Housing Units | 1,688 (60.2%) | 1,116 (39.8%) |
Occupancy by Educational Attainment in Logan
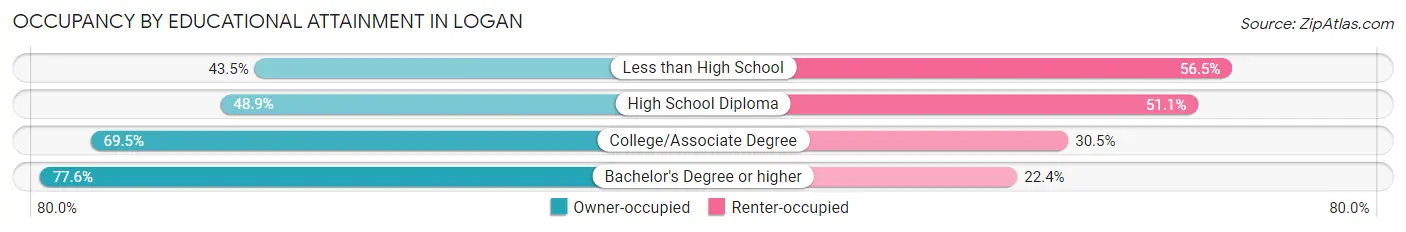
| Household Size | Owner-occupied | Renter-occupied |
| Less than High School | 64 (43.5%) | 83 (56.5%) |
| High School Diploma | 601 (48.9%) | 627 (51.1%) |
| College/Associate Degree | 739 (69.5%) | 324 (30.5%) |
| Bachelor's Degree or higher | 284 (77.6%) | 82 (22.4%) |
Occupancy by Age of Householder in Logan
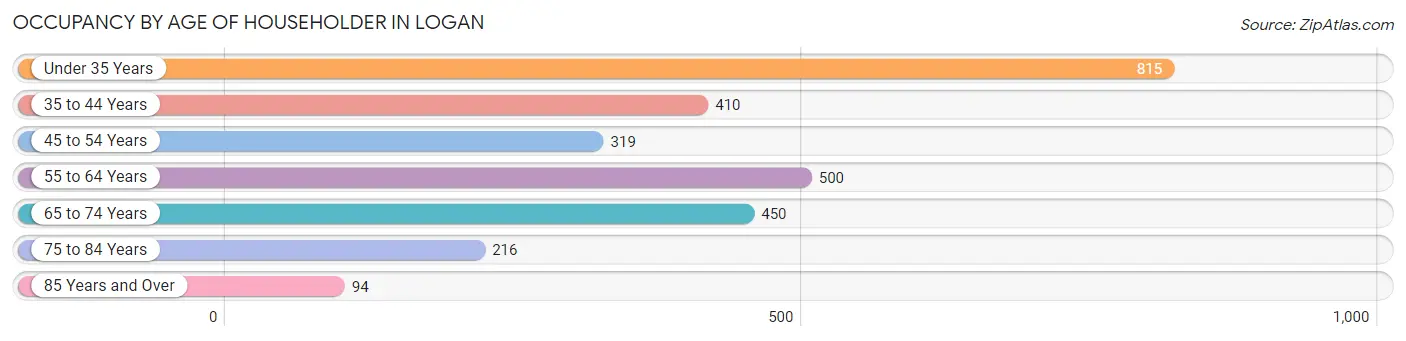
| Age Bracket | # Households | % Households |
| Under 35 Years | 815 | 29.1% |
| 35 to 44 Years | 410 | 14.6% |
| 45 to 54 Years | 319 | 11.4% |
| 55 to 64 Years | 500 | 17.8% |
| 65 to 74 Years | 450 | 16.1% |
| 75 to 84 Years | 216 | 7.7% |
| 85 Years and Over | 94 | 3.4% |
| Total | 2,804 | 100.0% |
Housing Finances in Logan
Median Income by Occupancy in Logan
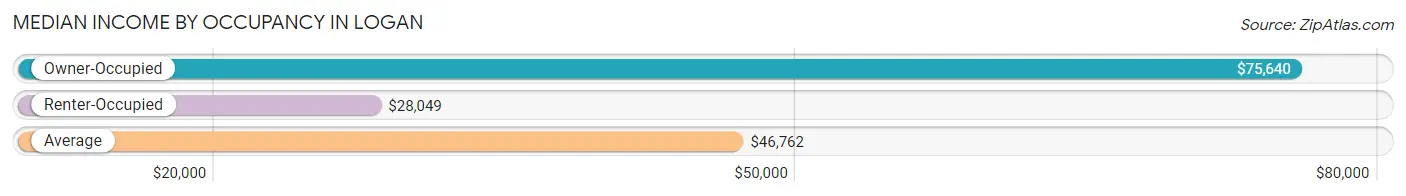
| Occupancy Type | # Households | Median Income |
| Owner-Occupied | 1,688 (60.2%) | $75,640 |
| Renter-Occupied | 1,116 (39.8%) | $28,049 |
| Average | 2,804 (100.0%) | $46,762 |
Occupancy by Householder Income Bracket in Logan
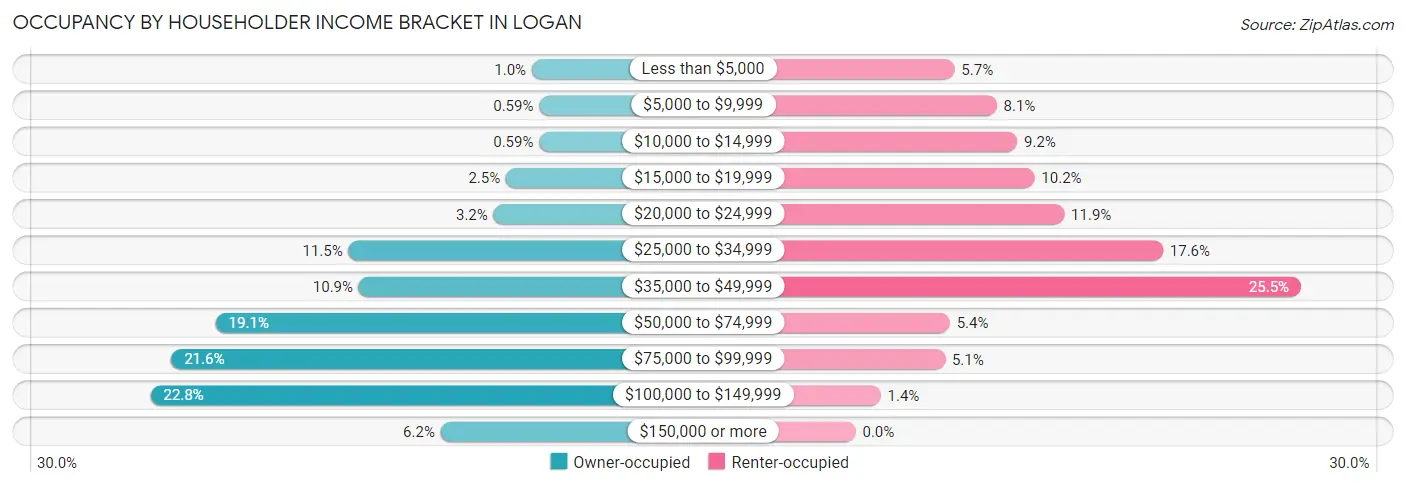
| Income Bracket | Owner-occupied | Renter-occupied |
| Less than $5,000 | 17 (1.0%) | 63 (5.7%) |
| $5,000 to $9,999 | 10 (0.6%) | 90 (8.1%) |
| $10,000 to $14,999 | 10 (0.6%) | 103 (9.2%) |
| $15,000 to $19,999 | 42 (2.5%) | 114 (10.2%) |
| $20,000 to $24,999 | 54 (3.2%) | 133 (11.9%) |
| $25,000 to $34,999 | 194 (11.5%) | 196 (17.6%) |
| $35,000 to $49,999 | 184 (10.9%) | 284 (25.5%) |
| $50,000 to $74,999 | 322 (19.1%) | 60 (5.4%) |
| $75,000 to $99,999 | 365 (21.6%) | 57 (5.1%) |
| $100,000 to $149,999 | 385 (22.8%) | 16 (1.4%) |
| $150,000 or more | 105 (6.2%) | 0 (0.0%) |
| Total | 1,688 (100.0%) | 1,116 (100.0%) |
Monthly Housing Cost Tiers in Logan
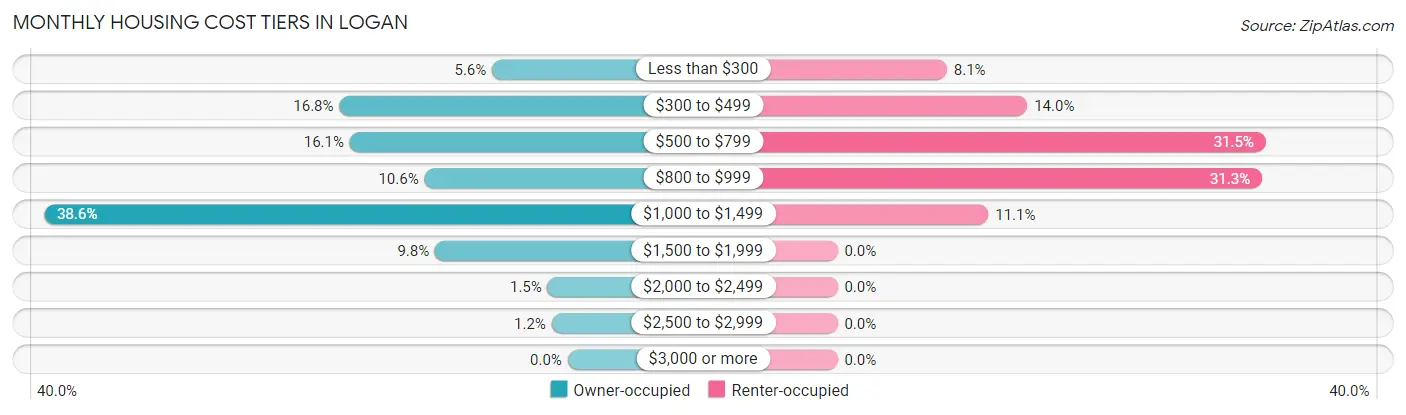
| Monthly Cost | Owner-occupied | Renter-occupied |
| Less than $300 | 94 (5.6%) | 90 (8.1%) |
| $300 to $499 | 284 (16.8%) | 156 (14.0%) |
| $500 to $799 | 271 (16.1%) | 352 (31.5%) |
| $800 to $999 | 178 (10.5%) | 349 (31.3%) |
| $1,000 to $1,499 | 651 (38.6%) | 124 (11.1%) |
| $1,500 to $1,999 | 165 (9.8%) | 0 (0.0%) |
| $2,000 to $2,499 | 25 (1.5%) | 0 (0.0%) |
| $2,500 to $2,999 | 20 (1.2%) | 0 (0.0%) |
| $3,000 or more | 0 (0.0%) | 0 (0.0%) |
| Total | 1,688 (100.0%) | 1,116 (100.0%) |
Physical Housing Characteristics in Logan
Housing Structures in Logan
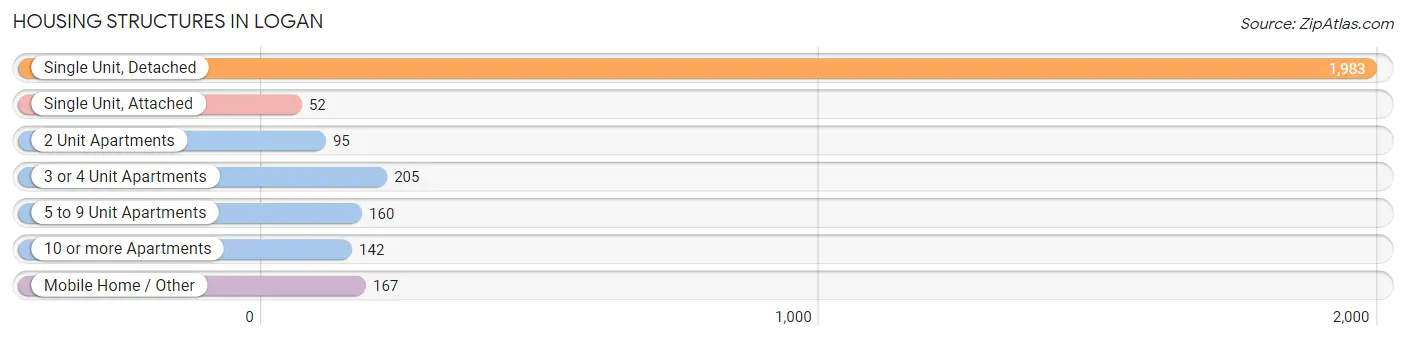
| Structure Type | # Housing Units | % Housing Units |
| Single Unit, Detached | 1,983 | 70.7% |
| Single Unit, Attached | 52 | 1.8% |
| 2 Unit Apartments | 95 | 3.4% |
| 3 or 4 Unit Apartments | 205 | 7.3% |
| 5 to 9 Unit Apartments | 160 | 5.7% |
| 10 or more Apartments | 142 | 5.1% |
| Mobile Home / Other | 167 | 6.0% |
| Total | 2,804 | 100.0% |
Housing Structures by Occupancy in Logan
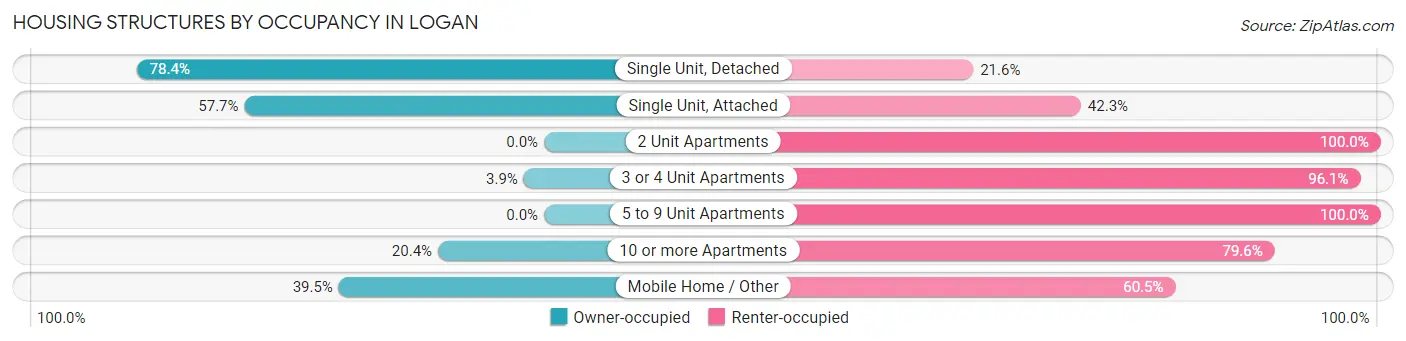
| Structure Type | Owner-occupied | Renter-occupied |
| Single Unit, Detached | 1,555 (78.4%) | 428 (21.6%) |
| Single Unit, Attached | 30 (57.7%) | 22 (42.3%) |
| 2 Unit Apartments | 0 (0.0%) | 95 (100.0%) |
| 3 or 4 Unit Apartments | 8 (3.9%) | 197 (96.1%) |
| 5 to 9 Unit Apartments | 0 (0.0%) | 160 (100.0%) |
| 10 or more Apartments | 29 (20.4%) | 113 (79.6%) |
| Mobile Home / Other | 66 (39.5%) | 101 (60.5%) |
| Total | 1,688 (60.2%) | 1,116 (39.8%) |
Housing Structures by Number of Rooms in Logan
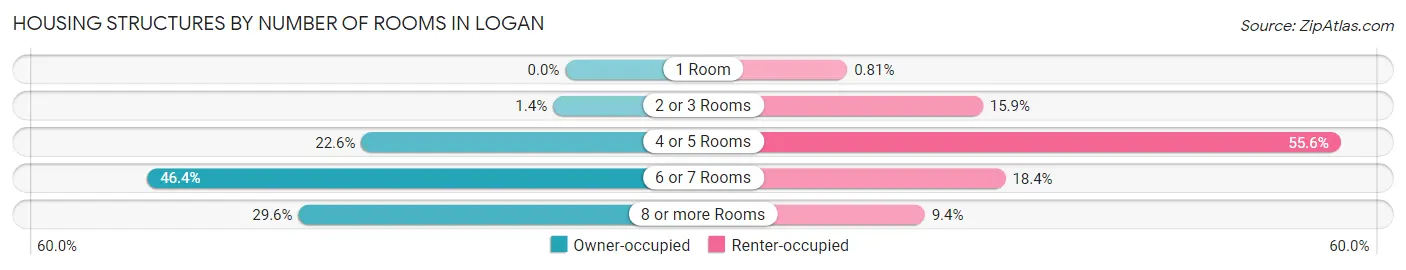
| Number of Rooms | Owner-occupied | Renter-occupied |
| 1 Room | 0 (0.0%) | 9 (0.8%) |
| 2 or 3 Rooms | 23 (1.4%) | 177 (15.9%) |
| 4 or 5 Rooms | 382 (22.6%) | 620 (55.6%) |
| 6 or 7 Rooms | 783 (46.4%) | 205 (18.4%) |
| 8 or more Rooms | 500 (29.6%) | 105 (9.4%) |
| Total | 1,688 (100.0%) | 1,116 (100.0%) |
Housing Structure by Heating Type in Logan
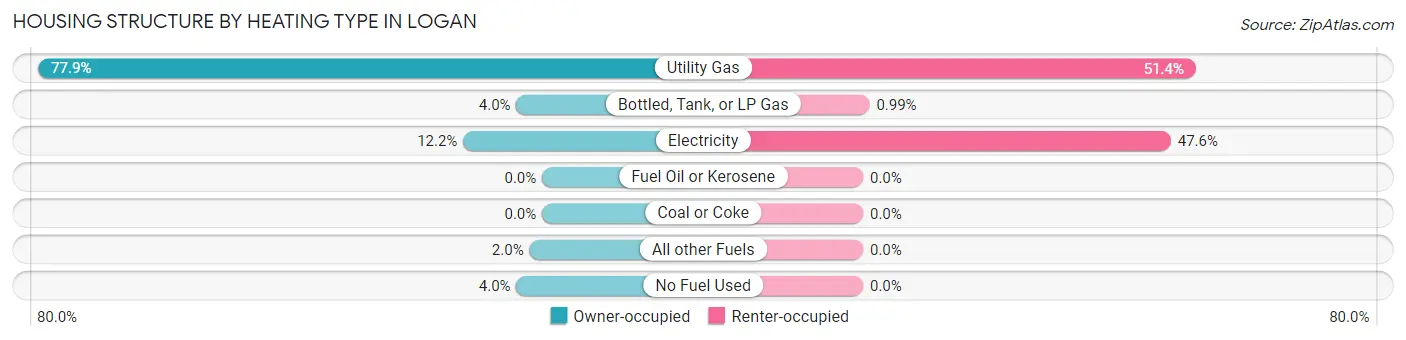
| Heating Type | Owner-occupied | Renter-occupied |
| Utility Gas | 1,315 (77.9%) | 574 (51.4%) |
| Bottled, Tank, or LP Gas | 67 (4.0%) | 11 (1.0%) |
| Electricity | 206 (12.2%) | 531 (47.6%) |
| Fuel Oil or Kerosene | 0 (0.0%) | 0 (0.0%) |
| Coal or Coke | 0 (0.0%) | 0 (0.0%) |
| All other Fuels | 33 (1.9%) | 0 (0.0%) |
| No Fuel Used | 67 (4.0%) | 0 (0.0%) |
| Total | 1,688 (100.0%) | 1,116 (100.0%) |
Household Vehicle Usage in Logan
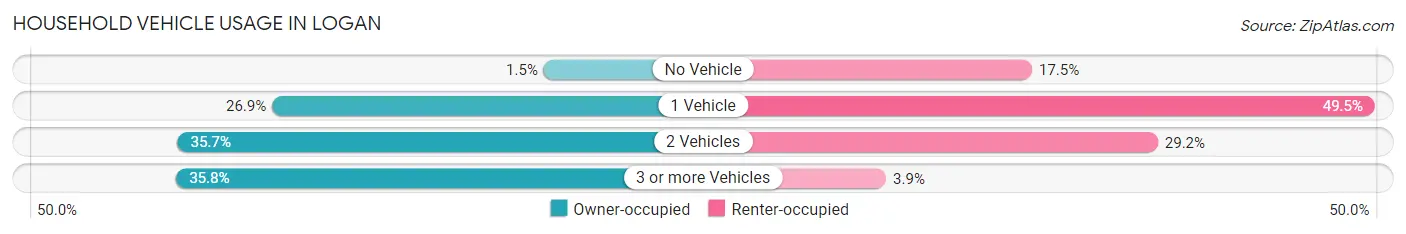
| Vehicles per Household | Owner-occupied | Renter-occupied |
| No Vehicle | 26 (1.5%) | 195 (17.5%) |
| 1 Vehicle | 454 (26.9%) | 552 (49.5%) |
| 2 Vehicles | 603 (35.7%) | 326 (29.2%) |
| 3 or more Vehicles | 605 (35.8%) | 43 (3.8%) |
| Total | 1,688 (100.0%) | 1,116 (100.0%) |
Real Estate & Mortgages in Logan
Real Estate and Mortgage Overview in Logan
| Characteristic | Without Mortgage | With Mortgage |
| Housing Units | 592 | 1,096 |
| Median Property Value | $122,300 | $147,200 |
| Median Household Income | $49,802 | $90 |
| Monthly Housing Costs | $464 | $0 |
| Real Estate Taxes | $1,274 | $30 |
Property Value by Mortgage Status in Logan
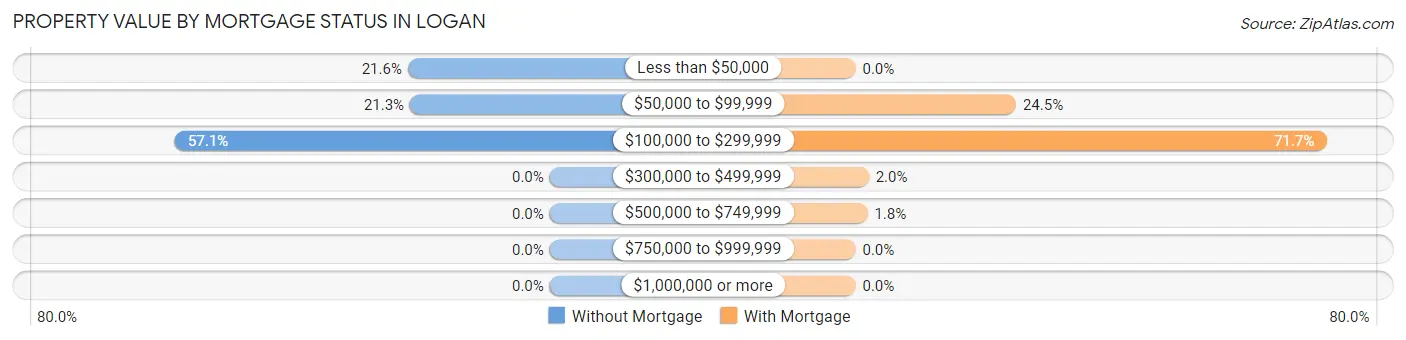
| Property Value | Without Mortgage | With Mortgage |
| Less than $50,000 | 128 (21.6%) | 0 (0.0%) |
| $50,000 to $99,999 | 126 (21.3%) | 268 (24.4%) |
| $100,000 to $299,999 | 338 (57.1%) | 786 (71.7%) |
| $300,000 to $499,999 | 0 (0.0%) | 22 (2.0%) |
| $500,000 to $749,999 | 0 (0.0%) | 20 (1.8%) |
| $750,000 to $999,999 | 0 (0.0%) | 0 (0.0%) |
| $1,000,000 or more | 0 (0.0%) | 0 (0.0%) |
| Total | 592 (100.0%) | 1,096 (100.0%) |
Household Income by Mortgage Status in Logan
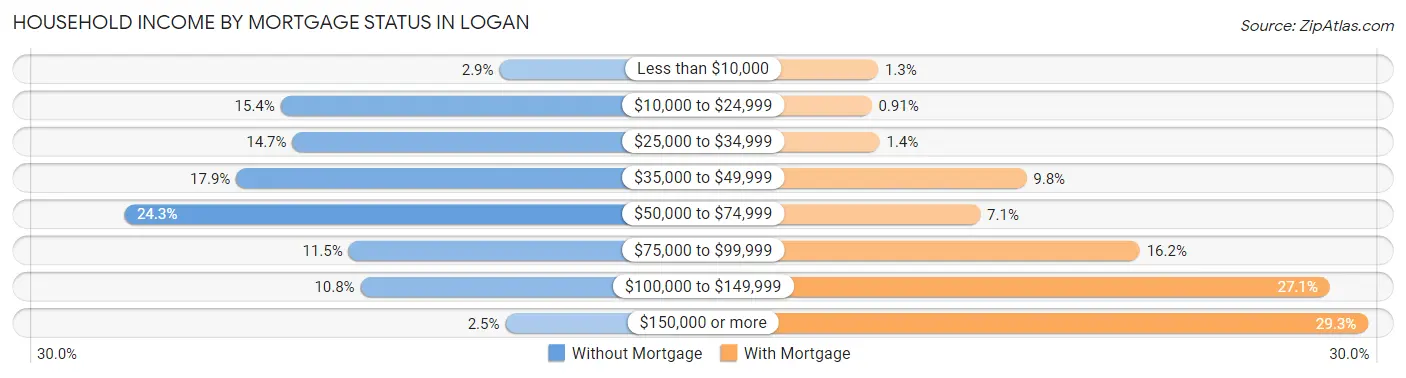
| Household Income | Without Mortgage | With Mortgage |
| Less than $10,000 | 17 (2.9%) | 14 (1.3%) |
| $10,000 to $24,999 | 91 (15.4%) | 10 (0.9%) |
| $25,000 to $34,999 | 87 (14.7%) | 15 (1.4%) |
| $35,000 to $49,999 | 106 (17.9%) | 107 (9.8%) |
| $50,000 to $74,999 | 144 (24.3%) | 78 (7.1%) |
| $75,000 to $99,999 | 68 (11.5%) | 178 (16.2%) |
| $100,000 to $149,999 | 64 (10.8%) | 297 (27.1%) |
| $150,000 or more | 15 (2.5%) | 321 (29.3%) |
| Total | 592 (100.0%) | 1,096 (100.0%) |
Property Value to Household Income Ratio in Logan
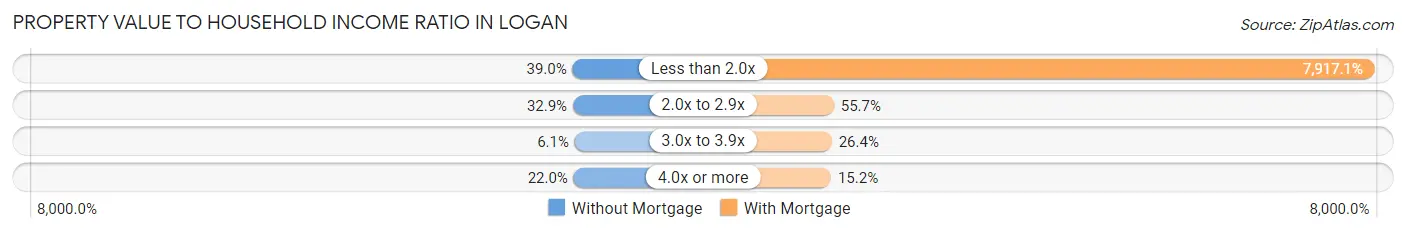
| Value-to-Income Ratio | Without Mortgage | With Mortgage |
| Less than 2.0x | 231 (39.0%) | 86,771 (7,917.1%) |
| 2.0x to 2.9x | 195 (32.9%) | 610 (55.7%) |
| 3.0x to 3.9x | 36 (6.1%) | 289 (26.4%) |
| 4.0x or more | 130 (22.0%) | 167 (15.2%) |
| Total | 592 (100.0%) | 1,096 (100.0%) |
Real Estate Taxes by Mortgage Status in Logan
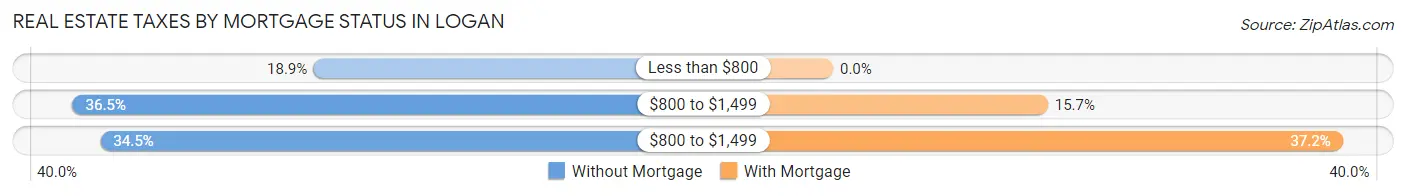
| Property Taxes | Without Mortgage | With Mortgage |
| Less than $800 | 112 (18.9%) | 0 (0.0%) |
| $800 to $1,499 | 216 (36.5%) | 172 (15.7%) |
| $800 to $1,499 | 204 (34.5%) | 408 (37.2%) |
| Total | 592 (100.0%) | 1,096 (100.0%) |
Health & Disability in Logan
Health Insurance Coverage by Age in Logan
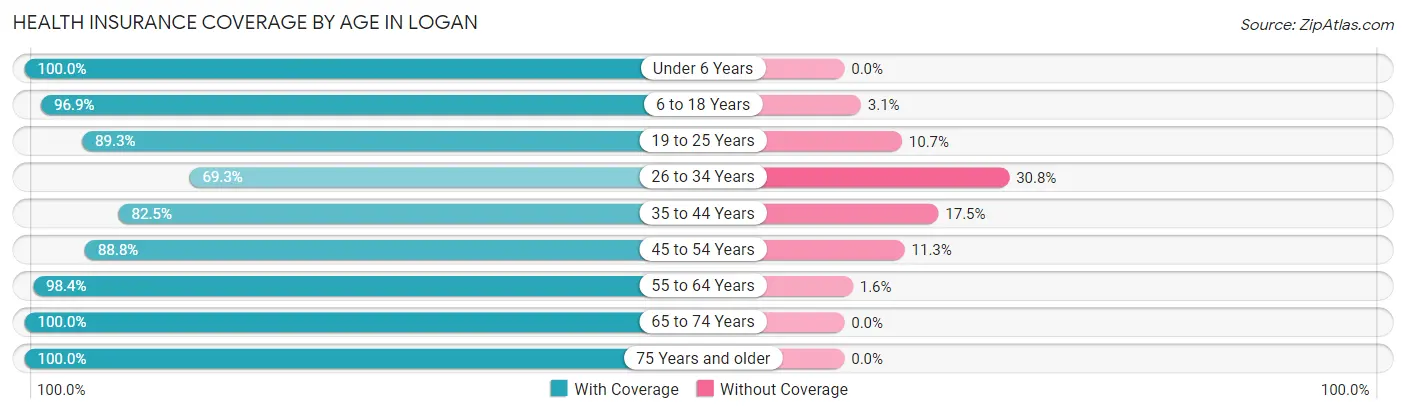
| Age Bracket | With Coverage | Without Coverage |
| Under 6 Years | 462 (100.0%) | 0 (0.0%) |
| 6 to 18 Years | 1,382 (96.9%) | 44 (3.1%) |
| 19 to 25 Years | 507 (89.3%) | 61 (10.7%) |
| 26 to 34 Years | 669 (69.3%) | 297 (30.7%) |
| 35 to 44 Years | 785 (82.5%) | 167 (17.5%) |
| 45 to 54 Years | 489 (88.7%) | 62 (11.3%) |
| 55 to 64 Years | 937 (98.4%) | 15 (1.6%) |
| 65 to 74 Years | 654 (100.0%) | 0 (0.0%) |
| 75 Years and older | 476 (100.0%) | 0 (0.0%) |
| Total | 6,361 (90.8%) | 646 (9.2%) |
Health Insurance Coverage by Citizenship Status in Logan
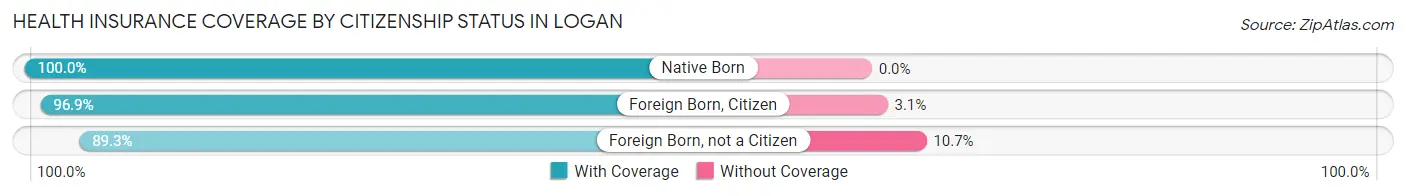
| Citizenship Status | With Coverage | Without Coverage |
| Native Born | 462 (100.0%) | 0 (0.0%) |
| Foreign Born, Citizen | 1,382 (96.9%) | 44 (3.1%) |
| Foreign Born, not a Citizen | 507 (89.3%) | 61 (10.7%) |
Health Insurance Coverage by Household Income in Logan
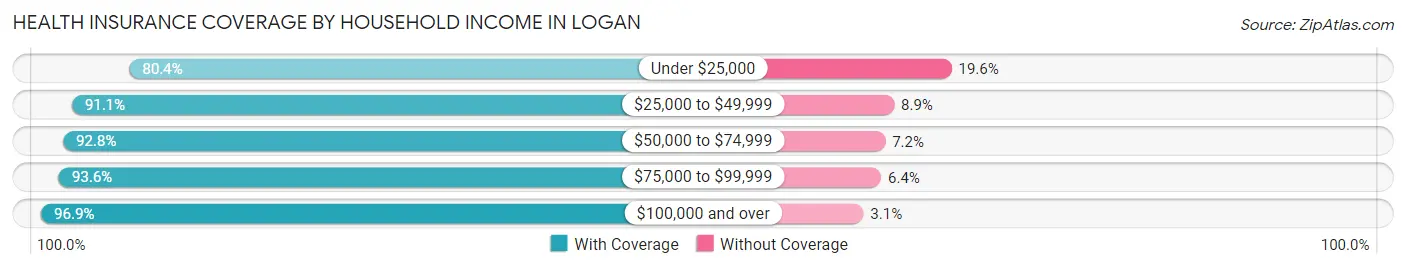
| Household Income | With Coverage | Without Coverage |
| Under $25,000 | 950 (80.4%) | 232 (19.6%) |
| $25,000 to $49,999 | 1,944 (91.1%) | 189 (8.9%) |
| $50,000 to $74,999 | 657 (92.8%) | 51 (7.2%) |
| $75,000 to $99,999 | 1,397 (93.6%) | 96 (6.4%) |
| $100,000 and over | 1,402 (96.9%) | 45 (3.1%) |
Public vs Private Health Insurance Coverage by Age in Logan
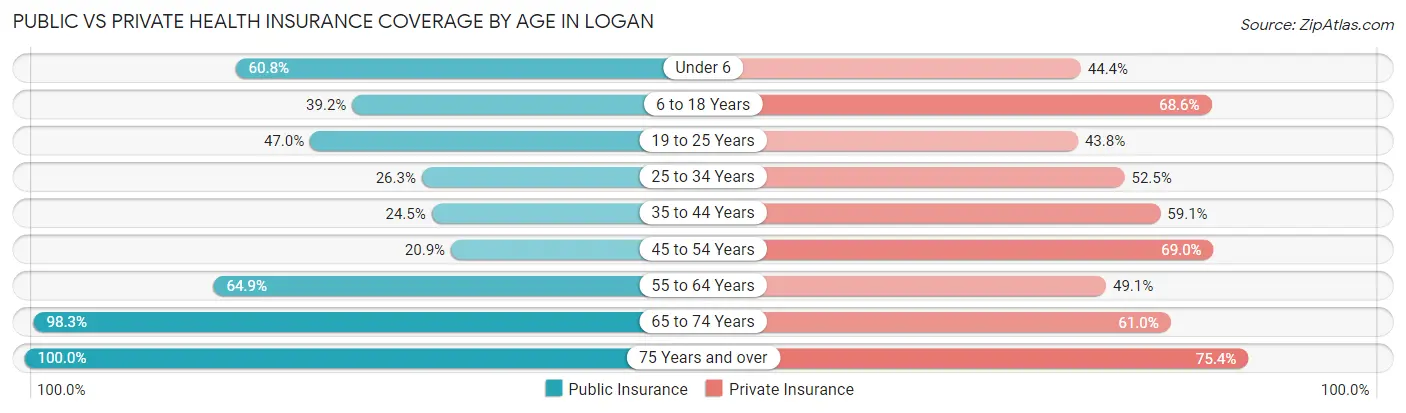
| Age Bracket | Public Insurance | Private Insurance |
| Under 6 | 281 (60.8%) | 205 (44.4%) |
| 6 to 18 Years | 559 (39.2%) | 978 (68.6%) |
| 19 to 25 Years | 267 (47.0%) | 249 (43.8%) |
| 25 to 34 Years | 254 (26.3%) | 507 (52.5%) |
| 35 to 44 Years | 233 (24.5%) | 563 (59.1%) |
| 45 to 54 Years | 115 (20.9%) | 380 (69.0%) |
| 55 to 64 Years | 618 (64.9%) | 467 (49.0%) |
| 65 to 74 Years | 643 (98.3%) | 399 (61.0%) |
| 75 Years and over | 476 (100.0%) | 359 (75.4%) |
| Total | 3,446 (49.2%) | 4,107 (58.6%) |
Disability Status by Sex by Age in Logan
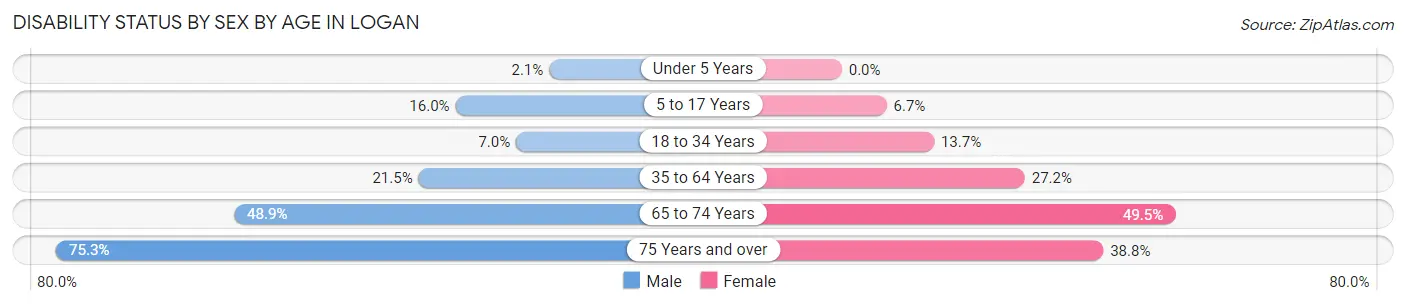
| Age Bracket | Male | Female |
| Under 5 Years | 6 (2.1%) | 0 (0.0%) |
| 5 to 17 Years | 117 (16.0%) | 45 (6.7%) |
| 18 to 34 Years | 68 (7.0%) | 88 (13.7%) |
| 35 to 64 Years | 270 (21.5%) | 326 (27.2%) |
| 65 to 74 Years | 131 (48.9%) | 191 (49.5%) |
| 75 Years and over | 180 (75.3%) | 92 (38.8%) |
Disability Class by Sex by Age in Logan
Disability Class: Hearing Difficulty
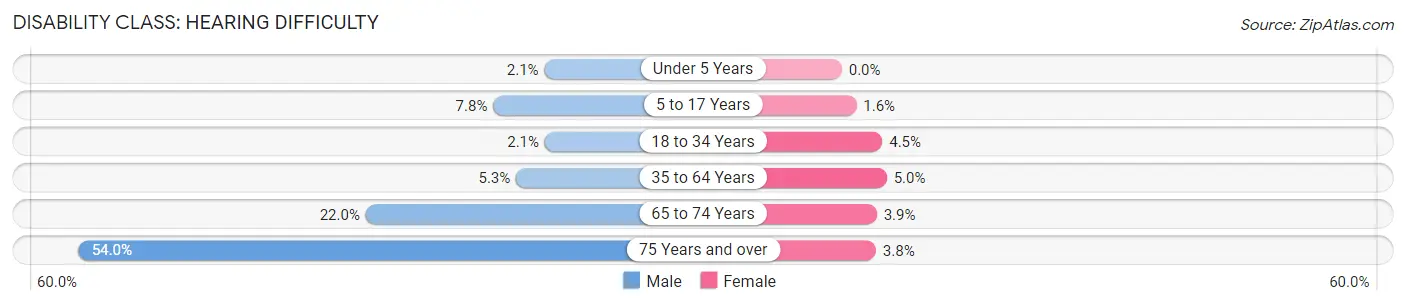
| Age Bracket | Male | Female |
| Under 5 Years | 6 (2.1%) | 0 (0.0%) |
| 5 to 17 Years | 57 (7.8%) | 11 (1.6%) |
| 18 to 34 Years | 20 (2.1%) | 29 (4.5%) |
| 35 to 64 Years | 66 (5.3%) | 60 (5.0%) |
| 65 to 74 Years | 59 (22.0%) | 15 (3.9%) |
| 75 Years and over | 129 (54.0%) | 9 (3.8%) |
Disability Class: Vision Difficulty
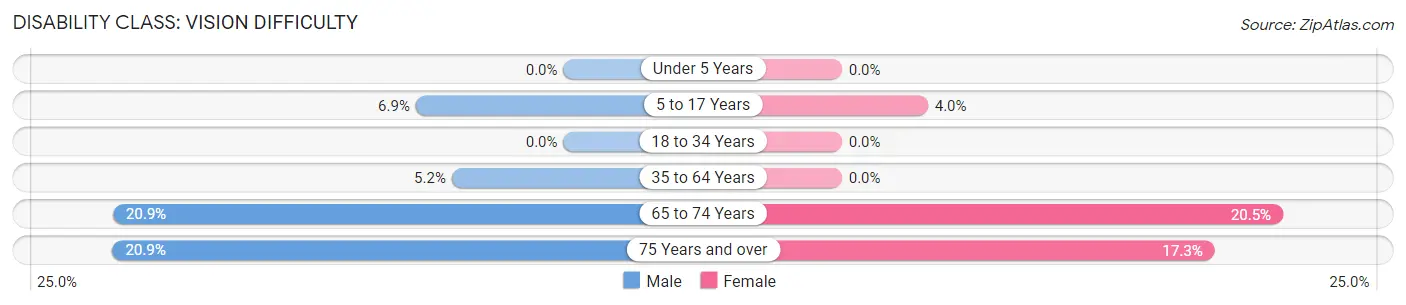
| Age Bracket | Male | Female |
| Under 5 Years | 0 (0.0%) | 0 (0.0%) |
| 5 to 17 Years | 50 (6.9%) | 27 (4.0%) |
| 18 to 34 Years | 0 (0.0%) | 0 (0.0%) |
| 35 to 64 Years | 65 (5.2%) | 0 (0.0%) |
| 65 to 74 Years | 56 (20.9%) | 79 (20.5%) |
| 75 Years and over | 50 (20.9%) | 41 (17.3%) |
Disability Class: Cognitive Difficulty
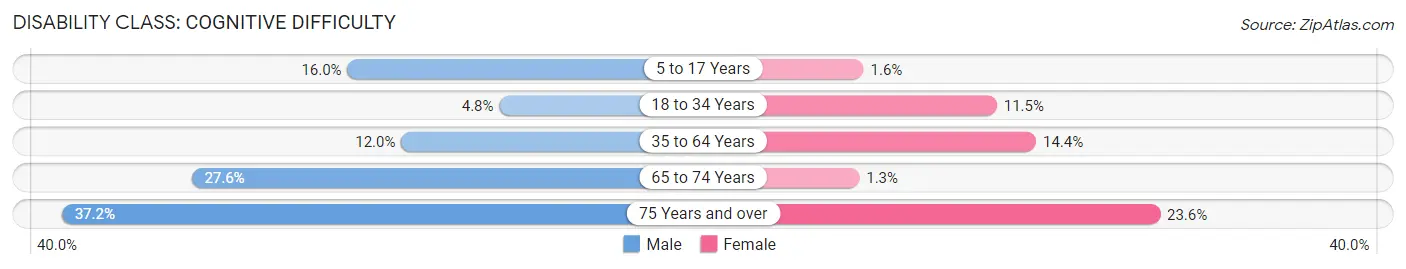
| Age Bracket | Male | Female |
| 5 to 17 Years | 117 (16.0%) | 11 (1.6%) |
| 18 to 34 Years | 46 (4.8%) | 74 (11.5%) |
| 35 to 64 Years | 151 (12.0%) | 173 (14.4%) |
| 65 to 74 Years | 74 (27.6%) | 5 (1.3%) |
| 75 Years and over | 89 (37.2%) | 56 (23.6%) |
Disability Class: Ambulatory Difficulty
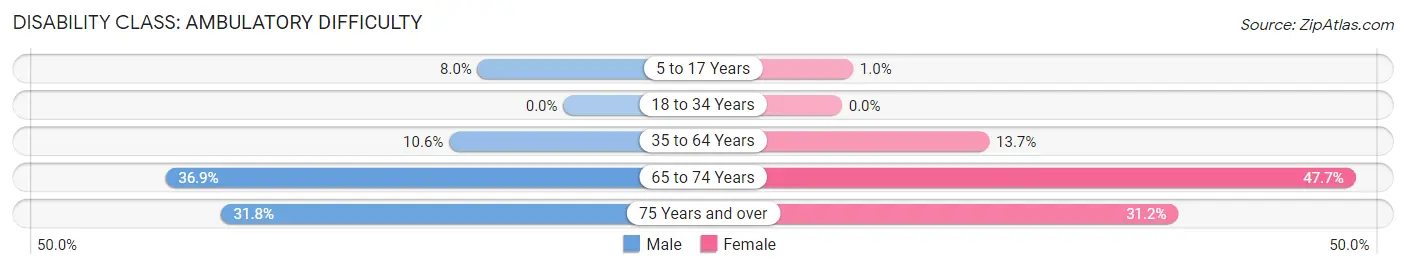
| Age Bracket | Male | Female |
| 5 to 17 Years | 58 (8.0%) | 7 (1.0%) |
| 18 to 34 Years | 0 (0.0%) | 0 (0.0%) |
| 35 to 64 Years | 133 (10.6%) | 164 (13.7%) |
| 65 to 74 Years | 99 (36.9%) | 184 (47.7%) |
| 75 Years and over | 76 (31.8%) | 74 (31.2%) |
Disability Class: Self-Care Difficulty
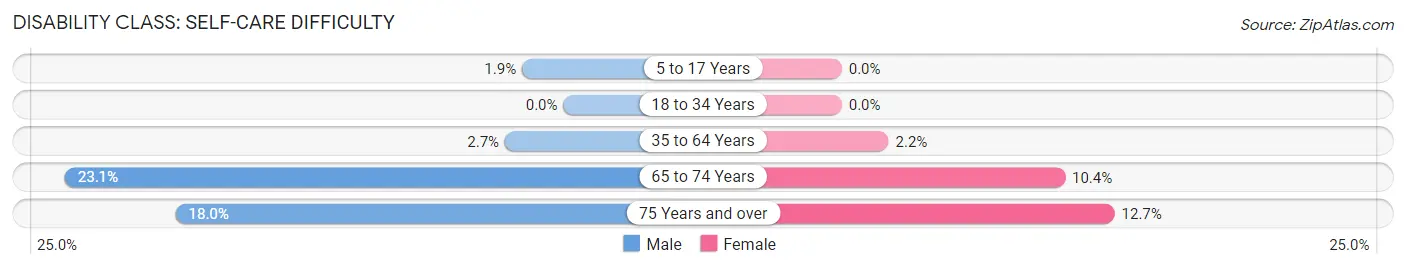
| Age Bracket | Male | Female |
| 5 to 17 Years | 14 (1.9%) | 0 (0.0%) |
| 18 to 34 Years | 0 (0.0%) | 0 (0.0%) |
| 35 to 64 Years | 34 (2.7%) | 26 (2.2%) |
| 65 to 74 Years | 62 (23.1%) | 40 (10.4%) |
| 75 Years and over | 43 (18.0%) | 30 (12.7%) |
Technology Access in Logan
Computing Device Access in Logan
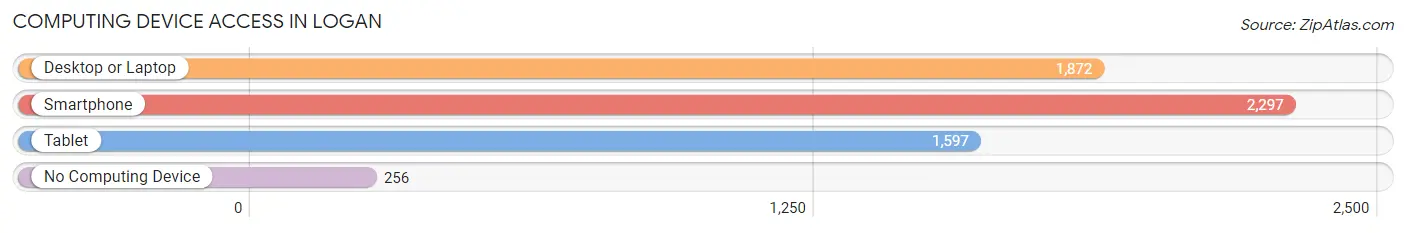
| Device Type | # Households | % Households |
| Desktop or Laptop | 1,872 | 66.8% |
| Smartphone | 2,297 | 81.9% |
| Tablet | 1,597 | 57.0% |
| No Computing Device | 256 | 9.1% |
| Total | 2,804 | 100.0% |
Internet Access in Logan
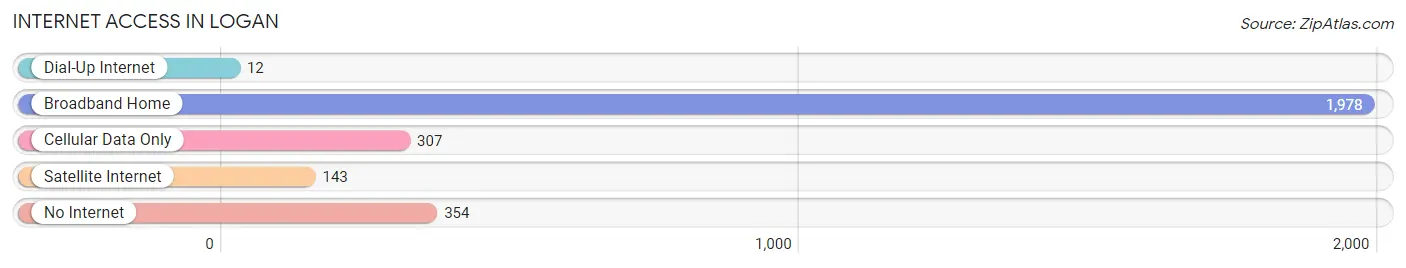
| Internet Type | # Households | % Households |
| Dial-Up Internet | 12 | 0.4% |
| Broadband Home | 1,978 | 70.5% |
| Cellular Data Only | 307 | 11.0% |
| Satellite Internet | 143 | 5.1% |
| No Internet | 354 | 12.6% |
| Total | 2,804 | 100.0% |
Logan Summary
Logan, Ohio is a small city located in Hocking County, Ohio. It is situated in the southeastern part of the state, approximately 50 miles southeast of Columbus. The city is home to a population of approximately 8,000 people, and is the county seat of Hocking County.
History
Logan was founded in 1816 by a group of settlers from Virginia, led by General William Logan. The city was named after General Logan, who was a veteran of the Revolutionary War. The city was originally known as “Logan’s Station”, and was the first settlement in Hocking County.
In 1817, the first post office was established in Logan, and the city was officially incorporated in 1831. During the 19th century, Logan was a major center for the production of iron and coal. The city was also home to several glass factories, which produced a variety of glass products.
Geography
Logan is located in southeastern Ohio, approximately 50 miles southeast of Columbus. The city is situated in the Hocking Valley, which is a region of rolling hills and valleys. The city is located on the banks of the Hocking River, which is a tributary of the Ohio River.
The city has a total area of 4.2 square miles, of which 4.1 square miles is land and 0.1 square miles is water. The city is located at an elevation of 890 feet above sea level.
Economy
Logan’s economy is largely based on manufacturing and agriculture. The city is home to several manufacturing companies, including a glass factory, a paper mill, and a steel mill. The city is also home to several agricultural businesses, including dairy farms, poultry farms, and vegetable farms.
The city is also home to several retail stores, restaurants, and other businesses. The city is served by the Hocking Valley Railroad, which provides freight and passenger service to the city.
Demographics
As of the 2010 census, the population of Logan was 8,152. The racial makeup of the city was 95.3% White, 1.2% African American, 0.3% Native American, 0.4% Asian, 0.1% Pacific Islander, 0.7% from other races, and 1.9% from two or more races. Hispanic or Latino of any race were 2.2% of the population.
The median income for a household in the city was $31,944, and the median income for a family was $41,944. The per capita income for the city was $17,845. About 16.2% of families and 19.2% of the population were below the poverty line, including 28.2% of those under age 18 and 8.2% of those age 65 or over.
Logan is a small city with a rich history and a diverse economy. The city is home to a variety of businesses, including manufacturing, agriculture, and retail. The city is also home to a diverse population, with a variety of racial and ethnic backgrounds. Logan is a great place to live, work, and visit.
Common Questions
What is Per Capita Income in Logan?
Per Capita income in Logan is $25,928.
What is the Median Family Income in Logan?
Median Family Income in Logan is $51,043.
What is the Median Household income in Logan?
Median Household Income in Logan is $46,762.
What is Income or Wage Gap in Logan?
Income or Wage Gap in Logan is 38.4%.
Women in Logan earn 61.6 cents for every dollar earned by a man.
What is Family Income Deficit in Logan?
Family Income Deficit in Logan is $11,632.
Families that are below poverty line in Logan earn $11,632 less on average than the poverty threshold level.
What is Inequality or Gini Index in Logan?
Inequality or Gini Index in Logan is 0.43.
What is the Total Population of Logan?
Total Population of Logan is 7,168.
What is the Total Male Population of Logan?
Total Male Population of Logan is 3,829.
What is the Total Female Population of Logan?
Total Female Population of Logan is 3,339.
What is the Ratio of Males per 100 Females in Logan?
There are 114.68 Males per 100 Females in Logan.
What is the Ratio of Females per 100 Males in Logan?
There are 87.20 Females per 100 Males in Logan.
What is the Median Population Age in Logan?
Median Population Age in Logan is 37.2 Years.
What is the Average Family Size in Logan
Average Family Size in Logan is 2.8 People.
What is the Average Household Size in Logan
Average Household Size in Logan is 2.5 People.
How Large is the Labor Force in Logan?
There are 3,097 People in the Labor Forcein in Logan.
What is the Percentage of People in the Labor Force in Logan?
56.2% of People are in the Labor Force in Logan.
What is the Unemployment Rate in Logan?
Unemployment Rate in Logan is 3.0%.