Leipsic, OH Map & Demographics
Leipsic Map
Leipsic Overview
$26,154
PER CAPITA INCOME
$69,375
AVG FAMILY INCOME
$59,750
AVG HOUSEHOLD INCOME
8.3%
WAGE / INCOME GAP [ % ]
91.7¢/ $1
WAGE / INCOME GAP [ $ ]
0.39
INEQUALITY / GINI INDEX
2,215
TOTAL POPULATION
1,236
MALE POPULATION
979
FEMALE POPULATION
126.25
MALES / 100 FEMALES
79.21
FEMALES / 100 MALES
31.0
MEDIAN AGE
3.3
AVG FAMILY SIZE
2.8
AVG HOUSEHOLD SIZE
1,131
LABOR FORCE [ PEOPLE ]
68.9%
PERCENT IN LABOR FORCE
3.1%
UNEMPLOYMENT RATE
Leipsic Zip Codes
Leipsic Area Codes
Income in Leipsic
Income Overview in Leipsic
Per Capita Income in Leipsic is $26,154, while median incomes of families and households are $69,375 and $59,750 respectively.
| Characteristic | Number | Measure |
| Per Capita Income | 2,215 | $26,154 |
| Median Family Income | 551 | $69,375 |
| Mean Family Income | 551 | $84,523 |
| Median Household Income | 761 | $59,750 |
| Mean Household Income | 761 | $74,618 |
| Income Deficit | 551 | $0 |
| Wage / Income Gap (%) | 2,215 | 8.29% |
| Wage / Income Gap ($) | 2,215 | 91.71¢ per $1 |
| Gini / Inequality Index | 2,215 | 0.39 |
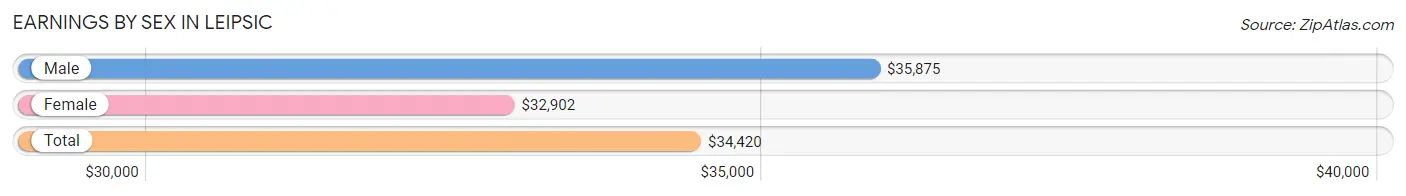
Earnings by Sex in Leipsic
Average Earnings in Leipsic are $34,420, $35,875 for men and $32,902 for women, a difference of 8.3%.
| Sex | Number | Average Earnings |
| Male | 671 (58.5%) | $35,875 |
| Female | 477 (41.5%) | $32,902 |
| Total | 1,148 (100.0%) | $34,420 |
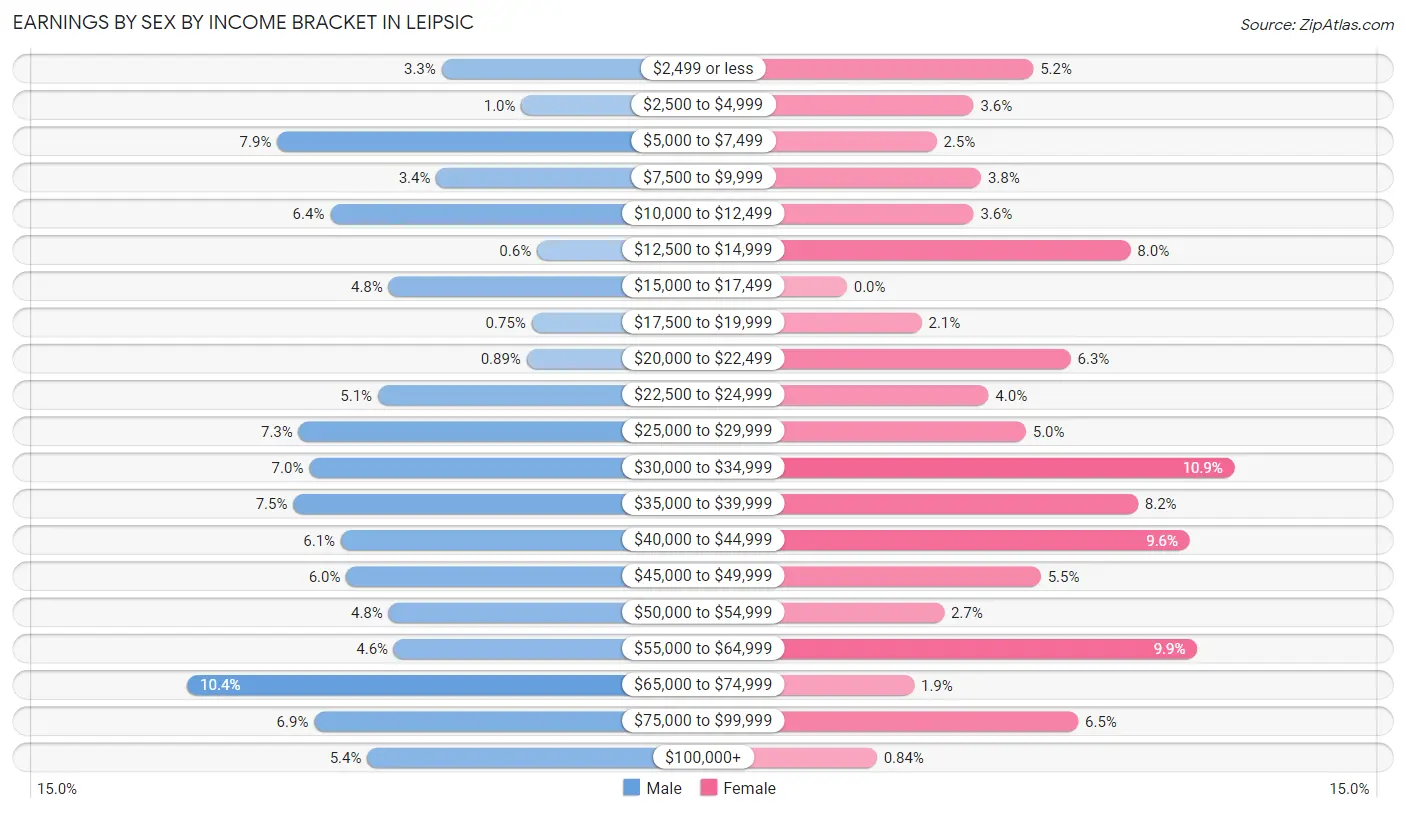
Earnings by Sex by Income Bracket in Leipsic
The most common earnings brackets in Leipsic are $65,000 to $74,999 for men (70 | 10.4%) and $30,000 to $34,999 for women (52 | 10.9%).
| Income | Male | Female |
| $2,499 or less | 22 (3.3%) | 25 (5.2%) |
| $2,500 to $4,999 | 7 (1.0%) | 17 (3.6%) |
| $5,000 to $7,499 | 53 (7.9%) | 12 (2.5%) |
| $7,500 to $9,999 | 23 (3.4%) | 18 (3.8%) |
| $10,000 to $12,499 | 43 (6.4%) | 17 (3.6%) |
| $12,500 to $14,999 | 4 (0.6%) | 38 (8.0%) |
| $15,000 to $17,499 | 32 (4.8%) | 0 (0.0%) |
| $17,500 to $19,999 | 5 (0.7%) | 10 (2.1%) |
| $20,000 to $22,499 | 6 (0.9%) | 30 (6.3%) |
| $22,500 to $24,999 | 34 (5.1%) | 19 (4.0%) |
| $25,000 to $29,999 | 49 (7.3%) | 24 (5.0%) |
| $30,000 to $34,999 | 47 (7.0%) | 52 (10.9%) |
| $35,000 to $39,999 | 50 (7.4%) | 39 (8.2%) |
| $40,000 to $44,999 | 41 (6.1%) | 46 (9.6%) |
| $45,000 to $49,999 | 40 (6.0%) | 26 (5.4%) |
| $50,000 to $54,999 | 32 (4.8%) | 13 (2.7%) |
| $55,000 to $64,999 | 31 (4.6%) | 47 (9.9%) |
| $65,000 to $74,999 | 70 (10.4%) | 9 (1.9%) |
| $75,000 to $99,999 | 46 (6.9%) | 31 (6.5%) |
| $100,000+ | 36 (5.4%) | 4 (0.8%) |
| Total | 671 (100.0%) | 477 (100.0%) |
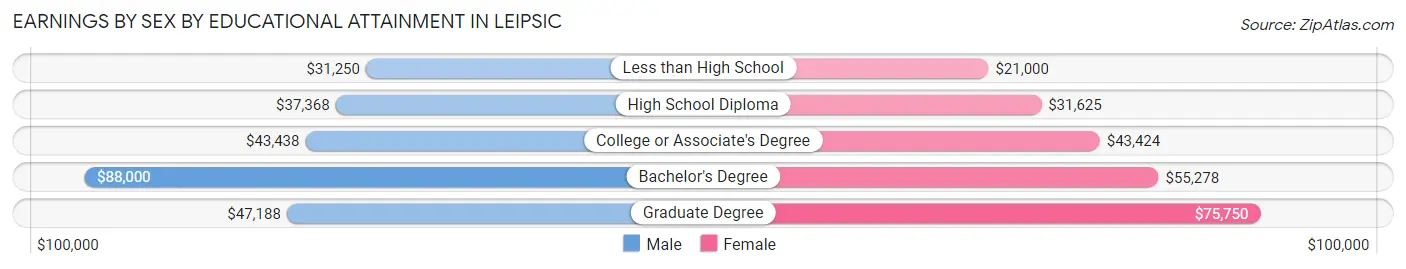
Earnings by Sex by Educational Attainment in Leipsic
Average earnings in Leipsic are $40,298 for men and $38,988 for women, a difference of 3.3%. Men with an educational attainment of bachelor's degree enjoy the highest average annual earnings of $88,000, while those with less than high school education earn the least with $31,250. Women with an educational attainment of graduate degree earn the most with the average annual earnings of $75,750, while those with less than high school education have the smallest earnings of $21,000.
| Educational Attainment | Male Income | Female Income |
| Less than High School | $31,250 | $21,000 |
| High School Diploma | $37,368 | $31,625 |
| College or Associate's Degree | $43,438 | $43,424 |
| Bachelor's Degree | $88,000 | $55,278 |
| Graduate Degree | $47,188 | $75,750 |
| Total | $40,298 | $38,988 |
Family Income in Leipsic
Family Income Brackets in Leipsic
According to the Leipsic family income data, there are 121 families falling into the $100,000 to $149,999 income range, which is the most common income bracket and makes up 22.0% of all families.
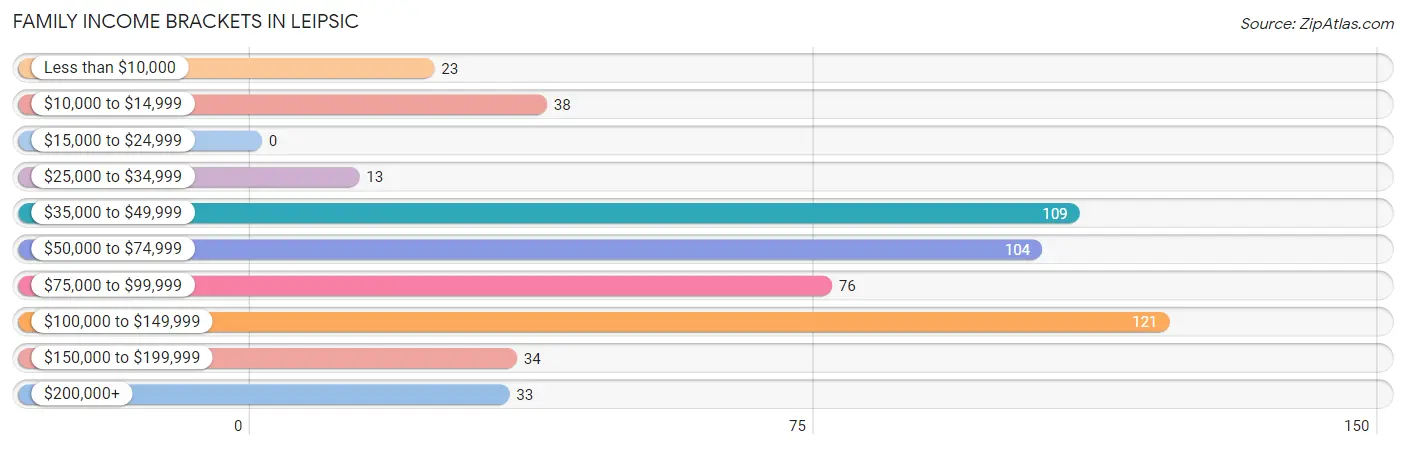
| Income Bracket | # Families | % Families |
| Less than $10,000 | 23 | 4.2% |
| $10,000 to $14,999 | 38 | 6.9% |
| $15,000 to $24,999 | 0 | 0.0% |
| $25,000 to $34,999 | 13 | 2.4% |
| $35,000 to $49,999 | 109 | 19.8% |
| $50,000 to $74,999 | 104 | 18.9% |
| $75,000 to $99,999 | 76 | 13.8% |
| $100,000 to $149,999 | 121 | 22.0% |
| $150,000 to $199,999 | 34 | 6.2% |
| $200,000+ | 33 | 6.0% |
Family Income by Famaliy Size in Leipsic
4-person families (97 | 17.6%) account for the highest median family income in Leipsic with $132,974 per family, while 4-person families (97 | 17.6%) have the highest median income of $33,244 per family member.
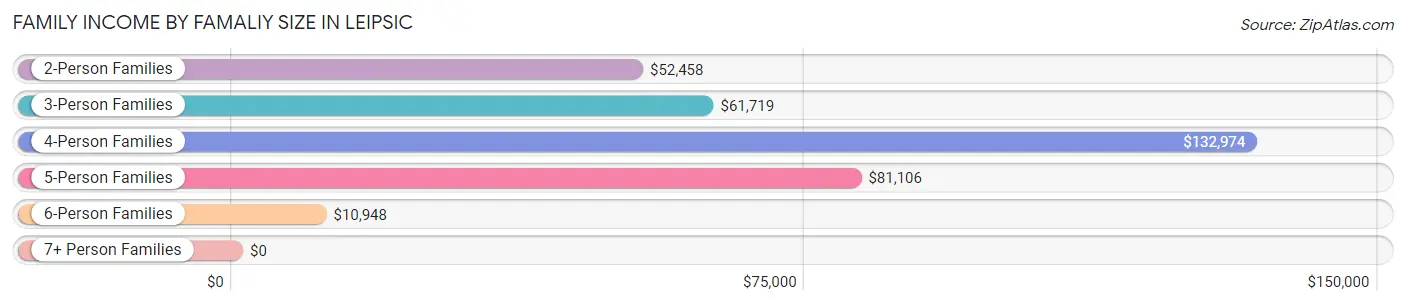
| Income Bracket | # Families | Median Income |
| 2-Person Families | 203 (36.8%) | $52,458 |
| 3-Person Families | 122 (22.1%) | $61,719 |
| 4-Person Families | 97 (17.6%) | $132,974 |
| 5-Person Families | 65 (11.8%) | $81,106 |
| 6-Person Families | 60 (10.9%) | $10,948 |
| 7+ Person Families | 4 (0.7%) | $0 |
| Total | 551 (100.0%) | $69,375 |
Family Income by Number of Earners in Leipsic
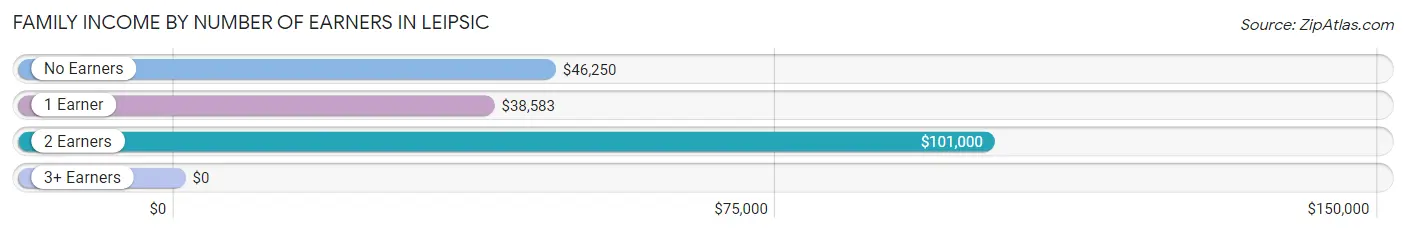
| Number of Earners | # Families | Median Income |
| No Earners | 48 (8.7%) | $46,250 |
| 1 Earner | 173 (31.4%) | $38,583 |
| 2 Earners | 240 (43.6%) | $101,000 |
| 3+ Earners | 90 (16.3%) | $0 |
| Total | 551 (100.0%) | $69,375 |
Household Income in Leipsic
Household Income Brackets in Leipsic
With 172 households falling in the category, the $50,000 to $74,999 income range is the most frequent in Leipsic, accounting for 22.6% of all households. In contrast, only 33 households (4.3%) fall into the $200,000+ income bracket, making it the least populous group.
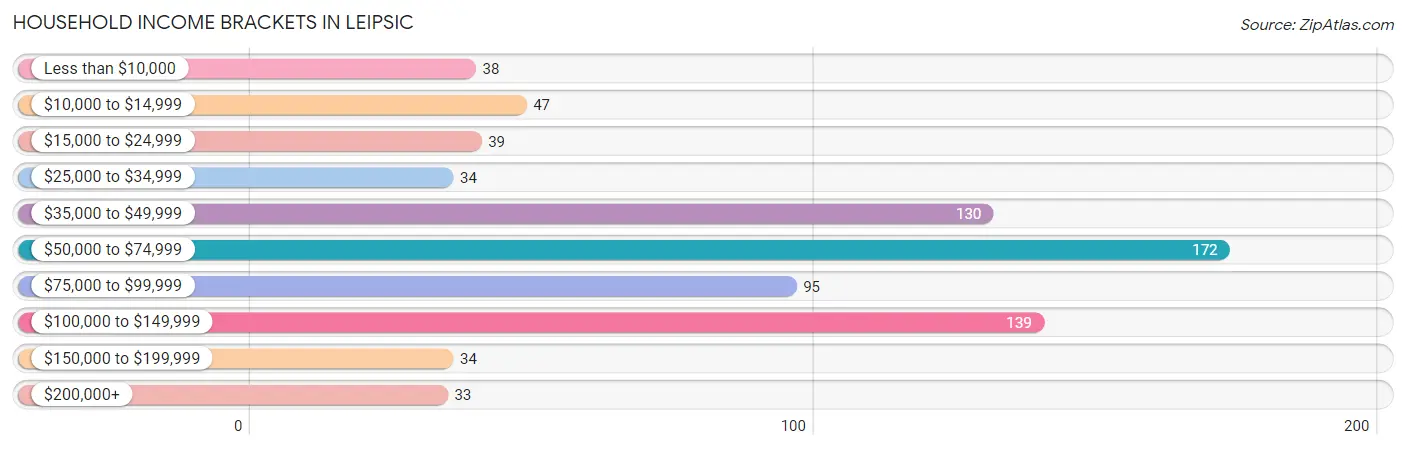
| Income Bracket | # Households | % Households |
| Less than $10,000 | 38 | 5.0% |
| $10,000 to $14,999 | 47 | 6.2% |
| $15,000 to $24,999 | 39 | 5.1% |
| $25,000 to $34,999 | 34 | 4.5% |
| $35,000 to $49,999 | 130 | 17.1% |
| $50,000 to $74,999 | 172 | 22.6% |
| $75,000 to $99,999 | 95 | 12.5% |
| $100,000 to $149,999 | 139 | 18.3% |
| $150,000 to $199,999 | 34 | 4.5% |
| $200,000+ | 33 | 4.3% |
Household Income by Householder Age in Leipsic
The median household income in Leipsic is $59,750, with the highest median household income of $74,722 found in the 45 to 64 years age bracket for the primary householder. A total of 264 households (34.7%) fall into this category. Meanwhile, the 25 to 44 years age bracket for the primary householder has the lowest median household income of $0, with 247 households (32.5%) in this group.
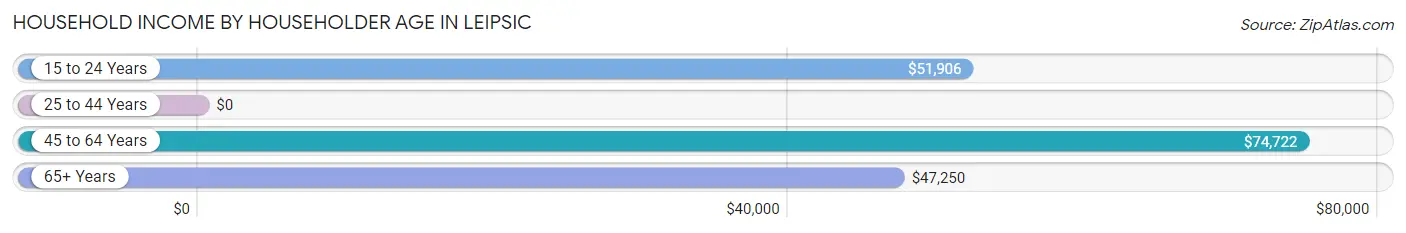
| Income Bracket | # Households | Median Income |
| 15 to 24 Years | 61 (8.0%) | $51,906 |
| 25 to 44 Years | 247 (32.5%) | $0 |
| 45 to 64 Years | 264 (34.7%) | $74,722 |
| 65+ Years | 189 (24.8%) | $47,250 |
| Total | 761 (100.0%) | $59,750 |
Poverty in Leipsic
Income Below Poverty by Sex and Age in Leipsic
With 25.1% poverty level for males and 15.0% for females among the residents of Leipsic, 16 and 17 year old males and under 5 year old females are the most vulnerable to poverty, with 12 males (66.7%) and 45 females (44.6%) in their respective age groups living below the poverty level.
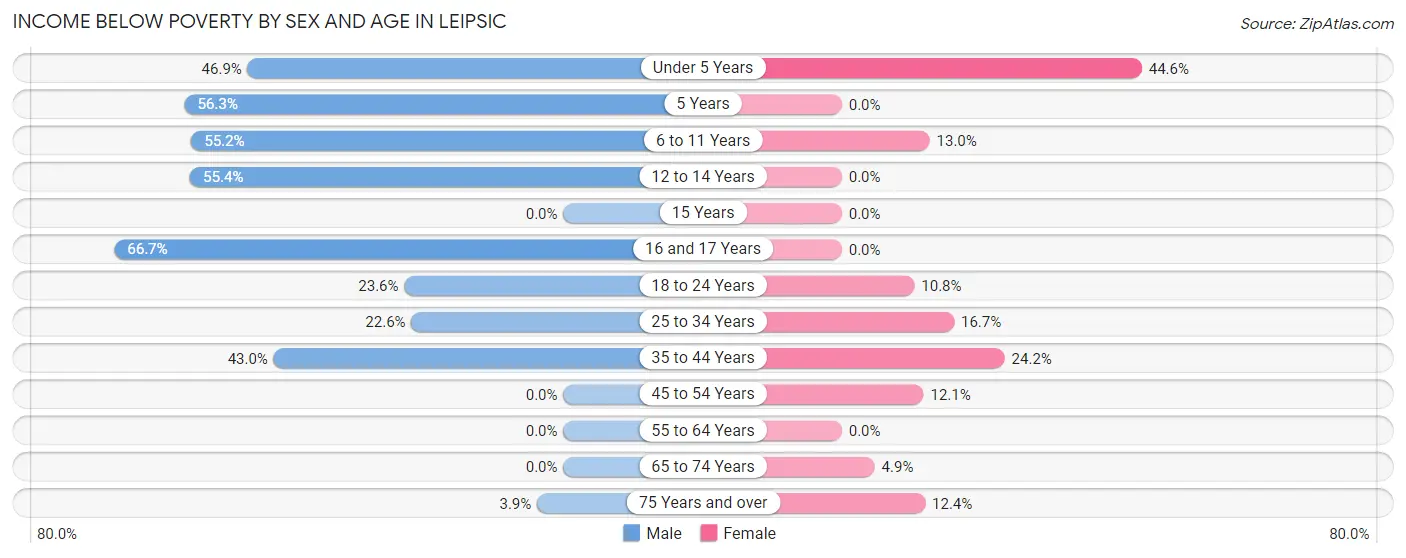
| Age Bracket | Male | Female |
| Under 5 Years | 45 (46.9%) | 45 (44.6%) |
| 5 Years | 27 (56.2%) | 0 (0.0%) |
| 6 to 11 Years | 58 (55.2%) | 12 (13.0%) |
| 12 to 14 Years | 41 (55.4%) | 0 (0.0%) |
| 15 Years | 0 (0.0%) | 0 (0.0%) |
| 16 and 17 Years | 12 (66.7%) | 0 (0.0%) |
| 18 to 24 Years | 34 (23.6%) | 11 (10.8%) |
| 25 to 34 Years | 44 (22.6%) | 16 (16.7%) |
| 35 to 44 Years | 40 (43.0%) | 22 (24.2%) |
| 45 to 54 Years | 0 (0.0%) | 17 (12.1%) |
| 55 to 64 Years | 0 (0.0%) | 0 (0.0%) |
| 65 to 74 Years | 0 (0.0%) | 4 (4.9%) |
| 75 Years and over | 3 (3.9%) | 12 (12.4%) |
| Total | 304 (25.1%) | 139 (15.0%) |
Income Above Poverty by Sex and Age in Leipsic
According to the poverty statistics in Leipsic, males aged 15 years and females aged 5 years are the age groups that are most secure financially, with 100.0% of males and 100.0% of females in these age groups living above the poverty line.
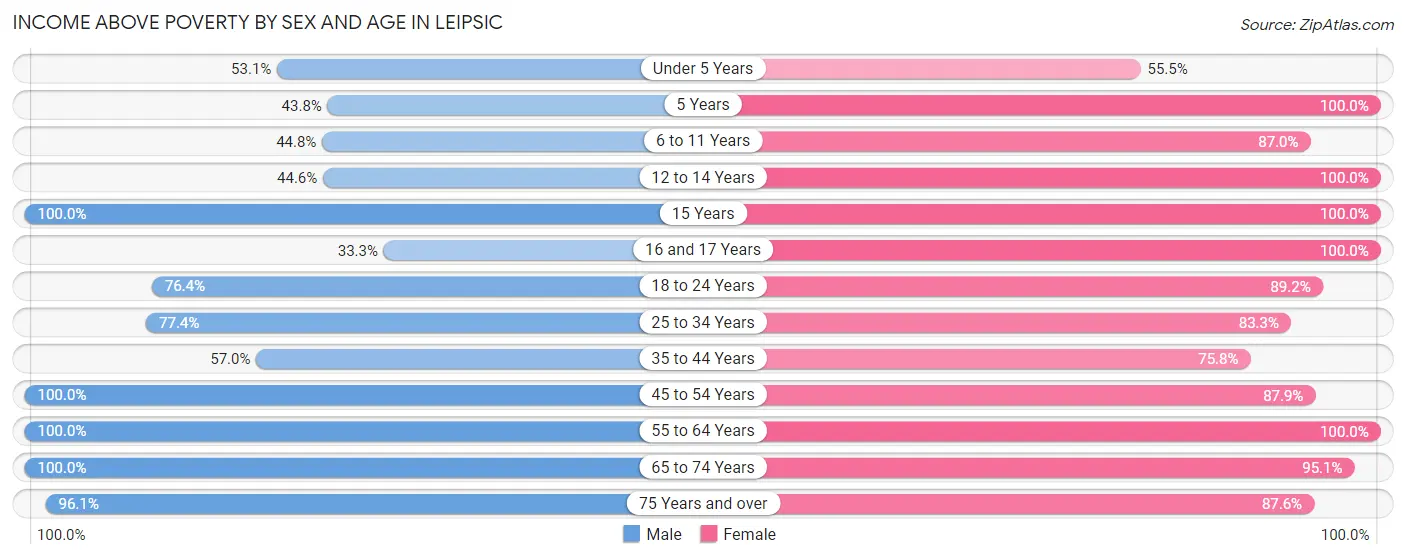
| Age Bracket | Male | Female |
| Under 5 Years | 51 (53.1%) | 56 (55.4%) |
| 5 Years | 21 (43.8%) | 6 (100.0%) |
| 6 to 11 Years | 47 (44.8%) | 80 (87.0%) |
| 12 to 14 Years | 33 (44.6%) | 14 (100.0%) |
| 15 Years | 5 (100.0%) | 8 (100.0%) |
| 16 and 17 Years | 6 (33.3%) | 30 (100.0%) |
| 18 to 24 Years | 110 (76.4%) | 91 (89.2%) |
| 25 to 34 Years | 151 (77.4%) | 80 (83.3%) |
| 35 to 44 Years | 53 (57.0%) | 69 (75.8%) |
| 45 to 54 Years | 145 (100.0%) | 123 (87.9%) |
| 55 to 64 Years | 117 (100.0%) | 65 (100.0%) |
| 65 to 74 Years | 92 (100.0%) | 78 (95.1%) |
| 75 Years and over | 74 (96.1%) | 85 (87.6%) |
| Total | 905 (74.9%) | 785 (85.0%) |
Income Below Poverty Among Married-Couple Families in Leipsic
The poverty statistics for married-couple families in Leipsic show that 15.7% or 70 of the total 446 families live below the poverty line. Families with 3 or 4 children have the highest poverty rate of 48.0%, comprising of 48 families. On the other hand, families with no children have the lowest poverty rate of 0.0%, which includes 0 families.
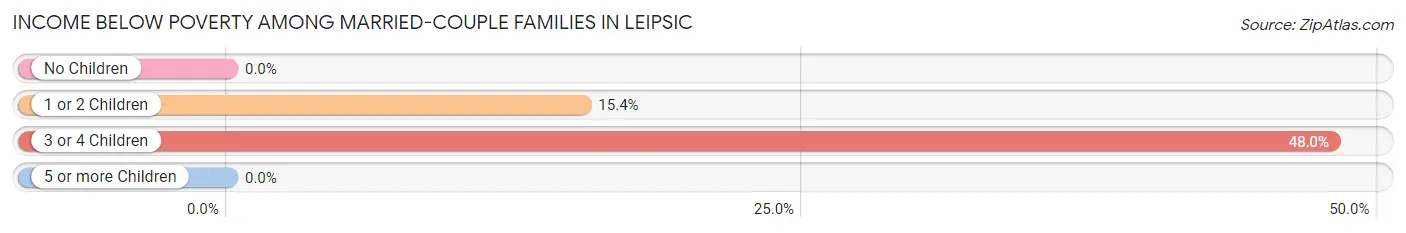
| Children | Above Poverty | Below Poverty |
| No Children | 199 (100.0%) | 0 (0.0%) |
| 1 or 2 Children | 121 (84.6%) | 22 (15.4%) |
| 3 or 4 Children | 52 (52.0%) | 48 (48.0%) |
| 5 or more Children | 4 (100.0%) | 0 (0.0%) |
| Total | 376 (84.3%) | 70 (15.7%) |
Income Below Poverty Among Single-Parent Households in Leipsic
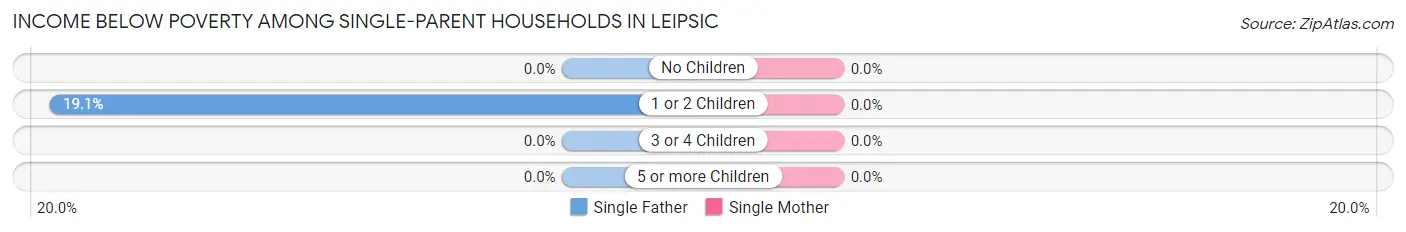
| Children | Single Father | Single Mother |
| No Children | 0 (0.0%) | 0 (0.0%) |
| 1 or 2 Children | 4 (19.1%) | 0 (0.0%) |
| 3 or 4 Children | 0 (0.0%) | 0 (0.0%) |
| 5 or more Children | 0 (0.0%) | 0 (0.0%) |
| Total | 4 (4.9%) | 0 (0.0%) |
Income Below Poverty Among Married-Couple vs Single-Parent Households in Leipsic
The poverty data for Leipsic shows that 70 of the married-couple family households (15.7%) and 4 of the single-parent households (3.8%) are living below the poverty level. Within the married-couple family households, those with 3 or 4 children have the highest poverty rate, with 48 households (48.0%) falling below the poverty line. Among the single-parent households, those with 1 or 2 children have the highest poverty rate, with 4 household (11.1%) living below poverty.
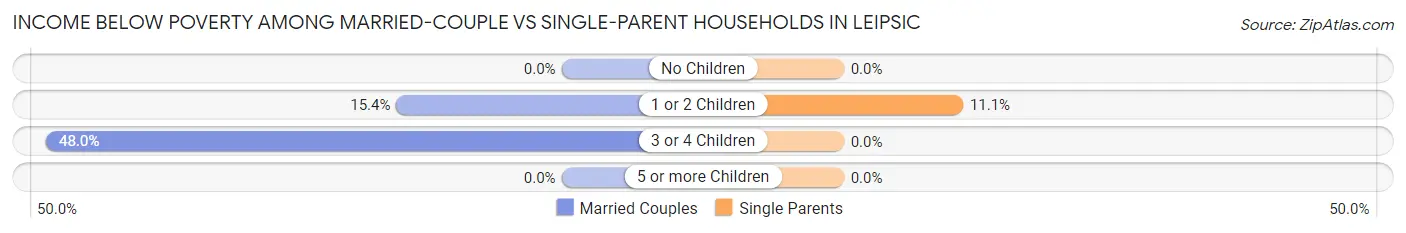
| Children | Married-Couple Families | Single-Parent Households |
| No Children | 0 (0.0%) | 0 (0.0%) |
| 1 or 2 Children | 22 (15.4%) | 4 (11.1%) |
| 3 or 4 Children | 48 (48.0%) | 0 (0.0%) |
| 5 or more Children | 0 (0.0%) | 0 (0.0%) |
| Total | 70 (15.7%) | 4 (3.8%) |
Race in Leipsic
The most populous races in Leipsic are White / Caucasian (1,328 | 60.0%), Hispanic or Latino (904 | 40.8%), and Some other Race (597 | 27.0%).
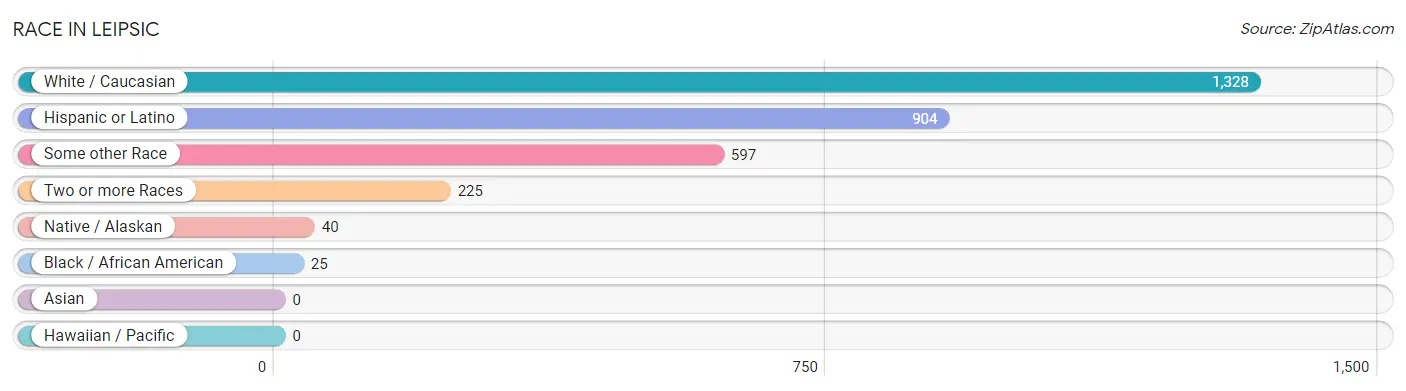
| Race | # Population | % Population |
| Asian | 0 | 0.0% |
| Black / African American | 25 | 1.1% |
| Hawaiian / Pacific | 0 | 0.0% |
| Hispanic or Latino | 904 | 40.8% |
| Native / Alaskan | 40 | 1.8% |
| White / Caucasian | 1,328 | 60.0% |
| Two or more Races | 225 | 10.2% |
| Some other Race | 597 | 27.0% |
| Total | 2,215 | 100.0% |
Ancestry in Leipsic
The most populous ancestries reported in Leipsic are Mexican (753 | 34.0%), German (671 | 30.3%), American (123 | 5.6%), Central American (113 | 5.1%), and Guatemalan (113 | 5.1%), together accounting for 80.0% of all Leipsic residents.
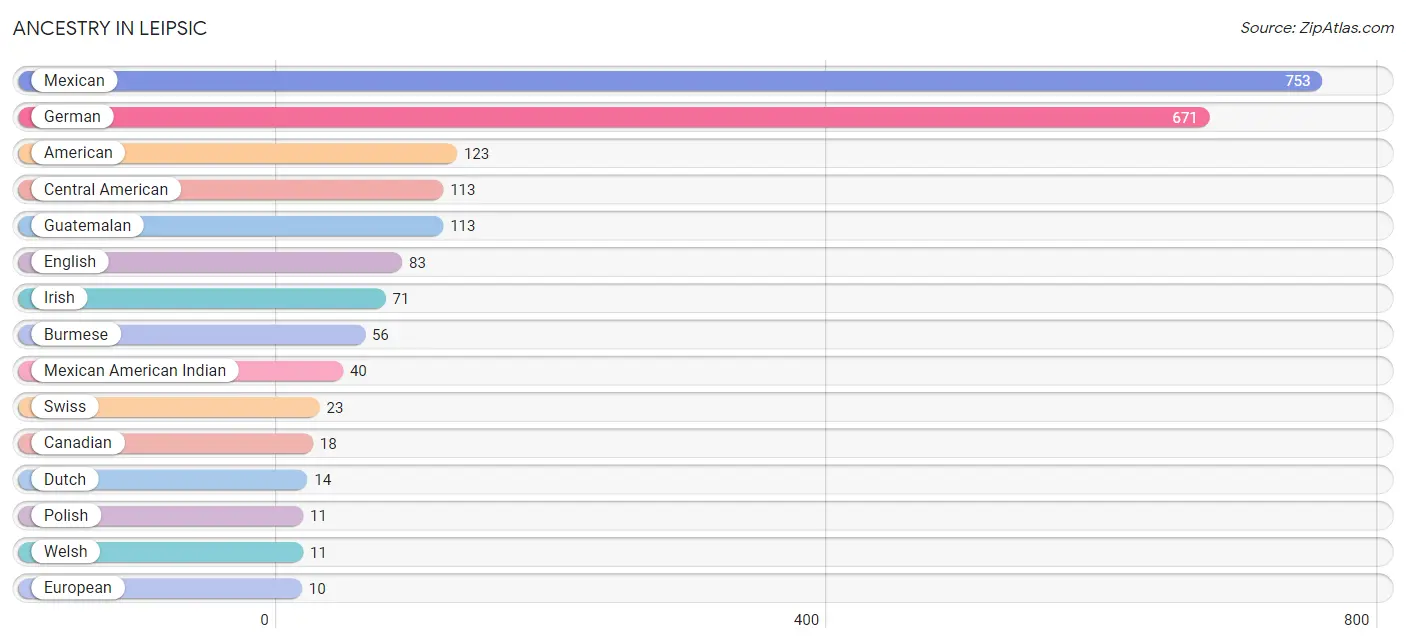
| Ancestry | # Population | % Population |
| American | 123 | 5.6% |
| Burmese | 56 | 2.5% |
| Canadian | 18 | 0.8% |
| Central American | 113 | 5.1% |
| Cuban | 4 | 0.2% |
| Danish | 3 | 0.1% |
| Dutch | 14 | 0.6% |
| English | 83 | 3.7% |
| European | 10 | 0.4% |
| French | 9 | 0.4% |
| German | 671 | 30.3% |
| Guatemalan | 113 | 5.1% |
| Irish | 71 | 3.2% |
| Italian | 7 | 0.3% |
| Mexican | 753 | 34.0% |
| Mexican American Indian | 40 | 1.8% |
| Native Hawaiian | 5 | 0.2% |
| Norwegian | 8 | 0.4% |
| Pennsylvania German | 3 | 0.1% |
| Polish | 11 | 0.5% |
| Scotch-Irish | 10 | 0.4% |
| Spanish | 6 | 0.3% |
| Swedish | 4 | 0.2% |
| Swiss | 23 | 1.0% |
| Ukrainian | 4 | 0.2% |
| Welsh | 11 | 0.5% | View All 26 Rows |
Immigrants in Leipsic
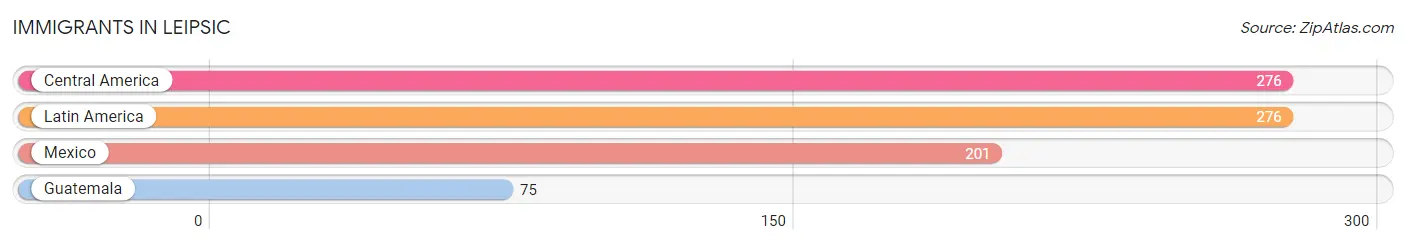
The most numerous immigrant groups reported in Leipsic came from Central America (276 | 12.5%), Latin America (276 | 12.5%), Mexico (201 | 9.1%), and Guatemala (75 | 3.4%), together accounting for 37.4% of all Leipsic residents.
| Immigration Origin | # Population | % Population |
| Central America | 276 | 12.5% |
| Guatemala | 75 | 3.4% |
| Latin America | 276 | 12.5% |
| Mexico | 201 | 9.1% | View All 4 Rows |
Sex and Age in Leipsic
Sex and Age in Leipsic
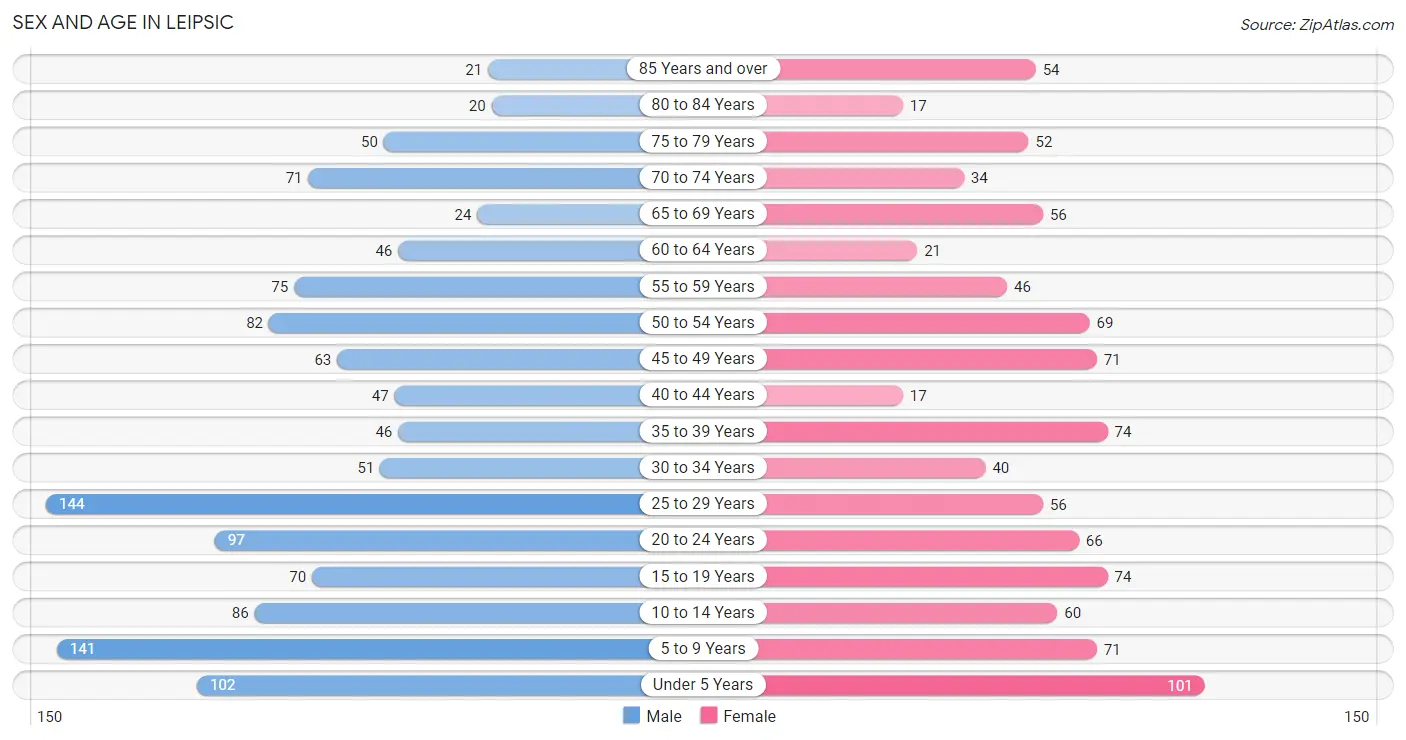
The most populous age groups in Leipsic are 25 to 29 Years (144 | 11.7%) for men and Under 5 Years (101 | 10.3%) for women.
| Age Bracket | Male | Female |
| Under 5 Years | 102 (8.3%) | 101 (10.3%) |
| 5 to 9 Years | 141 (11.4%) | 71 (7.2%) |
| 10 to 14 Years | 86 (7.0%) | 60 (6.1%) |
| 15 to 19 Years | 70 (5.7%) | 74 (7.6%) |
| 20 to 24 Years | 97 (7.9%) | 66 (6.7%) |
| 25 to 29 Years | 144 (11.7%) | 56 (5.7%) |
| 30 to 34 Years | 51 (4.1%) | 40 (4.1%) |
| 35 to 39 Years | 46 (3.7%) | 74 (7.6%) |
| 40 to 44 Years | 47 (3.8%) | 17 (1.7%) |
| 45 to 49 Years | 63 (5.1%) | 71 (7.2%) |
| 50 to 54 Years | 82 (6.6%) | 69 (7.0%) |
| 55 to 59 Years | 75 (6.1%) | 46 (4.7%) |
| 60 to 64 Years | 46 (3.7%) | 21 (2.1%) |
| 65 to 69 Years | 24 (1.9%) | 56 (5.7%) |
| 70 to 74 Years | 71 (5.7%) | 34 (3.5%) |
| 75 to 79 Years | 50 (4.1%) | 52 (5.3%) |
| 80 to 84 Years | 20 (1.6%) | 17 (1.7%) |
| 85 Years and over | 21 (1.7%) | 54 (5.5%) |
| Total | 1,236 (100.0%) | 979 (100.0%) |
Families and Households in Leipsic
Median Family Size in Leipsic
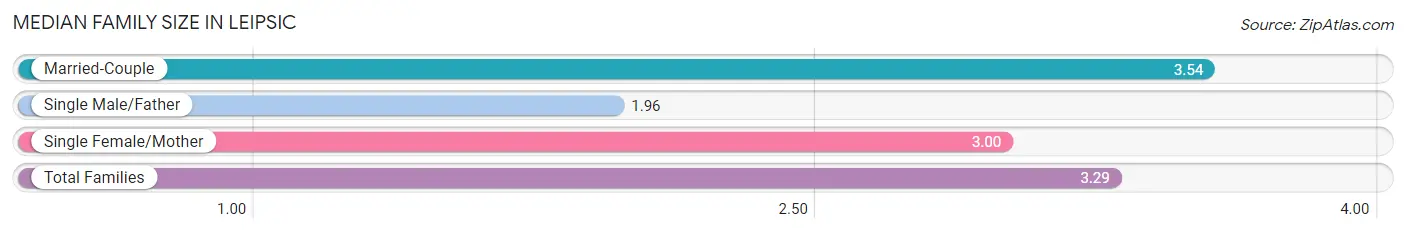
The median family size in Leipsic is 3.29 persons per family, with married-couple families (446 | 80.9%) accounting for the largest median family size of 3.54 persons per family. On the other hand, single male/father families (81 | 14.7%) represent the smallest median family size with 1.96 persons per family.
| Family Type | # Families | Family Size |
| Married-Couple | 446 (80.9%) | 3.54 |
| Single Male/Father | 81 (14.7%) | 1.96 |
| Single Female/Mother | 24 (4.4%) | 3.00 |
| Total Families | 551 (100.0%) | 3.29 |
Median Household Size in Leipsic
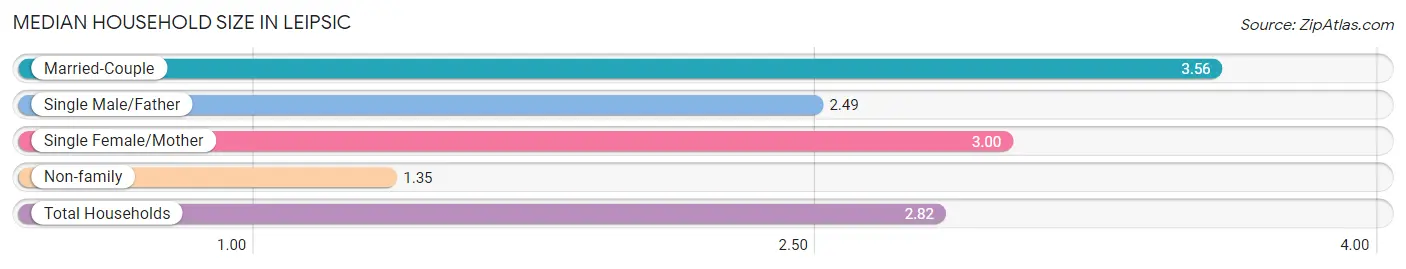
The median household size in Leipsic is 2.82 persons per household, with married-couple households (446 | 58.6%) accounting for the largest median household size of 3.56 persons per household. non-family households (210 | 27.6%) represent the smallest median household size with 1.35 persons per household.
| Household Type | # Households | Household Size |
| Married-Couple | 446 (58.6%) | 3.56 |
| Single Male/Father | 81 (10.6%) | 2.49 |
| Single Female/Mother | 24 (3.2%) | 3.00 |
| Non-family | 210 (27.6%) | 1.35 |
| Total Households | 761 (100.0%) | 2.82 |
Household Size by Marriage Status in Leipsic
Out of a total of 761 households in Leipsic, 551 (72.4%) are family households, while 210 (27.6%) are nonfamily households. The most numerous type of family households are 2-person households, comprising 179, and the most common type of nonfamily households are 1-person households, comprising 151.
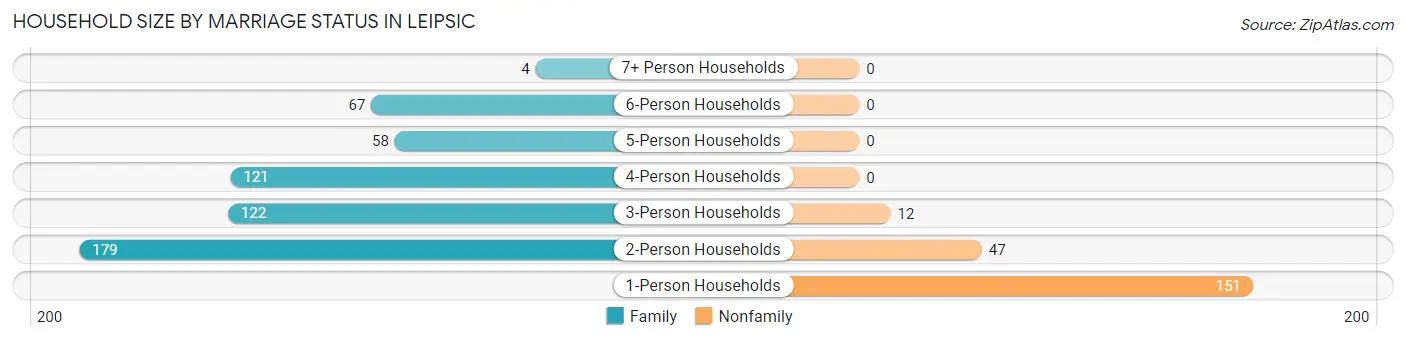
| Household Size | Family Households | Nonfamily Households |
| 1-Person Households | - | 151 (19.8%) |
| 2-Person Households | 179 (23.5%) | 47 (6.2%) |
| 3-Person Households | 122 (16.0%) | 12 (1.6%) |
| 4-Person Households | 121 (15.9%) | 0 (0.0%) |
| 5-Person Households | 58 (7.6%) | 0 (0.0%) |
| 6-Person Households | 67 (8.8%) | 0 (0.0%) |
| 7+ Person Households | 4 (0.5%) | 0 (0.0%) |
| Total | 551 (72.4%) | 210 (27.6%) |
Female Fertility in Leipsic
Fertility by Age in Leipsic
Average fertility rate in Leipsic is 169.0 births per 1,000 women. Women in the age bracket of 20 to 34 years have the highest fertility rate with 346.0 births per 1,000 women. Women in the age bracket of 20 to 34 years acount for 82.4% of all women with births.
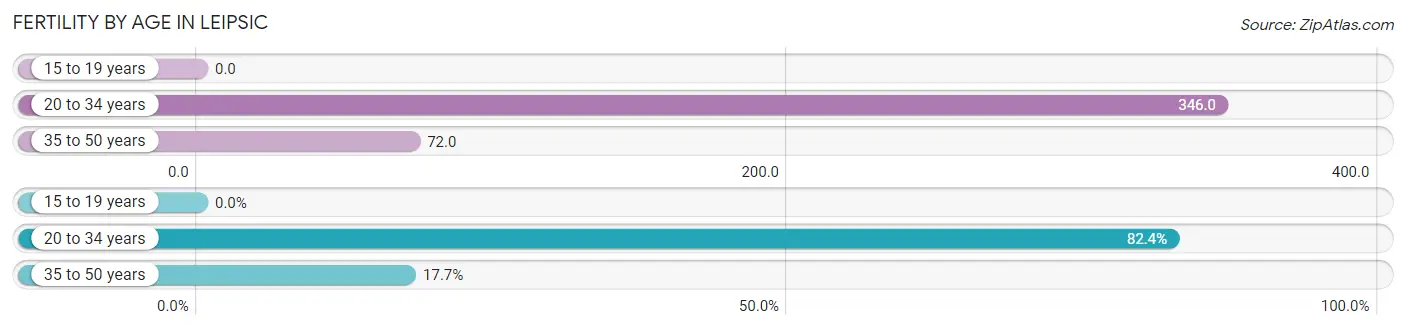
| Age Bracket | Women with Births | Births / 1,000 Women |
| 15 to 19 years | 0 (0.0%) | 0.0 |
| 20 to 34 years | 56 (82.4%) | 346.0 |
| 35 to 50 years | 12 (17.6%) | 72.0 |
| Total | 68 (100.0%) | 169.0 |
Fertility by Age by Marriage Status in Leipsic
79.4% of women with births (68) in Leipsic are married. The highest percentage of unmarried women with births falls into 35 to 50 years age bracket with 25.0% of them unmarried at the time of birth, while the lowest percentage of unmarried women with births belong to 20 to 34 years age bracket with 19.6% of them unmarried.
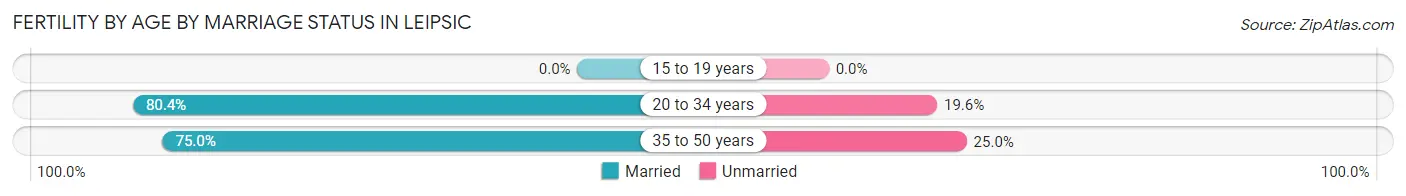
| Age Bracket | Married | Unmarried |
| 15 to 19 years | 0 (0.0%) | 0 (0.0%) |
| 20 to 34 years | 45 (80.4%) | 11 (19.6%) |
| 35 to 50 years | 9 (75.0%) | 3 (25.0%) |
| Total | 54 (79.4%) | 14 (20.6%) |
Fertility by Education in Leipsic
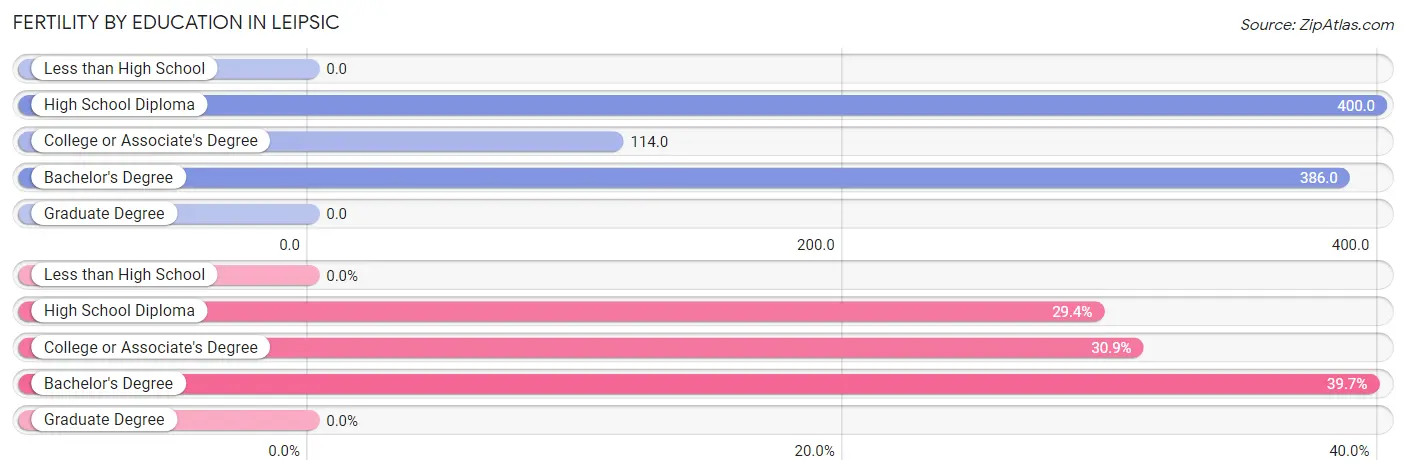
| Educational Attainment | Women with Births | Births / 1,000 Women |
| Less than High School | 0 (0.0%) | 0.0 |
| High School Diploma | 20 (29.4%) | 400.0 |
| College or Associate's Degree | 21 (30.9%) | 114.0 |
| Bachelor's Degree | 27 (39.7%) | 386.0 |
| Graduate Degree | 0 (0.0%) | 0.0 |
| Total | 68 (100.0%) | 169.0 |
Fertility by Education by Marriage Status in Leipsic
20.6% of women with births in Leipsic are unmarried. Women with the educational attainment of bachelor's degree are most likely to be married with 100.0% of them married at childbirth, while women with the educational attainment of college or associate's degree are least likely to be married with 52.4% of them unmarried at childbirth.
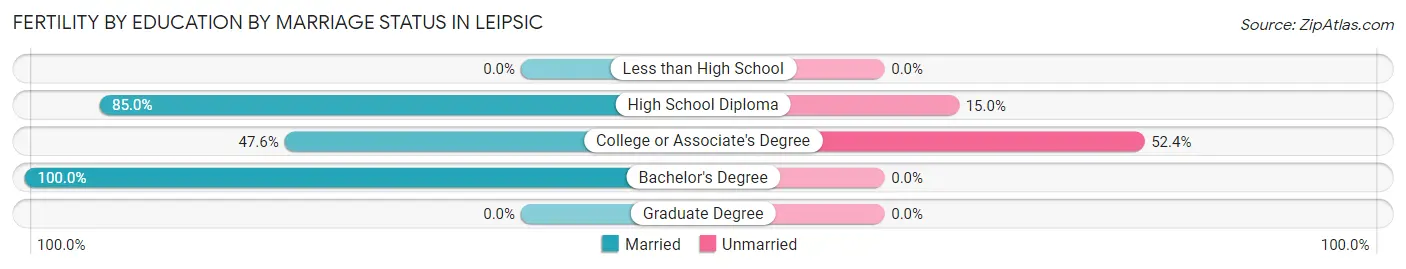
| Educational Attainment | Married | Unmarried |
| Less than High School | 0 (0.0%) | 0 (0.0%) |
| High School Diploma | 17 (85.0%) | 3 (15.0%) |
| College or Associate's Degree | 10 (47.6%) | 11 (52.4%) |
| Bachelor's Degree | 27 (100.0%) | 0 (0.0%) |
| Graduate Degree | 0 (0.0%) | 0 (0.0%) |
| Total | 54 (79.4%) | 14 (20.6%) |
Employment Characteristics in Leipsic
Employment by Class of Employer in Leipsic
Among the 1,084 employed individuals in Leipsic, private company employees (913 | 84.2%), not-for-profit organizations (92 | 8.5%), and self-employed (not incorporated) (31 | 2.9%) make up the most common classes of employment.
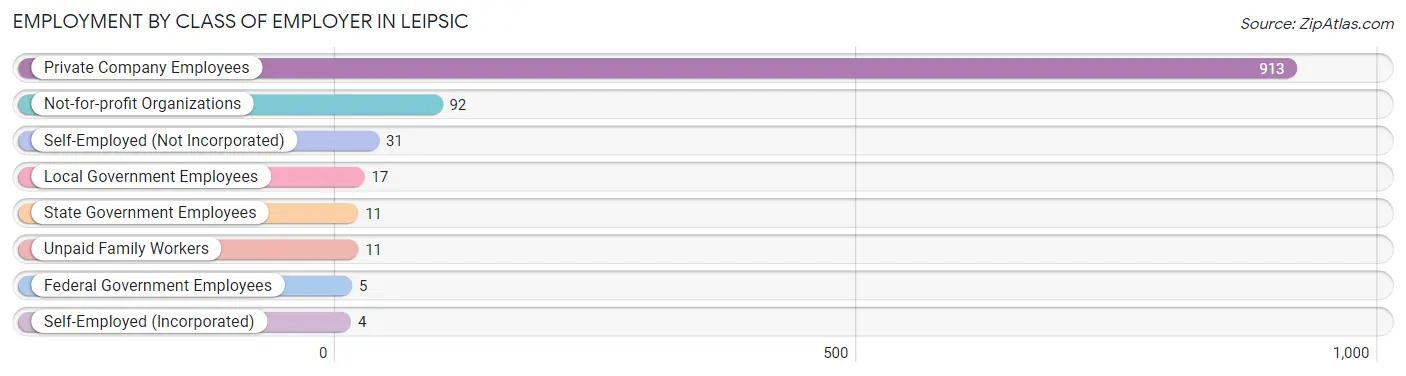
| Employer Class | # Employees | % Employees |
| Private Company Employees | 913 | 84.2% |
| Self-Employed (Incorporated) | 4 | 0.4% |
| Self-Employed (Not Incorporated) | 31 | 2.9% |
| Not-for-profit Organizations | 92 | 8.5% |
| Local Government Employees | 17 | 1.6% |
| State Government Employees | 11 | 1.0% |
| Federal Government Employees | 5 | 0.5% |
| Unpaid Family Workers | 11 | 1.0% |
| Total | 1,084 | 100.0% |
Employment Status by Age in Leipsic
According to the labor force statistics for Leipsic, out of the total population over 16 years of age (1,641), 68.9% or 1,131 individuals are in the labor force, with 3.1% or 35 of them unemployed. The age group with the highest labor force participation rate is 20 to 24 years, with 100.0% or 163 individuals in the labor force. Within the labor force, the 16 to 19 years age range has the highest percentage of unemployed individuals, with 24.4% or 11 of them being unemployed.
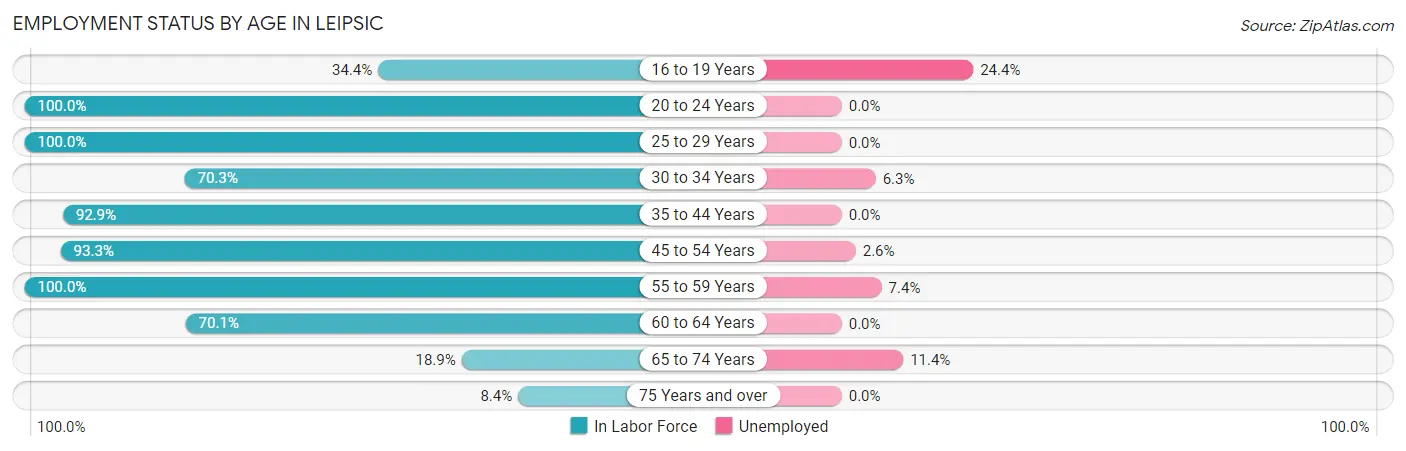
| Age Bracket | In Labor Force | Unemployed |
| 16 to 19 Years | 45 (34.4%) | 11 (24.4%) |
| 20 to 24 Years | 163 (100.0%) | 0 (0.0%) |
| 25 to 29 Years | 200 (100.0%) | 0 (0.0%) |
| 30 to 34 Years | 64 (70.3%) | 4 (6.3%) |
| 35 to 44 Years | 171 (92.9%) | 0 (0.0%) |
| 45 to 54 Years | 266 (93.3%) | 7 (2.6%) |
| 55 to 59 Years | 121 (100.0%) | 9 (7.4%) |
| 60 to 64 Years | 47 (70.1%) | 0 (0.0%) |
| 65 to 74 Years | 35 (18.9%) | 4 (11.4%) |
| 75 Years and over | 18 (8.4%) | 0 (0.0%) |
| Total | 1,131 (68.9%) | 35 (3.1%) |
Employment Status by Educational Attainment in Leipsic
According to labor force statistics for Leipsic, 91.7% of individuals (869) out of the total population between 25 and 64 years of age (948) are in the labor force, with 2.3% or 20 of them being unemployed. The group with the highest labor force participation rate are those with the educational attainment of bachelor's degree or higher, with 97.5% or 119 individuals in the labor force. Within the labor force, individuals with college / associate degree education have the highest percentage of unemployment, with 4.1% or 11 of them being unemployed.
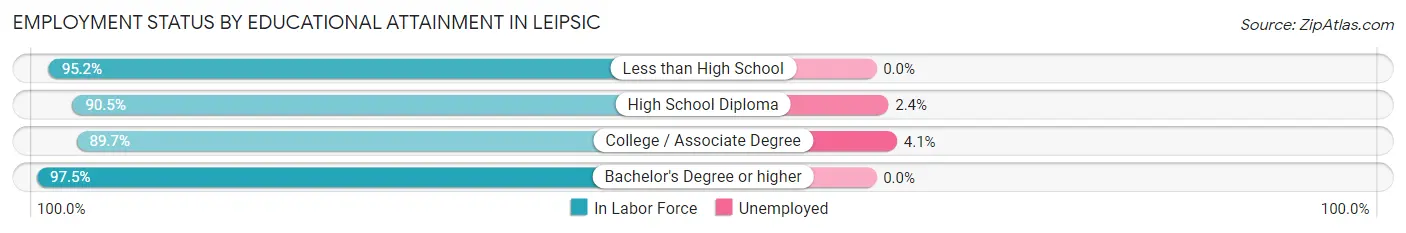
| Educational Attainment | In Labor Force | Unemployed |
| Less than High School | 99 (95.2%) | 0 (0.0%) |
| High School Diploma | 380 (90.5%) | 10 (2.4%) |
| College / Associate Degree | 271 (89.7%) | 12 (4.1%) |
| Bachelor's Degree or higher | 119 (97.5%) | 0 (0.0%) |
| Total | 869 (91.7%) | 22 (2.3%) |
Employment Occupations by Sex in Leipsic
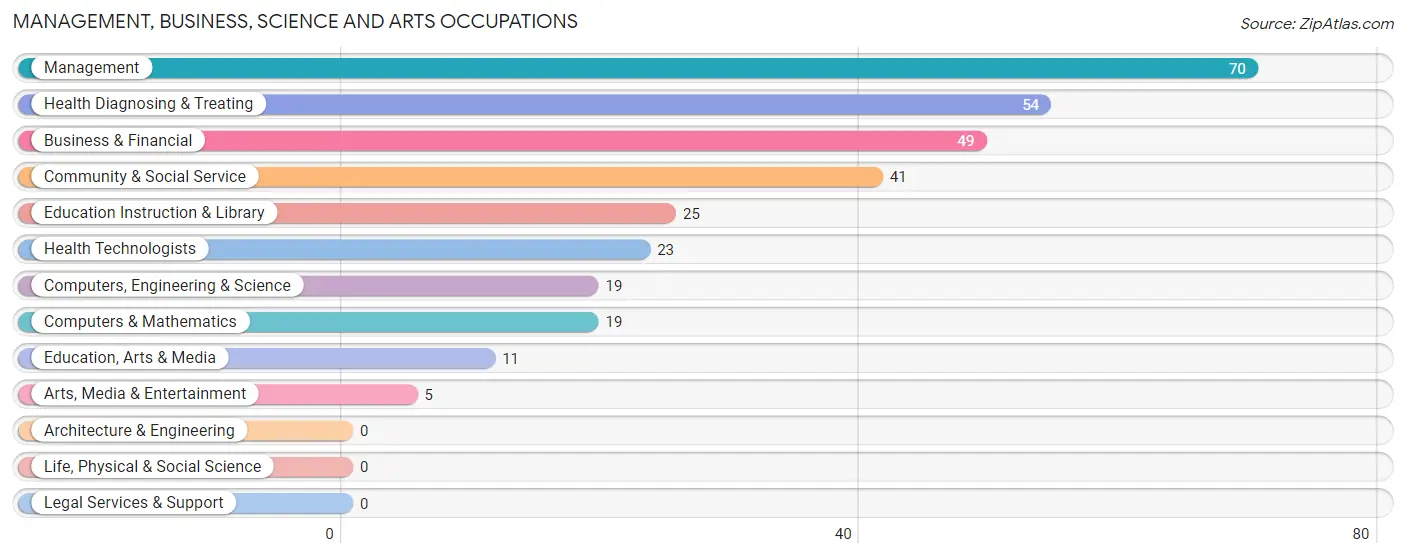
Management, Business, Science and Arts Occupations
The most common Management, Business, Science and Arts occupations in Leipsic are Management (70 | 6.4%), Health Diagnosing & Treating (54 | 4.9%), Business & Financial (49 | 4.5%), Community & Social Service (41 | 3.7%), and Education Instruction & Library (25 | 2.3%).
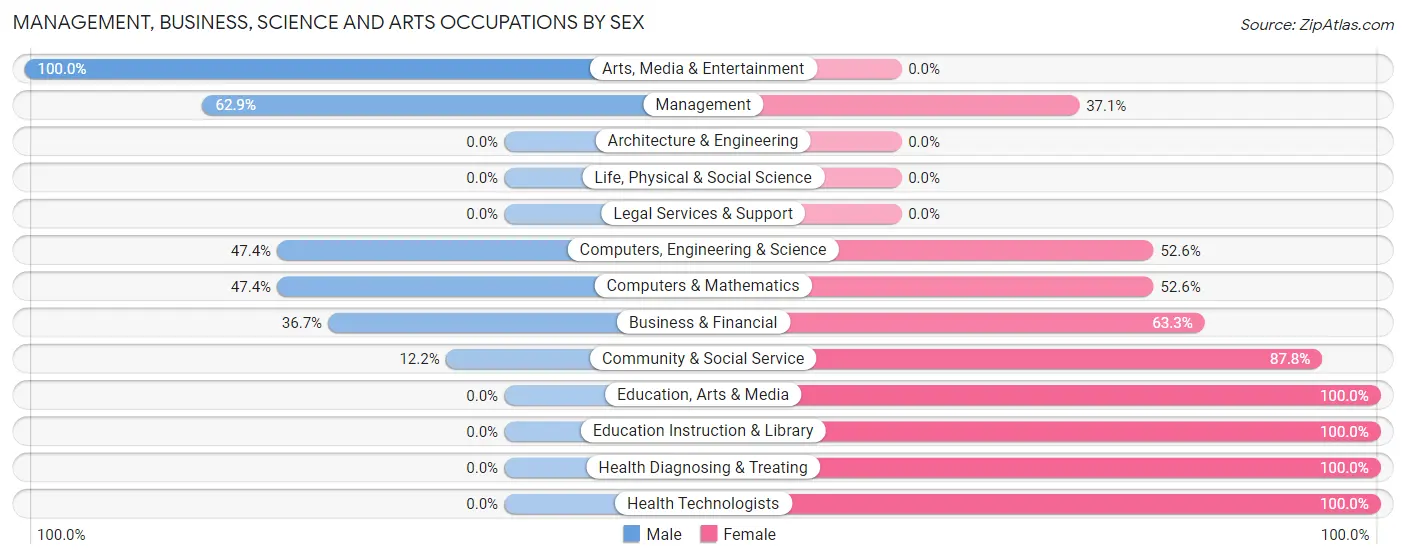
Management, Business, Science and Arts Occupations by Sex
Within the Management, Business, Science and Arts occupations in Leipsic, the most male-oriented occupations are Arts, Media & Entertainment (100.0%), Management (62.9%), and Computers, Engineering & Science (47.4%), while the most female-oriented occupations are Education, Arts & Media (100.0%), Education Instruction & Library (100.0%), and Health Diagnosing & Treating (100.0%).
| Occupation | Male | Female |
| Management | 44 (62.9%) | 26 (37.1%) |
| Business & Financial | 18 (36.7%) | 31 (63.3%) |
| Computers, Engineering & Science | 9 (47.4%) | 10 (52.6%) |
| Computers & Mathematics | 9 (47.4%) | 10 (52.6%) |
| Architecture & Engineering | 0 (0.0%) | 0 (0.0%) |
| Life, Physical & Social Science | 0 (0.0%) | 0 (0.0%) |
| Community & Social Service | 5 (12.2%) | 36 (87.8%) |
| Education, Arts & Media | 0 (0.0%) | 11 (100.0%) |
| Legal Services & Support | 0 (0.0%) | 0 (0.0%) |
| Education Instruction & Library | 0 (0.0%) | 25 (100.0%) |
| Arts, Media & Entertainment | 5 (100.0%) | 0 (0.0%) |
| Health Diagnosing & Treating | 0 (0.0%) | 54 (100.0%) |
| Health Technologists | 0 (0.0%) | 23 (100.0%) |
| Total (Category) | 76 (32.6%) | 157 (67.4%) |
| Total (Overall) | 654 (59.7%) | 441 (40.3%) |
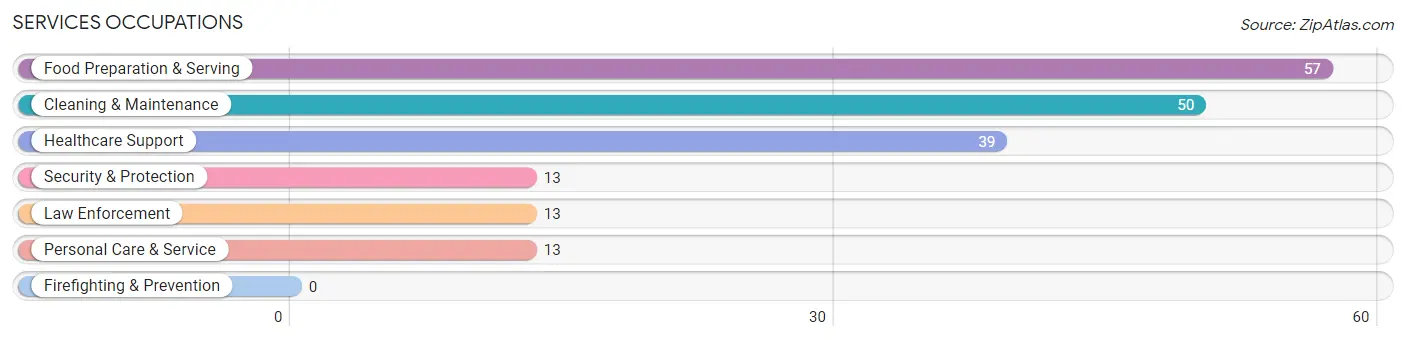
Services Occupations
The most common Services occupations in Leipsic are Food Preparation & Serving (57 | 5.2%), Cleaning & Maintenance (50 | 4.6%), Healthcare Support (39 | 3.6%), Security & Protection (13 | 1.2%), and Law Enforcement (13 | 1.2%).
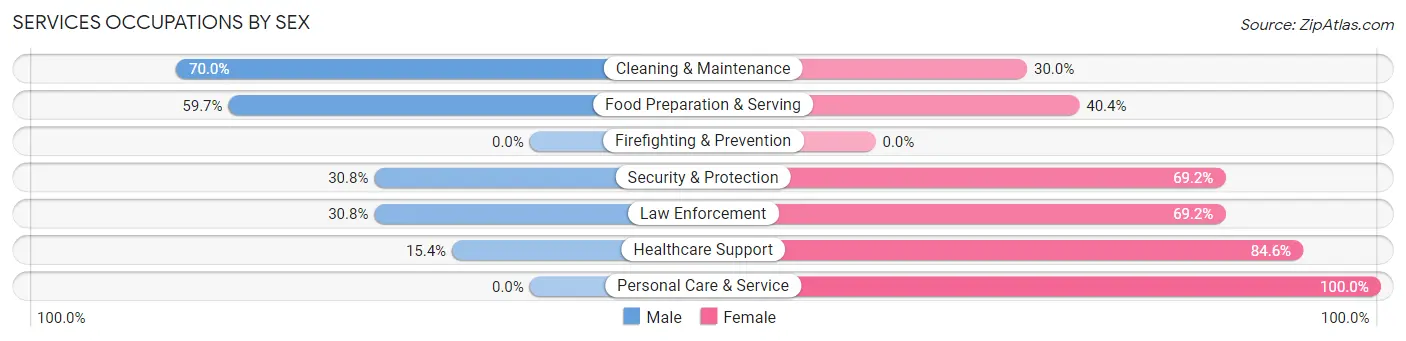
Services Occupations by Sex
Within the Services occupations in Leipsic, the most male-oriented occupations are Cleaning & Maintenance (70.0%), Food Preparation & Serving (59.7%), and Security & Protection (30.8%), while the most female-oriented occupations are Personal Care & Service (100.0%), Healthcare Support (84.6%), and Security & Protection (69.2%).
| Occupation | Male | Female |
| Healthcare Support | 6 (15.4%) | 33 (84.6%) |
| Security & Protection | 4 (30.8%) | 9 (69.2%) |
| Firefighting & Prevention | 0 (0.0%) | 0 (0.0%) |
| Law Enforcement | 4 (30.8%) | 9 (69.2%) |
| Food Preparation & Serving | 34 (59.7%) | 23 (40.4%) |
| Cleaning & Maintenance | 35 (70.0%) | 15 (30.0%) |
| Personal Care & Service | 0 (0.0%) | 13 (100.0%) |
| Total (Category) | 79 (45.9%) | 93 (54.1%) |
| Total (Overall) | 654 (59.7%) | 441 (40.3%) |
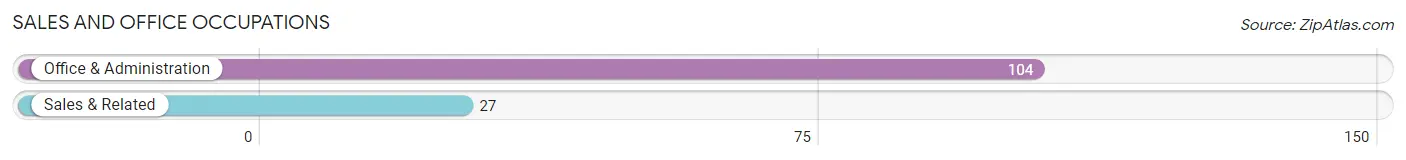
Sales and Office Occupations
The most common Sales and Office occupations in Leipsic are Office & Administration (104 | 9.5%), and Sales & Related (27 | 2.5%).
Sales and Office Occupations by Sex
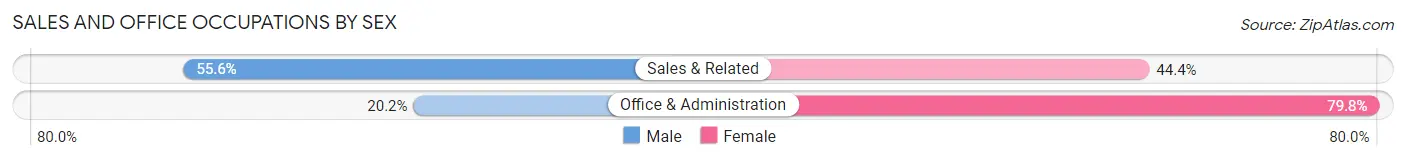
| Occupation | Male | Female |
| Sales & Related | 15 (55.6%) | 12 (44.4%) |
| Office & Administration | 21 (20.2%) | 83 (79.8%) |
| Total (Category) | 36 (27.5%) | 95 (72.5%) |
| Total (Overall) | 654 (59.7%) | 441 (40.3%) |
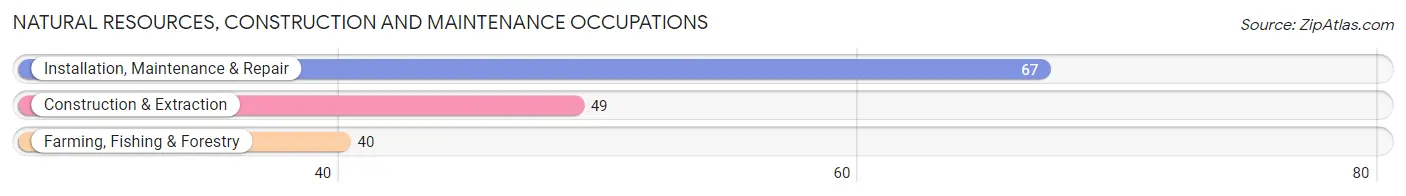
Natural Resources, Construction and Maintenance Occupations
The most common Natural Resources, Construction and Maintenance occupations in Leipsic are Installation, Maintenance & Repair (67 | 6.1%), Construction & Extraction (49 | 4.5%), and Farming, Fishing & Forestry (40 | 3.6%).
Natural Resources, Construction and Maintenance Occupations by Sex
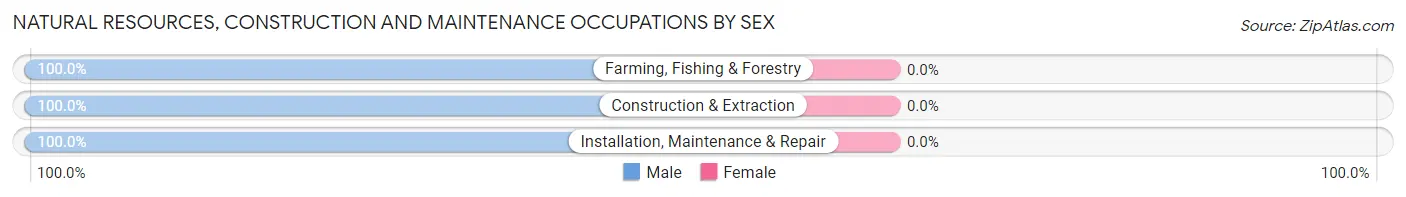
| Occupation | Male | Female |
| Farming, Fishing & Forestry | 40 (100.0%) | 0 (0.0%) |
| Construction & Extraction | 49 (100.0%) | 0 (0.0%) |
| Installation, Maintenance & Repair | 67 (100.0%) | 0 (0.0%) |
| Total (Category) | 156 (100.0%) | 0 (0.0%) |
| Total (Overall) | 654 (59.7%) | 441 (40.3%) |
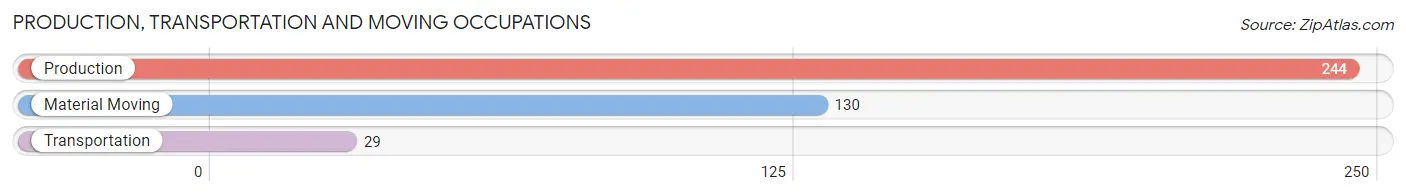
Production, Transportation and Moving Occupations
The most common Production, Transportation and Moving occupations in Leipsic are Production (244 | 22.3%), Material Moving (130 | 11.9%), and Transportation (29 | 2.6%).
Production, Transportation and Moving Occupations by Sex
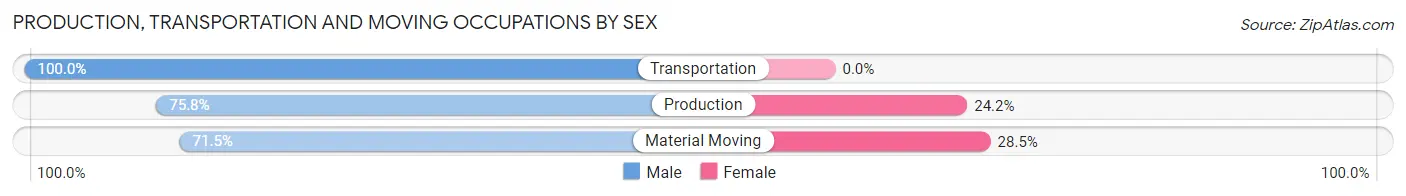
| Occupation | Male | Female |
| Production | 185 (75.8%) | 59 (24.2%) |
| Transportation | 29 (100.0%) | 0 (0.0%) |
| Material Moving | 93 (71.5%) | 37 (28.5%) |
| Total (Category) | 307 (76.2%) | 96 (23.8%) |
| Total (Overall) | 654 (59.7%) | 441 (40.3%) |
Employment Industries by Sex in Leipsic
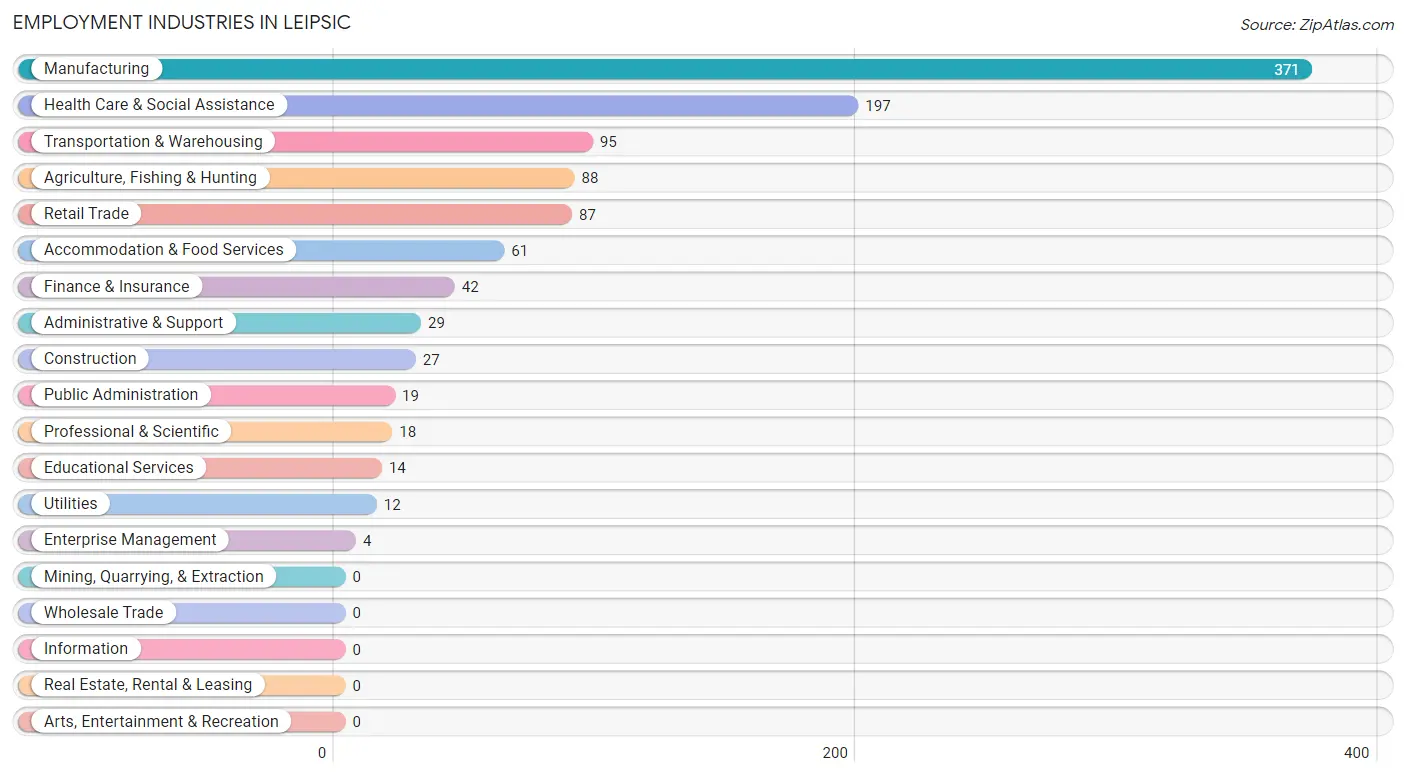
Employment Industries in Leipsic
The major employment industries in Leipsic include Manufacturing (371 | 33.9%), Health Care & Social Assistance (197 | 18.0%), Transportation & Warehousing (95 | 8.7%), Agriculture, Fishing & Hunting (88 | 8.0%), and Retail Trade (87 | 8.0%).
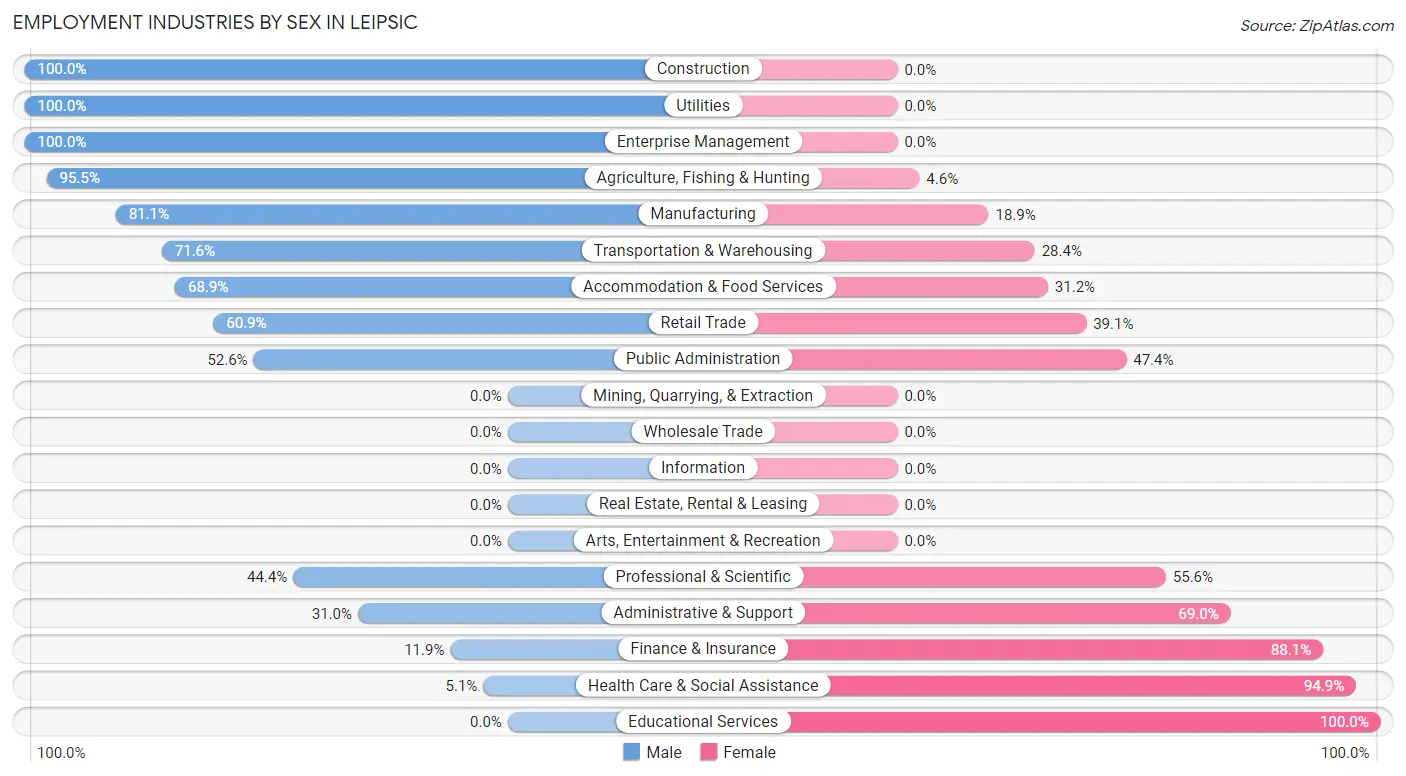
Employment Industries by Sex in Leipsic
The Leipsic industries that see more men than women are Construction (100.0%), Utilities (100.0%), and Enterprise Management (100.0%), whereas the industries that tend to have a higher number of women are Educational Services (100.0%), Health Care & Social Assistance (94.9%), and Finance & Insurance (88.1%).
| Industry | Male | Female |
| Agriculture, Fishing & Hunting | 84 (95.5%) | 4 (4.5%) |
| Mining, Quarrying, & Extraction | 0 (0.0%) | 0 (0.0%) |
| Construction | 27 (100.0%) | 0 (0.0%) |
| Manufacturing | 301 (81.1%) | 70 (18.9%) |
| Wholesale Trade | 0 (0.0%) | 0 (0.0%) |
| Retail Trade | 53 (60.9%) | 34 (39.1%) |
| Transportation & Warehousing | 68 (71.6%) | 27 (28.4%) |
| Utilities | 12 (100.0%) | 0 (0.0%) |
| Information | 0 (0.0%) | 0 (0.0%) |
| Finance & Insurance | 5 (11.9%) | 37 (88.1%) |
| Real Estate, Rental & Leasing | 0 (0.0%) | 0 (0.0%) |
| Professional & Scientific | 8 (44.4%) | 10 (55.6%) |
| Enterprise Management | 4 (100.0%) | 0 (0.0%) |
| Administrative & Support | 9 (31.0%) | 20 (69.0%) |
| Educational Services | 0 (0.0%) | 14 (100.0%) |
| Health Care & Social Assistance | 10 (5.1%) | 187 (94.9%) |
| Arts, Entertainment & Recreation | 0 (0.0%) | 0 (0.0%) |
| Accommodation & Food Services | 42 (68.9%) | 19 (31.1%) |
| Public Administration | 10 (52.6%) | 9 (47.4%) |
| Total | 654 (59.7%) | 441 (40.3%) |
Education in Leipsic
School Enrollment in Leipsic
The most common levels of schooling among the 537 students in Leipsic are elementary school (146 | 27.2%), high school (131 | 24.4%), and middle school (104 | 19.4%).
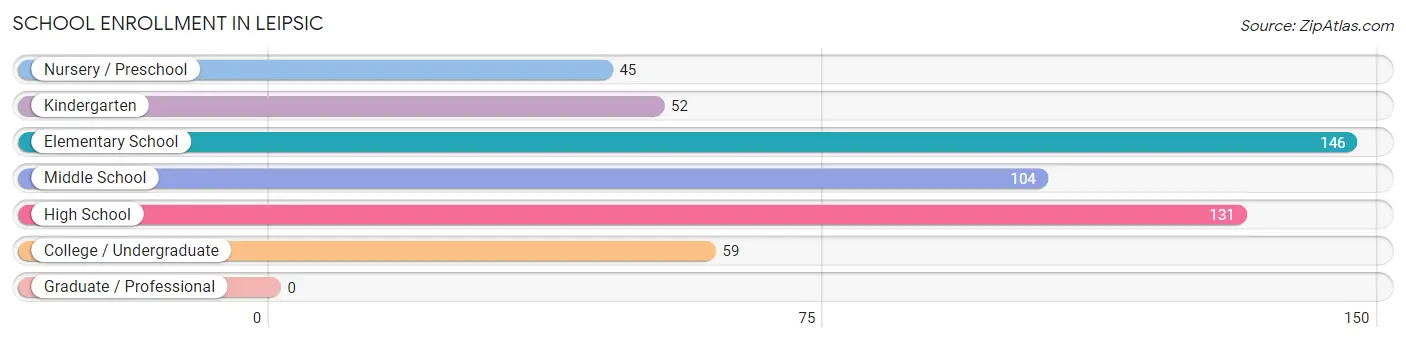
| School Level | # Students | % Students |
| Nursery / Preschool | 45 | 8.4% |
| Kindergarten | 52 | 9.7% |
| Elementary School | 146 | 27.2% |
| Middle School | 104 | 19.4% |
| High School | 131 | 24.4% |
| College / Undergraduate | 59 | 11.0% |
| Graduate / Professional | 0 | 0.0% |
| Total | 537 | 100.0% |
School Enrollment by Age by Funding Source in Leipsic
Out of a total of 537 students who are enrolled in schools in Leipsic, 84 (15.6%) attend a private institution, while the remaining 453 (84.4%) are enrolled in public schools. The age group of 3 to 4 year olds has the highest likelihood of being enrolled in private schools, with 16 (80.0% in the age bracket) enrolled. Conversely, the age group of 15 to 17 year olds has the lowest likelihood of being enrolled in a private school, with 61 (100.0% in the age bracket) attending a public institution.
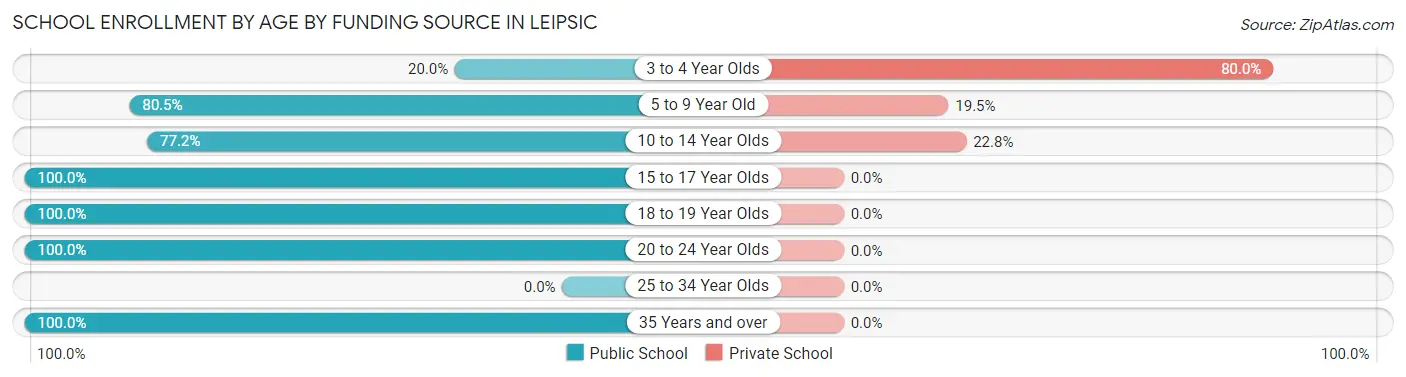
| Age Bracket | Public School | Private School |
| 3 to 4 Year Olds | 4 (20.0%) | 16 (80.0%) |
| 5 to 9 Year Old | 161 (80.5%) | 39 (19.5%) |
| 10 to 14 Year Olds | 98 (77.2%) | 29 (22.8%) |
| 15 to 17 Year Olds | 61 (100.0%) | 0 (0.0%) |
| 18 to 19 Year Olds | 68 (100.0%) | 0 (0.0%) |
| 20 to 24 Year Olds | 33 (100.0%) | 0 (0.0%) |
| 25 to 34 Year Olds | 0 (0.0%) | 0 (0.0%) |
| 35 Years and over | 28 (100.0%) | 0 (0.0%) |
| Total | 453 (84.4%) | 84 (15.6%) |
Educational Attainment by Field of Study in Leipsic
Business (63 | 40.9%), education (41 | 26.6%), science & technology (17 | 11.0%), visual & performing arts (10 | 6.5%), and computers & mathematics (8 | 5.2%) are the most common fields of study among 154 individuals in Leipsic who have obtained a bachelor's degree or higher.
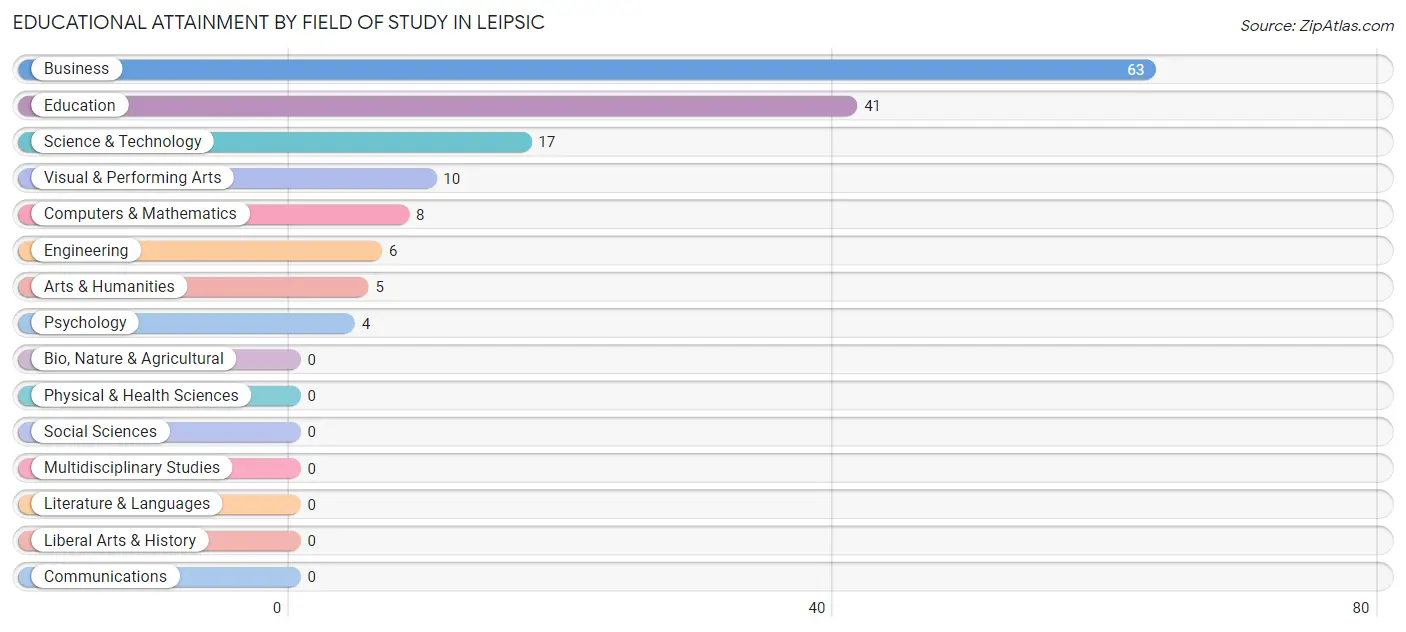
| Field of Study | # Graduates | % Graduates |
| Computers & Mathematics | 8 | 5.2% |
| Bio, Nature & Agricultural | 0 | 0.0% |
| Physical & Health Sciences | 0 | 0.0% |
| Psychology | 4 | 2.6% |
| Social Sciences | 0 | 0.0% |
| Engineering | 6 | 3.9% |
| Multidisciplinary Studies | 0 | 0.0% |
| Science & Technology | 17 | 11.0% |
| Business | 63 | 40.9% |
| Education | 41 | 26.6% |
| Literature & Languages | 0 | 0.0% |
| Liberal Arts & History | 0 | 0.0% |
| Visual & Performing Arts | 10 | 6.5% |
| Communications | 0 | 0.0% |
| Arts & Humanities | 5 | 3.3% |
| Total | 154 | 100.0% |
Transportation & Commute in Leipsic
Vehicle Availability by Sex in Leipsic
The most prevalent vehicle ownership categories in Leipsic are males with 2 vehicles (287, accounting for 44.6%) and females with 2 vehicles (145, making up 66.9%).
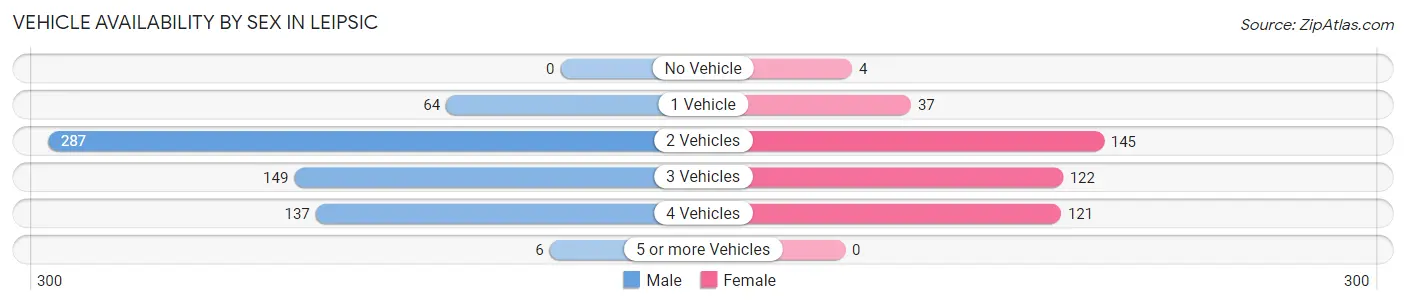
| Vehicles Available | Male | Female |
| No Vehicle | 0 (0.0%) | 4 (0.9%) |
| 1 Vehicle | 64 (10.0%) | 37 (8.6%) |
| 2 Vehicles | 287 (44.6%) | 145 (33.8%) |
| 3 Vehicles | 149 (23.2%) | 122 (28.4%) |
| 4 Vehicles | 137 (21.3%) | 121 (28.2%) |
| 5 or more Vehicles | 6 (0.9%) | 0 (0.0%) |
| Total | 643 (100.0%) | 429 (100.0%) |
Commute Time in Leipsic
The most frequently occuring commute durations in Leipsic are 20 to 24 minutes (162 commuters, 15.5%), 30 to 34 minutes (151 commuters, 14.4%), and 15 to 19 minutes (126 commuters, 12.0%).
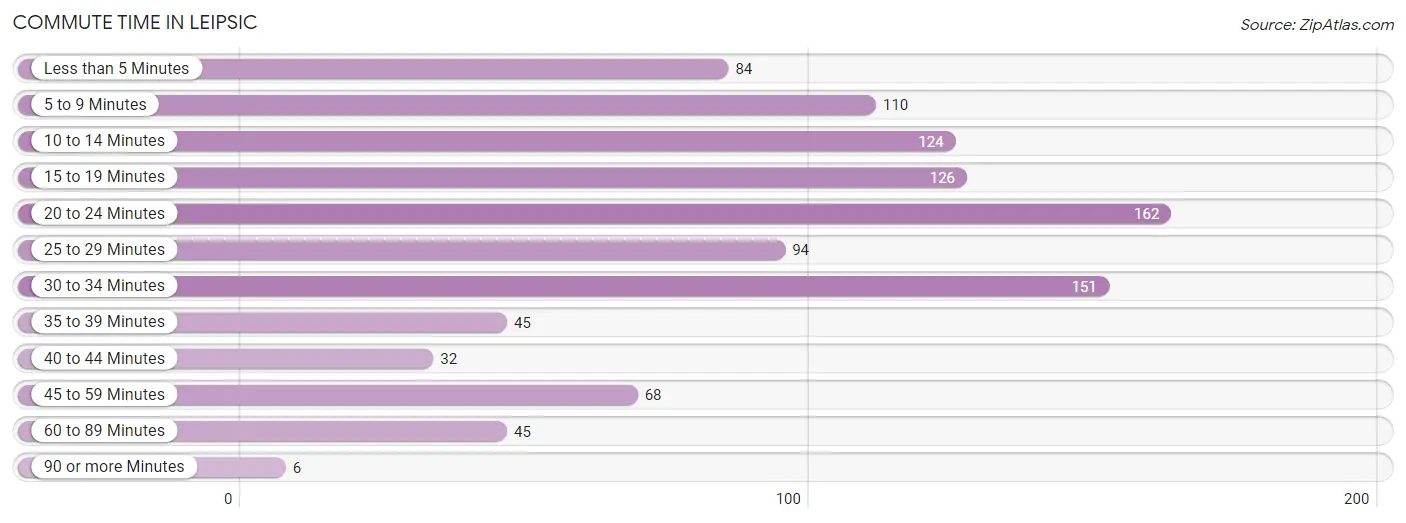
| Commute Time | # Commuters | % Commuters |
| Less than 5 Minutes | 84 | 8.0% |
| 5 to 9 Minutes | 110 | 10.5% |
| 10 to 14 Minutes | 124 | 11.8% |
| 15 to 19 Minutes | 126 | 12.0% |
| 20 to 24 Minutes | 162 | 15.5% |
| 25 to 29 Minutes | 94 | 9.0% |
| 30 to 34 Minutes | 151 | 14.4% |
| 35 to 39 Minutes | 45 | 4.3% |
| 40 to 44 Minutes | 32 | 3.1% |
| 45 to 59 Minutes | 68 | 6.5% |
| 60 to 89 Minutes | 45 | 4.3% |
| 90 or more Minutes | 6 | 0.6% |
Commute Time by Sex in Leipsic
The most common commute times in Leipsic are 30 to 34 minutes (120 commuters, 19.0%) for males and 20 to 24 minutes (75 commuters, 18.1%) for females.
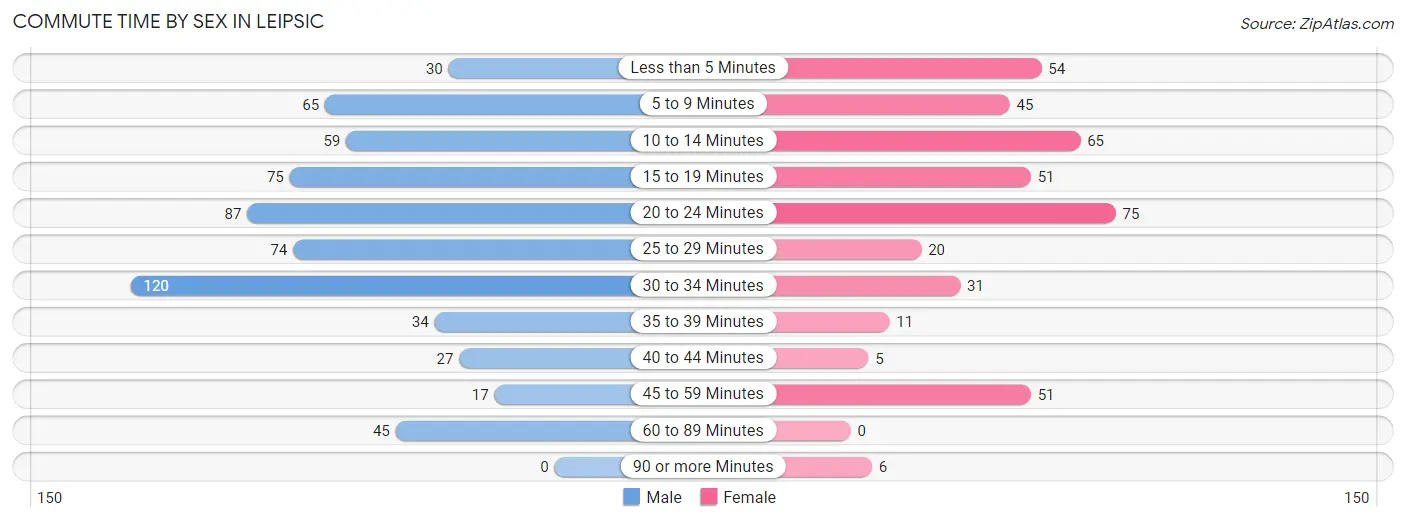
| Commute Time | Male | Female |
| Less than 5 Minutes | 30 (4.7%) | 54 (13.0%) |
| 5 to 9 Minutes | 65 (10.3%) | 45 (10.9%) |
| 10 to 14 Minutes | 59 (9.3%) | 65 (15.7%) |
| 15 to 19 Minutes | 75 (11.8%) | 51 (12.3%) |
| 20 to 24 Minutes | 87 (13.7%) | 75 (18.1%) |
| 25 to 29 Minutes | 74 (11.7%) | 20 (4.8%) |
| 30 to 34 Minutes | 120 (19.0%) | 31 (7.5%) |
| 35 to 39 Minutes | 34 (5.4%) | 11 (2.7%) |
| 40 to 44 Minutes | 27 (4.3%) | 5 (1.2%) |
| 45 to 59 Minutes | 17 (2.7%) | 51 (12.3%) |
| 60 to 89 Minutes | 45 (7.1%) | 0 (0.0%) |
| 90 or more Minutes | 0 (0.0%) | 6 (1.5%) |
Time of Departure to Work by Sex in Leipsic
The most frequent times of departure to work in Leipsic are 12:00 PM to 3:59 PM (126, 19.9%) for males and 7:30 AM to 7:59 AM (63, 15.2%) for females.
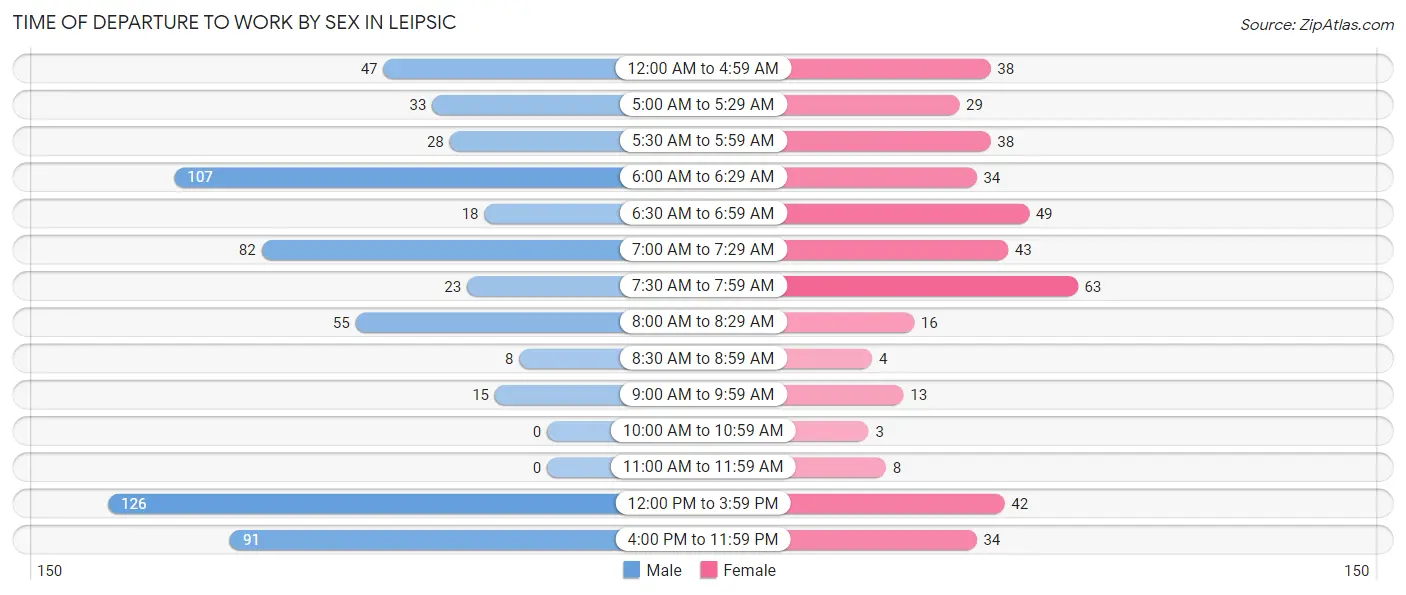
| Time of Departure | Male | Female |
| 12:00 AM to 4:59 AM | 47 (7.4%) | 38 (9.2%) |
| 5:00 AM to 5:29 AM | 33 (5.2%) | 29 (7.0%) |
| 5:30 AM to 5:59 AM | 28 (4.4%) | 38 (9.2%) |
| 6:00 AM to 6:29 AM | 107 (16.9%) | 34 (8.2%) |
| 6:30 AM to 6:59 AM | 18 (2.8%) | 49 (11.8%) |
| 7:00 AM to 7:29 AM | 82 (13.0%) | 43 (10.4%) |
| 7:30 AM to 7:59 AM | 23 (3.6%) | 63 (15.2%) |
| 8:00 AM to 8:29 AM | 55 (8.7%) | 16 (3.9%) |
| 8:30 AM to 8:59 AM | 8 (1.3%) | 4 (1.0%) |
| 9:00 AM to 9:59 AM | 15 (2.4%) | 13 (3.1%) |
| 10:00 AM to 10:59 AM | 0 (0.0%) | 3 (0.7%) |
| 11:00 AM to 11:59 AM | 0 (0.0%) | 8 (1.9%) |
| 12:00 PM to 3:59 PM | 126 (19.9%) | 42 (10.1%) |
| 4:00 PM to 11:59 PM | 91 (14.4%) | 34 (8.2%) |
| Total | 633 (100.0%) | 414 (100.0%) |
Housing Occupancy in Leipsic
Occupancy by Ownership in Leipsic
Of the total 761 dwellings in Leipsic, owner-occupied units account for 523 (68.7%), while renter-occupied units make up 238 (31.3%).
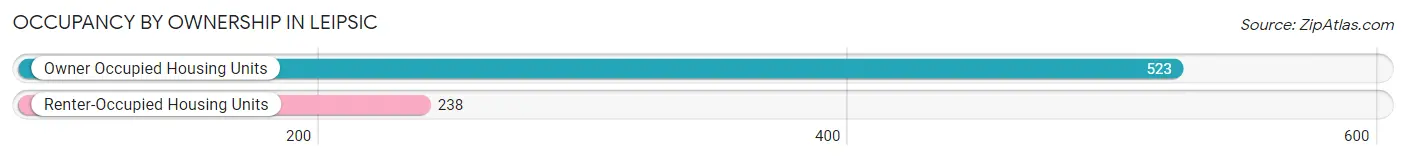
| Occupancy | # Housing Units | % Housing Units |
| Owner Occupied Housing Units | 523 | 68.7% |
| Renter-Occupied Housing Units | 238 | 31.3% |
| Total Occupied Housing Units | 761 | 100.0% |
Occupancy by Household Size in Leipsic
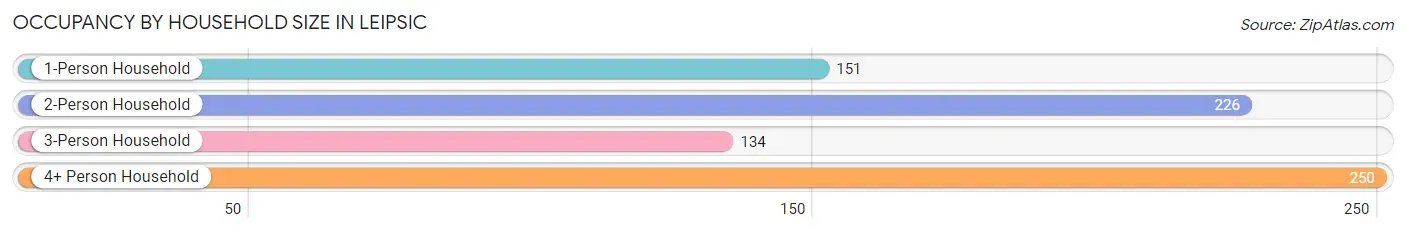
| Household Size | # Housing Units | % Housing Units |
| 1-Person Household | 151 | 19.8% |
| 2-Person Household | 226 | 29.7% |
| 3-Person Household | 134 | 17.6% |
| 4+ Person Household | 250 | 32.9% |
| Total Housing Units | 761 | 100.0% |
Occupancy by Ownership by Household Size in Leipsic
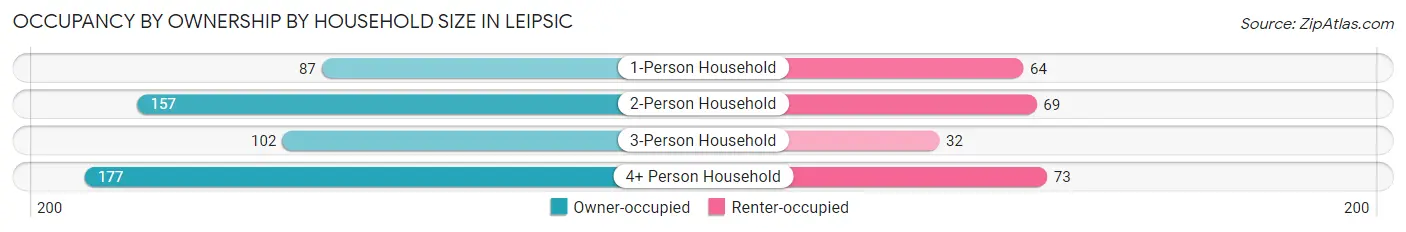
| Household Size | Owner-occupied | Renter-occupied |
| 1-Person Household | 87 (57.6%) | 64 (42.4%) |
| 2-Person Household | 157 (69.5%) | 69 (30.5%) |
| 3-Person Household | 102 (76.1%) | 32 (23.9%) |
| 4+ Person Household | 177 (70.8%) | 73 (29.2%) |
| Total Housing Units | 523 (68.7%) | 238 (31.3%) |
Occupancy by Educational Attainment in Leipsic
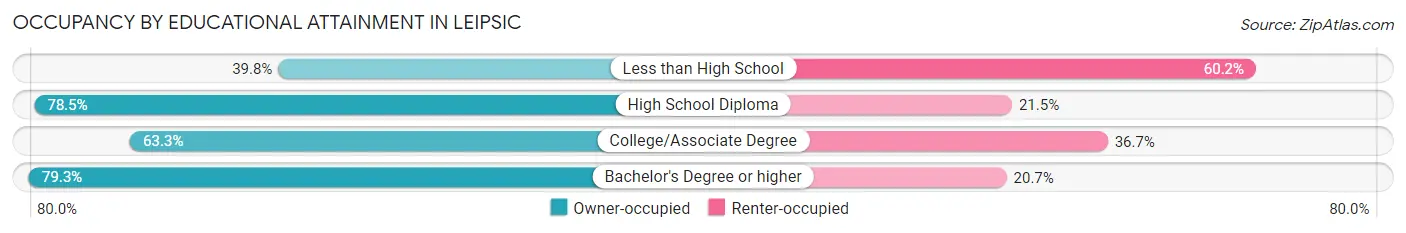
| Household Size | Owner-occupied | Renter-occupied |
| Less than High School | 37 (39.8%) | 56 (60.2%) |
| High School Diploma | 255 (78.5%) | 70 (21.5%) |
| College/Associate Degree | 162 (63.3%) | 94 (36.7%) |
| Bachelor's Degree or higher | 69 (79.3%) | 18 (20.7%) |
Occupancy by Age of Householder in Leipsic
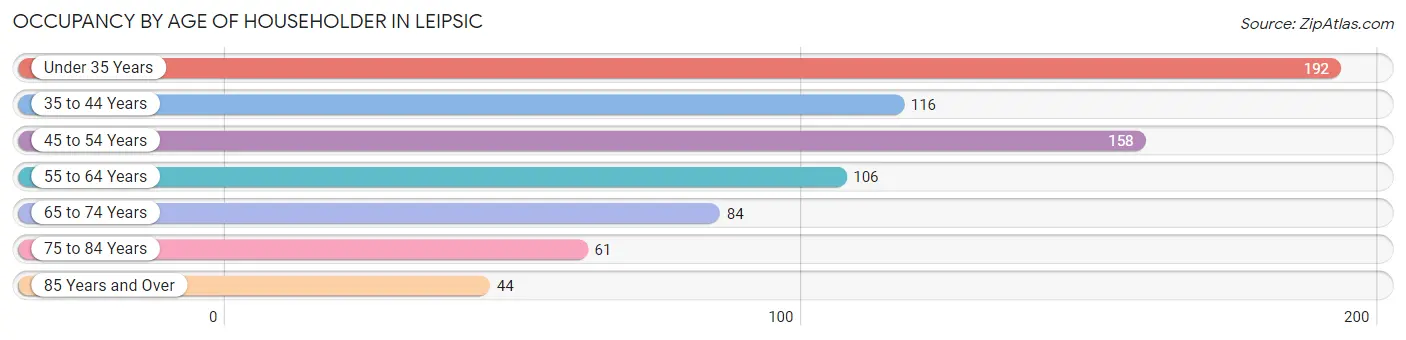
| Age Bracket | # Households | % Households |
| Under 35 Years | 192 | 25.2% |
| 35 to 44 Years | 116 | 15.2% |
| 45 to 54 Years | 158 | 20.8% |
| 55 to 64 Years | 106 | 13.9% |
| 65 to 74 Years | 84 | 11.0% |
| 75 to 84 Years | 61 | 8.0% |
| 85 Years and Over | 44 | 5.8% |
| Total | 761 | 100.0% |
Housing Finances in Leipsic
Median Income by Occupancy in Leipsic
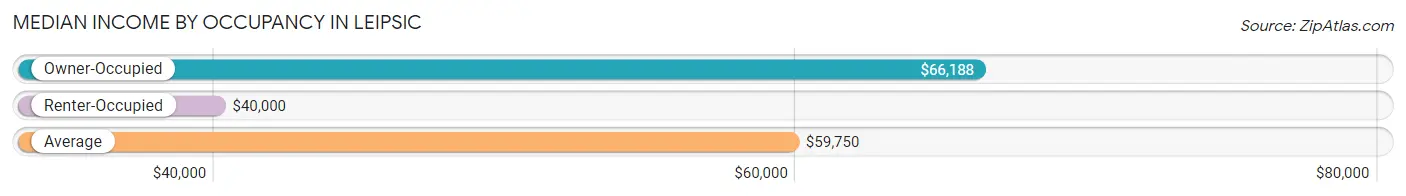
| Occupancy Type | # Households | Median Income |
| Owner-Occupied | 523 (68.7%) | $66,188 |
| Renter-Occupied | 238 (31.3%) | $40,000 |
| Average | 761 (100.0%) | $59,750 |
Occupancy by Householder Income Bracket in Leipsic
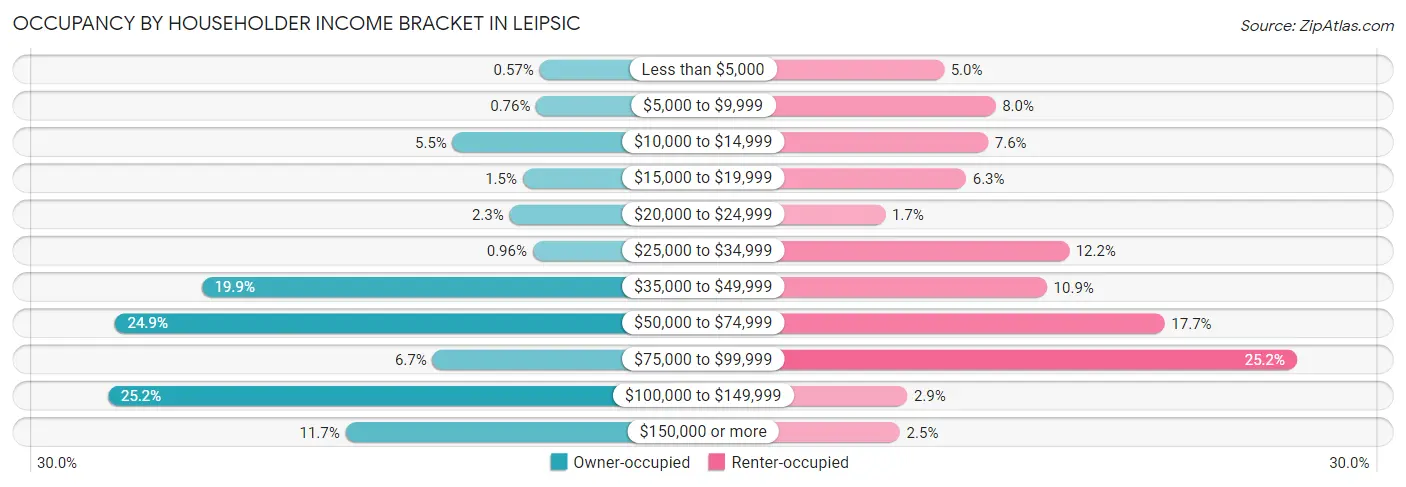
| Income Bracket | Owner-occupied | Renter-occupied |
| Less than $5,000 | 3 (0.6%) | 12 (5.0%) |
| $5,000 to $9,999 | 4 (0.8%) | 19 (8.0%) |
| $10,000 to $14,999 | 29 (5.5%) | 18 (7.6%) |
| $15,000 to $19,999 | 8 (1.5%) | 15 (6.3%) |
| $20,000 to $24,999 | 12 (2.3%) | 4 (1.7%) |
| $25,000 to $34,999 | 5 (1.0%) | 29 (12.2%) |
| $35,000 to $49,999 | 104 (19.9%) | 26 (10.9%) |
| $50,000 to $74,999 | 130 (24.9%) | 42 (17.6%) |
| $75,000 to $99,999 | 35 (6.7%) | 60 (25.2%) |
| $100,000 to $149,999 | 132 (25.2%) | 7 (2.9%) |
| $150,000 or more | 61 (11.7%) | 6 (2.5%) |
| Total | 523 (100.0%) | 238 (100.0%) |
Monthly Housing Cost Tiers in Leipsic
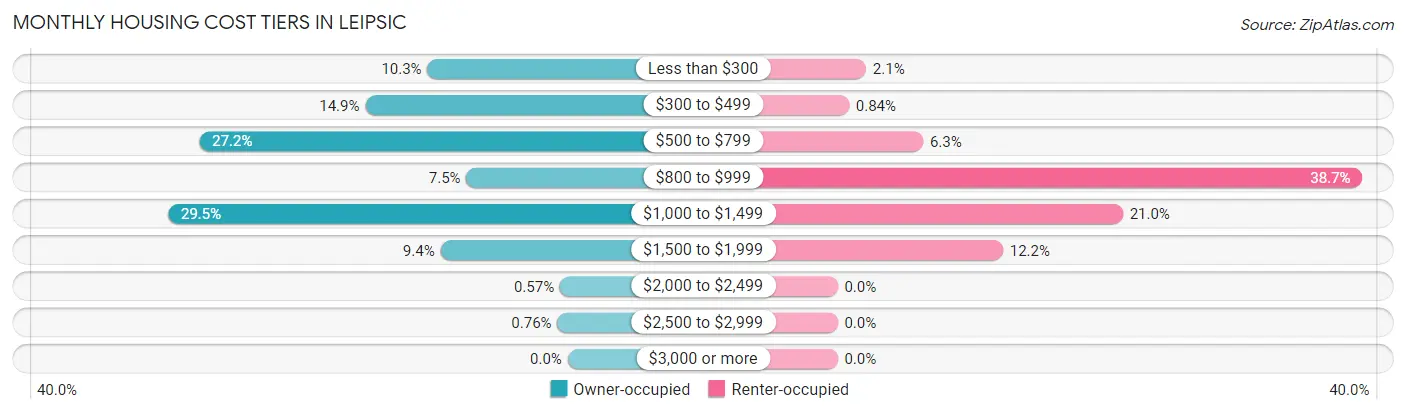
| Monthly Cost | Owner-occupied | Renter-occupied |
| Less than $300 | 54 (10.3%) | 5 (2.1%) |
| $300 to $499 | 78 (14.9%) | 2 (0.8%) |
| $500 to $799 | 142 (27.2%) | 15 (6.3%) |
| $800 to $999 | 39 (7.5%) | 92 (38.7%) |
| $1,000 to $1,499 | 154 (29.4%) | 50 (21.0%) |
| $1,500 to $1,999 | 49 (9.4%) | 29 (12.2%) |
| $2,000 to $2,499 | 3 (0.6%) | 0 (0.0%) |
| $2,500 to $2,999 | 4 (0.8%) | 0 (0.0%) |
| $3,000 or more | 0 (0.0%) | 0 (0.0%) |
| Total | 523 (100.0%) | 238 (100.0%) |
Physical Housing Characteristics in Leipsic
Housing Structures in Leipsic
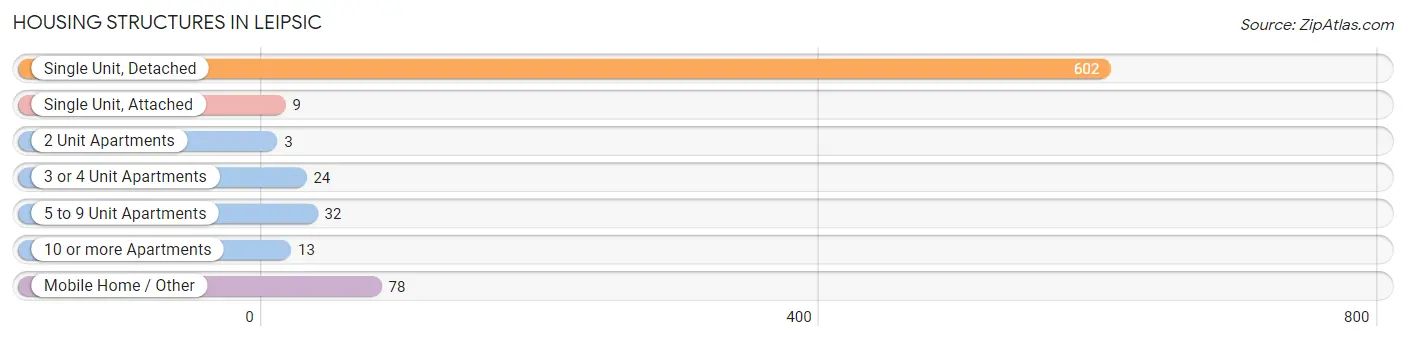
| Structure Type | # Housing Units | % Housing Units |
| Single Unit, Detached | 602 | 79.1% |
| Single Unit, Attached | 9 | 1.2% |
| 2 Unit Apartments | 3 | 0.4% |
| 3 or 4 Unit Apartments | 24 | 3.2% |
| 5 to 9 Unit Apartments | 32 | 4.2% |
| 10 or more Apartments | 13 | 1.7% |
| Mobile Home / Other | 78 | 10.2% |
| Total | 761 | 100.0% |
Housing Structures by Occupancy in Leipsic
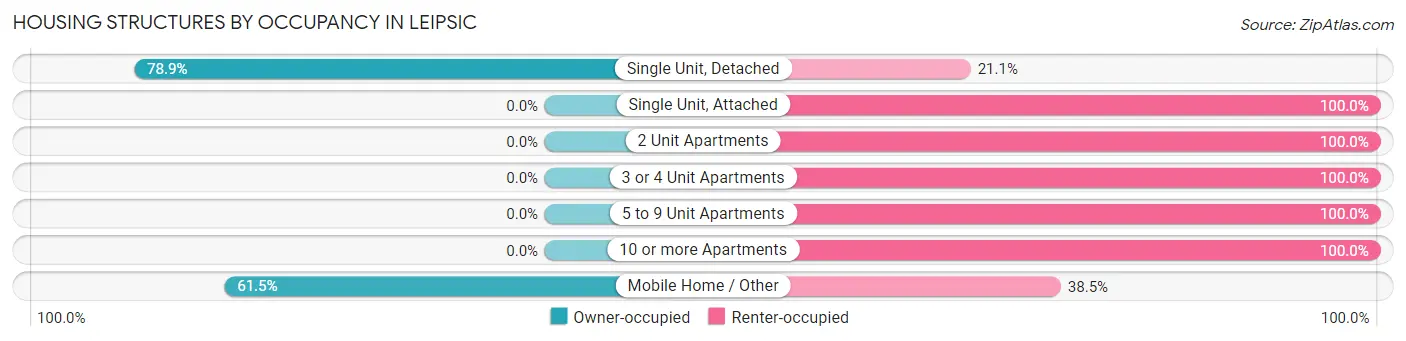
| Structure Type | Owner-occupied | Renter-occupied |
| Single Unit, Detached | 475 (78.9%) | 127 (21.1%) |
| Single Unit, Attached | 0 (0.0%) | 9 (100.0%) |
| 2 Unit Apartments | 0 (0.0%) | 3 (100.0%) |
| 3 or 4 Unit Apartments | 0 (0.0%) | 24 (100.0%) |
| 5 to 9 Unit Apartments | 0 (0.0%) | 32 (100.0%) |
| 10 or more Apartments | 0 (0.0%) | 13 (100.0%) |
| Mobile Home / Other | 48 (61.5%) | 30 (38.5%) |
| Total | 523 (68.7%) | 238 (31.3%) |
Housing Structures by Number of Rooms in Leipsic
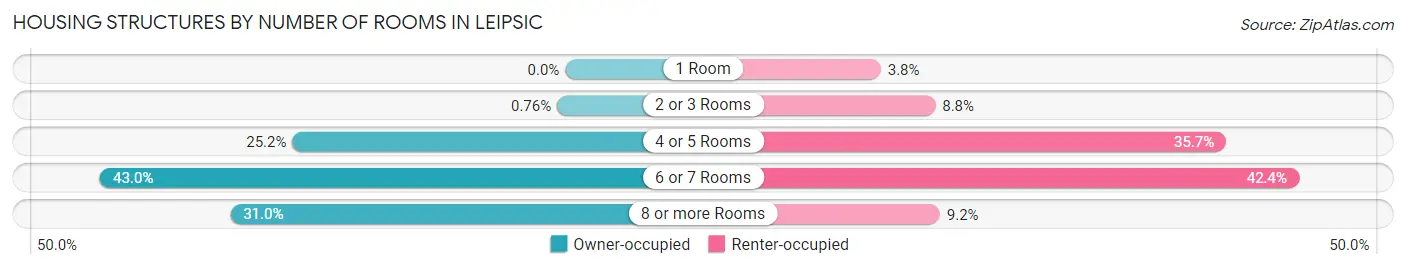
| Number of Rooms | Owner-occupied | Renter-occupied |
| 1 Room | 0 (0.0%) | 9 (3.8%) |
| 2 or 3 Rooms | 4 (0.8%) | 21 (8.8%) |
| 4 or 5 Rooms | 132 (25.2%) | 85 (35.7%) |
| 6 or 7 Rooms | 225 (43.0%) | 101 (42.4%) |
| 8 or more Rooms | 162 (31.0%) | 22 (9.2%) |
| Total | 523 (100.0%) | 238 (100.0%) |
Housing Structure by Heating Type in Leipsic
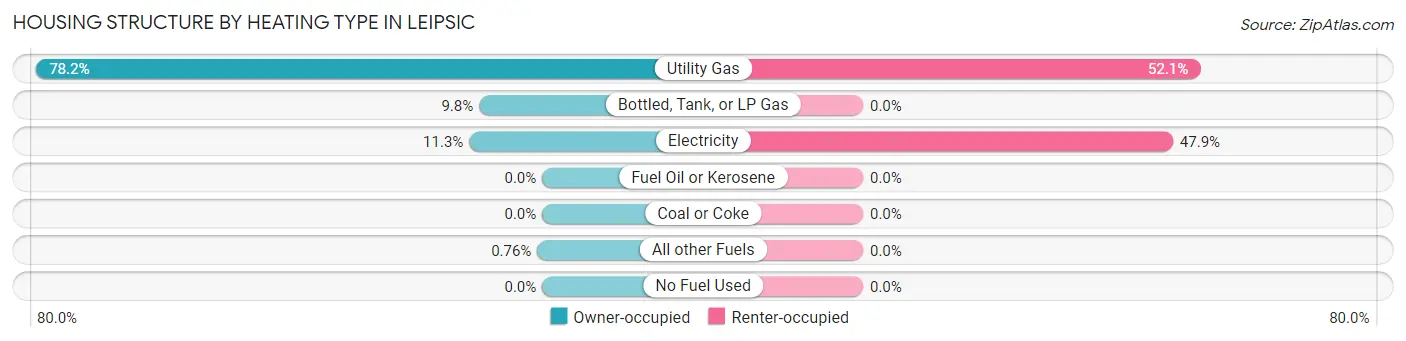
| Heating Type | Owner-occupied | Renter-occupied |
| Utility Gas | 409 (78.2%) | 124 (52.1%) |
| Bottled, Tank, or LP Gas | 51 (9.8%) | 0 (0.0%) |
| Electricity | 59 (11.3%) | 114 (47.9%) |
| Fuel Oil or Kerosene | 0 (0.0%) | 0 (0.0%) |
| Coal or Coke | 0 (0.0%) | 0 (0.0%) |
| All other Fuels | 4 (0.8%) | 0 (0.0%) |
| No Fuel Used | 0 (0.0%) | 0 (0.0%) |
| Total | 523 (100.0%) | 238 (100.0%) |
Household Vehicle Usage in Leipsic
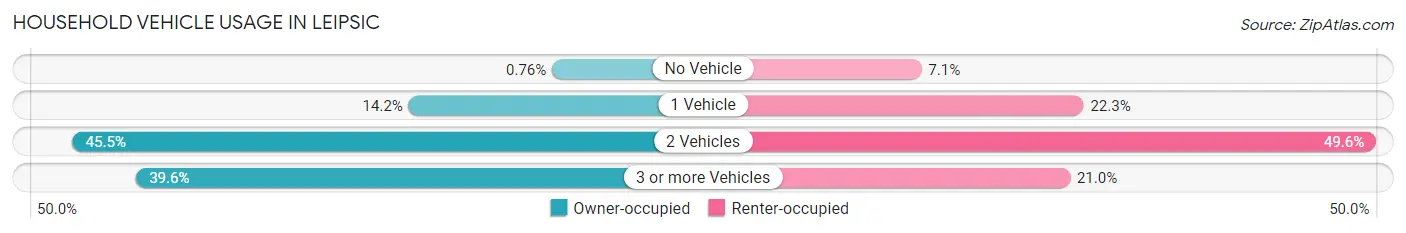
| Vehicles per Household | Owner-occupied | Renter-occupied |
| No Vehicle | 4 (0.8%) | 17 (7.1%) |
| 1 Vehicle | 74 (14.1%) | 53 (22.3%) |
| 2 Vehicles | 238 (45.5%) | 118 (49.6%) |
| 3 or more Vehicles | 207 (39.6%) | 50 (21.0%) |
| Total | 523 (100.0%) | 238 (100.0%) |
Real Estate & Mortgages in Leipsic
Real Estate and Mortgage Overview in Leipsic
| Characteristic | Without Mortgage | With Mortgage |
| Housing Units | 222 | 301 |
| Median Property Value | $94,200 | $104,000 |
| Median Household Income | $55,789 | $37 |
| Monthly Housing Costs | $454 | $0 |
| Real Estate Taxes | $1,046 | $11 |
Property Value by Mortgage Status in Leipsic
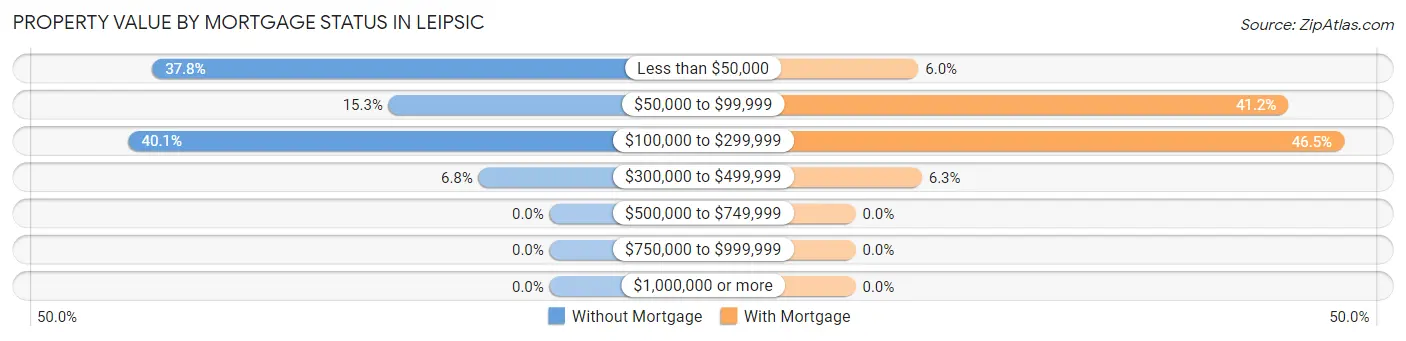
| Property Value | Without Mortgage | With Mortgage |
| Less than $50,000 | 84 (37.8%) | 18 (6.0%) |
| $50,000 to $99,999 | 34 (15.3%) | 124 (41.2%) |
| $100,000 to $299,999 | 89 (40.1%) | 140 (46.5%) |
| $300,000 to $499,999 | 15 (6.8%) | 19 (6.3%) |
| $500,000 to $749,999 | 0 (0.0%) | 0 (0.0%) |
| $750,000 to $999,999 | 0 (0.0%) | 0 (0.0%) |
| $1,000,000 or more | 0 (0.0%) | 0 (0.0%) |
| Total | 222 (100.0%) | 301 (100.0%) |
Household Income by Mortgage Status in Leipsic
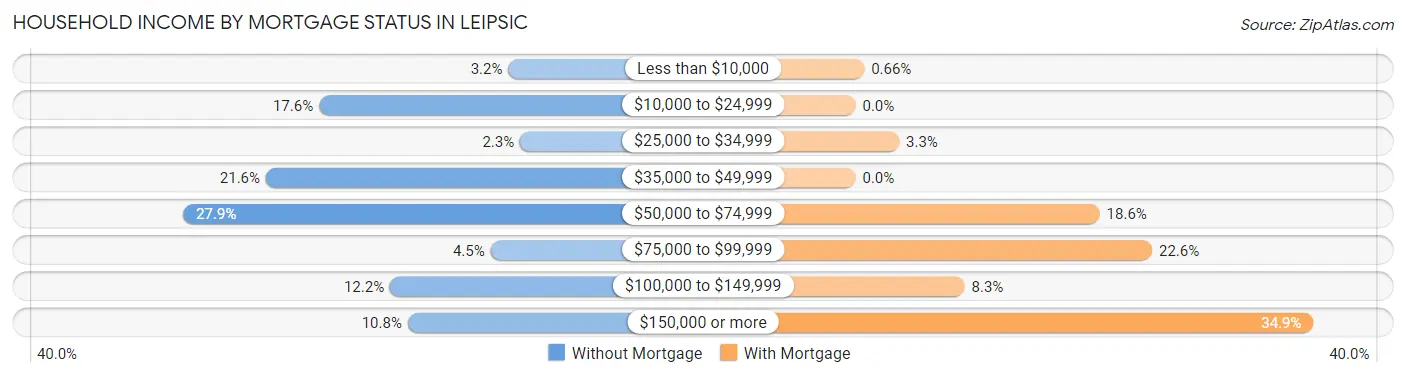
| Household Income | Without Mortgage | With Mortgage |
| Less than $10,000 | 7 (3.2%) | 2 (0.7%) |
| $10,000 to $24,999 | 39 (17.6%) | 0 (0.0%) |
| $25,000 to $34,999 | 5 (2.2%) | 10 (3.3%) |
| $35,000 to $49,999 | 48 (21.6%) | 0 (0.0%) |
| $50,000 to $74,999 | 62 (27.9%) | 56 (18.6%) |
| $75,000 to $99,999 | 10 (4.5%) | 68 (22.6%) |
| $100,000 to $149,999 | 27 (12.2%) | 25 (8.3%) |
| $150,000 or more | 24 (10.8%) | 105 (34.9%) |
| Total | 222 (100.0%) | 301 (100.0%) |
Property Value to Household Income Ratio in Leipsic
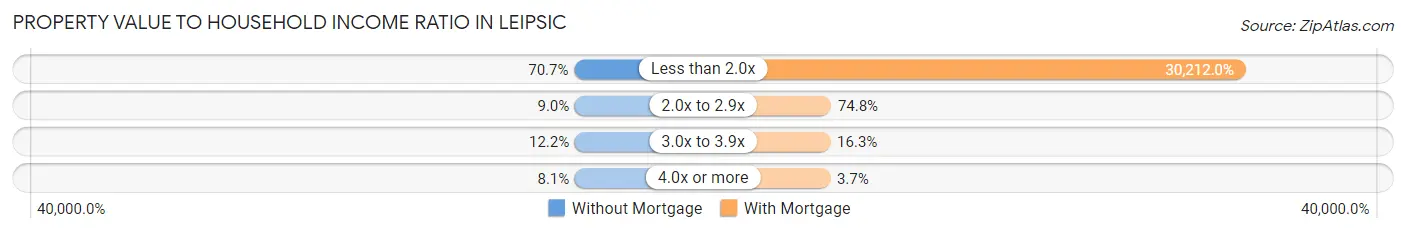
| Value-to-Income Ratio | Without Mortgage | With Mortgage |
| Less than 2.0x | 157 (70.7%) | 90,938 (30,212.0%) |
| 2.0x to 2.9x | 20 (9.0%) | 225 (74.8%) |
| 3.0x to 3.9x | 27 (12.2%) | 49 (16.3%) |
| 4.0x or more | 18 (8.1%) | 11 (3.6%) |
| Total | 222 (100.0%) | 301 (100.0%) |
Real Estate Taxes by Mortgage Status in Leipsic
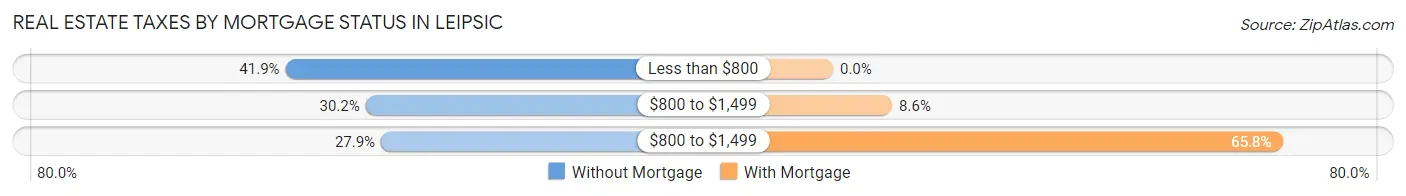
| Property Taxes | Without Mortgage | With Mortgage |
| Less than $800 | 93 (41.9%) | 0 (0.0%) |
| $800 to $1,499 | 67 (30.2%) | 26 (8.6%) |
| $800 to $1,499 | 62 (27.9%) | 198 (65.8%) |
| Total | 222 (100.0%) | 301 (100.0%) |
Health & Disability in Leipsic
Health Insurance Coverage by Age in Leipsic
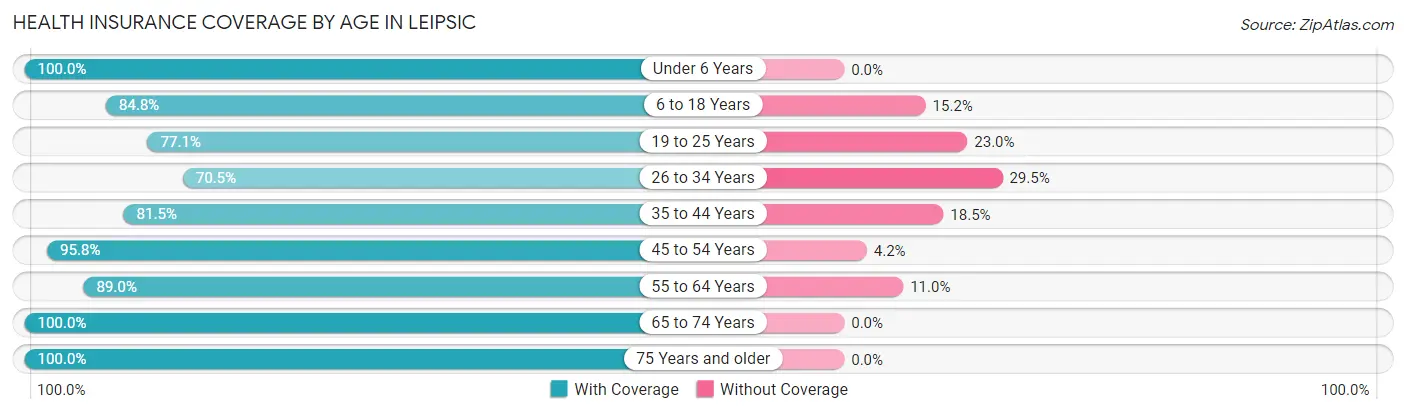
| Age Bracket | With Coverage | Without Coverage |
| Under 6 Years | 263 (100.0%) | 0 (0.0%) |
| 6 to 18 Years | 369 (84.8%) | 66 (15.2%) |
| 19 to 25 Years | 141 (77.0%) | 42 (23.0%) |
| 26 to 34 Years | 196 (70.5%) | 82 (29.5%) |
| 35 to 44 Years | 150 (81.5%) | 34 (18.5%) |
| 45 to 54 Years | 273 (95.8%) | 12 (4.2%) |
| 55 to 64 Years | 162 (89.0%) | 20 (11.0%) |
| 65 to 74 Years | 174 (100.0%) | 0 (0.0%) |
| 75 Years and older | 174 (100.0%) | 0 (0.0%) |
| Total | 1,902 (88.1%) | 256 (11.9%) |
Health Insurance Coverage by Citizenship Status in Leipsic
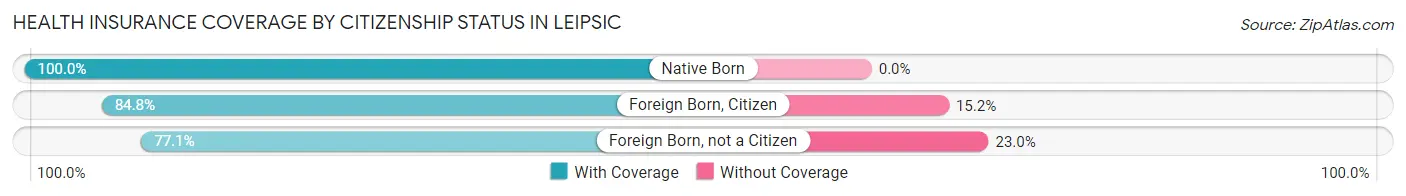
| Citizenship Status | With Coverage | Without Coverage |
| Native Born | 263 (100.0%) | 0 (0.0%) |
| Foreign Born, Citizen | 369 (84.8%) | 66 (15.2%) |
| Foreign Born, not a Citizen | 141 (77.0%) | 42 (23.0%) |
Health Insurance Coverage by Household Income in Leipsic
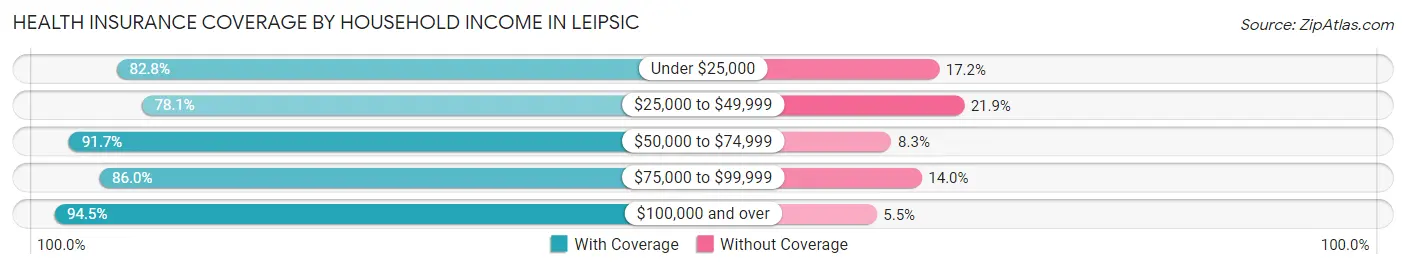
| Household Income | With Coverage | Without Coverage |
| Under $25,000 | 312 (82.8%) | 65 (17.2%) |
| $25,000 to $49,999 | 296 (78.1%) | 83 (21.9%) |
| $50,000 to $74,999 | 386 (91.7%) | 35 (8.3%) |
| $75,000 to $99,999 | 197 (86.0%) | 32 (14.0%) |
| $100,000 and over | 699 (94.5%) | 41 (5.5%) |
Public vs Private Health Insurance Coverage by Age in Leipsic
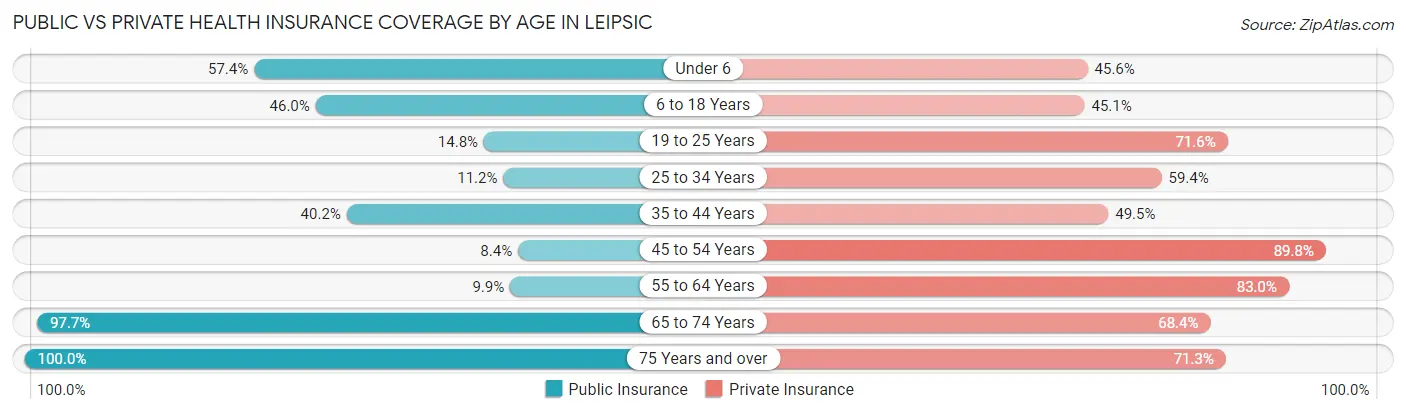
| Age Bracket | Public Insurance | Private Insurance |
| Under 6 | 151 (57.4%) | 120 (45.6%) |
| 6 to 18 Years | 200 (46.0%) | 196 (45.1%) |
| 19 to 25 Years | 27 (14.7%) | 131 (71.6%) |
| 25 to 34 Years | 31 (11.2%) | 165 (59.4%) |
| 35 to 44 Years | 74 (40.2%) | 91 (49.5%) |
| 45 to 54 Years | 24 (8.4%) | 256 (89.8%) |
| 55 to 64 Years | 18 (9.9%) | 151 (83.0%) |
| 65 to 74 Years | 170 (97.7%) | 119 (68.4%) |
| 75 Years and over | 174 (100.0%) | 124 (71.3%) |
| Total | 869 (40.3%) | 1,353 (62.7%) |
Disability Status by Sex by Age in Leipsic
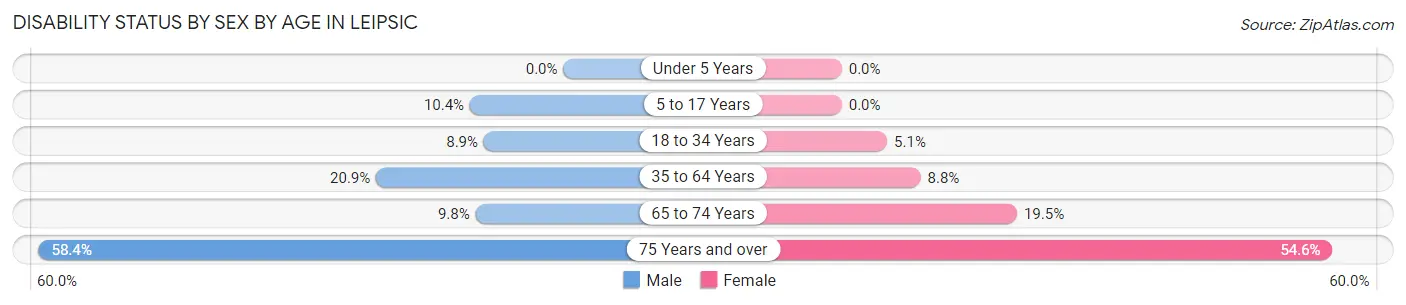
| Age Bracket | Male | Female |
| Under 5 Years | 0 (0.0%) | 0 (0.0%) |
| 5 to 17 Years | 26 (10.4%) | 0 (0.0%) |
| 18 to 34 Years | 30 (8.8%) | 10 (5.1%) |
| 35 to 64 Years | 74 (20.8%) | 26 (8.8%) |
| 65 to 74 Years | 9 (9.8%) | 16 (19.5%) |
| 75 Years and over | 45 (58.4%) | 53 (54.6%) |
Disability Class by Sex by Age in Leipsic
Disability Class: Hearing Difficulty
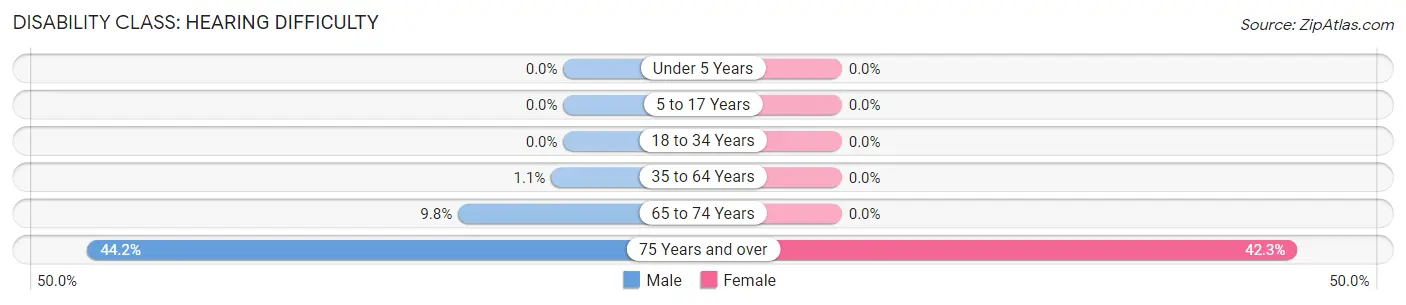
| Age Bracket | Male | Female |
| Under 5 Years | 0 (0.0%) | 0 (0.0%) |
| 5 to 17 Years | 0 (0.0%) | 0 (0.0%) |
| 18 to 34 Years | 0 (0.0%) | 0 (0.0%) |
| 35 to 64 Years | 4 (1.1%) | 0 (0.0%) |
| 65 to 74 Years | 9 (9.8%) | 0 (0.0%) |
| 75 Years and over | 34 (44.2%) | 41 (42.3%) |
Disability Class: Vision Difficulty
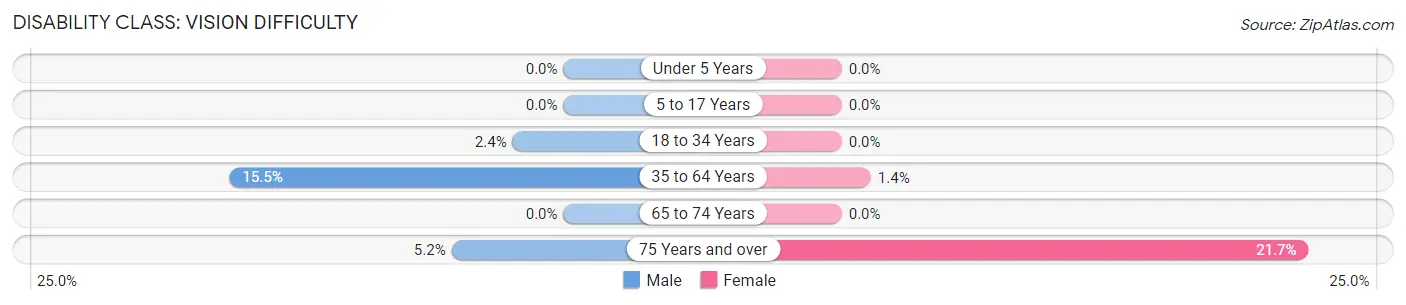
| Age Bracket | Male | Female |
| Under 5 Years | 0 (0.0%) | 0 (0.0%) |
| 5 to 17 Years | 0 (0.0%) | 0 (0.0%) |
| 18 to 34 Years | 8 (2.4%) | 0 (0.0%) |
| 35 to 64 Years | 55 (15.5%) | 4 (1.3%) |
| 65 to 74 Years | 0 (0.0%) | 0 (0.0%) |
| 75 Years and over | 4 (5.2%) | 21 (21.6%) |
Disability Class: Cognitive Difficulty
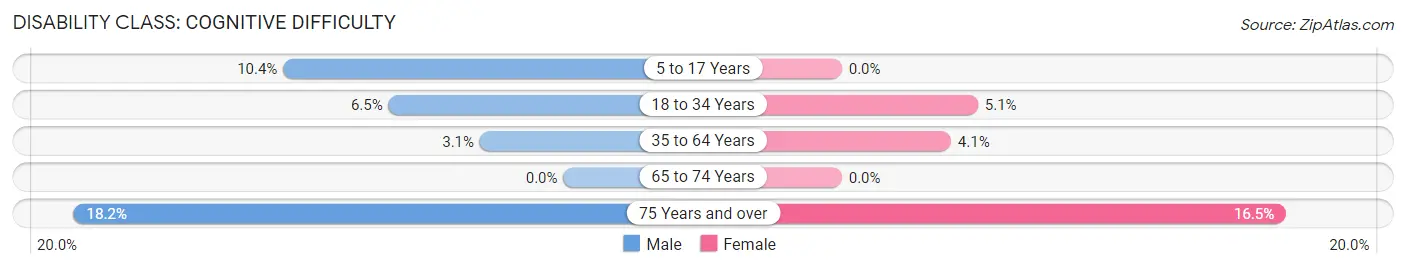
| Age Bracket | Male | Female |
| 5 to 17 Years | 26 (10.4%) | 0 (0.0%) |
| 18 to 34 Years | 22 (6.5%) | 10 (5.1%) |
| 35 to 64 Years | 11 (3.1%) | 12 (4.1%) |
| 65 to 74 Years | 0 (0.0%) | 0 (0.0%) |
| 75 Years and over | 14 (18.2%) | 16 (16.5%) |
Disability Class: Ambulatory Difficulty
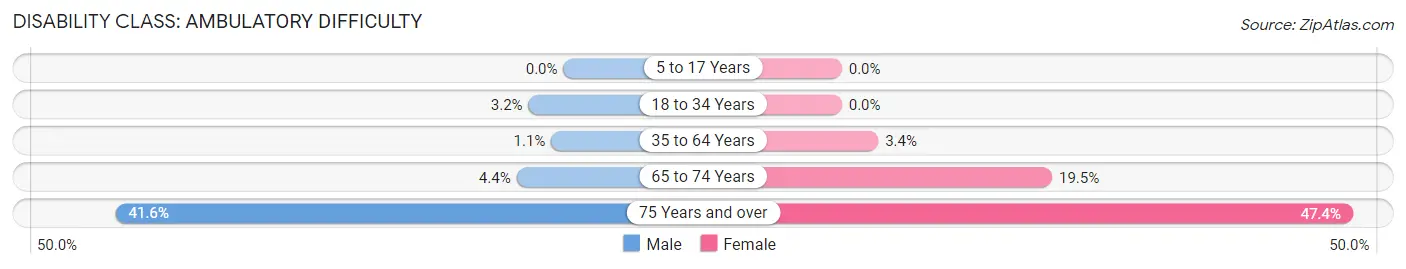
| Age Bracket | Male | Female |
| 5 to 17 Years | 0 (0.0%) | 0 (0.0%) |
| 18 to 34 Years | 11 (3.2%) | 0 (0.0%) |
| 35 to 64 Years | 4 (1.1%) | 10 (3.4%) |
| 65 to 74 Years | 4 (4.3%) | 16 (19.5%) |
| 75 Years and over | 32 (41.6%) | 46 (47.4%) |
Disability Class: Self-Care Difficulty
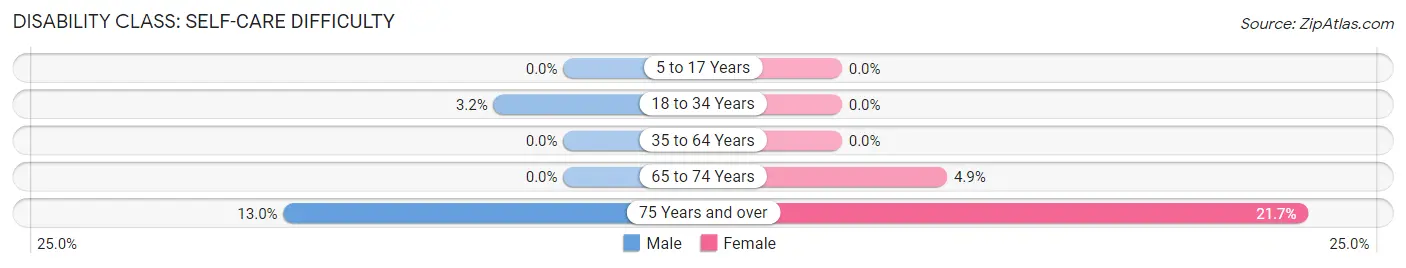
| Age Bracket | Male | Female |
| 5 to 17 Years | 0 (0.0%) | 0 (0.0%) |
| 18 to 34 Years | 11 (3.2%) | 0 (0.0%) |
| 35 to 64 Years | 0 (0.0%) | 0 (0.0%) |
| 65 to 74 Years | 0 (0.0%) | 4 (4.9%) |
| 75 Years and over | 10 (13.0%) | 21 (21.6%) |
Technology Access in Leipsic
Computing Device Access in Leipsic
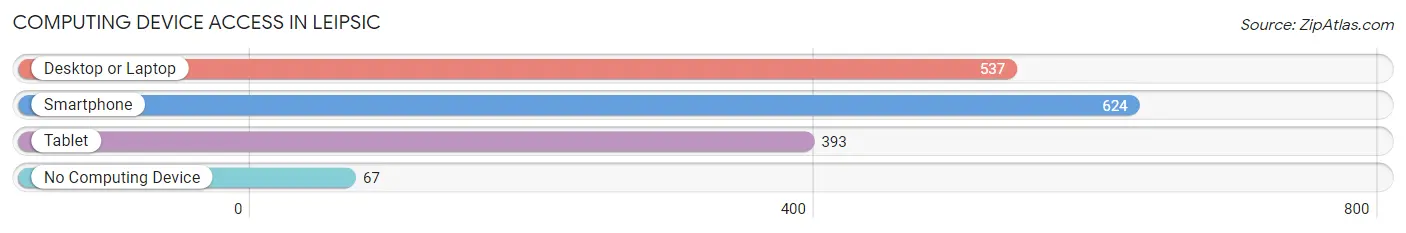
| Device Type | # Households | % Households |
| Desktop or Laptop | 537 | 70.6% |
| Smartphone | 624 | 82.0% |
| Tablet | 393 | 51.6% |
| No Computing Device | 67 | 8.8% |
| Total | 761 | 100.0% |
Internet Access in Leipsic
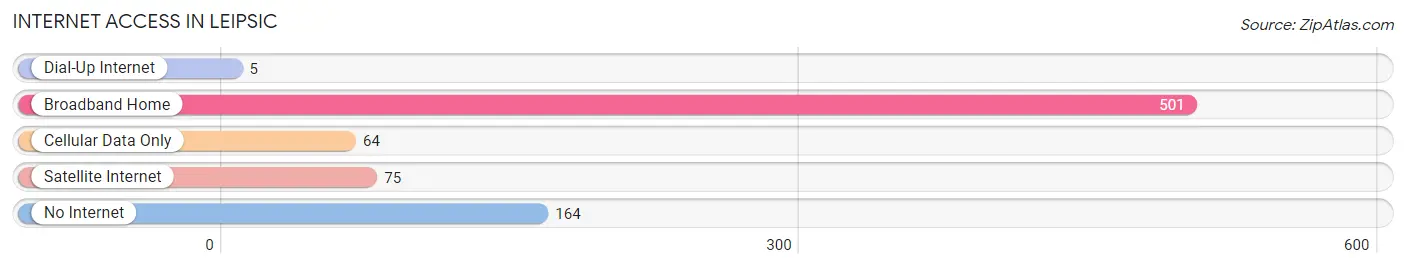
| Internet Type | # Households | % Households |
| Dial-Up Internet | 5 | 0.7% |
| Broadband Home | 501 | 65.8% |
| Cellular Data Only | 64 | 8.4% |
| Satellite Internet | 75 | 9.9% |
| No Internet | 164 | 21.5% |
| Total | 761 | 100.0% |
Leipsic Summary
Leipsic, Ohio is a small village located in Putnam County, Ohio. It is situated along the Blanchard River, approximately 30 miles southwest of Toledo. The village has a population of 1,845 people, according to the 2010 census.
History
Leipsic was founded in 1837 by German immigrants who had come to the area from Pennsylvania. The village was named after the city of Leipzig in Germany. The first settlers were mostly farmers, and the village grew slowly over the years. In 1854, the first post office was established, and the village was officially incorporated in 1867.
In the late 19th century, Leipsic became a center for the production of brick and tile. The village was home to several brickyards, and the brick and tile industry was a major source of employment for the local population. The brickyards eventually closed in the early 20th century, and the village shifted its focus to agriculture.
Geography
Leipsic is located in northwestern Ohio, in Putnam County. It is situated along the Blanchard River, approximately 30 miles southwest of Toledo. The village has a total area of 1.2 square miles, all of which is land. The terrain is mostly flat, with some rolling hills in the surrounding area.
Economy
The economy of Leipsic is largely based on agriculture. The village is home to several farms, which produce a variety of crops, including corn, soybeans, and wheat. The village also has several small businesses, including a grocery store, a hardware store, and a few restaurants.
Demographics
According to the 2010 census, Leipsic has a population of 1,845 people. The racial makeup of the village is 97.3% White, 0.7% African American, 0.2% Native American, 0.2% Asian, and 1.6% from other races. The median household income is $45,938, and the median age is 40.7 years.
Leipsic is a small village with a rich history and a strong agricultural economy. The village is home to a diverse population, and it offers a variety of amenities and services to its residents. With its close proximity to Toledo, Leipsic is an ideal place to live for those looking for a quiet, rural lifestyle.
Common Questions
What is Per Capita Income in Leipsic?
Per Capita income in Leipsic is $26,154.
What is the Median Family Income in Leipsic?
Median Family Income in Leipsic is $69,375.
What is the Median Household income in Leipsic?
Median Household Income in Leipsic is $59,750.
What is Income or Wage Gap in Leipsic?
Income or Wage Gap in Leipsic is 8.3%.
Women in Leipsic earn 91.7 cents for every dollar earned by a man.
What is Inequality or Gini Index in Leipsic?
Inequality or Gini Index in Leipsic is 0.39.
What is the Total Population of Leipsic?
Total Population of Leipsic is 2,215.
What is the Total Male Population of Leipsic?
Total Male Population of Leipsic is 1,236.
What is the Total Female Population of Leipsic?
Total Female Population of Leipsic is 979.
What is the Ratio of Males per 100 Females in Leipsic?
There are 126.25 Males per 100 Females in Leipsic.
What is the Ratio of Females per 100 Males in Leipsic?
There are 79.21 Females per 100 Males in Leipsic.
What is the Median Population Age in Leipsic?
Median Population Age in Leipsic is 31.0 Years.
What is the Average Family Size in Leipsic
Average Family Size in Leipsic is 3.3 People.
What is the Average Household Size in Leipsic
Average Household Size in Leipsic is 2.8 People.
How Large is the Labor Force in Leipsic?
There are 1,131 People in the Labor Forcein in Leipsic.
What is the Percentage of People in the Labor Force in Leipsic?
68.9% of People are in the Labor Force in Leipsic.
What is the Unemployment Rate in Leipsic?
Unemployment Rate in Leipsic is 3.1%.