Kimbolton, OH Map & Demographics
Kimbolton Map
Kimbolton Overview
$38,298
PER CAPITA INCOME
$83,424
AVG FAMILY INCOME
0.47
INEQUALITY / GINI INDEX
130
TOTAL POPULATION
73
MALE POPULATION
57
FEMALE POPULATION
128.07
MALES / 100 FEMALES
78.08
FEMALES / 100 MALES
58.4
MEDIAN AGE
2.1
AVG FAMILY SIZE
1.6
AVG HOUSEHOLD SIZE
43
LABOR FORCE [ PEOPLE ]
36.8%
PERCENT IN LABOR FORCE
Kimbolton Zip Codes
Income in Kimbolton
Income Overview in Kimbolton
| Characteristic | Number | Measure |
| Per Capita Income | 130 | $38,298 |
| Median Family Income | 43 | $83,424 |
| Mean Family Income | 43 | $98,972 |
| Median Household Income | 81 | $0 |
| Mean Household Income | 81 | $62,740 |
| Income Deficit | 43 | $0 |
| Wage / Income Gap (%) | 130 | 0.00% |
| Wage / Income Gap ($) | 130 | 100.00¢ per $1 |
| Gini / Inequality Index | 130 | 0.47 |
Earnings by Sex in Kimbolton
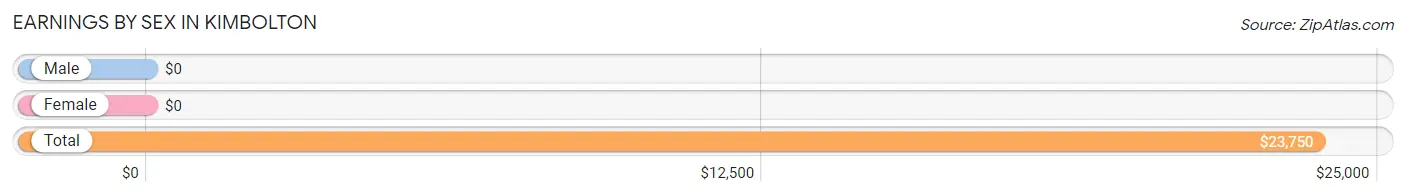
| Sex | Number | Average Earnings |
| Male | 20 (40.0%) | $0 |
| Female | 30 (60.0%) | $0 |
| Total | 50 (100.0%) | $23,750 |
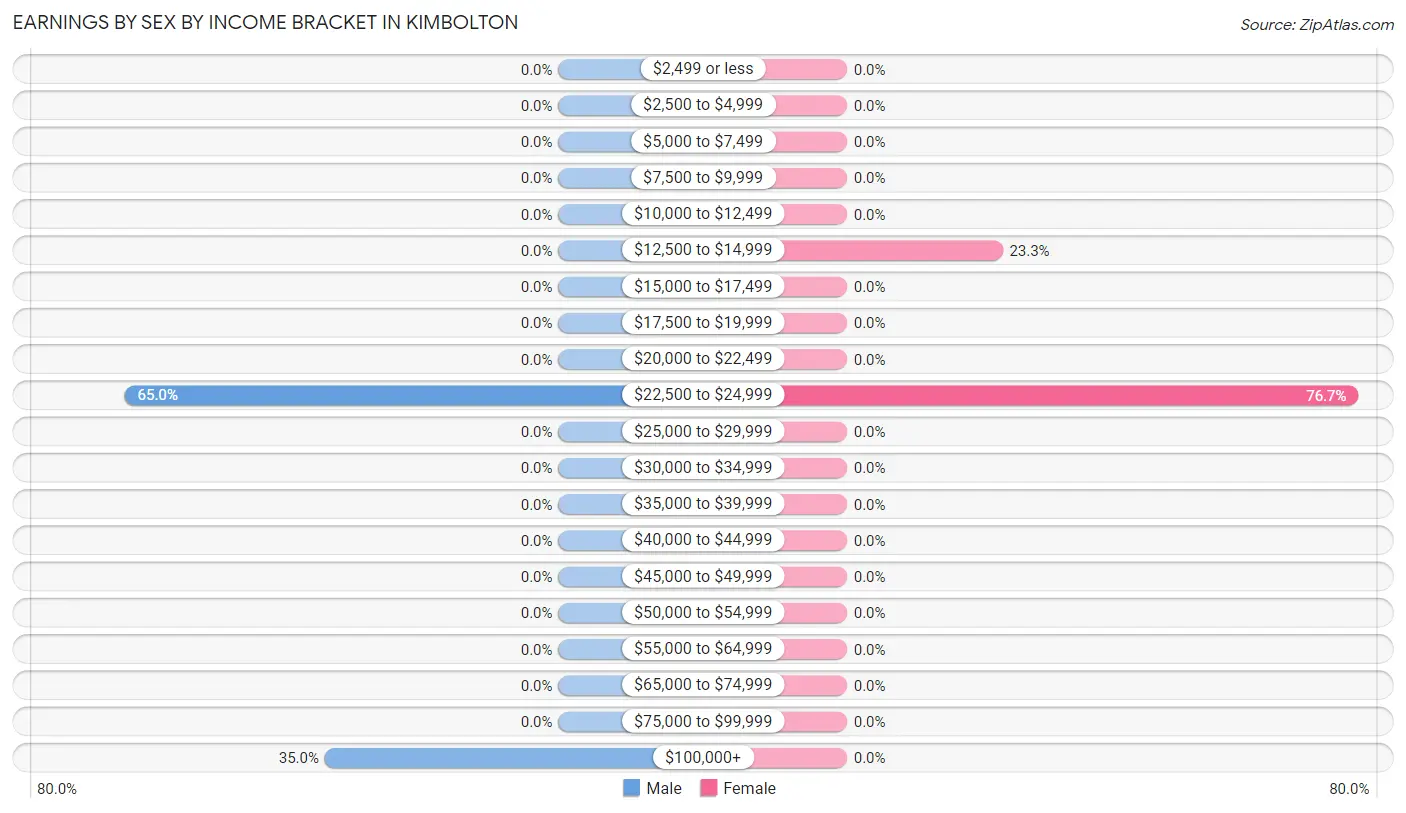
Earnings by Sex by Income Bracket in Kimbolton
The most common earnings brackets in Kimbolton are $22,500 to $24,999 for men (13 | 65.0%) and $22,500 to $24,999 for women (23 | 76.7%).
| Income | Male | Female |
| $2,499 or less | 0 (0.0%) | 0 (0.0%) |
| $2,500 to $4,999 | 0 (0.0%) | 0 (0.0%) |
| $5,000 to $7,499 | 0 (0.0%) | 0 (0.0%) |
| $7,500 to $9,999 | 0 (0.0%) | 0 (0.0%) |
| $10,000 to $12,499 | 0 (0.0%) | 0 (0.0%) |
| $12,500 to $14,999 | 0 (0.0%) | 7 (23.3%) |
| $15,000 to $17,499 | 0 (0.0%) | 0 (0.0%) |
| $17,500 to $19,999 | 0 (0.0%) | 0 (0.0%) |
| $20,000 to $22,499 | 0 (0.0%) | 0 (0.0%) |
| $22,500 to $24,999 | 13 (65.0%) | 23 (76.7%) |
| $25,000 to $29,999 | 0 (0.0%) | 0 (0.0%) |
| $30,000 to $34,999 | 0 (0.0%) | 0 (0.0%) |
| $35,000 to $39,999 | 0 (0.0%) | 0 (0.0%) |
| $40,000 to $44,999 | 0 (0.0%) | 0 (0.0%) |
| $45,000 to $49,999 | 0 (0.0%) | 0 (0.0%) |
| $50,000 to $54,999 | 0 (0.0%) | 0 (0.0%) |
| $55,000 to $64,999 | 0 (0.0%) | 0 (0.0%) |
| $65,000 to $74,999 | 0 (0.0%) | 0 (0.0%) |
| $75,000 to $99,999 | 0 (0.0%) | 0 (0.0%) |
| $100,000+ | 7 (35.0%) | 0 (0.0%) |
| Total | 20 (100.0%) | 30 (100.0%) |
Earnings by Sex by Educational Attainment in Kimbolton
| Educational Attainment | Male Income | Female Income |
| Less than High School | - | - |
| High School Diploma | - | - |
| College or Associate's Degree | - | - |
| Bachelor's Degree | - | - |
| Graduate Degree | - | - |
| Total | - | - |
Family Income in Kimbolton
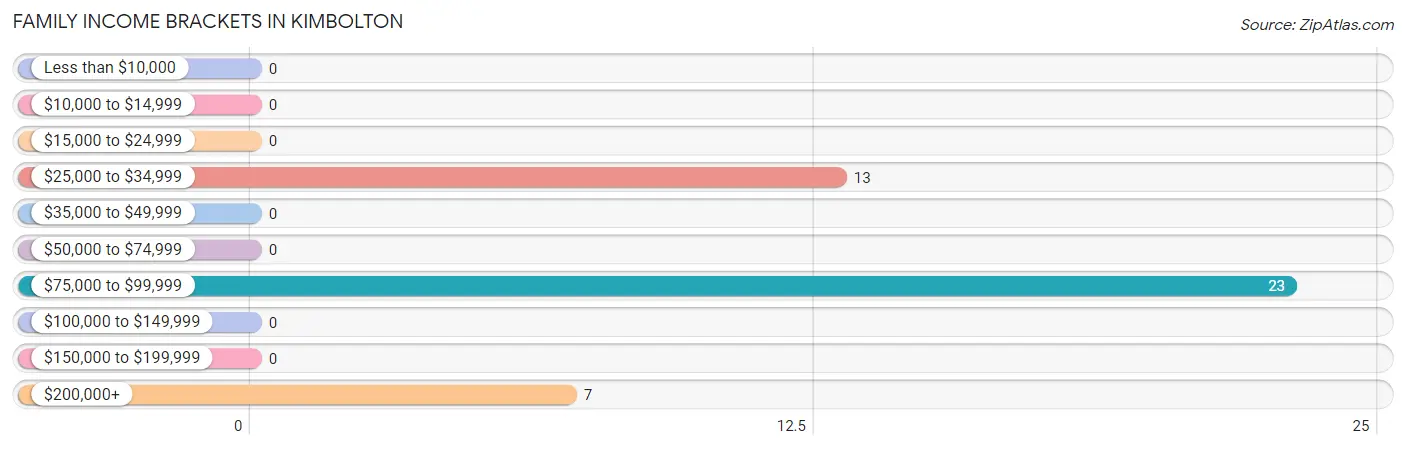
Family Income Brackets in Kimbolton
According to the Kimbolton family income data, there are 23 families falling into the $75,000 to $99,999 income range, which is the most common income bracket and makes up 53.5% of all families.
| Income Bracket | # Families | % Families |
| Less than $10,000 | 0 | 0.0% |
| $10,000 to $14,999 | 0 | 0.0% |
| $15,000 to $24,999 | 0 | 0.0% |
| $25,000 to $34,999 | 13 | 30.2% |
| $35,000 to $49,999 | 0 | 0.0% |
| $50,000 to $74,999 | 0 | 0.0% |
| $75,000 to $99,999 | 23 | 53.5% |
| $100,000 to $149,999 | 0 | 0.0% |
| $150,000 to $199,999 | 0 | 0.0% |
| $200,000+ | 7 | 16.3% |
Family Income by Famaliy Size in Kimbolton
| Income Bracket | # Families | Median Income |
| 2-Person Families | 36 (83.7%) | $0 |
| 3-Person Families | 0 (0.0%) | $0 |
| 4-Person Families | 7 (16.3%) | $0 |
| 5-Person Families | 0 (0.0%) | $0 |
| 6-Person Families | 0 (0.0%) | $0 |
| 7+ Person Families | 0 (0.0%) | $0 |
| Total | 43 (100.0%) | $83,424 |
Family Income by Number of Earners in Kimbolton
| Number of Earners | # Families | Median Income |
| No Earners | 0 (0.0%) | $0 |
| 1 Earner | 36 (83.7%) | $0 |
| 2 Earners | 7 (16.3%) | $0 |
| 3+ Earners | 0 (0.0%) | $0 |
| Total | 43 (100.0%) | $83,424 |
Household Income in Kimbolton
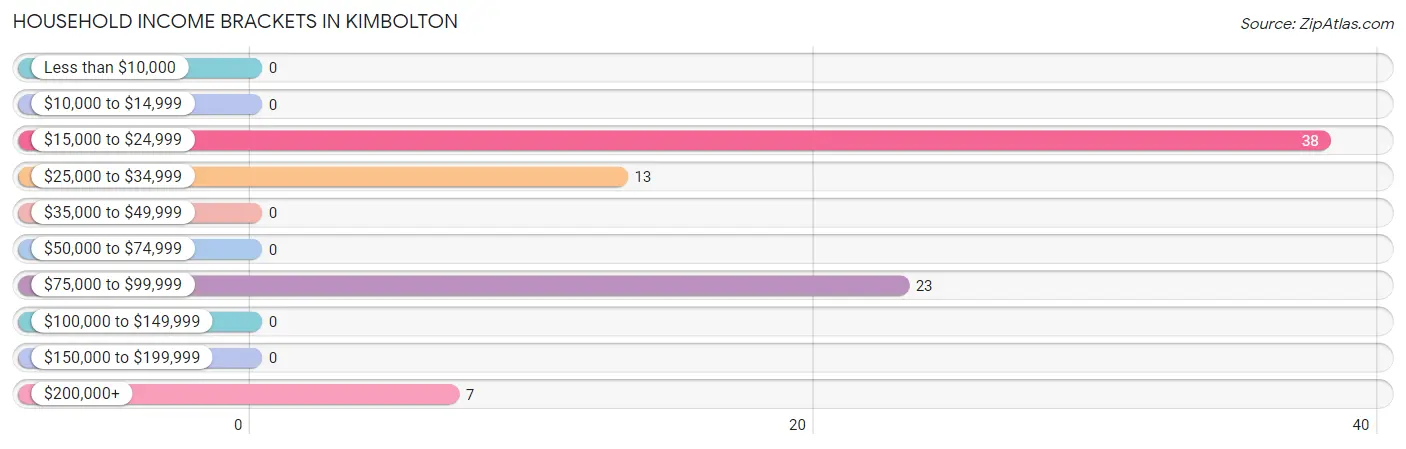
Household Income Brackets in Kimbolton
With 38 households falling in the category, the $15,000 to $24,999 income range is the most frequent in Kimbolton, accounting for 46.9% of all households.
| Income Bracket | # Households | % Households |
| Less than $10,000 | 0 | 0.0% |
| $10,000 to $14,999 | 0 | 0.0% |
| $15,000 to $24,999 | 38 | 46.9% |
| $25,000 to $34,999 | 13 | 16.0% |
| $35,000 to $49,999 | 0 | 0.0% |
| $50,000 to $74,999 | 0 | 0.0% |
| $75,000 to $99,999 | 23 | 28.4% |
| $100,000 to $149,999 | 0 | 0.0% |
| $150,000 to $199,999 | 0 | 0.0% |
| $200,000+ | 7 | 8.6% |
Household Income by Householder Age in Kimbolton
| Income Bracket | # Households | Median Income |
| 15 to 24 Years | 0 (0.0%) | $0 |
| 25 to 44 Years | 7 (8.6%) | $0 |
| 45 to 64 Years | 51 (63.0%) | $0 |
| 65+ Years | 23 (28.4%) | $0 |
| Total | 81 (100.0%) | $0 |
Poverty in Kimbolton
Income Below Poverty by Sex and Age in Kimbolton
| Age Bracket | Male | Female |
| Under 5 Years | 0 (0.0%) | 0 (0.0%) |
| 5 Years | 0 (0.0%) | 0 (0.0%) |
| 6 to 11 Years | 0 (0.0%) | 0 (0.0%) |
| 12 to 14 Years | 0 (0.0%) | 0 (0.0%) |
| 15 Years | 0 (0.0%) | 0 (0.0%) |
| 16 and 17 Years | 0 (0.0%) | 0 (0.0%) |
| 18 to 24 Years | 0 (0.0%) | 0 (0.0%) |
| 25 to 34 Years | 0 (0.0%) | 0 (0.0%) |
| 35 to 44 Years | 0 (0.0%) | 0 (0.0%) |
| 45 to 54 Years | 0 (0.0%) | 0 (0.0%) |
| 55 to 64 Years | 0 (0.0%) | 0 (0.0%) |
| 65 to 74 Years | 0 (0.0%) | 0 (0.0%) |
| 75 Years and over | 0 (0.0%) | 0 (0.0%) |
| Total | 0 (0.0%) | 0 (0.0%) |
Income Above Poverty by Sex and Age in Kimbolton
According to the poverty statistics in Kimbolton, males aged 6 to 11 years and females aged under 5 years are the age groups that are most secure financially, with 100.0% of males and 100.0% of females in these age groups living above the poverty line.
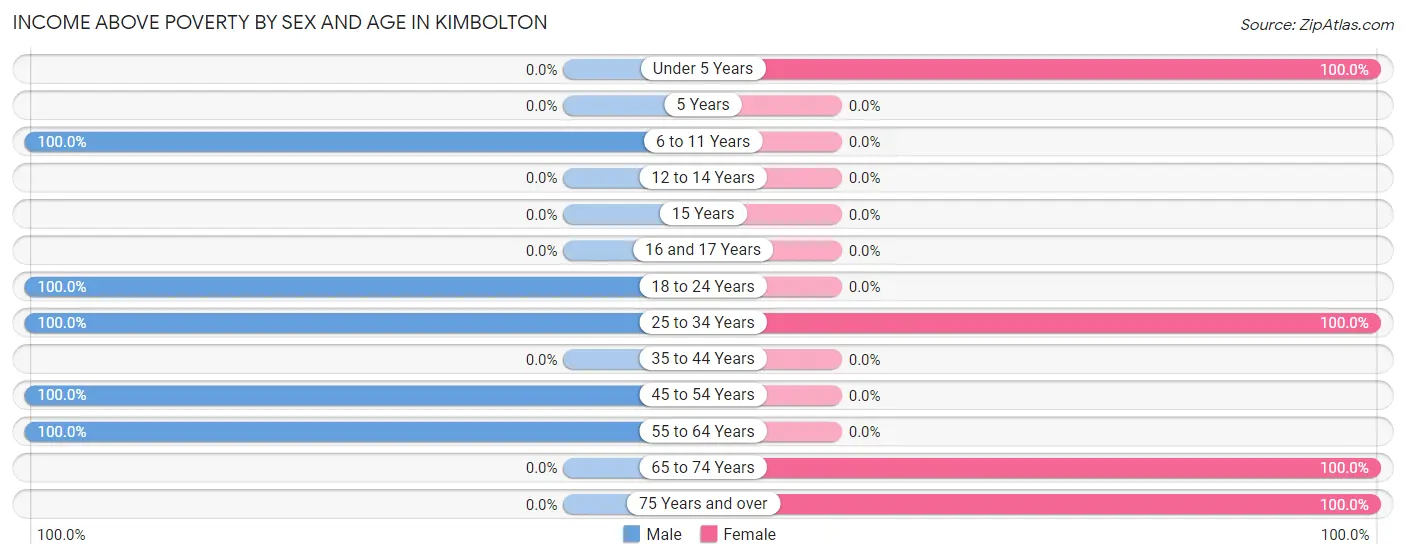
| Age Bracket | Male | Female |
| Under 5 Years | 0 (0.0%) | 6 (100.0%) |
| 5 Years | 0 (0.0%) | 0 (0.0%) |
| 6 to 11 Years | 7 (100.0%) | 0 (0.0%) |
| 12 to 14 Years | 0 (0.0%) | 0 (0.0%) |
| 15 Years | 0 (0.0%) | 0 (0.0%) |
| 16 and 17 Years | 0 (0.0%) | 0 (0.0%) |
| 18 to 24 Years | 8 (100.0%) | 0 (0.0%) |
| 25 to 34 Years | 7 (100.0%) | 7 (100.0%) |
| 35 to 44 Years | 0 (0.0%) | 0 (0.0%) |
| 45 to 54 Years | 13 (100.0%) | 0 (0.0%) |
| 55 to 64 Years | 38 (100.0%) | 0 (0.0%) |
| 65 to 74 Years | 0 (0.0%) | 23 (100.0%) |
| 75 Years and over | 0 (0.0%) | 21 (100.0%) |
| Total | 73 (100.0%) | 57 (100.0%) |
Income Below Poverty Among Married-Couple Families in Kimbolton
| Children | Above Poverty | Below Poverty |
| No Children | 0 (0.0%) | 0 (0.0%) |
| 1 or 2 Children | 7 (100.0%) | 0 (0.0%) |
| 3 or 4 Children | 0 (0.0%) | 0 (0.0%) |
| 5 or more Children | 0 (0.0%) | 0 (0.0%) |
| Total | 7 (100.0%) | 0 (0.0%) |
Income Below Poverty Among Single-Parent Households in Kimbolton
| Children | Single Father | Single Mother |
| No Children | 0 (0.0%) | 0 (0.0%) |
| 1 or 2 Children | 0 (0.0%) | 0 (0.0%) |
| 3 or 4 Children | 0 (0.0%) | 0 (0.0%) |
| 5 or more Children | 0 (0.0%) | 0 (0.0%) |
| Total | 0 (0.0%) | 0 (0.0%) |
Income Below Poverty Among Married-Couple vs Single-Parent Households in Kimbolton
| Children | Married-Couple Families | Single-Parent Households |
| No Children | 0 (0.0%) | 0 (0.0%) |
| 1 or 2 Children | 0 (0.0%) | 0 (0.0%) |
| 3 or 4 Children | 0 (0.0%) | 0 (0.0%) |
| 5 or more Children | 0 (0.0%) | 0 (0.0%) |
| Total | 0 (0.0%) | 0 (0.0%) |
Race in Kimbolton
The most populous races in Kimbolton are , and White / Caucasian (130 | 100.0%).
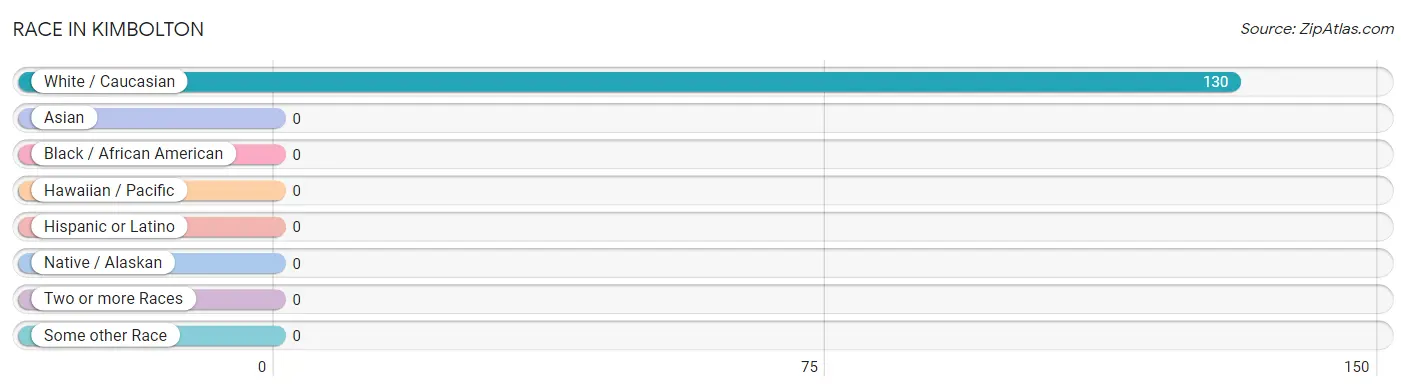
| Race | # Population | % Population |
| Asian | 0 | 0.0% |
| Black / African American | 0 | 0.0% |
| Hawaiian / Pacific | 0 | 0.0% |
| Hispanic or Latino | 0 | 0.0% |
| Native / Alaskan | 0 | 0.0% |
| White / Caucasian | 130 | 100.0% |
| Two or more Races | 0 | 0.0% |
| Some other Race | 0 | 0.0% |
| Total | 130 | 100.0% |
Ancestry in Kimbolton
The most populous ancestries reported in Kimbolton are German (65 | 50.0%), American (27 | 20.8%), and English (23 | 17.7%), together accounting for 88.5% of all Kimbolton residents.
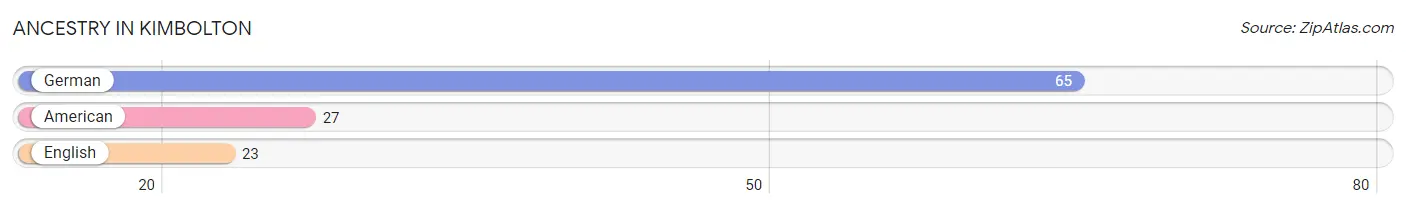
| Ancestry | # Population | % Population |
| American | 27 | 20.8% |
| English | 23 | 17.7% |
| German | 65 | 50.0% | View All 3 Rows |
Immigrants in Kimbolton

| Immigration Origin | # Population | % Population | View All 0 Rows |
Sex and Age in Kimbolton
Sex and Age in Kimbolton
The most populous age groups in Kimbolton are 55 to 59 Years (38 | 52.0%) for men and 65 to 69 Years (23 | 40.4%) for women.
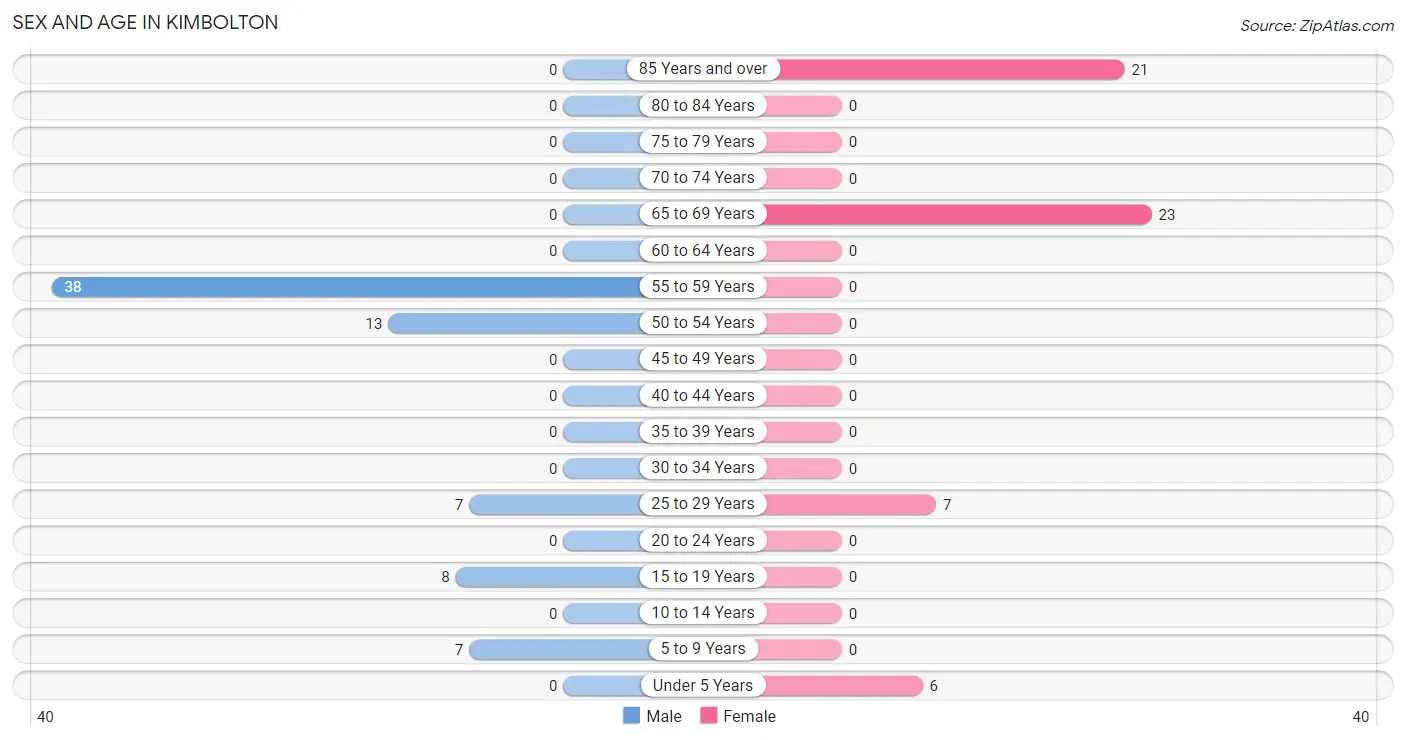
| Age Bracket | Male | Female |
| Under 5 Years | 0 (0.0%) | 6 (10.5%) |
| 5 to 9 Years | 7 (9.6%) | 0 (0.0%) |
| 10 to 14 Years | 0 (0.0%) | 0 (0.0%) |
| 15 to 19 Years | 8 (11.0%) | 0 (0.0%) |
| 20 to 24 Years | 0 (0.0%) | 0 (0.0%) |
| 25 to 29 Years | 7 (9.6%) | 7 (12.3%) |
| 30 to 34 Years | 0 (0.0%) | 0 (0.0%) |
| 35 to 39 Years | 0 (0.0%) | 0 (0.0%) |
| 40 to 44 Years | 0 (0.0%) | 0 (0.0%) |
| 45 to 49 Years | 0 (0.0%) | 0 (0.0%) |
| 50 to 54 Years | 13 (17.8%) | 0 (0.0%) |
| 55 to 59 Years | 38 (52.0%) | 0 (0.0%) |
| 60 to 64 Years | 0 (0.0%) | 0 (0.0%) |
| 65 to 69 Years | 0 (0.0%) | 23 (40.4%) |
| 70 to 74 Years | 0 (0.0%) | 0 (0.0%) |
| 75 to 79 Years | 0 (0.0%) | 0 (0.0%) |
| 80 to 84 Years | 0 (0.0%) | 0 (0.0%) |
| 85 Years and over | 0 (0.0%) | 21 (36.8%) |
| Total | 73 (100.0%) | 57 (100.0%) |
Families and Households in Kimbolton
Median Family Size in Kimbolton
The median family size in Kimbolton is 2.14 persons per family, with married-couple families (7 | 16.3%) accounting for the largest median family size of 3.86 persons per family. On the other hand, single male/father families (13 | 30.2%) represent the smallest median family size with 1.62 persons per family.
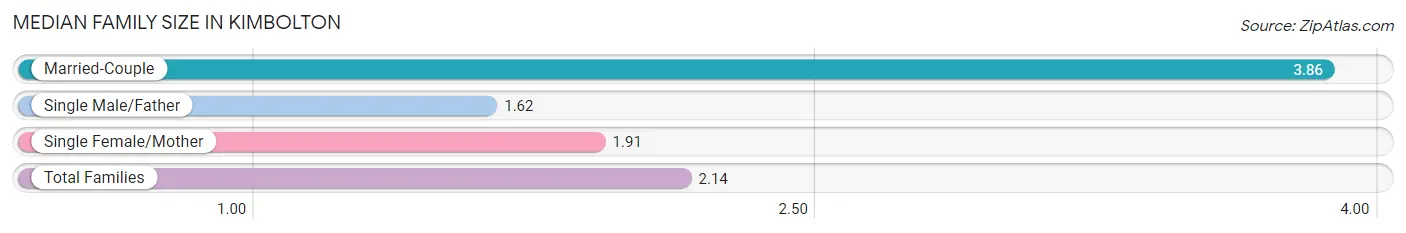
| Family Type | # Families | Family Size |
| Married-Couple | 7 (16.3%) | 3.86 |
| Single Male/Father | 13 (30.2%) | 1.62 |
| Single Female/Mother | 23 (53.5%) | 1.91 |
| Total Families | 43 (100.0%) | 2.14 |
Median Household Size in Kimbolton
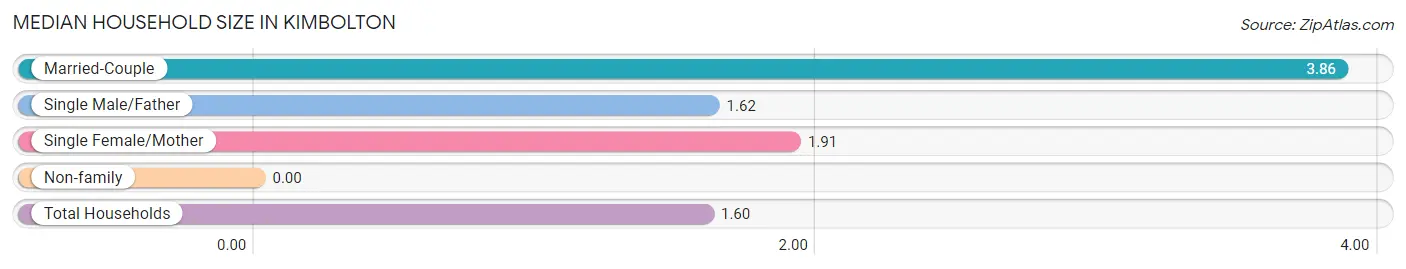
| Household Type | # Households | Household Size |
| Married-Couple | 7 (8.6%) | 3.86 |
| Single Male/Father | 13 (16.1%) | 1.62 |
| Single Female/Mother | 23 (28.4%) | 1.91 |
| Non-family | 38 (46.9%) | - |
| Total Households | 81 (100.0%) | 1.60 |
Household Size by Marriage Status in Kimbolton
Out of a total of 81 households in Kimbolton, 43 (53.1%) are family households, while 38 (46.9%) are nonfamily households. The most numerous type of family households are 2-person households, comprising 36, and the most common type of nonfamily households are 1-person households, comprising 38.
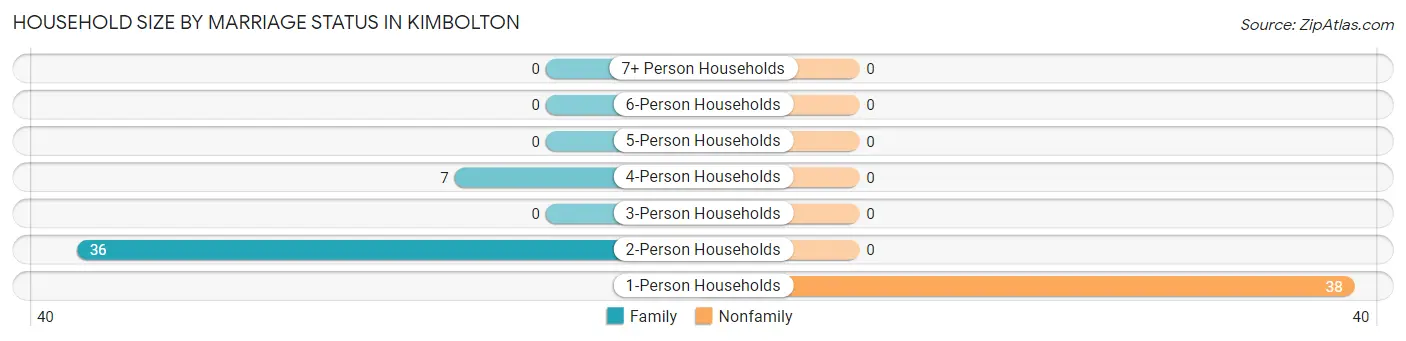
| Household Size | Family Households | Nonfamily Households |
| 1-Person Households | - | 38 (46.9%) |
| 2-Person Households | 36 (44.4%) | 0 (0.0%) |
| 3-Person Households | 0 (0.0%) | 0 (0.0%) |
| 4-Person Households | 7 (8.6%) | 0 (0.0%) |
| 5-Person Households | 0 (0.0%) | 0 (0.0%) |
| 6-Person Households | 0 (0.0%) | 0 (0.0%) |
| 7+ Person Households | 0 (0.0%) | 0 (0.0%) |
| Total | 43 (53.1%) | 38 (46.9%) |
Female Fertility in Kimbolton
Fertility by Age in Kimbolton
| Age Bracket | Women with Births | Births / 1,000 Women |
| 15 to 19 years | 0 (0.0%) | 0.0 |
| 20 to 34 years | 0 (0.0%) | 0.0 |
| 35 to 50 years | 0 (0.0%) | 0.0 |
| Total | 0 (0.0%) | 0.0 |
Fertility by Age by Marriage Status in Kimbolton
| Age Bracket | Married | Unmarried |
| 15 to 19 years | 0 (0.0%) | 0 (0.0%) |
| 20 to 34 years | 0 (0.0%) | 0 (0.0%) |
| 35 to 50 years | 0 (0.0%) | 0 (0.0%) |
| Total | 0 (0.0%) | 0 (0.0%) |
Fertility by Education in Kimbolton
| Educational Attainment | Women with Births | Births / 1,000 Women |
| Less than High School | 0 (0.0%) | 0.0 |
| High School Diploma | 0 (0.0%) | 0.0 |
| College or Associate's Degree | 0 (0.0%) | 0.0 |
| Bachelor's Degree | 0 (0.0%) | 0.0 |
| Graduate Degree | 0 (0.0%) | 0.0 |
| Total | 0 (0.0%) | 0.0 |
Fertility by Education by Marriage Status in Kimbolton
| Educational Attainment | Married | Unmarried |
| Less than High School | 0 (0.0%) | 0 (0.0%) |
| High School Diploma | 0 (0.0%) | 0 (0.0%) |
| College or Associate's Degree | 0 (0.0%) | 0 (0.0%) |
| Bachelor's Degree | 0 (0.0%) | 0 (0.0%) |
| Graduate Degree | 0 (0.0%) | 0 (0.0%) |
| Total | 0 (0.0%) | 0 (0.0%) |
Employment Characteristics in Kimbolton
Employment by Class of Employer in Kimbolton
Among the 43 employed individuals in Kimbolton, state government employees (23 | 53.5%), self-employed (not incorporated) (13 | 30.2%), and private company employees (7 | 16.3%) make up the most common classes of employment.
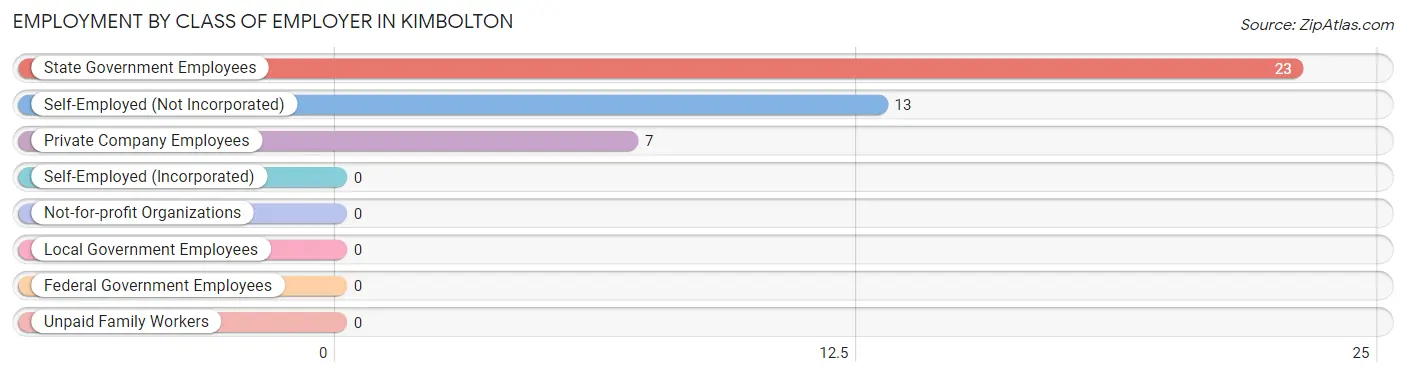
| Employer Class | # Employees | % Employees |
| Private Company Employees | 7 | 16.3% |
| Self-Employed (Incorporated) | 0 | 0.0% |
| Self-Employed (Not Incorporated) | 13 | 30.2% |
| Not-for-profit Organizations | 0 | 0.0% |
| Local Government Employees | 0 | 0.0% |
| State Government Employees | 23 | 53.5% |
| Federal Government Employees | 0 | 0.0% |
| Unpaid Family Workers | 0 | 0.0% |
| Total | 43 | 100.0% |
Employment Status by Age in Kimbolton
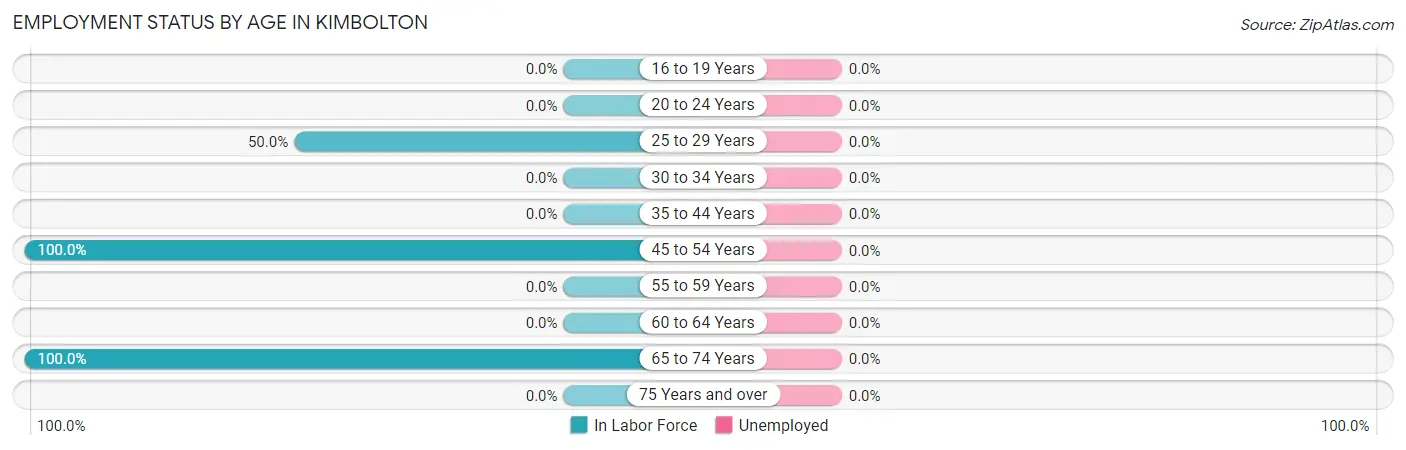
| Age Bracket | In Labor Force | Unemployed |
| 16 to 19 Years | 0 (0.0%) | 0 (0.0%) |
| 20 to 24 Years | 0 (0.0%) | 0 (0.0%) |
| 25 to 29 Years | 7 (50.0%) | 0 (0.0%) |
| 30 to 34 Years | 0 (0.0%) | 0 (0.0%) |
| 35 to 44 Years | 0 (0.0%) | 0 (0.0%) |
| 45 to 54 Years | 13 (100.0%) | 0 (0.0%) |
| 55 to 59 Years | 0 (0.0%) | 0 (0.0%) |
| 60 to 64 Years | 0 (0.0%) | 0 (0.0%) |
| 65 to 74 Years | 23 (100.0%) | 0 (0.0%) |
| 75 Years and over | 0 (0.0%) | 0 (0.0%) |
| Total | 43 (36.8%) | 0 (0.0%) |
Employment Status by Educational Attainment in Kimbolton
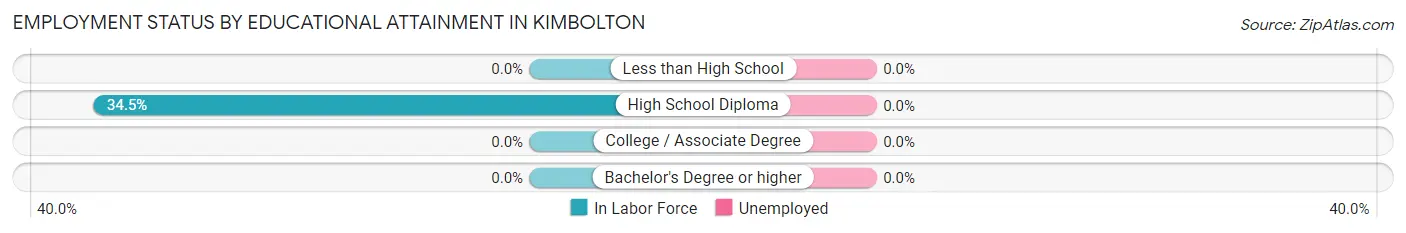
| Educational Attainment | In Labor Force | Unemployed |
| Less than High School | 0 (0.0%) | 0 (0.0%) |
| High School Diploma | 20 (34.5%) | 0 (0.0%) |
| College / Associate Degree | 0 (0.0%) | 0 (0.0%) |
| Bachelor's Degree or higher | 0 (0.0%) | 0 (0.0%) |
| Total | 20 (30.8%) | 0 (0.0%) |
Employment Occupations by Sex in Kimbolton
Management, Business, Science and Arts Occupations
The most common Management, Business, Science and Arts occupations in Kimbolton are , and Management (7 | 16.3%).
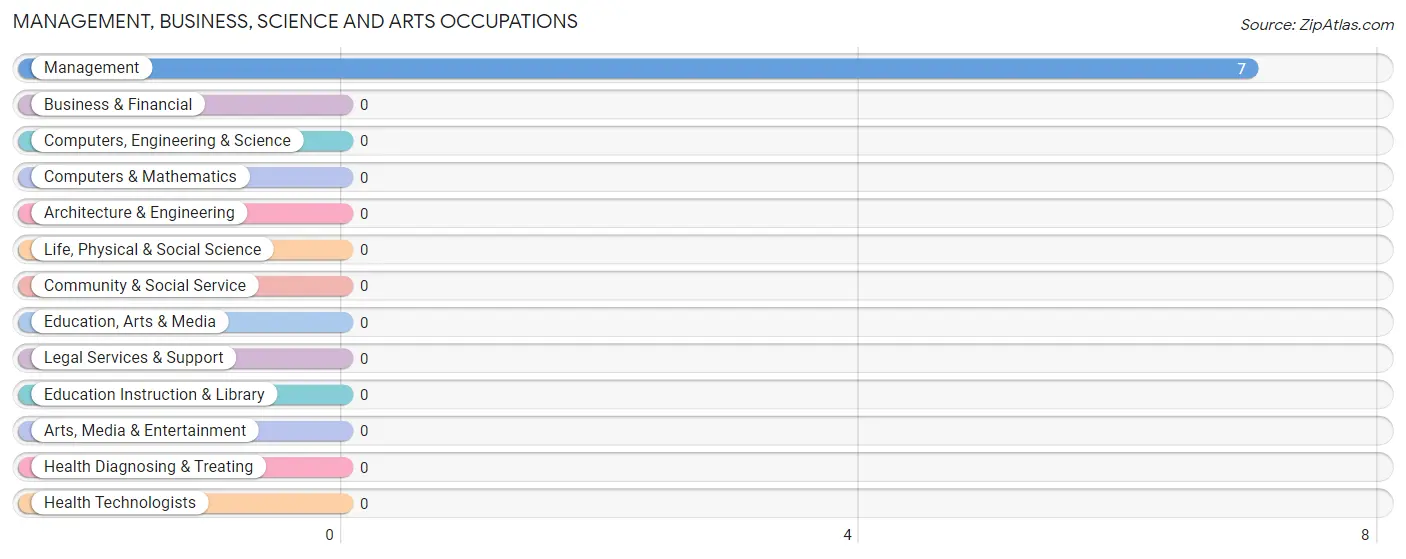
Management, Business, Science and Arts Occupations by Sex
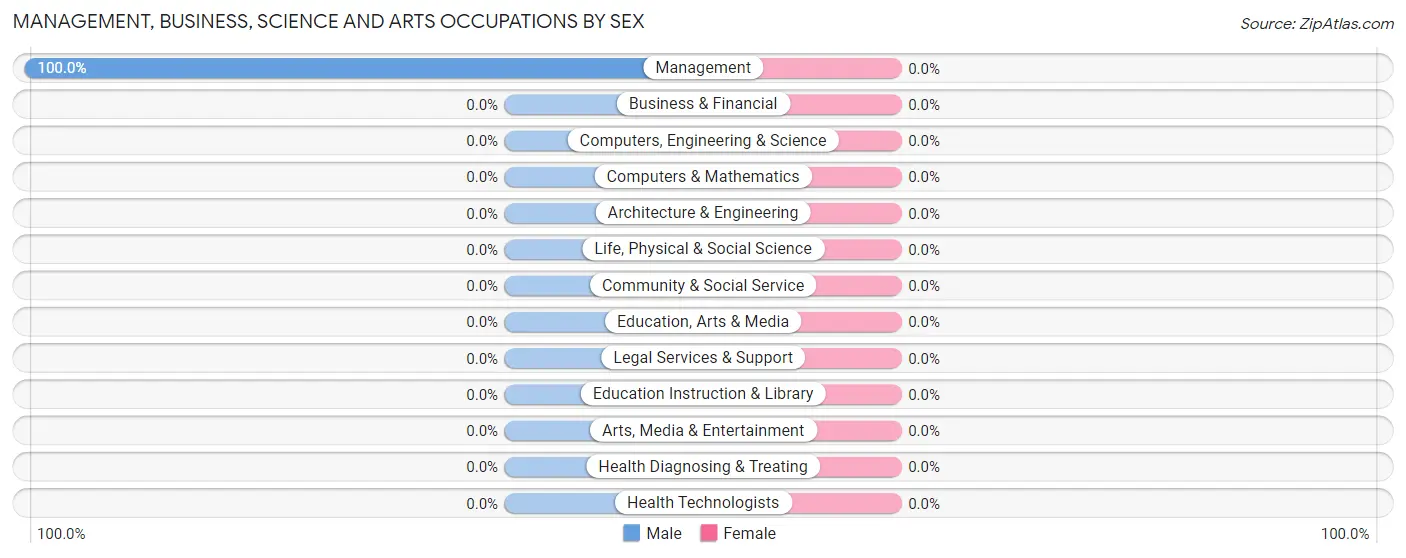
| Occupation | Male | Female |
| Management | 7 (100.0%) | 0 (0.0%) |
| Business & Financial | 0 (0.0%) | 0 (0.0%) |
| Computers, Engineering & Science | 0 (0.0%) | 0 (0.0%) |
| Computers & Mathematics | 0 (0.0%) | 0 (0.0%) |
| Architecture & Engineering | 0 (0.0%) | 0 (0.0%) |
| Life, Physical & Social Science | 0 (0.0%) | 0 (0.0%) |
| Community & Social Service | 0 (0.0%) | 0 (0.0%) |
| Education, Arts & Media | 0 (0.0%) | 0 (0.0%) |
| Legal Services & Support | 0 (0.0%) | 0 (0.0%) |
| Education Instruction & Library | 0 (0.0%) | 0 (0.0%) |
| Arts, Media & Entertainment | 0 (0.0%) | 0 (0.0%) |
| Health Diagnosing & Treating | 0 (0.0%) | 0 (0.0%) |
| Health Technologists | 0 (0.0%) | 0 (0.0%) |
| Total (Category) | 7 (100.0%) | 0 (0.0%) |
| Total (Overall) | 20 (46.5%) | 23 (53.5%) |
Services Occupations
Services Occupations by Sex
| Occupation | Male | Female |
| Healthcare Support | 0 (0.0%) | 0 (0.0%) |
| Security & Protection | 0 (0.0%) | 0 (0.0%) |
| Firefighting & Prevention | 0 (0.0%) | 0 (0.0%) |
| Law Enforcement | 0 (0.0%) | 0 (0.0%) |
| Food Preparation & Serving | 0 (0.0%) | 0 (0.0%) |
| Cleaning & Maintenance | 0 (0.0%) | 0 (0.0%) |
| Personal Care & Service | 0 (0.0%) | 0 (0.0%) |
| Total (Category) | 0 (0.0%) | 0 (0.0%) |
| Total (Overall) | 20 (46.5%) | 23 (53.5%) |
Sales and Office Occupations
The most common Sales and Office occupations in Kimbolton are , and Office & Administration (23 | 53.5%).
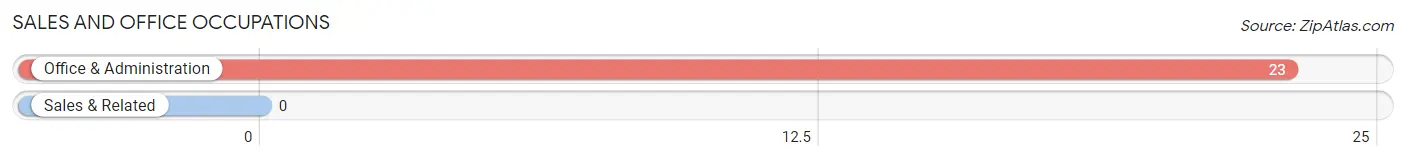
Sales and Office Occupations by Sex
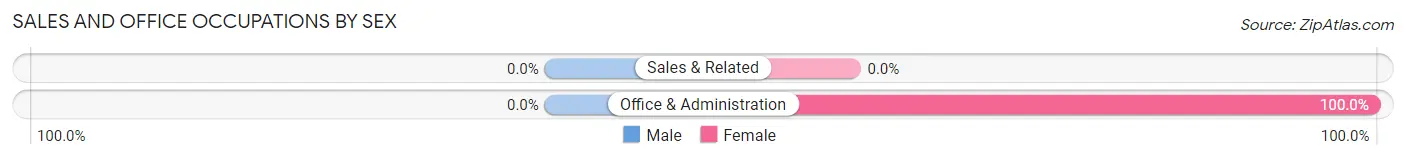
| Occupation | Male | Female |
| Sales & Related | 0 (0.0%) | 0 (0.0%) |
| Office & Administration | 0 (0.0%) | 23 (100.0%) |
| Total (Category) | 0 (0.0%) | 23 (100.0%) |
| Total (Overall) | 20 (46.5%) | 23 (53.5%) |
Natural Resources, Construction and Maintenance Occupations
The most common Natural Resources, Construction and Maintenance occupations in Kimbolton are , and Installation, Maintenance & Repair (13 | 30.2%).
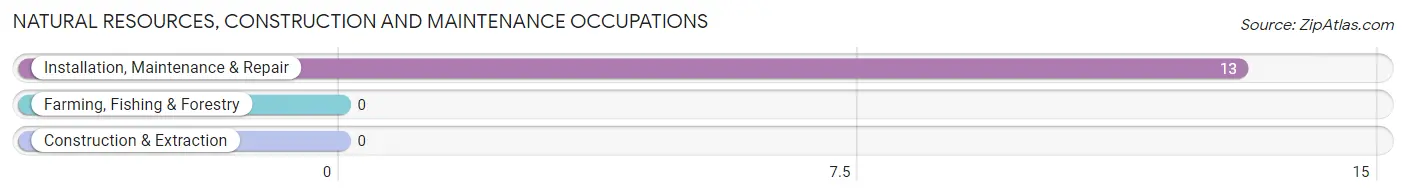
Natural Resources, Construction and Maintenance Occupations by Sex
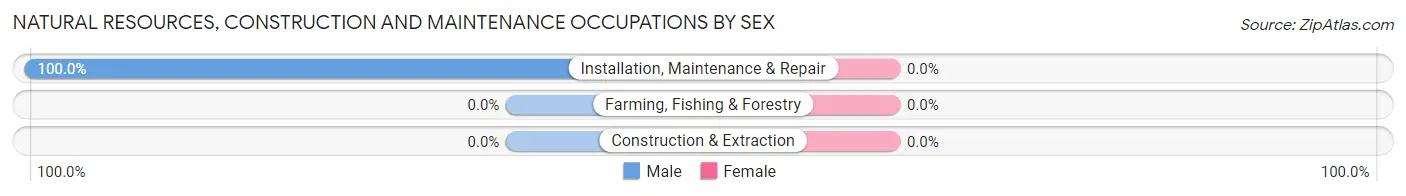
| Occupation | Male | Female |
| Farming, Fishing & Forestry | 0 (0.0%) | 0 (0.0%) |
| Construction & Extraction | 0 (0.0%) | 0 (0.0%) |
| Installation, Maintenance & Repair | 13 (100.0%) | 0 (0.0%) |
| Total (Category) | 13 (100.0%) | 0 (0.0%) |
| Total (Overall) | 20 (46.5%) | 23 (53.5%) |
Production, Transportation and Moving Occupations
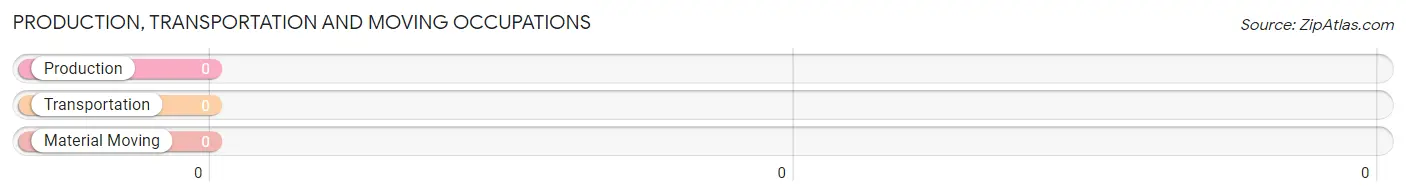
Production, Transportation and Moving Occupations by Sex
| Occupation | Male | Female |
| Production | 0 (0.0%) | 0 (0.0%) |
| Transportation | 0 (0.0%) | 0 (0.0%) |
| Material Moving | 0 (0.0%) | 0 (0.0%) |
| Total (Category) | 0 (0.0%) | 0 (0.0%) |
| Total (Overall) | 20 (46.5%) | 23 (53.5%) |
Employment Industries by Sex in Kimbolton
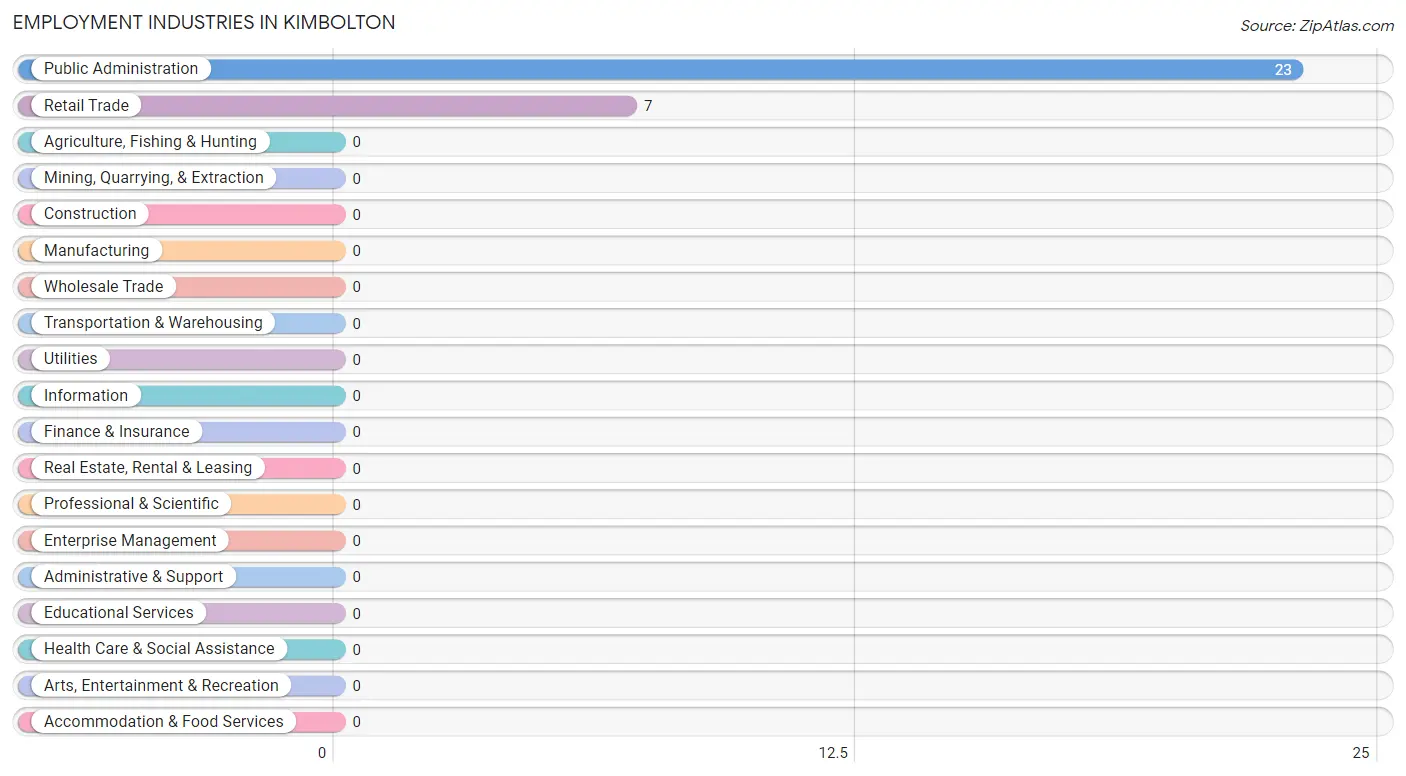
Employment Industries in Kimbolton
The major employment industries in Kimbolton include Public Administration (23 | 53.5%), and Retail Trade (7 | 16.3%).
Employment Industries by Sex in Kimbolton
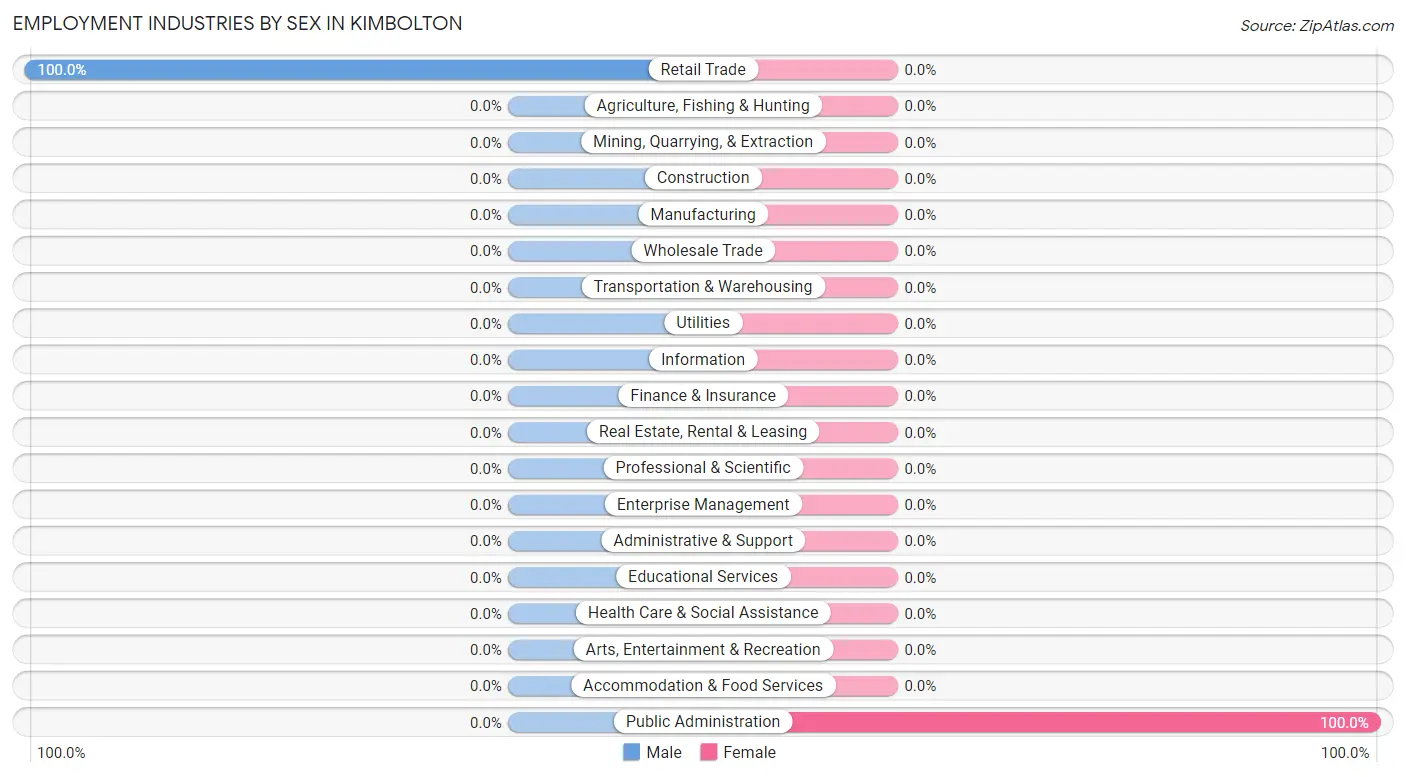
| Industry | Male | Female |
| Agriculture, Fishing & Hunting | 0 (0.0%) | 0 (0.0%) |
| Mining, Quarrying, & Extraction | 0 (0.0%) | 0 (0.0%) |
| Construction | 0 (0.0%) | 0 (0.0%) |
| Manufacturing | 0 (0.0%) | 0 (0.0%) |
| Wholesale Trade | 0 (0.0%) | 0 (0.0%) |
| Retail Trade | 7 (100.0%) | 0 (0.0%) |
| Transportation & Warehousing | 0 (0.0%) | 0 (0.0%) |
| Utilities | 0 (0.0%) | 0 (0.0%) |
| Information | 0 (0.0%) | 0 (0.0%) |
| Finance & Insurance | 0 (0.0%) | 0 (0.0%) |
| Real Estate, Rental & Leasing | 0 (0.0%) | 0 (0.0%) |
| Professional & Scientific | 0 (0.0%) | 0 (0.0%) |
| Enterprise Management | 0 (0.0%) | 0 (0.0%) |
| Administrative & Support | 0 (0.0%) | 0 (0.0%) |
| Educational Services | 0 (0.0%) | 0 (0.0%) |
| Health Care & Social Assistance | 0 (0.0%) | 0 (0.0%) |
| Arts, Entertainment & Recreation | 0 (0.0%) | 0 (0.0%) |
| Accommodation & Food Services | 0 (0.0%) | 0 (0.0%) |
| Public Administration | 0 (0.0%) | 23 (100.0%) |
| Total | 20 (46.5%) | 23 (53.5%) |
Education in Kimbolton
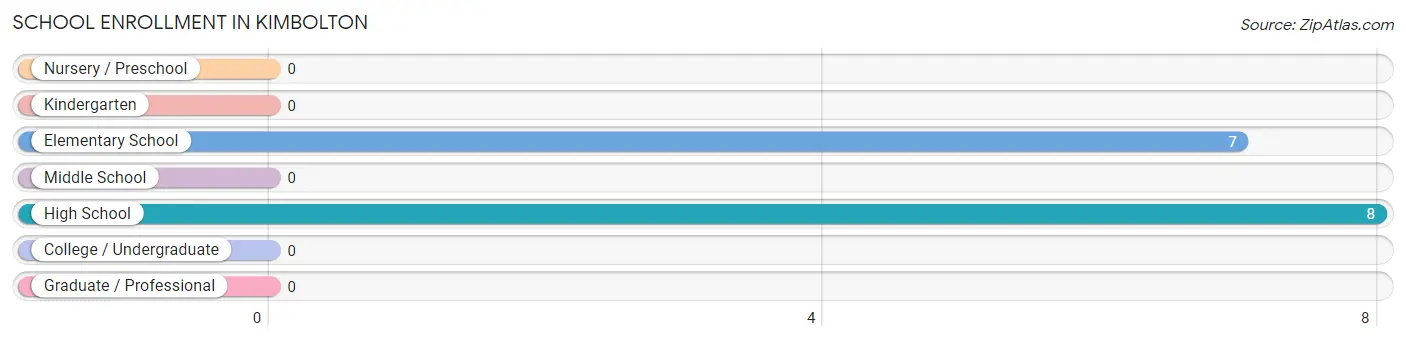
School Enrollment in Kimbolton
The most common levels of schooling among the 15 students in Kimbolton are high school (8 | 53.3%), and elementary school (7 | 46.7%).
| School Level | # Students | % Students |
| Nursery / Preschool | 0 | 0.0% |
| Kindergarten | 0 | 0.0% |
| Elementary School | 7 | 46.7% |
| Middle School | 0 | 0.0% |
| High School | 8 | 53.3% |
| College / Undergraduate | 0 | 0.0% |
| Graduate / Professional | 0 | 0.0% |
| Total | 15 | 100.0% |
School Enrollment by Age by Funding Source in Kimbolton
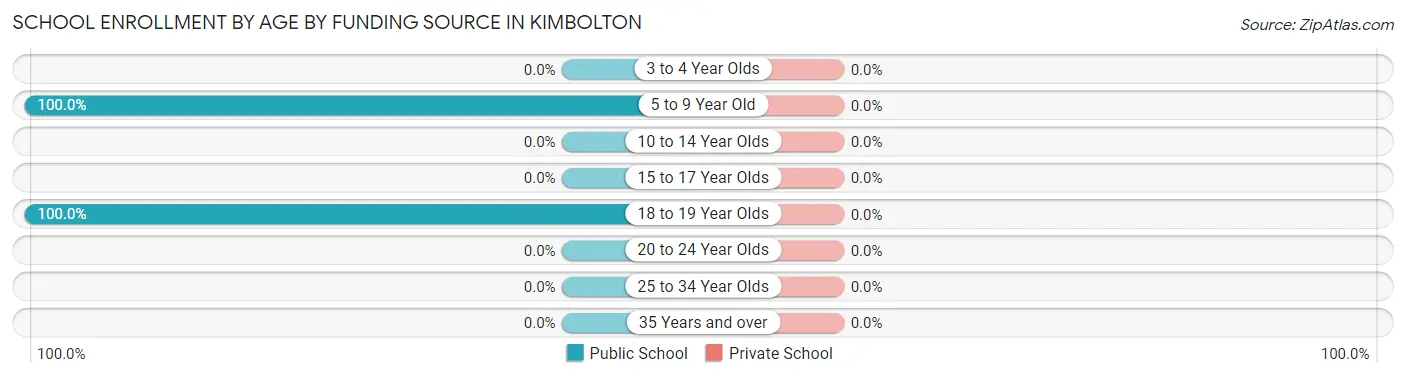
| Age Bracket | Public School | Private School |
| 3 to 4 Year Olds | 0 (0.0%) | 0 (0.0%) |
| 5 to 9 Year Old | 7 (100.0%) | 0 (0.0%) |
| 10 to 14 Year Olds | 0 (0.0%) | 0 (0.0%) |
| 15 to 17 Year Olds | 0 (0.0%) | 0 (0.0%) |
| 18 to 19 Year Olds | 8 (100.0%) | 0 (0.0%) |
| 20 to 24 Year Olds | 0 (0.0%) | 0 (0.0%) |
| 25 to 34 Year Olds | 0 (0.0%) | 0 (0.0%) |
| 35 Years and over | 0 (0.0%) | 0 (0.0%) |
| Total | 15 (100.0%) | 0 (0.0%) |
Educational Attainment by Field of Study in Kimbolton
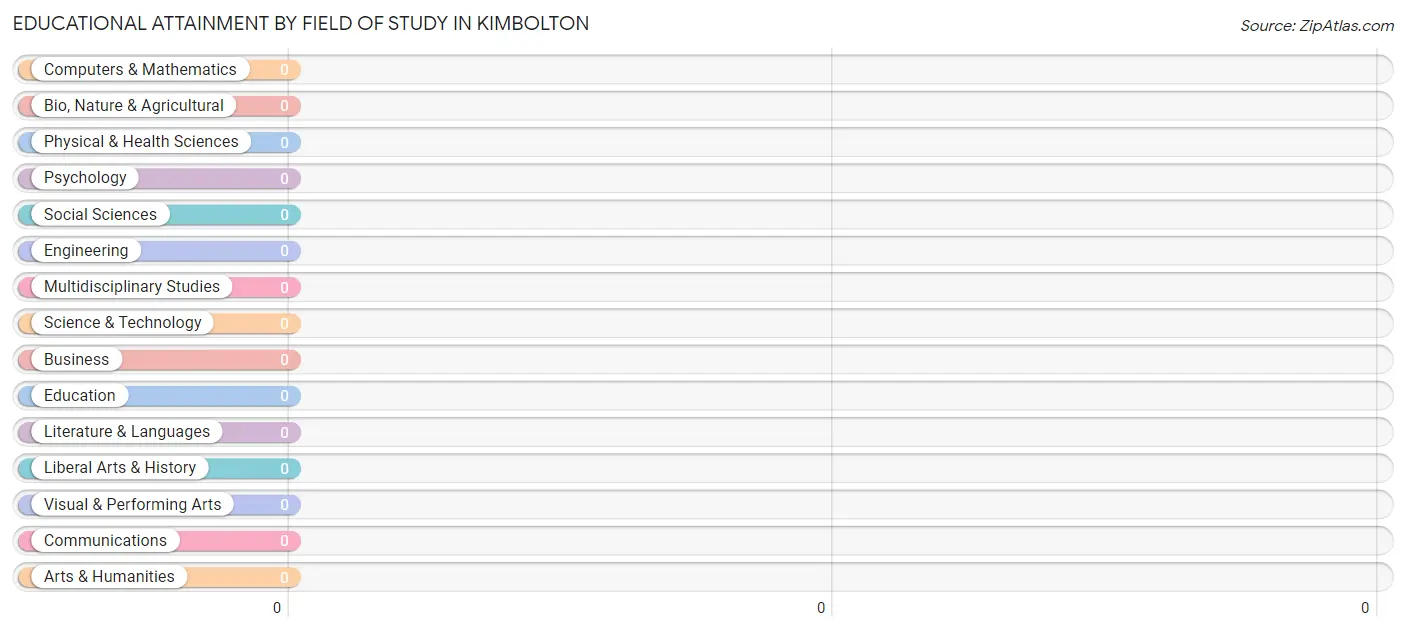
| Field of Study | # Graduates | % Graduates |
| Computers & Mathematics | 0 | 0.0% |
| Bio, Nature & Agricultural | 0 | 0.0% |
| Physical & Health Sciences | 0 | 0.0% |
| Psychology | 0 | 0.0% |
| Social Sciences | 0 | 0.0% |
| Engineering | 0 | 0.0% |
| Multidisciplinary Studies | 0 | 0.0% |
| Science & Technology | 0 | 0.0% |
| Business | 0 | 0.0% |
| Education | 0 | 0.0% |
| Literature & Languages | 0 | 0.0% |
| Liberal Arts & History | 0 | 0.0% |
| Visual & Performing Arts | 0 | 0.0% |
| Communications | 0 | 0.0% |
| Arts & Humanities | 0 | 0.0% |
| Total | 0 | 0.0% |
Transportation & Commute in Kimbolton
Vehicle Availability by Sex in Kimbolton
The most prevalent vehicle ownership categories in Kimbolton are males with 1 vehicle (13, accounting for 65.0%) and females with 1 vehicle (23, making up 56.5%).
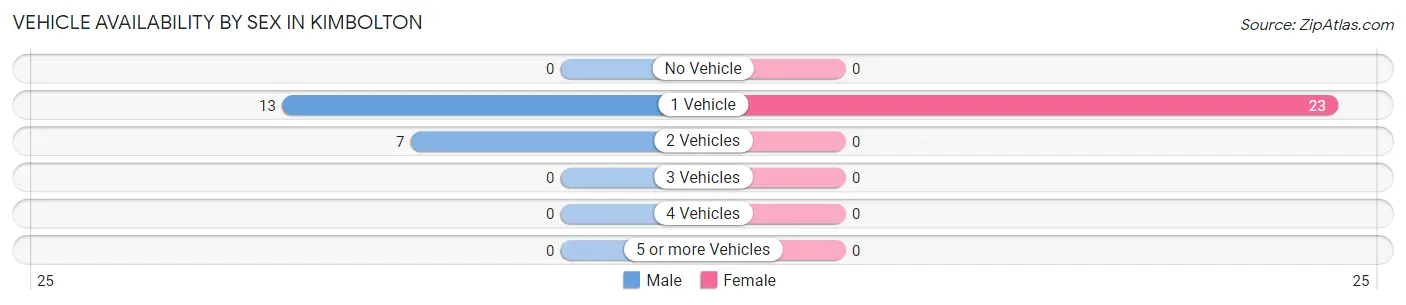
| Vehicles Available | Male | Female |
| No Vehicle | 0 (0.0%) | 0 (0.0%) |
| 1 Vehicle | 13 (65.0%) | 23 (100.0%) |
| 2 Vehicles | 7 (35.0%) | 0 (0.0%) |
| 3 Vehicles | 0 (0.0%) | 0 (0.0%) |
| 4 Vehicles | 0 (0.0%) | 0 (0.0%) |
| 5 or more Vehicles | 0 (0.0%) | 0 (0.0%) |
| Total | 20 (100.0%) | 23 (100.0%) |
Commute Time in Kimbolton
The most frequently occuring commute durations in Kimbolton are 45 to 59 minutes (23 commuters, 76.7%), 20 to 24 minutes (7 commuters, 23.3%), and less than 5 minutes (0 commuters, 0.0%).
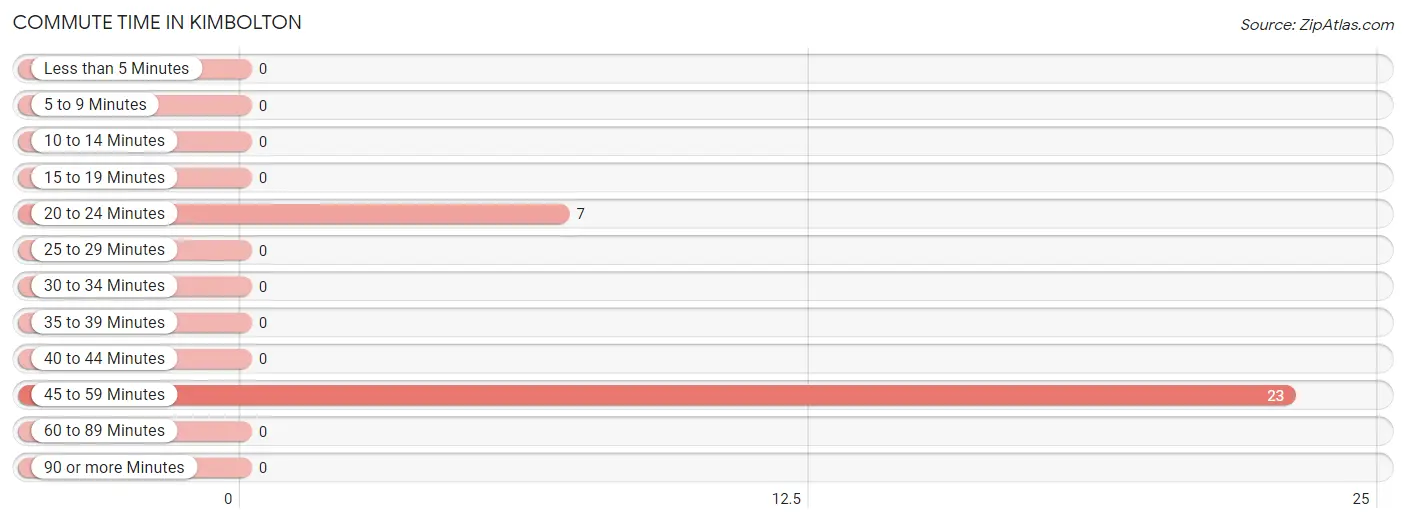
| Commute Time | # Commuters | % Commuters |
| Less than 5 Minutes | 0 | 0.0% |
| 5 to 9 Minutes | 0 | 0.0% |
| 10 to 14 Minutes | 0 | 0.0% |
| 15 to 19 Minutes | 0 | 0.0% |
| 20 to 24 Minutes | 7 | 23.3% |
| 25 to 29 Minutes | 0 | 0.0% |
| 30 to 34 Minutes | 0 | 0.0% |
| 35 to 39 Minutes | 0 | 0.0% |
| 40 to 44 Minutes | 0 | 0.0% |
| 45 to 59 Minutes | 23 | 76.7% |
| 60 to 89 Minutes | 0 | 0.0% |
| 90 or more Minutes | 0 | 0.0% |
Commute Time by Sex in Kimbolton
The most common commute times in Kimbolton are 20 to 24 minutes (7 commuters, 100.0%) for males and 45 to 59 minutes (23 commuters, 100.0%) for females.
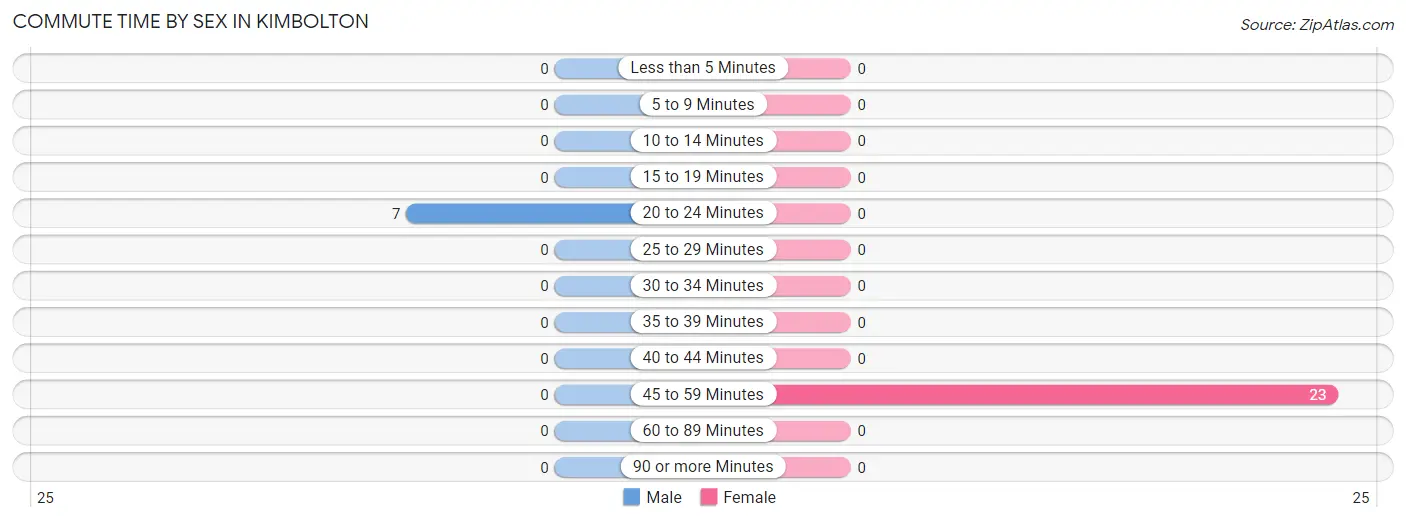
| Commute Time | Male | Female |
| Less than 5 Minutes | 0 (0.0%) | 0 (0.0%) |
| 5 to 9 Minutes | 0 (0.0%) | 0 (0.0%) |
| 10 to 14 Minutes | 0 (0.0%) | 0 (0.0%) |
| 15 to 19 Minutes | 0 (0.0%) | 0 (0.0%) |
| 20 to 24 Minutes | 7 (100.0%) | 0 (0.0%) |
| 25 to 29 Minutes | 0 (0.0%) | 0 (0.0%) |
| 30 to 34 Minutes | 0 (0.0%) | 0 (0.0%) |
| 35 to 39 Minutes | 0 (0.0%) | 0 (0.0%) |
| 40 to 44 Minutes | 0 (0.0%) | 0 (0.0%) |
| 45 to 59 Minutes | 0 (0.0%) | 23 (100.0%) |
| 60 to 89 Minutes | 0 (0.0%) | 0 (0.0%) |
| 90 or more Minutes | 0 (0.0%) | 0 (0.0%) |
Time of Departure to Work by Sex in Kimbolton
The most frequent times of departure to work in Kimbolton are 9:00 AM to 9:59 AM (7, 100.0%) for males and 7:00 AM to 7:29 AM (23, 100.0%) for females.
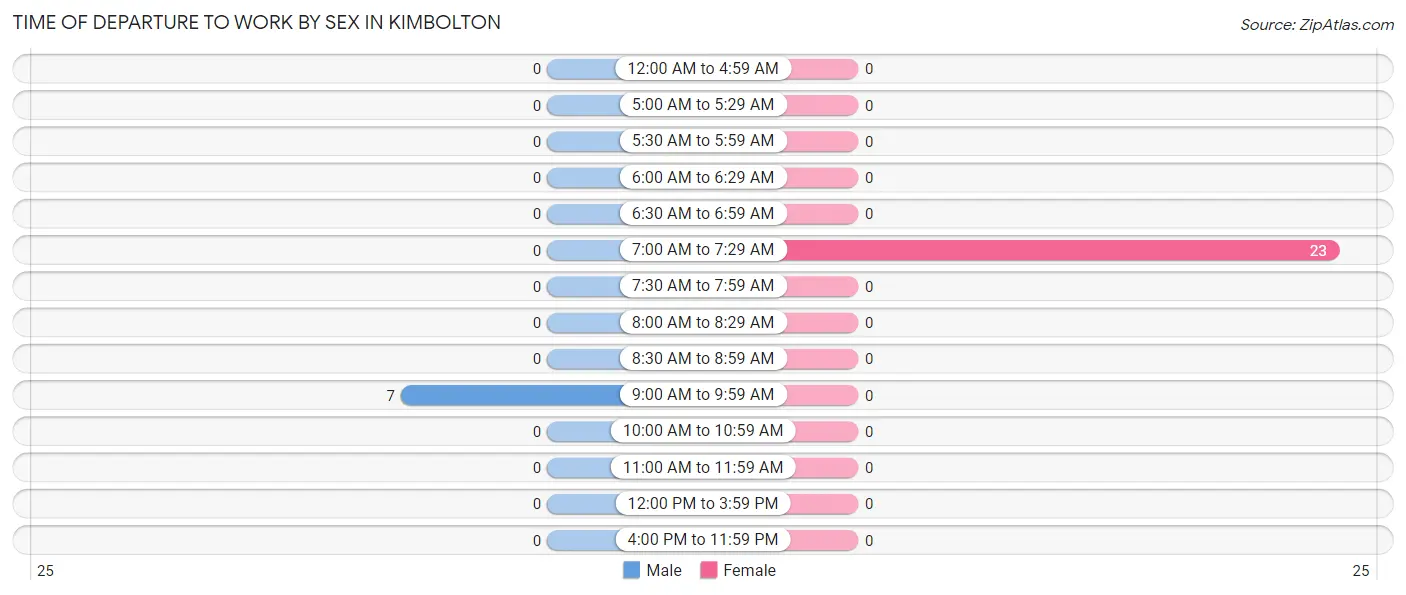
| Time of Departure | Male | Female |
| 12:00 AM to 4:59 AM | 0 (0.0%) | 0 (0.0%) |
| 5:00 AM to 5:29 AM | 0 (0.0%) | 0 (0.0%) |
| 5:30 AM to 5:59 AM | 0 (0.0%) | 0 (0.0%) |
| 6:00 AM to 6:29 AM | 0 (0.0%) | 0 (0.0%) |
| 6:30 AM to 6:59 AM | 0 (0.0%) | 0 (0.0%) |
| 7:00 AM to 7:29 AM | 0 (0.0%) | 23 (100.0%) |
| 7:30 AM to 7:59 AM | 0 (0.0%) | 0 (0.0%) |
| 8:00 AM to 8:29 AM | 0 (0.0%) | 0 (0.0%) |
| 8:30 AM to 8:59 AM | 0 (0.0%) | 0 (0.0%) |
| 9:00 AM to 9:59 AM | 7 (100.0%) | 0 (0.0%) |
| 10:00 AM to 10:59 AM | 0 (0.0%) | 0 (0.0%) |
| 11:00 AM to 11:59 AM | 0 (0.0%) | 0 (0.0%) |
| 12:00 PM to 3:59 PM | 0 (0.0%) | 0 (0.0%) |
| 4:00 PM to 11:59 PM | 0 (0.0%) | 0 (0.0%) |
| Total | 7 (100.0%) | 23 (100.0%) |
Housing Occupancy in Kimbolton
Occupancy by Ownership in Kimbolton
Of the total 81 dwellings in Kimbolton, owner-occupied units account for 74 (91.4%), while renter-occupied units make up 7 (8.6%).
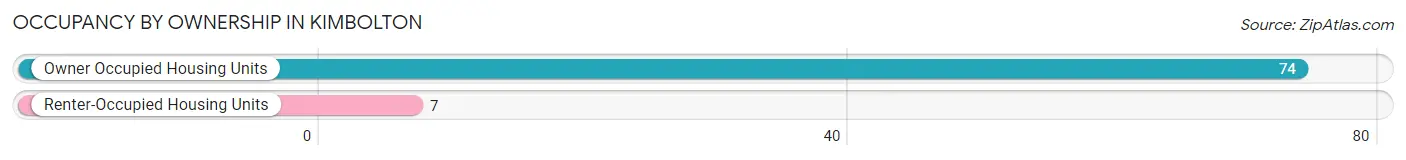
| Occupancy | # Housing Units | % Housing Units |
| Owner Occupied Housing Units | 74 | 91.4% |
| Renter-Occupied Housing Units | 7 | 8.6% |
| Total Occupied Housing Units | 81 | 100.0% |
Occupancy by Household Size in Kimbolton
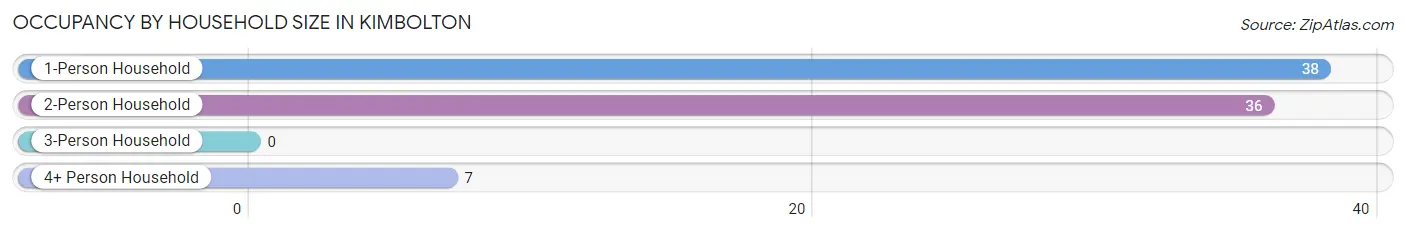
| Household Size | # Housing Units | % Housing Units |
| 1-Person Household | 38 | 46.9% |
| 2-Person Household | 36 | 44.4% |
| 3-Person Household | 0 | 0.0% |
| 4+ Person Household | 7 | 8.6% |
| Total Housing Units | 81 | 100.0% |
Occupancy by Ownership by Household Size in Kimbolton
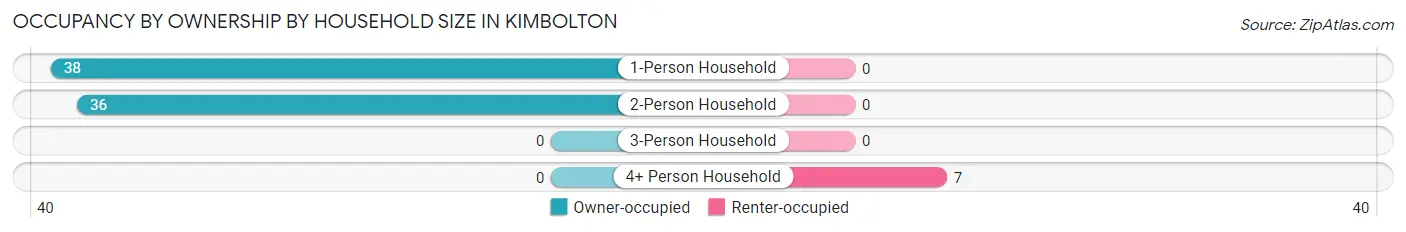
| Household Size | Owner-occupied | Renter-occupied |
| 1-Person Household | 38 (100.0%) | 0 (0.0%) |
| 2-Person Household | 36 (100.0%) | 0 (0.0%) |
| 3-Person Household | 0 (0.0%) | 0 (0.0%) |
| 4+ Person Household | 0 (0.0%) | 7 (100.0%) |
| Total Housing Units | 74 (91.4%) | 7 (8.6%) |
Occupancy by Educational Attainment in Kimbolton
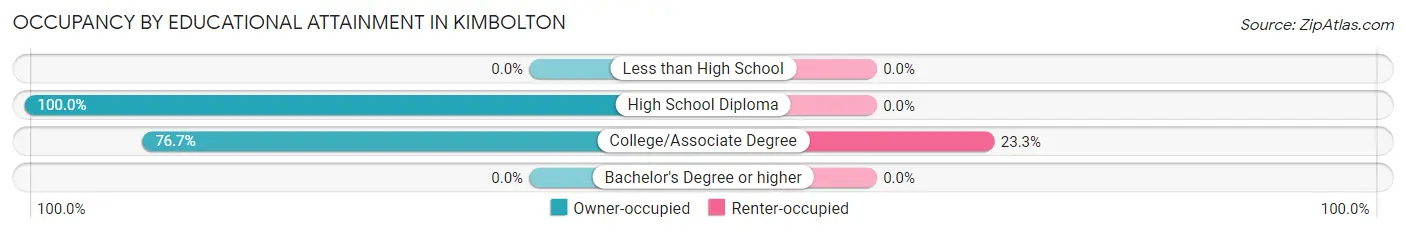
| Household Size | Owner-occupied | Renter-occupied |
| Less than High School | 0 (0.0%) | 0 (0.0%) |
| High School Diploma | 51 (100.0%) | 0 (0.0%) |
| College/Associate Degree | 23 (76.7%) | 7 (23.3%) |
| Bachelor's Degree or higher | 0 (0.0%) | 0 (0.0%) |
Occupancy by Age of Householder in Kimbolton
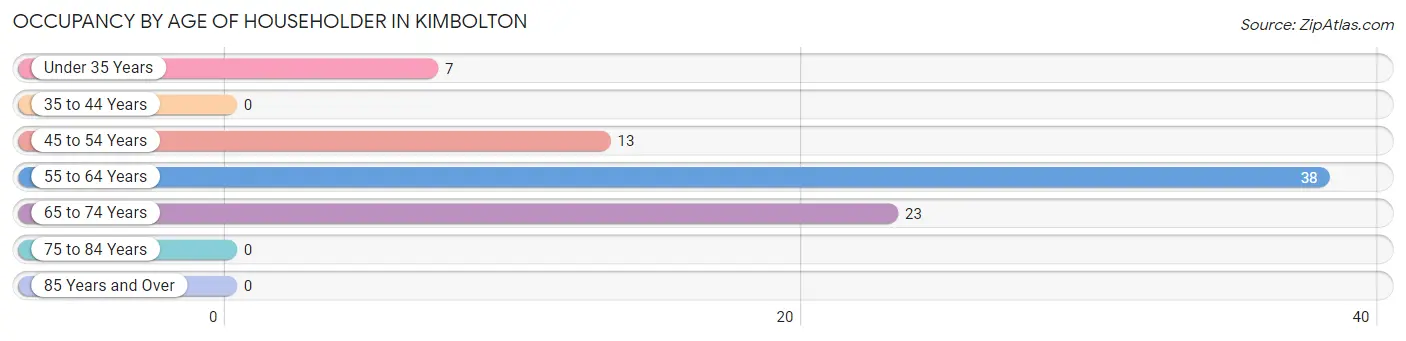
| Age Bracket | # Households | % Households |
| Under 35 Years | 7 | 8.6% |
| 35 to 44 Years | 0 | 0.0% |
| 45 to 54 Years | 13 | 16.1% |
| 55 to 64 Years | 38 | 46.9% |
| 65 to 74 Years | 23 | 28.4% |
| 75 to 84 Years | 0 | 0.0% |
| 85 Years and Over | 0 | 0.0% |
| Total | 81 | 100.0% |
Housing Finances in Kimbolton
Median Income by Occupancy in Kimbolton
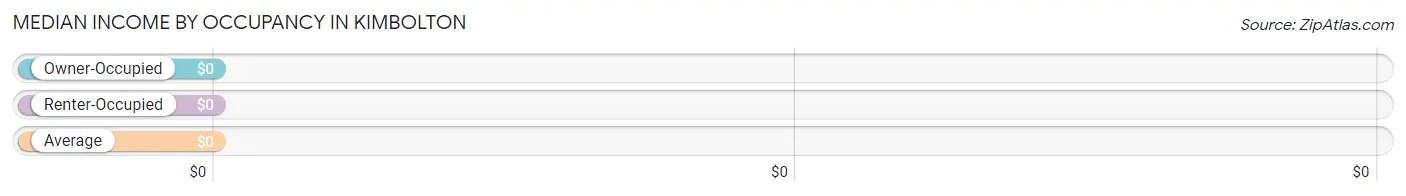
| Occupancy Type | # Households | Median Income |
| Owner-Occupied | 74 (91.4%) | $0 |
| Renter-Occupied | 7 (8.6%) | $0 |
| Average | 81 (100.0%) | $0 |
Occupancy by Householder Income Bracket in Kimbolton
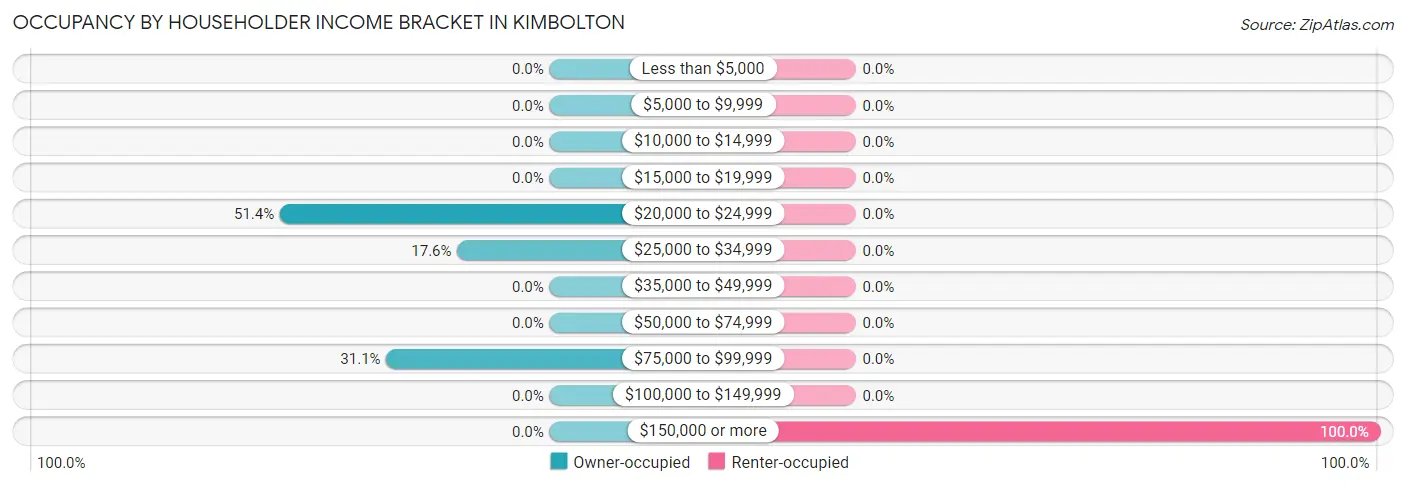
| Income Bracket | Owner-occupied | Renter-occupied |
| Less than $5,000 | 0 (0.0%) | 0 (0.0%) |
| $5,000 to $9,999 | 0 (0.0%) | 0 (0.0%) |
| $10,000 to $14,999 | 0 (0.0%) | 0 (0.0%) |
| $15,000 to $19,999 | 0 (0.0%) | 0 (0.0%) |
| $20,000 to $24,999 | 38 (51.3%) | 0 (0.0%) |
| $25,000 to $34,999 | 13 (17.6%) | 0 (0.0%) |
| $35,000 to $49,999 | 0 (0.0%) | 0 (0.0%) |
| $50,000 to $74,999 | 0 (0.0%) | 0 (0.0%) |
| $75,000 to $99,999 | 23 (31.1%) | 0 (0.0%) |
| $100,000 to $149,999 | 0 (0.0%) | 0 (0.0%) |
| $150,000 or more | 0 (0.0%) | 7 (100.0%) |
| Total | 74 (100.0%) | 7 (100.0%) |
Monthly Housing Cost Tiers in Kimbolton
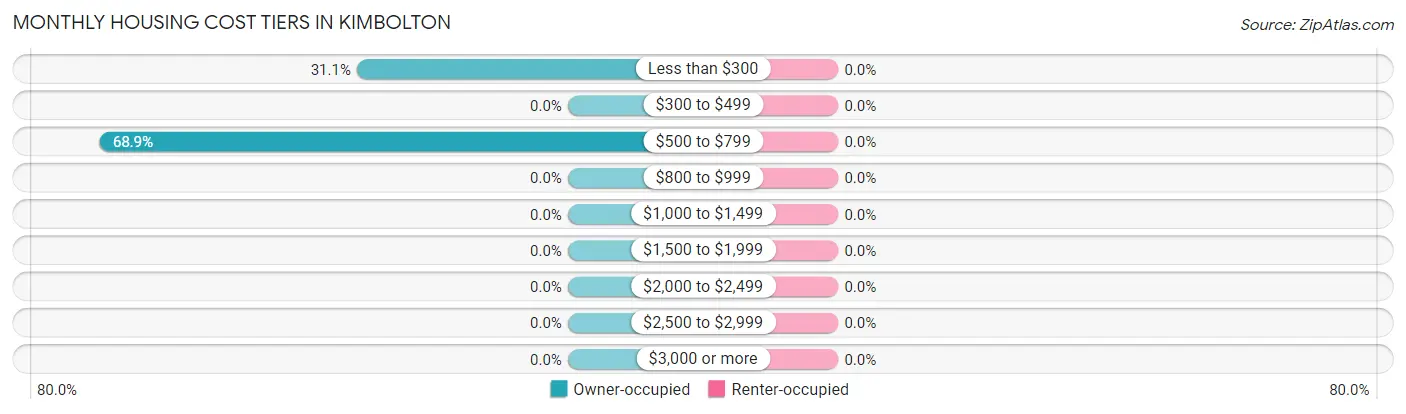
| Monthly Cost | Owner-occupied | Renter-occupied |
| Less than $300 | 23 (31.1%) | 0 (0.0%) |
| $300 to $499 | 0 (0.0%) | 0 (0.0%) |
| $500 to $799 | 51 (68.9%) | 0 (0.0%) |
| $800 to $999 | 0 (0.0%) | 0 (0.0%) |
| $1,000 to $1,499 | 0 (0.0%) | 0 (0.0%) |
| $1,500 to $1,999 | 0 (0.0%) | 0 (0.0%) |
| $2,000 to $2,499 | 0 (0.0%) | 0 (0.0%) |
| $2,500 to $2,999 | 0 (0.0%) | 0 (0.0%) |
| $3,000 or more | 0 (0.0%) | 0 (0.0%) |
| Total | 74 (100.0%) | 7 (100.0%) |
Physical Housing Characteristics in Kimbolton
Housing Structures in Kimbolton
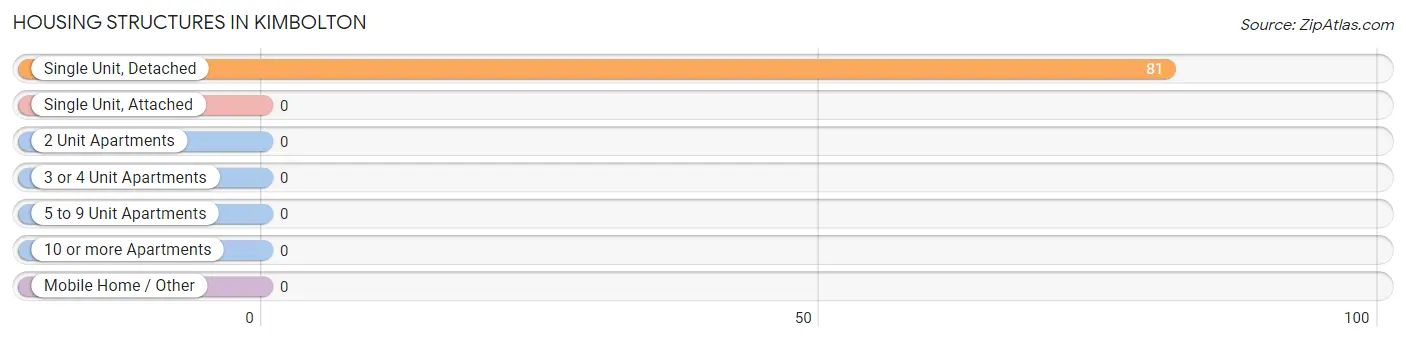
| Structure Type | # Housing Units | % Housing Units |
| Single Unit, Detached | 81 | 100.0% |
| Single Unit, Attached | 0 | 0.0% |
| 2 Unit Apartments | 0 | 0.0% |
| 3 or 4 Unit Apartments | 0 | 0.0% |
| 5 to 9 Unit Apartments | 0 | 0.0% |
| 10 or more Apartments | 0 | 0.0% |
| Mobile Home / Other | 0 | 0.0% |
| Total | 81 | 100.0% |
Housing Structures by Occupancy in Kimbolton
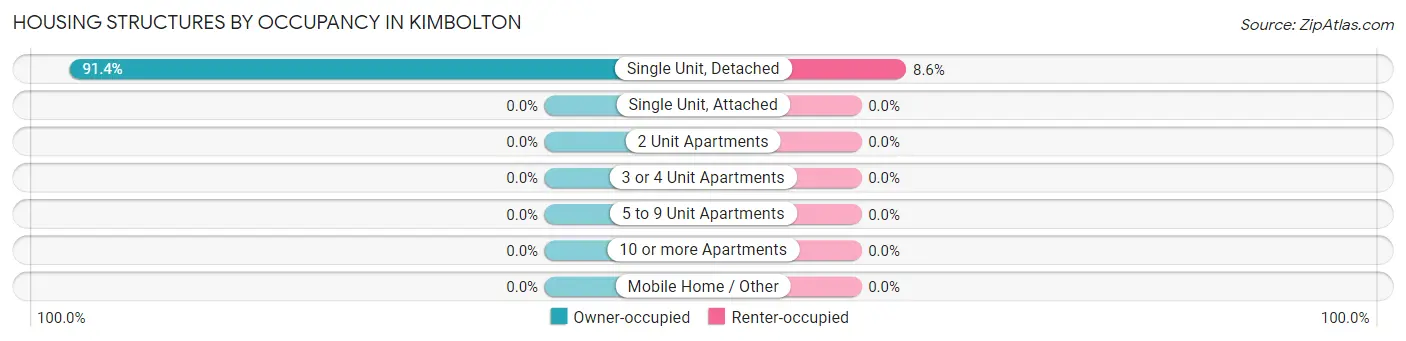
| Structure Type | Owner-occupied | Renter-occupied |
| Single Unit, Detached | 74 (91.4%) | 7 (8.6%) |
| Single Unit, Attached | 0 (0.0%) | 0 (0.0%) |
| 2 Unit Apartments | 0 (0.0%) | 0 (0.0%) |
| 3 or 4 Unit Apartments | 0 (0.0%) | 0 (0.0%) |
| 5 to 9 Unit Apartments | 0 (0.0%) | 0 (0.0%) |
| 10 or more Apartments | 0 (0.0%) | 0 (0.0%) |
| Mobile Home / Other | 0 (0.0%) | 0 (0.0%) |
| Total | 74 (91.4%) | 7 (8.6%) |
Housing Structures by Number of Rooms in Kimbolton
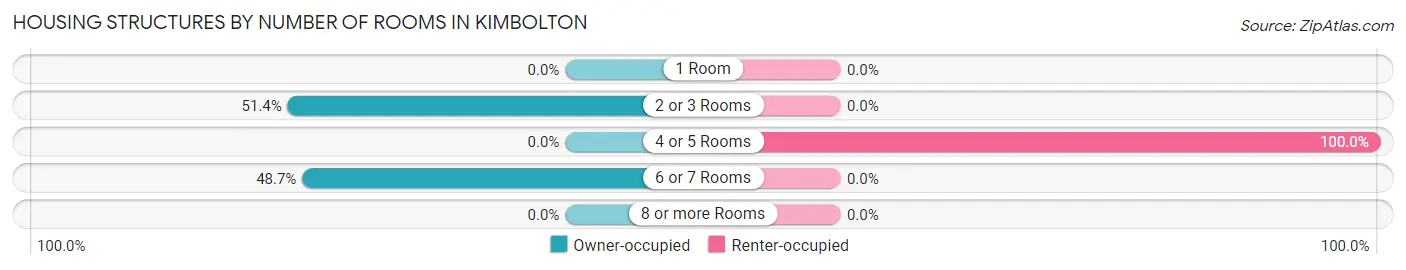
| Number of Rooms | Owner-occupied | Renter-occupied |
| 1 Room | 0 (0.0%) | 0 (0.0%) |
| 2 or 3 Rooms | 38 (51.3%) | 0 (0.0%) |
| 4 or 5 Rooms | 0 (0.0%) | 7 (100.0%) |
| 6 or 7 Rooms | 36 (48.6%) | 0 (0.0%) |
| 8 or more Rooms | 0 (0.0%) | 0 (0.0%) |
| Total | 74 (100.0%) | 7 (100.0%) |
Housing Structure by Heating Type in Kimbolton
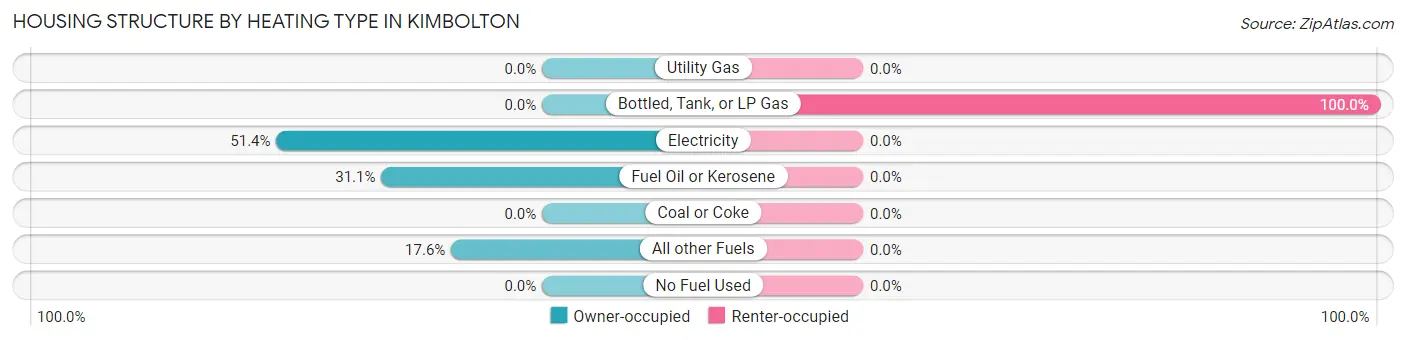
| Heating Type | Owner-occupied | Renter-occupied |
| Utility Gas | 0 (0.0%) | 0 (0.0%) |
| Bottled, Tank, or LP Gas | 0 (0.0%) | 7 (100.0%) |
| Electricity | 38 (51.3%) | 0 (0.0%) |
| Fuel Oil or Kerosene | 23 (31.1%) | 0 (0.0%) |
| Coal or Coke | 0 (0.0%) | 0 (0.0%) |
| All other Fuels | 13 (17.6%) | 0 (0.0%) |
| No Fuel Used | 0 (0.0%) | 0 (0.0%) |
| Total | 74 (100.0%) | 7 (100.0%) |
Household Vehicle Usage in Kimbolton
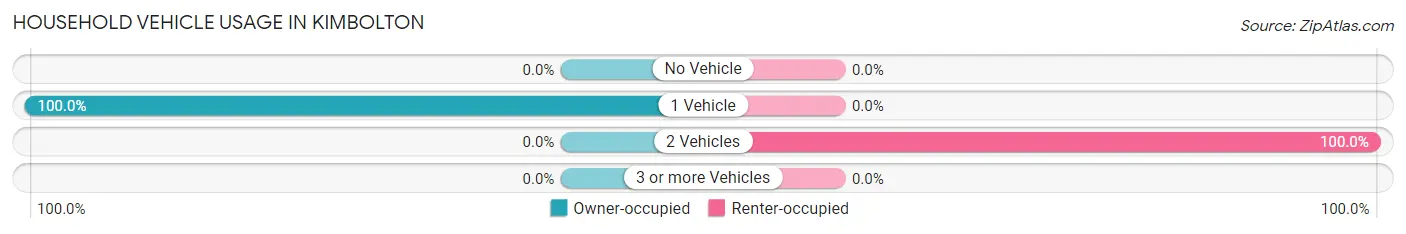
| Vehicles per Household | Owner-occupied | Renter-occupied |
| No Vehicle | 0 (0.0%) | 0 (0.0%) |
| 1 Vehicle | 74 (100.0%) | 0 (0.0%) |
| 2 Vehicles | 0 (0.0%) | 7 (100.0%) |
| 3 or more Vehicles | 0 (0.0%) | 0 (0.0%) |
| Total | 74 (100.0%) | 7 (100.0%) |
Real Estate & Mortgages in Kimbolton
Real Estate and Mortgage Overview in Kimbolton
| Characteristic | Without Mortgage | With Mortgage |
| Housing Units | 36 | 38 |
| Median Property Value | - | - |
| Median Household Income | - | - |
| Monthly Housing Costs | - | - |
| Real Estate Taxes | - | - |
Property Value by Mortgage Status in Kimbolton
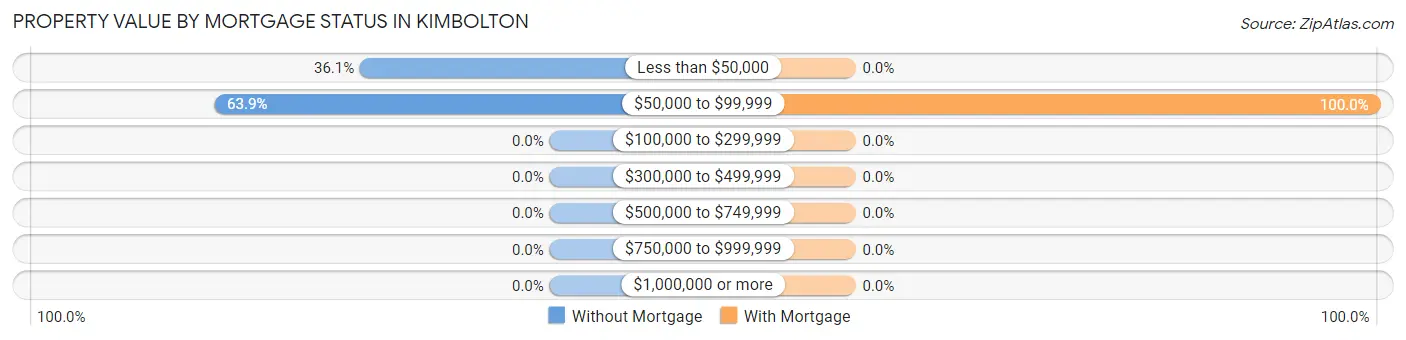
| Property Value | Without Mortgage | With Mortgage |
| Less than $50,000 | 13 (36.1%) | 0 (0.0%) |
| $50,000 to $99,999 | 23 (63.9%) | 38 (100.0%) |
| $100,000 to $299,999 | 0 (0.0%) | 0 (0.0%) |
| $300,000 to $499,999 | 0 (0.0%) | 0 (0.0%) |
| $500,000 to $749,999 | 0 (0.0%) | 0 (0.0%) |
| $750,000 to $999,999 | 0 (0.0%) | 0 (0.0%) |
| $1,000,000 or more | 0 (0.0%) | 0 (0.0%) |
| Total | 36 (100.0%) | 38 (100.0%) |
Household Income by Mortgage Status in Kimbolton
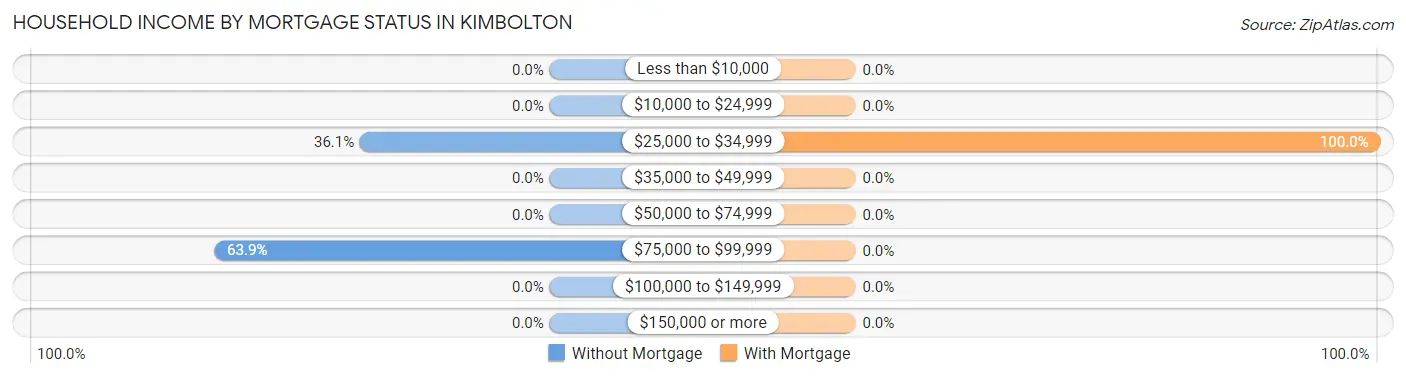
| Household Income | Without Mortgage | With Mortgage |
| Less than $10,000 | 0 (0.0%) | 0 (0.0%) |
| $10,000 to $24,999 | 0 (0.0%) | 0 (0.0%) |
| $25,000 to $34,999 | 13 (36.1%) | 38 (100.0%) |
| $35,000 to $49,999 | 0 (0.0%) | 0 (0.0%) |
| $50,000 to $74,999 | 0 (0.0%) | 0 (0.0%) |
| $75,000 to $99,999 | 23 (63.9%) | 0 (0.0%) |
| $100,000 to $149,999 | 0 (0.0%) | 0 (0.0%) |
| $150,000 or more | 0 (0.0%) | 0 (0.0%) |
| Total | 36 (100.0%) | 38 (100.0%) |
Property Value to Household Income Ratio in Kimbolton
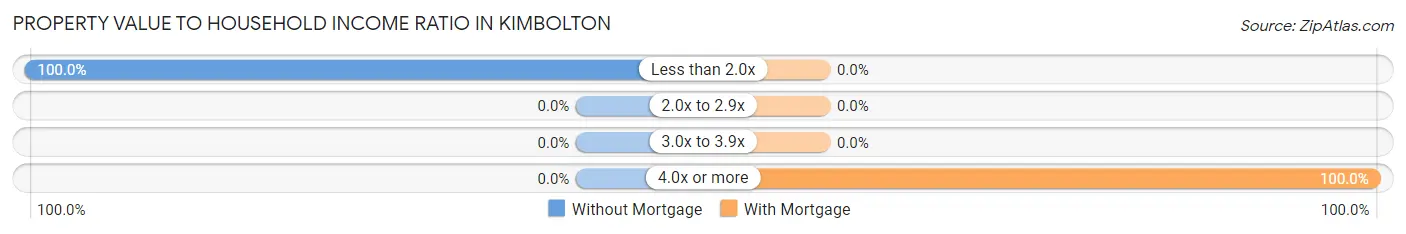
| Value-to-Income Ratio | Without Mortgage | With Mortgage |
| Less than 2.0x | 36 (100.0%) | 0 (0.0%) |
| 2.0x to 2.9x | 0 (0.0%) | 0 (0.0%) |
| 3.0x to 3.9x | 0 (0.0%) | 0 (0.0%) |
| 4.0x or more | 0 (0.0%) | 38 (100.0%) |
| Total | 36 (100.0%) | 38 (100.0%) |
Real Estate Taxes by Mortgage Status in Kimbolton
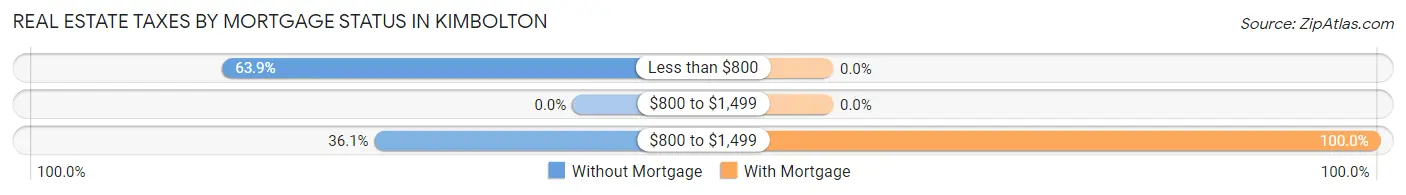
| Property Taxes | Without Mortgage | With Mortgage |
| Less than $800 | 23 (63.9%) | 0 (0.0%) |
| $800 to $1,499 | 0 (0.0%) | 0 (0.0%) |
| $800 to $1,499 | 13 (36.1%) | 38 (100.0%) |
| Total | 36 (100.0%) | 38 (100.0%) |
Health & Disability in Kimbolton
Health Insurance Coverage by Age in Kimbolton
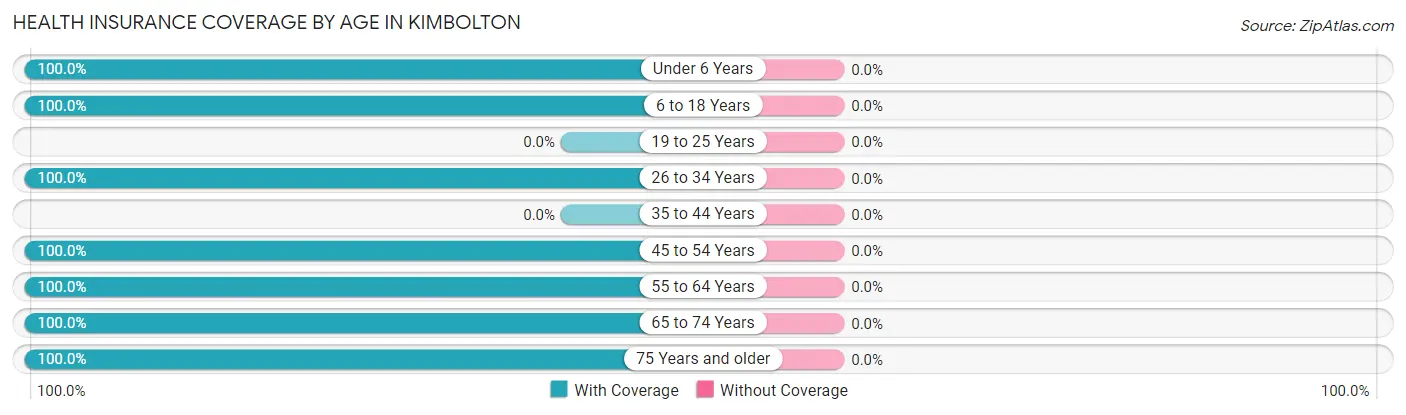
| Age Bracket | With Coverage | Without Coverage |
| Under 6 Years | 6 (100.0%) | 0 (0.0%) |
| 6 to 18 Years | 15 (100.0%) | 0 (0.0%) |
| 19 to 25 Years | 0 (0.0%) | 0 (0.0%) |
| 26 to 34 Years | 14 (100.0%) | 0 (0.0%) |
| 35 to 44 Years | 0 (0.0%) | 0 (0.0%) |
| 45 to 54 Years | 13 (100.0%) | 0 (0.0%) |
| 55 to 64 Years | 38 (100.0%) | 0 (0.0%) |
| 65 to 74 Years | 23 (100.0%) | 0 (0.0%) |
| 75 Years and older | 21 (100.0%) | 0 (0.0%) |
| Total | 130 (100.0%) | 0 (0.0%) |
Health Insurance Coverage by Citizenship Status in Kimbolton
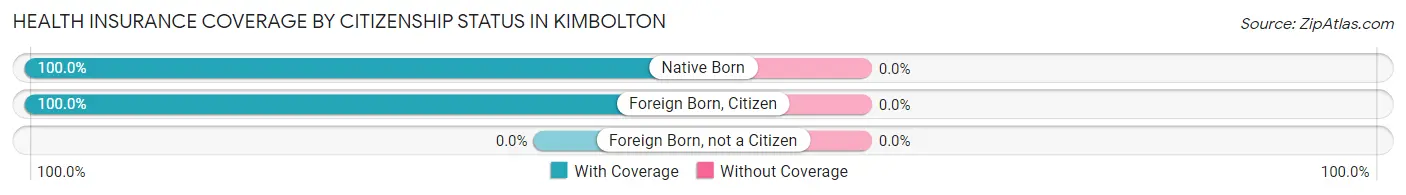
| Citizenship Status | With Coverage | Without Coverage |
| Native Born | 6 (100.0%) | 0 (0.0%) |
| Foreign Born, Citizen | 15 (100.0%) | 0 (0.0%) |
| Foreign Born, not a Citizen | 0 (0.0%) | 0 (0.0%) |
Health Insurance Coverage by Household Income in Kimbolton
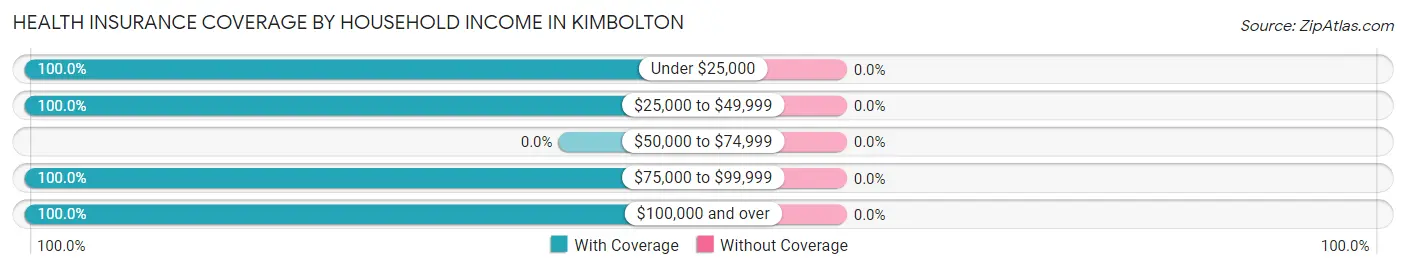
| Household Income | With Coverage | Without Coverage |
| Under $25,000 | 38 (100.0%) | 0 (0.0%) |
| $25,000 to $49,999 | 21 (100.0%) | 0 (0.0%) |
| $50,000 to $74,999 | 0 (0.0%) | 0 (0.0%) |
| $75,000 to $99,999 | 44 (100.0%) | 0 (0.0%) |
| $100,000 and over | 27 (100.0%) | 0 (0.0%) |
Public vs Private Health Insurance Coverage by Age in Kimbolton
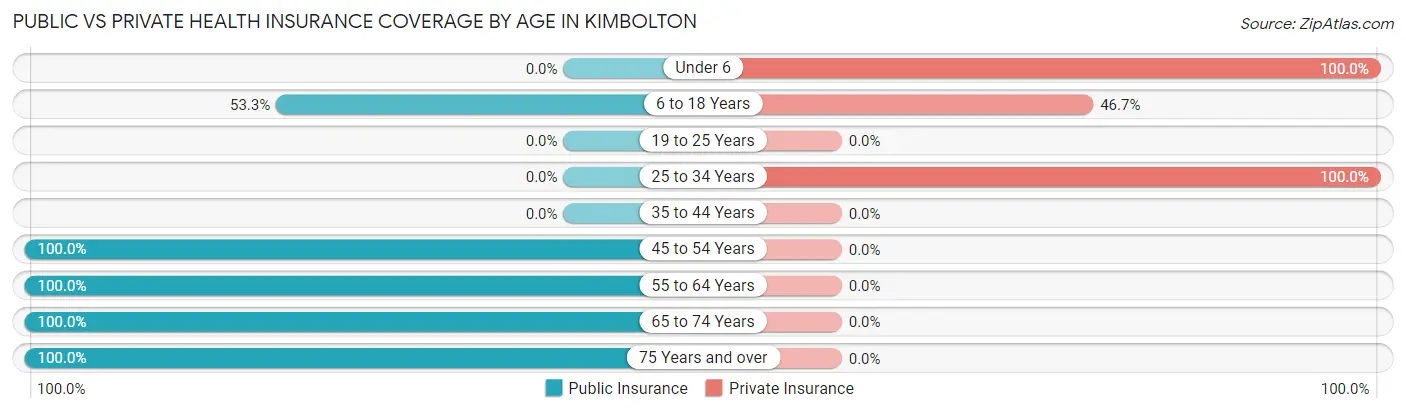
| Age Bracket | Public Insurance | Private Insurance |
| Under 6 | 0 (0.0%) | 6 (100.0%) |
| 6 to 18 Years | 8 (53.3%) | 7 (46.7%) |
| 19 to 25 Years | 0 (0.0%) | 0 (0.0%) |
| 25 to 34 Years | 0 (0.0%) | 14 (100.0%) |
| 35 to 44 Years | 0 (0.0%) | 0 (0.0%) |
| 45 to 54 Years | 13 (100.0%) | 0 (0.0%) |
| 55 to 64 Years | 38 (100.0%) | 0 (0.0%) |
| 65 to 74 Years | 23 (100.0%) | 0 (0.0%) |
| 75 Years and over | 21 (100.0%) | 0 (0.0%) |
| Total | 103 (79.2%) | 27 (20.8%) |
Disability Status by Sex by Age in Kimbolton
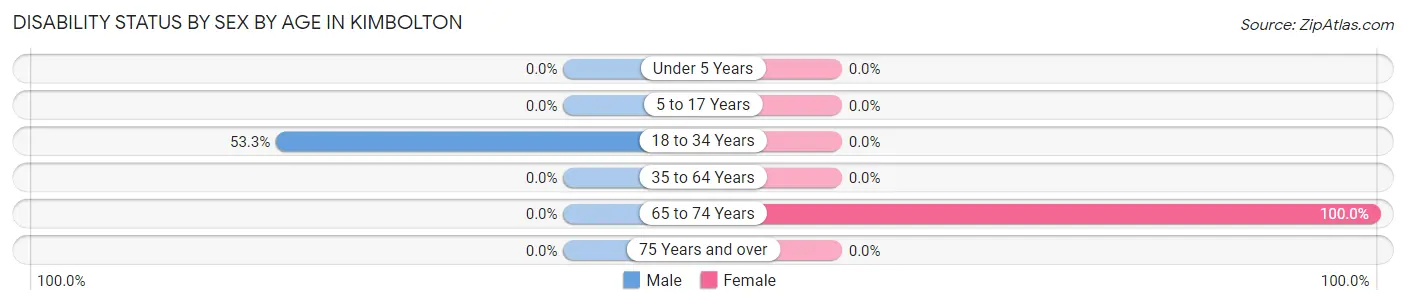
| Age Bracket | Male | Female |
| Under 5 Years | 0 (0.0%) | 0 (0.0%) |
| 5 to 17 Years | 0 (0.0%) | 0 (0.0%) |
| 18 to 34 Years | 8 (53.3%) | 0 (0.0%) |
| 35 to 64 Years | 0 (0.0%) | 0 (0.0%) |
| 65 to 74 Years | 0 (0.0%) | 23 (100.0%) |
| 75 Years and over | 0 (0.0%) | 0 (0.0%) |
Disability Class by Sex by Age in Kimbolton
Disability Class: Hearing Difficulty
| Age Bracket | Male | Female |
| Under 5 Years | 0 (0.0%) | 0 (0.0%) |
| 5 to 17 Years | 0 (0.0%) | 0 (0.0%) |
| 18 to 34 Years | 0 (0.0%) | 0 (0.0%) |
| 35 to 64 Years | 0 (0.0%) | 0 (0.0%) |
| 65 to 74 Years | 0 (0.0%) | 0 (0.0%) |
| 75 Years and over | 0 (0.0%) | 0 (0.0%) |
Disability Class: Vision Difficulty
| Age Bracket | Male | Female |
| Under 5 Years | 0 (0.0%) | 0 (0.0%) |
| 5 to 17 Years | 0 (0.0%) | 0 (0.0%) |
| 18 to 34 Years | 0 (0.0%) | 0 (0.0%) |
| 35 to 64 Years | 0 (0.0%) | 0 (0.0%) |
| 65 to 74 Years | 0 (0.0%) | 0 (0.0%) |
| 75 Years and over | 0 (0.0%) | 0 (0.0%) |
Disability Class: Cognitive Difficulty
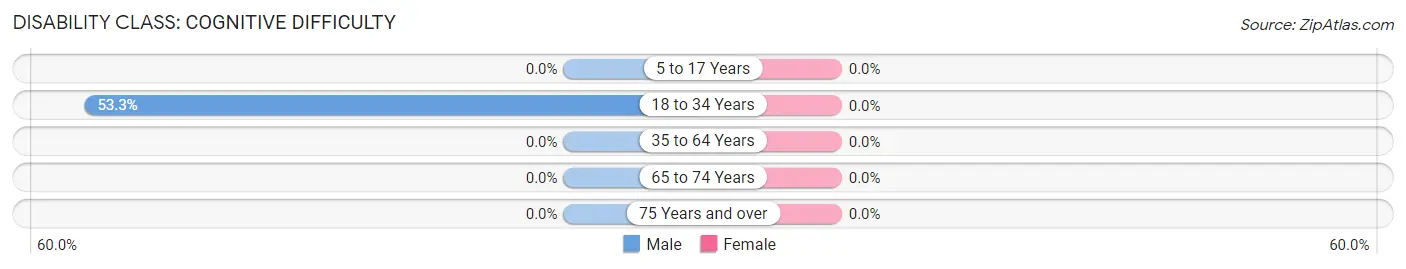
| Age Bracket | Male | Female |
| 5 to 17 Years | 0 (0.0%) | 0 (0.0%) |
| 18 to 34 Years | 8 (53.3%) | 0 (0.0%) |
| 35 to 64 Years | 0 (0.0%) | 0 (0.0%) |
| 65 to 74 Years | 0 (0.0%) | 0 (0.0%) |
| 75 Years and over | 0 (0.0%) | 0 (0.0%) |
Disability Class: Ambulatory Difficulty
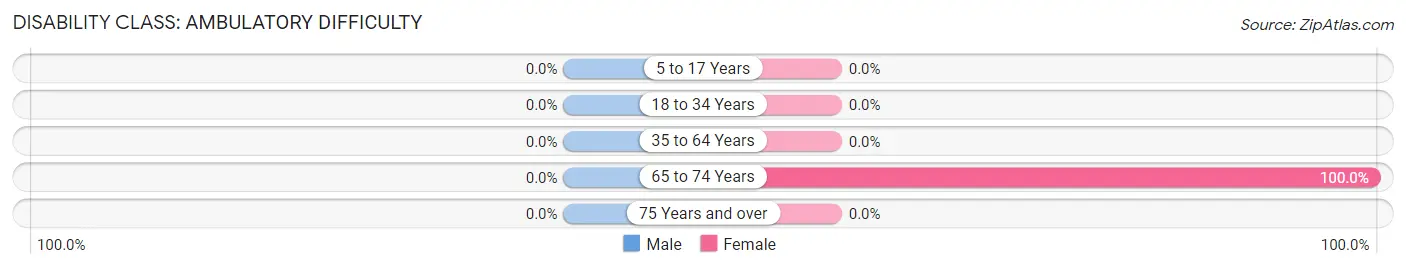
| Age Bracket | Male | Female |
| 5 to 17 Years | 0 (0.0%) | 0 (0.0%) |
| 18 to 34 Years | 0 (0.0%) | 0 (0.0%) |
| 35 to 64 Years | 0 (0.0%) | 0 (0.0%) |
| 65 to 74 Years | 0 (0.0%) | 23 (100.0%) |
| 75 Years and over | 0 (0.0%) | 0 (0.0%) |
Disability Class: Self-Care Difficulty
| Age Bracket | Male | Female |
| 5 to 17 Years | 0 (0.0%) | 0 (0.0%) |
| 18 to 34 Years | 0 (0.0%) | 0 (0.0%) |
| 35 to 64 Years | 0 (0.0%) | 0 (0.0%) |
| 65 to 74 Years | 0 (0.0%) | 0 (0.0%) |
| 75 Years and over | 0 (0.0%) | 0 (0.0%) |
Technology Access in Kimbolton
Computing Device Access in Kimbolton
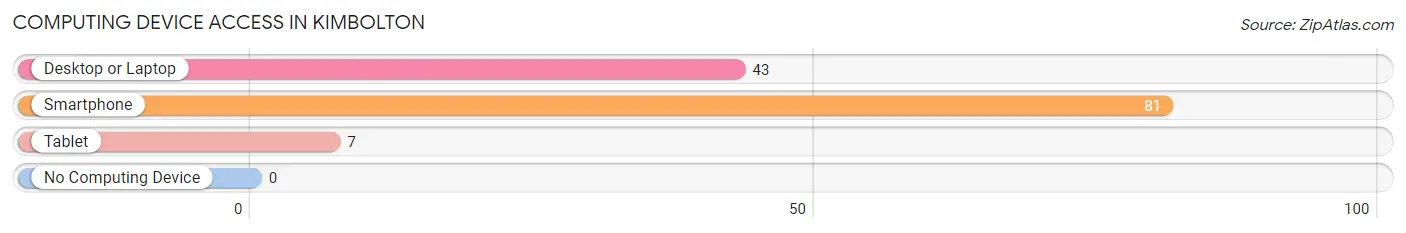
| Device Type | # Households | % Households |
| Desktop or Laptop | 43 | 53.1% |
| Smartphone | 81 | 100.0% |
| Tablet | 7 | 8.6% |
| No Computing Device | 0 | 0.0% |
| Total | 81 | 100.0% |
Internet Access in Kimbolton
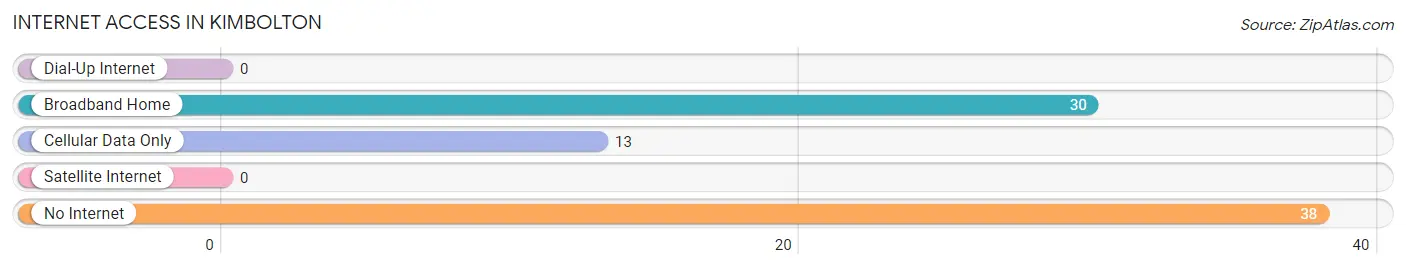
| Internet Type | # Households | % Households |
| Dial-Up Internet | 0 | 0.0% |
| Broadband Home | 30 | 37.0% |
| Cellular Data Only | 13 | 16.1% |
| Satellite Internet | 0 | 0.0% |
| No Internet | 38 | 46.9% |
| Total | 81 | 100.0% |
Kimbolton Summary
Kimbolton is a small village located in Guernsey County, Ohio, United States. The village is situated in the rolling hills of eastern Ohio, approximately 25 miles east of Cambridge and 30 miles west of Zanesville. The population of Kimbolton was estimated to be 441 in 2019.
Geography
Kimbolton is located at 39°59'N 81°37'W (39.983, -81.619). According to the United States Census Bureau, the village has a total area of 0.3 square miles (0.8 km2), all land.
The village is situated in the rolling hills of eastern Ohio, approximately 25 miles east of Cambridge and 30 miles west of Zanesville. Kimbolton is located in the Appalachian Plateau region of Ohio, which is characterized by its rugged terrain and steep hills. The village is surrounded by farmland and is located near the Muskingum River.
History
Kimbolton was founded in 1817 by a group of settlers from Pennsylvania. The village was named after Kimbolton Castle in England. The village was incorporated in 1837 and was the first village in Guernsey County to be incorporated.
Kimbolton was a small farming community until the late 19th century when the railroad was built through the village. This allowed the village to become a shipping point for local farmers and businesses. The village also became a popular tourist destination due to its proximity to the Muskingum River.
In the early 20th century, Kimbolton was home to several factories, including a brickyard, a canning factory, and a furniture factory. The village also had a bank, a hotel, and several stores.
Economy
Kimbolton’s economy is largely based on agriculture and tourism. The village is home to several farms, which produce a variety of crops, including corn, soybeans, and hay. The village is also home to several tourist attractions, including the Muskingum River, the Kimbolton Covered Bridge, and the Kimbolton Historical Museum.
Demographics
As of the census of 2010, there were 441 people, 181 households, and 122 families residing in the village. The population density was 1,521.7 people per square mile (586.7/km2). There were 197 housing units at an average density of 672.2 per square mile (259.3/km2). The racial makeup of the village was 97.3% White, 0.2% African American, 0.2% Native American, 0.2% Asian, 0.2% from other races, and 1.8% from two or more races. Hispanic or Latino of any race were 0.7% of the population.
There were 181 households, out of which 28.2% had children under the age of 18 living with them, 51.4% were married couples living together, 10.5% had a female householder with no husband present, and 33.7% were non-families. 29.3% of all households were made up of individuals, and 14.9% had someone living alone who was 65 years of age or older. The average household size was 2.44 and the average family size was 3.00.
In the village, the population was spread out, with 24.2% under the age of 18, 8.2% from 18 to 24, 25.2% from 25 to 44, 24.2% from 45 to 64, and 18.2% who were 65 years of age or older. The median age was 39 years. For every 100 females, there were 94.2 males. For every 100 females age 18 and over, there were 88.2 males.
The median income for a household in the village was $31,250, and the median income for a family was $37,500. Males had a median income of $30,000 versus $20,000 for females. The per capita income for the village was $15,945. About 8.3% of families and 11.2% of the population were below the poverty line, including 16.7% of those under age 18 and 8.3% of those age 65 or over.
Common Questions
What is Per Capita Income in Kimbolton?
Per Capita income in Kimbolton is $38,298.
What is the Median Family Income in Kimbolton?
Median Family Income in Kimbolton is $83,424.
What is Inequality or Gini Index in Kimbolton?
Inequality or Gini Index in Kimbolton is 0.47.
What is the Total Population of Kimbolton?
Total Population of Kimbolton is 130.
What is the Total Male Population of Kimbolton?
Total Male Population of Kimbolton is 73.
What is the Total Female Population of Kimbolton?
Total Female Population of Kimbolton is 57.
What is the Ratio of Males per 100 Females in Kimbolton?
There are 128.07 Males per 100 Females in Kimbolton.
What is the Ratio of Females per 100 Males in Kimbolton?
There are 78.08 Females per 100 Males in Kimbolton.
What is the Median Population Age in Kimbolton?
Median Population Age in Kimbolton is 58.4 Years.
What is the Average Family Size in Kimbolton
Average Family Size in Kimbolton is 2.1 People.
What is the Average Household Size in Kimbolton
Average Household Size in Kimbolton is 1.6 People.
How Large is the Labor Force in Kimbolton?
There are 43 People in the Labor Forcein in Kimbolton.
What is the Percentage of People in the Labor Force in Kimbolton?
36.8% of People are in the Labor Force in Kimbolton.