Kalida, OH Map & Demographics
Kalida Map
Kalida Overview
$43,674
PER CAPITA INCOME
$122,847
AVG FAMILY INCOME
$97,171
AVG HOUSEHOLD INCOME
0.9%
WAGE / INCOME GAP [ % ]
99.1¢/ $1
WAGE / INCOME GAP [ $ ]
0.35
INEQUALITY / GINI INDEX
1,575
TOTAL POPULATION
774
MALE POPULATION
801
FEMALE POPULATION
96.63
MALES / 100 FEMALES
103.49
FEMALES / 100 MALES
40.6
MEDIAN AGE
2.9
AVG FAMILY SIZE
2.4
AVG HOUSEHOLD SIZE
951
LABOR FORCE [ PEOPLE ]
74.0%
PERCENT IN LABOR FORCE
1.6%
UNEMPLOYMENT RATE
Kalida Zip Codes
Kalida Area Codes
Income in Kalida
Income Overview in Kalida
Per Capita Income in Kalida is $43,674, while median incomes of families and households are $122,847 and $97,171 respectively.
| Characteristic | Number | Measure |
| Per Capita Income | 1,575 | $43,674 |
| Median Family Income | 463 | $122,847 |
| Mean Family Income | 463 | $135,563 |
| Median Household Income | 615 | $97,171 |
| Mean Household Income | 615 | $114,644 |
| Income Deficit | 463 | $0 |
| Wage / Income Gap (%) | 1,575 | 0.90% |
| Wage / Income Gap ($) | 1,575 | 99.10¢ per $1 |
| Gini / Inequality Index | 1,575 | 0.35 |
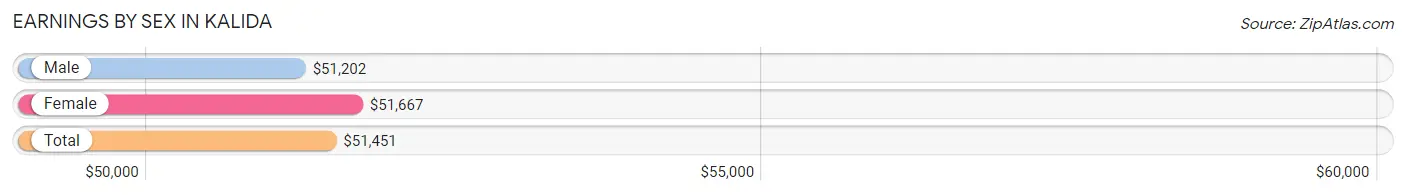
Earnings by Sex in Kalida
Average Earnings in Kalida are $51,451, $51,202 for men and $51,667 for women, a difference of 0.9%.
| Sex | Number | Average Earnings |
| Male | 534 (54.2%) | $51,202 |
| Female | 452 (45.8%) | $51,667 |
| Total | 986 (100.0%) | $51,451 |
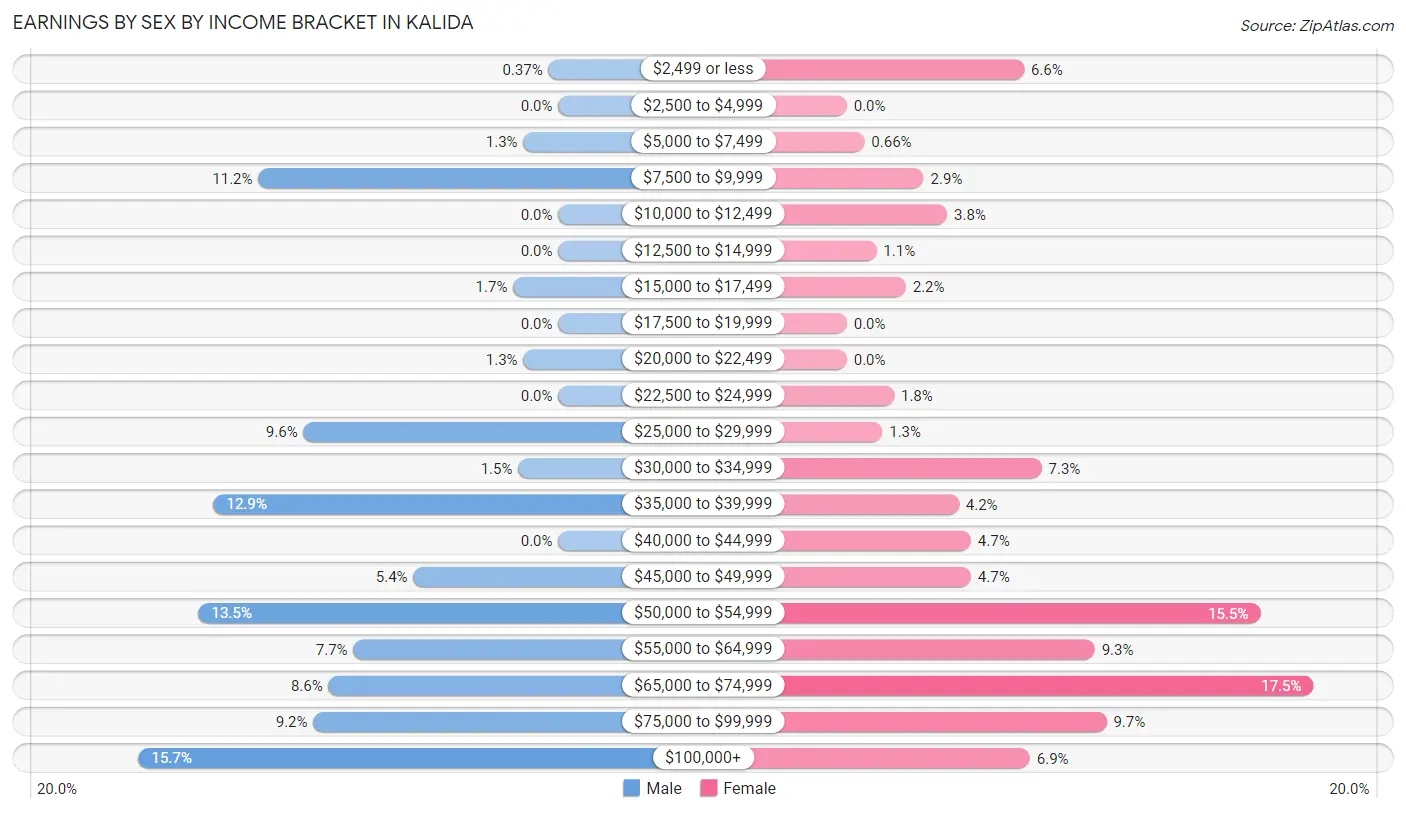
Earnings by Sex by Income Bracket in Kalida
The most common earnings brackets in Kalida are $100,000+ for men (84 | 15.7%) and $65,000 to $74,999 for women (79 | 17.5%).
| Income | Male | Female |
| $2,499 or less | 2 (0.4%) | 30 (6.6%) |
| $2,500 to $4,999 | 0 (0.0%) | 0 (0.0%) |
| $5,000 to $7,499 | 7 (1.3%) | 3 (0.7%) |
| $7,500 to $9,999 | 60 (11.2%) | 13 (2.9%) |
| $10,000 to $12,499 | 0 (0.0%) | 17 (3.8%) |
| $12,500 to $14,999 | 0 (0.0%) | 5 (1.1%) |
| $15,000 to $17,499 | 9 (1.7%) | 10 (2.2%) |
| $17,500 to $19,999 | 0 (0.0%) | 0 (0.0%) |
| $20,000 to $22,499 | 7 (1.3%) | 0 (0.0%) |
| $22,500 to $24,999 | 0 (0.0%) | 8 (1.8%) |
| $25,000 to $29,999 | 51 (9.6%) | 6 (1.3%) |
| $30,000 to $34,999 | 8 (1.5%) | 33 (7.3%) |
| $35,000 to $39,999 | 69 (12.9%) | 19 (4.2%) |
| $40,000 to $44,999 | 0 (0.0%) | 21 (4.6%) |
| $45,000 to $49,999 | 29 (5.4%) | 21 (4.6%) |
| $50,000 to $54,999 | 72 (13.5%) | 70 (15.5%) |
| $55,000 to $64,999 | 41 (7.7%) | 42 (9.3%) |
| $65,000 to $74,999 | 46 (8.6%) | 79 (17.5%) |
| $75,000 to $99,999 | 49 (9.2%) | 44 (9.7%) |
| $100,000+ | 84 (15.7%) | 31 (6.9%) |
| Total | 534 (100.0%) | 452 (100.0%) |
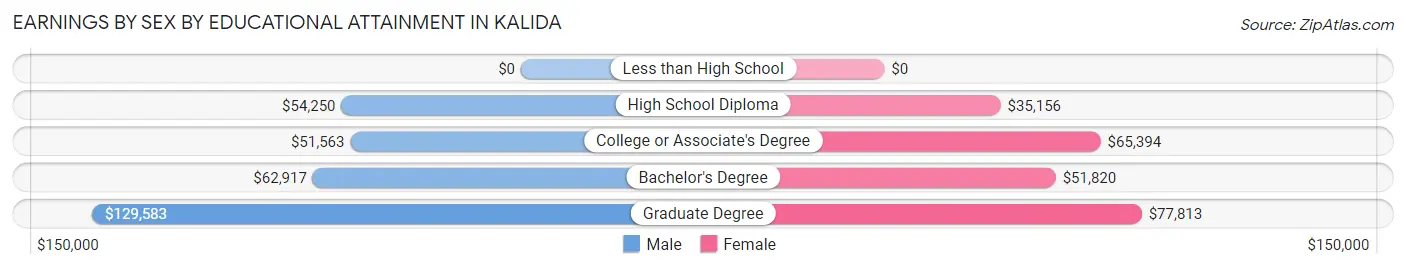
Earnings by Sex by Educational Attainment in Kalida
Average earnings in Kalida are $53,125 for men and $54,125 for women, a difference of 1.8%. Men with an educational attainment of graduate degree enjoy the highest average annual earnings of $129,583, while those with college or associate's degree education earn the least with $51,563. Women with an educational attainment of graduate degree earn the most with the average annual earnings of $77,813, while those with high school diploma education have the smallest earnings of $35,156.
| Educational Attainment | Male Income | Female Income |
| Less than High School | - | - |
| High School Diploma | $54,250 | $35,156 |
| College or Associate's Degree | $51,563 | $65,394 |
| Bachelor's Degree | $62,917 | $51,820 |
| Graduate Degree | $129,583 | $77,813 |
| Total | $53,125 | $54,125 |
Family Income in Kalida
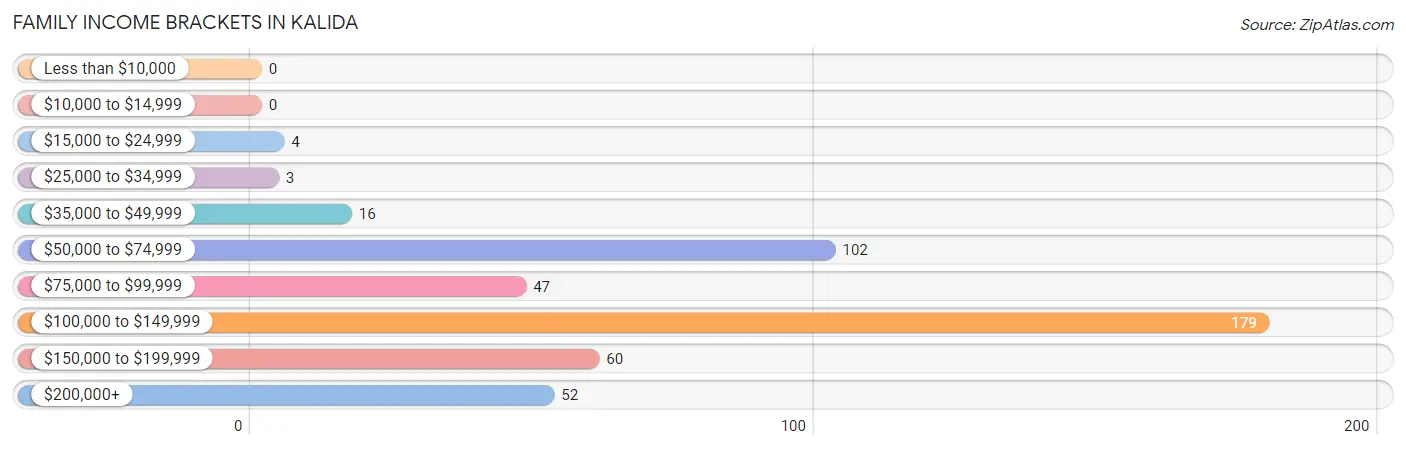
Family Income Brackets in Kalida
According to the Kalida family income data, there are 179 families falling into the $100,000 to $149,999 income range, which is the most common income bracket and makes up 38.7% of all families.
| Income Bracket | # Families | % Families |
| Less than $10,000 | 0 | 0.0% |
| $10,000 to $14,999 | 0 | 0.0% |
| $15,000 to $24,999 | 4 | 0.9% |
| $25,000 to $34,999 | 3 | 0.6% |
| $35,000 to $49,999 | 16 | 3.5% |
| $50,000 to $74,999 | 102 | 22.0% |
| $75,000 to $99,999 | 47 | 10.2% |
| $100,000 to $149,999 | 179 | 38.7% |
| $150,000 to $199,999 | 60 | 13.0% |
| $200,000+ | 52 | 11.2% |
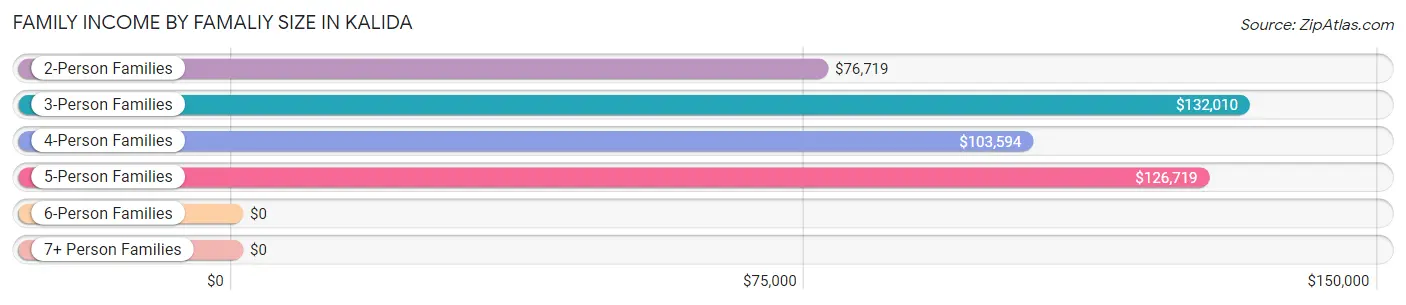
Family Income by Famaliy Size in Kalida
3-person families (104 | 22.5%) account for the highest median family income in Kalida with $132,010 per family, while 3-person families (104 | 22.5%) have the highest median income of $44,003 per family member.
| Income Bracket | # Families | Median Income |
| 2-Person Families | 237 (51.2%) | $76,719 |
| 3-Person Families | 104 (22.5%) | $132,010 |
| 4-Person Families | 67 (14.5%) | $103,594 |
| 5-Person Families | 40 (8.6%) | $126,719 |
| 6-Person Families | 15 (3.2%) | $0 |
| 7+ Person Families | 0 (0.0%) | $0 |
| Total | 463 (100.0%) | $122,847 |
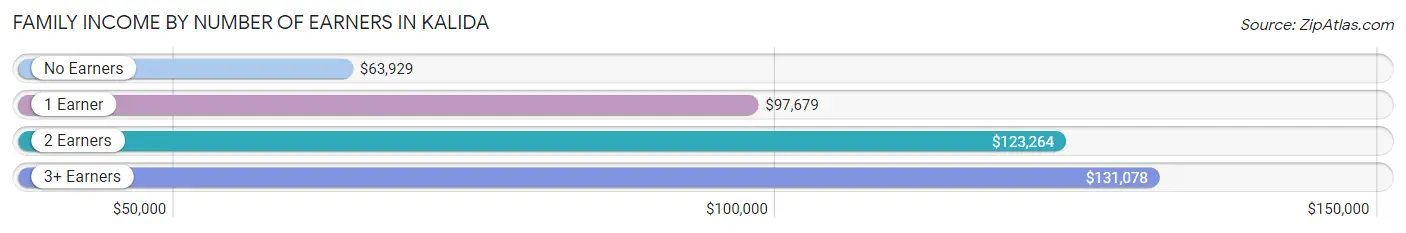
Family Income by Number of Earners in Kalida
The median family income in Kalida is $122,847, with families comprising 3+ earners (94) having the highest median family income of $131,078, while families with no earners (46) have the lowest median family income of $63,929, accounting for 20.3% and 9.9% of families, respectively.
| Number of Earners | # Families | Median Income |
| No Earners | 46 (9.9%) | $63,929 |
| 1 Earner | 82 (17.7%) | $97,679 |
| 2 Earners | 241 (52.0%) | $123,264 |
| 3+ Earners | 94 (20.3%) | $131,078 |
| Total | 463 (100.0%) | $122,847 |
Household Income in Kalida
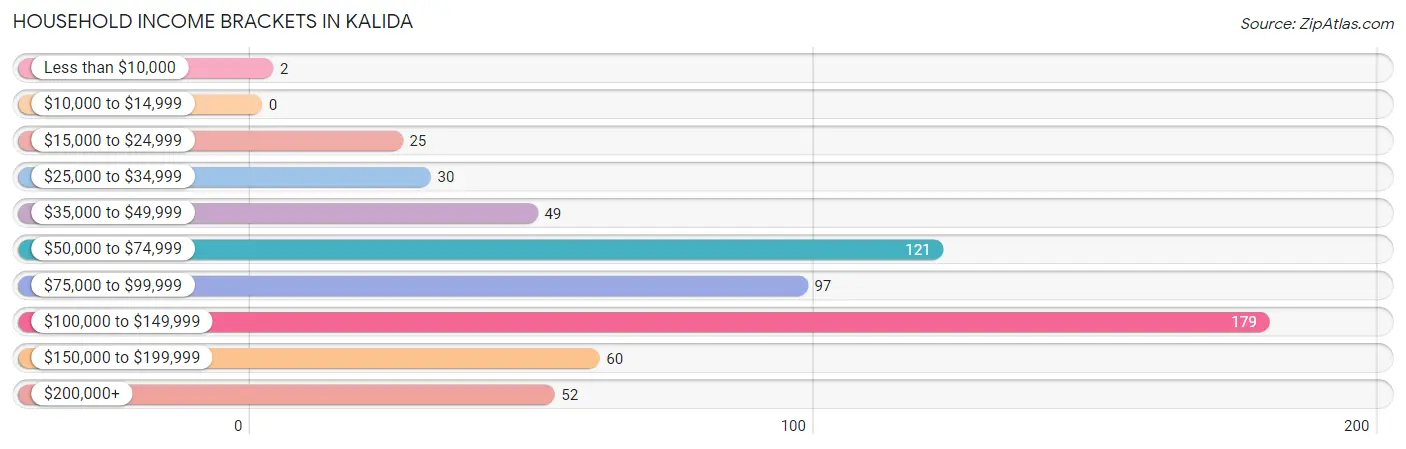
Household Income Brackets in Kalida
With 179 households falling in the category, the $100,000 to $149,999 income range is the most frequent in Kalida, accounting for 29.1% of all households.
| Income Bracket | # Households | % Households |
| Less than $10,000 | 2 | 0.3% |
| $10,000 to $14,999 | 0 | 0.0% |
| $15,000 to $24,999 | 25 | 4.1% |
| $25,000 to $34,999 | 30 | 4.9% |
| $35,000 to $49,999 | 49 | 8.0% |
| $50,000 to $74,999 | 121 | 19.7% |
| $75,000 to $99,999 | 97 | 15.8% |
| $100,000 to $149,999 | 179 | 29.1% |
| $150,000 to $199,999 | 60 | 9.8% |
| $200,000+ | 52 | 8.5% |
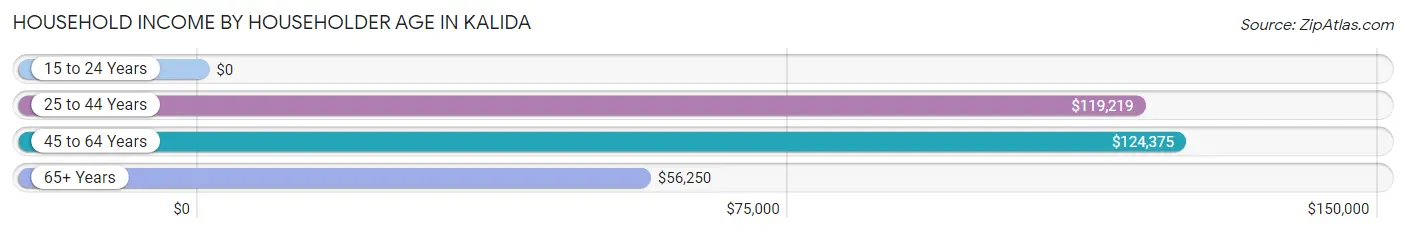
Household Income by Householder Age in Kalida
The median household income in Kalida is $97,171, with the highest median household income of $124,375 found in the 45 to 64 years age bracket for the primary householder. A total of 249 households (40.5%) fall into this category.
| Income Bracket | # Households | Median Income |
| 15 to 24 Years | 0 (0.0%) | $0 |
| 25 to 44 Years | 211 (34.3%) | $119,219 |
| 45 to 64 Years | 249 (40.5%) | $124,375 |
| 65+ Years | 155 (25.2%) | $56,250 |
| Total | 615 (100.0%) | $97,171 |
Poverty in Kalida
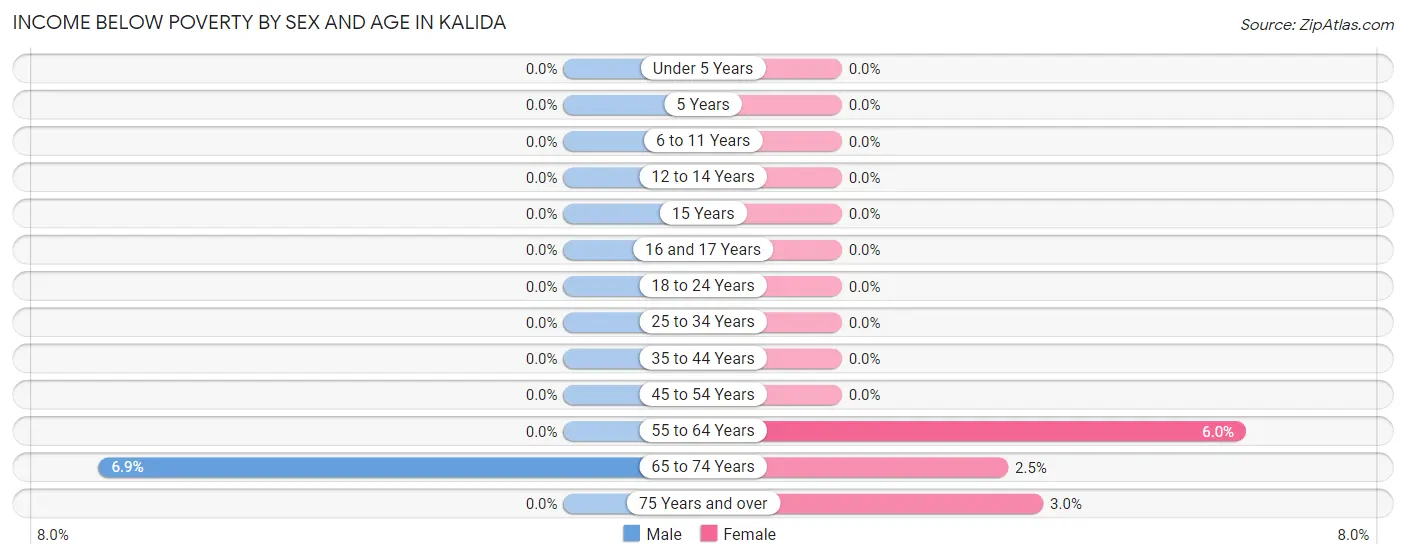
Income Below Poverty by Sex and Age in Kalida
With 0.5% poverty level for males and 1.8% for females among the residents of Kalida, 65 to 74 year old males and 55 to 64 year old females are the most vulnerable to poverty, with 4 males (6.9%) and 9 females (6.0%) in their respective age groups living below the poverty level.
| Age Bracket | Male | Female |
| Under 5 Years | 0 (0.0%) | 0 (0.0%) |
| 5 Years | 0 (0.0%) | 0 (0.0%) |
| 6 to 11 Years | 0 (0.0%) | 0 (0.0%) |
| 12 to 14 Years | 0 (0.0%) | 0 (0.0%) |
| 15 Years | 0 (0.0%) | 0 (0.0%) |
| 16 and 17 Years | 0 (0.0%) | 0 (0.0%) |
| 18 to 24 Years | 0 (0.0%) | 0 (0.0%) |
| 25 to 34 Years | 0 (0.0%) | 0 (0.0%) |
| 35 to 44 Years | 0 (0.0%) | 0 (0.0%) |
| 45 to 54 Years | 0 (0.0%) | 0 (0.0%) |
| 55 to 64 Years | 0 (0.0%) | 9 (6.0%) |
| 65 to 74 Years | 4 (6.9%) | 2 (2.5%) |
| 75 Years and over | 0 (0.0%) | 2 (3.0%) |
| Total | 4 (0.5%) | 13 (1.8%) |
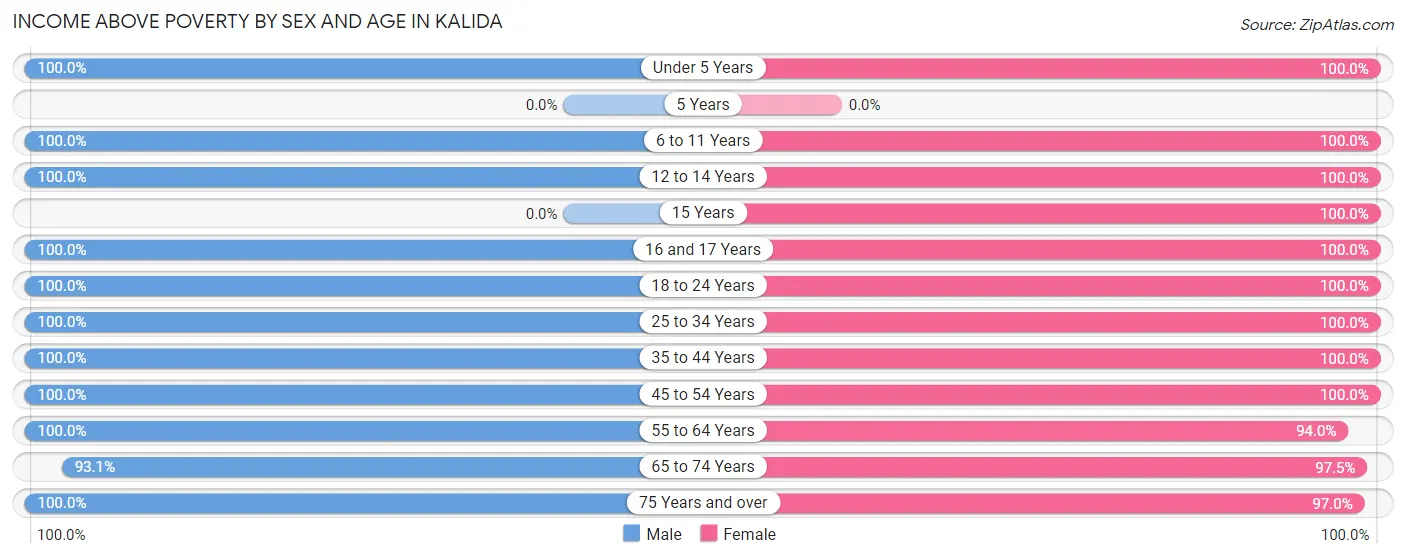
Income Above Poverty by Sex and Age in Kalida
According to the poverty statistics in Kalida, males aged under 5 years and females aged under 5 years are the age groups that are most secure financially, with 100.0% of males and 100.0% of females in these age groups living above the poverty line.
| Age Bracket | Male | Female |
| Under 5 Years | 47 (100.0%) | 70 (100.0%) |
| 5 Years | 0 (0.0%) | 0 (0.0%) |
| 6 to 11 Years | 69 (100.0%) | 32 (100.0%) |
| 12 to 14 Years | 48 (100.0%) | 18 (100.0%) |
| 15 Years | 0 (0.0%) | 6 (100.0%) |
| 16 and 17 Years | 8 (100.0%) | 20 (100.0%) |
| 18 to 24 Years | 64 (100.0%) | 47 (100.0%) |
| 25 to 34 Years | 157 (100.0%) | 101 (100.0%) |
| 35 to 44 Years | 64 (100.0%) | 77 (100.0%) |
| 45 to 54 Years | 86 (100.0%) | 72 (100.0%) |
| 55 to 64 Years | 125 (100.0%) | 141 (94.0%) |
| 65 to 74 Years | 54 (93.1%) | 79 (97.5%) |
| 75 Years and over | 34 (100.0%) | 65 (97.0%) |
| Total | 756 (99.5%) | 728 (98.3%) |
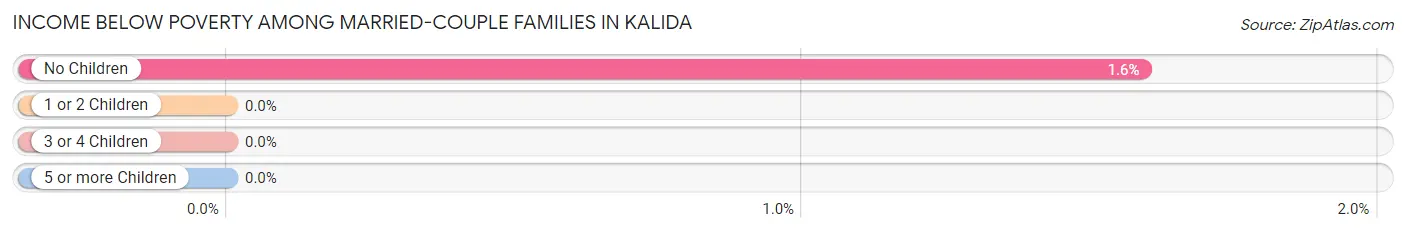
Income Below Poverty Among Married-Couple Families in Kalida
The poverty statistics for married-couple families in Kalida show that 1.0% or 4 of the total 385 families live below the poverty line. Families with no children have the highest poverty rate of 1.6%, comprising of 4 families. On the other hand, families with 1 or 2 children have the lowest poverty rate of 0.0%, which includes 0 families.
| Children | Above Poverty | Below Poverty |
| No Children | 247 (98.4%) | 4 (1.6%) |
| 1 or 2 Children | 97 (100.0%) | 0 (0.0%) |
| 3 or 4 Children | 37 (100.0%) | 0 (0.0%) |
| 5 or more Children | 0 (0.0%) | 0 (0.0%) |
| Total | 381 (99.0%) | 4 (1.0%) |
Income Below Poverty Among Single-Parent Households in Kalida
| Children | Single Father | Single Mother |
| No Children | 0 (0.0%) | 0 (0.0%) |
| 1 or 2 Children | 0 (0.0%) | 0 (0.0%) |
| 3 or 4 Children | 0 (0.0%) | 0 (0.0%) |
| 5 or more Children | 0 (0.0%) | 0 (0.0%) |
| Total | 0 (0.0%) | 0 (0.0%) |
Income Below Poverty Among Married-Couple vs Single-Parent Households in Kalida
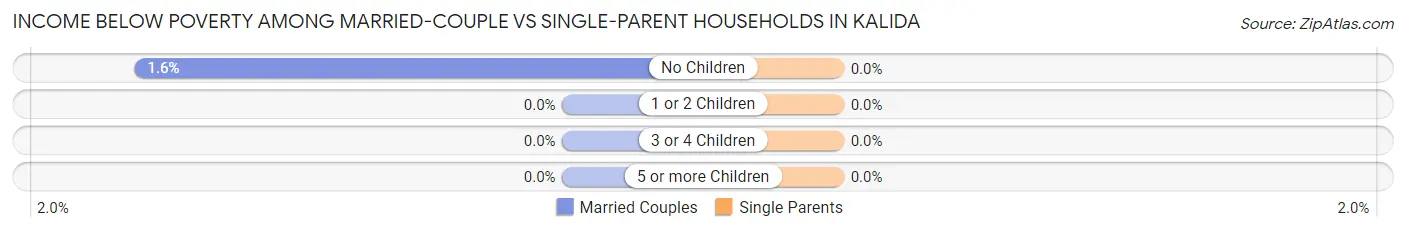
| Children | Married-Couple Families | Single-Parent Households |
| No Children | 4 (1.6%) | 0 (0.0%) |
| 1 or 2 Children | 0 (0.0%) | 0 (0.0%) |
| 3 or 4 Children | 0 (0.0%) | 0 (0.0%) |
| 5 or more Children | 0 (0.0%) | 0 (0.0%) |
| Total | 4 (1.0%) | 0 (0.0%) |
Race in Kalida
The most populous races in Kalida are White / Caucasian (1,542 | 97.9%), Hispanic or Latino (78 | 5.0%), and Some other Race (28 | 1.8%).
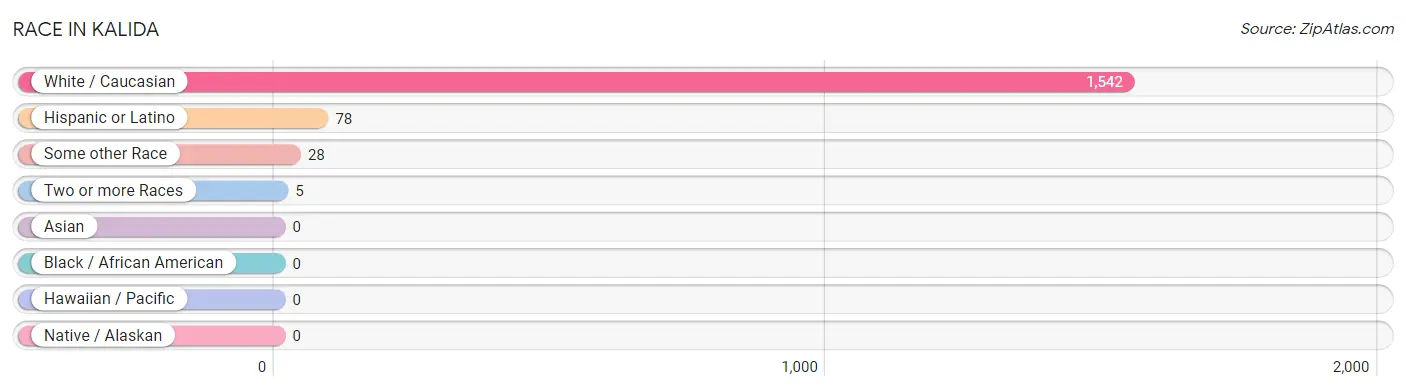
| Race | # Population | % Population |
| Asian | 0 | 0.0% |
| Black / African American | 0 | 0.0% |
| Hawaiian / Pacific | 0 | 0.0% |
| Hispanic or Latino | 78 | 5.0% |
| Native / Alaskan | 0 | 0.0% |
| White / Caucasian | 1,542 | 97.9% |
| Two or more Races | 5 | 0.3% |
| Some other Race | 28 | 1.8% |
| Total | 1,575 | 100.0% |
Ancestry in Kalida
The most populous ancestries reported in Kalida are German (1,064 | 67.6%), Irish (176 | 11.2%), Polish (90 | 5.7%), English (89 | 5.7%), and Mexican (78 | 5.0%), together accounting for 95.0% of all Kalida residents.
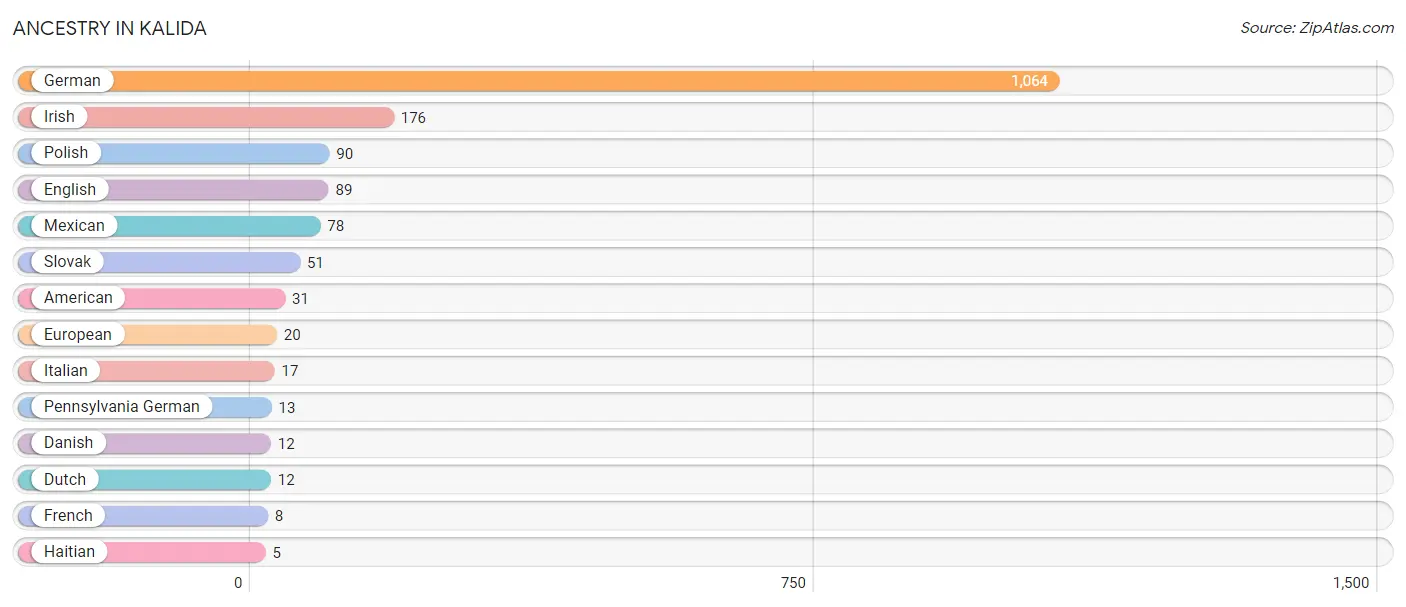
| Ancestry | # Population | % Population |
| American | 31 | 2.0% |
| Danish | 12 | 0.8% |
| Dutch | 12 | 0.8% |
| English | 89 | 5.7% |
| European | 20 | 1.3% |
| French | 8 | 0.5% |
| German | 1,064 | 67.6% |
| Haitian | 5 | 0.3% |
| Irish | 176 | 11.2% |
| Italian | 17 | 1.1% |
| Mexican | 78 | 5.0% |
| Pennsylvania German | 13 | 0.8% |
| Polish | 90 | 5.7% |
| Slovak | 51 | 3.2% | View All 14 Rows |
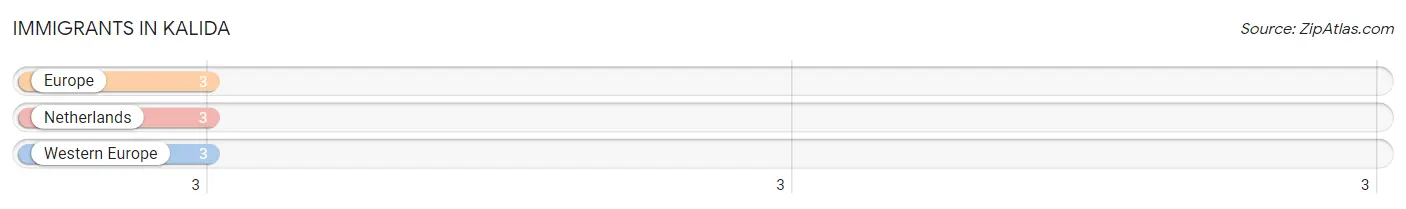
Immigrants in Kalida
The most numerous immigrant groups reported in Kalida came from Europe (3 | 0.2%), Netherlands (3 | 0.2%), and Western Europe (3 | 0.2%), together accounting for 0.6% of all Kalida residents.
| Immigration Origin | # Population | % Population |
| Europe | 3 | 0.2% |
| Netherlands | 3 | 0.2% |
| Western Europe | 3 | 0.2% | View All 3 Rows |
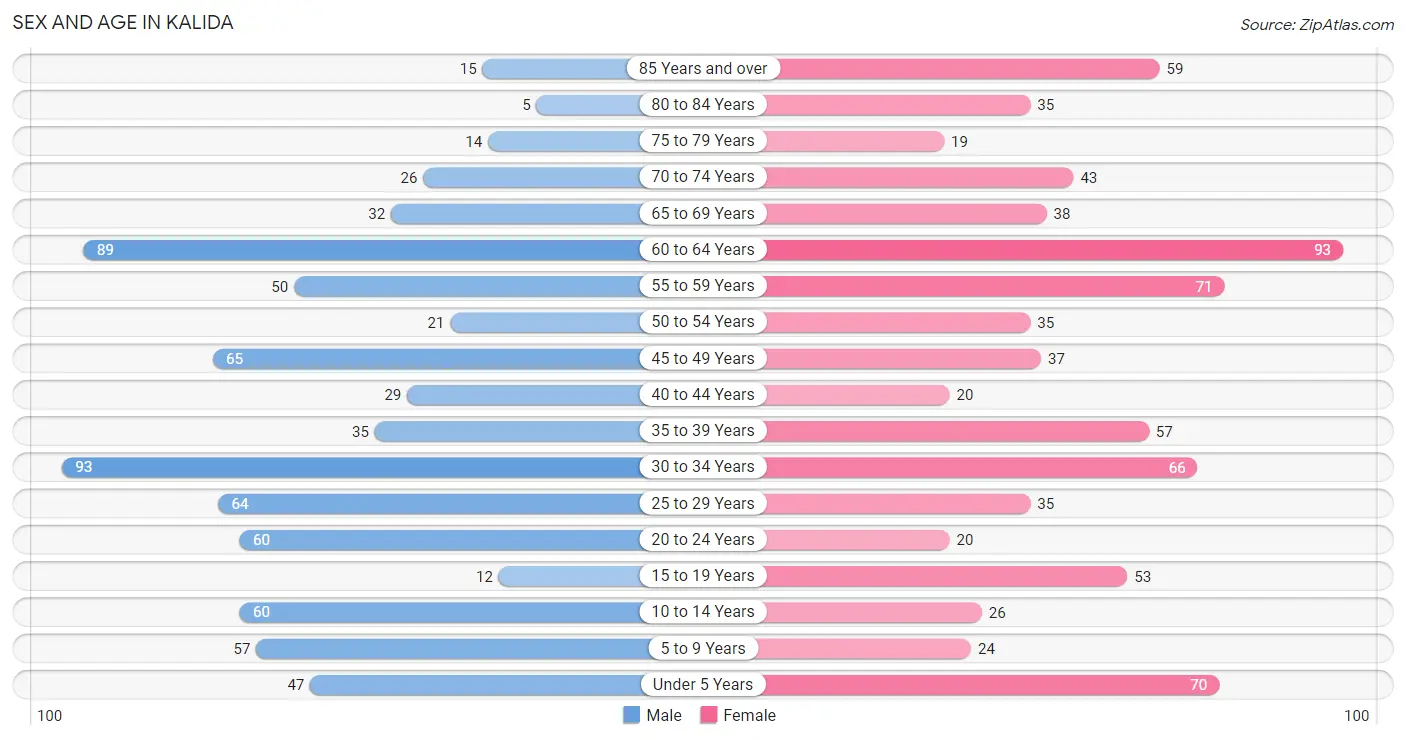
Sex and Age in Kalida
Sex and Age in Kalida
The most populous age groups in Kalida are 30 to 34 Years (93 | 12.0%) for men and 60 to 64 Years (93 | 11.6%) for women.
| Age Bracket | Male | Female |
| Under 5 Years | 47 (6.1%) | 70 (8.7%) |
| 5 to 9 Years | 57 (7.4%) | 24 (3.0%) |
| 10 to 14 Years | 60 (7.7%) | 26 (3.3%) |
| 15 to 19 Years | 12 (1.5%) | 53 (6.6%) |
| 20 to 24 Years | 60 (7.7%) | 20 (2.5%) |
| 25 to 29 Years | 64 (8.3%) | 35 (4.4%) |
| 30 to 34 Years | 93 (12.0%) | 66 (8.2%) |
| 35 to 39 Years | 35 (4.5%) | 57 (7.1%) |
| 40 to 44 Years | 29 (3.7%) | 20 (2.5%) |
| 45 to 49 Years | 65 (8.4%) | 37 (4.6%) |
| 50 to 54 Years | 21 (2.7%) | 35 (4.4%) |
| 55 to 59 Years | 50 (6.5%) | 71 (8.9%) |
| 60 to 64 Years | 89 (11.5%) | 93 (11.6%) |
| 65 to 69 Years | 32 (4.1%) | 38 (4.7%) |
| 70 to 74 Years | 26 (3.4%) | 43 (5.4%) |
| 75 to 79 Years | 14 (1.8%) | 19 (2.4%) |
| 80 to 84 Years | 5 (0.6%) | 35 (4.4%) |
| 85 Years and over | 15 (1.9%) | 59 (7.4%) |
| Total | 774 (100.0%) | 801 (100.0%) |
Families and Households in Kalida
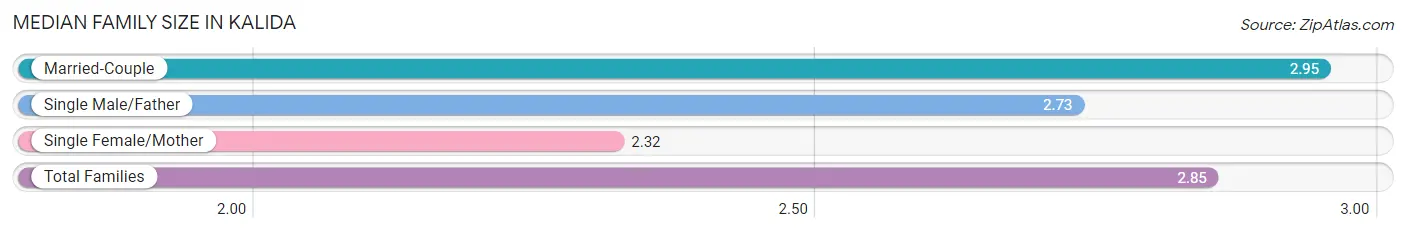
Median Family Size in Kalida
The median family size in Kalida is 2.85 persons per family, with married-couple families (385 | 83.2%) accounting for the largest median family size of 2.95 persons per family. On the other hand, single female/mother families (63 | 13.6%) represent the smallest median family size with 2.32 persons per family.
| Family Type | # Families | Family Size |
| Married-Couple | 385 (83.2%) | 2.95 |
| Single Male/Father | 15 (3.2%) | 2.73 |
| Single Female/Mother | 63 (13.6%) | 2.32 |
| Total Families | 463 (100.0%) | 2.85 |
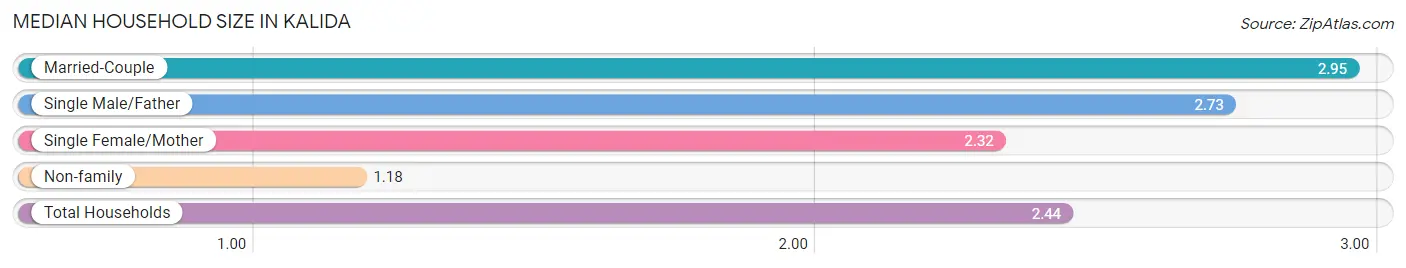
Median Household Size in Kalida
The median household size in Kalida is 2.44 persons per household, with married-couple households (385 | 62.6%) accounting for the largest median household size of 2.95 persons per household. non-family households (152 | 24.7%) represent the smallest median household size with 1.18 persons per household.
| Household Type | # Households | Household Size |
| Married-Couple | 385 (62.6%) | 2.95 |
| Single Male/Father | 15 (2.4%) | 2.73 |
| Single Female/Mother | 63 (10.2%) | 2.32 |
| Non-family | 152 (24.7%) | 1.18 |
| Total Households | 615 (100.0%) | 2.44 |
Household Size by Marriage Status in Kalida
Out of a total of 615 households in Kalida, 463 (75.3%) are family households, while 152 (24.7%) are nonfamily households. The most numerous type of family households are 2-person households, comprising 237, and the most common type of nonfamily households are 1-person households, comprising 93.
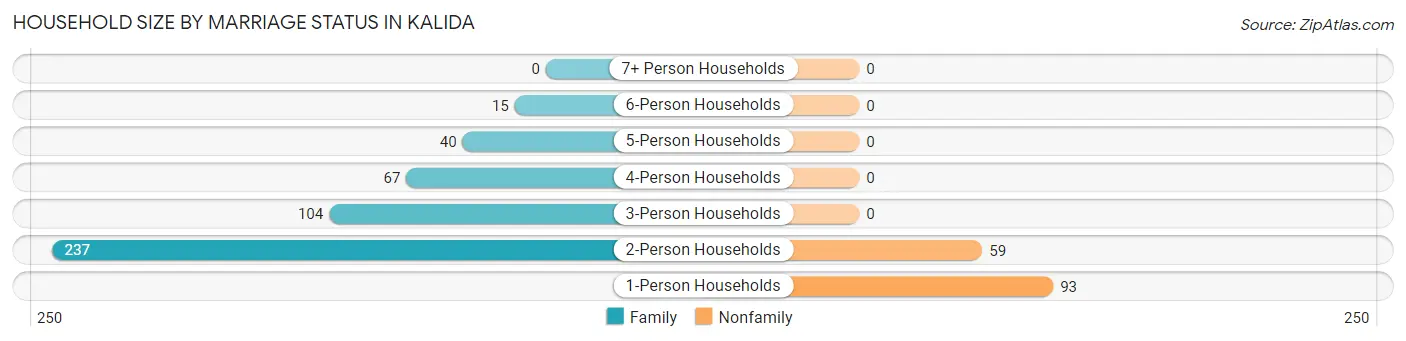
| Household Size | Family Households | Nonfamily Households |
| 1-Person Households | - | 93 (15.1%) |
| 2-Person Households | 237 (38.5%) | 59 (9.6%) |
| 3-Person Households | 104 (16.9%) | 0 (0.0%) |
| 4-Person Households | 67 (10.9%) | 0 (0.0%) |
| 5-Person Households | 40 (6.5%) | 0 (0.0%) |
| 6-Person Households | 15 (2.4%) | 0 (0.0%) |
| 7+ Person Households | 0 (0.0%) | 0 (0.0%) |
| Total | 463 (75.3%) | 152 (24.7%) |
Female Fertility in Kalida
Fertility by Age in Kalida
Average fertility rate in Kalida is 73.0 births per 1,000 women. Women in the age bracket of 20 to 34 years have the highest fertility rate with 174.0 births per 1,000 women. Women in the age bracket of 20 to 34 years acount for 100.0% of all women with births.
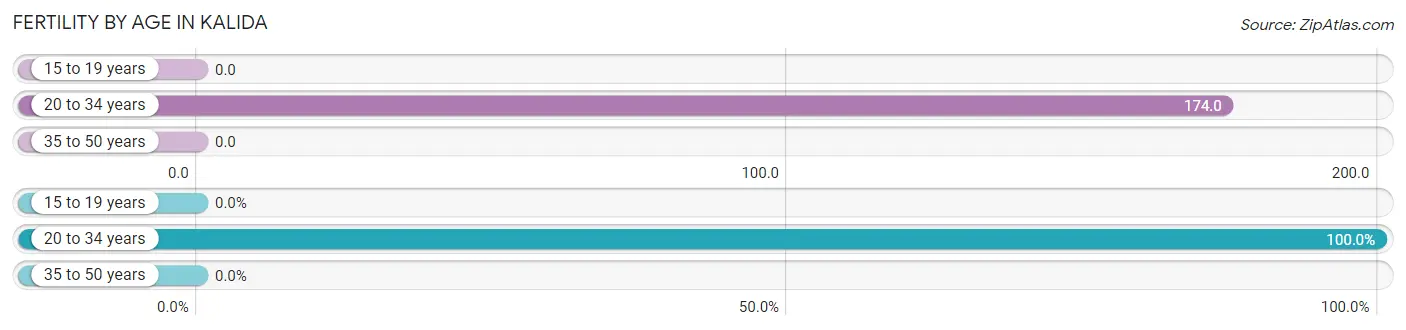
| Age Bracket | Women with Births | Births / 1,000 Women |
| 15 to 19 years | 0 (0.0%) | 0.0 |
| 20 to 34 years | 21 (100.0%) | 174.0 |
| 35 to 50 years | 0 (0.0%) | 0.0 |
| Total | 21 (100.0%) | 73.0 |
Fertility by Age by Marriage Status in Kalida
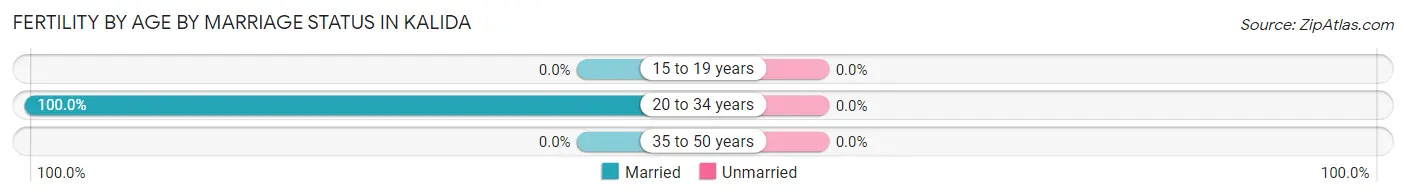
| Age Bracket | Married | Unmarried |
| 15 to 19 years | 0 (0.0%) | 0 (0.0%) |
| 20 to 34 years | 21 (100.0%) | 0 (0.0%) |
| 35 to 50 years | 0 (0.0%) | 0 (0.0%) |
| Total | 21 (100.0%) | 0 (0.0%) |
Fertility by Education in Kalida
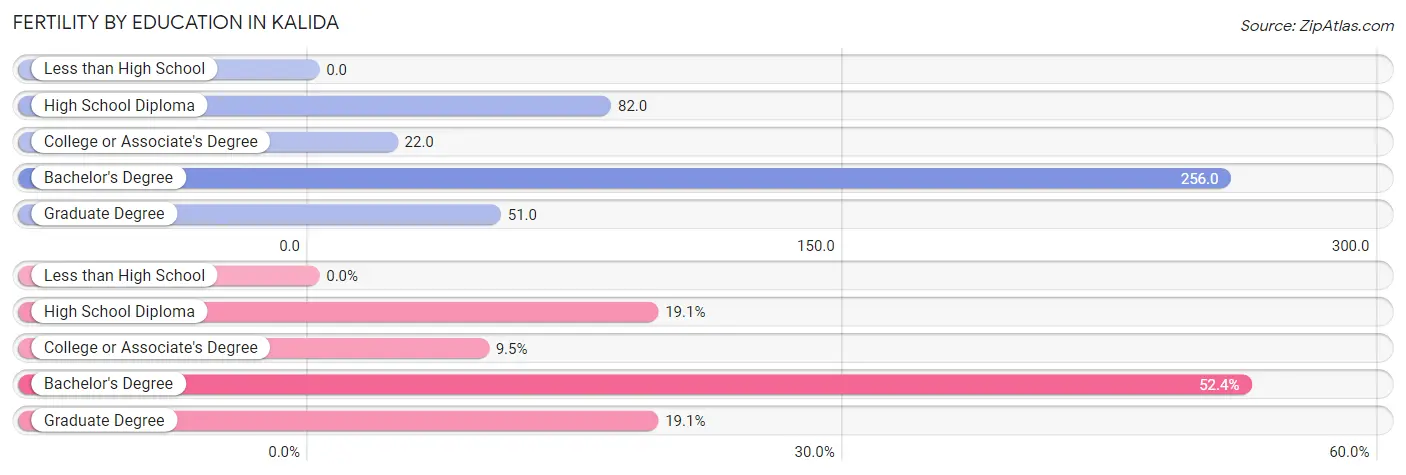
| Educational Attainment | Women with Births | Births / 1,000 Women |
| Less than High School | 0 (0.0%) | 0.0 |
| High School Diploma | 4 (19.1%) | 82.0 |
| College or Associate's Degree | 2 (9.5%) | 22.0 |
| Bachelor's Degree | 11 (52.4%) | 256.0 |
| Graduate Degree | 4 (19.1%) | 51.0 |
| Total | 21 (100.0%) | 73.0 |
Fertility by Education by Marriage Status in Kalida
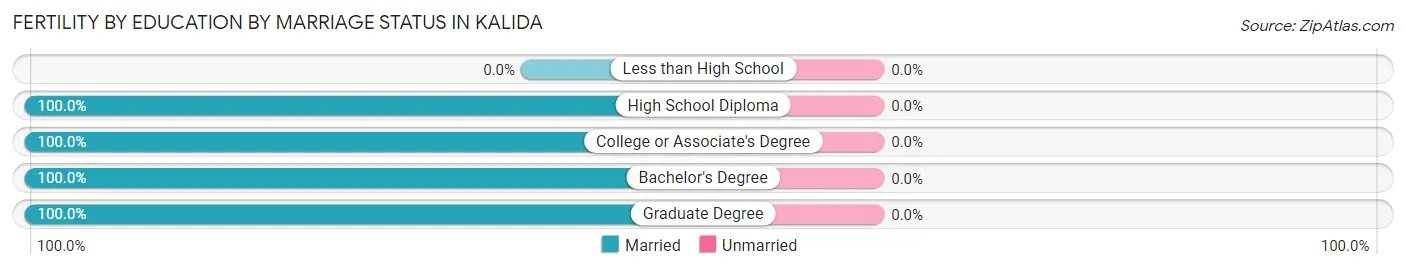
| Educational Attainment | Married | Unmarried |
| Less than High School | 0 (0.0%) | 0 (0.0%) |
| High School Diploma | 4 (100.0%) | 0 (0.0%) |
| College or Associate's Degree | 2 (100.0%) | 0 (0.0%) |
| Bachelor's Degree | 11 (100.0%) | 0 (0.0%) |
| Graduate Degree | 4 (100.0%) | 0 (0.0%) |
| Total | 21 (100.0%) | 0 (0.0%) |
Employment Characteristics in Kalida
Employment by Class of Employer in Kalida
Among the 916 employed individuals in Kalida, private company employees (623 | 68.0%), not-for-profit organizations (142 | 15.5%), and local government employees (64 | 7.0%) make up the most common classes of employment.
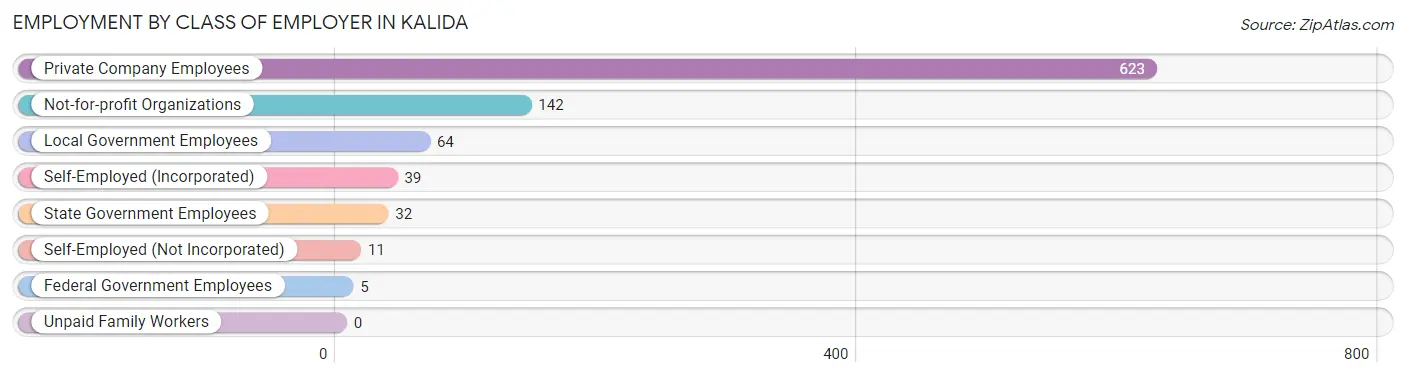
| Employer Class | # Employees | % Employees |
| Private Company Employees | 623 | 68.0% |
| Self-Employed (Incorporated) | 39 | 4.3% |
| Self-Employed (Not Incorporated) | 11 | 1.2% |
| Not-for-profit Organizations | 142 | 15.5% |
| Local Government Employees | 64 | 7.0% |
| State Government Employees | 32 | 3.5% |
| Federal Government Employees | 5 | 0.5% |
| Unpaid Family Workers | 0 | 0.0% |
| Total | 916 | 100.0% |
Employment Status by Age in Kalida
According to the labor force statistics for Kalida, out of the total population over 16 years of age (1,285), 74.0% or 951 individuals are in the labor force, with 1.6% or 15 of them unemployed. The age group with the highest labor force participation rate is 20 to 24 years, with 100.0% or 80 individuals in the labor force. Within the labor force, the 20 to 24 years age range has the highest percentage of unemployed individuals, with 18.8% or 15 of them being unemployed.
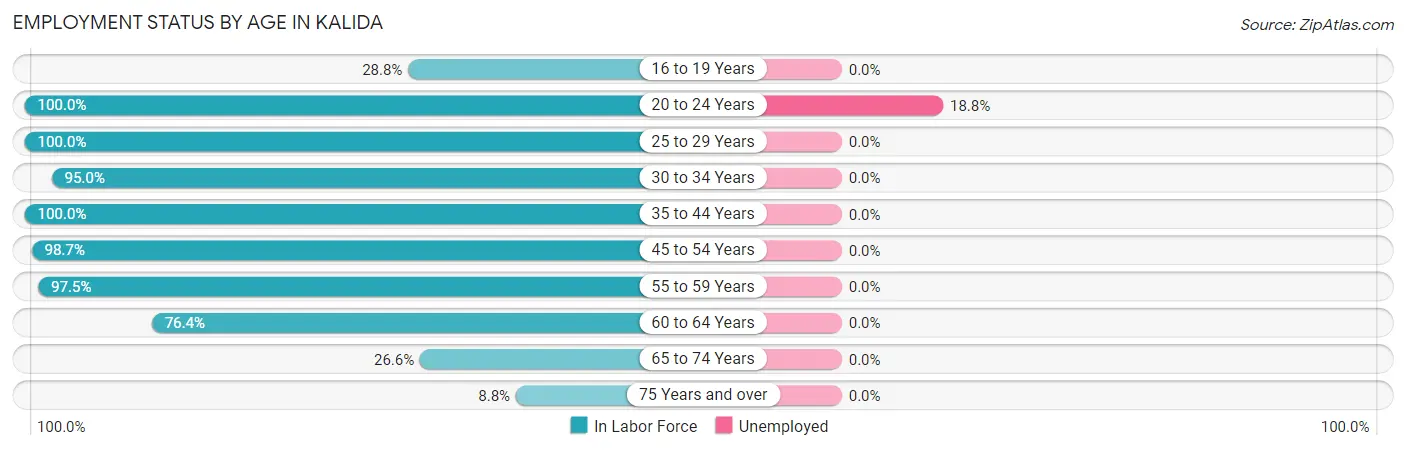
| Age Bracket | In Labor Force | Unemployed |
| 16 to 19 Years | 17 (28.8%) | 0 (0.0%) |
| 20 to 24 Years | 80 (100.0%) | 15 (18.8%) |
| 25 to 29 Years | 99 (100.0%) | 0 (0.0%) |
| 30 to 34 Years | 151 (95.0%) | 0 (0.0%) |
| 35 to 44 Years | 141 (100.0%) | 0 (0.0%) |
| 45 to 54 Years | 156 (98.7%) | 0 (0.0%) |
| 55 to 59 Years | 118 (97.5%) | 0 (0.0%) |
| 60 to 64 Years | 139 (76.4%) | 0 (0.0%) |
| 65 to 74 Years | 37 (26.6%) | 0 (0.0%) |
| 75 Years and over | 13 (8.8%) | 0 (0.0%) |
| Total | 951 (74.0%) | 15 (1.6%) |
Employment Status by Educational Attainment in Kalida
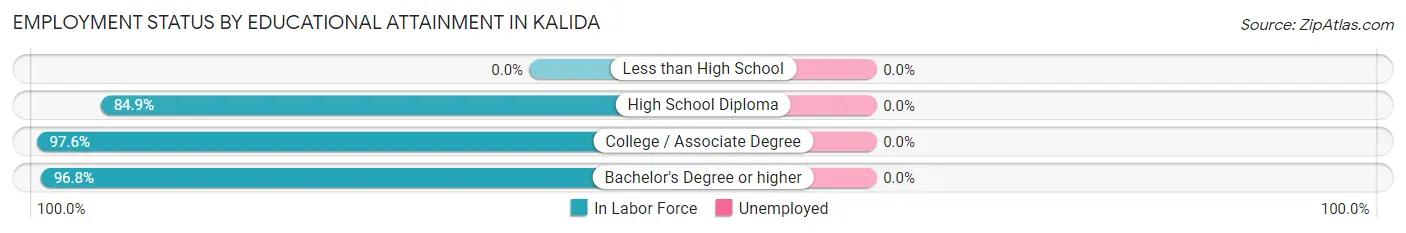
| Educational Attainment | In Labor Force | Unemployed |
| Less than High School | 0 (0.0%) | 0 (0.0%) |
| High School Diploma | 124 (84.9%) | 0 (0.0%) |
| College / Associate Degree | 320 (97.6%) | 0 (0.0%) |
| Bachelor's Degree or higher | 360 (96.8%) | 0 (0.0%) |
| Total | 804 (93.5%) | 0 (0.0%) |
Employment Occupations by Sex in Kalida
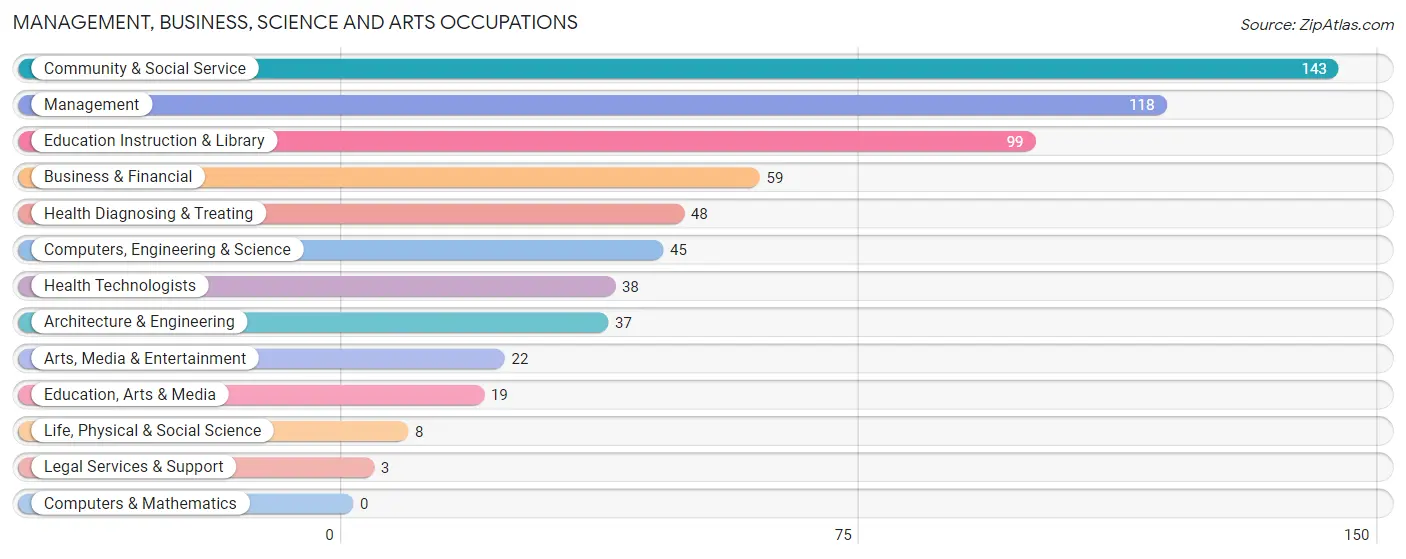
Management, Business, Science and Arts Occupations
The most common Management, Business, Science and Arts occupations in Kalida are Community & Social Service (143 | 15.3%), Management (118 | 12.6%), Education Instruction & Library (99 | 10.6%), Business & Financial (59 | 6.3%), and Health Diagnosing & Treating (48 | 5.1%).
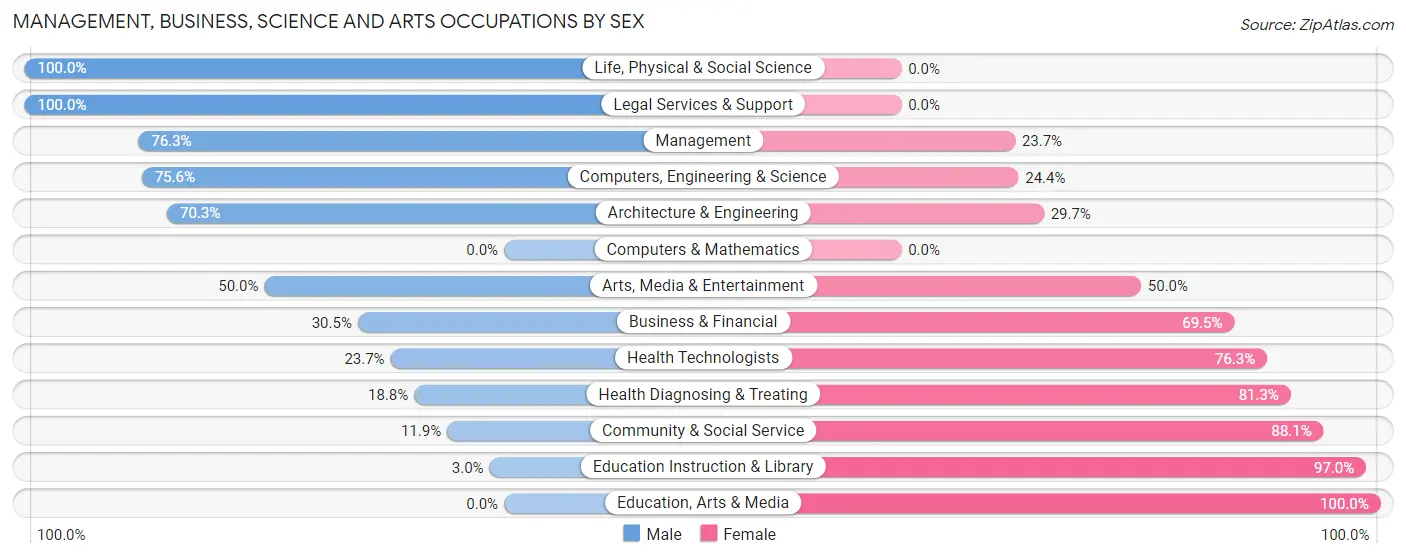
Management, Business, Science and Arts Occupations by Sex
Within the Management, Business, Science and Arts occupations in Kalida, the most male-oriented occupations are Life, Physical & Social Science (100.0%), Legal Services & Support (100.0%), and Management (76.3%), while the most female-oriented occupations are Education, Arts & Media (100.0%), Education Instruction & Library (97.0%), and Community & Social Service (88.1%).
| Occupation | Male | Female |
| Management | 90 (76.3%) | 28 (23.7%) |
| Business & Financial | 18 (30.5%) | 41 (69.5%) |
| Computers, Engineering & Science | 34 (75.6%) | 11 (24.4%) |
| Computers & Mathematics | 0 (0.0%) | 0 (0.0%) |
| Architecture & Engineering | 26 (70.3%) | 11 (29.7%) |
| Life, Physical & Social Science | 8 (100.0%) | 0 (0.0%) |
| Community & Social Service | 17 (11.9%) | 126 (88.1%) |
| Education, Arts & Media | 0 (0.0%) | 19 (100.0%) |
| Legal Services & Support | 3 (100.0%) | 0 (0.0%) |
| Education Instruction & Library | 3 (3.0%) | 96 (97.0%) |
| Arts, Media & Entertainment | 11 (50.0%) | 11 (50.0%) |
| Health Diagnosing & Treating | 9 (18.8%) | 39 (81.2%) |
| Health Technologists | 9 (23.7%) | 29 (76.3%) |
| Total (Category) | 168 (40.7%) | 245 (59.3%) |
| Total (Overall) | 525 (56.1%) | 411 (43.9%) |
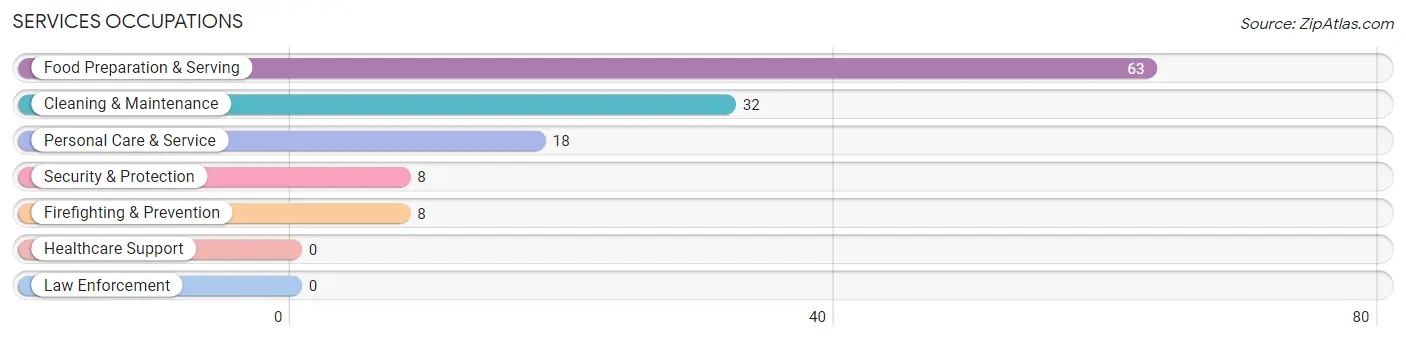
Services Occupations
The most common Services occupations in Kalida are Food Preparation & Serving (63 | 6.7%), Cleaning & Maintenance (32 | 3.4%), Personal Care & Service (18 | 1.9%), Security & Protection (8 | 0.9%), and Firefighting & Prevention (8 | 0.9%).
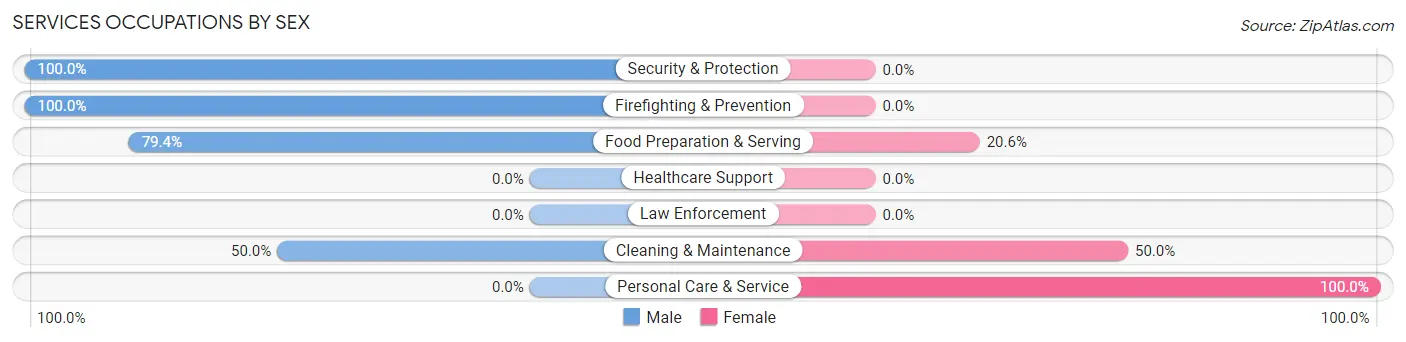
Services Occupations by Sex
Within the Services occupations in Kalida, the most male-oriented occupations are Security & Protection (100.0%), Firefighting & Prevention (100.0%), and Food Preparation & Serving (79.4%), while the most female-oriented occupations are Personal Care & Service (100.0%), Cleaning & Maintenance (50.0%), and Food Preparation & Serving (20.6%).
| Occupation | Male | Female |
| Healthcare Support | 0 (0.0%) | 0 (0.0%) |
| Security & Protection | 8 (100.0%) | 0 (0.0%) |
| Firefighting & Prevention | 8 (100.0%) | 0 (0.0%) |
| Law Enforcement | 0 (0.0%) | 0 (0.0%) |
| Food Preparation & Serving | 50 (79.4%) | 13 (20.6%) |
| Cleaning & Maintenance | 16 (50.0%) | 16 (50.0%) |
| Personal Care & Service | 0 (0.0%) | 18 (100.0%) |
| Total (Category) | 74 (61.2%) | 47 (38.8%) |
| Total (Overall) | 525 (56.1%) | 411 (43.9%) |
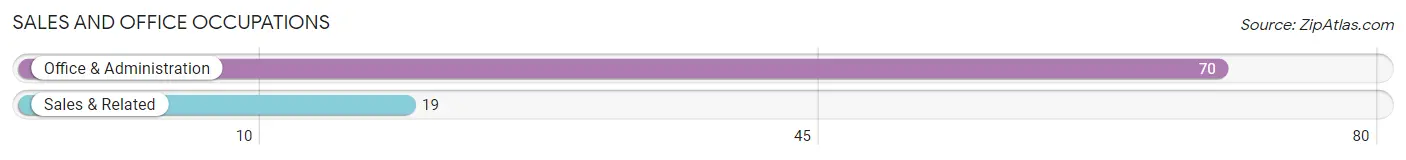
Sales and Office Occupations
The most common Sales and Office occupations in Kalida are Office & Administration (70 | 7.5%), and Sales & Related (19 | 2.0%).
Sales and Office Occupations by Sex
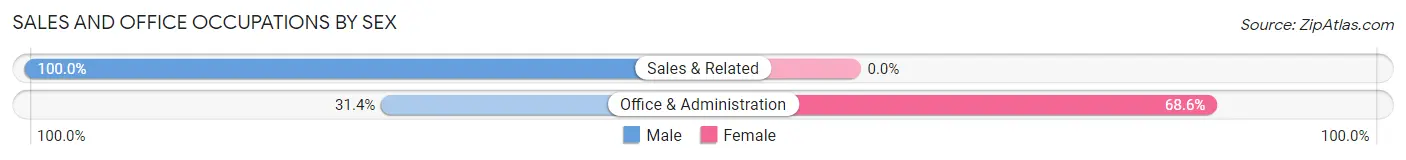
| Occupation | Male | Female |
| Sales & Related | 19 (100.0%) | 0 (0.0%) |
| Office & Administration | 22 (31.4%) | 48 (68.6%) |
| Total (Category) | 41 (46.1%) | 48 (53.9%) |
| Total (Overall) | 525 (56.1%) | 411 (43.9%) |
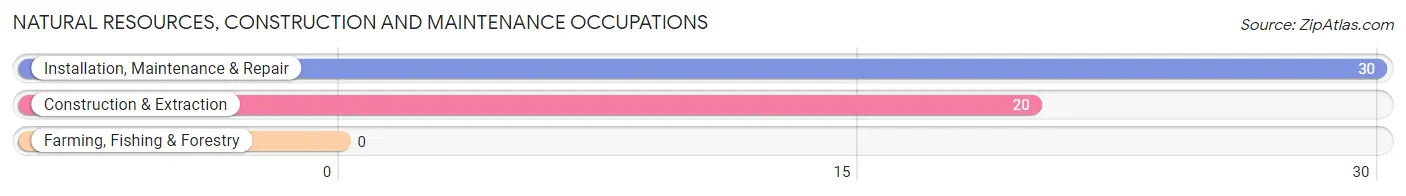
Natural Resources, Construction and Maintenance Occupations
The most common Natural Resources, Construction and Maintenance occupations in Kalida are Installation, Maintenance & Repair (30 | 3.2%), and Construction & Extraction (20 | 2.1%).
Natural Resources, Construction and Maintenance Occupations by Sex
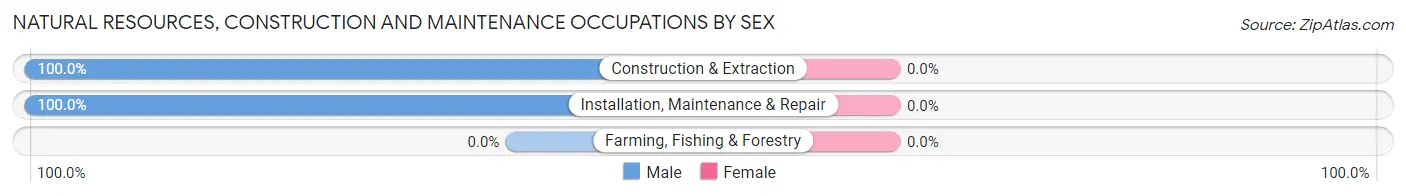
| Occupation | Male | Female |
| Farming, Fishing & Forestry | 0 (0.0%) | 0 (0.0%) |
| Construction & Extraction | 20 (100.0%) | 0 (0.0%) |
| Installation, Maintenance & Repair | 30 (100.0%) | 0 (0.0%) |
| Total (Category) | 50 (100.0%) | 0 (0.0%) |
| Total (Overall) | 525 (56.1%) | 411 (43.9%) |
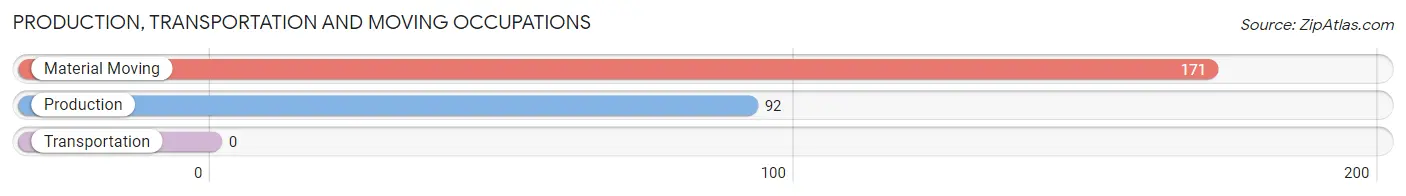
Production, Transportation and Moving Occupations
The most common Production, Transportation and Moving occupations in Kalida are Material Moving (171 | 18.3%), and Production (92 | 9.8%).
Production, Transportation and Moving Occupations by Sex
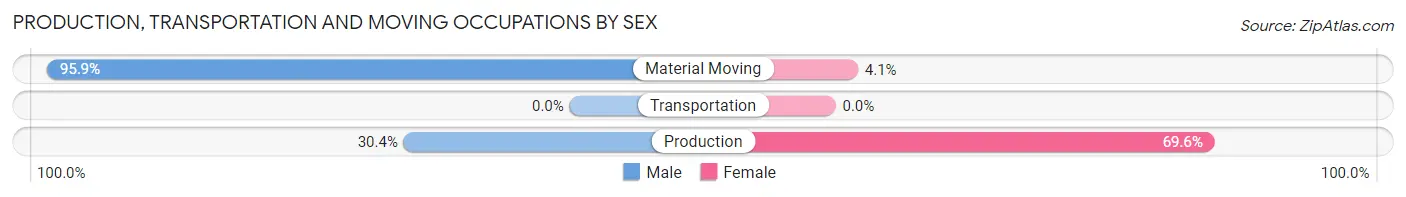
| Occupation | Male | Female |
| Production | 28 (30.4%) | 64 (69.6%) |
| Transportation | 0 (0.0%) | 0 (0.0%) |
| Material Moving | 164 (95.9%) | 7 (4.1%) |
| Total (Category) | 192 (73.0%) | 71 (27.0%) |
| Total (Overall) | 525 (56.1%) | 411 (43.9%) |
Employment Industries by Sex in Kalida
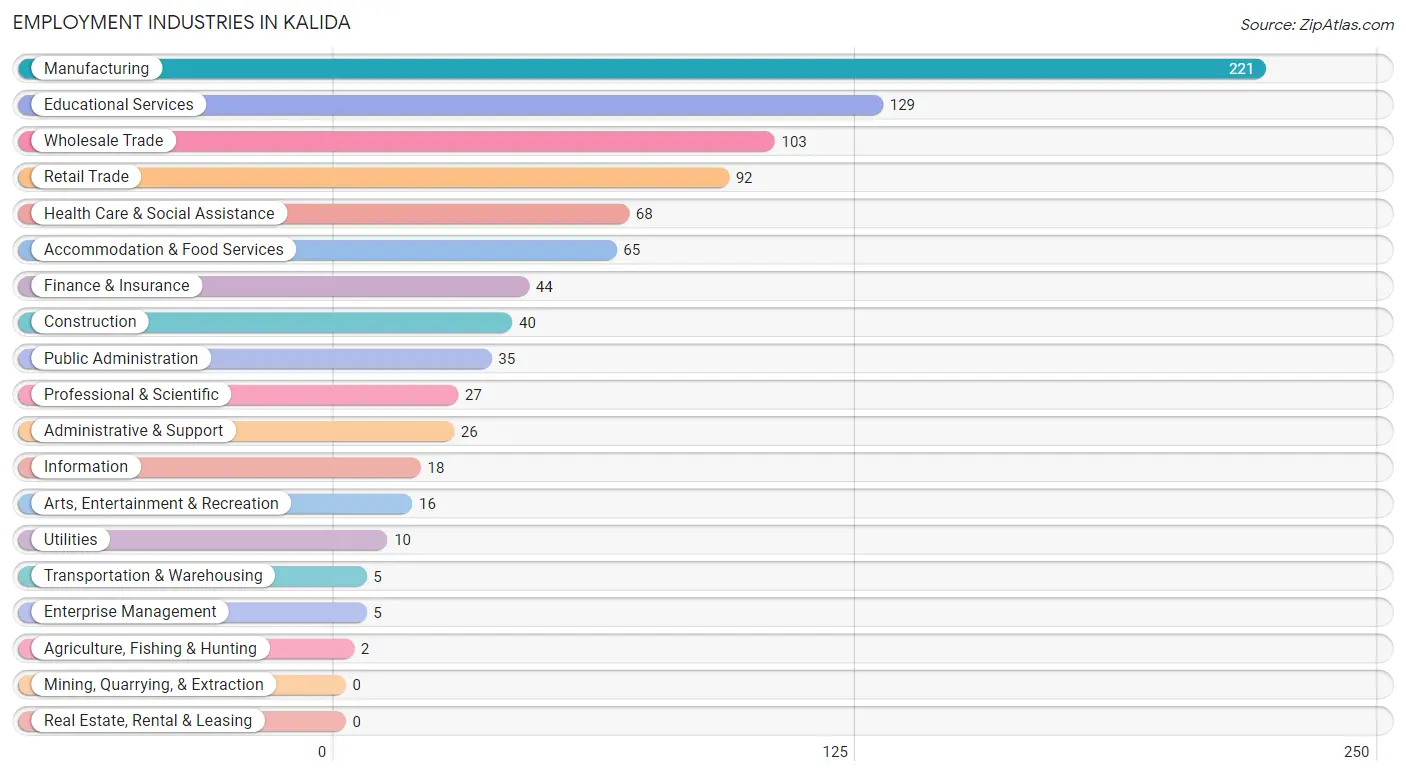
Employment Industries in Kalida
The major employment industries in Kalida include Manufacturing (221 | 23.6%), Educational Services (129 | 13.8%), Wholesale Trade (103 | 11.0%), Retail Trade (92 | 9.8%), and Health Care & Social Assistance (68 | 7.3%).
Employment Industries by Sex in Kalida
The Kalida industries that see more men than women are Agriculture, Fishing & Hunting (100.0%), Transportation & Warehousing (100.0%), and Utilities (100.0%), whereas the industries that tend to have a higher number of women are Arts, Entertainment & Recreation (100.0%), Educational Services (88.4%), and Finance & Insurance (81.8%).
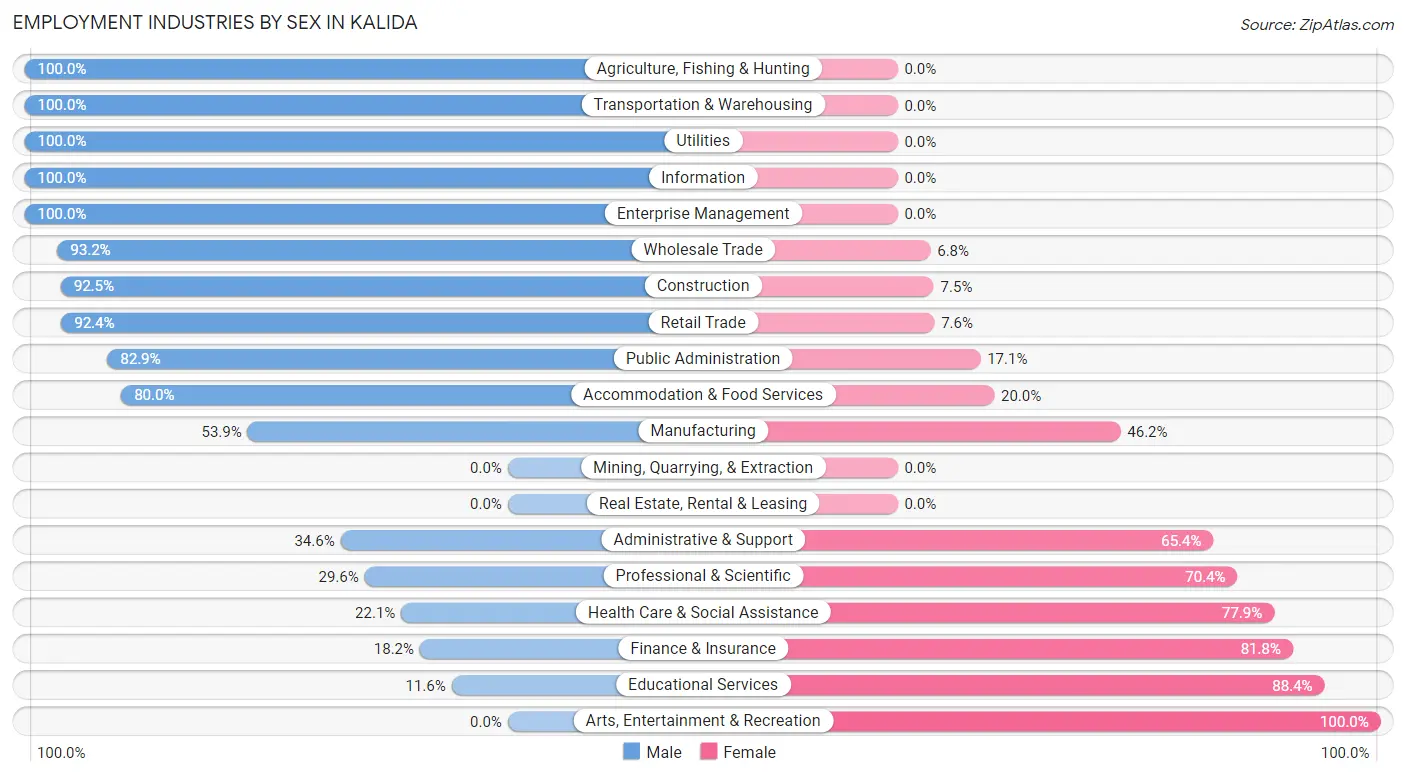
| Industry | Male | Female |
| Agriculture, Fishing & Hunting | 2 (100.0%) | 0 (0.0%) |
| Mining, Quarrying, & Extraction | 0 (0.0%) | 0 (0.0%) |
| Construction | 37 (92.5%) | 3 (7.5%) |
| Manufacturing | 119 (53.8%) | 102 (46.2%) |
| Wholesale Trade | 96 (93.2%) | 7 (6.8%) |
| Retail Trade | 85 (92.4%) | 7 (7.6%) |
| Transportation & Warehousing | 5 (100.0%) | 0 (0.0%) |
| Utilities | 10 (100.0%) | 0 (0.0%) |
| Information | 18 (100.0%) | 0 (0.0%) |
| Finance & Insurance | 8 (18.2%) | 36 (81.8%) |
| Real Estate, Rental & Leasing | 0 (0.0%) | 0 (0.0%) |
| Professional & Scientific | 8 (29.6%) | 19 (70.4%) |
| Enterprise Management | 5 (100.0%) | 0 (0.0%) |
| Administrative & Support | 9 (34.6%) | 17 (65.4%) |
| Educational Services | 15 (11.6%) | 114 (88.4%) |
| Health Care & Social Assistance | 15 (22.1%) | 53 (77.9%) |
| Arts, Entertainment & Recreation | 0 (0.0%) | 16 (100.0%) |
| Accommodation & Food Services | 52 (80.0%) | 13 (20.0%) |
| Public Administration | 29 (82.9%) | 6 (17.1%) |
| Total | 525 (56.1%) | 411 (43.9%) |
Education in Kalida
School Enrollment in Kalida
The most common levels of schooling among the 318 students in Kalida are college / undergraduate (101 | 31.8%), elementary school (76 | 23.9%), and middle school (60 | 18.9%).
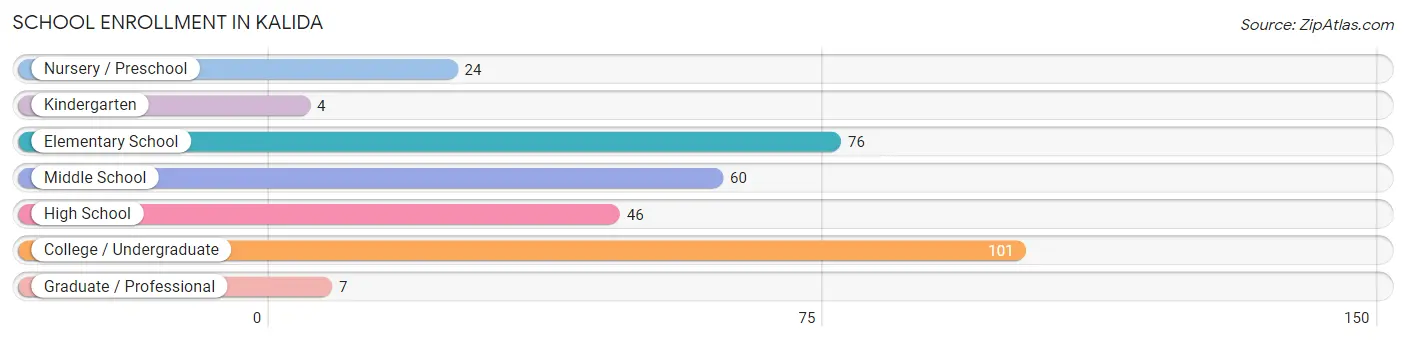
| School Level | # Students | % Students |
| Nursery / Preschool | 24 | 7.5% |
| Kindergarten | 4 | 1.3% |
| Elementary School | 76 | 23.9% |
| Middle School | 60 | 18.9% |
| High School | 46 | 14.5% |
| College / Undergraduate | 101 | 31.8% |
| Graduate / Professional | 7 | 2.2% |
| Total | 318 | 100.0% |
School Enrollment by Age by Funding Source in Kalida
Out of a total of 318 students who are enrolled in schools in Kalida, 19 (6.0%) attend a private institution, while the remaining 299 (94.0%) are enrolled in public schools. The age group of 35 years and over has the highest likelihood of being enrolled in private schools, with 3 (100.0% in the age bracket) enrolled. Conversely, the age group of 5 to 9 year old has the lowest likelihood of being enrolled in a private school, with 64 (100.0% in the age bracket) attending a public institution.
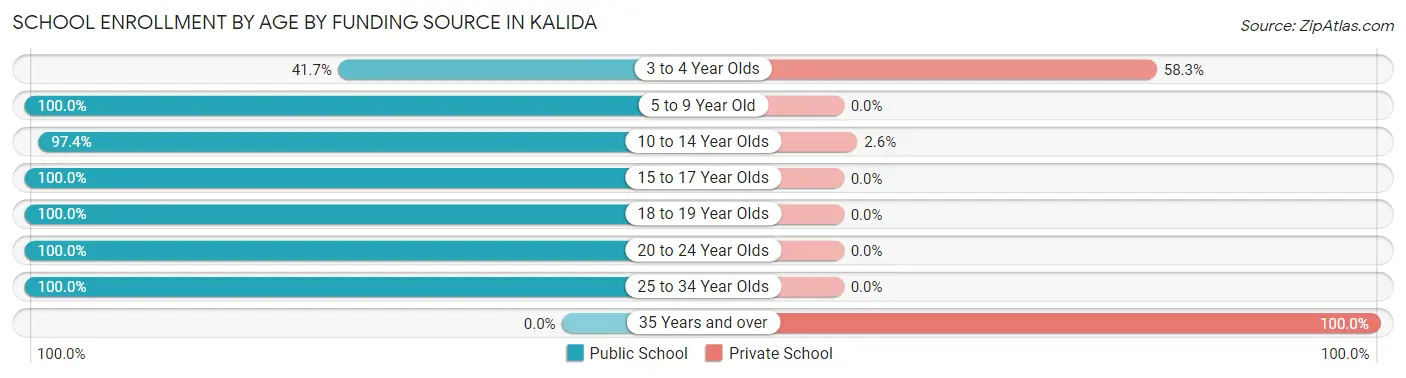
| Age Bracket | Public School | Private School |
| 3 to 4 Year Olds | 10 (41.7%) | 14 (58.3%) |
| 5 to 9 Year Old | 64 (100.0%) | 0 (0.0%) |
| 10 to 14 Year Olds | 76 (97.4%) | 2 (2.6%) |
| 15 to 17 Year Olds | 34 (100.0%) | 0 (0.0%) |
| 18 to 19 Year Olds | 30 (100.0%) | 0 (0.0%) |
| 20 to 24 Year Olds | 75 (100.0%) | 0 (0.0%) |
| 25 to 34 Year Olds | 10 (100.0%) | 0 (0.0%) |
| 35 Years and over | 0 (0.0%) | 3 (100.0%) |
| Total | 299 (94.0%) | 19 (6.0%) |
Educational Attainment by Field of Study in Kalida
Education (135 | 31.9%), business (80 | 18.9%), science & technology (55 | 13.0%), bio, nature & agricultural (53 | 12.5%), and engineering (39 | 9.2%) are the most common fields of study among 423 individuals in Kalida who have obtained a bachelor's degree or higher.
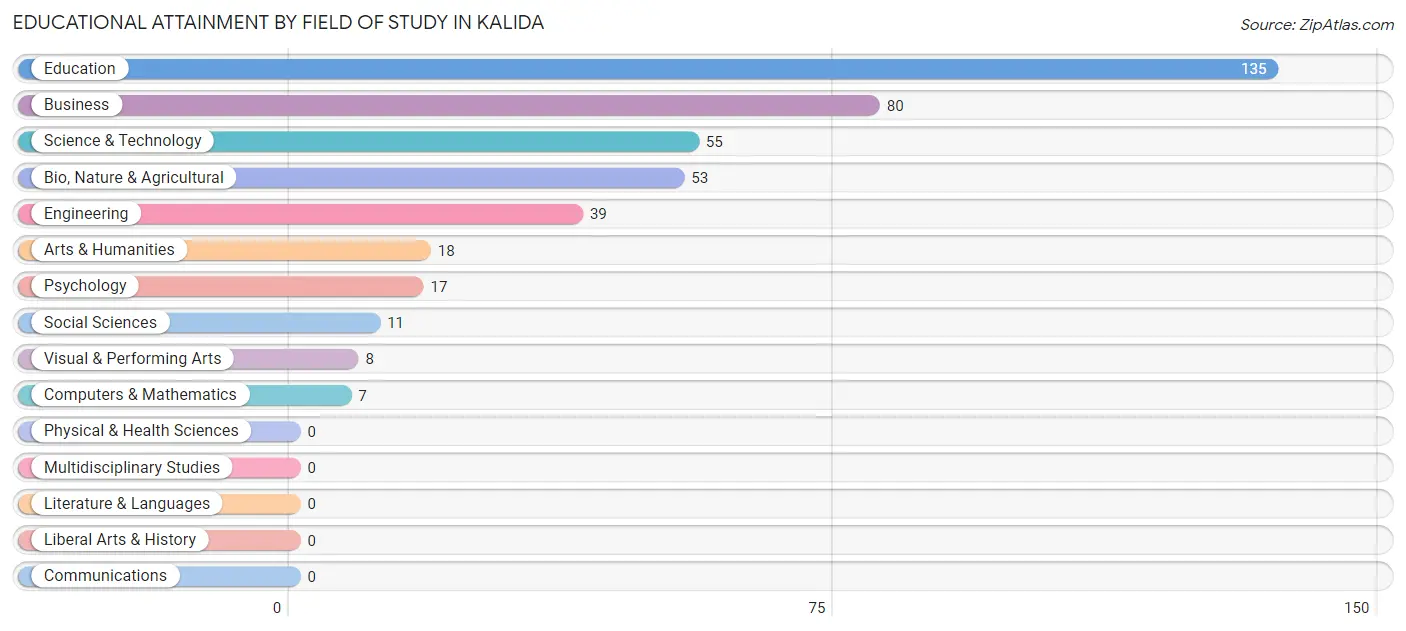
| Field of Study | # Graduates | % Graduates |
| Computers & Mathematics | 7 | 1.7% |
| Bio, Nature & Agricultural | 53 | 12.5% |
| Physical & Health Sciences | 0 | 0.0% |
| Psychology | 17 | 4.0% |
| Social Sciences | 11 | 2.6% |
| Engineering | 39 | 9.2% |
| Multidisciplinary Studies | 0 | 0.0% |
| Science & Technology | 55 | 13.0% |
| Business | 80 | 18.9% |
| Education | 135 | 31.9% |
| Literature & Languages | 0 | 0.0% |
| Liberal Arts & History | 0 | 0.0% |
| Visual & Performing Arts | 8 | 1.9% |
| Communications | 0 | 0.0% |
| Arts & Humanities | 18 | 4.3% |
| Total | 423 | 100.0% |
Transportation & Commute in Kalida
Vehicle Availability by Sex in Kalida
The most prevalent vehicle ownership categories in Kalida are males with 2 vehicles (268, accounting for 53.1%) and females with 2 vehicles (182, making up 65.2%).
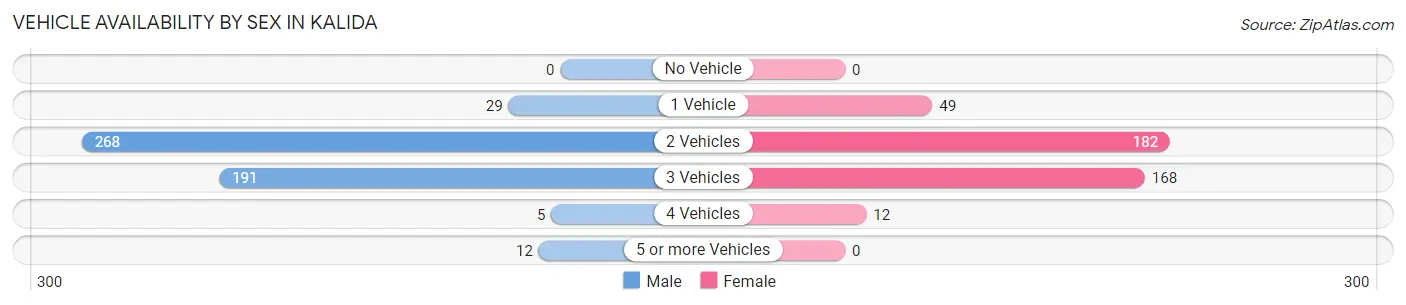
| Vehicles Available | Male | Female |
| No Vehicle | 0 (0.0%) | 0 (0.0%) |
| 1 Vehicle | 29 (5.7%) | 49 (11.9%) |
| 2 Vehicles | 268 (53.1%) | 182 (44.3%) |
| 3 Vehicles | 191 (37.8%) | 168 (40.9%) |
| 4 Vehicles | 5 (1.0%) | 12 (2.9%) |
| 5 or more Vehicles | 12 (2.4%) | 0 (0.0%) |
| Total | 505 (100.0%) | 411 (100.0%) |
Commute Time in Kalida
The most frequently occuring commute durations in Kalida are 30 to 34 minutes (164 commuters, 18.7%), less than 5 minutes (162 commuters, 18.4%), and 15 to 19 minutes (151 commuters, 17.2%).
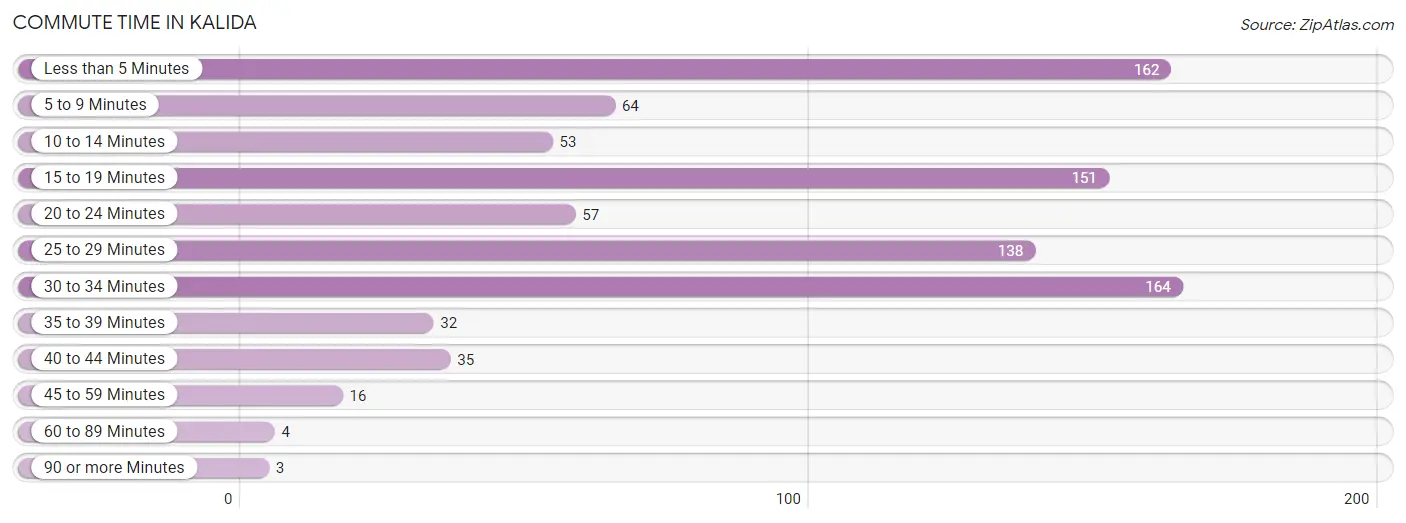
| Commute Time | # Commuters | % Commuters |
| Less than 5 Minutes | 162 | 18.4% |
| 5 to 9 Minutes | 64 | 7.3% |
| 10 to 14 Minutes | 53 | 6.0% |
| 15 to 19 Minutes | 151 | 17.2% |
| 20 to 24 Minutes | 57 | 6.5% |
| 25 to 29 Minutes | 138 | 15.7% |
| 30 to 34 Minutes | 164 | 18.7% |
| 35 to 39 Minutes | 32 | 3.6% |
| 40 to 44 Minutes | 35 | 4.0% |
| 45 to 59 Minutes | 16 | 1.8% |
| 60 to 89 Minutes | 4 | 0.5% |
| 90 or more Minutes | 3 | 0.3% |
Commute Time by Sex in Kalida
The most common commute times in Kalida are 25 to 29 minutes (107 commuters, 22.1%) for males and less than 5 minutes (108 commuters, 27.3%) for females.
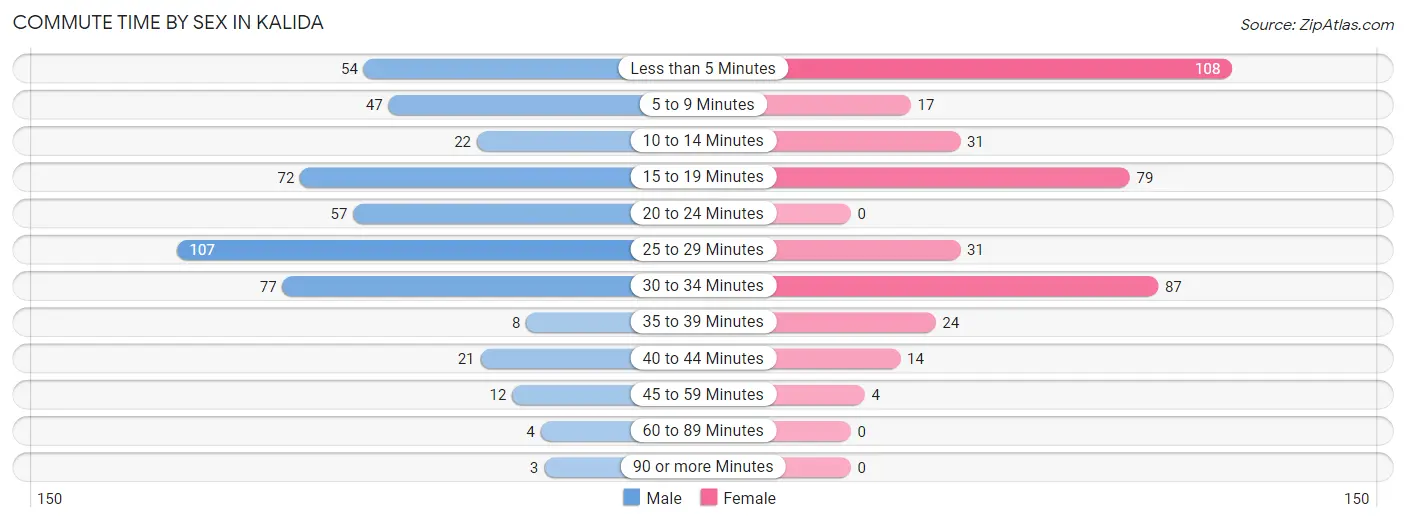
| Commute Time | Male | Female |
| Less than 5 Minutes | 54 (11.2%) | 108 (27.3%) |
| 5 to 9 Minutes | 47 (9.7%) | 17 (4.3%) |
| 10 to 14 Minutes | 22 (4.5%) | 31 (7.9%) |
| 15 to 19 Minutes | 72 (14.9%) | 79 (20.0%) |
| 20 to 24 Minutes | 57 (11.8%) | 0 (0.0%) |
| 25 to 29 Minutes | 107 (22.1%) | 31 (7.9%) |
| 30 to 34 Minutes | 77 (15.9%) | 87 (22.0%) |
| 35 to 39 Minutes | 8 (1.7%) | 24 (6.1%) |
| 40 to 44 Minutes | 21 (4.3%) | 14 (3.5%) |
| 45 to 59 Minutes | 12 (2.5%) | 4 (1.0%) |
| 60 to 89 Minutes | 4 (0.8%) | 0 (0.0%) |
| 90 or more Minutes | 3 (0.6%) | 0 (0.0%) |
Time of Departure to Work by Sex in Kalida
The most frequent times of departure to work in Kalida are 7:30 AM to 7:59 AM (125, 25.8%) for males and 7:00 AM to 7:29 AM (82, 20.8%) for females.
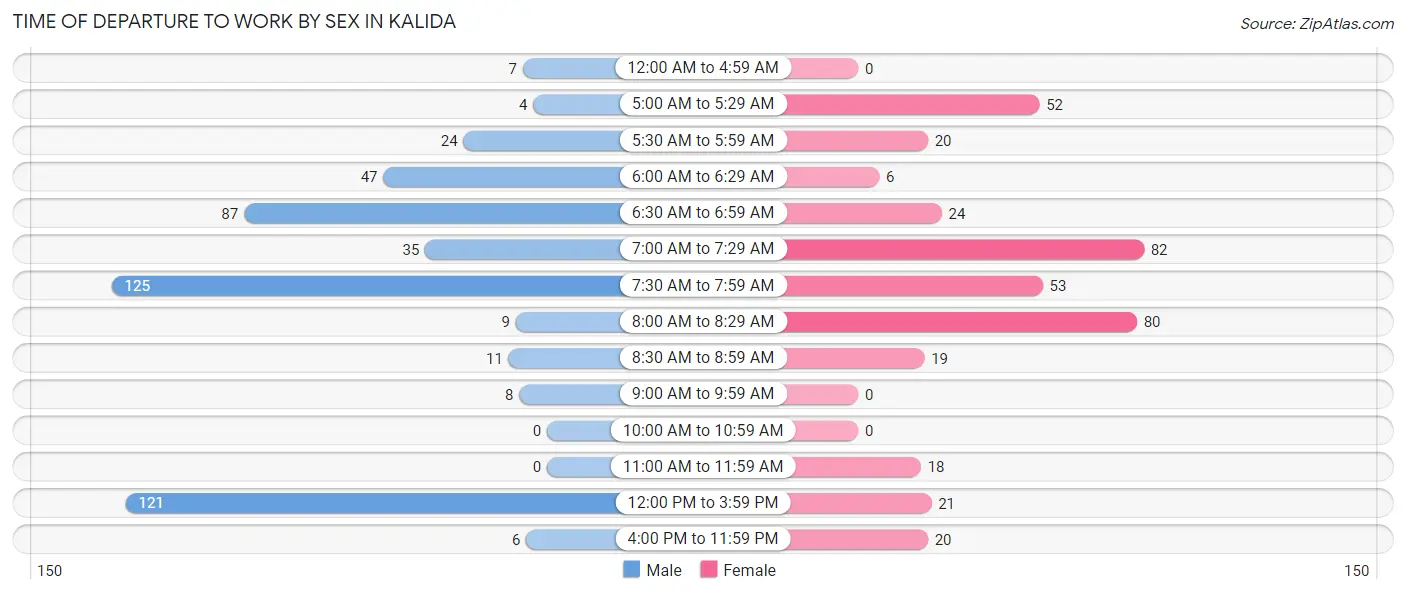
| Time of Departure | Male | Female |
| 12:00 AM to 4:59 AM | 7 (1.5%) | 0 (0.0%) |
| 5:00 AM to 5:29 AM | 4 (0.8%) | 52 (13.2%) |
| 5:30 AM to 5:59 AM | 24 (5.0%) | 20 (5.1%) |
| 6:00 AM to 6:29 AM | 47 (9.7%) | 6 (1.5%) |
| 6:30 AM to 6:59 AM | 87 (18.0%) | 24 (6.1%) |
| 7:00 AM to 7:29 AM | 35 (7.2%) | 82 (20.8%) |
| 7:30 AM to 7:59 AM | 125 (25.8%) | 53 (13.4%) |
| 8:00 AM to 8:29 AM | 9 (1.9%) | 80 (20.3%) |
| 8:30 AM to 8:59 AM | 11 (2.3%) | 19 (4.8%) |
| 9:00 AM to 9:59 AM | 8 (1.7%) | 0 (0.0%) |
| 10:00 AM to 10:59 AM | 0 (0.0%) | 0 (0.0%) |
| 11:00 AM to 11:59 AM | 0 (0.0%) | 18 (4.6%) |
| 12:00 PM to 3:59 PM | 121 (25.0%) | 21 (5.3%) |
| 4:00 PM to 11:59 PM | 6 (1.2%) | 20 (5.1%) |
| Total | 484 (100.0%) | 395 (100.0%) |
Housing Occupancy in Kalida
Occupancy by Ownership in Kalida
Of the total 615 dwellings in Kalida, owner-occupied units account for 483 (78.5%), while renter-occupied units make up 132 (21.5%).
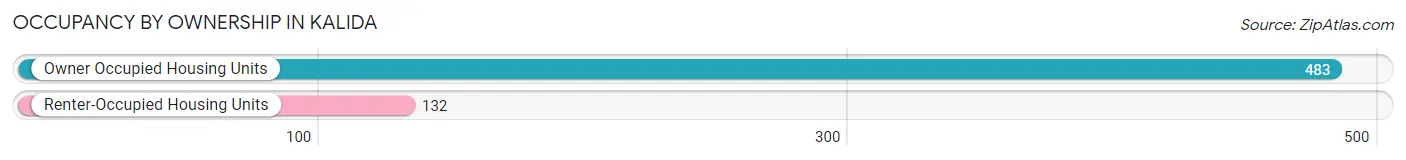
| Occupancy | # Housing Units | % Housing Units |
| Owner Occupied Housing Units | 483 | 78.5% |
| Renter-Occupied Housing Units | 132 | 21.5% |
| Total Occupied Housing Units | 615 | 100.0% |
Occupancy by Household Size in Kalida
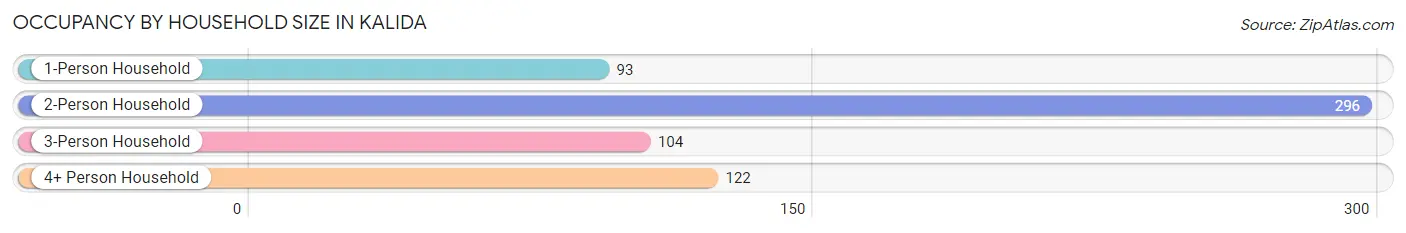
| Household Size | # Housing Units | % Housing Units |
| 1-Person Household | 93 | 15.1% |
| 2-Person Household | 296 | 48.1% |
| 3-Person Household | 104 | 16.9% |
| 4+ Person Household | 122 | 19.8% |
| Total Housing Units | 615 | 100.0% |
Occupancy by Ownership by Household Size in Kalida
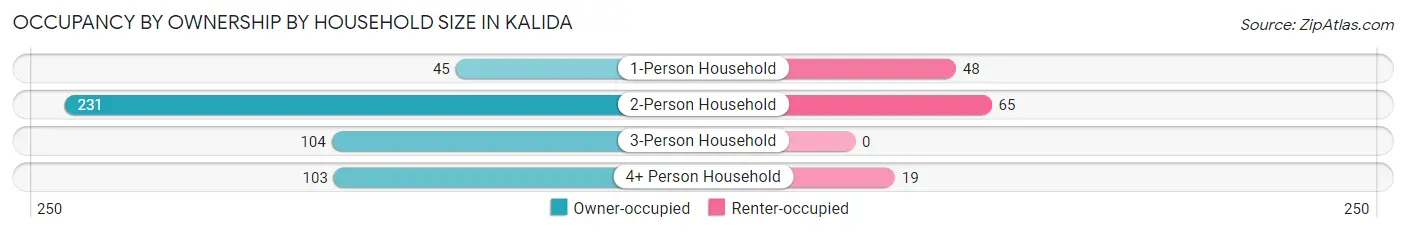
| Household Size | Owner-occupied | Renter-occupied |
| 1-Person Household | 45 (48.4%) | 48 (51.6%) |
| 2-Person Household | 231 (78.0%) | 65 (22.0%) |
| 3-Person Household | 104 (100.0%) | 0 (0.0%) |
| 4+ Person Household | 103 (84.4%) | 19 (15.6%) |
| Total Housing Units | 483 (78.5%) | 132 (21.5%) |
Occupancy by Educational Attainment in Kalida
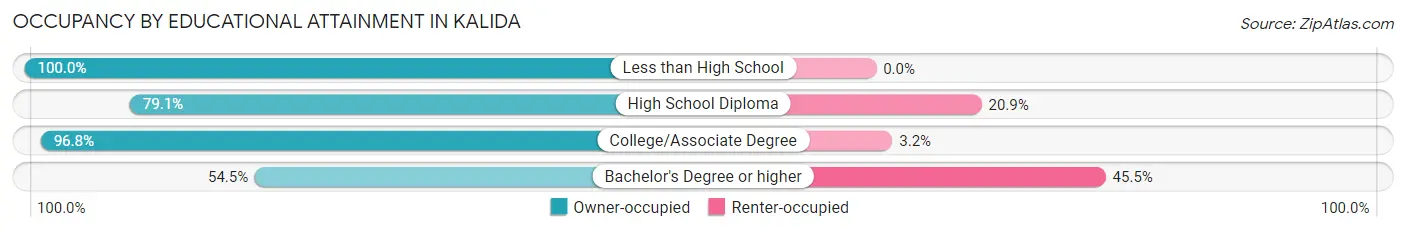
| Household Size | Owner-occupied | Renter-occupied |
| Less than High School | 8 (100.0%) | 0 (0.0%) |
| High School Diploma | 125 (79.1%) | 33 (20.9%) |
| College/Associate Degree | 241 (96.8%) | 8 (3.2%) |
| Bachelor's Degree or higher | 109 (54.5%) | 91 (45.5%) |
Occupancy by Age of Householder in Kalida
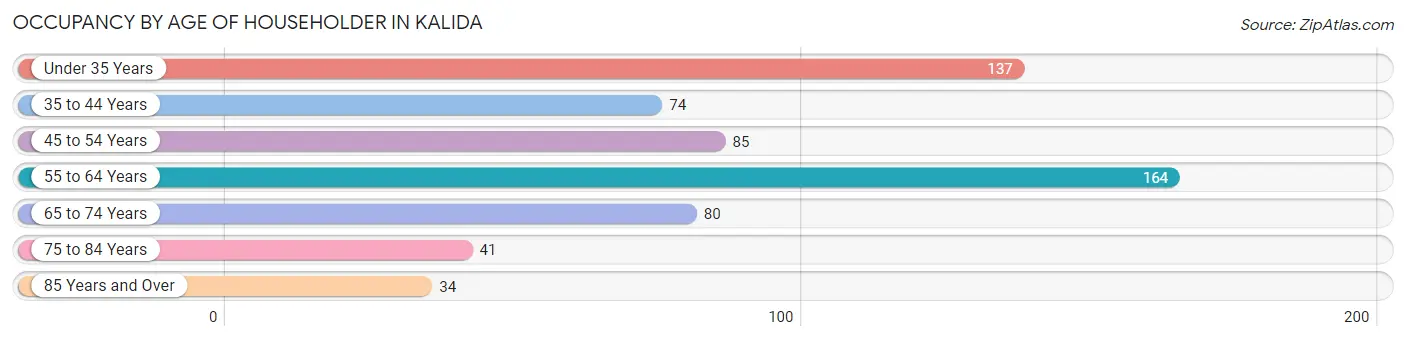
| Age Bracket | # Households | % Households |
| Under 35 Years | 137 | 22.3% |
| 35 to 44 Years | 74 | 12.0% |
| 45 to 54 Years | 85 | 13.8% |
| 55 to 64 Years | 164 | 26.7% |
| 65 to 74 Years | 80 | 13.0% |
| 75 to 84 Years | 41 | 6.7% |
| 85 Years and Over | 34 | 5.5% |
| Total | 615 | 100.0% |
Housing Finances in Kalida
Median Income by Occupancy in Kalida
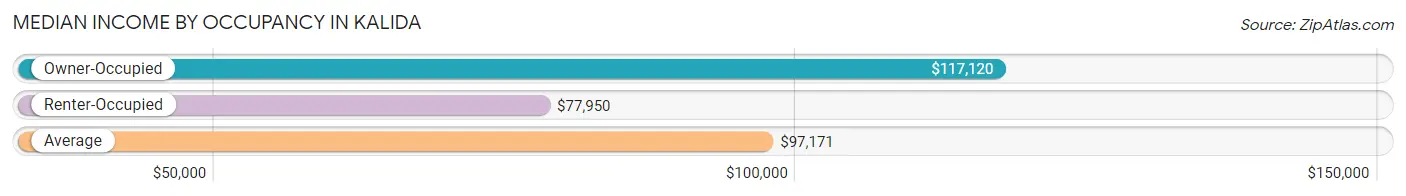
| Occupancy Type | # Households | Median Income |
| Owner-Occupied | 483 (78.5%) | $117,120 |
| Renter-Occupied | 132 (21.5%) | $77,950 |
| Average | 615 (100.0%) | $97,171 |
Occupancy by Householder Income Bracket in Kalida
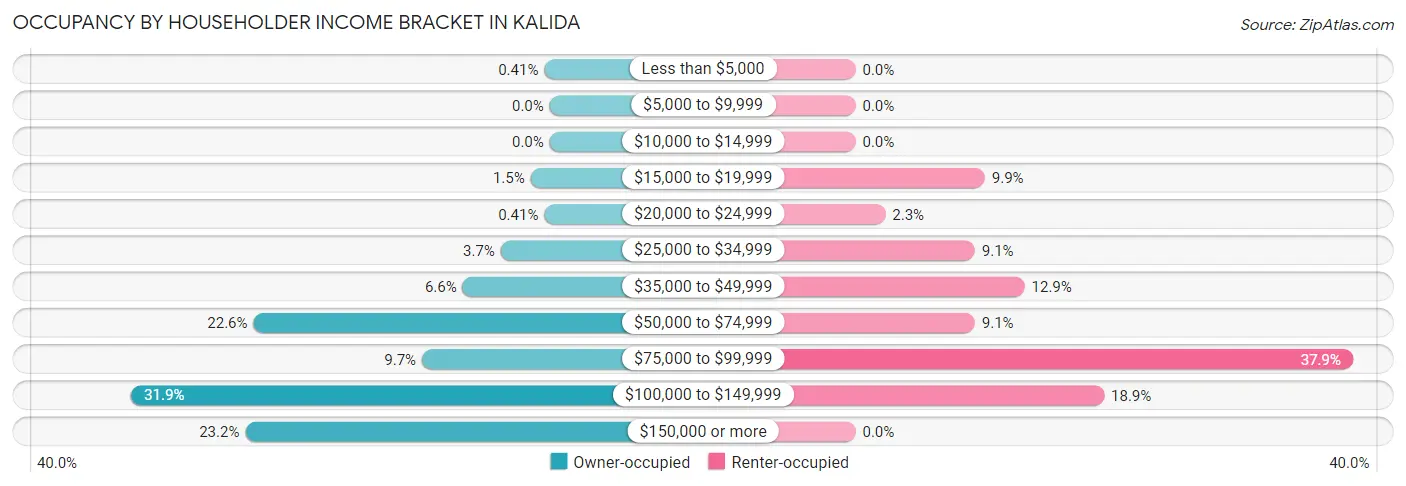
| Income Bracket | Owner-occupied | Renter-occupied |
| Less than $5,000 | 2 (0.4%) | 0 (0.0%) |
| $5,000 to $9,999 | 0 (0.0%) | 0 (0.0%) |
| $10,000 to $14,999 | 0 (0.0%) | 0 (0.0%) |
| $15,000 to $19,999 | 7 (1.5%) | 13 (9.9%) |
| $20,000 to $24,999 | 2 (0.4%) | 3 (2.3%) |
| $25,000 to $34,999 | 18 (3.7%) | 12 (9.1%) |
| $35,000 to $49,999 | 32 (6.6%) | 17 (12.9%) |
| $50,000 to $74,999 | 109 (22.6%) | 12 (9.1%) |
| $75,000 to $99,999 | 47 (9.7%) | 50 (37.9%) |
| $100,000 to $149,999 | 154 (31.9%) | 25 (18.9%) |
| $150,000 or more | 112 (23.2%) | 0 (0.0%) |
| Total | 483 (100.0%) | 132 (100.0%) |
Monthly Housing Cost Tiers in Kalida
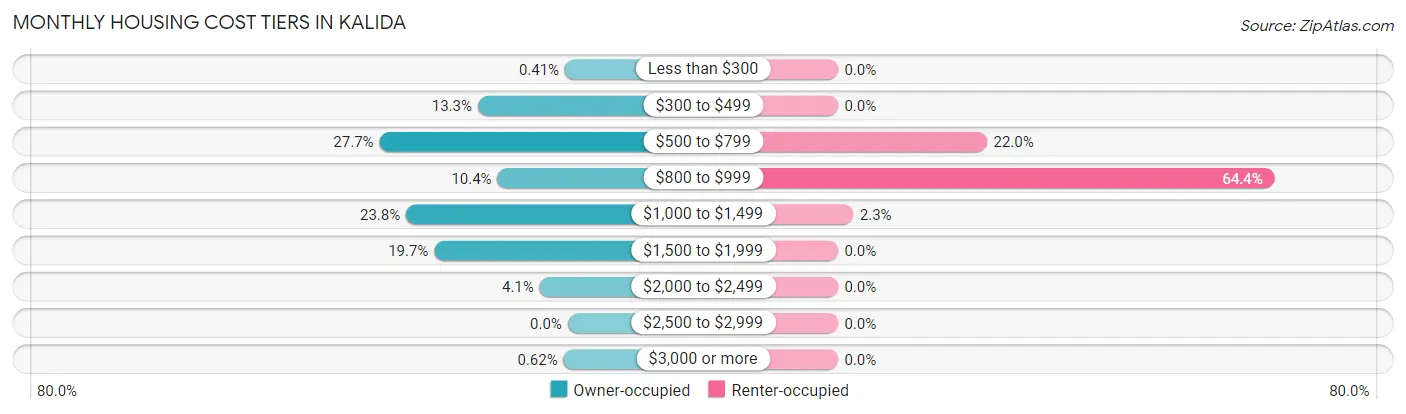
| Monthly Cost | Owner-occupied | Renter-occupied |
| Less than $300 | 2 (0.4%) | 0 (0.0%) |
| $300 to $499 | 64 (13.3%) | 0 (0.0%) |
| $500 to $799 | 134 (27.7%) | 29 (22.0%) |
| $800 to $999 | 50 (10.3%) | 85 (64.4%) |
| $1,000 to $1,499 | 115 (23.8%) | 3 (2.3%) |
| $1,500 to $1,999 | 95 (19.7%) | 0 (0.0%) |
| $2,000 to $2,499 | 20 (4.1%) | 0 (0.0%) |
| $2,500 to $2,999 | 0 (0.0%) | 0 (0.0%) |
| $3,000 or more | 3 (0.6%) | 0 (0.0%) |
| Total | 483 (100.0%) | 132 (100.0%) |
Physical Housing Characteristics in Kalida
Housing Structures in Kalida
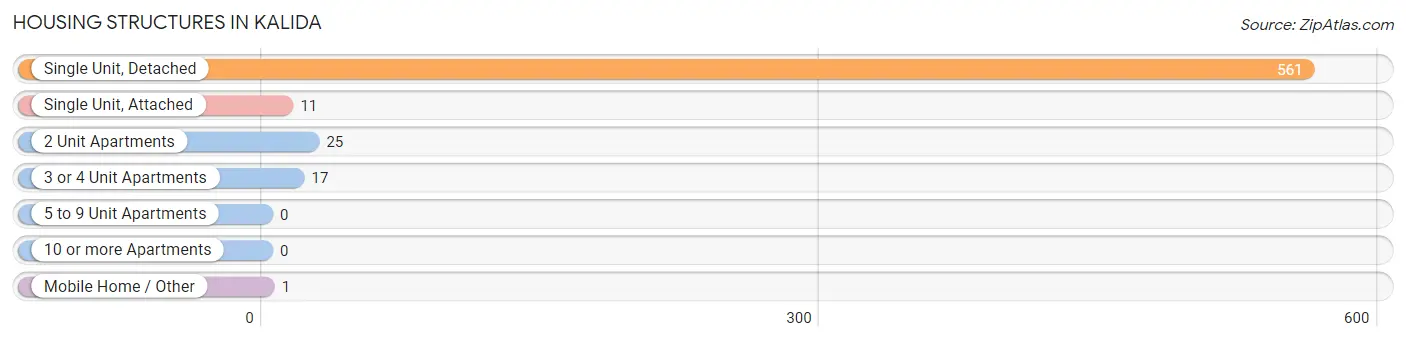
| Structure Type | # Housing Units | % Housing Units |
| Single Unit, Detached | 561 | 91.2% |
| Single Unit, Attached | 11 | 1.8% |
| 2 Unit Apartments | 25 | 4.1% |
| 3 or 4 Unit Apartments | 17 | 2.8% |
| 5 to 9 Unit Apartments | 0 | 0.0% |
| 10 or more Apartments | 0 | 0.0% |
| Mobile Home / Other | 1 | 0.2% |
| Total | 615 | 100.0% |
Housing Structures by Occupancy in Kalida
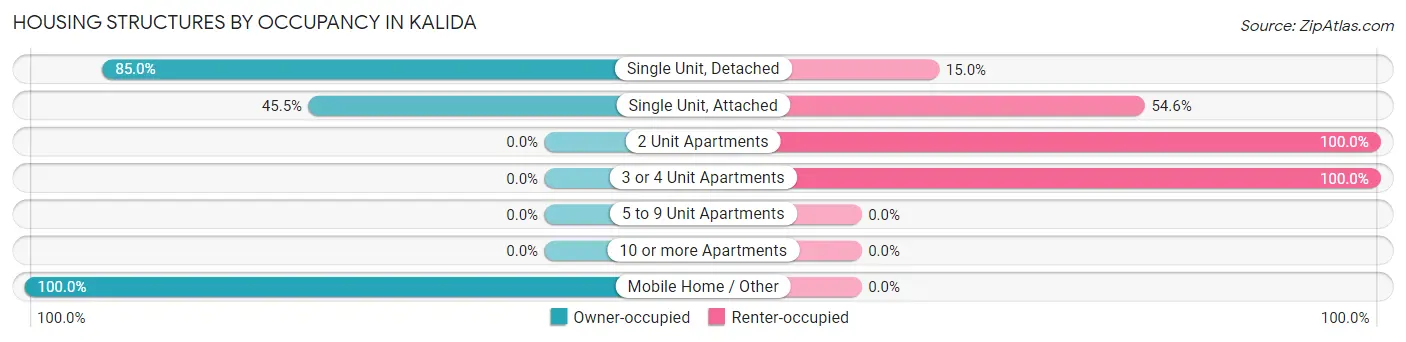
| Structure Type | Owner-occupied | Renter-occupied |
| Single Unit, Detached | 477 (85.0%) | 84 (15.0%) |
| Single Unit, Attached | 5 (45.5%) | 6 (54.5%) |
| 2 Unit Apartments | 0 (0.0%) | 25 (100.0%) |
| 3 or 4 Unit Apartments | 0 (0.0%) | 17 (100.0%) |
| 5 to 9 Unit Apartments | 0 (0.0%) | 0 (0.0%) |
| 10 or more Apartments | 0 (0.0%) | 0 (0.0%) |
| Mobile Home / Other | 1 (100.0%) | 0 (0.0%) |
| Total | 483 (78.5%) | 132 (21.5%) |
Housing Structures by Number of Rooms in Kalida
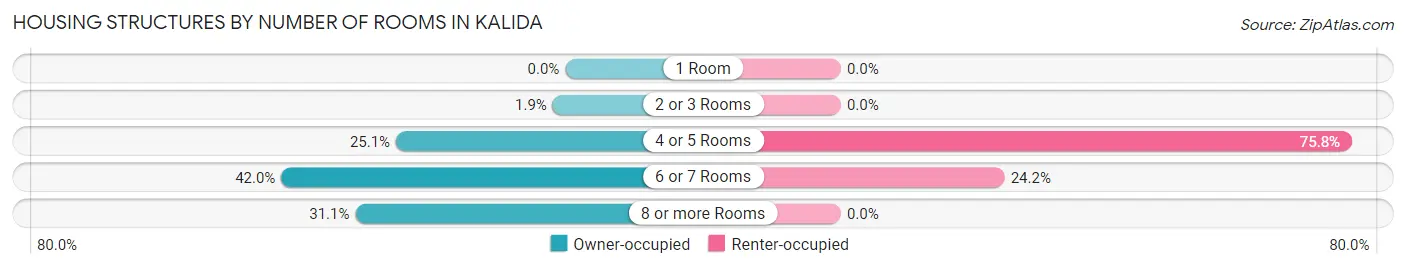
| Number of Rooms | Owner-occupied | Renter-occupied |
| 1 Room | 0 (0.0%) | 0 (0.0%) |
| 2 or 3 Rooms | 9 (1.9%) | 0 (0.0%) |
| 4 or 5 Rooms | 121 (25.1%) | 100 (75.8%) |
| 6 or 7 Rooms | 203 (42.0%) | 32 (24.2%) |
| 8 or more Rooms | 150 (31.1%) | 0 (0.0%) |
| Total | 483 (100.0%) | 132 (100.0%) |
Housing Structure by Heating Type in Kalida
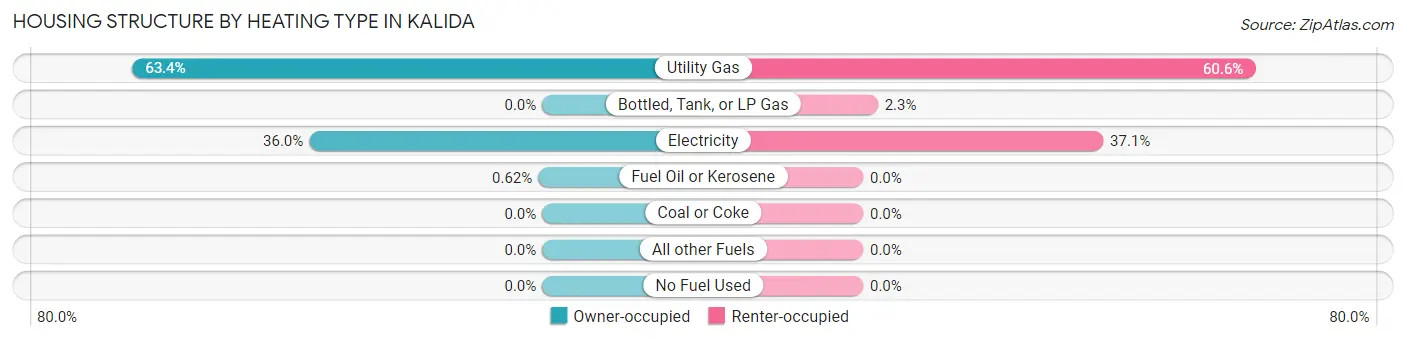
| Heating Type | Owner-occupied | Renter-occupied |
| Utility Gas | 306 (63.3%) | 80 (60.6%) |
| Bottled, Tank, or LP Gas | 0 (0.0%) | 3 (2.3%) |
| Electricity | 174 (36.0%) | 49 (37.1%) |
| Fuel Oil or Kerosene | 3 (0.6%) | 0 (0.0%) |
| Coal or Coke | 0 (0.0%) | 0 (0.0%) |
| All other Fuels | 0 (0.0%) | 0 (0.0%) |
| No Fuel Used | 0 (0.0%) | 0 (0.0%) |
| Total | 483 (100.0%) | 132 (100.0%) |
Household Vehicle Usage in Kalida
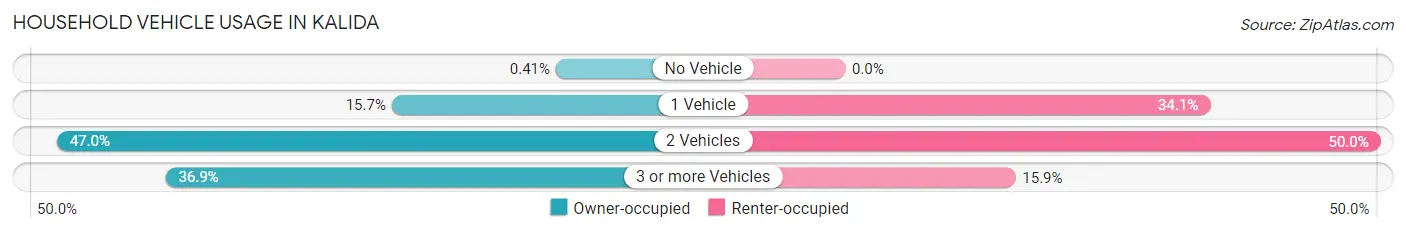
| Vehicles per Household | Owner-occupied | Renter-occupied |
| No Vehicle | 2 (0.4%) | 0 (0.0%) |
| 1 Vehicle | 76 (15.7%) | 45 (34.1%) |
| 2 Vehicles | 227 (47.0%) | 66 (50.0%) |
| 3 or more Vehicles | 178 (36.8%) | 21 (15.9%) |
| Total | 483 (100.0%) | 132 (100.0%) |
Real Estate & Mortgages in Kalida
Real Estate and Mortgage Overview in Kalida
| Characteristic | Without Mortgage | With Mortgage |
| Housing Units | 144 | 339 |
| Median Property Value | $273,700 | $174,600 |
| Median Household Income | $76,250 | $78 |
| Monthly Housing Costs | $525 | $3 |
| Real Estate Taxes | $1,730 | $0 |
Property Value by Mortgage Status in Kalida
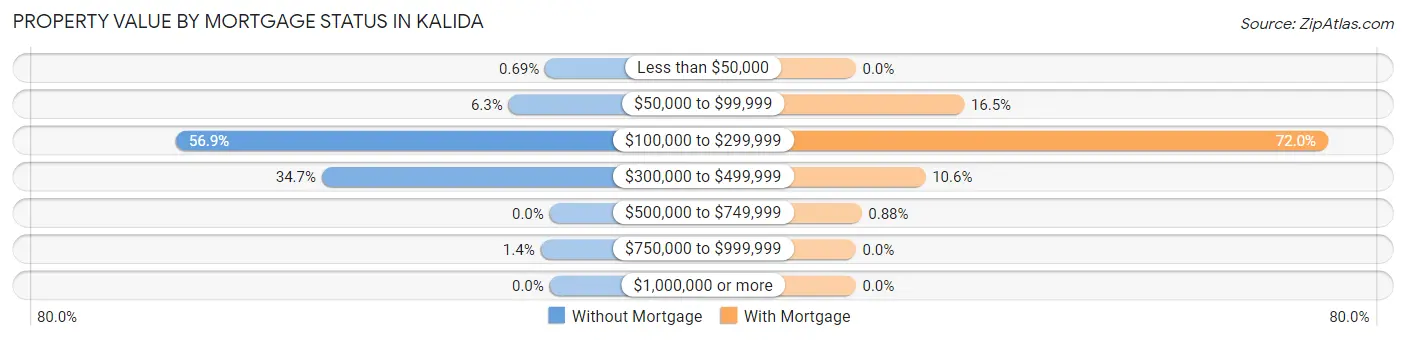
| Property Value | Without Mortgage | With Mortgage |
| Less than $50,000 | 1 (0.7%) | 0 (0.0%) |
| $50,000 to $99,999 | 9 (6.2%) | 56 (16.5%) |
| $100,000 to $299,999 | 82 (56.9%) | 244 (72.0%) |
| $300,000 to $499,999 | 50 (34.7%) | 36 (10.6%) |
| $500,000 to $749,999 | 0 (0.0%) | 3 (0.9%) |
| $750,000 to $999,999 | 2 (1.4%) | 0 (0.0%) |
| $1,000,000 or more | 0 (0.0%) | 0 (0.0%) |
| Total | 144 (100.0%) | 339 (100.0%) |
Household Income by Mortgage Status in Kalida
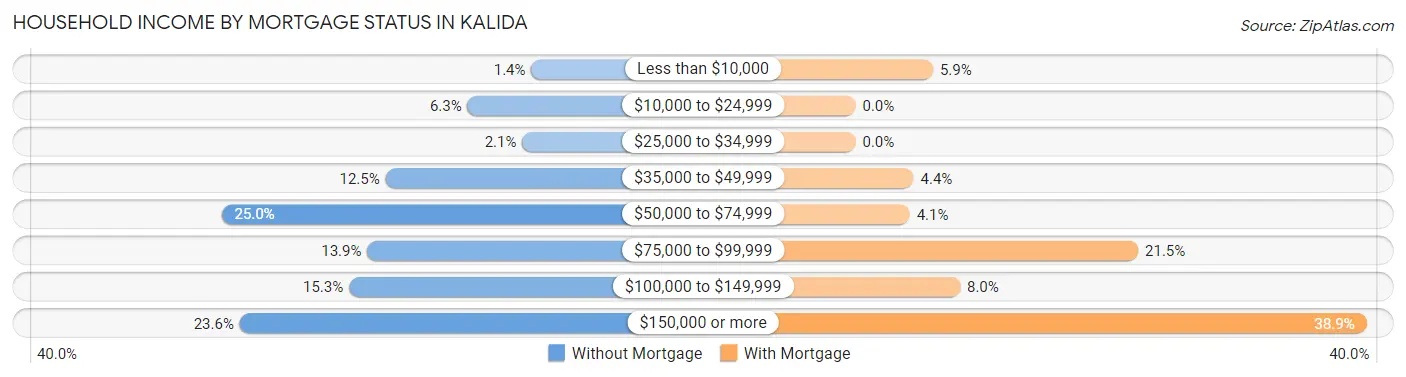
| Household Income | Without Mortgage | With Mortgage |
| Less than $10,000 | 2 (1.4%) | 20 (5.9%) |
| $10,000 to $24,999 | 9 (6.2%) | 0 (0.0%) |
| $25,000 to $34,999 | 3 (2.1%) | 0 (0.0%) |
| $35,000 to $49,999 | 18 (12.5%) | 15 (4.4%) |
| $50,000 to $74,999 | 36 (25.0%) | 14 (4.1%) |
| $75,000 to $99,999 | 20 (13.9%) | 73 (21.5%) |
| $100,000 to $149,999 | 22 (15.3%) | 27 (8.0%) |
| $150,000 or more | 34 (23.6%) | 132 (38.9%) |
| Total | 144 (100.0%) | 339 (100.0%) |
Property Value to Household Income Ratio in Kalida
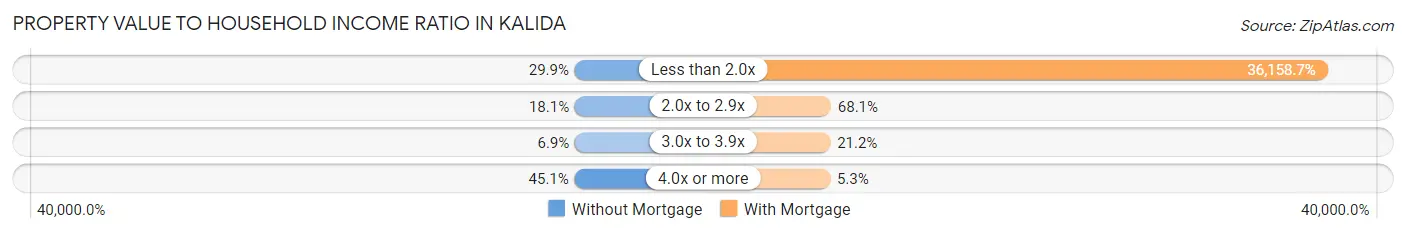
| Value-to-Income Ratio | Without Mortgage | With Mortgage |
| Less than 2.0x | 43 (29.9%) | 122,578 (36,158.7%) |
| 2.0x to 2.9x | 26 (18.1%) | 231 (68.1%) |
| 3.0x to 3.9x | 10 (6.9%) | 72 (21.2%) |
| 4.0x or more | 65 (45.1%) | 18 (5.3%) |
| Total | 144 (100.0%) | 339 (100.0%) |
Real Estate Taxes by Mortgage Status in Kalida
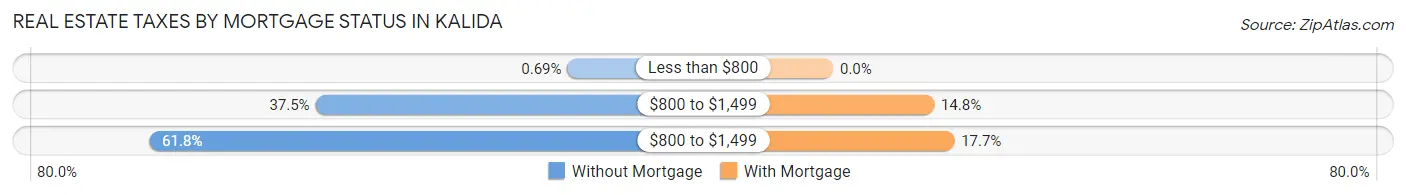
| Property Taxes | Without Mortgage | With Mortgage |
| Less than $800 | 1 (0.7%) | 0 (0.0%) |
| $800 to $1,499 | 54 (37.5%) | 50 (14.7%) |
| $800 to $1,499 | 89 (61.8%) | 60 (17.7%) |
| Total | 144 (100.0%) | 339 (100.0%) |
Health & Disability in Kalida
Health Insurance Coverage by Age in Kalida
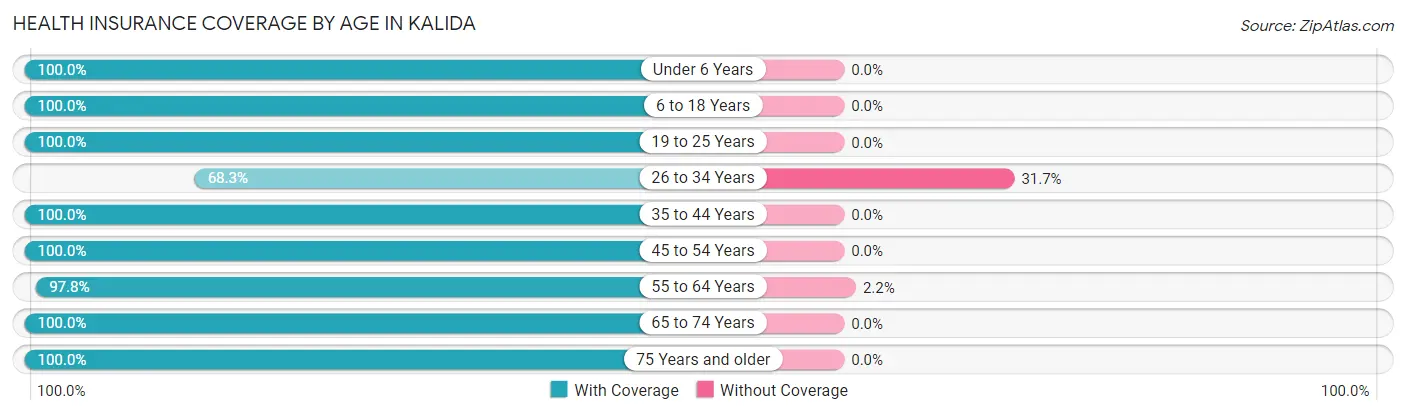
| Age Bracket | With Coverage | Without Coverage |
| Under 6 Years | 117 (100.0%) | 0 (0.0%) |
| 6 to 18 Years | 218 (100.0%) | 0 (0.0%) |
| 19 to 25 Years | 103 (100.0%) | 0 (0.0%) |
| 26 to 34 Years | 170 (68.3%) | 79 (31.7%) |
| 35 to 44 Years | 141 (100.0%) | 0 (0.0%) |
| 45 to 54 Years | 158 (100.0%) | 0 (0.0%) |
| 55 to 64 Years | 269 (97.8%) | 6 (2.2%) |
| 65 to 74 Years | 139 (100.0%) | 0 (0.0%) |
| 75 Years and older | 101 (100.0%) | 0 (0.0%) |
| Total | 1,416 (94.3%) | 85 (5.7%) |
Health Insurance Coverage by Citizenship Status in Kalida
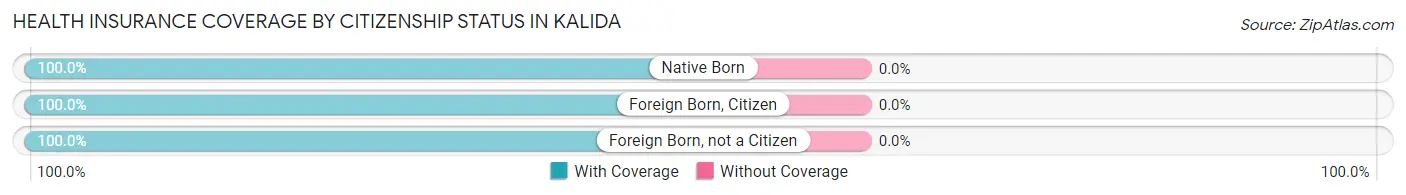
| Citizenship Status | With Coverage | Without Coverage |
| Native Born | 117 (100.0%) | 0 (0.0%) |
| Foreign Born, Citizen | 218 (100.0%) | 0 (0.0%) |
| Foreign Born, not a Citizen | 103 (100.0%) | 0 (0.0%) |
Health Insurance Coverage by Household Income in Kalida
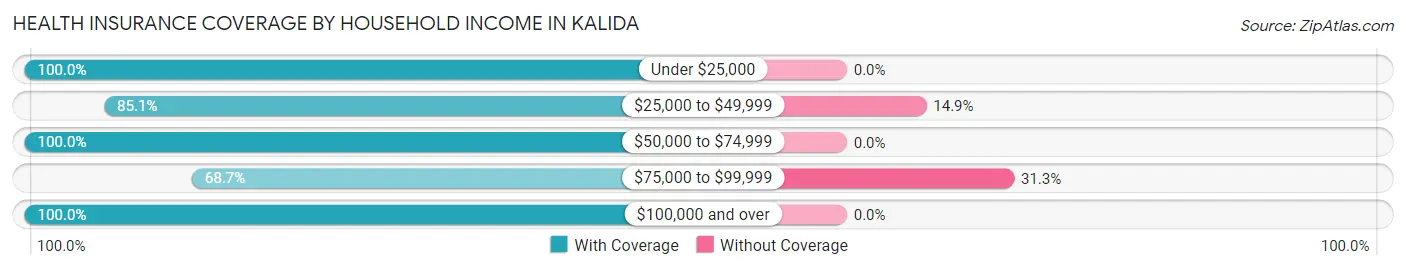
| Household Income | With Coverage | Without Coverage |
| Under $25,000 | 29 (100.0%) | 0 (0.0%) |
| $25,000 to $49,999 | 97 (85.1%) | 17 (14.9%) |
| $50,000 to $74,999 | 235 (100.0%) | 0 (0.0%) |
| $75,000 to $99,999 | 149 (68.7%) | 68 (31.3%) |
| $100,000 and over | 906 (100.0%) | 0 (0.0%) |
Public vs Private Health Insurance Coverage by Age in Kalida
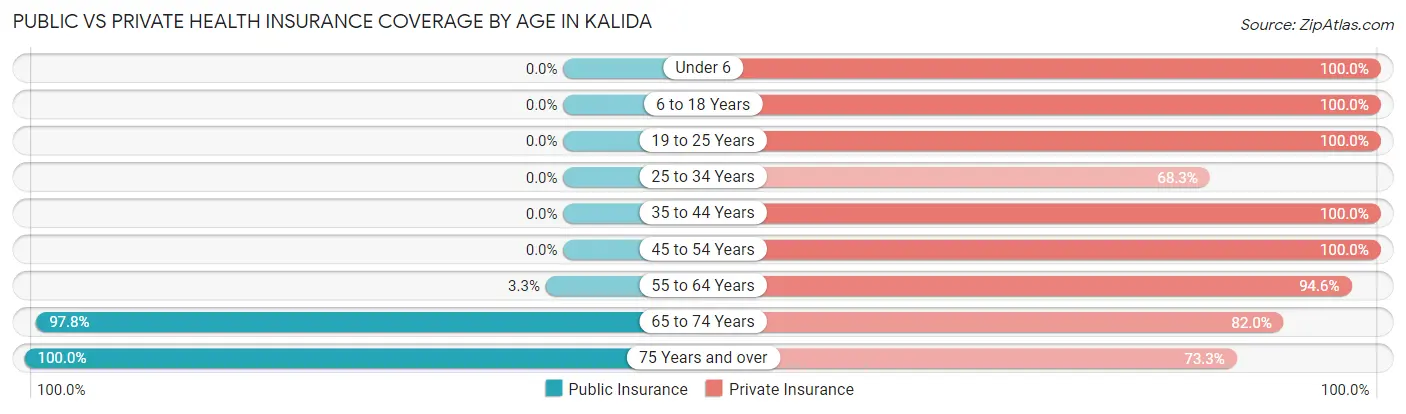
| Age Bracket | Public Insurance | Private Insurance |
| Under 6 | 0 (0.0%) | 117 (100.0%) |
| 6 to 18 Years | 0 (0.0%) | 218 (100.0%) |
| 19 to 25 Years | 0 (0.0%) | 103 (100.0%) |
| 25 to 34 Years | 0 (0.0%) | 170 (68.3%) |
| 35 to 44 Years | 0 (0.0%) | 141 (100.0%) |
| 45 to 54 Years | 0 (0.0%) | 158 (100.0%) |
| 55 to 64 Years | 9 (3.3%) | 260 (94.6%) |
| 65 to 74 Years | 136 (97.8%) | 114 (82.0%) |
| 75 Years and over | 101 (100.0%) | 74 (73.3%) |
| Total | 246 (16.4%) | 1,355 (90.3%) |
Disability Status by Sex by Age in Kalida
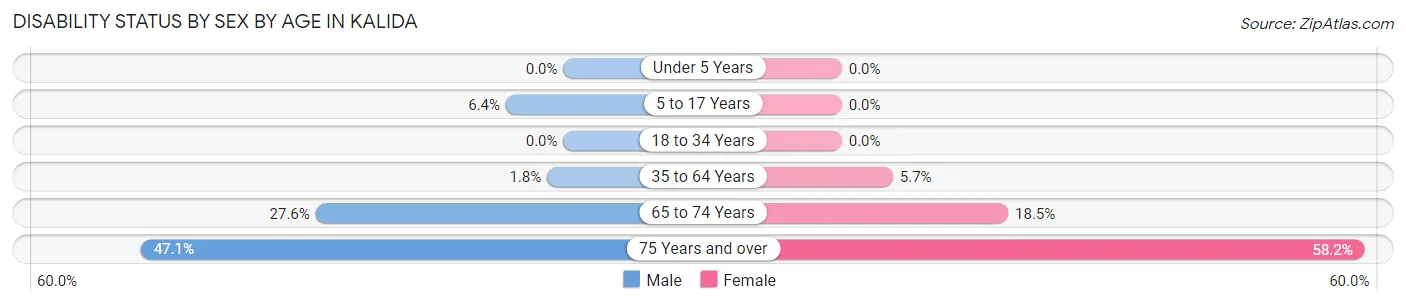
| Age Bracket | Male | Female |
| Under 5 Years | 0 (0.0%) | 0 (0.0%) |
| 5 to 17 Years | 8 (6.4%) | 0 (0.0%) |
| 18 to 34 Years | 0 (0.0%) | 0 (0.0%) |
| 35 to 64 Years | 5 (1.8%) | 17 (5.7%) |
| 65 to 74 Years | 16 (27.6%) | 15 (18.5%) |
| 75 Years and over | 16 (47.1%) | 39 (58.2%) |
Disability Class by Sex by Age in Kalida
Disability Class: Hearing Difficulty
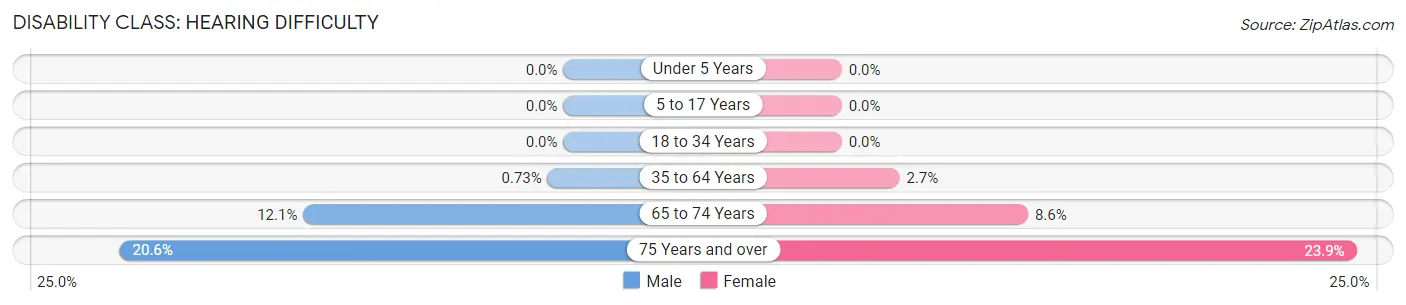
| Age Bracket | Male | Female |
| Under 5 Years | 0 (0.0%) | 0 (0.0%) |
| 5 to 17 Years | 0 (0.0%) | 0 (0.0%) |
| 18 to 34 Years | 0 (0.0%) | 0 (0.0%) |
| 35 to 64 Years | 2 (0.7%) | 8 (2.7%) |
| 65 to 74 Years | 7 (12.1%) | 7 (8.6%) |
| 75 Years and over | 7 (20.6%) | 16 (23.9%) |
Disability Class: Vision Difficulty
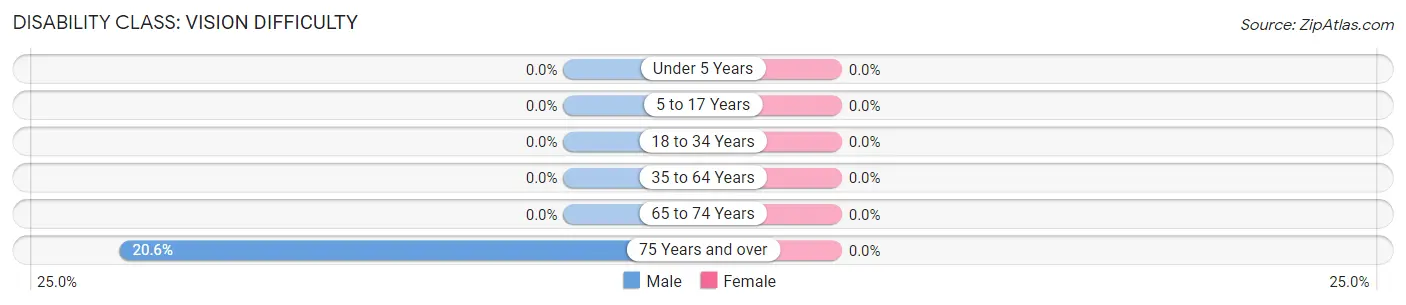
| Age Bracket | Male | Female |
| Under 5 Years | 0 (0.0%) | 0 (0.0%) |
| 5 to 17 Years | 0 (0.0%) | 0 (0.0%) |
| 18 to 34 Years | 0 (0.0%) | 0 (0.0%) |
| 35 to 64 Years | 0 (0.0%) | 0 (0.0%) |
| 65 to 74 Years | 0 (0.0%) | 0 (0.0%) |
| 75 Years and over | 7 (20.6%) | 0 (0.0%) |
Disability Class: Cognitive Difficulty
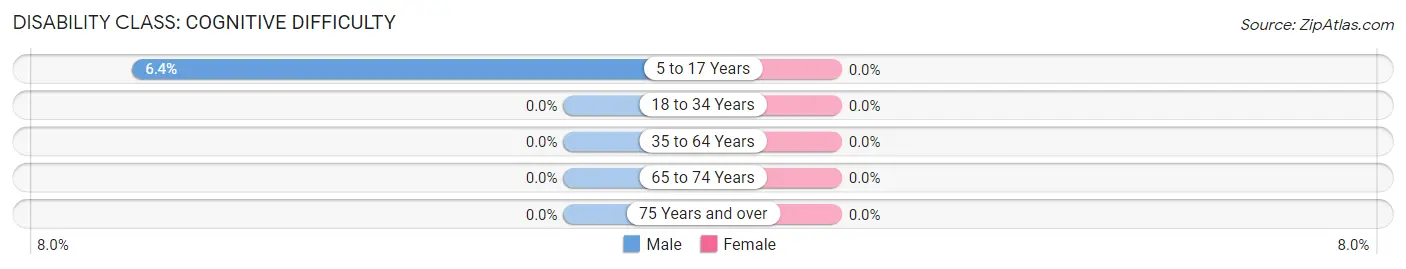
| Age Bracket | Male | Female |
| 5 to 17 Years | 8 (6.4%) | 0 (0.0%) |
| 18 to 34 Years | 0 (0.0%) | 0 (0.0%) |
| 35 to 64 Years | 0 (0.0%) | 0 (0.0%) |
| 65 to 74 Years | 0 (0.0%) | 0 (0.0%) |
| 75 Years and over | 0 (0.0%) | 0 (0.0%) |
Disability Class: Ambulatory Difficulty
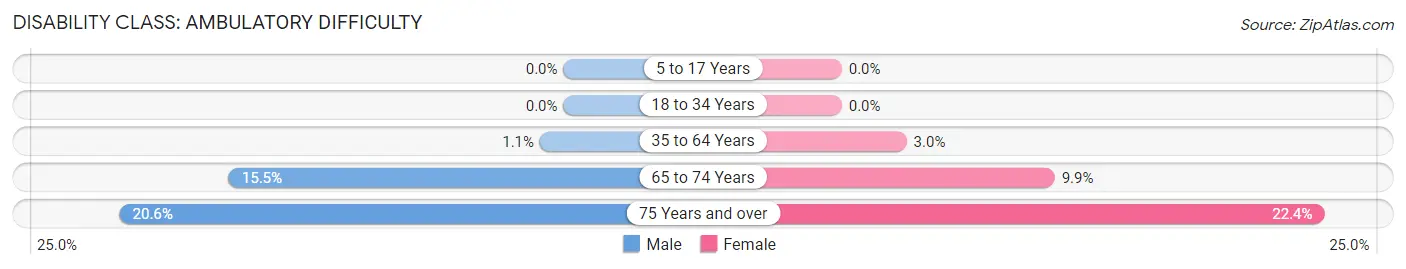
| Age Bracket | Male | Female |
| 5 to 17 Years | 0 (0.0%) | 0 (0.0%) |
| 18 to 34 Years | 0 (0.0%) | 0 (0.0%) |
| 35 to 64 Years | 3 (1.1%) | 9 (3.0%) |
| 65 to 74 Years | 9 (15.5%) | 8 (9.9%) |
| 75 Years and over | 7 (20.6%) | 15 (22.4%) |
Disability Class: Self-Care Difficulty
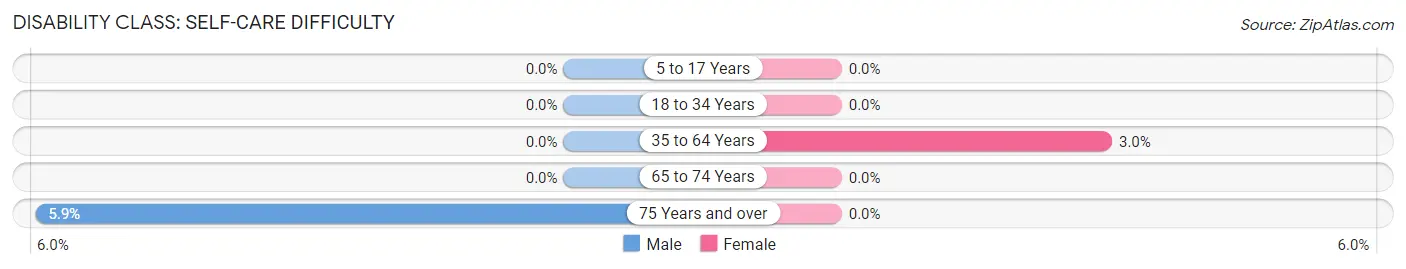
| Age Bracket | Male | Female |
| 5 to 17 Years | 0 (0.0%) | 0 (0.0%) |
| 18 to 34 Years | 0 (0.0%) | 0 (0.0%) |
| 35 to 64 Years | 0 (0.0%) | 9 (3.0%) |
| 65 to 74 Years | 0 (0.0%) | 0 (0.0%) |
| 75 Years and over | 2 (5.9%) | 0 (0.0%) |
Technology Access in Kalida
Computing Device Access in Kalida
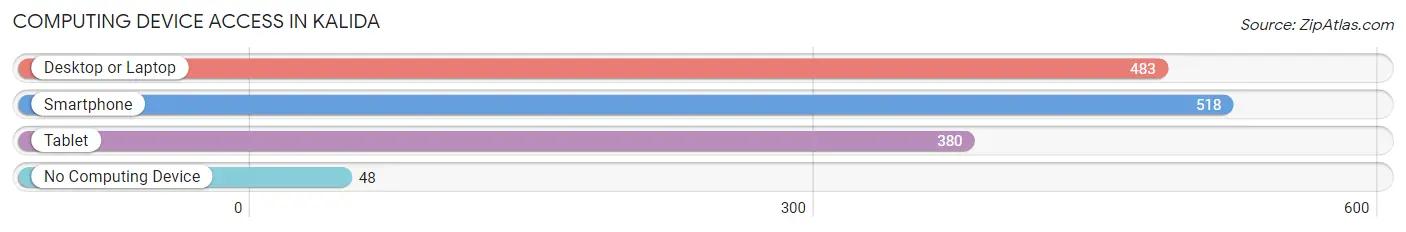
| Device Type | # Households | % Households |
| Desktop or Laptop | 483 | 78.5% |
| Smartphone | 518 | 84.2% |
| Tablet | 380 | 61.8% |
| No Computing Device | 48 | 7.8% |
| Total | 615 | 100.0% |
Internet Access in Kalida
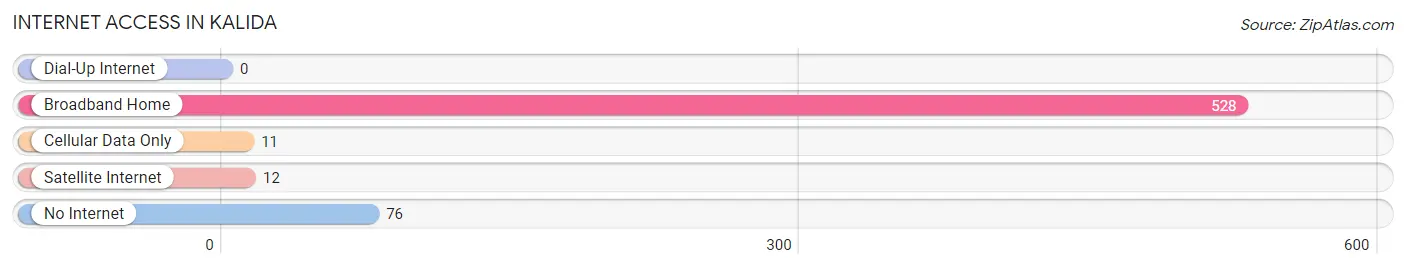
| Internet Type | # Households | % Households |
| Dial-Up Internet | 0 | 0.0% |
| Broadband Home | 528 | 85.9% |
| Cellular Data Only | 11 | 1.8% |
| Satellite Internet | 12 | 1.9% |
| No Internet | 76 | 12.4% |
| Total | 615 | 100.0% |
Kalida Summary
KALIDA OHIO
Kalida is a village located in Putnam County, Ohio, United States. The population was 1,717 at the 2010 census. Kalida is located in the northwest corner of the county, along the Auglaize River. It is part of the Ottawa–Perrysburg Metropolitan Statistical Area.
History
Kalida was founded in 1845 by German immigrants who had come to the area from Pennsylvania. The village was named after a town in Germany. The first settlers were mostly farmers, and the village grew slowly. In 1854, the first post office was established, and the first school was built in 1856.
In 1868, the first railroad line was built through Kalida, connecting it to the larger cities of Toledo and Cincinnati. This allowed the village to become a major shipping center for the surrounding area. The railroad also brought new businesses to the village, including a flour mill, a sawmill, and a brickyard.
In 1875, the village was incorporated, and the first mayor was elected. The village continued to grow, and by the early 1900s, it had become a thriving community with a population of over 1,000.
Geography
Kalida is located at 41°2′17″N 84°14′17″W (41.038139, -84.238118). According to the United States Census Bureau, the village has a total area of 1.02 square miles (2.64 km2), all land.
Economy
Kalida’s economy is largely based on agriculture and manufacturing. The village is home to several small businesses, including a grocery store, a hardware store, and a restaurant. The village also has a few larger employers, including a manufacturing plant and a trucking company.
Demographics
As of the census of 2010, there were 1,717 people, 690 households, and 463 families residing in the village. The population density was 1,683.3 people per square mile (650.2/km2). There were 745 housing units at an average density of 730.4 per square mile (282.3/km2). The racial makeup of the village was 97.7% White, 0.2% African American, 0.2% Native American, 0.2% Asian, 0.2% from other races, and 1.7% from two or more races. Hispanic or Latino of any race were 0.9% of the population.
There were 690 households, out of which 32.2% had children under the age of 18 living with them, 51.3% were married couples living together, 10.1% had a female householder with no husband present, and 33.6% were non-families. 29.3% of all households were made up of individuals, and 14.1% had someone living alone who was 65 years of age or older. The average household size was 2.48 and the average family size was 3.06.
In the village, the population was spread out, with 26.2% under the age of 18, 8.2% from 18 to 24, 27.2% from 25 to 44, 22.2% from 45 to 64, and 16.2% who were 65 years of age or older. The median age was 37 years. For every 100 females, there were 94.2 males. For every 100 females age 18 and over, there were 91.2 males.
The median income for a household in the village was $41,250, and the median income for a family was $50,000. Males had a median income of $35,000 versus $25,000 for females. The per capita income for the village was $19,845. About 4.2% of families and 5.7% of the population were below the poverty line, including 6.2% of those under age 18 and 5.3% of those age 65 or over.
Conclusion
Kalida is a small village located in Putnam County, Ohio. It was founded in 1845 by German immigrants and has grown slowly over the years. The village is largely agricultural and manufacturing based, and is home to several small businesses. The population of Kalida is 1,717, with a median household income of $41,250. The village is part of the Ottawa–Perrysburg Metropolitan Statistical Area.
Common Questions
What is Per Capita Income in Kalida?
Per Capita income in Kalida is $43,674.
What is the Median Family Income in Kalida?
Median Family Income in Kalida is $122,847.
What is the Median Household income in Kalida?
Median Household Income in Kalida is $97,171.
What is Income or Wage Gap in Kalida?
Income or Wage Gap in Kalida is 0.9%.
Women in Kalida earn 99.1 cents for every dollar earned by a man.
What is Inequality or Gini Index in Kalida?
Inequality or Gini Index in Kalida is 0.35.
What is the Total Population of Kalida?
Total Population of Kalida is 1,575.
What is the Total Male Population of Kalida?
Total Male Population of Kalida is 774.
What is the Total Female Population of Kalida?
Total Female Population of Kalida is 801.
What is the Ratio of Males per 100 Females in Kalida?
There are 96.63 Males per 100 Females in Kalida.
What is the Ratio of Females per 100 Males in Kalida?
There are 103.49 Females per 100 Males in Kalida.
What is the Median Population Age in Kalida?
Median Population Age in Kalida is 40.6 Years.
What is the Average Family Size in Kalida
Average Family Size in Kalida is 2.9 People.
What is the Average Household Size in Kalida
Average Household Size in Kalida is 2.4 People.
How Large is the Labor Force in Kalida?
There are 951 People in the Labor Forcein in Kalida.
What is the Percentage of People in the Labor Force in Kalida?
74.0% of People are in the Labor Force in Kalida.
What is the Unemployment Rate in Kalida?
Unemployment Rate in Kalida is 1.6%.