Johnstown, OH Map & Demographics
Johnstown Map
Johnstown Overview
$34,224
PER CAPITA INCOME
$91,837
AVG FAMILY INCOME
$78,442
AVG HOUSEHOLD INCOME
15.0%
WAGE / INCOME GAP [ % ]
85.0¢/ $1
WAGE / INCOME GAP [ $ ]
0.39
INEQUALITY / GINI INDEX
5,183
TOTAL POPULATION
2,604
MALE POPULATION
2,579
FEMALE POPULATION
100.97
MALES / 100 FEMALES
99.04
FEMALES / 100 MALES
37.7
MEDIAN AGE
3.0
AVG FAMILY SIZE
2.7
AVG HOUSEHOLD SIZE
2,879
LABOR FORCE [ PEOPLE ]
72.2%
PERCENT IN LABOR FORCE
1.5%
UNEMPLOYMENT RATE
Johnstown Zip Codes
Johnstown Area Codes
Income in Johnstown
Income Overview in Johnstown
Per Capita Income in Johnstown is $34,224, while median incomes of families and households are $91,837 and $78,442 respectively.
| Characteristic | Number | Measure |
| Per Capita Income | 5,183 | $34,224 |
| Median Family Income | 1,499 | $91,837 |
| Mean Family Income | 1,499 | $101,998 |
| Median Household Income | 1,950 | $78,442 |
| Mean Household Income | 1,950 | $89,942 |
| Income Deficit | 1,499 | $0 |
| Wage / Income Gap (%) | 5,183 | 15.02% |
| Wage / Income Gap ($) | 5,183 | 84.98¢ per $1 |
| Gini / Inequality Index | 5,183 | 0.39 |
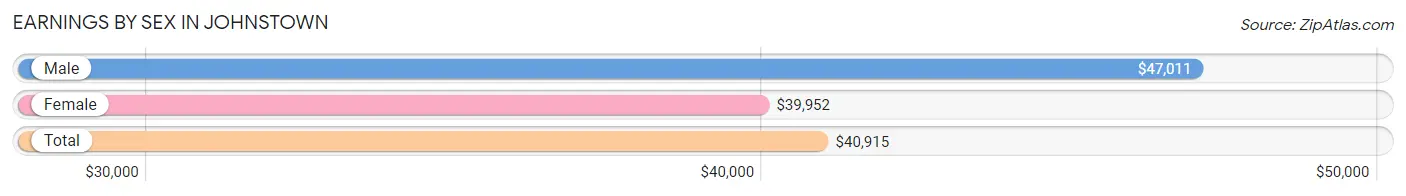
Earnings by Sex in Johnstown
Average Earnings in Johnstown are $40,915, $47,011 for men and $39,952 for women, a difference of 15.0%.
| Sex | Number | Average Earnings |
| Male | 1,527 (52.5%) | $47,011 |
| Female | 1,383 (47.5%) | $39,952 |
| Total | 2,910 (100.0%) | $40,915 |
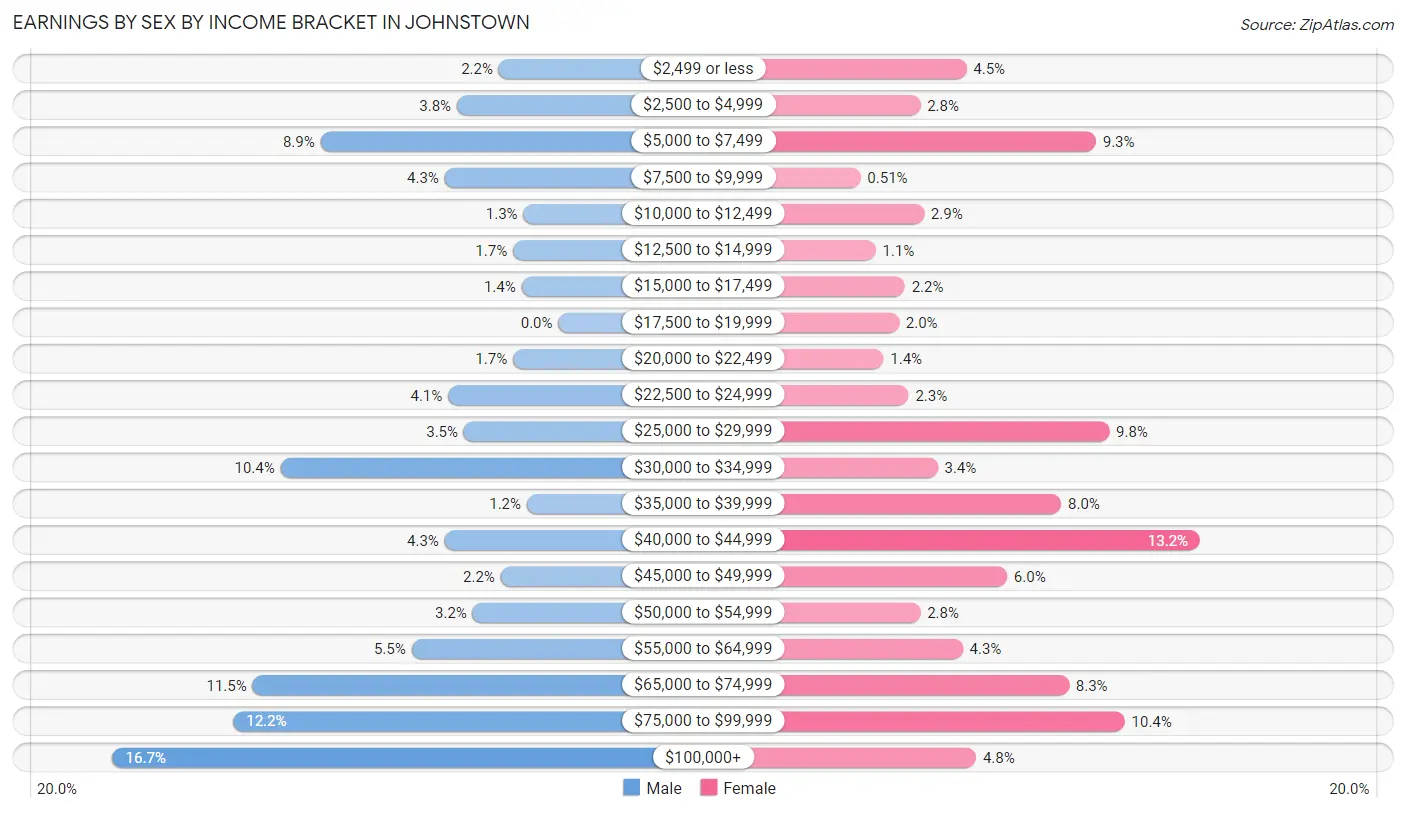
Earnings by Sex by Income Bracket in Johnstown
The most common earnings brackets in Johnstown are $100,000+ for men (255 | 16.7%) and $40,000 to $44,999 for women (183 | 13.2%).
| Income | Male | Female |
| $2,499 or less | 34 (2.2%) | 62 (4.5%) |
| $2,500 to $4,999 | 58 (3.8%) | 38 (2.8%) |
| $5,000 to $7,499 | 136 (8.9%) | 129 (9.3%) |
| $7,500 to $9,999 | 65 (4.3%) | 7 (0.5%) |
| $10,000 to $12,499 | 20 (1.3%) | 40 (2.9%) |
| $12,500 to $14,999 | 26 (1.7%) | 15 (1.1%) |
| $15,000 to $17,499 | 21 (1.4%) | 30 (2.2%) |
| $17,500 to $19,999 | 0 (0.0%) | 27 (1.9%) |
| $20,000 to $22,499 | 26 (1.7%) | 19 (1.4%) |
| $22,500 to $24,999 | 63 (4.1%) | 32 (2.3%) |
| $25,000 to $29,999 | 54 (3.5%) | 136 (9.8%) |
| $30,000 to $34,999 | 159 (10.4%) | 47 (3.4%) |
| $35,000 to $39,999 | 18 (1.2%) | 111 (8.0%) |
| $40,000 to $44,999 | 65 (4.3%) | 183 (13.2%) |
| $45,000 to $49,999 | 33 (2.2%) | 83 (6.0%) |
| $50,000 to $54,999 | 49 (3.2%) | 38 (2.8%) |
| $55,000 to $64,999 | 84 (5.5%) | 60 (4.3%) |
| $65,000 to $74,999 | 175 (11.5%) | 115 (8.3%) |
| $75,000 to $99,999 | 186 (12.2%) | 144 (10.4%) |
| $100,000+ | 255 (16.7%) | 67 (4.8%) |
| Total | 1,527 (100.0%) | 1,383 (100.0%) |
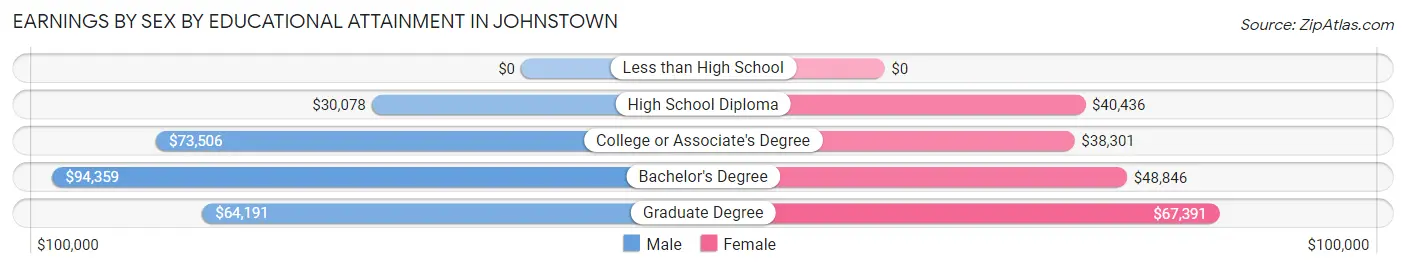
Earnings by Sex by Educational Attainment in Johnstown
Average earnings in Johnstown are $64,265 for men and $41,615 for women, a difference of 35.2%. Men with an educational attainment of bachelor's degree enjoy the highest average annual earnings of $94,359, while those with high school diploma education earn the least with $30,078. Women with an educational attainment of graduate degree earn the most with the average annual earnings of $67,391, while those with college or associate's degree education have the smallest earnings of $38,301.
| Educational Attainment | Male Income | Female Income |
| Less than High School | - | - |
| High School Diploma | $30,078 | $40,436 |
| College or Associate's Degree | $73,506 | $38,301 |
| Bachelor's Degree | $94,359 | $48,846 |
| Graduate Degree | $64,191 | $67,391 |
| Total | $64,265 | $41,615 |
Family Income in Johnstown
Family Income Brackets in Johnstown
According to the Johnstown family income data, there are 394 families falling into the $100,000 to $149,999 income range, which is the most common income bracket and makes up 26.3% of all families.
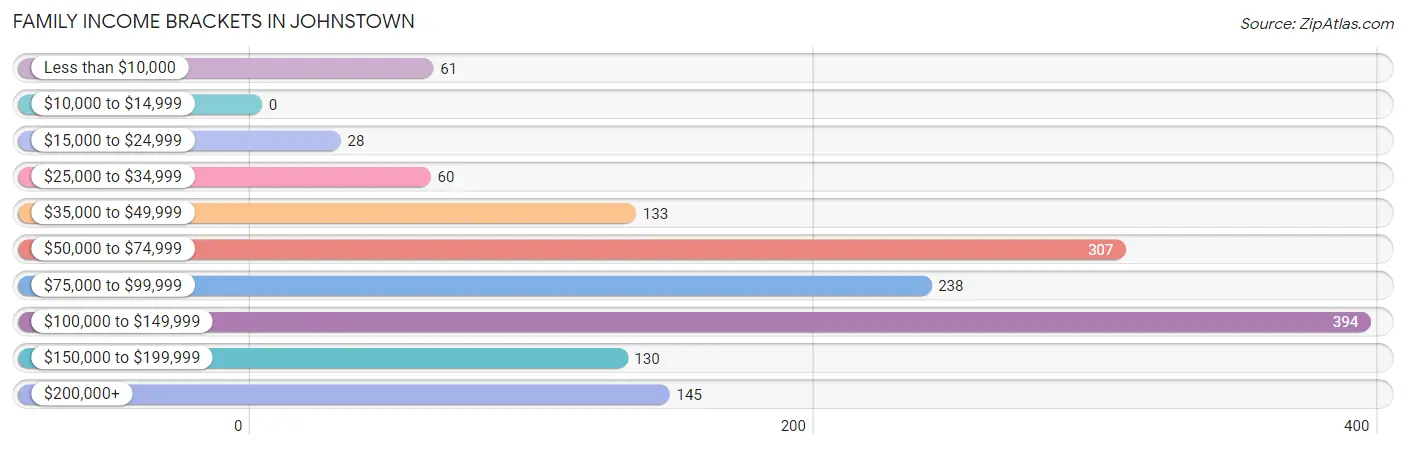
| Income Bracket | # Families | % Families |
| Less than $10,000 | 61 | 4.1% |
| $10,000 to $14,999 | 0 | 0.0% |
| $15,000 to $24,999 | 28 | 1.9% |
| $25,000 to $34,999 | 60 | 4.0% |
| $35,000 to $49,999 | 133 | 8.9% |
| $50,000 to $74,999 | 307 | 20.5% |
| $75,000 to $99,999 | 238 | 15.9% |
| $100,000 to $149,999 | 394 | 26.3% |
| $150,000 to $199,999 | 130 | 8.7% |
| $200,000+ | 145 | 9.7% |
Family Income by Famaliy Size in Johnstown
6-person families (85 | 5.7%) account for the highest median family income in Johnstown with $215,457 per family, while 2-person families (728 | 48.6%) have the highest median income of $39,286 per family member.
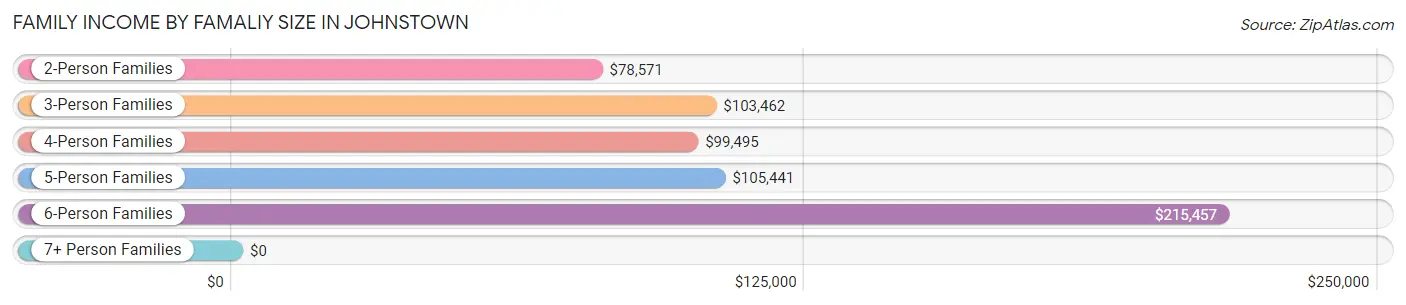
| Income Bracket | # Families | Median Income |
| 2-Person Families | 728 (48.6%) | $78,571 |
| 3-Person Families | 334 (22.3%) | $103,462 |
| 4-Person Families | 273 (18.2%) | $99,495 |
| 5-Person Families | 72 (4.8%) | $105,441 |
| 6-Person Families | 85 (5.7%) | $215,457 |
| 7+ Person Families | 7 (0.5%) | $0 |
| Total | 1,499 (100.0%) | $91,837 |
Family Income by Number of Earners in Johnstown
The median family income in Johnstown is $91,837, with families comprising 3+ earners (222) having the highest median family income of $152,778, while families with 1 earner (464) have the lowest median family income of $51,397, accounting for 14.8% and 30.9% of families, respectively.
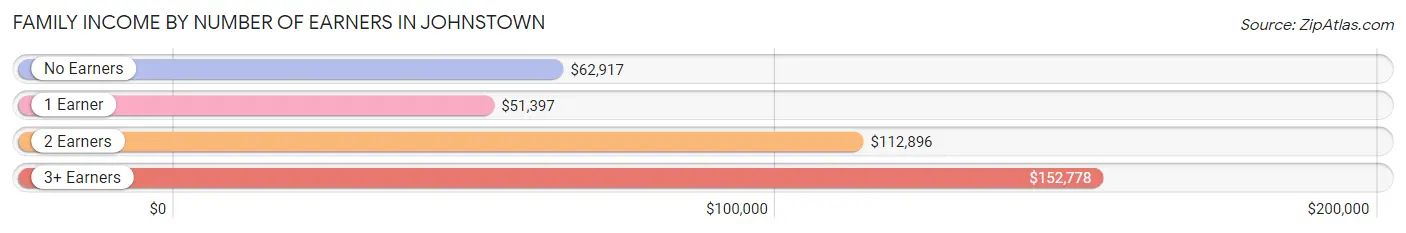
| Number of Earners | # Families | Median Income |
| No Earners | 119 (7.9%) | $62,917 |
| 1 Earner | 464 (30.9%) | $51,397 |
| 2 Earners | 694 (46.3%) | $112,896 |
| 3+ Earners | 222 (14.8%) | $152,778 |
| Total | 1,499 (100.0%) | $91,837 |
Household Income in Johnstown
Household Income Brackets in Johnstown
With 433 households falling in the category, the $100,000 to $149,999 income range is the most frequent in Johnstown, accounting for 22.2% of all households. In contrast, only 62 households (3.2%) fall into the less than $10,000 income bracket, making it the least populous group.
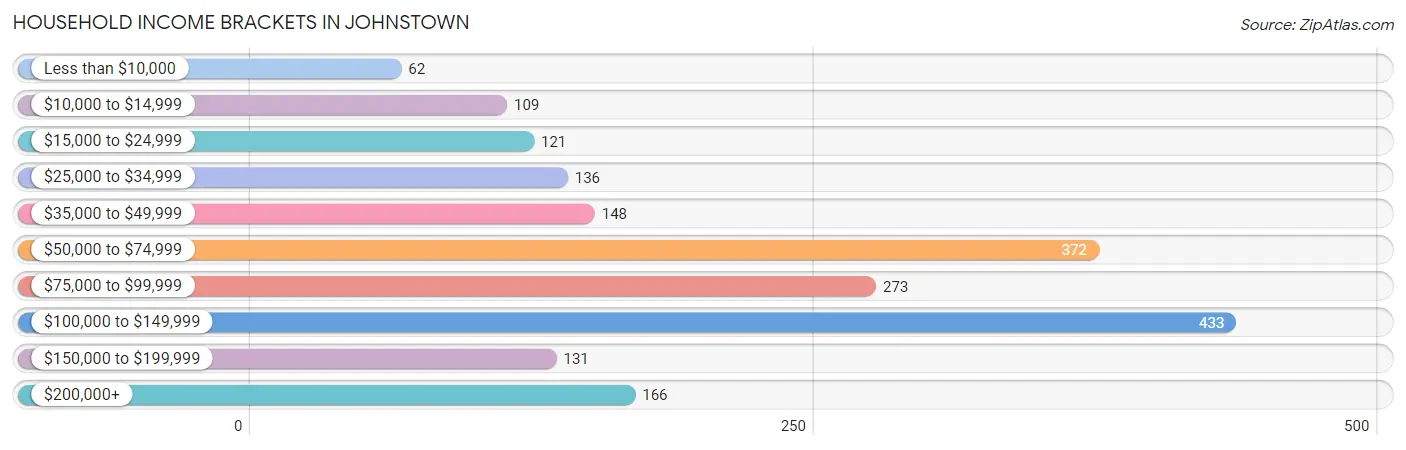
| Income Bracket | # Households | % Households |
| Less than $10,000 | 62 | 3.2% |
| $10,000 to $14,999 | 109 | 5.6% |
| $15,000 to $24,999 | 121 | 6.2% |
| $25,000 to $34,999 | 136 | 7.0% |
| $35,000 to $49,999 | 148 | 7.6% |
| $50,000 to $74,999 | 372 | 19.1% |
| $75,000 to $99,999 | 273 | 14.0% |
| $100,000 to $149,999 | 433 | 22.2% |
| $150,000 to $199,999 | 131 | 6.7% |
| $200,000+ | 166 | 8.5% |
Household Income by Householder Age in Johnstown
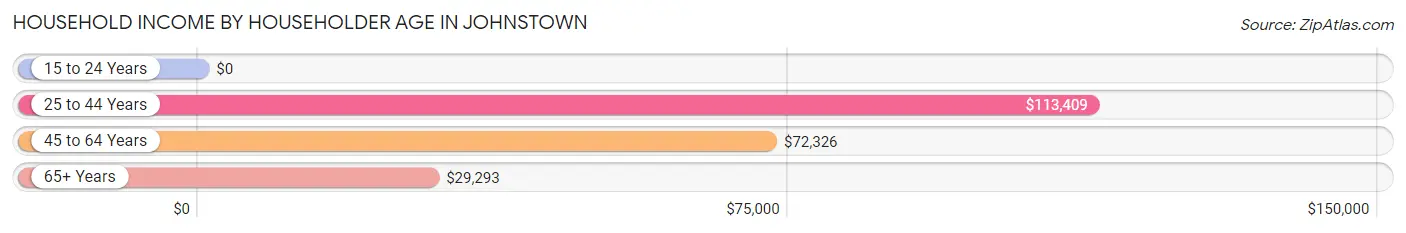
The median household income in Johnstown is $78,442, with the highest median household income of $113,409 found in the 25 to 44 years age bracket for the primary householder. A total of 692 households (35.5%) fall into this category. Meanwhile, the 15 to 24 years age bracket for the primary householder has the lowest median household income of $0, with 133 households (6.8%) in this group.
| Income Bracket | # Households | Median Income |
| 15 to 24 Years | 133 (6.8%) | $0 |
| 25 to 44 Years | 692 (35.5%) | $113,409 |
| 45 to 64 Years | 619 (31.7%) | $72,326 |
| 65+ Years | 506 (26.0%) | $29,293 |
| Total | 1,950 (100.0%) | $78,442 |
Poverty in Johnstown
Income Below Poverty by Sex and Age in Johnstown
With 7.4% poverty level for males and 10.8% for females among the residents of Johnstown, 75 year old and over males and under 5 year old females are the most vulnerable to poverty, with 51 males (38.9%) and 52 females (40.0%) in their respective age groups living below the poverty level.
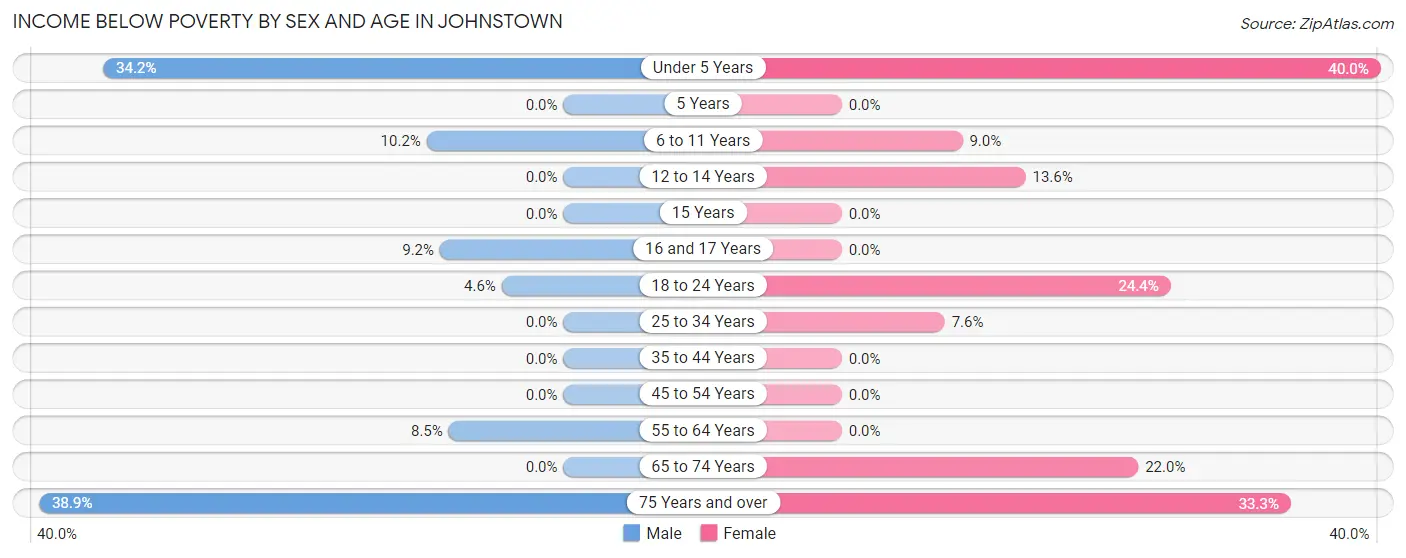
| Age Bracket | Male | Female |
| Under 5 Years | 82 (34.2%) | 52 (40.0%) |
| 5 Years | 0 (0.0%) | 0 (0.0%) |
| 6 to 11 Years | 20 (10.2%) | 19 (9.0%) |
| 12 to 14 Years | 0 (0.0%) | 18 (13.6%) |
| 15 Years | 0 (0.0%) | 0 (0.0%) |
| 16 and 17 Years | 10 (9.2%) | 0 (0.0%) |
| 18 to 24 Years | 12 (4.6%) | 62 (24.4%) |
| 25 to 34 Years | 0 (0.0%) | 22 (7.6%) |
| 35 to 44 Years | 0 (0.0%) | 0 (0.0%) |
| 45 to 54 Years | 0 (0.0%) | 0 (0.0%) |
| 55 to 64 Years | 19 (8.5%) | 0 (0.0%) |
| 65 to 74 Years | 0 (0.0%) | 70 (22.0%) |
| 75 Years and over | 51 (38.9%) | 35 (33.3%) |
| Total | 194 (7.4%) | 278 (10.8%) |
Income Above Poverty by Sex and Age in Johnstown
According to the poverty statistics in Johnstown, males aged 5 years and females aged 5 years are the age groups that are most secure financially, with 100.0% of males and 100.0% of females in these age groups living above the poverty line.
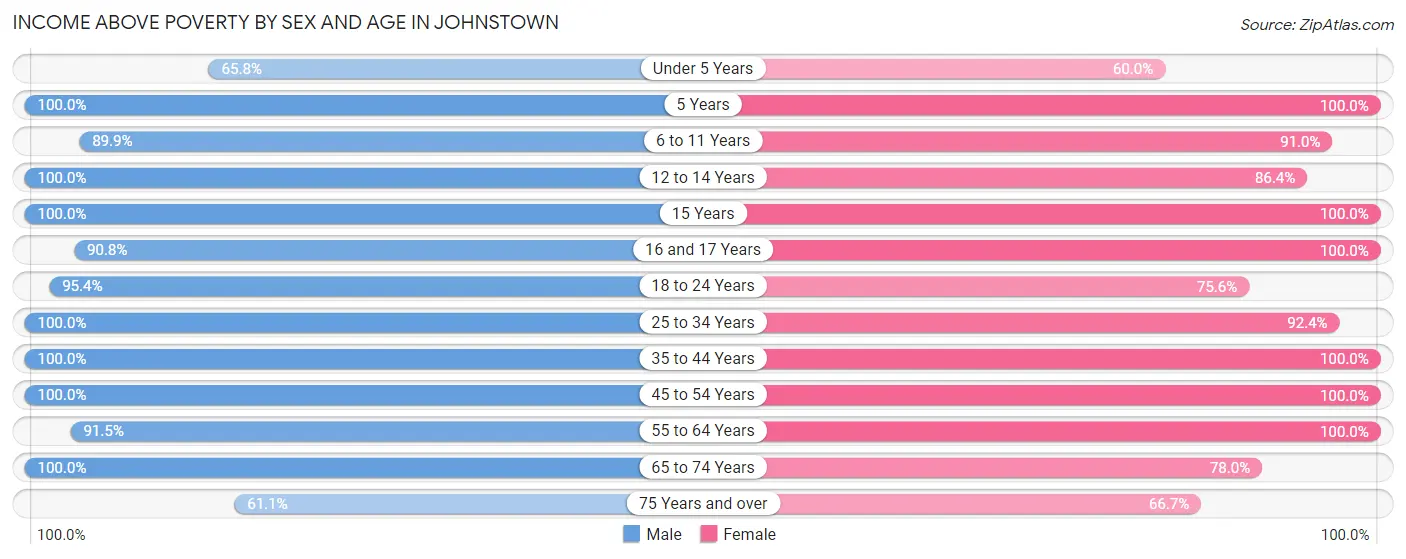
| Age Bracket | Male | Female |
| Under 5 Years | 158 (65.8%) | 78 (60.0%) |
| 5 Years | 34 (100.0%) | 29 (100.0%) |
| 6 to 11 Years | 177 (89.8%) | 193 (91.0%) |
| 12 to 14 Years | 113 (100.0%) | 114 (86.4%) |
| 15 Years | 35 (100.0%) | 64 (100.0%) |
| 16 and 17 Years | 99 (90.8%) | 75 (100.0%) |
| 18 to 24 Years | 250 (95.4%) | 192 (75.6%) |
| 25 to 34 Years | 278 (100.0%) | 266 (92.4%) |
| 35 to 44 Years | 529 (100.0%) | 452 (100.0%) |
| 45 to 54 Years | 235 (100.0%) | 222 (100.0%) |
| 55 to 64 Years | 204 (91.5%) | 288 (100.0%) |
| 65 to 74 Years | 218 (100.0%) | 248 (78.0%) |
| 75 Years and over | 80 (61.1%) | 70 (66.7%) |
| Total | 2,410 (92.5%) | 2,291 (89.2%) |
Income Below Poverty Among Married-Couple Families in Johnstown
The poverty statistics for married-couple families in Johnstown show that 3.4% or 37 of the total 1,096 families live below the poverty line. Families with 3 or 4 children have the highest poverty rate of 13.1%, comprising of 19 families. On the other hand, families with 1 or 2 children have the lowest poverty rate of 0.0%, which includes 0 families.
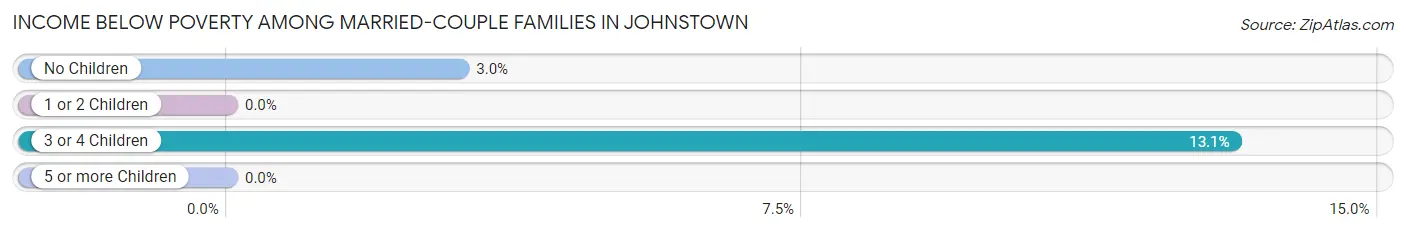
| Children | Above Poverty | Below Poverty |
| No Children | 578 (97.0%) | 18 (3.0%) |
| 1 or 2 Children | 355 (100.0%) | 0 (0.0%) |
| 3 or 4 Children | 126 (86.9%) | 19 (13.1%) |
| 5 or more Children | 0 (0.0%) | 0 (0.0%) |
| Total | 1,059 (96.6%) | 37 (3.4%) |
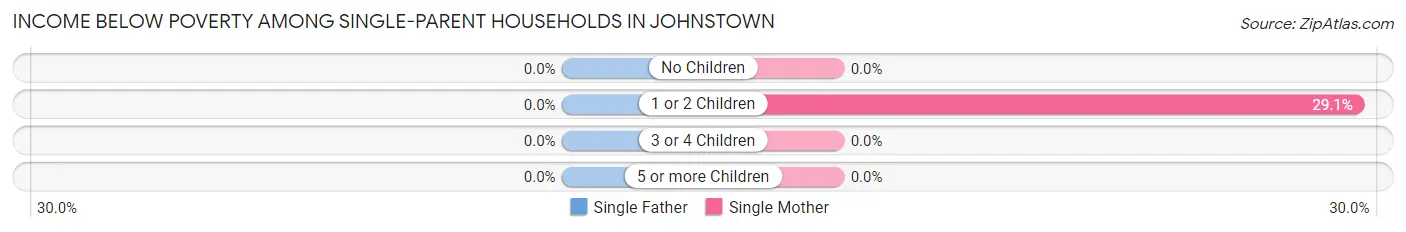
Income Below Poverty Among Single-Parent Households in Johnstown
| Children | Single Father | Single Mother |
| No Children | 0 (0.0%) | 0 (0.0%) |
| 1 or 2 Children | 0 (0.0%) | 62 (29.1%) |
| 3 or 4 Children | 0 (0.0%) | 0 (0.0%) |
| 5 or more Children | 0 (0.0%) | 0 (0.0%) |
| Total | 0 (0.0%) | 62 (16.9%) |
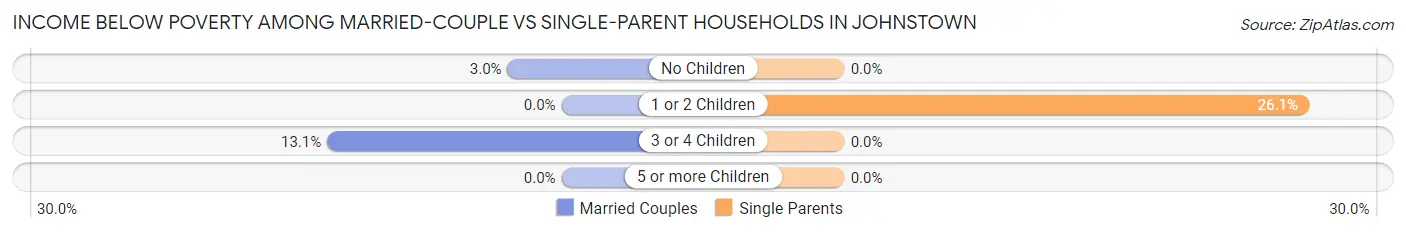
Income Below Poverty Among Married-Couple vs Single-Parent Households in Johnstown
The poverty data for Johnstown shows that 37 of the married-couple family households (3.4%) and 62 of the single-parent households (15.4%) are living below the poverty level. Within the married-couple family households, those with 3 or 4 children have the highest poverty rate, with 19 households (13.1%) falling below the poverty line. Among the single-parent households, those with 1 or 2 children have the highest poverty rate, with 62 household (26.1%) living below poverty.
| Children | Married-Couple Families | Single-Parent Households |
| No Children | 18 (3.0%) | 0 (0.0%) |
| 1 or 2 Children | 0 (0.0%) | 62 (26.1%) |
| 3 or 4 Children | 19 (13.1%) | 0 (0.0%) |
| 5 or more Children | 0 (0.0%) | 0 (0.0%) |
| Total | 37 (3.4%) | 62 (15.4%) |
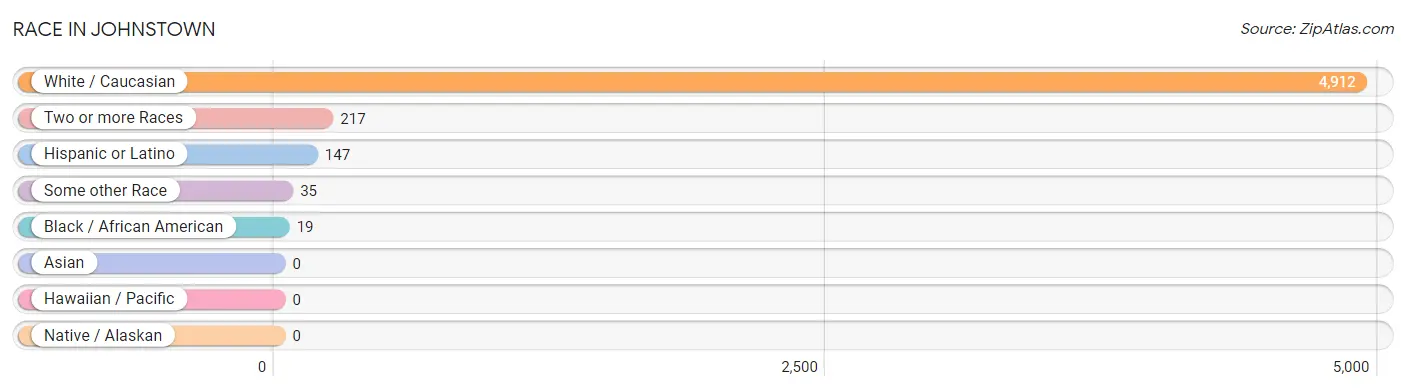
Race in Johnstown
The most populous races in Johnstown are White / Caucasian (4,912 | 94.8%), Two or more Races (217 | 4.2%), and Hispanic or Latino (147 | 2.8%).
| Race | # Population | % Population |
| Asian | 0 | 0.0% |
| Black / African American | 19 | 0.4% |
| Hawaiian / Pacific | 0 | 0.0% |
| Hispanic or Latino | 147 | 2.8% |
| Native / Alaskan | 0 | 0.0% |
| White / Caucasian | 4,912 | 94.8% |
| Two or more Races | 217 | 4.2% |
| Some other Race | 35 | 0.7% |
| Total | 5,183 | 100.0% |
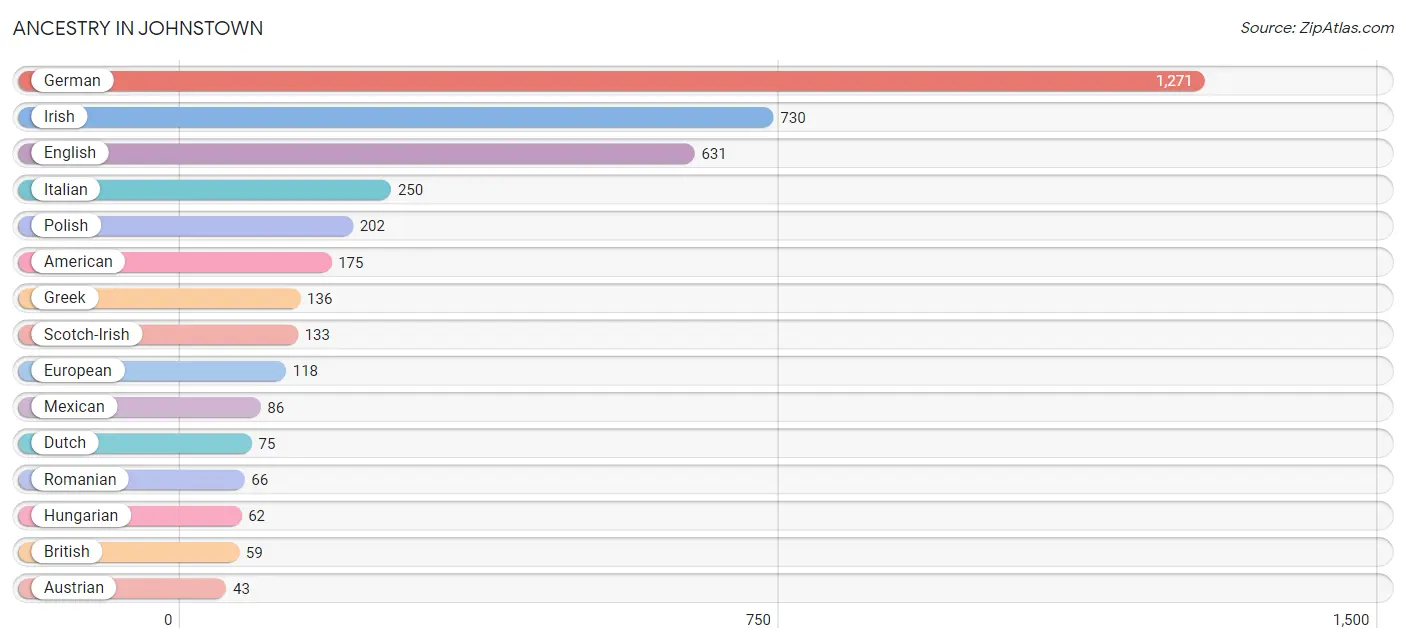
Ancestry in Johnstown
The most populous ancestries reported in Johnstown are German (1,271 | 24.5%), Irish (730 | 14.1%), English (631 | 12.2%), Italian (250 | 4.8%), and Polish (202 | 3.9%), together accounting for 59.5% of all Johnstown residents.
| Ancestry | # Population | % Population |
| American | 175 | 3.4% |
| Austrian | 43 | 0.8% |
| British | 59 | 1.1% |
| Cherokee | 6 | 0.1% |
| Colombian | 21 | 0.4% |
| Czech | 29 | 0.6% |
| Dutch | 75 | 1.5% |
| English | 631 | 12.2% |
| Estonian | 16 | 0.3% |
| European | 118 | 2.3% |
| French | 36 | 0.7% |
| German | 1,271 | 24.5% |
| Greek | 136 | 2.6% |
| Hungarian | 62 | 1.2% |
| Irish | 730 | 14.1% |
| Italian | 250 | 4.8% |
| Lithuanian | 13 | 0.3% |
| Maltese | 14 | 0.3% |
| Mexican | 86 | 1.7% |
| Northern European | 39 | 0.7% |
| Norwegian | 20 | 0.4% |
| Polish | 202 | 3.9% |
| Romanian | 66 | 1.3% |
| Russian | 13 | 0.3% |
| Scotch-Irish | 133 | 2.6% |
| Scottish | 30 | 0.6% |
| Seminole | 6 | 0.1% |
| Serbian | 1 | 0.0% |
| South American | 21 | 0.4% |
| Spanish | 40 | 0.8% |
| Sri Lankan | 8 | 0.2% |
| Swedish | 11 | 0.2% |
| Swiss | 13 | 0.3% |
| Welsh | 42 | 0.8% |
| Yugoslavian | 11 | 0.2% | View All 35 Rows |
Immigrants in Johnstown
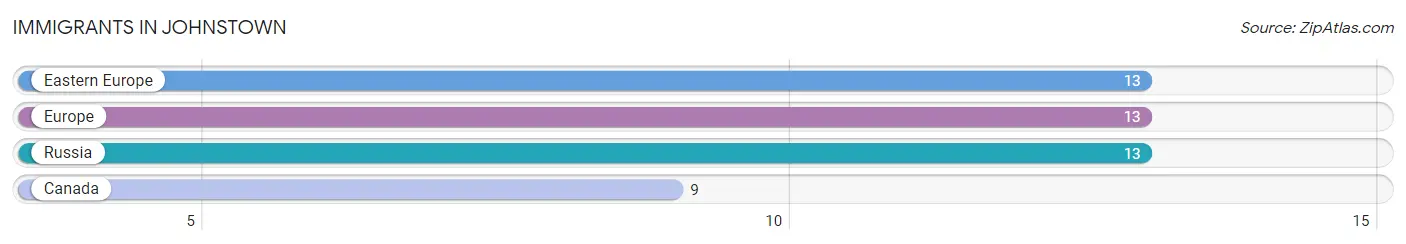
The most numerous immigrant groups reported in Johnstown came from Eastern Europe (13 | 0.3%), Europe (13 | 0.3%), Russia (13 | 0.3%), and Canada (9 | 0.2%), together accounting for 0.9% of all Johnstown residents.
| Immigration Origin | # Population | % Population |
| Canada | 9 | 0.2% |
| Eastern Europe | 13 | 0.3% |
| Europe | 13 | 0.3% |
| Russia | 13 | 0.3% | View All 4 Rows |
Sex and Age in Johnstown
Sex and Age in Johnstown
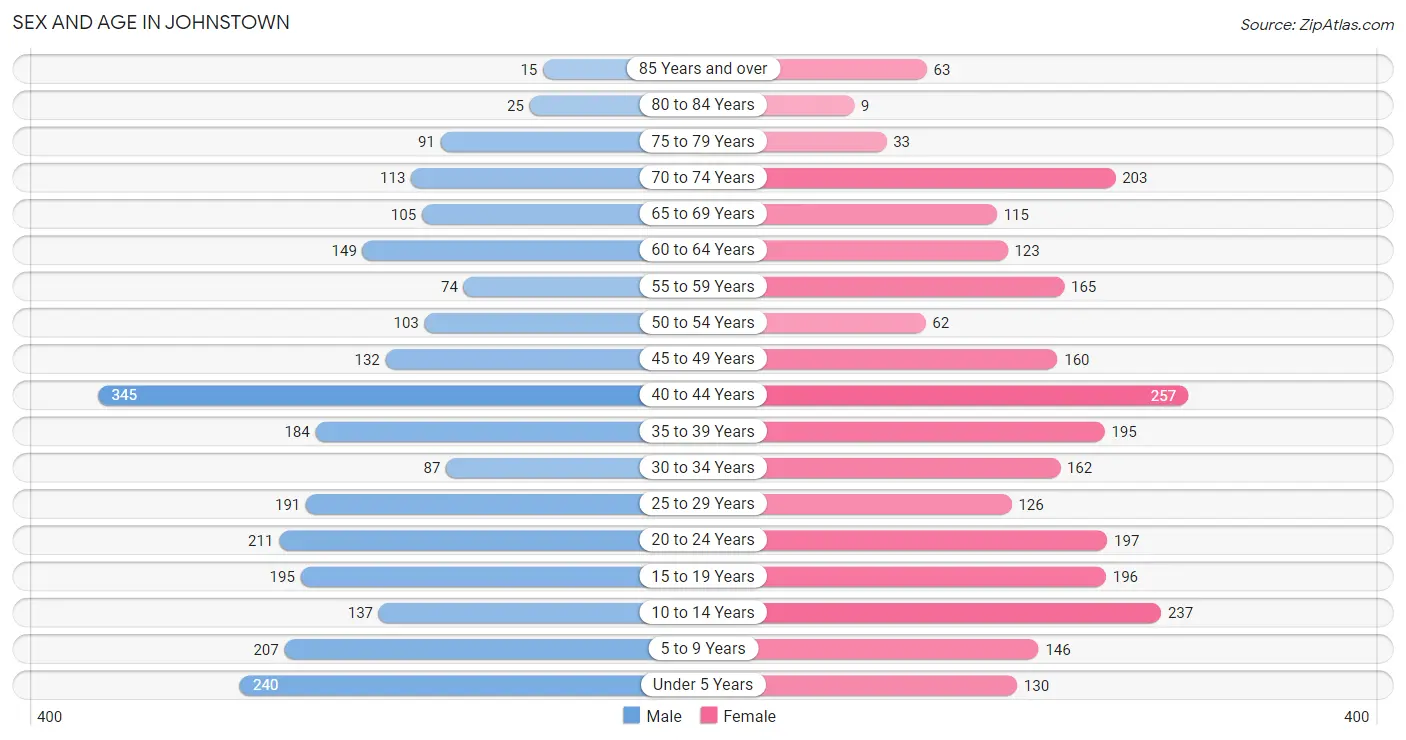
The most populous age groups in Johnstown are 40 to 44 Years (345 | 13.3%) for men and 40 to 44 Years (257 | 10.0%) for women.
| Age Bracket | Male | Female |
| Under 5 Years | 240 (9.2%) | 130 (5.0%) |
| 5 to 9 Years | 207 (8.0%) | 146 (5.7%) |
| 10 to 14 Years | 137 (5.3%) | 237 (9.2%) |
| 15 to 19 Years | 195 (7.5%) | 196 (7.6%) |
| 20 to 24 Years | 211 (8.1%) | 197 (7.6%) |
| 25 to 29 Years | 191 (7.3%) | 126 (4.9%) |
| 30 to 34 Years | 87 (3.3%) | 162 (6.3%) |
| 35 to 39 Years | 184 (7.1%) | 195 (7.6%) |
| 40 to 44 Years | 345 (13.3%) | 257 (10.0%) |
| 45 to 49 Years | 132 (5.1%) | 160 (6.2%) |
| 50 to 54 Years | 103 (4.0%) | 62 (2.4%) |
| 55 to 59 Years | 74 (2.8%) | 165 (6.4%) |
| 60 to 64 Years | 149 (5.7%) | 123 (4.8%) |
| 65 to 69 Years | 105 (4.0%) | 115 (4.5%) |
| 70 to 74 Years | 113 (4.3%) | 203 (7.9%) |
| 75 to 79 Years | 91 (3.5%) | 33 (1.3%) |
| 80 to 84 Years | 25 (1.0%) | 9 (0.4%) |
| 85 Years and over | 15 (0.6%) | 63 (2.4%) |
| Total | 2,604 (100.0%) | 2,579 (100.0%) |
Families and Households in Johnstown
Median Family Size in Johnstown
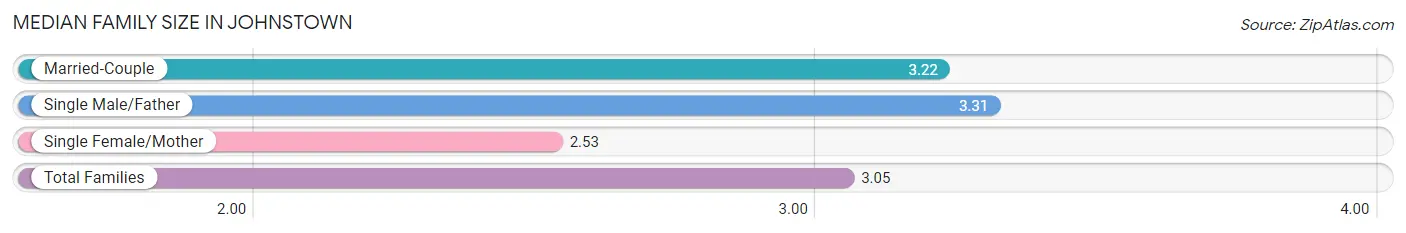
The median family size in Johnstown is 3.05 persons per family, with single male/father families (36 | 2.4%) accounting for the largest median family size of 3.31 persons per family. On the other hand, single female/mother families (367 | 24.5%) represent the smallest median family size with 2.53 persons per family.
| Family Type | # Families | Family Size |
| Married-Couple | 1,096 (73.1%) | 3.22 |
| Single Male/Father | 36 (2.4%) | 3.31 |
| Single Female/Mother | 367 (24.5%) | 2.53 |
| Total Families | 1,499 (100.0%) | 3.05 |
Median Household Size in Johnstown
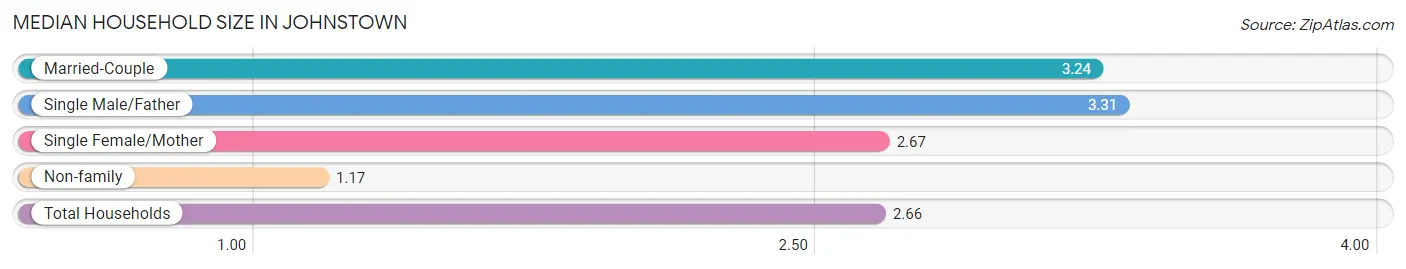
The median household size in Johnstown is 2.66 persons per household, with single male/father households (36 | 1.8%) accounting for the largest median household size of 3.31 persons per household. non-family households (451 | 23.1%) represent the smallest median household size with 1.17 persons per household.
| Household Type | # Households | Household Size |
| Married-Couple | 1,096 (56.2%) | 3.24 |
| Single Male/Father | 36 (1.8%) | 3.31 |
| Single Female/Mother | 367 (18.8%) | 2.67 |
| Non-family | 451 (23.1%) | 1.17 |
| Total Households | 1,950 (100.0%) | 2.66 |
Household Size by Marriage Status in Johnstown
Out of a total of 1,950 households in Johnstown, 1,499 (76.9%) are family households, while 451 (23.1%) are nonfamily households. The most numerous type of family households are 2-person households, comprising 690, and the most common type of nonfamily households are 1-person households, comprising 384.
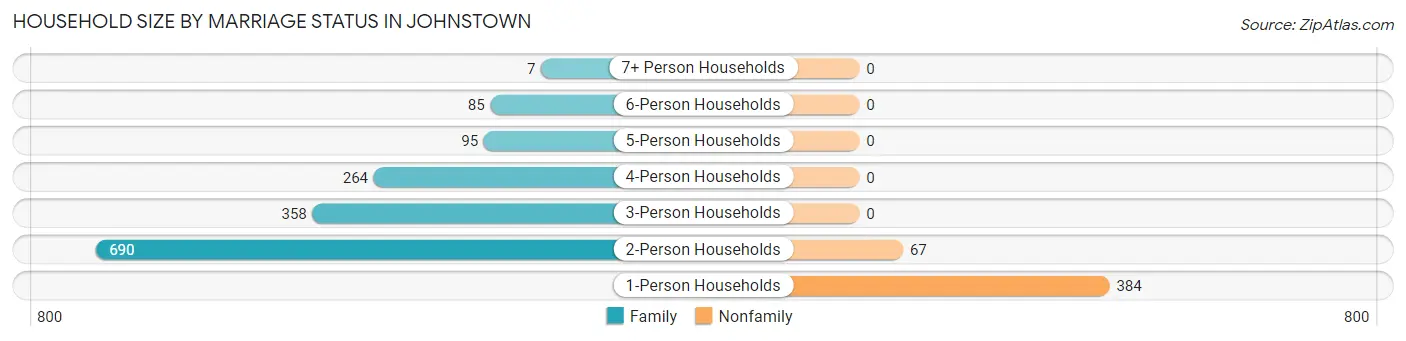
| Household Size | Family Households | Nonfamily Households |
| 1-Person Households | - | 384 (19.7%) |
| 2-Person Households | 690 (35.4%) | 67 (3.4%) |
| 3-Person Households | 358 (18.4%) | 0 (0.0%) |
| 4-Person Households | 264 (13.5%) | 0 (0.0%) |
| 5-Person Households | 95 (4.9%) | 0 (0.0%) |
| 6-Person Households | 85 (4.4%) | 0 (0.0%) |
| 7+ Person Households | 7 (0.4%) | 0 (0.0%) |
| Total | 1,499 (76.9%) | 451 (23.1%) |
Female Fertility in Johnstown
Fertility by Age in Johnstown
Average fertility rate in Johnstown is 92.0 births per 1,000 women. Women in the age bracket of 20 to 34 years have the highest fertility rate with 206.0 births per 1,000 women. Women in the age bracket of 20 to 34 years acount for 83.3% of all women with births.
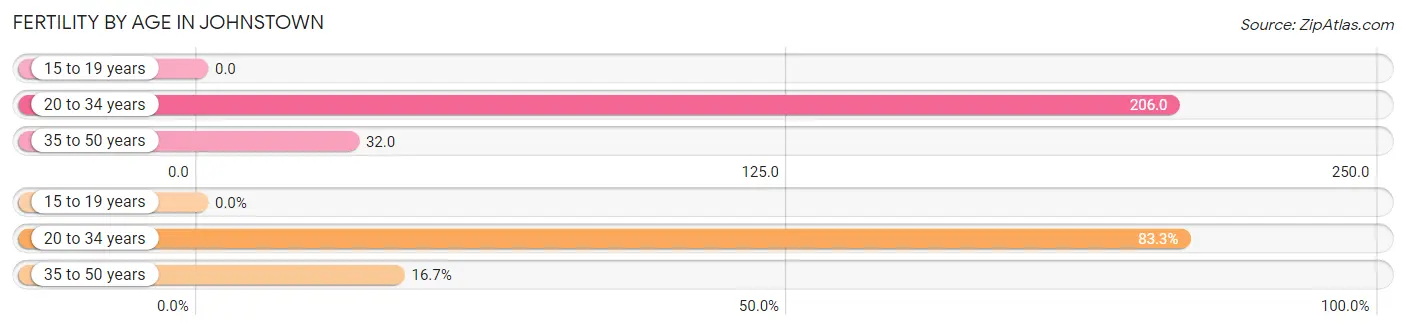
| Age Bracket | Women with Births | Births / 1,000 Women |
| 15 to 19 years | 0 (0.0%) | 0.0 |
| 20 to 34 years | 100 (83.3%) | 206.0 |
| 35 to 50 years | 20 (16.7%) | 32.0 |
| Total | 120 (100.0%) | 92.0 |
Fertility by Age by Marriage Status in Johnstown
48.3% of women with births (120) in Johnstown are married. The highest percentage of unmarried women with births falls into 20 to 34 years age bracket with 62.0% of them unmarried at the time of birth, while the lowest percentage of unmarried women with births belong to 35 to 50 years age bracket with 0.0% of them unmarried.
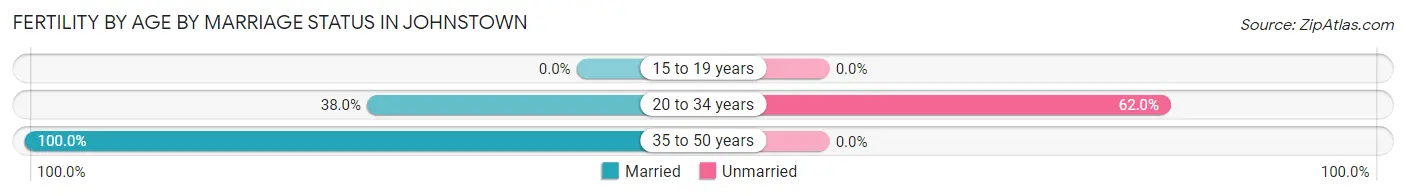
| Age Bracket | Married | Unmarried |
| 15 to 19 years | 0 (0.0%) | 0 (0.0%) |
| 20 to 34 years | 38 (38.0%) | 62 (62.0%) |
| 35 to 50 years | 20 (100.0%) | 0 (0.0%) |
| Total | 58 (48.3%) | 62 (51.7%) |
Fertility by Education in Johnstown

| Educational Attainment | Women with Births | Births / 1,000 Women |
| Less than High School | 0 (0.0%) | 0.0 |
| High School Diploma | 62 (51.7%) | 221.0 |
| College or Associate's Degree | 0 (0.0%) | 0.0 |
| Bachelor's Degree | 58 (48.3%) | 194.0 |
| Graduate Degree | 0 (0.0%) | 0.0 |
| Total | 120 (100.0%) | 92.0 |
Fertility by Education by Marriage Status in Johnstown
51.7% of women with births in Johnstown are unmarried. Women with the educational attainment of bachelor's degree are most likely to be married with 100.0% of them married at childbirth, while women with the educational attainment of high school diploma are least likely to be married with 100.0% of them unmarried at childbirth.
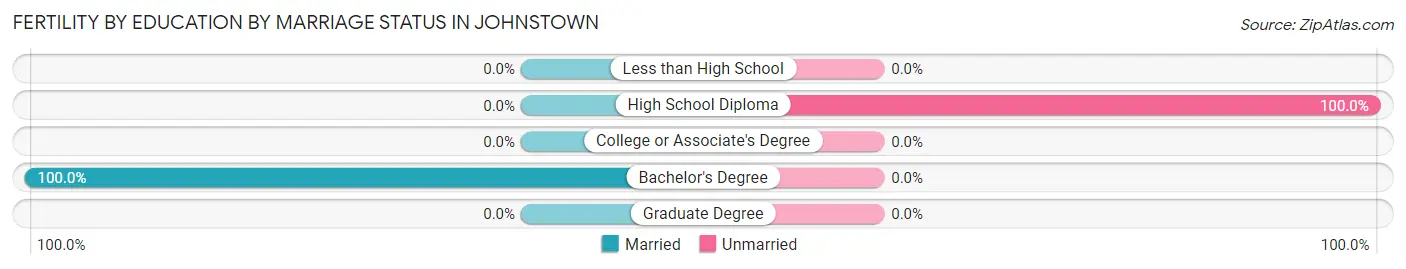
| Educational Attainment | Married | Unmarried |
| Less than High School | 0 (0.0%) | 0 (0.0%) |
| High School Diploma | 0 (0.0%) | 62 (100.0%) |
| College or Associate's Degree | 0 (0.0%) | 0 (0.0%) |
| Bachelor's Degree | 58 (100.0%) | 0 (0.0%) |
| Graduate Degree | 0 (0.0%) | 0 (0.0%) |
| Total | 58 (48.3%) | 62 (51.7%) |
Employment Characteristics in Johnstown
Employment by Class of Employer in Johnstown
Among the 2,719 employed individuals in Johnstown, private company employees (1,853 | 68.1%), local government employees (245 | 9.0%), and self-employed (incorporated) (212 | 7.8%) make up the most common classes of employment.
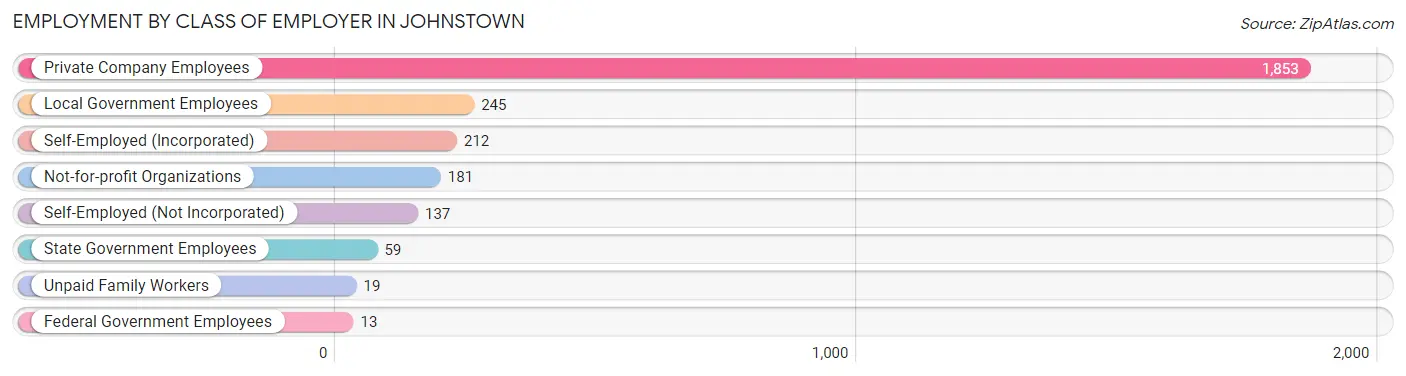
| Employer Class | # Employees | % Employees |
| Private Company Employees | 1,853 | 68.1% |
| Self-Employed (Incorporated) | 212 | 7.8% |
| Self-Employed (Not Incorporated) | 137 | 5.0% |
| Not-for-profit Organizations | 181 | 6.7% |
| Local Government Employees | 245 | 9.0% |
| State Government Employees | 59 | 2.2% |
| Federal Government Employees | 13 | 0.5% |
| Unpaid Family Workers | 19 | 0.7% |
| Total | 2,719 | 100.0% |
Employment Status by Age in Johnstown
According to the labor force statistics for Johnstown, out of the total population over 16 years of age (3,987), 72.2% or 2,879 individuals are in the labor force, with 1.5% or 43 of them unemployed. The age group with the highest labor force participation rate is 25 to 29 years, with 100.0% or 317 individuals in the labor force. Within the labor force, the 45 to 54 years age range has the highest percentage of unemployed individuals, with 6.5% or 27 of them being unemployed.
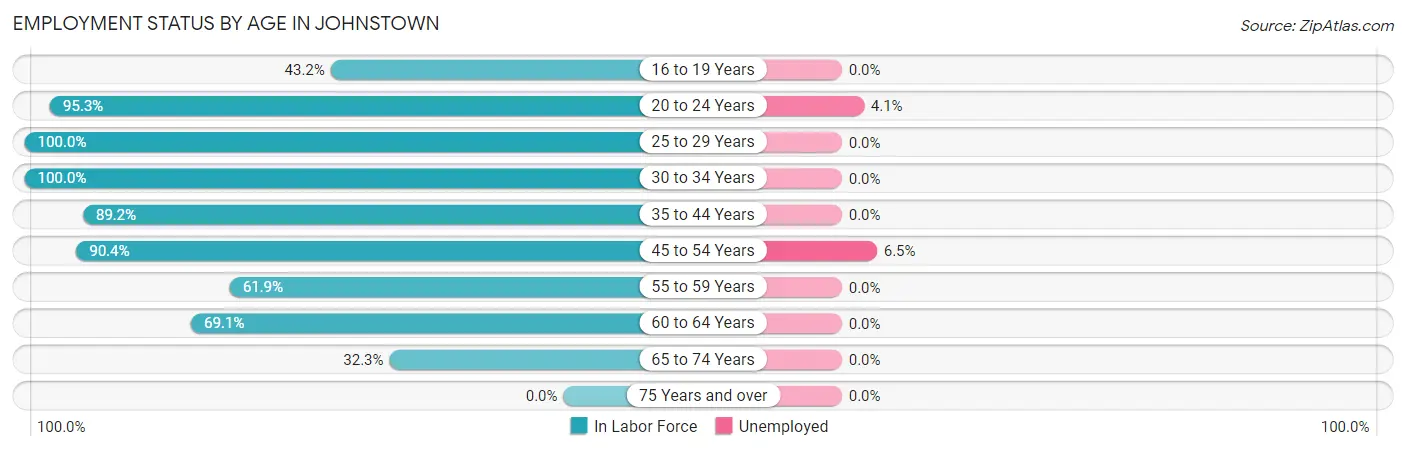
| Age Bracket | In Labor Force | Unemployed |
| 16 to 19 Years | 126 (43.2%) | 0 (0.0%) |
| 20 to 24 Years | 389 (95.3%) | 16 (4.1%) |
| 25 to 29 Years | 317 (100.0%) | 0 (0.0%) |
| 30 to 34 Years | 249 (100.0%) | 0 (0.0%) |
| 35 to 44 Years | 875 (89.2%) | 0 (0.0%) |
| 45 to 54 Years | 413 (90.4%) | 27 (6.5%) |
| 55 to 59 Years | 148 (61.9%) | 0 (0.0%) |
| 60 to 64 Years | 188 (69.1%) | 0 (0.0%) |
| 65 to 74 Years | 173 (32.3%) | 0 (0.0%) |
| 75 Years and over | 0 (0.0%) | 0 (0.0%) |
| Total | 2,879 (72.2%) | 43 (1.5%) |
Employment Status by Educational Attainment in Johnstown
According to labor force statistics for Johnstown, 87.1% of individuals (2,191) out of the total population between 25 and 64 years of age (2,515) are in the labor force, with 1.2% or 26 of them being unemployed. The group with the highest labor force participation rate are those with the educational attainment of college / associate degree, with 97.8% or 532 individuals in the labor force. Within the labor force, individuals with college / associate degree education have the highest percentage of unemployment, with 3.0% or 16 of them being unemployed.
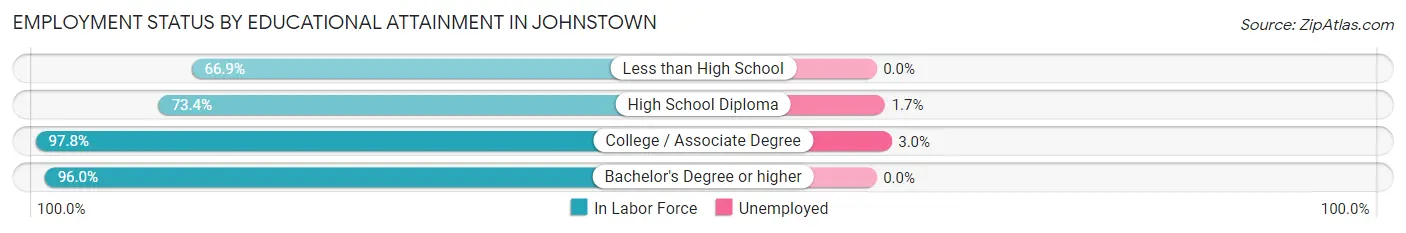
| Educational Attainment | In Labor Force | Unemployed |
| Less than High School | 79 (66.9%) | 0 (0.0%) |
| High School Diploma | 647 (73.4%) | 15 (1.7%) |
| College / Associate Degree | 532 (97.8%) | 16 (3.0%) |
| Bachelor's Degree or higher | 932 (96.0%) | 0 (0.0%) |
| Total | 2,191 (87.1%) | 30 (1.2%) |
Employment Occupations by Sex in Johnstown
Management, Business, Science and Arts Occupations
The most common Management, Business, Science and Arts occupations in Johnstown are Community & Social Service (271 | 9.6%), Management (247 | 8.7%), Health Diagnosing & Treating (234 | 8.3%), Business & Financial (233 | 8.2%), and Education Instruction & Library (124 | 4.4%).
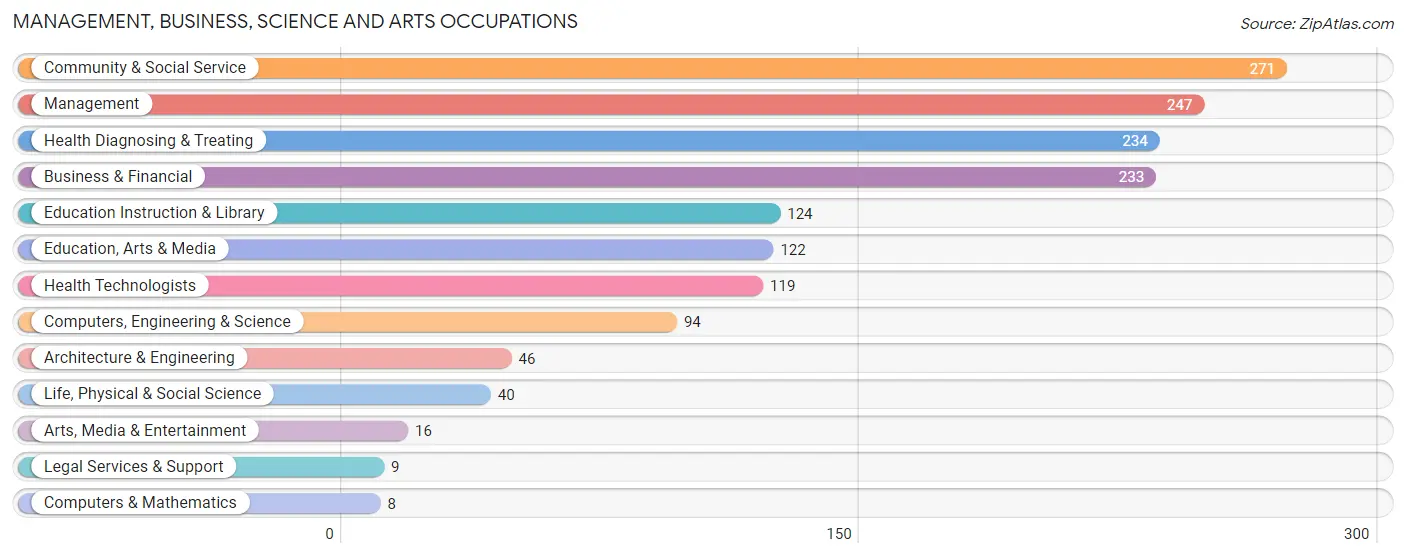
Management, Business, Science and Arts Occupations by Sex
Within the Management, Business, Science and Arts occupations in Johnstown, the most male-oriented occupations are Computers & Mathematics (100.0%), Management (78.9%), and Architecture & Engineering (76.1%), while the most female-oriented occupations are Education, Arts & Media (100.0%), Legal Services & Support (100.0%), and Arts, Media & Entertainment (100.0%).
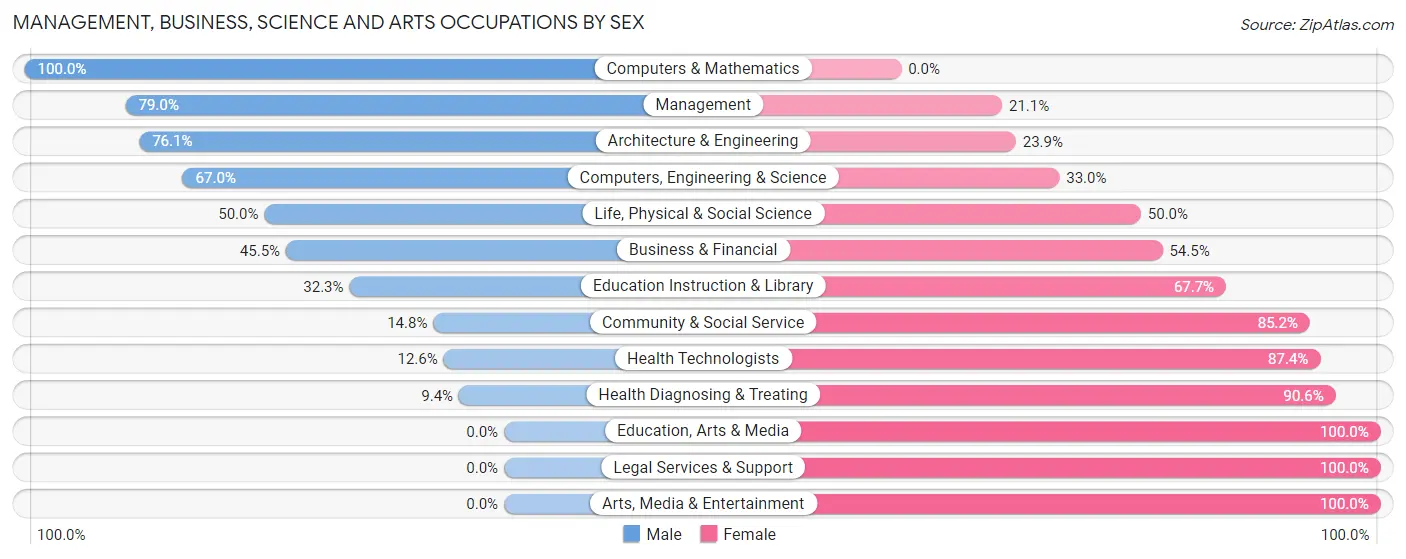
| Occupation | Male | Female |
| Management | 195 (78.9%) | 52 (21.0%) |
| Business & Financial | 106 (45.5%) | 127 (54.5%) |
| Computers, Engineering & Science | 63 (67.0%) | 31 (33.0%) |
| Computers & Mathematics | 8 (100.0%) | 0 (0.0%) |
| Architecture & Engineering | 35 (76.1%) | 11 (23.9%) |
| Life, Physical & Social Science | 20 (50.0%) | 20 (50.0%) |
| Community & Social Service | 40 (14.8%) | 231 (85.2%) |
| Education, Arts & Media | 0 (0.0%) | 122 (100.0%) |
| Legal Services & Support | 0 (0.0%) | 9 (100.0%) |
| Education Instruction & Library | 40 (32.3%) | 84 (67.7%) |
| Arts, Media & Entertainment | 0 (0.0%) | 16 (100.0%) |
| Health Diagnosing & Treating | 22 (9.4%) | 212 (90.6%) |
| Health Technologists | 15 (12.6%) | 104 (87.4%) |
| Total (Category) | 426 (39.5%) | 653 (60.5%) |
| Total (Overall) | 1,509 (53.2%) | 1,326 (46.8%) |
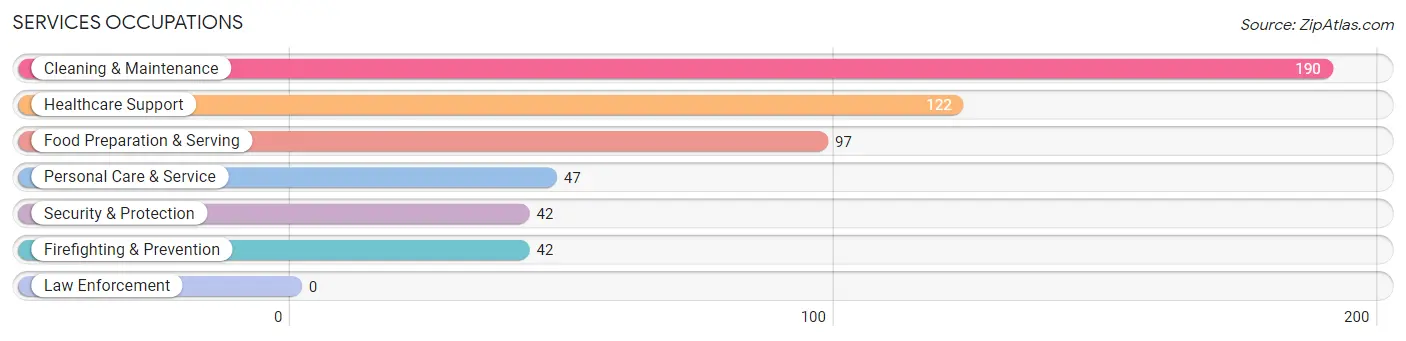
Services Occupations
The most common Services occupations in Johnstown are Cleaning & Maintenance (190 | 6.7%), Healthcare Support (122 | 4.3%), Food Preparation & Serving (97 | 3.4%), Personal Care & Service (47 | 1.7%), and Security & Protection (42 | 1.5%).
Services Occupations by Sex
Within the Services occupations in Johnstown, the most male-oriented occupations are Security & Protection (100.0%), Firefighting & Prevention (100.0%), and Cleaning & Maintenance (100.0%), while the most female-oriented occupations are Personal Care & Service (100.0%), Healthcare Support (82.8%), and Food Preparation & Serving (67.0%).
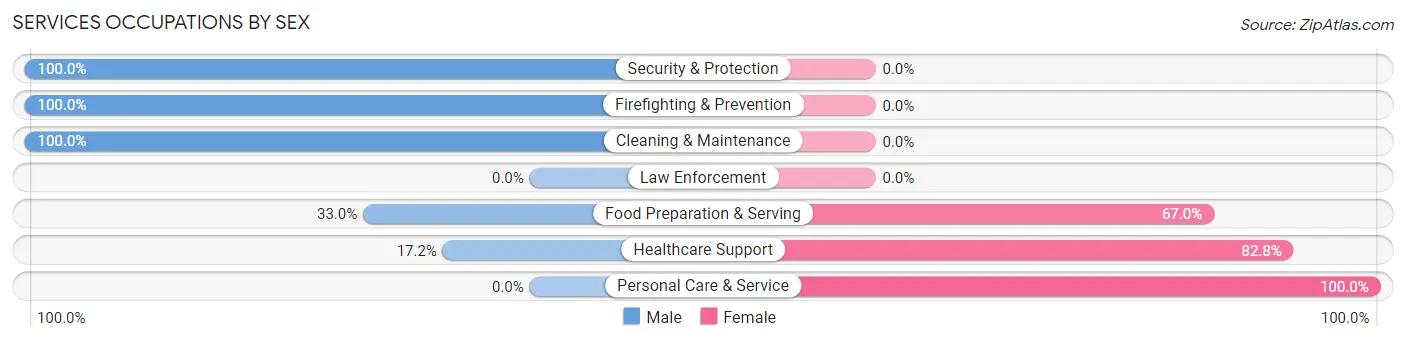
| Occupation | Male | Female |
| Healthcare Support | 21 (17.2%) | 101 (82.8%) |
| Security & Protection | 42 (100.0%) | 0 (0.0%) |
| Firefighting & Prevention | 42 (100.0%) | 0 (0.0%) |
| Law Enforcement | 0 (0.0%) | 0 (0.0%) |
| Food Preparation & Serving | 32 (33.0%) | 65 (67.0%) |
| Cleaning & Maintenance | 190 (100.0%) | 0 (0.0%) |
| Personal Care & Service | 0 (0.0%) | 47 (100.0%) |
| Total (Category) | 285 (57.2%) | 213 (42.8%) |
| Total (Overall) | 1,509 (53.2%) | 1,326 (46.8%) |
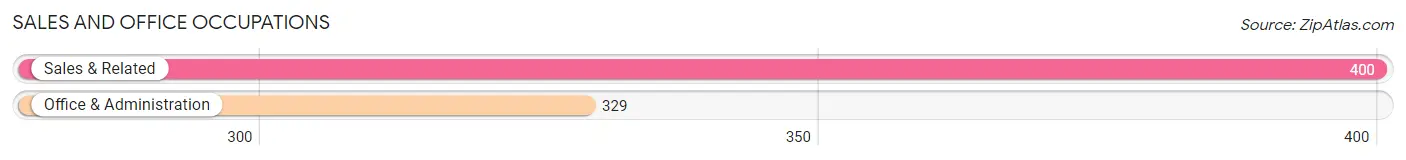
Sales and Office Occupations
The most common Sales and Office occupations in Johnstown are Sales & Related (400 | 14.1%), and Office & Administration (329 | 11.6%).
Sales and Office Occupations by Sex
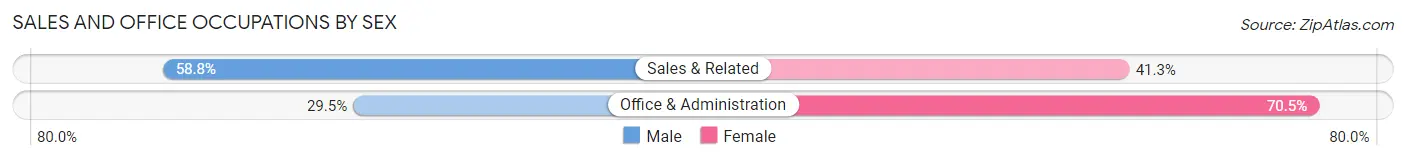
| Occupation | Male | Female |
| Sales & Related | 235 (58.8%) | 165 (41.2%) |
| Office & Administration | 97 (29.5%) | 232 (70.5%) |
| Total (Category) | 332 (45.5%) | 397 (54.5%) |
| Total (Overall) | 1,509 (53.2%) | 1,326 (46.8%) |
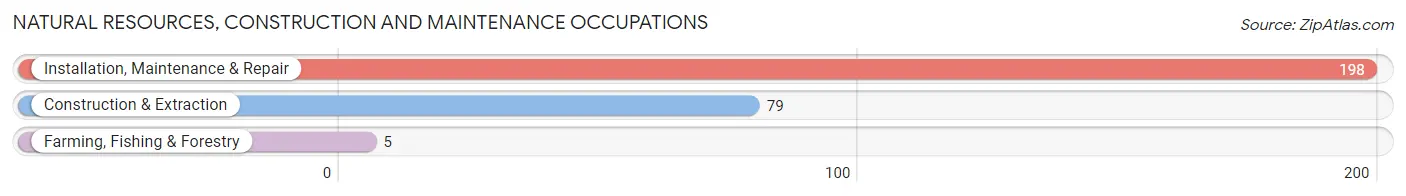
Natural Resources, Construction and Maintenance Occupations
The most common Natural Resources, Construction and Maintenance occupations in Johnstown are Installation, Maintenance & Repair (198 | 7.0%), Construction & Extraction (79 | 2.8%), and Farming, Fishing & Forestry (5 | 0.2%).
Natural Resources, Construction and Maintenance Occupations by Sex
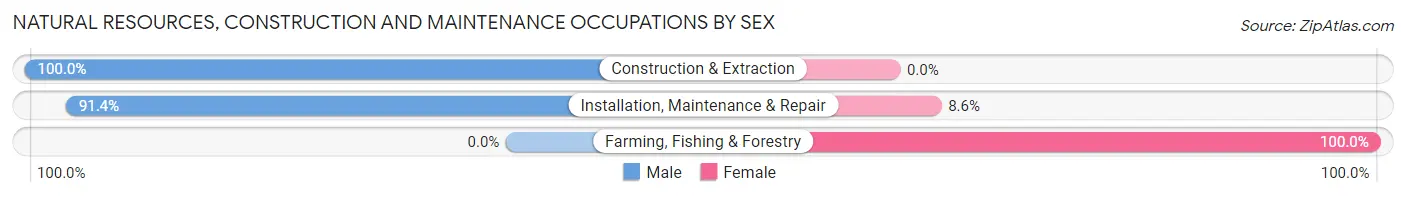
| Occupation | Male | Female |
| Farming, Fishing & Forestry | 0 (0.0%) | 5 (100.0%) |
| Construction & Extraction | 79 (100.0%) | 0 (0.0%) |
| Installation, Maintenance & Repair | 181 (91.4%) | 17 (8.6%) |
| Total (Category) | 260 (92.2%) | 22 (7.8%) |
| Total (Overall) | 1,509 (53.2%) | 1,326 (46.8%) |
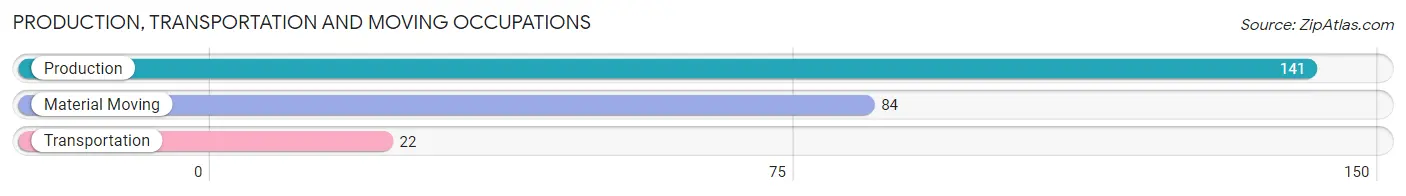
Production, Transportation and Moving Occupations
The most common Production, Transportation and Moving occupations in Johnstown are Production (141 | 5.0%), Material Moving (84 | 3.0%), and Transportation (22 | 0.8%).
Production, Transportation and Moving Occupations by Sex
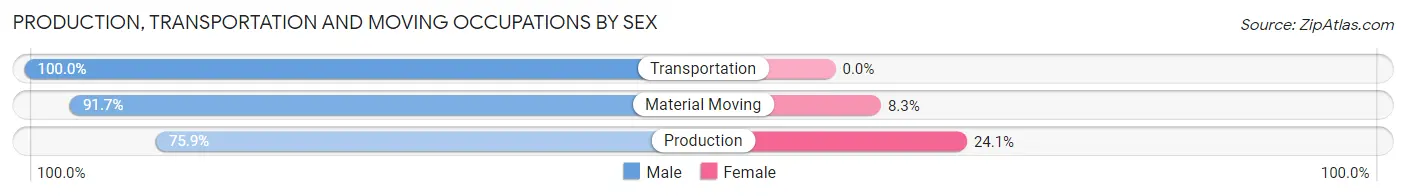
| Occupation | Male | Female |
| Production | 107 (75.9%) | 34 (24.1%) |
| Transportation | 22 (100.0%) | 0 (0.0%) |
| Material Moving | 77 (91.7%) | 7 (8.3%) |
| Total (Category) | 206 (83.4%) | 41 (16.6%) |
| Total (Overall) | 1,509 (53.2%) | 1,326 (46.8%) |
Employment Industries by Sex in Johnstown
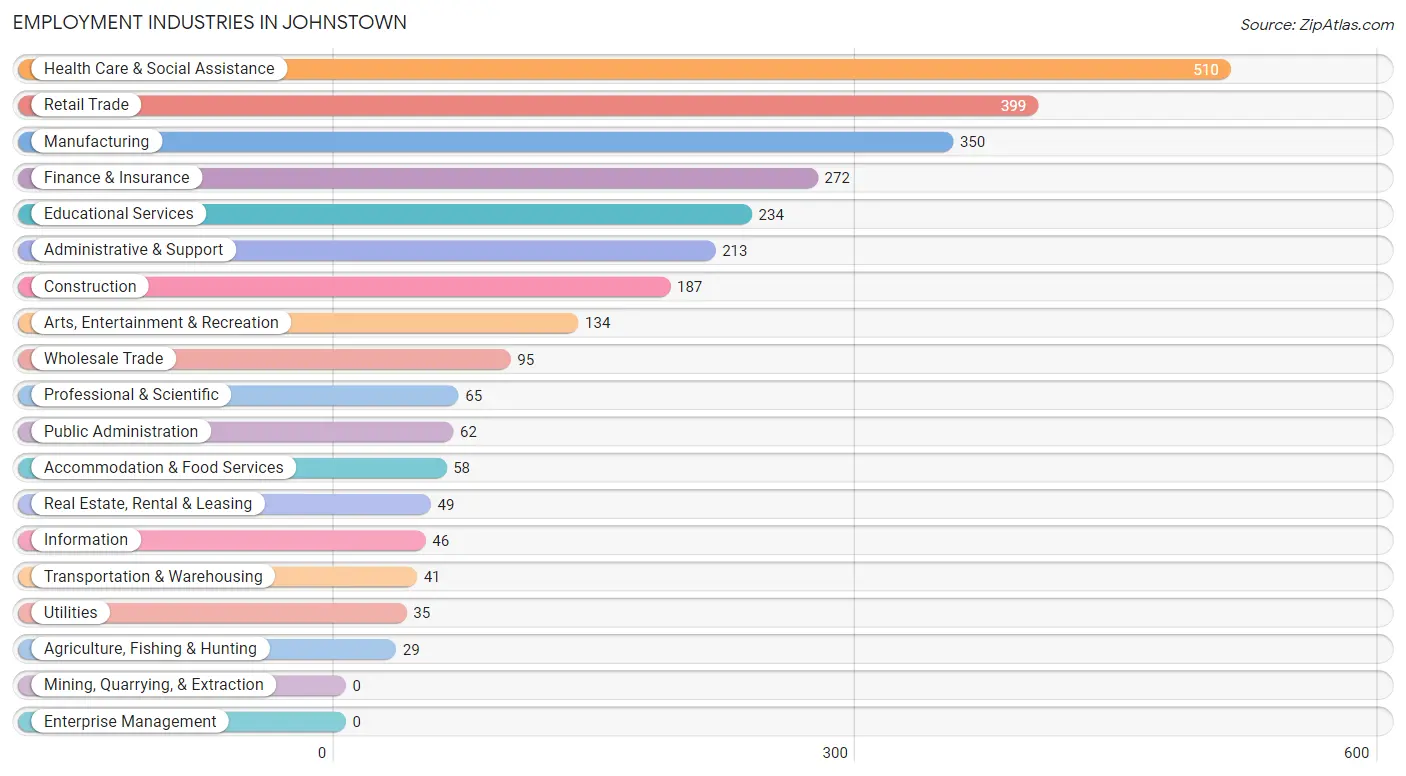
Employment Industries in Johnstown
The major employment industries in Johnstown include Health Care & Social Assistance (510 | 18.0%), Retail Trade (399 | 14.1%), Manufacturing (350 | 12.3%), Finance & Insurance (272 | 9.6%), and Educational Services (234 | 8.3%).
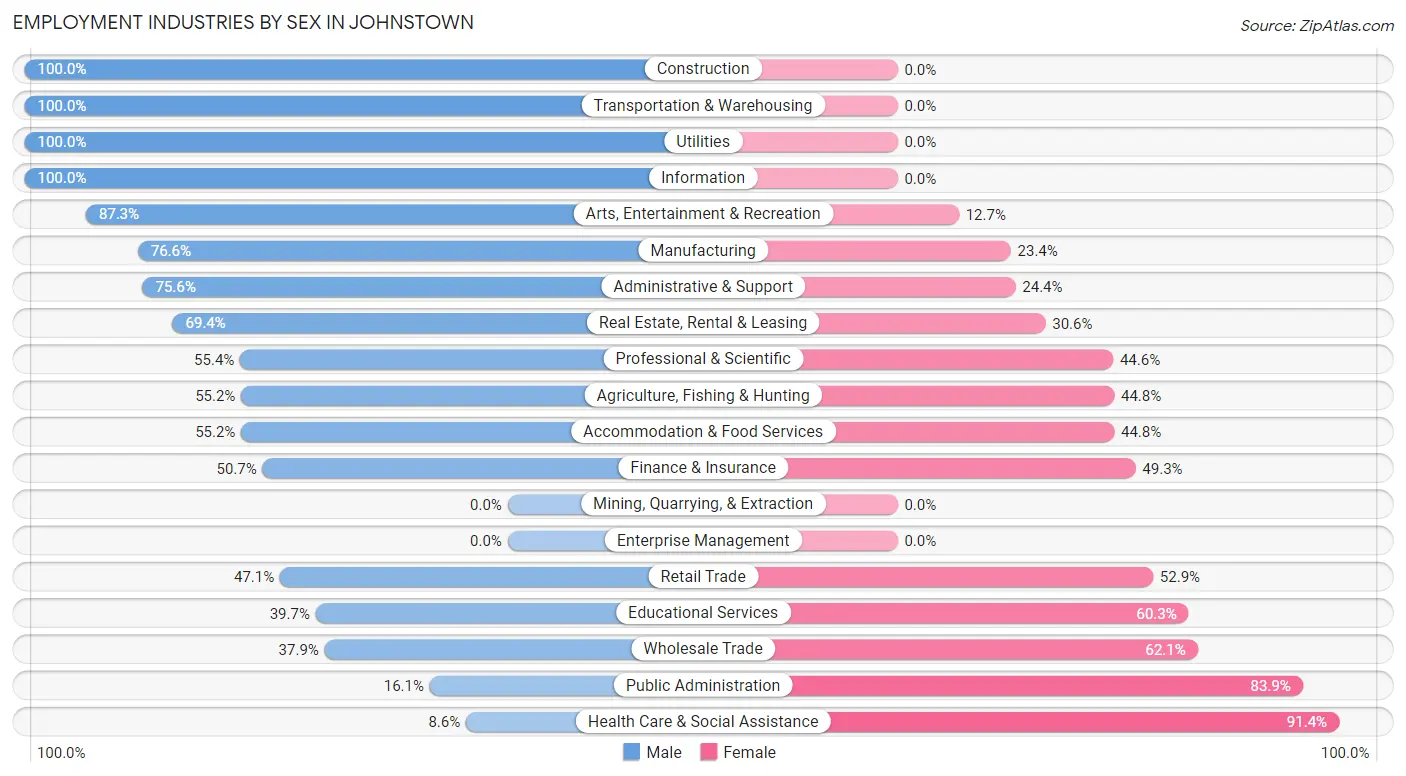
Employment Industries by Sex in Johnstown
The Johnstown industries that see more men than women are Construction (100.0%), Transportation & Warehousing (100.0%), and Utilities (100.0%), whereas the industries that tend to have a higher number of women are Health Care & Social Assistance (91.4%), Public Administration (83.9%), and Wholesale Trade (62.1%).
| Industry | Male | Female |
| Agriculture, Fishing & Hunting | 16 (55.2%) | 13 (44.8%) |
| Mining, Quarrying, & Extraction | 0 (0.0%) | 0 (0.0%) |
| Construction | 187 (100.0%) | 0 (0.0%) |
| Manufacturing | 268 (76.6%) | 82 (23.4%) |
| Wholesale Trade | 36 (37.9%) | 59 (62.1%) |
| Retail Trade | 188 (47.1%) | 211 (52.9%) |
| Transportation & Warehousing | 41 (100.0%) | 0 (0.0%) |
| Utilities | 35 (100.0%) | 0 (0.0%) |
| Information | 46 (100.0%) | 0 (0.0%) |
| Finance & Insurance | 138 (50.7%) | 134 (49.3%) |
| Real Estate, Rental & Leasing | 34 (69.4%) | 15 (30.6%) |
| Professional & Scientific | 36 (55.4%) | 29 (44.6%) |
| Enterprise Management | 0 (0.0%) | 0 (0.0%) |
| Administrative & Support | 161 (75.6%) | 52 (24.4%) |
| Educational Services | 93 (39.7%) | 141 (60.3%) |
| Health Care & Social Assistance | 44 (8.6%) | 466 (91.4%) |
| Arts, Entertainment & Recreation | 117 (87.3%) | 17 (12.7%) |
| Accommodation & Food Services | 32 (55.2%) | 26 (44.8%) |
| Public Administration | 10 (16.1%) | 52 (83.9%) |
| Total | 1,509 (53.2%) | 1,326 (46.8%) |
Education in Johnstown
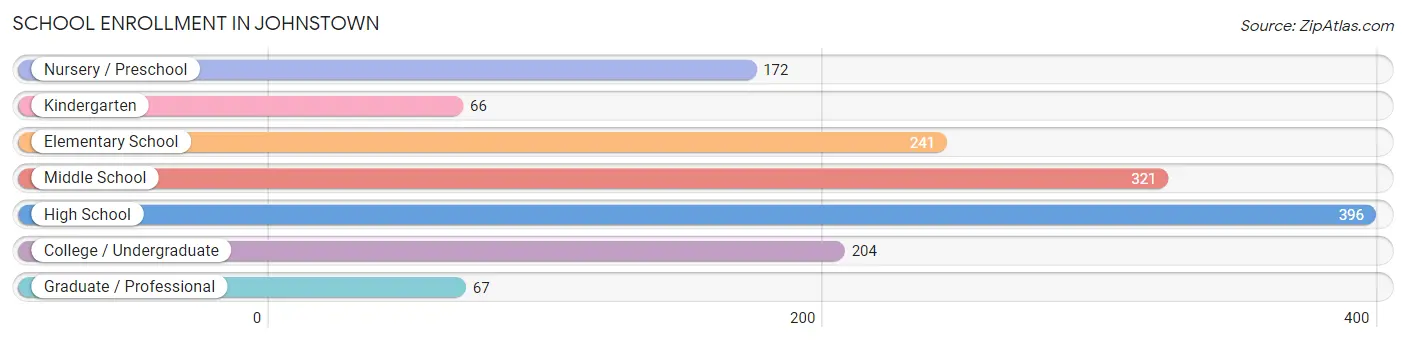
School Enrollment in Johnstown
The most common levels of schooling among the 1,467 students in Johnstown are high school (396 | 27.0%), middle school (321 | 21.9%), and elementary school (241 | 16.4%).
| School Level | # Students | % Students |
| Nursery / Preschool | 172 | 11.7% |
| Kindergarten | 66 | 4.5% |
| Elementary School | 241 | 16.4% |
| Middle School | 321 | 21.9% |
| High School | 396 | 27.0% |
| College / Undergraduate | 204 | 13.9% |
| Graduate / Professional | 67 | 4.6% |
| Total | 1,467 | 100.0% |
School Enrollment by Age by Funding Source in Johnstown
Out of a total of 1,467 students who are enrolled in schools in Johnstown, 163 (11.1%) attend a private institution, while the remaining 1,304 (88.9%) are enrolled in public schools. The age group of 25 to 34 year olds has the highest likelihood of being enrolled in private schools, with 14 (20.9% in the age bracket) enrolled. Conversely, the age group of 20 to 24 year olds has the lowest likelihood of being enrolled in a private school, with 147 (100.0% in the age bracket) attending a public institution.
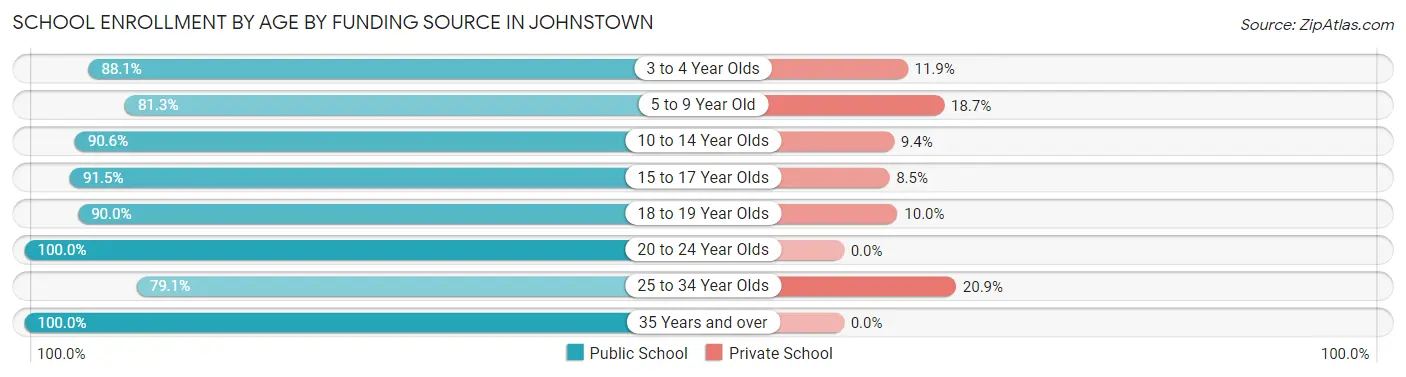
| Age Bracket | Public School | Private School |
| 3 to 4 Year Olds | 111 (88.1%) | 15 (11.9%) |
| 5 to 9 Year Old | 287 (81.3%) | 66 (18.7%) |
| 10 to 14 Year Olds | 339 (90.6%) | 35 (9.4%) |
| 15 to 17 Year Olds | 259 (91.5%) | 24 (8.5%) |
| 18 to 19 Year Olds | 81 (90.0%) | 9 (10.0%) |
| 20 to 24 Year Olds | 147 (100.0%) | 0 (0.0%) |
| 25 to 34 Year Olds | 53 (79.1%) | 14 (20.9%) |
| 35 Years and over | 27 (100.0%) | 0 (0.0%) |
| Total | 1,304 (88.9%) | 163 (11.1%) |
Educational Attainment by Field of Study in Johnstown
Business (457 | 38.6%), education (130 | 11.0%), science & technology (129 | 10.9%), social sciences (83 | 7.0%), and arts & humanities (67 | 5.7%) are the most common fields of study among 1,185 individuals in Johnstown who have obtained a bachelor's degree or higher.
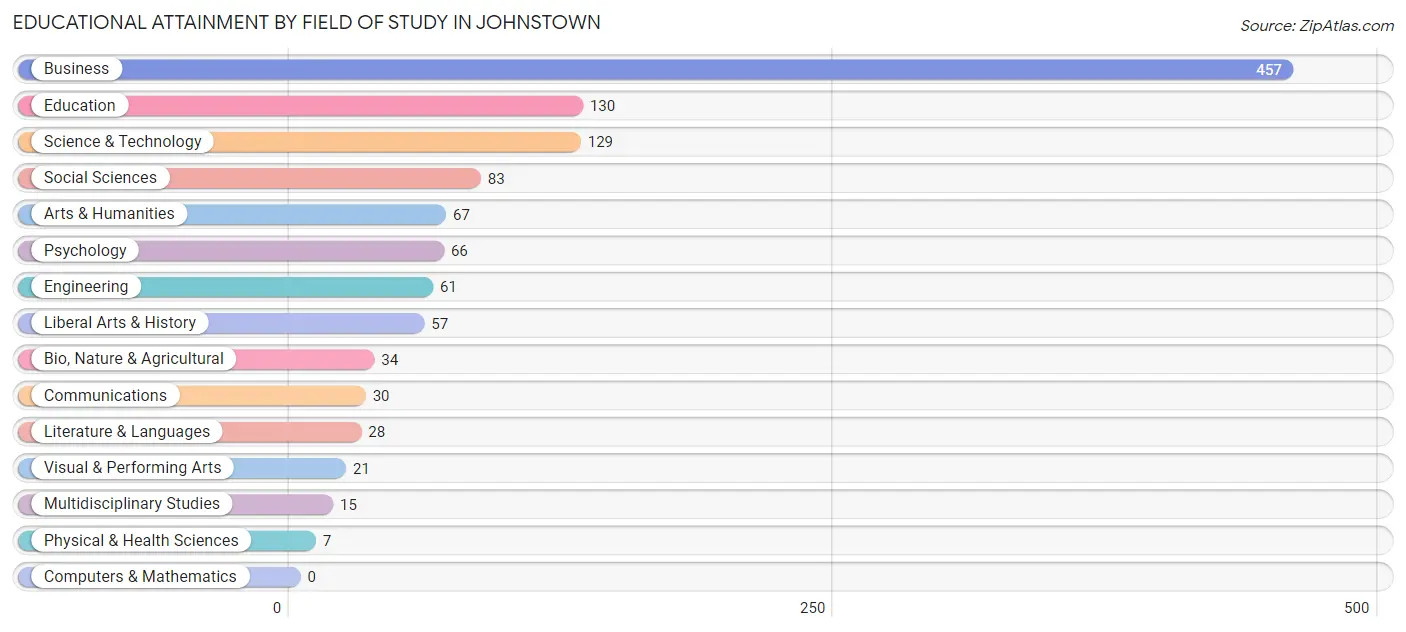
| Field of Study | # Graduates | % Graduates |
| Computers & Mathematics | 0 | 0.0% |
| Bio, Nature & Agricultural | 34 | 2.9% |
| Physical & Health Sciences | 7 | 0.6% |
| Psychology | 66 | 5.6% |
| Social Sciences | 83 | 7.0% |
| Engineering | 61 | 5.1% |
| Multidisciplinary Studies | 15 | 1.3% |
| Science & Technology | 129 | 10.9% |
| Business | 457 | 38.6% |
| Education | 130 | 11.0% |
| Literature & Languages | 28 | 2.4% |
| Liberal Arts & History | 57 | 4.8% |
| Visual & Performing Arts | 21 | 1.8% |
| Communications | 30 | 2.5% |
| Arts & Humanities | 67 | 5.7% |
| Total | 1,185 | 100.0% |
Transportation & Commute in Johnstown
Vehicle Availability by Sex in Johnstown
The most prevalent vehicle ownership categories in Johnstown are males with 2 vehicles (765, accounting for 54.6%) and females with 2 vehicles (718, making up 58.1%).
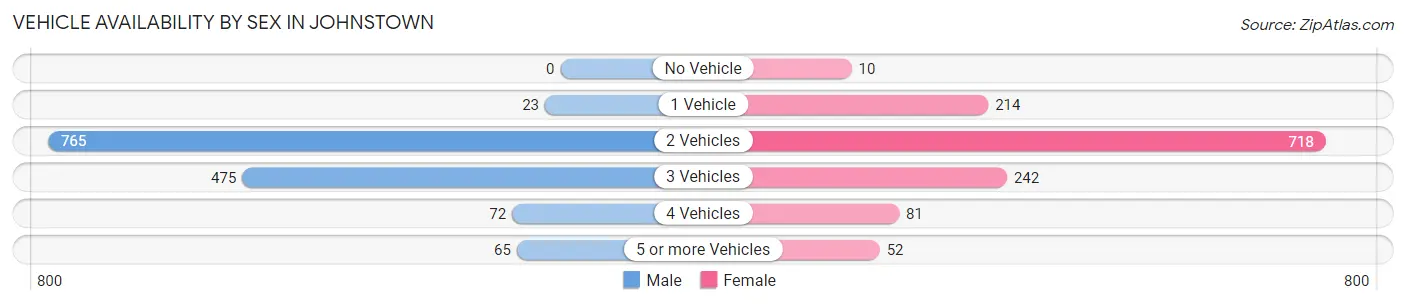
| Vehicles Available | Male | Female |
| No Vehicle | 0 (0.0%) | 10 (0.8%) |
| 1 Vehicle | 23 (1.6%) | 214 (16.3%) |
| 2 Vehicles | 765 (54.6%) | 718 (54.5%) |
| 3 Vehicles | 475 (33.9%) | 242 (18.4%) |
| 4 Vehicles | 72 (5.1%) | 81 (6.1%) |
| 5 or more Vehicles | 65 (4.6%) | 52 (4.0%) |
| Total | 1,400 (100.0%) | 1,317 (100.0%) |
Commute Time in Johnstown
The most frequently occuring commute durations in Johnstown are 30 to 34 minutes (478 commuters, 20.5%), 20 to 24 minutes (395 commuters, 17.0%), and 15 to 19 minutes (235 commuters, 10.1%).
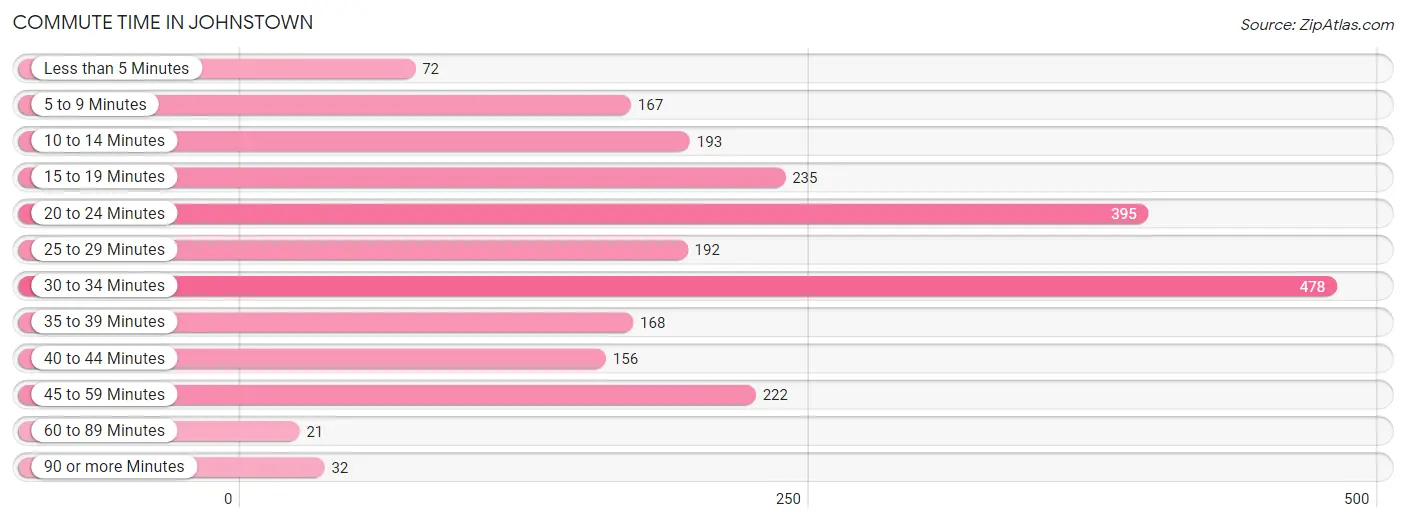
| Commute Time | # Commuters | % Commuters |
| Less than 5 Minutes | 72 | 3.1% |
| 5 to 9 Minutes | 167 | 7.2% |
| 10 to 14 Minutes | 193 | 8.3% |
| 15 to 19 Minutes | 235 | 10.1% |
| 20 to 24 Minutes | 395 | 17.0% |
| 25 to 29 Minutes | 192 | 8.2% |
| 30 to 34 Minutes | 478 | 20.5% |
| 35 to 39 Minutes | 168 | 7.2% |
| 40 to 44 Minutes | 156 | 6.7% |
| 45 to 59 Minutes | 222 | 9.5% |
| 60 to 89 Minutes | 21 | 0.9% |
| 90 or more Minutes | 32 | 1.4% |
Commute Time by Sex in Johnstown
The most common commute times in Johnstown are 30 to 34 minutes (289 commuters, 22.7%) for males and 20 to 24 minutes (276 commuters, 26.1%) for females.
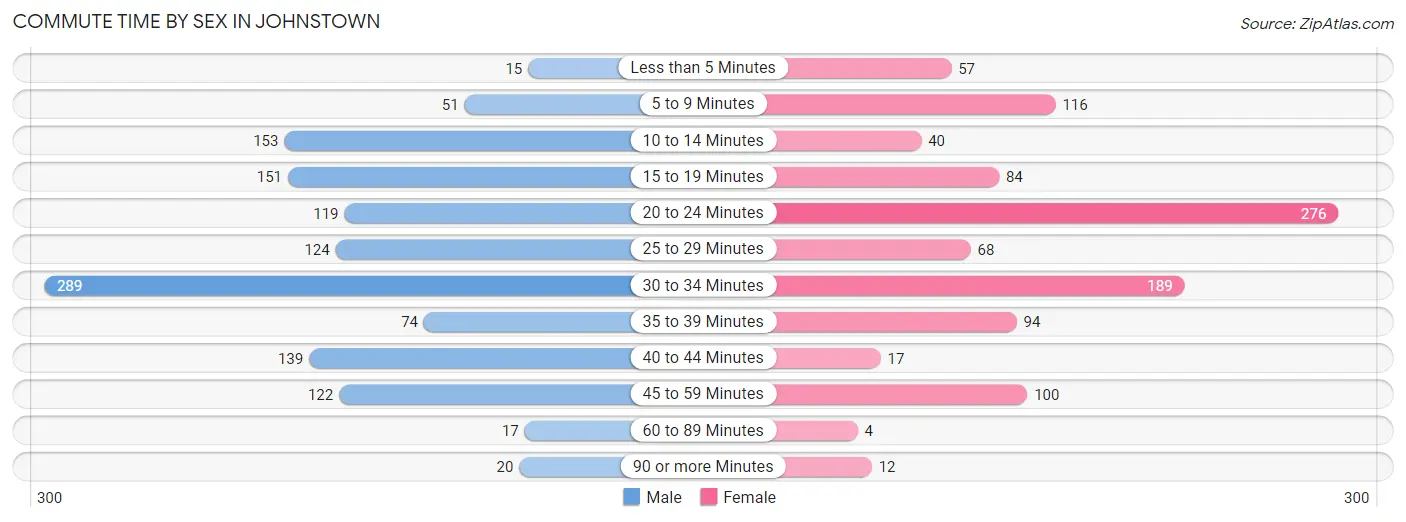
| Commute Time | Male | Female |
| Less than 5 Minutes | 15 (1.2%) | 57 (5.4%) |
| 5 to 9 Minutes | 51 (4.0%) | 116 (11.0%) |
| 10 to 14 Minutes | 153 (12.0%) | 40 (3.8%) |
| 15 to 19 Minutes | 151 (11.8%) | 84 (8.0%) |
| 20 to 24 Minutes | 119 (9.3%) | 276 (26.1%) |
| 25 to 29 Minutes | 124 (9.7%) | 68 (6.4%) |
| 30 to 34 Minutes | 289 (22.7%) | 189 (17.9%) |
| 35 to 39 Minutes | 74 (5.8%) | 94 (8.9%) |
| 40 to 44 Minutes | 139 (10.9%) | 17 (1.6%) |
| 45 to 59 Minutes | 122 (9.6%) | 100 (9.5%) |
| 60 to 89 Minutes | 17 (1.3%) | 4 (0.4%) |
| 90 or more Minutes | 20 (1.6%) | 12 (1.1%) |
Time of Departure to Work by Sex in Johnstown
The most frequent times of departure to work in Johnstown are 8:00 AM to 8:29 AM (163, 12.8%) for males and 6:30 AM to 6:59 AM (222, 21.0%) for females.
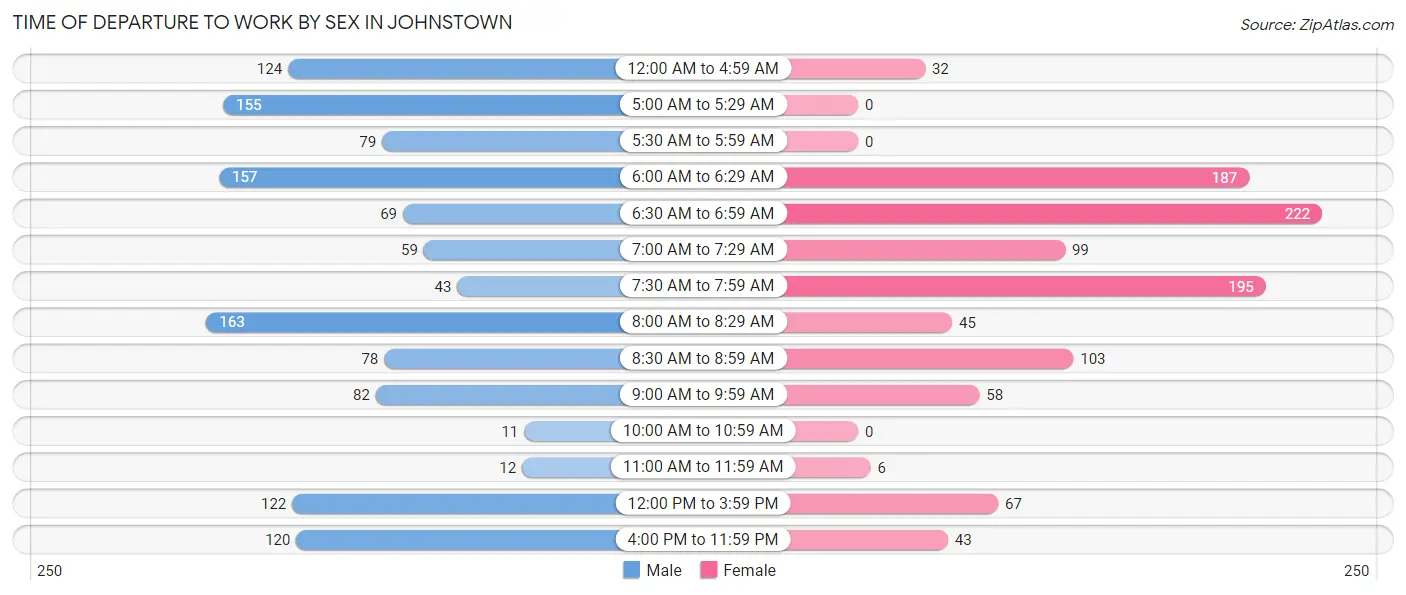
| Time of Departure | Male | Female |
| 12:00 AM to 4:59 AM | 124 (9.7%) | 32 (3.0%) |
| 5:00 AM to 5:29 AM | 155 (12.2%) | 0 (0.0%) |
| 5:30 AM to 5:59 AM | 79 (6.2%) | 0 (0.0%) |
| 6:00 AM to 6:29 AM | 157 (12.3%) | 187 (17.7%) |
| 6:30 AM to 6:59 AM | 69 (5.4%) | 222 (21.0%) |
| 7:00 AM to 7:29 AM | 59 (4.6%) | 99 (9.4%) |
| 7:30 AM to 7:59 AM | 43 (3.4%) | 195 (18.4%) |
| 8:00 AM to 8:29 AM | 163 (12.8%) | 45 (4.3%) |
| 8:30 AM to 8:59 AM | 78 (6.1%) | 103 (9.7%) |
| 9:00 AM to 9:59 AM | 82 (6.4%) | 58 (5.5%) |
| 10:00 AM to 10:59 AM | 11 (0.9%) | 0 (0.0%) |
| 11:00 AM to 11:59 AM | 12 (0.9%) | 6 (0.6%) |
| 12:00 PM to 3:59 PM | 122 (9.6%) | 67 (6.3%) |
| 4:00 PM to 11:59 PM | 120 (9.4%) | 43 (4.1%) |
| Total | 1,274 (100.0%) | 1,057 (100.0%) |
Housing Occupancy in Johnstown
Occupancy by Ownership in Johnstown
Of the total 1,950 dwellings in Johnstown, owner-occupied units account for 1,163 (59.6%), while renter-occupied units make up 787 (40.4%).
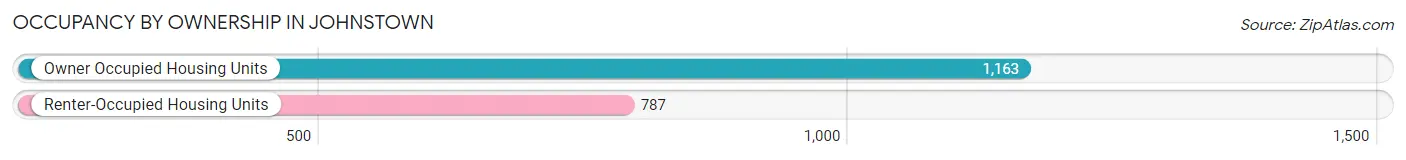
| Occupancy | # Housing Units | % Housing Units |
| Owner Occupied Housing Units | 1,163 | 59.6% |
| Renter-Occupied Housing Units | 787 | 40.4% |
| Total Occupied Housing Units | 1,950 | 100.0% |
Occupancy by Household Size in Johnstown
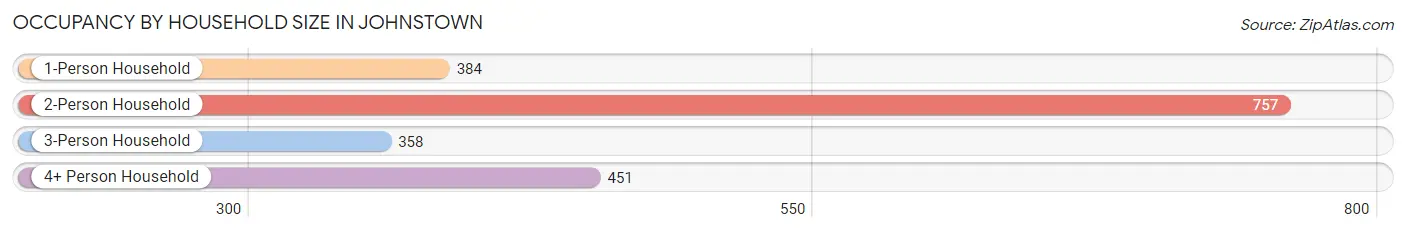
| Household Size | # Housing Units | % Housing Units |
| 1-Person Household | 384 | 19.7% |
| 2-Person Household | 757 | 38.8% |
| 3-Person Household | 358 | 18.4% |
| 4+ Person Household | 451 | 23.1% |
| Total Housing Units | 1,950 | 100.0% |
Occupancy by Ownership by Household Size in Johnstown
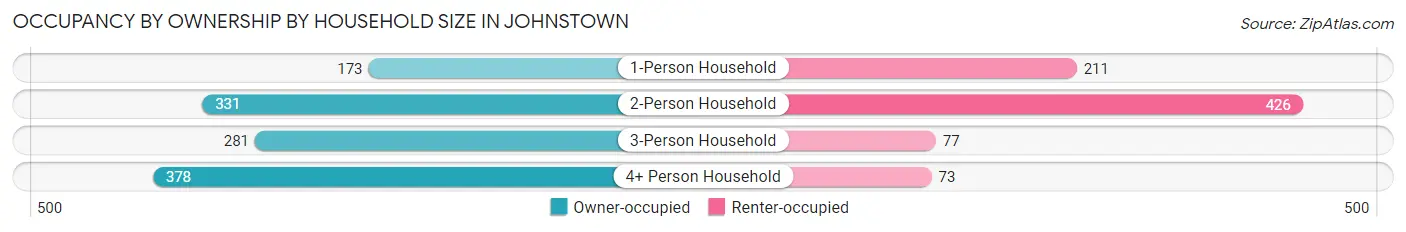
| Household Size | Owner-occupied | Renter-occupied |
| 1-Person Household | 173 (45.1%) | 211 (54.9%) |
| 2-Person Household | 331 (43.7%) | 426 (56.3%) |
| 3-Person Household | 281 (78.5%) | 77 (21.5%) |
| 4+ Person Household | 378 (83.8%) | 73 (16.2%) |
| Total Housing Units | 1,163 (59.6%) | 787 (40.4%) |
Occupancy by Educational Attainment in Johnstown
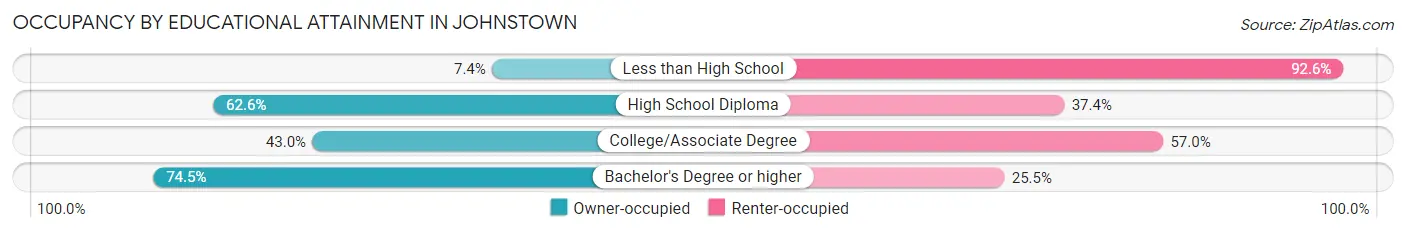
| Household Size | Owner-occupied | Renter-occupied |
| Less than High School | 4 (7.4%) | 50 (92.6%) |
| High School Diploma | 442 (62.6%) | 264 (37.4%) |
| College/Associate Degree | 232 (43.0%) | 307 (57.0%) |
| Bachelor's Degree or higher | 485 (74.5%) | 166 (25.5%) |
Occupancy by Age of Householder in Johnstown
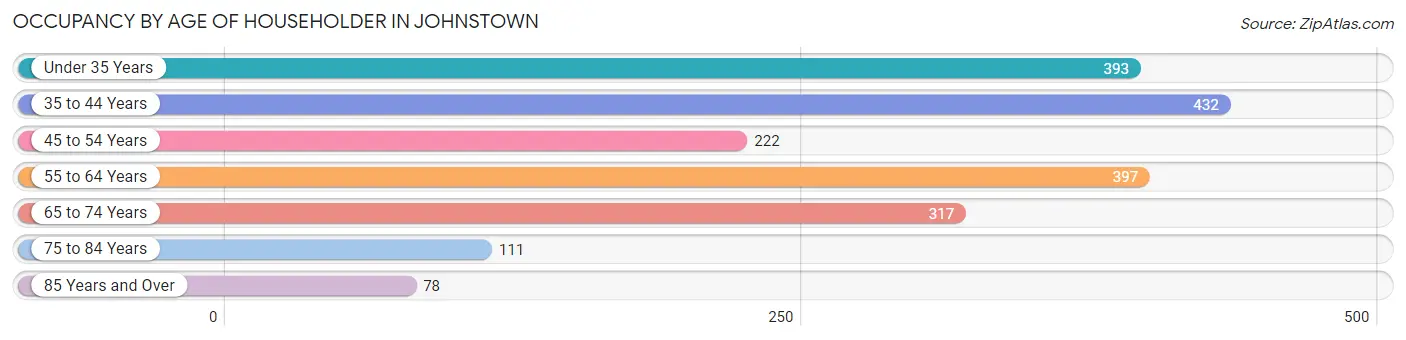
| Age Bracket | # Households | % Households |
| Under 35 Years | 393 | 20.2% |
| 35 to 44 Years | 432 | 22.2% |
| 45 to 54 Years | 222 | 11.4% |
| 55 to 64 Years | 397 | 20.4% |
| 65 to 74 Years | 317 | 16.3% |
| 75 to 84 Years | 111 | 5.7% |
| 85 Years and Over | 78 | 4.0% |
| Total | 1,950 | 100.0% |
Housing Finances in Johnstown
Median Income by Occupancy in Johnstown
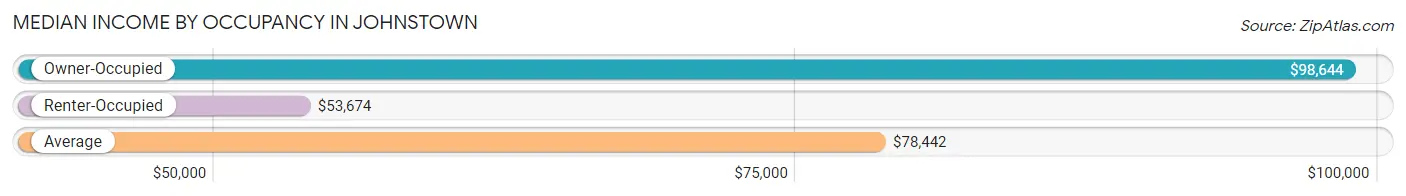
| Occupancy Type | # Households | Median Income |
| Owner-Occupied | 1,163 (59.6%) | $98,644 |
| Renter-Occupied | 787 (40.4%) | $53,674 |
| Average | 1,950 (100.0%) | $78,442 |
Occupancy by Householder Income Bracket in Johnstown
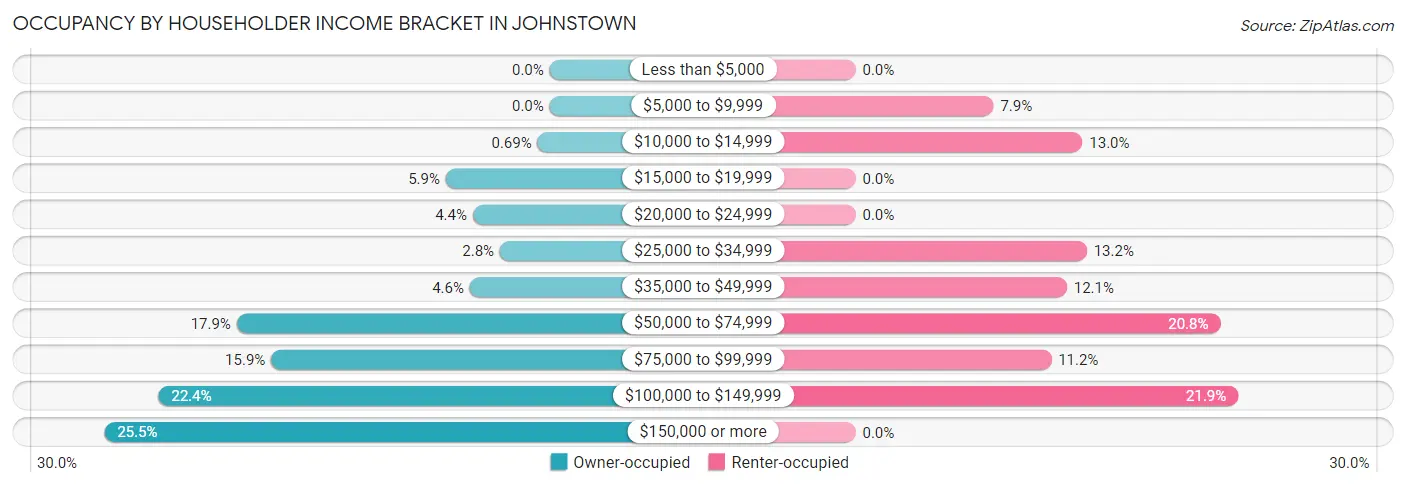
| Income Bracket | Owner-occupied | Renter-occupied |
| Less than $5,000 | 0 (0.0%) | 0 (0.0%) |
| $5,000 to $9,999 | 0 (0.0%) | 62 (7.9%) |
| $10,000 to $14,999 | 8 (0.7%) | 102 (13.0%) |
| $15,000 to $19,999 | 69 (5.9%) | 0 (0.0%) |
| $20,000 to $24,999 | 51 (4.4%) | 0 (0.0%) |
| $25,000 to $34,999 | 33 (2.8%) | 104 (13.2%) |
| $35,000 to $49,999 | 53 (4.6%) | 95 (12.1%) |
| $50,000 to $74,999 | 208 (17.9%) | 164 (20.8%) |
| $75,000 to $99,999 | 185 (15.9%) | 88 (11.2%) |
| $100,000 to $149,999 | 260 (22.4%) | 172 (21.9%) |
| $150,000 or more | 296 (25.5%) | 0 (0.0%) |
| Total | 1,163 (100.0%) | 787 (100.0%) |
Monthly Housing Cost Tiers in Johnstown
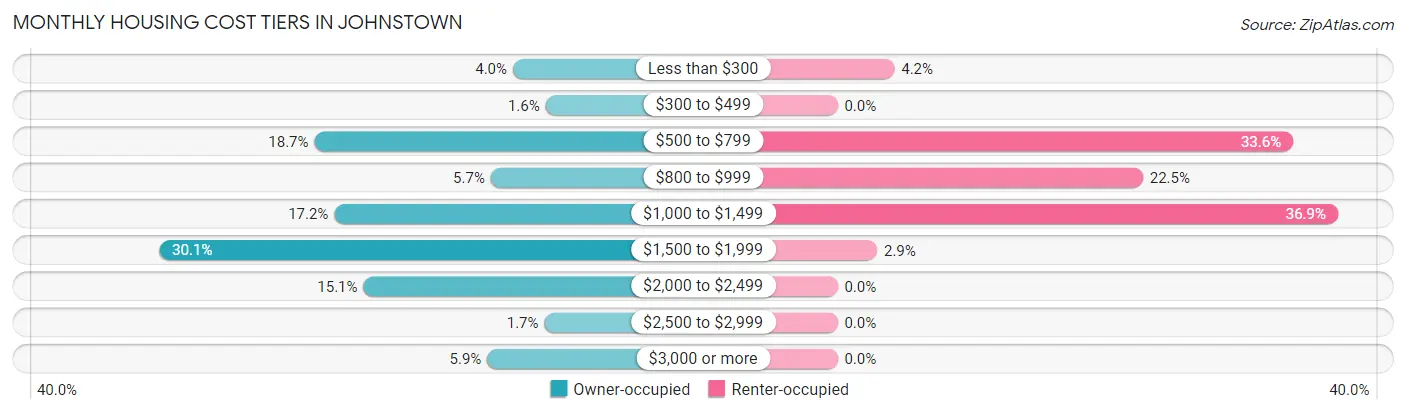
| Monthly Cost | Owner-occupied | Renter-occupied |
| Less than $300 | 47 (4.0%) | 33 (4.2%) |
| $300 to $499 | 19 (1.6%) | 0 (0.0%) |
| $500 to $799 | 217 (18.7%) | 264 (33.6%) |
| $800 to $999 | 66 (5.7%) | 177 (22.5%) |
| $1,000 to $1,499 | 200 (17.2%) | 290 (36.8%) |
| $1,500 to $1,999 | 350 (30.1%) | 23 (2.9%) |
| $2,000 to $2,499 | 175 (15.0%) | 0 (0.0%) |
| $2,500 to $2,999 | 20 (1.7%) | 0 (0.0%) |
| $3,000 or more | 69 (5.9%) | 0 (0.0%) |
| Total | 1,163 (100.0%) | 787 (100.0%) |
Physical Housing Characteristics in Johnstown
Housing Structures in Johnstown
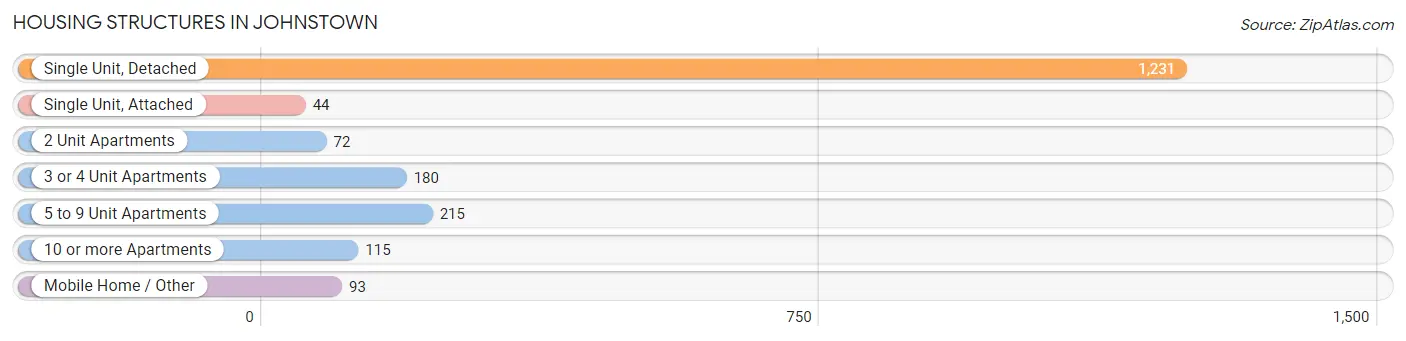
| Structure Type | # Housing Units | % Housing Units |
| Single Unit, Detached | 1,231 | 63.1% |
| Single Unit, Attached | 44 | 2.3% |
| 2 Unit Apartments | 72 | 3.7% |
| 3 or 4 Unit Apartments | 180 | 9.2% |
| 5 to 9 Unit Apartments | 215 | 11.0% |
| 10 or more Apartments | 115 | 5.9% |
| Mobile Home / Other | 93 | 4.8% |
| Total | 1,950 | 100.0% |
Housing Structures by Occupancy in Johnstown
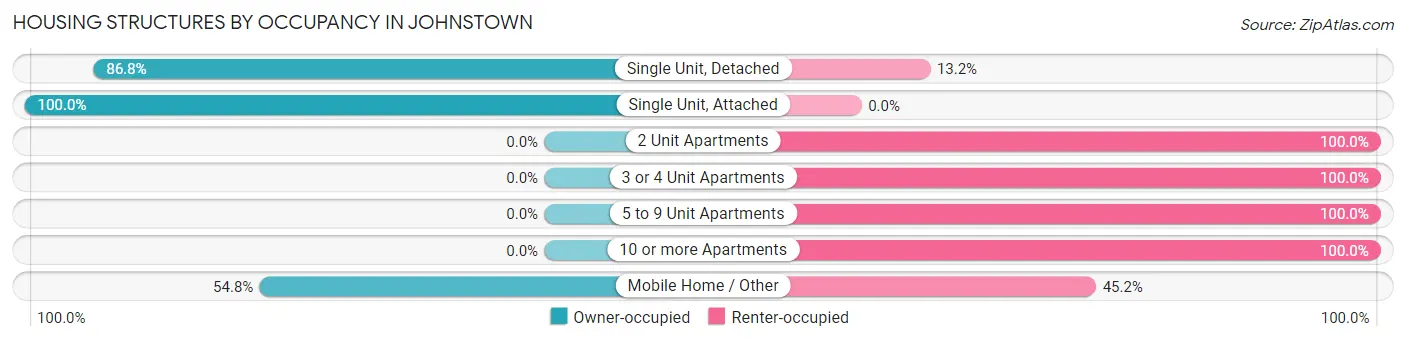
| Structure Type | Owner-occupied | Renter-occupied |
| Single Unit, Detached | 1,068 (86.8%) | 163 (13.2%) |
| Single Unit, Attached | 44 (100.0%) | 0 (0.0%) |
| 2 Unit Apartments | 0 (0.0%) | 72 (100.0%) |
| 3 or 4 Unit Apartments | 0 (0.0%) | 180 (100.0%) |
| 5 to 9 Unit Apartments | 0 (0.0%) | 215 (100.0%) |
| 10 or more Apartments | 0 (0.0%) | 115 (100.0%) |
| Mobile Home / Other | 51 (54.8%) | 42 (45.2%) |
| Total | 1,163 (59.6%) | 787 (40.4%) |
Housing Structures by Number of Rooms in Johnstown
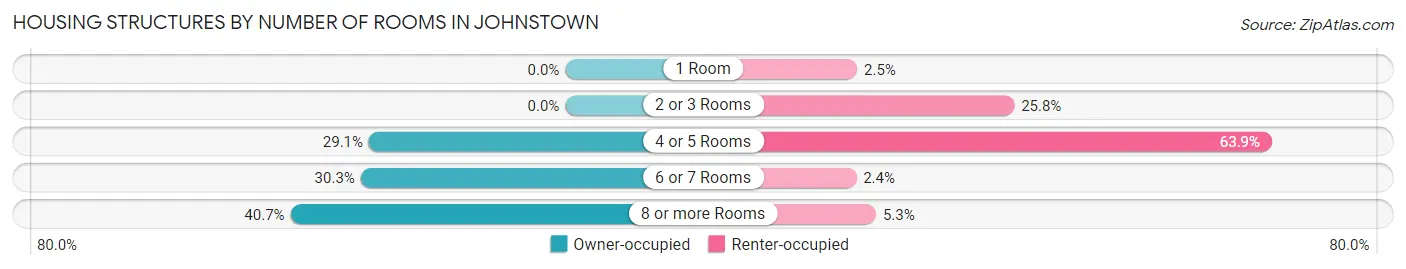
| Number of Rooms | Owner-occupied | Renter-occupied |
| 1 Room | 0 (0.0%) | 20 (2.5%) |
| 2 or 3 Rooms | 0 (0.0%) | 203 (25.8%) |
| 4 or 5 Rooms | 338 (29.1%) | 503 (63.9%) |
| 6 or 7 Rooms | 352 (30.3%) | 19 (2.4%) |
| 8 or more Rooms | 473 (40.7%) | 42 (5.3%) |
| Total | 1,163 (100.0%) | 787 (100.0%) |
Housing Structure by Heating Type in Johnstown
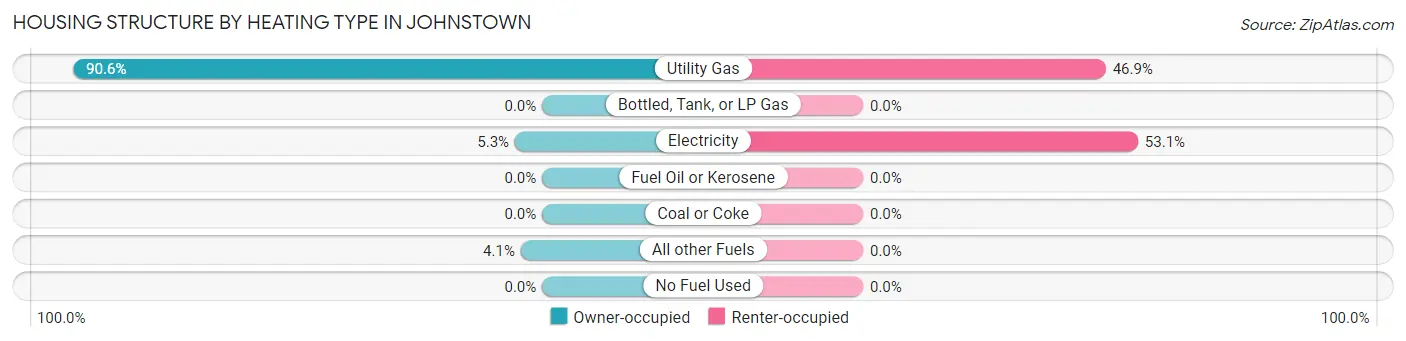
| Heating Type | Owner-occupied | Renter-occupied |
| Utility Gas | 1,054 (90.6%) | 369 (46.9%) |
| Bottled, Tank, or LP Gas | 0 (0.0%) | 0 (0.0%) |
| Electricity | 61 (5.2%) | 418 (53.1%) |
| Fuel Oil or Kerosene | 0 (0.0%) | 0 (0.0%) |
| Coal or Coke | 0 (0.0%) | 0 (0.0%) |
| All other Fuels | 48 (4.1%) | 0 (0.0%) |
| No Fuel Used | 0 (0.0%) | 0 (0.0%) |
| Total | 1,163 (100.0%) | 787 (100.0%) |
Household Vehicle Usage in Johnstown
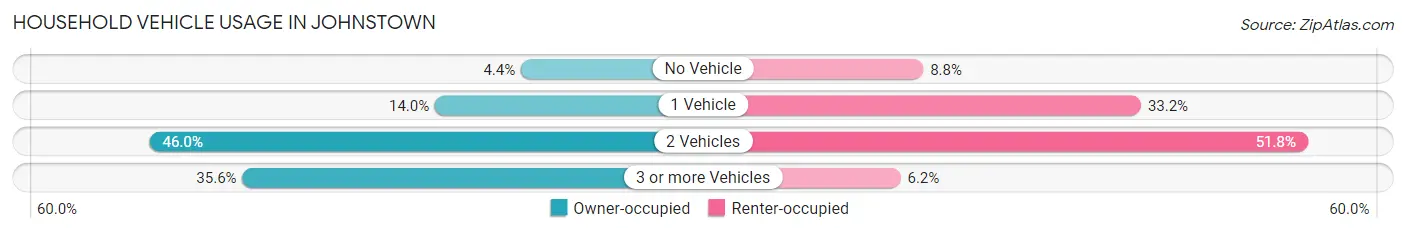
| Vehicles per Household | Owner-occupied | Renter-occupied |
| No Vehicle | 51 (4.4%) | 69 (8.8%) |
| 1 Vehicle | 163 (14.0%) | 261 (33.2%) |
| 2 Vehicles | 535 (46.0%) | 408 (51.8%) |
| 3 or more Vehicles | 414 (35.6%) | 49 (6.2%) |
| Total | 1,163 (100.0%) | 787 (100.0%) |
Real Estate & Mortgages in Johnstown
Real Estate and Mortgage Overview in Johnstown
| Characteristic | Without Mortgage | With Mortgage |
| Housing Units | 277 | 886 |
| Median Property Value | $137,500 | $285,900 |
| Median Household Income | $55,083 | $286 |
| Monthly Housing Costs | $594 | $69 |
| Real Estate Taxes | $2,726 | $0 |
Property Value by Mortgage Status in Johnstown
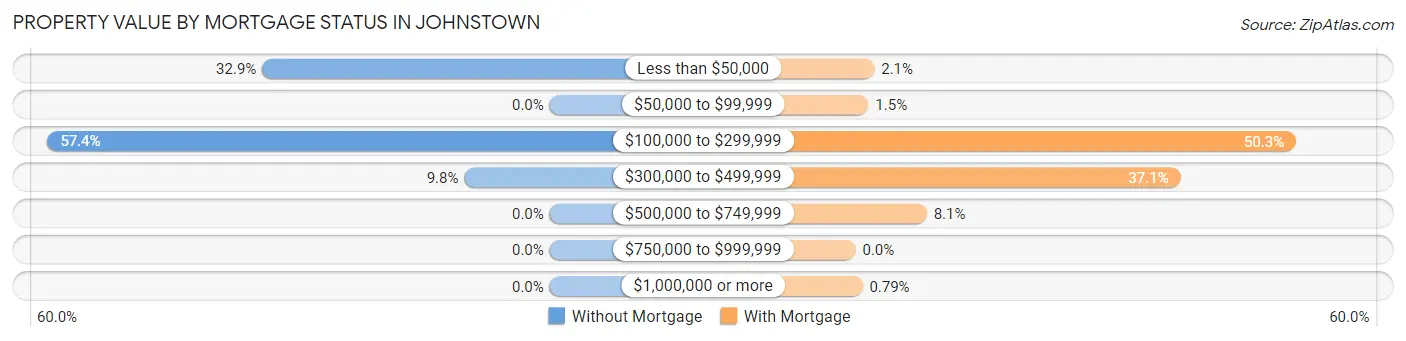
| Property Value | Without Mortgage | With Mortgage |
| Less than $50,000 | 91 (32.9%) | 19 (2.1%) |
| $50,000 to $99,999 | 0 (0.0%) | 13 (1.5%) |
| $100,000 to $299,999 | 159 (57.4%) | 446 (50.3%) |
| $300,000 to $499,999 | 27 (9.8%) | 329 (37.1%) |
| $500,000 to $749,999 | 0 (0.0%) | 72 (8.1%) |
| $750,000 to $999,999 | 0 (0.0%) | 0 (0.0%) |
| $1,000,000 or more | 0 (0.0%) | 7 (0.8%) |
| Total | 277 (100.0%) | 886 (100.0%) |
Household Income by Mortgage Status in Johnstown
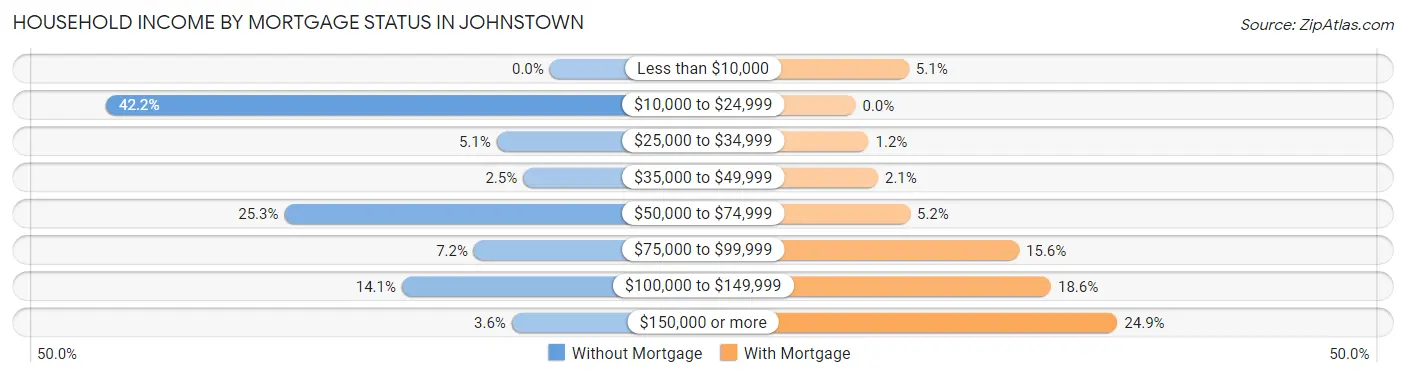
| Household Income | Without Mortgage | With Mortgage |
| Less than $10,000 | 0 (0.0%) | 45 (5.1%) |
| $10,000 to $24,999 | 117 (42.2%) | 0 (0.0%) |
| $25,000 to $34,999 | 14 (5.1%) | 11 (1.2%) |
| $35,000 to $49,999 | 7 (2.5%) | 19 (2.1%) |
| $50,000 to $74,999 | 70 (25.3%) | 46 (5.2%) |
| $75,000 to $99,999 | 20 (7.2%) | 138 (15.6%) |
| $100,000 to $149,999 | 39 (14.1%) | 165 (18.6%) |
| $150,000 or more | 10 (3.6%) | 221 (24.9%) |
| Total | 277 (100.0%) | 886 (100.0%) |
Property Value to Household Income Ratio in Johnstown
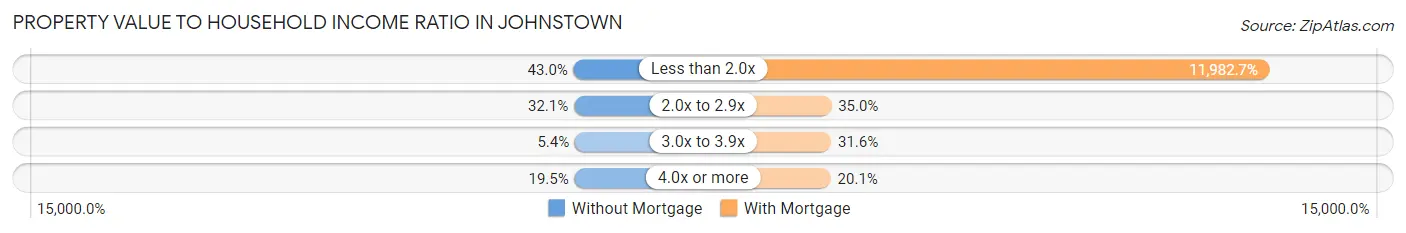
| Value-to-Income Ratio | Without Mortgage | With Mortgage |
| Less than 2.0x | 119 (43.0%) | 106,167 (11,982.7%) |
| 2.0x to 2.9x | 89 (32.1%) | 310 (35.0%) |
| 3.0x to 3.9x | 15 (5.4%) | 280 (31.6%) |
| 4.0x or more | 54 (19.5%) | 178 (20.1%) |
| Total | 277 (100.0%) | 886 (100.0%) |
Real Estate Taxes by Mortgage Status in Johnstown
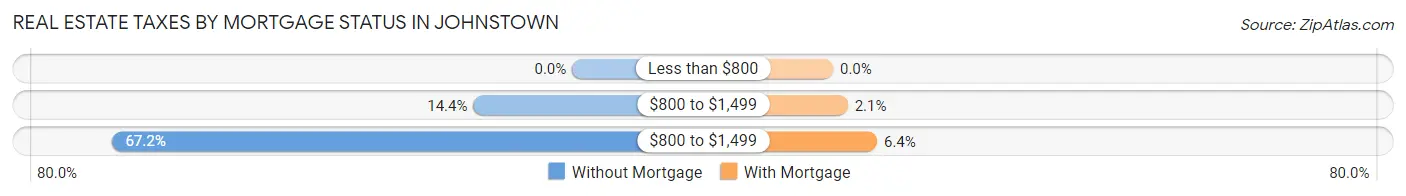
| Property Taxes | Without Mortgage | With Mortgage |
| Less than $800 | 0 (0.0%) | 0 (0.0%) |
| $800 to $1,499 | 40 (14.4%) | 19 (2.1%) |
| $800 to $1,499 | 186 (67.1%) | 57 (6.4%) |
| Total | 277 (100.0%) | 886 (100.0%) |
Health & Disability in Johnstown
Health Insurance Coverage by Age in Johnstown
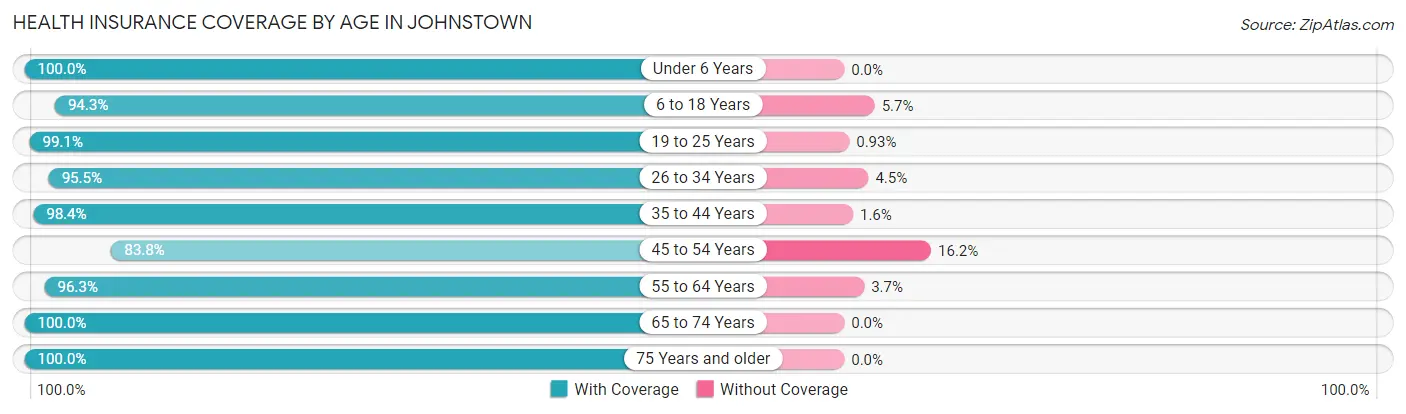
| Age Bracket | With Coverage | Without Coverage |
| Under 6 Years | 433 (100.0%) | 0 (0.0%) |
| 6 to 18 Years | 949 (94.3%) | 57 (5.7%) |
| 19 to 25 Years | 530 (99.1%) | 5 (0.9%) |
| 26 to 34 Years | 466 (95.5%) | 22 (4.5%) |
| 35 to 44 Years | 965 (98.4%) | 16 (1.6%) |
| 45 to 54 Years | 383 (83.8%) | 74 (16.2%) |
| 55 to 64 Years | 492 (96.3%) | 19 (3.7%) |
| 65 to 74 Years | 536 (100.0%) | 0 (0.0%) |
| 75 Years and older | 236 (100.0%) | 0 (0.0%) |
| Total | 4,990 (96.3%) | 193 (3.7%) |
Health Insurance Coverage by Citizenship Status in Johnstown
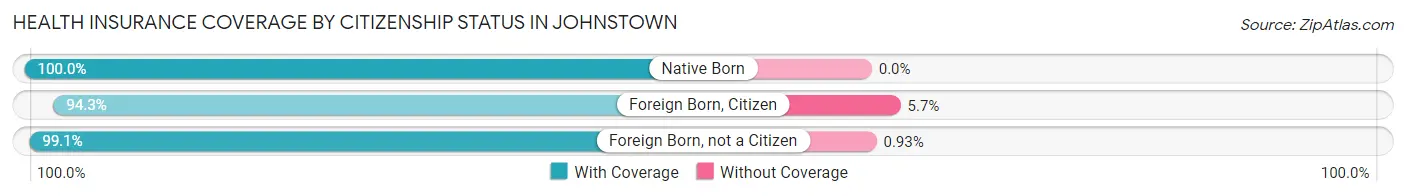
| Citizenship Status | With Coverage | Without Coverage |
| Native Born | 433 (100.0%) | 0 (0.0%) |
| Foreign Born, Citizen | 949 (94.3%) | 57 (5.7%) |
| Foreign Born, not a Citizen | 530 (99.1%) | 5 (0.9%) |
Health Insurance Coverage by Household Income in Johnstown
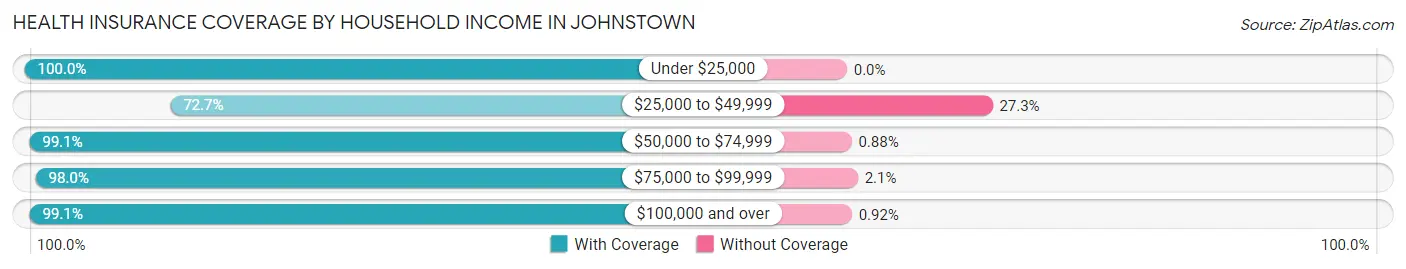
| Household Income | With Coverage | Without Coverage |
| Under $25,000 | 438 (100.0%) | 0 (0.0%) |
| $25,000 to $49,999 | 389 (72.7%) | 146 (27.3%) |
| $50,000 to $74,999 | 1,016 (99.1%) | 9 (0.9%) |
| $75,000 to $99,999 | 763 (98.0%) | 16 (2.1%) |
| $100,000 and over | 2,379 (99.1%) | 22 (0.9%) |
Public vs Private Health Insurance Coverage by Age in Johnstown
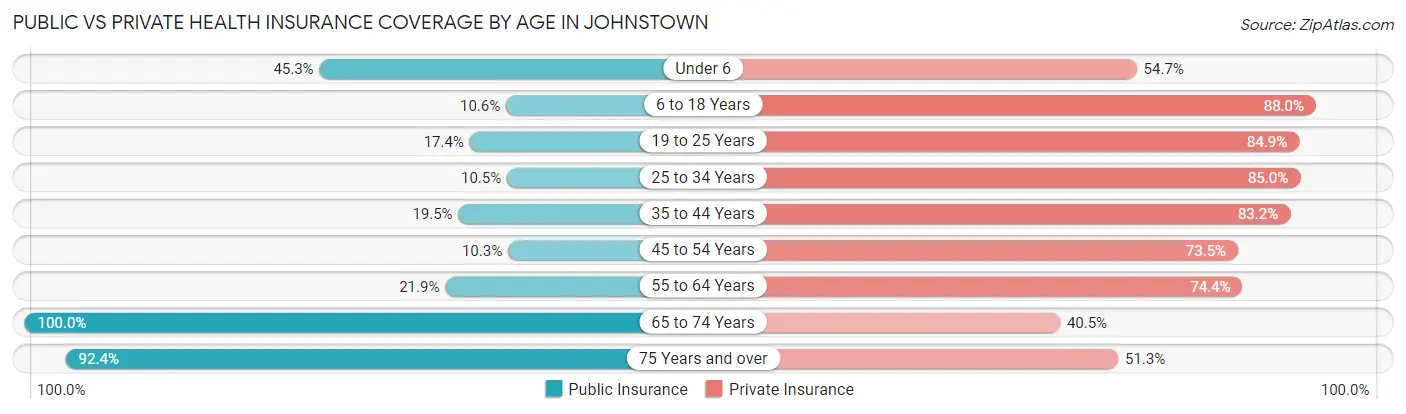
| Age Bracket | Public Insurance | Private Insurance |
| Under 6 | 196 (45.3%) | 237 (54.7%) |
| 6 to 18 Years | 107 (10.6%) | 885 (88.0%) |
| 19 to 25 Years | 93 (17.4%) | 454 (84.9%) |
| 25 to 34 Years | 51 (10.4%) | 415 (85.0%) |
| 35 to 44 Years | 191 (19.5%) | 816 (83.2%) |
| 45 to 54 Years | 47 (10.3%) | 336 (73.5%) |
| 55 to 64 Years | 112 (21.9%) | 380 (74.4%) |
| 65 to 74 Years | 536 (100.0%) | 217 (40.5%) |
| 75 Years and over | 218 (92.4%) | 121 (51.3%) |
| Total | 1,551 (29.9%) | 3,861 (74.5%) |
Disability Status by Sex by Age in Johnstown
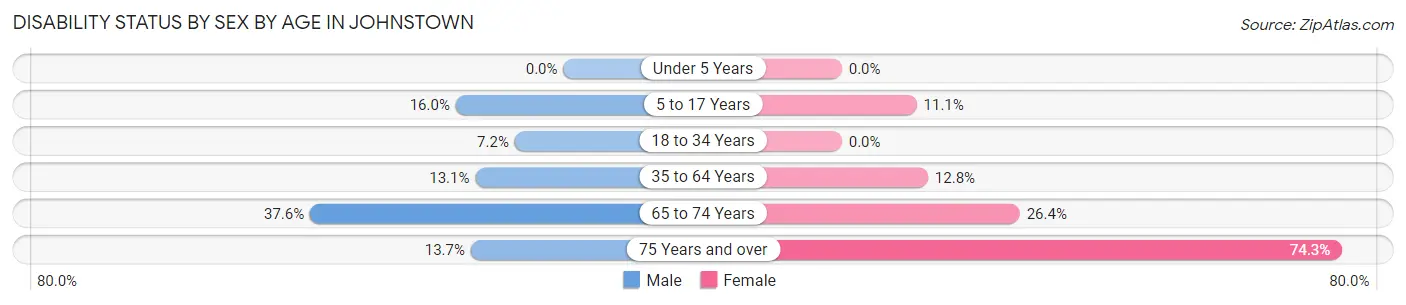
| Age Bracket | Male | Female |
| Under 5 Years | 0 (0.0%) | 0 (0.0%) |
| 5 to 17 Years | 78 (16.0%) | 58 (11.1%) |
| 18 to 34 Years | 39 (7.2%) | 0 (0.0%) |
| 35 to 64 Years | 129 (13.1%) | 123 (12.8%) |
| 65 to 74 Years | 82 (37.6%) | 84 (26.4%) |
| 75 Years and over | 18 (13.7%) | 78 (74.3%) |
Disability Class by Sex by Age in Johnstown
Disability Class: Hearing Difficulty
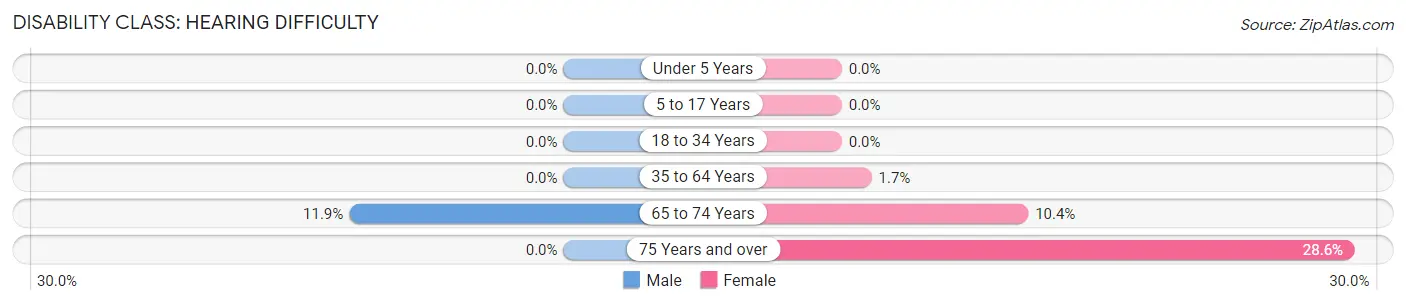
| Age Bracket | Male | Female |
| Under 5 Years | 0 (0.0%) | 0 (0.0%) |
| 5 to 17 Years | 0 (0.0%) | 0 (0.0%) |
| 18 to 34 Years | 0 (0.0%) | 0 (0.0%) |
| 35 to 64 Years | 0 (0.0%) | 16 (1.7%) |
| 65 to 74 Years | 26 (11.9%) | 33 (10.4%) |
| 75 Years and over | 0 (0.0%) | 30 (28.6%) |
Disability Class: Vision Difficulty
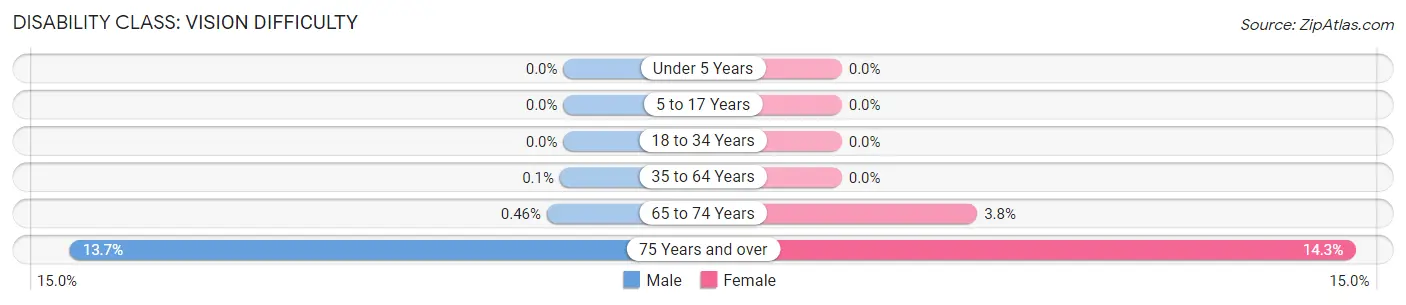
| Age Bracket | Male | Female |
| Under 5 Years | 0 (0.0%) | 0 (0.0%) |
| 5 to 17 Years | 0 (0.0%) | 0 (0.0%) |
| 18 to 34 Years | 0 (0.0%) | 0 (0.0%) |
| 35 to 64 Years | 1 (0.1%) | 0 (0.0%) |
| 65 to 74 Years | 1 (0.5%) | 12 (3.8%) |
| 75 Years and over | 18 (13.7%) | 15 (14.3%) |
Disability Class: Cognitive Difficulty
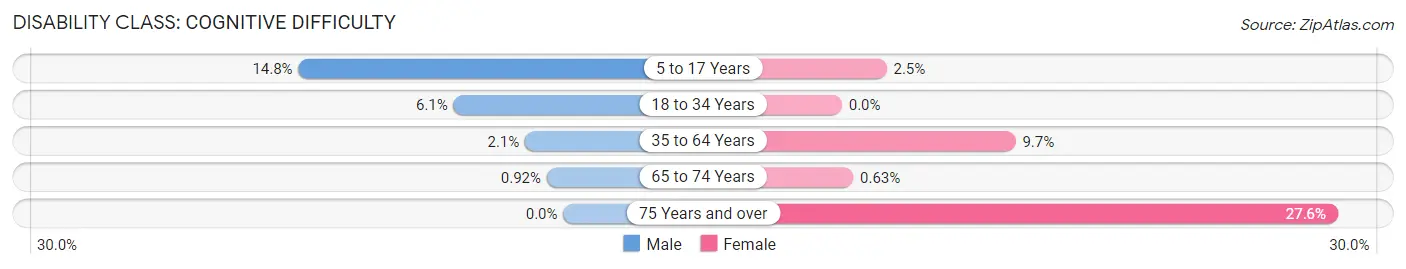
| Age Bracket | Male | Female |
| 5 to 17 Years | 72 (14.7%) | 13 (2.5%) |
| 18 to 34 Years | 33 (6.1%) | 0 (0.0%) |
| 35 to 64 Years | 21 (2.1%) | 93 (9.7%) |
| 65 to 74 Years | 2 (0.9%) | 2 (0.6%) |
| 75 Years and over | 0 (0.0%) | 29 (27.6%) |
Disability Class: Ambulatory Difficulty
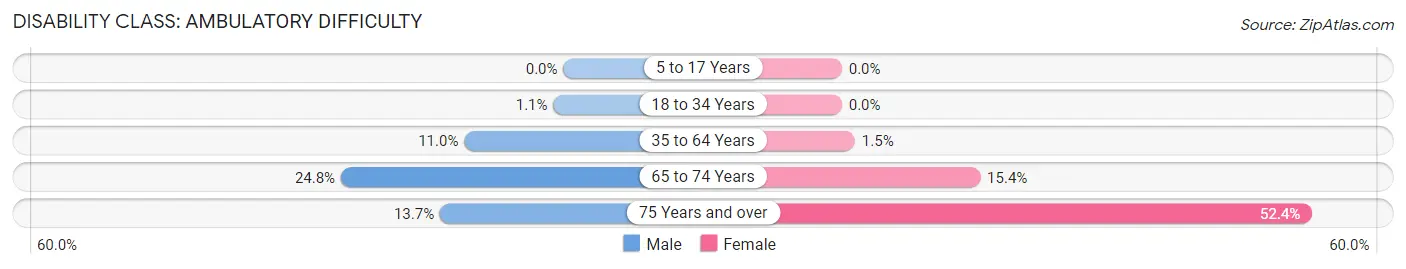
| Age Bracket | Male | Female |
| 5 to 17 Years | 0 (0.0%) | 0 (0.0%) |
| 18 to 34 Years | 6 (1.1%) | 0 (0.0%) |
| 35 to 64 Years | 109 (11.0%) | 14 (1.5%) |
| 65 to 74 Years | 54 (24.8%) | 49 (15.4%) |
| 75 Years and over | 18 (13.7%) | 55 (52.4%) |
Disability Class: Self-Care Difficulty
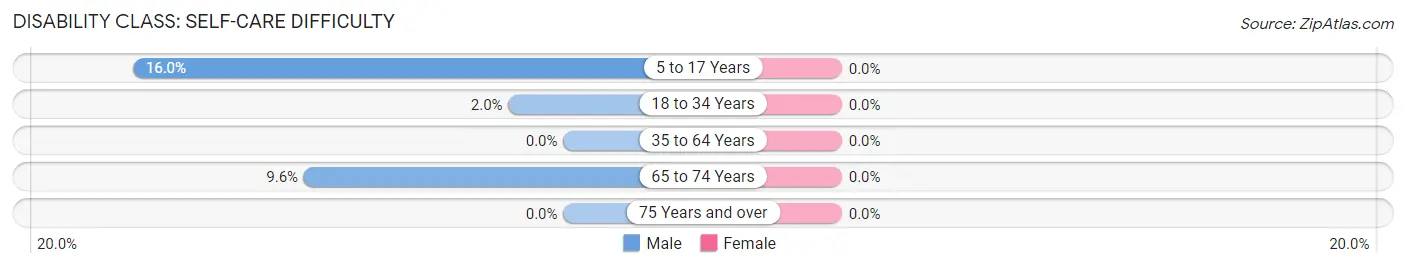
| Age Bracket | Male | Female |
| 5 to 17 Years | 78 (16.0%) | 0 (0.0%) |
| 18 to 34 Years | 11 (2.0%) | 0 (0.0%) |
| 35 to 64 Years | 0 (0.0%) | 0 (0.0%) |
| 65 to 74 Years | 21 (9.6%) | 0 (0.0%) |
| 75 Years and over | 0 (0.0%) | 0 (0.0%) |
Technology Access in Johnstown
Computing Device Access in Johnstown
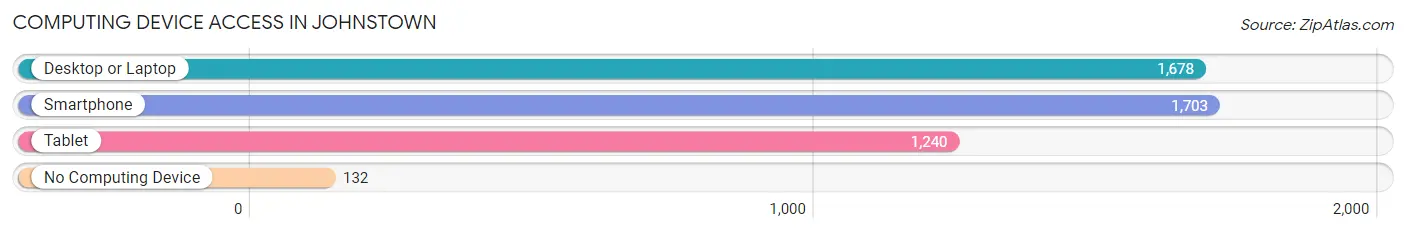
| Device Type | # Households | % Households |
| Desktop or Laptop | 1,678 | 86.1% |
| Smartphone | 1,703 | 87.3% |
| Tablet | 1,240 | 63.6% |
| No Computing Device | 132 | 6.8% |
| Total | 1,950 | 100.0% |
Internet Access in Johnstown
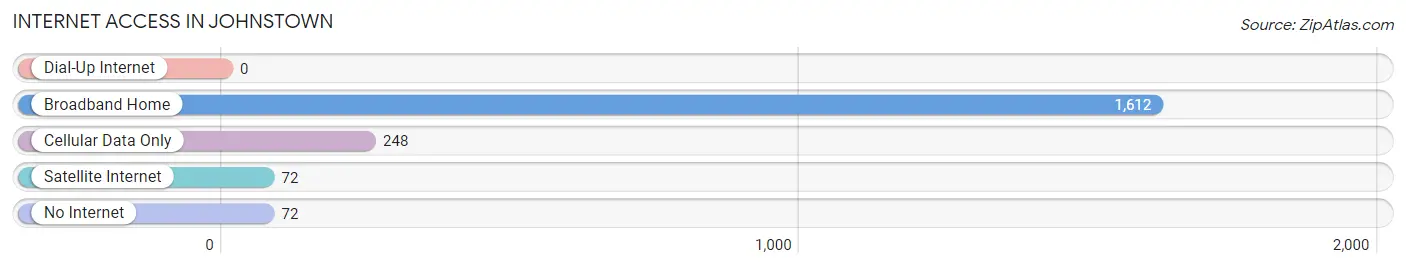
| Internet Type | # Households | % Households |
| Dial-Up Internet | 0 | 0.0% |
| Broadband Home | 1,612 | 82.7% |
| Cellular Data Only | 248 | 12.7% |
| Satellite Internet | 72 | 3.7% |
| No Internet | 72 | 3.7% |
| Total | 1,950 | 100.0% |
Johnstown Summary
Johnstown, Ohio is a small village located in Licking County, Ohio. It is situated on the banks of the Licking River, about 25 miles east of Columbus. The village has a population of approximately 3,000 people and is part of the Columbus metropolitan area.
History
Johnstown was founded in 1814 by John and Mary Smith, who were among the first settlers in the area. The village was named after John Smith, who was a veteran of the War of 1812. The village was incorporated in 1837 and has remained a small, rural community ever since.
The village was an important stop on the Underground Railroad, with many of the local residents helping to hide and transport escaped slaves. The village was also home to a number of prominent abolitionists, including John Rankin and Levi Coffin.
Geography
Johnstown is located in Licking County, Ohio, about 25 miles east of Columbus. The village is situated on the banks of the Licking River, which is a tributary of the Ohio River. The village is surrounded by rolling hills and farmland, and is located in the Appalachian Plateau region of Ohio.
The village has a total area of 1.3 square miles, all of which is land. The village is located at an elevation of 890 feet above sea level.
Economy
Johnstown is a small, rural community with a largely agricultural economy. The village is home to a number of small businesses, including a grocery store, a hardware store, and a few restaurants. The village also has a few manufacturing companies, including a plastics factory and a metal fabrication plant.
The village is also home to a number of farms, which produce a variety of crops, including corn, soybeans, and wheat. The village is also home to a number of horse farms, which are popular with local residents.
Demographics
Johnstown has a population of approximately 3,000 people. The village is predominantly white, with about 95% of the population being white. The village also has a small African American population, with about 2% of the population being African American.
The median household income in Johnstown is $45,000, and the median home value is $125,000. The village has a low unemployment rate, with only about 4% of the population being unemployed.
Johnstown is a small, rural community with a long history and a strong sense of community. The village is home to a number of small businesses and farms, and is a popular destination for outdoor recreation. The village is also home to a number of historic sites, including the Johnstown Historical Society Museum and the Johnstown Underground Railroad Museum.
Common Questions
What is Per Capita Income in Johnstown?
Per Capita income in Johnstown is $34,224.
What is the Median Family Income in Johnstown?
Median Family Income in Johnstown is $91,837.
What is the Median Household income in Johnstown?
Median Household Income in Johnstown is $78,442.
What is Income or Wage Gap in Johnstown?
Income or Wage Gap in Johnstown is 15.0%.
Women in Johnstown earn 85.0 cents for every dollar earned by a man.
What is Inequality or Gini Index in Johnstown?
Inequality or Gini Index in Johnstown is 0.39.
What is the Total Population of Johnstown?
Total Population of Johnstown is 5,183.
What is the Total Male Population of Johnstown?
Total Male Population of Johnstown is 2,604.
What is the Total Female Population of Johnstown?
Total Female Population of Johnstown is 2,579.
What is the Ratio of Males per 100 Females in Johnstown?
There are 100.97 Males per 100 Females in Johnstown.
What is the Ratio of Females per 100 Males in Johnstown?
There are 99.04 Females per 100 Males in Johnstown.
What is the Median Population Age in Johnstown?
Median Population Age in Johnstown is 37.7 Years.
What is the Average Family Size in Johnstown
Average Family Size in Johnstown is 3.0 People.
What is the Average Household Size in Johnstown
Average Household Size in Johnstown is 2.7 People.
How Large is the Labor Force in Johnstown?
There are 2,879 People in the Labor Forcein in Johnstown.
What is the Percentage of People in the Labor Force in Johnstown?
72.2% of People are in the Labor Force in Johnstown.
What is the Unemployment Rate in Johnstown?
Unemployment Rate in Johnstown is 1.5%.