Holiday City, OH Map & Demographics
Holiday City Map
Holiday City Overview
$54,250
PER CAPITA INCOME
$103,750
AVG FAMILY INCOME
$54,500
AVG HOUSEHOLD INCOME
0.21
INEQUALITY / GINI INDEX
18
TOTAL POPULATION
15
MALE POPULATION
3
FEMALE POPULATION
500.00
MALES / 100 FEMALES
20.00
FEMALES / 100 MALES
46.6
MEDIAN AGE
2.3
AVG FAMILY SIZE
1.3
AVG HOUSEHOLD SIZE
13
LABOR FORCE [ PEOPLE ]
76.5%
PERCENT IN LABOR FORCE
Holiday City Area Codes
Income in Holiday City
Income Overview in Holiday City
Per Capita Income in Holiday City is $54,250, while median incomes of families and households are $103,750 and $54,500 respectively.
| Characteristic | Number | Measure |
| Per Capita Income | 18 | $54,250 |
| Median Family Income | 3 | $103,750 |
| Mean Family Income | 3 | $123,333 |
| Median Household Income | 14 | $54,500 |
| Mean Household Income | 14 | $69,750 |
| Income Deficit | 3 | $0 |
| Wage / Income Gap (%) | 18 | 0.00% |
| Wage / Income Gap ($) | 18 | 100.00¢ per $1 |
| Gini / Inequality Index | 18 | 0.21 |
Earnings by Sex in Holiday City
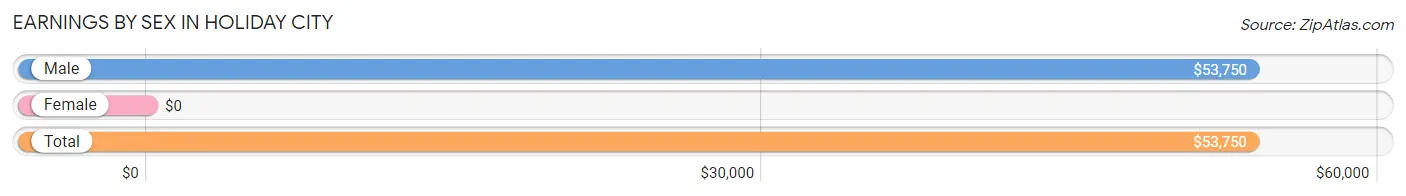
| Sex | Number | Average Earnings |
| Male | 11 (84.6%) | $53,750 |
| Female | 2 (15.4%) | $0 |
| Total | 13 (100.0%) | $53,750 |
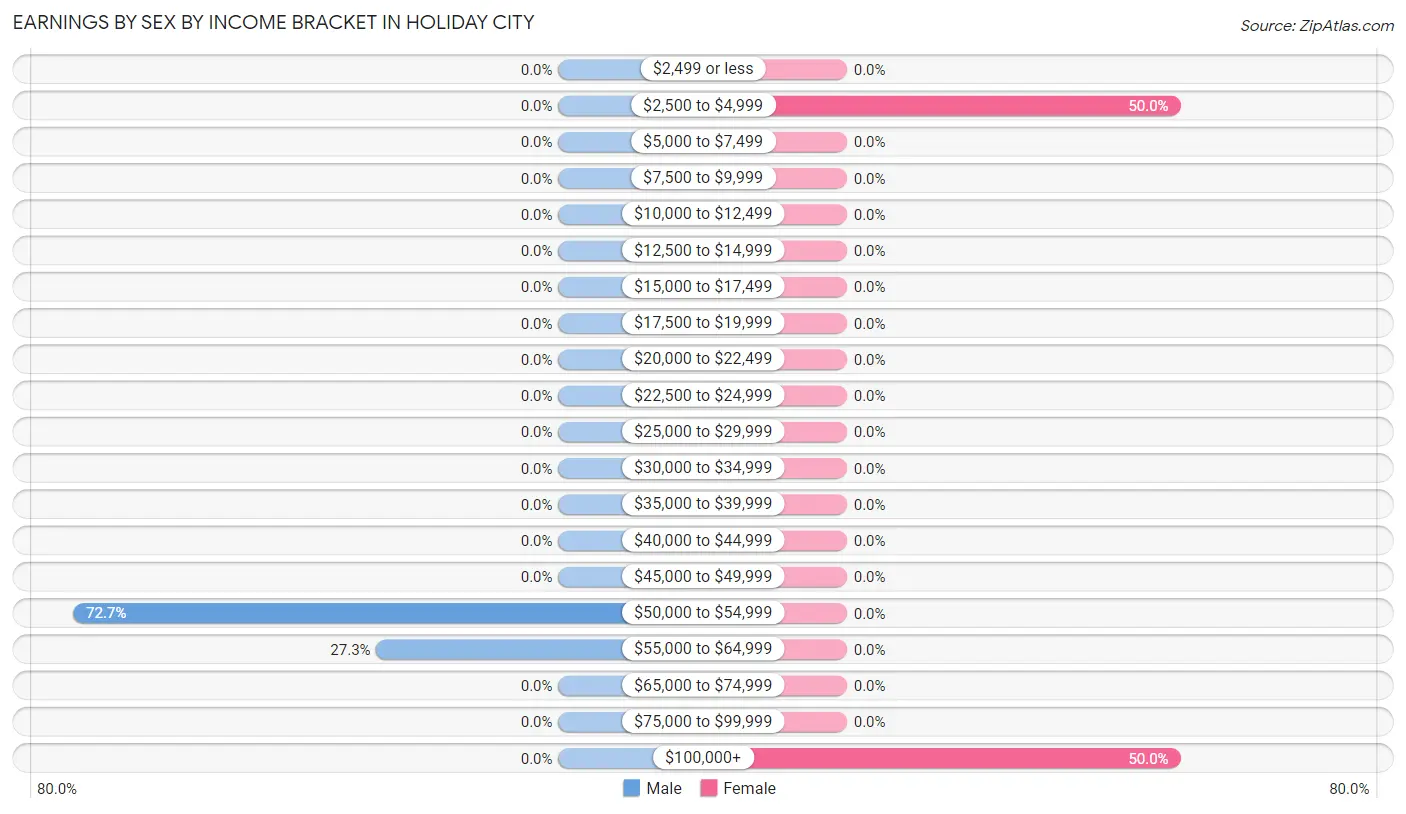
Earnings by Sex by Income Bracket in Holiday City
The most common earnings brackets in Holiday City are $50,000 to $54,999 for men (8 | 72.7%) and $2,500 to $4,999 for women (1 | 50.0%).
| Income | Male | Female |
| $2,499 or less | 0 (0.0%) | 0 (0.0%) |
| $2,500 to $4,999 | 0 (0.0%) | 1 (50.0%) |
| $5,000 to $7,499 | 0 (0.0%) | 0 (0.0%) |
| $7,500 to $9,999 | 0 (0.0%) | 0 (0.0%) |
| $10,000 to $12,499 | 0 (0.0%) | 0 (0.0%) |
| $12,500 to $14,999 | 0 (0.0%) | 0 (0.0%) |
| $15,000 to $17,499 | 0 (0.0%) | 0 (0.0%) |
| $17,500 to $19,999 | 0 (0.0%) | 0 (0.0%) |
| $20,000 to $22,499 | 0 (0.0%) | 0 (0.0%) |
| $22,500 to $24,999 | 0 (0.0%) | 0 (0.0%) |
| $25,000 to $29,999 | 0 (0.0%) | 0 (0.0%) |
| $30,000 to $34,999 | 0 (0.0%) | 0 (0.0%) |
| $35,000 to $39,999 | 0 (0.0%) | 0 (0.0%) |
| $40,000 to $44,999 | 0 (0.0%) | 0 (0.0%) |
| $45,000 to $49,999 | 0 (0.0%) | 0 (0.0%) |
| $50,000 to $54,999 | 8 (72.7%) | 0 (0.0%) |
| $55,000 to $64,999 | 3 (27.3%) | 0 (0.0%) |
| $65,000 to $74,999 | 0 (0.0%) | 0 (0.0%) |
| $75,000 to $99,999 | 0 (0.0%) | 0 (0.0%) |
| $100,000+ | 0 (0.0%) | 1 (50.0%) |
| Total | 11 (100.0%) | 2 (100.0%) |
Earnings by Sex by Educational Attainment in Holiday City
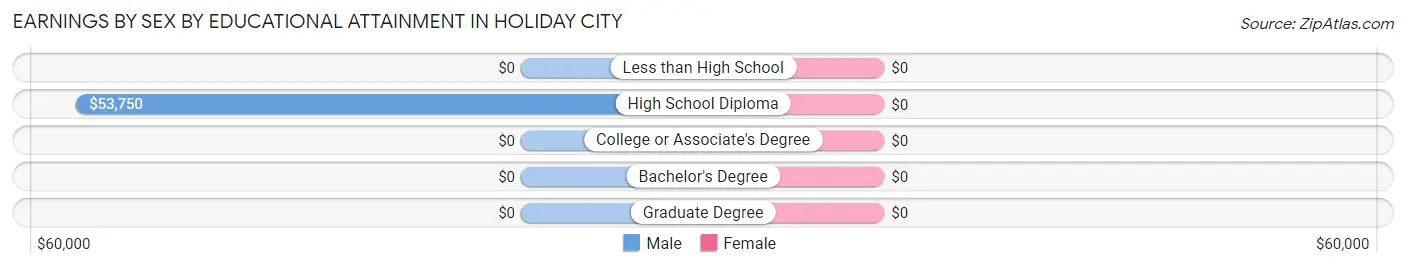
| Educational Attainment | Male Income | Female Income |
| Less than High School | - | - |
| High School Diploma | $53,750 | $0 |
| College or Associate's Degree | - | - |
| Bachelor's Degree | - | - |
| Graduate Degree | - | - |
| Total | $53,750 | $0 |
Family Income in Holiday City
Family Income Brackets in Holiday City
According to the Holiday City family income data, there are 1 families falling into the $50,000 to $74,999 income range, which is the most common income bracket and makes up 33.3% of all families.
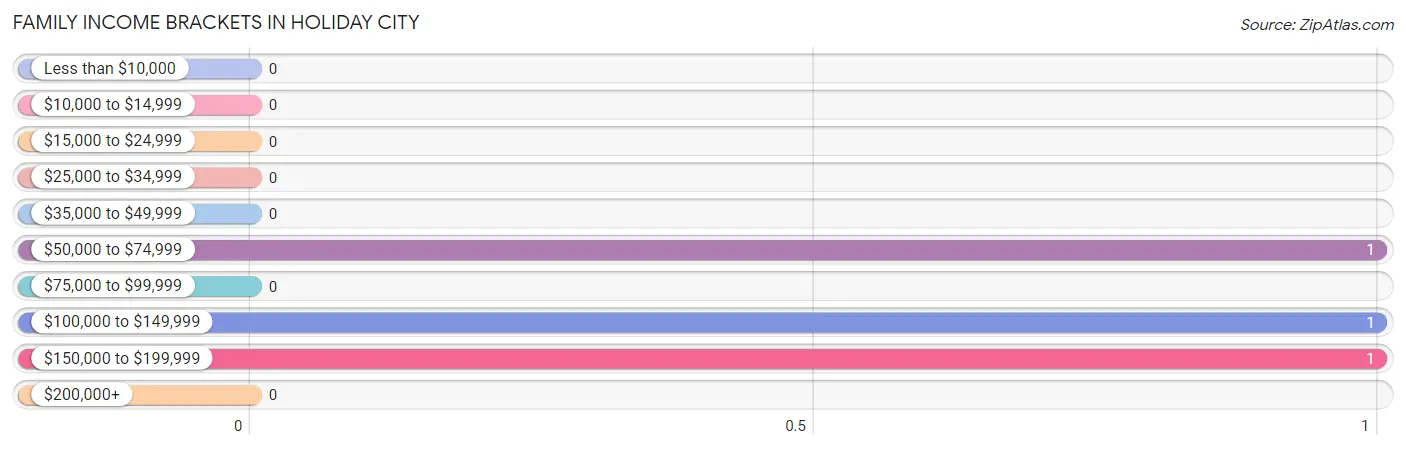
| Income Bracket | # Families | % Families |
| Less than $10,000 | 0 | 0.0% |
| $10,000 to $14,999 | 0 | 0.0% |
| $15,000 to $24,999 | 0 | 0.0% |
| $25,000 to $34,999 | 0 | 0.0% |
| $35,000 to $49,999 | 0 | 0.0% |
| $50,000 to $74,999 | 1 | 33.3% |
| $75,000 to $99,999 | 0 | 0.0% |
| $100,000 to $149,999 | 1 | 33.3% |
| $150,000 to $199,999 | 1 | 33.3% |
| $200,000+ | 0 | 0.0% |
Family Income by Famaliy Size in Holiday City
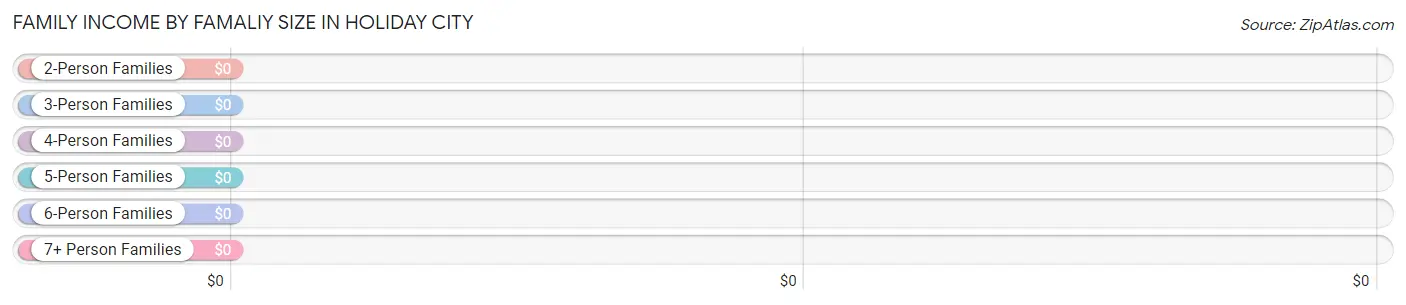
| Income Bracket | # Families | Median Income |
| 2-Person Families | 2 (66.7%) | $0 |
| 3-Person Families | 1 (33.3%) | $0 |
| 4-Person Families | 0 (0.0%) | $0 |
| 5-Person Families | 0 (0.0%) | $0 |
| 6-Person Families | 0 (0.0%) | $0 |
| 7+ Person Families | 0 (0.0%) | $0 |
| Total | 3 (100.0%) | $103,750 |
Family Income by Number of Earners in Holiday City
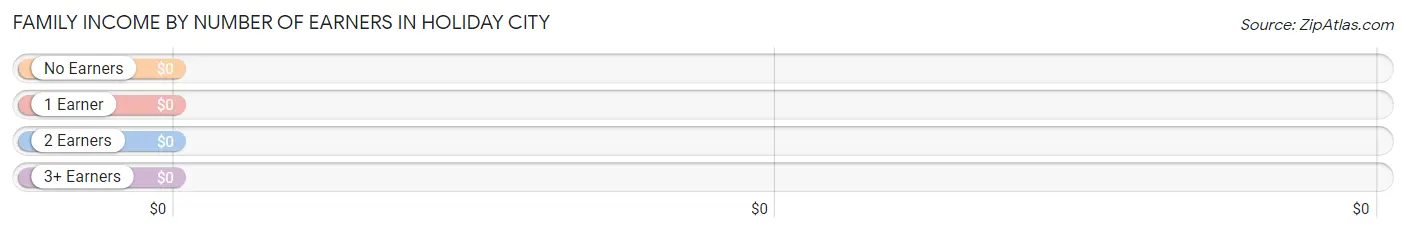
| Number of Earners | # Families | Median Income |
| No Earners | 1 (33.3%) | $0 |
| 1 Earner | 1 (33.3%) | $0 |
| 2 Earners | 1 (33.3%) | $0 |
| 3+ Earners | 0 (0.0%) | $0 |
| Total | 3 (100.0%) | $103,750 |
Household Income in Holiday City
Household Income Brackets in Holiday City
With 12 households falling in the category, the $50,000 to $74,999 income range is the most frequent in Holiday City, accounting for 85.7% of all households.
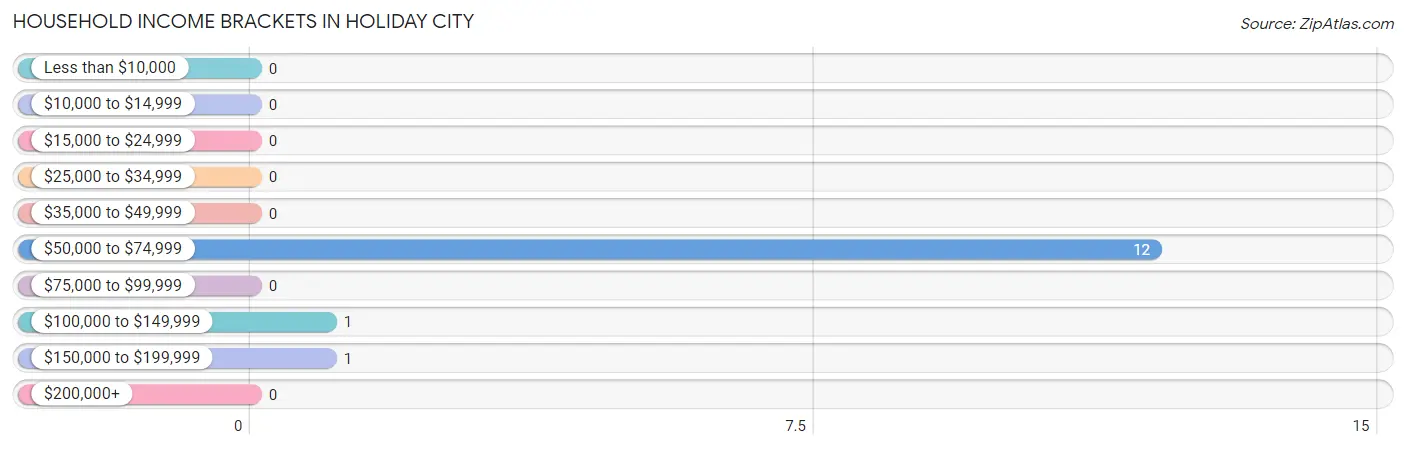
| Income Bracket | # Households | % Households |
| Less than $10,000 | 0 | 0.0% |
| $10,000 to $14,999 | 0 | 0.0% |
| $15,000 to $24,999 | 0 | 0.0% |
| $25,000 to $34,999 | 0 | 0.0% |
| $35,000 to $49,999 | 0 | 0.0% |
| $50,000 to $74,999 | 12 | 85.7% |
| $75,000 to $99,999 | 0 | 0.0% |
| $100,000 to $149,999 | 1 | 7.1% |
| $150,000 to $199,999 | 1 | 7.1% |
| $200,000+ | 0 | 0.0% |
Household Income by Householder Age in Holiday City
The median household income in Holiday City is $54,500, with the highest median household income of $54,250 found in the 45 to 64 years age bracket for the primary householder. A total of 7 households (50.0%) fall into this category.
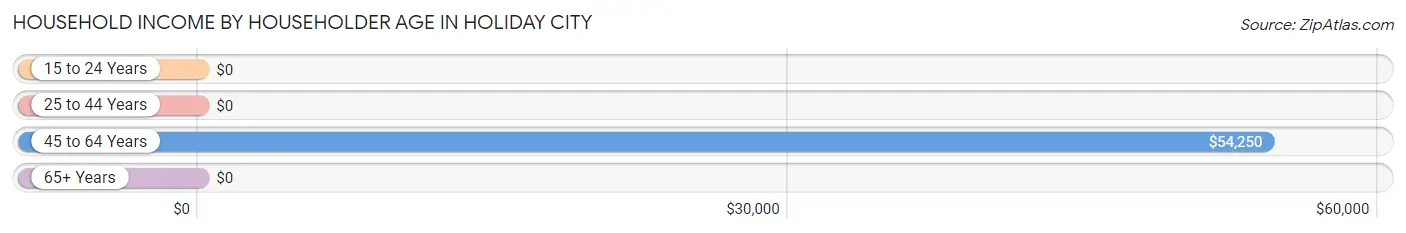
| Income Bracket | # Households | Median Income |
| 15 to 24 Years | 0 (0.0%) | $0 |
| 25 to 44 Years | 5 (35.7%) | $0 |
| 45 to 64 Years | 7 (50.0%) | $54,250 |
| 65+ Years | 2 (14.3%) | $0 |
| Total | 14 (100.0%) | $54,500 |
Poverty in Holiday City
Income Below Poverty by Sex and Age in Holiday City
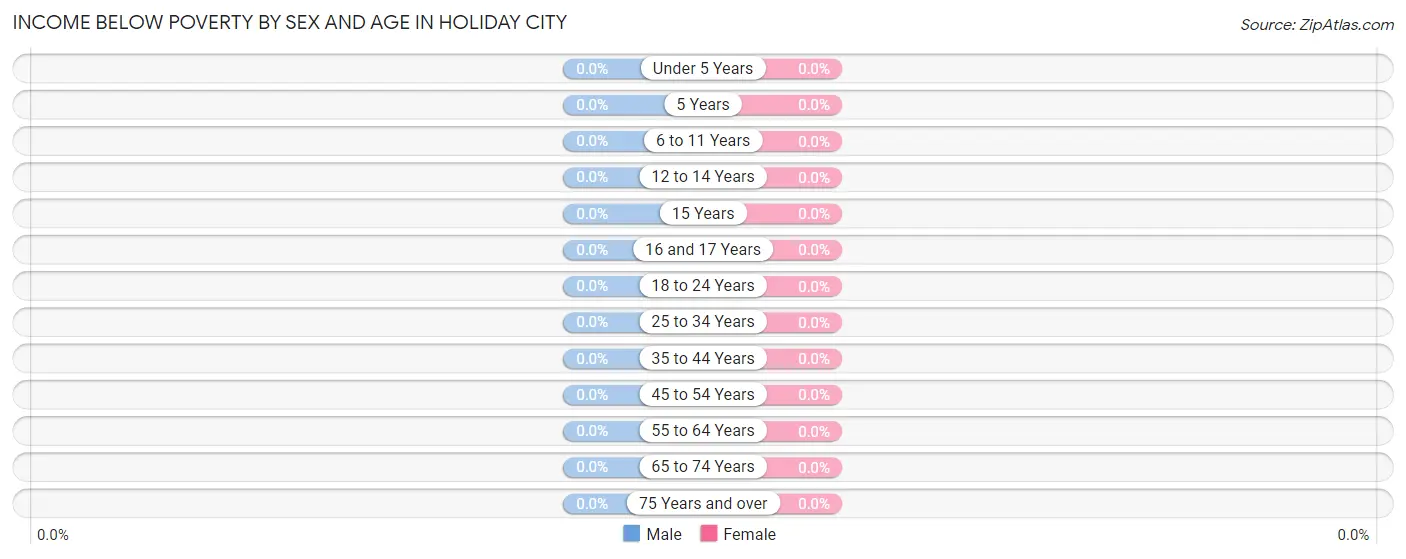
| Age Bracket | Male | Female |
| Under 5 Years | 0 (0.0%) | 0 (0.0%) |
| 5 Years | 0 (0.0%) | 0 (0.0%) |
| 6 to 11 Years | 0 (0.0%) | 0 (0.0%) |
| 12 to 14 Years | 0 (0.0%) | 0 (0.0%) |
| 15 Years | 0 (0.0%) | 0 (0.0%) |
| 16 and 17 Years | 0 (0.0%) | 0 (0.0%) |
| 18 to 24 Years | 0 (0.0%) | 0 (0.0%) |
| 25 to 34 Years | 0 (0.0%) | 0 (0.0%) |
| 35 to 44 Years | 0 (0.0%) | 0 (0.0%) |
| 45 to 54 Years | 0 (0.0%) | 0 (0.0%) |
| 55 to 64 Years | 0 (0.0%) | 0 (0.0%) |
| 65 to 74 Years | 0 (0.0%) | 0 (0.0%) |
| 75 Years and over | 0 (0.0%) | 0 (0.0%) |
| Total | 0 (0.0%) | 0 (0.0%) |
Income Above Poverty by Sex and Age in Holiday City
According to the poverty statistics in Holiday City, males aged 12 to 14 years and females aged 45 to 54 years are the age groups that are most secure financially, with 100.0% of males and 100.0% of females in these age groups living above the poverty line.
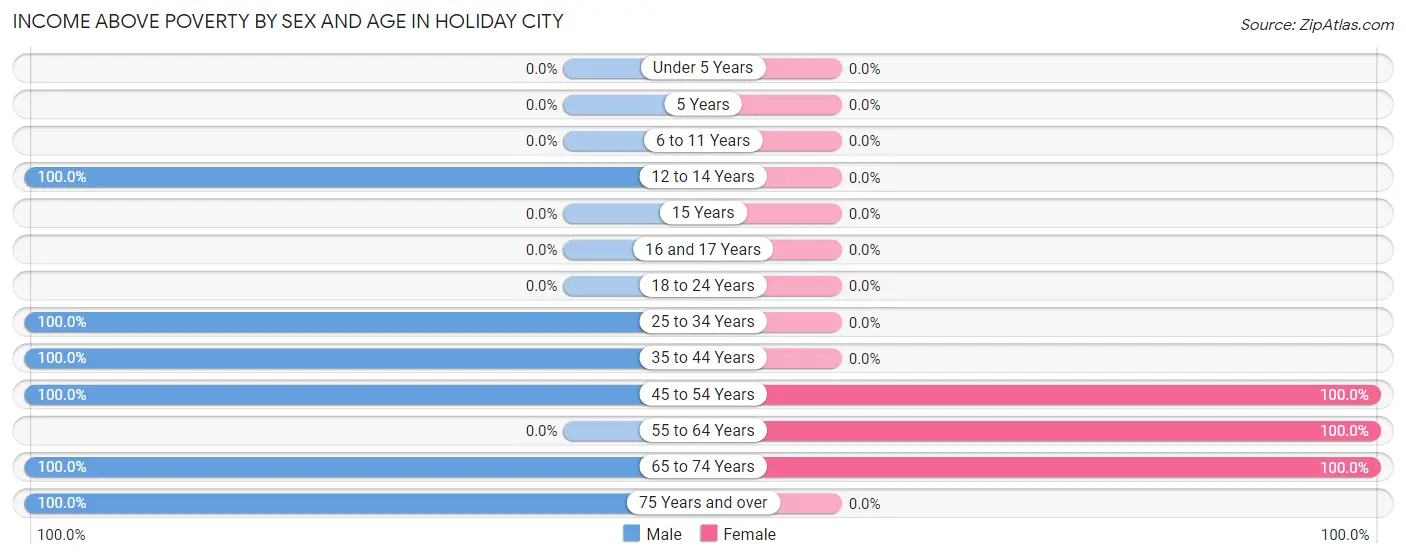
| Age Bracket | Male | Female |
| Under 5 Years | 0 (0.0%) | 0 (0.0%) |
| 5 Years | 0 (0.0%) | 0 (0.0%) |
| 6 to 11 Years | 0 (0.0%) | 0 (0.0%) |
| 12 to 14 Years | 1 (100.0%) | 0 (0.0%) |
| 15 Years | 0 (0.0%) | 0 (0.0%) |
| 16 and 17 Years | 0 (0.0%) | 0 (0.0%) |
| 18 to 24 Years | 0 (0.0%) | 0 (0.0%) |
| 25 to 34 Years | 2 (100.0%) | 0 (0.0%) |
| 35 to 44 Years | 3 (100.0%) | 0 (0.0%) |
| 45 to 54 Years | 6 (100.0%) | 1 (100.0%) |
| 55 to 64 Years | 0 (0.0%) | 1 (100.0%) |
| 65 to 74 Years | 1 (100.0%) | 1 (100.0%) |
| 75 Years and over | 2 (100.0%) | 0 (0.0%) |
| Total | 15 (100.0%) | 3 (100.0%) |
Income Below Poverty Among Married-Couple Families in Holiday City
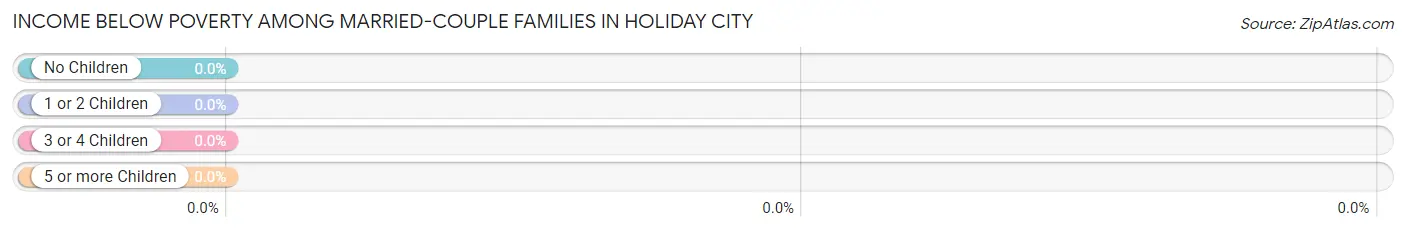
| Children | Above Poverty | Below Poverty |
| No Children | 2 (100.0%) | 0 (0.0%) |
| 1 or 2 Children | 1 (100.0%) | 0 (0.0%) |
| 3 or 4 Children | 0 (0.0%) | 0 (0.0%) |
| 5 or more Children | 0 (0.0%) | 0 (0.0%) |
| Total | 3 (100.0%) | 0 (0.0%) |
Income Below Poverty Among Single-Parent Households in Holiday City
| Children | Single Father | Single Mother |
| No Children | 0 (0.0%) | 0 (0.0%) |
| 1 or 2 Children | 0 (0.0%) | 0 (0.0%) |
| 3 or 4 Children | 0 (0.0%) | 0 (0.0%) |
| 5 or more Children | 0 (0.0%) | 0 (0.0%) |
| Total | 0 (0.0%) | 0 (0.0%) |
Income Below Poverty Among Married-Couple vs Single-Parent Households in Holiday City
| Children | Married-Couple Families | Single-Parent Households |
| No Children | 0 (0.0%) | 0 (0.0%) |
| 1 or 2 Children | 0 (0.0%) | 0 (0.0%) |
| 3 or 4 Children | 0 (0.0%) | 0 (0.0%) |
| 5 or more Children | 0 (0.0%) | 0 (0.0%) |
| Total | 0 (0.0%) | 0 (0.0%) |
Race in Holiday City
The most populous races in Holiday City are , and White / Caucasian (18 | 100.0%).
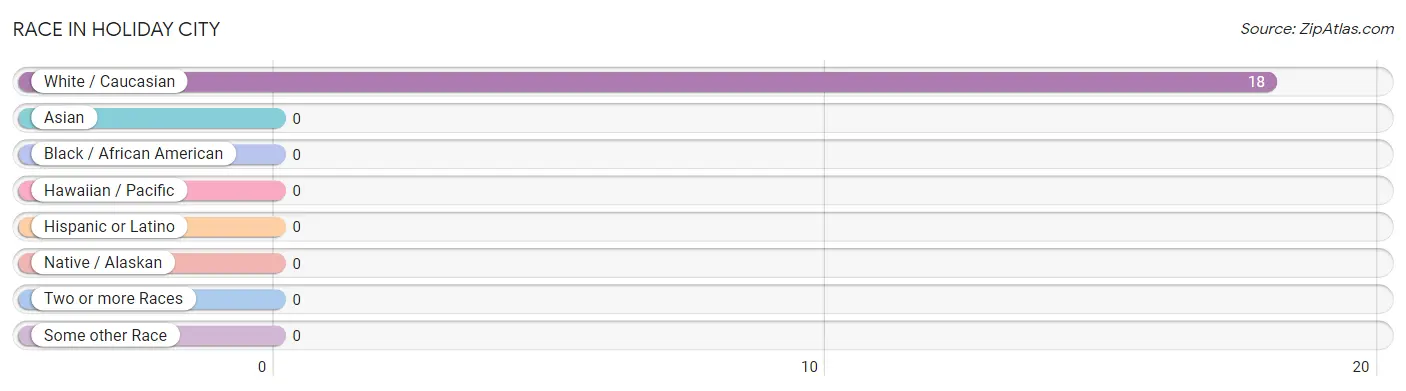
| Race | # Population | % Population |
| Asian | 0 | 0.0% |
| Black / African American | 0 | 0.0% |
| Hawaiian / Pacific | 0 | 0.0% |
| Hispanic or Latino | 0 | 0.0% |
| Native / Alaskan | 0 | 0.0% |
| White / Caucasian | 18 | 100.0% |
| Two or more Races | 0 | 0.0% |
| Some other Race | 0 | 0.0% |
| Total | 18 | 100.0% |
Ancestry in Holiday City
The most populous ancestries reported in Holiday City are German (3 | 16.7%), Irish (2 | 11.1%), Polish (2 | 11.1%), and Welsh (1 | 5.6%), together accounting for 44.5% of all Holiday City residents.
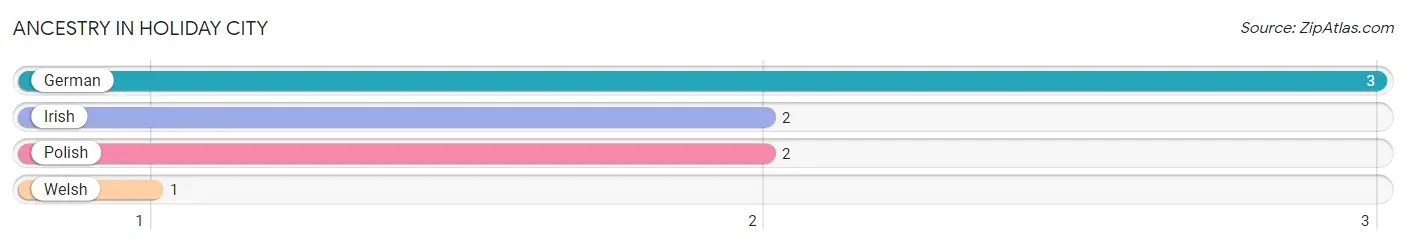
| Ancestry | # Population | % Population |
| German | 3 | 16.7% |
| Irish | 2 | 11.1% |
| Polish | 2 | 11.1% |
| Welsh | 1 | 5.6% | View All 4 Rows |
Immigrants in Holiday City

| Immigration Origin | # Population | % Population | View All 0 Rows |
Sex and Age in Holiday City
Sex and Age in Holiday City
The most populous age groups in Holiday City are 45 to 49 Years (5 | 33.3%) for men and 50 to 54 Years (1 | 33.3%) for women.
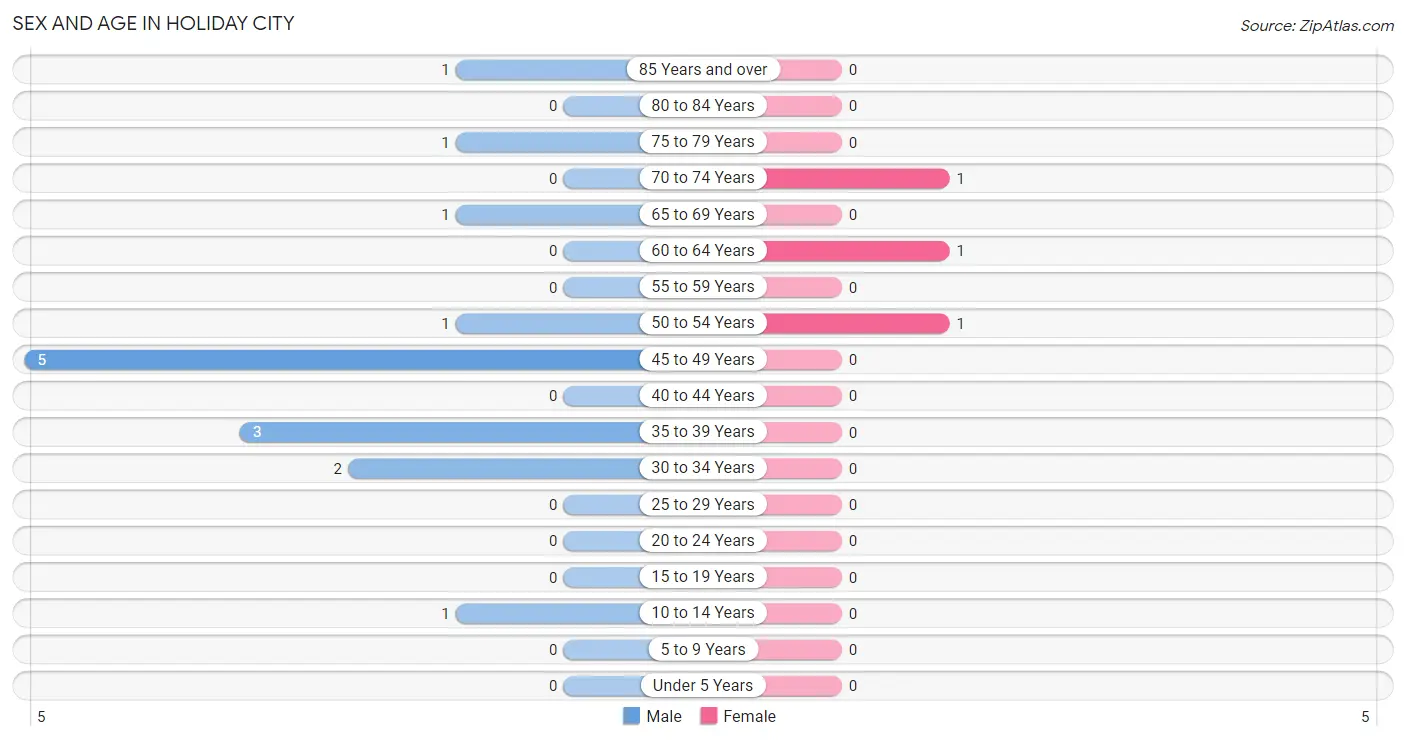
| Age Bracket | Male | Female |
| Under 5 Years | 0 (0.0%) | 0 (0.0%) |
| 5 to 9 Years | 0 (0.0%) | 0 (0.0%) |
| 10 to 14 Years | 1 (6.7%) | 0 (0.0%) |
| 15 to 19 Years | 0 (0.0%) | 0 (0.0%) |
| 20 to 24 Years | 0 (0.0%) | 0 (0.0%) |
| 25 to 29 Years | 0 (0.0%) | 0 (0.0%) |
| 30 to 34 Years | 2 (13.3%) | 0 (0.0%) |
| 35 to 39 Years | 3 (20.0%) | 0 (0.0%) |
| 40 to 44 Years | 0 (0.0%) | 0 (0.0%) |
| 45 to 49 Years | 5 (33.3%) | 0 (0.0%) |
| 50 to 54 Years | 1 (6.7%) | 1 (33.3%) |
| 55 to 59 Years | 0 (0.0%) | 0 (0.0%) |
| 60 to 64 Years | 0 (0.0%) | 1 (33.3%) |
| 65 to 69 Years | 1 (6.7%) | 0 (0.0%) |
| 70 to 74 Years | 0 (0.0%) | 1 (33.3%) |
| 75 to 79 Years | 1 (6.7%) | 0 (0.0%) |
| 80 to 84 Years | 0 (0.0%) | 0 (0.0%) |
| 85 Years and over | 1 (6.7%) | 0 (0.0%) |
| Total | 15 (100.0%) | 3 (100.0%) |
Families and Households in Holiday City
Median Family Size in Holiday City
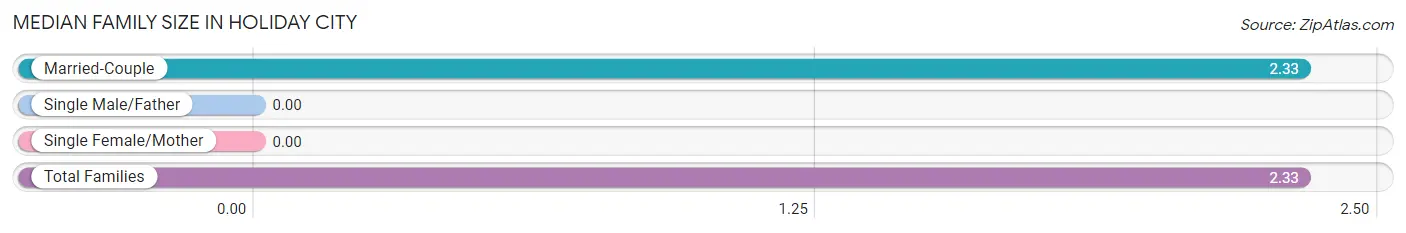
| Family Type | # Families | Family Size |
| Married-Couple | 3 (100.0%) | 2.33 |
| Single Male/Father | 0 (0.0%) | - |
| Single Female/Mother | 0 (0.0%) | - |
| Total Families | 3 (100.0%) | 2.33 |
Median Household Size in Holiday City
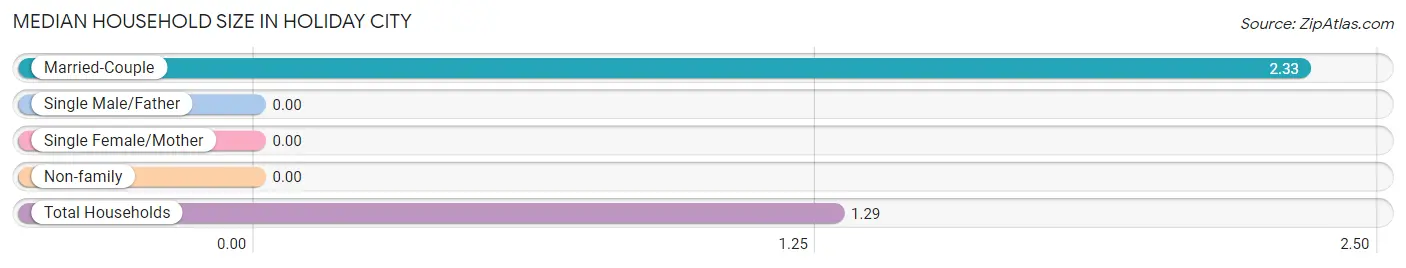
| Household Type | # Households | Household Size |
| Married-Couple | 3 (21.4%) | 2.33 |
| Single Male/Father | 0 (0.0%) | - |
| Single Female/Mother | 0 (0.0%) | - |
| Non-family | 11 (78.6%) | - |
| Total Households | 14 (100.0%) | 1.29 |
Household Size by Marriage Status in Holiday City
Out of a total of 14 households in Holiday City, 3 (21.4%) are family households, while 11 (78.6%) are nonfamily households. The most numerous type of family households are 2-person households, comprising 2, and the most common type of nonfamily households are 1-person households, comprising 11.
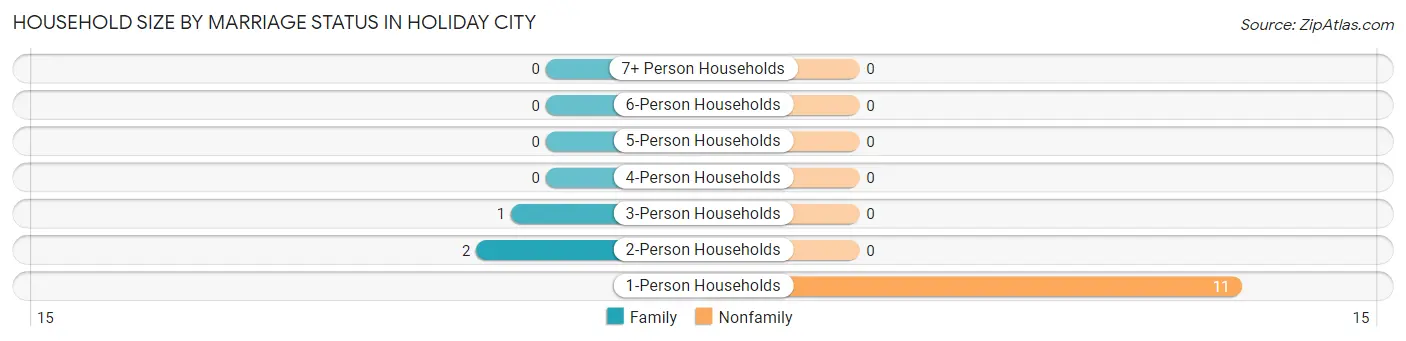
| Household Size | Family Households | Nonfamily Households |
| 1-Person Households | - | 11 (78.6%) |
| 2-Person Households | 2 (14.3%) | 0 (0.0%) |
| 3-Person Households | 1 (7.1%) | 0 (0.0%) |
| 4-Person Households | 0 (0.0%) | 0 (0.0%) |
| 5-Person Households | 0 (0.0%) | 0 (0.0%) |
| 6-Person Households | 0 (0.0%) | 0 (0.0%) |
| 7+ Person Households | 0 (0.0%) | 0 (0.0%) |
| Total | 3 (21.4%) | 11 (78.6%) |
Female Fertility in Holiday City
Fertility by Age in Holiday City
| Age Bracket | Women with Births | Births / 1,000 Women |
| 15 to 19 years | 0 (0.0%) | 0.0 |
| 20 to 34 years | 0 (0.0%) | 0.0 |
| 35 to 50 years | 0 (0.0%) | 0.0 |
| Total | 0 (0.0%) | 0.0 |
Fertility by Age by Marriage Status in Holiday City
| Age Bracket | Married | Unmarried |
| 15 to 19 years | 0 (0.0%) | 0 (0.0%) |
| 20 to 34 years | 0 (0.0%) | 0 (0.0%) |
| 35 to 50 years | 0 (0.0%) | 0 (0.0%) |
| Total | 0 (0.0%) | 0 (0.0%) |
Fertility by Education in Holiday City
| Educational Attainment | Women with Births | Births / 1,000 Women |
| Less than High School | 0 (0.0%) | 0.0 |
| High School Diploma | 0 (0.0%) | 0.0 |
| College or Associate's Degree | 0 (0.0%) | 0.0 |
| Bachelor's Degree | 0 (0.0%) | 0.0 |
| Graduate Degree | 0 (0.0%) | 0.0 |
| Total | 0 (0.0%) | 0.0 |
Fertility by Education by Marriage Status in Holiday City
| Educational Attainment | Married | Unmarried |
| Less than High School | 0 (0.0%) | 0 (0.0%) |
| High School Diploma | 0 (0.0%) | 0 (0.0%) |
| College or Associate's Degree | 0 (0.0%) | 0 (0.0%) |
| Bachelor's Degree | 0 (0.0%) | 0 (0.0%) |
| Graduate Degree | 0 (0.0%) | 0 (0.0%) |
| Total | 0 (0.0%) | 0 (0.0%) |
Employment Characteristics in Holiday City
Employment by Class of Employer in Holiday City
Among the 13 employed individuals in Holiday City, private company employees (10 | 76.9%), not-for-profit organizations (1 | 7.7%), and local government employees (1 | 7.7%) make up the most common classes of employment.
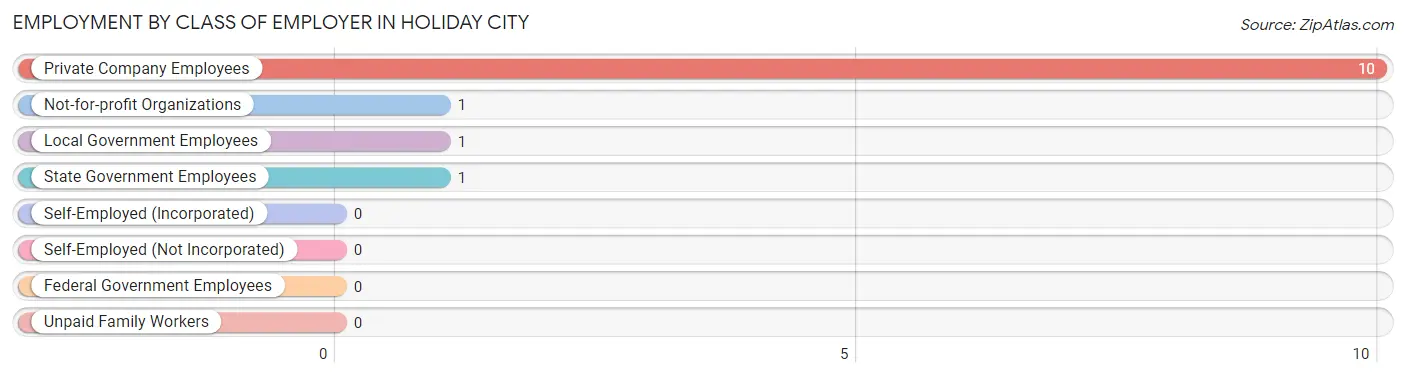
| Employer Class | # Employees | % Employees |
| Private Company Employees | 10 | 76.9% |
| Self-Employed (Incorporated) | 0 | 0.0% |
| Self-Employed (Not Incorporated) | 0 | 0.0% |
| Not-for-profit Organizations | 1 | 7.7% |
| Local Government Employees | 1 | 7.7% |
| State Government Employees | 1 | 7.7% |
| Federal Government Employees | 0 | 0.0% |
| Unpaid Family Workers | 0 | 0.0% |
| Total | 13 | 100.0% |
Employment Status by Age in Holiday City
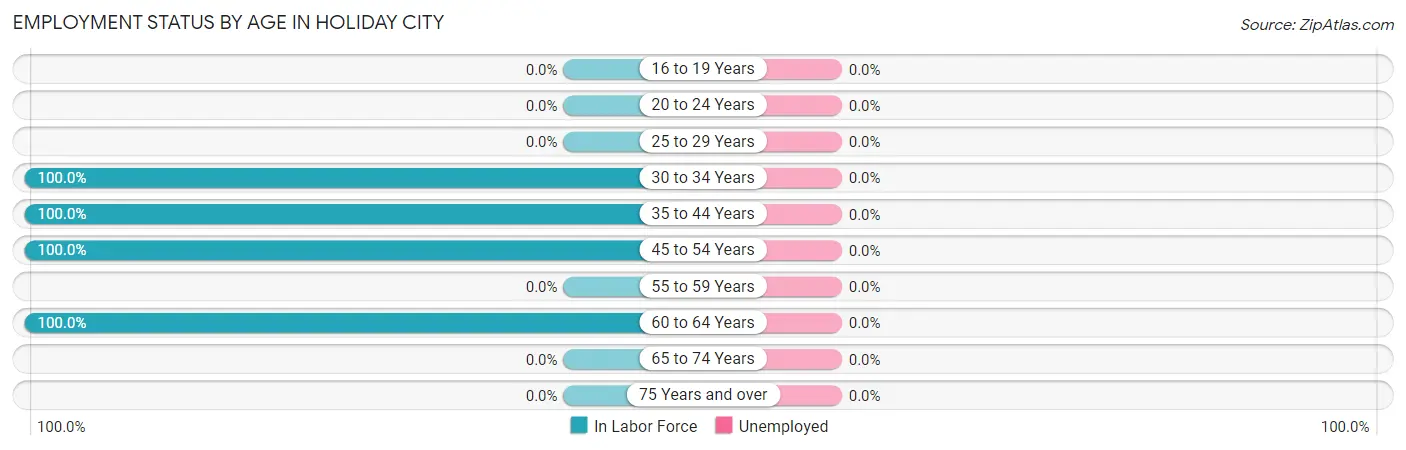
| Age Bracket | In Labor Force | Unemployed |
| 16 to 19 Years | 0 (0.0%) | 0 (0.0%) |
| 20 to 24 Years | 0 (0.0%) | 0 (0.0%) |
| 25 to 29 Years | 0 (0.0%) | 0 (0.0%) |
| 30 to 34 Years | 2 (100.0%) | 0 (0.0%) |
| 35 to 44 Years | 3 (100.0%) | 0 (0.0%) |
| 45 to 54 Years | 7 (100.0%) | 0 (0.0%) |
| 55 to 59 Years | 0 (0.0%) | 0 (0.0%) |
| 60 to 64 Years | 1 (100.0%) | 0 (0.0%) |
| 65 to 74 Years | 0 (0.0%) | 0 (0.0%) |
| 75 Years and over | 0 (0.0%) | 0 (0.0%) |
| Total | 13 (76.5%) | 0 (0.0%) |
Employment Status by Educational Attainment in Holiday City

| Educational Attainment | In Labor Force | Unemployed |
| Less than High School | 0 (0.0%) | 0 (0.0%) |
| High School Diploma | 6 (100.0%) | 0 (0.0%) |
| College / Associate Degree | 1 (100.0%) | 0 (0.0%) |
| Bachelor's Degree or higher | 6 (100.0%) | 0 (0.0%) |
| Total | 13 (100.0%) | 0 (0.0%) |
Employment Occupations by Sex in Holiday City
Management, Business, Science and Arts Occupations
The most common Management, Business, Science and Arts occupations in Holiday City are , and Management (2 | 15.4%).
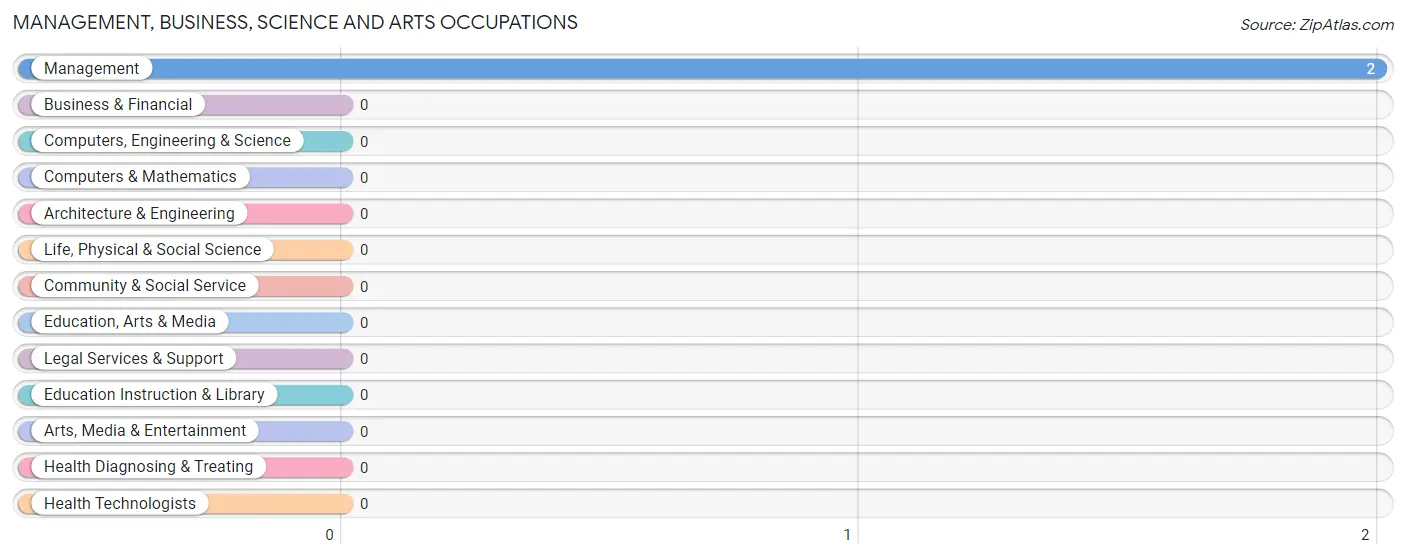
Management, Business, Science and Arts Occupations by Sex
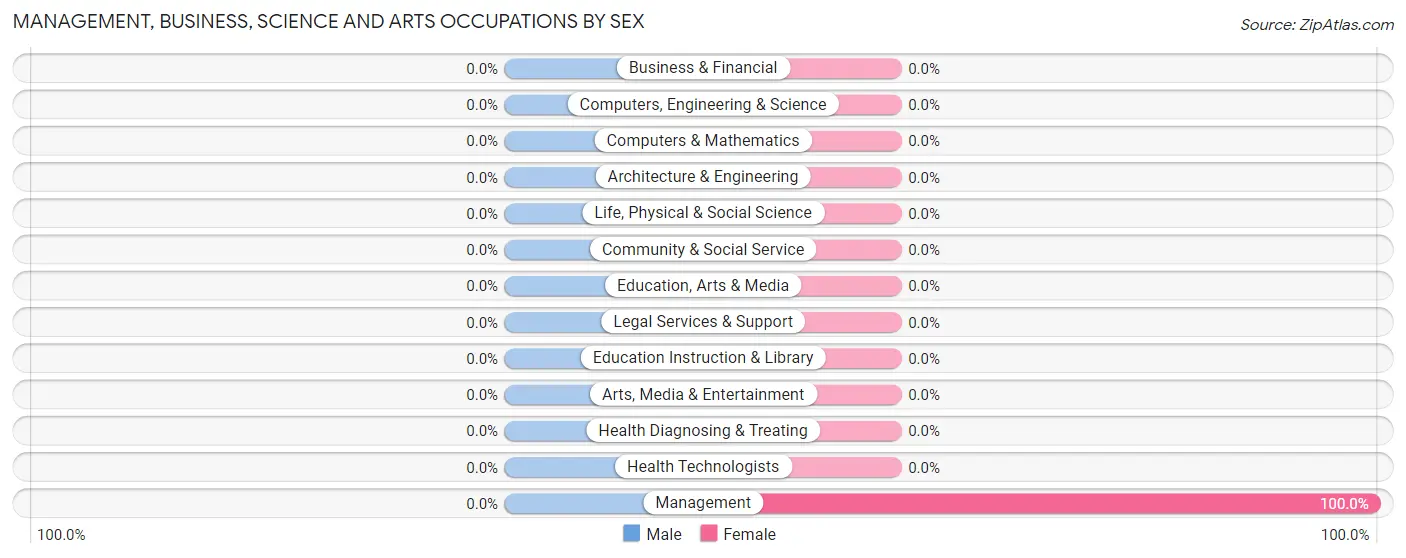
| Occupation | Male | Female |
| Management | 0 (0.0%) | 2 (100.0%) |
| Business & Financial | 0 (0.0%) | 0 (0.0%) |
| Computers, Engineering & Science | 0 (0.0%) | 0 (0.0%) |
| Computers & Mathematics | 0 (0.0%) | 0 (0.0%) |
| Architecture & Engineering | 0 (0.0%) | 0 (0.0%) |
| Life, Physical & Social Science | 0 (0.0%) | 0 (0.0%) |
| Community & Social Service | 0 (0.0%) | 0 (0.0%) |
| Education, Arts & Media | 0 (0.0%) | 0 (0.0%) |
| Legal Services & Support | 0 (0.0%) | 0 (0.0%) |
| Education Instruction & Library | 0 (0.0%) | 0 (0.0%) |
| Arts, Media & Entertainment | 0 (0.0%) | 0 (0.0%) |
| Health Diagnosing & Treating | 0 (0.0%) | 0 (0.0%) |
| Health Technologists | 0 (0.0%) | 0 (0.0%) |
| Total (Category) | 0 (0.0%) | 2 (100.0%) |
| Total (Overall) | 11 (84.6%) | 2 (15.4%) |
Services Occupations
The most common Services occupations in Holiday City are , and Food Preparation & Serving (2 | 15.4%).
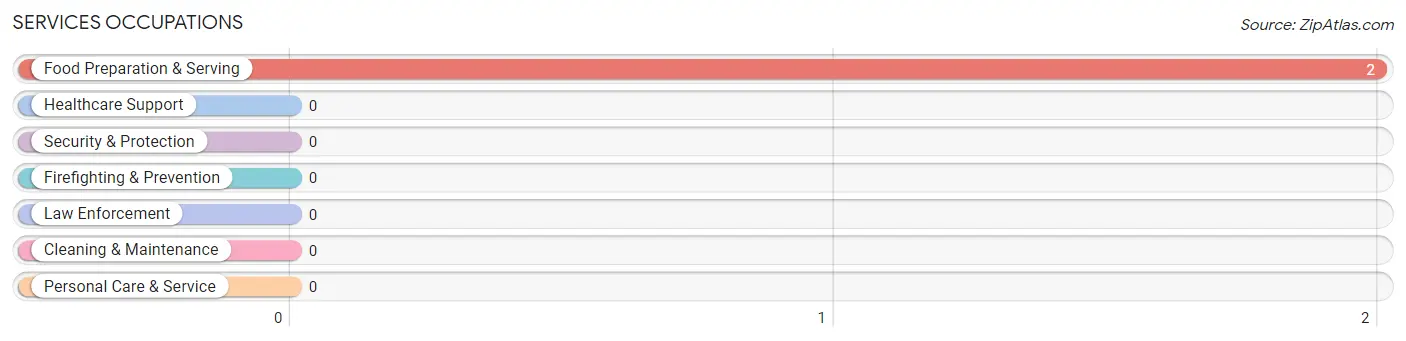
Services Occupations by Sex
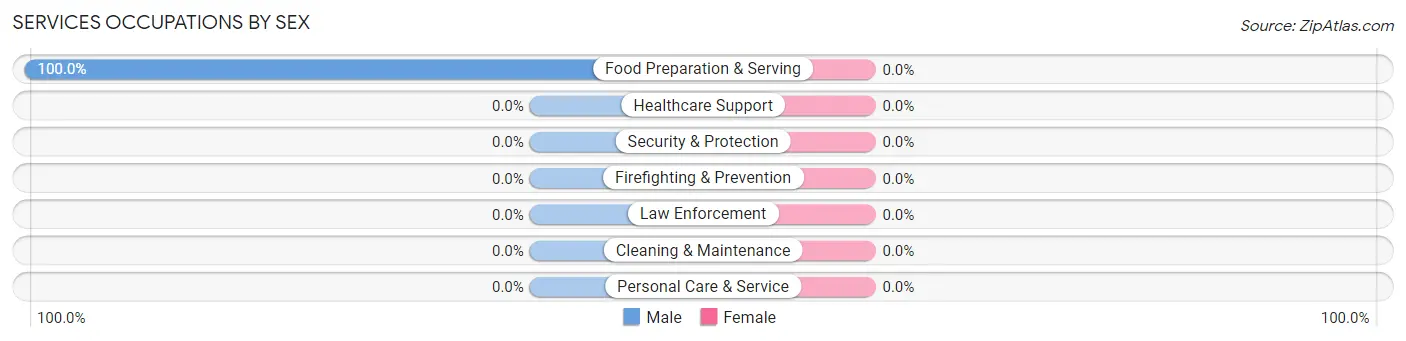
| Occupation | Male | Female |
| Healthcare Support | 0 (0.0%) | 0 (0.0%) |
| Security & Protection | 0 (0.0%) | 0 (0.0%) |
| Firefighting & Prevention | 0 (0.0%) | 0 (0.0%) |
| Law Enforcement | 0 (0.0%) | 0 (0.0%) |
| Food Preparation & Serving | 2 (100.0%) | 0 (0.0%) |
| Cleaning & Maintenance | 0 (0.0%) | 0 (0.0%) |
| Personal Care & Service | 0 (0.0%) | 0 (0.0%) |
| Total (Category) | 2 (100.0%) | 0 (0.0%) |
| Total (Overall) | 11 (84.6%) | 2 (15.4%) |
Sales and Office Occupations
The most common Sales and Office occupations in Holiday City are , and Office & Administration (5 | 38.5%).
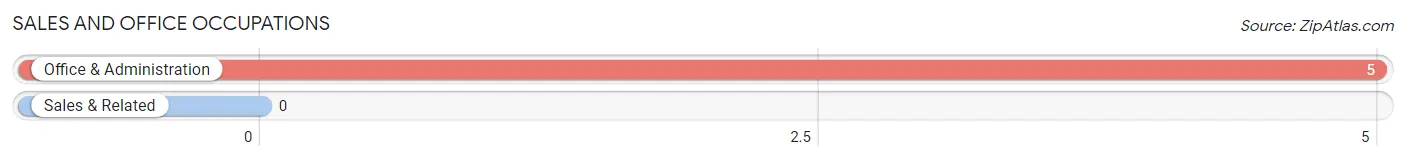
Sales and Office Occupations by Sex
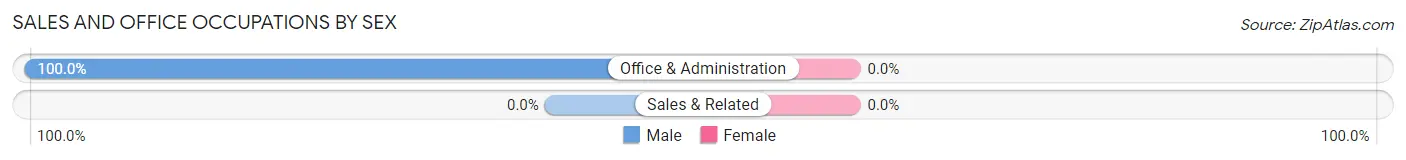
| Occupation | Male | Female |
| Sales & Related | 0 (0.0%) | 0 (0.0%) |
| Office & Administration | 5 (100.0%) | 0 (0.0%) |
| Total (Category) | 5 (100.0%) | 0 (0.0%) |
| Total (Overall) | 11 (84.6%) | 2 (15.4%) |
Natural Resources, Construction and Maintenance Occupations
The most common Natural Resources, Construction and Maintenance occupations in Holiday City are , and Construction & Extraction (1 | 7.7%).
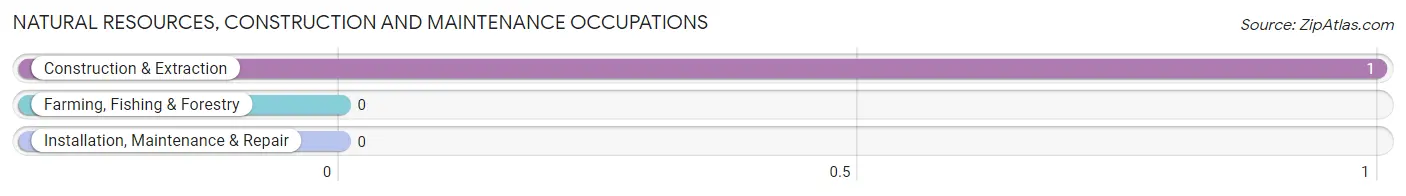
Natural Resources, Construction and Maintenance Occupations by Sex
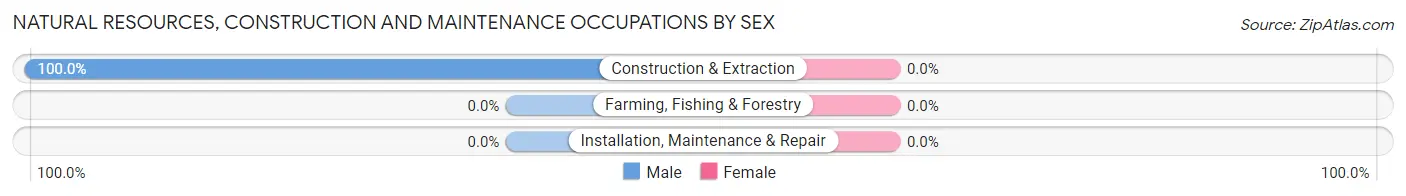
| Occupation | Male | Female |
| Farming, Fishing & Forestry | 0 (0.0%) | 0 (0.0%) |
| Construction & Extraction | 1 (100.0%) | 0 (0.0%) |
| Installation, Maintenance & Repair | 0 (0.0%) | 0 (0.0%) |
| Total (Category) | 1 (100.0%) | 0 (0.0%) |
| Total (Overall) | 11 (84.6%) | 2 (15.4%) |
Production, Transportation and Moving Occupations
The most common Production, Transportation and Moving occupations in Holiday City are , and Material Moving (3 | 23.1%).
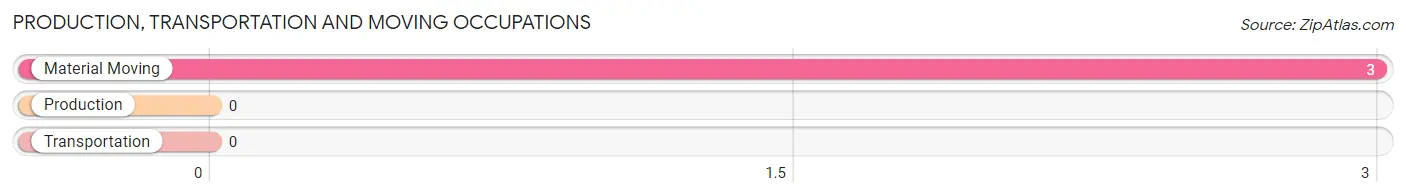
Production, Transportation and Moving Occupations by Sex
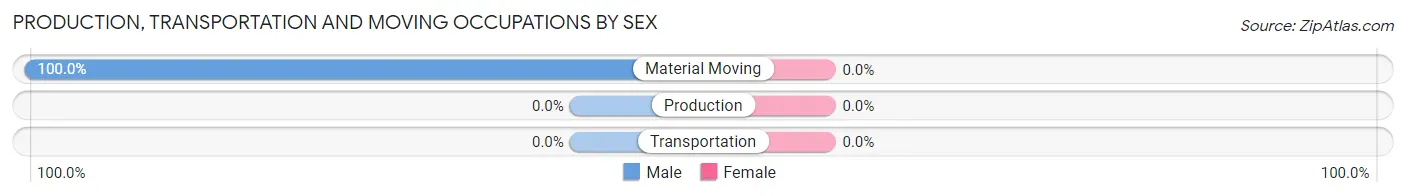
| Occupation | Male | Female |
| Production | 0 (0.0%) | 0 (0.0%) |
| Transportation | 0 (0.0%) | 0 (0.0%) |
| Material Moving | 3 (100.0%) | 0 (0.0%) |
| Total (Category) | 3 (100.0%) | 0 (0.0%) |
| Total (Overall) | 11 (84.6%) | 2 (15.4%) |
Employment Industries by Sex in Holiday City
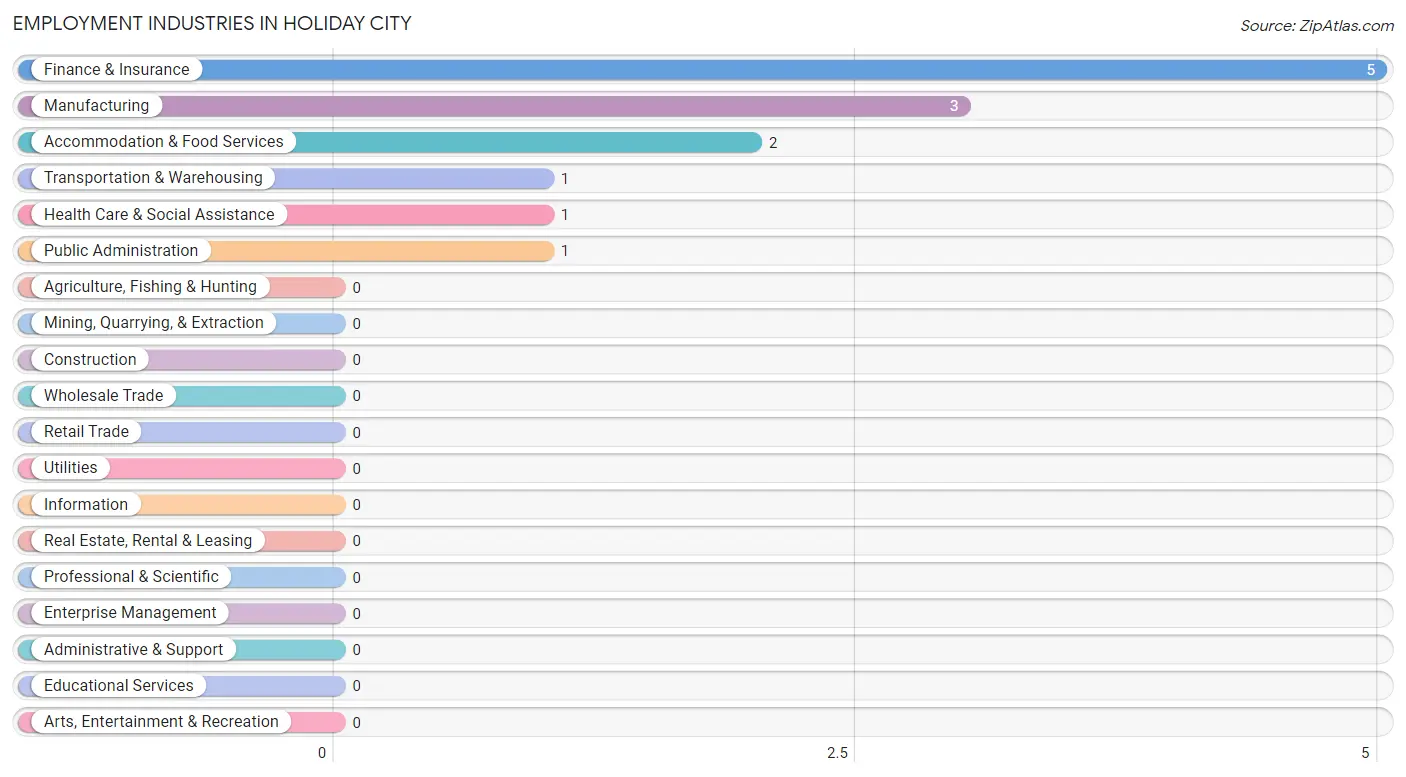
Employment Industries in Holiday City
The major employment industries in Holiday City include Finance & Insurance (5 | 38.5%), Manufacturing (3 | 23.1%), Accommodation & Food Services (2 | 15.4%), Transportation & Warehousing (1 | 7.7%), and Health Care & Social Assistance (1 | 7.7%).
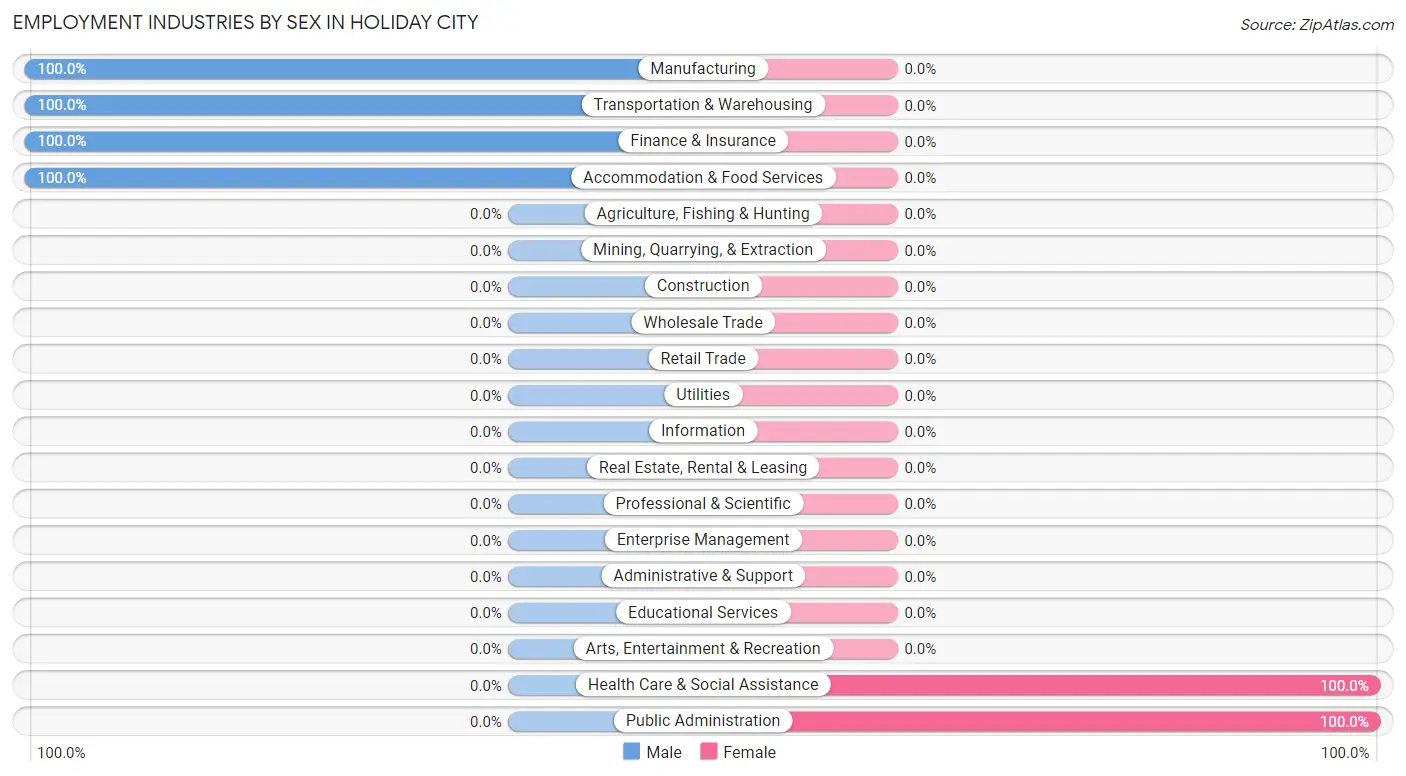
Employment Industries by Sex in Holiday City
The Holiday City industries that see more men than women are Manufacturing (100.0%), Transportation & Warehousing (100.0%), and Finance & Insurance (100.0%), whereas the industries that tend to have a higher number of women are Health Care & Social Assistance (100.0%), and Public Administration (100.0%).
| Industry | Male | Female |
| Agriculture, Fishing & Hunting | 0 (0.0%) | 0 (0.0%) |
| Mining, Quarrying, & Extraction | 0 (0.0%) | 0 (0.0%) |
| Construction | 0 (0.0%) | 0 (0.0%) |
| Manufacturing | 3 (100.0%) | 0 (0.0%) |
| Wholesale Trade | 0 (0.0%) | 0 (0.0%) |
| Retail Trade | 0 (0.0%) | 0 (0.0%) |
| Transportation & Warehousing | 1 (100.0%) | 0 (0.0%) |
| Utilities | 0 (0.0%) | 0 (0.0%) |
| Information | 0 (0.0%) | 0 (0.0%) |
| Finance & Insurance | 5 (100.0%) | 0 (0.0%) |
| Real Estate, Rental & Leasing | 0 (0.0%) | 0 (0.0%) |
| Professional & Scientific | 0 (0.0%) | 0 (0.0%) |
| Enterprise Management | 0 (0.0%) | 0 (0.0%) |
| Administrative & Support | 0 (0.0%) | 0 (0.0%) |
| Educational Services | 0 (0.0%) | 0 (0.0%) |
| Health Care & Social Assistance | 0 (0.0%) | 1 (100.0%) |
| Arts, Entertainment & Recreation | 0 (0.0%) | 0 (0.0%) |
| Accommodation & Food Services | 2 (100.0%) | 0 (0.0%) |
| Public Administration | 0 (0.0%) | 1 (100.0%) |
| Total | 11 (84.6%) | 2 (15.4%) |
Education in Holiday City
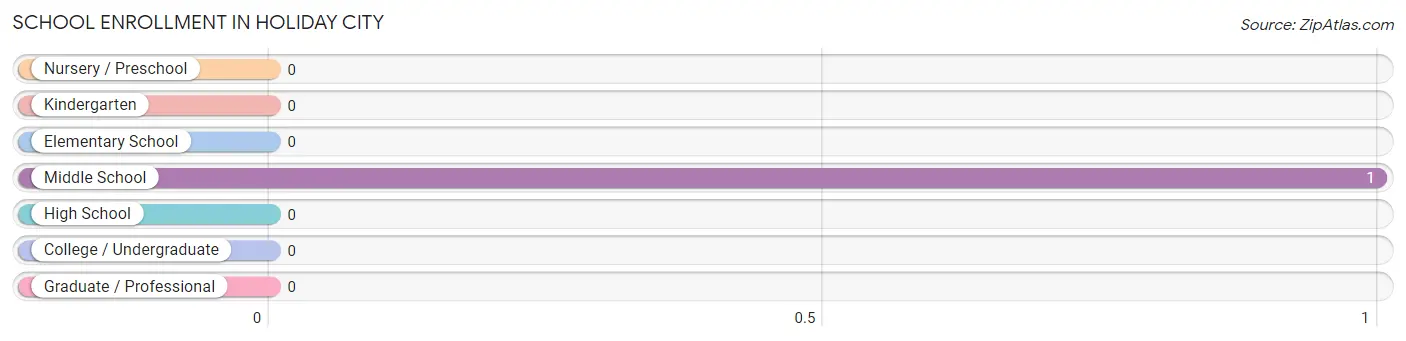
School Enrollment in Holiday City
| School Level | # Students | % Students |
| Nursery / Preschool | 0 | 0.0% |
| Kindergarten | 0 | 0.0% |
| Elementary School | 0 | 0.0% |
| Middle School | 1 | 100.0% |
| High School | 0 | 0.0% |
| College / Undergraduate | 0 | 0.0% |
| Graduate / Professional | 0 | 0.0% |
| Total | 1 | 100.0% |
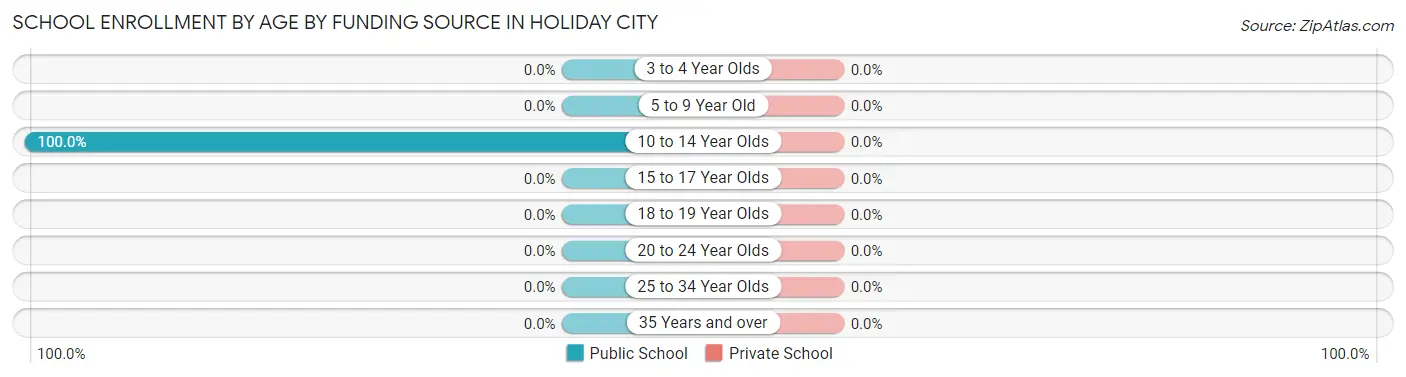
School Enrollment by Age by Funding Source in Holiday City
| Age Bracket | Public School | Private School |
| 3 to 4 Year Olds | 0 (0.0%) | 0 (0.0%) |
| 5 to 9 Year Old | 0 (0.0%) | 0 (0.0%) |
| 10 to 14 Year Olds | 1 (100.0%) | 0 (0.0%) |
| 15 to 17 Year Olds | 0 (0.0%) | 0 (0.0%) |
| 18 to 19 Year Olds | 0 (0.0%) | 0 (0.0%) |
| 20 to 24 Year Olds | 0 (0.0%) | 0 (0.0%) |
| 25 to 34 Year Olds | 0 (0.0%) | 0 (0.0%) |
| 35 Years and over | 0 (0.0%) | 0 (0.0%) |
| Total | 1 (100.0%) | 0 (0.0%) |
Educational Attainment by Field of Study in Holiday City
Bio, nature & agricultural (5 | 41.7%), psychology (5 | 41.7%), business (1 | 8.3%), and education (1 | 8.3%) are the most common fields of study among 12 individuals in Holiday City who have obtained a bachelor's degree or higher.
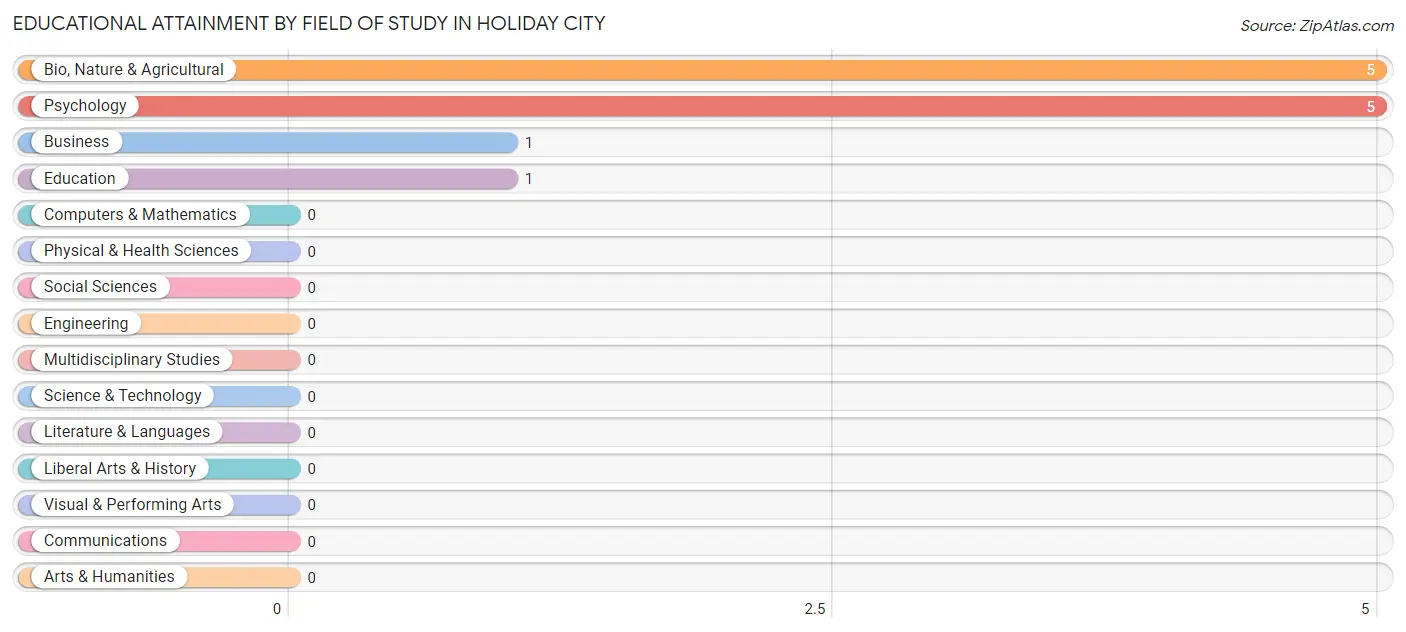
| Field of Study | # Graduates | % Graduates |
| Computers & Mathematics | 0 | 0.0% |
| Bio, Nature & Agricultural | 5 | 41.7% |
| Physical & Health Sciences | 0 | 0.0% |
| Psychology | 5 | 41.7% |
| Social Sciences | 0 | 0.0% |
| Engineering | 0 | 0.0% |
| Multidisciplinary Studies | 0 | 0.0% |
| Science & Technology | 0 | 0.0% |
| Business | 1 | 8.3% |
| Education | 1 | 8.3% |
| Literature & Languages | 0 | 0.0% |
| Liberal Arts & History | 0 | 0.0% |
| Visual & Performing Arts | 0 | 0.0% |
| Communications | 0 | 0.0% |
| Arts & Humanities | 0 | 0.0% |
| Total | 12 | 100.0% |
Transportation & Commute in Holiday City
Vehicle Availability by Sex in Holiday City
The most prevalent vehicle ownership categories in Holiday City are males with 2 vehicles (9, accounting for 81.8%) and females with 2 vehicles (1, making up 450.0%).
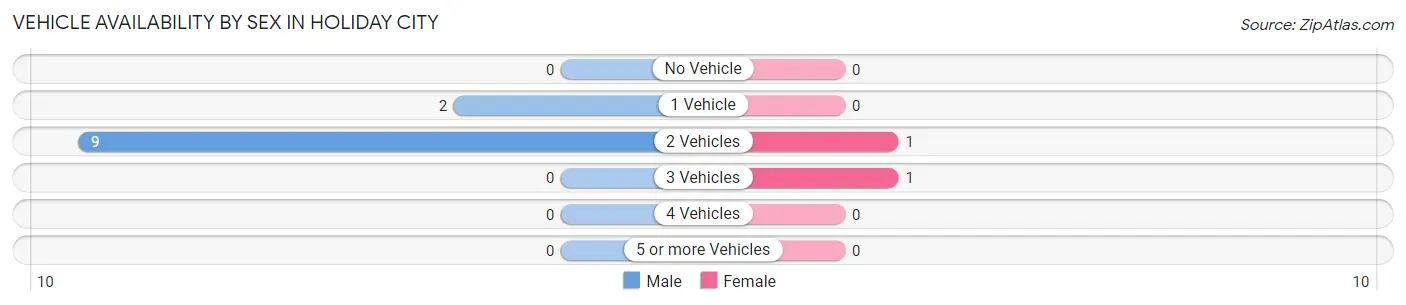
| Vehicles Available | Male | Female |
| No Vehicle | 0 (0.0%) | 0 (0.0%) |
| 1 Vehicle | 2 (18.2%) | 0 (0.0%) |
| 2 Vehicles | 9 (81.8%) | 1 (50.0%) |
| 3 Vehicles | 0 (0.0%) | 1 (50.0%) |
| 4 Vehicles | 0 (0.0%) | 0 (0.0%) |
| 5 or more Vehicles | 0 (0.0%) | 0 (0.0%) |
| Total | 11 (100.0%) | 2 (100.0%) |
Commute Time in Holiday City
The most frequently occuring commute durations in Holiday City are 40 to 44 minutes (5 commuters, 41.7%), 5 to 9 minutes (4 commuters, 33.3%), and less than 5 minutes (3 commuters, 25.0%).
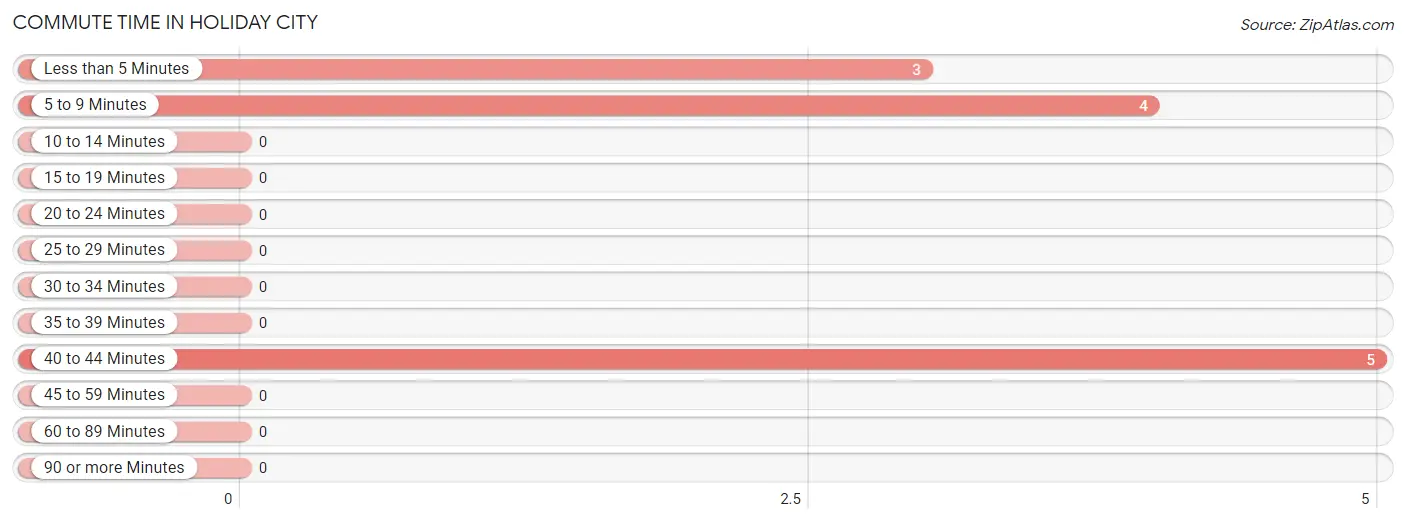
| Commute Time | # Commuters | % Commuters |
| Less than 5 Minutes | 3 | 25.0% |
| 5 to 9 Minutes | 4 | 33.3% |
| 10 to 14 Minutes | 0 | 0.0% |
| 15 to 19 Minutes | 0 | 0.0% |
| 20 to 24 Minutes | 0 | 0.0% |
| 25 to 29 Minutes | 0 | 0.0% |
| 30 to 34 Minutes | 0 | 0.0% |
| 35 to 39 Minutes | 0 | 0.0% |
| 40 to 44 Minutes | 5 | 41.7% |
| 45 to 59 Minutes | 0 | 0.0% |
| 60 to 89 Minutes | 0 | 0.0% |
| 90 or more Minutes | 0 | 0.0% |
Commute Time by Sex in Holiday City
The most common commute times in Holiday City are 40 to 44 minutes (5 commuters, 45.5%) for males and less than 5 minutes (1 commuters, 100.0%) for females.
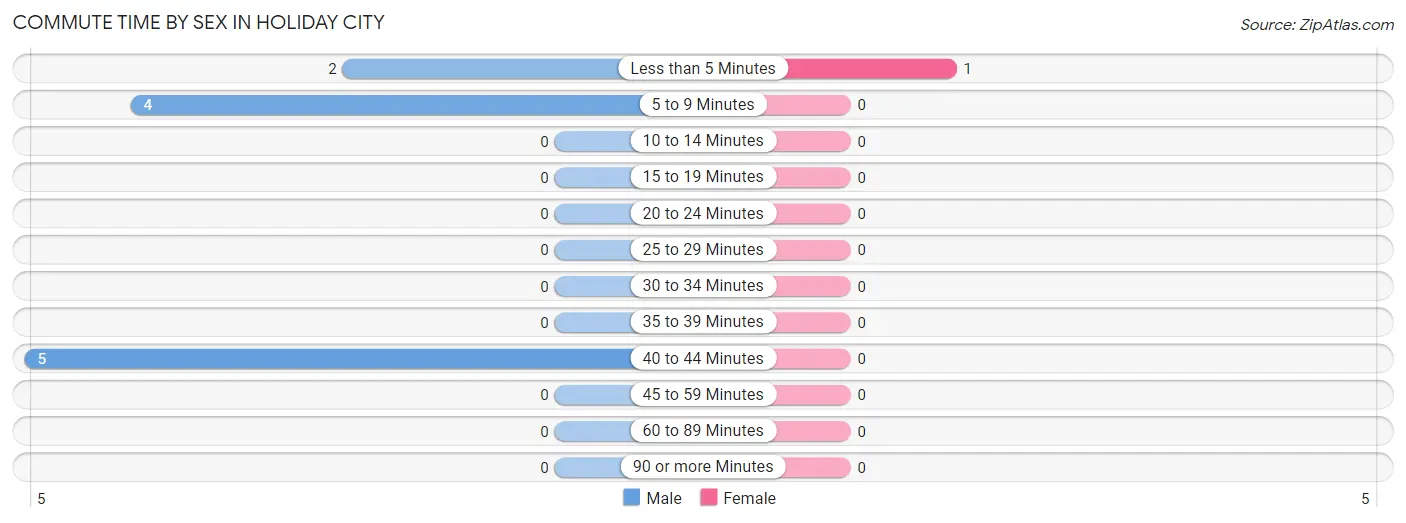
| Commute Time | Male | Female |
| Less than 5 Minutes | 2 (18.2%) | 1 (100.0%) |
| 5 to 9 Minutes | 4 (36.4%) | 0 (0.0%) |
| 10 to 14 Minutes | 0 (0.0%) | 0 (0.0%) |
| 15 to 19 Minutes | 0 (0.0%) | 0 (0.0%) |
| 20 to 24 Minutes | 0 (0.0%) | 0 (0.0%) |
| 25 to 29 Minutes | 0 (0.0%) | 0 (0.0%) |
| 30 to 34 Minutes | 0 (0.0%) | 0 (0.0%) |
| 35 to 39 Minutes | 0 (0.0%) | 0 (0.0%) |
| 40 to 44 Minutes | 5 (45.5%) | 0 (0.0%) |
| 45 to 59 Minutes | 0 (0.0%) | 0 (0.0%) |
| 60 to 89 Minutes | 0 (0.0%) | 0 (0.0%) |
| 90 or more Minutes | 0 (0.0%) | 0 (0.0%) |
Time of Departure to Work by Sex in Holiday City
The most frequent times of departure to work in Holiday City are 7:30 AM to 7:59 AM (5, 45.5%) for males and 4:00 PM to 11:59 PM (1, 100.0%) for females.
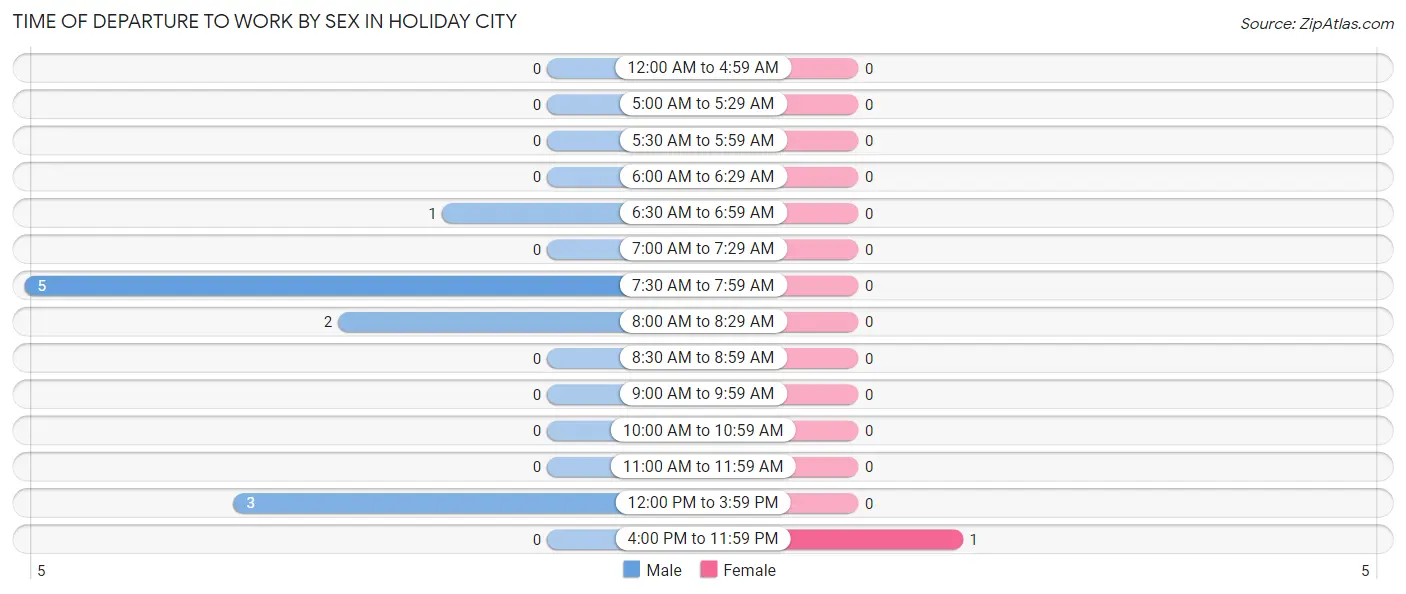
| Time of Departure | Male | Female |
| 12:00 AM to 4:59 AM | 0 (0.0%) | 0 (0.0%) |
| 5:00 AM to 5:29 AM | 0 (0.0%) | 0 (0.0%) |
| 5:30 AM to 5:59 AM | 0 (0.0%) | 0 (0.0%) |
| 6:00 AM to 6:29 AM | 0 (0.0%) | 0 (0.0%) |
| 6:30 AM to 6:59 AM | 1 (9.1%) | 0 (0.0%) |
| 7:00 AM to 7:29 AM | 0 (0.0%) | 0 (0.0%) |
| 7:30 AM to 7:59 AM | 5 (45.5%) | 0 (0.0%) |
| 8:00 AM to 8:29 AM | 2 (18.2%) | 0 (0.0%) |
| 8:30 AM to 8:59 AM | 0 (0.0%) | 0 (0.0%) |
| 9:00 AM to 9:59 AM | 0 (0.0%) | 0 (0.0%) |
| 10:00 AM to 10:59 AM | 0 (0.0%) | 0 (0.0%) |
| 11:00 AM to 11:59 AM | 0 (0.0%) | 0 (0.0%) |
| 12:00 PM to 3:59 PM | 3 (27.3%) | 0 (0.0%) |
| 4:00 PM to 11:59 PM | 0 (0.0%) | 1 (100.0%) |
| Total | 11 (100.0%) | 1 (100.0%) |
Housing Occupancy in Holiday City
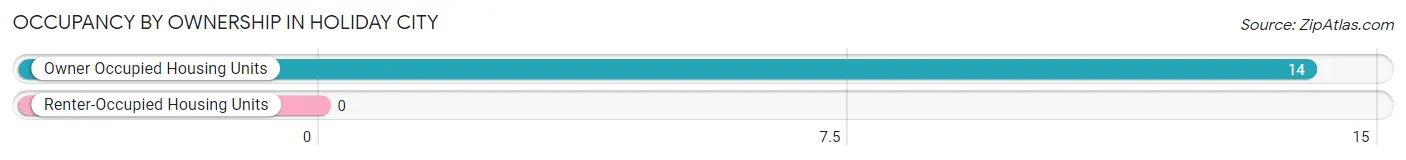
Occupancy by Ownership in Holiday City
Of the total 14 dwellings in Holiday City, owner-occupied units account for 14 (100.0%), while renter-occupied units make up 0 (0.0%).
| Occupancy | # Housing Units | % Housing Units |
| Owner Occupied Housing Units | 14 | 100.0% |
| Renter-Occupied Housing Units | 0 | 0.0% |
| Total Occupied Housing Units | 14 | 100.0% |
Occupancy by Household Size in Holiday City
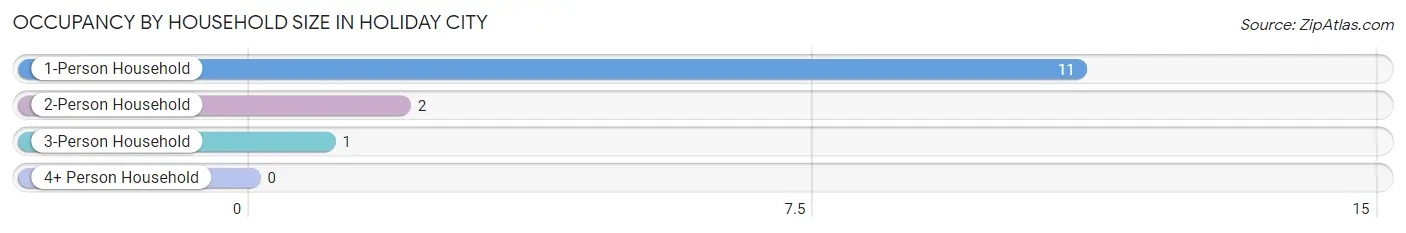
| Household Size | # Housing Units | % Housing Units |
| 1-Person Household | 11 | 78.6% |
| 2-Person Household | 2 | 14.3% |
| 3-Person Household | 1 | 7.1% |
| 4+ Person Household | 0 | 0.0% |
| Total Housing Units | 14 | 100.0% |
Occupancy by Ownership by Household Size in Holiday City
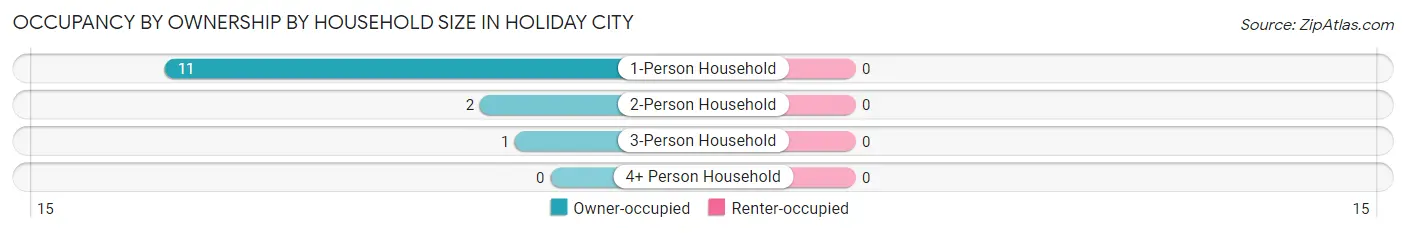
| Household Size | Owner-occupied | Renter-occupied |
| 1-Person Household | 11 (100.0%) | 0 (0.0%) |
| 2-Person Household | 2 (100.0%) | 0 (0.0%) |
| 3-Person Household | 1 (100.0%) | 0 (0.0%) |
| 4+ Person Household | 0 (0.0%) | 0 (0.0%) |
| Total Housing Units | 14 (100.0%) | 0 (0.0%) |
Occupancy by Educational Attainment in Holiday City
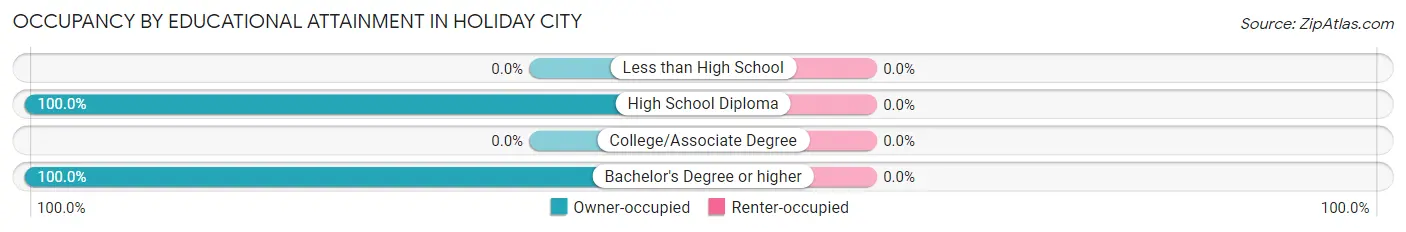
| Household Size | Owner-occupied | Renter-occupied |
| Less than High School | 0 (0.0%) | 0 (0.0%) |
| High School Diploma | 8 (100.0%) | 0 (0.0%) |
| College/Associate Degree | 0 (0.0%) | 0 (0.0%) |
| Bachelor's Degree or higher | 6 (100.0%) | 0 (0.0%) |
Occupancy by Age of Householder in Holiday City
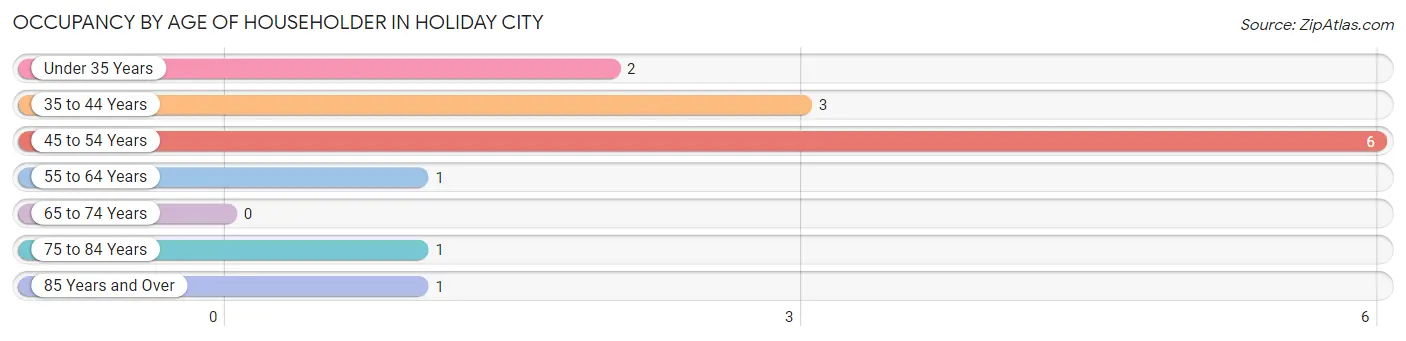
| Age Bracket | # Households | % Households |
| Under 35 Years | 2 | 14.3% |
| 35 to 44 Years | 3 | 21.4% |
| 45 to 54 Years | 6 | 42.9% |
| 55 to 64 Years | 1 | 7.1% |
| 65 to 74 Years | 0 | 0.0% |
| 75 to 84 Years | 1 | 7.1% |
| 85 Years and Over | 1 | 7.1% |
| Total | 14 | 100.0% |
Housing Finances in Holiday City
Median Income by Occupancy in Holiday City
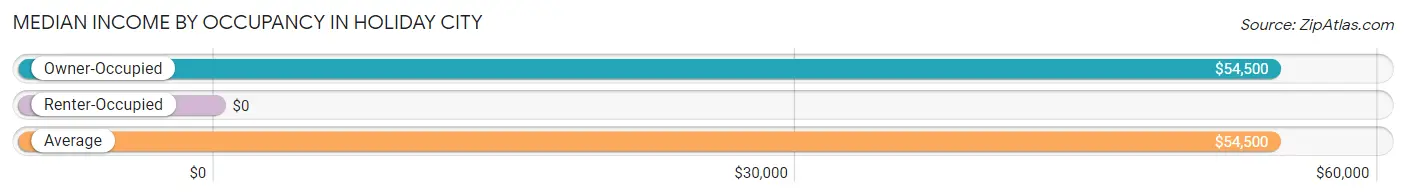
| Occupancy Type | # Households | Median Income |
| Owner-Occupied | 14 (100.0%) | $54,500 |
| Renter-Occupied | 0 (0.0%) | $0 |
| Average | 14 (100.0%) | $54,500 |
Occupancy by Householder Income Bracket in Holiday City
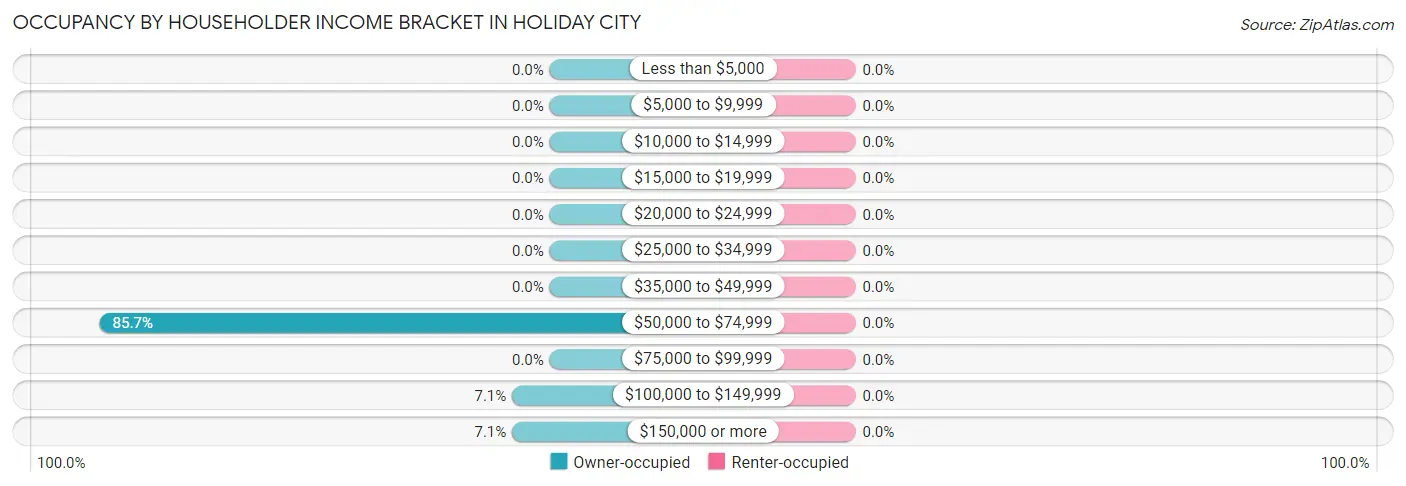
| Income Bracket | Owner-occupied | Renter-occupied |
| Less than $5,000 | 0 (0.0%) | 0 (0.0%) |
| $5,000 to $9,999 | 0 (0.0%) | 0 (0.0%) |
| $10,000 to $14,999 | 0 (0.0%) | 0 (0.0%) |
| $15,000 to $19,999 | 0 (0.0%) | 0 (0.0%) |
| $20,000 to $24,999 | 0 (0.0%) | 0 (0.0%) |
| $25,000 to $34,999 | 0 (0.0%) | 0 (0.0%) |
| $35,000 to $49,999 | 0 (0.0%) | 0 (0.0%) |
| $50,000 to $74,999 | 12 (85.7%) | 0 (0.0%) |
| $75,000 to $99,999 | 0 (0.0%) | 0 (0.0%) |
| $100,000 to $149,999 | 1 (7.1%) | 0 (0.0%) |
| $150,000 or more | 1 (7.1%) | 0 (0.0%) |
| Total | 14 (100.0%) | 0 (0.0%) |
Monthly Housing Cost Tiers in Holiday City
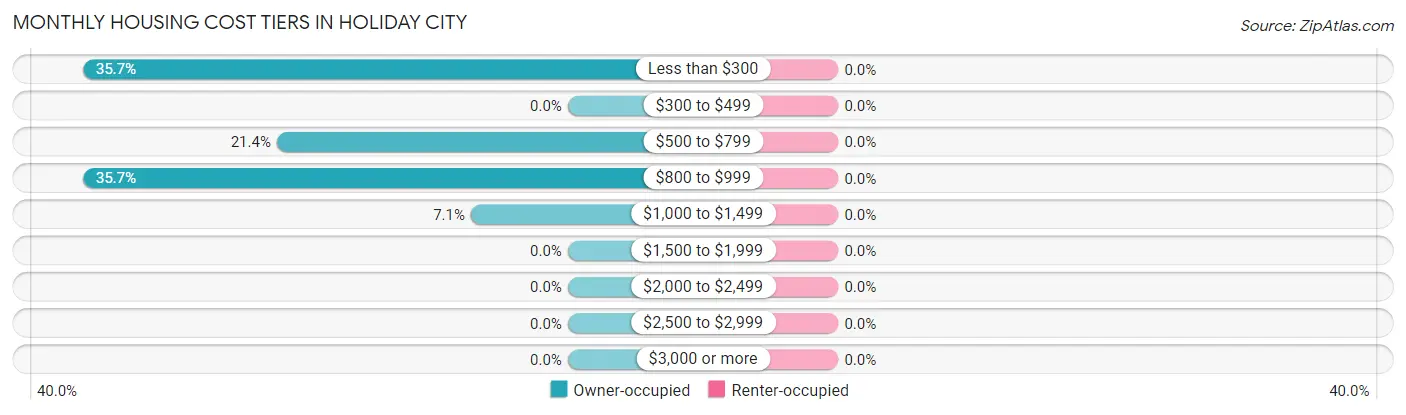
| Monthly Cost | Owner-occupied | Renter-occupied |
| Less than $300 | 5 (35.7%) | 0 (0.0%) |
| $300 to $499 | 0 (0.0%) | 0 (0.0%) |
| $500 to $799 | 3 (21.4%) | 0 (0.0%) |
| $800 to $999 | 5 (35.7%) | 0 (0.0%) |
| $1,000 to $1,499 | 1 (7.1%) | 0 (0.0%) |
| $1,500 to $1,999 | 0 (0.0%) | 0 (0.0%) |
| $2,000 to $2,499 | 0 (0.0%) | 0 (0.0%) |
| $2,500 to $2,999 | 0 (0.0%) | 0 (0.0%) |
| $3,000 or more | 0 (0.0%) | 0 (0.0%) |
| Total | 14 (100.0%) | 0 (0.0%) |
Physical Housing Characteristics in Holiday City
Housing Structures in Holiday City
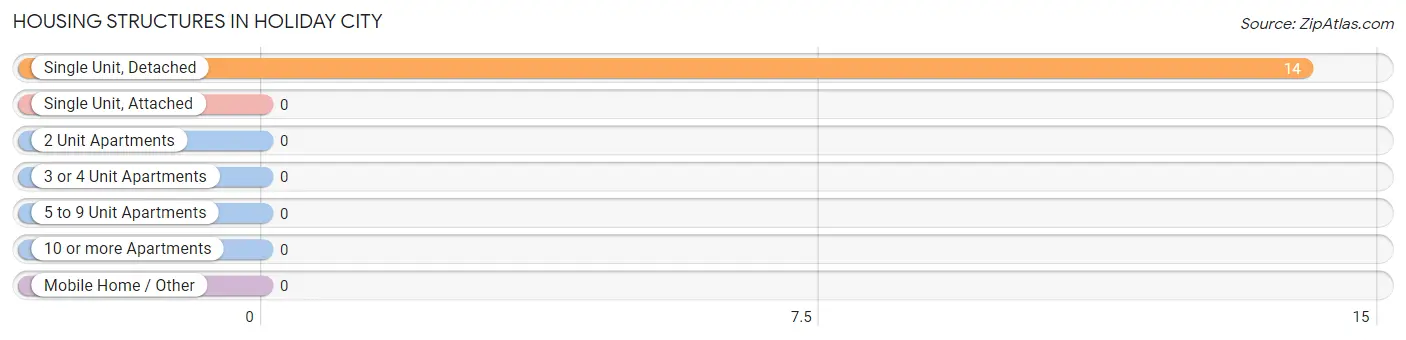
| Structure Type | # Housing Units | % Housing Units |
| Single Unit, Detached | 14 | 100.0% |
| Single Unit, Attached | 0 | 0.0% |
| 2 Unit Apartments | 0 | 0.0% |
| 3 or 4 Unit Apartments | 0 | 0.0% |
| 5 to 9 Unit Apartments | 0 | 0.0% |
| 10 or more Apartments | 0 | 0.0% |
| Mobile Home / Other | 0 | 0.0% |
| Total | 14 | 100.0% |
Housing Structures by Occupancy in Holiday City
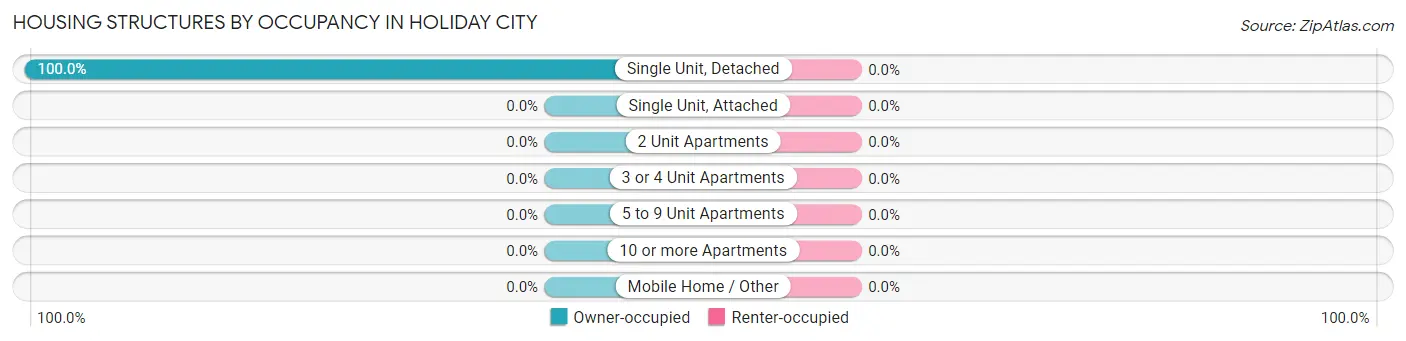
| Structure Type | Owner-occupied | Renter-occupied |
| Single Unit, Detached | 14 (100.0%) | 0 (0.0%) |
| Single Unit, Attached | 0 (0.0%) | 0 (0.0%) |
| 2 Unit Apartments | 0 (0.0%) | 0 (0.0%) |
| 3 or 4 Unit Apartments | 0 (0.0%) | 0 (0.0%) |
| 5 to 9 Unit Apartments | 0 (0.0%) | 0 (0.0%) |
| 10 or more Apartments | 0 (0.0%) | 0 (0.0%) |
| Mobile Home / Other | 0 (0.0%) | 0 (0.0%) |
| Total | 14 (100.0%) | 0 (0.0%) |
Housing Structures by Number of Rooms in Holiday City
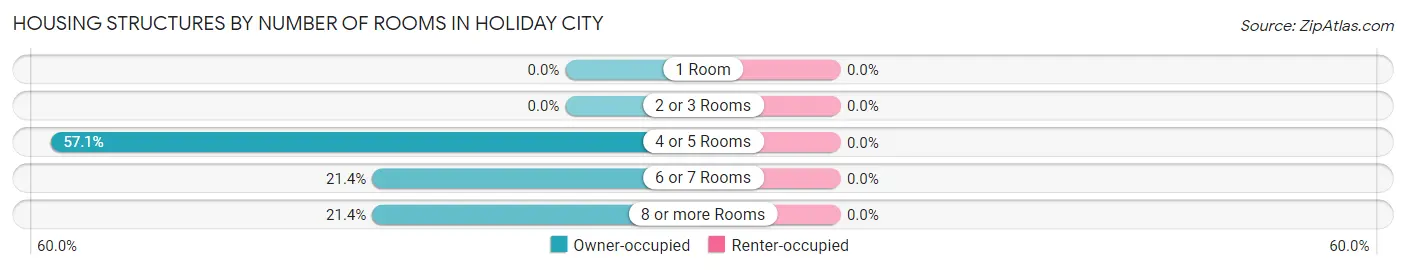
| Number of Rooms | Owner-occupied | Renter-occupied |
| 1 Room | 0 (0.0%) | 0 (0.0%) |
| 2 or 3 Rooms | 0 (0.0%) | 0 (0.0%) |
| 4 or 5 Rooms | 8 (57.1%) | 0 (0.0%) |
| 6 or 7 Rooms | 3 (21.4%) | 0 (0.0%) |
| 8 or more Rooms | 3 (21.4%) | 0 (0.0%) |
| Total | 14 (100.0%) | 0 (0.0%) |
Housing Structure by Heating Type in Holiday City
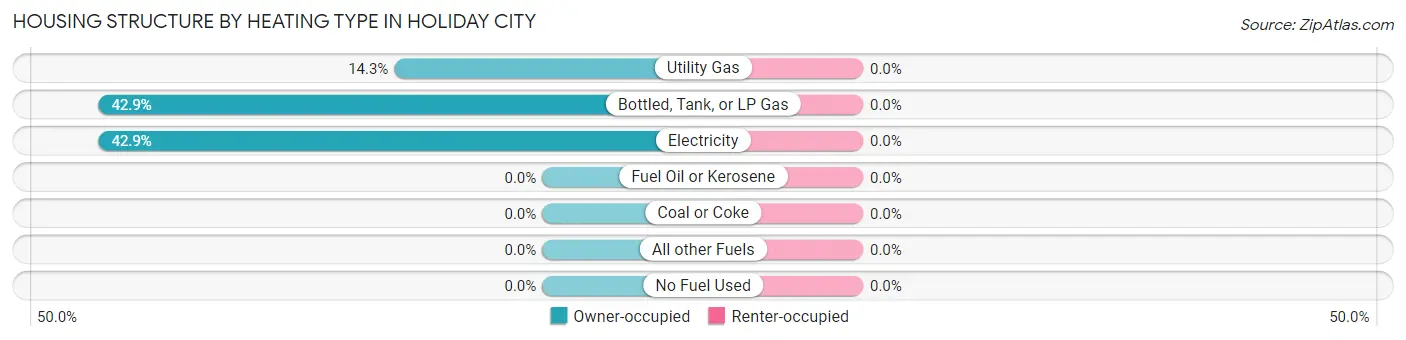
| Heating Type | Owner-occupied | Renter-occupied |
| Utility Gas | 2 (14.3%) | 0 (0.0%) |
| Bottled, Tank, or LP Gas | 6 (42.9%) | 0 (0.0%) |
| Electricity | 6 (42.9%) | 0 (0.0%) |
| Fuel Oil or Kerosene | 0 (0.0%) | 0 (0.0%) |
| Coal or Coke | 0 (0.0%) | 0 (0.0%) |
| All other Fuels | 0 (0.0%) | 0 (0.0%) |
| No Fuel Used | 0 (0.0%) | 0 (0.0%) |
| Total | 14 (100.0%) | 0 (0.0%) |
Household Vehicle Usage in Holiday City
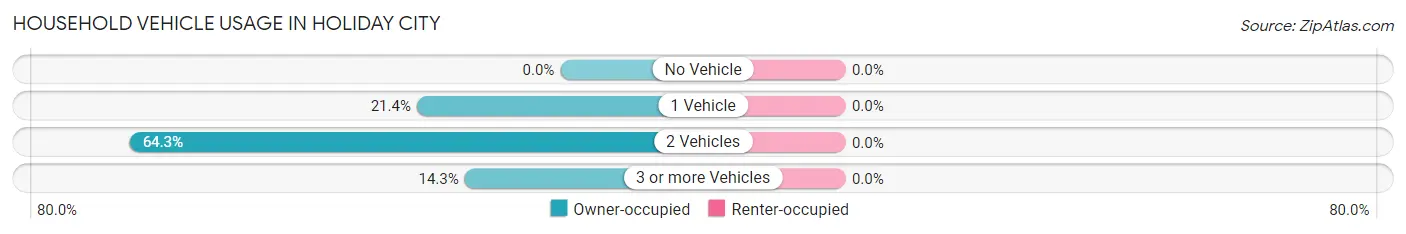
| Vehicles per Household | Owner-occupied | Renter-occupied |
| No Vehicle | 0 (0.0%) | 0 (0.0%) |
| 1 Vehicle | 3 (21.4%) | 0 (0.0%) |
| 2 Vehicles | 9 (64.3%) | 0 (0.0%) |
| 3 or more Vehicles | 2 (14.3%) | 0 (0.0%) |
| Total | 14 (100.0%) | 0 (0.0%) |
Real Estate & Mortgages in Holiday City
Real Estate and Mortgage Overview in Holiday City
| Characteristic | Without Mortgage | With Mortgage |
| Housing Units | 8 | 6 |
| Median Property Value | - | - |
| Median Household Income | $54,500 | $0 |
| Monthly Housing Costs | - | - |
| Real Estate Taxes | - | - |
Property Value by Mortgage Status in Holiday City
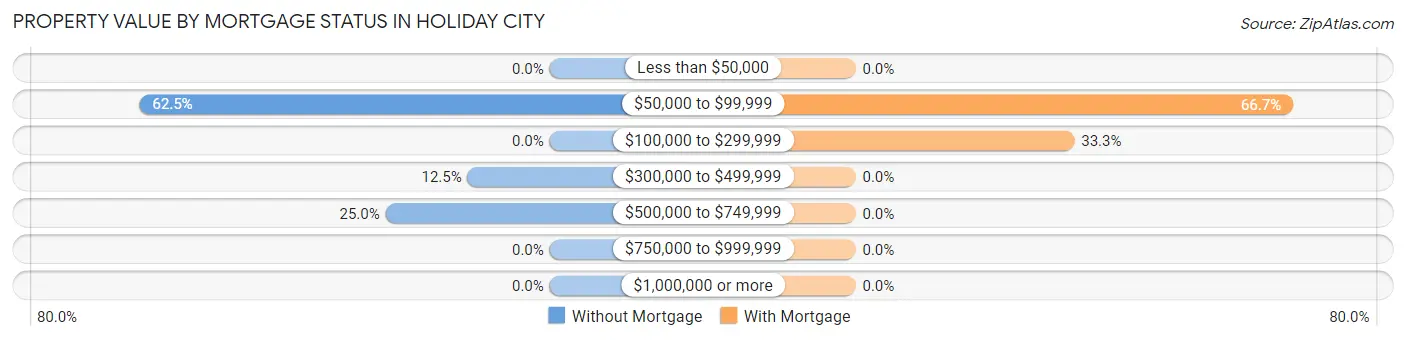
| Property Value | Without Mortgage | With Mortgage |
| Less than $50,000 | 0 (0.0%) | 0 (0.0%) |
| $50,000 to $99,999 | 5 (62.5%) | 4 (66.7%) |
| $100,000 to $299,999 | 0 (0.0%) | 2 (33.3%) |
| $300,000 to $499,999 | 1 (12.5%) | 0 (0.0%) |
| $500,000 to $749,999 | 2 (25.0%) | 0 (0.0%) |
| $750,000 to $999,999 | 0 (0.0%) | 0 (0.0%) |
| $1,000,000 or more | 0 (0.0%) | 0 (0.0%) |
| Total | 8 (100.0%) | 6 (100.0%) |
Household Income by Mortgage Status in Holiday City
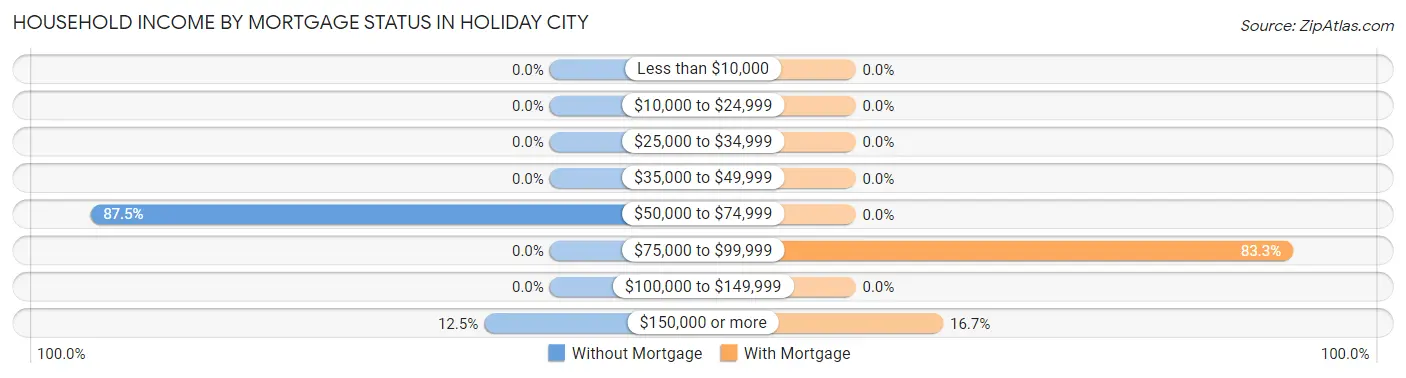
| Household Income | Without Mortgage | With Mortgage |
| Less than $10,000 | 0 (0.0%) | 0 (0.0%) |
| $10,000 to $24,999 | 0 (0.0%) | 0 (0.0%) |
| $25,000 to $34,999 | 0 (0.0%) | 0 (0.0%) |
| $35,000 to $49,999 | 0 (0.0%) | 0 (0.0%) |
| $50,000 to $74,999 | 7 (87.5%) | 0 (0.0%) |
| $75,000 to $99,999 | 0 (0.0%) | 5 (83.3%) |
| $100,000 to $149,999 | 0 (0.0%) | 0 (0.0%) |
| $150,000 or more | 1 (12.5%) | 1 (16.7%) |
| Total | 8 (100.0%) | 6 (100.0%) |
Property Value to Household Income Ratio in Holiday City
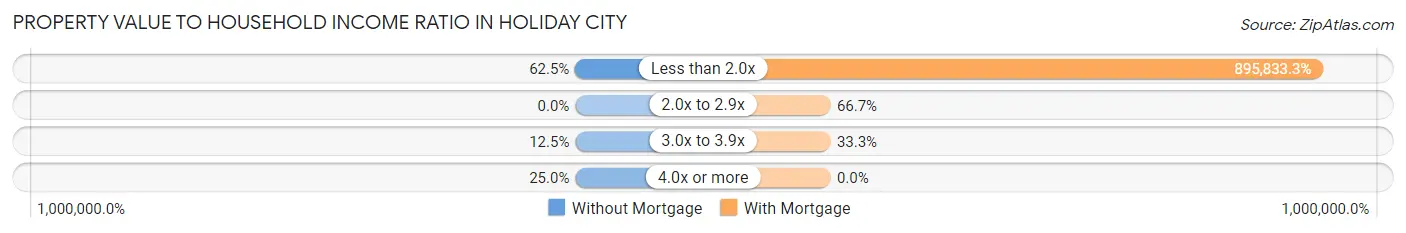
| Value-to-Income Ratio | Without Mortgage | With Mortgage |
| Less than 2.0x | 5 (62.5%) | 53,750 (895,833.3%) |
| 2.0x to 2.9x | 0 (0.0%) | 4 (66.7%) |
| 3.0x to 3.9x | 1 (12.5%) | 2 (33.3%) |
| 4.0x or more | 2 (25.0%) | 0 (0.0%) |
| Total | 8 (100.0%) | 6 (100.0%) |
Real Estate Taxes by Mortgage Status in Holiday City
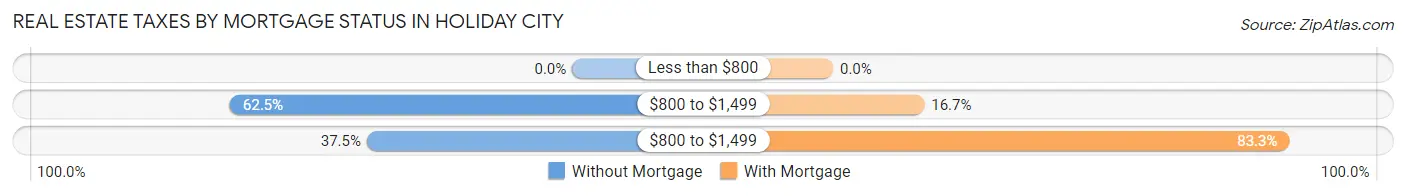
| Property Taxes | Without Mortgage | With Mortgage |
| Less than $800 | 0 (0.0%) | 0 (0.0%) |
| $800 to $1,499 | 5 (62.5%) | 1 (16.7%) |
| $800 to $1,499 | 3 (37.5%) | 5 (83.3%) |
| Total | 8 (100.0%) | 6 (100.0%) |
Health & Disability in Holiday City
Health Insurance Coverage by Age in Holiday City
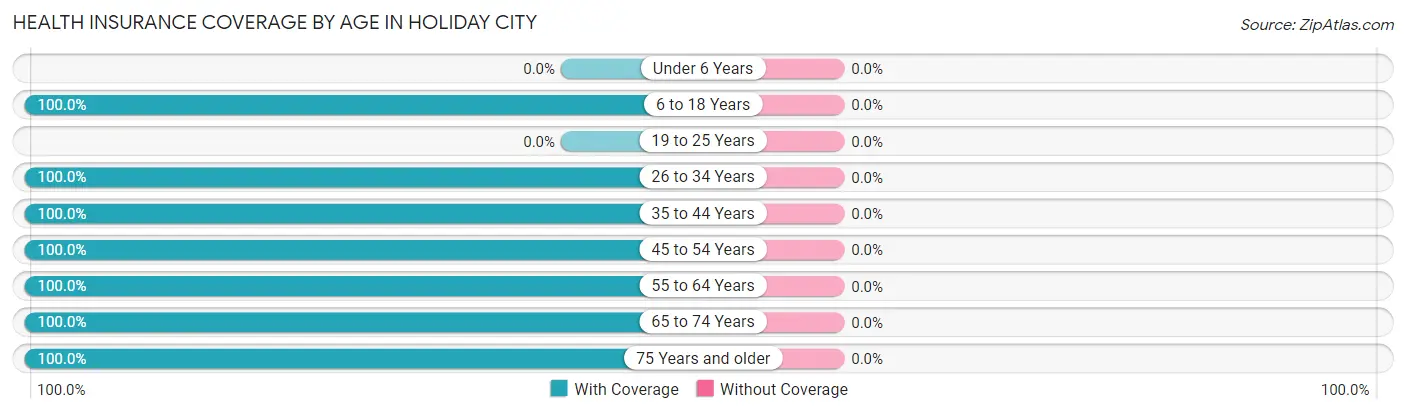
| Age Bracket | With Coverage | Without Coverage |
| Under 6 Years | 0 (0.0%) | 0 (0.0%) |
| 6 to 18 Years | 1 (100.0%) | 0 (0.0%) |
| 19 to 25 Years | 0 (0.0%) | 0 (0.0%) |
| 26 to 34 Years | 2 (100.0%) | 0 (0.0%) |
| 35 to 44 Years | 3 (100.0%) | 0 (0.0%) |
| 45 to 54 Years | 7 (100.0%) | 0 (0.0%) |
| 55 to 64 Years | 1 (100.0%) | 0 (0.0%) |
| 65 to 74 Years | 2 (100.0%) | 0 (0.0%) |
| 75 Years and older | 2 (100.0%) | 0 (0.0%) |
| Total | 18 (100.0%) | 0 (0.0%) |
Health Insurance Coverage by Citizenship Status in Holiday City
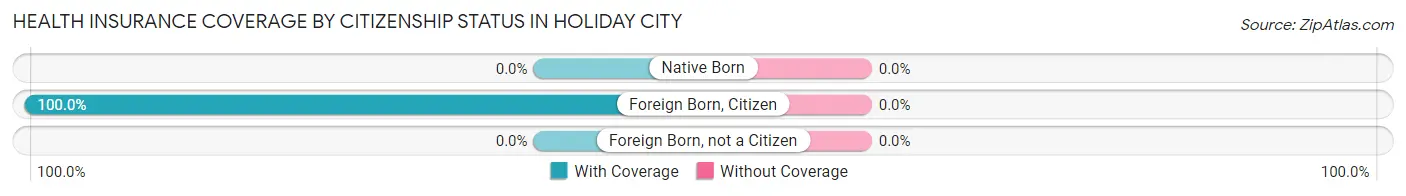
| Citizenship Status | With Coverage | Without Coverage |
| Native Born | 0 (0.0%) | 0 (0.0%) |
| Foreign Born, Citizen | 1 (100.0%) | 0 (0.0%) |
| Foreign Born, not a Citizen | 0 (0.0%) | 0 (0.0%) |
Health Insurance Coverage by Household Income in Holiday City
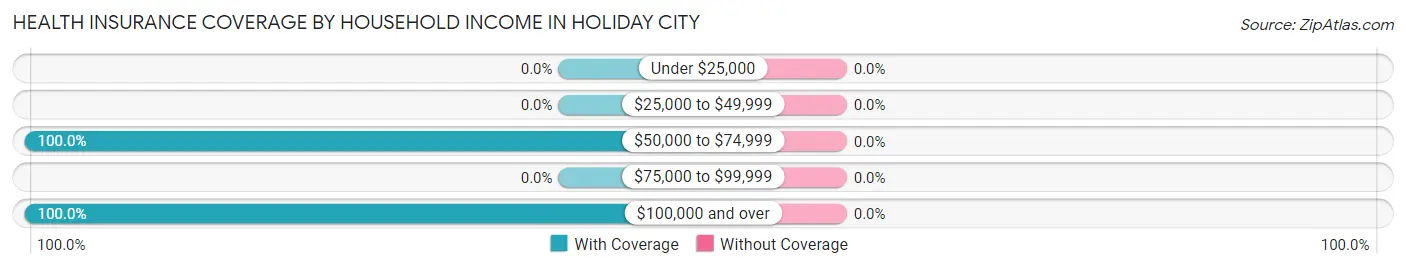
| Household Income | With Coverage | Without Coverage |
| Under $25,000 | 0 (0.0%) | 0 (0.0%) |
| $25,000 to $49,999 | 0 (0.0%) | 0 (0.0%) |
| $50,000 to $74,999 | 14 (100.0%) | 0 (0.0%) |
| $75,000 to $99,999 | 0 (0.0%) | 0 (0.0%) |
| $100,000 and over | 4 (100.0%) | 0 (0.0%) |
Public vs Private Health Insurance Coverage by Age in Holiday City
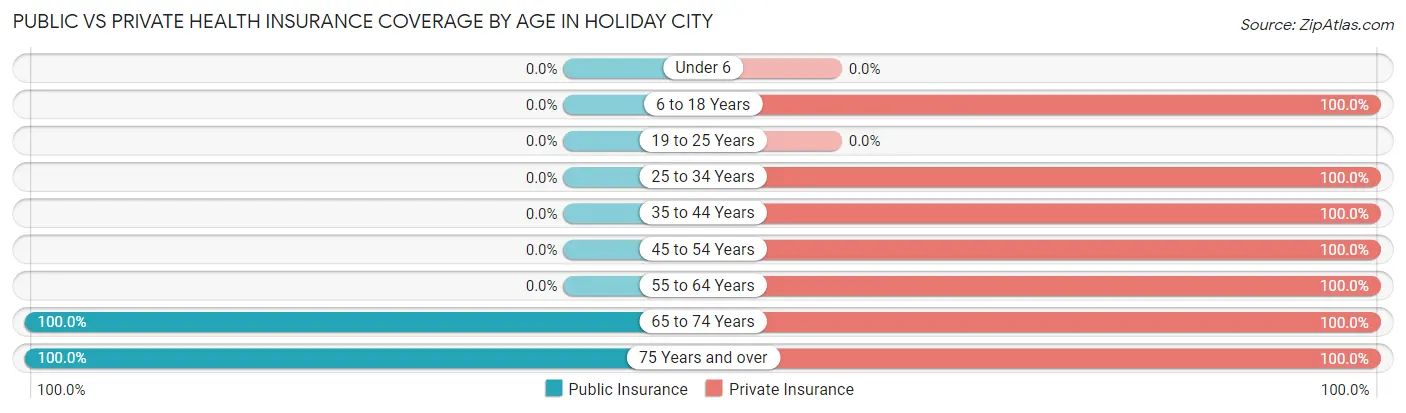
| Age Bracket | Public Insurance | Private Insurance |
| Under 6 | 0 (0.0%) | 0 (0.0%) |
| 6 to 18 Years | 0 (0.0%) | 1 (100.0%) |
| 19 to 25 Years | 0 (0.0%) | 0 (0.0%) |
| 25 to 34 Years | 0 (0.0%) | 2 (100.0%) |
| 35 to 44 Years | 0 (0.0%) | 3 (100.0%) |
| 45 to 54 Years | 0 (0.0%) | 7 (100.0%) |
| 55 to 64 Years | 0 (0.0%) | 1 (100.0%) |
| 65 to 74 Years | 2 (100.0%) | 2 (100.0%) |
| 75 Years and over | 2 (100.0%) | 2 (100.0%) |
| Total | 4 (22.2%) | 18 (100.0%) |
Disability Status by Sex by Age in Holiday City
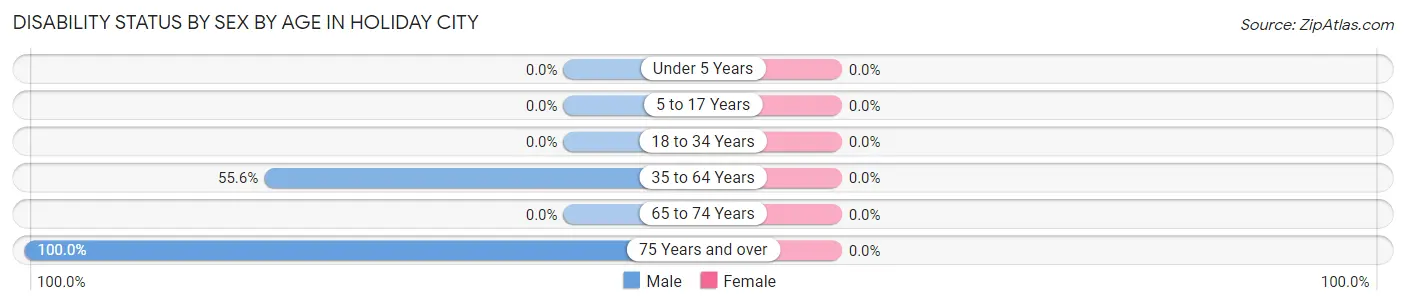
| Age Bracket | Male | Female |
| Under 5 Years | 0 (0.0%) | 0 (0.0%) |
| 5 to 17 Years | 0 (0.0%) | 0 (0.0%) |
| 18 to 34 Years | 0 (0.0%) | 0 (0.0%) |
| 35 to 64 Years | 5 (55.6%) | 0 (0.0%) |
| 65 to 74 Years | 0 (0.0%) | 0 (0.0%) |
| 75 Years and over | 2 (100.0%) | 0 (0.0%) |
Disability Class by Sex by Age in Holiday City
Disability Class: Hearing Difficulty
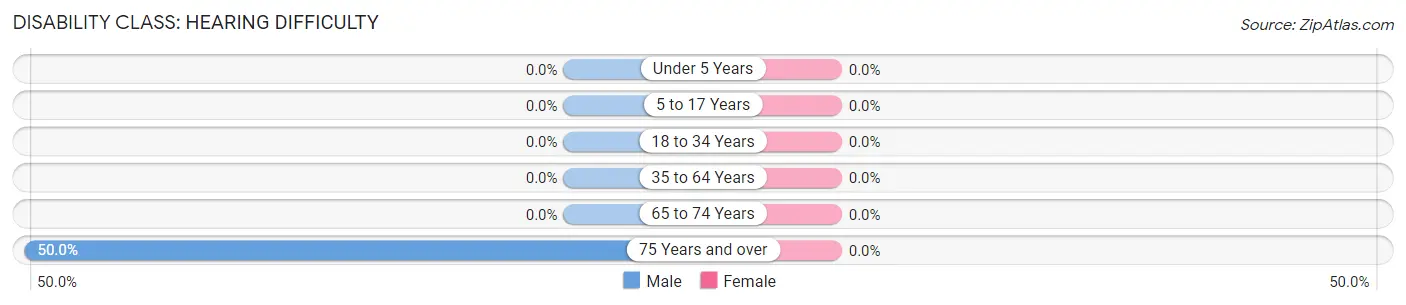
| Age Bracket | Male | Female |
| Under 5 Years | 0 (0.0%) | 0 (0.0%) |
| 5 to 17 Years | 0 (0.0%) | 0 (0.0%) |
| 18 to 34 Years | 0 (0.0%) | 0 (0.0%) |
| 35 to 64 Years | 0 (0.0%) | 0 (0.0%) |
| 65 to 74 Years | 0 (0.0%) | 0 (0.0%) |
| 75 Years and over | 1 (50.0%) | 0 (0.0%) |
Disability Class: Vision Difficulty
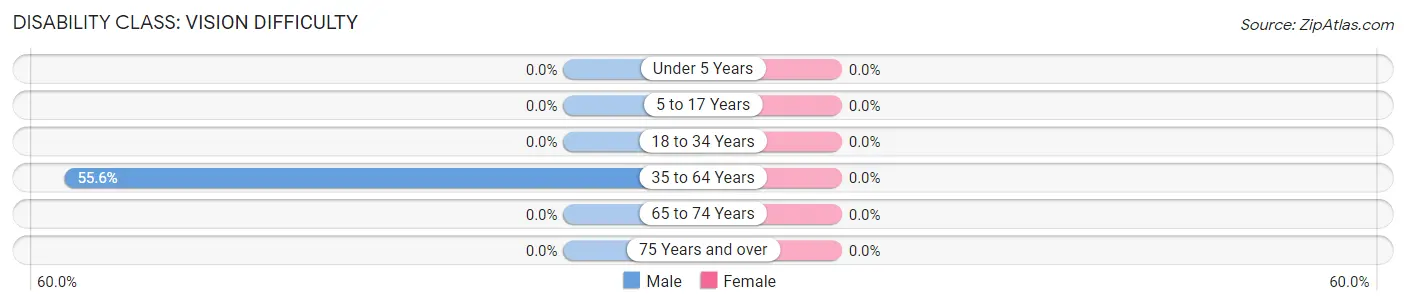
| Age Bracket | Male | Female |
| Under 5 Years | 0 (0.0%) | 0 (0.0%) |
| 5 to 17 Years | 0 (0.0%) | 0 (0.0%) |
| 18 to 34 Years | 0 (0.0%) | 0 (0.0%) |
| 35 to 64 Years | 5 (55.6%) | 0 (0.0%) |
| 65 to 74 Years | 0 (0.0%) | 0 (0.0%) |
| 75 Years and over | 0 (0.0%) | 0 (0.0%) |
Disability Class: Cognitive Difficulty
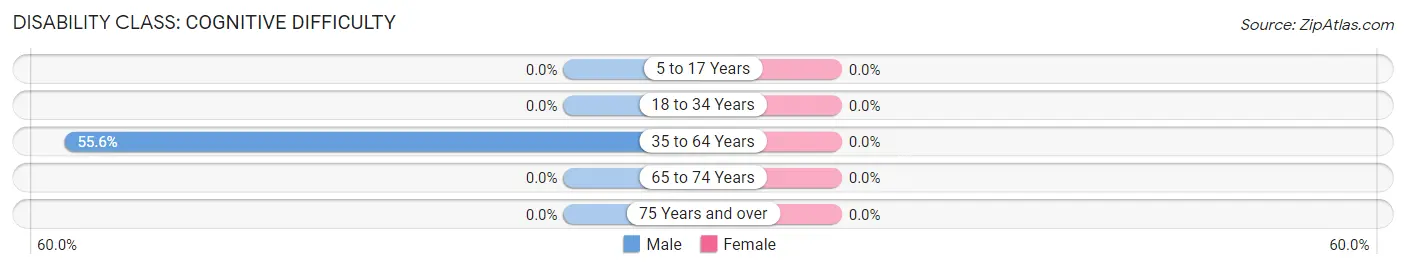
| Age Bracket | Male | Female |
| 5 to 17 Years | 0 (0.0%) | 0 (0.0%) |
| 18 to 34 Years | 0 (0.0%) | 0 (0.0%) |
| 35 to 64 Years | 5 (55.6%) | 0 (0.0%) |
| 65 to 74 Years | 0 (0.0%) | 0 (0.0%) |
| 75 Years and over | 0 (0.0%) | 0 (0.0%) |
Disability Class: Ambulatory Difficulty
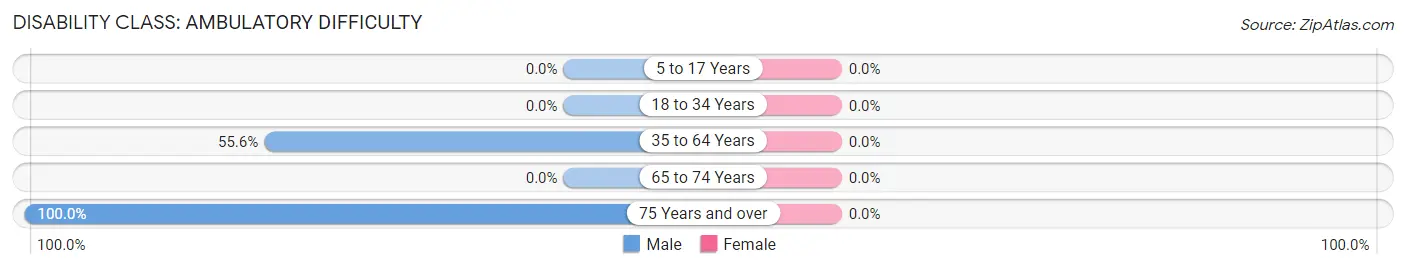
| Age Bracket | Male | Female |
| 5 to 17 Years | 0 (0.0%) | 0 (0.0%) |
| 18 to 34 Years | 0 (0.0%) | 0 (0.0%) |
| 35 to 64 Years | 5 (55.6%) | 0 (0.0%) |
| 65 to 74 Years | 0 (0.0%) | 0 (0.0%) |
| 75 Years and over | 2 (100.0%) | 0 (0.0%) |
Disability Class: Self-Care Difficulty
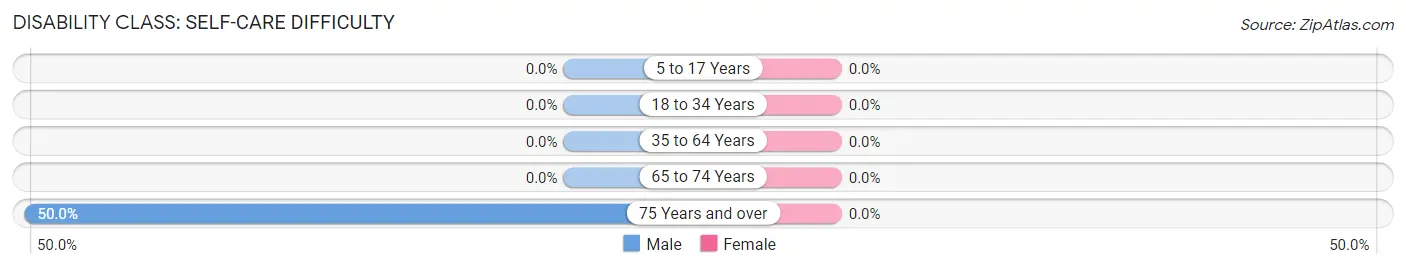
| Age Bracket | Male | Female |
| 5 to 17 Years | 0 (0.0%) | 0 (0.0%) |
| 18 to 34 Years | 0 (0.0%) | 0 (0.0%) |
| 35 to 64 Years | 0 (0.0%) | 0 (0.0%) |
| 65 to 74 Years | 0 (0.0%) | 0 (0.0%) |
| 75 Years and over | 1 (50.0%) | 0 (0.0%) |
Technology Access in Holiday City
Computing Device Access in Holiday City
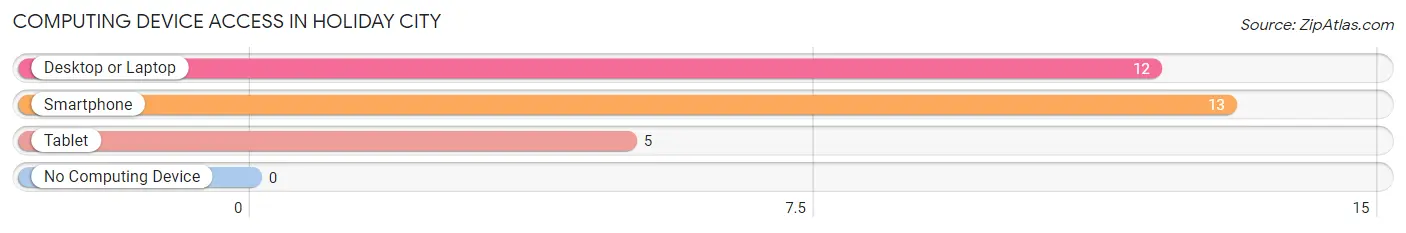
| Device Type | # Households | % Households |
| Desktop or Laptop | 12 | 85.7% |
| Smartphone | 13 | 92.9% |
| Tablet | 5 | 35.7% |
| No Computing Device | 0 | 0.0% |
| Total | 14 | 100.0% |
Internet Access in Holiday City
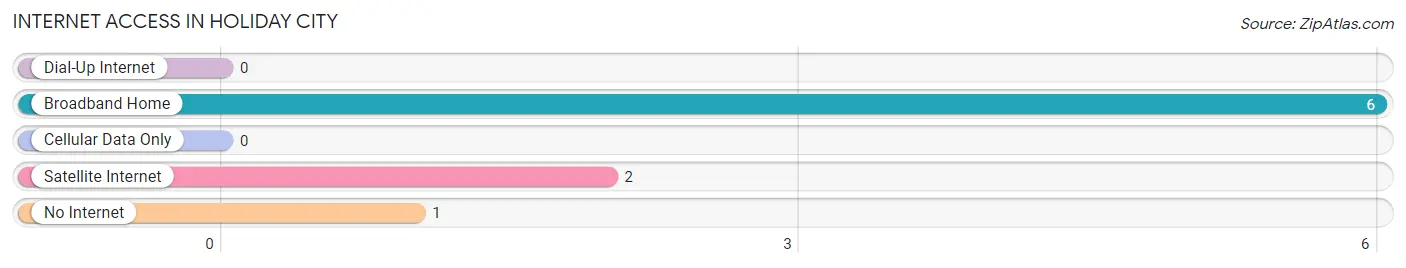
| Internet Type | # Households | % Households |
| Dial-Up Internet | 0 | 0.0% |
| Broadband Home | 6 | 42.9% |
| Cellular Data Only | 0 | 0.0% |
| Satellite Internet | 2 | 14.3% |
| No Internet | 1 | 7.1% |
| Total | 14 | 100.0% |
Holiday City Summary
Holiday City is a small city located in Ohio, United States. It is situated in the northwest corner of the state, near the border of Michigan. The city is part of the Toledo Metropolitan Statistical Area and is home to a population of approximately 8,000 people.
Geography
Holiday City is located in the northwest corner of Ohio, near the border of Michigan. The city is situated on the banks of the Maumee River, which flows through the city and provides a scenic backdrop. The city is surrounded by rolling hills and farmland, and is home to a variety of wildlife. The city is located approximately 30 miles from Toledo, Ohio and is within a two-hour drive of both Cleveland and Detroit.
Economy
Holiday City is a small city with a diverse economy. The city is home to a variety of businesses, including manufacturing, retail, and service industries. The city is also home to a number of small businesses, including restaurants, shops, and other services. The city is also home to a number of large employers, including a major automotive parts manufacturer and a large health care provider.
Demographics
As of the 2010 census, Holiday City had a population of 8,000 people. The population is predominantly white, with a small percentage of African Americans, Hispanics, and other ethnicities. The median household income is $45,000, and the median age is 38. The city has a high rate of homeownership, with nearly 70% of residents owning their own homes.
History
Holiday City was founded in 1837 by a group of settlers from New York. The city was originally named “Holiday” after the holiday season, and the name was later changed to “Holiday City” in 1845. The city was incorporated in 1851 and has since grown to become a thriving community. The city has a rich history, and is home to a number of historic sites, including the Holiday City Museum and the Holiday City Opera House.
Conclusion
Holiday City is a small city located in Ohio, United States. It is situated in the northwest corner of the state, near the border of Michigan. The city is part of the Toledo Metropolitan Statistical Area and is home to a population of approximately 8,000 people. The city has a diverse economy, with a variety of businesses, including manufacturing, retail, and service industries. The population is predominantly white, with a small percentage of African Americans, Hispanics, and other ethnicities. The city has a rich history, and is home to a number of historic sites, including the Holiday City Museum and the Holiday City Opera House.
Common Questions
What is Per Capita Income in Holiday City?
Per Capita income in Holiday City is $54,250.
What is the Median Family Income in Holiday City?
Median Family Income in Holiday City is $103,750.
What is the Median Household income in Holiday City?
Median Household Income in Holiday City is $54,500.
What is Inequality or Gini Index in Holiday City?
Inequality or Gini Index in Holiday City is 0.21.
What is the Total Population of Holiday City?
Total Population of Holiday City is 18.
What is the Total Male Population of Holiday City?
Total Male Population of Holiday City is 15.
What is the Total Female Population of Holiday City?
Total Female Population of Holiday City is 3.
What is the Ratio of Males per 100 Females in Holiday City?
There are 500.00 Males per 100 Females in Holiday City.
What is the Ratio of Females per 100 Males in Holiday City?
There are 20.00 Females per 100 Males in Holiday City.
What is the Median Population Age in Holiday City?
Median Population Age in Holiday City is 46.6 Years.
What is the Average Family Size in Holiday City
Average Family Size in Holiday City is 2.3 People.
What is the Average Household Size in Holiday City
Average Household Size in Holiday City is 1.3 People.
How Large is the Labor Force in Holiday City?
There are 13 People in the Labor Forcein in Holiday City.
What is the Percentage of People in the Labor Force in Holiday City?
76.5% of People are in the Labor Force in Holiday City.