Highland, OH Map & Demographics
Highland Map
Highland Overview
$26,898
PER CAPITA INCOME
$70,625
AVG FAMILY INCOME
$38,750
AVG HOUSEHOLD INCOME
52.8%
WAGE / INCOME GAP [ % ]
47.2¢/ $1
WAGE / INCOME GAP [ $ ]
0.36
INEQUALITY / GINI INDEX
131
TOTAL POPULATION
62
MALE POPULATION
69
FEMALE POPULATION
89.86
MALES / 100 FEMALES
111.29
FEMALES / 100 MALES
48.4
MEDIAN AGE
2.4
AVG FAMILY SIZE
1.8
AVG HOUSEHOLD SIZE
73
LABOR FORCE [ PEOPLE ]
65.8%
PERCENT IN LABOR FORCE
Highland Zip Codes
Highland Area Codes
Income in Highland
Income Overview in Highland
Per Capita Income in Highland is $26,898, while median incomes of families and households are $70,625 and $38,750 respectively.
| Characteristic | Number | Measure |
| Per Capita Income | 131 | $26,898 |
| Median Family Income | 38 | $70,625 |
| Mean Family Income | 38 | $60,895 |
| Median Household Income | 73 | $38,750 |
| Mean Household Income | 73 | $45,738 |
| Income Deficit | 38 | $0 |
| Wage / Income Gap (%) | 131 | 52.81% |
| Wage / Income Gap ($) | 131 | 47.19¢ per $1 |
| Gini / Inequality Index | 131 | 0.36 |
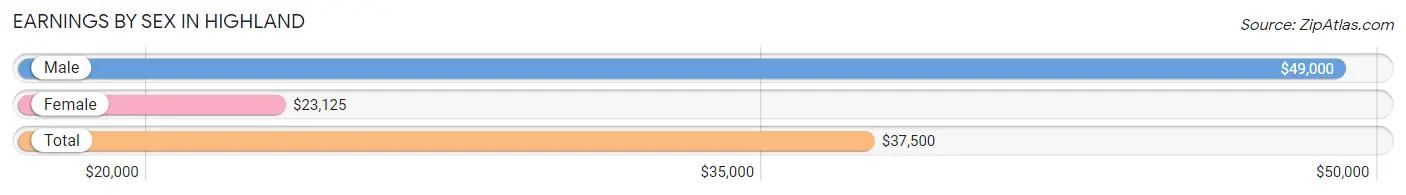
Earnings by Sex in Highland
Average Earnings in Highland are $37,500, $49,000 for men and $23,125 for women, a difference of 52.8%.
| Sex | Number | Average Earnings |
| Male | 42 (56.8%) | $49,000 |
| Female | 32 (43.2%) | $23,125 |
| Total | 74 (100.0%) | $37,500 |
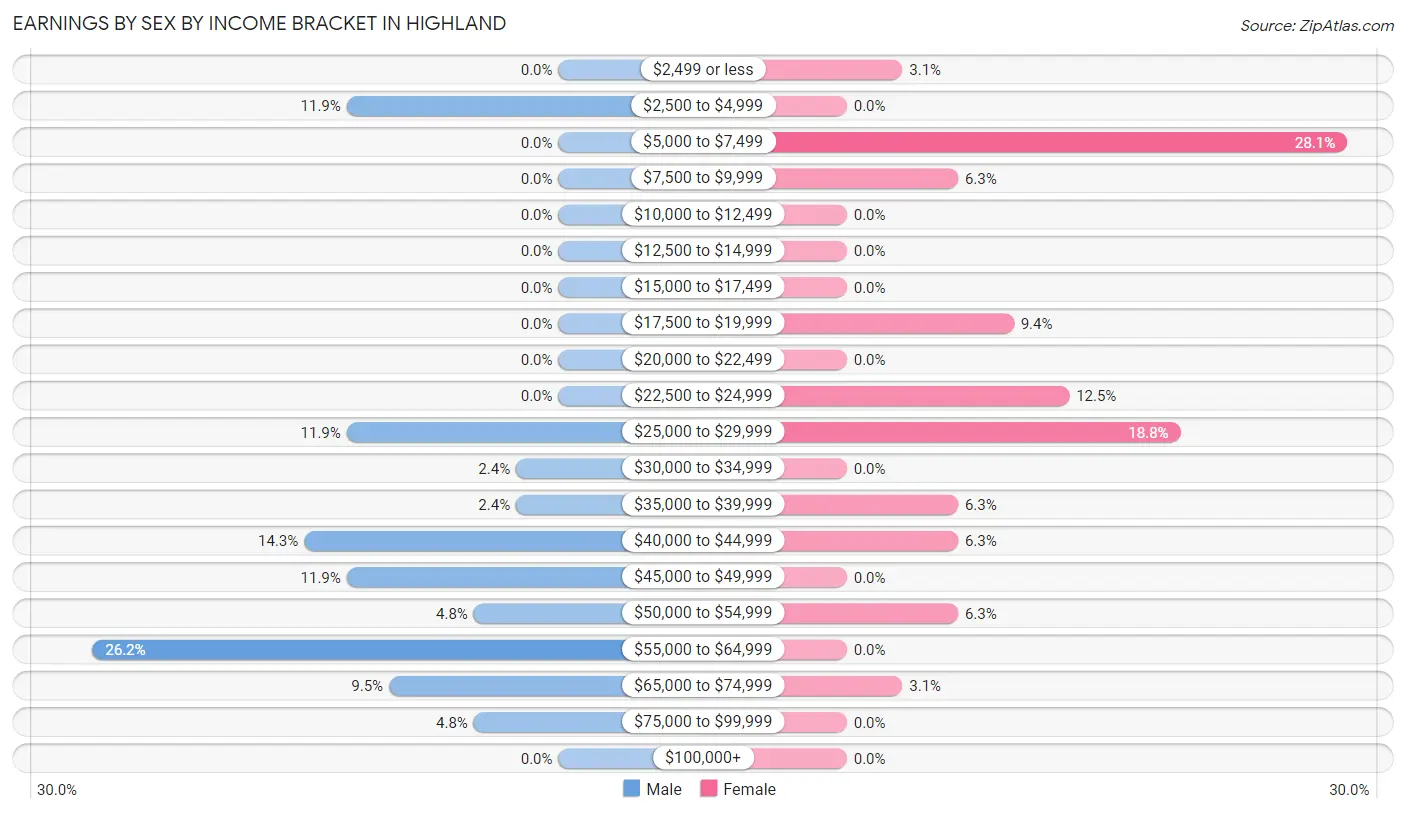
Earnings by Sex by Income Bracket in Highland
The most common earnings brackets in Highland are $55,000 to $64,999 for men (11 | 26.2%) and $5,000 to $7,499 for women (9 | 28.1%).
| Income | Male | Female |
| $2,499 or less | 0 (0.0%) | 1 (3.1%) |
| $2,500 to $4,999 | 5 (11.9%) | 0 (0.0%) |
| $5,000 to $7,499 | 0 (0.0%) | 9 (28.1%) |
| $7,500 to $9,999 | 0 (0.0%) | 2 (6.2%) |
| $10,000 to $12,499 | 0 (0.0%) | 0 (0.0%) |
| $12,500 to $14,999 | 0 (0.0%) | 0 (0.0%) |
| $15,000 to $17,499 | 0 (0.0%) | 0 (0.0%) |
| $17,500 to $19,999 | 0 (0.0%) | 3 (9.4%) |
| $20,000 to $22,499 | 0 (0.0%) | 0 (0.0%) |
| $22,500 to $24,999 | 0 (0.0%) | 4 (12.5%) |
| $25,000 to $29,999 | 5 (11.9%) | 6 (18.8%) |
| $30,000 to $34,999 | 1 (2.4%) | 0 (0.0%) |
| $35,000 to $39,999 | 1 (2.4%) | 2 (6.2%) |
| $40,000 to $44,999 | 6 (14.3%) | 2 (6.2%) |
| $45,000 to $49,999 | 5 (11.9%) | 0 (0.0%) |
| $50,000 to $54,999 | 2 (4.8%) | 2 (6.2%) |
| $55,000 to $64,999 | 11 (26.2%) | 0 (0.0%) |
| $65,000 to $74,999 | 4 (9.5%) | 1 (3.1%) |
| $75,000 to $99,999 | 2 (4.8%) | 0 (0.0%) |
| $100,000+ | 0 (0.0%) | 0 (0.0%) |
| Total | 42 (100.0%) | 32 (100.0%) |
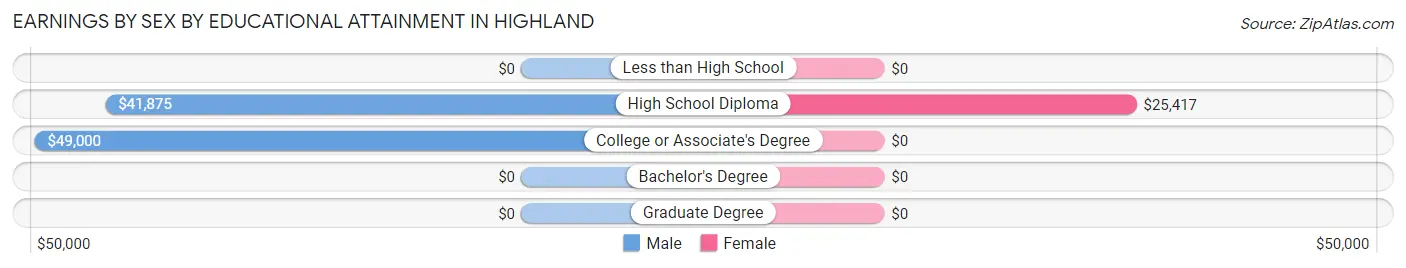
Earnings by Sex by Educational Attainment in Highland
Average earnings in Highland are $48,500 for men and $23,438 for women, a difference of 51.7%. Men with an educational attainment of college or associate's degree enjoy the highest average annual earnings of $49,000, while those with high school diploma education earn the least with $41,875. Women with an educational attainment of high school diploma earn the most with the average annual earnings of $25,417, while those with high school diploma education have the smallest earnings of $25,417.
| Educational Attainment | Male Income | Female Income |
| Less than High School | - | - |
| High School Diploma | $41,875 | $25,417 |
| College or Associate's Degree | $49,000 | $0 |
| Bachelor's Degree | - | - |
| Graduate Degree | - | - |
| Total | $48,500 | $23,438 |
Family Income in Highland
Family Income Brackets in Highland
According to the Highland family income data, there are 22 families falling into the $50,000 to $74,999 income range, which is the most common income bracket and makes up 57.9% of all families.
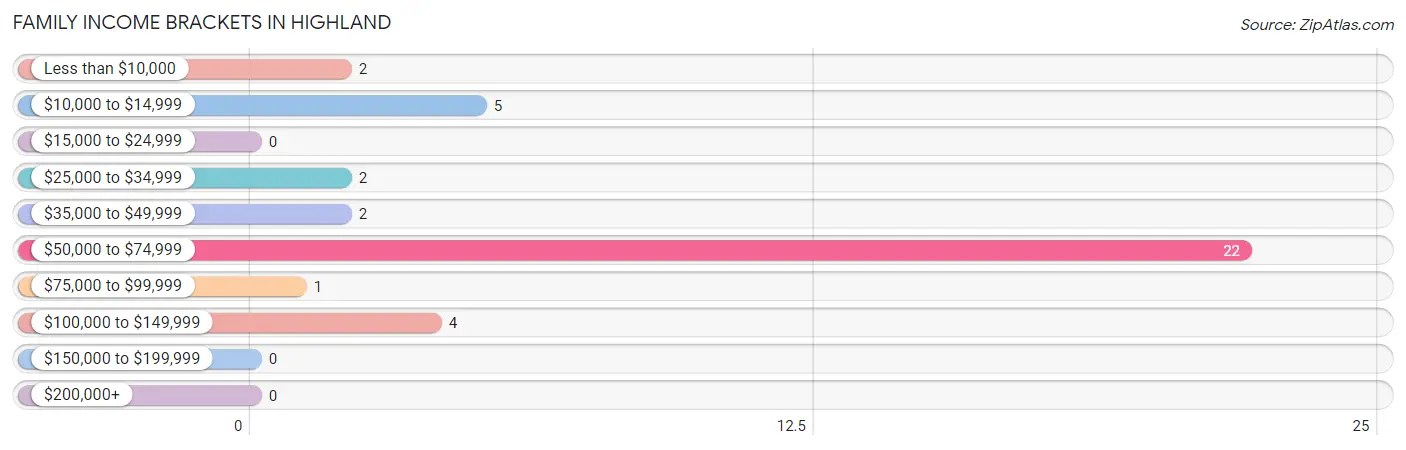
| Income Bracket | # Families | % Families |
| Less than $10,000 | 2 | 5.3% |
| $10,000 to $14,999 | 5 | 13.2% |
| $15,000 to $24,999 | 0 | 0.0% |
| $25,000 to $34,999 | 2 | 5.3% |
| $35,000 to $49,999 | 2 | 5.3% |
| $50,000 to $74,999 | 22 | 57.9% |
| $75,000 to $99,999 | 1 | 2.6% |
| $100,000 to $149,999 | 4 | 10.5% |
| $150,000 to $199,999 | 0 | 0.0% |
| $200,000+ | 0 | 0.0% |
Family Income by Famaliy Size in Highland
2-person families (29 | 76.3%) account for the highest median family income in Highland with $70,521 per family, while 2-person families (29 | 76.3%) have the highest median income of $35,260 per family member.
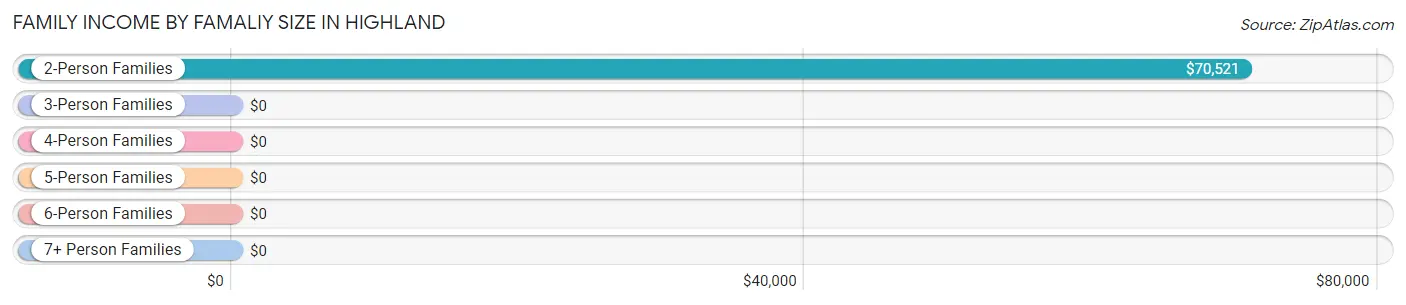
| Income Bracket | # Families | Median Income |
| 2-Person Families | 29 (76.3%) | $70,521 |
| 3-Person Families | 4 (10.5%) | $0 |
| 4-Person Families | 3 (7.9%) | $0 |
| 5-Person Families | 1 (2.6%) | $0 |
| 6-Person Families | 1 (2.6%) | $0 |
| 7+ Person Families | 0 (0.0%) | $0 |
| Total | 38 (100.0%) | $70,625 |
Family Income by Number of Earners in Highland
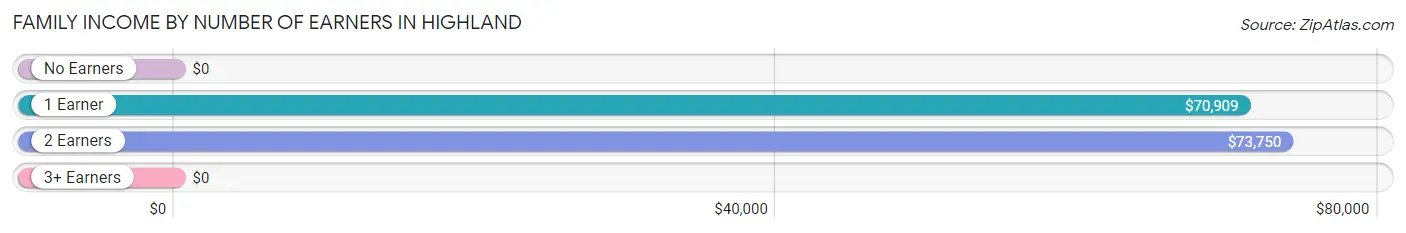
| Number of Earners | # Families | Median Income |
| No Earners | 9 (23.7%) | $0 |
| 1 Earner | 16 (42.1%) | $70,909 |
| 2 Earners | 12 (31.6%) | $73,750 |
| 3+ Earners | 1 (2.6%) | $0 |
| Total | 38 (100.0%) | $70,625 |
Household Income in Highland
Household Income Brackets in Highland
With 23 households falling in the category, the $50,000 to $74,999 income range is the most frequent in Highland, accounting for 31.5% of all households.
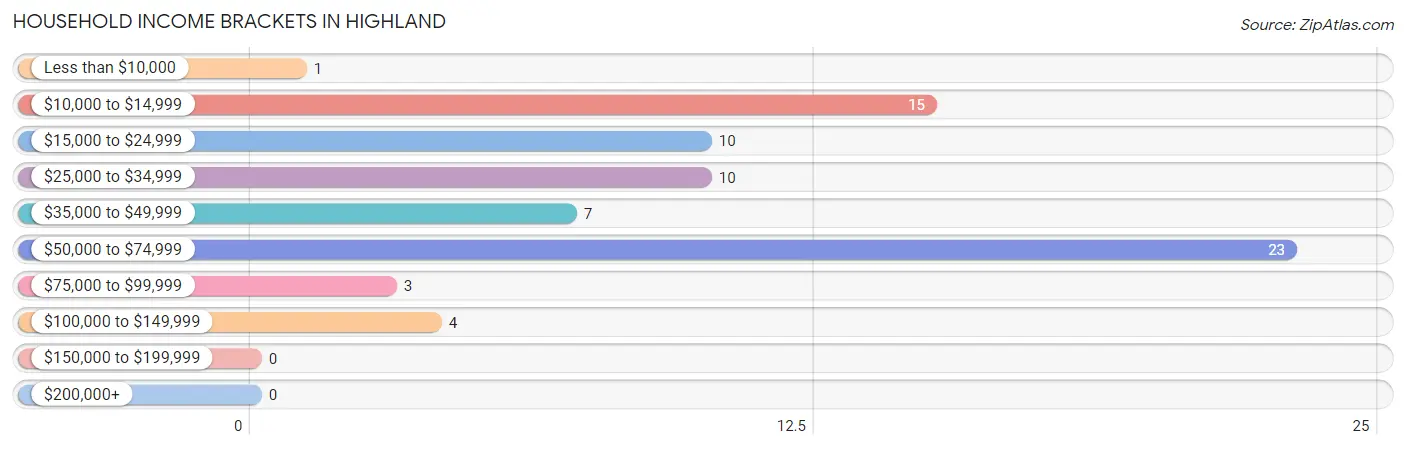
| Income Bracket | # Households | % Households |
| Less than $10,000 | 1 | 1.4% |
| $10,000 to $14,999 | 15 | 20.5% |
| $15,000 to $24,999 | 10 | 13.7% |
| $25,000 to $34,999 | 10 | 13.7% |
| $35,000 to $49,999 | 7 | 9.6% |
| $50,000 to $74,999 | 23 | 31.5% |
| $75,000 to $99,999 | 3 | 4.1% |
| $100,000 to $149,999 | 4 | 5.5% |
| $150,000 to $199,999 | 0 | 0.0% |
| $200,000+ | 0 | 0.0% |
Household Income by Householder Age in Highland
The median household income in Highland is $38,750, with the highest median household income of $70,313 found in the 45 to 64 years age bracket for the primary householder. A total of 31 households (42.5%) fall into this category. Meanwhile, the 15 to 24 years age bracket for the primary householder has the lowest median household income of $0, with 1 households (1.4%) in this group.
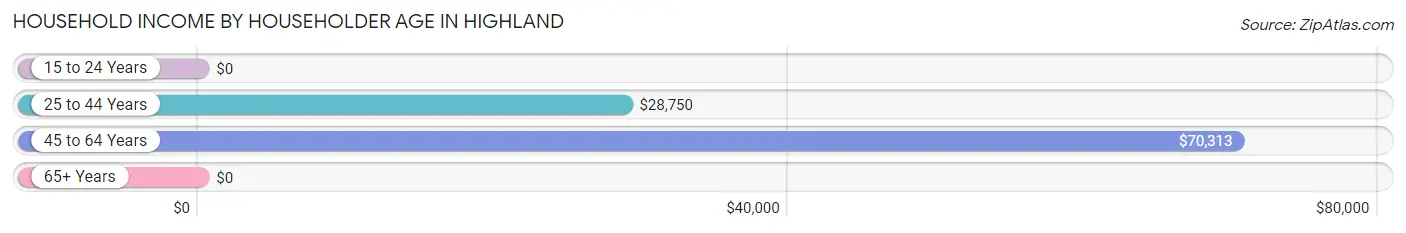
| Income Bracket | # Households | Median Income |
| 15 to 24 Years | 1 (1.4%) | $0 |
| 25 to 44 Years | 19 (26.0%) | $28,750 |
| 45 to 64 Years | 31 (42.5%) | $70,313 |
| 65+ Years | 22 (30.1%) | $0 |
| Total | 73 (100.0%) | $38,750 |
Poverty in Highland
Income Below Poverty by Sex and Age in Highland
With 14.5% poverty level for males and 29.0% for females among the residents of Highland, 12 to 14 year old males and 18 to 24 year old females are the most vulnerable to poverty, with 3 males (75.0%) and 1 females (100.0%) in their respective age groups living below the poverty level.
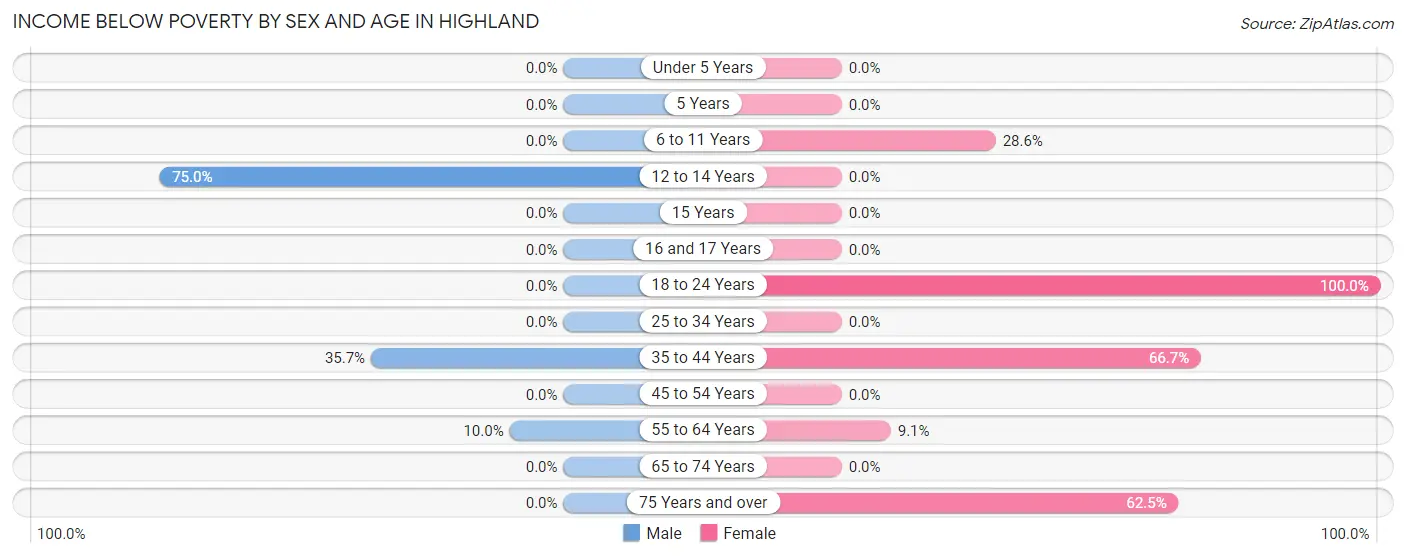
| Age Bracket | Male | Female |
| Under 5 Years | 0 (0.0%) | 0 (0.0%) |
| 5 Years | 0 (0.0%) | 0 (0.0%) |
| 6 to 11 Years | 0 (0.0%) | 2 (28.6%) |
| 12 to 14 Years | 3 (75.0%) | 0 (0.0%) |
| 15 Years | 0 (0.0%) | 0 (0.0%) |
| 16 and 17 Years | 0 (0.0%) | 0 (0.0%) |
| 18 to 24 Years | 0 (0.0%) | 1 (100.0%) |
| 25 to 34 Years | 0 (0.0%) | 0 (0.0%) |
| 35 to 44 Years | 5 (35.7%) | 6 (66.7%) |
| 45 to 54 Years | 0 (0.0%) | 0 (0.0%) |
| 55 to 64 Years | 1 (10.0%) | 1 (9.1%) |
| 65 to 74 Years | 0 (0.0%) | 0 (0.0%) |
| 75 Years and over | 0 (0.0%) | 10 (62.5%) |
| Total | 9 (14.5%) | 20 (29.0%) |
Income Above Poverty by Sex and Age in Highland
According to the poverty statistics in Highland, males aged under 5 years and females aged under 5 years are the age groups that are most secure financially, with 100.0% of males and 100.0% of females in these age groups living above the poverty line.
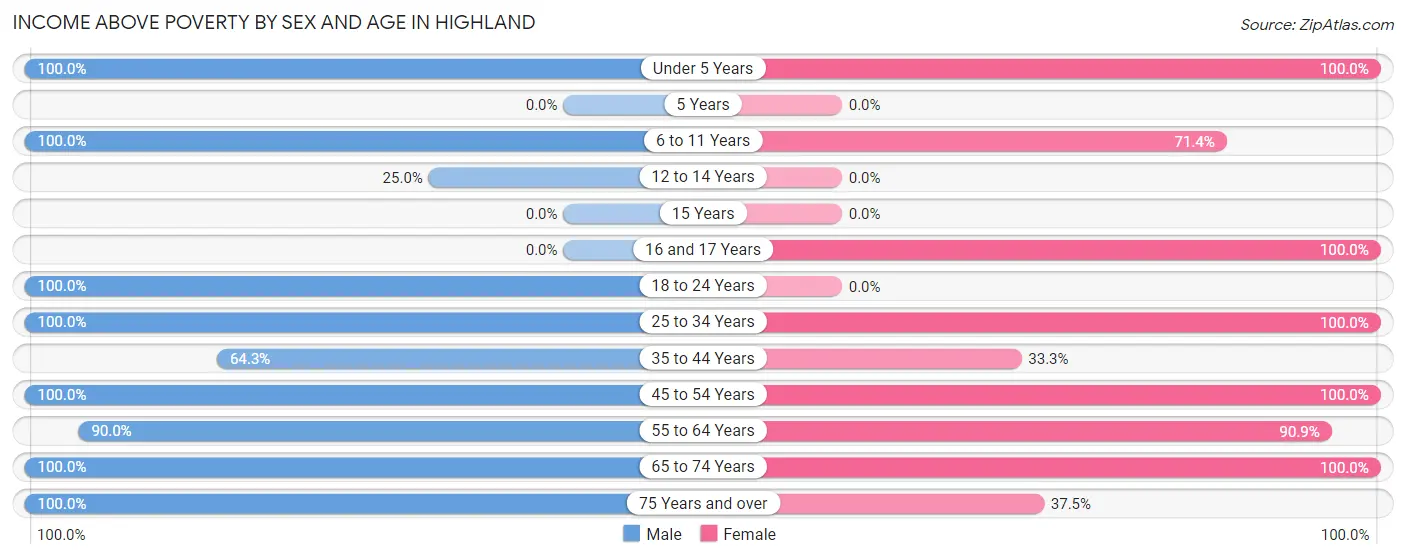
| Age Bracket | Male | Female |
| Under 5 Years | 2 (100.0%) | 2 (100.0%) |
| 5 Years | 0 (0.0%) | 0 (0.0%) |
| 6 to 11 Years | 5 (100.0%) | 5 (71.4%) |
| 12 to 14 Years | 1 (25.0%) | 0 (0.0%) |
| 15 Years | 0 (0.0%) | 0 (0.0%) |
| 16 and 17 Years | 0 (0.0%) | 1 (100.0%) |
| 18 to 24 Years | 2 (100.0%) | 0 (0.0%) |
| 25 to 34 Years | 7 (100.0%) | 8 (100.0%) |
| 35 to 44 Years | 9 (64.3%) | 3 (33.3%) |
| 45 to 54 Years | 16 (100.0%) | 7 (100.0%) |
| 55 to 64 Years | 9 (90.0%) | 10 (90.9%) |
| 65 to 74 Years | 1 (100.0%) | 7 (100.0%) |
| 75 Years and over | 1 (100.0%) | 6 (37.5%) |
| Total | 53 (85.5%) | 49 (71.0%) |
Income Below Poverty Among Married-Couple Families in Highland
The poverty statistics for married-couple families in Highland show that 15.6% or 5 of the total 32 families live below the poverty line. Families with no children have the highest poverty rate of 18.5%, comprising of 5 families. On the other hand, families with 1 or 2 children have the lowest poverty rate of 0.0%, which includes 0 families.
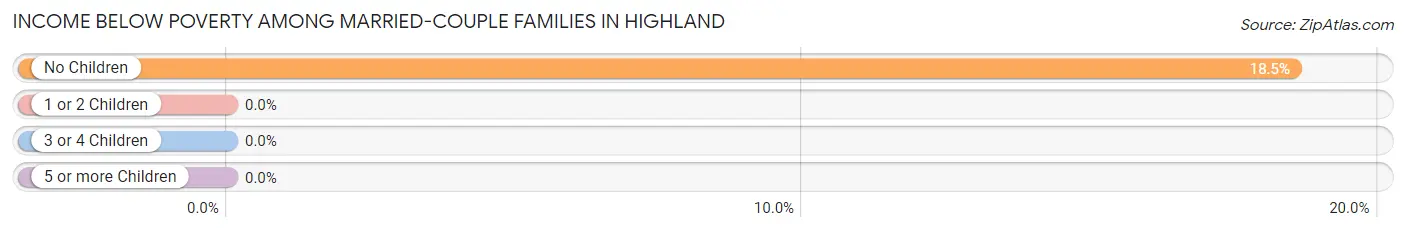
| Children | Above Poverty | Below Poverty |
| No Children | 22 (81.5%) | 5 (18.5%) |
| 1 or 2 Children | 3 (100.0%) | 0 (0.0%) |
| 3 or 4 Children | 2 (100.0%) | 0 (0.0%) |
| 5 or more Children | 0 (0.0%) | 0 (0.0%) |
| Total | 27 (84.4%) | 5 (15.6%) |
Income Below Poverty Among Single-Parent Households in Highland
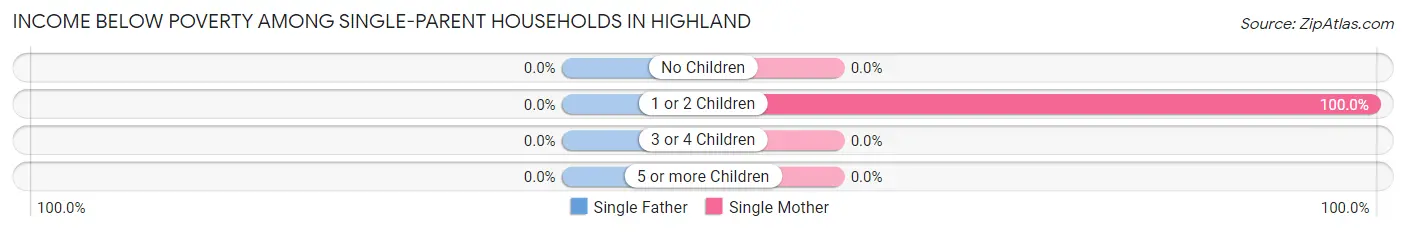
| Children | Single Father | Single Mother |
| No Children | 0 (0.0%) | 0 (0.0%) |
| 1 or 2 Children | 0 (0.0%) | 2 (100.0%) |
| 3 or 4 Children | 0 (0.0%) | 0 (0.0%) |
| 5 or more Children | 0 (0.0%) | 0 (0.0%) |
| Total | 0 (0.0%) | 2 (40.0%) |
Income Below Poverty Among Married-Couple vs Single-Parent Households in Highland
The poverty data for Highland shows that 5 of the married-couple family households (15.6%) and 2 of the single-parent households (33.3%) are living below the poverty level. Within the married-couple family households, those with no children have the highest poverty rate, with 5 households (18.5%) falling below the poverty line. Among the single-parent households, those with 1 or 2 children have the highest poverty rate, with 2 household (66.7%) living below poverty.
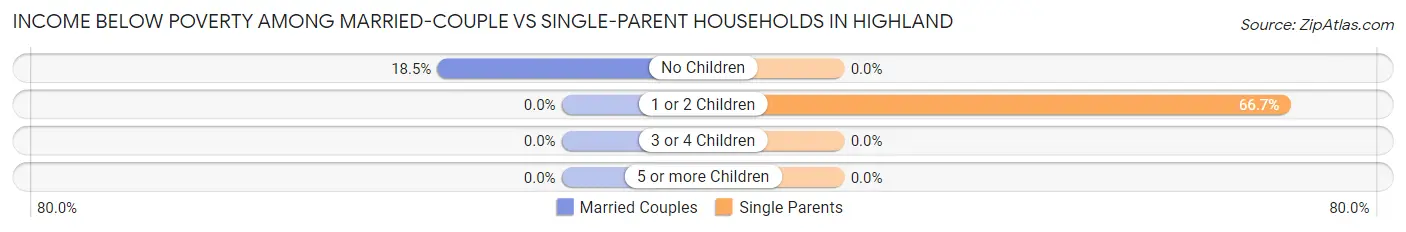
| Children | Married-Couple Families | Single-Parent Households |
| No Children | 5 (18.5%) | 0 (0.0%) |
| 1 or 2 Children | 0 (0.0%) | 2 (66.7%) |
| 3 or 4 Children | 0 (0.0%) | 0 (0.0%) |
| 5 or more Children | 0 (0.0%) | 0 (0.0%) |
| Total | 5 (15.6%) | 2 (33.3%) |
Race in Highland
The most populous races in Highland are White / Caucasian (120 | 91.6%), Native / Alaskan (6 | 4.6%), and Two or more Races (5 | 3.8%).
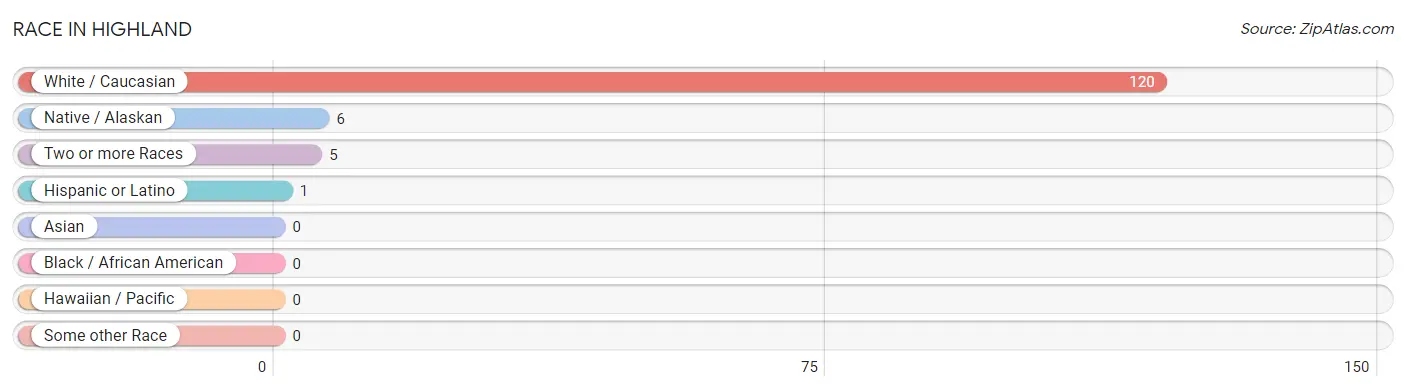
| Race | # Population | % Population |
| Asian | 0 | 0.0% |
| Black / African American | 0 | 0.0% |
| Hawaiian / Pacific | 0 | 0.0% |
| Hispanic or Latino | 1 | 0.8% |
| Native / Alaskan | 6 | 4.6% |
| White / Caucasian | 120 | 91.6% |
| Two or more Races | 5 | 3.8% |
| Some other Race | 0 | 0.0% |
| Total | 131 | 100.0% |
Ancestry in Highland
The most populous ancestries reported in Highland are American (23 | 17.6%), Irish (21 | 16.0%), English (14 | 10.7%), Cherokee (7 | 5.3%), and German (4 | 3.0%), together accounting for 52.7% of all Highland residents.
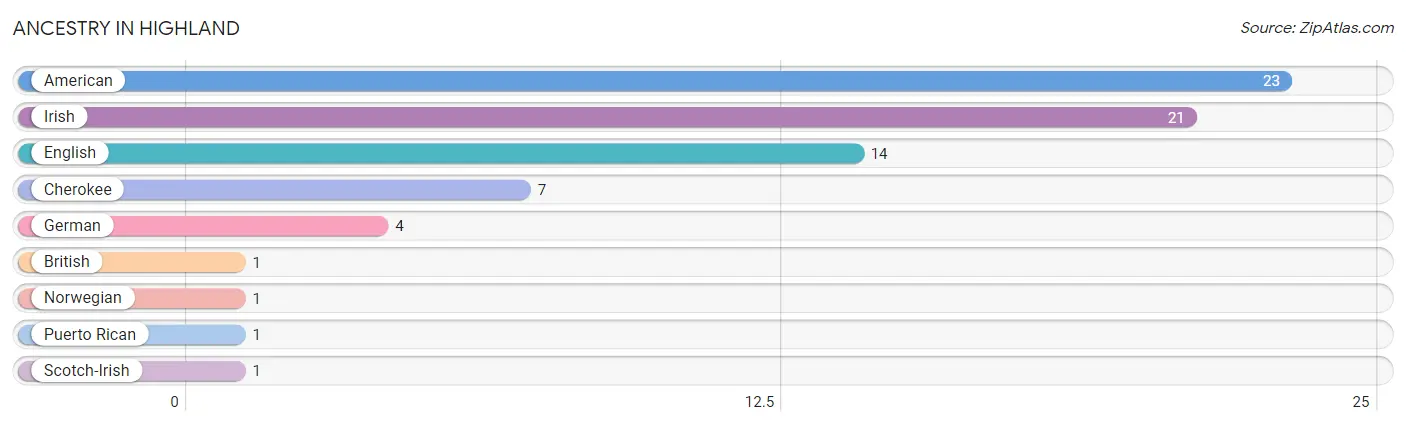
| Ancestry | # Population | % Population |
| American | 23 | 17.6% |
| British | 1 | 0.8% |
| Cherokee | 7 | 5.3% |
| English | 14 | 10.7% |
| German | 4 | 3.0% |
| Irish | 21 | 16.0% |
| Norwegian | 1 | 0.8% |
| Puerto Rican | 1 | 0.8% |
| Scotch-Irish | 1 | 0.8% | View All 9 Rows |
Immigrants in Highland

| Immigration Origin | # Population | % Population | View All 0 Rows |
Sex and Age in Highland
Sex and Age in Highland
The most populous age groups in Highland are 50 to 54 Years (11 | 17.7%) for men and 55 to 59 Years (10 | 14.5%) for women.
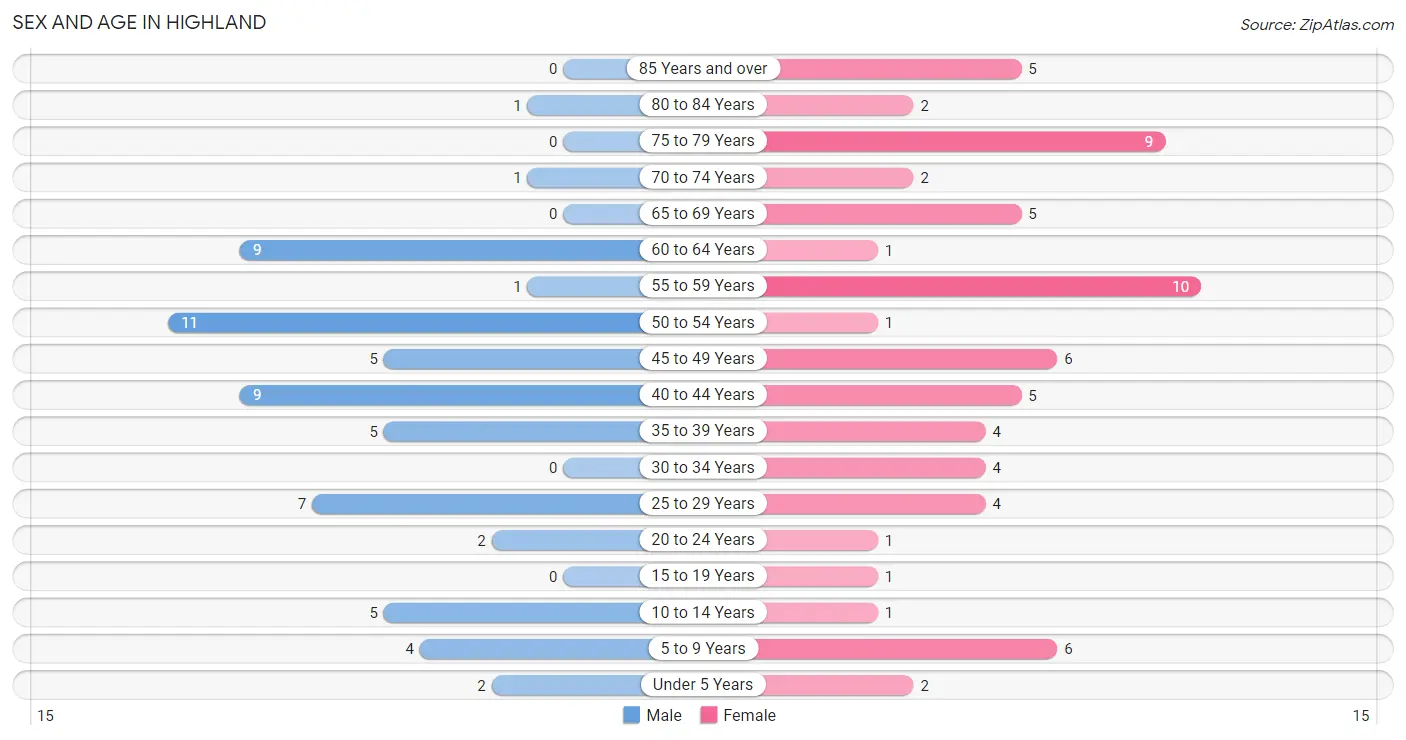
| Age Bracket | Male | Female |
| Under 5 Years | 2 (3.2%) | 2 (2.9%) |
| 5 to 9 Years | 4 (6.5%) | 6 (8.7%) |
| 10 to 14 Years | 5 (8.1%) | 1 (1.5%) |
| 15 to 19 Years | 0 (0.0%) | 1 (1.5%) |
| 20 to 24 Years | 2 (3.2%) | 1 (1.5%) |
| 25 to 29 Years | 7 (11.3%) | 4 (5.8%) |
| 30 to 34 Years | 0 (0.0%) | 4 (5.8%) |
| 35 to 39 Years | 5 (8.1%) | 4 (5.8%) |
| 40 to 44 Years | 9 (14.5%) | 5 (7.2%) |
| 45 to 49 Years | 5 (8.1%) | 6 (8.7%) |
| 50 to 54 Years | 11 (17.7%) | 1 (1.5%) |
| 55 to 59 Years | 1 (1.6%) | 10 (14.5%) |
| 60 to 64 Years | 9 (14.5%) | 1 (1.5%) |
| 65 to 69 Years | 0 (0.0%) | 5 (7.2%) |
| 70 to 74 Years | 1 (1.6%) | 2 (2.9%) |
| 75 to 79 Years | 0 (0.0%) | 9 (13.0%) |
| 80 to 84 Years | 1 (1.6%) | 2 (2.9%) |
| 85 Years and over | 0 (0.0%) | 5 (7.2%) |
| Total | 62 (100.0%) | 69 (100.0%) |
Families and Households in Highland
Median Family Size in Highland
The median family size in Highland is 2.37 persons per family, with single male/father families (1 | 2.6%) accounting for the largest median family size of 6 persons per family. On the other hand, married-couple families (32 | 84.2%) represent the smallest median family size with 2.13 persons per family.
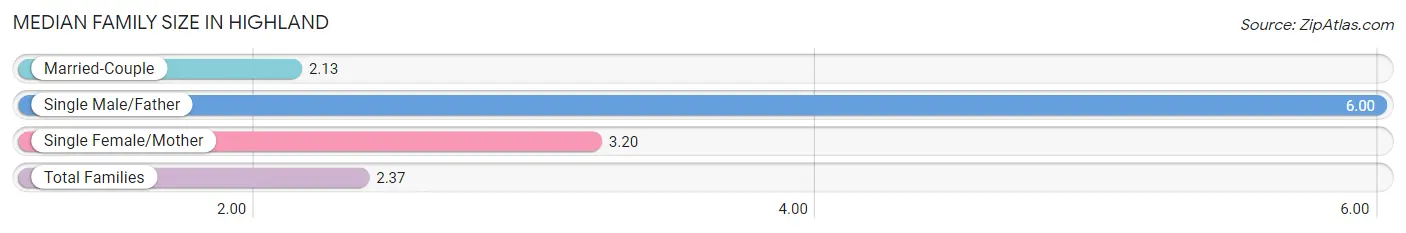
| Family Type | # Families | Family Size |
| Married-Couple | 32 (84.2%) | 2.13 |
| Single Male/Father | 1 (2.6%) | 6.00 |
| Single Female/Mother | 5 (13.2%) | 3.20 |
| Total Families | 38 (100.0%) | 2.37 |
Median Household Size in Highland
The median household size in Highland is 1.79 persons per household, with single male/father households (1 | 1.4%) accounting for the largest median household size of 8 persons per household. non-family households (35 | 47.9%) represent the smallest median household size with 1.06 persons per household.
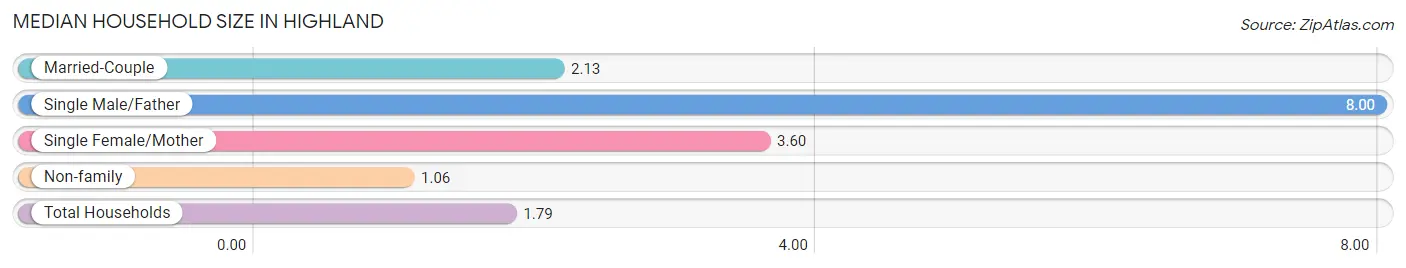
| Household Type | # Households | Household Size |
| Married-Couple | 32 (43.8%) | 2.13 |
| Single Male/Father | 1 (1.4%) | 8.00 |
| Single Female/Mother | 5 (6.9%) | 3.60 |
| Non-family | 35 (47.9%) | 1.06 |
| Total Households | 73 (100.0%) | 1.79 |
Household Size by Marriage Status in Highland
Out of a total of 73 households in Highland, 38 (52.0%) are family households, while 35 (47.9%) are nonfamily households. The most numerous type of family households are 2-person households, comprising 28, and the most common type of nonfamily households are 1-person households, comprising 34.
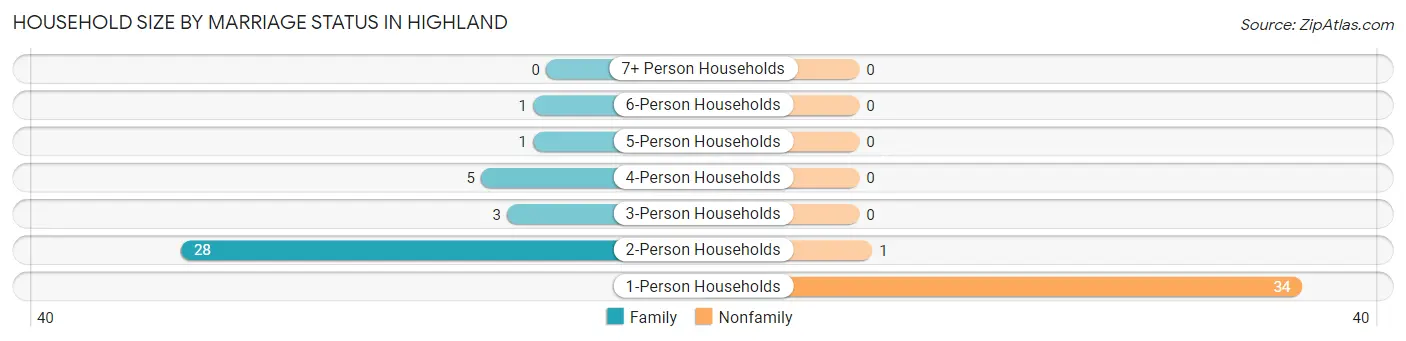
| Household Size | Family Households | Nonfamily Households |
| 1-Person Households | - | 34 (46.6%) |
| 2-Person Households | 28 (38.4%) | 1 (1.4%) |
| 3-Person Households | 3 (4.1%) | 0 (0.0%) |
| 4-Person Households | 5 (6.9%) | 0 (0.0%) |
| 5-Person Households | 1 (1.4%) | 0 (0.0%) |
| 6-Person Households | 1 (1.4%) | 0 (0.0%) |
| 7+ Person Households | 0 (0.0%) | 0 (0.0%) |
| Total | 38 (52.0%) | 35 (47.9%) |
Female Fertility in Highland
Fertility by Age in Highland
| Age Bracket | Women with Births | Births / 1,000 Women |
| 15 to 19 years | 0 (0.0%) | 0.0 |
| 20 to 34 years | 0 (0.0%) | 0.0 |
| 35 to 50 years | 0 (0.0%) | 0.0 |
| Total | 0 (0.0%) | 0.0 |
Fertility by Age by Marriage Status in Highland
| Age Bracket | Married | Unmarried |
| 15 to 19 years | 0 (0.0%) | 0 (0.0%) |
| 20 to 34 years | 0 (0.0%) | 0 (0.0%) |
| 35 to 50 years | 0 (0.0%) | 0 (0.0%) |
| Total | 0 (0.0%) | 0 (0.0%) |
Fertility by Education in Highland
| Educational Attainment | Women with Births | Births / 1,000 Women |
| Less than High School | 0 (0.0%) | 0.0 |
| High School Diploma | 0 (0.0%) | 0.0 |
| College or Associate's Degree | 0 (0.0%) | 0.0 |
| Bachelor's Degree | 0 (0.0%) | 0.0 |
| Graduate Degree | 0 (0.0%) | 0.0 |
| Total | 0 (0.0%) | 0.0 |
Fertility by Education by Marriage Status in Highland
| Educational Attainment | Married | Unmarried |
| Less than High School | 0 (0.0%) | 0 (0.0%) |
| High School Diploma | 0 (0.0%) | 0 (0.0%) |
| College or Associate's Degree | 0 (0.0%) | 0 (0.0%) |
| Bachelor's Degree | 0 (0.0%) | 0 (0.0%) |
| Graduate Degree | 0 (0.0%) | 0 (0.0%) |
| Total | 0 (0.0%) | 0 (0.0%) |
Employment Characteristics in Highland
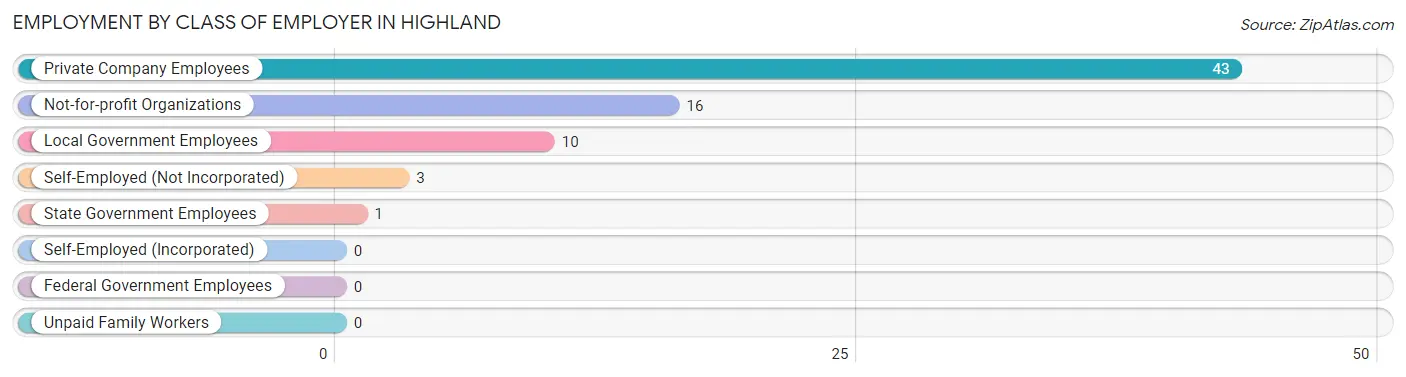
Employment by Class of Employer in Highland
Among the 73 employed individuals in Highland, private company employees (43 | 58.9%), not-for-profit organizations (16 | 21.9%), and local government employees (10 | 13.7%) make up the most common classes of employment.
| Employer Class | # Employees | % Employees |
| Private Company Employees | 43 | 58.9% |
| Self-Employed (Incorporated) | 0 | 0.0% |
| Self-Employed (Not Incorporated) | 3 | 4.1% |
| Not-for-profit Organizations | 16 | 21.9% |
| Local Government Employees | 10 | 13.7% |
| State Government Employees | 1 | 1.4% |
| Federal Government Employees | 0 | 0.0% |
| Unpaid Family Workers | 0 | 0.0% |
| Total | 73 | 100.0% |
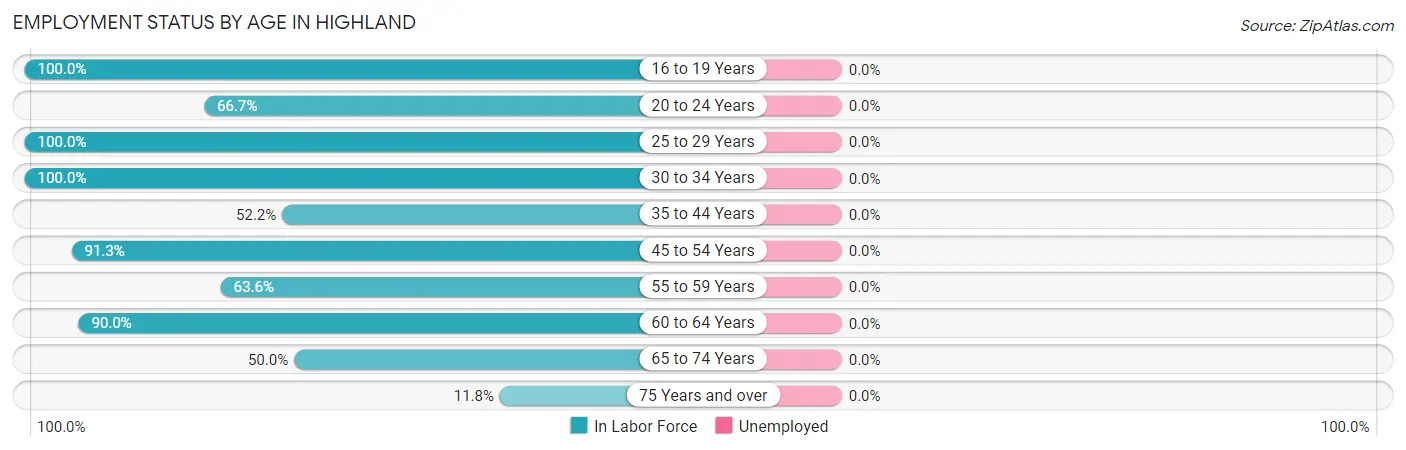
Employment Status by Age in Highland
| Age Bracket | In Labor Force | Unemployed |
| 16 to 19 Years | 1 (100.0%) | 0 (0.0%) |
| 20 to 24 Years | 2 (66.7%) | 0 (0.0%) |
| 25 to 29 Years | 11 (100.0%) | 0 (0.0%) |
| 30 to 34 Years | 4 (100.0%) | 0 (0.0%) |
| 35 to 44 Years | 12 (52.2%) | 0 (0.0%) |
| 45 to 54 Years | 21 (91.3%) | 0 (0.0%) |
| 55 to 59 Years | 7 (63.6%) | 0 (0.0%) |
| 60 to 64 Years | 9 (90.0%) | 0 (0.0%) |
| 65 to 74 Years | 4 (50.0%) | 0 (0.0%) |
| 75 Years and over | 2 (11.8%) | 0 (0.0%) |
| Total | 73 (65.8%) | 0 (0.0%) |
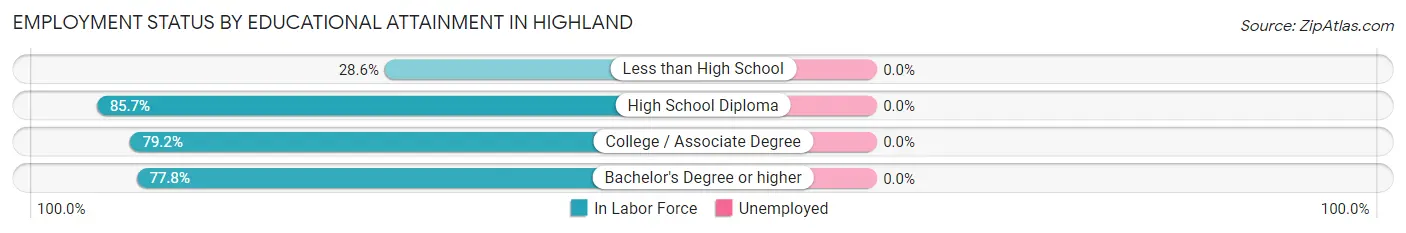
Employment Status by Educational Attainment in Highland
| Educational Attainment | In Labor Force | Unemployed |
| Less than High School | 2 (28.6%) | 0 (0.0%) |
| High School Diploma | 36 (85.7%) | 0 (0.0%) |
| College / Associate Degree | 19 (79.2%) | 0 (0.0%) |
| Bachelor's Degree or higher | 7 (77.8%) | 0 (0.0%) |
| Total | 64 (78.0%) | 0 (0.0%) |
Employment Occupations by Sex in Highland
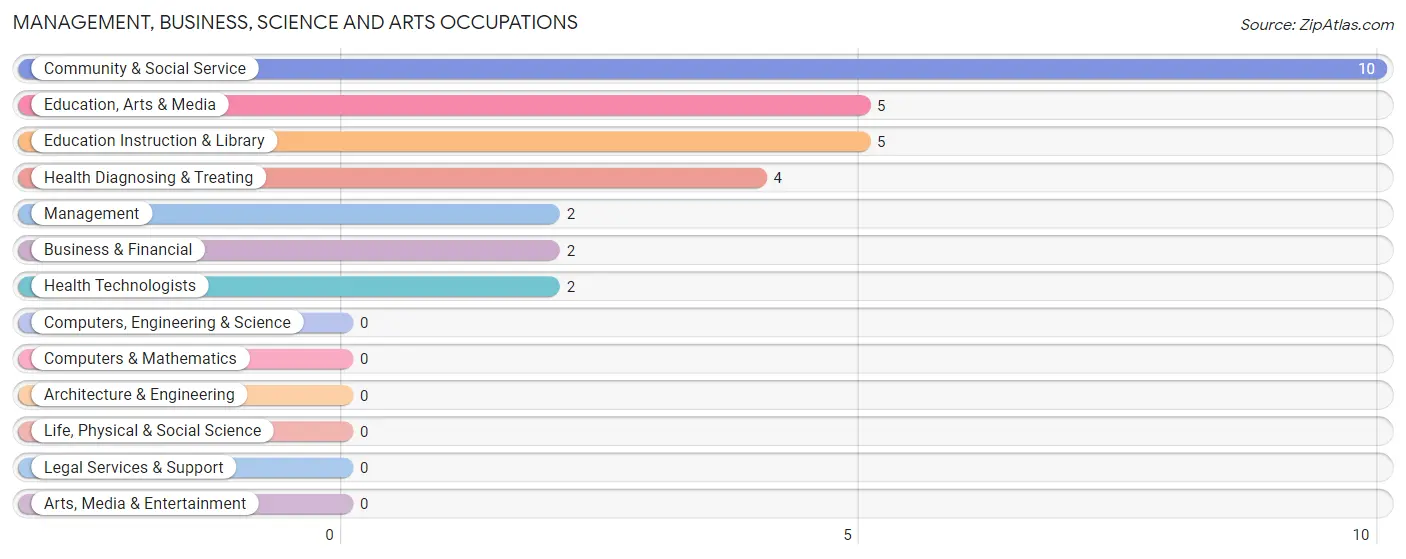
Management, Business, Science and Arts Occupations
The most common Management, Business, Science and Arts occupations in Highland are Community & Social Service (10 | 13.7%), Education, Arts & Media (5 | 6.9%), Education Instruction & Library (5 | 6.9%), Health Diagnosing & Treating (4 | 5.5%), and Management (2 | 2.7%).
Management, Business, Science and Arts Occupations by Sex
Within the Management, Business, Science and Arts occupations in Highland, the most male-oriented occupations are Management (100.0%), and Business & Financial (100.0%), while the most female-oriented occupations are Community & Social Service (100.0%), Education, Arts & Media (100.0%), and Education Instruction & Library (100.0%).
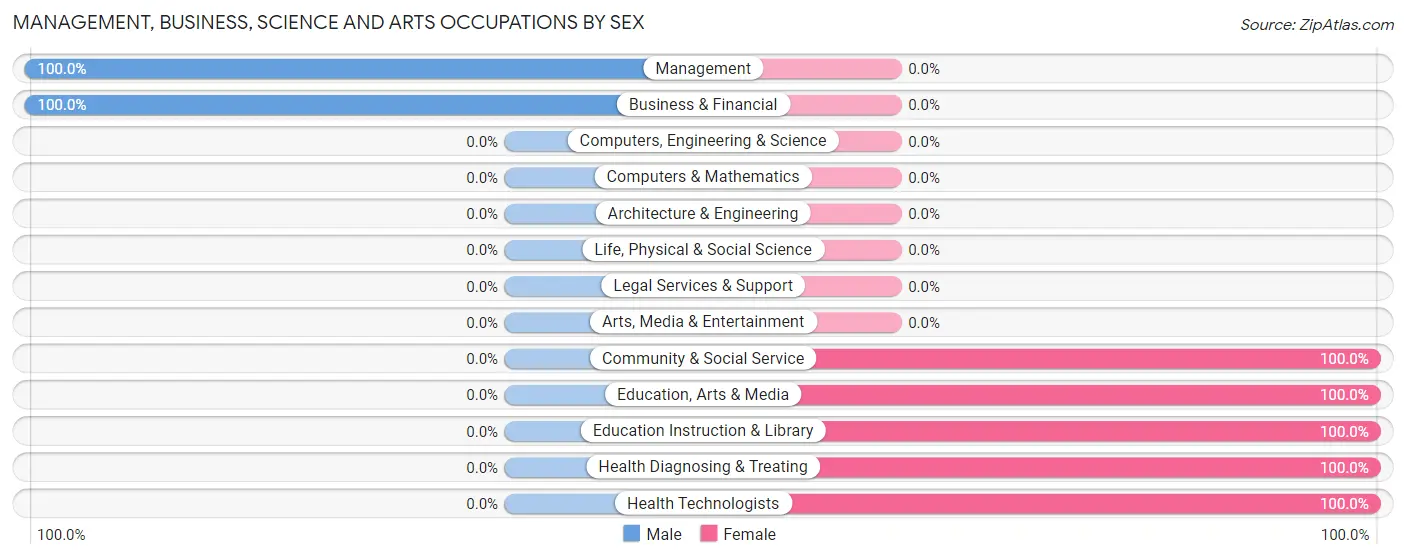
| Occupation | Male | Female |
| Management | 2 (100.0%) | 0 (0.0%) |
| Business & Financial | 2 (100.0%) | 0 (0.0%) |
| Computers, Engineering & Science | 0 (0.0%) | 0 (0.0%) |
| Computers & Mathematics | 0 (0.0%) | 0 (0.0%) |
| Architecture & Engineering | 0 (0.0%) | 0 (0.0%) |
| Life, Physical & Social Science | 0 (0.0%) | 0 (0.0%) |
| Community & Social Service | 0 (0.0%) | 10 (100.0%) |
| Education, Arts & Media | 0 (0.0%) | 5 (100.0%) |
| Legal Services & Support | 0 (0.0%) | 0 (0.0%) |
| Education Instruction & Library | 0 (0.0%) | 5 (100.0%) |
| Arts, Media & Entertainment | 0 (0.0%) | 0 (0.0%) |
| Health Diagnosing & Treating | 0 (0.0%) | 4 (100.0%) |
| Health Technologists | 0 (0.0%) | 2 (100.0%) |
| Total (Category) | 4 (22.2%) | 14 (77.8%) |
| Total (Overall) | 41 (56.2%) | 32 (43.8%) |
Services Occupations
The most common Services occupations in Highland are Personal Care & Service (6 | 8.2%), Healthcare Support (3 | 4.1%), Food Preparation & Serving (3 | 4.1%), Security & Protection (1 | 1.4%), and Firefighting & Prevention (1 | 1.4%).
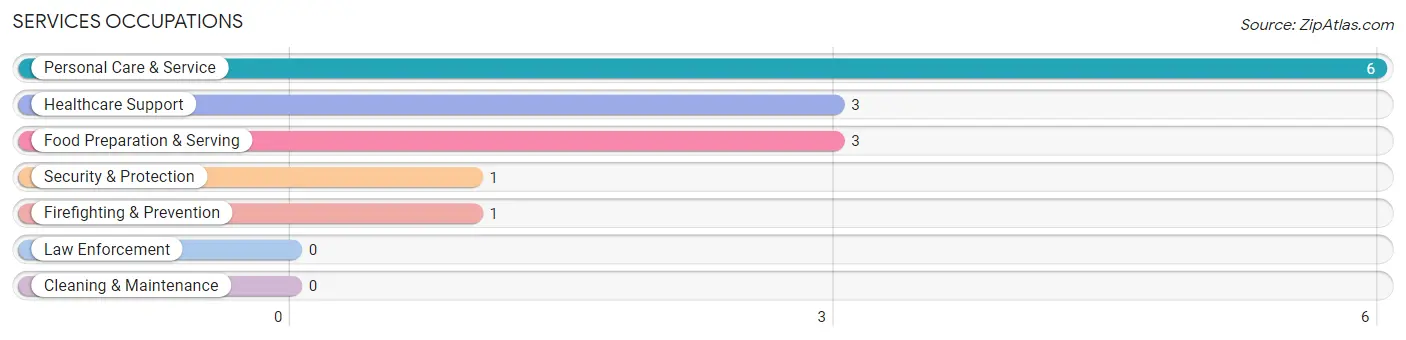
Services Occupations by Sex
Within the Services occupations in Highland, the most male-oriented occupations are Security & Protection (100.0%), Firefighting & Prevention (100.0%), and Personal Care & Service (100.0%), while the most female-oriented occupations are Healthcare Support (100.0%), and Food Preparation & Serving (100.0%).
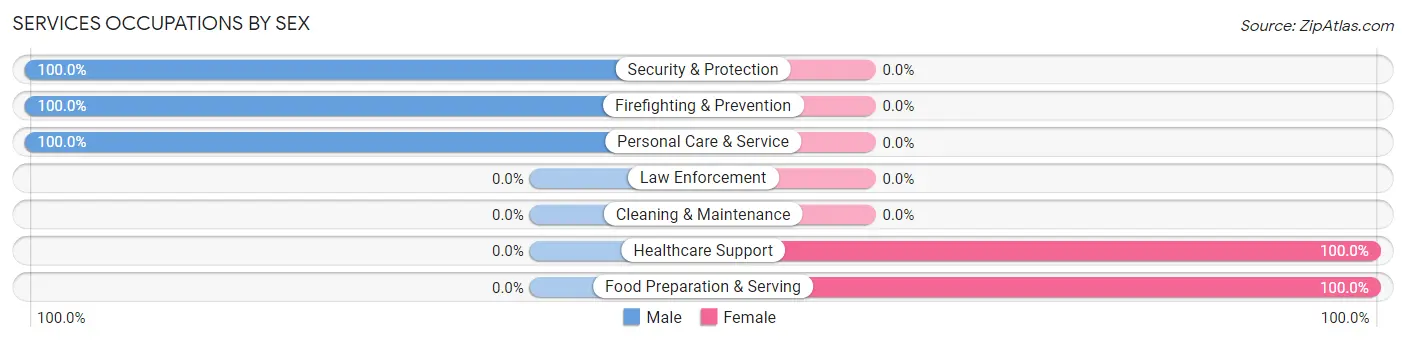
| Occupation | Male | Female |
| Healthcare Support | 0 (0.0%) | 3 (100.0%) |
| Security & Protection | 1 (100.0%) | 0 (0.0%) |
| Firefighting & Prevention | 1 (100.0%) | 0 (0.0%) |
| Law Enforcement | 0 (0.0%) | 0 (0.0%) |
| Food Preparation & Serving | 0 (0.0%) | 3 (100.0%) |
| Cleaning & Maintenance | 0 (0.0%) | 0 (0.0%) |
| Personal Care & Service | 6 (100.0%) | 0 (0.0%) |
| Total (Category) | 7 (53.8%) | 6 (46.2%) |
| Total (Overall) | 41 (56.2%) | 32 (43.8%) |
Sales and Office Occupations
The most common Sales and Office occupations in Highland are , and Office & Administration (11 | 15.1%).
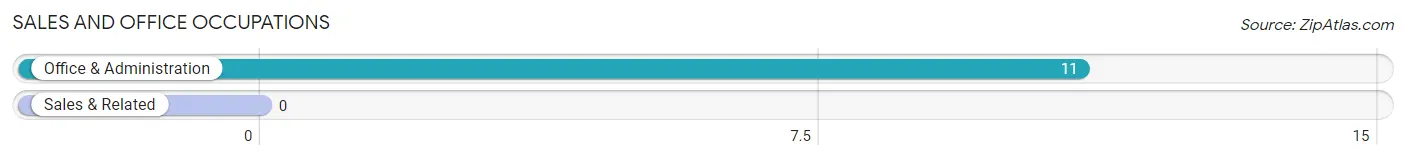
Sales and Office Occupations by Sex
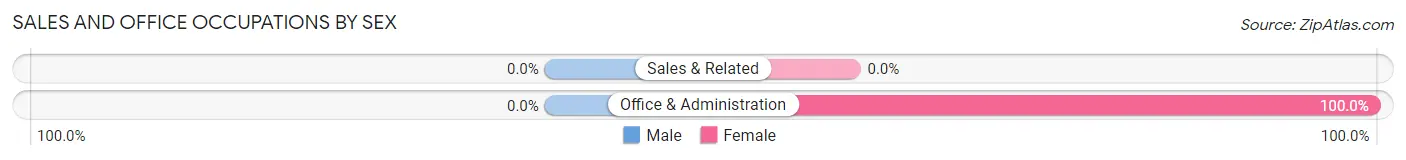
| Occupation | Male | Female |
| Sales & Related | 0 (0.0%) | 0 (0.0%) |
| Office & Administration | 0 (0.0%) | 11 (100.0%) |
| Total (Category) | 0 (0.0%) | 11 (100.0%) |
| Total (Overall) | 41 (56.2%) | 32 (43.8%) |
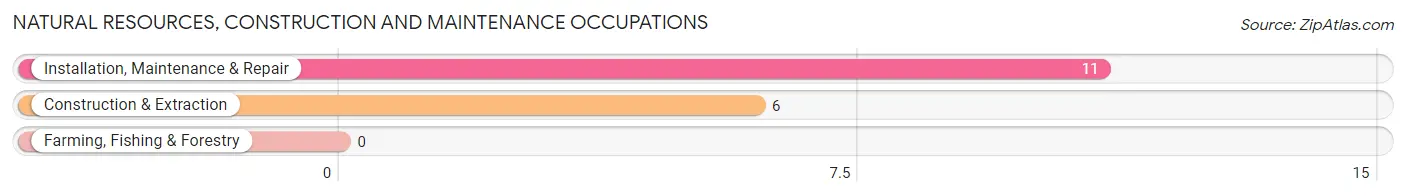
Natural Resources, Construction and Maintenance Occupations
The most common Natural Resources, Construction and Maintenance occupations in Highland are Installation, Maintenance & Repair (11 | 15.1%), and Construction & Extraction (6 | 8.2%).
Natural Resources, Construction and Maintenance Occupations by Sex
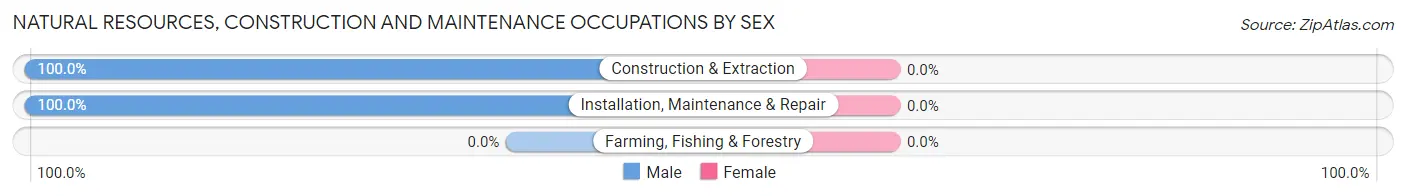
| Occupation | Male | Female |
| Farming, Fishing & Forestry | 0 (0.0%) | 0 (0.0%) |
| Construction & Extraction | 6 (100.0%) | 0 (0.0%) |
| Installation, Maintenance & Repair | 11 (100.0%) | 0 (0.0%) |
| Total (Category) | 17 (100.0%) | 0 (0.0%) |
| Total (Overall) | 41 (56.2%) | 32 (43.8%) |
Production, Transportation and Moving Occupations
The most common Production, Transportation and Moving occupations in Highland are Transportation (11 | 15.1%), Production (2 | 2.7%), and Material Moving (1 | 1.4%).
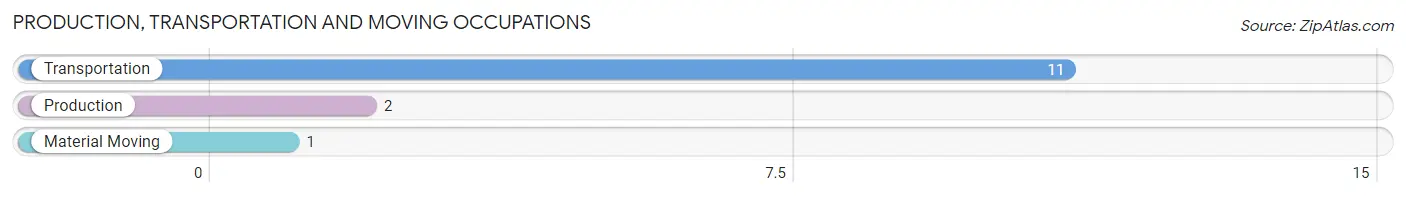
Production, Transportation and Moving Occupations by Sex
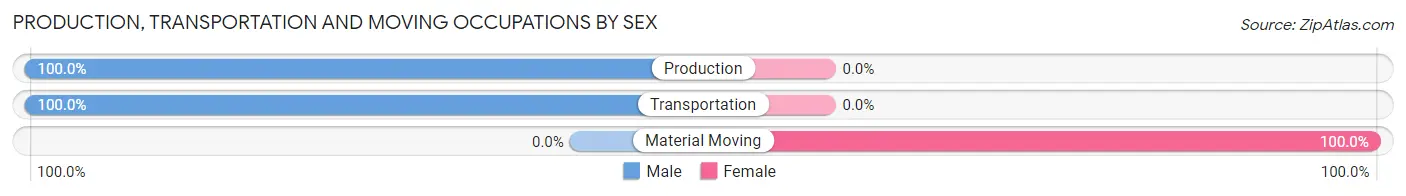
| Occupation | Male | Female |
| Production | 2 (100.0%) | 0 (0.0%) |
| Transportation | 11 (100.0%) | 0 (0.0%) |
| Material Moving | 0 (0.0%) | 1 (100.0%) |
| Total (Category) | 13 (92.9%) | 1 (7.1%) |
| Total (Overall) | 41 (56.2%) | 32 (43.8%) |
Employment Industries by Sex in Highland
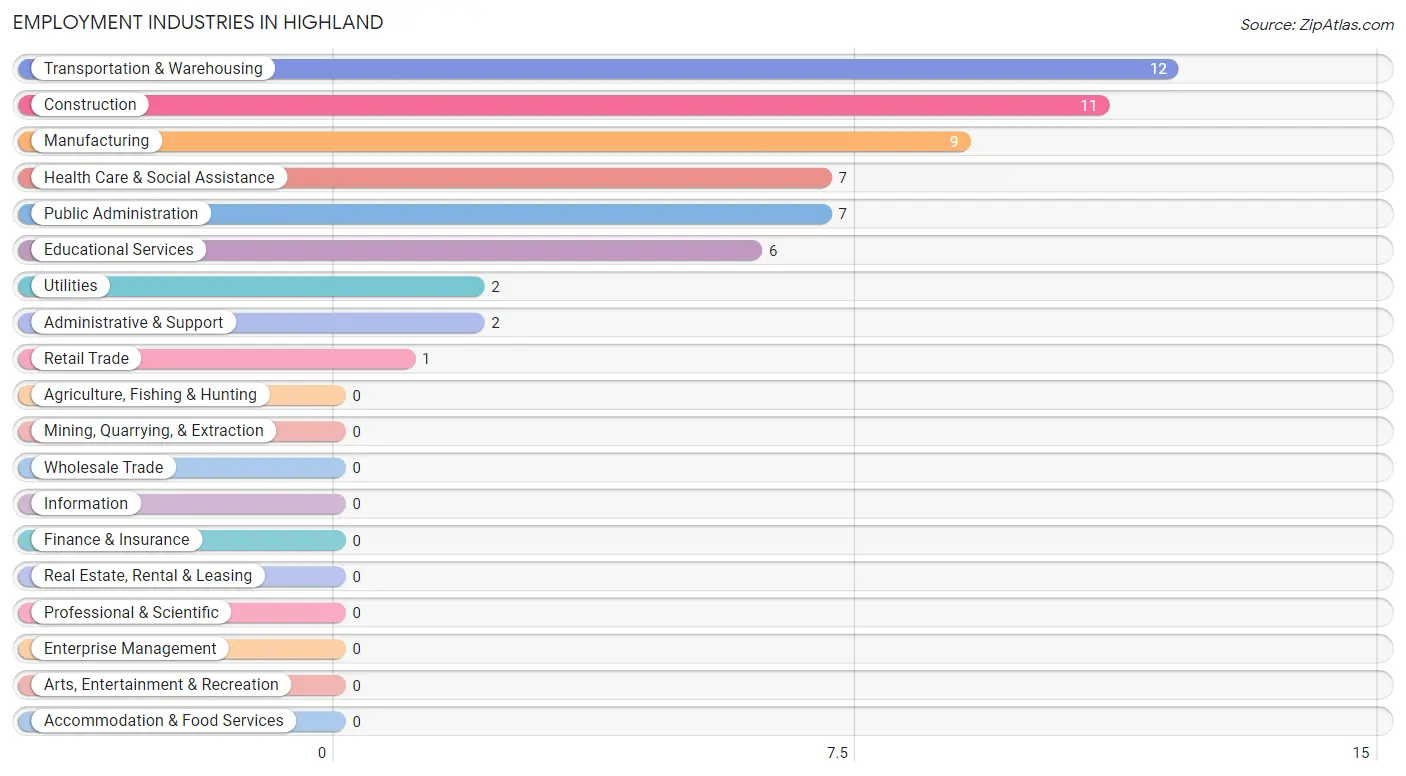
Employment Industries in Highland
The major employment industries in Highland include Transportation & Warehousing (12 | 16.4%), Construction (11 | 15.1%), Manufacturing (9 | 12.3%), Health Care & Social Assistance (7 | 9.6%), and Public Administration (7 | 9.6%).
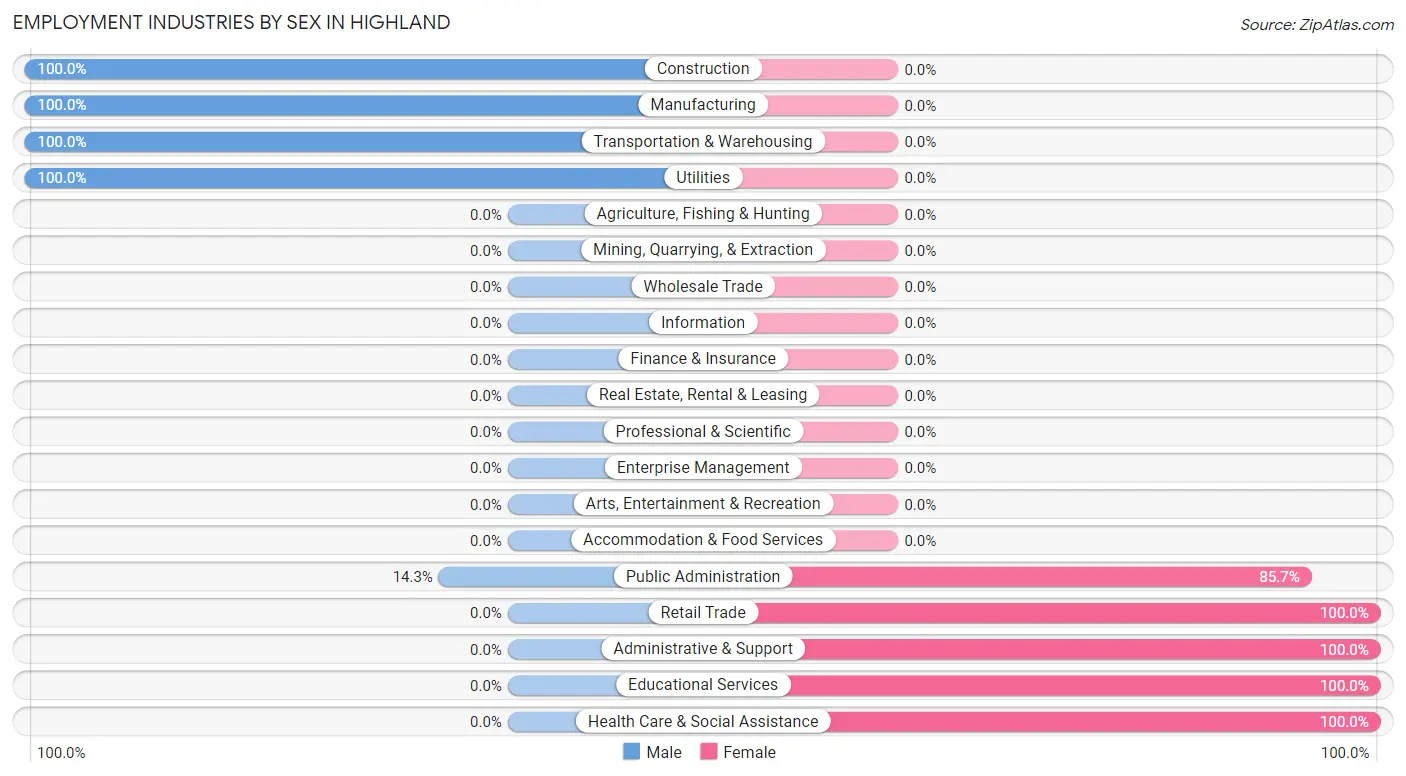
Employment Industries by Sex in Highland
The Highland industries that see more men than women are Construction (100.0%), Manufacturing (100.0%), and Transportation & Warehousing (100.0%), whereas the industries that tend to have a higher number of women are Retail Trade (100.0%), Administrative & Support (100.0%), and Educational Services (100.0%).
| Industry | Male | Female |
| Agriculture, Fishing & Hunting | 0 (0.0%) | 0 (0.0%) |
| Mining, Quarrying, & Extraction | 0 (0.0%) | 0 (0.0%) |
| Construction | 11 (100.0%) | 0 (0.0%) |
| Manufacturing | 9 (100.0%) | 0 (0.0%) |
| Wholesale Trade | 0 (0.0%) | 0 (0.0%) |
| Retail Trade | 0 (0.0%) | 1 (100.0%) |
| Transportation & Warehousing | 12 (100.0%) | 0 (0.0%) |
| Utilities | 2 (100.0%) | 0 (0.0%) |
| Information | 0 (0.0%) | 0 (0.0%) |
| Finance & Insurance | 0 (0.0%) | 0 (0.0%) |
| Real Estate, Rental & Leasing | 0 (0.0%) | 0 (0.0%) |
| Professional & Scientific | 0 (0.0%) | 0 (0.0%) |
| Enterprise Management | 0 (0.0%) | 0 (0.0%) |
| Administrative & Support | 0 (0.0%) | 2 (100.0%) |
| Educational Services | 0 (0.0%) | 6 (100.0%) |
| Health Care & Social Assistance | 0 (0.0%) | 7 (100.0%) |
| Arts, Entertainment & Recreation | 0 (0.0%) | 0 (0.0%) |
| Accommodation & Food Services | 0 (0.0%) | 0 (0.0%) |
| Public Administration | 1 (14.3%) | 6 (85.7%) |
| Total | 41 (56.2%) | 32 (43.8%) |
Education in Highland
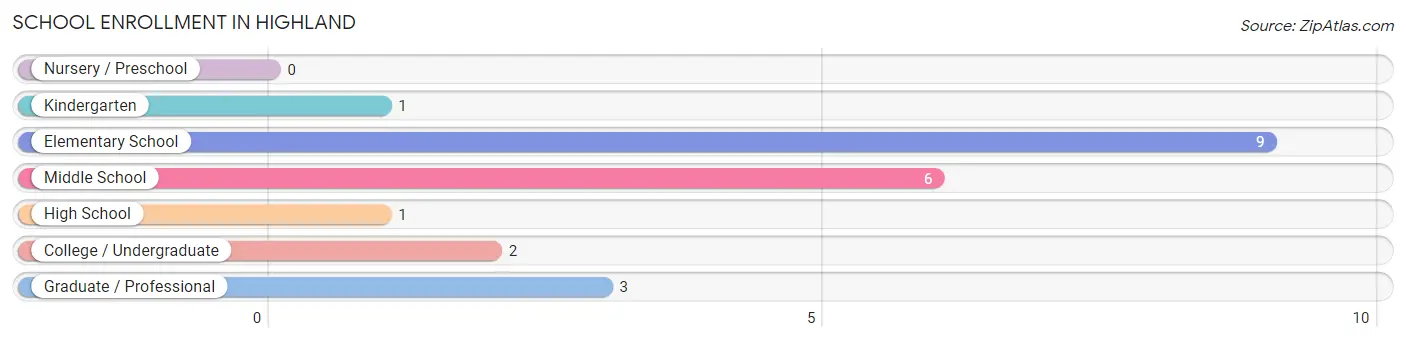
School Enrollment in Highland
The most common levels of schooling among the 22 students in Highland are elementary school (9 | 40.9%), middle school (6 | 27.3%), and graduate / professional (3 | 13.6%).
| School Level | # Students | % Students |
| Nursery / Preschool | 0 | 0.0% |
| Kindergarten | 1 | 4.5% |
| Elementary School | 9 | 40.9% |
| Middle School | 6 | 27.3% |
| High School | 1 | 4.5% |
| College / Undergraduate | 2 | 9.1% |
| Graduate / Professional | 3 | 13.6% |
| Total | 22 | 100.0% |
School Enrollment by Age by Funding Source in Highland
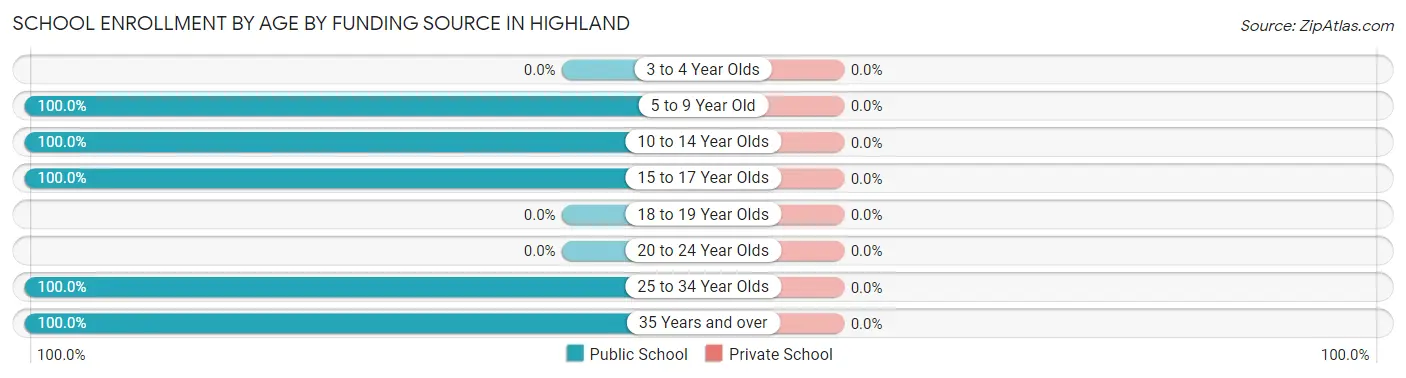
| Age Bracket | Public School | Private School |
| 3 to 4 Year Olds | 0 (0.0%) | 0 (0.0%) |
| 5 to 9 Year Old | 10 (100.0%) | 0 (0.0%) |
| 10 to 14 Year Olds | 6 (100.0%) | 0 (0.0%) |
| 15 to 17 Year Olds | 1 (100.0%) | 0 (0.0%) |
| 18 to 19 Year Olds | 0 (0.0%) | 0 (0.0%) |
| 20 to 24 Year Olds | 0 (0.0%) | 0 (0.0%) |
| 25 to 34 Year Olds | 4 (100.0%) | 0 (0.0%) |
| 35 Years and over | 1 (100.0%) | 0 (0.0%) |
| Total | 22 (100.0%) | 0 (0.0%) |
Educational Attainment by Field of Study in Highland
Education (3 | 33.3%), psychology (2 | 22.2%), engineering (2 | 22.2%), and science & technology (2 | 22.2%) are the most common fields of study among 9 individuals in Highland who have obtained a bachelor's degree or higher.
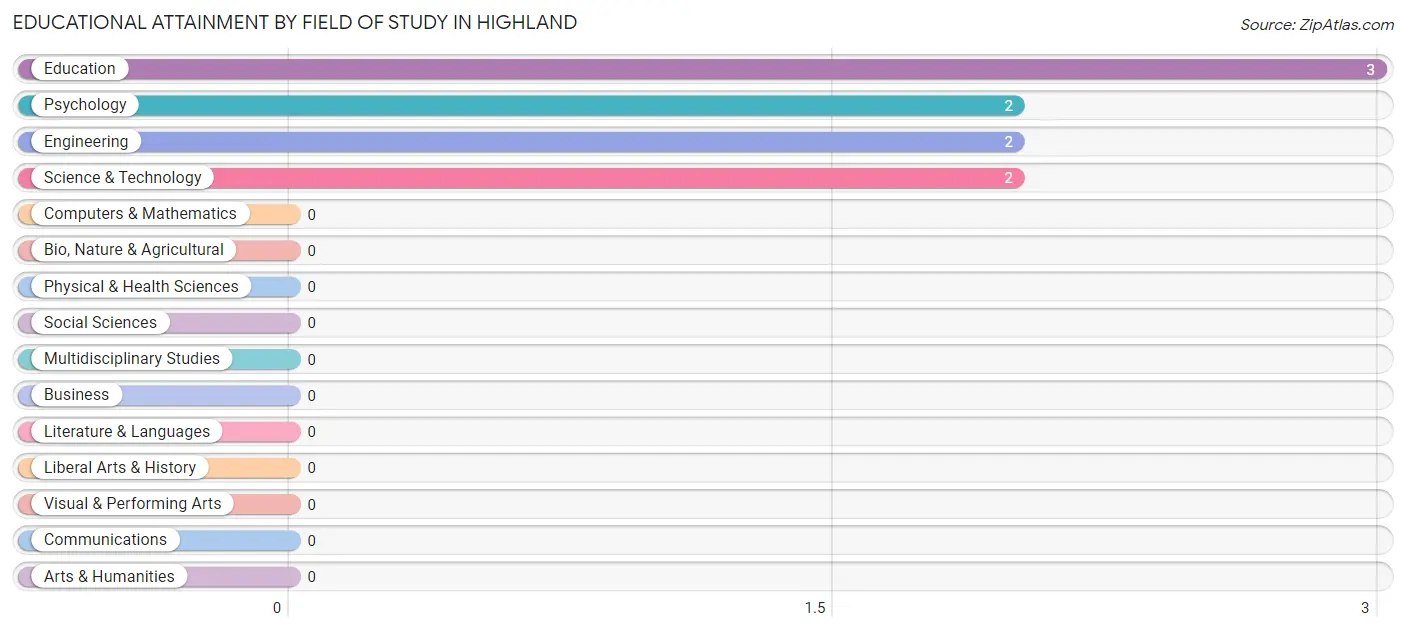
| Field of Study | # Graduates | % Graduates |
| Computers & Mathematics | 0 | 0.0% |
| Bio, Nature & Agricultural | 0 | 0.0% |
| Physical & Health Sciences | 0 | 0.0% |
| Psychology | 2 | 22.2% |
| Social Sciences | 0 | 0.0% |
| Engineering | 2 | 22.2% |
| Multidisciplinary Studies | 0 | 0.0% |
| Science & Technology | 2 | 22.2% |
| Business | 0 | 0.0% |
| Education | 3 | 33.3% |
| Literature & Languages | 0 | 0.0% |
| Liberal Arts & History | 0 | 0.0% |
| Visual & Performing Arts | 0 | 0.0% |
| Communications | 0 | 0.0% |
| Arts & Humanities | 0 | 0.0% |
| Total | 9 | 100.0% |
Transportation & Commute in Highland
Vehicle Availability by Sex in Highland
The most prevalent vehicle ownership categories in Highland are males with 2 vehicles (23, accounting for 56.1%) and females with 2 vehicles (10, making up 71.9%).
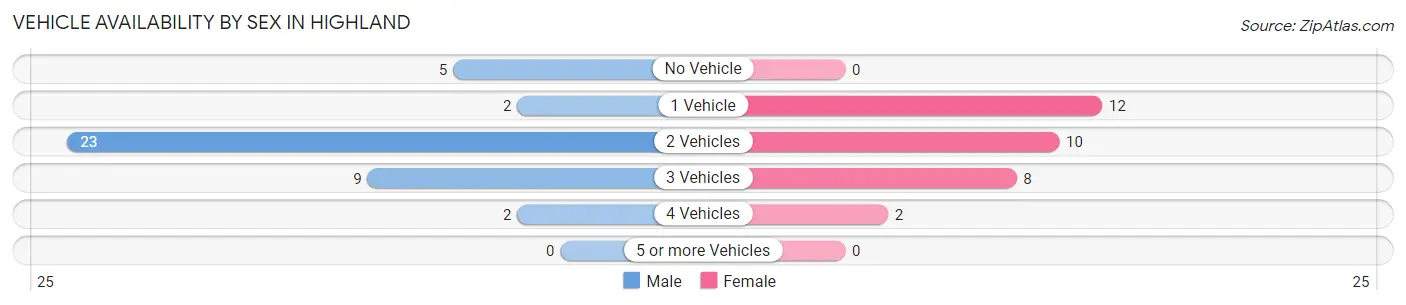
| Vehicles Available | Male | Female |
| No Vehicle | 5 (12.2%) | 0 (0.0%) |
| 1 Vehicle | 2 (4.9%) | 12 (37.5%) |
| 2 Vehicles | 23 (56.1%) | 10 (31.2%) |
| 3 Vehicles | 9 (22.0%) | 8 (25.0%) |
| 4 Vehicles | 2 (4.9%) | 2 (6.2%) |
| 5 or more Vehicles | 0 (0.0%) | 0 (0.0%) |
| Total | 41 (100.0%) | 32 (100.0%) |
Commute Time in Highland
The most frequently occuring commute durations in Highland are 10 to 14 minutes (21 commuters, 28.8%), 5 to 9 minutes (13 commuters, 17.8%), and 15 to 19 minutes (13 commuters, 17.8%).
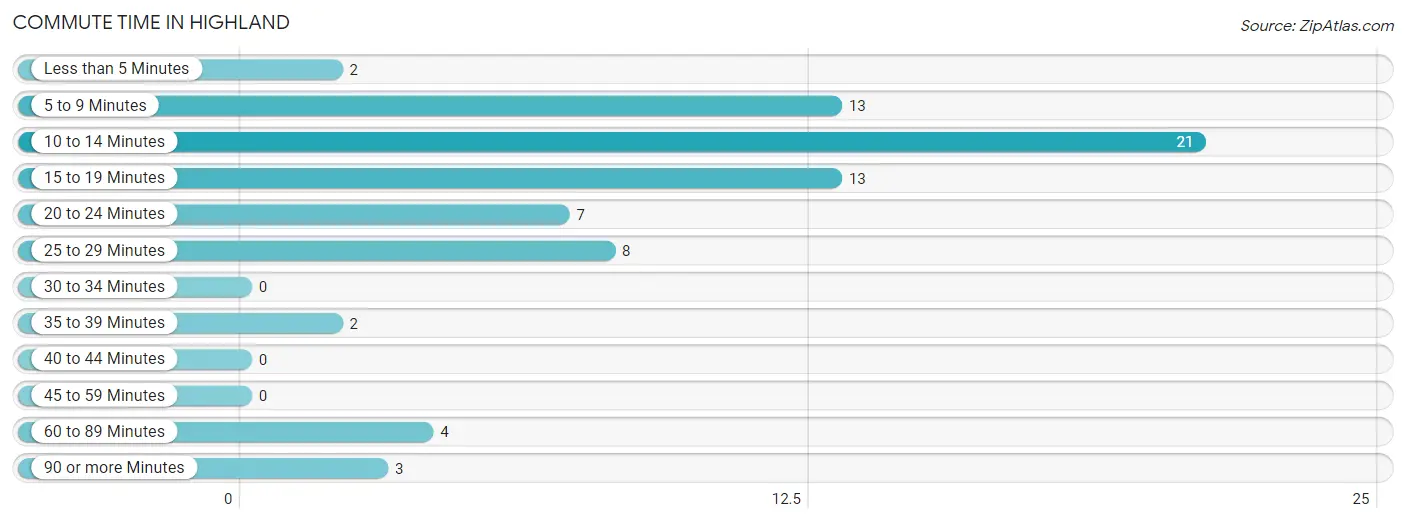
| Commute Time | # Commuters | % Commuters |
| Less than 5 Minutes | 2 | 2.7% |
| 5 to 9 Minutes | 13 | 17.8% |
| 10 to 14 Minutes | 21 | 28.8% |
| 15 to 19 Minutes | 13 | 17.8% |
| 20 to 24 Minutes | 7 | 9.6% |
| 25 to 29 Minutes | 8 | 11.0% |
| 30 to 34 Minutes | 0 | 0.0% |
| 35 to 39 Minutes | 2 | 2.7% |
| 40 to 44 Minutes | 0 | 0.0% |
| 45 to 59 Minutes | 0 | 0.0% |
| 60 to 89 Minutes | 4 | 5.5% |
| 90 or more Minutes | 3 | 4.1% |
Commute Time by Sex in Highland
The most common commute times in Highland are 10 to 14 minutes (13 commuters, 31.7%) for males and 5 to 9 minutes (8 commuters, 25.0%) for females.
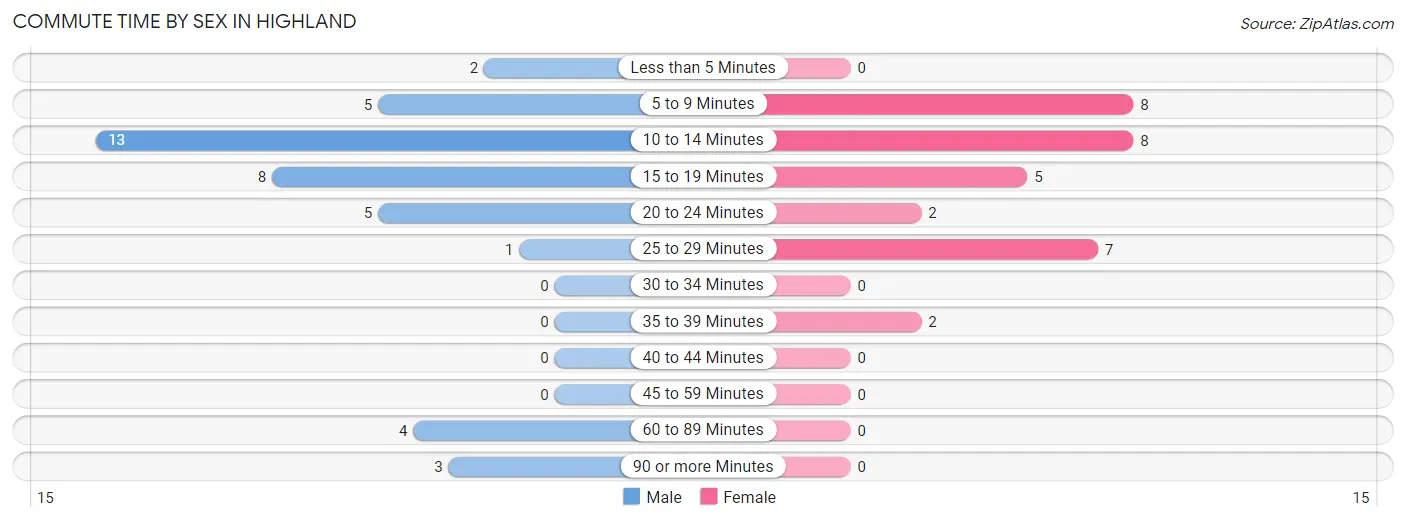
| Commute Time | Male | Female |
| Less than 5 Minutes | 2 (4.9%) | 0 (0.0%) |
| 5 to 9 Minutes | 5 (12.2%) | 8 (25.0%) |
| 10 to 14 Minutes | 13 (31.7%) | 8 (25.0%) |
| 15 to 19 Minutes | 8 (19.5%) | 5 (15.6%) |
| 20 to 24 Minutes | 5 (12.2%) | 2 (6.2%) |
| 25 to 29 Minutes | 1 (2.4%) | 7 (21.9%) |
| 30 to 34 Minutes | 0 (0.0%) | 0 (0.0%) |
| 35 to 39 Minutes | 0 (0.0%) | 2 (6.2%) |
| 40 to 44 Minutes | 0 (0.0%) | 0 (0.0%) |
| 45 to 59 Minutes | 0 (0.0%) | 0 (0.0%) |
| 60 to 89 Minutes | 4 (9.8%) | 0 (0.0%) |
| 90 or more Minutes | 3 (7.3%) | 0 (0.0%) |
Time of Departure to Work by Sex in Highland
The most frequent times of departure to work in Highland are 12:00 PM to 3:59 PM (11, 26.8%) for males and 12:00 PM to 3:59 PM (10, 31.2%) for females.
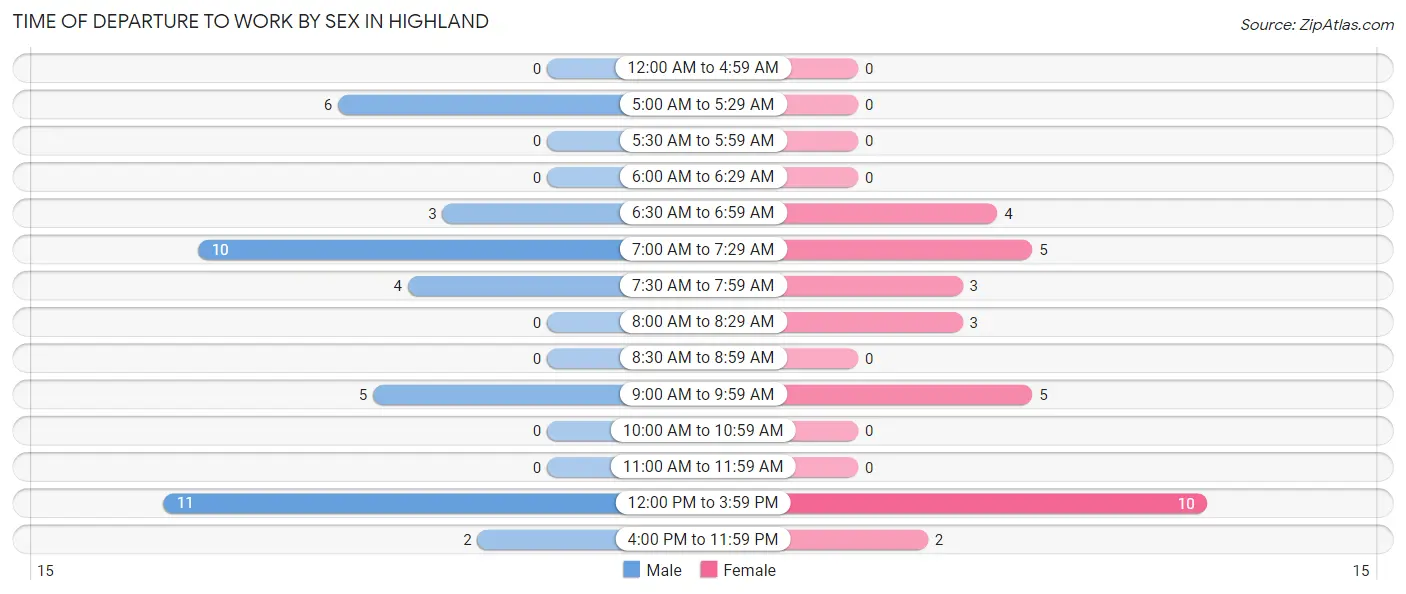
| Time of Departure | Male | Female |
| 12:00 AM to 4:59 AM | 0 (0.0%) | 0 (0.0%) |
| 5:00 AM to 5:29 AM | 6 (14.6%) | 0 (0.0%) |
| 5:30 AM to 5:59 AM | 0 (0.0%) | 0 (0.0%) |
| 6:00 AM to 6:29 AM | 0 (0.0%) | 0 (0.0%) |
| 6:30 AM to 6:59 AM | 3 (7.3%) | 4 (12.5%) |
| 7:00 AM to 7:29 AM | 10 (24.4%) | 5 (15.6%) |
| 7:30 AM to 7:59 AM | 4 (9.8%) | 3 (9.4%) |
| 8:00 AM to 8:29 AM | 0 (0.0%) | 3 (9.4%) |
| 8:30 AM to 8:59 AM | 0 (0.0%) | 0 (0.0%) |
| 9:00 AM to 9:59 AM | 5 (12.2%) | 5 (15.6%) |
| 10:00 AM to 10:59 AM | 0 (0.0%) | 0 (0.0%) |
| 11:00 AM to 11:59 AM | 0 (0.0%) | 0 (0.0%) |
| 12:00 PM to 3:59 PM | 11 (26.8%) | 10 (31.2%) |
| 4:00 PM to 11:59 PM | 2 (4.9%) | 2 (6.2%) |
| Total | 41 (100.0%) | 32 (100.0%) |
Housing Occupancy in Highland
Occupancy by Ownership in Highland
Of the total 73 dwellings in Highland, owner-occupied units account for 57 (78.1%), while renter-occupied units make up 16 (21.9%).
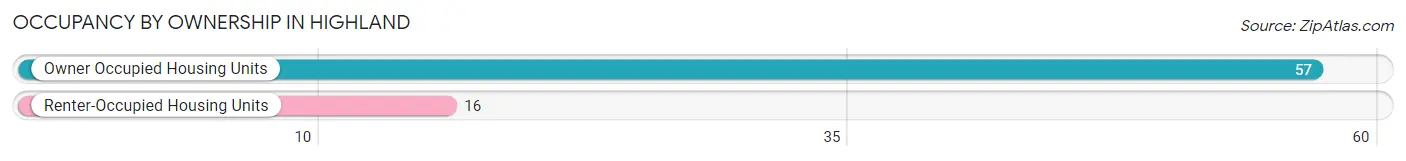
| Occupancy | # Housing Units | % Housing Units |
| Owner Occupied Housing Units | 57 | 78.1% |
| Renter-Occupied Housing Units | 16 | 21.9% |
| Total Occupied Housing Units | 73 | 100.0% |
Occupancy by Household Size in Highland
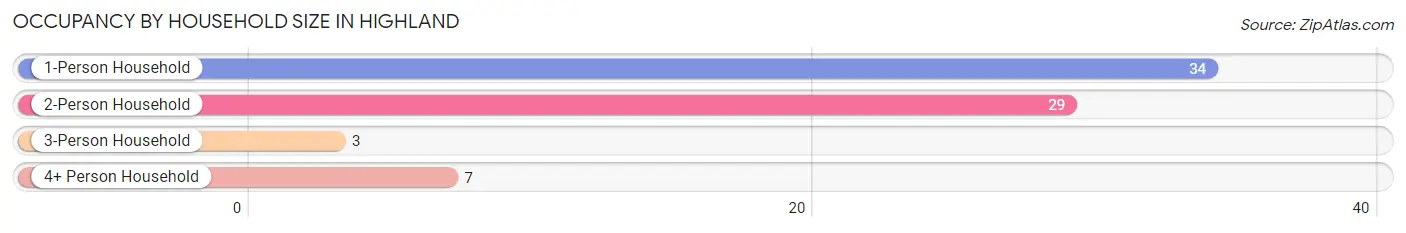
| Household Size | # Housing Units | % Housing Units |
| 1-Person Household | 34 | 46.6% |
| 2-Person Household | 29 | 39.7% |
| 3-Person Household | 3 | 4.1% |
| 4+ Person Household | 7 | 9.6% |
| Total Housing Units | 73 | 100.0% |
Occupancy by Ownership by Household Size in Highland
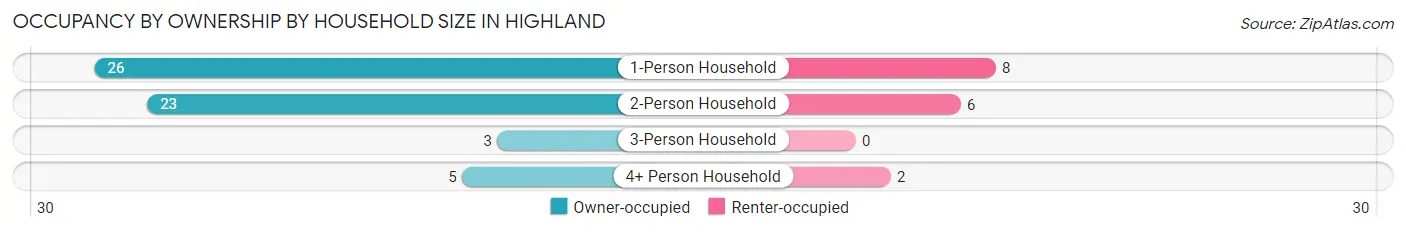
| Household Size | Owner-occupied | Renter-occupied |
| 1-Person Household | 26 (76.5%) | 8 (23.5%) |
| 2-Person Household | 23 (79.3%) | 6 (20.7%) |
| 3-Person Household | 3 (100.0%) | 0 (0.0%) |
| 4+ Person Household | 5 (71.4%) | 2 (28.6%) |
| Total Housing Units | 57 (78.1%) | 16 (21.9%) |
Occupancy by Educational Attainment in Highland
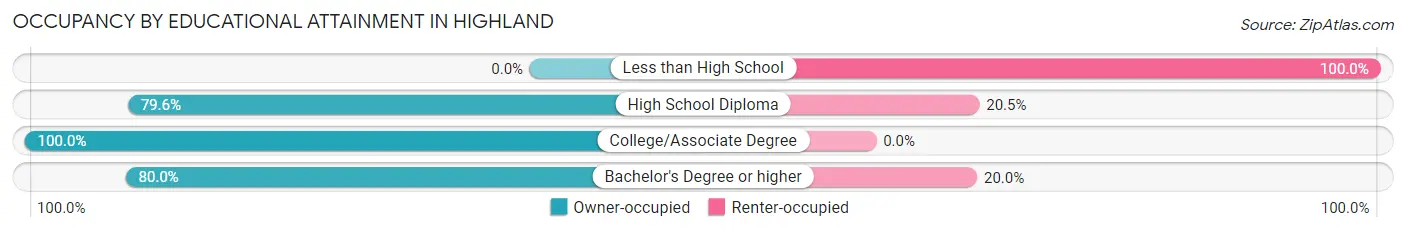
| Household Size | Owner-occupied | Renter-occupied |
| Less than High School | 0 (0.0%) | 6 (100.0%) |
| High School Diploma | 35 (79.5%) | 9 (20.4%) |
| College/Associate Degree | 18 (100.0%) | 0 (0.0%) |
| Bachelor's Degree or higher | 4 (80.0%) | 1 (20.0%) |
Occupancy by Age of Householder in Highland
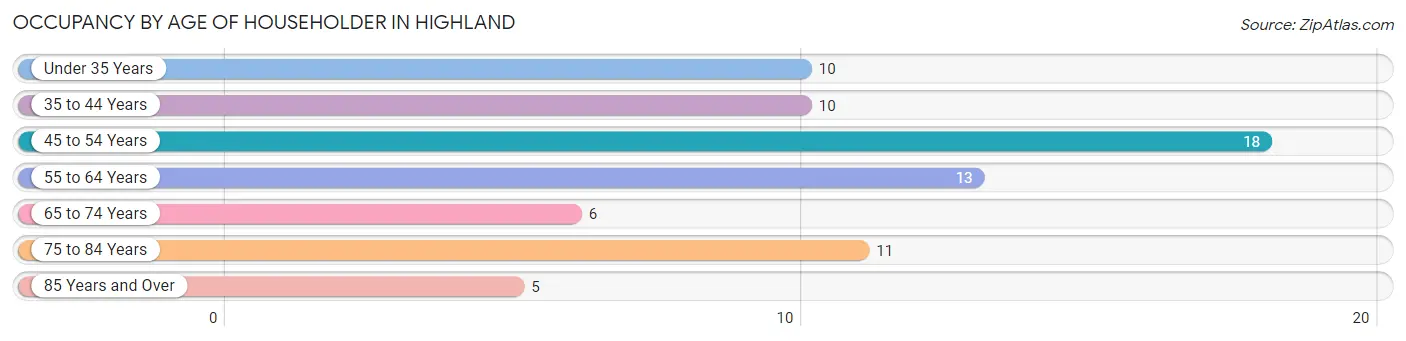
| Age Bracket | # Households | % Households |
| Under 35 Years | 10 | 13.7% |
| 35 to 44 Years | 10 | 13.7% |
| 45 to 54 Years | 18 | 24.7% |
| 55 to 64 Years | 13 | 17.8% |
| 65 to 74 Years | 6 | 8.2% |
| 75 to 84 Years | 11 | 15.1% |
| 85 Years and Over | 5 | 6.9% |
| Total | 73 | 100.0% |
Housing Finances in Highland
Median Income by Occupancy in Highland
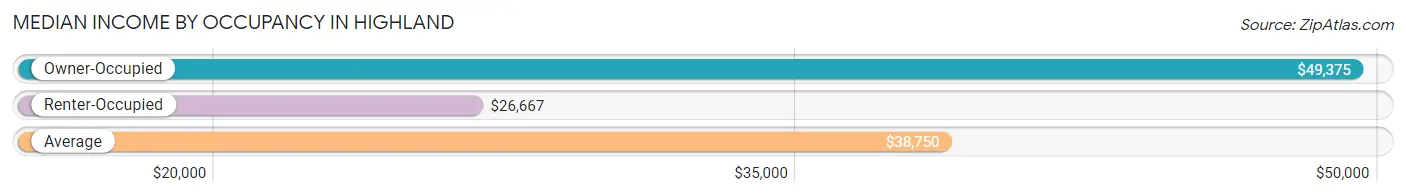
| Occupancy Type | # Households | Median Income |
| Owner-Occupied | 57 (78.1%) | $49,375 |
| Renter-Occupied | 16 (21.9%) | $26,667 |
| Average | 73 (100.0%) | $38,750 |
Occupancy by Householder Income Bracket in Highland
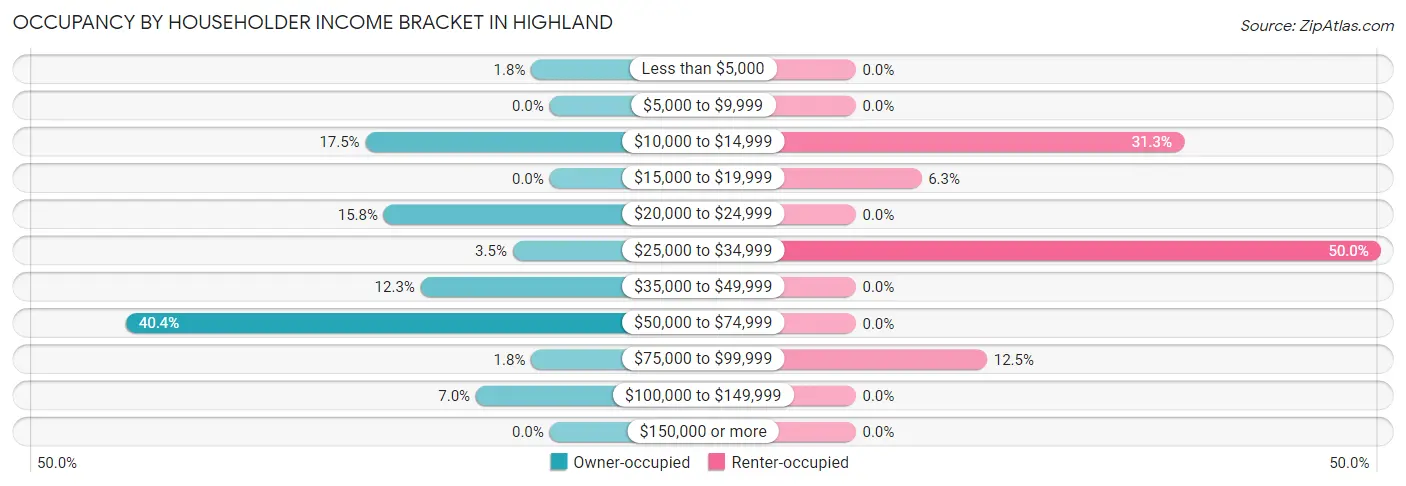
| Income Bracket | Owner-occupied | Renter-occupied |
| Less than $5,000 | 1 (1.8%) | 0 (0.0%) |
| $5,000 to $9,999 | 0 (0.0%) | 0 (0.0%) |
| $10,000 to $14,999 | 10 (17.5%) | 5 (31.2%) |
| $15,000 to $19,999 | 0 (0.0%) | 1 (6.2%) |
| $20,000 to $24,999 | 9 (15.8%) | 0 (0.0%) |
| $25,000 to $34,999 | 2 (3.5%) | 8 (50.0%) |
| $35,000 to $49,999 | 7 (12.3%) | 0 (0.0%) |
| $50,000 to $74,999 | 23 (40.4%) | 0 (0.0%) |
| $75,000 to $99,999 | 1 (1.8%) | 2 (12.5%) |
| $100,000 to $149,999 | 4 (7.0%) | 0 (0.0%) |
| $150,000 or more | 0 (0.0%) | 0 (0.0%) |
| Total | 57 (100.0%) | 16 (100.0%) |
Monthly Housing Cost Tiers in Highland
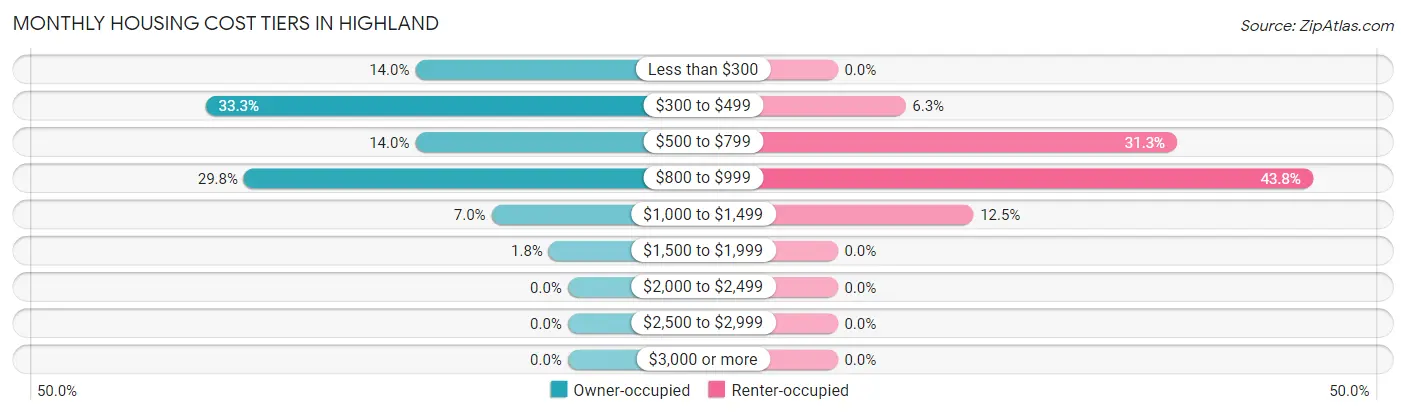
| Monthly Cost | Owner-occupied | Renter-occupied |
| Less than $300 | 8 (14.0%) | 0 (0.0%) |
| $300 to $499 | 19 (33.3%) | 1 (6.2%) |
| $500 to $799 | 8 (14.0%) | 5 (31.2%) |
| $800 to $999 | 17 (29.8%) | 7 (43.8%) |
| $1,000 to $1,499 | 4 (7.0%) | 2 (12.5%) |
| $1,500 to $1,999 | 1 (1.8%) | 0 (0.0%) |
| $2,000 to $2,499 | 0 (0.0%) | 0 (0.0%) |
| $2,500 to $2,999 | 0 (0.0%) | 0 (0.0%) |
| $3,000 or more | 0 (0.0%) | 0 (0.0%) |
| Total | 57 (100.0%) | 16 (100.0%) |
Physical Housing Characteristics in Highland
Housing Structures in Highland
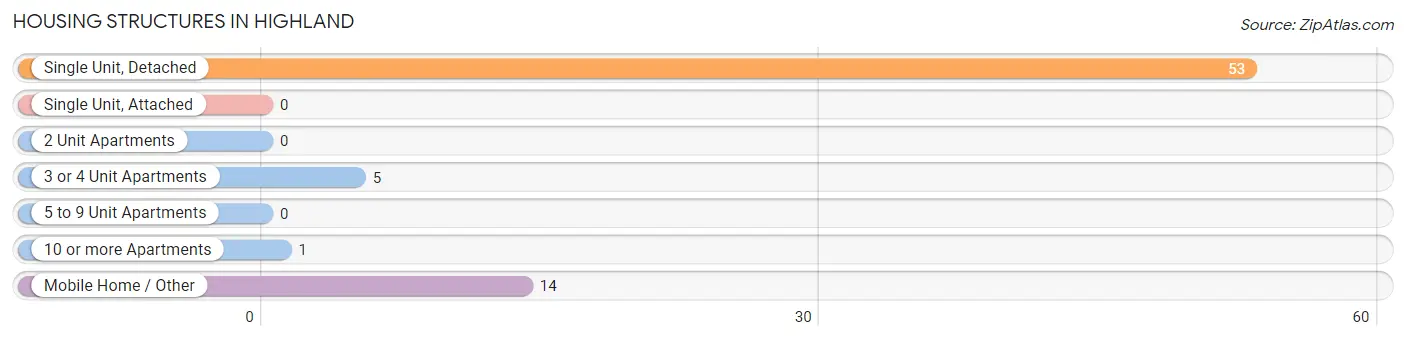
| Structure Type | # Housing Units | % Housing Units |
| Single Unit, Detached | 53 | 72.6% |
| Single Unit, Attached | 0 | 0.0% |
| 2 Unit Apartments | 0 | 0.0% |
| 3 or 4 Unit Apartments | 5 | 6.9% |
| 5 to 9 Unit Apartments | 0 | 0.0% |
| 10 or more Apartments | 1 | 1.4% |
| Mobile Home / Other | 14 | 19.2% |
| Total | 73 | 100.0% |
Housing Structures by Occupancy in Highland
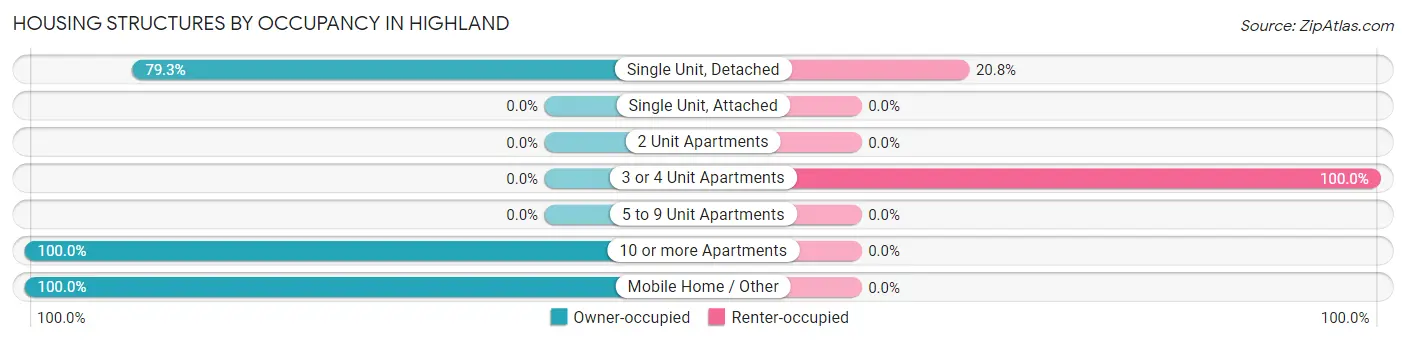
| Structure Type | Owner-occupied | Renter-occupied |
| Single Unit, Detached | 42 (79.2%) | 11 (20.7%) |
| Single Unit, Attached | 0 (0.0%) | 0 (0.0%) |
| 2 Unit Apartments | 0 (0.0%) | 0 (0.0%) |
| 3 or 4 Unit Apartments | 0 (0.0%) | 5 (100.0%) |
| 5 to 9 Unit Apartments | 0 (0.0%) | 0 (0.0%) |
| 10 or more Apartments | 1 (100.0%) | 0 (0.0%) |
| Mobile Home / Other | 14 (100.0%) | 0 (0.0%) |
| Total | 57 (78.1%) | 16 (21.9%) |
Housing Structures by Number of Rooms in Highland
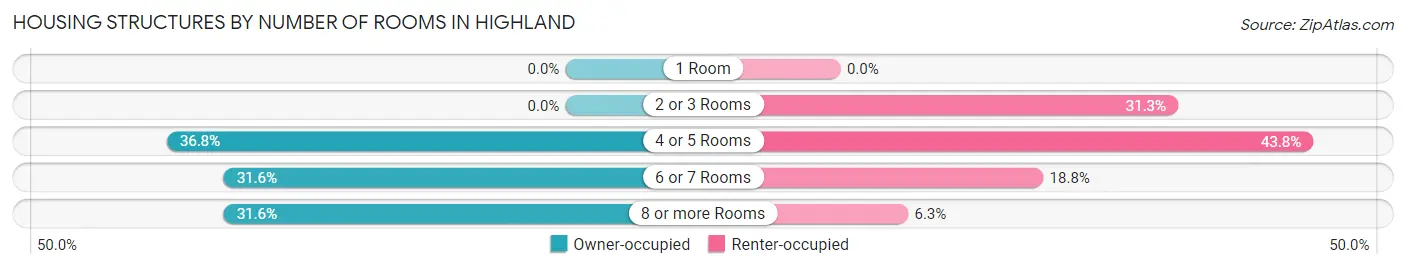
| Number of Rooms | Owner-occupied | Renter-occupied |
| 1 Room | 0 (0.0%) | 0 (0.0%) |
| 2 or 3 Rooms | 0 (0.0%) | 5 (31.2%) |
| 4 or 5 Rooms | 21 (36.8%) | 7 (43.8%) |
| 6 or 7 Rooms | 18 (31.6%) | 3 (18.8%) |
| 8 or more Rooms | 18 (31.6%) | 1 (6.2%) |
| Total | 57 (100.0%) | 16 (100.0%) |
Housing Structure by Heating Type in Highland
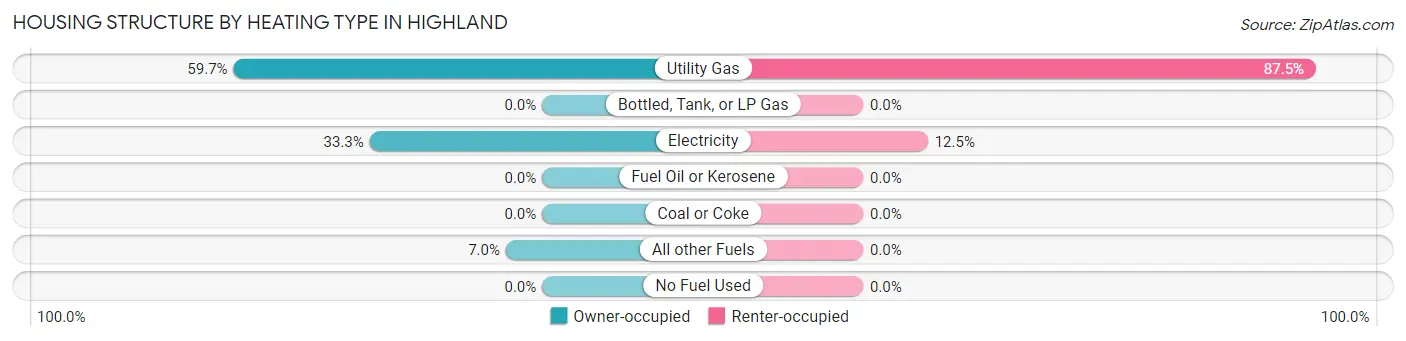
| Heating Type | Owner-occupied | Renter-occupied |
| Utility Gas | 34 (59.7%) | 14 (87.5%) |
| Bottled, Tank, or LP Gas | 0 (0.0%) | 0 (0.0%) |
| Electricity | 19 (33.3%) | 2 (12.5%) |
| Fuel Oil or Kerosene | 0 (0.0%) | 0 (0.0%) |
| Coal or Coke | 0 (0.0%) | 0 (0.0%) |
| All other Fuels | 4 (7.0%) | 0 (0.0%) |
| No Fuel Used | 0 (0.0%) | 0 (0.0%) |
| Total | 57 (100.0%) | 16 (100.0%) |
Household Vehicle Usage in Highland
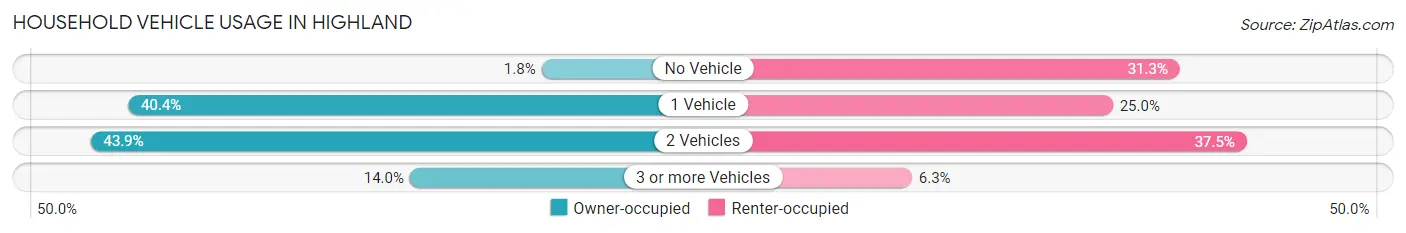
| Vehicles per Household | Owner-occupied | Renter-occupied |
| No Vehicle | 1 (1.8%) | 5 (31.2%) |
| 1 Vehicle | 23 (40.4%) | 4 (25.0%) |
| 2 Vehicles | 25 (43.9%) | 6 (37.5%) |
| 3 or more Vehicles | 8 (14.0%) | 1 (6.2%) |
| Total | 57 (100.0%) | 16 (100.0%) |
Real Estate & Mortgages in Highland
Real Estate and Mortgage Overview in Highland
| Characteristic | Without Mortgage | With Mortgage |
| Housing Units | 26 | 31 |
| Median Property Value | $49,100 | $95,800 |
| Median Household Income | - | - |
| Monthly Housing Costs | $356 | $0 |
| Real Estate Taxes | $1,000 | $0 |
Property Value by Mortgage Status in Highland
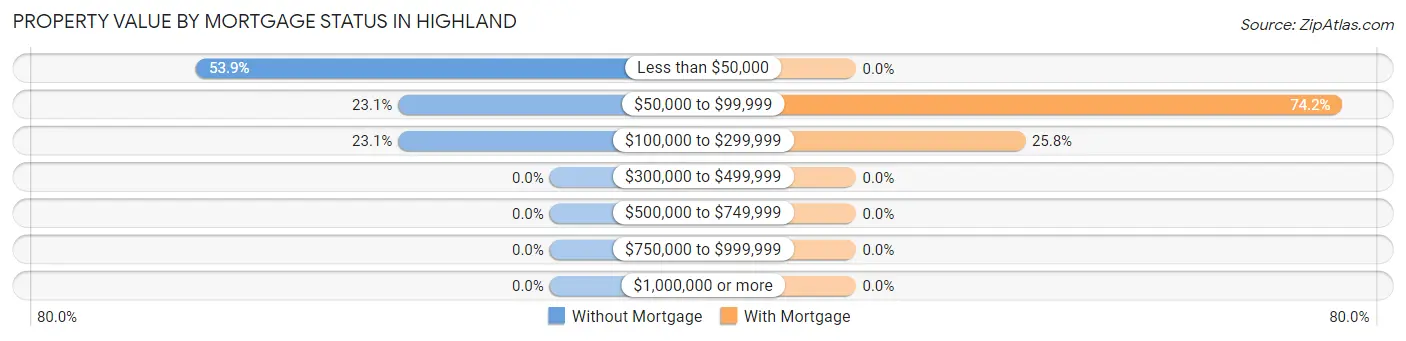
| Property Value | Without Mortgage | With Mortgage |
| Less than $50,000 | 14 (53.8%) | 0 (0.0%) |
| $50,000 to $99,999 | 6 (23.1%) | 23 (74.2%) |
| $100,000 to $299,999 | 6 (23.1%) | 8 (25.8%) |
| $300,000 to $499,999 | 0 (0.0%) | 0 (0.0%) |
| $500,000 to $749,999 | 0 (0.0%) | 0 (0.0%) |
| $750,000 to $999,999 | 0 (0.0%) | 0 (0.0%) |
| $1,000,000 or more | 0 (0.0%) | 0 (0.0%) |
| Total | 26 (100.0%) | 31 (100.0%) |
Household Income by Mortgage Status in Highland
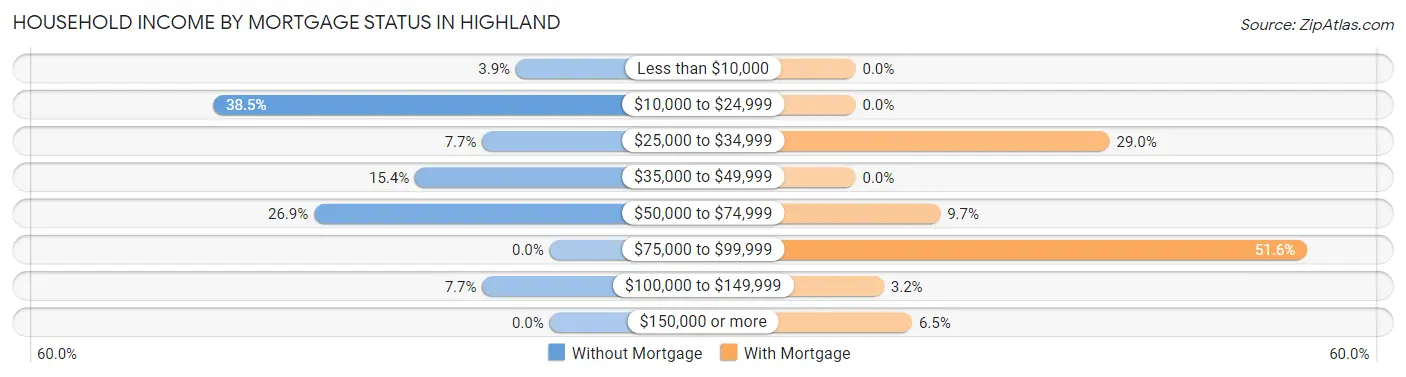
| Household Income | Without Mortgage | With Mortgage |
| Less than $10,000 | 1 (3.8%) | 0 (0.0%) |
| $10,000 to $24,999 | 10 (38.5%) | 0 (0.0%) |
| $25,000 to $34,999 | 2 (7.7%) | 9 (29.0%) |
| $35,000 to $49,999 | 4 (15.4%) | 0 (0.0%) |
| $50,000 to $74,999 | 7 (26.9%) | 3 (9.7%) |
| $75,000 to $99,999 | 0 (0.0%) | 16 (51.6%) |
| $100,000 to $149,999 | 2 (7.7%) | 1 (3.2%) |
| $150,000 or more | 0 (0.0%) | 2 (6.5%) |
| Total | 26 (100.0%) | 31 (100.0%) |
Property Value to Household Income Ratio in Highland
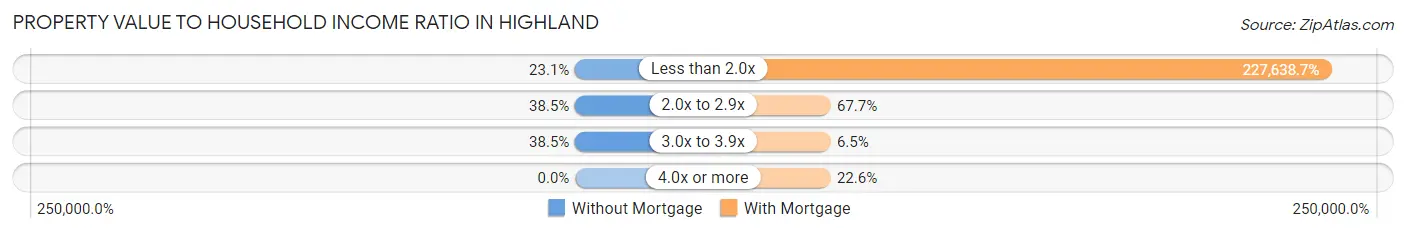
| Value-to-Income Ratio | Without Mortgage | With Mortgage |
| Less than 2.0x | 6 (23.1%) | 70,568 (227,638.7%) |
| 2.0x to 2.9x | 10 (38.5%) | 21 (67.7%) |
| 3.0x to 3.9x | 10 (38.5%) | 2 (6.5%) |
| 4.0x or more | 0 (0.0%) | 7 (22.6%) |
| Total | 26 (100.0%) | 31 (100.0%) |
Real Estate Taxes by Mortgage Status in Highland
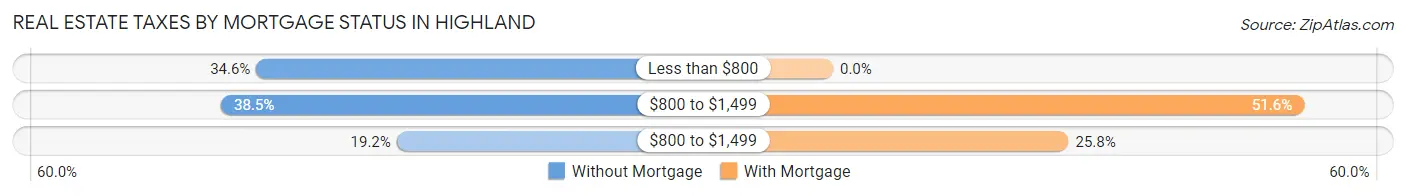
| Property Taxes | Without Mortgage | With Mortgage |
| Less than $800 | 9 (34.6%) | 0 (0.0%) |
| $800 to $1,499 | 10 (38.5%) | 16 (51.6%) |
| $800 to $1,499 | 5 (19.2%) | 8 (25.8%) |
| Total | 26 (100.0%) | 31 (100.0%) |
Health & Disability in Highland
Health Insurance Coverage by Age in Highland
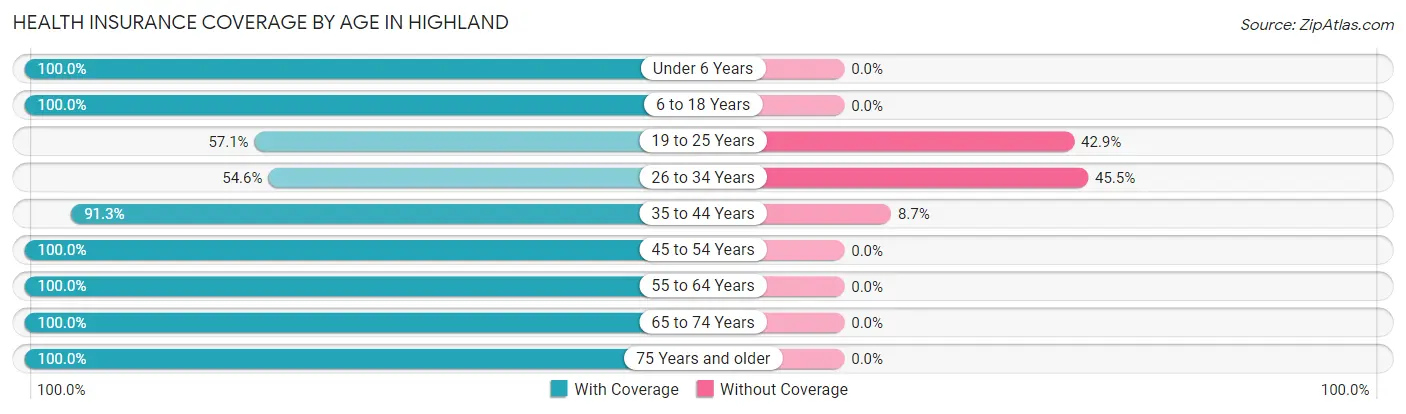
| Age Bracket | With Coverage | Without Coverage |
| Under 6 Years | 4 (100.0%) | 0 (0.0%) |
| 6 to 18 Years | 17 (100.0%) | 0 (0.0%) |
| 19 to 25 Years | 4 (57.1%) | 3 (42.9%) |
| 26 to 34 Years | 6 (54.5%) | 5 (45.5%) |
| 35 to 44 Years | 21 (91.3%) | 2 (8.7%) |
| 45 to 54 Years | 23 (100.0%) | 0 (0.0%) |
| 55 to 64 Years | 21 (100.0%) | 0 (0.0%) |
| 65 to 74 Years | 8 (100.0%) | 0 (0.0%) |
| 75 Years and older | 17 (100.0%) | 0 (0.0%) |
| Total | 121 (92.4%) | 10 (7.6%) |
Health Insurance Coverage by Citizenship Status in Highland
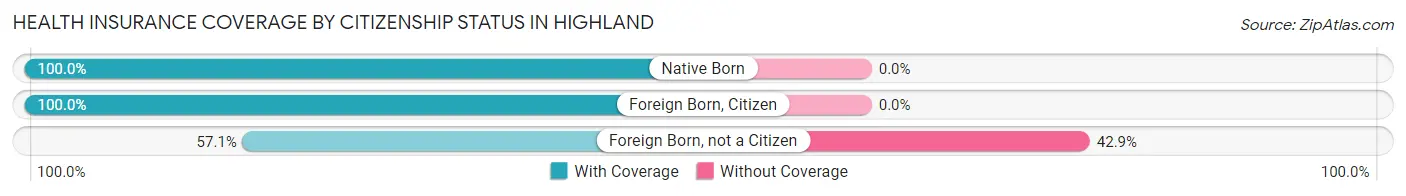
| Citizenship Status | With Coverage | Without Coverage |
| Native Born | 4 (100.0%) | 0 (0.0%) |
| Foreign Born, Citizen | 17 (100.0%) | 0 (0.0%) |
| Foreign Born, not a Citizen | 4 (57.1%) | 3 (42.9%) |
Health Insurance Coverage by Household Income in Highland
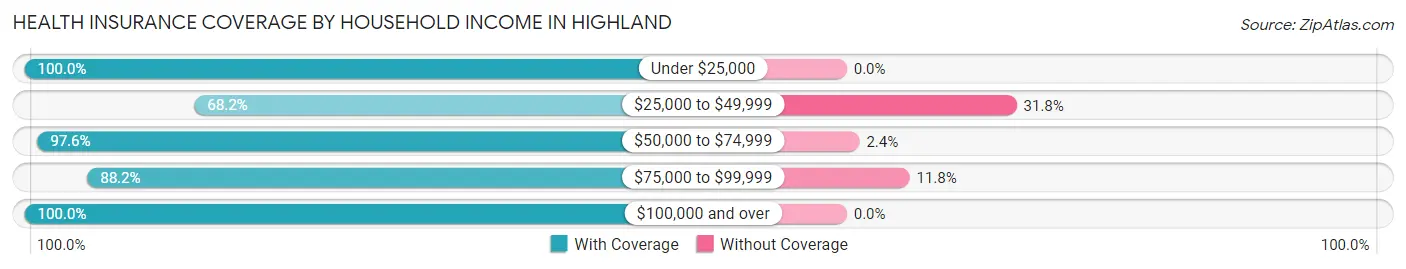
| Household Income | With Coverage | Without Coverage |
| Under $25,000 | 33 (100.0%) | 0 (0.0%) |
| $25,000 to $49,999 | 15 (68.2%) | 7 (31.8%) |
| $50,000 to $74,999 | 41 (97.6%) | 1 (2.4%) |
| $75,000 to $99,999 | 15 (88.2%) | 2 (11.8%) |
| $100,000 and over | 17 (100.0%) | 0 (0.0%) |
Public vs Private Health Insurance Coverage by Age in Highland
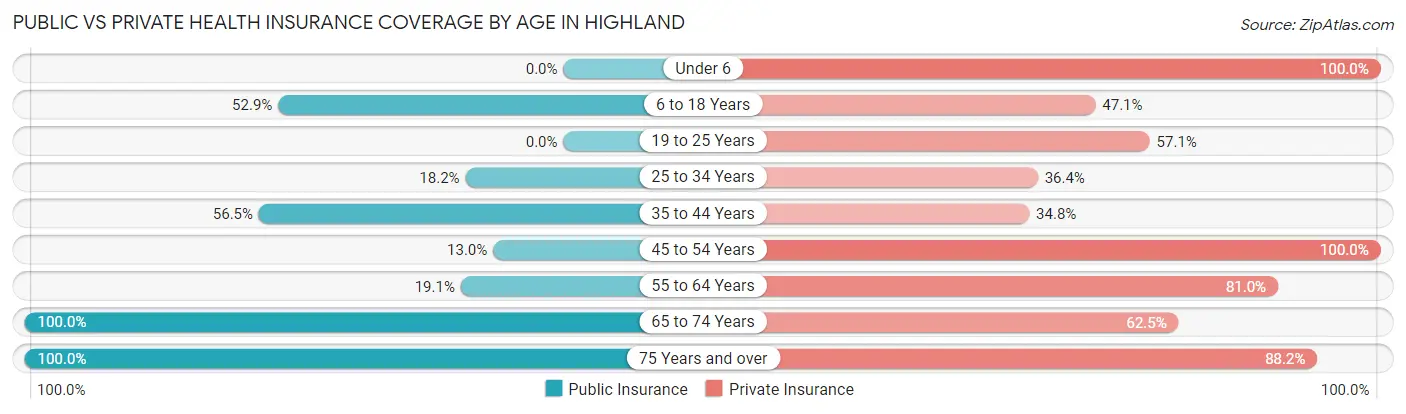
| Age Bracket | Public Insurance | Private Insurance |
| Under 6 | 0 (0.0%) | 4 (100.0%) |
| 6 to 18 Years | 9 (52.9%) | 8 (47.1%) |
| 19 to 25 Years | 0 (0.0%) | 4 (57.1%) |
| 25 to 34 Years | 2 (18.2%) | 4 (36.4%) |
| 35 to 44 Years | 13 (56.5%) | 8 (34.8%) |
| 45 to 54 Years | 3 (13.0%) | 23 (100.0%) |
| 55 to 64 Years | 4 (19.1%) | 17 (80.9%) |
| 65 to 74 Years | 8 (100.0%) | 5 (62.5%) |
| 75 Years and over | 17 (100.0%) | 15 (88.2%) |
| Total | 56 (42.7%) | 88 (67.2%) |
Disability Status by Sex by Age in Highland
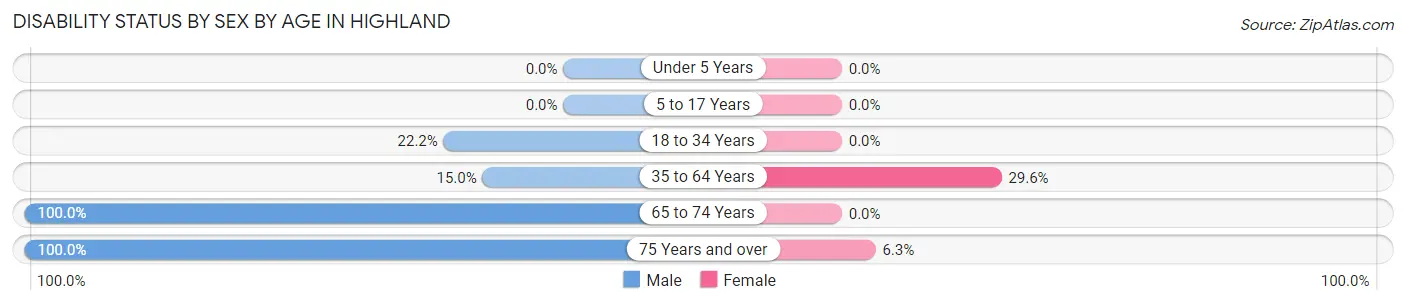
| Age Bracket | Male | Female |
| Under 5 Years | 0 (0.0%) | 0 (0.0%) |
| 5 to 17 Years | 0 (0.0%) | 0 (0.0%) |
| 18 to 34 Years | 2 (22.2%) | 0 (0.0%) |
| 35 to 64 Years | 6 (15.0%) | 8 (29.6%) |
| 65 to 74 Years | 1 (100.0%) | 0 (0.0%) |
| 75 Years and over | 1 (100.0%) | 1 (6.2%) |
Disability Class by Sex by Age in Highland
Disability Class: Hearing Difficulty
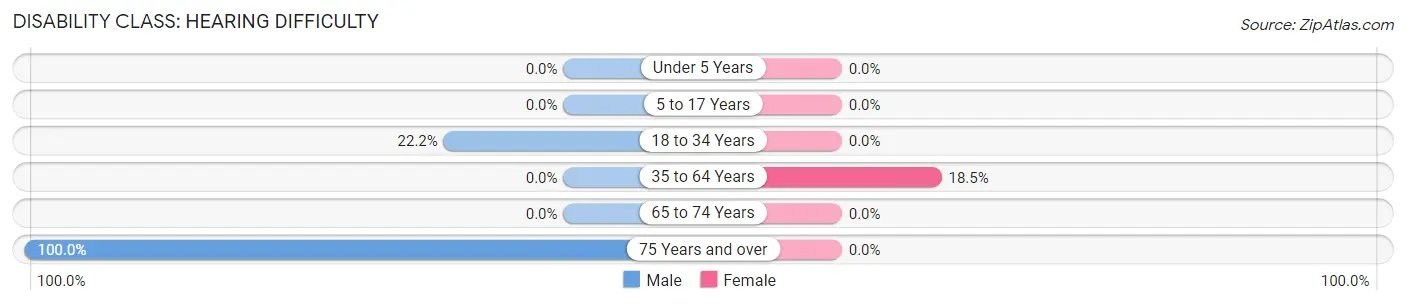
| Age Bracket | Male | Female |
| Under 5 Years | 0 (0.0%) | 0 (0.0%) |
| 5 to 17 Years | 0 (0.0%) | 0 (0.0%) |
| 18 to 34 Years | 2 (22.2%) | 0 (0.0%) |
| 35 to 64 Years | 0 (0.0%) | 5 (18.5%) |
| 65 to 74 Years | 0 (0.0%) | 0 (0.0%) |
| 75 Years and over | 1 (100.0%) | 0 (0.0%) |
Disability Class: Vision Difficulty
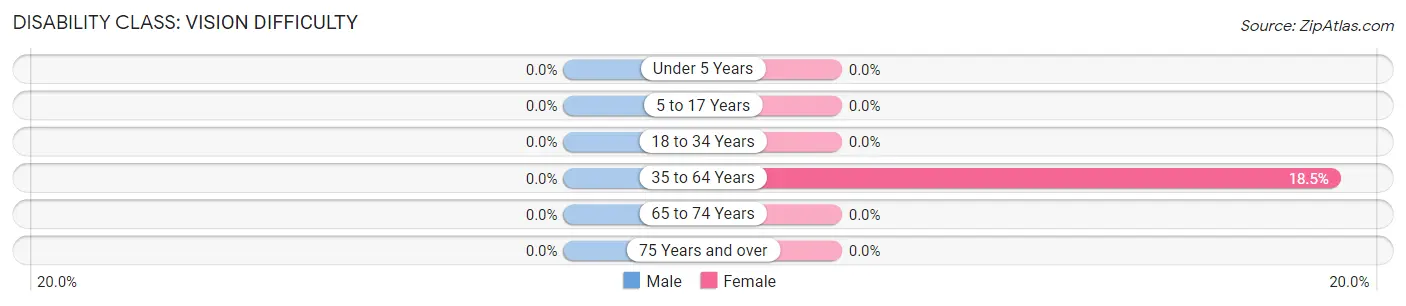
| Age Bracket | Male | Female |
| Under 5 Years | 0 (0.0%) | 0 (0.0%) |
| 5 to 17 Years | 0 (0.0%) | 0 (0.0%) |
| 18 to 34 Years | 0 (0.0%) | 0 (0.0%) |
| 35 to 64 Years | 0 (0.0%) | 5 (18.5%) |
| 65 to 74 Years | 0 (0.0%) | 0 (0.0%) |
| 75 Years and over | 0 (0.0%) | 0 (0.0%) |
Disability Class: Cognitive Difficulty
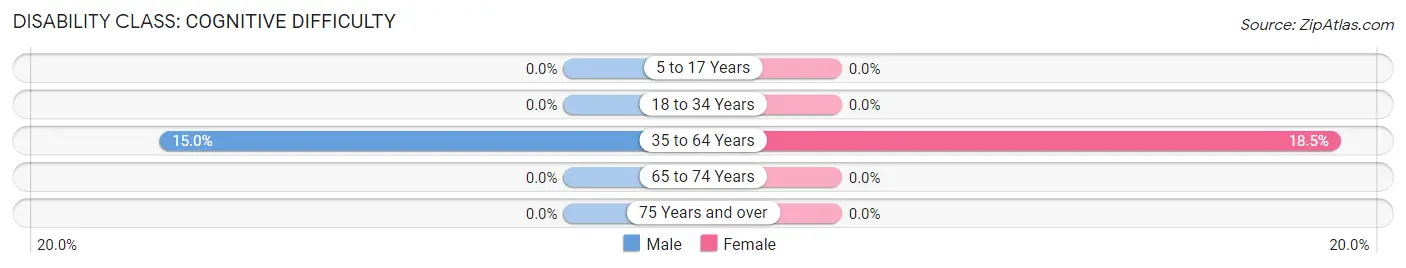
| Age Bracket | Male | Female |
| 5 to 17 Years | 0 (0.0%) | 0 (0.0%) |
| 18 to 34 Years | 0 (0.0%) | 0 (0.0%) |
| 35 to 64 Years | 6 (15.0%) | 5 (18.5%) |
| 65 to 74 Years | 0 (0.0%) | 0 (0.0%) |
| 75 Years and over | 0 (0.0%) | 0 (0.0%) |
Disability Class: Ambulatory Difficulty
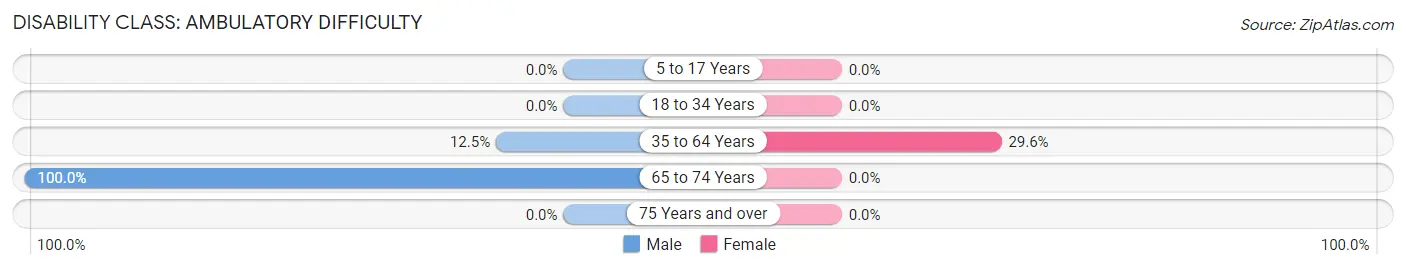
| Age Bracket | Male | Female |
| 5 to 17 Years | 0 (0.0%) | 0 (0.0%) |
| 18 to 34 Years | 0 (0.0%) | 0 (0.0%) |
| 35 to 64 Years | 5 (12.5%) | 8 (29.6%) |
| 65 to 74 Years | 1 (100.0%) | 0 (0.0%) |
| 75 Years and over | 0 (0.0%) | 0 (0.0%) |
Disability Class: Self-Care Difficulty
| Age Bracket | Male | Female |
| 5 to 17 Years | 0 (0.0%) | 0 (0.0%) |
| 18 to 34 Years | 0 (0.0%) | 0 (0.0%) |
| 35 to 64 Years | 0 (0.0%) | 0 (0.0%) |
| 65 to 74 Years | 0 (0.0%) | 0 (0.0%) |
| 75 Years and over | 0 (0.0%) | 0 (0.0%) |
Technology Access in Highland
Computing Device Access in Highland
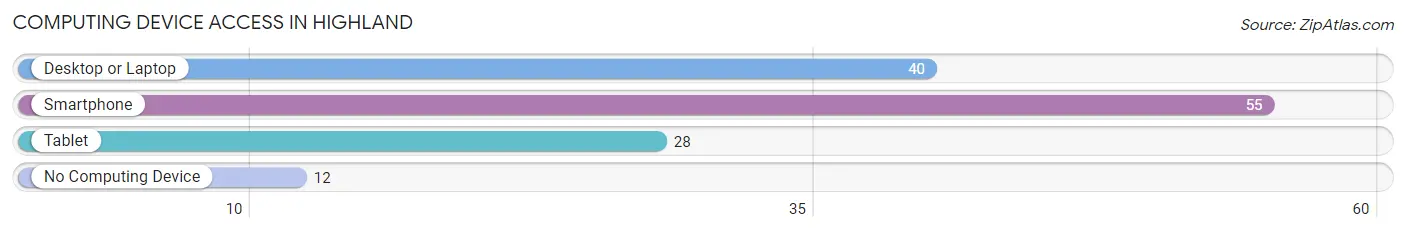
| Device Type | # Households | % Households |
| Desktop or Laptop | 40 | 54.8% |
| Smartphone | 55 | 75.3% |
| Tablet | 28 | 38.4% |
| No Computing Device | 12 | 16.4% |
| Total | 73 | 100.0% |
Internet Access in Highland
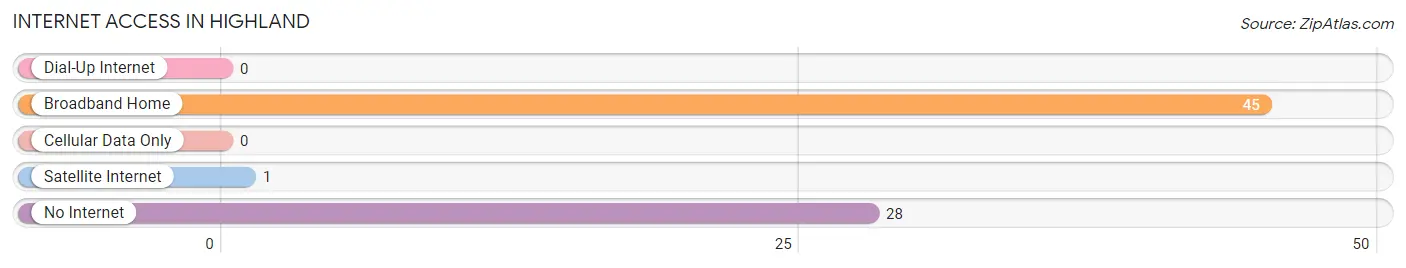
| Internet Type | # Households | % Households |
| Dial-Up Internet | 0 | 0.0% |
| Broadband Home | 45 | 61.6% |
| Cellular Data Only | 0 | 0.0% |
| Satellite Internet | 1 | 1.4% |
| No Internet | 28 | 38.4% |
| Total | 73 | 100.0% |
Highland Summary
Highland, Ohio is a small village located in Medina County, Ohio. It is situated in the northeast corner of the county, just south of the city of Medina. The village has a population of approximately 1,400 people, and is part of the Cleveland-Akron-Canton metropolitan area.
History
Highland was founded in 1818 by a group of settlers from Connecticut. The village was originally known as “Highland Station”, and was named after the high elevation of the area. The village was incorporated in 1837, and the first post office was established in 1845.
In the late 19th century, Highland was a thriving agricultural community. The village was home to several mills, including a grist mill, a saw mill, and a woolen mill. The village also had a blacksmith shop, a general store, and a hotel.
Geography
Highland is located in the northeast corner of Medina County, Ohio. It is situated on the banks of the Chippewa Creek, which flows through the village. The village is surrounded by rolling hills and farmland. The nearest major city is Cleveland, which is located approximately 30 miles to the northeast.
Economy
Highland’s economy is largely based on agriculture. The village is home to several farms, which produce a variety of crops, including corn, soybeans, and wheat. The village also has several small businesses, including a grocery store, a hardware store, and a restaurant.
Demographics
As of the 2010 census, the population of Highland was 1,400. The racial makeup of the village was 97.3% White, 0.7% African American, 0.3% Native American, 0.3% Asian, and 1.3% from other races. The median household income was $50,000, and the median home value was $150,000.
Highland is a small, rural village with a rich history and a strong sense of community. The village is home to a variety of businesses and farms, and is a great place to live and work.
Common Questions
What is Per Capita Income in Highland?
Per Capita income in Highland is $26,898.
What is the Median Family Income in Highland?
Median Family Income in Highland is $70,625.
What is the Median Household income in Highland?
Median Household Income in Highland is $38,750.
What is Income or Wage Gap in Highland?
Income or Wage Gap in Highland is 52.8%.
Women in Highland earn 47.2 cents for every dollar earned by a man.
What is Inequality or Gini Index in Highland?
Inequality or Gini Index in Highland is 0.36.
What is the Total Population of Highland?
Total Population of Highland is 131.
What is the Total Male Population of Highland?
Total Male Population of Highland is 62.
What is the Total Female Population of Highland?
Total Female Population of Highland is 69.
What is the Ratio of Males per 100 Females in Highland?
There are 89.86 Males per 100 Females in Highland.
What is the Ratio of Females per 100 Males in Highland?
There are 111.29 Females per 100 Males in Highland.
What is the Median Population Age in Highland?
Median Population Age in Highland is 48.4 Years.
What is the Average Family Size in Highland
Average Family Size in Highland is 2.4 People.
What is the Average Household Size in Highland
Average Household Size in Highland is 1.8 People.
How Large is the Labor Force in Highland?
There are 73 People in the Labor Forcein in Highland.
What is the Percentage of People in the Labor Force in Highland?
65.8% of People are in the Labor Force in Highland.