Hebron, OH Map & Demographics
Hebron Map
Hebron Overview
$32,241
PER CAPITA INCOME
$69,500
AVG FAMILY INCOME
$60,706
AVG HOUSEHOLD INCOME
26.8%
WAGE / INCOME GAP [ % ]
73.2¢/ $1
WAGE / INCOME GAP [ $ ]
0.43
INEQUALITY / GINI INDEX
2,485
TOTAL POPULATION
1,281
MALE POPULATION
1,204
FEMALE POPULATION
106.40
MALES / 100 FEMALES
93.99
FEMALES / 100 MALES
34.7
MEDIAN AGE
3.1
AVG FAMILY SIZE
2.5
AVG HOUSEHOLD SIZE
1,340
LABOR FORCE [ PEOPLE ]
70.2%
PERCENT IN LABOR FORCE
5.4%
UNEMPLOYMENT RATE
Hebron Zip Codes
Hebron Area Codes
Income in Hebron
Income Overview in Hebron
Per Capita Income in Hebron is $32,241, while median incomes of families and households are $69,500 and $60,706 respectively.
| Characteristic | Number | Measure |
| Per Capita Income | 2,485 | $32,241 |
| Median Family Income | 616 | $69,500 |
| Mean Family Income | 616 | $90,132 |
| Median Household Income | 991 | $60,706 |
| Mean Household Income | 991 | $77,255 |
| Income Deficit | 616 | $0 |
| Wage / Income Gap (%) | 2,485 | 26.84% |
| Wage / Income Gap ($) | 2,485 | 73.16¢ per $1 |
| Gini / Inequality Index | 2,485 | 0.43 |
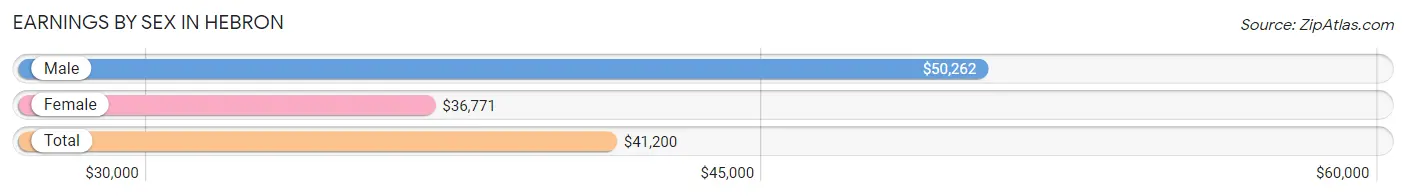
Earnings by Sex in Hebron
Average Earnings in Hebron are $41,200, $50,262 for men and $36,771 for women, a difference of 26.8%.
| Sex | Number | Average Earnings |
| Male | 645 (48.9%) | $50,262 |
| Female | 674 (51.1%) | $36,771 |
| Total | 1,319 (100.0%) | $41,200 |
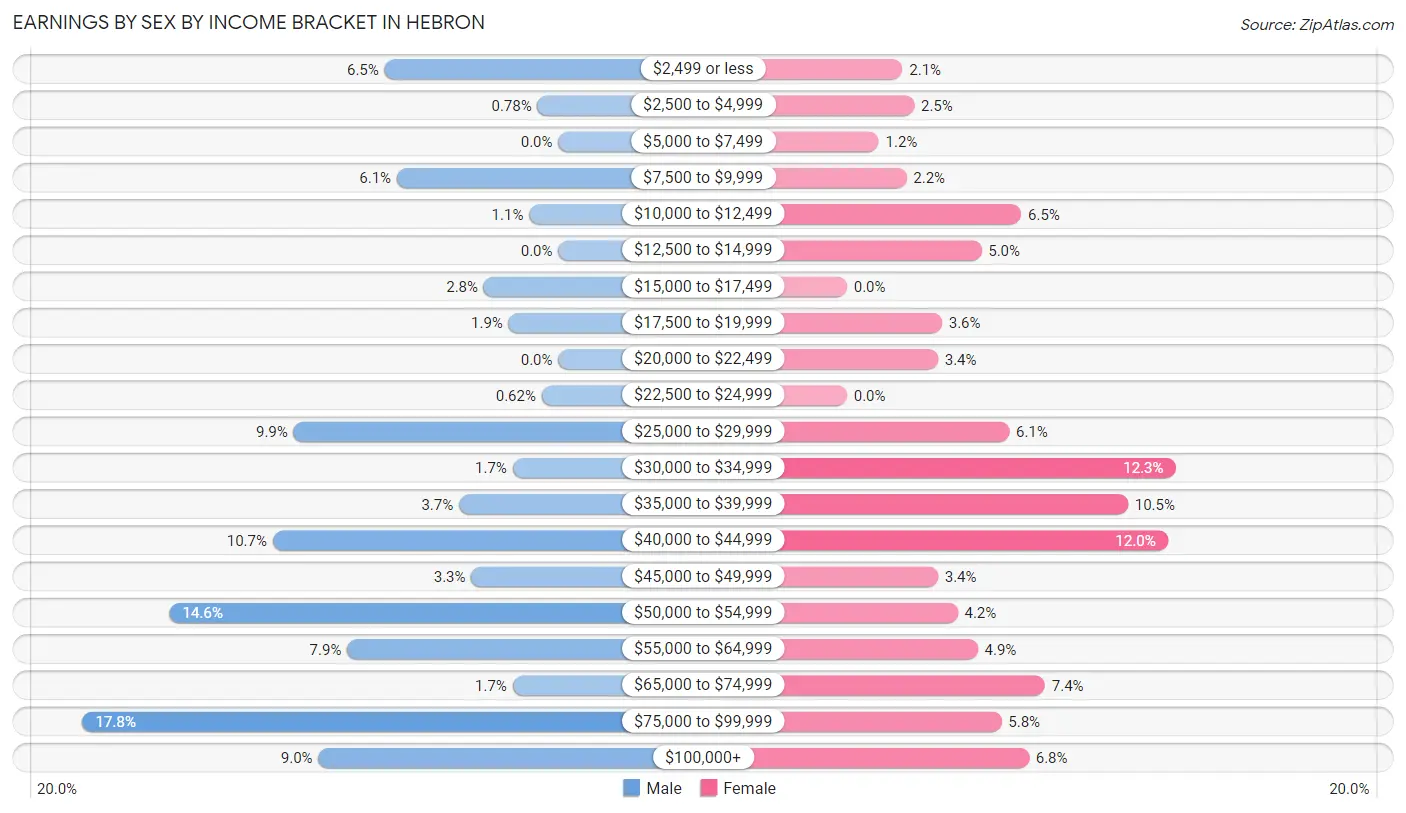
Earnings by Sex by Income Bracket in Hebron
The most common earnings brackets in Hebron are $75,000 to $99,999 for men (115 | 17.8%) and $30,000 to $34,999 for women (83 | 12.3%).
| Income | Male | Female |
| $2,499 or less | 42 (6.5%) | 14 (2.1%) |
| $2,500 to $4,999 | 5 (0.8%) | 17 (2.5%) |
| $5,000 to $7,499 | 0 (0.0%) | 8 (1.2%) |
| $7,500 to $9,999 | 39 (6.0%) | 15 (2.2%) |
| $10,000 to $12,499 | 7 (1.1%) | 44 (6.5%) |
| $12,500 to $14,999 | 0 (0.0%) | 34 (5.0%) |
| $15,000 to $17,499 | 18 (2.8%) | 0 (0.0%) |
| $17,500 to $19,999 | 12 (1.9%) | 24 (3.6%) |
| $20,000 to $22,499 | 0 (0.0%) | 23 (3.4%) |
| $22,500 to $24,999 | 4 (0.6%) | 0 (0.0%) |
| $25,000 to $29,999 | 64 (9.9%) | 41 (6.1%) |
| $30,000 to $34,999 | 11 (1.7%) | 83 (12.3%) |
| $35,000 to $39,999 | 24 (3.7%) | 71 (10.5%) |
| $40,000 to $44,999 | 69 (10.7%) | 81 (12.0%) |
| $45,000 to $49,999 | 21 (3.3%) | 23 (3.4%) |
| $50,000 to $54,999 | 94 (14.6%) | 28 (4.2%) |
| $55,000 to $64,999 | 51 (7.9%) | 33 (4.9%) |
| $65,000 to $74,999 | 11 (1.7%) | 50 (7.4%) |
| $75,000 to $99,999 | 115 (17.8%) | 39 (5.8%) |
| $100,000+ | 58 (9.0%) | 46 (6.8%) |
| Total | 645 (100.0%) | 674 (100.0%) |
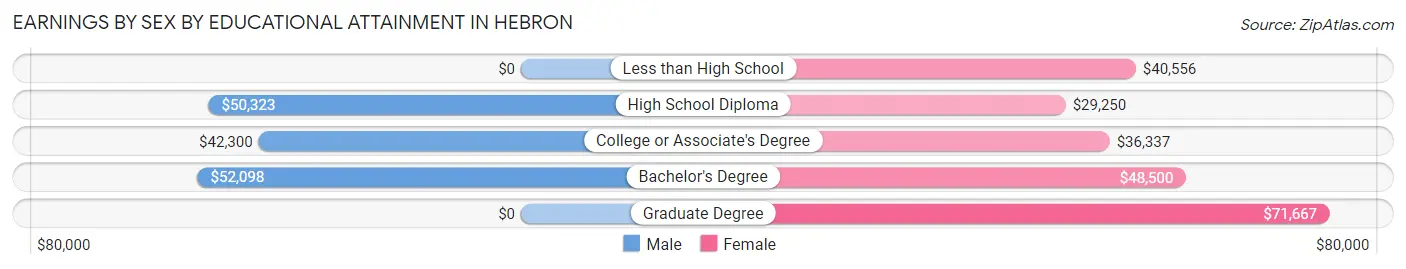
Earnings by Sex by Educational Attainment in Hebron
Average earnings in Hebron are $51,109 for men and $39,130 for women, a difference of 23.4%. Men with an educational attainment of bachelor's degree enjoy the highest average annual earnings of $52,098, while those with college or associate's degree education earn the least with $42,300. Women with an educational attainment of graduate degree earn the most with the average annual earnings of $71,667, while those with high school diploma education have the smallest earnings of $29,250.
| Educational Attainment | Male Income | Female Income |
| Less than High School | - | - |
| High School Diploma | $50,323 | $29,250 |
| College or Associate's Degree | $42,300 | $36,337 |
| Bachelor's Degree | $52,098 | $48,500 |
| Graduate Degree | - | - |
| Total | $51,109 | $39,130 |
Family Income in Hebron
Family Income Brackets in Hebron
According to the Hebron family income data, there are 151 families falling into the $100,000 to $149,999 income range, which is the most common income bracket and makes up 24.5% of all families. Conversely, the $15,000 to $24,999 income bracket is the least frequent group with only 9 families (1.5%) belonging to this category.
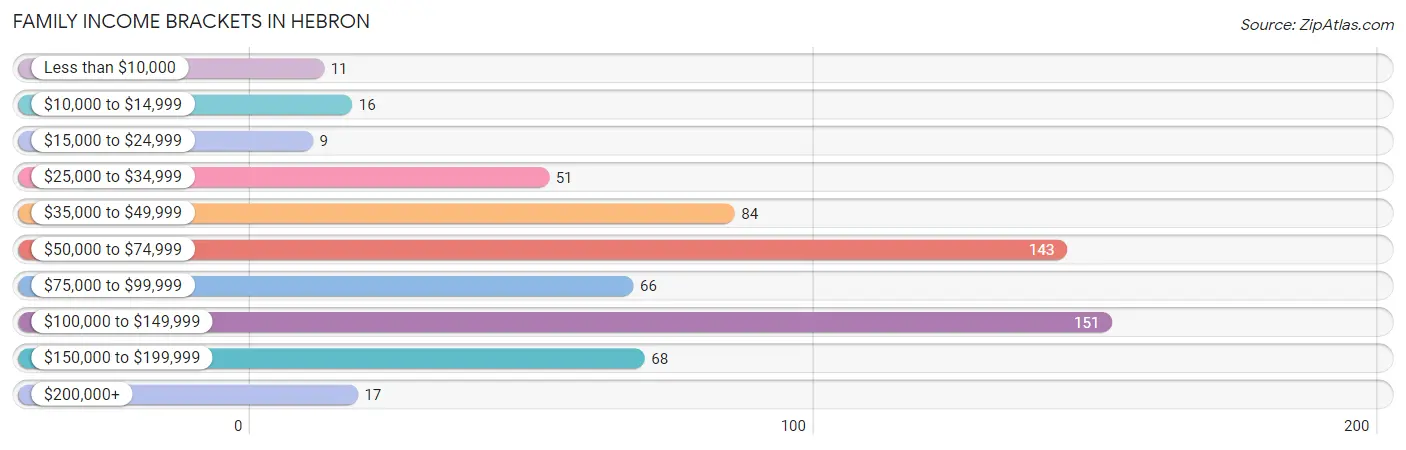
| Income Bracket | # Families | % Families |
| Less than $10,000 | 11 | 1.8% |
| $10,000 to $14,999 | 16 | 2.6% |
| $15,000 to $24,999 | 9 | 1.5% |
| $25,000 to $34,999 | 51 | 8.3% |
| $35,000 to $49,999 | 84 | 13.6% |
| $50,000 to $74,999 | 143 | 23.2% |
| $75,000 to $99,999 | 66 | 10.7% |
| $100,000 to $149,999 | 151 | 24.5% |
| $150,000 to $199,999 | 68 | 11.0% |
| $200,000+ | 17 | 2.8% |
Family Income by Famaliy Size in Hebron
5-person families (52 | 8.4%) account for the highest median family income in Hebron with $133,333 per family, while 3-person families (143 | 23.2%) have the highest median income of $33,411 per family member.
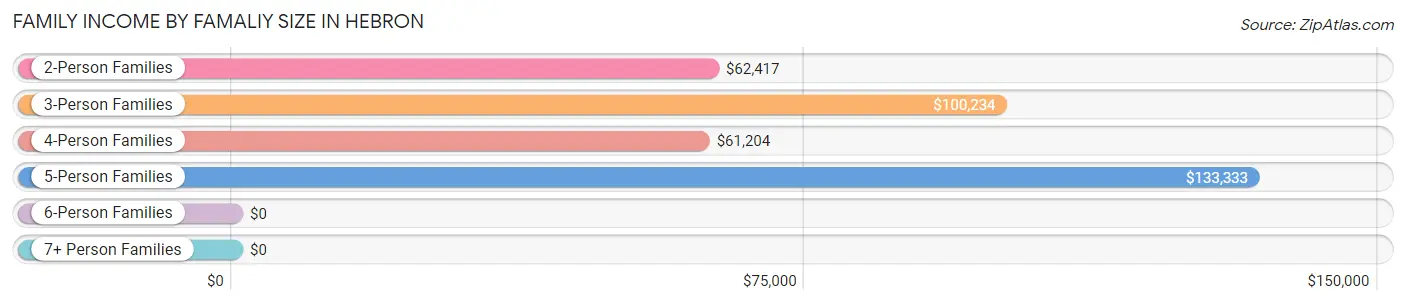
| Income Bracket | # Families | Median Income |
| 2-Person Families | 287 (46.6%) | $62,417 |
| 3-Person Families | 143 (23.2%) | $100,234 |
| 4-Person Families | 116 (18.8%) | $61,204 |
| 5-Person Families | 52 (8.4%) | $133,333 |
| 6-Person Families | 18 (2.9%) | $0 |
| 7+ Person Families | 0 (0.0%) | $0 |
| Total | 616 (100.0%) | $69,500 |
Family Income by Number of Earners in Hebron
The median family income in Hebron is $69,500, with families comprising 3+ earners (67) having the highest median family income of $138,750, while families with no earners (57) have the lowest median family income of $47,961, accounting for 10.9% and 9.2% of families, respectively.
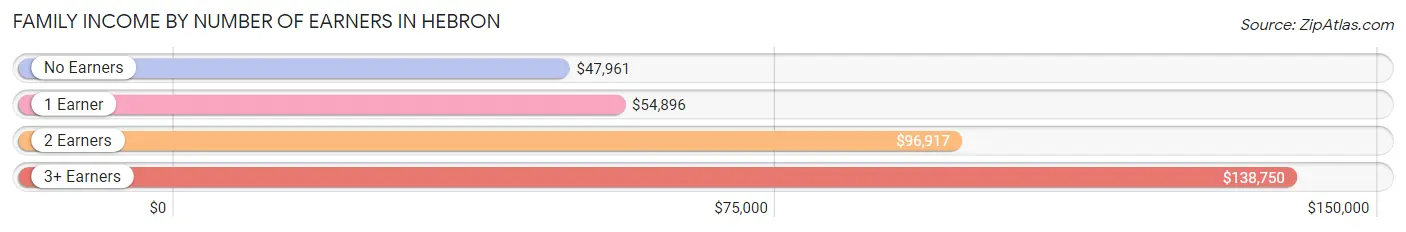
| Number of Earners | # Families | Median Income |
| No Earners | 57 (9.2%) | $47,961 |
| 1 Earner | 245 (39.8%) | $54,896 |
| 2 Earners | 247 (40.1%) | $96,917 |
| 3+ Earners | 67 (10.9%) | $138,750 |
| Total | 616 (100.0%) | $69,500 |
Household Income in Hebron
Household Income Brackets in Hebron
With 179 households falling in the category, the $50,000 to $74,999 income range is the most frequent in Hebron, accounting for 18.1% of all households. In contrast, only 31 households (3.1%) fall into the $200,000+ income bracket, making it the least populous group.
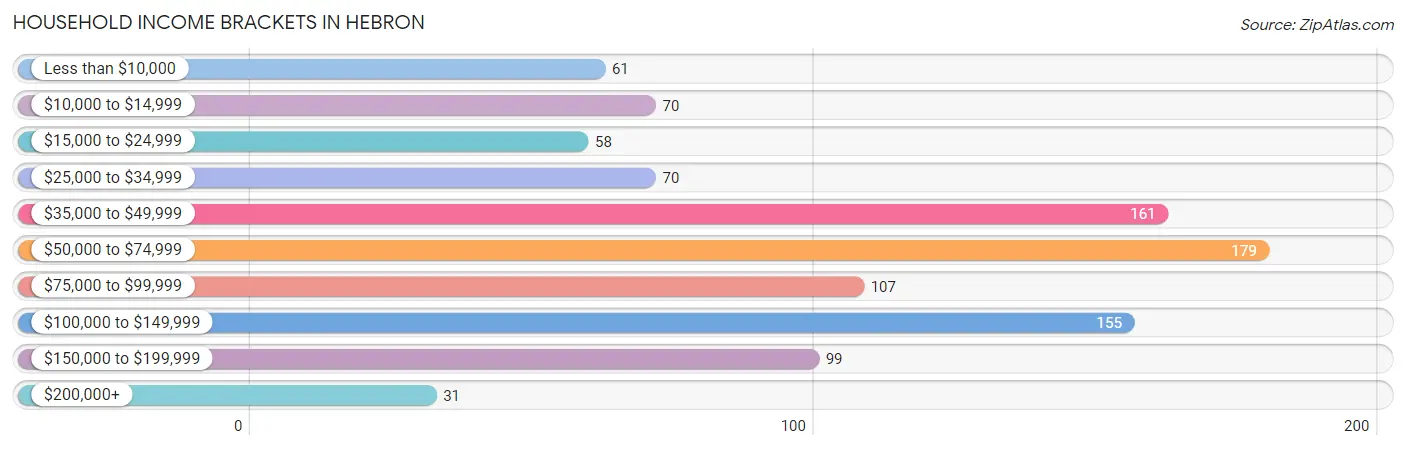
| Income Bracket | # Households | % Households |
| Less than $10,000 | 61 | 6.2% |
| $10,000 to $14,999 | 70 | 7.1% |
| $15,000 to $24,999 | 58 | 5.9% |
| $25,000 to $34,999 | 70 | 7.1% |
| $35,000 to $49,999 | 161 | 16.2% |
| $50,000 to $74,999 | 179 | 18.1% |
| $75,000 to $99,999 | 107 | 10.8% |
| $100,000 to $149,999 | 155 | 15.6% |
| $150,000 to $199,999 | 99 | 10.0% |
| $200,000+ | 31 | 3.1% |
Household Income by Householder Age in Hebron
The median household income in Hebron is $60,706, with the highest median household income of $74,489 found in the 25 to 44 years age bracket for the primary householder. A total of 387 households (39.1%) fall into this category. Meanwhile, the 15 to 24 years age bracket for the primary householder has the lowest median household income of $0, with 43 households (4.3%) in this group.
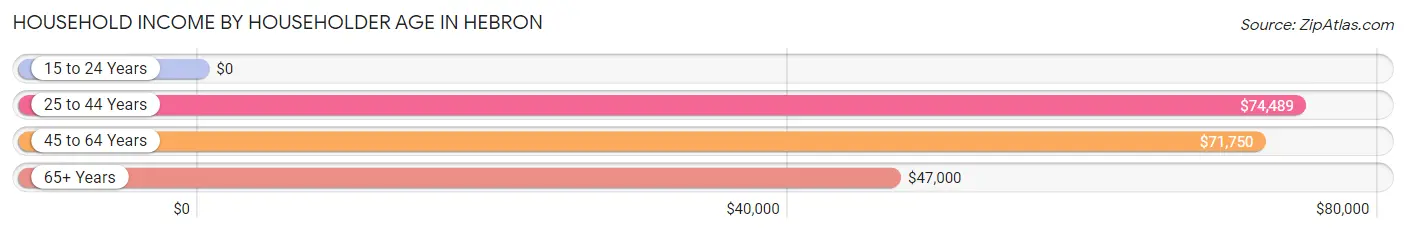
| Income Bracket | # Households | Median Income |
| 15 to 24 Years | 43 (4.3%) | $0 |
| 25 to 44 Years | 387 (39.1%) | $74,489 |
| 45 to 64 Years | 289 (29.2%) | $71,750 |
| 65+ Years | 272 (27.5%) | $47,000 |
| Total | 991 (100.0%) | $60,706 |
Poverty in Hebron
Income Below Poverty by Sex and Age in Hebron
With 10.0% poverty level for males and 11.0% for females among the residents of Hebron, 15 year old males and 18 to 24 year old females are the most vulnerable to poverty, with 15 males (100.0%) and 32 females (59.3%) in their respective age groups living below the poverty level.
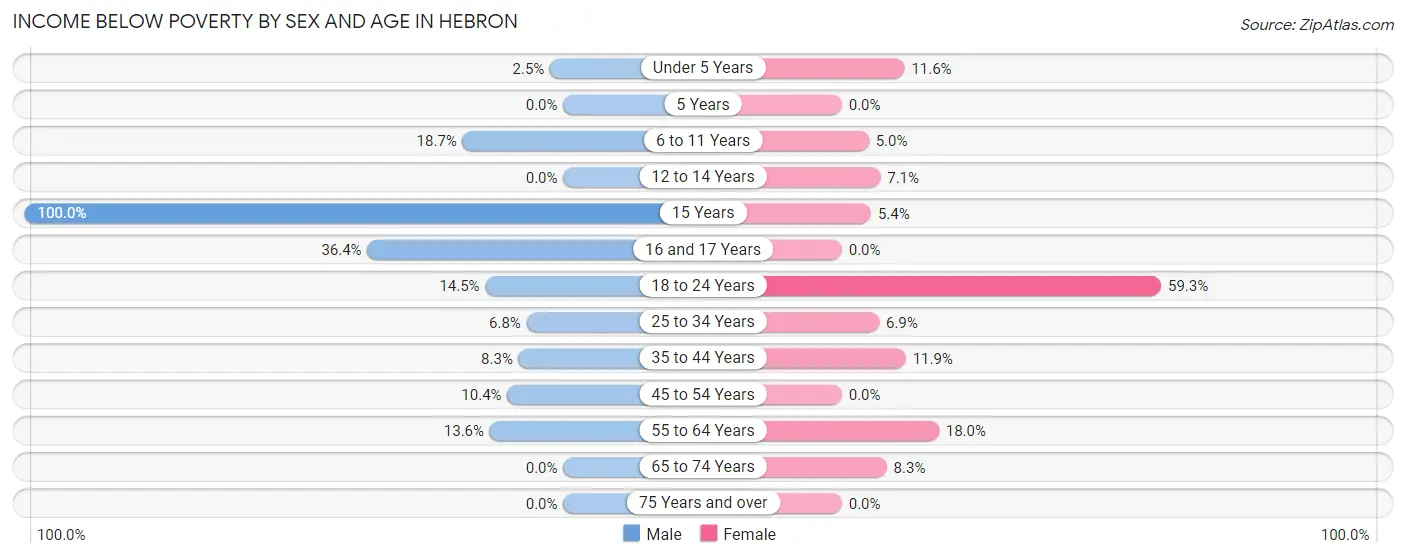
| Age Bracket | Male | Female |
| Under 5 Years | 4 (2.5%) | 5 (11.6%) |
| 5 Years | 0 (0.0%) | 0 (0.0%) |
| 6 to 11 Years | 20 (18.7%) | 3 (5.0%) |
| 12 to 14 Years | 0 (0.0%) | 2 (7.1%) |
| 15 Years | 15 (100.0%) | 2 (5.4%) |
| 16 and 17 Years | 16 (36.4%) | 0 (0.0%) |
| 18 to 24 Years | 12 (14.5%) | 32 (59.3%) |
| 25 to 34 Years | 19 (6.8%) | 15 (6.9%) |
| 35 to 44 Years | 14 (8.3%) | 23 (11.9%) |
| 45 to 54 Years | 11 (10.4%) | 0 (0.0%) |
| 55 to 64 Years | 15 (13.6%) | 36 (18.0%) |
| 65 to 74 Years | 0 (0.0%) | 13 (8.3%) |
| 75 Years and over | 0 (0.0%) | 0 (0.0%) |
| Total | 126 (10.0%) | 131 (11.0%) |
Income Above Poverty by Sex and Age in Hebron
According to the poverty statistics in Hebron, males aged 5 years and females aged 5 years are the age groups that are most secure financially, with 100.0% of males and 100.0% of females in these age groups living above the poverty line.
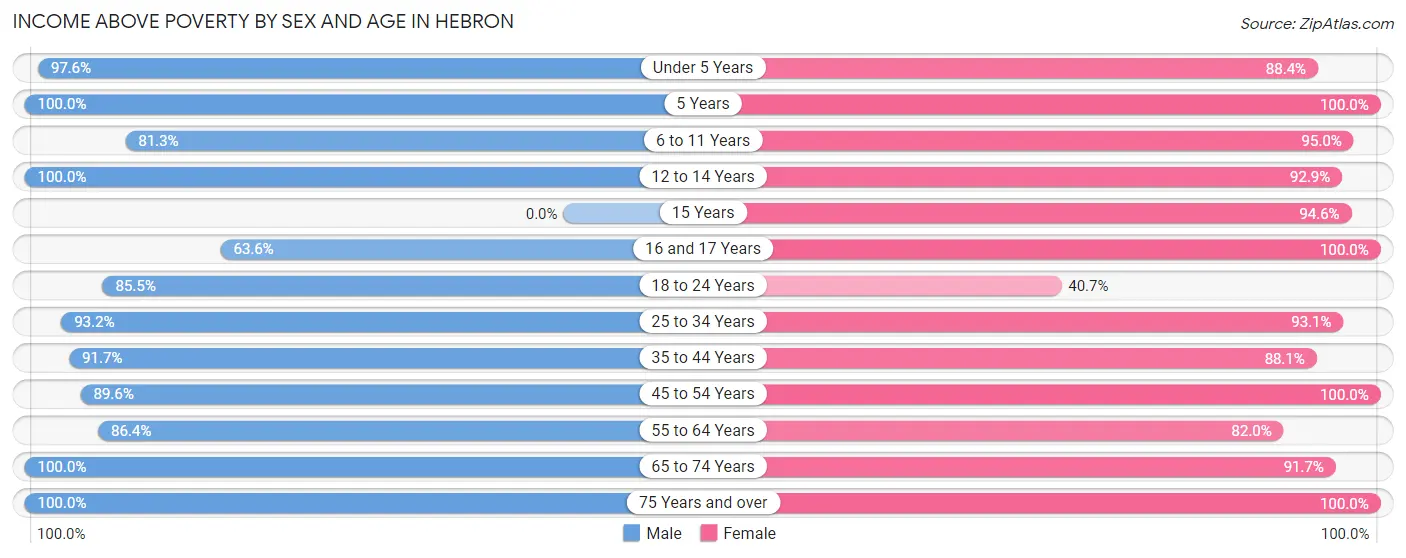
| Age Bracket | Male | Female |
| Under 5 Years | 159 (97.6%) | 38 (88.4%) |
| 5 Years | 3 (100.0%) | 28 (100.0%) |
| 6 to 11 Years | 87 (81.3%) | 57 (95.0%) |
| 12 to 14 Years | 67 (100.0%) | 26 (92.9%) |
| 15 Years | 0 (0.0%) | 35 (94.6%) |
| 16 and 17 Years | 28 (63.6%) | 13 (100.0%) |
| 18 to 24 Years | 71 (85.5%) | 22 (40.7%) |
| 25 to 34 Years | 260 (93.2%) | 202 (93.1%) |
| 35 to 44 Years | 155 (91.7%) | 171 (88.1%) |
| 45 to 54 Years | 95 (89.6%) | 77 (100.0%) |
| 55 to 64 Years | 95 (86.4%) | 164 (82.0%) |
| 65 to 74 Years | 79 (100.0%) | 143 (91.7%) |
| 75 Years and over | 39 (100.0%) | 89 (100.0%) |
| Total | 1,138 (90.0%) | 1,065 (89.0%) |
Income Below Poverty Among Married-Couple Families in Hebron
The poverty statistics for married-couple families in Hebron show that 1.7% or 6 of the total 363 families live below the poverty line. Families with 3 or 4 children have the highest poverty rate of 27.3%, comprising of 6 families. On the other hand, families with no children have the lowest poverty rate of 0.0%, which includes 0 families.
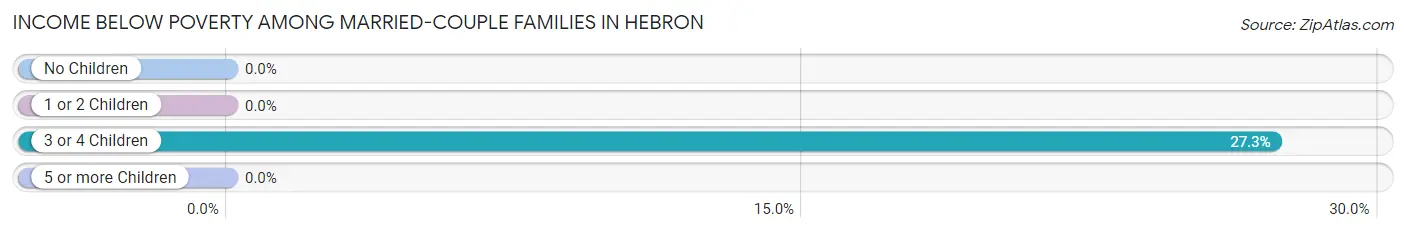
| Children | Above Poverty | Below Poverty |
| No Children | 192 (100.0%) | 0 (0.0%) |
| 1 or 2 Children | 149 (100.0%) | 0 (0.0%) |
| 3 or 4 Children | 16 (72.7%) | 6 (27.3%) |
| 5 or more Children | 0 (0.0%) | 0 (0.0%) |
| Total | 357 (98.4%) | 6 (1.7%) |
Income Below Poverty Among Single-Parent Households in Hebron
According to the poverty data in Hebron, 15.7% or 11 single-father households and 8.7% or 16 single-mother households are living below the poverty line. Among single-father households, those with 1 or 2 children have the highest poverty rate, with 11 households (21.6%) experiencing poverty. Likewise, among single-mother households, those with 1 or 2 children have the highest poverty rate, with 16 households (16.0%) falling below the poverty line.
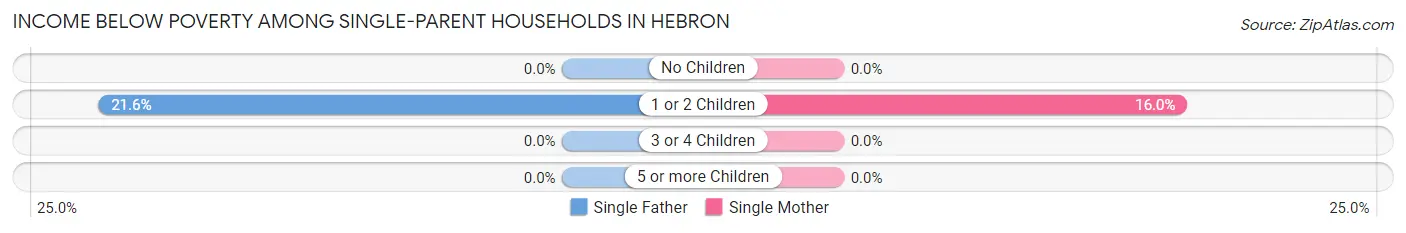
| Children | Single Father | Single Mother |
| No Children | 0 (0.0%) | 0 (0.0%) |
| 1 or 2 Children | 11 (21.6%) | 16 (16.0%) |
| 3 or 4 Children | 0 (0.0%) | 0 (0.0%) |
| 5 or more Children | 0 (0.0%) | 0 (0.0%) |
| Total | 11 (15.7%) | 16 (8.7%) |
Income Below Poverty Among Married-Couple vs Single-Parent Households in Hebron
The poverty data for Hebron shows that 6 of the married-couple family households (1.7%) and 27 of the single-parent households (10.7%) are living below the poverty level. Within the married-couple family households, those with 3 or 4 children have the highest poverty rate, with 6 households (27.3%) falling below the poverty line. Among the single-parent households, those with 1 or 2 children have the highest poverty rate, with 27 household (17.9%) living below poverty.
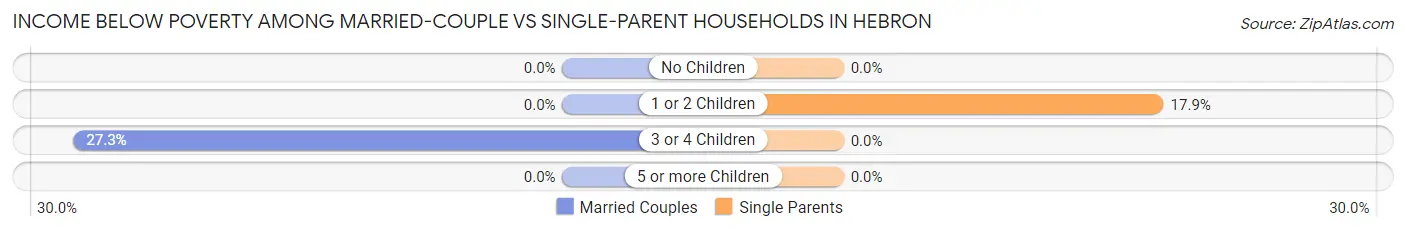
| Children | Married-Couple Families | Single-Parent Households |
| No Children | 0 (0.0%) | 0 (0.0%) |
| 1 or 2 Children | 0 (0.0%) | 27 (17.9%) |
| 3 or 4 Children | 6 (27.3%) | 0 (0.0%) |
| 5 or more Children | 0 (0.0%) | 0 (0.0%) |
| Total | 6 (1.7%) | 27 (10.7%) |
Race in Hebron
The most populous races in Hebron are White / Caucasian (2,281 | 91.8%), Black / African American (90 | 3.6%), and Hispanic or Latino (80 | 3.2%).
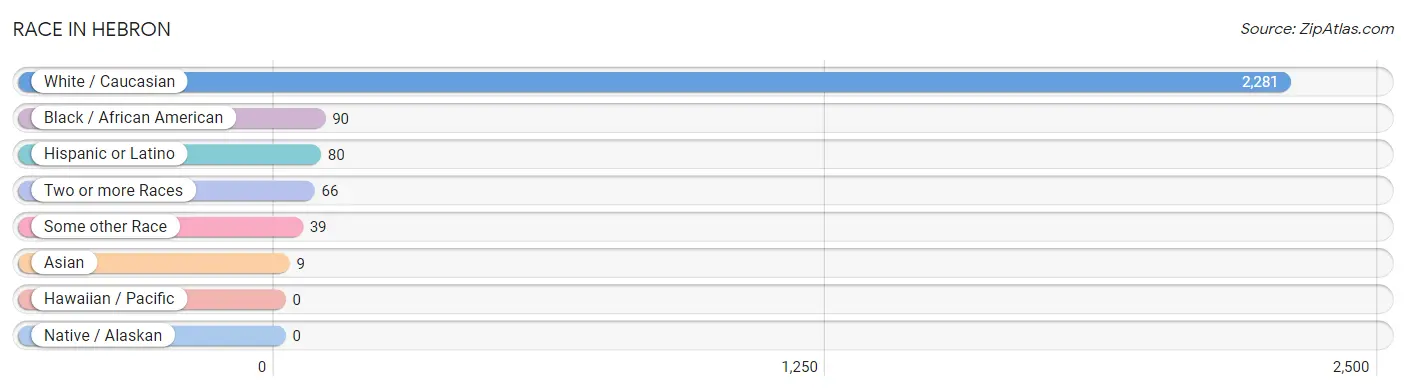
| Race | # Population | % Population |
| Asian | 9 | 0.4% |
| Black / African American | 90 | 3.6% |
| Hawaiian / Pacific | 0 | 0.0% |
| Hispanic or Latino | 80 | 3.2% |
| Native / Alaskan | 0 | 0.0% |
| White / Caucasian | 2,281 | 91.8% |
| Two or more Races | 66 | 2.7% |
| Some other Race | 39 | 1.6% |
| Total | 2,485 | 100.0% |
Ancestry in Hebron
The most populous ancestries reported in Hebron are German (528 | 21.2%), English (467 | 18.8%), Irish (338 | 13.6%), American (113 | 4.5%), and Italian (103 | 4.1%), together accounting for 62.3% of all Hebron residents.
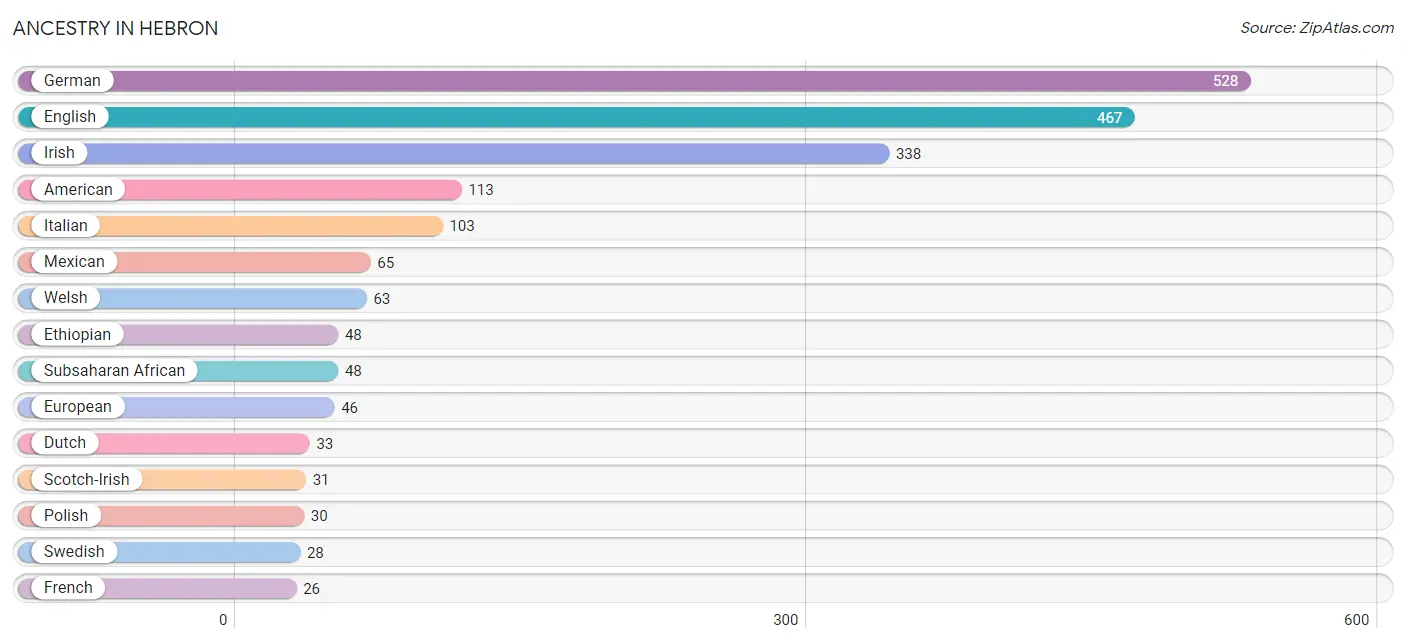
| Ancestry | # Population | % Population |
| American | 113 | 4.5% |
| Bhutanese | 6 | 0.2% |
| Blackfeet | 18 | 0.7% |
| British | 7 | 0.3% |
| Cherokee | 18 | 0.7% |
| Dutch | 33 | 1.3% |
| English | 467 | 18.8% |
| Ethiopian | 48 | 1.9% |
| European | 46 | 1.8% |
| French | 26 | 1.1% |
| French Canadian | 12 | 0.5% |
| German | 528 | 21.2% |
| Indian (Asian) | 9 | 0.4% |
| Irish | 338 | 13.6% |
| Italian | 103 | 4.1% |
| Mexican | 65 | 2.6% |
| Norwegian | 17 | 0.7% |
| Polish | 30 | 1.2% |
| Scandinavian | 4 | 0.2% |
| Scotch-Irish | 31 | 1.3% |
| Scottish | 26 | 1.1% |
| Sioux | 22 | 0.9% |
| Spanish | 15 | 0.6% |
| Subsaharan African | 48 | 1.9% |
| Swedish | 28 | 1.1% |
| Swiss | 5 | 0.2% |
| Ukrainian | 2 | 0.1% |
| Welsh | 63 | 2.5% | View All 28 Rows |
Immigrants in Hebron
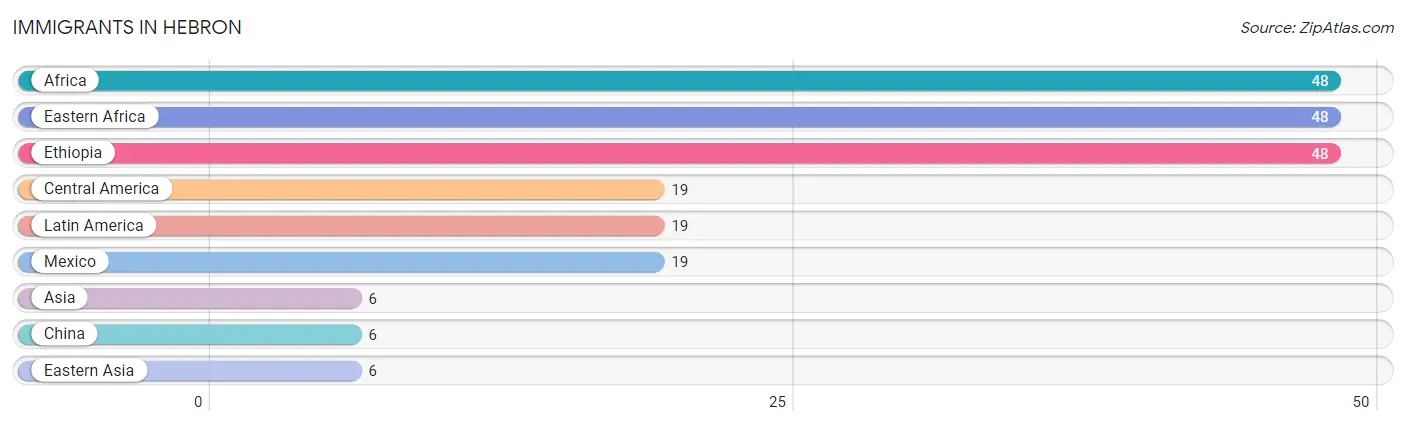
The most numerous immigrant groups reported in Hebron came from Africa (48 | 1.9%), Eastern Africa (48 | 1.9%), Ethiopia (48 | 1.9%), Central America (19 | 0.8%), and Latin America (19 | 0.8%), together accounting for 7.3% of all Hebron residents.
| Immigration Origin | # Population | % Population |
| Africa | 48 | 1.9% |
| Asia | 6 | 0.2% |
| Central America | 19 | 0.8% |
| China | 6 | 0.2% |
| Eastern Africa | 48 | 1.9% |
| Eastern Asia | 6 | 0.2% |
| Ethiopia | 48 | 1.9% |
| Latin America | 19 | 0.8% |
| Mexico | 19 | 0.8% | View All 9 Rows |
Sex and Age in Hebron
Sex and Age in Hebron
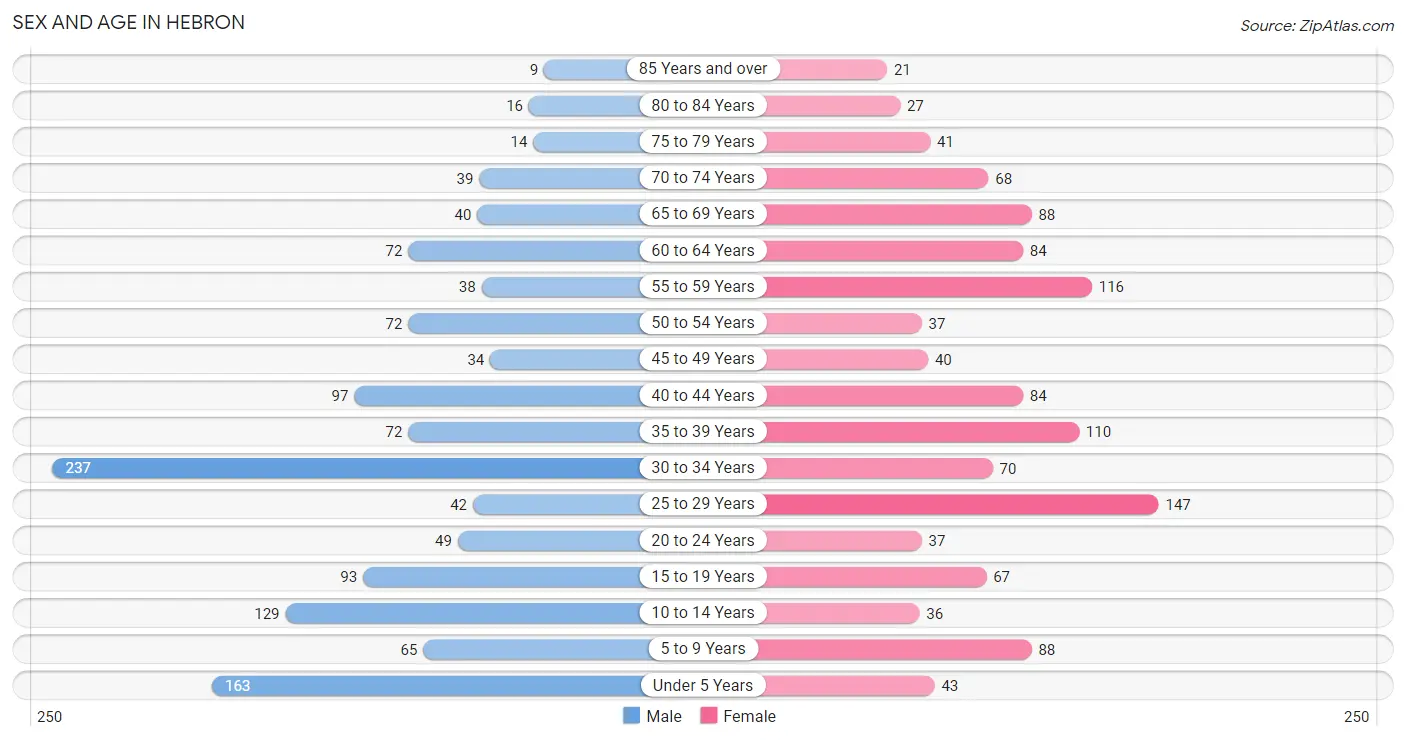
The most populous age groups in Hebron are 30 to 34 Years (237 | 18.5%) for men and 25 to 29 Years (147 | 12.2%) for women.
| Age Bracket | Male | Female |
| Under 5 Years | 163 (12.7%) | 43 (3.6%) |
| 5 to 9 Years | 65 (5.1%) | 88 (7.3%) |
| 10 to 14 Years | 129 (10.1%) | 36 (3.0%) |
| 15 to 19 Years | 93 (7.3%) | 67 (5.6%) |
| 20 to 24 Years | 49 (3.8%) | 37 (3.1%) |
| 25 to 29 Years | 42 (3.3%) | 147 (12.2%) |
| 30 to 34 Years | 237 (18.5%) | 70 (5.8%) |
| 35 to 39 Years | 72 (5.6%) | 110 (9.1%) |
| 40 to 44 Years | 97 (7.6%) | 84 (7.0%) |
| 45 to 49 Years | 34 (2.6%) | 40 (3.3%) |
| 50 to 54 Years | 72 (5.6%) | 37 (3.1%) |
| 55 to 59 Years | 38 (3.0%) | 116 (9.6%) |
| 60 to 64 Years | 72 (5.6%) | 84 (7.0%) |
| 65 to 69 Years | 40 (3.1%) | 88 (7.3%) |
| 70 to 74 Years | 39 (3.0%) | 68 (5.7%) |
| 75 to 79 Years | 14 (1.1%) | 41 (3.4%) |
| 80 to 84 Years | 16 (1.3%) | 27 (2.2%) |
| 85 Years and over | 9 (0.7%) | 21 (1.7%) |
| Total | 1,281 (100.0%) | 1,204 (100.0%) |
Families and Households in Hebron
Median Family Size in Hebron
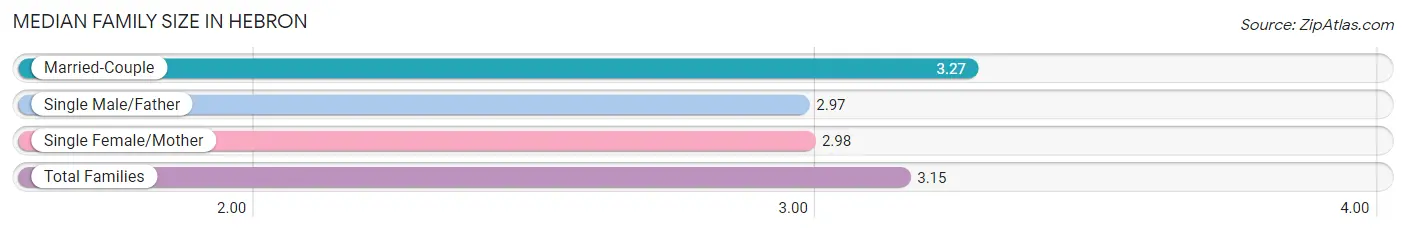
The median family size in Hebron is 3.15 persons per family, with married-couple families (363 | 58.9%) accounting for the largest median family size of 3.27 persons per family. On the other hand, single male/father families (70 | 11.4%) represent the smallest median family size with 2.97 persons per family.
| Family Type | # Families | Family Size |
| Married-Couple | 363 (58.9%) | 3.27 |
| Single Male/Father | 70 (11.4%) | 2.97 |
| Single Female/Mother | 183 (29.7%) | 2.98 |
| Total Families | 616 (100.0%) | 3.15 |
Median Household Size in Hebron
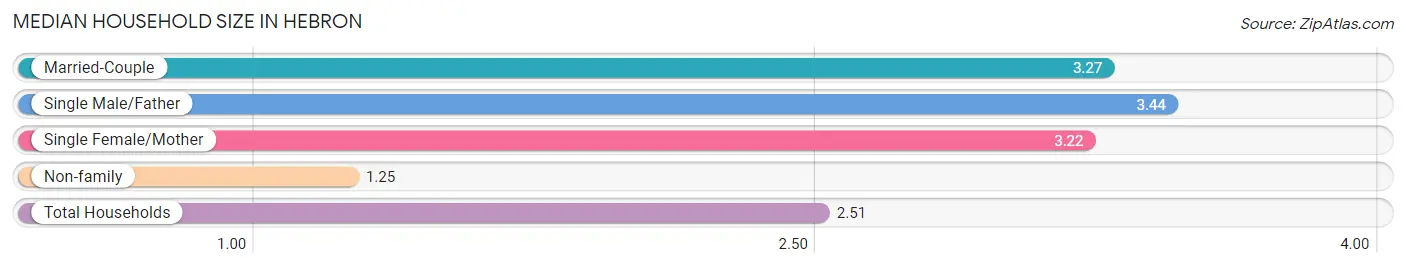
The median household size in Hebron is 2.51 persons per household, with single male/father households (70 | 7.1%) accounting for the largest median household size of 3.44 persons per household. non-family households (375 | 37.8%) represent the smallest median household size with 1.25 persons per household.
| Household Type | # Households | Household Size |
| Married-Couple | 363 (36.6%) | 3.27 |
| Single Male/Father | 70 (7.1%) | 3.44 |
| Single Female/Mother | 183 (18.5%) | 3.22 |
| Non-family | 375 (37.8%) | 1.25 |
| Total Households | 991 (100.0%) | 2.51 |
Household Size by Marriage Status in Hebron
Out of a total of 991 households in Hebron, 616 (62.2%) are family households, while 375 (37.8%) are nonfamily households. The most numerous type of family households are 2-person households, comprising 249, and the most common type of nonfamily households are 1-person households, comprising 306.
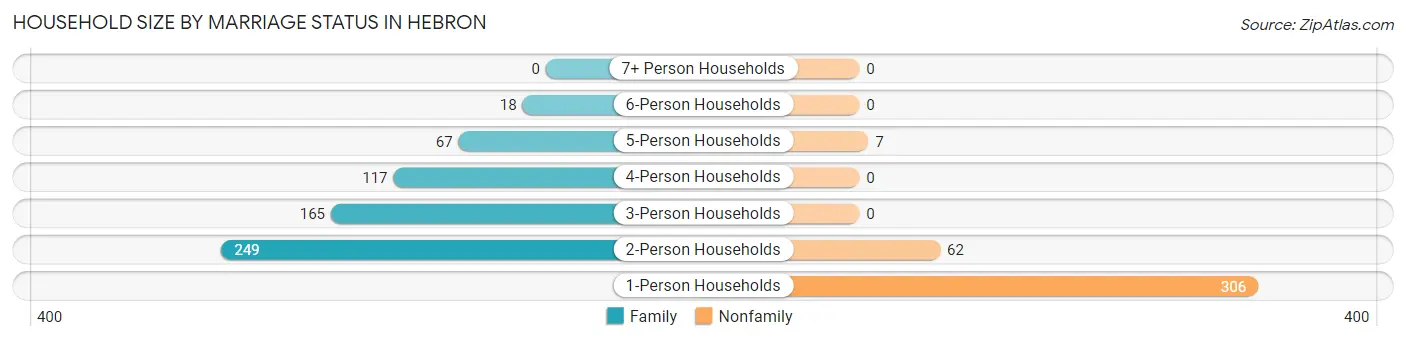
| Household Size | Family Households | Nonfamily Households |
| 1-Person Households | - | 306 (30.9%) |
| 2-Person Households | 249 (25.1%) | 62 (6.3%) |
| 3-Person Households | 165 (16.7%) | 0 (0.0%) |
| 4-Person Households | 117 (11.8%) | 0 (0.0%) |
| 5-Person Households | 67 (6.8%) | 7 (0.7%) |
| 6-Person Households | 18 (1.8%) | 0 (0.0%) |
| 7+ Person Households | 0 (0.0%) | 0 (0.0%) |
| Total | 616 (62.2%) | 375 (37.8%) |
Female Fertility in Hebron
Fertility by Age in Hebron
Average fertility rate in Hebron is 135.0 births per 1,000 women. Women in the age bracket of 20 to 34 years have the highest fertility rate with 299.0 births per 1,000 women. Women in the age bracket of 20 to 34 years acount for 100.0% of all women with births.
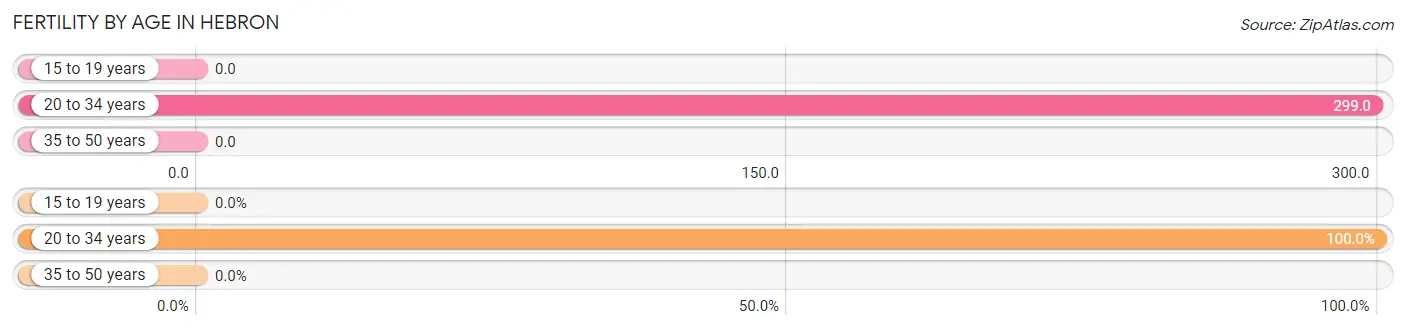
| Age Bracket | Women with Births | Births / 1,000 Women |
| 15 to 19 years | 0 (0.0%) | 0.0 |
| 20 to 34 years | 76 (100.0%) | 299.0 |
| 35 to 50 years | 0 (0.0%) | 0.0 |
| Total | 76 (100.0%) | 135.0 |
Fertility by Age by Marriage Status in Hebron
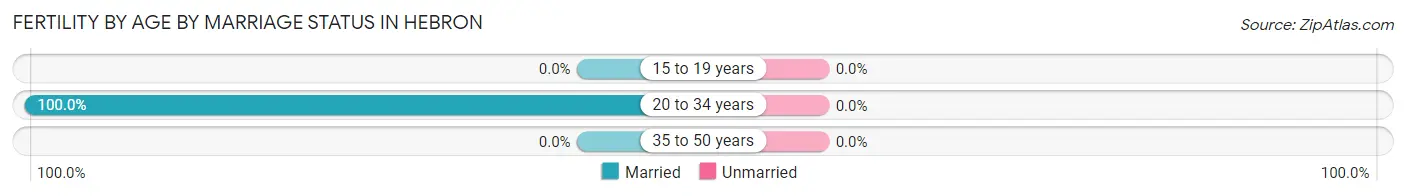
| Age Bracket | Married | Unmarried |
| 15 to 19 years | 0 (0.0%) | 0 (0.0%) |
| 20 to 34 years | 76 (100.0%) | 0 (0.0%) |
| 35 to 50 years | 0 (0.0%) | 0 (0.0%) |
| Total | 76 (100.0%) | 0 (0.0%) |
Fertility by Education in Hebron
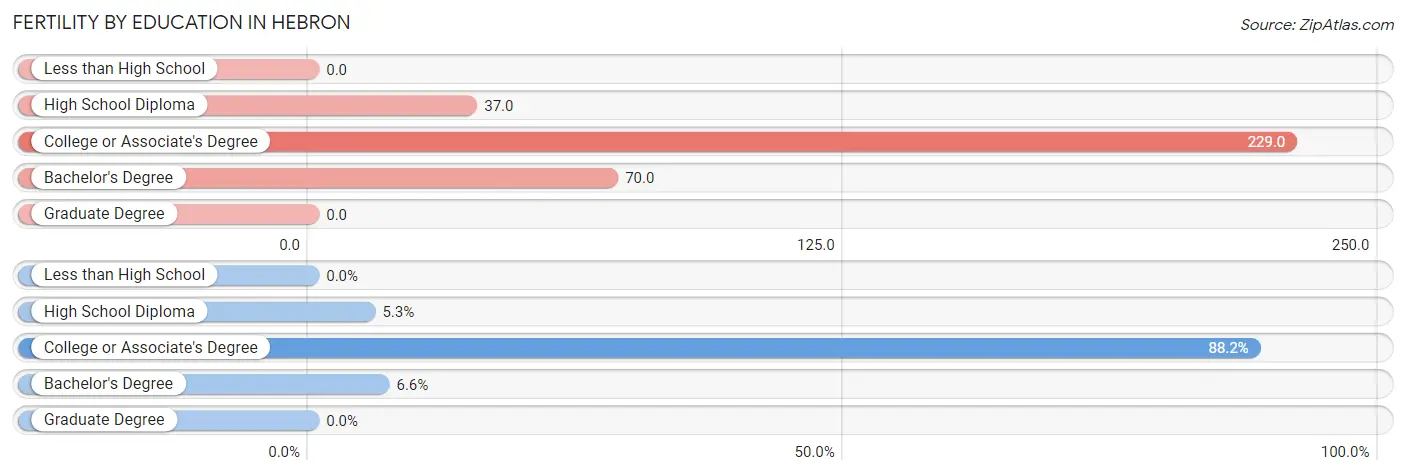
| Educational Attainment | Women with Births | Births / 1,000 Women |
| Less than High School | 0 (0.0%) | 0.0 |
| High School Diploma | 4 (5.3%) | 37.0 |
| College or Associate's Degree | 67 (88.2%) | 229.0 |
| Bachelor's Degree | 5 (6.6%) | 70.0 |
| Graduate Degree | 0 (0.0%) | 0.0 |
| Total | 76 (100.0%) | 135.0 |
Fertility by Education by Marriage Status in Hebron
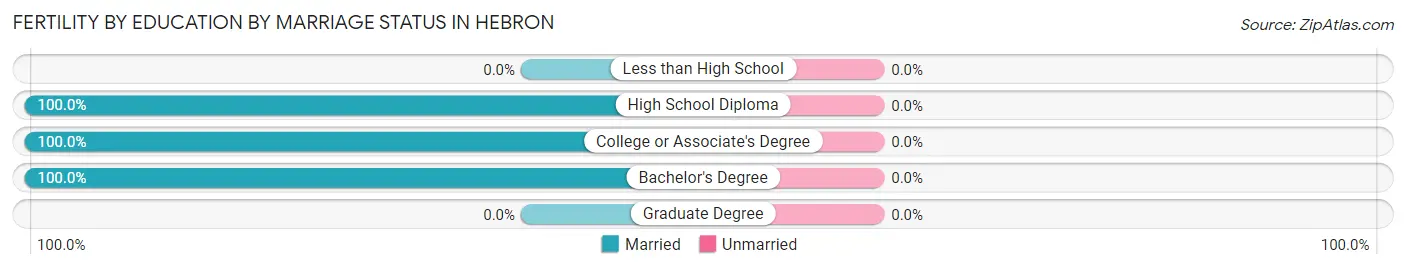
| Educational Attainment | Married | Unmarried |
| Less than High School | 0 (0.0%) | 0 (0.0%) |
| High School Diploma | 4 (100.0%) | 0 (0.0%) |
| College or Associate's Degree | 67 (100.0%) | 0 (0.0%) |
| Bachelor's Degree | 5 (100.0%) | 0 (0.0%) |
| Graduate Degree | 0 (0.0%) | 0 (0.0%) |
| Total | 76 (100.0%) | 0 (0.0%) |
Employment Characteristics in Hebron
Employment by Class of Employer in Hebron
Among the 1,248 employed individuals in Hebron, private company employees (955 | 76.5%), local government employees (107 | 8.6%), and self-employed (not incorporated) (62 | 5.0%) make up the most common classes of employment.
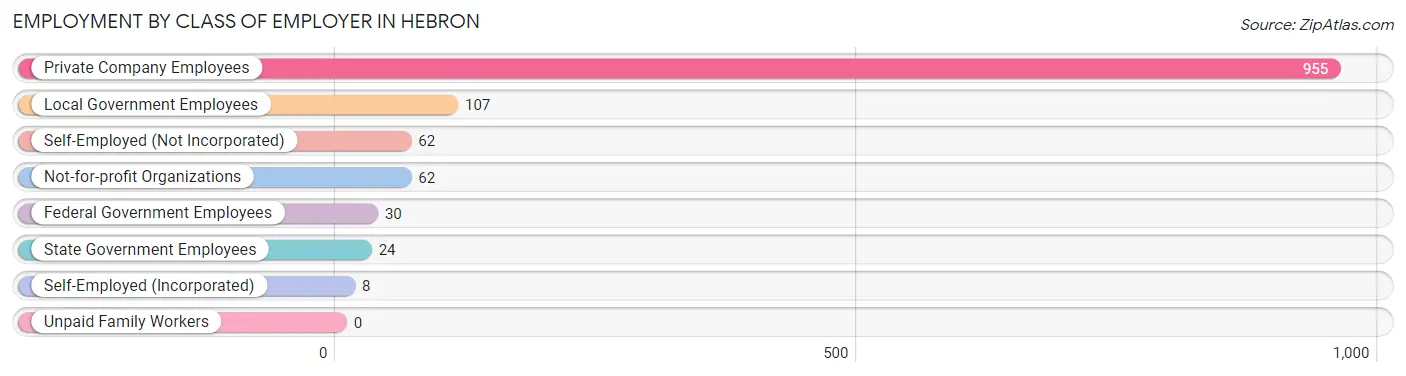
| Employer Class | # Employees | % Employees |
| Private Company Employees | 955 | 76.5% |
| Self-Employed (Incorporated) | 8 | 0.6% |
| Self-Employed (Not Incorporated) | 62 | 5.0% |
| Not-for-profit Organizations | 62 | 5.0% |
| Local Government Employees | 107 | 8.6% |
| State Government Employees | 24 | 1.9% |
| Federal Government Employees | 30 | 2.4% |
| Unpaid Family Workers | 0 | 0.0% |
| Total | 1,248 | 100.0% |
Employment Status by Age in Hebron
According to the labor force statistics for Hebron, out of the total population over 16 years of age (1,909), 70.2% or 1,340 individuals are in the labor force, with 5.4% or 72 of them unemployed. The age group with the highest labor force participation rate is 25 to 29 years, with 100.0% or 189 individuals in the labor force. Within the labor force, the 55 to 59 years age range has the highest percentage of unemployed individuals, with 29.0% or 31 of them being unemployed.
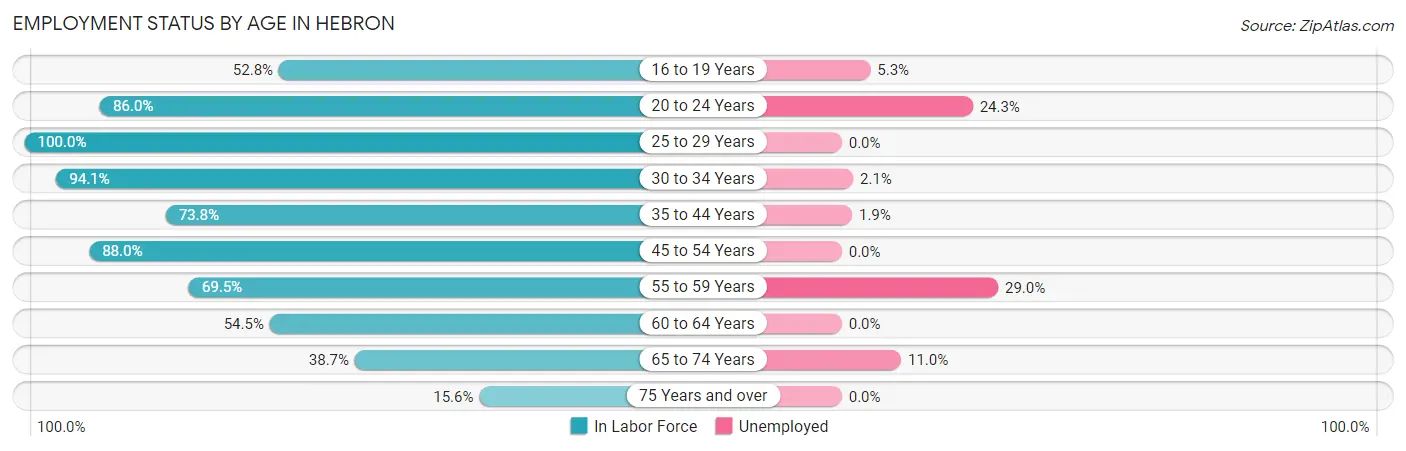
| Age Bracket | In Labor Force | Unemployed |
| 16 to 19 Years | 57 (52.8%) | 3 (5.3%) |
| 20 to 24 Years | 74 (86.0%) | 18 (24.3%) |
| 25 to 29 Years | 189 (100.0%) | 0 (0.0%) |
| 30 to 34 Years | 289 (94.1%) | 6 (2.1%) |
| 35 to 44 Years | 268 (73.8%) | 5 (1.9%) |
| 45 to 54 Years | 161 (88.0%) | 0 (0.0%) |
| 55 to 59 Years | 107 (69.5%) | 31 (29.0%) |
| 60 to 64 Years | 85 (54.5%) | 0 (0.0%) |
| 65 to 74 Years | 91 (38.7%) | 10 (11.0%) |
| 75 Years and over | 20 (15.6%) | 0 (0.0%) |
| Total | 1,340 (70.2%) | 72 (5.4%) |
Employment Status by Educational Attainment in Hebron
According to labor force statistics for Hebron, 81.3% of individuals (1,099) out of the total population between 25 and 64 years of age (1,352) are in the labor force, with 3.8% or 42 of them being unemployed. The group with the highest labor force participation rate are those with the educational attainment of bachelor's degree or higher, with 94.1% or 222 individuals in the labor force. Within the labor force, individuals with college / associate degree education have the highest percentage of unemployment, with 8.6% or 37 of them being unemployed.
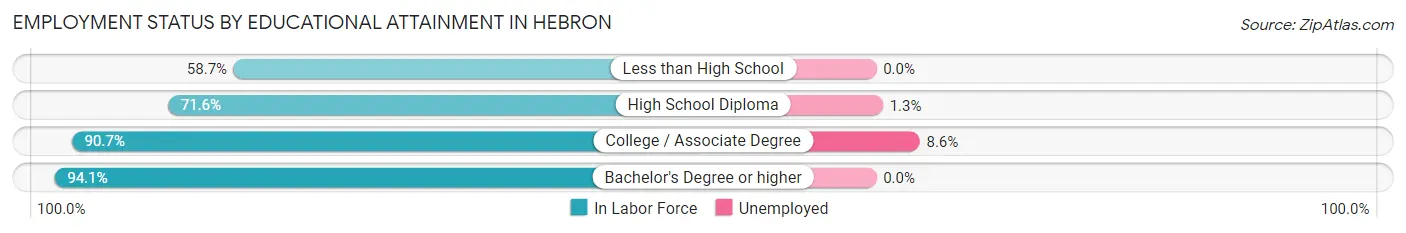
| Educational Attainment | In Labor Force | Unemployed |
| Less than High School | 54 (58.7%) | 0 (0.0%) |
| High School Diploma | 395 (71.6%) | 7 (1.3%) |
| College / Associate Degree | 428 (90.7%) | 41 (8.6%) |
| Bachelor's Degree or higher | 222 (94.1%) | 0 (0.0%) |
| Total | 1,099 (81.3%) | 51 (3.8%) |
Employment Occupations by Sex in Hebron
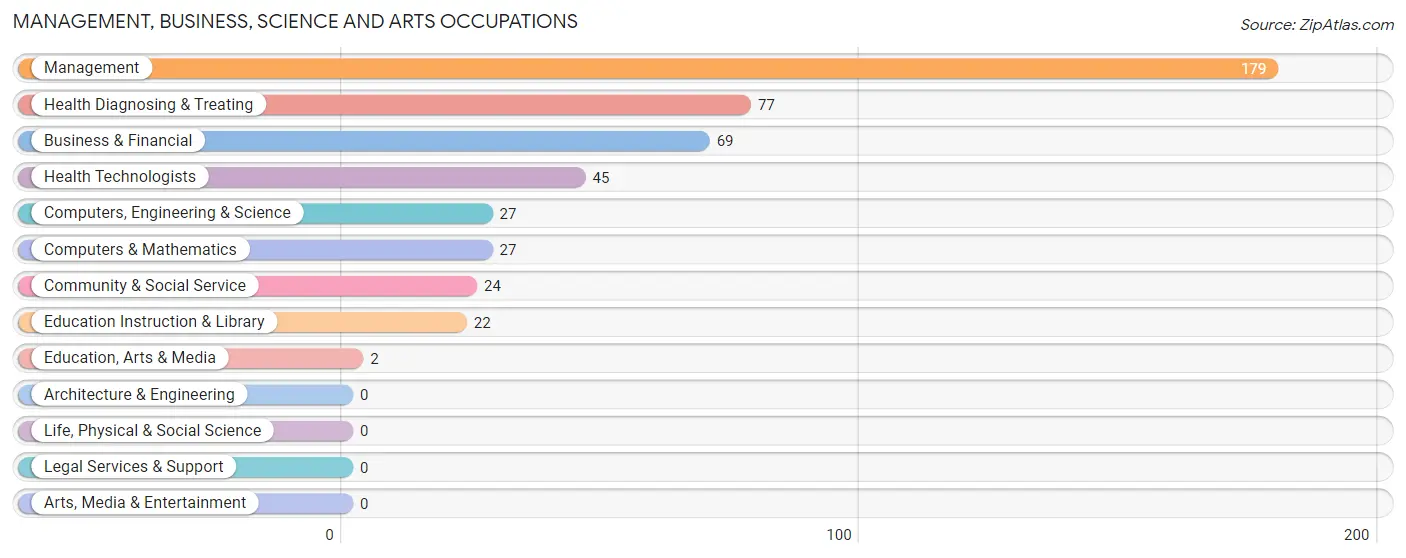
Management, Business, Science and Arts Occupations
The most common Management, Business, Science and Arts occupations in Hebron are Management (179 | 14.1%), Health Diagnosing & Treating (77 | 6.1%), Business & Financial (69 | 5.4%), Health Technologists (45 | 3.5%), and Computers, Engineering & Science (27 | 2.1%).
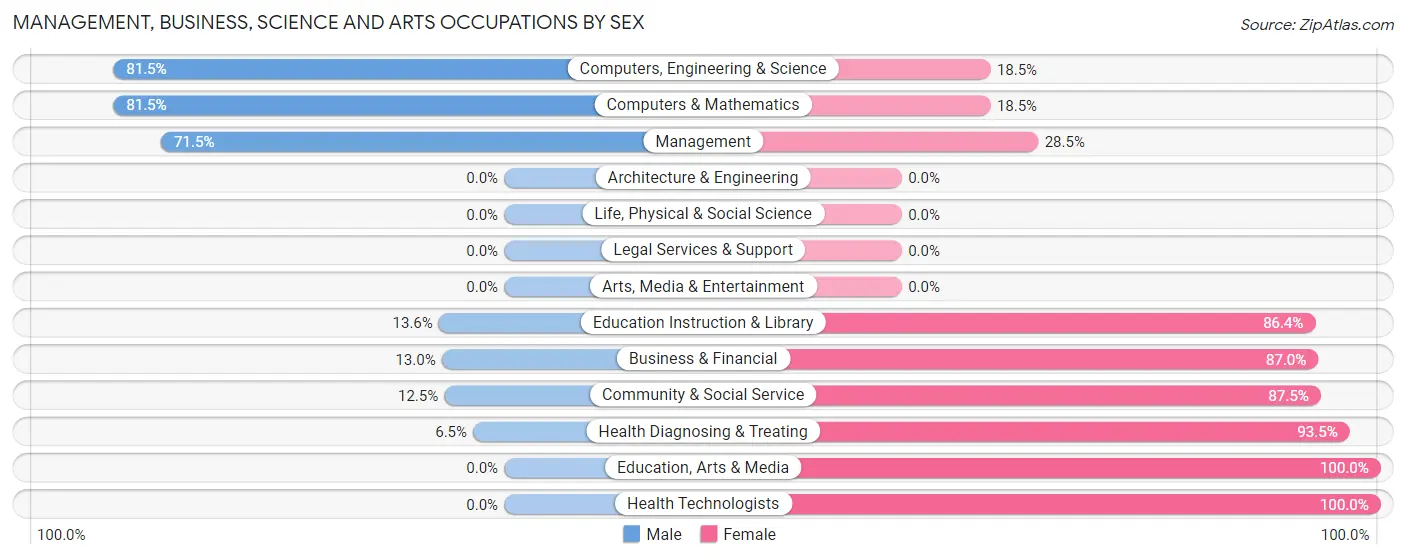
Management, Business, Science and Arts Occupations by Sex
Within the Management, Business, Science and Arts occupations in Hebron, the most male-oriented occupations are Computers, Engineering & Science (81.5%), Computers & Mathematics (81.5%), and Management (71.5%), while the most female-oriented occupations are Education, Arts & Media (100.0%), Health Technologists (100.0%), and Health Diagnosing & Treating (93.5%).
| Occupation | Male | Female |
| Management | 128 (71.5%) | 51 (28.5%) |
| Business & Financial | 9 (13.0%) | 60 (87.0%) |
| Computers, Engineering & Science | 22 (81.5%) | 5 (18.5%) |
| Computers & Mathematics | 22 (81.5%) | 5 (18.5%) |
| Architecture & Engineering | 0 (0.0%) | 0 (0.0%) |
| Life, Physical & Social Science | 0 (0.0%) | 0 (0.0%) |
| Community & Social Service | 3 (12.5%) | 21 (87.5%) |
| Education, Arts & Media | 0 (0.0%) | 2 (100.0%) |
| Legal Services & Support | 0 (0.0%) | 0 (0.0%) |
| Education Instruction & Library | 3 (13.6%) | 19 (86.4%) |
| Arts, Media & Entertainment | 0 (0.0%) | 0 (0.0%) |
| Health Diagnosing & Treating | 5 (6.5%) | 72 (93.5%) |
| Health Technologists | 0 (0.0%) | 45 (100.0%) |
| Total (Category) | 167 (44.4%) | 209 (55.6%) |
| Total (Overall) | 645 (50.9%) | 623 (49.1%) |
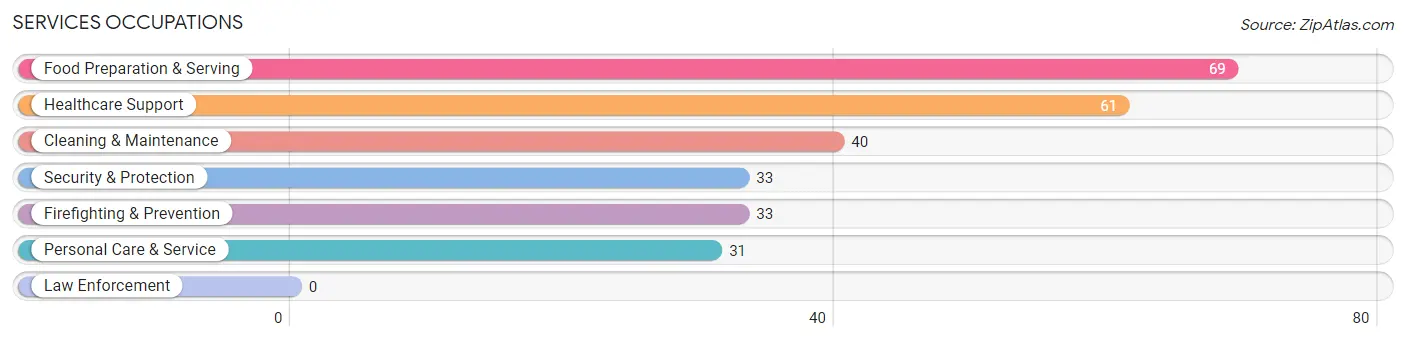
Services Occupations
The most common Services occupations in Hebron are Food Preparation & Serving (69 | 5.4%), Healthcare Support (61 | 4.8%), Cleaning & Maintenance (40 | 3.2%), Security & Protection (33 | 2.6%), and Firefighting & Prevention (33 | 2.6%).
Services Occupations by Sex
Within the Services occupations in Hebron, the most male-oriented occupations are Cleaning & Maintenance (87.5%), Security & Protection (84.9%), and Firefighting & Prevention (84.9%), while the most female-oriented occupations are Healthcare Support (100.0%), Personal Care & Service (100.0%), and Food Preparation & Serving (92.7%).

| Occupation | Male | Female |
| Healthcare Support | 0 (0.0%) | 61 (100.0%) |
| Security & Protection | 28 (84.9%) | 5 (15.1%) |
| Firefighting & Prevention | 28 (84.9%) | 5 (15.1%) |
| Law Enforcement | 0 (0.0%) | 0 (0.0%) |
| Food Preparation & Serving | 5 (7.2%) | 64 (92.7%) |
| Cleaning & Maintenance | 35 (87.5%) | 5 (12.5%) |
| Personal Care & Service | 0 (0.0%) | 31 (100.0%) |
| Total (Category) | 68 (29.1%) | 166 (70.9%) |
| Total (Overall) | 645 (50.9%) | 623 (49.1%) |
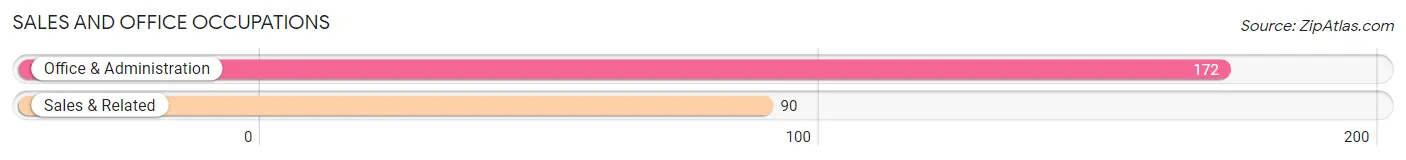
Sales and Office Occupations
The most common Sales and Office occupations in Hebron are Office & Administration (172 | 13.6%), and Sales & Related (90 | 7.1%).
Sales and Office Occupations by Sex

| Occupation | Male | Female |
| Sales & Related | 35 (38.9%) | 55 (61.1%) |
| Office & Administration | 24 (14.0%) | 148 (86.1%) |
| Total (Category) | 59 (22.5%) | 203 (77.5%) |
| Total (Overall) | 645 (50.9%) | 623 (49.1%) |
Natural Resources, Construction and Maintenance Occupations
The most common Natural Resources, Construction and Maintenance occupations in Hebron are Installation, Maintenance & Repair (69 | 5.4%), and Construction & Extraction (19 | 1.5%).
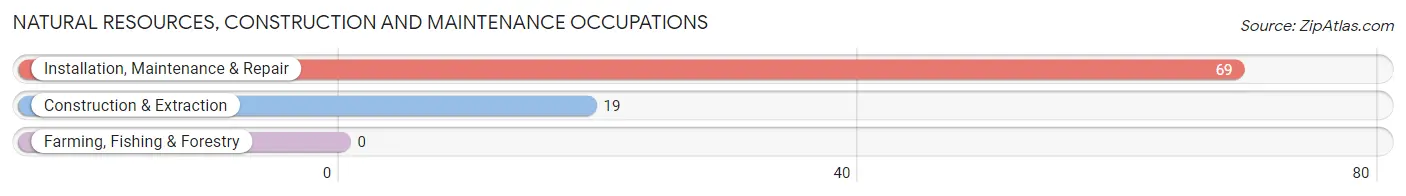
Natural Resources, Construction and Maintenance Occupations by Sex
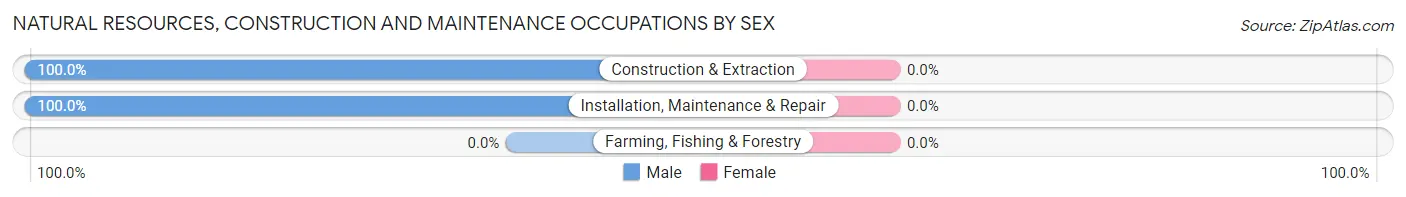
| Occupation | Male | Female |
| Farming, Fishing & Forestry | 0 (0.0%) | 0 (0.0%) |
| Construction & Extraction | 19 (100.0%) | 0 (0.0%) |
| Installation, Maintenance & Repair | 69 (100.0%) | 0 (0.0%) |
| Total (Category) | 88 (100.0%) | 0 (0.0%) |
| Total (Overall) | 645 (50.9%) | 623 (49.1%) |
Production, Transportation and Moving Occupations
The most common Production, Transportation and Moving occupations in Hebron are Production (139 | 11.0%), Material Moving (89 | 7.0%), and Transportation (80 | 6.3%).
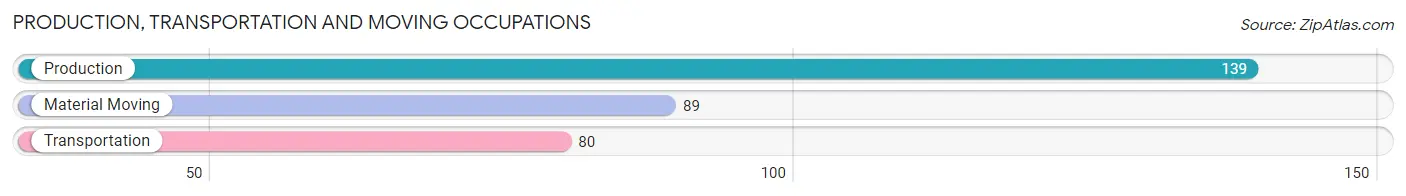
Production, Transportation and Moving Occupations by Sex
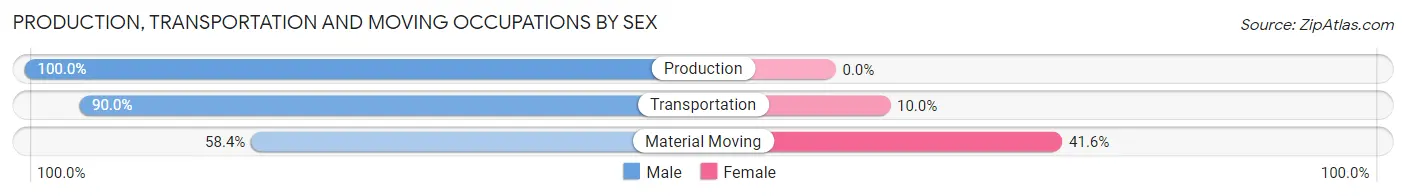
| Occupation | Male | Female |
| Production | 139 (100.0%) | 0 (0.0%) |
| Transportation | 72 (90.0%) | 8 (10.0%) |
| Material Moving | 52 (58.4%) | 37 (41.6%) |
| Total (Category) | 263 (85.4%) | 45 (14.6%) |
| Total (Overall) | 645 (50.9%) | 623 (49.1%) |
Employment Industries by Sex in Hebron
Employment Industries in Hebron
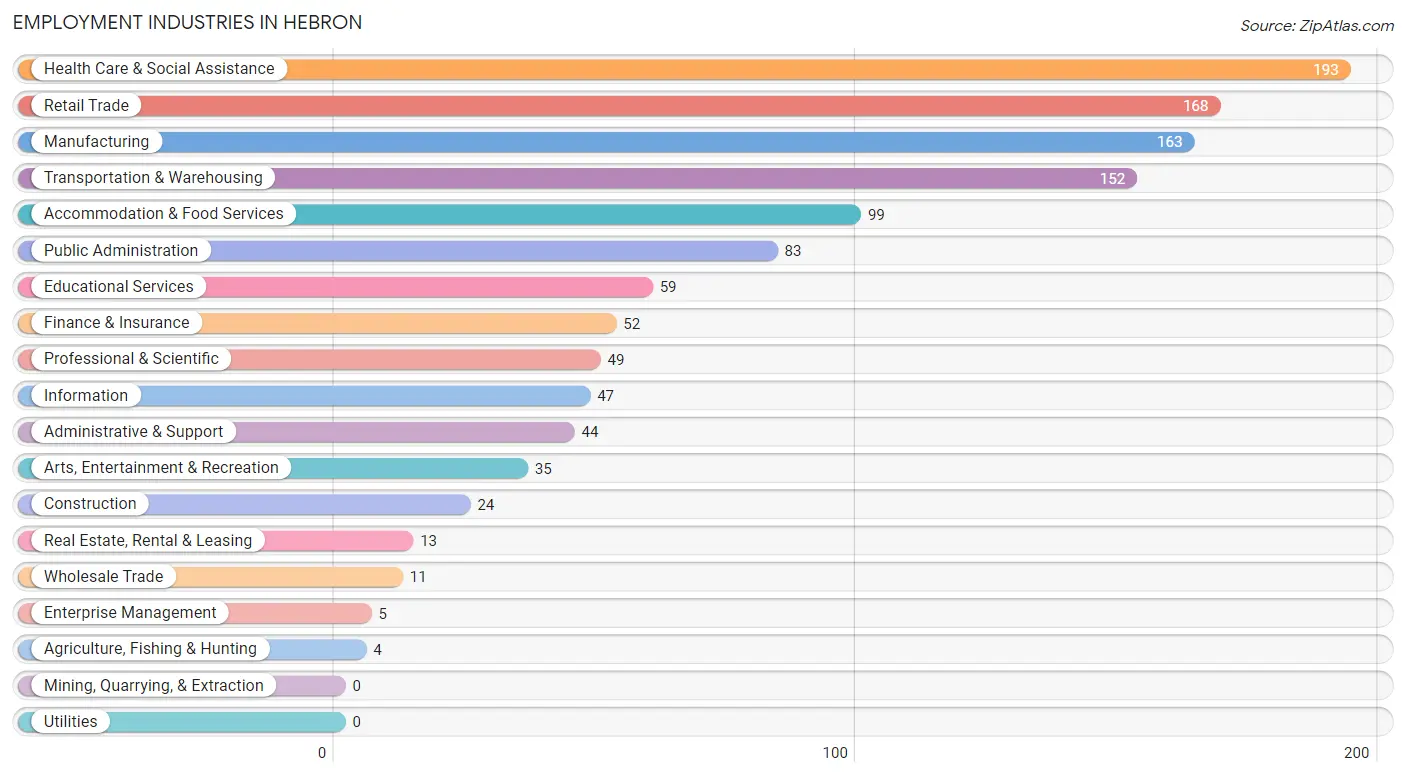
The major employment industries in Hebron include Health Care & Social Assistance (193 | 15.2%), Retail Trade (168 | 13.3%), Manufacturing (163 | 12.9%), Transportation & Warehousing (152 | 12.0%), and Accommodation & Food Services (99 | 7.8%).
Employment Industries by Sex in Hebron
The Hebron industries that see more men than women are Agriculture, Fishing & Hunting (100.0%), Wholesale Trade (100.0%), and Information (100.0%), whereas the industries that tend to have a higher number of women are Real Estate, Rental & Leasing (100.0%), Enterprise Management (100.0%), and Health Care & Social Assistance (95.9%).
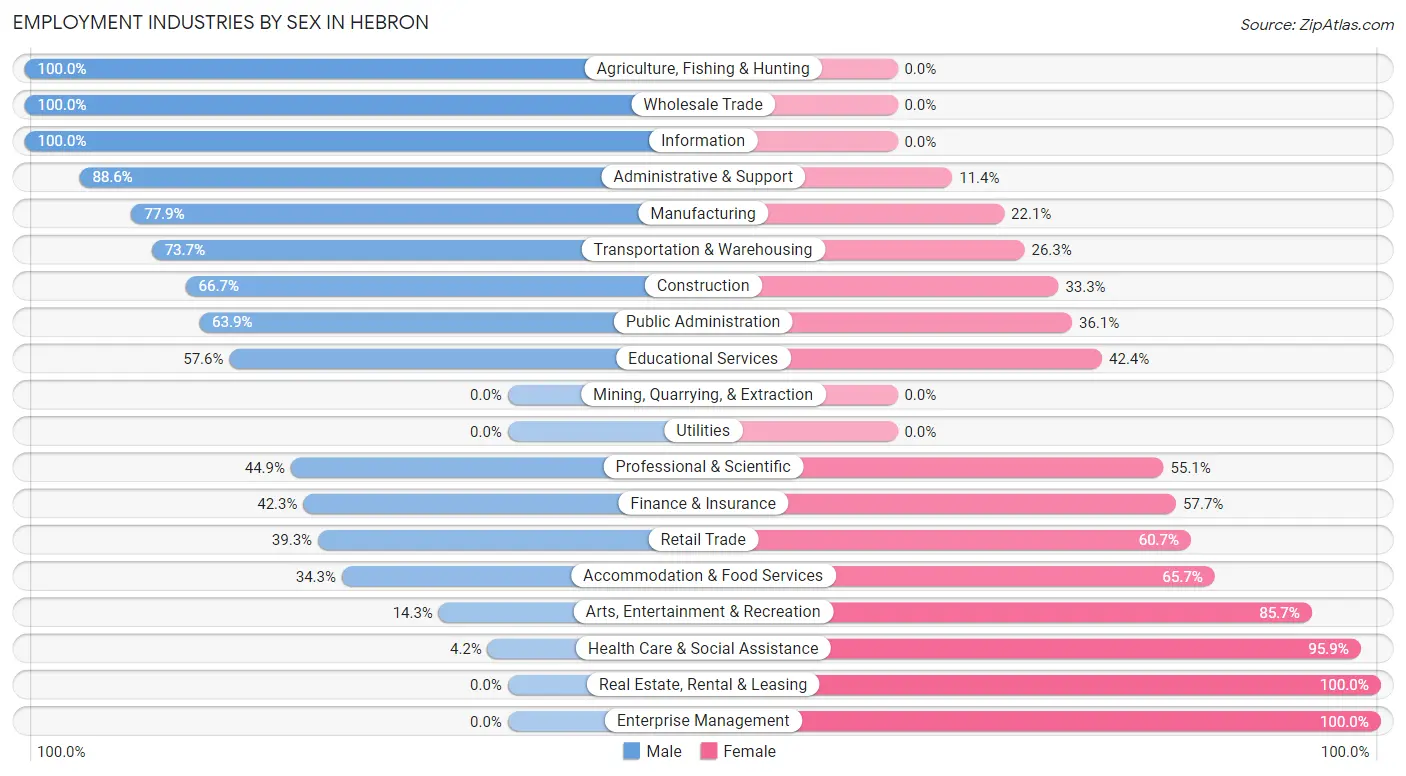
| Industry | Male | Female |
| Agriculture, Fishing & Hunting | 4 (100.0%) | 0 (0.0%) |
| Mining, Quarrying, & Extraction | 0 (0.0%) | 0 (0.0%) |
| Construction | 16 (66.7%) | 8 (33.3%) |
| Manufacturing | 127 (77.9%) | 36 (22.1%) |
| Wholesale Trade | 11 (100.0%) | 0 (0.0%) |
| Retail Trade | 66 (39.3%) | 102 (60.7%) |
| Transportation & Warehousing | 112 (73.7%) | 40 (26.3%) |
| Utilities | 0 (0.0%) | 0 (0.0%) |
| Information | 47 (100.0%) | 0 (0.0%) |
| Finance & Insurance | 22 (42.3%) | 30 (57.7%) |
| Real Estate, Rental & Leasing | 0 (0.0%) | 13 (100.0%) |
| Professional & Scientific | 22 (44.9%) | 27 (55.1%) |
| Enterprise Management | 0 (0.0%) | 5 (100.0%) |
| Administrative & Support | 39 (88.6%) | 5 (11.4%) |
| Educational Services | 34 (57.6%) | 25 (42.4%) |
| Health Care & Social Assistance | 8 (4.2%) | 185 (95.9%) |
| Arts, Entertainment & Recreation | 5 (14.3%) | 30 (85.7%) |
| Accommodation & Food Services | 34 (34.3%) | 65 (65.7%) |
| Public Administration | 53 (63.9%) | 30 (36.1%) |
| Total | 645 (50.9%) | 623 (49.1%) |
Education in Hebron
School Enrollment in Hebron
The most common levels of schooling among the 524 students in Hebron are high school (165 | 31.5%), elementary school (158 | 30.1%), and middle school (89 | 17.0%).
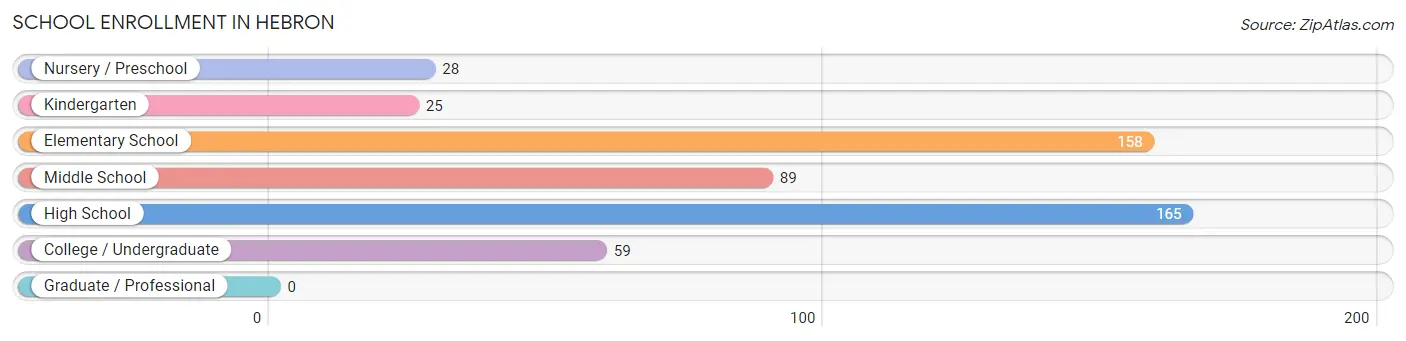
| School Level | # Students | % Students |
| Nursery / Preschool | 28 | 5.3% |
| Kindergarten | 25 | 4.8% |
| Elementary School | 158 | 30.1% |
| Middle School | 89 | 17.0% |
| High School | 165 | 31.5% |
| College / Undergraduate | 59 | 11.3% |
| Graduate / Professional | 0 | 0.0% |
| Total | 524 | 100.0% |
School Enrollment by Age by Funding Source in Hebron
Out of a total of 524 students who are enrolled in schools in Hebron, 86 (16.4%) attend a private institution, while the remaining 438 (83.6%) are enrolled in public schools. The age group of 3 to 4 year olds has the highest likelihood of being enrolled in private schools, with 13 (56.5% in the age bracket) enrolled. Conversely, the age group of 20 to 24 year olds has the lowest likelihood of being enrolled in a private school, with 19 (100.0% in the age bracket) attending a public institution.
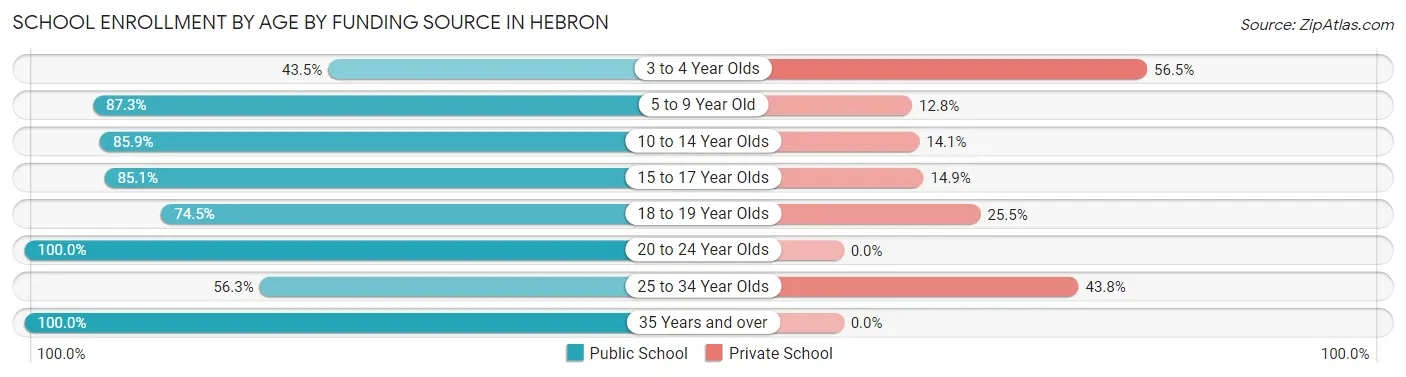
| Age Bracket | Public School | Private School |
| 3 to 4 Year Olds | 10 (43.5%) | 13 (56.5%) |
| 5 to 9 Year Old | 130 (87.3%) | 19 (12.8%) |
| 10 to 14 Year Olds | 122 (85.9%) | 20 (14.1%) |
| 15 to 17 Year Olds | 80 (85.1%) | 14 (14.9%) |
| 18 to 19 Year Olds | 38 (74.5%) | 13 (25.5%) |
| 20 to 24 Year Olds | 19 (100.0%) | 0 (0.0%) |
| 25 to 34 Year Olds | 9 (56.2%) | 7 (43.8%) |
| 35 Years and over | 30 (100.0%) | 0 (0.0%) |
| Total | 438 (83.6%) | 86 (16.4%) |
Educational Attainment by Field of Study in Hebron
Business (104 | 36.9%), education (50 | 17.7%), bio, nature & agricultural (29 | 10.3%), computers & mathematics (28 | 9.9%), and arts & humanities (26 | 9.2%) are the most common fields of study among 282 individuals in Hebron who have obtained a bachelor's degree or higher.
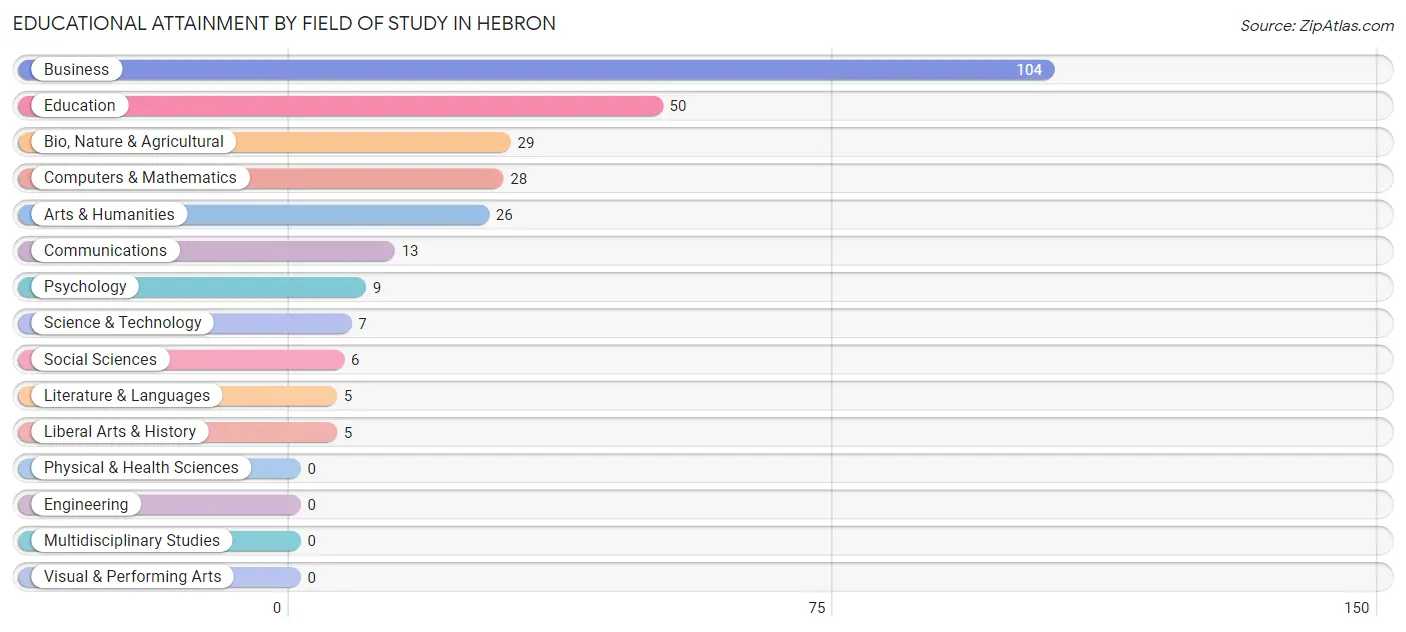
| Field of Study | # Graduates | % Graduates |
| Computers & Mathematics | 28 | 9.9% |
| Bio, Nature & Agricultural | 29 | 10.3% |
| Physical & Health Sciences | 0 | 0.0% |
| Psychology | 9 | 3.2% |
| Social Sciences | 6 | 2.1% |
| Engineering | 0 | 0.0% |
| Multidisciplinary Studies | 0 | 0.0% |
| Science & Technology | 7 | 2.5% |
| Business | 104 | 36.9% |
| Education | 50 | 17.7% |
| Literature & Languages | 5 | 1.8% |
| Liberal Arts & History | 5 | 1.8% |
| Visual & Performing Arts | 0 | 0.0% |
| Communications | 13 | 4.6% |
| Arts & Humanities | 26 | 9.2% |
| Total | 282 | 100.0% |
Transportation & Commute in Hebron
Vehicle Availability by Sex in Hebron
The most prevalent vehicle ownership categories in Hebron are males with 2 vehicles (344, accounting for 54.0%) and females with 2 vehicles (307, making up 56.3%).
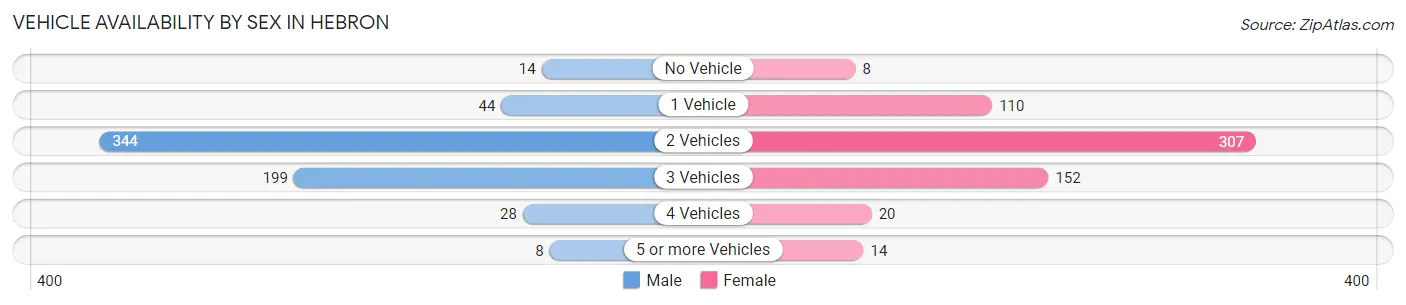
| Vehicles Available | Male | Female |
| No Vehicle | 14 (2.2%) | 8 (1.3%) |
| 1 Vehicle | 44 (6.9%) | 110 (18.0%) |
| 2 Vehicles | 344 (54.0%) | 307 (50.2%) |
| 3 Vehicles | 199 (31.2%) | 152 (24.9%) |
| 4 Vehicles | 28 (4.4%) | 20 (3.3%) |
| 5 or more Vehicles | 8 (1.3%) | 14 (2.3%) |
| Total | 637 (100.0%) | 611 (100.0%) |
Commute Time in Hebron
The most frequently occuring commute durations in Hebron are 20 to 24 minutes (275 commuters, 24.3%), 10 to 14 minutes (172 commuters, 15.2%), and 45 to 59 minutes (142 commuters, 12.6%).
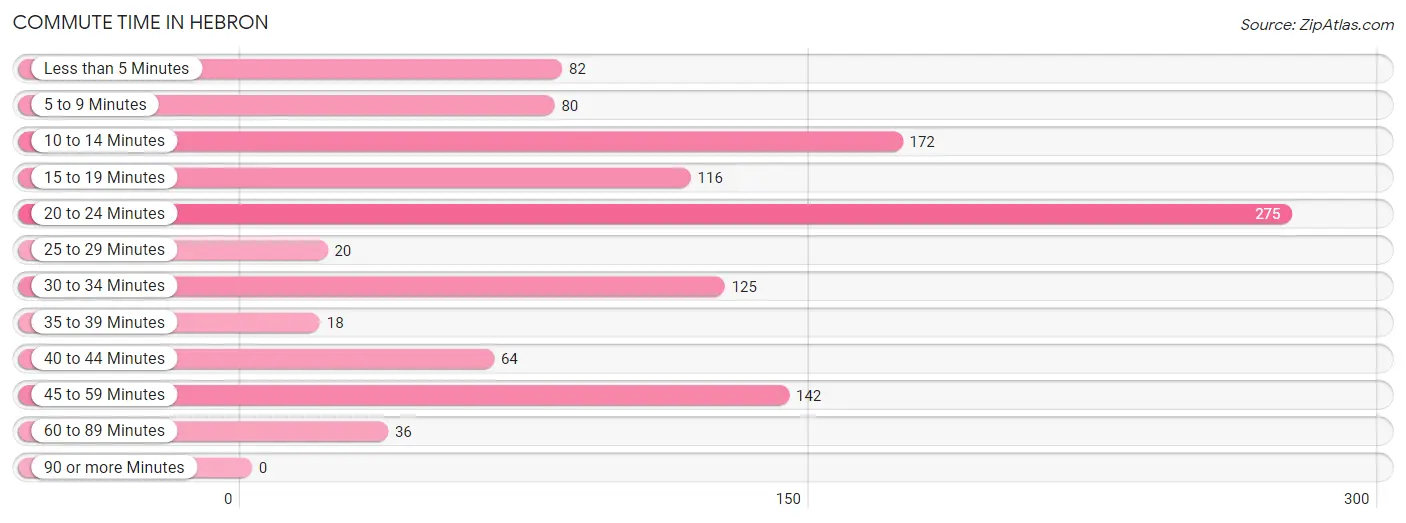
| Commute Time | # Commuters | % Commuters |
| Less than 5 Minutes | 82 | 7.3% |
| 5 to 9 Minutes | 80 | 7.1% |
| 10 to 14 Minutes | 172 | 15.2% |
| 15 to 19 Minutes | 116 | 10.3% |
| 20 to 24 Minutes | 275 | 24.3% |
| 25 to 29 Minutes | 20 | 1.8% |
| 30 to 34 Minutes | 125 | 11.1% |
| 35 to 39 Minutes | 18 | 1.6% |
| 40 to 44 Minutes | 64 | 5.7% |
| 45 to 59 Minutes | 142 | 12.6% |
| 60 to 89 Minutes | 36 | 3.2% |
| 90 or more Minutes | 0 | 0.0% |
Commute Time by Sex in Hebron
The most common commute times in Hebron are 20 to 24 minutes (117 commuters, 19.4%) for males and 20 to 24 minutes (158 commuters, 29.9%) for females.
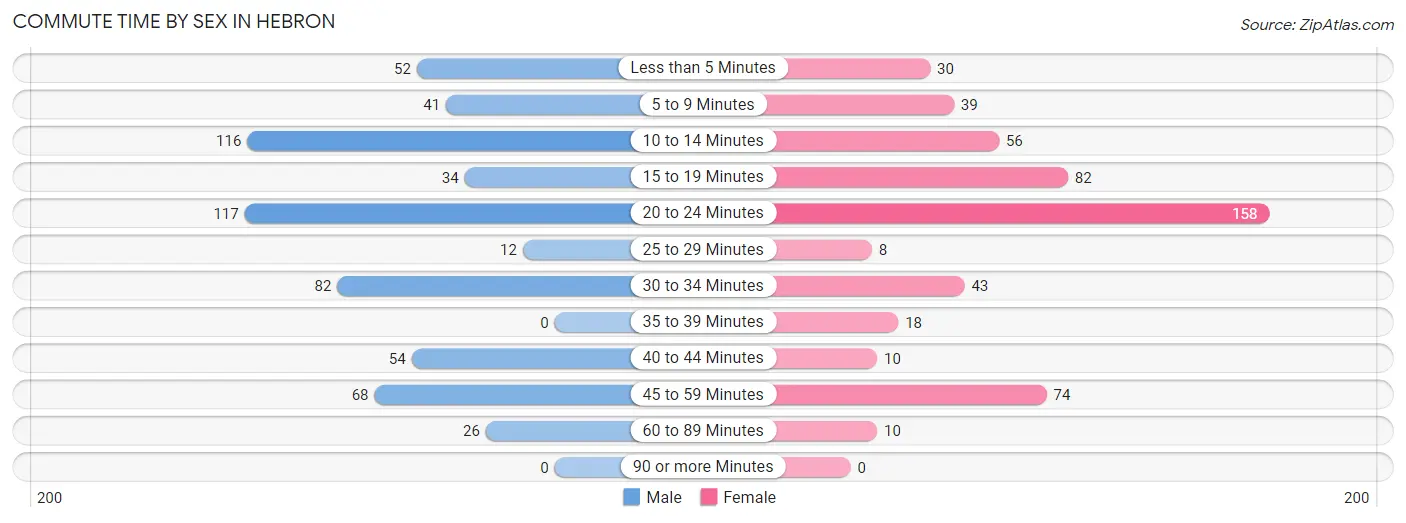
| Commute Time | Male | Female |
| Less than 5 Minutes | 52 (8.6%) | 30 (5.7%) |
| 5 to 9 Minutes | 41 (6.8%) | 39 (7.4%) |
| 10 to 14 Minutes | 116 (19.3%) | 56 (10.6%) |
| 15 to 19 Minutes | 34 (5.7%) | 82 (15.5%) |
| 20 to 24 Minutes | 117 (19.4%) | 158 (29.9%) |
| 25 to 29 Minutes | 12 (2.0%) | 8 (1.5%) |
| 30 to 34 Minutes | 82 (13.6%) | 43 (8.1%) |
| 35 to 39 Minutes | 0 (0.0%) | 18 (3.4%) |
| 40 to 44 Minutes | 54 (9.0%) | 10 (1.9%) |
| 45 to 59 Minutes | 68 (11.3%) | 74 (14.0%) |
| 60 to 89 Minutes | 26 (4.3%) | 10 (1.9%) |
| 90 or more Minutes | 0 (0.0%) | 0 (0.0%) |
Time of Departure to Work by Sex in Hebron
The most frequent times of departure to work in Hebron are 12:00 PM to 3:59 PM (102, 16.9%) for males and 12:00 AM to 4:59 AM (75, 14.2%) for females.
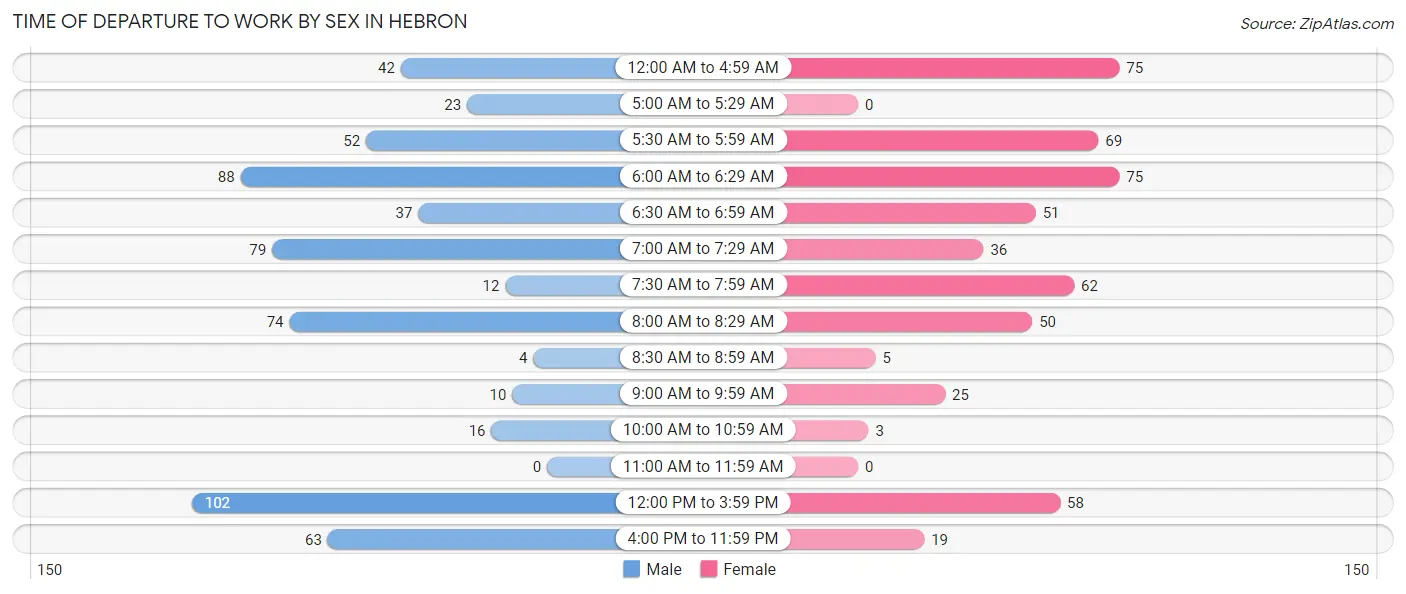
| Time of Departure | Male | Female |
| 12:00 AM to 4:59 AM | 42 (7.0%) | 75 (14.2%) |
| 5:00 AM to 5:29 AM | 23 (3.8%) | 0 (0.0%) |
| 5:30 AM to 5:59 AM | 52 (8.6%) | 69 (13.1%) |
| 6:00 AM to 6:29 AM | 88 (14.6%) | 75 (14.2%) |
| 6:30 AM to 6:59 AM | 37 (6.1%) | 51 (9.7%) |
| 7:00 AM to 7:29 AM | 79 (13.1%) | 36 (6.8%) |
| 7:30 AM to 7:59 AM | 12 (2.0%) | 62 (11.7%) |
| 8:00 AM to 8:29 AM | 74 (12.3%) | 50 (9.5%) |
| 8:30 AM to 8:59 AM | 4 (0.7%) | 5 (0.9%) |
| 9:00 AM to 9:59 AM | 10 (1.7%) | 25 (4.7%) |
| 10:00 AM to 10:59 AM | 16 (2.7%) | 3 (0.6%) |
| 11:00 AM to 11:59 AM | 0 (0.0%) | 0 (0.0%) |
| 12:00 PM to 3:59 PM | 102 (16.9%) | 58 (11.0%) |
| 4:00 PM to 11:59 PM | 63 (10.5%) | 19 (3.6%) |
| Total | 602 (100.0%) | 528 (100.0%) |
Housing Occupancy in Hebron
Occupancy by Ownership in Hebron
Of the total 991 dwellings in Hebron, owner-occupied units account for 554 (55.9%), while renter-occupied units make up 437 (44.1%).
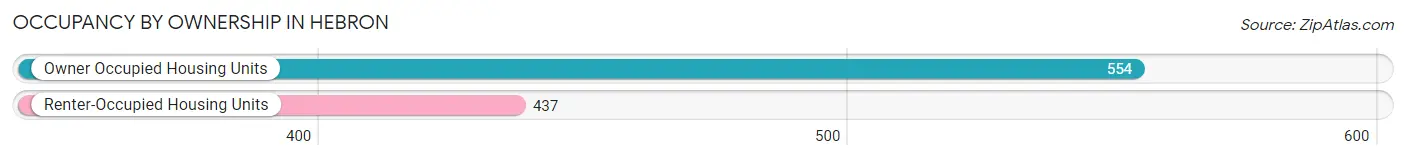
| Occupancy | # Housing Units | % Housing Units |
| Owner Occupied Housing Units | 554 | 55.9% |
| Renter-Occupied Housing Units | 437 | 44.1% |
| Total Occupied Housing Units | 991 | 100.0% |
Occupancy by Household Size in Hebron
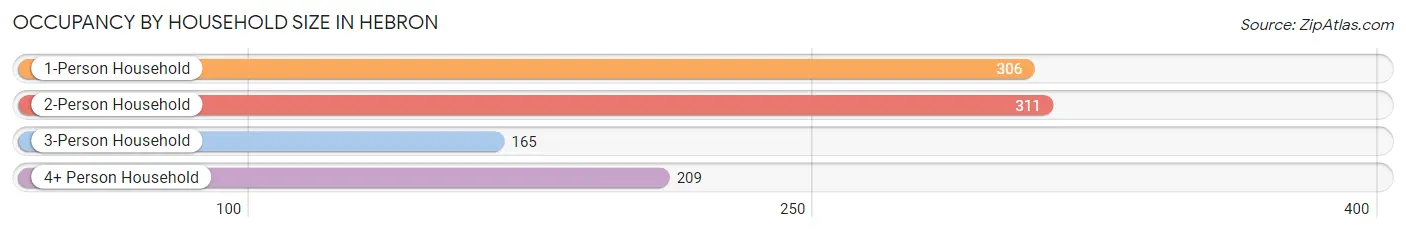
| Household Size | # Housing Units | % Housing Units |
| 1-Person Household | 306 | 30.9% |
| 2-Person Household | 311 | 31.4% |
| 3-Person Household | 165 | 16.7% |
| 4+ Person Household | 209 | 21.1% |
| Total Housing Units | 991 | 100.0% |
Occupancy by Ownership by Household Size in Hebron
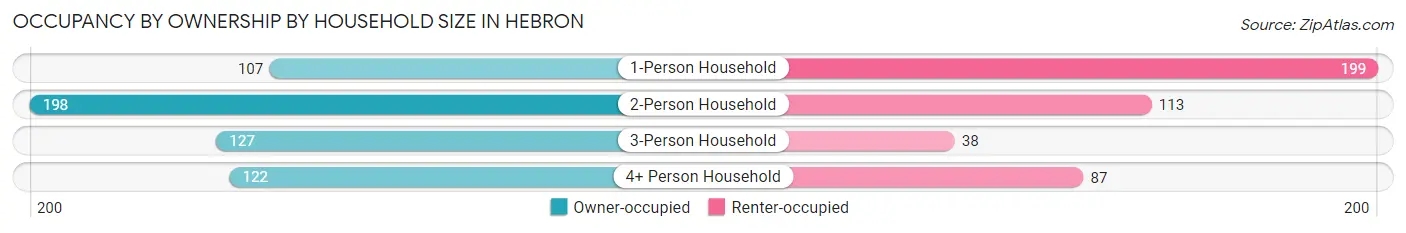
| Household Size | Owner-occupied | Renter-occupied |
| 1-Person Household | 107 (35.0%) | 199 (65.0%) |
| 2-Person Household | 198 (63.7%) | 113 (36.3%) |
| 3-Person Household | 127 (77.0%) | 38 (23.0%) |
| 4+ Person Household | 122 (58.4%) | 87 (41.6%) |
| Total Housing Units | 554 (55.9%) | 437 (44.1%) |
Occupancy by Educational Attainment in Hebron
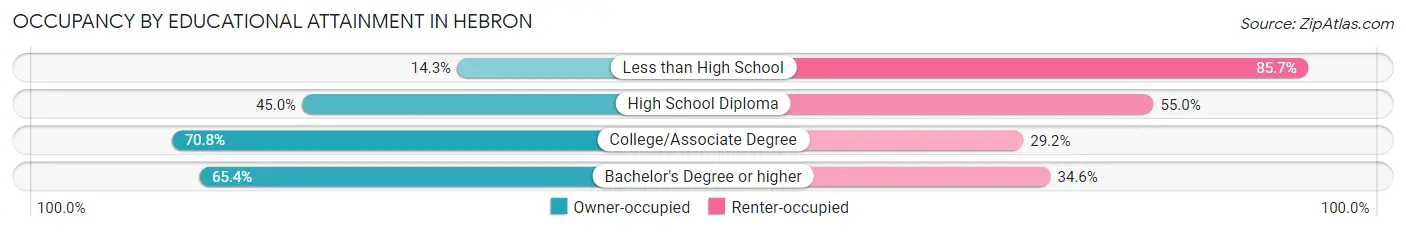
| Household Size | Owner-occupied | Renter-occupied |
| Less than High School | 8 (14.3%) | 48 (85.7%) |
| High School Diploma | 185 (45.0%) | 226 (55.0%) |
| College/Associate Degree | 238 (70.8%) | 98 (29.2%) |
| Bachelor's Degree or higher | 123 (65.4%) | 65 (34.6%) |
Occupancy by Age of Householder in Hebron
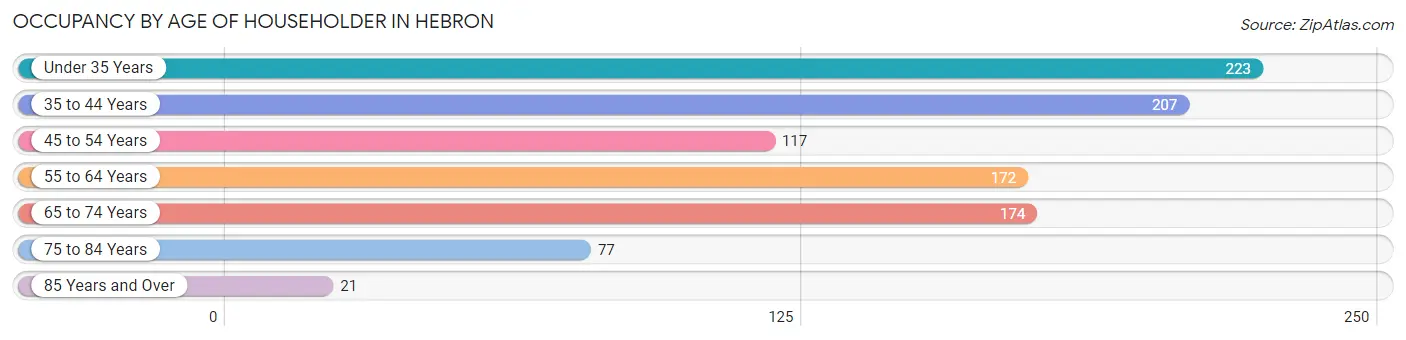
| Age Bracket | # Households | % Households |
| Under 35 Years | 223 | 22.5% |
| 35 to 44 Years | 207 | 20.9% |
| 45 to 54 Years | 117 | 11.8% |
| 55 to 64 Years | 172 | 17.4% |
| 65 to 74 Years | 174 | 17.6% |
| 75 to 84 Years | 77 | 7.8% |
| 85 Years and Over | 21 | 2.1% |
| Total | 991 | 100.0% |
Housing Finances in Hebron
Median Income by Occupancy in Hebron
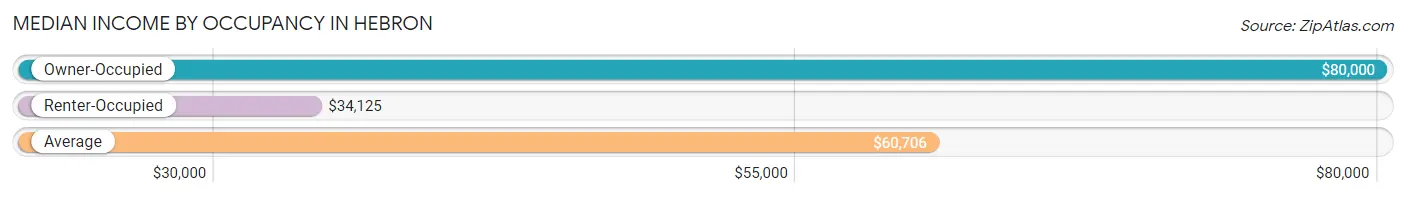
| Occupancy Type | # Households | Median Income |
| Owner-Occupied | 554 (55.9%) | $80,000 |
| Renter-Occupied | 437 (44.1%) | $34,125 |
| Average | 991 (100.0%) | $60,706 |
Occupancy by Householder Income Bracket in Hebron
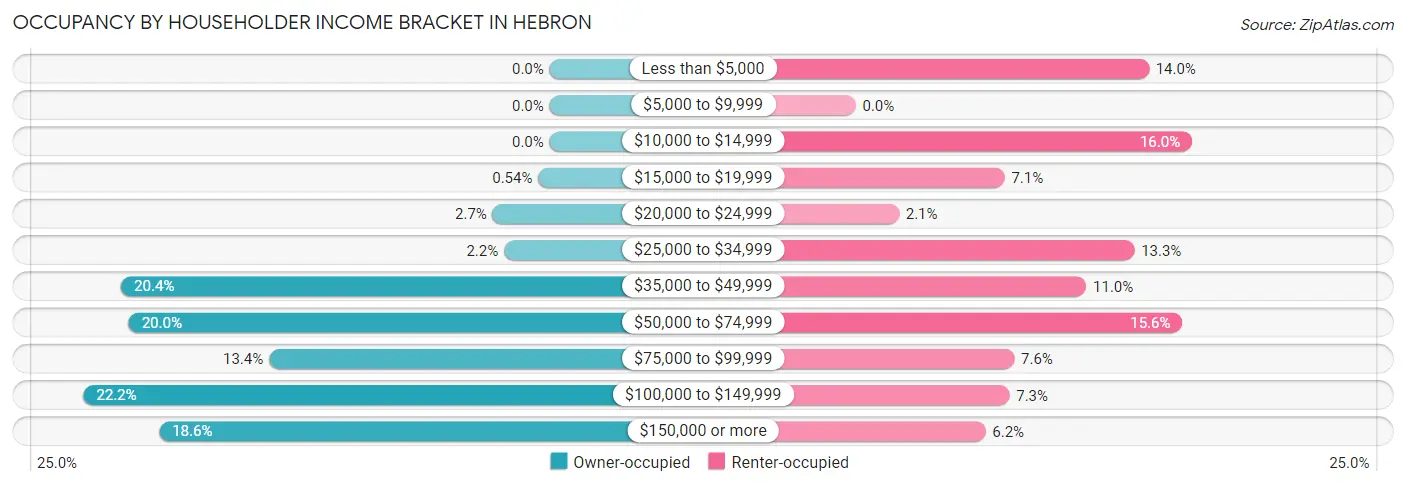
| Income Bracket | Owner-occupied | Renter-occupied |
| Less than $5,000 | 0 (0.0%) | 61 (14.0%) |
| $5,000 to $9,999 | 0 (0.0%) | 0 (0.0%) |
| $10,000 to $14,999 | 0 (0.0%) | 70 (16.0%) |
| $15,000 to $19,999 | 3 (0.5%) | 31 (7.1%) |
| $20,000 to $24,999 | 15 (2.7%) | 9 (2.1%) |
| $25,000 to $34,999 | 12 (2.2%) | 58 (13.3%) |
| $35,000 to $49,999 | 113 (20.4%) | 48 (11.0%) |
| $50,000 to $74,999 | 111 (20.0%) | 68 (15.6%) |
| $75,000 to $99,999 | 74 (13.4%) | 33 (7.5%) |
| $100,000 to $149,999 | 123 (22.2%) | 32 (7.3%) |
| $150,000 or more | 103 (18.6%) | 27 (6.2%) |
| Total | 554 (100.0%) | 437 (100.0%) |
Monthly Housing Cost Tiers in Hebron
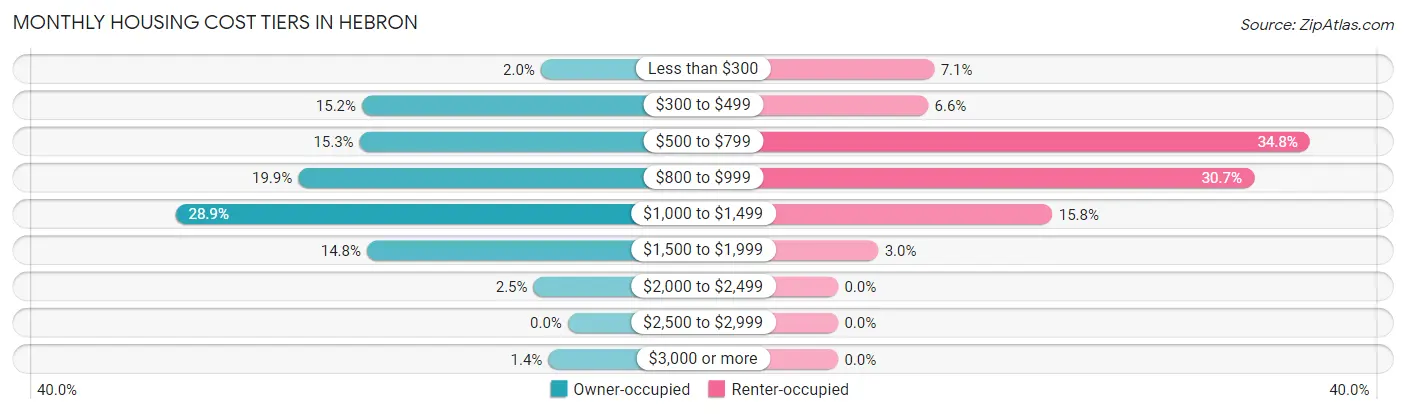
| Monthly Cost | Owner-occupied | Renter-occupied |
| Less than $300 | 11 (2.0%) | 31 (7.1%) |
| $300 to $499 | 84 (15.2%) | 29 (6.6%) |
| $500 to $799 | 85 (15.3%) | 152 (34.8%) |
| $800 to $999 | 110 (19.9%) | 134 (30.7%) |
| $1,000 to $1,499 | 160 (28.9%) | 69 (15.8%) |
| $1,500 to $1,999 | 82 (14.8%) | 13 (3.0%) |
| $2,000 to $2,499 | 14 (2.5%) | 0 (0.0%) |
| $2,500 to $2,999 | 0 (0.0%) | 0 (0.0%) |
| $3,000 or more | 8 (1.4%) | 0 (0.0%) |
| Total | 554 (100.0%) | 437 (100.0%) |
Physical Housing Characteristics in Hebron
Housing Structures in Hebron
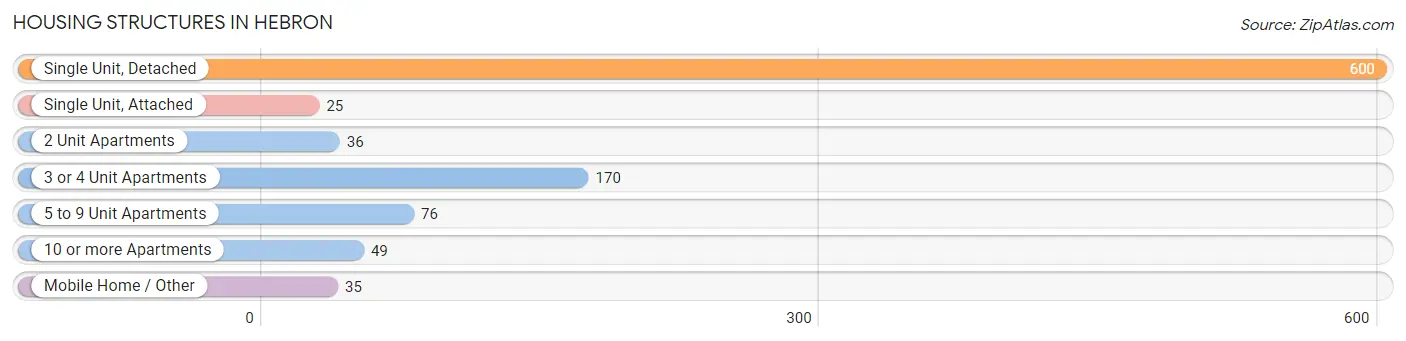
| Structure Type | # Housing Units | % Housing Units |
| Single Unit, Detached | 600 | 60.5% |
| Single Unit, Attached | 25 | 2.5% |
| 2 Unit Apartments | 36 | 3.6% |
| 3 or 4 Unit Apartments | 170 | 17.2% |
| 5 to 9 Unit Apartments | 76 | 7.7% |
| 10 or more Apartments | 49 | 4.9% |
| Mobile Home / Other | 35 | 3.5% |
| Total | 991 | 100.0% |
Housing Structures by Occupancy in Hebron
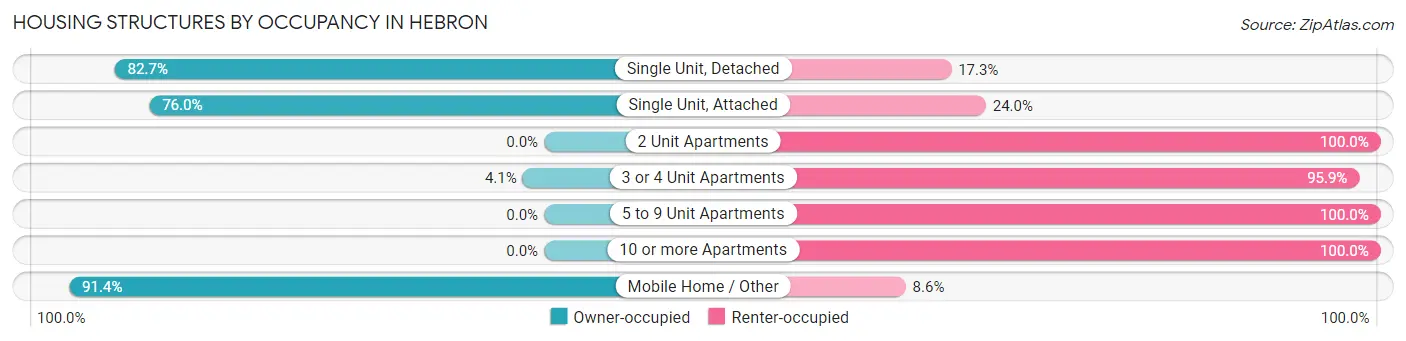
| Structure Type | Owner-occupied | Renter-occupied |
| Single Unit, Detached | 496 (82.7%) | 104 (17.3%) |
| Single Unit, Attached | 19 (76.0%) | 6 (24.0%) |
| 2 Unit Apartments | 0 (0.0%) | 36 (100.0%) |
| 3 or 4 Unit Apartments | 7 (4.1%) | 163 (95.9%) |
| 5 to 9 Unit Apartments | 0 (0.0%) | 76 (100.0%) |
| 10 or more Apartments | 0 (0.0%) | 49 (100.0%) |
| Mobile Home / Other | 32 (91.4%) | 3 (8.6%) |
| Total | 554 (55.9%) | 437 (44.1%) |
Housing Structures by Number of Rooms in Hebron
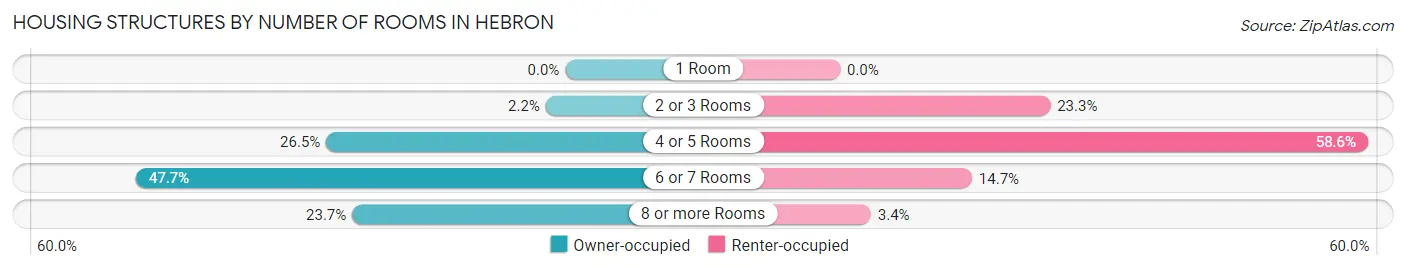
| Number of Rooms | Owner-occupied | Renter-occupied |
| 1 Room | 0 (0.0%) | 0 (0.0%) |
| 2 or 3 Rooms | 12 (2.2%) | 102 (23.3%) |
| 4 or 5 Rooms | 147 (26.5%) | 256 (58.6%) |
| 6 or 7 Rooms | 264 (47.6%) | 64 (14.6%) |
| 8 or more Rooms | 131 (23.6%) | 15 (3.4%) |
| Total | 554 (100.0%) | 437 (100.0%) |
Housing Structure by Heating Type in Hebron
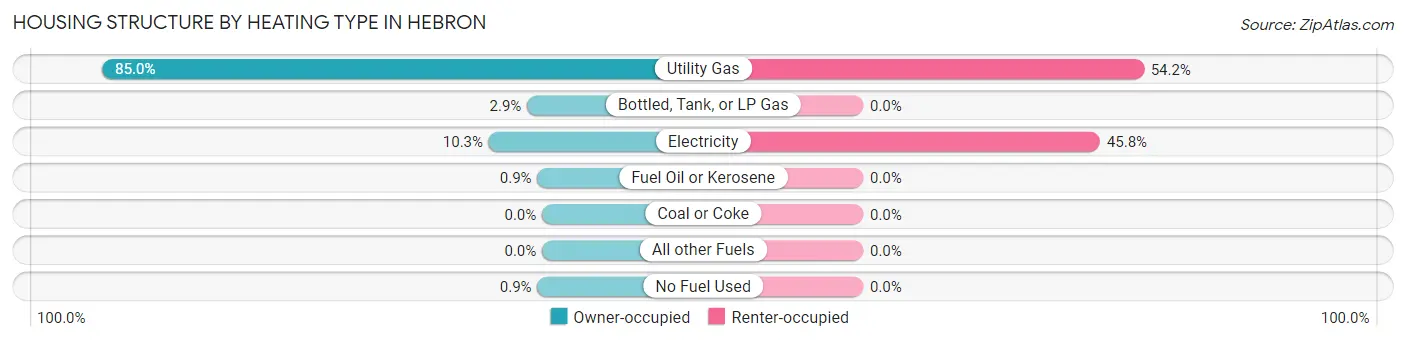
| Heating Type | Owner-occupied | Renter-occupied |
| Utility Gas | 471 (85.0%) | 237 (54.2%) |
| Bottled, Tank, or LP Gas | 16 (2.9%) | 0 (0.0%) |
| Electricity | 57 (10.3%) | 200 (45.8%) |
| Fuel Oil or Kerosene | 5 (0.9%) | 0 (0.0%) |
| Coal or Coke | 0 (0.0%) | 0 (0.0%) |
| All other Fuels | 0 (0.0%) | 0 (0.0%) |
| No Fuel Used | 5 (0.9%) | 0 (0.0%) |
| Total | 554 (100.0%) | 437 (100.0%) |
Household Vehicle Usage in Hebron
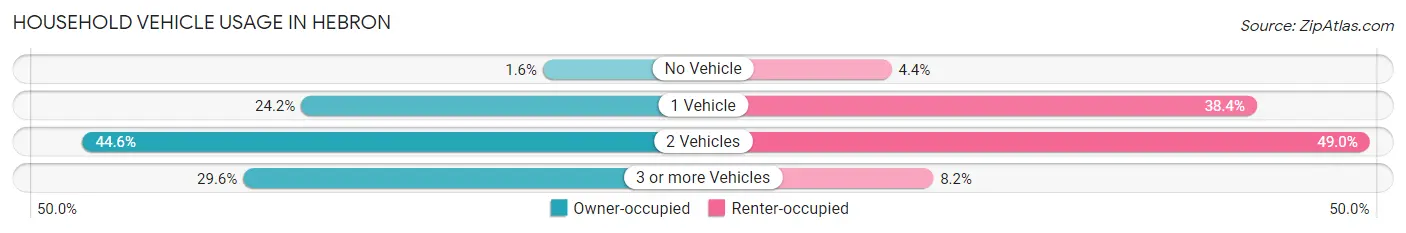
| Vehicles per Household | Owner-occupied | Renter-occupied |
| No Vehicle | 9 (1.6%) | 19 (4.3%) |
| 1 Vehicle | 134 (24.2%) | 168 (38.4%) |
| 2 Vehicles | 247 (44.6%) | 214 (49.0%) |
| 3 or more Vehicles | 164 (29.6%) | 36 (8.2%) |
| Total | 554 (100.0%) | 437 (100.0%) |
Real Estate & Mortgages in Hebron
Real Estate and Mortgage Overview in Hebron
| Characteristic | Without Mortgage | With Mortgage |
| Housing Units | 158 | 396 |
| Median Property Value | $157,000 | $161,800 |
| Median Household Income | $72,969 | $52 |
| Monthly Housing Costs | $480 | $8 |
| Real Estate Taxes | $1,471 | $13 |
Property Value by Mortgage Status in Hebron
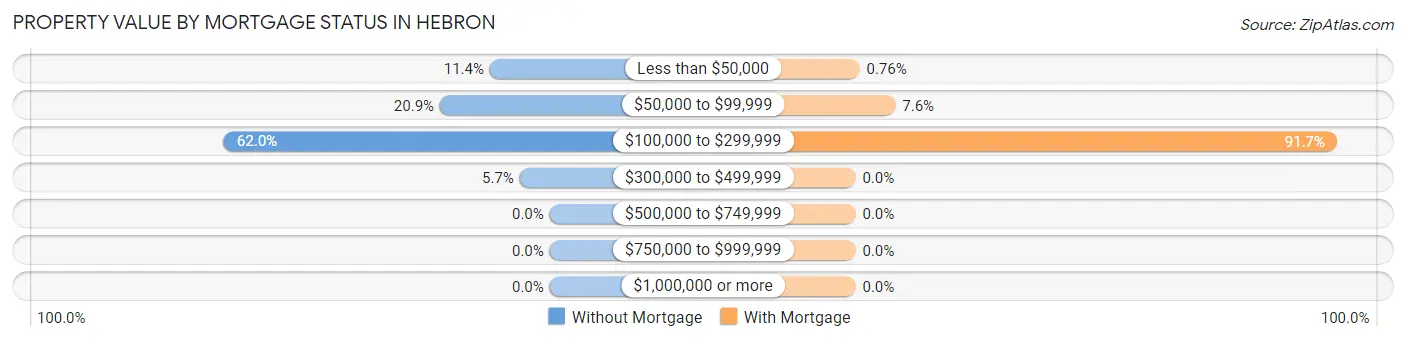
| Property Value | Without Mortgage | With Mortgage |
| Less than $50,000 | 18 (11.4%) | 3 (0.8%) |
| $50,000 to $99,999 | 33 (20.9%) | 30 (7.6%) |
| $100,000 to $299,999 | 98 (62.0%) | 363 (91.7%) |
| $300,000 to $499,999 | 9 (5.7%) | 0 (0.0%) |
| $500,000 to $749,999 | 0 (0.0%) | 0 (0.0%) |
| $750,000 to $999,999 | 0 (0.0%) | 0 (0.0%) |
| $1,000,000 or more | 0 (0.0%) | 0 (0.0%) |
| Total | 158 (100.0%) | 396 (100.0%) |
Household Income by Mortgage Status in Hebron
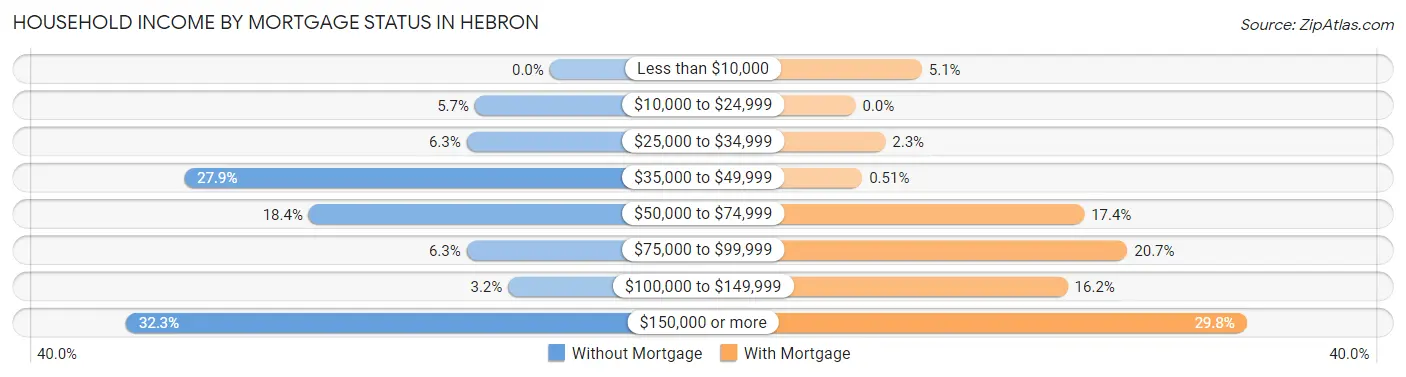
| Household Income | Without Mortgage | With Mortgage |
| Less than $10,000 | 0 (0.0%) | 20 (5.1%) |
| $10,000 to $24,999 | 9 (5.7%) | 0 (0.0%) |
| $25,000 to $34,999 | 10 (6.3%) | 9 (2.3%) |
| $35,000 to $49,999 | 44 (27.9%) | 2 (0.5%) |
| $50,000 to $74,999 | 29 (18.3%) | 69 (17.4%) |
| $75,000 to $99,999 | 10 (6.3%) | 82 (20.7%) |
| $100,000 to $149,999 | 5 (3.2%) | 64 (16.2%) |
| $150,000 or more | 51 (32.3%) | 118 (29.8%) |
| Total | 158 (100.0%) | 396 (100.0%) |
Property Value to Household Income Ratio in Hebron
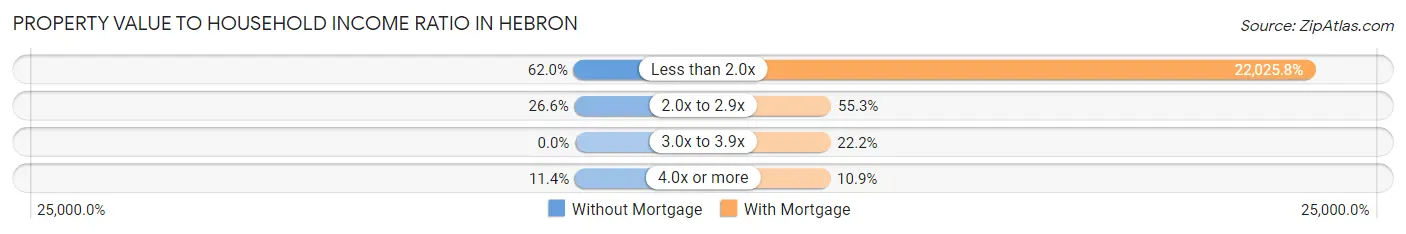
| Value-to-Income Ratio | Without Mortgage | With Mortgage |
| Less than 2.0x | 98 (62.0%) | 87,222 (22,025.8%) |
| 2.0x to 2.9x | 42 (26.6%) | 219 (55.3%) |
| 3.0x to 3.9x | 0 (0.0%) | 88 (22.2%) |
| 4.0x or more | 18 (11.4%) | 43 (10.9%) |
| Total | 158 (100.0%) | 396 (100.0%) |
Real Estate Taxes by Mortgage Status in Hebron
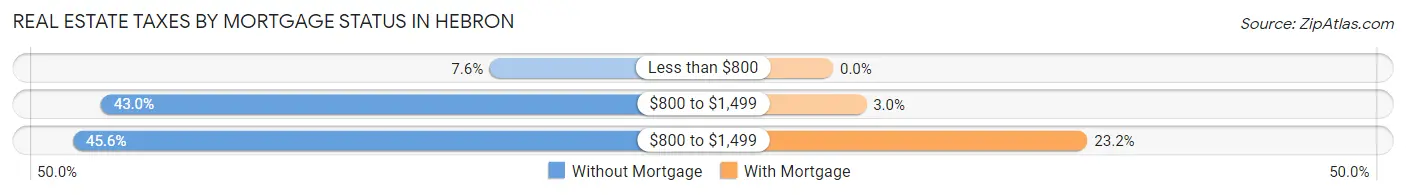
| Property Taxes | Without Mortgage | With Mortgage |
| Less than $800 | 12 (7.6%) | 0 (0.0%) |
| $800 to $1,499 | 68 (43.0%) | 12 (3.0%) |
| $800 to $1,499 | 72 (45.6%) | 92 (23.2%) |
| Total | 158 (100.0%) | 396 (100.0%) |
Health & Disability in Hebron
Health Insurance Coverage by Age in Hebron
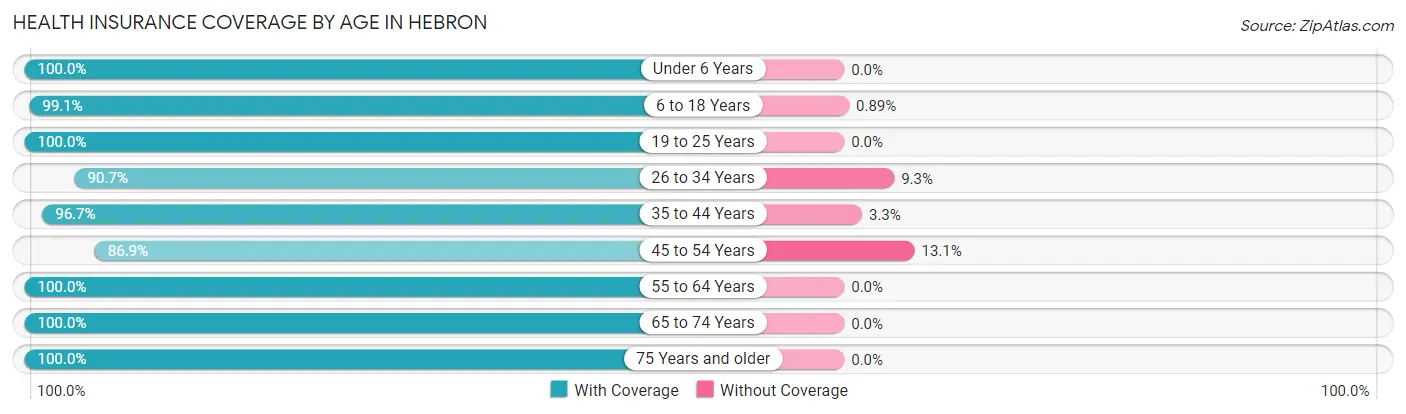
| Age Bracket | With Coverage | Without Coverage |
| Under 6 Years | 237 (100.0%) | 0 (0.0%) |
| 6 to 18 Years | 443 (99.1%) | 4 (0.9%) |
| 19 to 25 Years | 174 (100.0%) | 0 (0.0%) |
| 26 to 34 Years | 370 (90.7%) | 38 (9.3%) |
| 35 to 44 Years | 351 (96.7%) | 12 (3.3%) |
| 45 to 54 Years | 159 (86.9%) | 24 (13.1%) |
| 55 to 64 Years | 310 (100.0%) | 0 (0.0%) |
| 65 to 74 Years | 235 (100.0%) | 0 (0.0%) |
| 75 Years and older | 128 (100.0%) | 0 (0.0%) |
| Total | 2,407 (96.9%) | 78 (3.1%) |
Health Insurance Coverage by Citizenship Status in Hebron
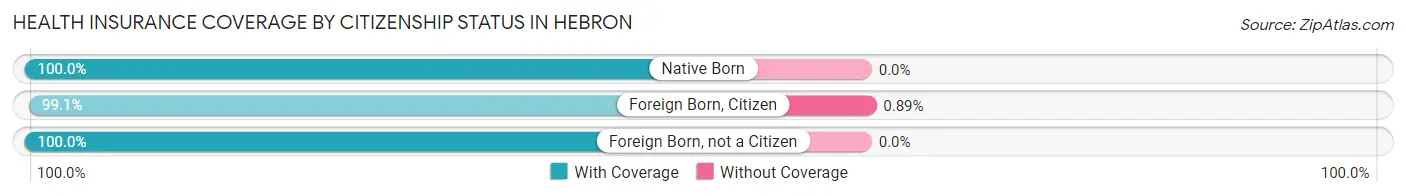
| Citizenship Status | With Coverage | Without Coverage |
| Native Born | 237 (100.0%) | 0 (0.0%) |
| Foreign Born, Citizen | 443 (99.1%) | 4 (0.9%) |
| Foreign Born, not a Citizen | 174 (100.0%) | 0 (0.0%) |
Health Insurance Coverage by Household Income in Hebron
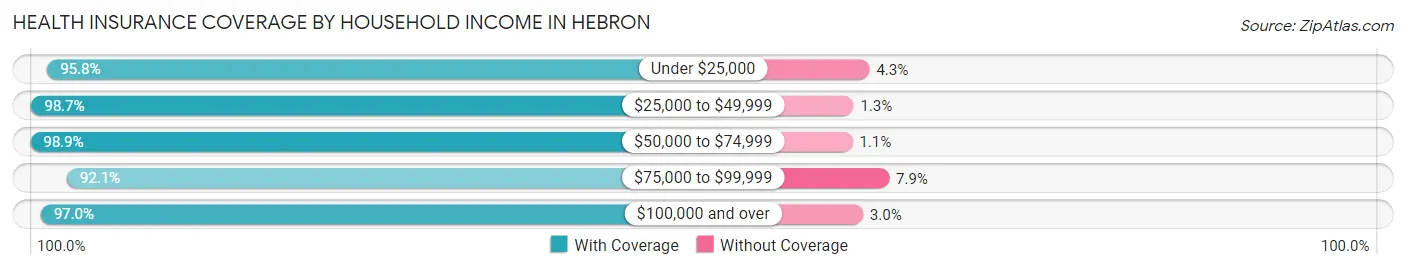
| Household Income | With Coverage | Without Coverage |
| Under $25,000 | 248 (95.8%) | 11 (4.3%) |
| $25,000 to $49,999 | 472 (98.7%) | 6 (1.3%) |
| $50,000 to $74,999 | 464 (98.9%) | 5 (1.1%) |
| $75,000 to $99,999 | 325 (92.1%) | 28 (7.9%) |
| $100,000 and over | 898 (97.0%) | 28 (3.0%) |
Public vs Private Health Insurance Coverage by Age in Hebron
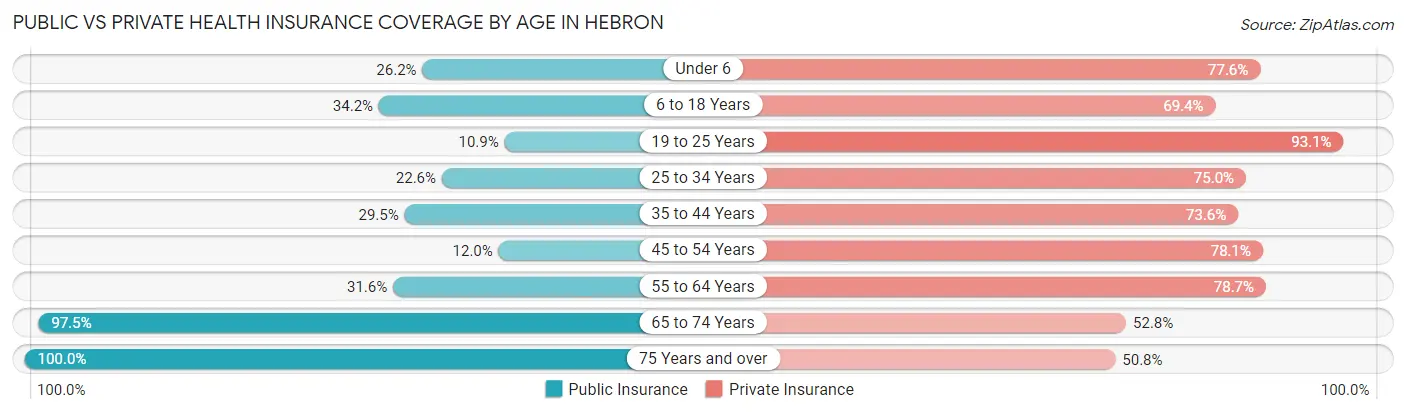
| Age Bracket | Public Insurance | Private Insurance |
| Under 6 | 62 (26.2%) | 184 (77.6%) |
| 6 to 18 Years | 153 (34.2%) | 310 (69.4%) |
| 19 to 25 Years | 19 (10.9%) | 162 (93.1%) |
| 25 to 34 Years | 92 (22.6%) | 306 (75.0%) |
| 35 to 44 Years | 107 (29.5%) | 267 (73.6%) |
| 45 to 54 Years | 22 (12.0%) | 143 (78.1%) |
| 55 to 64 Years | 98 (31.6%) | 244 (78.7%) |
| 65 to 74 Years | 229 (97.5%) | 124 (52.8%) |
| 75 Years and over | 128 (100.0%) | 65 (50.8%) |
| Total | 910 (36.6%) | 1,805 (72.6%) |
Disability Status by Sex by Age in Hebron
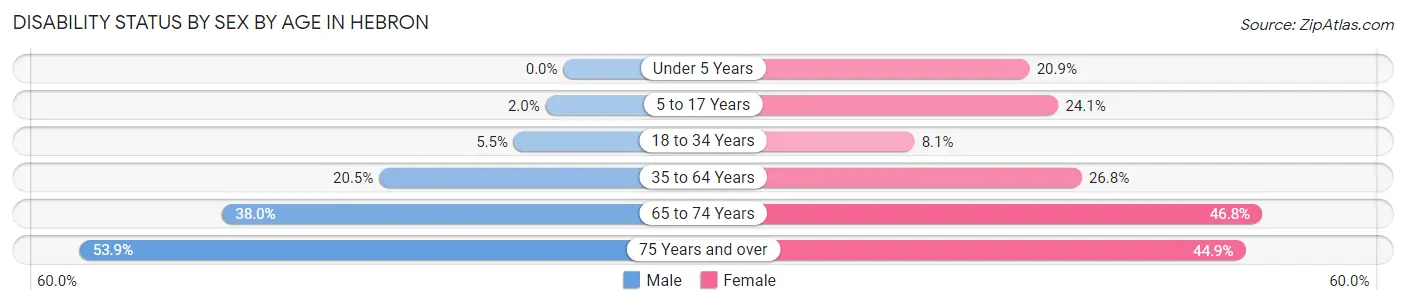
| Age Bracket | Male | Female |
| Under 5 Years | 0 (0.0%) | 9 (20.9%) |
| 5 to 17 Years | 5 (2.0%) | 42 (24.1%) |
| 18 to 34 Years | 20 (5.5%) | 22 (8.1%) |
| 35 to 64 Years | 79 (20.5%) | 126 (26.8%) |
| 65 to 74 Years | 30 (38.0%) | 73 (46.8%) |
| 75 Years and over | 21 (53.8%) | 40 (44.9%) |
Disability Class by Sex by Age in Hebron
Disability Class: Hearing Difficulty
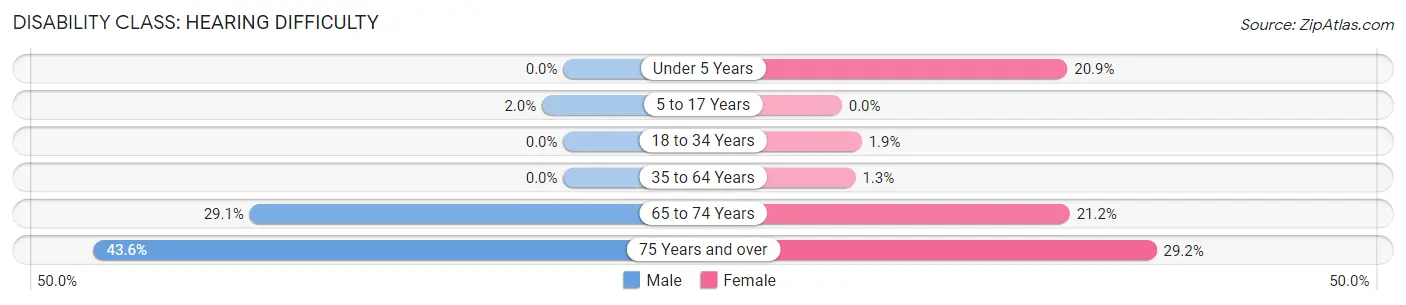
| Age Bracket | Male | Female |
| Under 5 Years | 0 (0.0%) | 9 (20.9%) |
| 5 to 17 Years | 5 (2.0%) | 0 (0.0%) |
| 18 to 34 Years | 0 (0.0%) | 5 (1.8%) |
| 35 to 64 Years | 0 (0.0%) | 6 (1.3%) |
| 65 to 74 Years | 23 (29.1%) | 33 (21.1%) |
| 75 Years and over | 17 (43.6%) | 26 (29.2%) |
Disability Class: Vision Difficulty
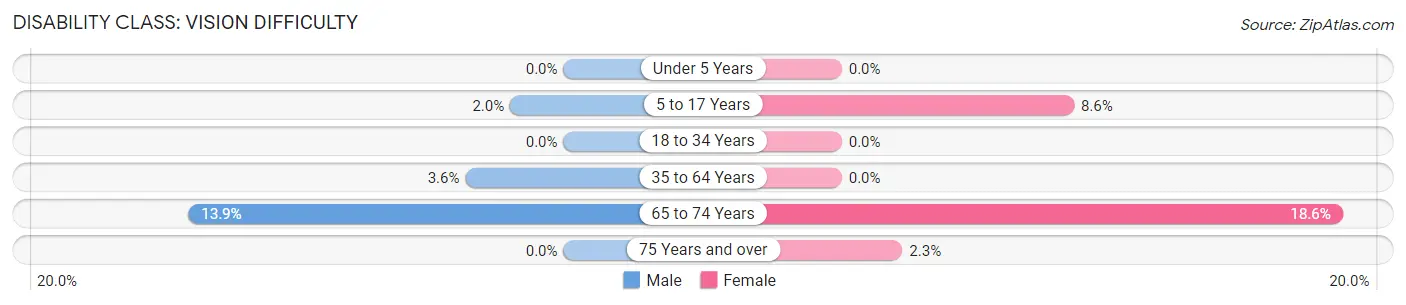
| Age Bracket | Male | Female |
| Under 5 Years | 0 (0.0%) | 0 (0.0%) |
| 5 to 17 Years | 5 (2.0%) | 15 (8.6%) |
| 18 to 34 Years | 0 (0.0%) | 0 (0.0%) |
| 35 to 64 Years | 14 (3.6%) | 0 (0.0%) |
| 65 to 74 Years | 11 (13.9%) | 29 (18.6%) |
| 75 Years and over | 0 (0.0%) | 2 (2.2%) |
Disability Class: Cognitive Difficulty
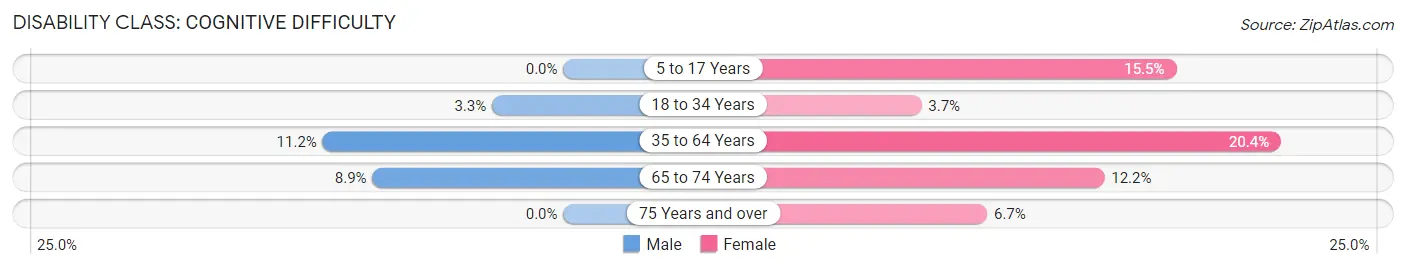
| Age Bracket | Male | Female |
| 5 to 17 Years | 0 (0.0%) | 27 (15.5%) |
| 18 to 34 Years | 12 (3.3%) | 10 (3.7%) |
| 35 to 64 Years | 43 (11.2%) | 96 (20.4%) |
| 65 to 74 Years | 7 (8.9%) | 19 (12.2%) |
| 75 Years and over | 0 (0.0%) | 6 (6.7%) |
Disability Class: Ambulatory Difficulty
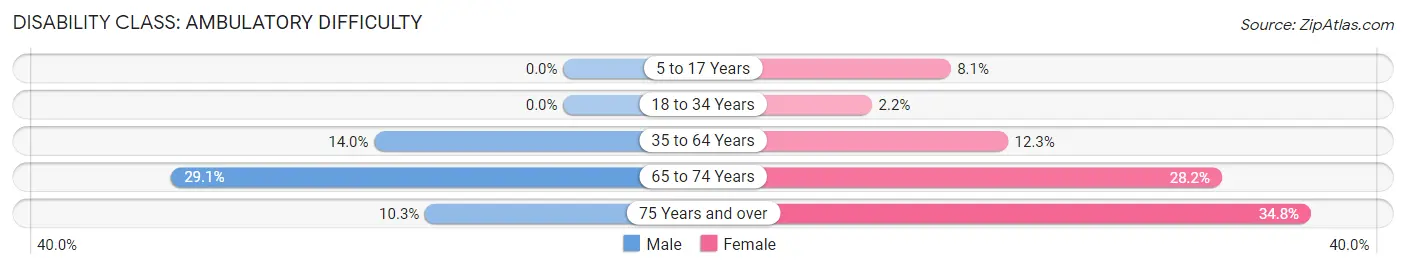
| Age Bracket | Male | Female |
| 5 to 17 Years | 0 (0.0%) | 14 (8.1%) |
| 18 to 34 Years | 0 (0.0%) | 6 (2.2%) |
| 35 to 64 Years | 54 (14.0%) | 58 (12.3%) |
| 65 to 74 Years | 23 (29.1%) | 44 (28.2%) |
| 75 Years and over | 4 (10.3%) | 31 (34.8%) |
Disability Class: Self-Care Difficulty
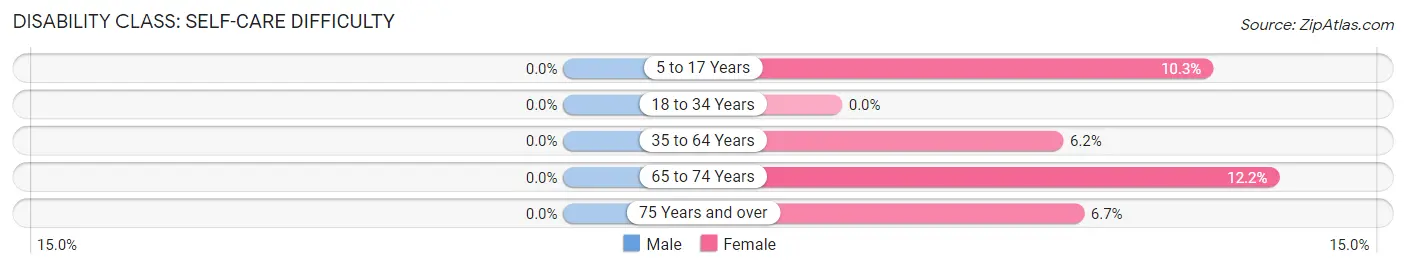
| Age Bracket | Male | Female |
| 5 to 17 Years | 0 (0.0%) | 18 (10.3%) |
| 18 to 34 Years | 0 (0.0%) | 0 (0.0%) |
| 35 to 64 Years | 0 (0.0%) | 29 (6.2%) |
| 65 to 74 Years | 0 (0.0%) | 19 (12.2%) |
| 75 Years and over | 0 (0.0%) | 6 (6.7%) |
Technology Access in Hebron
Computing Device Access in Hebron
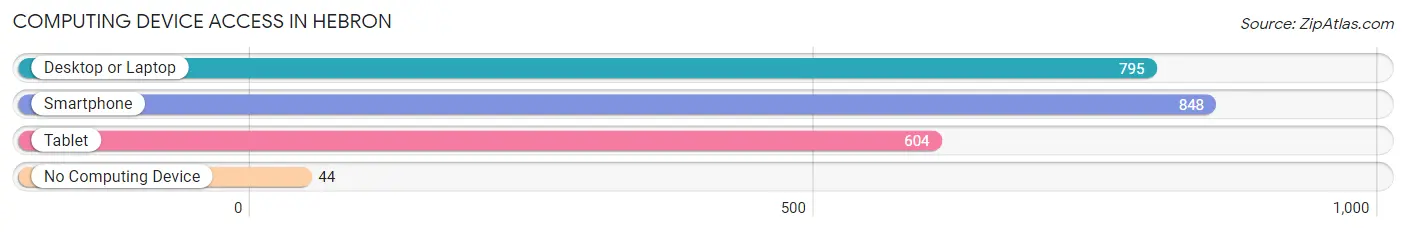
| Device Type | # Households | % Households |
| Desktop or Laptop | 795 | 80.2% |
| Smartphone | 848 | 85.6% |
| Tablet | 604 | 61.0% |
| No Computing Device | 44 | 4.4% |
| Total | 991 | 100.0% |
Internet Access in Hebron
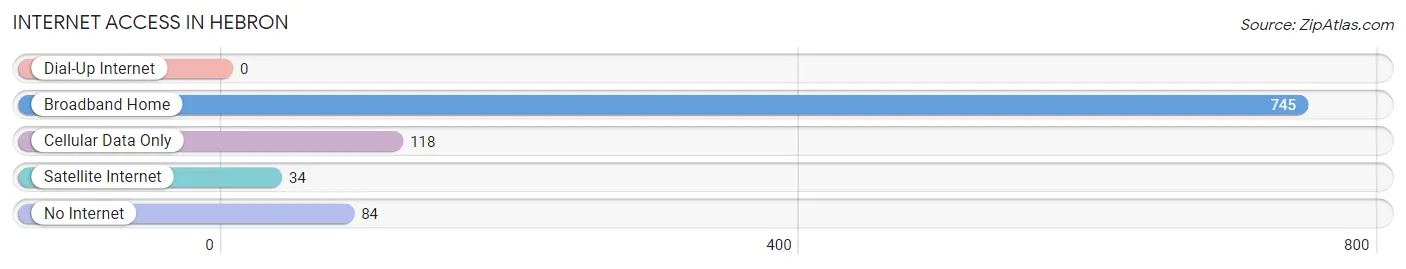
| Internet Type | # Households | % Households |
| Dial-Up Internet | 0 | 0.0% |
| Broadband Home | 745 | 75.2% |
| Cellular Data Only | 118 | 11.9% |
| Satellite Internet | 34 | 3.4% |
| No Internet | 84 | 8.5% |
| Total | 991 | 100.0% |
Hebron Summary
Hebron, Ohio is a small village located in Licking County, Ohio, United States. It is situated along the Licking River, approximately 25 miles east of Columbus. The population was 2,746 at the 2010 census.
History
Hebron was founded in 1805 by a group of settlers from Pennsylvania. The village was named after the biblical city of Hebron, which is located in the West Bank. The first settlers were mostly of German descent and were attracted to the area by the abundance of natural resources. The village was incorporated in 1817 and quickly became a thriving agricultural community.
In the late 19th century, Hebron began to experience a period of growth and development. The village was connected to the outside world by the Columbus and Toledo Railroad in 1871, and the first post office was established in 1872. The village also saw the construction of several churches, a school, and a number of businesses.
Geography
Hebron is located at 40°14'17" North, 82°30'45" West (40.238, -82.512). According to the United States Census Bureau, the village has a total area of 1.2 square miles, all of it land.
Economy
Hebron’s economy is largely based on agriculture and light manufacturing. The village is home to several small businesses, including a grocery store, a hardware store, and a few restaurants. The village also has a few small industrial parks, which are home to a variety of light manufacturing companies.
Demographics
As of the 2010 census, there were 2,746 people, 1,093 households, and 790 families residing in the village. The population density was 2,288.3 people per square mile. The racial makeup of the village was 97.2% White, 0.7% African American, 0.2% Native American, 0.3% Asian, 0.2% from other races, and 1.5% from two or more races. Hispanic or Latino of any race were 1.2% of the population.
The median income for a household in the village was $45,938, and the median income for a family was $54,917. Males had a median income of $41,964 versus $30,917 for females. The per capita income for the village was $20,945. About 4.2% of families and 5.7% of the population were below the poverty line, including 7.2% of those under age 18 and 4.2% of those age 65 or over.
Hebron is served by the Licking Valley Local School District. The village is home to two elementary schools, one middle school, and one high school. The village also has a public library and a number of parks and recreational facilities.
Common Questions
What is Per Capita Income in Hebron?
Per Capita income in Hebron is $32,241.
What is the Median Family Income in Hebron?
Median Family Income in Hebron is $69,500.
What is the Median Household income in Hebron?
Median Household Income in Hebron is $60,706.
What is Income or Wage Gap in Hebron?
Income or Wage Gap in Hebron is 26.8%.
Women in Hebron earn 73.2 cents for every dollar earned by a man.
What is Inequality or Gini Index in Hebron?
Inequality or Gini Index in Hebron is 0.43.
What is the Total Population of Hebron?
Total Population of Hebron is 2,485.
What is the Total Male Population of Hebron?
Total Male Population of Hebron is 1,281.
What is the Total Female Population of Hebron?
Total Female Population of Hebron is 1,204.
What is the Ratio of Males per 100 Females in Hebron?
There are 106.40 Males per 100 Females in Hebron.
What is the Ratio of Females per 100 Males in Hebron?
There are 93.99 Females per 100 Males in Hebron.
What is the Median Population Age in Hebron?
Median Population Age in Hebron is 34.7 Years.
What is the Average Family Size in Hebron
Average Family Size in Hebron is 3.1 People.
What is the Average Household Size in Hebron
Average Household Size in Hebron is 2.5 People.
How Large is the Labor Force in Hebron?
There are 1,340 People in the Labor Forcein in Hebron.
What is the Percentage of People in the Labor Force in Hebron?
70.2% of People are in the Labor Force in Hebron.
What is the Unemployment Rate in Hebron?
Unemployment Rate in Hebron is 5.4%.