Heath, OH Map & Demographics
Heath Map
Heath Overview
$36,247
PER CAPITA INCOME
$96,053
AVG FAMILY INCOME
$75,822
AVG HOUSEHOLD INCOME
19.2%
WAGE / INCOME GAP [ % ]
80.8¢/ $1
WAGE / INCOME GAP [ $ ]
0.41
INEQUALITY / GINI INDEX
10,492
TOTAL POPULATION
4,846
MALE POPULATION
5,646
FEMALE POPULATION
85.83
MALES / 100 FEMALES
116.51
FEMALES / 100 MALES
42.0
MEDIAN AGE
3.1
AVG FAMILY SIZE
2.5
AVG HOUSEHOLD SIZE
4,824
LABOR FORCE [ PEOPLE ]
59.4%
PERCENT IN LABOR FORCE
3.2%
UNEMPLOYMENT RATE
Heath Zip Codes
Heath Area Codes
Income in Heath
Income Overview in Heath
Per Capita Income in Heath is $36,247, while median incomes of families and households are $96,053 and $75,822 respectively.
| Characteristic | Number | Measure |
| Per Capita Income | 10,492 | $36,247 |
| Median Family Income | 2,610 | $96,053 |
| Mean Family Income | 2,610 | $107,457 |
| Median Household Income | 4,085 | $75,822 |
| Mean Household Income | 4,085 | $89,785 |
| Income Deficit | 2,610 | $0 |
| Wage / Income Gap (%) | 10,492 | 19.15% |
| Wage / Income Gap ($) | 10,492 | 80.85¢ per $1 |
| Gini / Inequality Index | 10,492 | 0.41 |
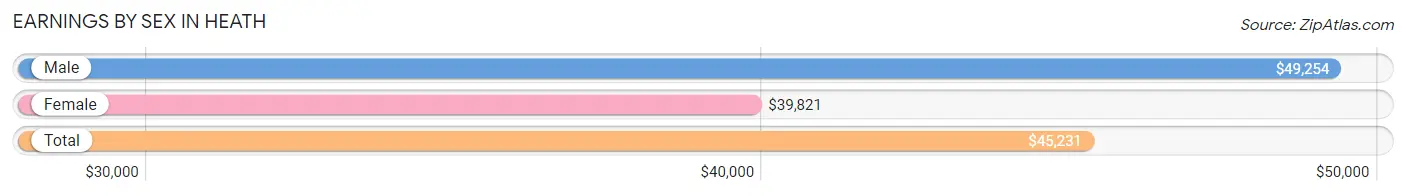
Earnings by Sex in Heath
Average Earnings in Heath are $45,231, $49,254 for men and $39,821 for women, a difference of 19.2%.
| Sex | Number | Average Earnings |
| Male | 2,745 (53.5%) | $49,254 |
| Female | 2,388 (46.5%) | $39,821 |
| Total | 5,133 (100.0%) | $45,231 |
Earnings by Sex by Income Bracket in Heath
The most common earnings brackets in Heath are $55,000 to $64,999 for men (418 | 15.2%) and $75,000 to $99,999 for women (224 | 9.4%).
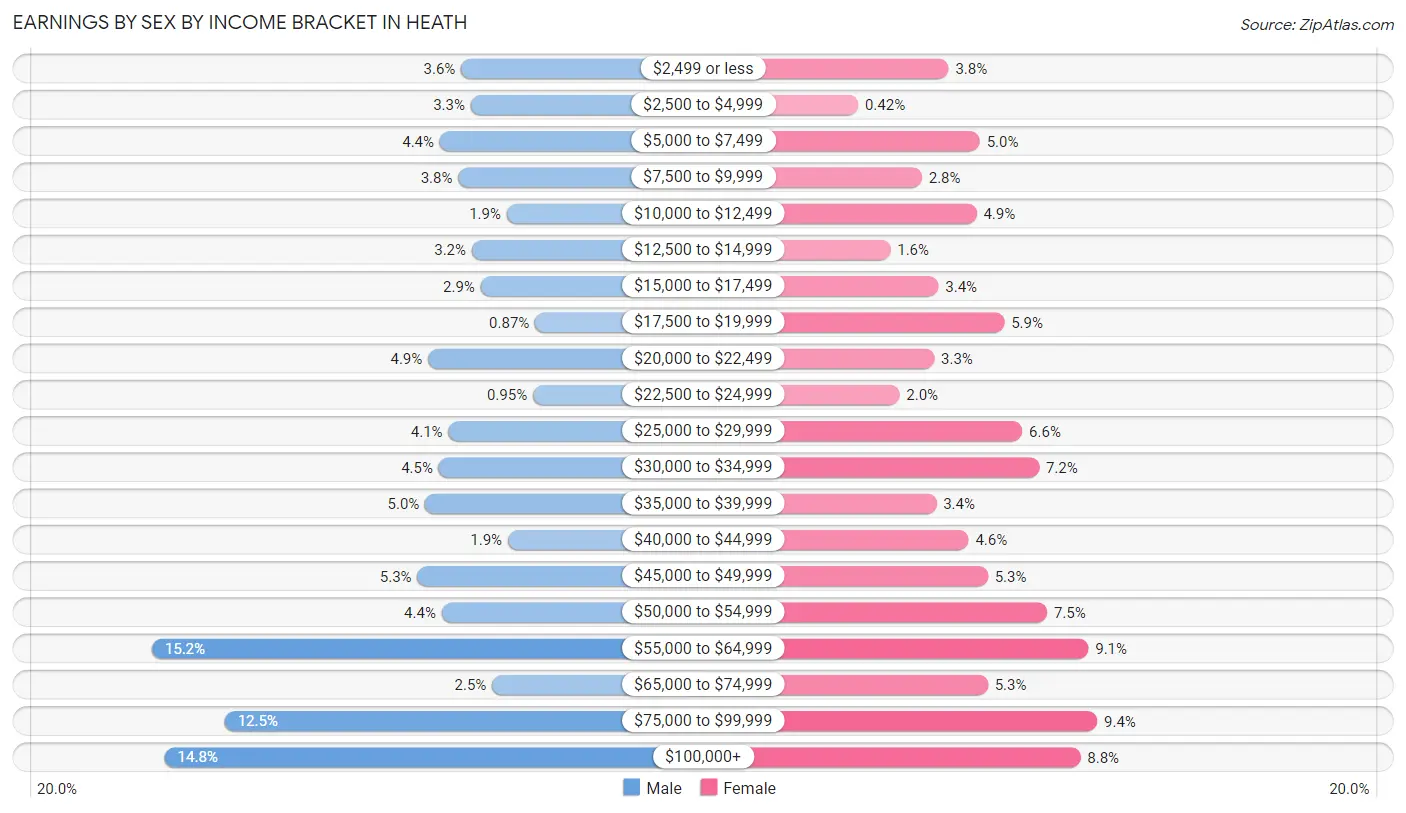
| Income | Male | Female |
| $2,499 or less | 100 (3.6%) | 91 (3.8%) |
| $2,500 to $4,999 | 90 (3.3%) | 10 (0.4%) |
| $5,000 to $7,499 | 122 (4.4%) | 119 (5.0%) |
| $7,500 to $9,999 | 103 (3.7%) | 67 (2.8%) |
| $10,000 to $12,499 | 53 (1.9%) | 116 (4.9%) |
| $12,500 to $14,999 | 89 (3.2%) | 39 (1.6%) |
| $15,000 to $17,499 | 80 (2.9%) | 82 (3.4%) |
| $17,500 to $19,999 | 24 (0.9%) | 141 (5.9%) |
| $20,000 to $22,499 | 134 (4.9%) | 78 (3.3%) |
| $22,500 to $24,999 | 26 (0.9%) | 47 (2.0%) |
| $25,000 to $29,999 | 113 (4.1%) | 157 (6.6%) |
| $30,000 to $34,999 | 123 (4.5%) | 172 (7.2%) |
| $35,000 to $39,999 | 137 (5.0%) | 80 (3.4%) |
| $40,000 to $44,999 | 52 (1.9%) | 109 (4.6%) |
| $45,000 to $49,999 | 145 (5.3%) | 126 (5.3%) |
| $50,000 to $54,999 | 120 (4.4%) | 179 (7.5%) |
| $55,000 to $64,999 | 418 (15.2%) | 216 (9.0%) |
| $65,000 to $74,999 | 68 (2.5%) | 126 (5.3%) |
| $75,000 to $99,999 | 343 (12.5%) | 224 (9.4%) |
| $100,000+ | 405 (14.7%) | 209 (8.7%) |
| Total | 2,745 (100.0%) | 2,388 (100.0%) |
Earnings by Sex by Educational Attainment in Heath
Average earnings in Heath are $54,694 for men and $46,394 for women, a difference of 15.2%. Men with an educational attainment of graduate degree enjoy the highest average annual earnings of $90,179, while those with high school diploma education earn the least with $37,955. Women with an educational attainment of graduate degree earn the most with the average annual earnings of $68,897, while those with less than high school education have the smallest earnings of $27,961.
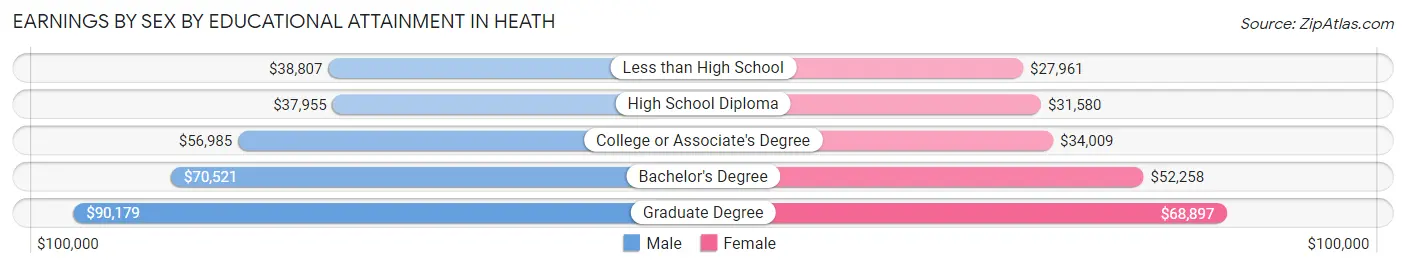
| Educational Attainment | Male Income | Female Income |
| Less than High School | $38,807 | $27,961 |
| High School Diploma | $37,955 | $31,580 |
| College or Associate's Degree | $56,985 | $34,009 |
| Bachelor's Degree | $70,521 | $52,258 |
| Graduate Degree | $90,179 | $68,897 |
| Total | $54,694 | $46,394 |
Family Income in Heath
Family Income Brackets in Heath
According to the Heath family income data, there are 663 families falling into the $100,000 to $149,999 income range, which is the most common income bracket and makes up 25.4% of all families. Conversely, the $10,000 to $14,999 income bracket is the least frequent group with only 18 families (0.7%) belonging to this category.
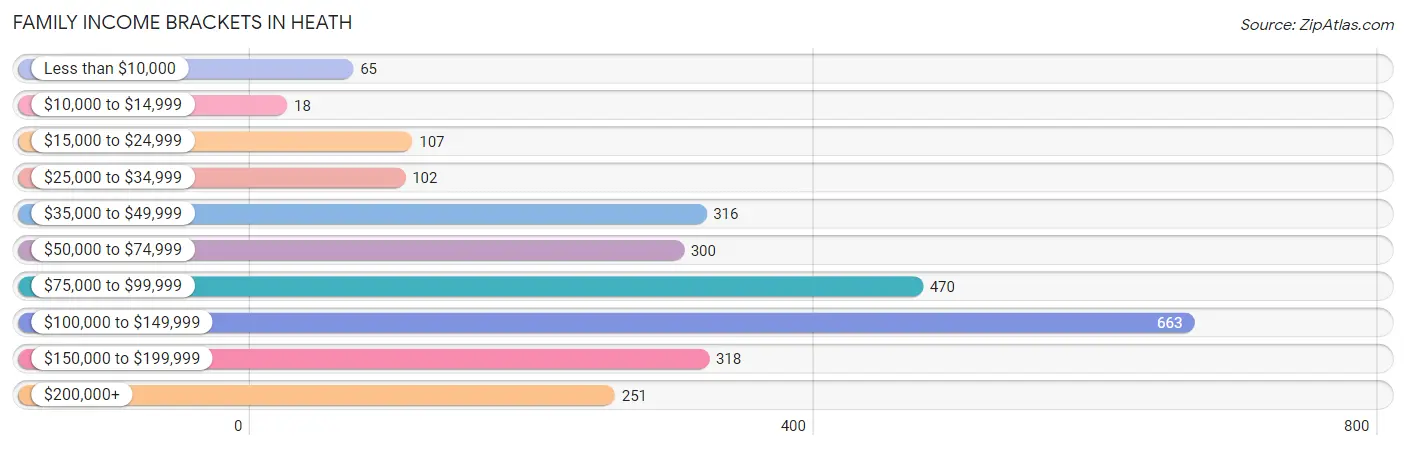
| Income Bracket | # Families | % Families |
| Less than $10,000 | 65 | 2.5% |
| $10,000 to $14,999 | 18 | 0.7% |
| $15,000 to $24,999 | 107 | 4.1% |
| $25,000 to $34,999 | 102 | 3.9% |
| $35,000 to $49,999 | 316 | 12.1% |
| $50,000 to $74,999 | 300 | 11.5% |
| $75,000 to $99,999 | 470 | 18.0% |
| $100,000 to $149,999 | 663 | 25.4% |
| $150,000 to $199,999 | 318 | 12.2% |
| $200,000+ | 251 | 9.6% |
Family Income by Famaliy Size in Heath
7+ person families (86 | 3.3%) account for the highest median family income in Heath with $202,727 per family, while 2-person families (1,448 | 55.5%) have the highest median income of $45,106 per family member.
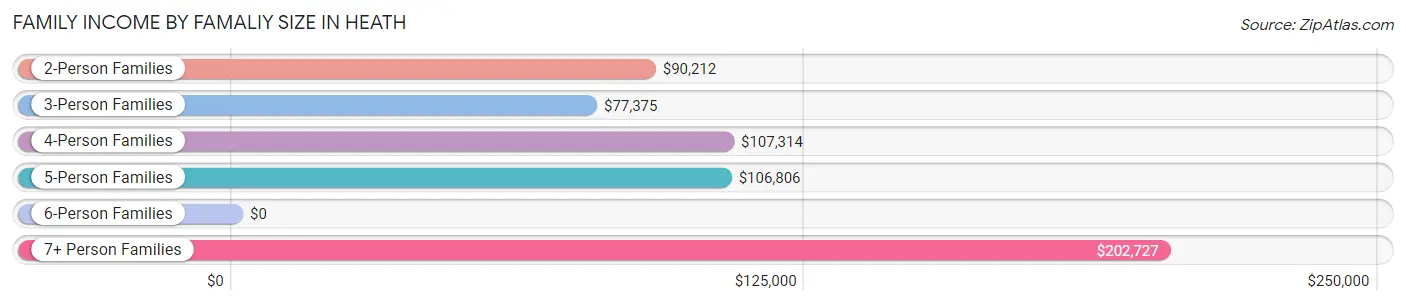
| Income Bracket | # Families | Median Income |
| 2-Person Families | 1,448 (55.5%) | $90,212 |
| 3-Person Families | 331 (12.7%) | $77,375 |
| 4-Person Families | 457 (17.5%) | $107,314 |
| 5-Person Families | 243 (9.3%) | $106,806 |
| 6-Person Families | 45 (1.7%) | $0 |
| 7+ Person Families | 86 (3.3%) | $202,727 |
| Total | 2,610 (100.0%) | $96,053 |
Family Income by Number of Earners in Heath
The median family income in Heath is $96,053, with families comprising 3+ earners (198) having the highest median family income of $192,667, while families with no earners (384) have the lowest median family income of $45,909, accounting for 7.6% and 14.7% of families, respectively.
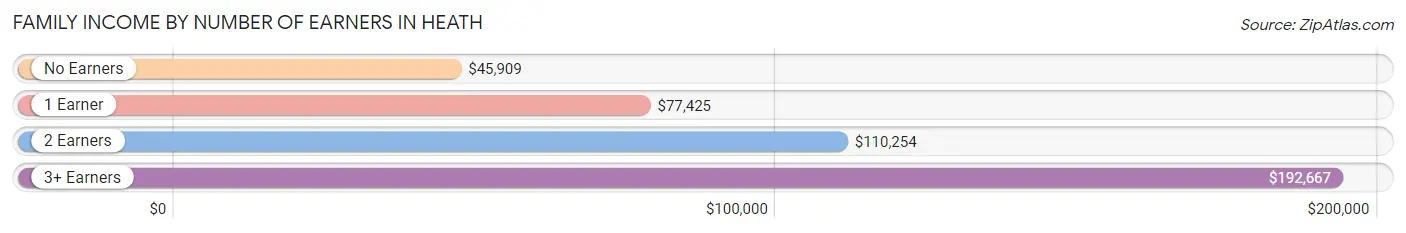
| Number of Earners | # Families | Median Income |
| No Earners | 384 (14.7%) | $45,909 |
| 1 Earner | 822 (31.5%) | $77,425 |
| 2 Earners | 1,206 (46.2%) | $110,254 |
| 3+ Earners | 198 (7.6%) | $192,667 |
| Total | 2,610 (100.0%) | $96,053 |
Household Income in Heath
Household Income Brackets in Heath
With 772 households falling in the category, the $100,000 to $149,999 income range is the most frequent in Heath, accounting for 18.9% of all households. In contrast, only 127 households (3.1%) fall into the less than $10,000 income bracket, making it the least populous group.
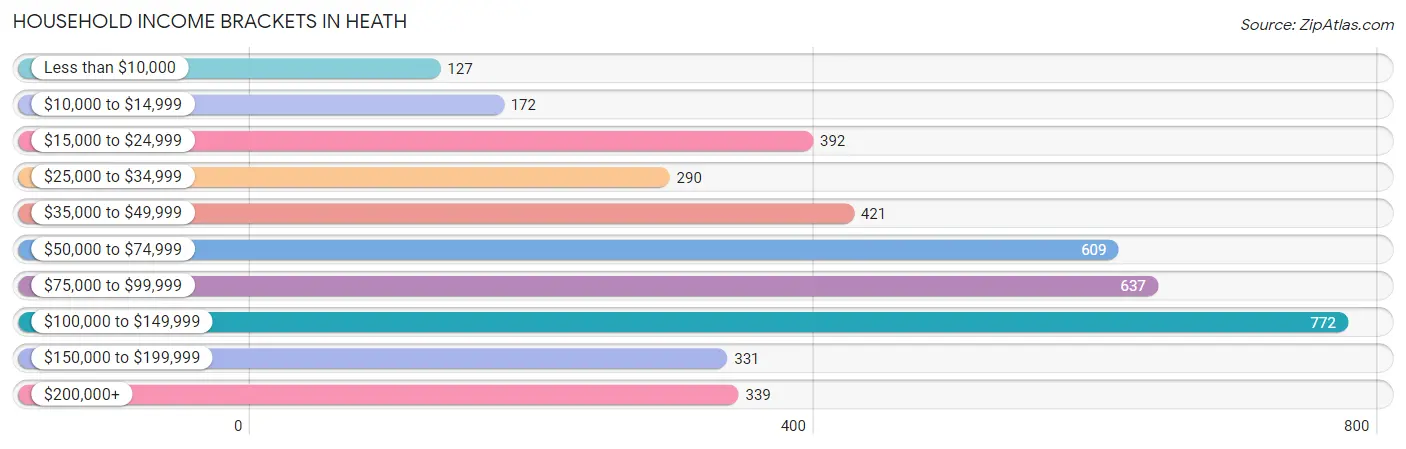
| Income Bracket | # Households | % Households |
| Less than $10,000 | 127 | 3.1% |
| $10,000 to $14,999 | 172 | 4.2% |
| $15,000 to $24,999 | 392 | 9.6% |
| $25,000 to $34,999 | 290 | 7.1% |
| $35,000 to $49,999 | 421 | 10.3% |
| $50,000 to $74,999 | 609 | 14.9% |
| $75,000 to $99,999 | 637 | 15.6% |
| $100,000 to $149,999 | 772 | 18.9% |
| $150,000 to $199,999 | 331 | 8.1% |
| $200,000+ | 339 | 8.3% |
Household Income by Householder Age in Heath
The median household income in Heath is $75,822, with the highest median household income of $110,208 found in the 45 to 64 years age bracket for the primary householder. A total of 1,348 households (33.0%) fall into this category. Meanwhile, the 15 to 24 years age bracket for the primary householder has the lowest median household income of $31,083, with 171 households (4.2%) in this group.
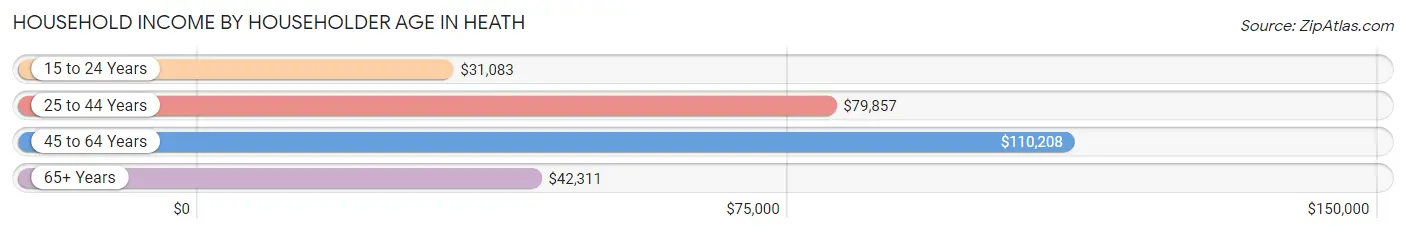
| Income Bracket | # Households | Median Income |
| 15 to 24 Years | 171 (4.2%) | $31,083 |
| 25 to 44 Years | 1,056 (25.9%) | $79,857 |
| 45 to 64 Years | 1,348 (33.0%) | $110,208 |
| 65+ Years | 1,510 (37.0%) | $42,311 |
| Total | 4,085 (100.0%) | $75,822 |
Poverty in Heath
Income Below Poverty by Sex and Age in Heath
With 9.4% poverty level for males and 9.4% for females among the residents of Heath, 5 year old males and 18 to 24 year old females are the most vulnerable to poverty, with 30 males (47.6%) and 117 females (37.5%) in their respective age groups living below the poverty level.
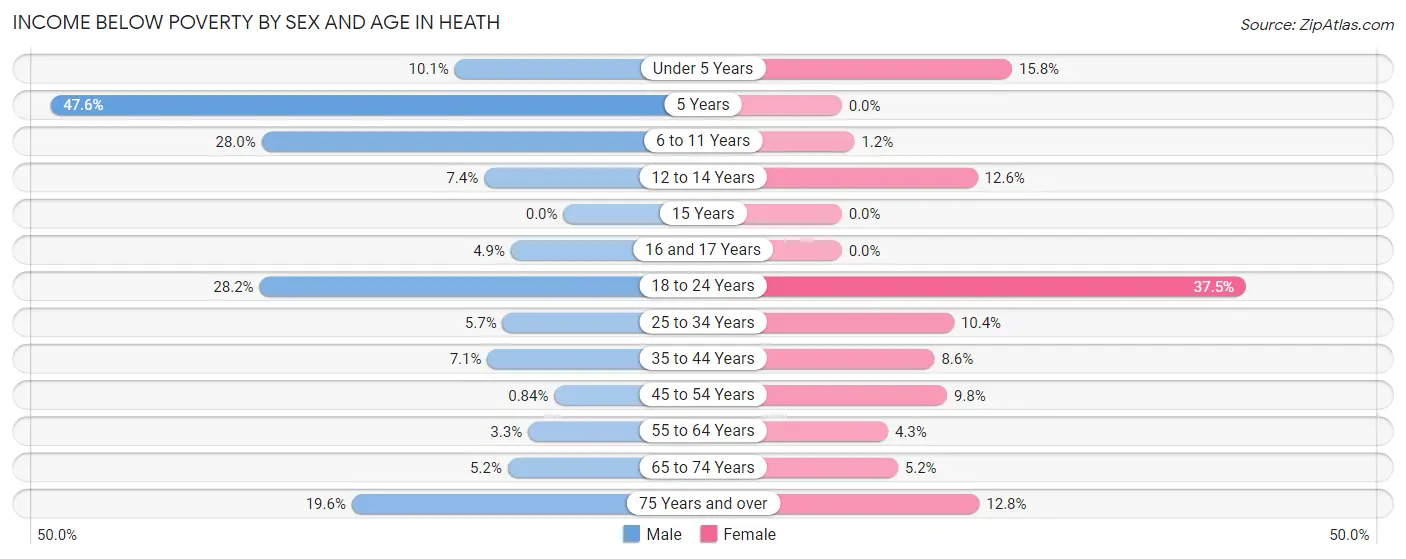
| Age Bracket | Male | Female |
| Under 5 Years | 34 (10.1%) | 39 (15.8%) |
| 5 Years | 30 (47.6%) | 0 (0.0%) |
| 6 to 11 Years | 79 (28.0%) | 6 (1.2%) |
| 12 to 14 Years | 19 (7.4%) | 44 (12.6%) |
| 15 Years | 0 (0.0%) | 0 (0.0%) |
| 16 and 17 Years | 6 (4.9%) | 0 (0.0%) |
| 18 to 24 Years | 77 (28.2%) | 117 (37.5%) |
| 25 to 34 Years | 33 (5.7%) | 61 (10.4%) |
| 35 to 44 Years | 54 (7.1%) | 46 (8.6%) |
| 45 to 54 Years | 4 (0.8%) | 59 (9.8%) |
| 55 to 64 Years | 21 (3.3%) | 28 (4.3%) |
| 65 to 74 Years | 28 (5.2%) | 38 (5.2%) |
| 75 Years and over | 65 (19.6%) | 78 (12.8%) |
| Total | 450 (9.4%) | 516 (9.4%) |
Income Above Poverty by Sex and Age in Heath
According to the poverty statistics in Heath, males aged 15 years and females aged 5 years are the age groups that are most secure financially, with 100.0% of males and 100.0% of females in these age groups living above the poverty line.
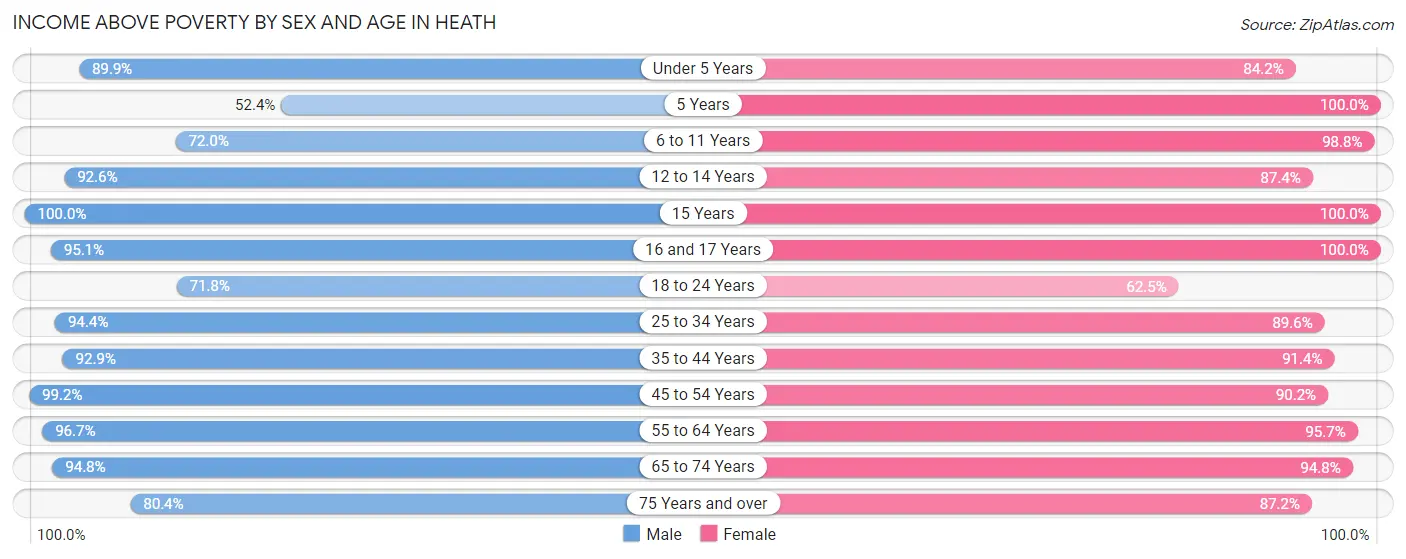
| Age Bracket | Male | Female |
| Under 5 Years | 303 (89.9%) | 208 (84.2%) |
| 5 Years | 33 (52.4%) | 56 (100.0%) |
| 6 to 11 Years | 203 (72.0%) | 503 (98.8%) |
| 12 to 14 Years | 239 (92.6%) | 305 (87.4%) |
| 15 Years | 97 (100.0%) | 136 (100.0%) |
| 16 and 17 Years | 117 (95.1%) | 155 (100.0%) |
| 18 to 24 Years | 196 (71.8%) | 195 (62.5%) |
| 25 to 34 Years | 551 (94.4%) | 525 (89.6%) |
| 35 to 44 Years | 711 (92.9%) | 489 (91.4%) |
| 45 to 54 Years | 473 (99.2%) | 545 (90.2%) |
| 55 to 64 Years | 620 (96.7%) | 624 (95.7%) |
| 65 to 74 Years | 515 (94.8%) | 693 (94.8%) |
| 75 Years and over | 266 (80.4%) | 533 (87.2%) |
| Total | 4,324 (90.6%) | 4,967 (90.6%) |
Income Below Poverty Among Married-Couple Families in Heath
The poverty statistics for married-couple families in Heath show that 0.3% or 5 of the total 2,017 families live below the poverty line. Families with 1 or 2 children have the highest poverty rate of 0.9%, comprising of 5 families. On the other hand, families with no children have the lowest poverty rate of 0.0%, which includes 0 families.
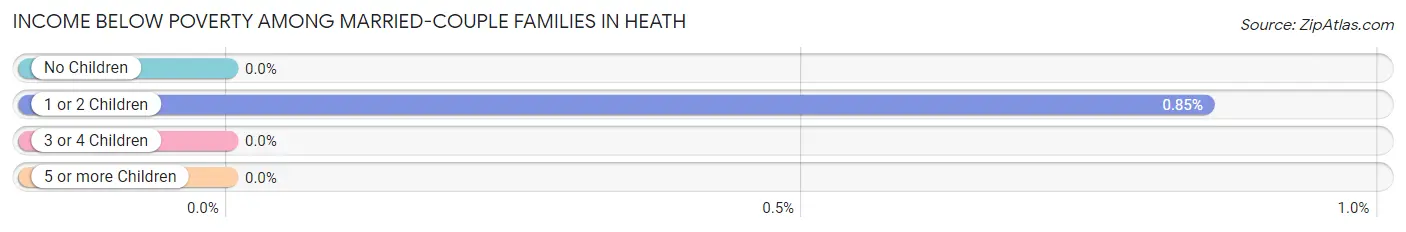
| Children | Above Poverty | Below Poverty |
| No Children | 1,206 (100.0%) | 0 (0.0%) |
| 1 or 2 Children | 580 (99.2%) | 5 (0.9%) |
| 3 or 4 Children | 209 (100.0%) | 0 (0.0%) |
| 5 or more Children | 17 (100.0%) | 0 (0.0%) |
| Total | 2,012 (99.8%) | 5 (0.3%) |
Income Below Poverty Among Single-Parent Households in Heath
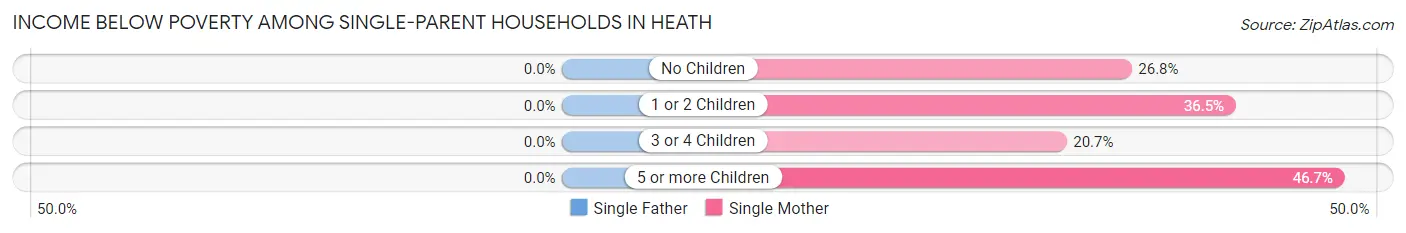
| Children | Single Father | Single Mother |
| No Children | 0 (0.0%) | 30 (26.8%) |
| 1 or 2 Children | 0 (0.0%) | 80 (36.5%) |
| 3 or 4 Children | 0 (0.0%) | 17 (20.7%) |
| 5 or more Children | 0 (0.0%) | 7 (46.7%) |
| Total | 0 (0.0%) | 134 (31.3%) |
Income Below Poverty Among Married-Couple vs Single-Parent Households in Heath
The poverty data for Heath shows that 5 of the married-couple family households (0.3%) and 134 of the single-parent households (22.6%) are living below the poverty level. Within the married-couple family households, those with 1 or 2 children have the highest poverty rate, with 5 households (0.9%) falling below the poverty line. Among the single-parent households, those with 5 or more children have the highest poverty rate, with 7 household (46.7%) living below poverty.
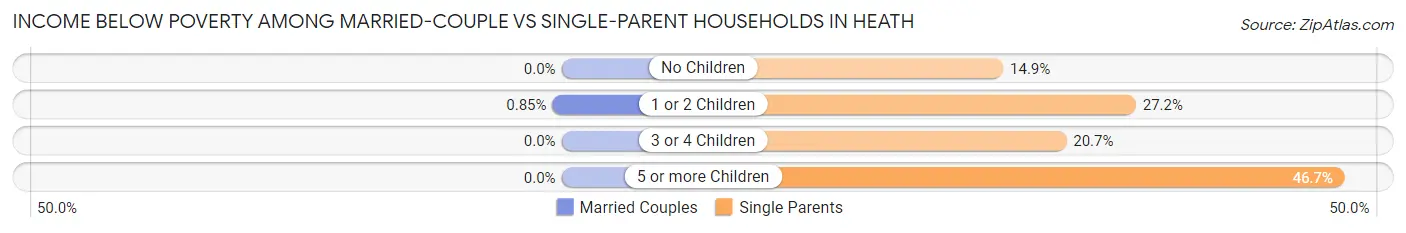
| Children | Married-Couple Families | Single-Parent Households |
| No Children | 0 (0.0%) | 30 (14.8%) |
| 1 or 2 Children | 5 (0.9%) | 80 (27.2%) |
| 3 or 4 Children | 0 (0.0%) | 17 (20.7%) |
| 5 or more Children | 0 (0.0%) | 7 (46.7%) |
| Total | 5 (0.3%) | 134 (22.6%) |
Race in Heath
The most populous races in Heath are White / Caucasian (9,600 | 91.5%), Two or more Races (378 | 3.6%), and Hispanic or Latino (359 | 3.4%).
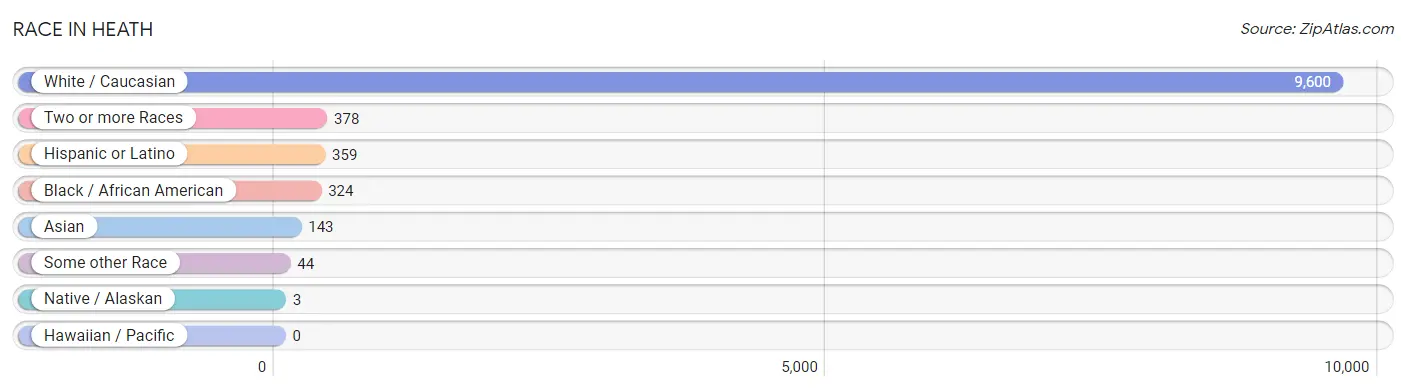
| Race | # Population | % Population |
| Asian | 143 | 1.4% |
| Black / African American | 324 | 3.1% |
| Hawaiian / Pacific | 0 | 0.0% |
| Hispanic or Latino | 359 | 3.4% |
| Native / Alaskan | 3 | 0.0% |
| White / Caucasian | 9,600 | 91.5% |
| Two or more Races | 378 | 3.6% |
| Some other Race | 44 | 0.4% |
| Total | 10,492 | 100.0% |
Ancestry in Heath
The most populous ancestries reported in Heath are German (2,145 | 20.4%), English (2,064 | 19.7%), Irish (1,600 | 15.2%), American (950 | 9.0%), and Italian (321 | 3.1%), together accounting for 67.5% of all Heath residents.
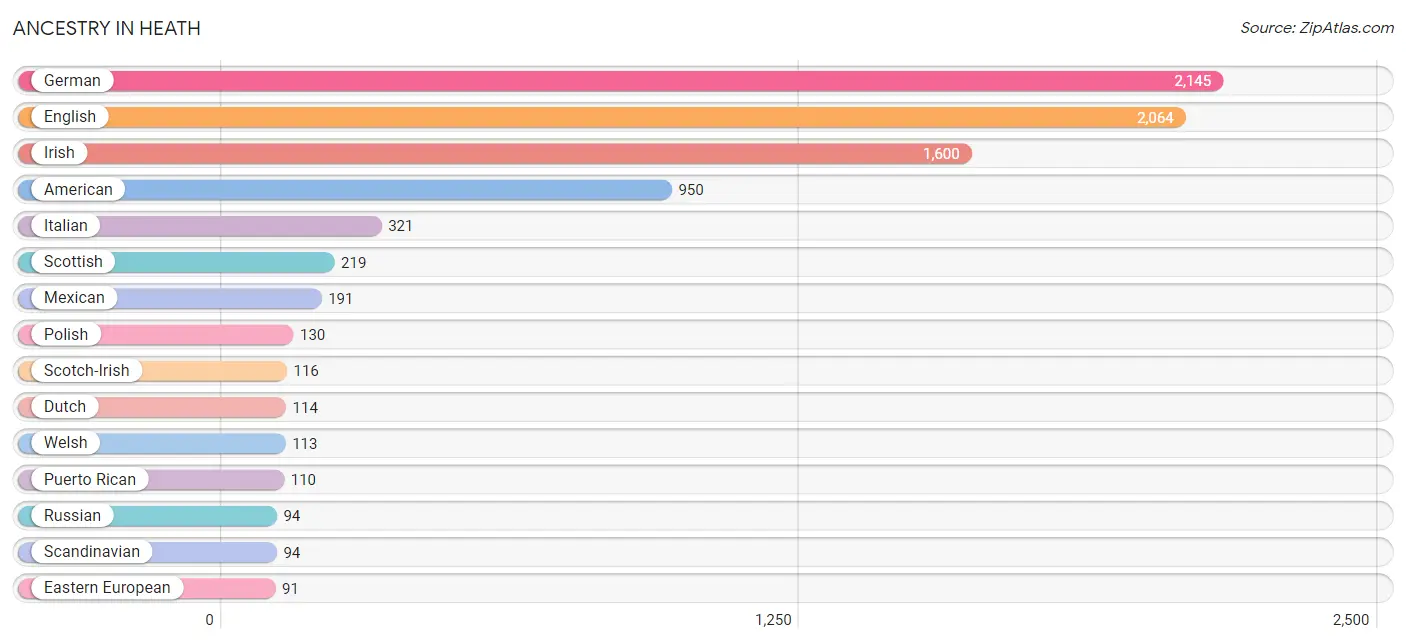
| Ancestry | # Population | % Population |
| African | 48 | 0.5% |
| Alaska Native | 3 | 0.0% |
| American | 950 | 9.0% |
| Arab | 15 | 0.1% |
| Australian | 19 | 0.2% |
| British | 50 | 0.5% |
| Burmese | 30 | 0.3% |
| Canadian | 15 | 0.1% |
| Cherokee | 4 | 0.0% |
| Colombian | 14 | 0.1% |
| Cuban | 25 | 0.2% |
| Czech | 84 | 0.8% |
| Danish | 5 | 0.1% |
| Delaware | 23 | 0.2% |
| Dutch | 114 | 1.1% |
| Eastern European | 91 | 0.9% |
| English | 2,064 | 19.7% |
| European | 40 | 0.4% |
| French | 47 | 0.4% |
| French Canadian | 5 | 0.1% |
| German | 2,145 | 20.4% |
| Greek | 19 | 0.2% |
| Hungarian | 25 | 0.2% |
| Irish | 1,600 | 15.2% |
| Italian | 321 | 3.1% |
| Korean | 88 | 0.8% |
| Lebanese | 11 | 0.1% |
| Lithuanian | 9 | 0.1% |
| Mexican | 191 | 1.8% |
| Norwegian | 71 | 0.7% |
| Pennsylvania German | 7 | 0.1% |
| Polish | 130 | 1.2% |
| Puerto Rican | 110 | 1.1% |
| Romanian | 7 | 0.1% |
| Russian | 94 | 0.9% |
| Scandinavian | 94 | 0.9% |
| Scotch-Irish | 116 | 1.1% |
| Scottish | 219 | 2.1% |
| Slavic | 29 | 0.3% |
| South American | 33 | 0.3% |
| Sri Lankan | 38 | 0.4% |
| Subsaharan African | 48 | 0.5% |
| Swedish | 47 | 0.4% |
| Syrian | 4 | 0.0% |
| Thai | 4 | 0.0% |
| Venezuelan | 19 | 0.2% |
| Welsh | 113 | 1.1% | View All 47 Rows |
Immigrants in Heath
The most numerous immigrant groups reported in Heath came from Asia (58 | 0.5%), South Eastern Asia (58 | 0.5%), Latin America (52 | 0.5%), South America (33 | 0.3%), and Philippines (32 | 0.3%), together accounting for 2.2% of all Heath residents.
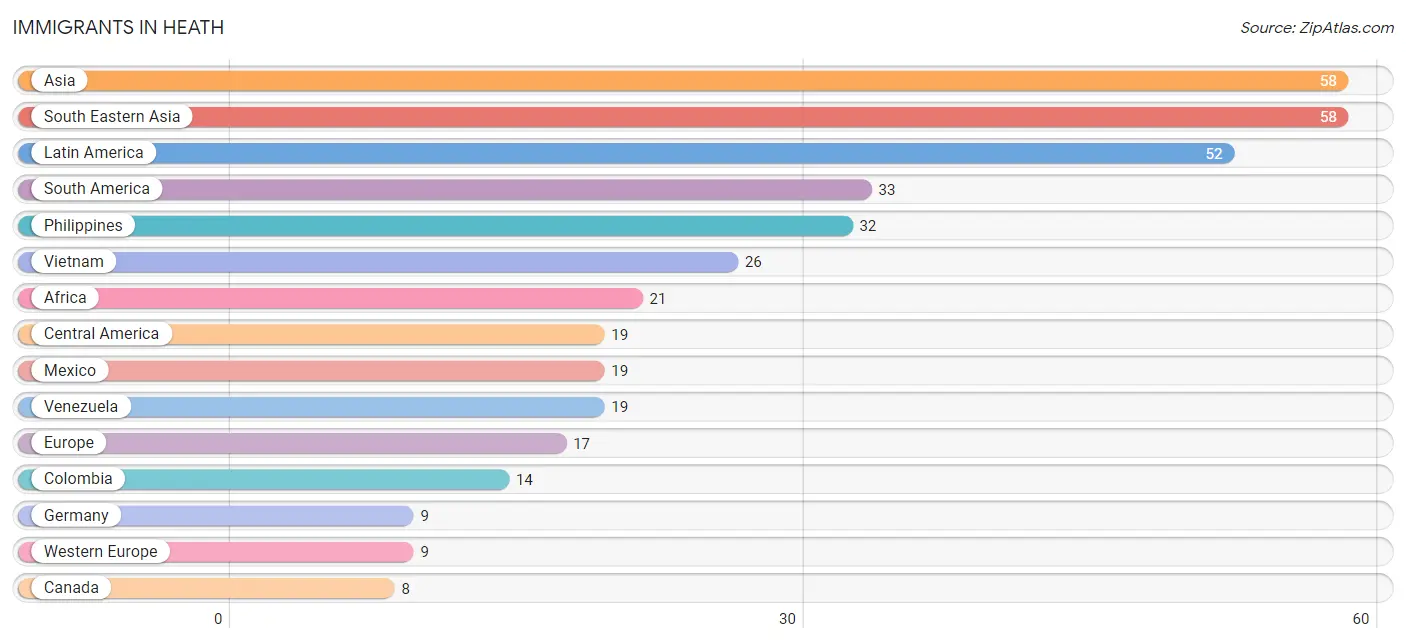
| Immigration Origin | # Population | % Population |
| Africa | 21 | 0.2% |
| Asia | 58 | 0.5% |
| Canada | 8 | 0.1% |
| Central America | 19 | 0.2% |
| Colombia | 14 | 0.1% |
| Eastern Europe | 8 | 0.1% |
| Europe | 17 | 0.2% |
| Germany | 9 | 0.1% |
| Hungary | 8 | 0.1% |
| Latin America | 52 | 0.5% |
| Mexico | 19 | 0.2% |
| Philippines | 32 | 0.3% |
| South America | 33 | 0.3% |
| South Eastern Asia | 58 | 0.5% |
| Venezuela | 19 | 0.2% |
| Vietnam | 26 | 0.3% |
| Western Europe | 9 | 0.1% | View All 17 Rows |
Sex and Age in Heath
Sex and Age in Heath
The most populous age groups in Heath are 40 to 44 Years (488 | 10.1%) for men and 10 to 14 Years (523 | 9.3%) for women.
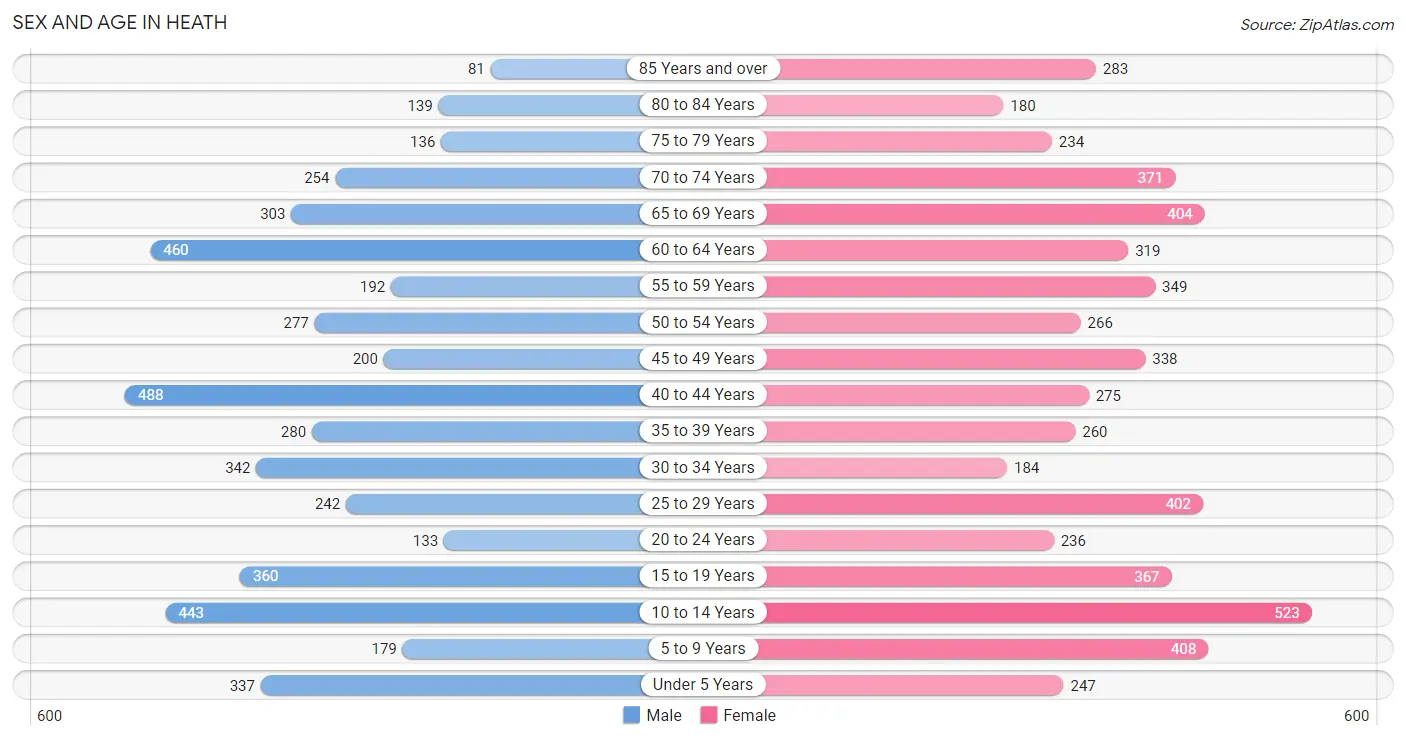
| Age Bracket | Male | Female |
| Under 5 Years | 337 (7.0%) | 247 (4.4%) |
| 5 to 9 Years | 179 (3.7%) | 408 (7.2%) |
| 10 to 14 Years | 443 (9.1%) | 523 (9.3%) |
| 15 to 19 Years | 360 (7.4%) | 367 (6.5%) |
| 20 to 24 Years | 133 (2.7%) | 236 (4.2%) |
| 25 to 29 Years | 242 (5.0%) | 402 (7.1%) |
| 30 to 34 Years | 342 (7.1%) | 184 (3.3%) |
| 35 to 39 Years | 280 (5.8%) | 260 (4.6%) |
| 40 to 44 Years | 488 (10.1%) | 275 (4.9%) |
| 45 to 49 Years | 200 (4.1%) | 338 (6.0%) |
| 50 to 54 Years | 277 (5.7%) | 266 (4.7%) |
| 55 to 59 Years | 192 (4.0%) | 349 (6.2%) |
| 60 to 64 Years | 460 (9.5%) | 319 (5.7%) |
| 65 to 69 Years | 303 (6.2%) | 404 (7.2%) |
| 70 to 74 Years | 254 (5.2%) | 371 (6.6%) |
| 75 to 79 Years | 136 (2.8%) | 234 (4.1%) |
| 80 to 84 Years | 139 (2.9%) | 180 (3.2%) |
| 85 Years and over | 81 (1.7%) | 283 (5.0%) |
| Total | 4,846 (100.0%) | 5,646 (100.0%) |
Families and Households in Heath
Median Family Size in Heath
The median family size in Heath is 3.12 persons per family, with single female/mother families (428 | 16.4%) accounting for the largest median family size of 3.26 persons per family. On the other hand, single male/father families (165 | 6.3%) represent the smallest median family size with 1.98 persons per family.
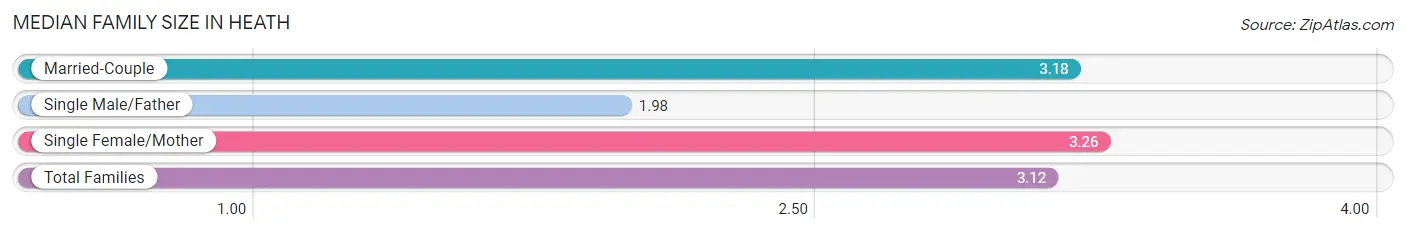
| Family Type | # Families | Family Size |
| Married-Couple | 2,017 (77.3%) | 3.18 |
| Single Male/Father | 165 (6.3%) | 1.98 |
| Single Female/Mother | 428 (16.4%) | 3.26 |
| Total Families | 2,610 (100.0%) | 3.12 |
Median Household Size in Heath
The median household size in Heath is 2.52 persons per household, with single female/mother households (428 | 10.5%) accounting for the largest median household size of 3.82 persons per household. non-family households (1,475 | 36.1%) represent the smallest median household size with 1.27 persons per household.
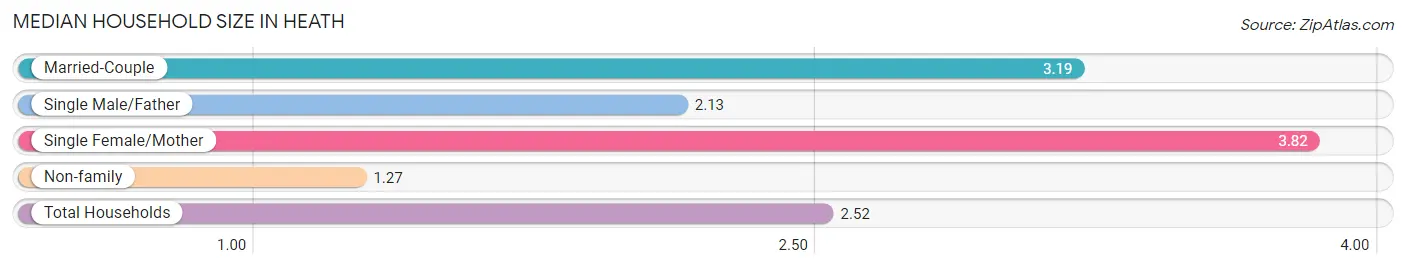
| Household Type | # Households | Household Size |
| Married-Couple | 2,017 (49.4%) | 3.19 |
| Single Male/Father | 165 (4.0%) | 2.13 |
| Single Female/Mother | 428 (10.5%) | 3.82 |
| Non-family | 1,475 (36.1%) | 1.27 |
| Total Households | 4,085 (100.0%) | 2.52 |
Household Size by Marriage Status in Heath
Out of a total of 4,085 households in Heath, 2,610 (63.9%) are family households, while 1,475 (36.1%) are nonfamily households. The most numerous type of family households are 2-person households, comprising 1,363, and the most common type of nonfamily households are 1-person households, comprising 1,127.
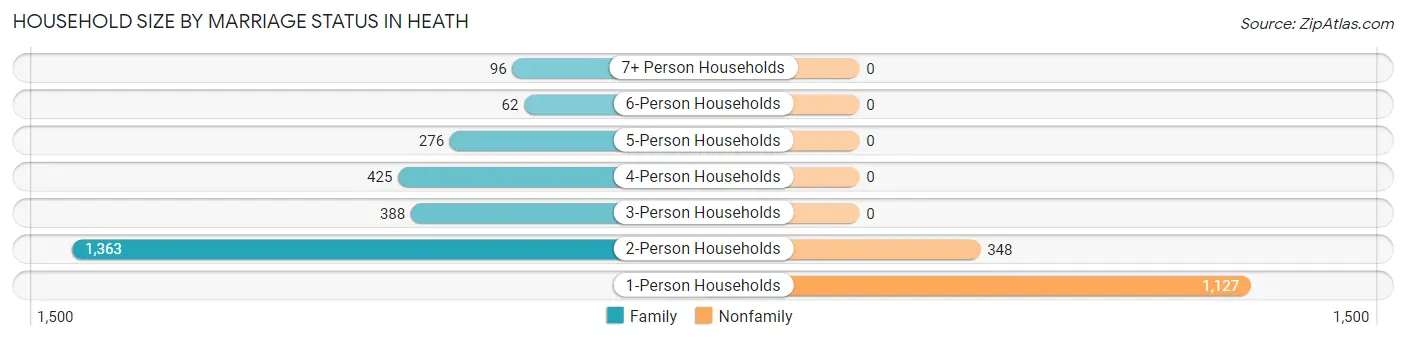
| Household Size | Family Households | Nonfamily Households |
| 1-Person Households | - | 1,127 (27.6%) |
| 2-Person Households | 1,363 (33.4%) | 348 (8.5%) |
| 3-Person Households | 388 (9.5%) | 0 (0.0%) |
| 4-Person Households | 425 (10.4%) | 0 (0.0%) |
| 5-Person Households | 276 (6.8%) | 0 (0.0%) |
| 6-Person Households | 62 (1.5%) | 0 (0.0%) |
| 7+ Person Households | 96 (2.4%) | 0 (0.0%) |
| Total | 2,610 (63.9%) | 1,475 (36.1%) |
Female Fertility in Heath
Fertility by Age in Heath
Average fertility rate in Heath is 42.0 births per 1,000 women. Women in the age bracket of 20 to 34 years have the highest fertility rate with 102.0 births per 1,000 women. Women in the age bracket of 20 to 34 years acount for 92.3% of all women with births.
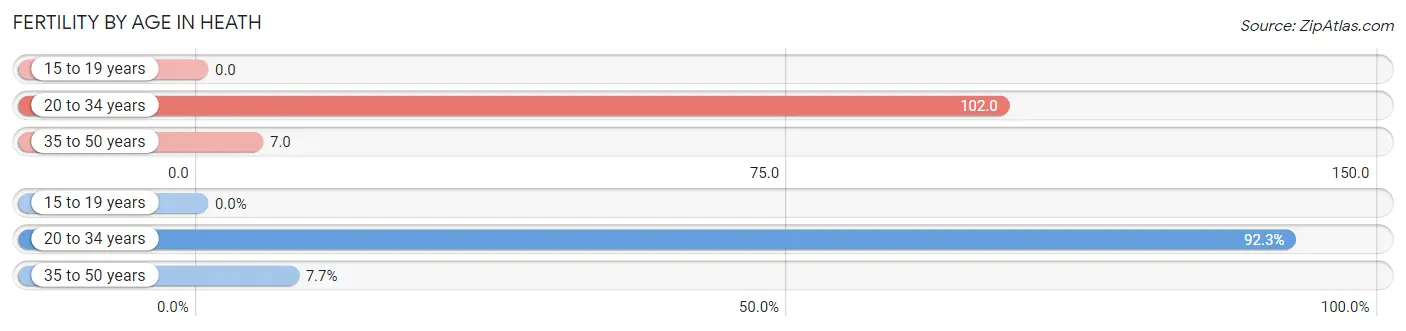
| Age Bracket | Women with Births | Births / 1,000 Women |
| 15 to 19 years | 0 (0.0%) | 0.0 |
| 20 to 34 years | 84 (92.3%) | 102.0 |
| 35 to 50 years | 7 (7.7%) | 7.0 |
| Total | 91 (100.0%) | 42.0 |
Fertility by Age by Marriage Status in Heath
84.6% of women with births (91) in Heath are married. The highest percentage of unmarried women with births falls into 20 to 34 years age bracket with 16.7% of them unmarried at the time of birth, while the lowest percentage of unmarried women with births belong to 35 to 50 years age bracket with 0.0% of them unmarried.
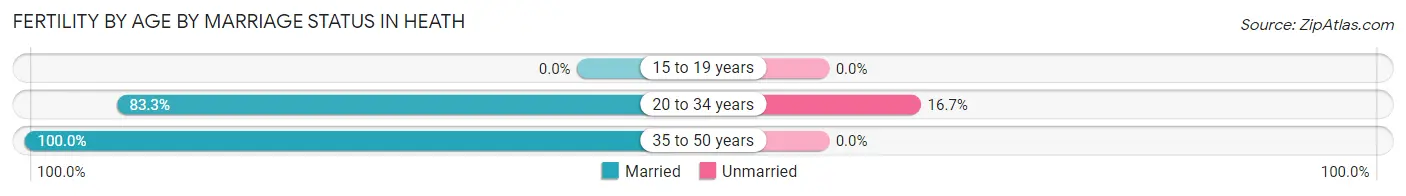
| Age Bracket | Married | Unmarried |
| 15 to 19 years | 0 (0.0%) | 0 (0.0%) |
| 20 to 34 years | 70 (83.3%) | 14 (16.7%) |
| 35 to 50 years | 7 (100.0%) | 0 (0.0%) |
| Total | 77 (84.6%) | 14 (15.4%) |
Fertility by Education in Heath
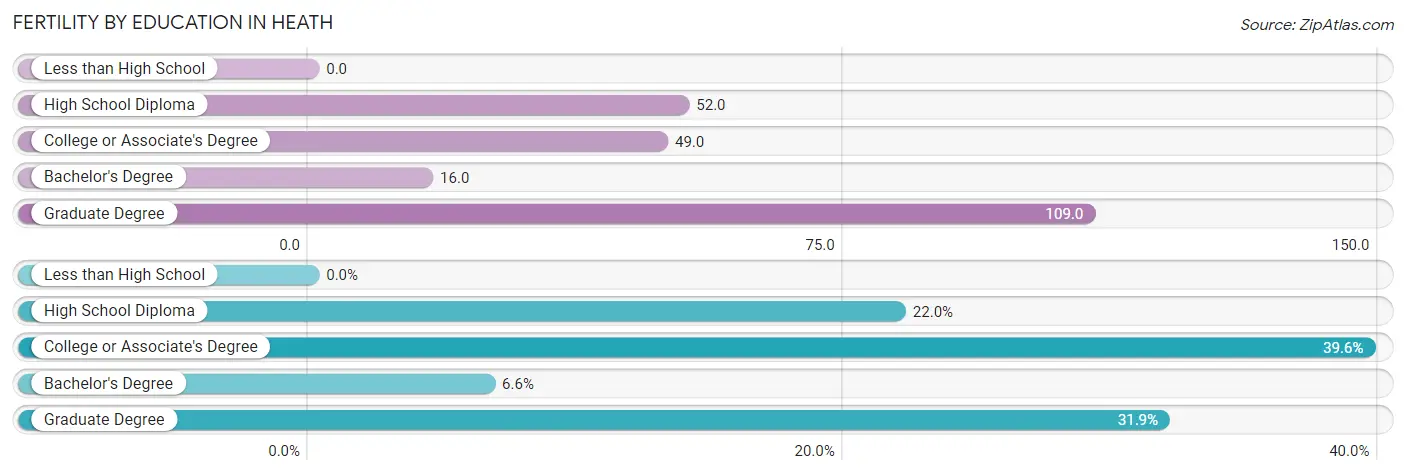
| Educational Attainment | Women with Births | Births / 1,000 Women |
| Less than High School | 0 (0.0%) | 0.0 |
| High School Diploma | 20 (22.0%) | 52.0 |
| College or Associate's Degree | 36 (39.6%) | 49.0 |
| Bachelor's Degree | 6 (6.6%) | 16.0 |
| Graduate Degree | 29 (31.9%) | 109.0 |
| Total | 91 (100.0%) | 42.0 |
Fertility by Education by Marriage Status in Heath
15.4% of women with births in Heath are unmarried. Women with the educational attainment of high school diploma are most likely to be married with 100.0% of them married at childbirth, while women with the educational attainment of college or associate's degree are least likely to be married with 38.9% of them unmarried at childbirth.
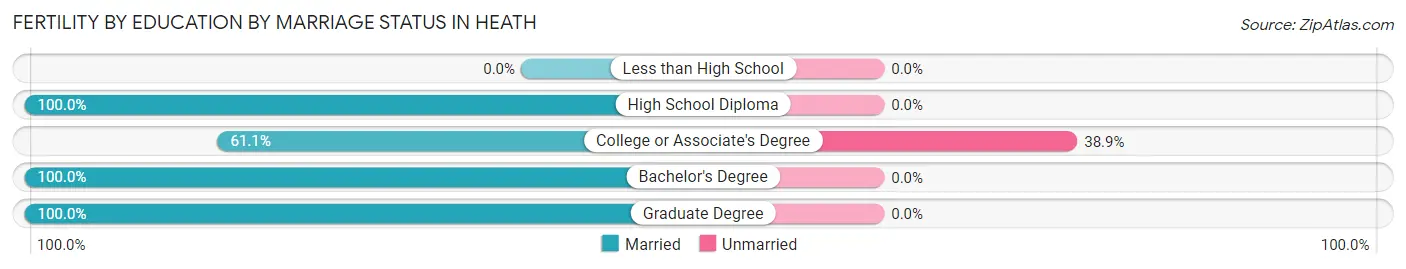
| Educational Attainment | Married | Unmarried |
| Less than High School | 0 (0.0%) | 0 (0.0%) |
| High School Diploma | 20 (100.0%) | 0 (0.0%) |
| College or Associate's Degree | 22 (61.1%) | 14 (38.9%) |
| Bachelor's Degree | 6 (100.0%) | 0 (0.0%) |
| Graduate Degree | 29 (100.0%) | 0 (0.0%) |
| Total | 77 (84.6%) | 14 (15.4%) |
Employment Characteristics in Heath
Employment by Class of Employer in Heath
Among the 4,614 employed individuals in Heath, private company employees (3,156 | 68.4%), not-for-profit organizations (459 | 10.0%), and local government employees (349 | 7.6%) make up the most common classes of employment.
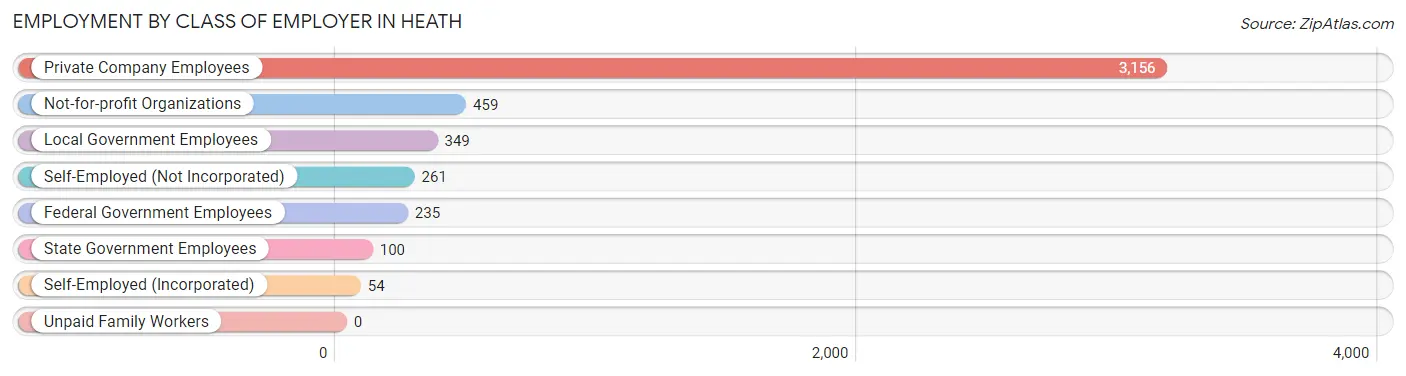
| Employer Class | # Employees | % Employees |
| Private Company Employees | 3,156 | 68.4% |
| Self-Employed (Incorporated) | 54 | 1.2% |
| Self-Employed (Not Incorporated) | 261 | 5.7% |
| Not-for-profit Organizations | 459 | 10.0% |
| Local Government Employees | 349 | 7.6% |
| State Government Employees | 100 | 2.2% |
| Federal Government Employees | 235 | 5.1% |
| Unpaid Family Workers | 0 | 0.0% |
| Total | 4,614 | 100.0% |
Employment Status by Age in Heath
According to the labor force statistics for Heath, out of the total population over 16 years of age (8,122), 59.4% or 4,824 individuals are in the labor force, with 3.2% or 154 of them unemployed. The age group with the highest labor force participation rate is 30 to 34 years, with 90.3% or 475 individuals in the labor force. Within the labor force, the 30 to 34 years age range has the highest percentage of unemployed individuals, with 14.9% or 71 of them being unemployed.
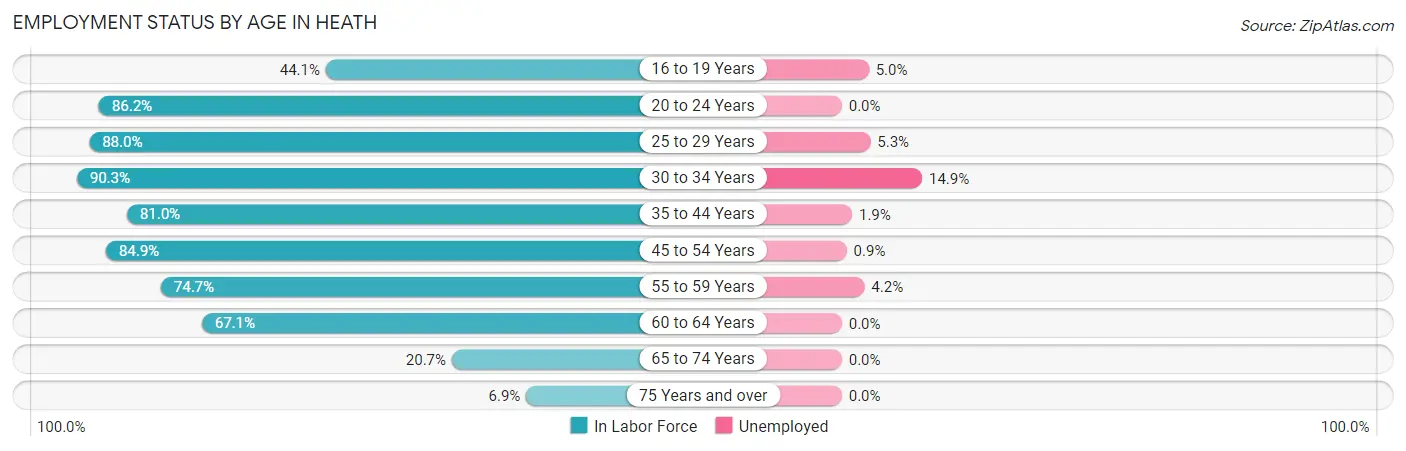
| Age Bracket | In Labor Force | Unemployed |
| 16 to 19 Years | 218 (44.1%) | 11 (5.0%) |
| 20 to 24 Years | 318 (86.2%) | 0 (0.0%) |
| 25 to 29 Years | 567 (88.0%) | 30 (5.3%) |
| 30 to 34 Years | 475 (90.3%) | 71 (14.9%) |
| 35 to 44 Years | 1,055 (81.0%) | 20 (1.9%) |
| 45 to 54 Years | 918 (84.9%) | 8 (0.9%) |
| 55 to 59 Years | 404 (74.7%) | 17 (4.2%) |
| 60 to 64 Years | 523 (67.1%) | 0 (0.0%) |
| 65 to 74 Years | 276 (20.7%) | 0 (0.0%) |
| 75 Years and over | 73 (6.9%) | 0 (0.0%) |
| Total | 4,824 (59.4%) | 154 (3.2%) |
Employment Status by Educational Attainment in Heath
According to labor force statistics for Heath, 80.9% of individuals (3,943) out of the total population between 25 and 64 years of age (4,874) are in the labor force, with 3.7% or 146 of them being unemployed. The group with the highest labor force participation rate are those with the educational attainment of bachelor's degree or higher, with 94.4% or 1,323 individuals in the labor force. Within the labor force, individuals with high school diploma education have the highest percentage of unemployment, with 10.0% or 99 of them being unemployed.
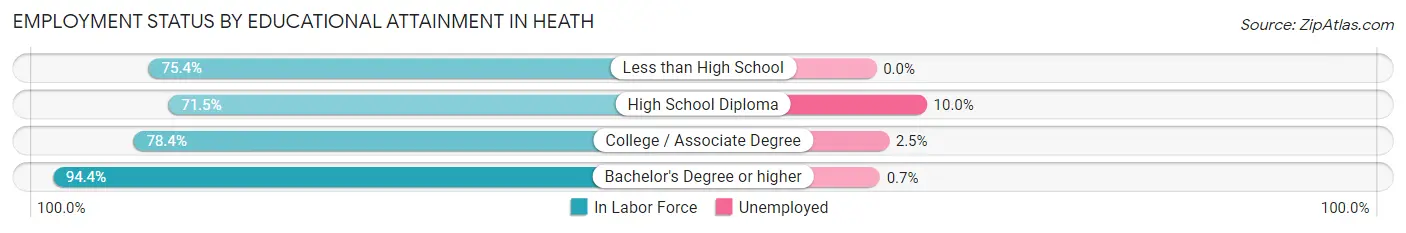
| Educational Attainment | In Labor Force | Unemployed |
| Less than High School | 175 (75.4%) | 0 (0.0%) |
| High School Diploma | 991 (71.5%) | 139 (10.0%) |
| College / Associate Degree | 1,454 (78.4%) | 46 (2.5%) |
| Bachelor's Degree or higher | 1,323 (94.4%) | 10 (0.7%) |
| Total | 3,943 (80.9%) | 180 (3.7%) |
Employment Occupations by Sex in Heath
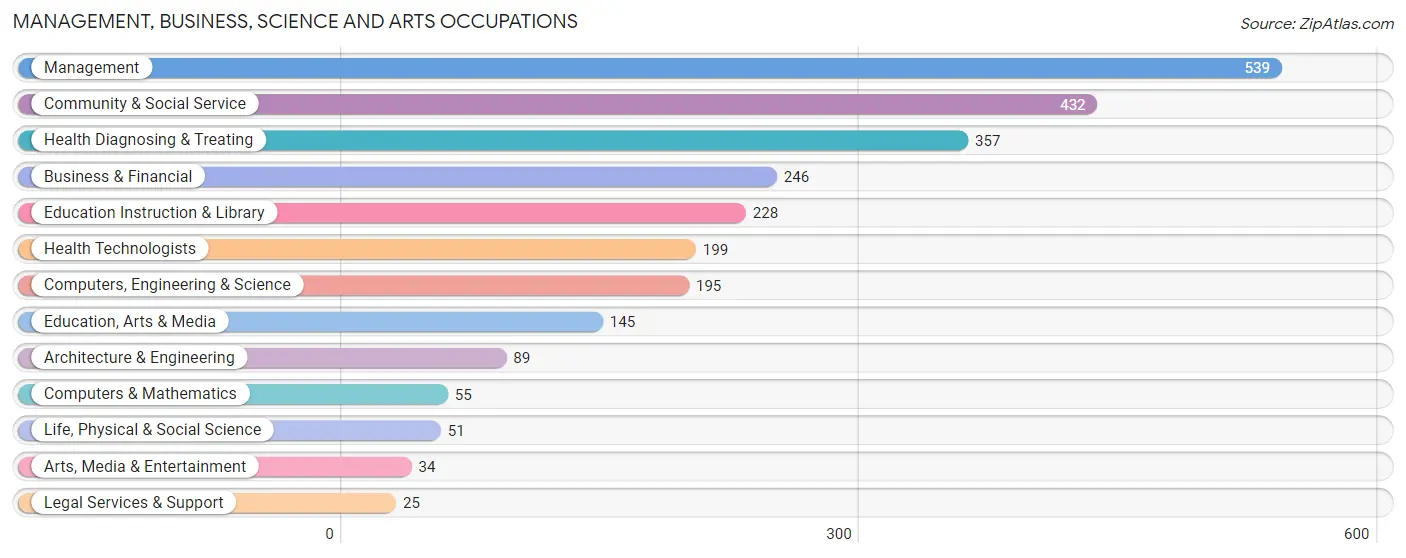
Management, Business, Science and Arts Occupations
The most common Management, Business, Science and Arts occupations in Heath are Management (539 | 11.6%), Community & Social Service (432 | 9.3%), Health Diagnosing & Treating (357 | 7.7%), Business & Financial (246 | 5.3%), and Education Instruction & Library (228 | 4.9%).
Management, Business, Science and Arts Occupations by Sex
Within the Management, Business, Science and Arts occupations in Heath, the most male-oriented occupations are Computers & Mathematics (100.0%), Architecture & Engineering (100.0%), and Arts, Media & Entertainment (100.0%), while the most female-oriented occupations are Life, Physical & Social Science (100.0%), Legal Services & Support (100.0%), and Health Diagnosing & Treating (90.2%).
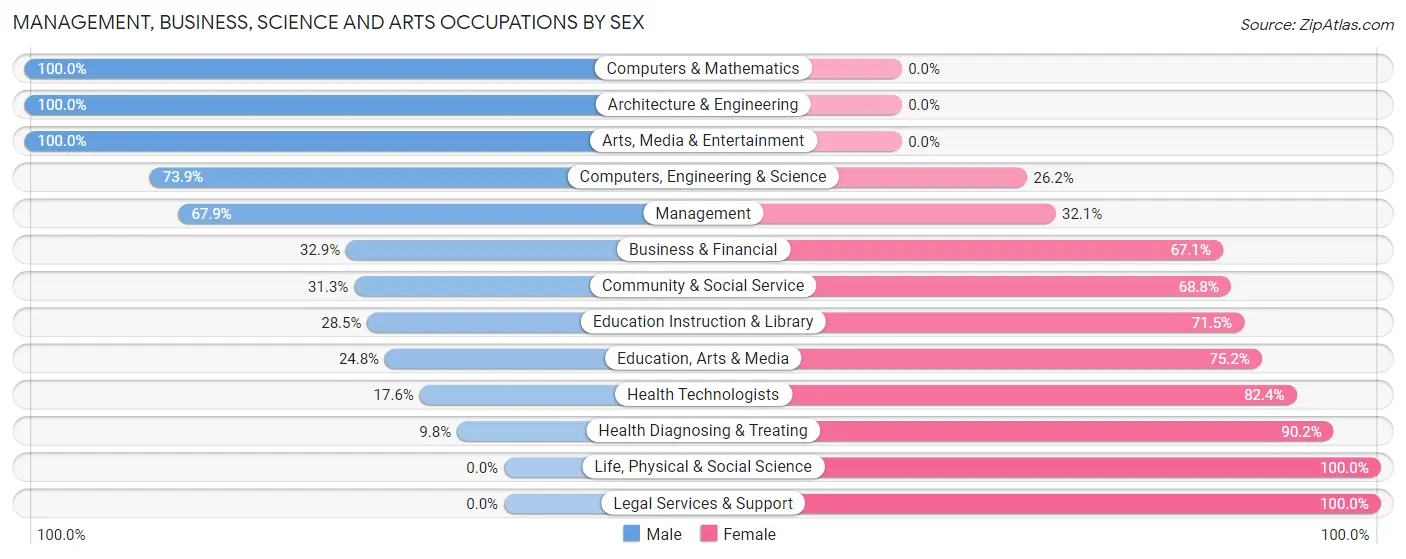
| Occupation | Male | Female |
| Management | 366 (67.9%) | 173 (32.1%) |
| Business & Financial | 81 (32.9%) | 165 (67.1%) |
| Computers, Engineering & Science | 144 (73.9%) | 51 (26.2%) |
| Computers & Mathematics | 55 (100.0%) | 0 (0.0%) |
| Architecture & Engineering | 89 (100.0%) | 0 (0.0%) |
| Life, Physical & Social Science | 0 (0.0%) | 51 (100.0%) |
| Community & Social Service | 135 (31.2%) | 297 (68.8%) |
| Education, Arts & Media | 36 (24.8%) | 109 (75.2%) |
| Legal Services & Support | 0 (0.0%) | 25 (100.0%) |
| Education Instruction & Library | 65 (28.5%) | 163 (71.5%) |
| Arts, Media & Entertainment | 34 (100.0%) | 0 (0.0%) |
| Health Diagnosing & Treating | 35 (9.8%) | 322 (90.2%) |
| Health Technologists | 35 (17.6%) | 164 (82.4%) |
| Total (Category) | 761 (43.0%) | 1,008 (57.0%) |
| Total (Overall) | 2,425 (52.3%) | 2,211 (47.7%) |
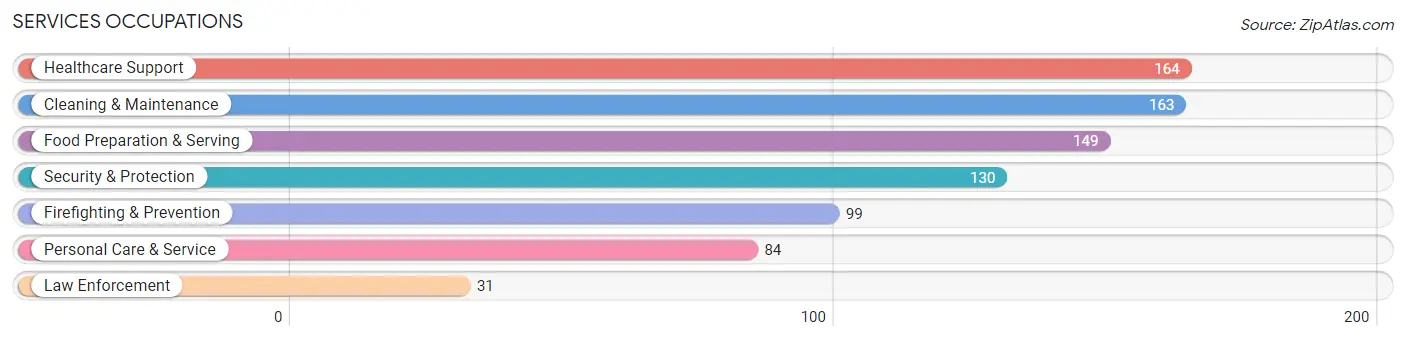
Services Occupations
The most common Services occupations in Heath are Healthcare Support (164 | 3.5%), Cleaning & Maintenance (163 | 3.5%), Food Preparation & Serving (149 | 3.2%), Security & Protection (130 | 2.8%), and Firefighting & Prevention (99 | 2.1%).
Services Occupations by Sex
Within the Services occupations in Heath, the most male-oriented occupations are Law Enforcement (100.0%), Security & Protection (83.1%), and Firefighting & Prevention (77.8%), while the most female-oriented occupations are Healthcare Support (87.8%), Personal Care & Service (84.5%), and Food Preparation & Serving (47.6%).
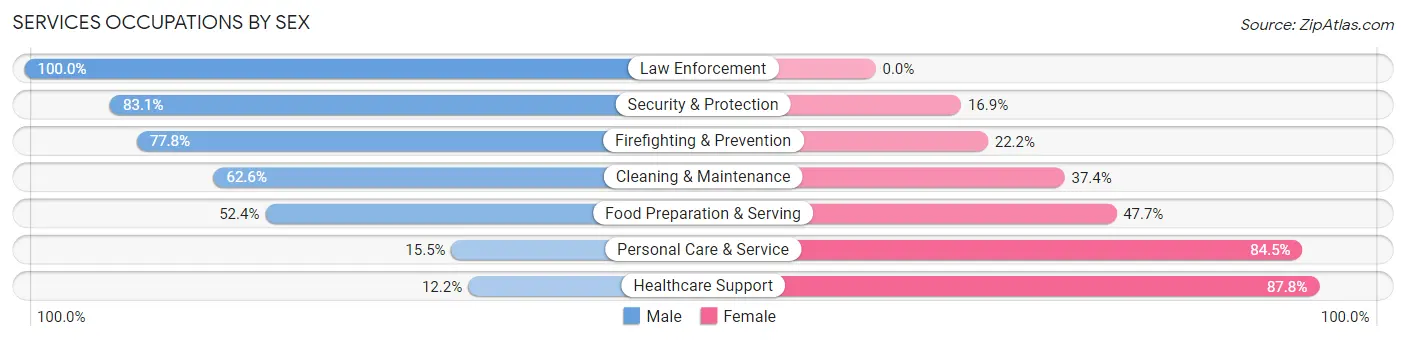
| Occupation | Male | Female |
| Healthcare Support | 20 (12.2%) | 144 (87.8%) |
| Security & Protection | 108 (83.1%) | 22 (16.9%) |
| Firefighting & Prevention | 77 (77.8%) | 22 (22.2%) |
| Law Enforcement | 31 (100.0%) | 0 (0.0%) |
| Food Preparation & Serving | 78 (52.3%) | 71 (47.6%) |
| Cleaning & Maintenance | 102 (62.6%) | 61 (37.4%) |
| Personal Care & Service | 13 (15.5%) | 71 (84.5%) |
| Total (Category) | 321 (46.5%) | 369 (53.5%) |
| Total (Overall) | 2,425 (52.3%) | 2,211 (47.7%) |
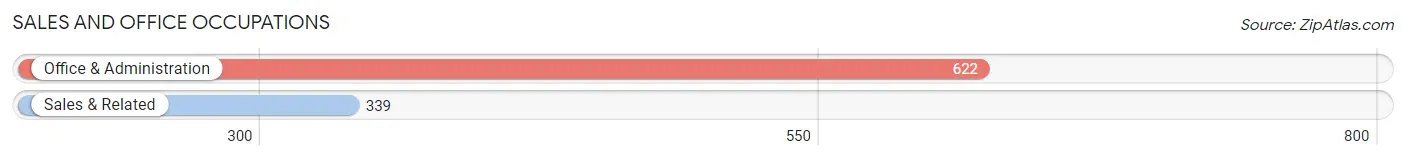
Sales and Office Occupations
The most common Sales and Office occupations in Heath are Office & Administration (622 | 13.4%), and Sales & Related (339 | 7.3%).
Sales and Office Occupations by Sex
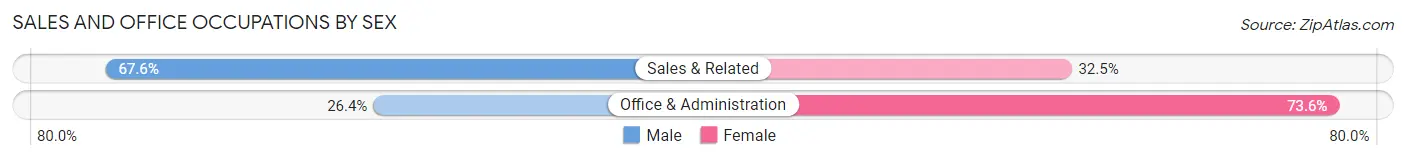
| Occupation | Male | Female |
| Sales & Related | 229 (67.5%) | 110 (32.5%) |
| Office & Administration | 164 (26.4%) | 458 (73.6%) |
| Total (Category) | 393 (40.9%) | 568 (59.1%) |
| Total (Overall) | 2,425 (52.3%) | 2,211 (47.7%) |
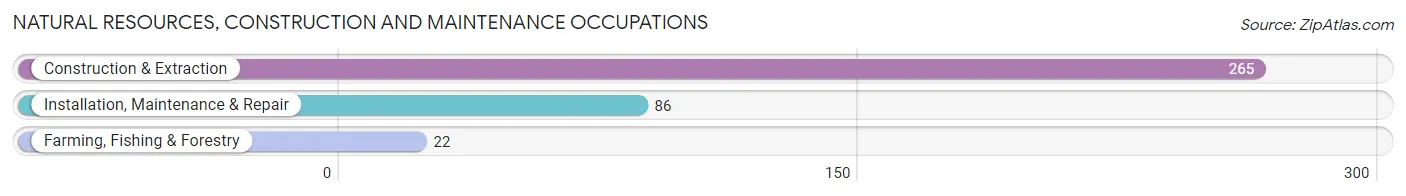
Natural Resources, Construction and Maintenance Occupations
The most common Natural Resources, Construction and Maintenance occupations in Heath are Construction & Extraction (265 | 5.7%), Installation, Maintenance & Repair (86 | 1.9%), and Farming, Fishing & Forestry (22 | 0.5%).
Natural Resources, Construction and Maintenance Occupations by Sex
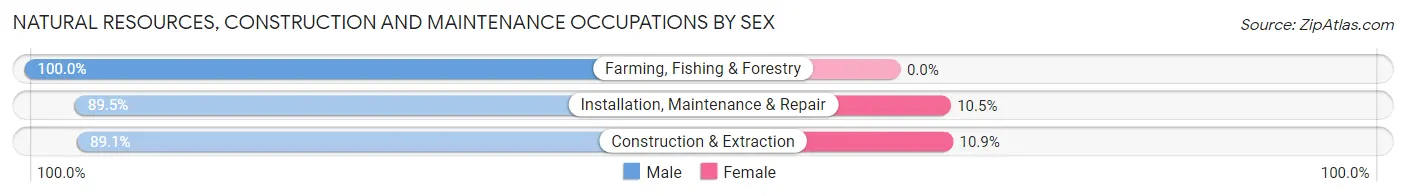
| Occupation | Male | Female |
| Farming, Fishing & Forestry | 22 (100.0%) | 0 (0.0%) |
| Construction & Extraction | 236 (89.1%) | 29 (10.9%) |
| Installation, Maintenance & Repair | 77 (89.5%) | 9 (10.5%) |
| Total (Category) | 335 (89.8%) | 38 (10.2%) |
| Total (Overall) | 2,425 (52.3%) | 2,211 (47.7%) |
Production, Transportation and Moving Occupations
The most common Production, Transportation and Moving occupations in Heath are Production (417 | 9.0%), Material Moving (271 | 5.9%), and Transportation (155 | 3.3%).
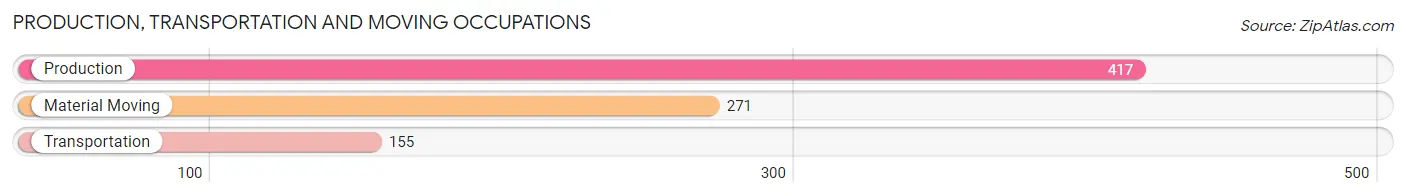
Production, Transportation and Moving Occupations by Sex
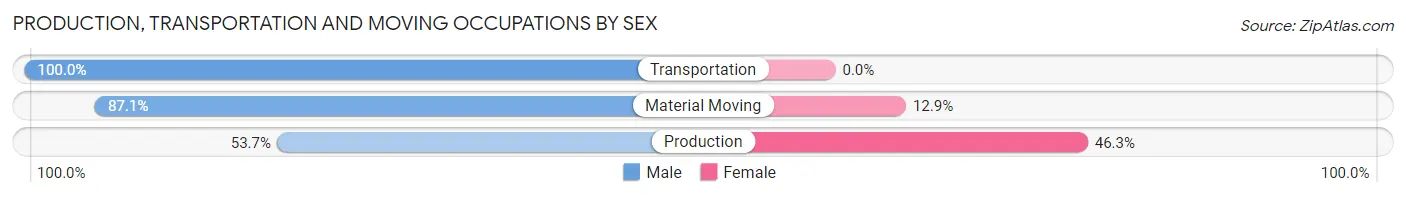
| Occupation | Male | Female |
| Production | 224 (53.7%) | 193 (46.3%) |
| Transportation | 155 (100.0%) | 0 (0.0%) |
| Material Moving | 236 (87.1%) | 35 (12.9%) |
| Total (Category) | 615 (73.0%) | 228 (27.1%) |
| Total (Overall) | 2,425 (52.3%) | 2,211 (47.7%) |
Employment Industries by Sex in Heath
Employment Industries in Heath
The major employment industries in Heath include Health Care & Social Assistance (875 | 18.9%), Manufacturing (686 | 14.8%), Retail Trade (601 | 13.0%), Construction (324 | 7.0%), and Finance & Insurance (311 | 6.7%).
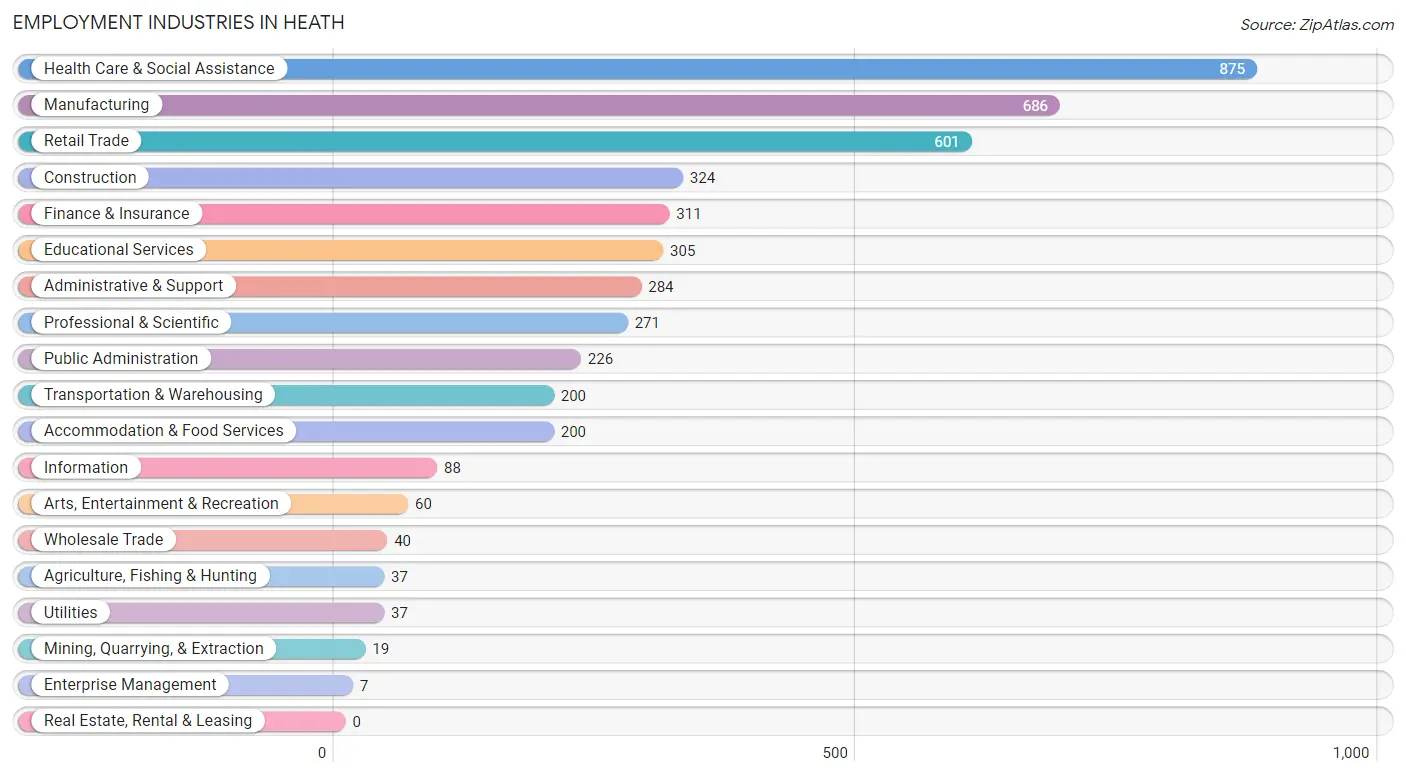
Employment Industries by Sex in Heath
The Heath industries that see more men than women are Agriculture, Fishing & Hunting (100.0%), Mining, Quarrying, & Extraction (100.0%), and Transportation & Warehousing (100.0%), whereas the industries that tend to have a higher number of women are Enterprise Management (100.0%), Health Care & Social Assistance (82.2%), and Finance & Insurance (68.8%).
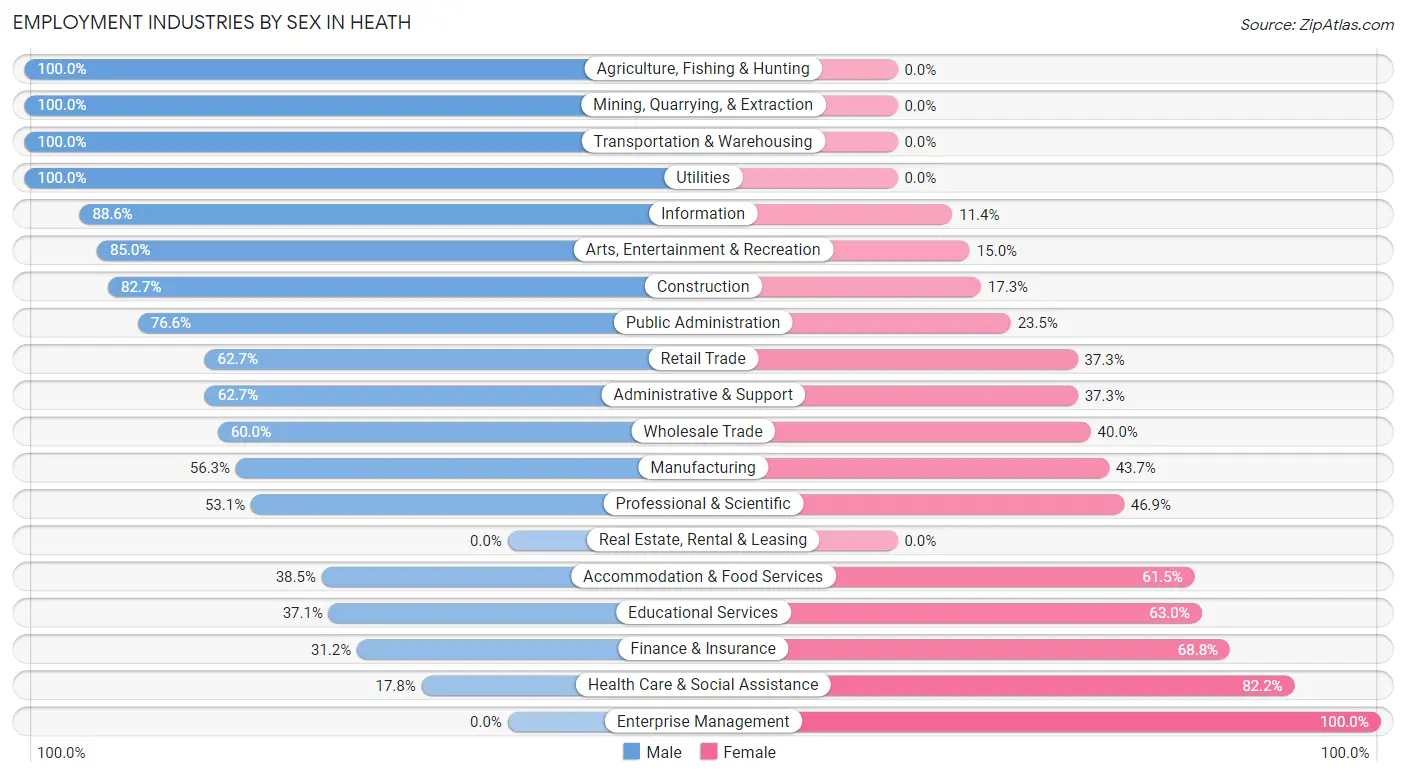
| Industry | Male | Female |
| Agriculture, Fishing & Hunting | 37 (100.0%) | 0 (0.0%) |
| Mining, Quarrying, & Extraction | 19 (100.0%) | 0 (0.0%) |
| Construction | 268 (82.7%) | 56 (17.3%) |
| Manufacturing | 386 (56.3%) | 300 (43.7%) |
| Wholesale Trade | 24 (60.0%) | 16 (40.0%) |
| Retail Trade | 377 (62.7%) | 224 (37.3%) |
| Transportation & Warehousing | 200 (100.0%) | 0 (0.0%) |
| Utilities | 37 (100.0%) | 0 (0.0%) |
| Information | 78 (88.6%) | 10 (11.4%) |
| Finance & Insurance | 97 (31.2%) | 214 (68.8%) |
| Real Estate, Rental & Leasing | 0 (0.0%) | 0 (0.0%) |
| Professional & Scientific | 144 (53.1%) | 127 (46.9%) |
| Enterprise Management | 0 (0.0%) | 7 (100.0%) |
| Administrative & Support | 178 (62.7%) | 106 (37.3%) |
| Educational Services | 113 (37.0%) | 192 (62.9%) |
| Health Care & Social Assistance | 156 (17.8%) | 719 (82.2%) |
| Arts, Entertainment & Recreation | 51 (85.0%) | 9 (15.0%) |
| Accommodation & Food Services | 77 (38.5%) | 123 (61.5%) |
| Public Administration | 173 (76.5%) | 53 (23.4%) |
| Total | 2,425 (52.3%) | 2,211 (47.7%) |
Education in Heath
School Enrollment in Heath
The most common levels of schooling among the 2,571 students in Heath are middle school (825 | 32.1%), high school (591 | 23.0%), and elementary school (541 | 21.0%).
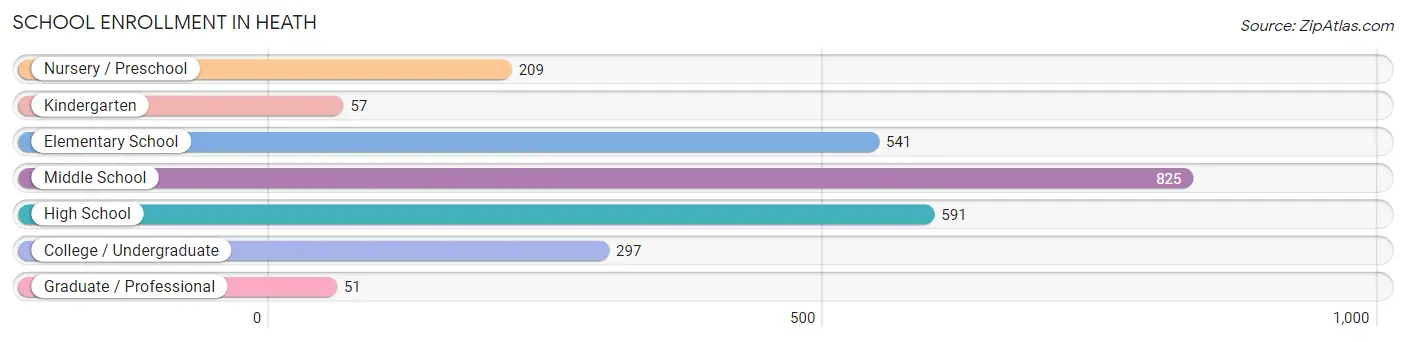
| School Level | # Students | % Students |
| Nursery / Preschool | 209 | 8.1% |
| Kindergarten | 57 | 2.2% |
| Elementary School | 541 | 21.0% |
| Middle School | 825 | 32.1% |
| High School | 591 | 23.0% |
| College / Undergraduate | 297 | 11.6% |
| Graduate / Professional | 51 | 2.0% |
| Total | 2,571 | 100.0% |
School Enrollment by Age by Funding Source in Heath
Out of a total of 2,571 students who are enrolled in schools in Heath, 329 (12.8%) attend a private institution, while the remaining 2,242 (87.2%) are enrolled in public schools. The age group of 3 to 4 year olds has the highest likelihood of being enrolled in private schools, with 79 (57.3% in the age bracket) enrolled. Conversely, the age group of 35 years and over has the lowest likelihood of being enrolled in a private school, with 77 (100.0% in the age bracket) attending a public institution.
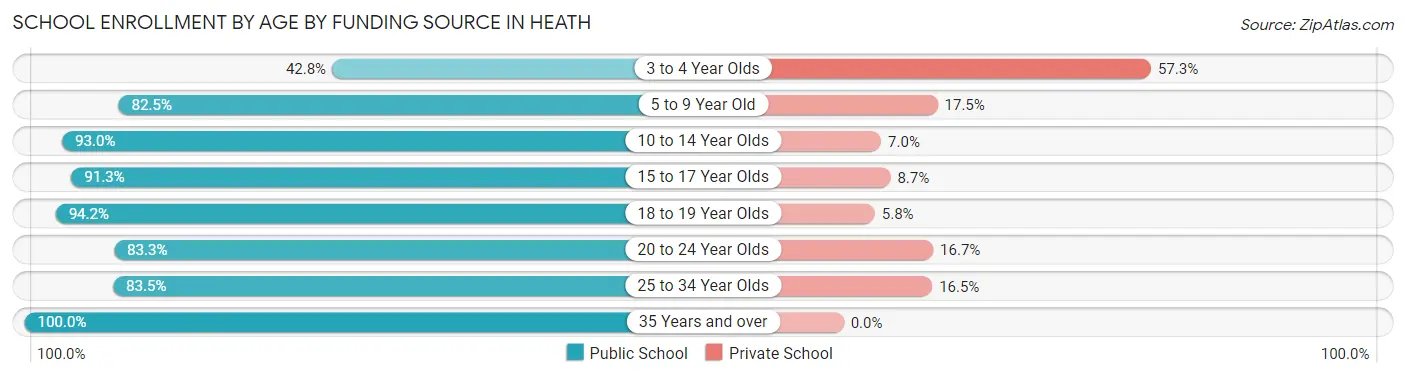
| Age Bracket | Public School | Private School |
| 3 to 4 Year Olds | 59 (42.7%) | 79 (57.3%) |
| 5 to 9 Year Old | 462 (82.5%) | 98 (17.5%) |
| 10 to 14 Year Olds | 893 (93.0%) | 67 (7.0%) |
| 15 to 17 Year Olds | 450 (91.3%) | 43 (8.7%) |
| 18 to 19 Year Olds | 130 (94.2%) | 8 (5.8%) |
| 20 to 24 Year Olds | 90 (83.3%) | 18 (16.7%) |
| 25 to 34 Year Olds | 81 (83.5%) | 16 (16.5%) |
| 35 Years and over | 77 (100.0%) | 0 (0.0%) |
| Total | 2,242 (87.2%) | 329 (12.8%) |
Educational Attainment by Field of Study in Heath
Business (382 | 20.2%), science & technology (262 | 13.8%), education (231 | 12.2%), arts & humanities (195 | 10.3%), and engineering (134 | 7.1%) are the most common fields of study among 1,893 individuals in Heath who have obtained a bachelor's degree or higher.
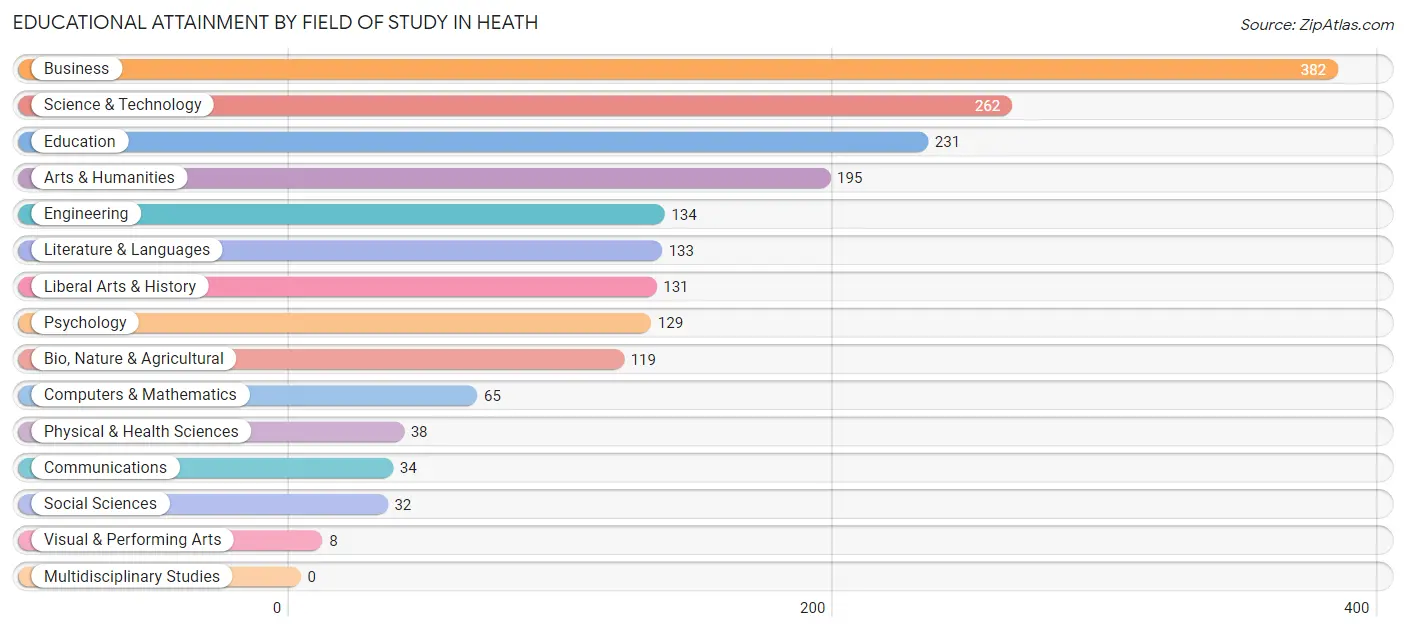
| Field of Study | # Graduates | % Graduates |
| Computers & Mathematics | 65 | 3.4% |
| Bio, Nature & Agricultural | 119 | 6.3% |
| Physical & Health Sciences | 38 | 2.0% |
| Psychology | 129 | 6.8% |
| Social Sciences | 32 | 1.7% |
| Engineering | 134 | 7.1% |
| Multidisciplinary Studies | 0 | 0.0% |
| Science & Technology | 262 | 13.8% |
| Business | 382 | 20.2% |
| Education | 231 | 12.2% |
| Literature & Languages | 133 | 7.0% |
| Liberal Arts & History | 131 | 6.9% |
| Visual & Performing Arts | 8 | 0.4% |
| Communications | 34 | 1.8% |
| Arts & Humanities | 195 | 10.3% |
| Total | 1,893 | 100.0% |
Transportation & Commute in Heath
Vehicle Availability by Sex in Heath
The most prevalent vehicle ownership categories in Heath are males with 2 vehicles (1,303, accounting for 54.2%) and females with 2 vehicles (1,092, making up 58.9%).
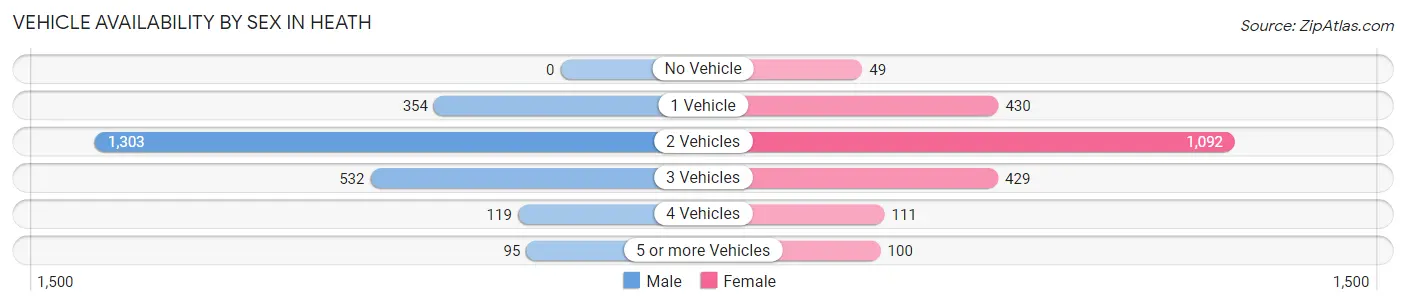
| Vehicles Available | Male | Female |
| No Vehicle | 0 (0.0%) | 49 (2.2%) |
| 1 Vehicle | 354 (14.7%) | 430 (19.5%) |
| 2 Vehicles | 1,303 (54.2%) | 1,092 (49.4%) |
| 3 Vehicles | 532 (22.1%) | 429 (19.4%) |
| 4 Vehicles | 119 (5.0%) | 111 (5.0%) |
| 5 or more Vehicles | 95 (4.0%) | 100 (4.5%) |
| Total | 2,403 (100.0%) | 2,211 (100.0%) |
Commute Time in Heath
The most frequently occuring commute durations in Heath are 15 to 19 minutes (817 commuters, 20.4%), 10 to 14 minutes (797 commuters, 19.9%), and 5 to 9 minutes (582 commuters, 14.5%).
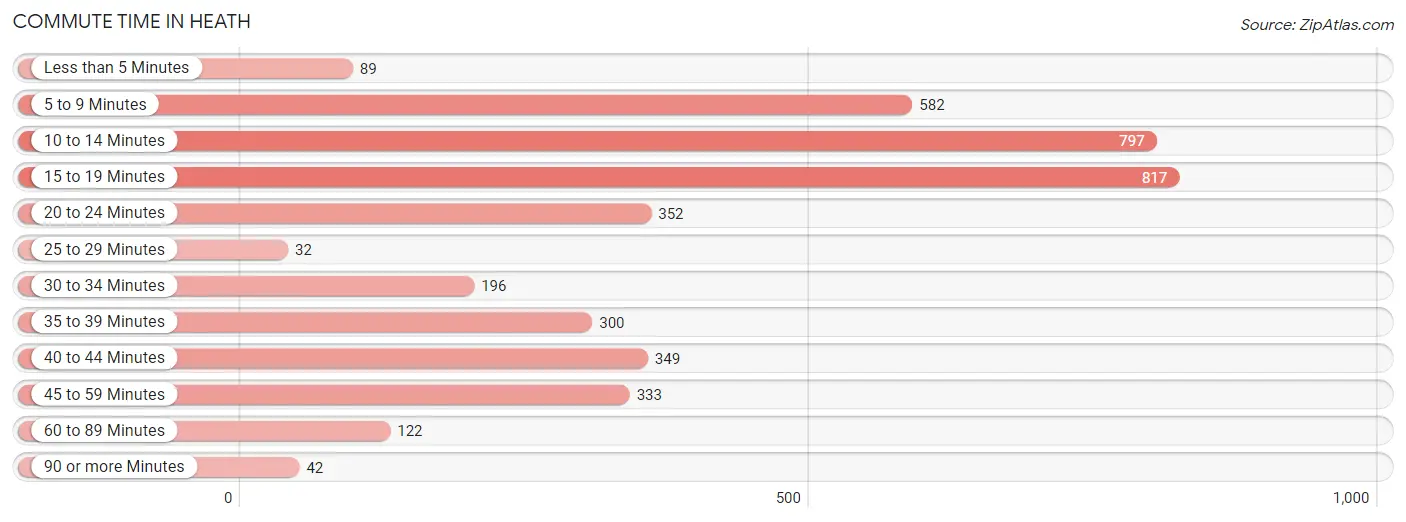
| Commute Time | # Commuters | % Commuters |
| Less than 5 Minutes | 89 | 2.2% |
| 5 to 9 Minutes | 582 | 14.5% |
| 10 to 14 Minutes | 797 | 19.9% |
| 15 to 19 Minutes | 817 | 20.4% |
| 20 to 24 Minutes | 352 | 8.8% |
| 25 to 29 Minutes | 32 | 0.8% |
| 30 to 34 Minutes | 196 | 4.9% |
| 35 to 39 Minutes | 300 | 7.5% |
| 40 to 44 Minutes | 349 | 8.7% |
| 45 to 59 Minutes | 333 | 8.3% |
| 60 to 89 Minutes | 122 | 3.0% |
| 90 or more Minutes | 42 | 1.1% |
Commute Time by Sex in Heath
The most common commute times in Heath are 15 to 19 minutes (539 commuters, 25.3%) for males and 10 to 14 minutes (514 commuters, 27.4%) for females.
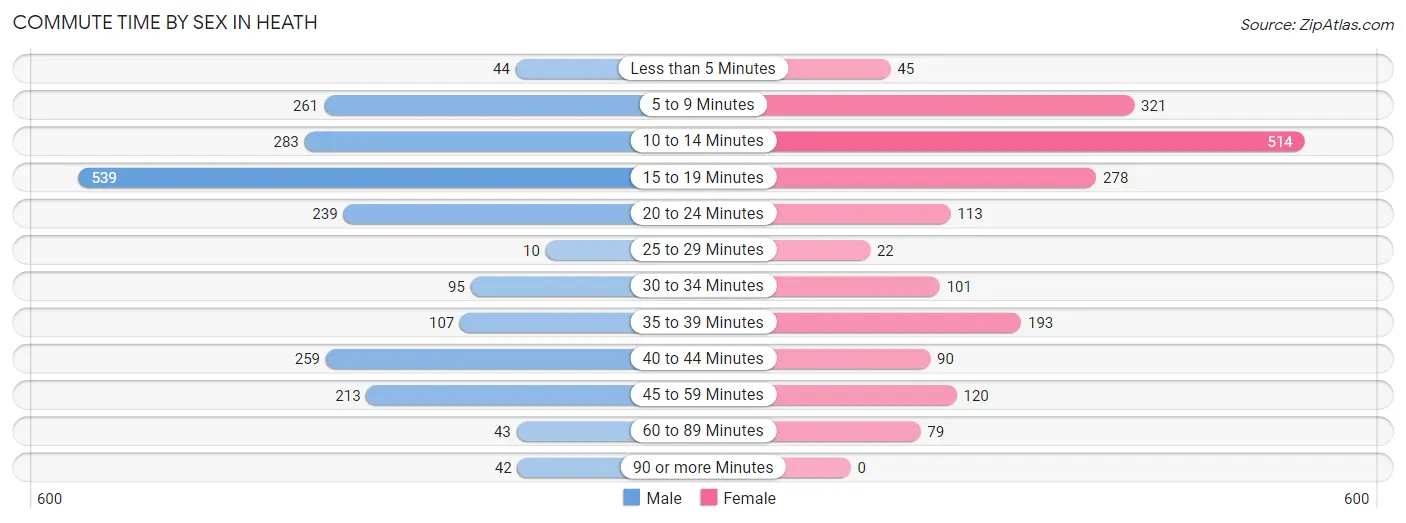
| Commute Time | Male | Female |
| Less than 5 Minutes | 44 (2.1%) | 45 (2.4%) |
| 5 to 9 Minutes | 261 (12.2%) | 321 (17.1%) |
| 10 to 14 Minutes | 283 (13.3%) | 514 (27.4%) |
| 15 to 19 Minutes | 539 (25.3%) | 278 (14.8%) |
| 20 to 24 Minutes | 239 (11.2%) | 113 (6.0%) |
| 25 to 29 Minutes | 10 (0.5%) | 22 (1.2%) |
| 30 to 34 Minutes | 95 (4.4%) | 101 (5.4%) |
| 35 to 39 Minutes | 107 (5.0%) | 193 (10.3%) |
| 40 to 44 Minutes | 259 (12.1%) | 90 (4.8%) |
| 45 to 59 Minutes | 213 (10.0%) | 120 (6.4%) |
| 60 to 89 Minutes | 43 (2.0%) | 79 (4.2%) |
| 90 or more Minutes | 42 (2.0%) | 0 (0.0%) |
Time of Departure to Work by Sex in Heath
The most frequent times of departure to work in Heath are 6:30 AM to 6:59 AM (395, 18.5%) for males and 7:00 AM to 7:29 AM (363, 19.4%) for females.
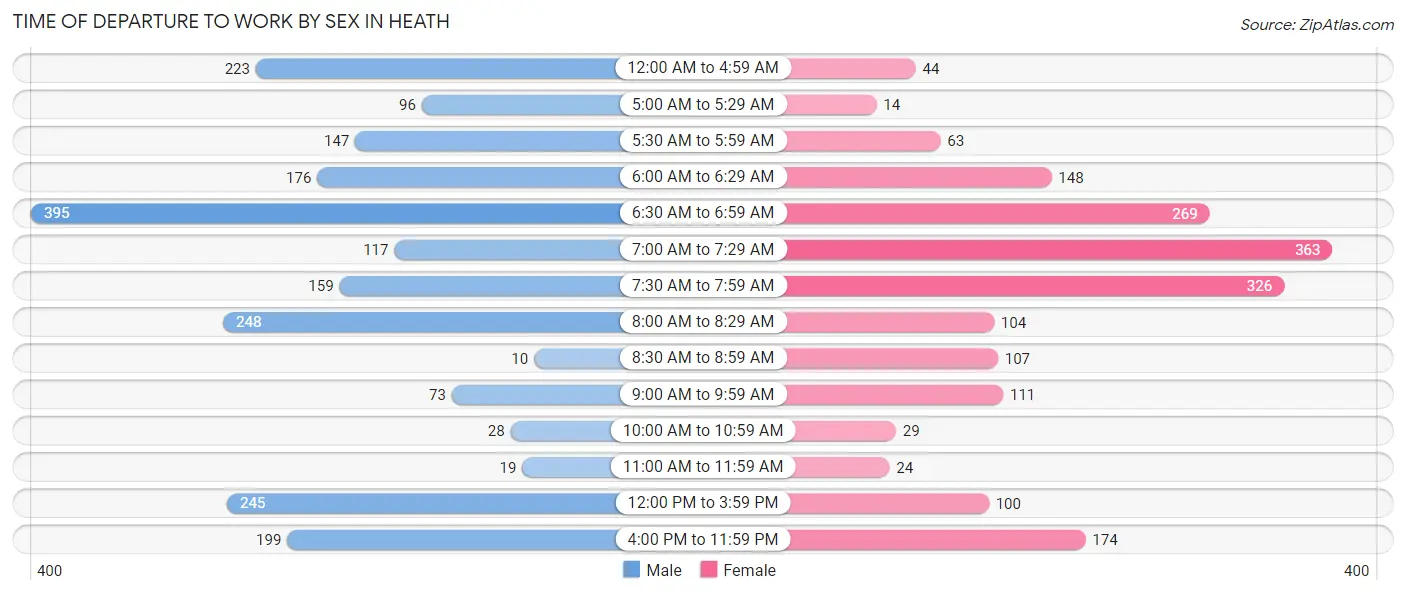
| Time of Departure | Male | Female |
| 12:00 AM to 4:59 AM | 223 (10.4%) | 44 (2.4%) |
| 5:00 AM to 5:29 AM | 96 (4.5%) | 14 (0.7%) |
| 5:30 AM to 5:59 AM | 147 (6.9%) | 63 (3.4%) |
| 6:00 AM to 6:29 AM | 176 (8.2%) | 148 (7.9%) |
| 6:30 AM to 6:59 AM | 395 (18.5%) | 269 (14.3%) |
| 7:00 AM to 7:29 AM | 117 (5.5%) | 363 (19.4%) |
| 7:30 AM to 7:59 AM | 159 (7.4%) | 326 (17.4%) |
| 8:00 AM to 8:29 AM | 248 (11.6%) | 104 (5.5%) |
| 8:30 AM to 8:59 AM | 10 (0.5%) | 107 (5.7%) |
| 9:00 AM to 9:59 AM | 73 (3.4%) | 111 (5.9%) |
| 10:00 AM to 10:59 AM | 28 (1.3%) | 29 (1.5%) |
| 11:00 AM to 11:59 AM | 19 (0.9%) | 24 (1.3%) |
| 12:00 PM to 3:59 PM | 245 (11.5%) | 100 (5.3%) |
| 4:00 PM to 11:59 PM | 199 (9.3%) | 174 (9.3%) |
| Total | 2,135 (100.0%) | 1,876 (100.0%) |
Housing Occupancy in Heath
Occupancy by Ownership in Heath
Of the total 4,085 dwellings in Heath, owner-occupied units account for 2,936 (71.9%), while renter-occupied units make up 1,149 (28.1%).
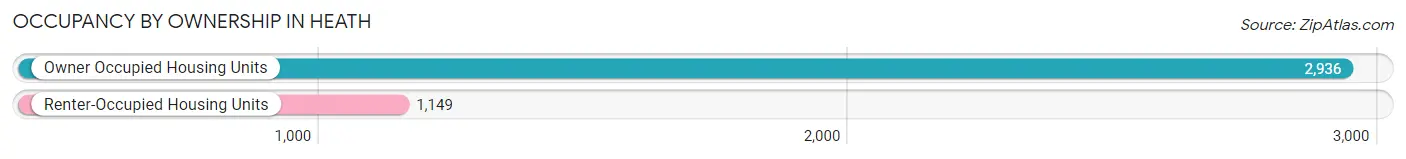
| Occupancy | # Housing Units | % Housing Units |
| Owner Occupied Housing Units | 2,936 | 71.9% |
| Renter-Occupied Housing Units | 1,149 | 28.1% |
| Total Occupied Housing Units | 4,085 | 100.0% |
Occupancy by Household Size in Heath
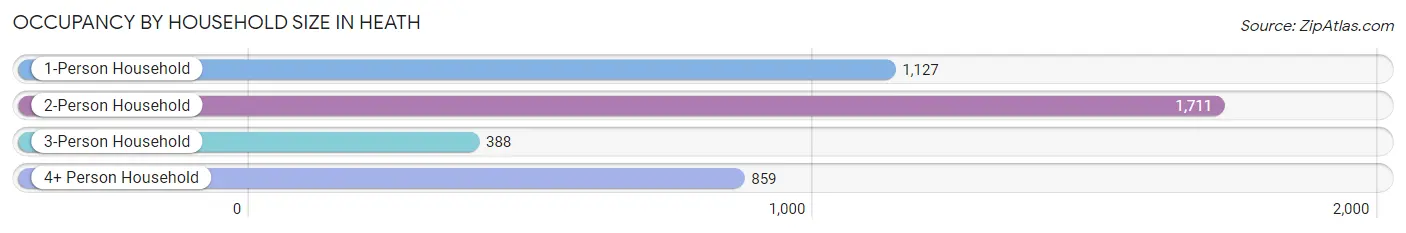
| Household Size | # Housing Units | % Housing Units |
| 1-Person Household | 1,127 | 27.6% |
| 2-Person Household | 1,711 | 41.9% |
| 3-Person Household | 388 | 9.5% |
| 4+ Person Household | 859 | 21.0% |
| Total Housing Units | 4,085 | 100.0% |
Occupancy by Ownership by Household Size in Heath
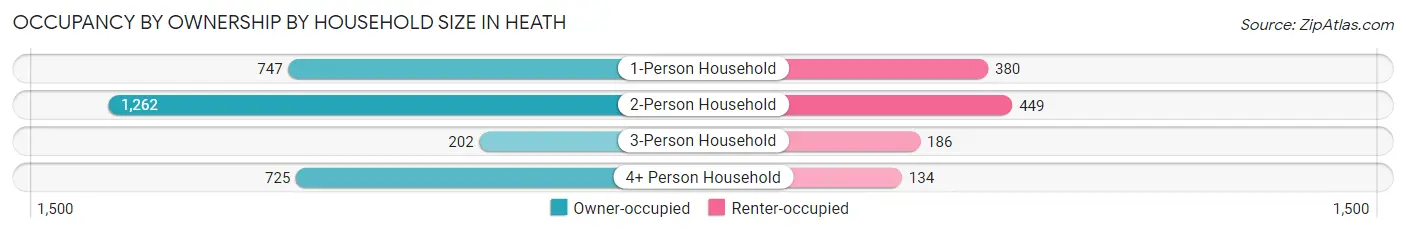
| Household Size | Owner-occupied | Renter-occupied |
| 1-Person Household | 747 (66.3%) | 380 (33.7%) |
| 2-Person Household | 1,262 (73.8%) | 449 (26.2%) |
| 3-Person Household | 202 (52.1%) | 186 (47.9%) |
| 4+ Person Household | 725 (84.4%) | 134 (15.6%) |
| Total Housing Units | 2,936 (71.9%) | 1,149 (28.1%) |
Occupancy by Educational Attainment in Heath
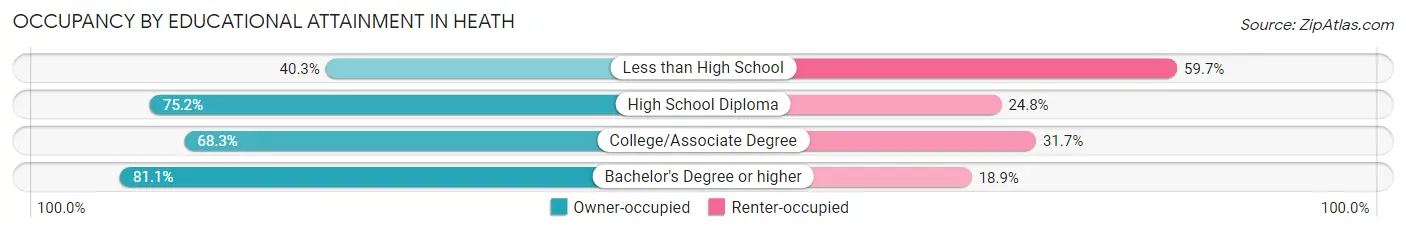
| Household Size | Owner-occupied | Renter-occupied |
| Less than High School | 100 (40.3%) | 148 (59.7%) |
| High School Diploma | 962 (75.2%) | 318 (24.8%) |
| College/Associate Degree | 1,065 (68.3%) | 494 (31.7%) |
| Bachelor's Degree or higher | 809 (81.1%) | 189 (18.9%) |
Occupancy by Age of Householder in Heath
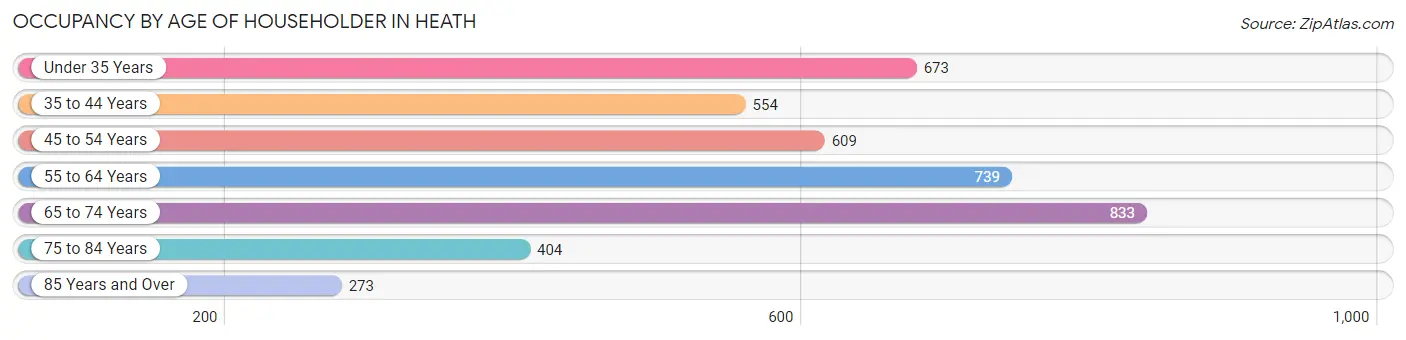
| Age Bracket | # Households | % Households |
| Under 35 Years | 673 | 16.5% |
| 35 to 44 Years | 554 | 13.6% |
| 45 to 54 Years | 609 | 14.9% |
| 55 to 64 Years | 739 | 18.1% |
| 65 to 74 Years | 833 | 20.4% |
| 75 to 84 Years | 404 | 9.9% |
| 85 Years and Over | 273 | 6.7% |
| Total | 4,085 | 100.0% |
Housing Finances in Heath
Median Income by Occupancy in Heath
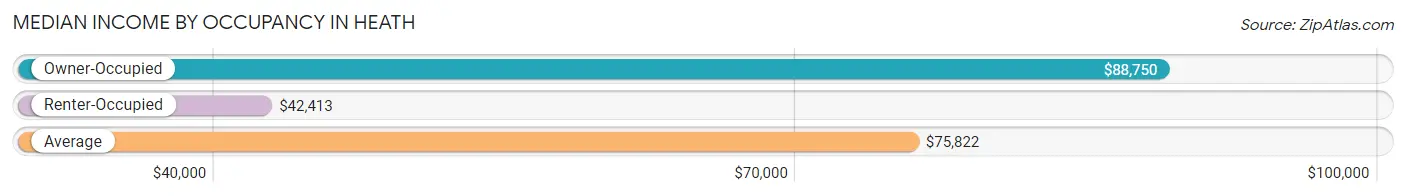
| Occupancy Type | # Households | Median Income |
| Owner-Occupied | 2,936 (71.9%) | $88,750 |
| Renter-Occupied | 1,149 (28.1%) | $42,413 |
| Average | 4,085 (100.0%) | $75,822 |
Occupancy by Householder Income Bracket in Heath
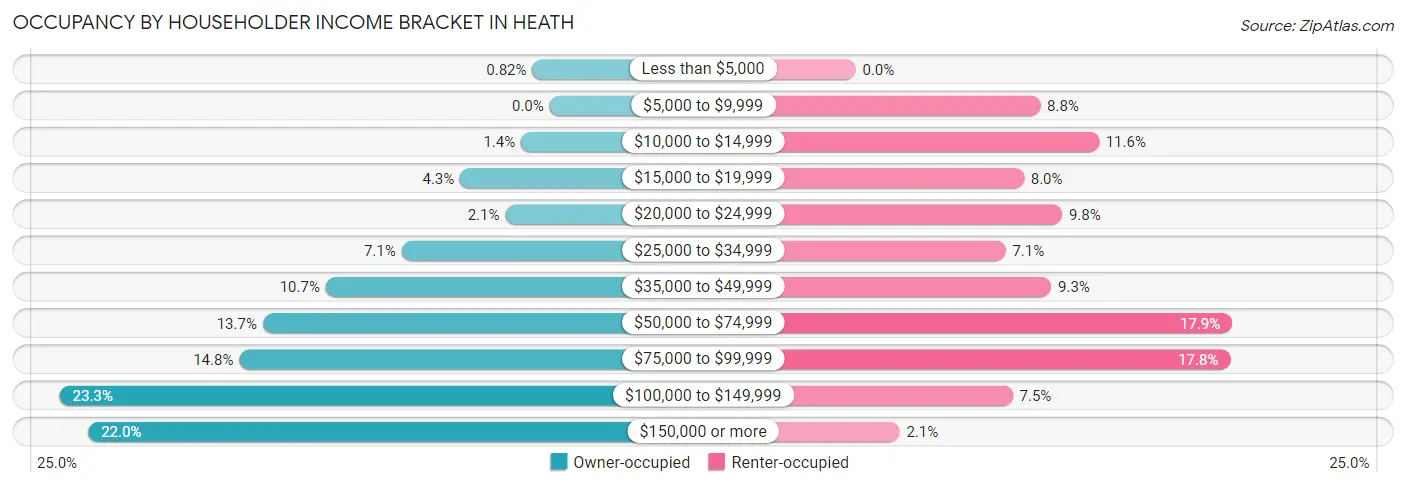
| Income Bracket | Owner-occupied | Renter-occupied |
| Less than $5,000 | 24 (0.8%) | 0 (0.0%) |
| $5,000 to $9,999 | 0 (0.0%) | 101 (8.8%) |
| $10,000 to $14,999 | 40 (1.4%) | 133 (11.6%) |
| $15,000 to $19,999 | 125 (4.3%) | 92 (8.0%) |
| $20,000 to $24,999 | 62 (2.1%) | 113 (9.8%) |
| $25,000 to $34,999 | 207 (7.0%) | 82 (7.1%) |
| $35,000 to $49,999 | 313 (10.7%) | 107 (9.3%) |
| $50,000 to $74,999 | 401 (13.7%) | 206 (17.9%) |
| $75,000 to $99,999 | 434 (14.8%) | 205 (17.8%) |
| $100,000 to $149,999 | 685 (23.3%) | 86 (7.5%) |
| $150,000 or more | 645 (22.0%) | 24 (2.1%) |
| Total | 2,936 (100.0%) | 1,149 (100.0%) |
Monthly Housing Cost Tiers in Heath
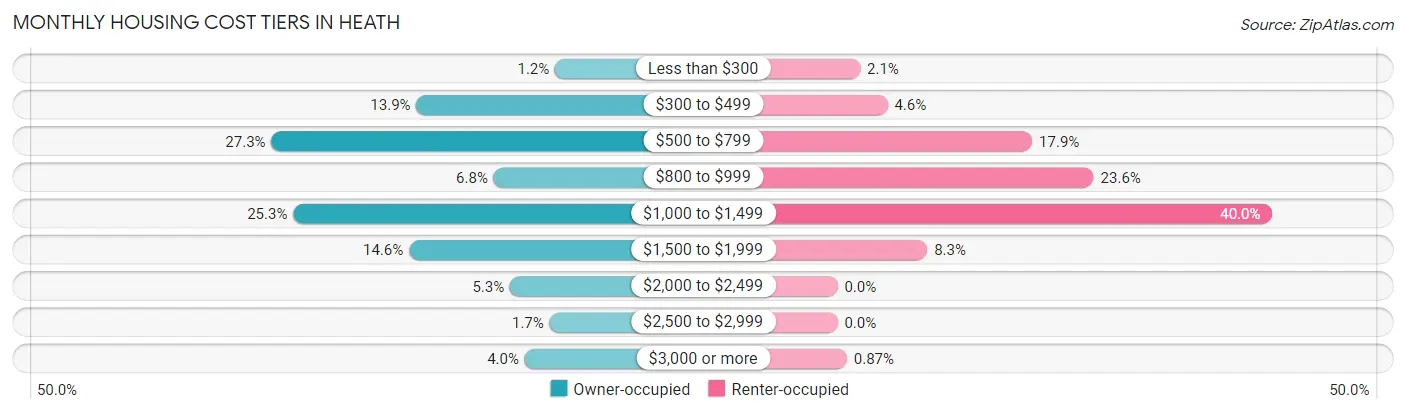
| Monthly Cost | Owner-occupied | Renter-occupied |
| Less than $300 | 34 (1.2%) | 24 (2.1%) |
| $300 to $499 | 409 (13.9%) | 53 (4.6%) |
| $500 to $799 | 801 (27.3%) | 206 (17.9%) |
| $800 to $999 | 200 (6.8%) | 271 (23.6%) |
| $1,000 to $1,499 | 742 (25.3%) | 460 (40.0%) |
| $1,500 to $1,999 | 429 (14.6%) | 95 (8.3%) |
| $2,000 to $2,499 | 156 (5.3%) | 0 (0.0%) |
| $2,500 to $2,999 | 49 (1.7%) | 0 (0.0%) |
| $3,000 or more | 116 (4.0%) | 10 (0.9%) |
| Total | 2,936 (100.0%) | 1,149 (100.0%) |
Physical Housing Characteristics in Heath
Housing Structures in Heath
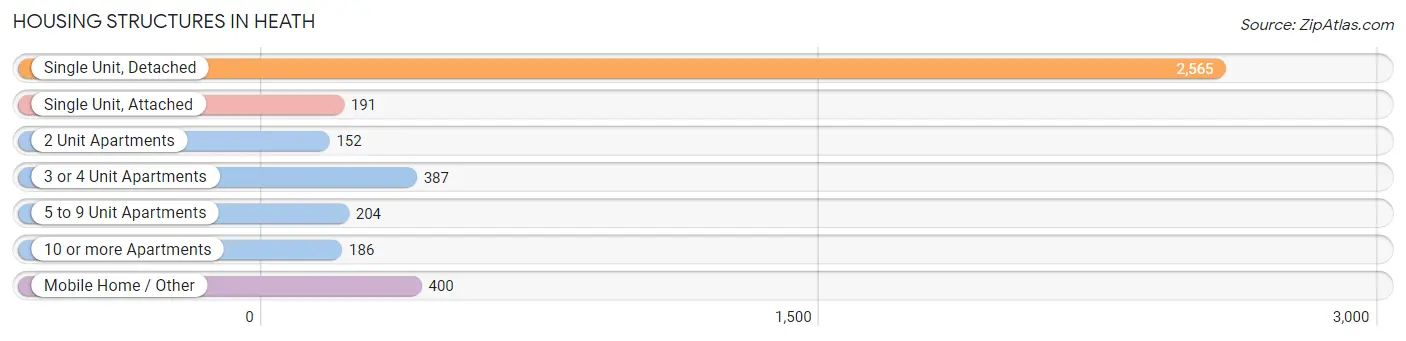
| Structure Type | # Housing Units | % Housing Units |
| Single Unit, Detached | 2,565 | 62.8% |
| Single Unit, Attached | 191 | 4.7% |
| 2 Unit Apartments | 152 | 3.7% |
| 3 or 4 Unit Apartments | 387 | 9.5% |
| 5 to 9 Unit Apartments | 204 | 5.0% |
| 10 or more Apartments | 186 | 4.5% |
| Mobile Home / Other | 400 | 9.8% |
| Total | 4,085 | 100.0% |
Housing Structures by Occupancy in Heath
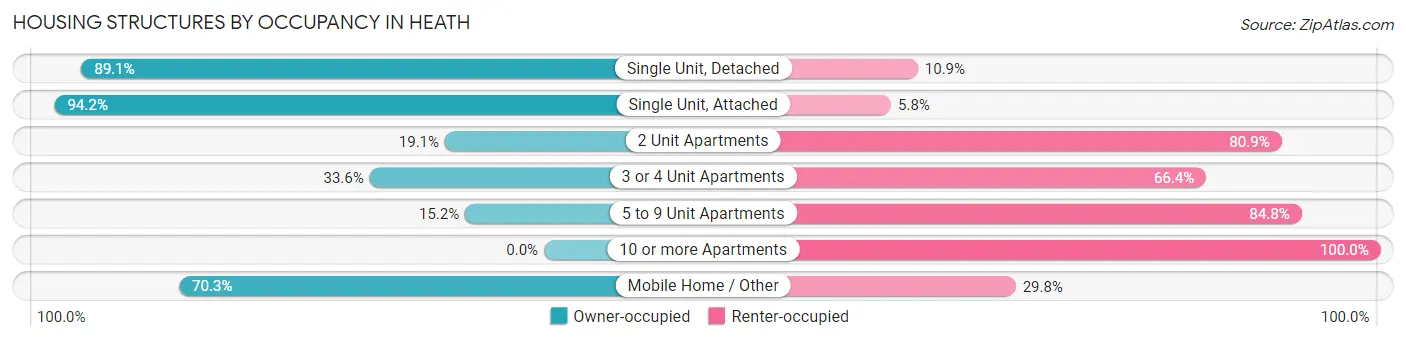
| Structure Type | Owner-occupied | Renter-occupied |
| Single Unit, Detached | 2,285 (89.1%) | 280 (10.9%) |
| Single Unit, Attached | 180 (94.2%) | 11 (5.8%) |
| 2 Unit Apartments | 29 (19.1%) | 123 (80.9%) |
| 3 or 4 Unit Apartments | 130 (33.6%) | 257 (66.4%) |
| 5 to 9 Unit Apartments | 31 (15.2%) | 173 (84.8%) |
| 10 or more Apartments | 0 (0.0%) | 186 (100.0%) |
| Mobile Home / Other | 281 (70.3%) | 119 (29.7%) |
| Total | 2,936 (71.9%) | 1,149 (28.1%) |
Housing Structures by Number of Rooms in Heath
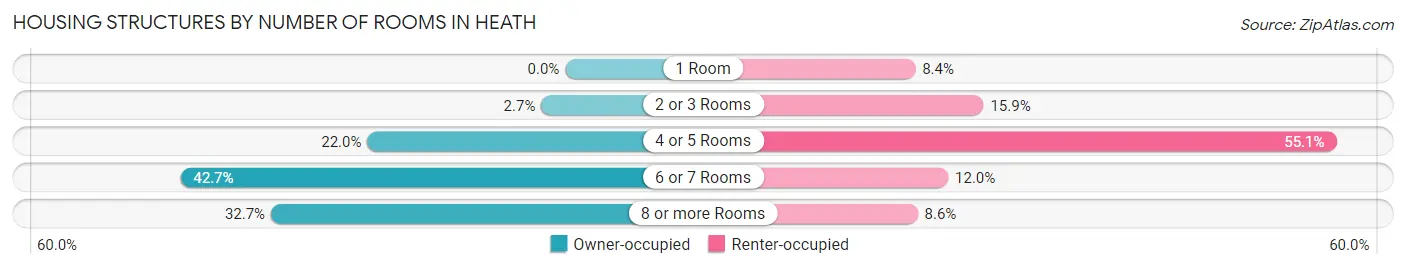
| Number of Rooms | Owner-occupied | Renter-occupied |
| 1 Room | 0 (0.0%) | 96 (8.4%) |
| 2 or 3 Rooms | 78 (2.7%) | 183 (15.9%) |
| 4 or 5 Rooms | 645 (22.0%) | 633 (55.1%) |
| 6 or 7 Rooms | 1,254 (42.7%) | 138 (12.0%) |
| 8 or more Rooms | 959 (32.7%) | 99 (8.6%) |
| Total | 2,936 (100.0%) | 1,149 (100.0%) |
Housing Structure by Heating Type in Heath
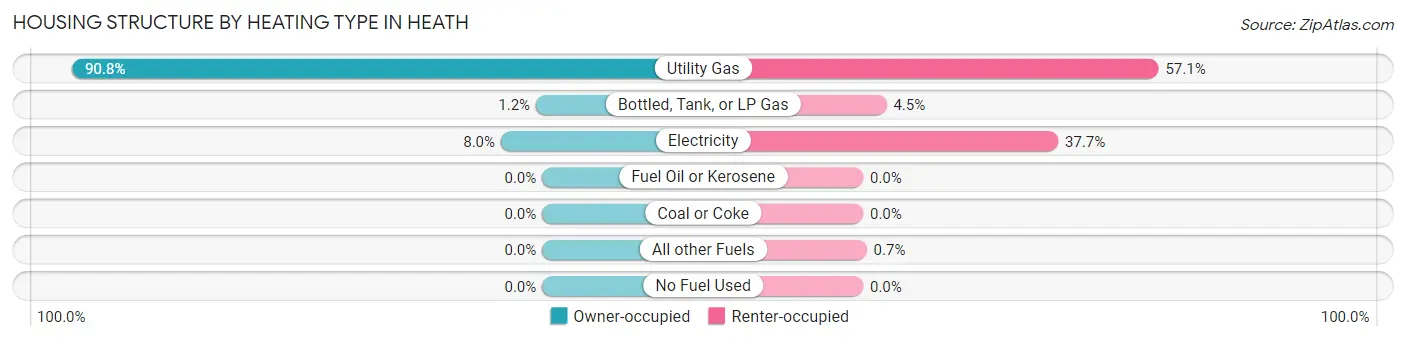
| Heating Type | Owner-occupied | Renter-occupied |
| Utility Gas | 2,667 (90.8%) | 656 (57.1%) |
| Bottled, Tank, or LP Gas | 35 (1.2%) | 52 (4.5%) |
| Electricity | 234 (8.0%) | 433 (37.7%) |
| Fuel Oil or Kerosene | 0 (0.0%) | 0 (0.0%) |
| Coal or Coke | 0 (0.0%) | 0 (0.0%) |
| All other Fuels | 0 (0.0%) | 8 (0.7%) |
| No Fuel Used | 0 (0.0%) | 0 (0.0%) |
| Total | 2,936 (100.0%) | 1,149 (100.0%) |
Household Vehicle Usage in Heath
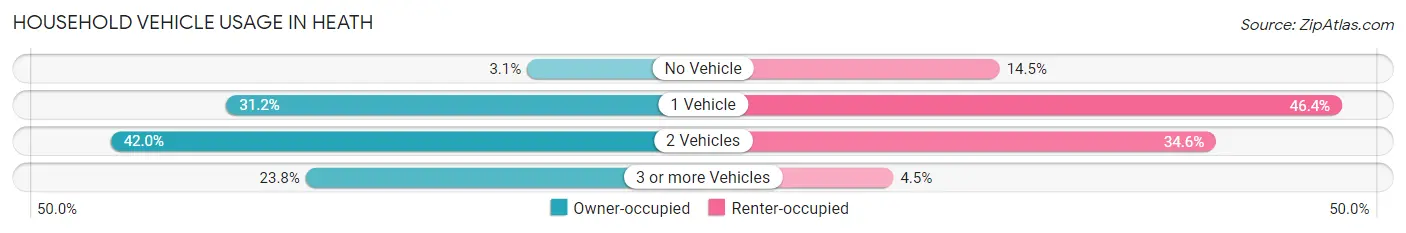
| Vehicles per Household | Owner-occupied | Renter-occupied |
| No Vehicle | 91 (3.1%) | 166 (14.4%) |
| 1 Vehicle | 915 (31.2%) | 533 (46.4%) |
| 2 Vehicles | 1,232 (42.0%) | 398 (34.6%) |
| 3 or more Vehicles | 698 (23.8%) | 52 (4.5%) |
| Total | 2,936 (100.0%) | 1,149 (100.0%) |
Real Estate & Mortgages in Heath
Real Estate and Mortgage Overview in Heath
| Characteristic | Without Mortgage | With Mortgage |
| Housing Units | 1,377 | 1,559 |
| Median Property Value | $161,800 | $204,500 |
| Median Household Income | $60,625 | $487 |
| Monthly Housing Costs | $579 | $107 |
| Real Estate Taxes | $2,493 | $14 |
Property Value by Mortgage Status in Heath
| Property Value | Without Mortgage | With Mortgage |
| Less than $50,000 | 276 (20.0%) | 11 (0.7%) |
| $50,000 to $99,999 | 69 (5.0%) | 44 (2.8%) |
| $100,000 to $299,999 | 954 (69.3%) | 1,192 (76.5%) |
| $300,000 to $499,999 | 78 (5.7%) | 263 (16.9%) |
| $500,000 to $749,999 | 0 (0.0%) | 49 (3.1%) |
| $750,000 to $999,999 | 0 (0.0%) | 0 (0.0%) |
| $1,000,000 or more | 0 (0.0%) | 0 (0.0%) |
| Total | 1,377 (100.0%) | 1,559 (100.0%) |
Household Income by Mortgage Status in Heath
| Household Income | Without Mortgage | With Mortgage |
| Less than $10,000 | 16 (1.2%) | 8 (0.5%) |
| $10,000 to $24,999 | 197 (14.3%) | 8 (0.5%) |
| $25,000 to $34,999 | 103 (7.5%) | 30 (1.9%) |
| $35,000 to $49,999 | 280 (20.3%) | 104 (6.7%) |
| $50,000 to $74,999 | 195 (14.2%) | 33 (2.1%) |
| $75,000 to $99,999 | 225 (16.3%) | 206 (13.2%) |
| $100,000 to $149,999 | 203 (14.7%) | 209 (13.4%) |
| $150,000 or more | 158 (11.5%) | 482 (30.9%) |
| Total | 1,377 (100.0%) | 1,559 (100.0%) |
Property Value to Household Income Ratio in Heath
| Value-to-Income Ratio | Without Mortgage | With Mortgage |
| Less than 2.0x | 628 (45.6%) | 120,096 (7,703.4%) |
| 2.0x to 2.9x | 268 (19.5%) | 870 (55.8%) |
| 3.0x to 3.9x | 118 (8.6%) | 341 (21.9%) |
| 4.0x or more | 363 (26.4%) | 184 (11.8%) |
| Total | 1,377 (100.0%) | 1,559 (100.0%) |
Real Estate Taxes by Mortgage Status in Heath
| Property Taxes | Without Mortgage | With Mortgage |
| Less than $800 | 140 (10.2%) | 8 (0.5%) |
| $800 to $1,499 | 81 (5.9%) | 15 (1.0%) |
| $800 to $1,499 | 1,014 (73.6%) | 150 (9.6%) |
| Total | 1,377 (100.0%) | 1,559 (100.0%) |
Health & Disability in Heath
Health Insurance Coverage by Age in Heath
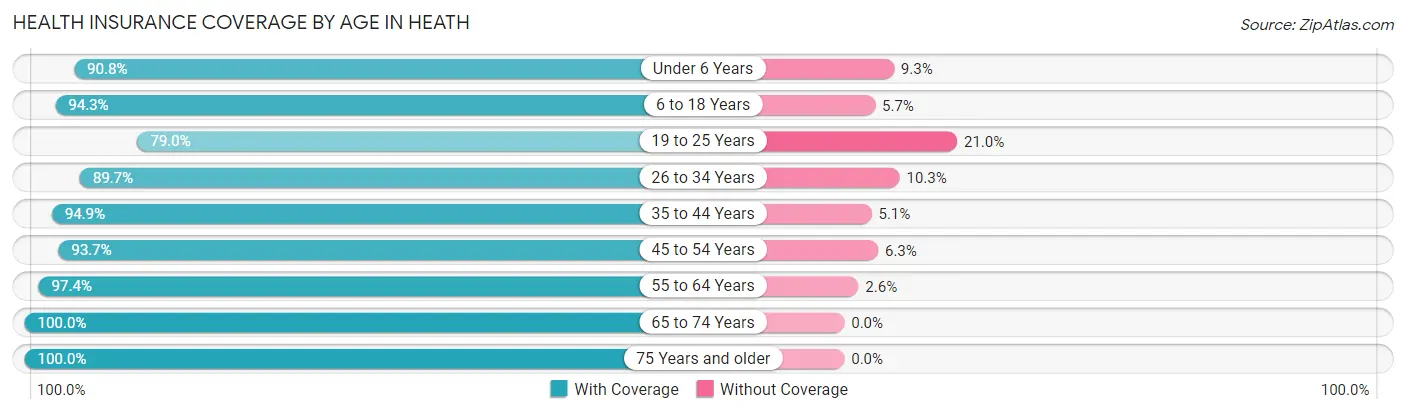
| Age Bracket | With Coverage | Without Coverage |
| Under 6 Years | 638 (90.7%) | 65 (9.2%) |
| 6 to 18 Years | 1,923 (94.3%) | 117 (5.7%) |
| 19 to 25 Years | 477 (79.0%) | 127 (21.0%) |
| 26 to 34 Years | 914 (89.7%) | 105 (10.3%) |
| 35 to 44 Years | 1,234 (94.9%) | 66 (5.1%) |
| 45 to 54 Years | 1,013 (93.7%) | 68 (6.3%) |
| 55 to 64 Years | 1,259 (97.4%) | 34 (2.6%) |
| 65 to 74 Years | 1,274 (100.0%) | 0 (0.0%) |
| 75 Years and older | 942 (100.0%) | 0 (0.0%) |
| Total | 9,674 (94.3%) | 582 (5.7%) |
Health Insurance Coverage by Citizenship Status in Heath
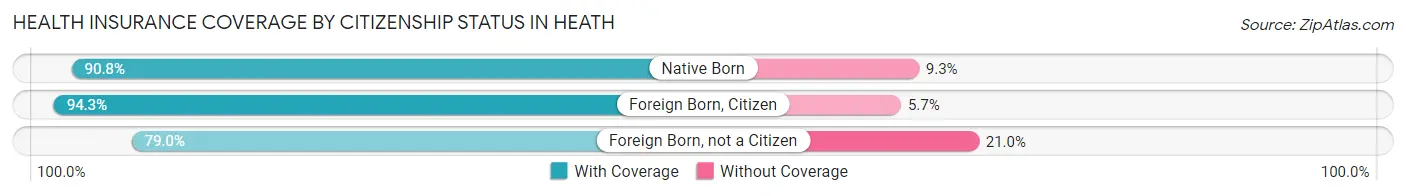
| Citizenship Status | With Coverage | Without Coverage |
| Native Born | 638 (90.7%) | 65 (9.2%) |
| Foreign Born, Citizen | 1,923 (94.3%) | 117 (5.7%) |
| Foreign Born, not a Citizen | 477 (79.0%) | 127 (21.0%) |
Health Insurance Coverage by Household Income in Heath
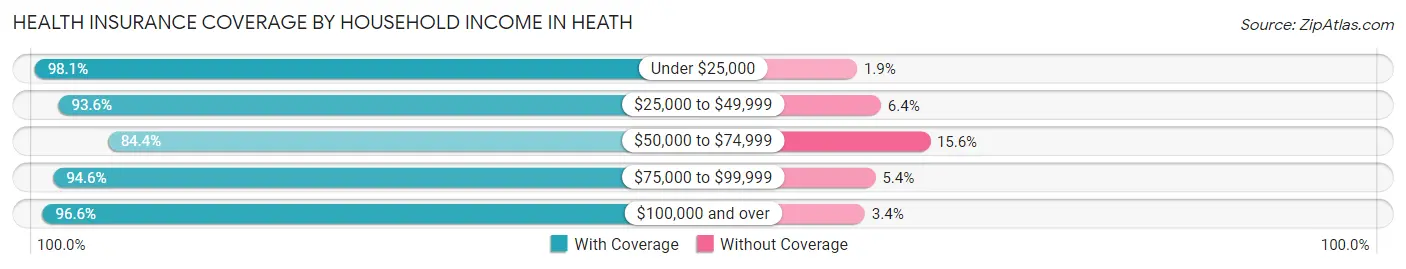
| Household Income | With Coverage | Without Coverage |
| Under $25,000 | 1,028 (98.1%) | 20 (1.9%) |
| $25,000 to $49,999 | 1,363 (93.6%) | 93 (6.4%) |
| $50,000 to $74,999 | 1,235 (84.4%) | 228 (15.6%) |
| $75,000 to $99,999 | 1,339 (94.6%) | 76 (5.4%) |
| $100,000 and over | 4,698 (96.6%) | 165 (3.4%) |
Public vs Private Health Insurance Coverage by Age in Heath
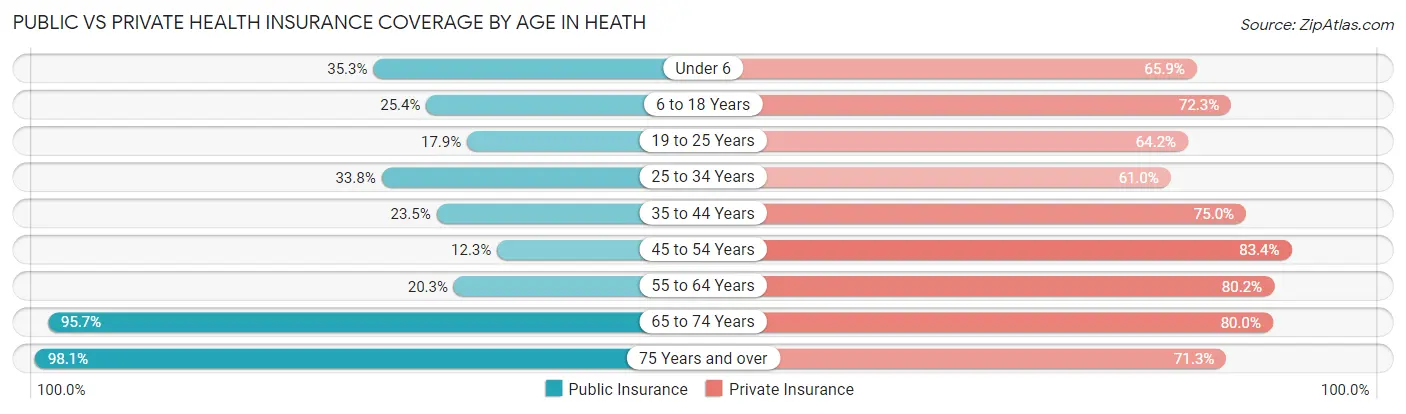
| Age Bracket | Public Insurance | Private Insurance |
| Under 6 | 248 (35.3%) | 463 (65.9%) |
| 6 to 18 Years | 519 (25.4%) | 1,474 (72.3%) |
| 19 to 25 Years | 108 (17.9%) | 388 (64.2%) |
| 25 to 34 Years | 344 (33.8%) | 622 (61.0%) |
| 35 to 44 Years | 306 (23.5%) | 975 (75.0%) |
| 45 to 54 Years | 133 (12.3%) | 902 (83.4%) |
| 55 to 64 Years | 263 (20.3%) | 1,037 (80.2%) |
| 65 to 74 Years | 1,219 (95.7%) | 1,019 (80.0%) |
| 75 Years and over | 924 (98.1%) | 672 (71.3%) |
| Total | 4,064 (39.6%) | 7,552 (73.6%) |
Disability Status by Sex by Age in Heath
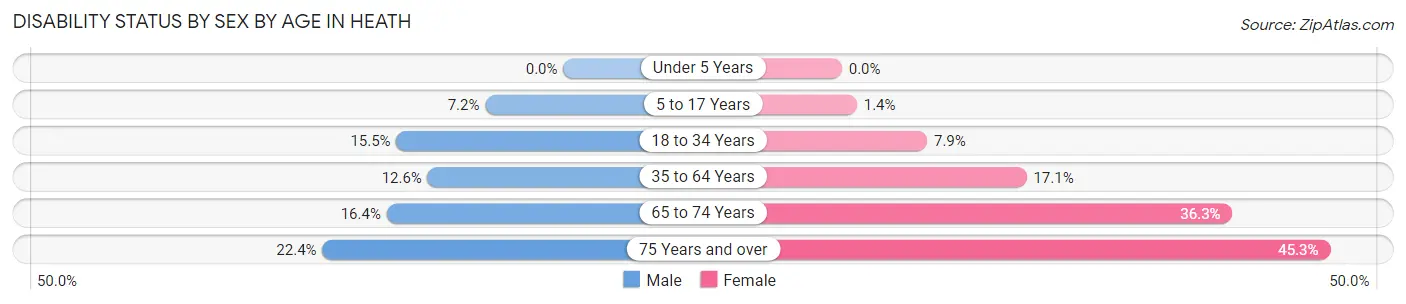
| Age Bracket | Male | Female |
| Under 5 Years | 0 (0.0%) | 0 (0.0%) |
| 5 to 17 Years | 61 (7.2%) | 17 (1.4%) |
| 18 to 34 Years | 127 (15.5%) | 71 (7.9%) |
| 35 to 64 Years | 237 (12.6%) | 307 (17.1%) |
| 65 to 74 Years | 89 (16.4%) | 265 (36.2%) |
| 75 Years and over | 74 (22.4%) | 277 (45.3%) |
Disability Class by Sex by Age in Heath
Disability Class: Hearing Difficulty
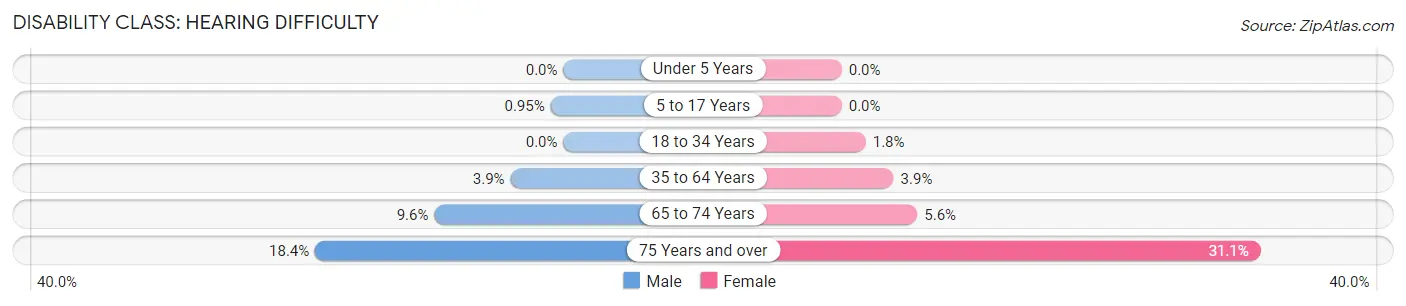
| Age Bracket | Male | Female |
| Under 5 Years | 0 (0.0%) | 0 (0.0%) |
| 5 to 17 Years | 8 (0.9%) | 0 (0.0%) |
| 18 to 34 Years | 0 (0.0%) | 16 (1.8%) |
| 35 to 64 Years | 74 (3.9%) | 69 (3.8%) |
| 65 to 74 Years | 52 (9.6%) | 41 (5.6%) |
| 75 Years and over | 61 (18.4%) | 190 (31.1%) |
Disability Class: Vision Difficulty
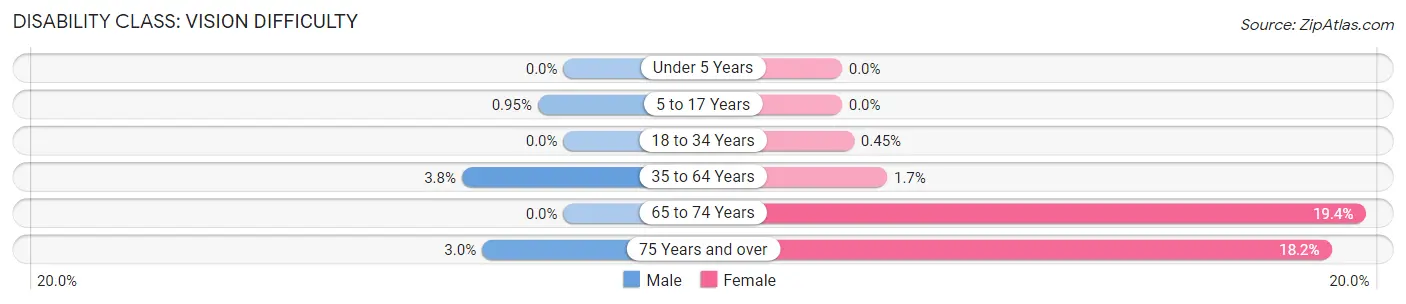
| Age Bracket | Male | Female |
| Under 5 Years | 0 (0.0%) | 0 (0.0%) |
| 5 to 17 Years | 8 (0.9%) | 0 (0.0%) |
| 18 to 34 Years | 0 (0.0%) | 4 (0.4%) |
| 35 to 64 Years | 71 (3.8%) | 30 (1.7%) |
| 65 to 74 Years | 0 (0.0%) | 142 (19.4%) |
| 75 Years and over | 10 (3.0%) | 111 (18.2%) |
Disability Class: Cognitive Difficulty
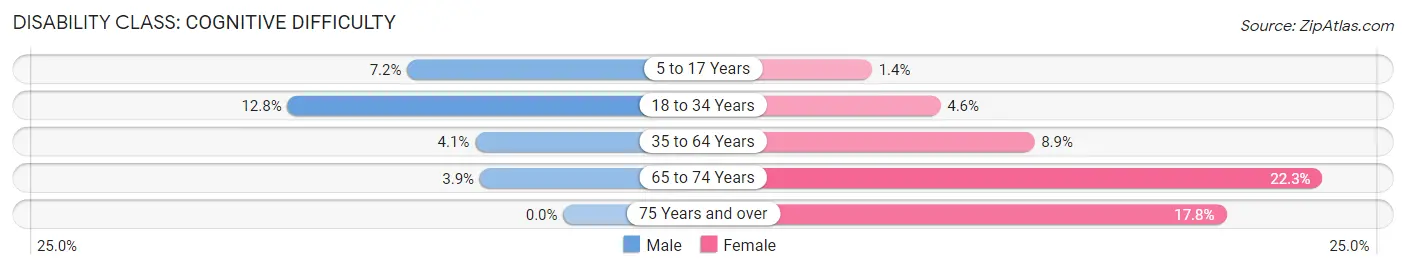
| Age Bracket | Male | Female |
| 5 to 17 Years | 61 (7.2%) | 17 (1.4%) |
| 18 to 34 Years | 105 (12.8%) | 41 (4.6%) |
| 35 to 64 Years | 77 (4.1%) | 160 (8.9%) |
| 65 to 74 Years | 21 (3.9%) | 163 (22.3%) |
| 75 Years and over | 0 (0.0%) | 109 (17.8%) |
Disability Class: Ambulatory Difficulty
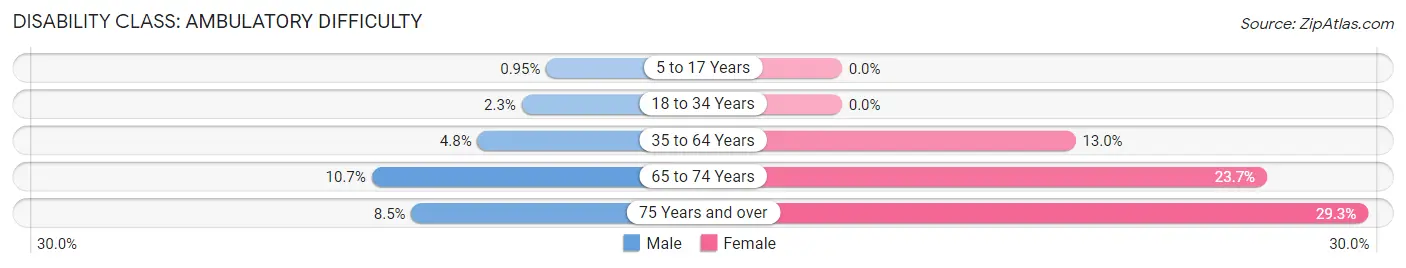
| Age Bracket | Male | Female |
| 5 to 17 Years | 8 (0.9%) | 0 (0.0%) |
| 18 to 34 Years | 19 (2.3%) | 0 (0.0%) |
| 35 to 64 Years | 90 (4.8%) | 233 (13.0%) |
| 65 to 74 Years | 58 (10.7%) | 173 (23.7%) |
| 75 Years and over | 28 (8.5%) | 179 (29.3%) |
Disability Class: Self-Care Difficulty
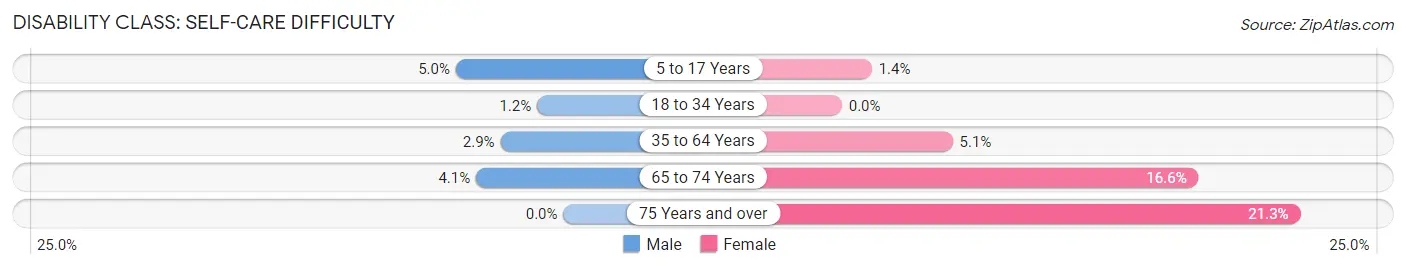
| Age Bracket | Male | Female |
| 5 to 17 Years | 42 (5.0%) | 17 (1.4%) |
| 18 to 34 Years | 10 (1.2%) | 0 (0.0%) |
| 35 to 64 Years | 55 (2.9%) | 92 (5.1%) |
| 65 to 74 Years | 22 (4.1%) | 121 (16.6%) |
| 75 Years and over | 0 (0.0%) | 130 (21.3%) |
Technology Access in Heath
Computing Device Access in Heath
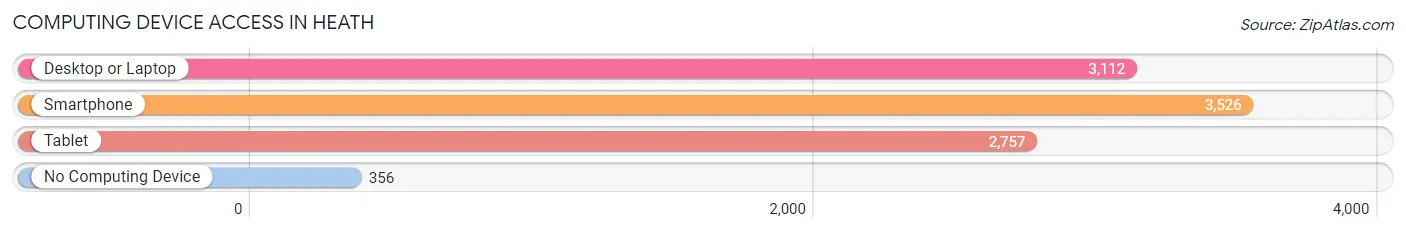
| Device Type | # Households | % Households |
| Desktop or Laptop | 3,112 | 76.2% |
| Smartphone | 3,526 | 86.3% |
| Tablet | 2,757 | 67.5% |
| No Computing Device | 356 | 8.7% |
| Total | 4,085 | 100.0% |
Internet Access in Heath
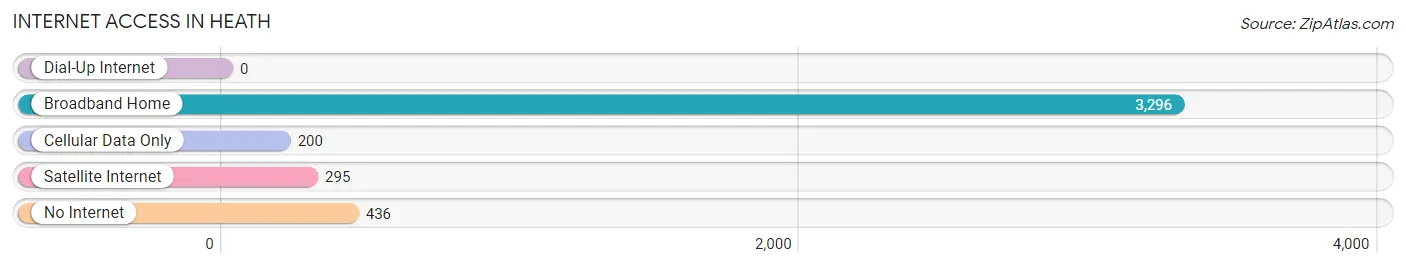
| Internet Type | # Households | % Households |
| Dial-Up Internet | 0 | 0.0% |
| Broadband Home | 3,296 | 80.7% |
| Cellular Data Only | 200 | 4.9% |
| Satellite Internet | 295 | 7.2% |
| No Internet | 436 | 10.7% |
| Total | 4,085 | 100.0% |
Heath Summary
Heath, Ohio is a small city located in Licking County, Ohio. It is situated along the banks of the Licking River, approximately 25 miles east of Columbus. The city has a population of approximately 10,000 people and is part of the Newark Metropolitan Statistical Area.
History
Heath was founded in 1816 by a group of settlers from New England. The city was named after a local landowner, John Heath. The city was incorporated in 1833 and was the first city in Licking County to be incorporated.
The city was an important stop on the Ohio and Erie Canal, which was built in the early 1800s. The canal was used to transport goods and people between the Ohio River and Lake Erie. The canal was a major factor in the growth of the city and the surrounding area.
The city was also an important stop on the Underground Railroad. The city was a safe haven for escaped slaves and was a major hub for the abolitionist movement.
Geography
Heath is located in the central part of Licking County, Ohio. The city is situated along the banks of the Licking River, approximately 25 miles east of Columbus. The city has a total area of 4.3 square miles, all of which is land.
The city is located in the Appalachian Plateau region of Ohio. The terrain is mostly flat with some rolling hills. The city is located in a humid continental climate zone, with hot summers and cold winters.
Economy
Heath is a small city with a diverse economy. The city is home to several manufacturing companies, including a paper mill, a steel mill, and a plastics factory. The city is also home to several retail stores, restaurants, and other businesses.
The city is also home to several educational institutions, including the Ohio State University at Newark and the Central Ohio Technical College.
Demographics
As of the 2010 census, the population of Heath was 10,310. The racial makeup of the city was 94.3% White, 2.2% African American, 0.3% Native American, 0.7% Asian, 0.1% Pacific Islander, 0.7% from other races, and 1.9% from two or more races. Hispanic or Latino of any race were 2.2% of the population.
The median household income in Heath was $45,945, and the median family income was $54,945. The per capita income for the city was $21,945. About 8.3% of families and 10.3% of the population were below the poverty line, including 14.2% of those under age 18 and 6.2% of those age 65 or over.
Heath is a small city with a diverse economy and a rich history. The city is home to several manufacturing companies, educational institutions, and other businesses. The city has a population of approximately 10,000 people and is part of the Newark Metropolitan Statistical Area.
Common Questions
What is Per Capita Income in Heath?
Per Capita income in Heath is $36,247.
What is the Median Family Income in Heath?
Median Family Income in Heath is $96,053.
What is the Median Household income in Heath?
Median Household Income in Heath is $75,822.
What is Income or Wage Gap in Heath?
Income or Wage Gap in Heath is 19.2%.
Women in Heath earn 80.8 cents for every dollar earned by a man.
What is Inequality or Gini Index in Heath?
Inequality or Gini Index in Heath is 0.41.
What is the Total Population of Heath?
Total Population of Heath is 10,492.
What is the Total Male Population of Heath?
Total Male Population of Heath is 4,846.
What is the Total Female Population of Heath?
Total Female Population of Heath is 5,646.
What is the Ratio of Males per 100 Females in Heath?
There are 85.83 Males per 100 Females in Heath.
What is the Ratio of Females per 100 Males in Heath?
There are 116.51 Females per 100 Males in Heath.
What is the Median Population Age in Heath?
Median Population Age in Heath is 42.0 Years.
What is the Average Family Size in Heath
Average Family Size in Heath is 3.1 People.
What is the Average Household Size in Heath
Average Household Size in Heath is 2.5 People.
How Large is the Labor Force in Heath?
There are 4,824 People in the Labor Forcein in Heath.
What is the Percentage of People in the Labor Force in Heath?
59.4% of People are in the Labor Force in Heath.
What is the Unemployment Rate in Heath?
Unemployment Rate in Heath is 3.2%.