Grover Hill, OH Map & Demographics
Grover Hill Map
Grover Hill Overview
$19,976
PER CAPITA INCOME
$70,000
AVG FAMILY INCOME
$55,227
AVG HOUSEHOLD INCOME
13.6%
WAGE / INCOME GAP [ % ]
86.4¢/ $1
WAGE / INCOME GAP [ $ ]
0.36
INEQUALITY / GINI INDEX
461
TOTAL POPULATION
220
MALE POPULATION
241
FEMALE POPULATION
91.29
MALES / 100 FEMALES
109.55
FEMALES / 100 MALES
30.3
MEDIAN AGE
4.2
AVG FAMILY SIZE
2.9
AVG HOUSEHOLD SIZE
166
LABOR FORCE [ PEOPLE ]
56.5%
PERCENT IN LABOR FORCE
6.6%
UNEMPLOYMENT RATE
Grover Hill Zip Codes
Grover Hill Area Codes
Income in Grover Hill
Income Overview in Grover Hill
Per Capita Income in Grover Hill is $19,976, while median incomes of families and households are $70,000 and $55,227 respectively.
| Characteristic | Number | Measure |
| Per Capita Income | 461 | $19,976 |
| Median Family Income | 88 | $70,000 |
| Mean Family Income | 88 | $67,761 |
| Median Household Income | 158 | $55,227 |
| Mean Household Income | 158 | $57,004 |
| Income Deficit | 88 | $0 |
| Wage / Income Gap (%) | 461 | 13.57% |
| Wage / Income Gap ($) | 461 | 86.43¢ per $1 |
| Gini / Inequality Index | 461 | 0.36 |
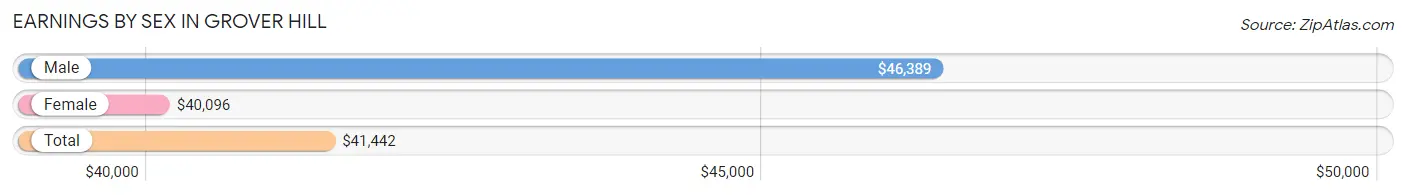
Earnings by Sex in Grover Hill
Average Earnings in Grover Hill are $41,442, $46,389 for men and $40,096 for women, a difference of 13.6%.
| Sex | Number | Average Earnings |
| Male | 94 (57.0%) | $46,389 |
| Female | 71 (43.0%) | $40,096 |
| Total | 165 (100.0%) | $41,442 |
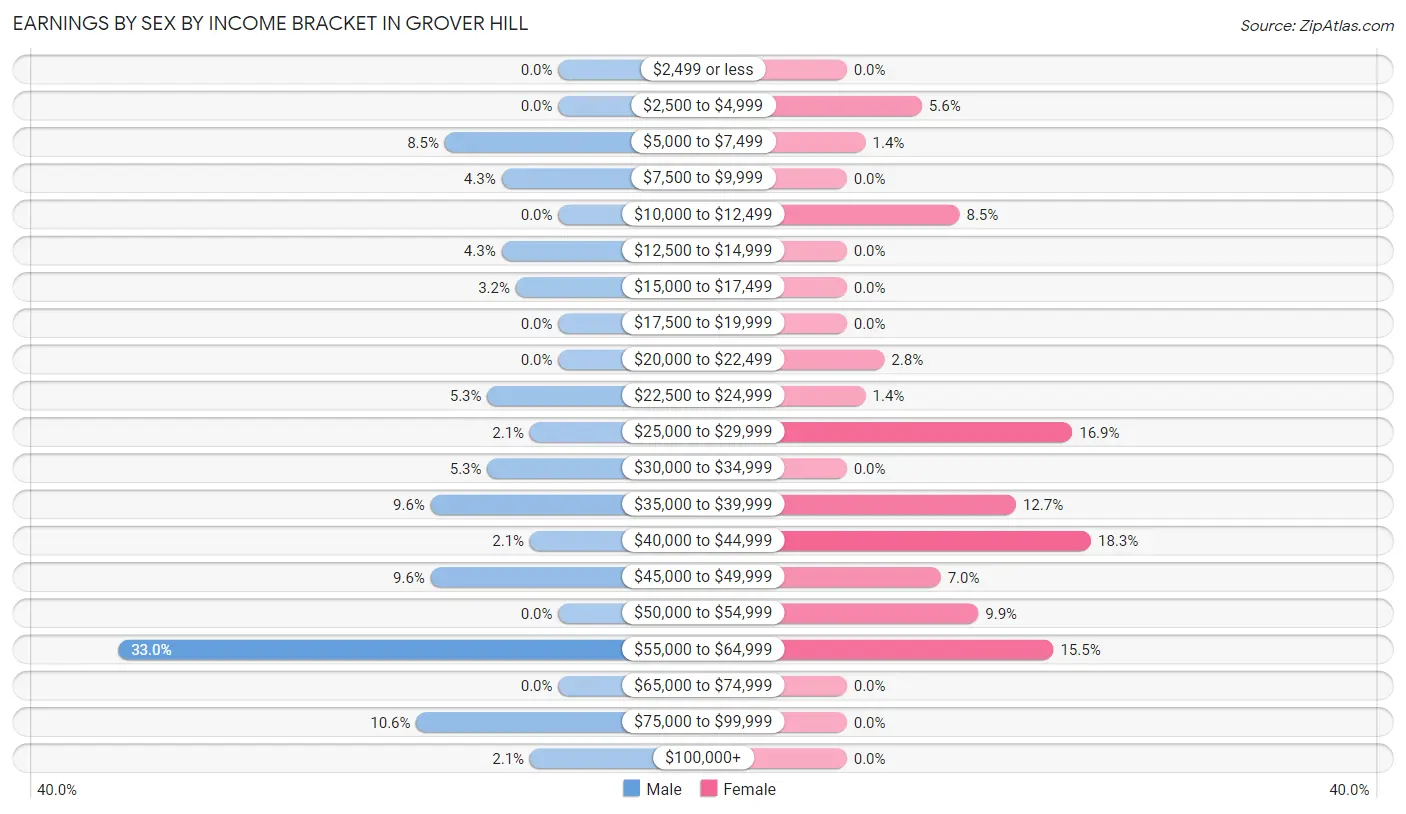
Earnings by Sex by Income Bracket in Grover Hill
The most common earnings brackets in Grover Hill are $55,000 to $64,999 for men (31 | 33.0%) and $40,000 to $44,999 for women (13 | 18.3%).
| Income | Male | Female |
| $2,499 or less | 0 (0.0%) | 0 (0.0%) |
| $2,500 to $4,999 | 0 (0.0%) | 4 (5.6%) |
| $5,000 to $7,499 | 8 (8.5%) | 1 (1.4%) |
| $7,500 to $9,999 | 4 (4.3%) | 0 (0.0%) |
| $10,000 to $12,499 | 0 (0.0%) | 6 (8.5%) |
| $12,500 to $14,999 | 4 (4.3%) | 0 (0.0%) |
| $15,000 to $17,499 | 3 (3.2%) | 0 (0.0%) |
| $17,500 to $19,999 | 0 (0.0%) | 0 (0.0%) |
| $20,000 to $22,499 | 0 (0.0%) | 2 (2.8%) |
| $22,500 to $24,999 | 5 (5.3%) | 1 (1.4%) |
| $25,000 to $29,999 | 2 (2.1%) | 12 (16.9%) |
| $30,000 to $34,999 | 5 (5.3%) | 0 (0.0%) |
| $35,000 to $39,999 | 9 (9.6%) | 9 (12.7%) |
| $40,000 to $44,999 | 2 (2.1%) | 13 (18.3%) |
| $45,000 to $49,999 | 9 (9.6%) | 5 (7.0%) |
| $50,000 to $54,999 | 0 (0.0%) | 7 (9.9%) |
| $55,000 to $64,999 | 31 (33.0%) | 11 (15.5%) |
| $65,000 to $74,999 | 0 (0.0%) | 0 (0.0%) |
| $75,000 to $99,999 | 10 (10.6%) | 0 (0.0%) |
| $100,000+ | 2 (2.1%) | 0 (0.0%) |
| Total | 94 (100.0%) | 71 (100.0%) |
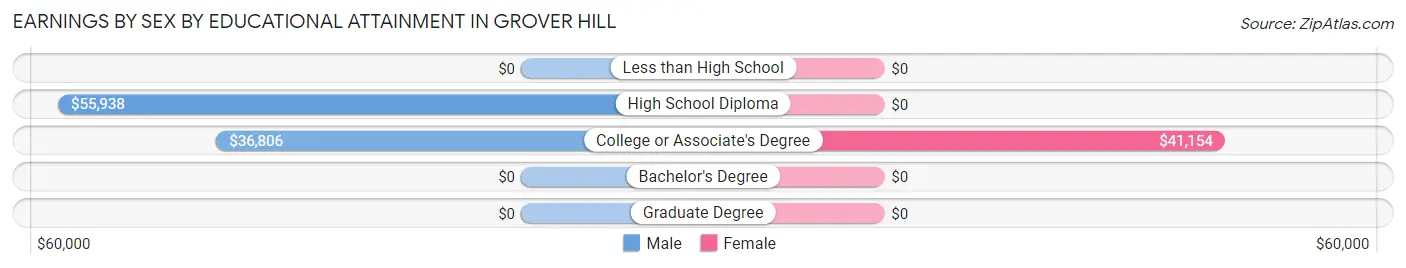
Earnings by Sex by Educational Attainment in Grover Hill
Average earnings in Grover Hill are $47,222 for men and $41,635 for women, a difference of 11.8%. Men with an educational attainment of high school diploma enjoy the highest average annual earnings of $55,938, while those with college or associate's degree education earn the least with $36,806. Women with an educational attainment of college or associate's degree earn the most with the average annual earnings of $41,154, while those with college or associate's degree education have the smallest earnings of $41,154.
| Educational Attainment | Male Income | Female Income |
| Less than High School | - | - |
| High School Diploma | $55,938 | $0 |
| College or Associate's Degree | $36,806 | $41,154 |
| Bachelor's Degree | - | - |
| Graduate Degree | - | - |
| Total | $47,222 | $41,635 |
Family Income in Grover Hill
Family Income Brackets in Grover Hill
According to the Grover Hill family income data, there are 32 families falling into the $50,000 to $74,999 income range, which is the most common income bracket and makes up 36.4% of all families.
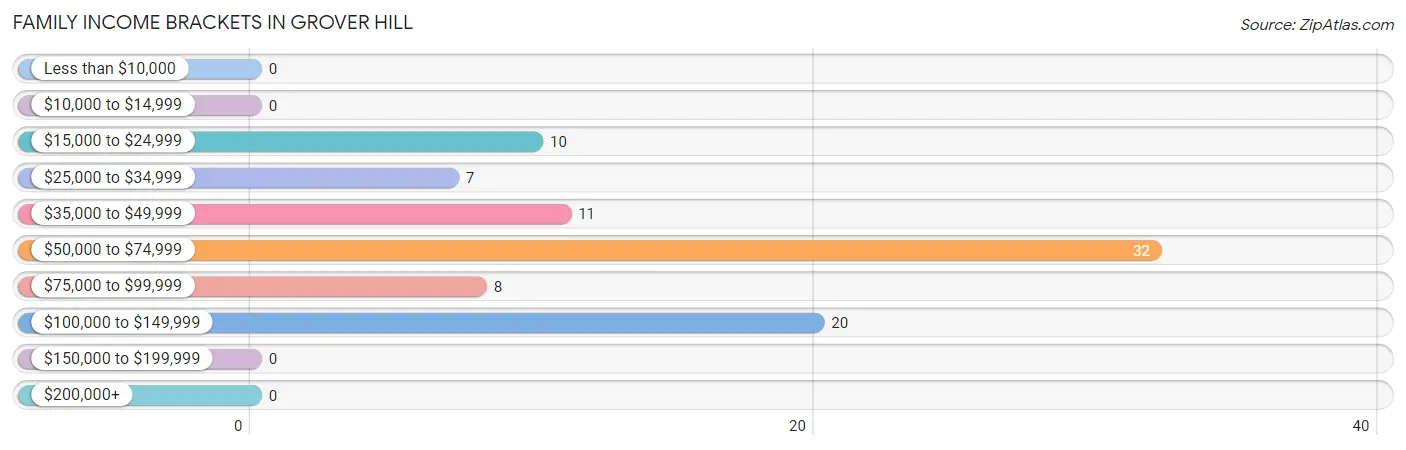
| Income Bracket | # Families | % Families |
| Less than $10,000 | 0 | 0.0% |
| $10,000 to $14,999 | 0 | 0.0% |
| $15,000 to $24,999 | 10 | 11.4% |
| $25,000 to $34,999 | 7 | 8.0% |
| $35,000 to $49,999 | 11 | 12.5% |
| $50,000 to $74,999 | 32 | 36.4% |
| $75,000 to $99,999 | 8 | 9.1% |
| $100,000 to $149,999 | 20 | 22.7% |
| $150,000 to $199,999 | 0 | 0.0% |
| $200,000+ | 0 | 0.0% |
Family Income by Famaliy Size in Grover Hill
4-person families (26 | 29.5%) account for the highest median family income in Grover Hill with $73,864 per family, while 4-person families (26 | 29.5%) have the highest median income of $18,466 per family member.
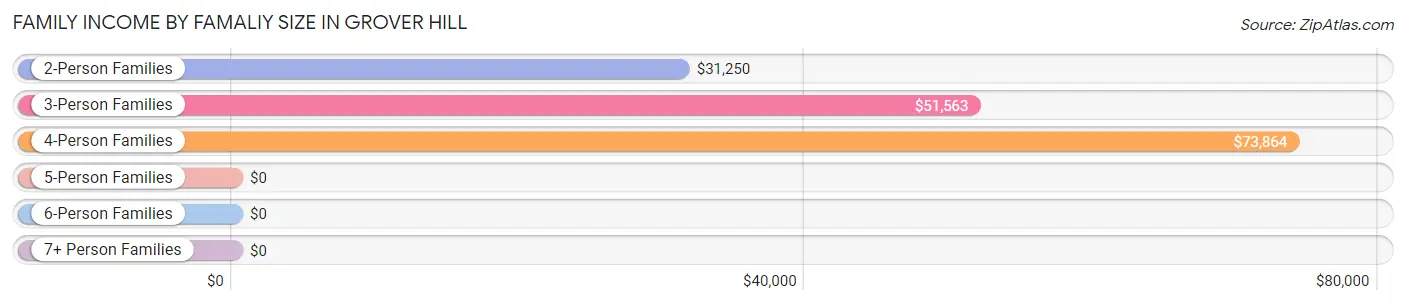
| Income Bracket | # Families | Median Income |
| 2-Person Families | 13 (14.8%) | $31,250 |
| 3-Person Families | 26 (29.5%) | $51,563 |
| 4-Person Families | 26 (29.5%) | $73,864 |
| 5-Person Families | 6 (6.8%) | $0 |
| 6-Person Families | 9 (10.2%) | $0 |
| 7+ Person Families | 8 (9.1%) | $0 |
| Total | 88 (100.0%) | $70,000 |
Family Income by Number of Earners in Grover Hill
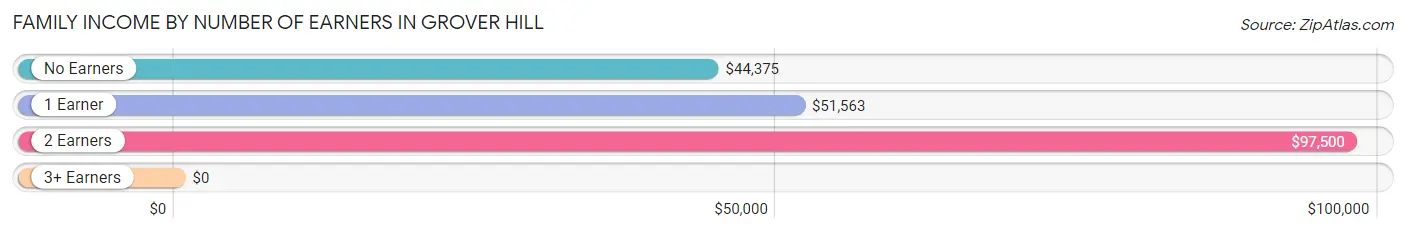
| Number of Earners | # Families | Median Income |
| No Earners | 11 (12.5%) | $44,375 |
| 1 Earner | 54 (61.4%) | $51,563 |
| 2 Earners | 18 (20.4%) | $97,500 |
| 3+ Earners | 5 (5.7%) | $0 |
| Total | 88 (100.0%) | $70,000 |
Household Income in Grover Hill
Household Income Brackets in Grover Hill
With 48 households falling in the category, the $50,000 to $74,999 income range is the most frequent in Grover Hill, accounting for 30.4% of all households.
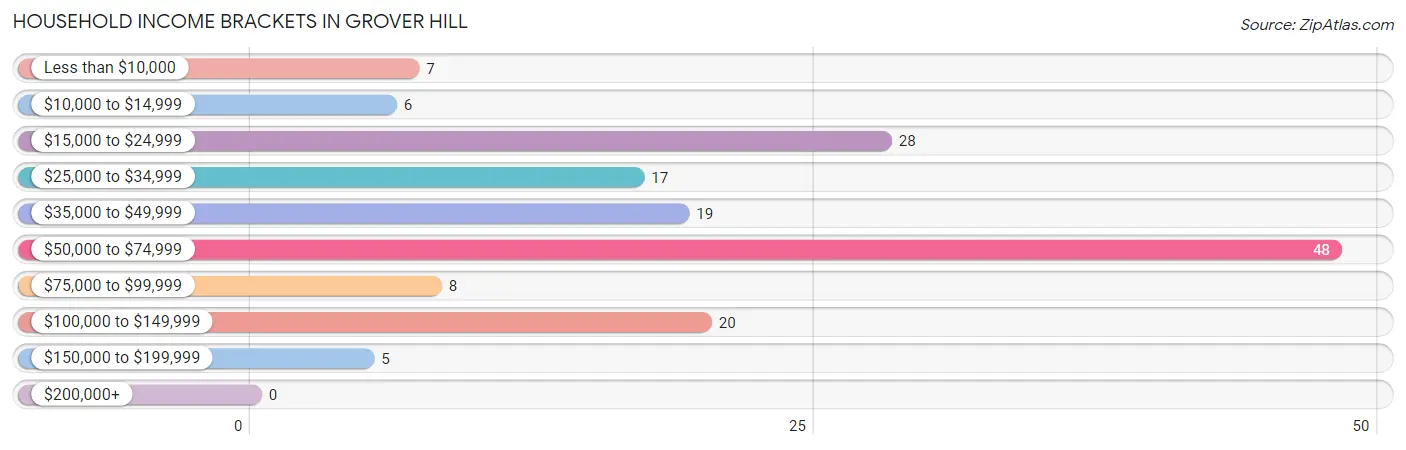
| Income Bracket | # Households | % Households |
| Less than $10,000 | 7 | 4.4% |
| $10,000 to $14,999 | 6 | 3.8% |
| $15,000 to $24,999 | 28 | 17.7% |
| $25,000 to $34,999 | 17 | 10.8% |
| $35,000 to $49,999 | 19 | 12.0% |
| $50,000 to $74,999 | 48 | 30.4% |
| $75,000 to $99,999 | 8 | 5.1% |
| $100,000 to $149,999 | 20 | 12.7% |
| $150,000 to $199,999 | 5 | 3.2% |
| $200,000+ | 0 | 0.0% |
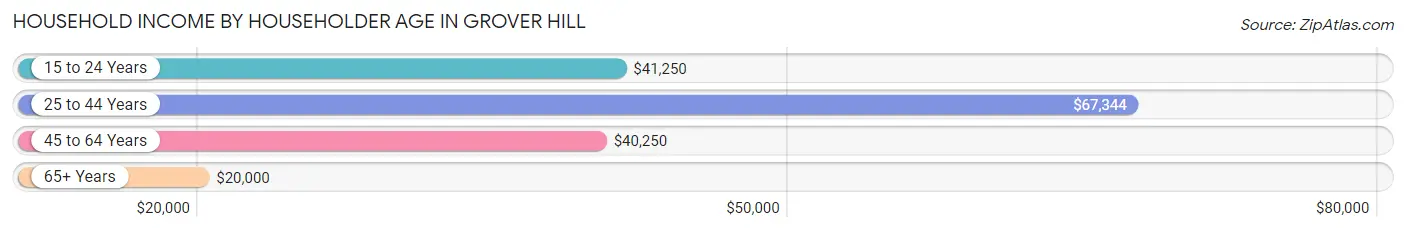
Household Income by Householder Age in Grover Hill
The median household income in Grover Hill is $55,227, with the highest median household income of $67,344 found in the 25 to 44 years age bracket for the primary householder. A total of 93 households (58.9%) fall into this category. Meanwhile, the 65+ years age bracket for the primary householder has the lowest median household income of $20,000, with 34 households (21.5%) in this group.
| Income Bracket | # Households | Median Income |
| 15 to 24 Years | 6 (3.8%) | $41,250 |
| 25 to 44 Years | 93 (58.9%) | $67,344 |
| 45 to 64 Years | 25 (15.8%) | $40,250 |
| 65+ Years | 34 (21.5%) | $20,000 |
| Total | 158 (100.0%) | $55,227 |
Poverty in Grover Hill
Income Below Poverty by Sex and Age in Grover Hill
With 16.8% poverty level for males and 12.0% for females among the residents of Grover Hill, 45 to 54 year old males and 18 to 24 year old females are the most vulnerable to poverty, with 3 males (37.5%) and 4 females (25.0%) in their respective age groups living below the poverty level.
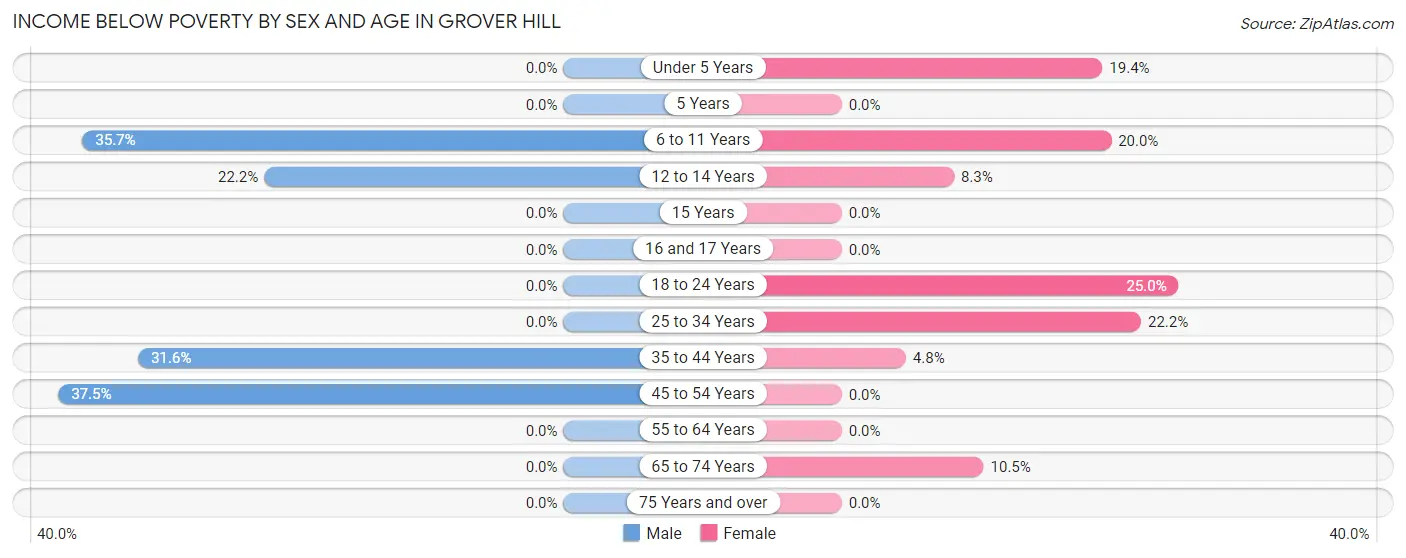
| Age Bracket | Male | Female |
| Under 5 Years | 0 (0.0%) | 6 (19.4%) |
| 5 Years | 0 (0.0%) | 0 (0.0%) |
| 6 to 11 Years | 10 (35.7%) | 4 (20.0%) |
| 12 to 14 Years | 6 (22.2%) | 3 (8.3%) |
| 15 Years | 0 (0.0%) | 0 (0.0%) |
| 16 and 17 Years | 0 (0.0%) | 0 (0.0%) |
| 18 to 24 Years | 0 (0.0%) | 4 (25.0%) |
| 25 to 34 Years | 0 (0.0%) | 8 (22.2%) |
| 35 to 44 Years | 18 (31.6%) | 2 (4.8%) |
| 45 to 54 Years | 3 (37.5%) | 0 (0.0%) |
| 55 to 64 Years | 0 (0.0%) | 0 (0.0%) |
| 65 to 74 Years | 0 (0.0%) | 2 (10.5%) |
| 75 Years and over | 0 (0.0%) | 0 (0.0%) |
| Total | 37 (16.8%) | 29 (12.0%) |
Income Above Poverty by Sex and Age in Grover Hill
According to the poverty statistics in Grover Hill, males aged under 5 years and females aged 5 years are the age groups that are most secure financially, with 100.0% of males and 100.0% of females in these age groups living above the poverty line.
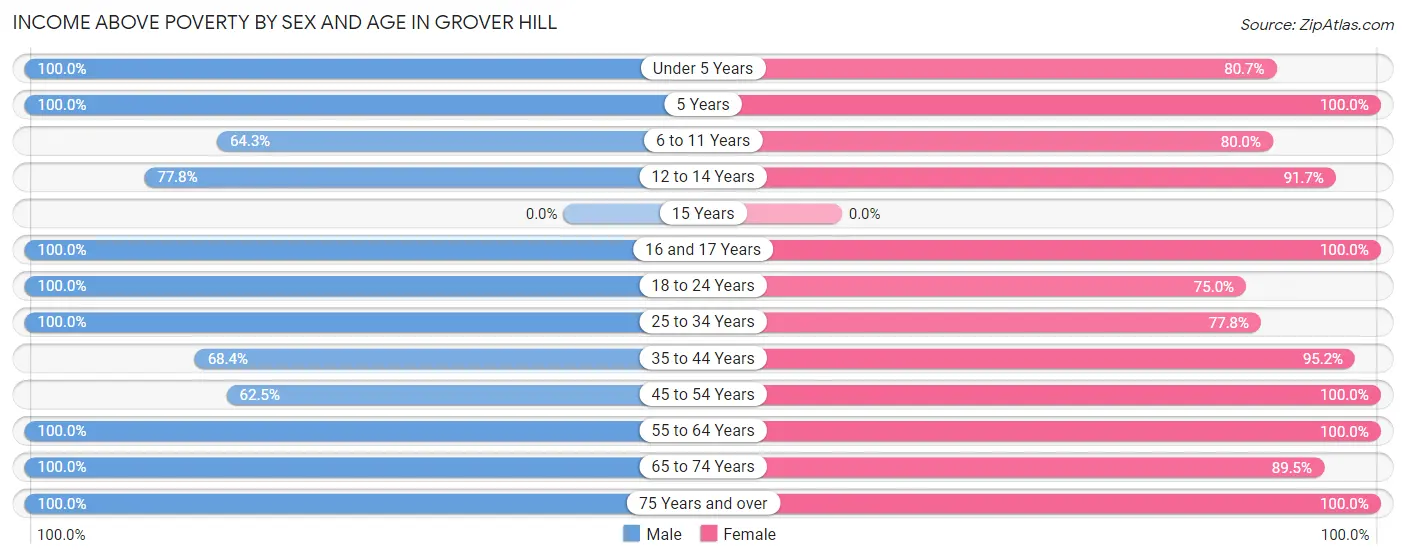
| Age Bracket | Male | Female |
| Under 5 Years | 21 (100.0%) | 25 (80.6%) |
| 5 Years | 3 (100.0%) | 1 (100.0%) |
| 6 to 11 Years | 18 (64.3%) | 16 (80.0%) |
| 12 to 14 Years | 21 (77.8%) | 33 (91.7%) |
| 15 Years | 0 (0.0%) | 0 (0.0%) |
| 16 and 17 Years | 17 (100.0%) | 4 (100.0%) |
| 18 to 24 Years | 10 (100.0%) | 12 (75.0%) |
| 25 to 34 Years | 20 (100.0%) | 28 (77.8%) |
| 35 to 44 Years | 39 (68.4%) | 40 (95.2%) |
| 45 to 54 Years | 5 (62.5%) | 14 (100.0%) |
| 55 to 64 Years | 8 (100.0%) | 13 (100.0%) |
| 65 to 74 Years | 14 (100.0%) | 17 (89.5%) |
| 75 Years and over | 7 (100.0%) | 9 (100.0%) |
| Total | 183 (83.2%) | 212 (88.0%) |
Income Below Poverty Among Married-Couple Families in Grover Hill
The poverty statistics for married-couple families in Grover Hill show that 11.0% or 8 of the total 73 families live below the poverty line. Families with 5 or more children have the highest poverty rate of 100.0%, comprising of 3 families. On the other hand, families with no children have the lowest poverty rate of 0.0%, which includes 0 families.
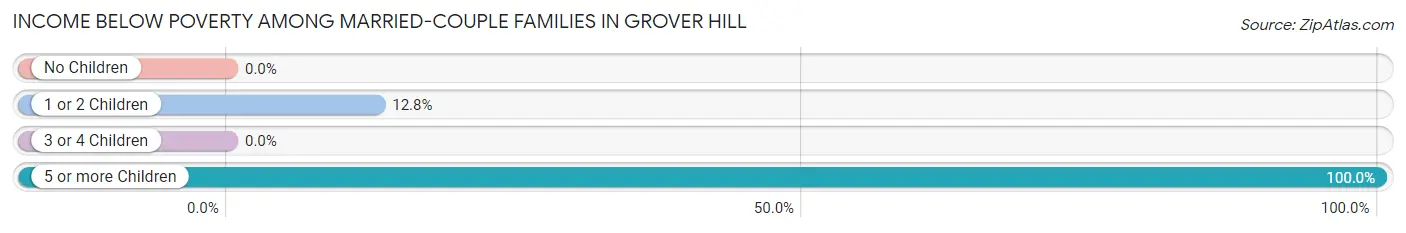
| Children | Above Poverty | Below Poverty |
| No Children | 11 (100.0%) | 0 (0.0%) |
| 1 or 2 Children | 34 (87.2%) | 5 (12.8%) |
| 3 or 4 Children | 20 (100.0%) | 0 (0.0%) |
| 5 or more Children | 0 (0.0%) | 3 (100.0%) |
| Total | 65 (89.0%) | 8 (11.0%) |
Income Below Poverty Among Single-Parent Households in Grover Hill
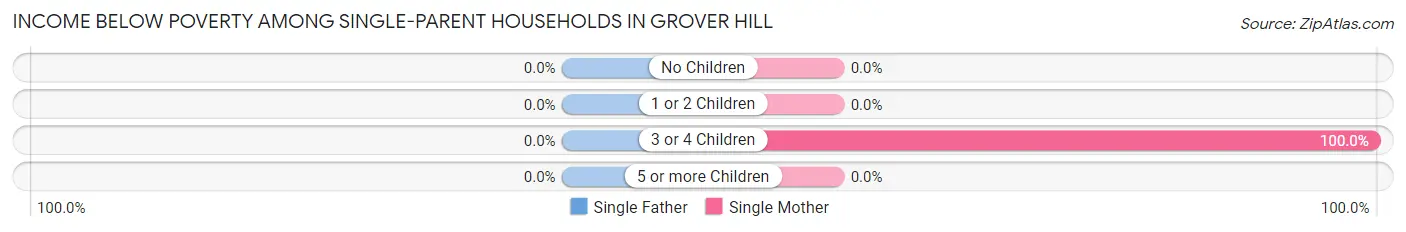
| Children | Single Father | Single Mother |
| No Children | 0 (0.0%) | 0 (0.0%) |
| 1 or 2 Children | 0 (0.0%) | 0 (0.0%) |
| 3 or 4 Children | 0 (0.0%) | 2 (100.0%) |
| 5 or more Children | 0 (0.0%) | 0 (0.0%) |
| Total | 0 (0.0%) | 2 (14.3%) |
Income Below Poverty Among Married-Couple vs Single-Parent Households in Grover Hill
The poverty data for Grover Hill shows that 8 of the married-couple family households (11.0%) and 2 of the single-parent households (13.3%) are living below the poverty level. Within the married-couple family households, those with 5 or more children have the highest poverty rate, with 3 households (100.0%) falling below the poverty line. Among the single-parent households, those with 3 or 4 children have the highest poverty rate, with 2 household (100.0%) living below poverty.
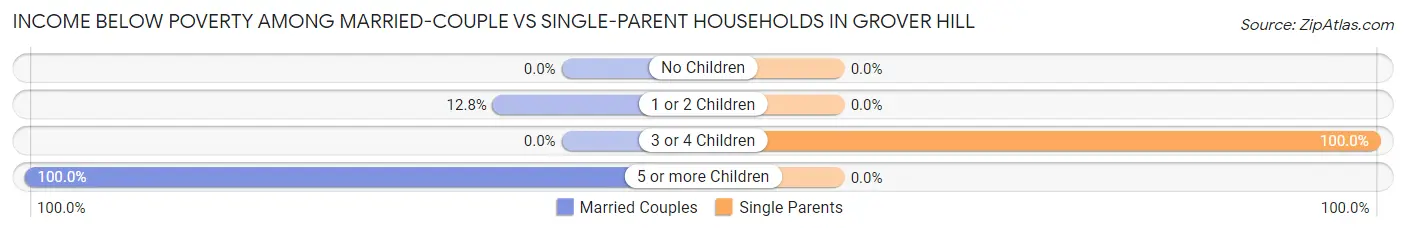
| Children | Married-Couple Families | Single-Parent Households |
| No Children | 0 (0.0%) | 0 (0.0%) |
| 1 or 2 Children | 5 (12.8%) | 0 (0.0%) |
| 3 or 4 Children | 0 (0.0%) | 2 (100.0%) |
| 5 or more Children | 3 (100.0%) | 0 (0.0%) |
| Total | 8 (11.0%) | 2 (13.3%) |
Race in Grover Hill
The most populous races in Grover Hill are White / Caucasian (443 | 96.1%), Hispanic or Latino (18 | 3.9%), and Some other Race (14 | 3.0%).
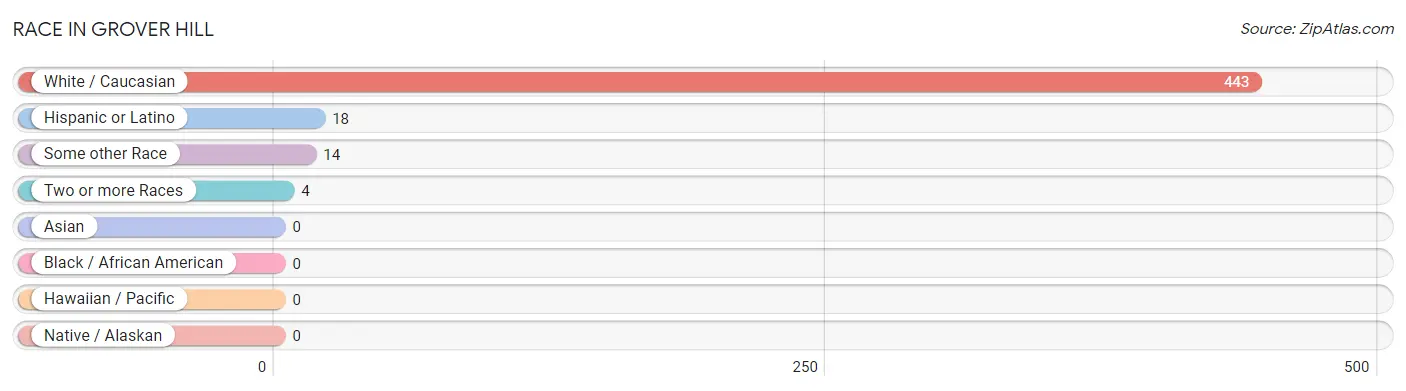
| Race | # Population | % Population |
| Asian | 0 | 0.0% |
| Black / African American | 0 | 0.0% |
| Hawaiian / Pacific | 0 | 0.0% |
| Hispanic or Latino | 18 | 3.9% |
| Native / Alaskan | 0 | 0.0% |
| White / Caucasian | 443 | 96.1% |
| Two or more Races | 4 | 0.9% |
| Some other Race | 14 | 3.0% |
| Total | 461 | 100.0% |
Ancestry in Grover Hill
The most populous ancestries reported in Grover Hill are German (79 | 17.1%), Irish (31 | 6.7%), English (23 | 5.0%), Mexican (18 | 3.9%), and American (14 | 3.0%), together accounting for 35.8% of all Grover Hill residents.
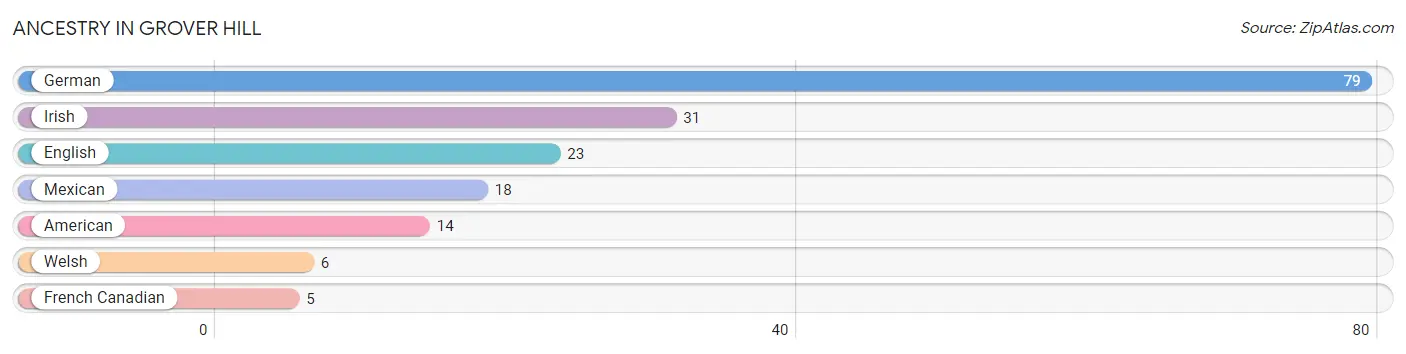
| Ancestry | # Population | % Population |
| American | 14 | 3.0% |
| English | 23 | 5.0% |
| French Canadian | 5 | 1.1% |
| German | 79 | 17.1% |
| Irish | 31 | 6.7% |
| Mexican | 18 | 3.9% |
| Welsh | 6 | 1.3% | View All 7 Rows |
Immigrants in Grover Hill
The most numerous immigrant groups reported in Grover Hill came from Central America (1 | 0.2%), Latin America (1 | 0.2%), and Mexico (1 | 0.2%), together accounting for 0.7% of all Grover Hill residents.
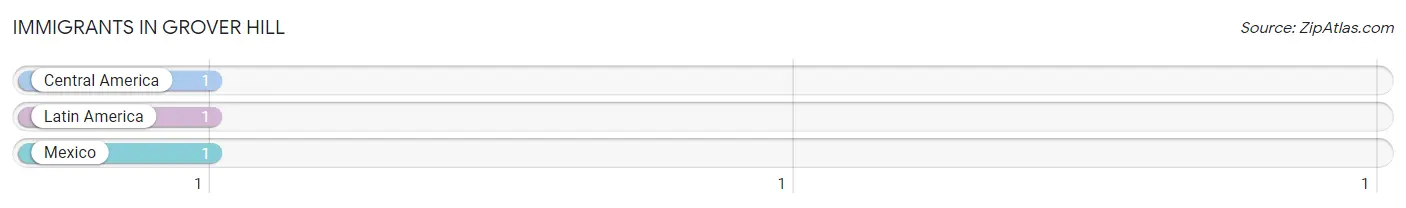
| Immigration Origin | # Population | % Population |
| Central America | 1 | 0.2% |
| Latin America | 1 | 0.2% |
| Mexico | 1 | 0.2% | View All 3 Rows |
Sex and Age in Grover Hill
Sex and Age in Grover Hill
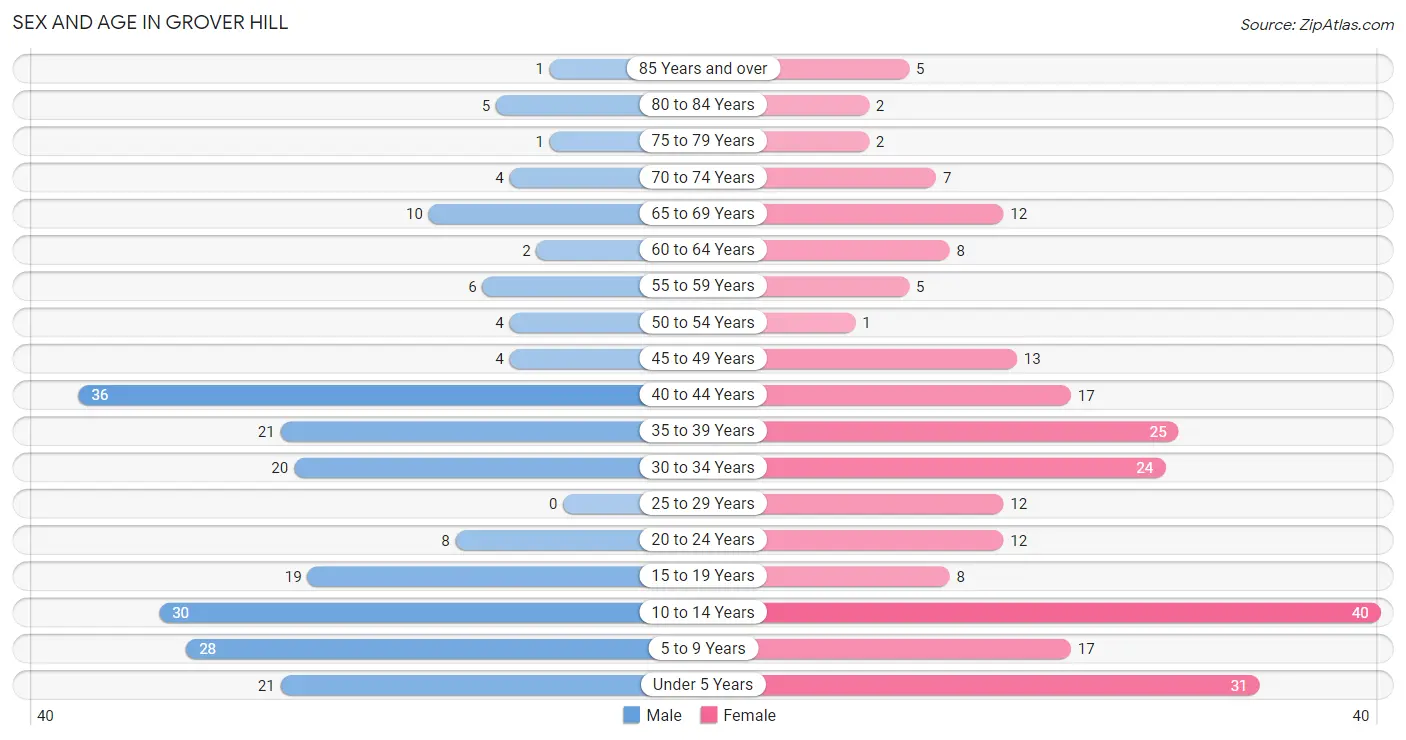
The most populous age groups in Grover Hill are 40 to 44 Years (36 | 16.4%) for men and 10 to 14 Years (40 | 16.6%) for women.
| Age Bracket | Male | Female |
| Under 5 Years | 21 (9.6%) | 31 (12.9%) |
| 5 to 9 Years | 28 (12.7%) | 17 (7.0%) |
| 10 to 14 Years | 30 (13.6%) | 40 (16.6%) |
| 15 to 19 Years | 19 (8.6%) | 8 (3.3%) |
| 20 to 24 Years | 8 (3.6%) | 12 (5.0%) |
| 25 to 29 Years | 0 (0.0%) | 12 (5.0%) |
| 30 to 34 Years | 20 (9.1%) | 24 (10.0%) |
| 35 to 39 Years | 21 (9.6%) | 25 (10.4%) |
| 40 to 44 Years | 36 (16.4%) | 17 (7.0%) |
| 45 to 49 Years | 4 (1.8%) | 13 (5.4%) |
| 50 to 54 Years | 4 (1.8%) | 1 (0.4%) |
| 55 to 59 Years | 6 (2.7%) | 5 (2.1%) |
| 60 to 64 Years | 2 (0.9%) | 8 (3.3%) |
| 65 to 69 Years | 10 (4.5%) | 12 (5.0%) |
| 70 to 74 Years | 4 (1.8%) | 7 (2.9%) |
| 75 to 79 Years | 1 (0.4%) | 2 (0.8%) |
| 80 to 84 Years | 5 (2.3%) | 2 (0.8%) |
| 85 Years and over | 1 (0.4%) | 5 (2.1%) |
| Total | 220 (100.0%) | 241 (100.0%) |
Families and Households in Grover Hill
Median Family Size in Grover Hill
The median family size in Grover Hill is 4.23 persons per family, with married-couple families (73 | 83.0%) accounting for the largest median family size of 4.34 persons per family. On the other hand, single female/mother families (14 | 15.9%) represent the smallest median family size with 3.64 persons per family.
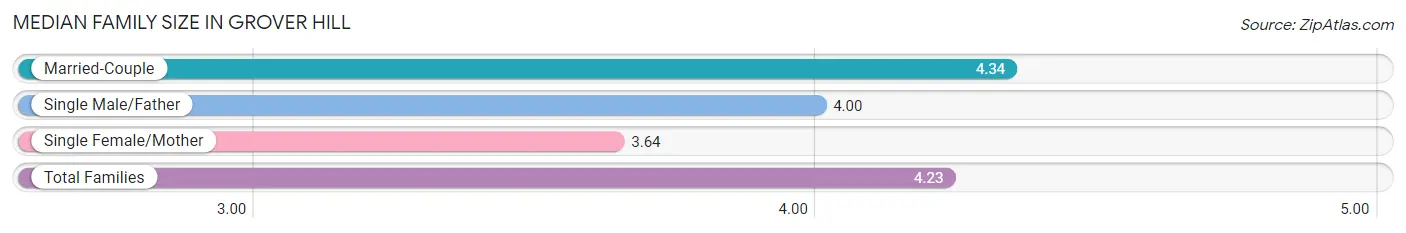
| Family Type | # Families | Family Size |
| Married-Couple | 73 (83.0%) | 4.34 |
| Single Male/Father | 1 (1.1%) | 4.00 |
| Single Female/Mother | 14 (15.9%) | 3.64 |
| Total Families | 88 (100.0%) | 4.23 |
Median Household Size in Grover Hill
The median household size in Grover Hill is 2.92 persons per household, with single male/father households (1 | 0.6%) accounting for the largest median household size of 5 persons per household. non-family households (70 | 44.3%) represent the smallest median household size with 1.17 persons per household.
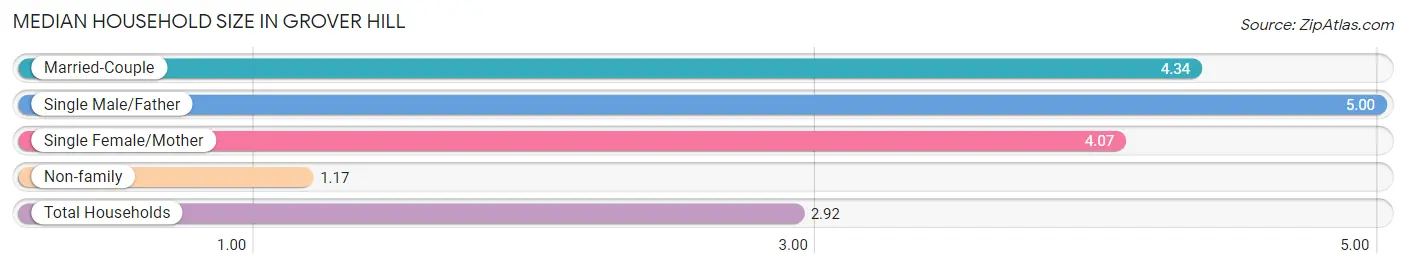
| Household Type | # Households | Household Size |
| Married-Couple | 73 (46.2%) | 4.34 |
| Single Male/Father | 1 (0.6%) | 5.00 |
| Single Female/Mother | 14 (8.9%) | 4.07 |
| Non-family | 70 (44.3%) | 1.17 |
| Total Households | 158 (100.0%) | 2.92 |
Household Size by Marriage Status in Grover Hill
Out of a total of 158 households in Grover Hill, 88 (55.7%) are family households, while 70 (44.3%) are nonfamily households. The most numerous type of family households are 4-person households, comprising 35, and the most common type of nonfamily households are 1-person households, comprising 63.
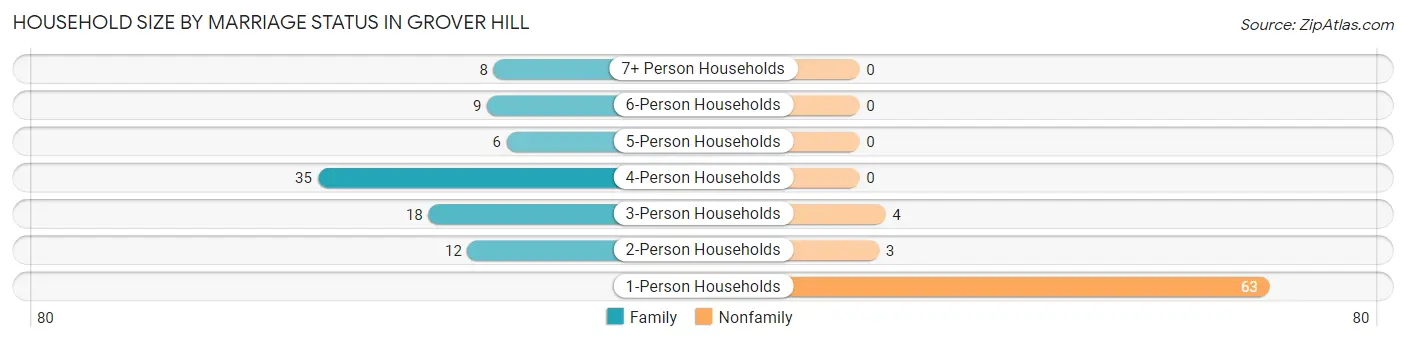
| Household Size | Family Households | Nonfamily Households |
| 1-Person Households | - | 63 (39.9%) |
| 2-Person Households | 12 (7.6%) | 3 (1.9%) |
| 3-Person Households | 18 (11.4%) | 4 (2.5%) |
| 4-Person Households | 35 (22.2%) | 0 (0.0%) |
| 5-Person Households | 6 (3.8%) | 0 (0.0%) |
| 6-Person Households | 9 (5.7%) | 0 (0.0%) |
| 7+ Person Households | 8 (5.1%) | 0 (0.0%) |
| Total | 88 (55.7%) | 70 (44.3%) |
Female Fertility in Grover Hill
Fertility by Age in Grover Hill
Average fertility rate in Grover Hill is 18.0 births per 1,000 women. Women in the age bracket of 20 to 34 years have the highest fertility rate with 42.0 births per 1,000 women. Women in the age bracket of 20 to 34 years acount for 100.0% of all women with births.
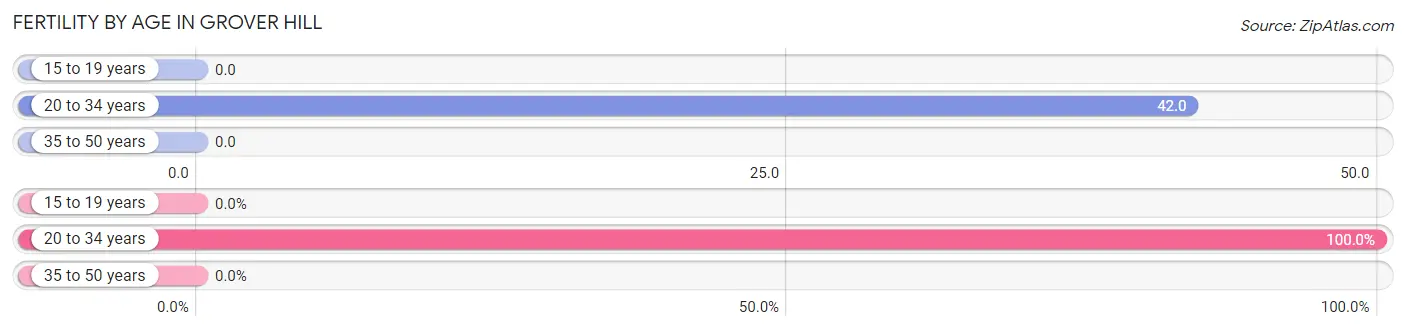
| Age Bracket | Women with Births | Births / 1,000 Women |
| 15 to 19 years | 0 (0.0%) | 0.0 |
| 20 to 34 years | 2 (100.0%) | 42.0 |
| 35 to 50 years | 0 (0.0%) | 0.0 |
| Total | 2 (100.0%) | 18.0 |
Fertility by Age by Marriage Status in Grover Hill
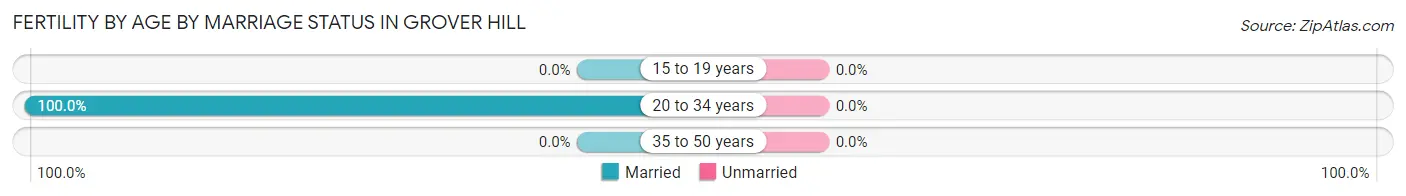
| Age Bracket | Married | Unmarried |
| 15 to 19 years | 0 (0.0%) | 0 (0.0%) |
| 20 to 34 years | 2 (100.0%) | 0 (0.0%) |
| 35 to 50 years | 0 (0.0%) | 0 (0.0%) |
| Total | 2 (100.0%) | 0 (0.0%) |
Fertility by Education in Grover Hill
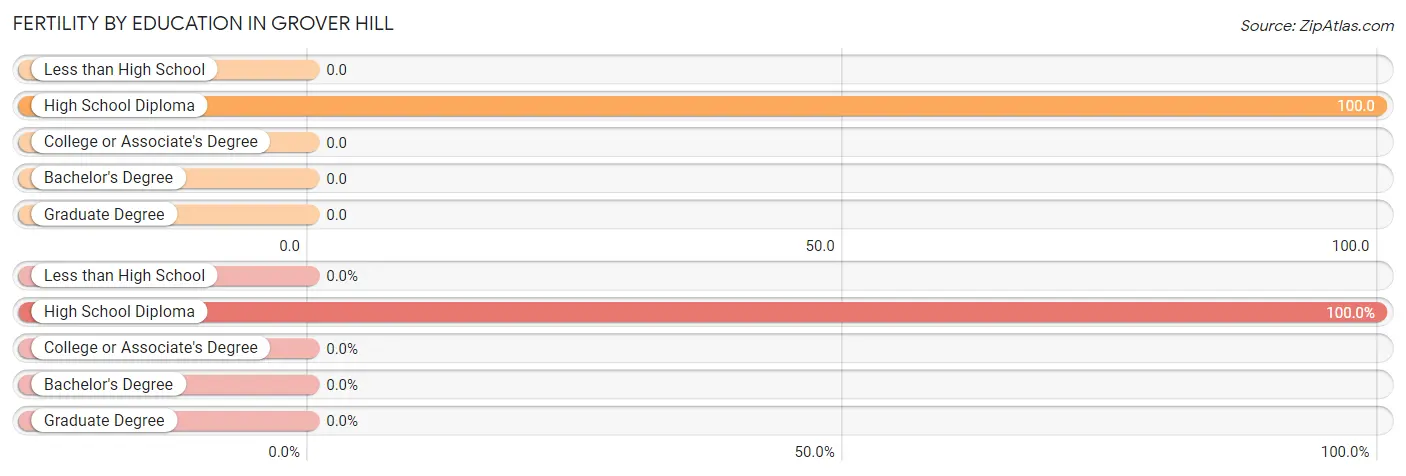
| Educational Attainment | Women with Births | Births / 1,000 Women |
| Less than High School | 0 (0.0%) | 0.0 |
| High School Diploma | 2 (100.0%) | 100.0 |
| College or Associate's Degree | 0 (0.0%) | 0.0 |
| Bachelor's Degree | 0 (0.0%) | 0.0 |
| Graduate Degree | 0 (0.0%) | 0.0 |
| Total | 2 (100.0%) | 18.0 |
Fertility by Education by Marriage Status in Grover Hill
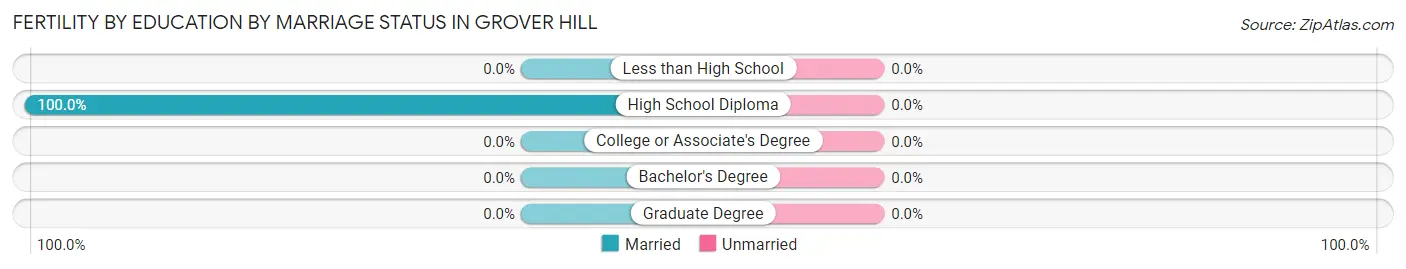
| Educational Attainment | Married | Unmarried |
| Less than High School | 0 (0.0%) | 0 (0.0%) |
| High School Diploma | 2 (100.0%) | 0 (0.0%) |
| College or Associate's Degree | 0 (0.0%) | 0 (0.0%) |
| Bachelor's Degree | 0 (0.0%) | 0 (0.0%) |
| Graduate Degree | 0 (0.0%) | 0 (0.0%) |
| Total | 2 (100.0%) | 0 (0.0%) |
Employment Characteristics in Grover Hill
Employment by Class of Employer in Grover Hill
Among the 155 employed individuals in Grover Hill, private company employees (146 | 94.2%), local government employees (6 | 3.9%), and self-employed (not incorporated) (2 | 1.3%) make up the most common classes of employment.
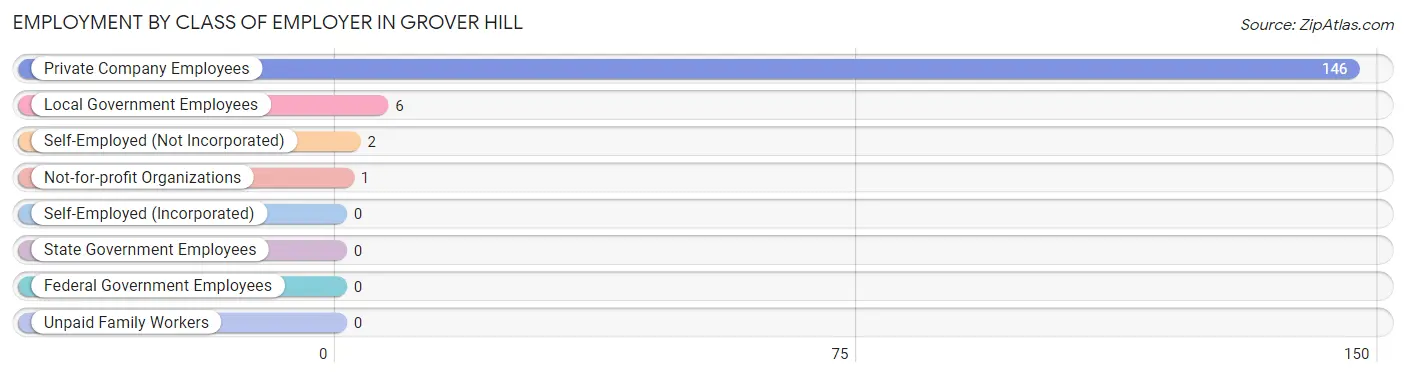
| Employer Class | # Employees | % Employees |
| Private Company Employees | 146 | 94.2% |
| Self-Employed (Incorporated) | 0 | 0.0% |
| Self-Employed (Not Incorporated) | 2 | 1.3% |
| Not-for-profit Organizations | 1 | 0.6% |
| Local Government Employees | 6 | 3.9% |
| State Government Employees | 0 | 0.0% |
| Federal Government Employees | 0 | 0.0% |
| Unpaid Family Workers | 0 | 0.0% |
| Total | 155 | 100.0% |
Employment Status by Age in Grover Hill
According to the labor force statistics for Grover Hill, out of the total population over 16 years of age (294), 56.5% or 166 individuals are in the labor force, with 6.6% or 11 of them unemployed. The age group with the highest labor force participation rate is 45 to 54 years, with 100.0% or 22 individuals in the labor force. Within the labor force, the 30 to 34 years age range has the highest percentage of unemployed individuals, with 16.7% or 5 of them being unemployed.
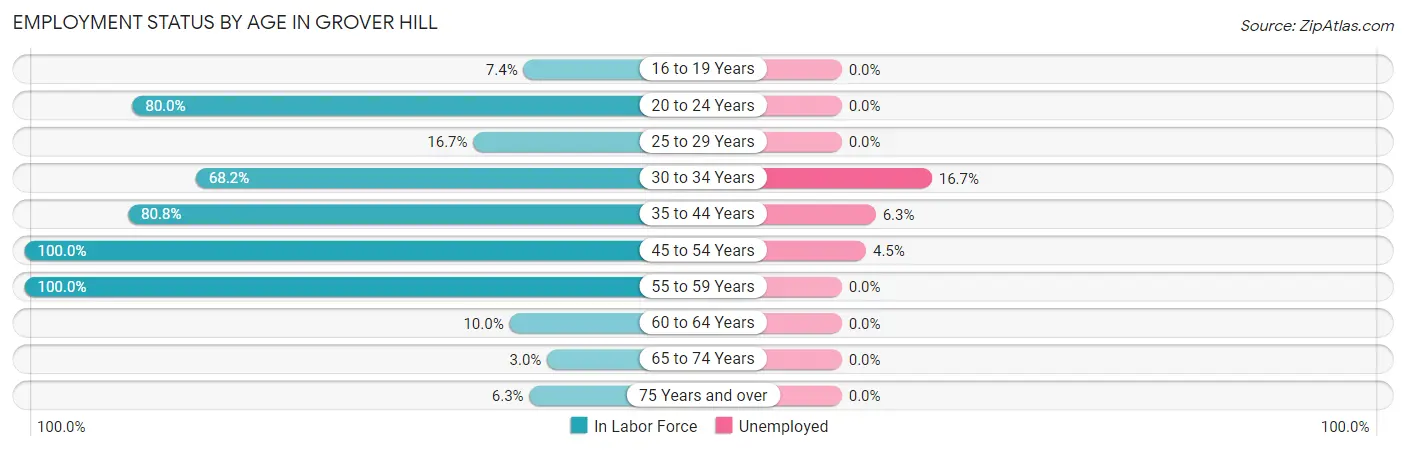
| Age Bracket | In Labor Force | Unemployed |
| 16 to 19 Years | 2 (7.4%) | 0 (0.0%) |
| 20 to 24 Years | 16 (80.0%) | 0 (0.0%) |
| 25 to 29 Years | 2 (16.7%) | 0 (0.0%) |
| 30 to 34 Years | 30 (68.2%) | 5 (16.7%) |
| 35 to 44 Years | 80 (80.8%) | 5 (6.3%) |
| 45 to 54 Years | 22 (100.0%) | 1 (4.5%) |
| 55 to 59 Years | 11 (100.0%) | 0 (0.0%) |
| 60 to 64 Years | 1 (10.0%) | 0 (0.0%) |
| 65 to 74 Years | 1 (3.0%) | 0 (0.0%) |
| 75 Years and over | 1 (6.3%) | 0 (0.0%) |
| Total | 166 (56.5%) | 11 (6.6%) |
Employment Status by Educational Attainment in Grover Hill
According to labor force statistics for Grover Hill, 73.7% of individuals (146) out of the total population between 25 and 64 years of age (198) are in the labor force, with 7.5% or 11 of them being unemployed. The group with the highest labor force participation rate are those with the educational attainment of high school diploma, with 87.1% or 61 individuals in the labor force. Within the labor force, individuals with less than high school education have the highest percentage of unemployment, with 35.7% or 5 of them being unemployed.
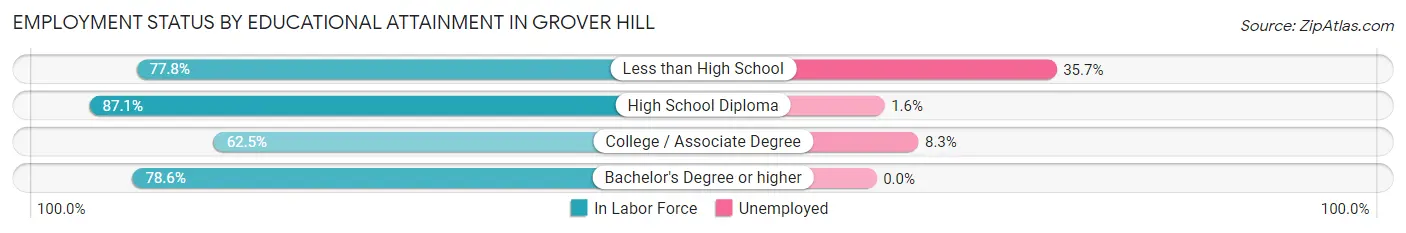
| Educational Attainment | In Labor Force | Unemployed |
| Less than High School | 14 (77.8%) | 6 (35.7%) |
| High School Diploma | 61 (87.1%) | 1 (1.6%) |
| College / Associate Degree | 60 (62.5%) | 8 (8.3%) |
| Bachelor's Degree or higher | 11 (78.6%) | 0 (0.0%) |
| Total | 146 (73.7%) | 15 (7.5%) |
Employment Occupations by Sex in Grover Hill
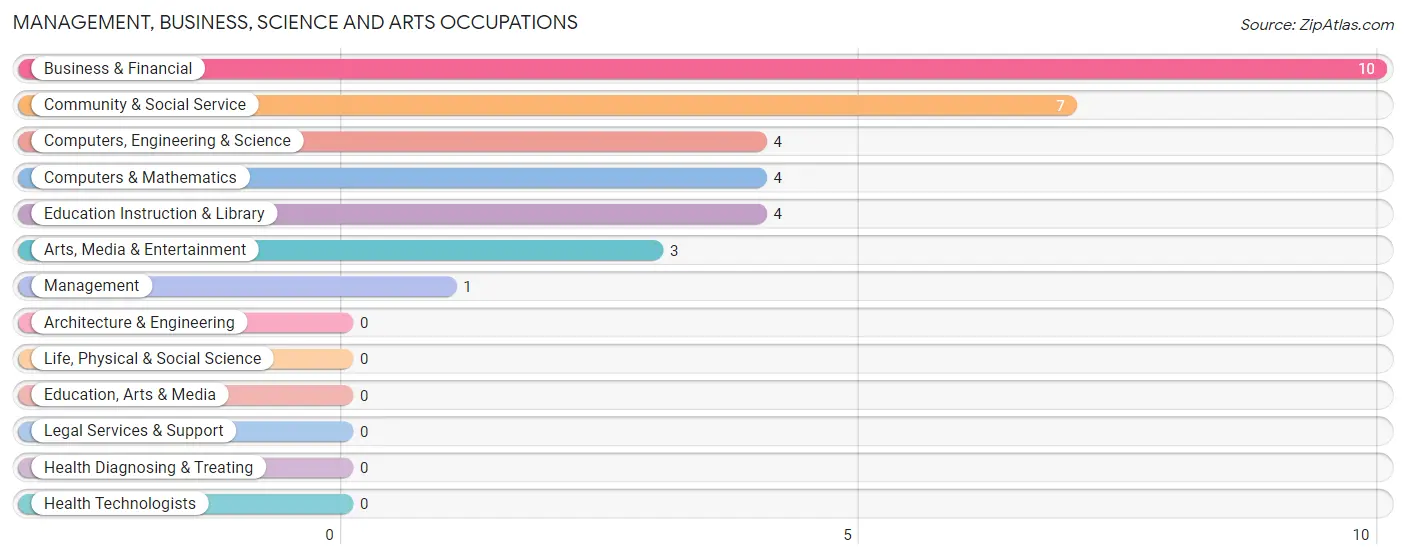
Management, Business, Science and Arts Occupations
The most common Management, Business, Science and Arts occupations in Grover Hill are Business & Financial (10 | 6.5%), Community & Social Service (7 | 4.5%), Computers, Engineering & Science (4 | 2.6%), Computers & Mathematics (4 | 2.6%), and Education Instruction & Library (4 | 2.6%).
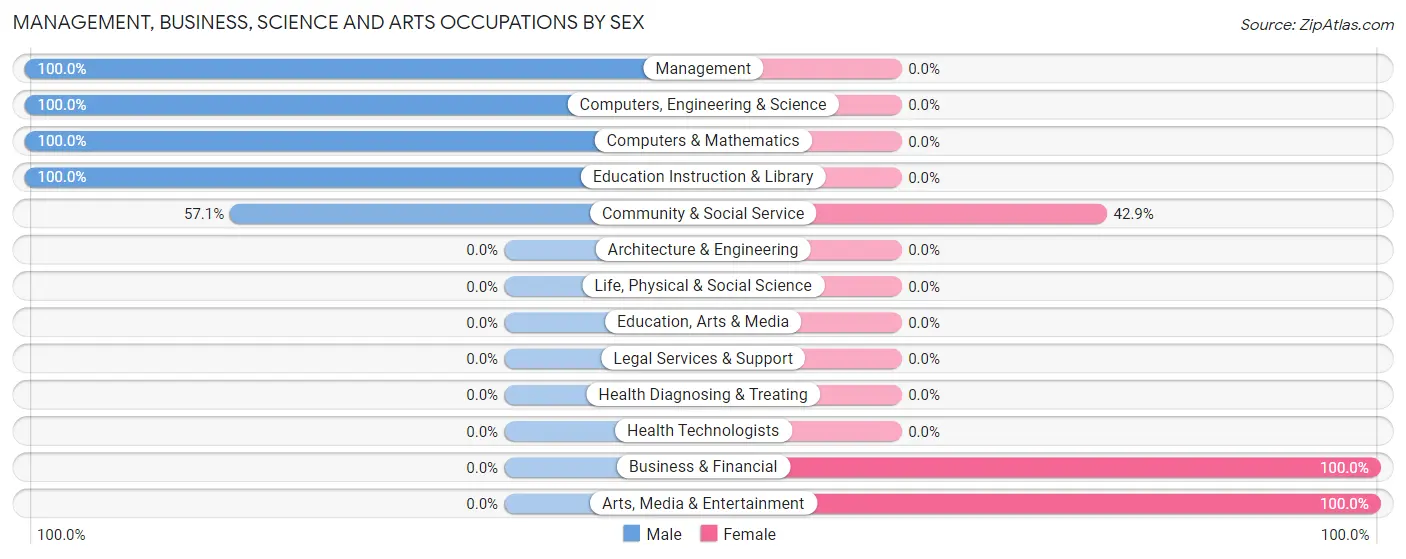
Management, Business, Science and Arts Occupations by Sex
Within the Management, Business, Science and Arts occupations in Grover Hill, the most male-oriented occupations are Management (100.0%), Computers, Engineering & Science (100.0%), and Computers & Mathematics (100.0%), while the most female-oriented occupations are Business & Financial (100.0%), Arts, Media & Entertainment (100.0%), and Community & Social Service (42.9%).
| Occupation | Male | Female |
| Management | 1 (100.0%) | 0 (0.0%) |
| Business & Financial | 0 (0.0%) | 10 (100.0%) |
| Computers, Engineering & Science | 4 (100.0%) | 0 (0.0%) |
| Computers & Mathematics | 4 (100.0%) | 0 (0.0%) |
| Architecture & Engineering | 0 (0.0%) | 0 (0.0%) |
| Life, Physical & Social Science | 0 (0.0%) | 0 (0.0%) |
| Community & Social Service | 4 (57.1%) | 3 (42.9%) |
| Education, Arts & Media | 0 (0.0%) | 0 (0.0%) |
| Legal Services & Support | 0 (0.0%) | 0 (0.0%) |
| Education Instruction & Library | 4 (100.0%) | 0 (0.0%) |
| Arts, Media & Entertainment | 0 (0.0%) | 3 (100.0%) |
| Health Diagnosing & Treating | 0 (0.0%) | 0 (0.0%) |
| Health Technologists | 0 (0.0%) | 0 (0.0%) |
| Total (Category) | 9 (40.9%) | 13 (59.1%) |
| Total (Overall) | 93 (60.0%) | 62 (40.0%) |
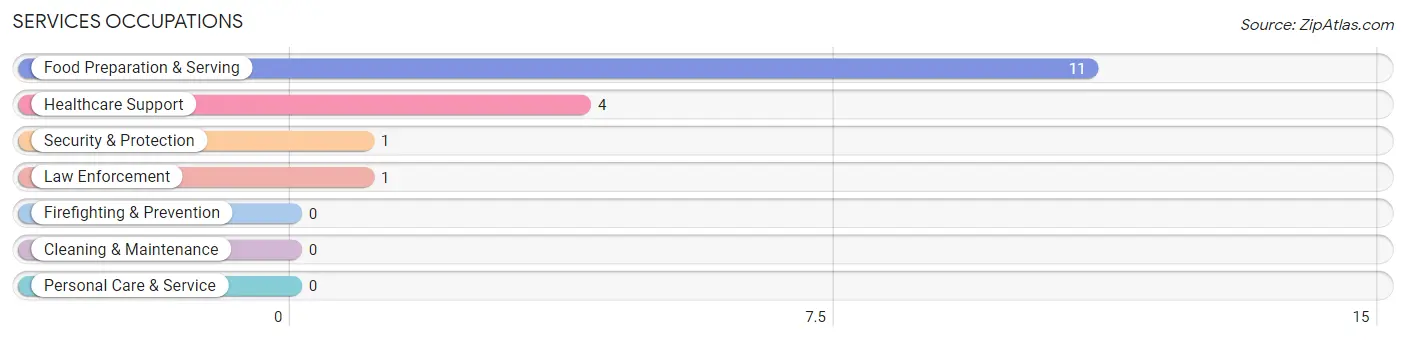
Services Occupations
The most common Services occupations in Grover Hill are Food Preparation & Serving (11 | 7.1%), Healthcare Support (4 | 2.6%), Security & Protection (1 | 0.6%), and Law Enforcement (1 | 0.6%).
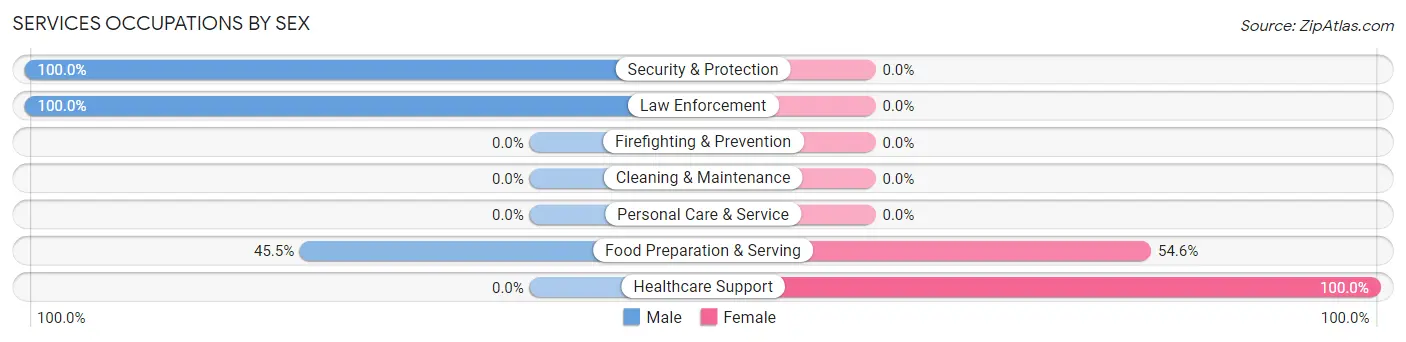
Services Occupations by Sex
Within the Services occupations in Grover Hill, the most male-oriented occupations are Security & Protection (100.0%), Law Enforcement (100.0%), and Food Preparation & Serving (45.5%), while the most female-oriented occupations are Healthcare Support (100.0%), and Food Preparation & Serving (54.5%).
| Occupation | Male | Female |
| Healthcare Support | 0 (0.0%) | 4 (100.0%) |
| Security & Protection | 1 (100.0%) | 0 (0.0%) |
| Firefighting & Prevention | 0 (0.0%) | 0 (0.0%) |
| Law Enforcement | 1 (100.0%) | 0 (0.0%) |
| Food Preparation & Serving | 5 (45.5%) | 6 (54.5%) |
| Cleaning & Maintenance | 0 (0.0%) | 0 (0.0%) |
| Personal Care & Service | 0 (0.0%) | 0 (0.0%) |
| Total (Category) | 6 (37.5%) | 10 (62.5%) |
| Total (Overall) | 93 (60.0%) | 62 (40.0%) |
Sales and Office Occupations
The most common Sales and Office occupations in Grover Hill are Sales & Related (16 | 10.3%), and Office & Administration (5 | 3.2%).
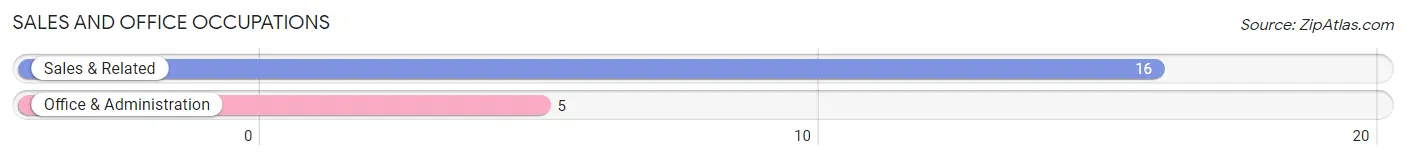
Sales and Office Occupations by Sex
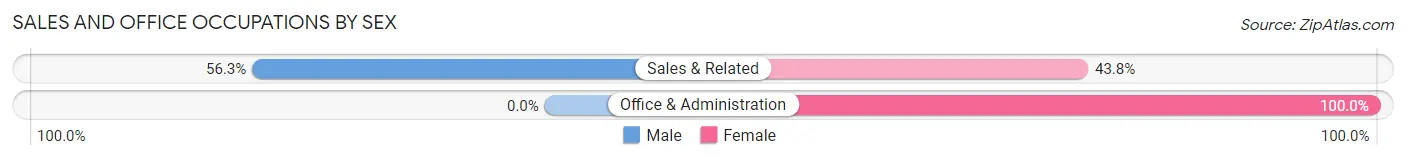
| Occupation | Male | Female |
| Sales & Related | 9 (56.2%) | 7 (43.8%) |
| Office & Administration | 0 (0.0%) | 5 (100.0%) |
| Total (Category) | 9 (42.9%) | 12 (57.1%) |
| Total (Overall) | 93 (60.0%) | 62 (40.0%) |
Natural Resources, Construction and Maintenance Occupations
The most common Natural Resources, Construction and Maintenance occupations in Grover Hill are Construction & Extraction (18 | 11.6%), Installation, Maintenance & Repair (16 | 10.3%), and Farming, Fishing & Forestry (3 | 1.9%).
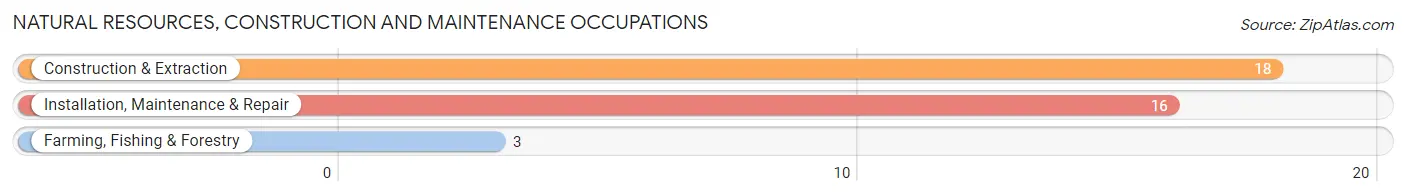
Natural Resources, Construction and Maintenance Occupations by Sex
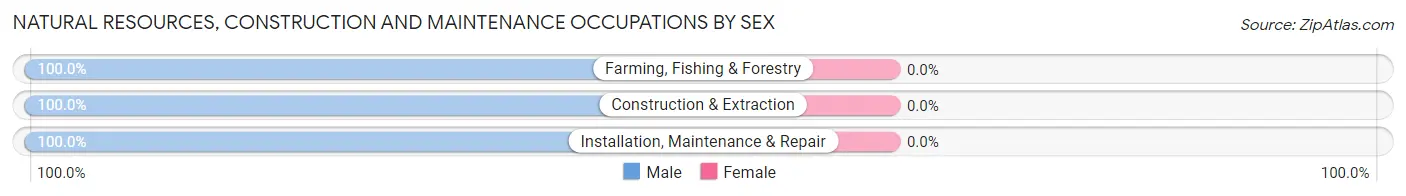
| Occupation | Male | Female |
| Farming, Fishing & Forestry | 3 (100.0%) | 0 (0.0%) |
| Construction & Extraction | 18 (100.0%) | 0 (0.0%) |
| Installation, Maintenance & Repair | 16 (100.0%) | 0 (0.0%) |
| Total (Category) | 37 (100.0%) | 0 (0.0%) |
| Total (Overall) | 93 (60.0%) | 62 (40.0%) |
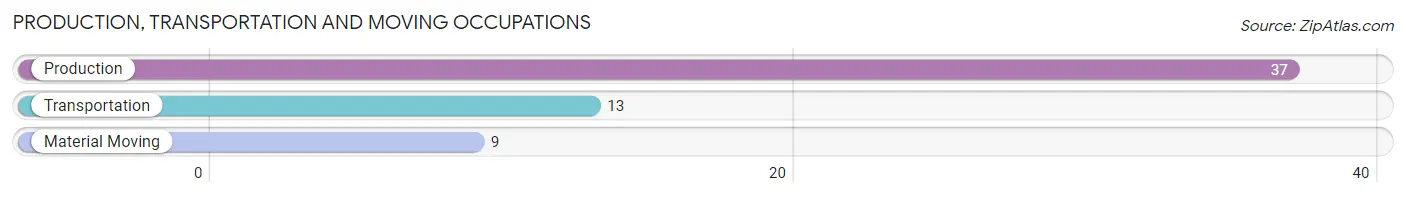
Production, Transportation and Moving Occupations
The most common Production, Transportation and Moving occupations in Grover Hill are Production (37 | 23.9%), Transportation (13 | 8.4%), and Material Moving (9 | 5.8%).
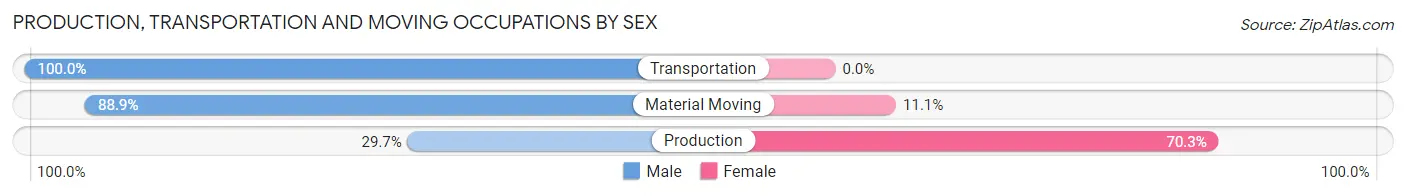
Production, Transportation and Moving Occupations by Sex
| Occupation | Male | Female |
| Production | 11 (29.7%) | 26 (70.3%) |
| Transportation | 13 (100.0%) | 0 (0.0%) |
| Material Moving | 8 (88.9%) | 1 (11.1%) |
| Total (Category) | 32 (54.2%) | 27 (45.8%) |
| Total (Overall) | 93 (60.0%) | 62 (40.0%) |
Employment Industries by Sex in Grover Hill
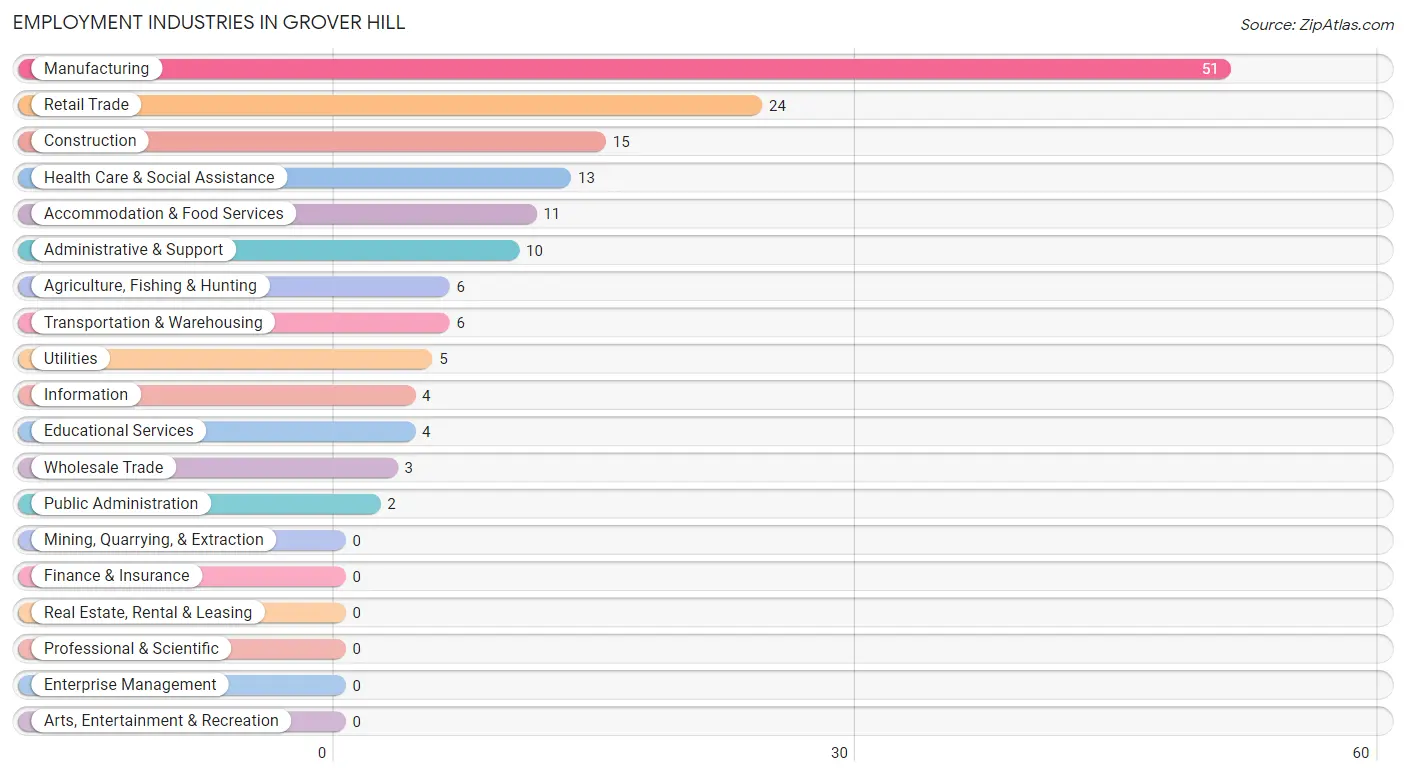
Employment Industries in Grover Hill
The major employment industries in Grover Hill include Manufacturing (51 | 32.9%), Retail Trade (24 | 15.5%), Construction (15 | 9.7%), Health Care & Social Assistance (13 | 8.4%), and Accommodation & Food Services (11 | 7.1%).
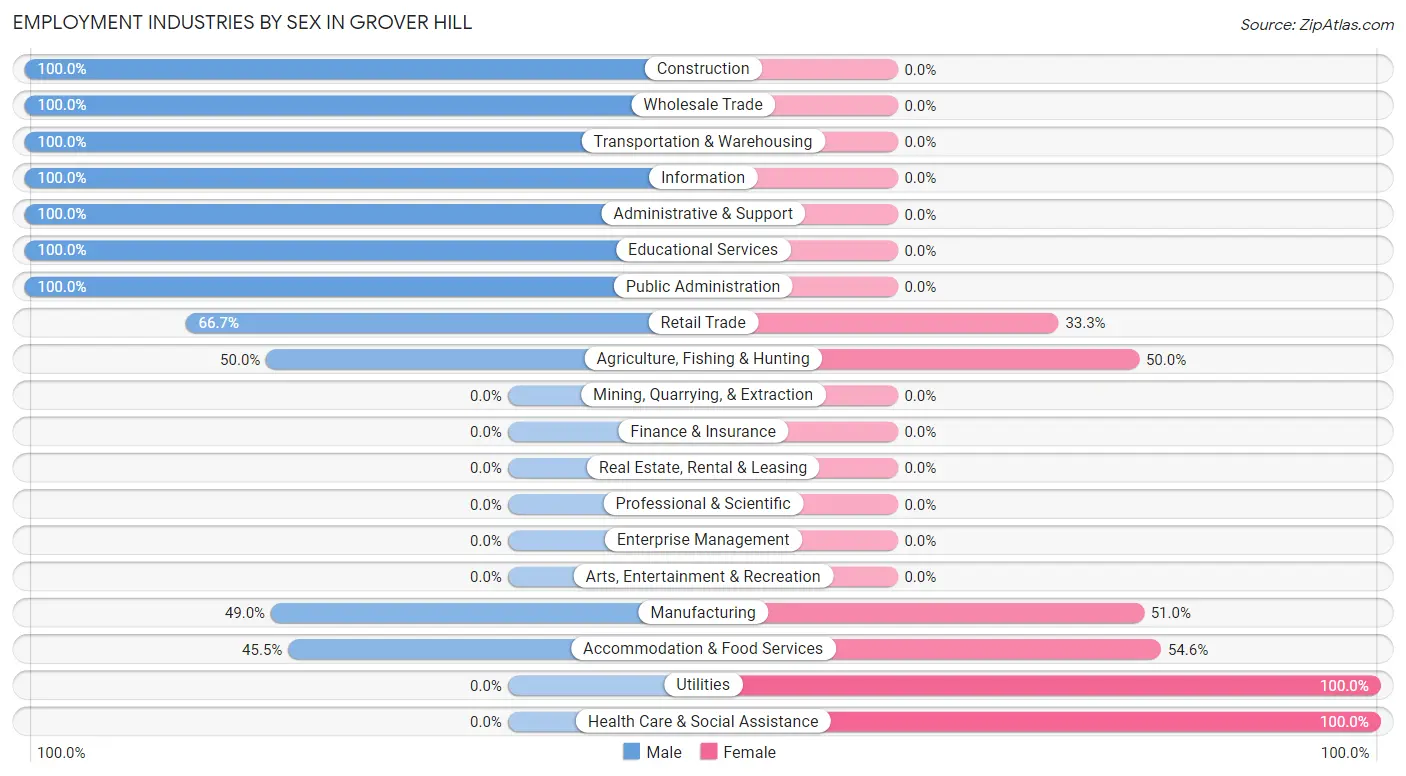
Employment Industries by Sex in Grover Hill
The Grover Hill industries that see more men than women are Construction (100.0%), Wholesale Trade (100.0%), and Transportation & Warehousing (100.0%), whereas the industries that tend to have a higher number of women are Utilities (100.0%), Health Care & Social Assistance (100.0%), and Accommodation & Food Services (54.5%).
| Industry | Male | Female |
| Agriculture, Fishing & Hunting | 3 (50.0%) | 3 (50.0%) |
| Mining, Quarrying, & Extraction | 0 (0.0%) | 0 (0.0%) |
| Construction | 15 (100.0%) | 0 (0.0%) |
| Manufacturing | 25 (49.0%) | 26 (51.0%) |
| Wholesale Trade | 3 (100.0%) | 0 (0.0%) |
| Retail Trade | 16 (66.7%) | 8 (33.3%) |
| Transportation & Warehousing | 6 (100.0%) | 0 (0.0%) |
| Utilities | 0 (0.0%) | 5 (100.0%) |
| Information | 4 (100.0%) | 0 (0.0%) |
| Finance & Insurance | 0 (0.0%) | 0 (0.0%) |
| Real Estate, Rental & Leasing | 0 (0.0%) | 0 (0.0%) |
| Professional & Scientific | 0 (0.0%) | 0 (0.0%) |
| Enterprise Management | 0 (0.0%) | 0 (0.0%) |
| Administrative & Support | 10 (100.0%) | 0 (0.0%) |
| Educational Services | 4 (100.0%) | 0 (0.0%) |
| Health Care & Social Assistance | 0 (0.0%) | 13 (100.0%) |
| Arts, Entertainment & Recreation | 0 (0.0%) | 0 (0.0%) |
| Accommodation & Food Services | 5 (45.5%) | 6 (54.5%) |
| Public Administration | 2 (100.0%) | 0 (0.0%) |
| Total | 93 (60.0%) | 62 (40.0%) |
Education in Grover Hill
School Enrollment in Grover Hill
The most common levels of schooling among the 157 students in Grover Hill are middle school (65 | 41.4%), high school (36 | 22.9%), and elementary school (29 | 18.5%).
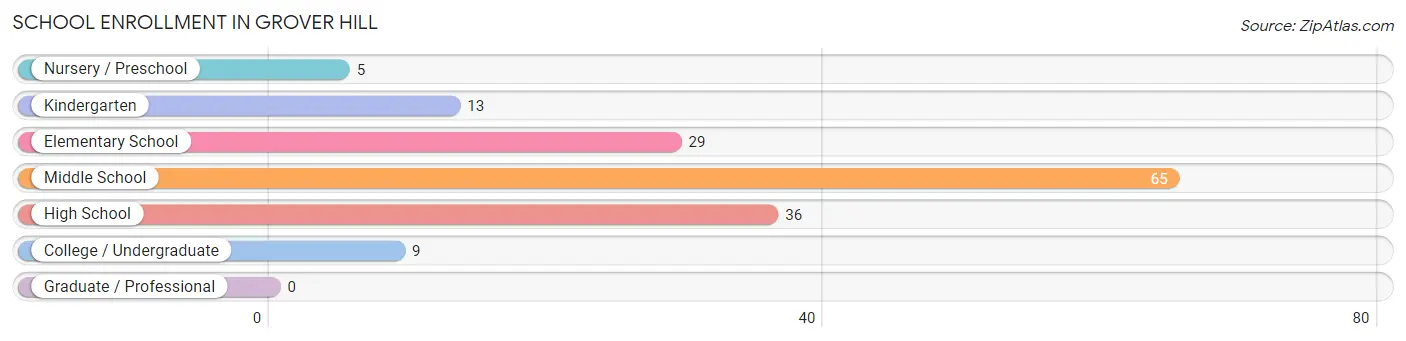
| School Level | # Students | % Students |
| Nursery / Preschool | 5 | 3.2% |
| Kindergarten | 13 | 8.3% |
| Elementary School | 29 | 18.5% |
| Middle School | 65 | 41.4% |
| High School | 36 | 22.9% |
| College / Undergraduate | 9 | 5.7% |
| Graduate / Professional | 0 | 0.0% |
| Total | 157 | 100.0% |
School Enrollment by Age by Funding Source in Grover Hill
Out of a total of 157 students who are enrolled in schools in Grover Hill, 15 (9.6%) attend a private institution, while the remaining 142 (90.4%) are enrolled in public schools. The age group of 25 to 34 year olds has the highest likelihood of being enrolled in private schools, with 3 (100.0% in the age bracket) enrolled. Conversely, the age group of 3 to 4 year olds has the lowest likelihood of being enrolled in a private school, with 5 (100.0% in the age bracket) attending a public institution.
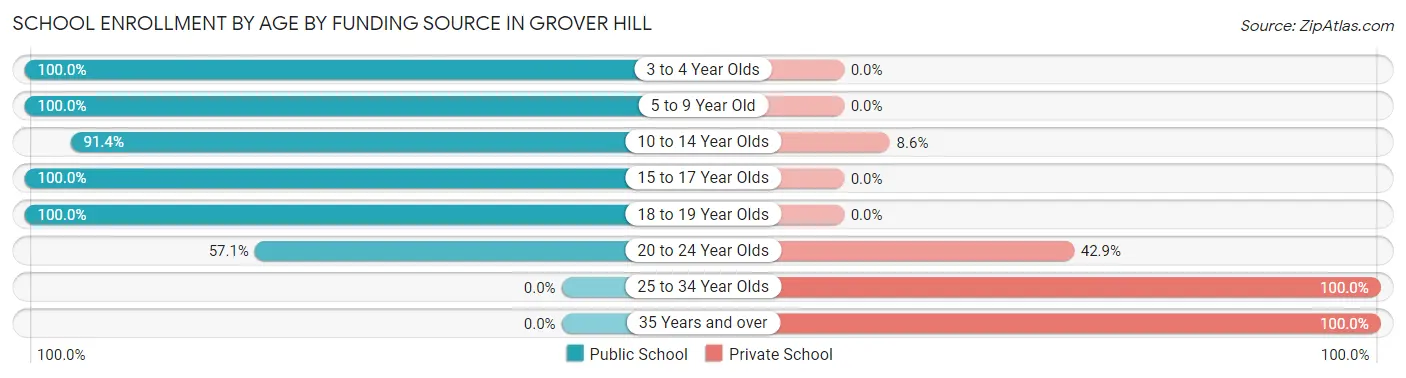
| Age Bracket | Public School | Private School |
| 3 to 4 Year Olds | 5 (100.0%) | 0 (0.0%) |
| 5 to 9 Year Old | 42 (100.0%) | 0 (0.0%) |
| 10 to 14 Year Olds | 64 (91.4%) | 6 (8.6%) |
| 15 to 17 Year Olds | 21 (100.0%) | 0 (0.0%) |
| 18 to 19 Year Olds | 6 (100.0%) | 0 (0.0%) |
| 20 to 24 Year Olds | 4 (57.1%) | 3 (42.9%) |
| 25 to 34 Year Olds | 0 (0.0%) | 3 (100.0%) |
| 35 Years and over | 0 (0.0%) | 3 (100.0%) |
| Total | 142 (90.4%) | 15 (9.6%) |
Educational Attainment by Field of Study in Grover Hill
Bio, nature & agricultural (9 | 39.1%), social sciences (9 | 39.1%), engineering (3 | 13.0%), and business (2 | 8.7%) are the most common fields of study among 23 individuals in Grover Hill who have obtained a bachelor's degree or higher.
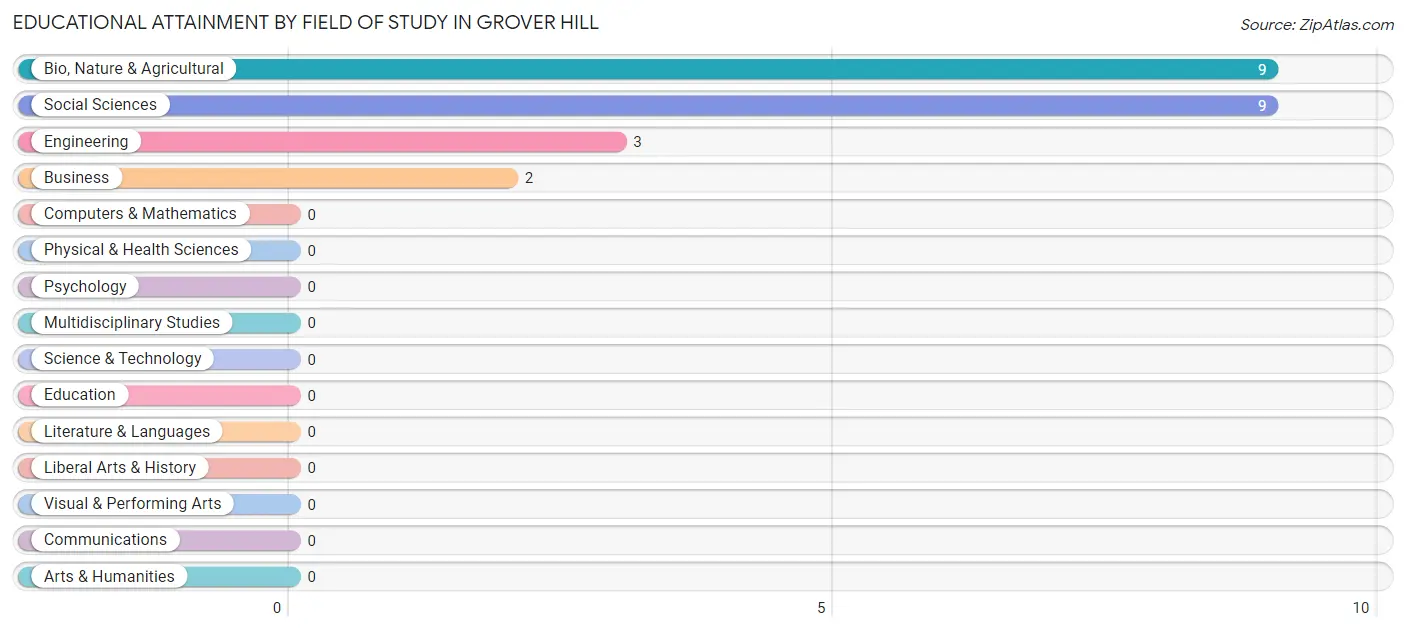
| Field of Study | # Graduates | % Graduates |
| Computers & Mathematics | 0 | 0.0% |
| Bio, Nature & Agricultural | 9 | 39.1% |
| Physical & Health Sciences | 0 | 0.0% |
| Psychology | 0 | 0.0% |
| Social Sciences | 9 | 39.1% |
| Engineering | 3 | 13.0% |
| Multidisciplinary Studies | 0 | 0.0% |
| Science & Technology | 0 | 0.0% |
| Business | 2 | 8.7% |
| Education | 0 | 0.0% |
| Literature & Languages | 0 | 0.0% |
| Liberal Arts & History | 0 | 0.0% |
| Visual & Performing Arts | 0 | 0.0% |
| Communications | 0 | 0.0% |
| Arts & Humanities | 0 | 0.0% |
| Total | 23 | 100.0% |
Transportation & Commute in Grover Hill
Vehicle Availability by Sex in Grover Hill
The most prevalent vehicle ownership categories in Grover Hill are males with 3 vehicles (40, accounting for 43.0%) and females with 3 vehicles (11, making up 64.5%).
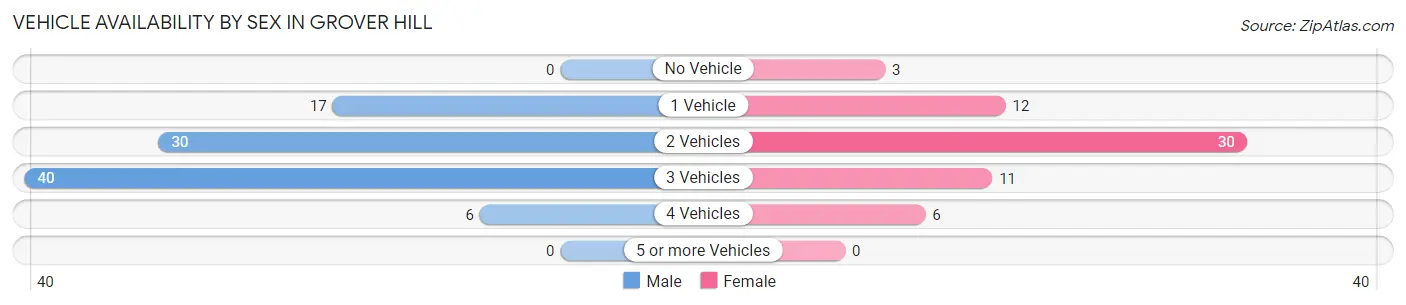
| Vehicles Available | Male | Female |
| No Vehicle | 0 (0.0%) | 3 (4.8%) |
| 1 Vehicle | 17 (18.3%) | 12 (19.4%) |
| 2 Vehicles | 30 (32.3%) | 30 (48.4%) |
| 3 Vehicles | 40 (43.0%) | 11 (17.7%) |
| 4 Vehicles | 6 (6.5%) | 6 (9.7%) |
| 5 or more Vehicles | 0 (0.0%) | 0 (0.0%) |
| Total | 93 (100.0%) | 62 (100.0%) |
Commute Time in Grover Hill
The most frequently occuring commute durations in Grover Hill are 20 to 24 minutes (42 commuters, 27.1%), 60 to 89 minutes (21 commuters, 13.6%), and 10 to 14 minutes (19 commuters, 12.3%).
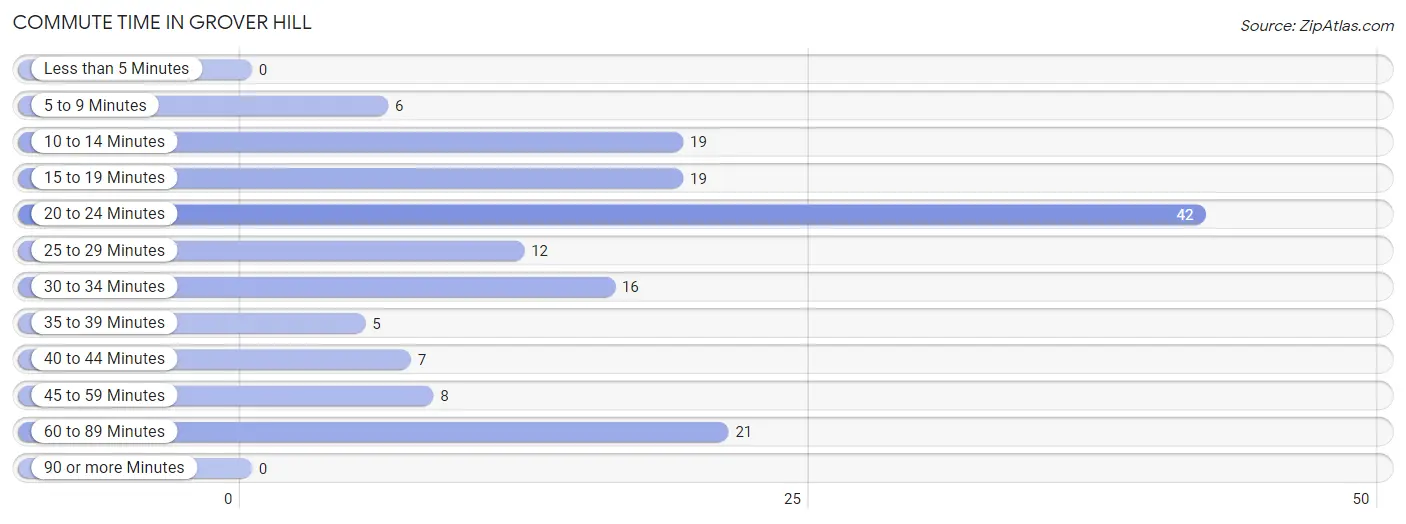
| Commute Time | # Commuters | % Commuters |
| Less than 5 Minutes | 0 | 0.0% |
| 5 to 9 Minutes | 6 | 3.9% |
| 10 to 14 Minutes | 19 | 12.3% |
| 15 to 19 Minutes | 19 | 12.3% |
| 20 to 24 Minutes | 42 | 27.1% |
| 25 to 29 Minutes | 12 | 7.7% |
| 30 to 34 Minutes | 16 | 10.3% |
| 35 to 39 Minutes | 5 | 3.2% |
| 40 to 44 Minutes | 7 | 4.5% |
| 45 to 59 Minutes | 8 | 5.2% |
| 60 to 89 Minutes | 21 | 13.6% |
| 90 or more Minutes | 0 | 0.0% |
Commute Time by Sex in Grover Hill
The most common commute times in Grover Hill are 30 to 34 minutes (16 commuters, 17.2%) for males and 20 to 24 minutes (31 commuters, 50.0%) for females.
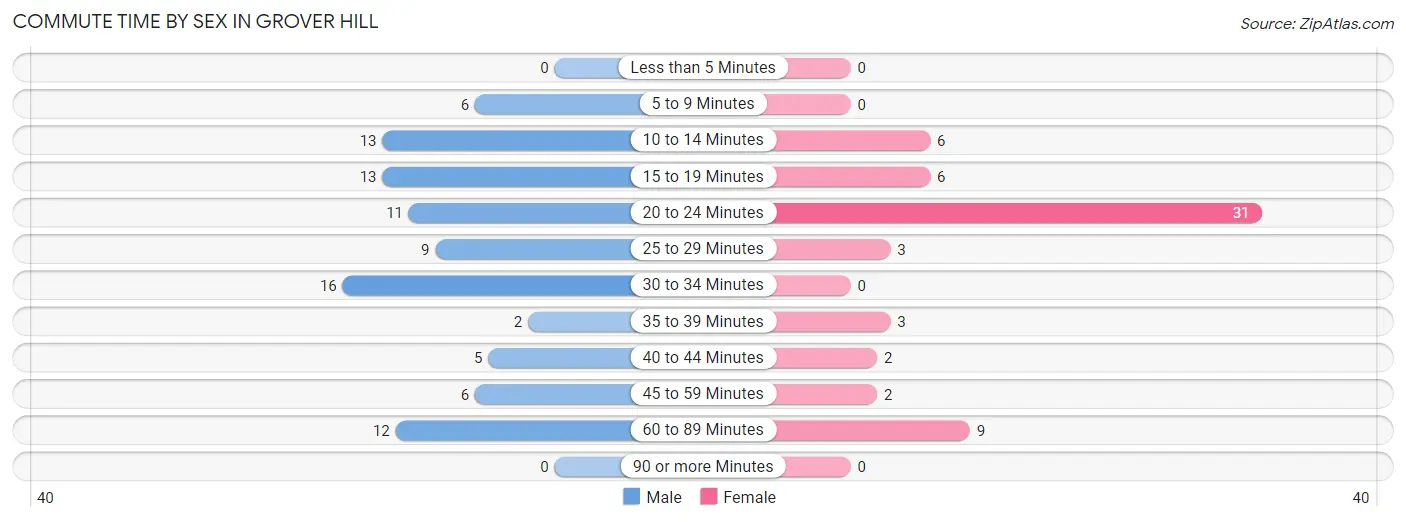
| Commute Time | Male | Female |
| Less than 5 Minutes | 0 (0.0%) | 0 (0.0%) |
| 5 to 9 Minutes | 6 (6.5%) | 0 (0.0%) |
| 10 to 14 Minutes | 13 (14.0%) | 6 (9.7%) |
| 15 to 19 Minutes | 13 (14.0%) | 6 (9.7%) |
| 20 to 24 Minutes | 11 (11.8%) | 31 (50.0%) |
| 25 to 29 Minutes | 9 (9.7%) | 3 (4.8%) |
| 30 to 34 Minutes | 16 (17.2%) | 0 (0.0%) |
| 35 to 39 Minutes | 2 (2.1%) | 3 (4.8%) |
| 40 to 44 Minutes | 5 (5.4%) | 2 (3.2%) |
| 45 to 59 Minutes | 6 (6.5%) | 2 (3.2%) |
| 60 to 89 Minutes | 12 (12.9%) | 9 (14.5%) |
| 90 or more Minutes | 0 (0.0%) | 0 (0.0%) |
Time of Departure to Work by Sex in Grover Hill
The most frequent times of departure to work in Grover Hill are 6:00 AM to 6:29 AM (21, 22.6%) for males and 4:00 PM to 11:59 PM (13, 21.0%) for females.
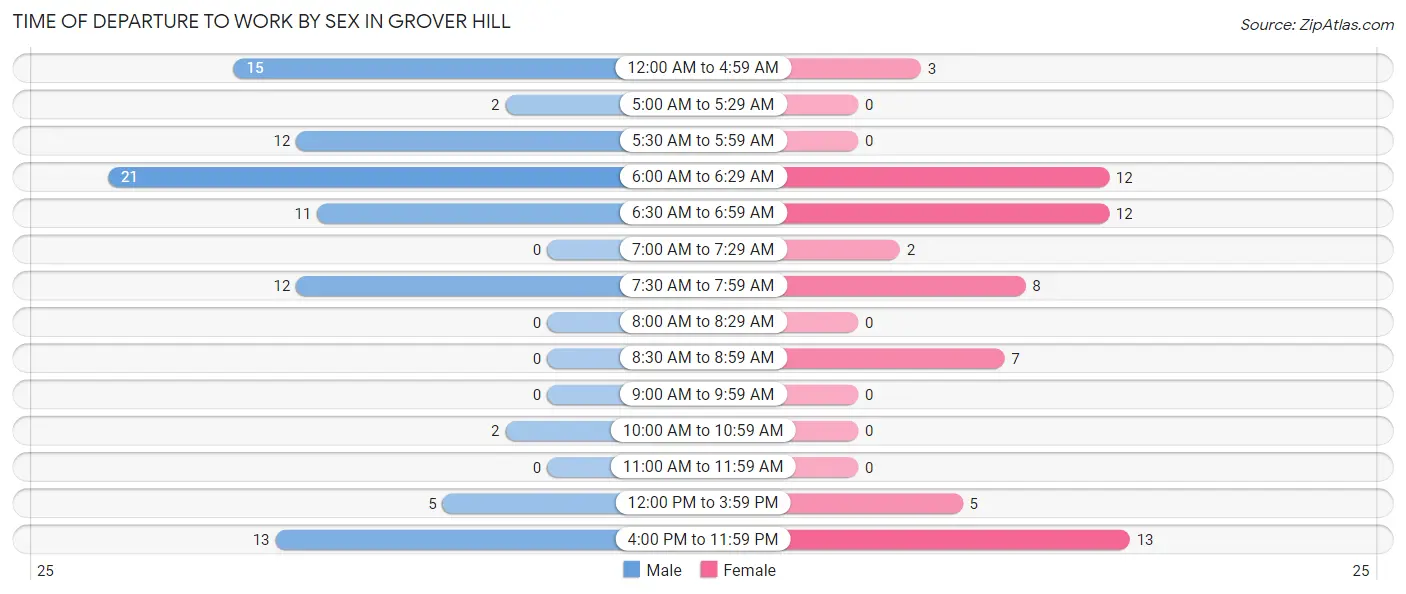
| Time of Departure | Male | Female |
| 12:00 AM to 4:59 AM | 15 (16.1%) | 3 (4.8%) |
| 5:00 AM to 5:29 AM | 2 (2.1%) | 0 (0.0%) |
| 5:30 AM to 5:59 AM | 12 (12.9%) | 0 (0.0%) |
| 6:00 AM to 6:29 AM | 21 (22.6%) | 12 (19.4%) |
| 6:30 AM to 6:59 AM | 11 (11.8%) | 12 (19.4%) |
| 7:00 AM to 7:29 AM | 0 (0.0%) | 2 (3.2%) |
| 7:30 AM to 7:59 AM | 12 (12.9%) | 8 (12.9%) |
| 8:00 AM to 8:29 AM | 0 (0.0%) | 0 (0.0%) |
| 8:30 AM to 8:59 AM | 0 (0.0%) | 7 (11.3%) |
| 9:00 AM to 9:59 AM | 0 (0.0%) | 0 (0.0%) |
| 10:00 AM to 10:59 AM | 2 (2.1%) | 0 (0.0%) |
| 11:00 AM to 11:59 AM | 0 (0.0%) | 0 (0.0%) |
| 12:00 PM to 3:59 PM | 5 (5.4%) | 5 (8.1%) |
| 4:00 PM to 11:59 PM | 13 (14.0%) | 13 (21.0%) |
| Total | 93 (100.0%) | 62 (100.0%) |
Housing Occupancy in Grover Hill
Occupancy by Ownership in Grover Hill
Of the total 158 dwellings in Grover Hill, owner-occupied units account for 111 (70.3%), while renter-occupied units make up 47 (29.7%).
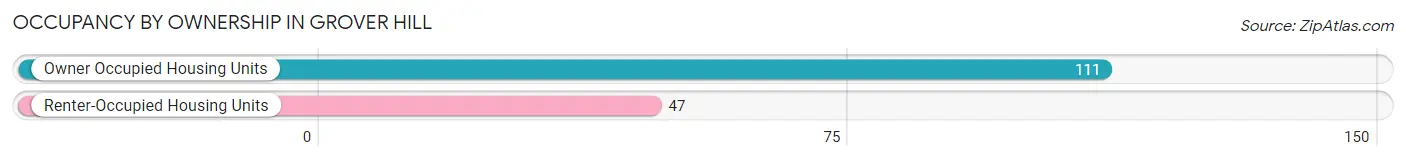
| Occupancy | # Housing Units | % Housing Units |
| Owner Occupied Housing Units | 111 | 70.3% |
| Renter-Occupied Housing Units | 47 | 29.7% |
| Total Occupied Housing Units | 158 | 100.0% |
Occupancy by Household Size in Grover Hill
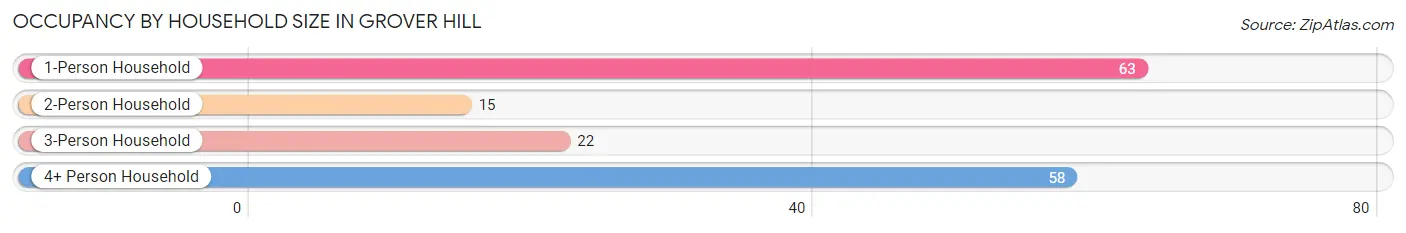
| Household Size | # Housing Units | % Housing Units |
| 1-Person Household | 63 | 39.9% |
| 2-Person Household | 15 | 9.5% |
| 3-Person Household | 22 | 13.9% |
| 4+ Person Household | 58 | 36.7% |
| Total Housing Units | 158 | 100.0% |
Occupancy by Ownership by Household Size in Grover Hill
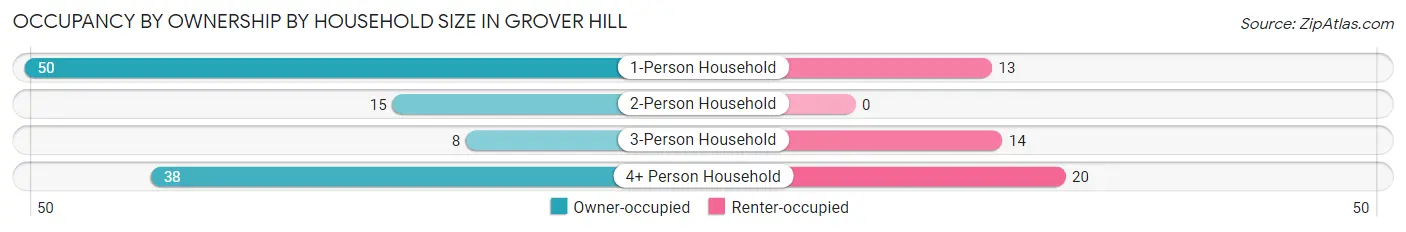
| Household Size | Owner-occupied | Renter-occupied |
| 1-Person Household | 50 (79.4%) | 13 (20.6%) |
| 2-Person Household | 15 (100.0%) | 0 (0.0%) |
| 3-Person Household | 8 (36.4%) | 14 (63.6%) |
| 4+ Person Household | 38 (65.5%) | 20 (34.5%) |
| Total Housing Units | 111 (70.3%) | 47 (29.7%) |
Occupancy by Educational Attainment in Grover Hill
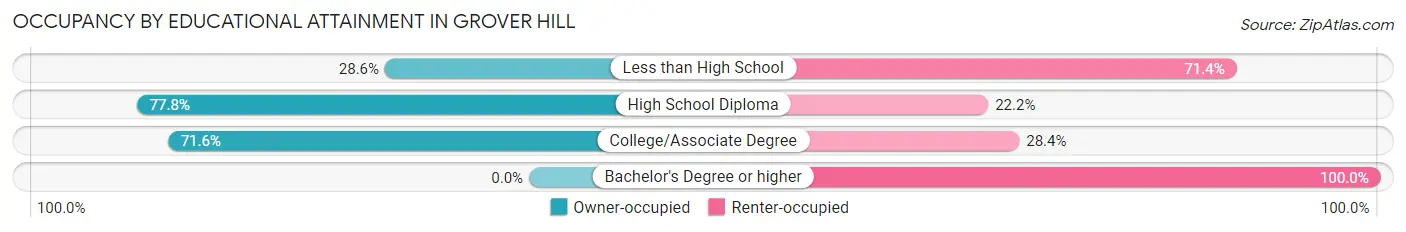
| Household Size | Owner-occupied | Renter-occupied |
| Less than High School | 2 (28.6%) | 5 (71.4%) |
| High School Diploma | 56 (77.8%) | 16 (22.2%) |
| College/Associate Degree | 53 (71.6%) | 21 (28.4%) |
| Bachelor's Degree or higher | 0 (0.0%) | 5 (100.0%) |
Occupancy by Age of Householder in Grover Hill
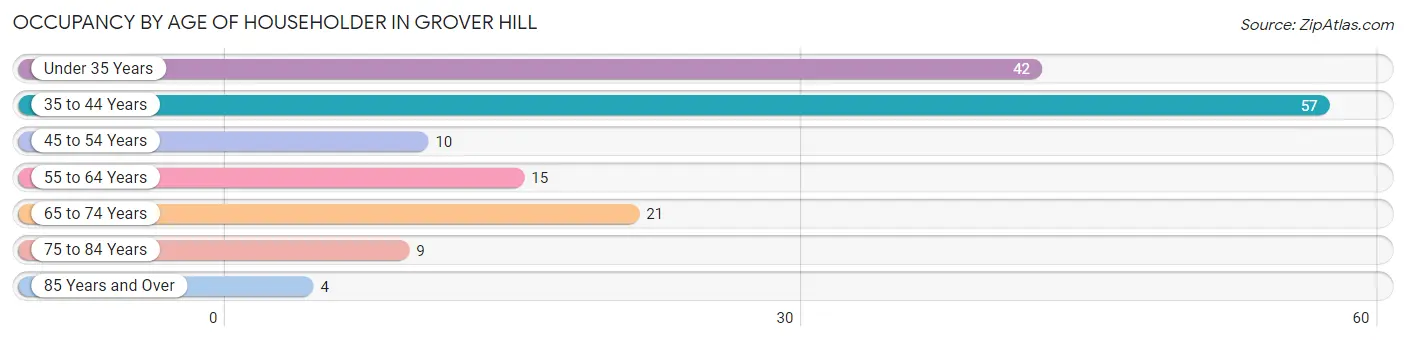
| Age Bracket | # Households | % Households |
| Under 35 Years | 42 | 26.6% |
| 35 to 44 Years | 57 | 36.1% |
| 45 to 54 Years | 10 | 6.3% |
| 55 to 64 Years | 15 | 9.5% |
| 65 to 74 Years | 21 | 13.3% |
| 75 to 84 Years | 9 | 5.7% |
| 85 Years and Over | 4 | 2.5% |
| Total | 158 | 100.0% |
Housing Finances in Grover Hill
Median Income by Occupancy in Grover Hill
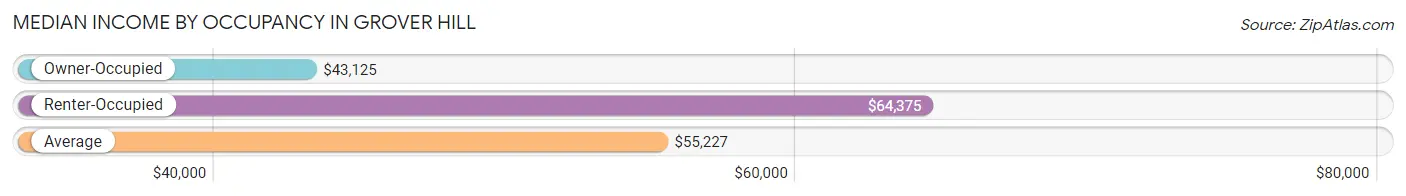
| Occupancy Type | # Households | Median Income |
| Owner-Occupied | 111 (70.3%) | $43,125 |
| Renter-Occupied | 47 (29.7%) | $64,375 |
| Average | 158 (100.0%) | $55,227 |
Occupancy by Householder Income Bracket in Grover Hill
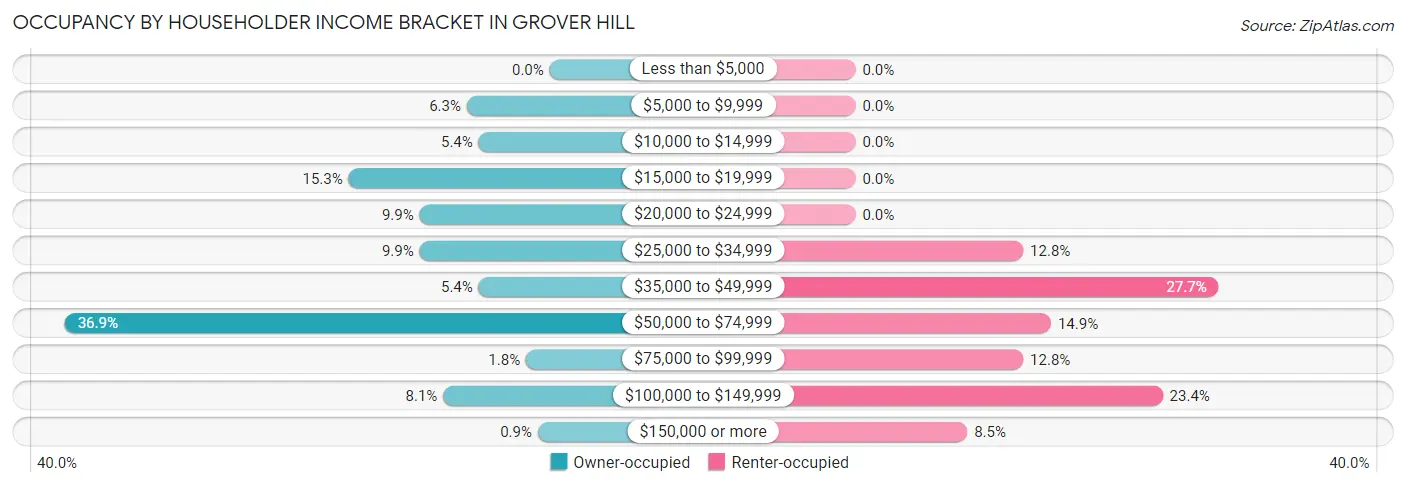
| Income Bracket | Owner-occupied | Renter-occupied |
| Less than $5,000 | 0 (0.0%) | 0 (0.0%) |
| $5,000 to $9,999 | 7 (6.3%) | 0 (0.0%) |
| $10,000 to $14,999 | 6 (5.4%) | 0 (0.0%) |
| $15,000 to $19,999 | 17 (15.3%) | 0 (0.0%) |
| $20,000 to $24,999 | 11 (9.9%) | 0 (0.0%) |
| $25,000 to $34,999 | 11 (9.9%) | 6 (12.8%) |
| $35,000 to $49,999 | 6 (5.4%) | 13 (27.7%) |
| $50,000 to $74,999 | 41 (36.9%) | 7 (14.9%) |
| $75,000 to $99,999 | 2 (1.8%) | 6 (12.8%) |
| $100,000 to $149,999 | 9 (8.1%) | 11 (23.4%) |
| $150,000 or more | 1 (0.9%) | 4 (8.5%) |
| Total | 111 (100.0%) | 47 (100.0%) |
Monthly Housing Cost Tiers in Grover Hill
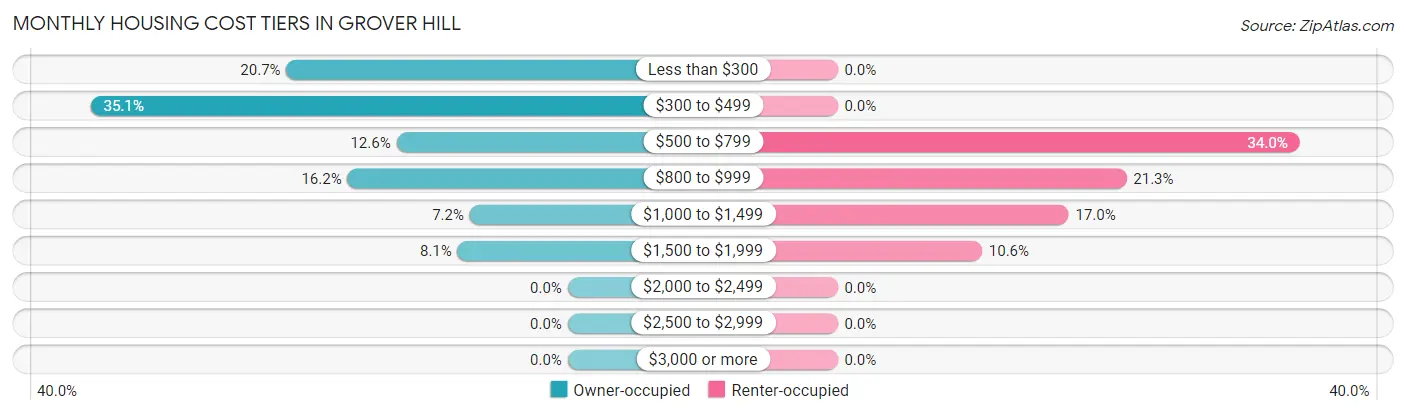
| Monthly Cost | Owner-occupied | Renter-occupied |
| Less than $300 | 23 (20.7%) | 0 (0.0%) |
| $300 to $499 | 39 (35.1%) | 0 (0.0%) |
| $500 to $799 | 14 (12.6%) | 16 (34.0%) |
| $800 to $999 | 18 (16.2%) | 10 (21.3%) |
| $1,000 to $1,499 | 8 (7.2%) | 8 (17.0%) |
| $1,500 to $1,999 | 9 (8.1%) | 5 (10.6%) |
| $2,000 to $2,499 | 0 (0.0%) | 0 (0.0%) |
| $2,500 to $2,999 | 0 (0.0%) | 0 (0.0%) |
| $3,000 or more | 0 (0.0%) | 0 (0.0%) |
| Total | 111 (100.0%) | 47 (100.0%) |
Physical Housing Characteristics in Grover Hill
Housing Structures in Grover Hill
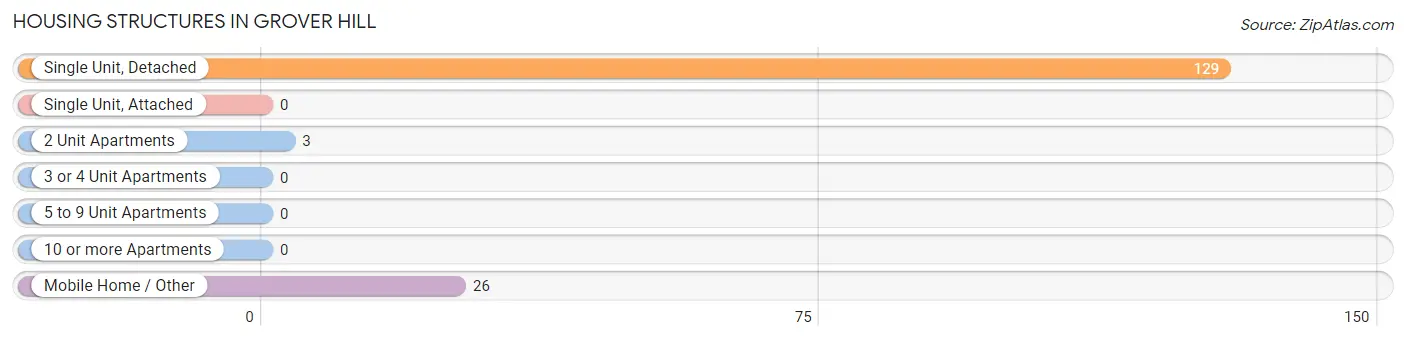
| Structure Type | # Housing Units | % Housing Units |
| Single Unit, Detached | 129 | 81.7% |
| Single Unit, Attached | 0 | 0.0% |
| 2 Unit Apartments | 3 | 1.9% |
| 3 or 4 Unit Apartments | 0 | 0.0% |
| 5 to 9 Unit Apartments | 0 | 0.0% |
| 10 or more Apartments | 0 | 0.0% |
| Mobile Home / Other | 26 | 16.5% |
| Total | 158 | 100.0% |
Housing Structures by Occupancy in Grover Hill
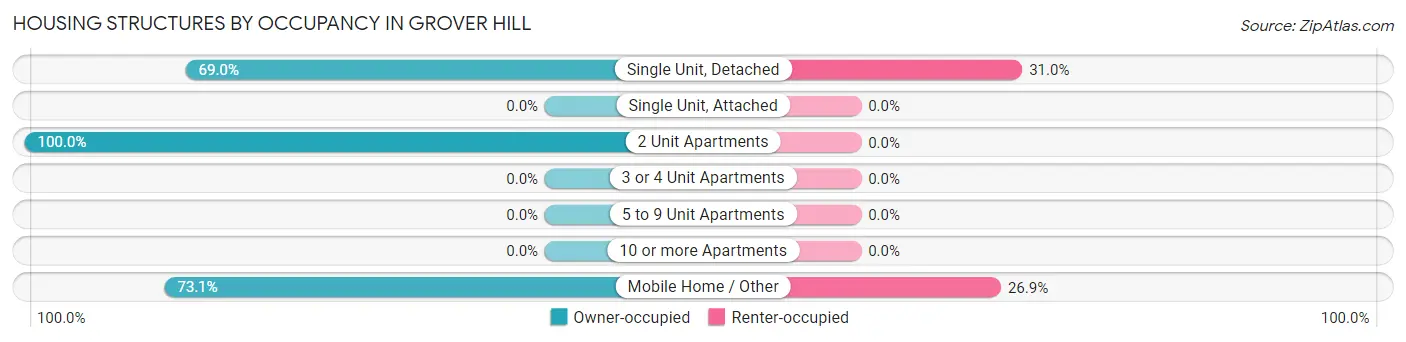
| Structure Type | Owner-occupied | Renter-occupied |
| Single Unit, Detached | 89 (69.0%) | 40 (31.0%) |
| Single Unit, Attached | 0 (0.0%) | 0 (0.0%) |
| 2 Unit Apartments | 3 (100.0%) | 0 (0.0%) |
| 3 or 4 Unit Apartments | 0 (0.0%) | 0 (0.0%) |
| 5 to 9 Unit Apartments | 0 (0.0%) | 0 (0.0%) |
| 10 or more Apartments | 0 (0.0%) | 0 (0.0%) |
| Mobile Home / Other | 19 (73.1%) | 7 (26.9%) |
| Total | 111 (70.3%) | 47 (29.7%) |
Housing Structures by Number of Rooms in Grover Hill
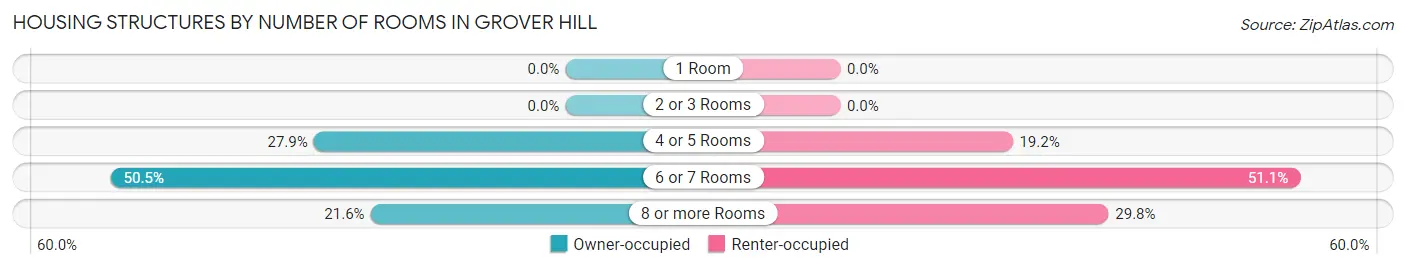
| Number of Rooms | Owner-occupied | Renter-occupied |
| 1 Room | 0 (0.0%) | 0 (0.0%) |
| 2 or 3 Rooms | 0 (0.0%) | 0 (0.0%) |
| 4 or 5 Rooms | 31 (27.9%) | 9 (19.2%) |
| 6 or 7 Rooms | 56 (50.4%) | 24 (51.1%) |
| 8 or more Rooms | 24 (21.6%) | 14 (29.8%) |
| Total | 111 (100.0%) | 47 (100.0%) |
Housing Structure by Heating Type in Grover Hill
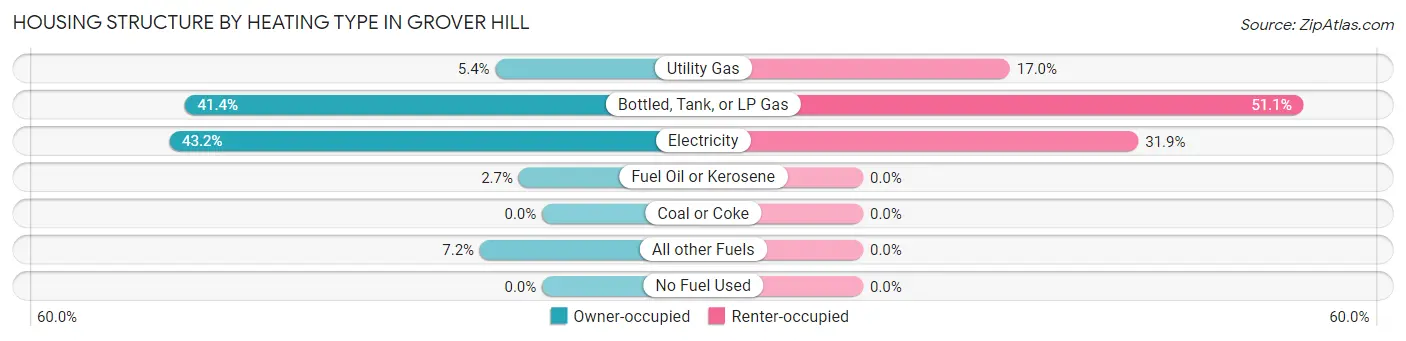
| Heating Type | Owner-occupied | Renter-occupied |
| Utility Gas | 6 (5.4%) | 8 (17.0%) |
| Bottled, Tank, or LP Gas | 46 (41.4%) | 24 (51.1%) |
| Electricity | 48 (43.2%) | 15 (31.9%) |
| Fuel Oil or Kerosene | 3 (2.7%) | 0 (0.0%) |
| Coal or Coke | 0 (0.0%) | 0 (0.0%) |
| All other Fuels | 8 (7.2%) | 0 (0.0%) |
| No Fuel Used | 0 (0.0%) | 0 (0.0%) |
| Total | 111 (100.0%) | 47 (100.0%) |
Household Vehicle Usage in Grover Hill
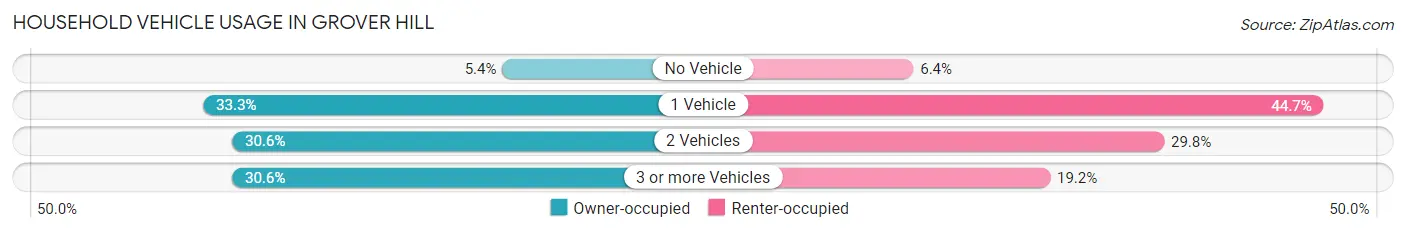
| Vehicles per Household | Owner-occupied | Renter-occupied |
| No Vehicle | 6 (5.4%) | 3 (6.4%) |
| 1 Vehicle | 37 (33.3%) | 21 (44.7%) |
| 2 Vehicles | 34 (30.6%) | 14 (29.8%) |
| 3 or more Vehicles | 34 (30.6%) | 9 (19.2%) |
| Total | 111 (100.0%) | 47 (100.0%) |
Real Estate & Mortgages in Grover Hill
Real Estate and Mortgage Overview in Grover Hill
| Characteristic | Without Mortgage | With Mortgage |
| Housing Units | 70 | 41 |
| Median Property Value | $55,700 | $75,000 |
| Median Household Income | $25,000 | $0 |
| Monthly Housing Costs | $340 | $0 |
| Real Estate Taxes | $538 | $3 |
Property Value by Mortgage Status in Grover Hill
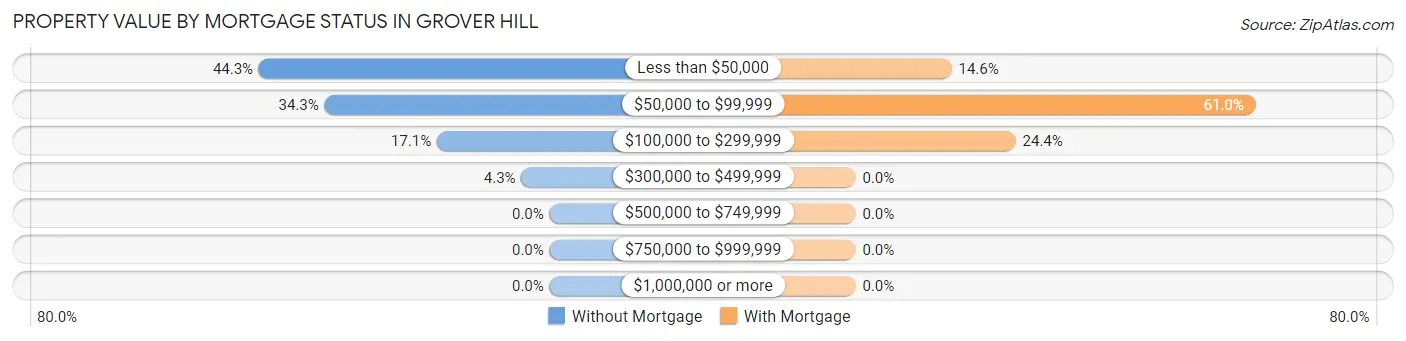
| Property Value | Without Mortgage | With Mortgage |
| Less than $50,000 | 31 (44.3%) | 6 (14.6%) |
| $50,000 to $99,999 | 24 (34.3%) | 25 (61.0%) |
| $100,000 to $299,999 | 12 (17.1%) | 10 (24.4%) |
| $300,000 to $499,999 | 3 (4.3%) | 0 (0.0%) |
| $500,000 to $749,999 | 0 (0.0%) | 0 (0.0%) |
| $750,000 to $999,999 | 0 (0.0%) | 0 (0.0%) |
| $1,000,000 or more | 0 (0.0%) | 0 (0.0%) |
| Total | 70 (100.0%) | 41 (100.0%) |
Household Income by Mortgage Status in Grover Hill
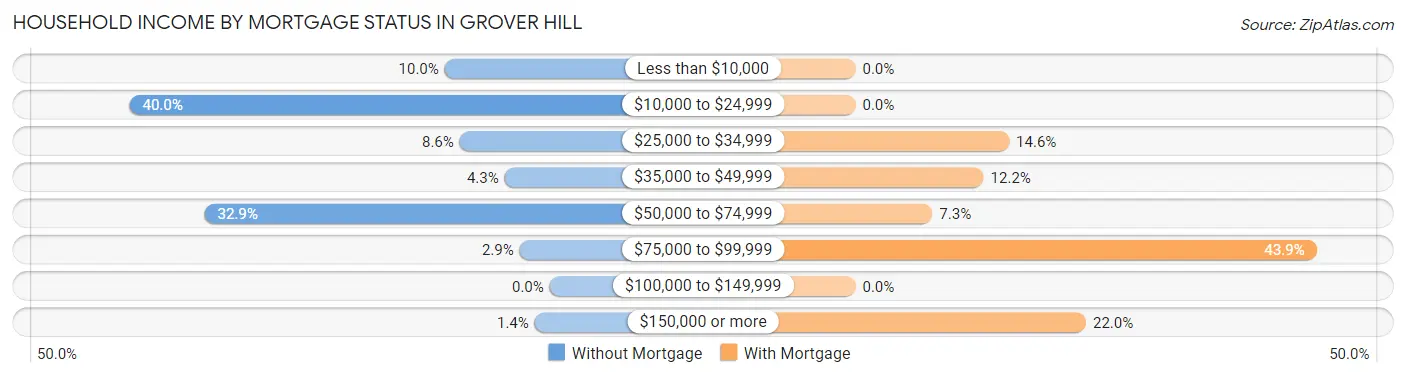
| Household Income | Without Mortgage | With Mortgage |
| Less than $10,000 | 7 (10.0%) | 0 (0.0%) |
| $10,000 to $24,999 | 28 (40.0%) | 0 (0.0%) |
| $25,000 to $34,999 | 6 (8.6%) | 6 (14.6%) |
| $35,000 to $49,999 | 3 (4.3%) | 5 (12.2%) |
| $50,000 to $74,999 | 23 (32.9%) | 3 (7.3%) |
| $75,000 to $99,999 | 2 (2.9%) | 18 (43.9%) |
| $100,000 to $149,999 | 0 (0.0%) | 0 (0.0%) |
| $150,000 or more | 1 (1.4%) | 9 (22.0%) |
| Total | 70 (100.0%) | 41 (100.0%) |
Property Value to Household Income Ratio in Grover Hill
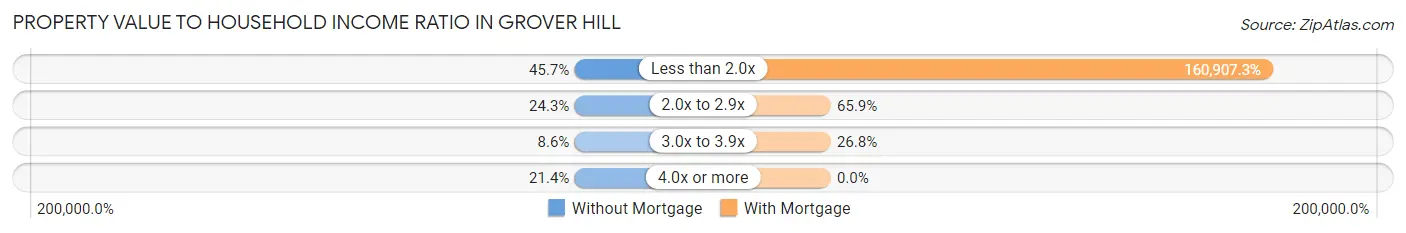
| Value-to-Income Ratio | Without Mortgage | With Mortgage |
| Less than 2.0x | 32 (45.7%) | 65,972 (160,907.3%) |
| 2.0x to 2.9x | 17 (24.3%) | 27 (65.8%) |
| 3.0x to 3.9x | 6 (8.6%) | 11 (26.8%) |
| 4.0x or more | 15 (21.4%) | 0 (0.0%) |
| Total | 70 (100.0%) | 41 (100.0%) |
Real Estate Taxes by Mortgage Status in Grover Hill
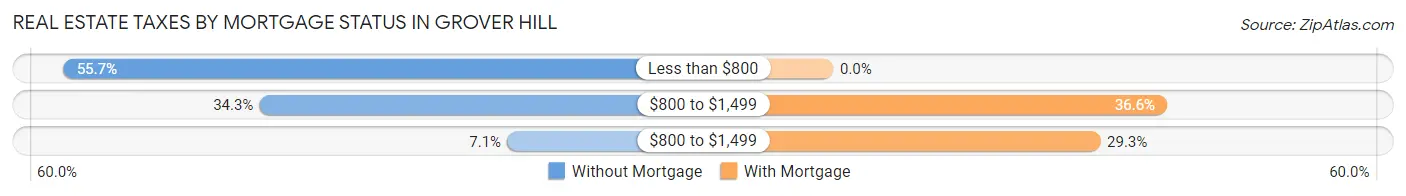
| Property Taxes | Without Mortgage | With Mortgage |
| Less than $800 | 39 (55.7%) | 0 (0.0%) |
| $800 to $1,499 | 24 (34.3%) | 15 (36.6%) |
| $800 to $1,499 | 5 (7.1%) | 12 (29.3%) |
| Total | 70 (100.0%) | 41 (100.0%) |
Health & Disability in Grover Hill
Health Insurance Coverage by Age in Grover Hill
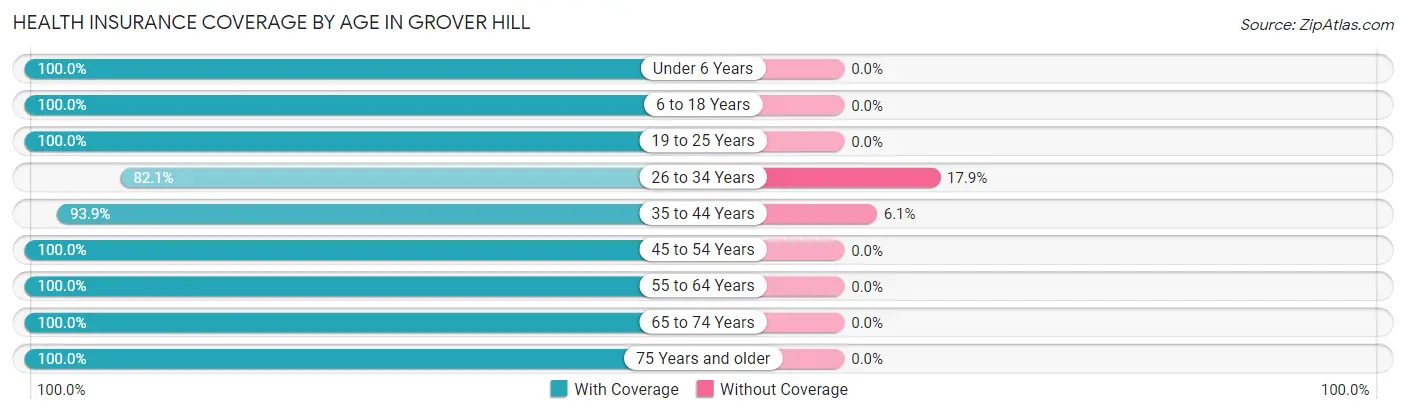
| Age Bracket | With Coverage | Without Coverage |
| Under 6 Years | 56 (100.0%) | 0 (0.0%) |
| 6 to 18 Years | 134 (100.0%) | 0 (0.0%) |
| 19 to 25 Years | 24 (100.0%) | 0 (0.0%) |
| 26 to 34 Years | 46 (82.1%) | 10 (17.9%) |
| 35 to 44 Years | 93 (93.9%) | 6 (6.1%) |
| 45 to 54 Years | 22 (100.0%) | 0 (0.0%) |
| 55 to 64 Years | 21 (100.0%) | 0 (0.0%) |
| 65 to 74 Years | 33 (100.0%) | 0 (0.0%) |
| 75 Years and older | 16 (100.0%) | 0 (0.0%) |
| Total | 445 (96.5%) | 16 (3.5%) |
Health Insurance Coverage by Citizenship Status in Grover Hill
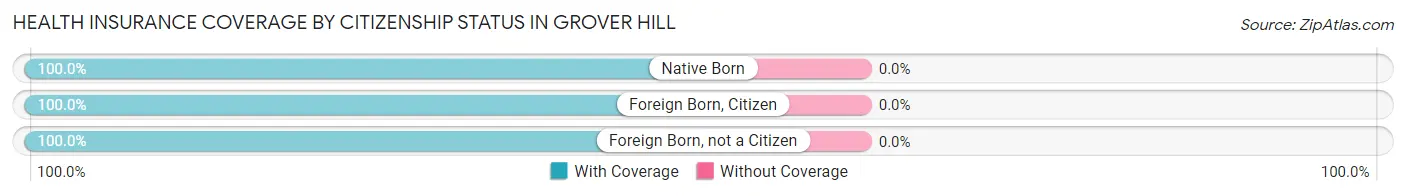
| Citizenship Status | With Coverage | Without Coverage |
| Native Born | 56 (100.0%) | 0 (0.0%) |
| Foreign Born, Citizen | 134 (100.0%) | 0 (0.0%) |
| Foreign Born, not a Citizen | 24 (100.0%) | 0 (0.0%) |
Health Insurance Coverage by Household Income in Grover Hill
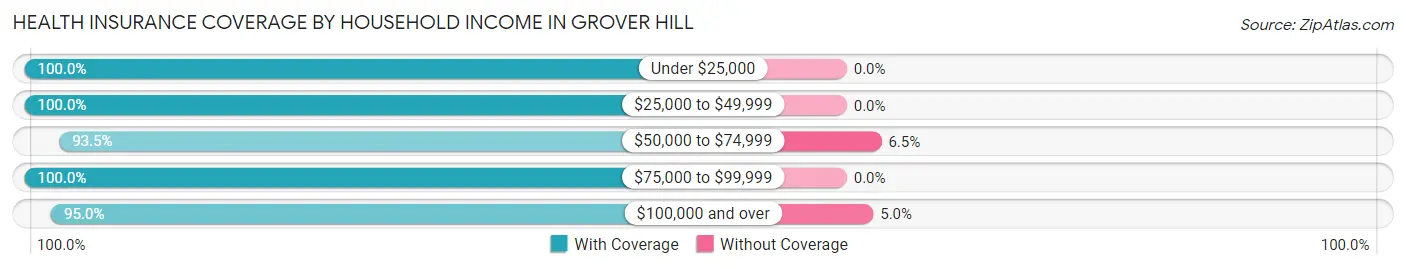
| Household Income | With Coverage | Without Coverage |
| Under $25,000 | 77 (100.0%) | 0 (0.0%) |
| $25,000 to $49,999 | 67 (100.0%) | 0 (0.0%) |
| $50,000 to $74,999 | 144 (93.5%) | 10 (6.5%) |
| $75,000 to $99,999 | 42 (100.0%) | 0 (0.0%) |
| $100,000 and over | 115 (95.0%) | 6 (5.0%) |
Public vs Private Health Insurance Coverage by Age in Grover Hill
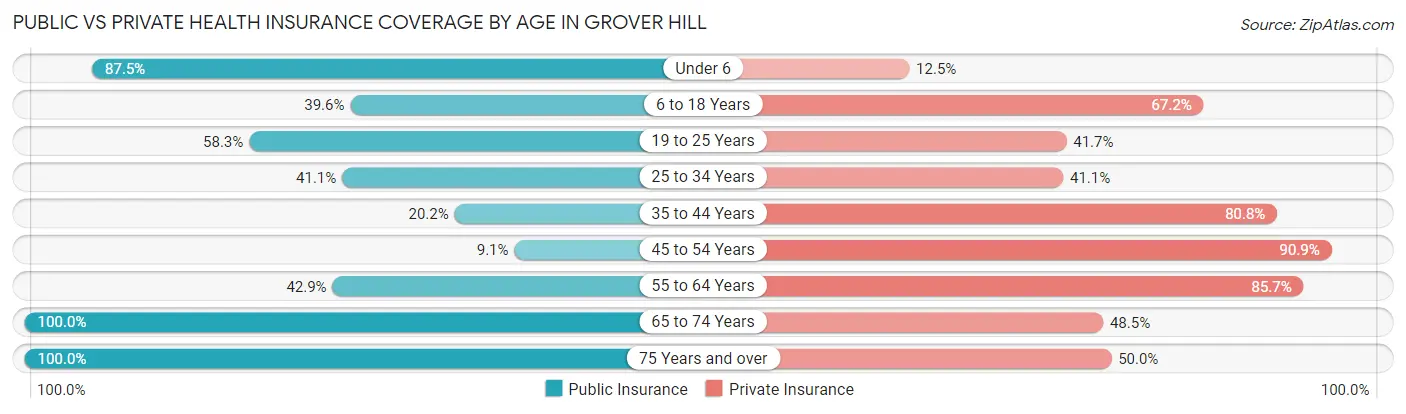
| Age Bracket | Public Insurance | Private Insurance |
| Under 6 | 49 (87.5%) | 7 (12.5%) |
| 6 to 18 Years | 53 (39.6%) | 90 (67.2%) |
| 19 to 25 Years | 14 (58.3%) | 10 (41.7%) |
| 25 to 34 Years | 23 (41.1%) | 23 (41.1%) |
| 35 to 44 Years | 20 (20.2%) | 80 (80.8%) |
| 45 to 54 Years | 2 (9.1%) | 20 (90.9%) |
| 55 to 64 Years | 9 (42.9%) | 18 (85.7%) |
| 65 to 74 Years | 33 (100.0%) | 16 (48.5%) |
| 75 Years and over | 16 (100.0%) | 8 (50.0%) |
| Total | 219 (47.5%) | 272 (59.0%) |
Disability Status by Sex by Age in Grover Hill
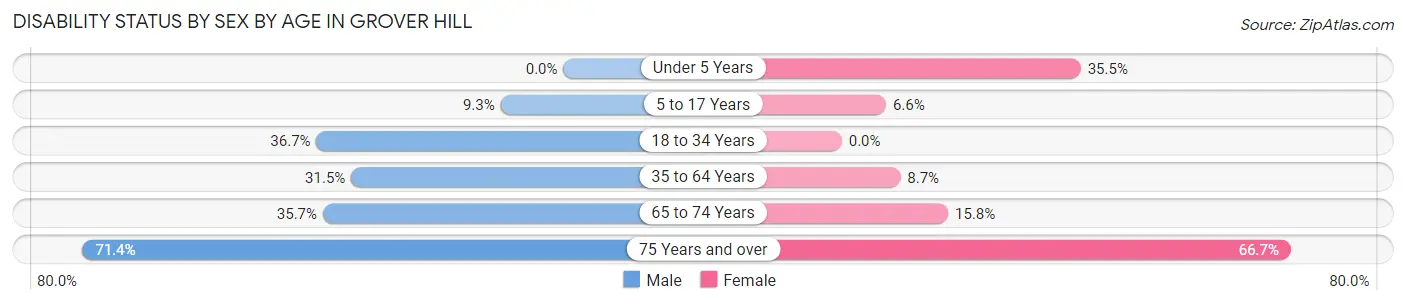
| Age Bracket | Male | Female |
| Under 5 Years | 0 (0.0%) | 11 (35.5%) |
| 5 to 17 Years | 7 (9.3%) | 4 (6.6%) |
| 18 to 34 Years | 11 (36.7%) | 0 (0.0%) |
| 35 to 64 Years | 23 (31.5%) | 6 (8.7%) |
| 65 to 74 Years | 5 (35.7%) | 3 (15.8%) |
| 75 Years and over | 5 (71.4%) | 6 (66.7%) |
Disability Class by Sex by Age in Grover Hill
Disability Class: Hearing Difficulty
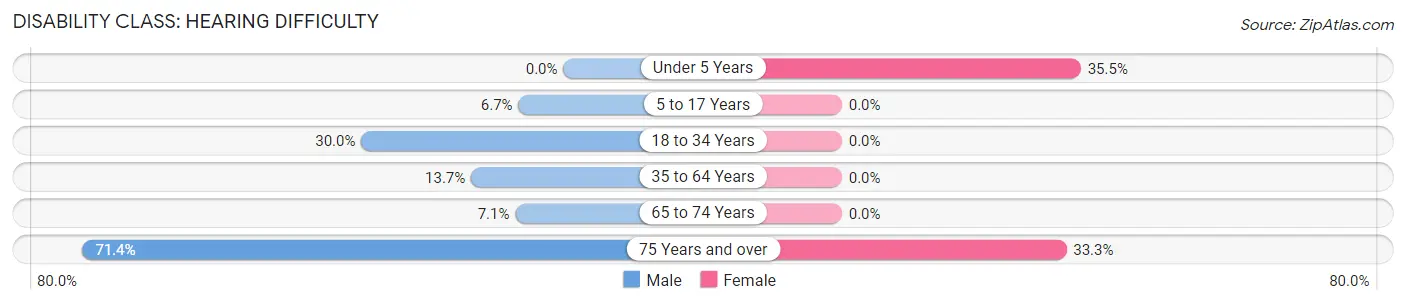
| Age Bracket | Male | Female |
| Under 5 Years | 0 (0.0%) | 11 (35.5%) |
| 5 to 17 Years | 5 (6.7%) | 0 (0.0%) |
| 18 to 34 Years | 9 (30.0%) | 0 (0.0%) |
| 35 to 64 Years | 10 (13.7%) | 0 (0.0%) |
| 65 to 74 Years | 1 (7.1%) | 0 (0.0%) |
| 75 Years and over | 5 (71.4%) | 3 (33.3%) |
Disability Class: Vision Difficulty
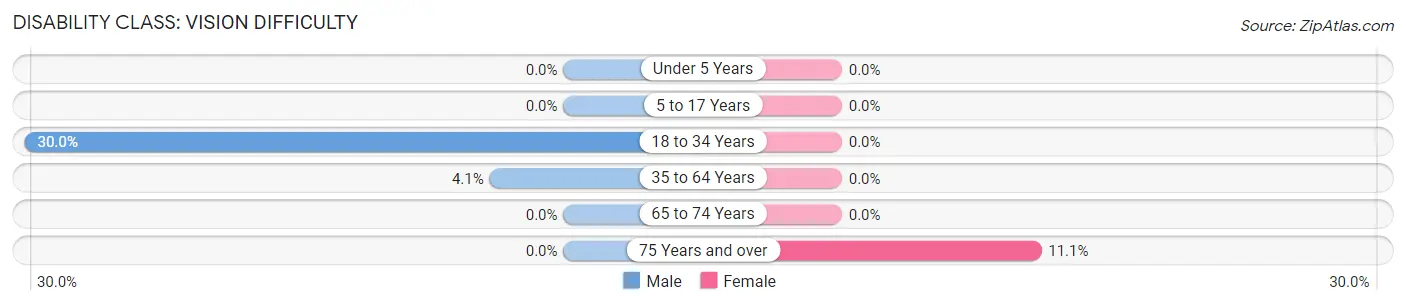
| Age Bracket | Male | Female |
| Under 5 Years | 0 (0.0%) | 0 (0.0%) |
| 5 to 17 Years | 0 (0.0%) | 0 (0.0%) |
| 18 to 34 Years | 9 (30.0%) | 0 (0.0%) |
| 35 to 64 Years | 3 (4.1%) | 0 (0.0%) |
| 65 to 74 Years | 0 (0.0%) | 0 (0.0%) |
| 75 Years and over | 0 (0.0%) | 1 (11.1%) |
Disability Class: Cognitive Difficulty
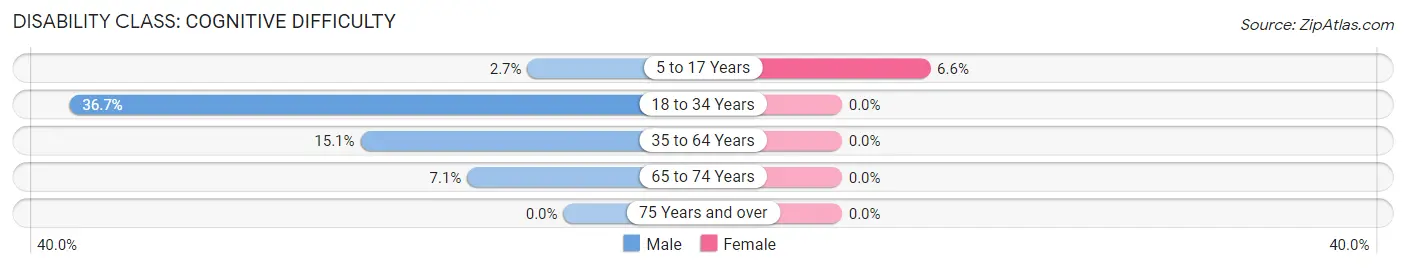
| Age Bracket | Male | Female |
| 5 to 17 Years | 2 (2.7%) | 4 (6.6%) |
| 18 to 34 Years | 11 (36.7%) | 0 (0.0%) |
| 35 to 64 Years | 11 (15.1%) | 0 (0.0%) |
| 65 to 74 Years | 1 (7.1%) | 0 (0.0%) |
| 75 Years and over | 0 (0.0%) | 0 (0.0%) |
Disability Class: Ambulatory Difficulty
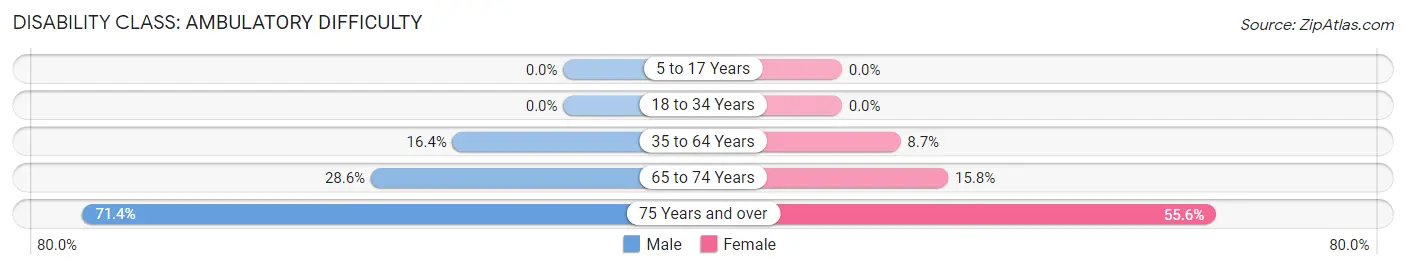
| Age Bracket | Male | Female |
| 5 to 17 Years | 0 (0.0%) | 0 (0.0%) |
| 18 to 34 Years | 0 (0.0%) | 0 (0.0%) |
| 35 to 64 Years | 12 (16.4%) | 6 (8.7%) |
| 65 to 74 Years | 4 (28.6%) | 3 (15.8%) |
| 75 Years and over | 5 (71.4%) | 5 (55.6%) |
Disability Class: Self-Care Difficulty
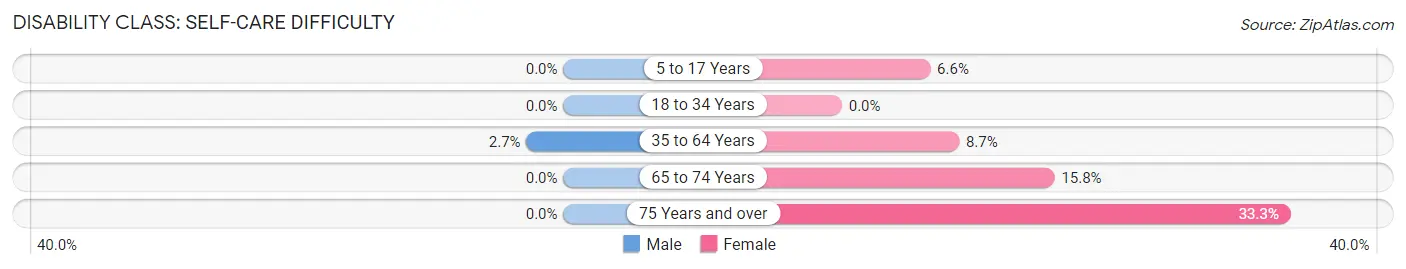
| Age Bracket | Male | Female |
| 5 to 17 Years | 0 (0.0%) | 4 (6.6%) |
| 18 to 34 Years | 0 (0.0%) | 0 (0.0%) |
| 35 to 64 Years | 2 (2.7%) | 6 (8.7%) |
| 65 to 74 Years | 0 (0.0%) | 3 (15.8%) |
| 75 Years and over | 0 (0.0%) | 3 (33.3%) |
Technology Access in Grover Hill
Computing Device Access in Grover Hill
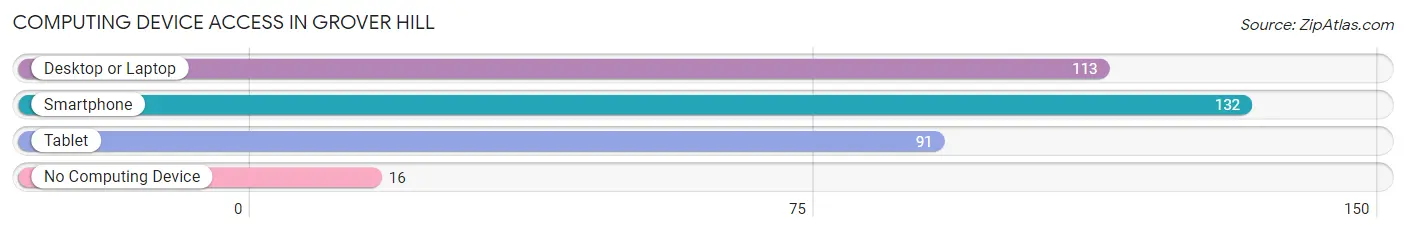
| Device Type | # Households | % Households |
| Desktop or Laptop | 113 | 71.5% |
| Smartphone | 132 | 83.5% |
| Tablet | 91 | 57.6% |
| No Computing Device | 16 | 10.1% |
| Total | 158 | 100.0% |
Internet Access in Grover Hill
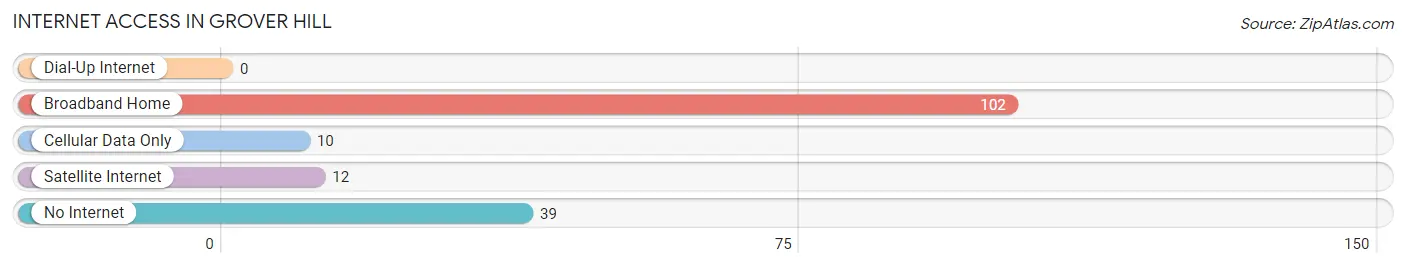
| Internet Type | # Households | % Households |
| Dial-Up Internet | 0 | 0.0% |
| Broadband Home | 102 | 64.6% |
| Cellular Data Only | 10 | 6.3% |
| Satellite Internet | 12 | 7.6% |
| No Internet | 39 | 24.7% |
| Total | 158 | 100.0% |
Grover Hill Summary
Grover Hill is a village located in Paulding County, Ohio, United States. The population was 545 at the 2010 census. It is part of the Van Wert Micropolitan Statistical Area.
History
The village of Grover Hill was founded in 1875 by John Grover, a local farmer. Grover had purchased the land from the government in 1871 and began to develop the area. He built a general store, a post office, and a blacksmith shop. The village was named after him.
In 1876, the first school was built in Grover Hill. It was a one-room schoolhouse that served the community until it was replaced by a larger building in 1891.
The village continued to grow throughout the late 19th and early 20th centuries. In 1910, the population was 545. By 1920, it had grown to 645.
Geography
Grover Hill is located at 41 14 25 North 84 37 17 West 41 240278 84 621389
According to the United States Census Bureau, the village has a total area of 0.6 square miles (1.6 km2), all land.
Demographics
As of the census of 2000, there were 545 people, 212 households, and 155 families residing in the village. The population density was 890.3 people per square mile (344.7/km2). There were 224 housing units at an average density of 365.2 per square mile (141.2/km2). The racial makeup of the village was 98.18% White, 0.18% African American, 0.37% Native American, 0.18% Asian, 0.37% from other races, and 0.73% from two or more races. Hispanic or Latino of any race were 0.73% of the population.
There were 212 households, out of which 33.0% had children under the age of 18 living with them, 59.4% were married couples living together, 9.4% had a female householder with no husband present, and 27.4% were non-families. 24.5% of all households were made up of individuals, and 12.3% had someone living alone who was 65 years of age or older. The average household size was 2.57 and the average family size was 3.06.
In the village, the population was spread out, with 27.2% under the age of 18, 8.2% from 18 to 24, 28.2% from 25 to 44, 22.2% from 45 to 64, and 14.2% who were 65 years of age or older. The median age was 36 years. For every 100 females, there were 97.3 males. For every 100 females age 18 and over, there were 94.2 males.
The median income for a household in the village was $37,500, and the median income for a family was $41,250. Males had a median income of $30,625 versus $21,250 for females. The per capita income for the village was $15,945. About 6.3% of families and 8.2% of the population were below the poverty line, including 8.3% of those under age 18 and 8.3% of those age 65 or over.
Economy
The economy of Grover Hill is largely based on agriculture. The village is home to several farms, which produce a variety of crops, including corn, soybeans, wheat, and hay.
The village also has a few small businesses, including a grocery store, a hardware store, and a few restaurants.
The village is also home to a few manufacturing companies, including a plastics manufacturer and a metal fabrication company.
Conclusion
Grover Hill is a small village located in Paulding County, Ohio. It was founded in 1875 by John Grover and has a population of 545 as of the 2010 census. The village is largely agricultural, with several farms producing a variety of crops. It also has a few small businesses and manufacturing companies.
Common Questions
What is Per Capita Income in Grover Hill?
Per Capita income in Grover Hill is $19,976.
What is the Median Family Income in Grover Hill?
Median Family Income in Grover Hill is $70,000.
What is the Median Household income in Grover Hill?
Median Household Income in Grover Hill is $55,227.
What is Income or Wage Gap in Grover Hill?
Income or Wage Gap in Grover Hill is 13.6%.
Women in Grover Hill earn 86.4 cents for every dollar earned by a man.
What is Inequality or Gini Index in Grover Hill?
Inequality or Gini Index in Grover Hill is 0.36.
What is the Total Population of Grover Hill?
Total Population of Grover Hill is 461.
What is the Total Male Population of Grover Hill?
Total Male Population of Grover Hill is 220.
What is the Total Female Population of Grover Hill?
Total Female Population of Grover Hill is 241.
What is the Ratio of Males per 100 Females in Grover Hill?
There are 91.29 Males per 100 Females in Grover Hill.
What is the Ratio of Females per 100 Males in Grover Hill?
There are 109.55 Females per 100 Males in Grover Hill.
What is the Median Population Age in Grover Hill?
Median Population Age in Grover Hill is 30.3 Years.
What is the Average Family Size in Grover Hill
Average Family Size in Grover Hill is 4.2 People.
What is the Average Household Size in Grover Hill
Average Household Size in Grover Hill is 2.9 People.
How Large is the Labor Force in Grover Hill?
There are 166 People in the Labor Forcein in Grover Hill.
What is the Percentage of People in the Labor Force in Grover Hill?
56.5% of People are in the Labor Force in Grover Hill.
What is the Unemployment Rate in Grover Hill?
Unemployment Rate in Grover Hill is 6.6%.