Greenville, OH Map & Demographics
Greenville Map
Greenville Overview
$28,285
PER CAPITA INCOME
$70,481
AVG FAMILY INCOME
$45,746
AVG HOUSEHOLD INCOME
23.9%
WAGE / INCOME GAP [ % ]
76.1¢/ $1
WAGE / INCOME GAP [ $ ]
0.45
INEQUALITY / GINI INDEX
12,768
TOTAL POPULATION
5,931
MALE POPULATION
6,837
FEMALE POPULATION
86.75
MALES / 100 FEMALES
115.28
FEMALES / 100 MALES
44.2
MEDIAN AGE
3.0
AVG FAMILY SIZE
2.1
AVG HOUSEHOLD SIZE
5,705
LABOR FORCE [ PEOPLE ]
55.2%
PERCENT IN LABOR FORCE
4.0%
UNEMPLOYMENT RATE
Greenville Zip Codes
Greenville Area Codes
Income in Greenville
Income Overview in Greenville
Per Capita Income in Greenville is $28,285, while median incomes of families and households are $70,481 and $45,746 respectively.
| Characteristic | Number | Measure |
| Per Capita Income | 12,768 | $28,285 |
| Median Family Income | 2,853 | $70,481 |
| Mean Family Income | 2,853 | $81,703 |
| Median Household Income | 5,869 | $45,746 |
| Mean Household Income | 5,869 | $60,383 |
| Income Deficit | 2,853 | $0 |
| Wage / Income Gap (%) | 12,768 | 23.93% |
| Wage / Income Gap ($) | 12,768 | 76.07¢ per $1 |
| Gini / Inequality Index | 12,768 | 0.45 |
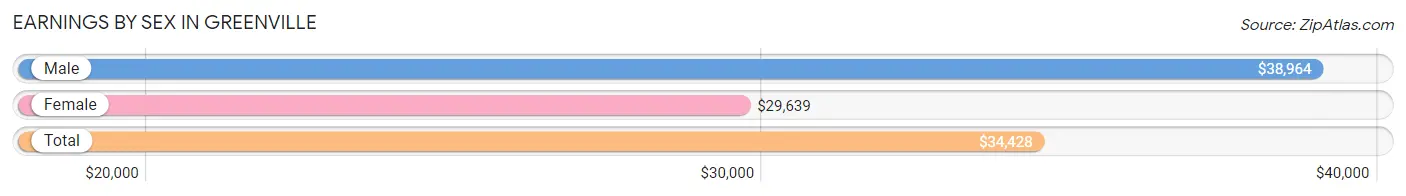
Earnings by Sex in Greenville
Average Earnings in Greenville are $34,428, $38,964 for men and $29,639 for women, a difference of 23.9%.
| Sex | Number | Average Earnings |
| Male | 2,969 (50.0%) | $38,964 |
| Female | 2,963 (49.9%) | $29,639 |
| Total | 5,932 (100.0%) | $34,428 |
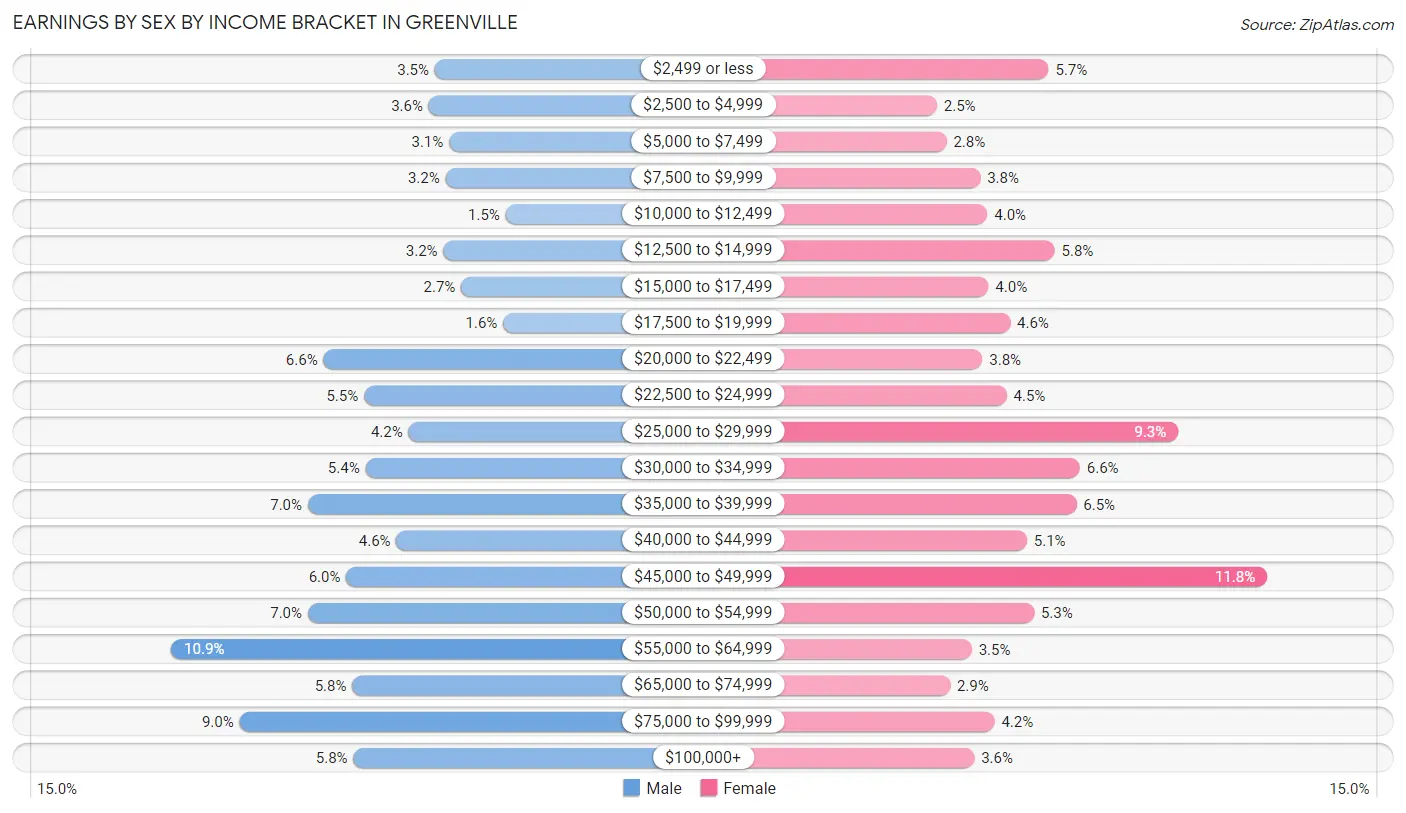
Earnings by Sex by Income Bracket in Greenville
The most common earnings brackets in Greenville are $55,000 to $64,999 for men (323 | 10.9%) and $45,000 to $49,999 for women (350 | 11.8%).
| Income | Male | Female |
| $2,499 or less | 103 (3.5%) | 168 (5.7%) |
| $2,500 to $4,999 | 108 (3.6%) | 75 (2.5%) |
| $5,000 to $7,499 | 91 (3.1%) | 83 (2.8%) |
| $7,500 to $9,999 | 94 (3.2%) | 111 (3.7%) |
| $10,000 to $12,499 | 44 (1.5%) | 117 (4.0%) |
| $12,500 to $14,999 | 96 (3.2%) | 173 (5.8%) |
| $15,000 to $17,499 | 81 (2.7%) | 118 (4.0%) |
| $17,500 to $19,999 | 46 (1.5%) | 136 (4.6%) |
| $20,000 to $22,499 | 196 (6.6%) | 113 (3.8%) |
| $22,500 to $24,999 | 162 (5.5%) | 133 (4.5%) |
| $25,000 to $29,999 | 125 (4.2%) | 276 (9.3%) |
| $30,000 to $34,999 | 161 (5.4%) | 194 (6.6%) |
| $35,000 to $39,999 | 209 (7.0%) | 191 (6.5%) |
| $40,000 to $44,999 | 135 (4.5%) | 150 (5.1%) |
| $45,000 to $49,999 | 177 (6.0%) | 350 (11.8%) |
| $50,000 to $54,999 | 209 (7.0%) | 156 (5.3%) |
| $55,000 to $64,999 | 323 (10.9%) | 104 (3.5%) |
| $65,000 to $74,999 | 172 (5.8%) | 86 (2.9%) |
| $75,000 to $99,999 | 266 (9.0%) | 123 (4.2%) |
| $100,000+ | 171 (5.8%) | 106 (3.6%) |
| Total | 2,969 (100.0%) | 2,963 (100.0%) |
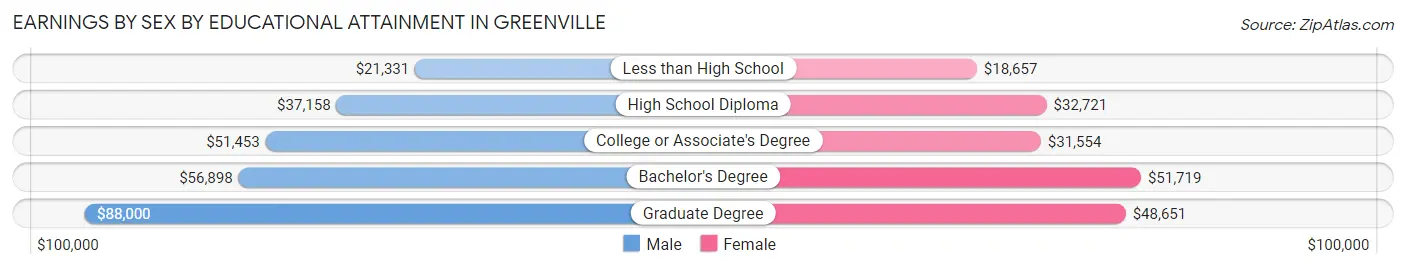
Earnings by Sex by Educational Attainment in Greenville
Average earnings in Greenville are $45,827 for men and $34,712 for women, a difference of 24.2%. Men with an educational attainment of graduate degree enjoy the highest average annual earnings of $88,000, while those with less than high school education earn the least with $21,331. Women with an educational attainment of bachelor's degree earn the most with the average annual earnings of $51,719, while those with less than high school education have the smallest earnings of $18,657.
| Educational Attainment | Male Income | Female Income |
| Less than High School | $21,331 | $18,657 |
| High School Diploma | $37,158 | $32,721 |
| College or Associate's Degree | $51,453 | $31,554 |
| Bachelor's Degree | $56,898 | $51,719 |
| Graduate Degree | $88,000 | $48,651 |
| Total | $45,827 | $34,712 |
Family Income in Greenville
Family Income Brackets in Greenville
According to the Greenville family income data, there are 668 families falling into the $75,000 to $99,999 income range, which is the most common income bracket and makes up 23.4% of all families. Conversely, the less than $10,000 income bracket is the least frequent group with only 14 families (0.5%) belonging to this category.
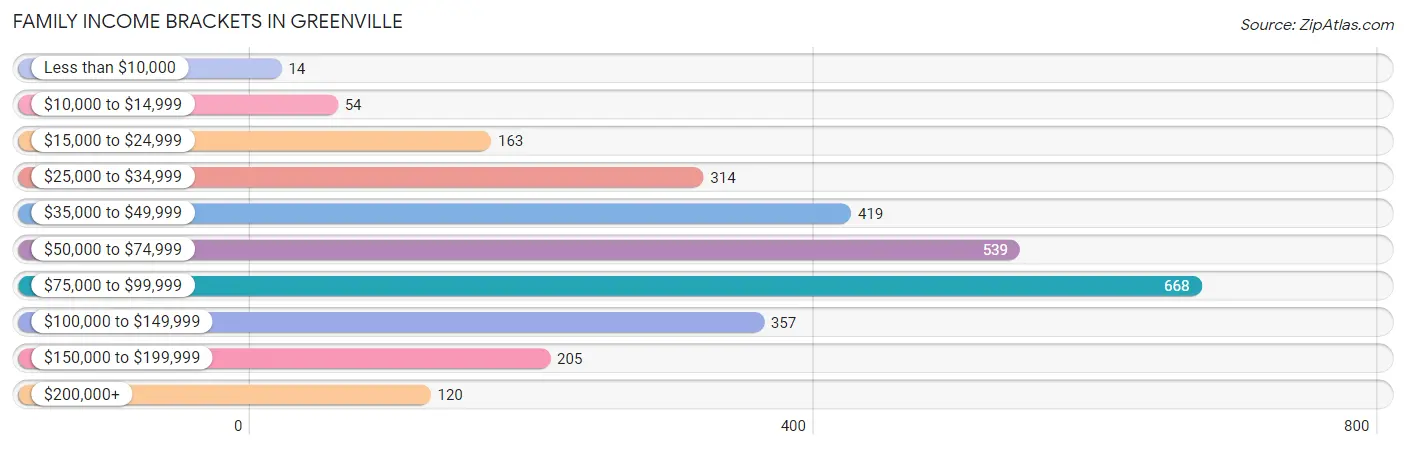
| Income Bracket | # Families | % Families |
| Less than $10,000 | 14 | 0.5% |
| $10,000 to $14,999 | 54 | 1.9% |
| $15,000 to $24,999 | 163 | 5.7% |
| $25,000 to $34,999 | 314 | 11.0% |
| $35,000 to $49,999 | 419 | 14.7% |
| $50,000 to $74,999 | 539 | 18.9% |
| $75,000 to $99,999 | 668 | 23.4% |
| $100,000 to $149,999 | 357 | 12.5% |
| $150,000 to $199,999 | 205 | 7.2% |
| $200,000+ | 120 | 4.2% |
Family Income by Famaliy Size in Greenville
4-person families (324 | 11.4%) account for the highest median family income in Greenville with $98,081 per family, while 2-person families (1,449 | 50.8%) have the highest median income of $30,264 per family member.
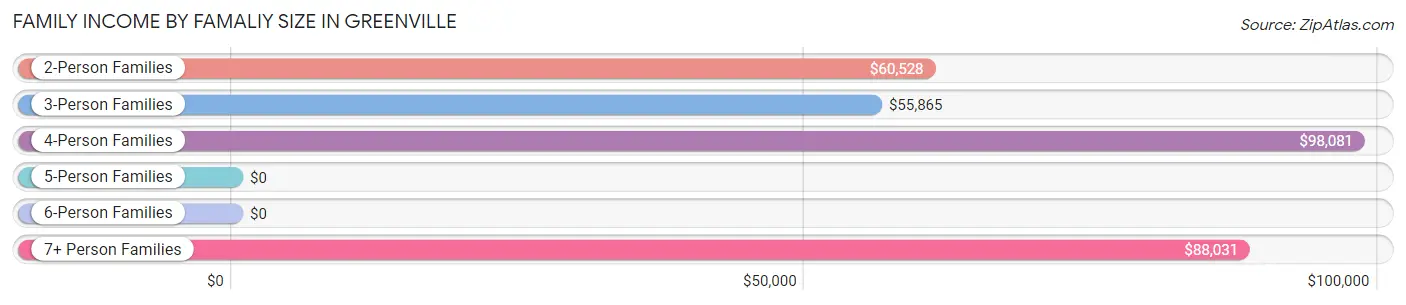
| Income Bracket | # Families | Median Income |
| 2-Person Families | 1,449 (50.8%) | $60,528 |
| 3-Person Families | 624 (21.9%) | $55,865 |
| 4-Person Families | 324 (11.4%) | $98,081 |
| 5-Person Families | 259 (9.1%) | $0 |
| 6-Person Families | 71 (2.5%) | $0 |
| 7+ Person Families | 126 (4.4%) | $88,031 |
| Total | 2,853 (100.0%) | $70,481 |
Family Income by Number of Earners in Greenville
The median family income in Greenville is $70,481, with families comprising 3+ earners (370) having the highest median family income of $109,444, while families with no earners (423) have the lowest median family income of $44,554, accounting for 13.0% and 14.8% of families, respectively.
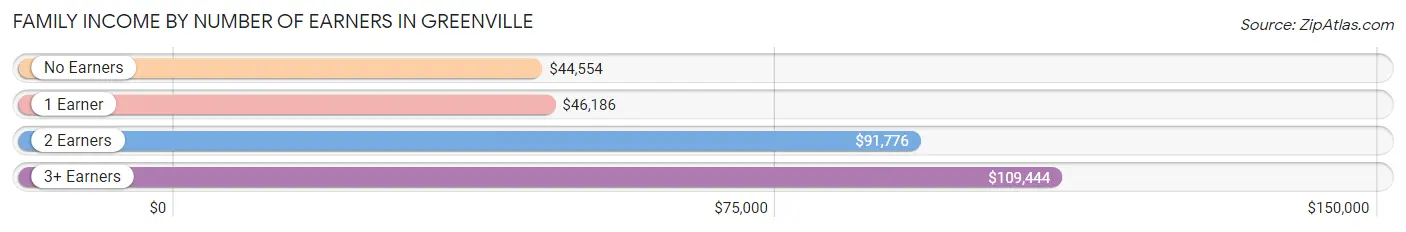
| Number of Earners | # Families | Median Income |
| No Earners | 423 (14.8%) | $44,554 |
| 1 Earner | 843 (29.5%) | $46,186 |
| 2 Earners | 1,217 (42.7%) | $91,776 |
| 3+ Earners | 370 (13.0%) | $109,444 |
| Total | 2,853 (100.0%) | $70,481 |
Household Income in Greenville
Household Income Brackets in Greenville
With 968 households falling in the category, the $50,000 to $74,999 income range is the most frequent in Greenville, accounting for 16.5% of all households. In contrast, only 158 households (2.7%) fall into the $200,000+ income bracket, making it the least populous group.
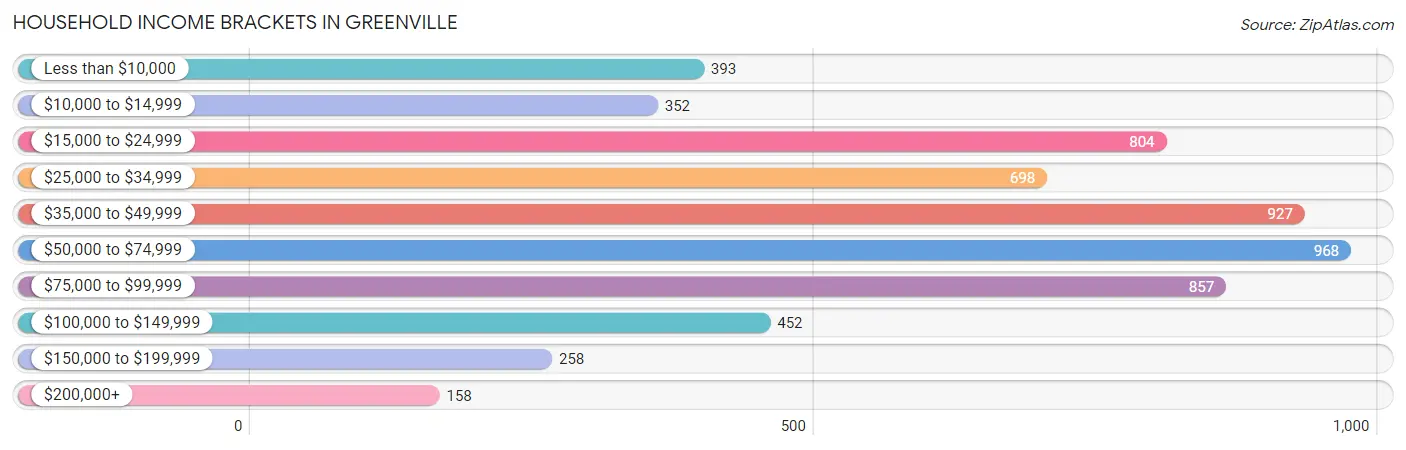
| Income Bracket | # Households | % Households |
| Less than $10,000 | 393 | 6.7% |
| $10,000 to $14,999 | 352 | 6.0% |
| $15,000 to $24,999 | 804 | 13.7% |
| $25,000 to $34,999 | 698 | 11.9% |
| $35,000 to $49,999 | 927 | 15.8% |
| $50,000 to $74,999 | 968 | 16.5% |
| $75,000 to $99,999 | 857 | 14.6% |
| $100,000 to $149,999 | 452 | 7.7% |
| $150,000 to $199,999 | 258 | 4.4% |
| $200,000+ | 158 | 2.7% |
Household Income by Householder Age in Greenville
The median household income in Greenville is $45,746, with the highest median household income of $56,331 found in the 25 to 44 years age bracket for the primary householder. A total of 1,460 households (24.9%) fall into this category. Meanwhile, the 65+ years age bracket for the primary householder has the lowest median household income of $32,894, with 2,137 households (36.4%) in this group.
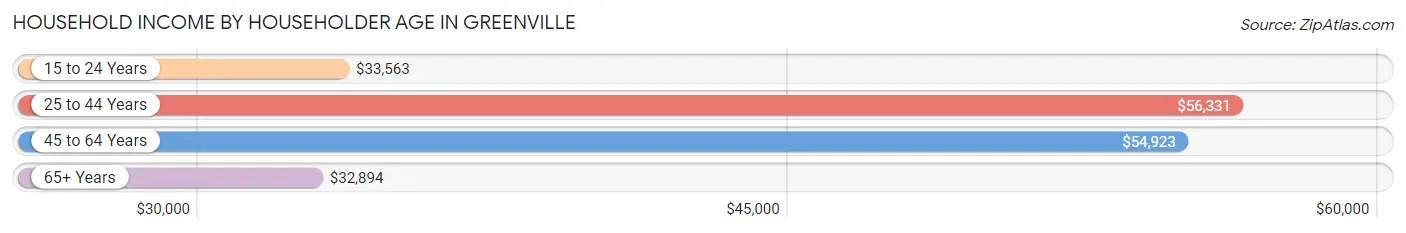
| Income Bracket | # Households | Median Income |
| 15 to 24 Years | 275 (4.7%) | $33,563 |
| 25 to 44 Years | 1,460 (24.9%) | $56,331 |
| 45 to 64 Years | 1,997 (34.0%) | $54,923 |
| 65+ Years | 2,137 (36.4%) | $32,894 |
| Total | 5,869 (100.0%) | $45,746 |
Poverty in Greenville
Income Below Poverty by Sex and Age in Greenville
With 9.2% poverty level for males and 17.5% for females among the residents of Greenville, 18 to 24 year old males and 16 and 17 year old females are the most vulnerable to poverty, with 156 males (26.0%) and 44 females (30.3%) in their respective age groups living below the poverty level.
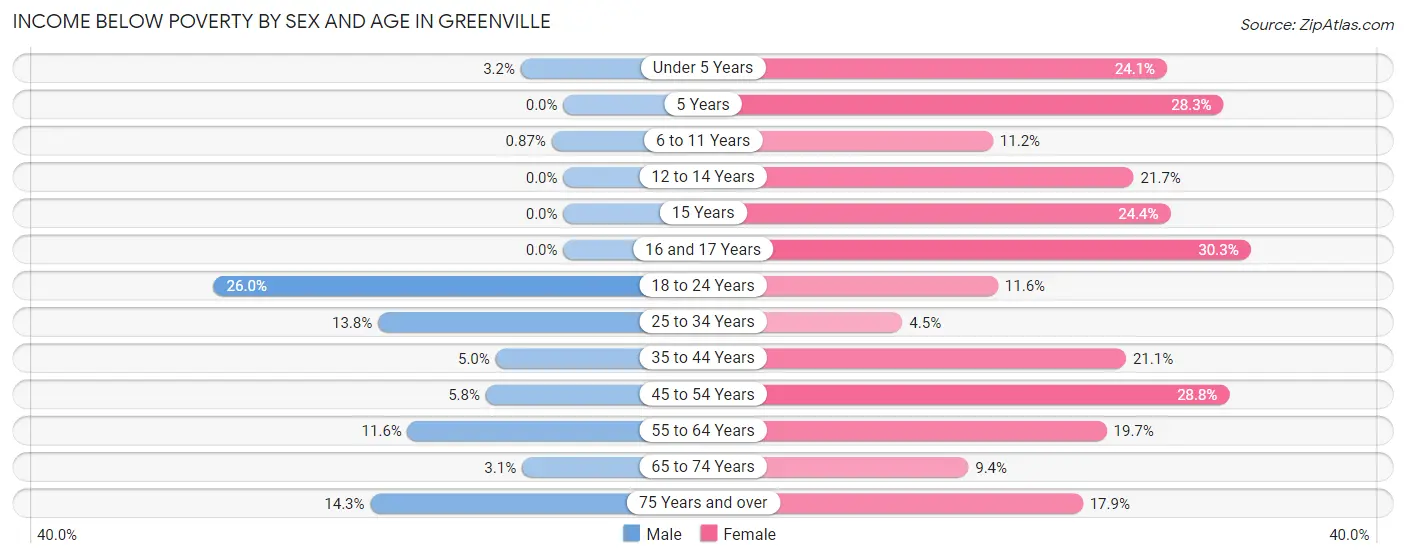
| Age Bracket | Male | Female |
| Under 5 Years | 8 (3.2%) | 91 (24.1%) |
| 5 Years | 0 (0.0%) | 51 (28.3%) |
| 6 to 11 Years | 4 (0.9%) | 35 (11.2%) |
| 12 to 14 Years | 0 (0.0%) | 65 (21.7%) |
| 15 Years | 0 (0.0%) | 40 (24.4%) |
| 16 and 17 Years | 0 (0.0%) | 44 (30.3%) |
| 18 to 24 Years | 156 (26.0%) | 48 (11.6%) |
| 25 to 34 Years | 89 (13.8%) | 35 (4.5%) |
| 35 to 44 Years | 34 (5.0%) | 134 (21.1%) |
| 45 to 54 Years | 28 (5.8%) | 176 (28.8%) |
| 55 to 64 Years | 108 (11.6%) | 187 (19.7%) |
| 65 to 74 Years | 18 (3.1%) | 65 (9.4%) |
| 75 Years and over | 90 (14.3%) | 192 (17.9%) |
| Total | 535 (9.2%) | 1,163 (17.5%) |
Income Above Poverty by Sex and Age in Greenville
According to the poverty statistics in Greenville, males aged 5 years and females aged 25 to 34 years are the age groups that are most secure financially, with 100.0% of males and 95.5% of females in these age groups living above the poverty line.
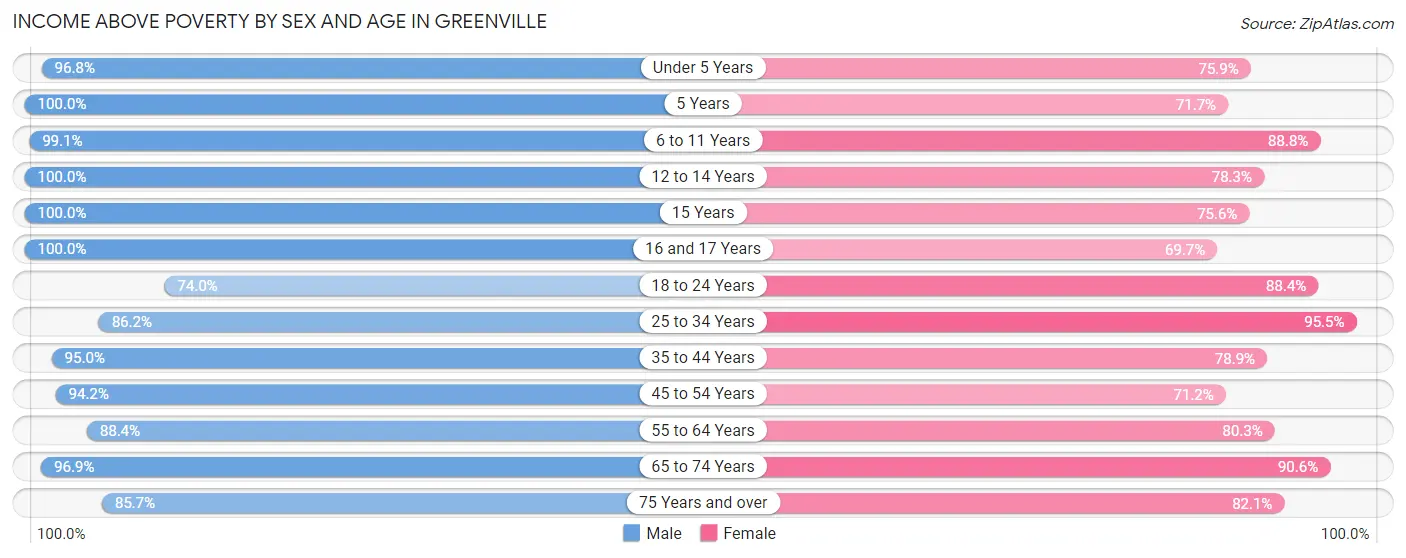
| Age Bracket | Male | Female |
| Under 5 Years | 245 (96.8%) | 286 (75.9%) |
| 5 Years | 163 (100.0%) | 129 (71.7%) |
| 6 to 11 Years | 455 (99.1%) | 277 (88.8%) |
| 12 to 14 Years | 185 (100.0%) | 235 (78.3%) |
| 15 Years | 40 (100.0%) | 124 (75.6%) |
| 16 and 17 Years | 149 (100.0%) | 101 (69.7%) |
| 18 to 24 Years | 445 (74.0%) | 366 (88.4%) |
| 25 to 34 Years | 558 (86.2%) | 742 (95.5%) |
| 35 to 44 Years | 642 (95.0%) | 501 (78.9%) |
| 45 to 54 Years | 458 (94.2%) | 436 (71.2%) |
| 55 to 64 Years | 826 (88.4%) | 764 (80.3%) |
| 65 to 74 Years | 569 (96.9%) | 627 (90.6%) |
| 75 Years and over | 538 (85.7%) | 881 (82.1%) |
| Total | 5,273 (90.8%) | 5,469 (82.5%) |
Income Below Poverty Among Married-Couple Families in Greenville
The poverty statistics for married-couple families in Greenville show that 2.2% or 47 of the total 2,110 families live below the poverty line. Families with 3 or 4 children have the highest poverty rate of 3.6%, comprising of 11 families. On the other hand, families with 5 or more children have the lowest poverty rate of 0.0%, which includes 0 families.
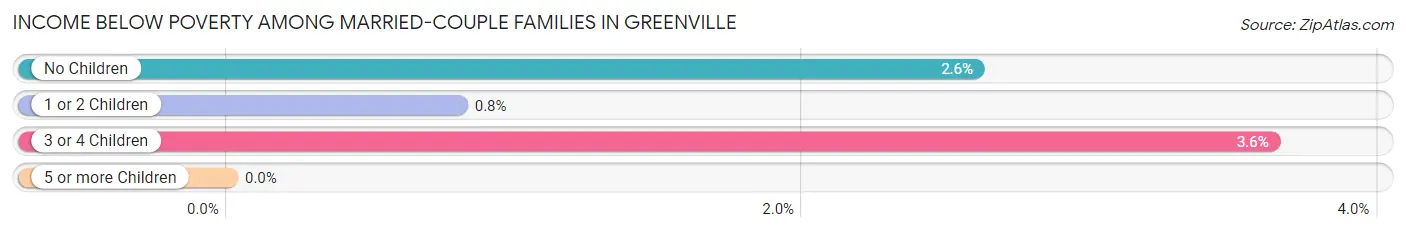
| Children | Above Poverty | Below Poverty |
| No Children | 1,201 (97.4%) | 32 (2.6%) |
| 1 or 2 Children | 496 (99.2%) | 4 (0.8%) |
| 3 or 4 Children | 292 (96.4%) | 11 (3.6%) |
| 5 or more Children | 74 (100.0%) | 0 (0.0%) |
| Total | 2,063 (97.8%) | 47 (2.2%) |
Income Below Poverty Among Single-Parent Households in Greenville
According to the poverty data in Greenville, 16.2% or 23 single-father households and 24.5% or 147 single-mother households are living below the poverty line. Among single-father households, those with 1 or 2 children have the highest poverty rate, with 23 households (24.0%) experiencing poverty. Likewise, among single-mother households, those with 5 or more children have the highest poverty rate, with 35 households (100.0%) falling below the poverty line.
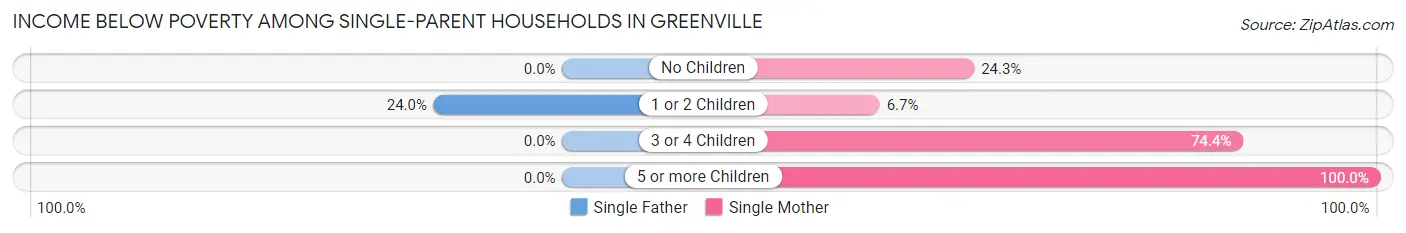
| Children | Single Father | Single Mother |
| No Children | 0 (0.0%) | 62 (24.3%) |
| 1 or 2 Children | 23 (24.0%) | 18 (6.7%) |
| 3 or 4 Children | 0 (0.0%) | 32 (74.4%) |
| 5 or more Children | 0 (0.0%) | 35 (100.0%) |
| Total | 23 (16.2%) | 147 (24.5%) |
Income Below Poverty Among Married-Couple vs Single-Parent Households in Greenville
The poverty data for Greenville shows that 47 of the married-couple family households (2.2%) and 170 of the single-parent households (22.9%) are living below the poverty level. Within the married-couple family households, those with 3 or 4 children have the highest poverty rate, with 11 households (3.6%) falling below the poverty line. Among the single-parent households, those with 5 or more children have the highest poverty rate, with 35 household (100.0%) living below poverty.
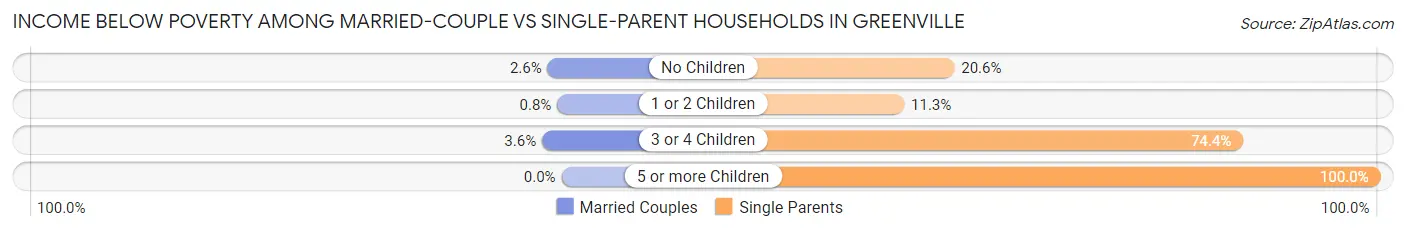
| Children | Married-Couple Families | Single-Parent Households |
| No Children | 32 (2.6%) | 62 (20.6%) |
| 1 or 2 Children | 4 (0.8%) | 41 (11.3%) |
| 3 or 4 Children | 11 (3.6%) | 32 (74.4%) |
| 5 or more Children | 0 (0.0%) | 35 (100.0%) |
| Total | 47 (2.2%) | 170 (22.9%) |
Race in Greenville
The most populous races in Greenville are White / Caucasian (12,225 | 95.8%), Two or more Races (316 | 2.5%), and Hispanic or Latino (148 | 1.2%).
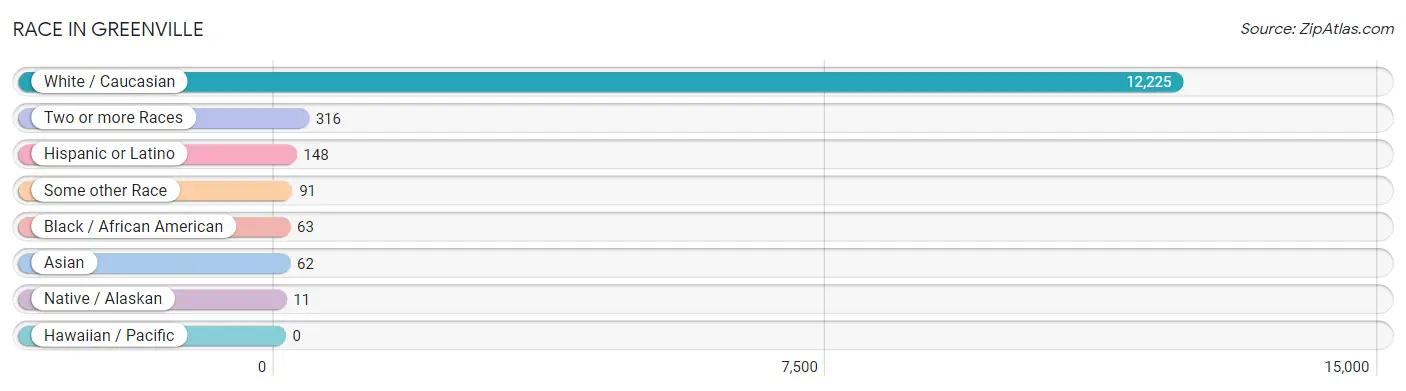
| Race | # Population | % Population |
| Asian | 62 | 0.5% |
| Black / African American | 63 | 0.5% |
| Hawaiian / Pacific | 0 | 0.0% |
| Hispanic or Latino | 148 | 1.2% |
| Native / Alaskan | 11 | 0.1% |
| White / Caucasian | 12,225 | 95.8% |
| Two or more Races | 316 | 2.5% |
| Some other Race | 91 | 0.7% |
| Total | 12,768 | 100.0% |
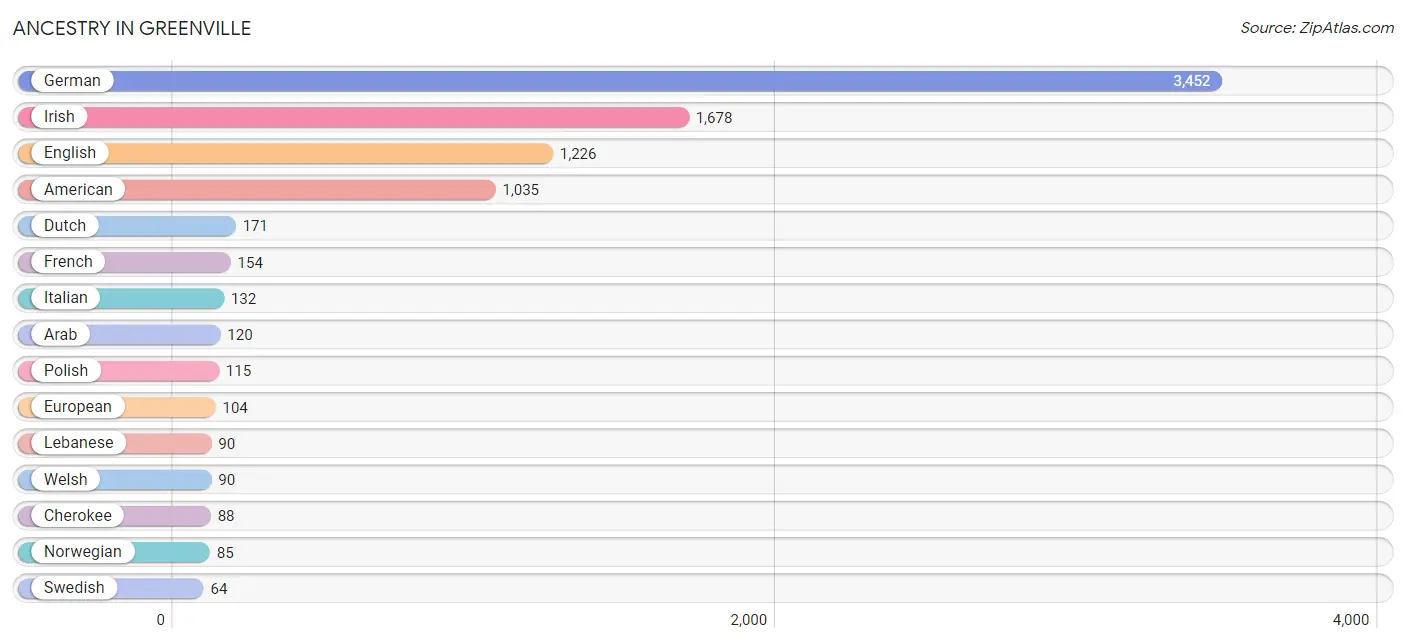
Ancestry in Greenville
The most populous ancestries reported in Greenville are German (3,452 | 27.0%), Irish (1,678 | 13.1%), English (1,226 | 9.6%), American (1,035 | 8.1%), and Dutch (171 | 1.3%), together accounting for 59.2% of all Greenville residents.
| Ancestry | # Population | % Population |
| American | 1,035 | 8.1% |
| Arab | 120 | 0.9% |
| Armenian | 18 | 0.1% |
| Blackfeet | 11 | 0.1% |
| British | 40 | 0.3% |
| Cherokee | 88 | 0.7% |
| Chickasaw | 4 | 0.0% |
| Creek | 6 | 0.1% |
| Cuban | 11 | 0.1% |
| Danish | 10 | 0.1% |
| Dutch | 171 | 1.3% |
| Egyptian | 18 | 0.1% |
| English | 1,226 | 9.6% |
| European | 104 | 0.8% |
| French | 154 | 1.2% |
| French Canadian | 17 | 0.1% |
| German | 3,452 | 27.0% |
| Hungarian | 22 | 0.2% |
| Indian (Asian) | 51 | 0.4% |
| Irish | 1,678 | 13.1% |
| Italian | 132 | 1.0% |
| Korean | 39 | 0.3% |
| Lebanese | 90 | 0.7% |
| Lithuanian | 23 | 0.2% |
| Mexican | 27 | 0.2% |
| Native Hawaiian | 26 | 0.2% |
| Norwegian | 85 | 0.7% |
| Palestinian | 12 | 0.1% |
| Pennsylvania German | 36 | 0.3% |
| Polish | 115 | 0.9% |
| Puerto Rican | 14 | 0.1% |
| Scandinavian | 8 | 0.1% |
| Scotch-Irish | 30 | 0.2% |
| Scottish | 50 | 0.4% |
| Swedish | 64 | 0.5% |
| Welsh | 90 | 0.7% | View All 36 Rows |
Immigrants in Greenville
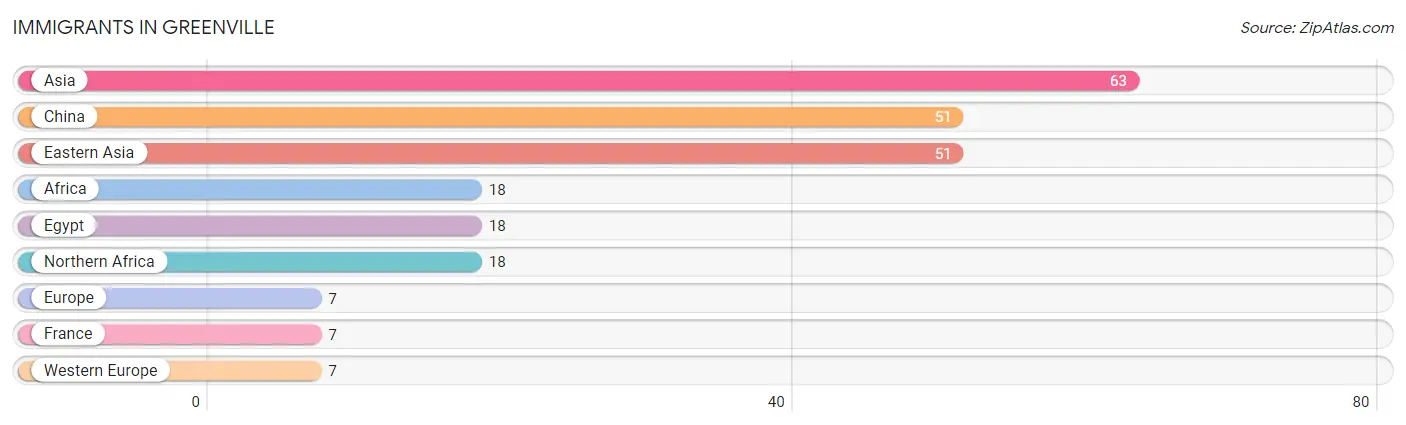
The most numerous immigrant groups reported in Greenville came from Asia (63 | 0.5%), China (51 | 0.4%), Eastern Asia (51 | 0.4%), Africa (18 | 0.1%), and Egypt (18 | 0.1%), together accounting for 1.6% of all Greenville residents.
| Immigration Origin | # Population | % Population |
| Africa | 18 | 0.1% |
| Asia | 63 | 0.5% |
| China | 51 | 0.4% |
| Eastern Asia | 51 | 0.4% |
| Egypt | 18 | 0.1% |
| Europe | 7 | 0.1% |
| France | 7 | 0.1% |
| Northern Africa | 18 | 0.1% |
| Western Europe | 7 | 0.1% | View All 9 Rows |
Sex and Age in Greenville
Sex and Age in Greenville
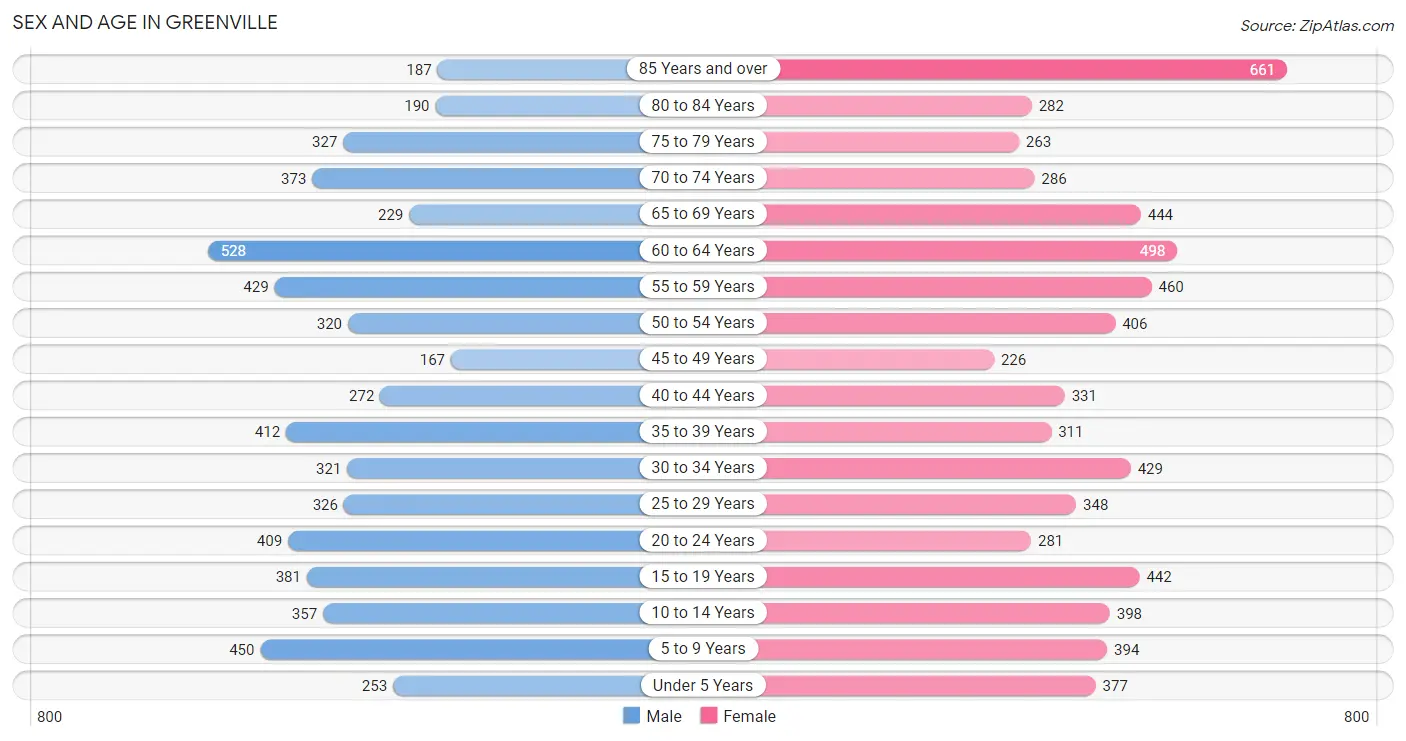
The most populous age groups in Greenville are 60 to 64 Years (528 | 8.9%) for men and 85 Years and over (661 | 9.7%) for women.
| Age Bracket | Male | Female |
| Under 5 Years | 253 (4.3%) | 377 (5.5%) |
| 5 to 9 Years | 450 (7.6%) | 394 (5.8%) |
| 10 to 14 Years | 357 (6.0%) | 398 (5.8%) |
| 15 to 19 Years | 381 (6.4%) | 442 (6.5%) |
| 20 to 24 Years | 409 (6.9%) | 281 (4.1%) |
| 25 to 29 Years | 326 (5.5%) | 348 (5.1%) |
| 30 to 34 Years | 321 (5.4%) | 429 (6.3%) |
| 35 to 39 Years | 412 (7.0%) | 311 (4.5%) |
| 40 to 44 Years | 272 (4.6%) | 331 (4.8%) |
| 45 to 49 Years | 167 (2.8%) | 226 (3.3%) |
| 50 to 54 Years | 320 (5.4%) | 406 (5.9%) |
| 55 to 59 Years | 429 (7.2%) | 460 (6.7%) |
| 60 to 64 Years | 528 (8.9%) | 498 (7.3%) |
| 65 to 69 Years | 229 (3.9%) | 444 (6.5%) |
| 70 to 74 Years | 373 (6.3%) | 286 (4.2%) |
| 75 to 79 Years | 327 (5.5%) | 263 (3.8%) |
| 80 to 84 Years | 190 (3.2%) | 282 (4.1%) |
| 85 Years and over | 187 (3.2%) | 661 (9.7%) |
| Total | 5,931 (100.0%) | 6,837 (100.0%) |
Families and Households in Greenville
Median Family Size in Greenville
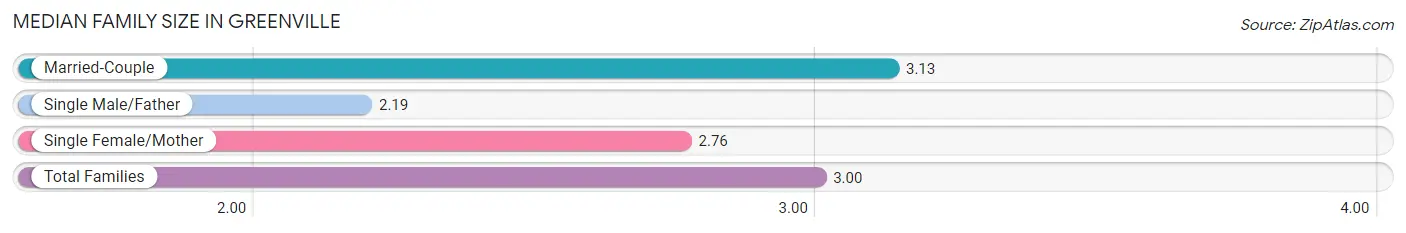
The median family size in Greenville is 3.00 persons per family, with married-couple families (2,110 | 74.0%) accounting for the largest median family size of 3.13 persons per family. On the other hand, single male/father families (142 | 5.0%) represent the smallest median family size with 2.19 persons per family.
| Family Type | # Families | Family Size |
| Married-Couple | 2,110 (74.0%) | 3.13 |
| Single Male/Father | 142 (5.0%) | 2.19 |
| Single Female/Mother | 601 (21.1%) | 2.76 |
| Total Families | 2,853 (100.0%) | 3.00 |
Median Household Size in Greenville
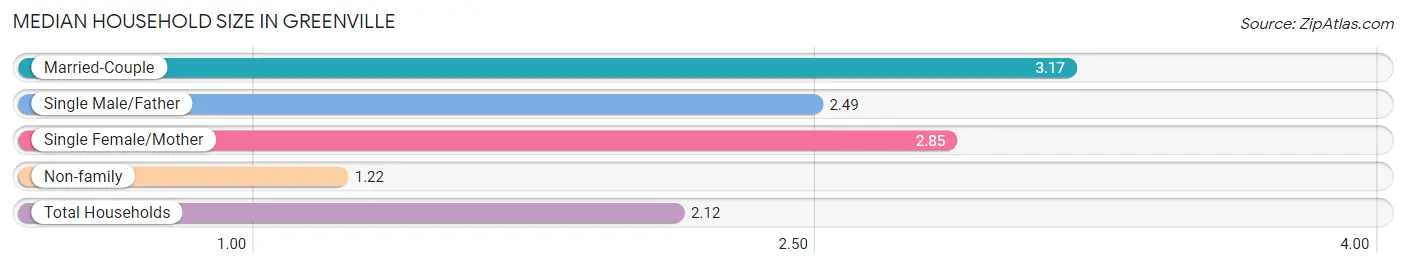
The median household size in Greenville is 2.12 persons per household, with married-couple households (2,110 | 35.9%) accounting for the largest median household size of 3.17 persons per household. non-family households (3,016 | 51.4%) represent the smallest median household size with 1.22 persons per household.
| Household Type | # Households | Household Size |
| Married-Couple | 2,110 (35.9%) | 3.17 |
| Single Male/Father | 142 (2.4%) | 2.49 |
| Single Female/Mother | 601 (10.2%) | 2.85 |
| Non-family | 3,016 (51.4%) | 1.22 |
| Total Households | 5,869 (100.0%) | 2.12 |
Household Size by Marriage Status in Greenville
Out of a total of 5,869 households in Greenville, 2,853 (48.6%) are family households, while 3,016 (51.4%) are nonfamily households. The most numerous type of family households are 2-person households, comprising 1,389, and the most common type of nonfamily households are 1-person households, comprising 2,603.
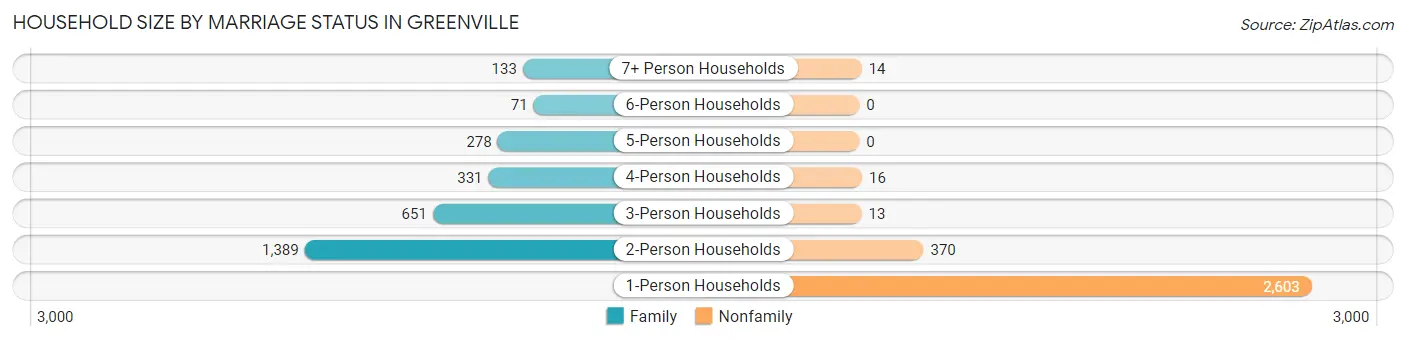
| Household Size | Family Households | Nonfamily Households |
| 1-Person Households | - | 2,603 (44.4%) |
| 2-Person Households | 1,389 (23.7%) | 370 (6.3%) |
| 3-Person Households | 651 (11.1%) | 13 (0.2%) |
| 4-Person Households | 331 (5.6%) | 16 (0.3%) |
| 5-Person Households | 278 (4.7%) | 0 (0.0%) |
| 6-Person Households | 71 (1.2%) | 0 (0.0%) |
| 7+ Person Households | 133 (2.3%) | 14 (0.2%) |
| Total | 2,853 (48.6%) | 3,016 (51.4%) |
Female Fertility in Greenville
Fertility by Age in Greenville
Average fertility rate in Greenville is 83.0 births per 1,000 women. Women in the age bracket of 20 to 34 years have the highest fertility rate with 124.0 births per 1,000 women. Women in the age bracket of 20 to 34 years acount for 64.2% of all women with births.
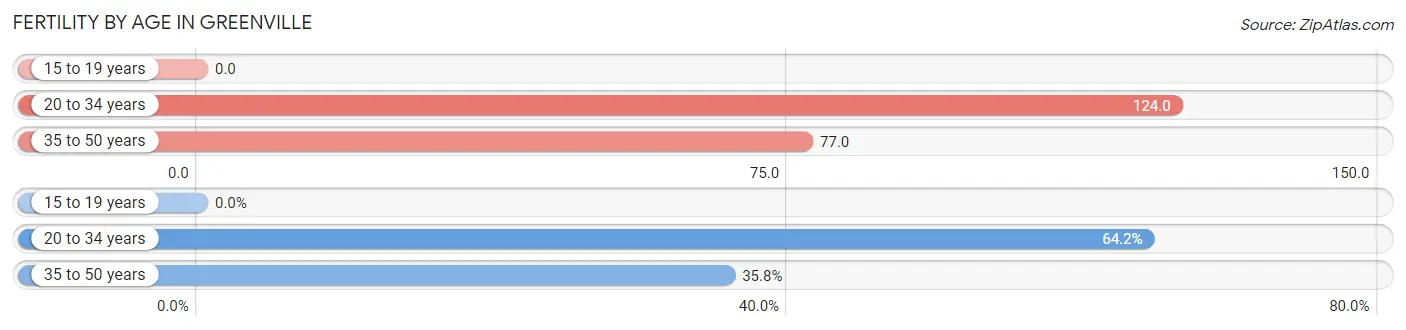
| Age Bracket | Women with Births | Births / 1,000 Women |
| 15 to 19 years | 0 (0.0%) | 0.0 |
| 20 to 34 years | 131 (64.2%) | 124.0 |
| 35 to 50 years | 73 (35.8%) | 77.0 |
| Total | 204 (100.0%) | 83.0 |
Fertility by Age by Marriage Status in Greenville
51.5% of women with births (204) in Greenville are married. The highest percentage of unmarried women with births falls into 35 to 50 years age bracket with 100.0% of them unmarried at the time of birth, while the lowest percentage of unmarried women with births belong to 20 to 34 years age bracket with 19.9% of them unmarried.
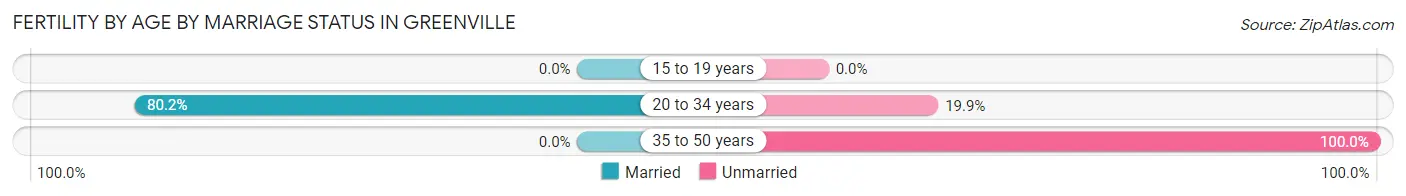
| Age Bracket | Married | Unmarried |
| 15 to 19 years | 0 (0.0%) | 0 (0.0%) |
| 20 to 34 years | 105 (80.1%) | 26 (19.9%) |
| 35 to 50 years | 0 (0.0%) | 73 (100.0%) |
| Total | 105 (51.5%) | 99 (48.5%) |
Fertility by Education in Greenville
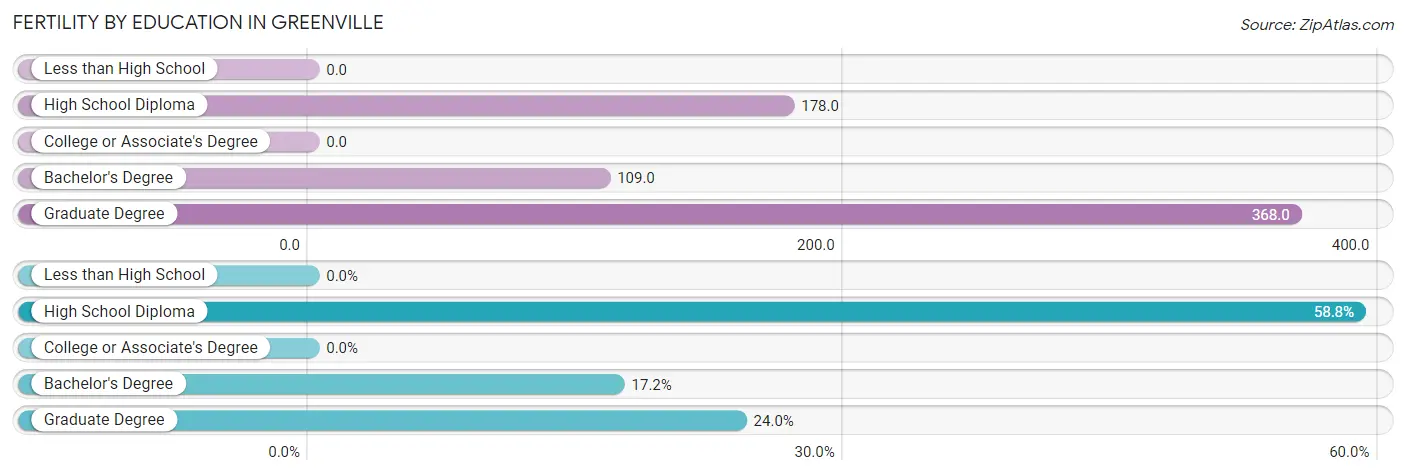
| Educational Attainment | Women with Births | Births / 1,000 Women |
| Less than High School | 0 (0.0%) | 0.0 |
| High School Diploma | 120 (58.8%) | 178.0 |
| College or Associate's Degree | 0 (0.0%) | 0.0 |
| Bachelor's Degree | 35 (17.2%) | 109.0 |
| Graduate Degree | 49 (24.0%) | 368.0 |
| Total | 204 (100.0%) | 83.0 |
Fertility by Education by Marriage Status in Greenville
48.5% of women with births in Greenville are unmarried. Women with the educational attainment of graduate degree are most likely to be married with 100.0% of them married at childbirth, while women with the educational attainment of bachelor's degree are least likely to be married with 100.0% of them unmarried at childbirth.
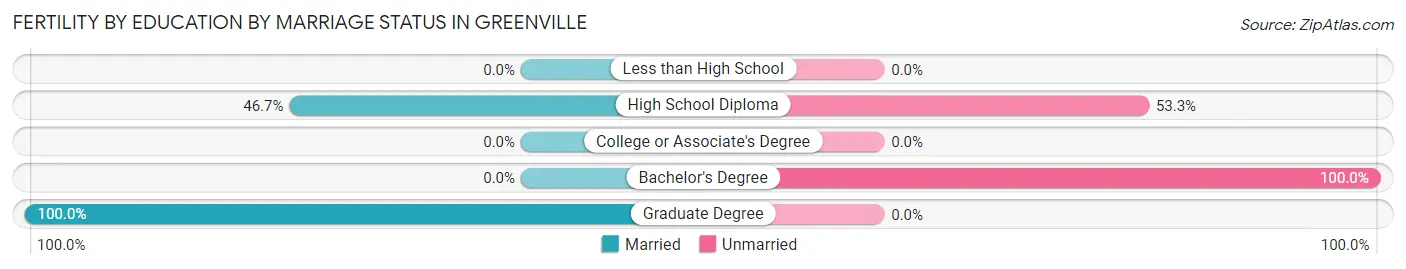
| Educational Attainment | Married | Unmarried |
| Less than High School | 0 (0.0%) | 0 (0.0%) |
| High School Diploma | 56 (46.7%) | 64 (53.3%) |
| College or Associate's Degree | 0 (0.0%) | 0 (0.0%) |
| Bachelor's Degree | 0 (0.0%) | 35 (100.0%) |
| Graduate Degree | 49 (100.0%) | 0 (0.0%) |
| Total | 105 (51.5%) | 99 (48.5%) |
Employment Characteristics in Greenville
Employment by Class of Employer in Greenville
Among the 5,411 employed individuals in Greenville, private company employees (4,189 | 77.4%), not-for-profit organizations (419 | 7.7%), and local government employees (321 | 5.9%) make up the most common classes of employment.
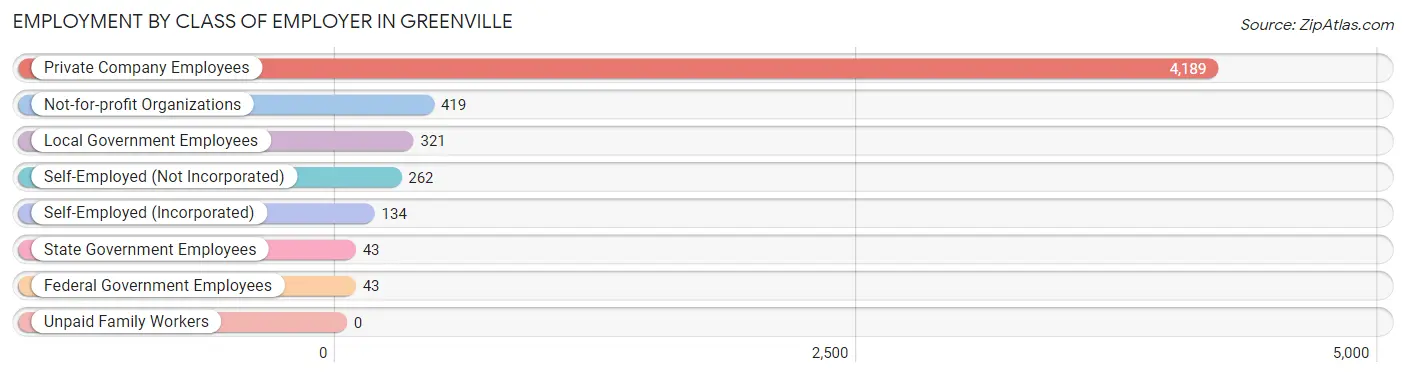
| Employer Class | # Employees | % Employees |
| Private Company Employees | 4,189 | 77.4% |
| Self-Employed (Incorporated) | 134 | 2.5% |
| Self-Employed (Not Incorporated) | 262 | 4.8% |
| Not-for-profit Organizations | 419 | 7.7% |
| Local Government Employees | 321 | 5.9% |
| State Government Employees | 43 | 0.8% |
| Federal Government Employees | 43 | 0.8% |
| Unpaid Family Workers | 0 | 0.0% |
| Total | 5,411 | 100.0% |
Employment Status by Age in Greenville
According to the labor force statistics for Greenville, out of the total population over 16 years of age (10,335), 55.2% or 5,705 individuals are in the labor force, with 4.0% or 228 of them unemployed. The age group with the highest labor force participation rate is 25 to 29 years, with 96.3% or 649 individuals in the labor force. Within the labor force, the 16 to 19 years age range has the highest percentage of unemployed individuals, with 18.0% or 44 of them being unemployed.
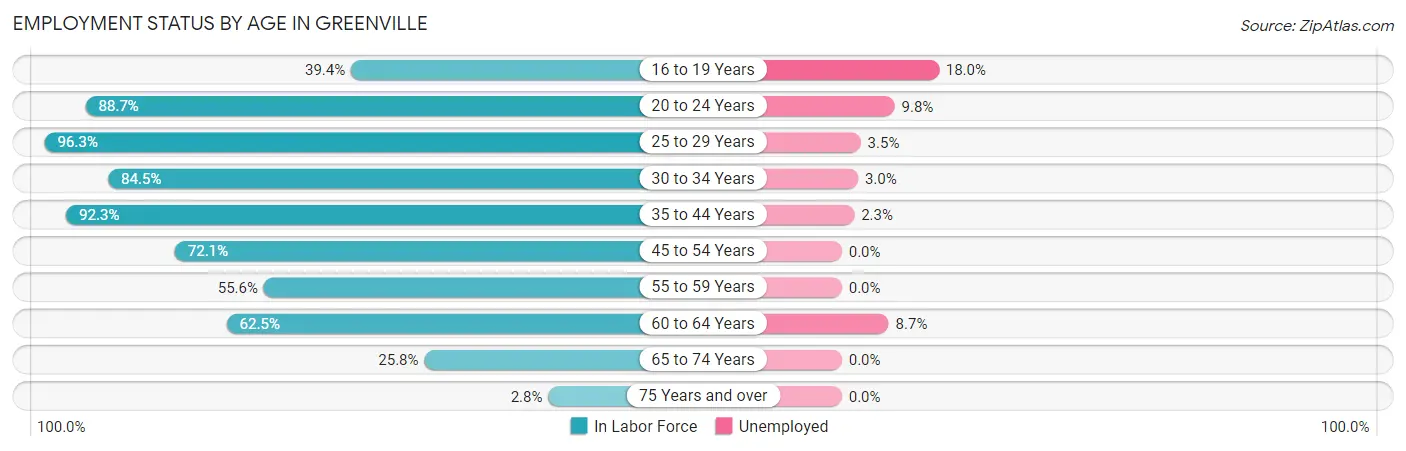
| Age Bracket | In Labor Force | Unemployed |
| 16 to 19 Years | 244 (39.4%) | 44 (18.0%) |
| 20 to 24 Years | 612 (88.7%) | 60 (9.8%) |
| 25 to 29 Years | 649 (96.3%) | 23 (3.5%) |
| 30 to 34 Years | 634 (84.5%) | 19 (3.0%) |
| 35 to 44 Years | 1,224 (92.3%) | 28 (2.3%) |
| 45 to 54 Years | 807 (72.1%) | 0 (0.0%) |
| 55 to 59 Years | 494 (55.6%) | 0 (0.0%) |
| 60 to 64 Years | 641 (62.5%) | 56 (8.7%) |
| 65 to 74 Years | 344 (25.8%) | 0 (0.0%) |
| 75 Years and over | 53 (2.8%) | 0 (0.0%) |
| Total | 5,705 (55.2%) | 228 (4.0%) |
Employment Status by Educational Attainment in Greenville
According to labor force statistics for Greenville, 76.9% of individuals (4,448) out of the total population between 25 and 64 years of age (5,784) are in the labor force, with 2.8% or 125 of them being unemployed. The group with the highest labor force participation rate are those with the educational attainment of bachelor's degree or higher, with 92.9% or 971 individuals in the labor force. Within the labor force, individuals with college / associate degree education have the highest percentage of unemployment, with 3.4% or 52 of them being unemployed.
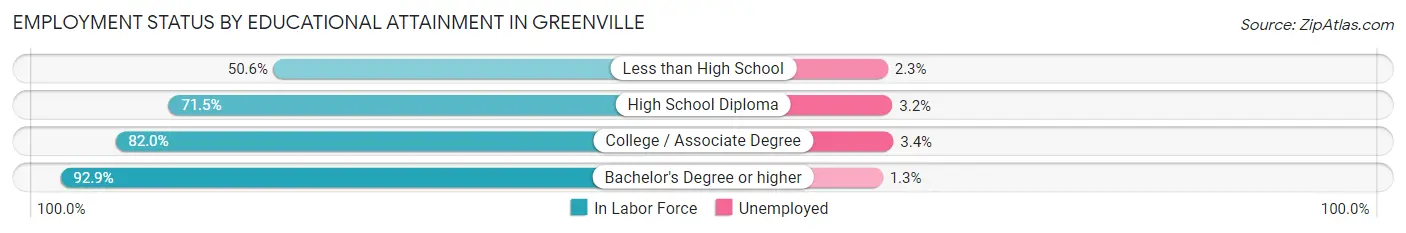
| Educational Attainment | In Labor Force | Unemployed |
| Less than High School | 261 (50.6%) | 12 (2.3%) |
| High School Diploma | 1,676 (71.5%) | 75 (3.2%) |
| College / Associate Degree | 1,541 (82.0%) | 64 (3.4%) |
| Bachelor's Degree or higher | 971 (92.9%) | 14 (1.3%) |
| Total | 4,448 (76.9%) | 162 (2.8%) |
Employment Occupations by Sex in Greenville
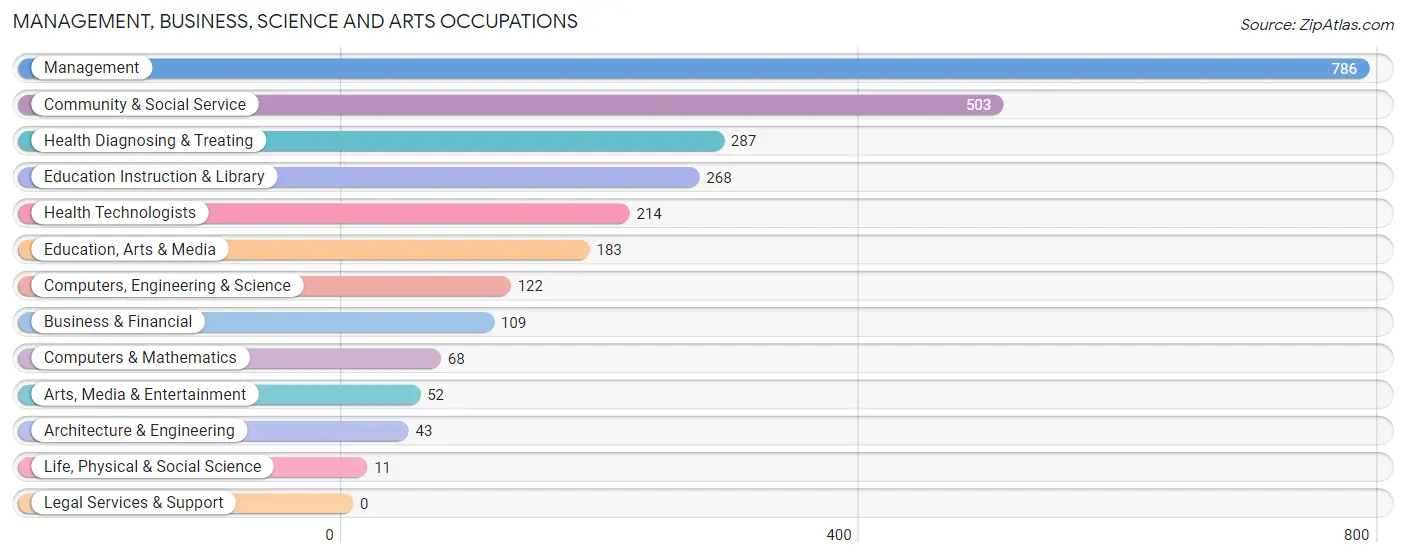
Management, Business, Science and Arts Occupations
The most common Management, Business, Science and Arts occupations in Greenville are Management (786 | 14.4%), Community & Social Service (503 | 9.2%), Health Diagnosing & Treating (287 | 5.2%), Education Instruction & Library (268 | 4.9%), and Health Technologists (214 | 3.9%).
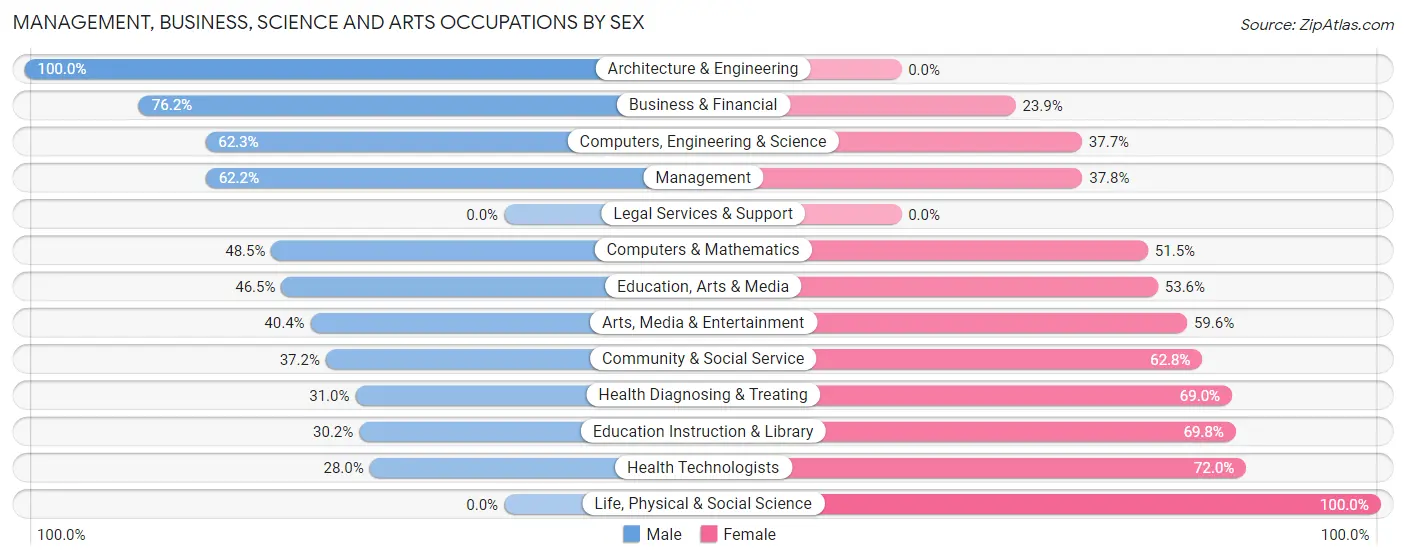
Management, Business, Science and Arts Occupations by Sex
Within the Management, Business, Science and Arts occupations in Greenville, the most male-oriented occupations are Architecture & Engineering (100.0%), Business & Financial (76.1%), and Computers, Engineering & Science (62.3%), while the most female-oriented occupations are Life, Physical & Social Science (100.0%), Health Technologists (72.0%), and Education Instruction & Library (69.8%).
| Occupation | Male | Female |
| Management | 489 (62.2%) | 297 (37.8%) |
| Business & Financial | 83 (76.1%) | 26 (23.8%) |
| Computers, Engineering & Science | 76 (62.3%) | 46 (37.7%) |
| Computers & Mathematics | 33 (48.5%) | 35 (51.5%) |
| Architecture & Engineering | 43 (100.0%) | 0 (0.0%) |
| Life, Physical & Social Science | 0 (0.0%) | 11 (100.0%) |
| Community & Social Service | 187 (37.2%) | 316 (62.8%) |
| Education, Arts & Media | 85 (46.5%) | 98 (53.5%) |
| Legal Services & Support | 0 (0.0%) | 0 (0.0%) |
| Education Instruction & Library | 81 (30.2%) | 187 (69.8%) |
| Arts, Media & Entertainment | 21 (40.4%) | 31 (59.6%) |
| Health Diagnosing & Treating | 89 (31.0%) | 198 (69.0%) |
| Health Technologists | 60 (28.0%) | 154 (72.0%) |
| Total (Category) | 924 (51.1%) | 883 (48.9%) |
| Total (Overall) | 2,826 (51.6%) | 2,647 (48.4%) |
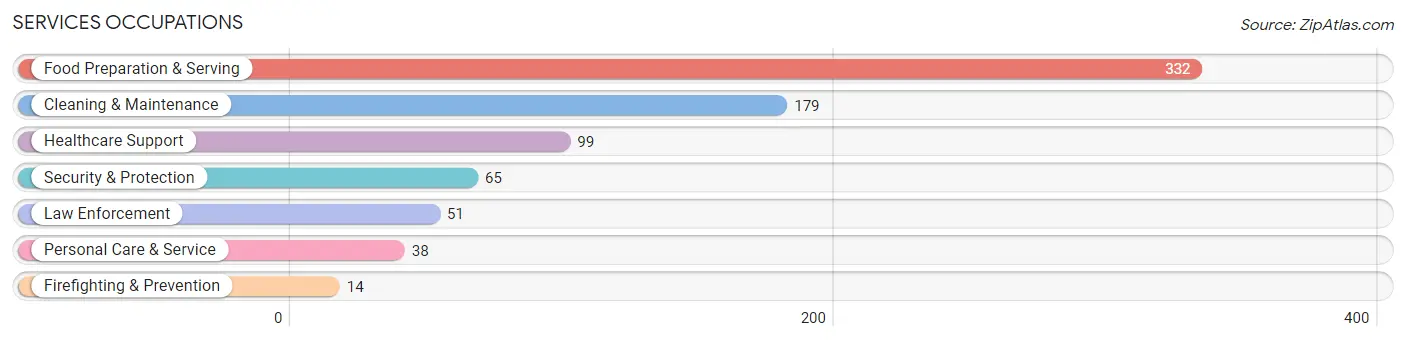
Services Occupations
The most common Services occupations in Greenville are Food Preparation & Serving (332 | 6.1%), Cleaning & Maintenance (179 | 3.3%), Healthcare Support (99 | 1.8%), Security & Protection (65 | 1.2%), and Law Enforcement (51 | 0.9%).
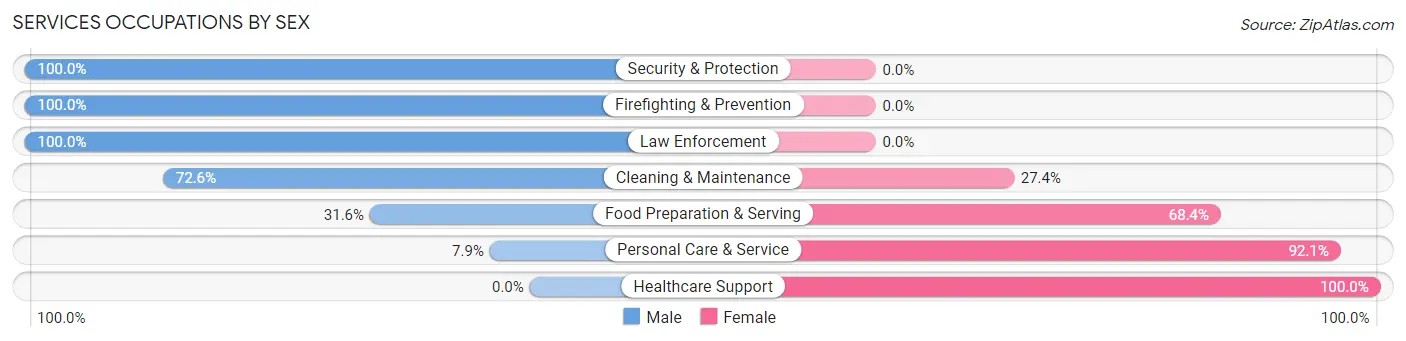
Services Occupations by Sex
Within the Services occupations in Greenville, the most male-oriented occupations are Security & Protection (100.0%), Firefighting & Prevention (100.0%), and Law Enforcement (100.0%), while the most female-oriented occupations are Healthcare Support (100.0%), Personal Care & Service (92.1%), and Food Preparation & Serving (68.4%).
| Occupation | Male | Female |
| Healthcare Support | 0 (0.0%) | 99 (100.0%) |
| Security & Protection | 65 (100.0%) | 0 (0.0%) |
| Firefighting & Prevention | 14 (100.0%) | 0 (0.0%) |
| Law Enforcement | 51 (100.0%) | 0 (0.0%) |
| Food Preparation & Serving | 105 (31.6%) | 227 (68.4%) |
| Cleaning & Maintenance | 130 (72.6%) | 49 (27.4%) |
| Personal Care & Service | 3 (7.9%) | 35 (92.1%) |
| Total (Category) | 303 (42.5%) | 410 (57.5%) |
| Total (Overall) | 2,826 (51.6%) | 2,647 (48.4%) |
Sales and Office Occupations
The most common Sales and Office occupations in Greenville are Sales & Related (617 | 11.3%), and Office & Administration (448 | 8.2%).

Sales and Office Occupations by Sex
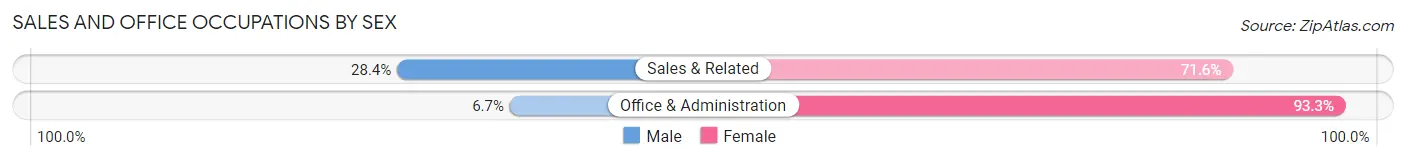
| Occupation | Male | Female |
| Sales & Related | 175 (28.4%) | 442 (71.6%) |
| Office & Administration | 30 (6.7%) | 418 (93.3%) |
| Total (Category) | 205 (19.3%) | 860 (80.7%) |
| Total (Overall) | 2,826 (51.6%) | 2,647 (48.4%) |
Natural Resources, Construction and Maintenance Occupations
The most common Natural Resources, Construction and Maintenance occupations in Greenville are Construction & Extraction (214 | 3.9%), Installation, Maintenance & Repair (164 | 3.0%), and Farming, Fishing & Forestry (77 | 1.4%).

Natural Resources, Construction and Maintenance Occupations by Sex
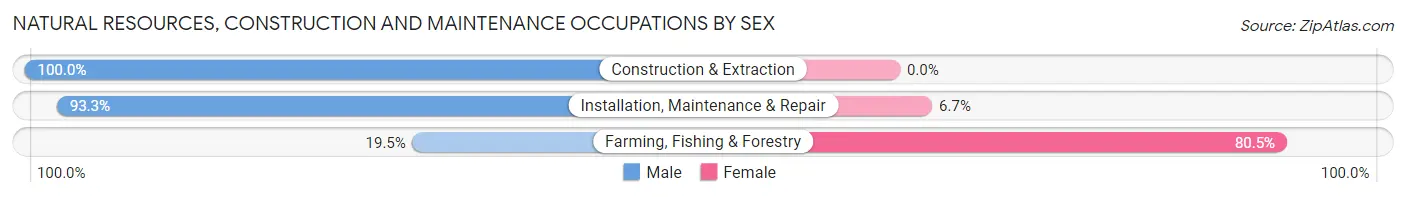
| Occupation | Male | Female |
| Farming, Fishing & Forestry | 15 (19.5%) | 62 (80.5%) |
| Construction & Extraction | 214 (100.0%) | 0 (0.0%) |
| Installation, Maintenance & Repair | 153 (93.3%) | 11 (6.7%) |
| Total (Category) | 382 (84.0%) | 73 (16.0%) |
| Total (Overall) | 2,826 (51.6%) | 2,647 (48.4%) |
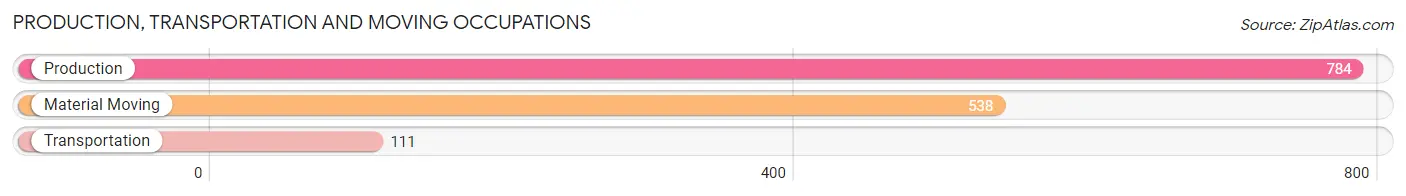
Production, Transportation and Moving Occupations
The most common Production, Transportation and Moving occupations in Greenville are Production (784 | 14.3%), Material Moving (538 | 9.8%), and Transportation (111 | 2.0%).
Production, Transportation and Moving Occupations by Sex
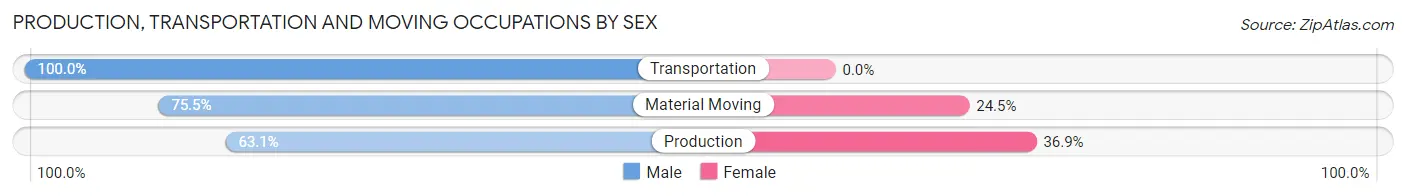
| Occupation | Male | Female |
| Production | 495 (63.1%) | 289 (36.9%) |
| Transportation | 111 (100.0%) | 0 (0.0%) |
| Material Moving | 406 (75.5%) | 132 (24.5%) |
| Total (Category) | 1,012 (70.6%) | 421 (29.4%) |
| Total (Overall) | 2,826 (51.6%) | 2,647 (48.4%) |
Employment Industries by Sex in Greenville
Employment Industries in Greenville
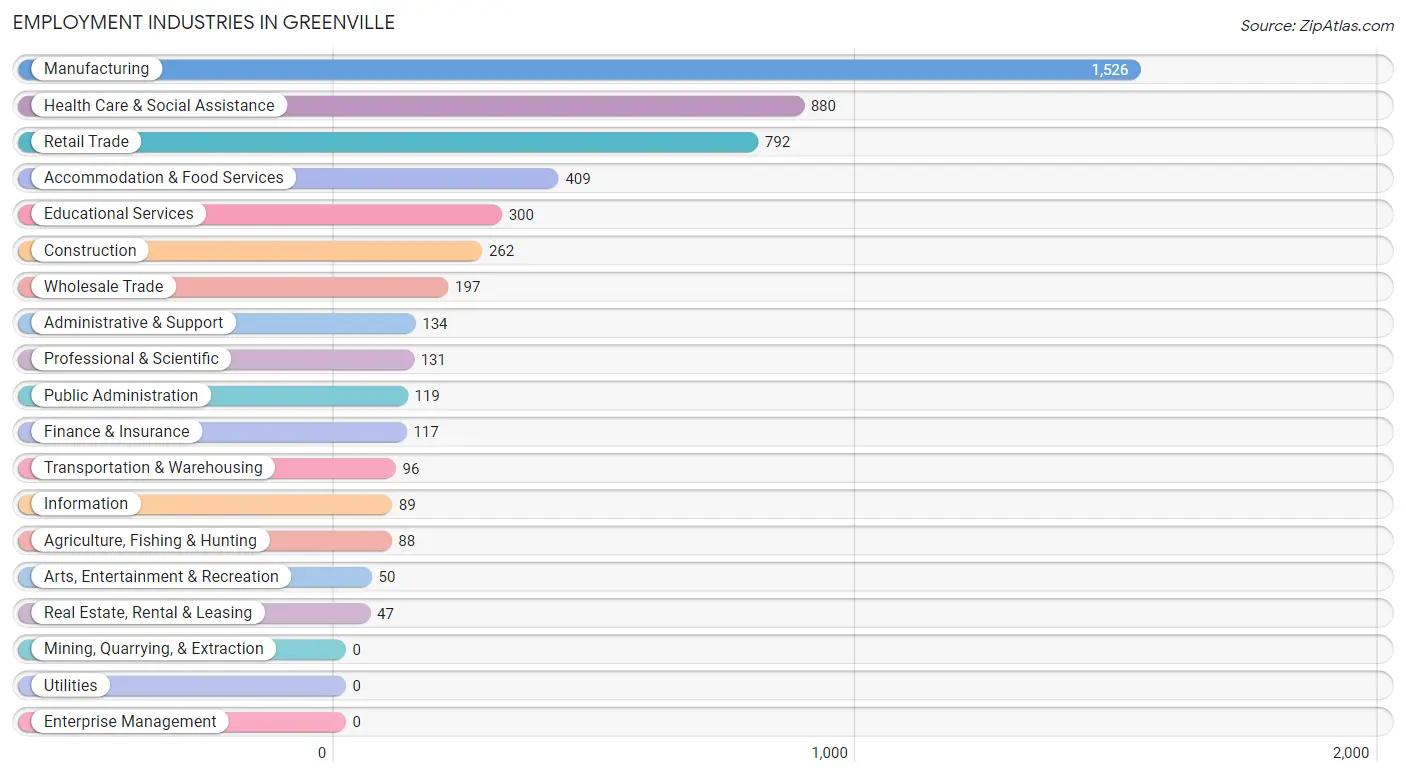
The major employment industries in Greenville include Manufacturing (1,526 | 27.9%), Health Care & Social Assistance (880 | 16.1%), Retail Trade (792 | 14.5%), Accommodation & Food Services (409 | 7.5%), and Educational Services (300 | 5.5%).
Employment Industries by Sex in Greenville
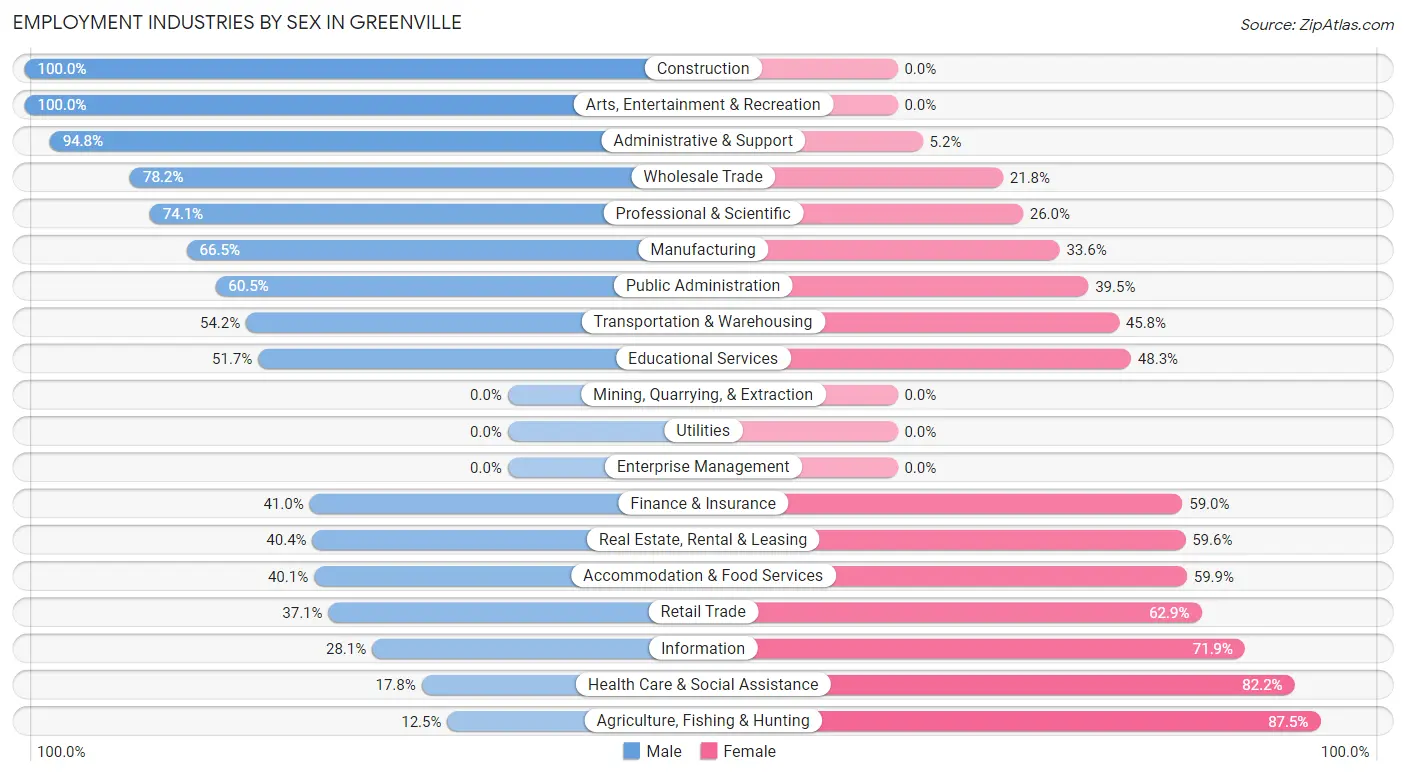
The Greenville industries that see more men than women are Construction (100.0%), Arts, Entertainment & Recreation (100.0%), and Administrative & Support (94.8%), whereas the industries that tend to have a higher number of women are Agriculture, Fishing & Hunting (87.5%), Health Care & Social Assistance (82.2%), and Information (71.9%).
| Industry | Male | Female |
| Agriculture, Fishing & Hunting | 11 (12.5%) | 77 (87.5%) |
| Mining, Quarrying, & Extraction | 0 (0.0%) | 0 (0.0%) |
| Construction | 262 (100.0%) | 0 (0.0%) |
| Manufacturing | 1,014 (66.4%) | 512 (33.6%) |
| Wholesale Trade | 154 (78.2%) | 43 (21.8%) |
| Retail Trade | 294 (37.1%) | 498 (62.9%) |
| Transportation & Warehousing | 52 (54.2%) | 44 (45.8%) |
| Utilities | 0 (0.0%) | 0 (0.0%) |
| Information | 25 (28.1%) | 64 (71.9%) |
| Finance & Insurance | 48 (41.0%) | 69 (59.0%) |
| Real Estate, Rental & Leasing | 19 (40.4%) | 28 (59.6%) |
| Professional & Scientific | 97 (74.1%) | 34 (26.0%) |
| Enterprise Management | 0 (0.0%) | 0 (0.0%) |
| Administrative & Support | 127 (94.8%) | 7 (5.2%) |
| Educational Services | 155 (51.7%) | 145 (48.3%) |
| Health Care & Social Assistance | 157 (17.8%) | 723 (82.2%) |
| Arts, Entertainment & Recreation | 50 (100.0%) | 0 (0.0%) |
| Accommodation & Food Services | 164 (40.1%) | 245 (59.9%) |
| Public Administration | 72 (60.5%) | 47 (39.5%) |
| Total | 2,826 (51.6%) | 2,647 (48.4%) |
Education in Greenville
School Enrollment in Greenville
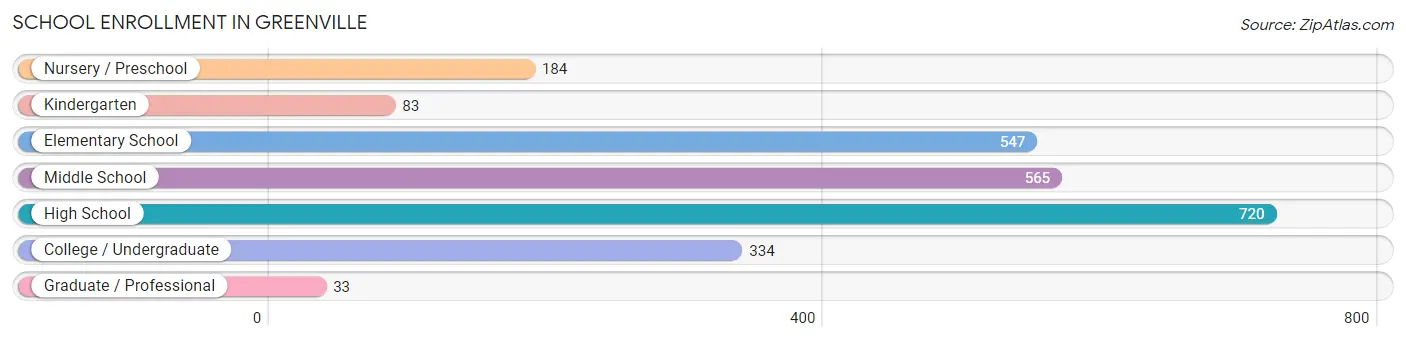
The most common levels of schooling among the 2,466 students in Greenville are high school (720 | 29.2%), middle school (565 | 22.9%), and elementary school (547 | 22.2%).
| School Level | # Students | % Students |
| Nursery / Preschool | 184 | 7.5% |
| Kindergarten | 83 | 3.4% |
| Elementary School | 547 | 22.2% |
| Middle School | 565 | 22.9% |
| High School | 720 | 29.2% |
| College / Undergraduate | 334 | 13.5% |
| Graduate / Professional | 33 | 1.3% |
| Total | 2,466 | 100.0% |
School Enrollment by Age by Funding Source in Greenville
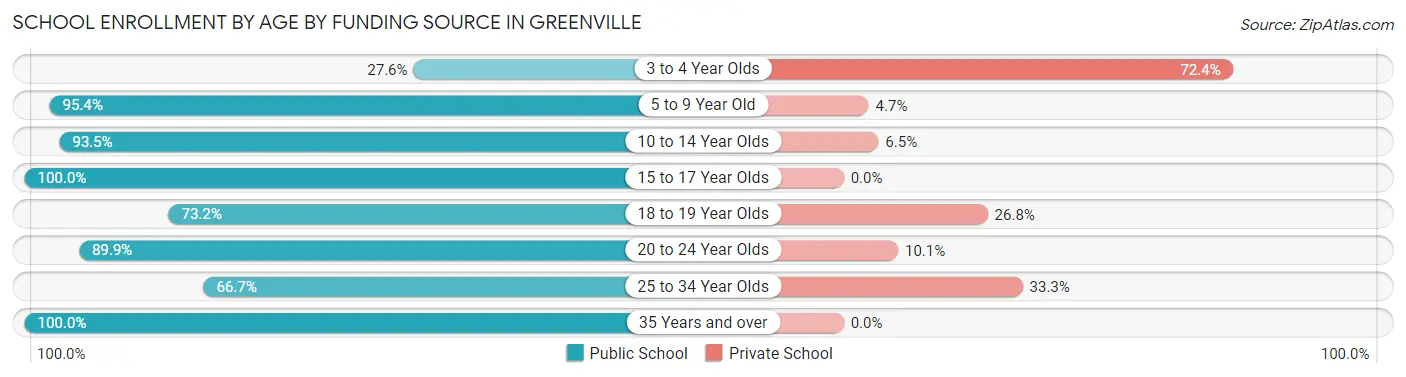
Out of a total of 2,466 students who are enrolled in schools in Greenville, 187 (7.6%) attend a private institution, while the remaining 2,279 (92.4%) are enrolled in public schools. The age group of 3 to 4 year olds has the highest likelihood of being enrolled in private schools, with 21 (72.4% in the age bracket) enrolled. Conversely, the age group of 15 to 17 year olds has the lowest likelihood of being enrolled in a private school, with 498 (100.0% in the age bracket) attending a public institution.
| Age Bracket | Public School | Private School |
| 3 to 4 Year Olds | 8 (27.6%) | 21 (72.4%) |
| 5 to 9 Year Old | 656 (95.4%) | 32 (4.6%) |
| 10 to 14 Year Olds | 651 (93.5%) | 45 (6.5%) |
| 15 to 17 Year Olds | 498 (100.0%) | 0 (0.0%) |
| 18 to 19 Year Olds | 161 (73.2%) | 59 (26.8%) |
| 20 to 24 Year Olds | 71 (89.9%) | 8 (10.1%) |
| 25 to 34 Year Olds | 46 (66.7%) | 23 (33.3%) |
| 35 Years and over | 187 (100.0%) | 0 (0.0%) |
| Total | 2,279 (92.4%) | 187 (7.6%) |
Educational Attainment by Field of Study in Greenville
Business (433 | 27.7%), education (384 | 24.5%), science & technology (185 | 11.8%), liberal arts & history (131 | 8.4%), and psychology (103 | 6.6%) are the most common fields of study among 1,564 individuals in Greenville who have obtained a bachelor's degree or higher.
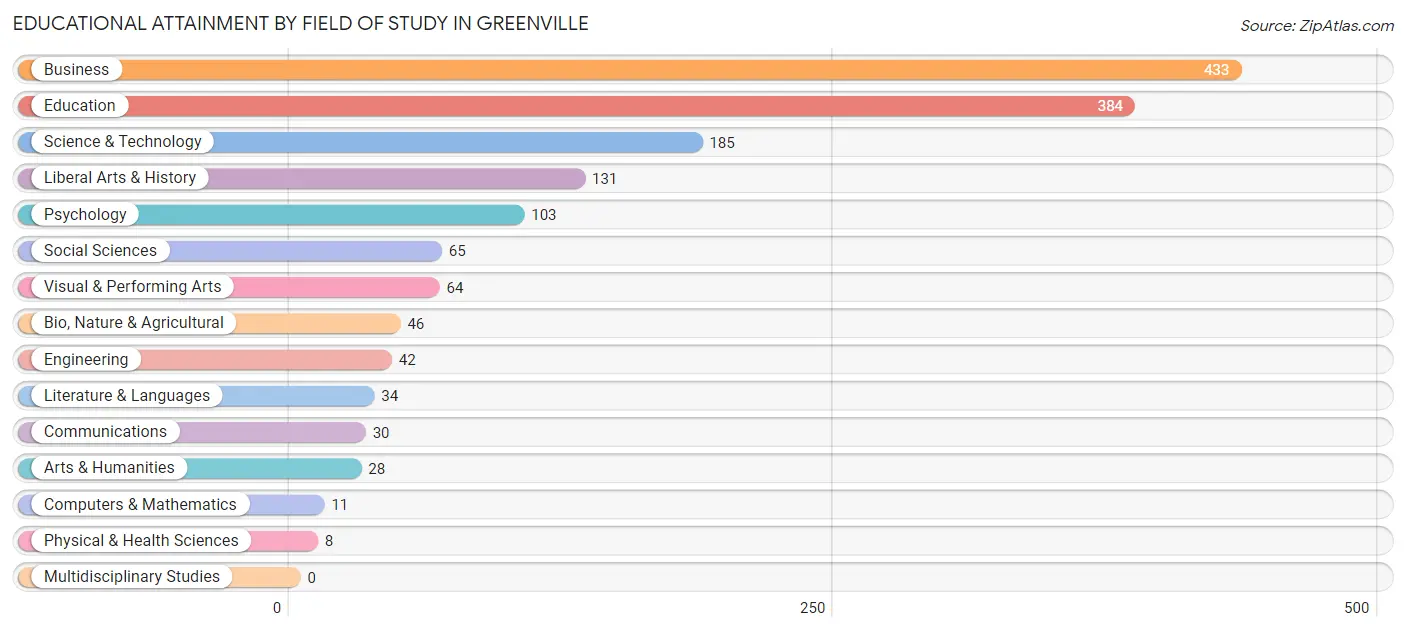
| Field of Study | # Graduates | % Graduates |
| Computers & Mathematics | 11 | 0.7% |
| Bio, Nature & Agricultural | 46 | 2.9% |
| Physical & Health Sciences | 8 | 0.5% |
| Psychology | 103 | 6.6% |
| Social Sciences | 65 | 4.2% |
| Engineering | 42 | 2.7% |
| Multidisciplinary Studies | 0 | 0.0% |
| Science & Technology | 185 | 11.8% |
| Business | 433 | 27.7% |
| Education | 384 | 24.5% |
| Literature & Languages | 34 | 2.2% |
| Liberal Arts & History | 131 | 8.4% |
| Visual & Performing Arts | 64 | 4.1% |
| Communications | 30 | 1.9% |
| Arts & Humanities | 28 | 1.8% |
| Total | 1,564 | 100.0% |
Transportation & Commute in Greenville
Vehicle Availability by Sex in Greenville
The most prevalent vehicle ownership categories in Greenville are males with 2 vehicles (1,446, accounting for 51.6%) and females with 2 vehicles (1,208, making up 55.5%).
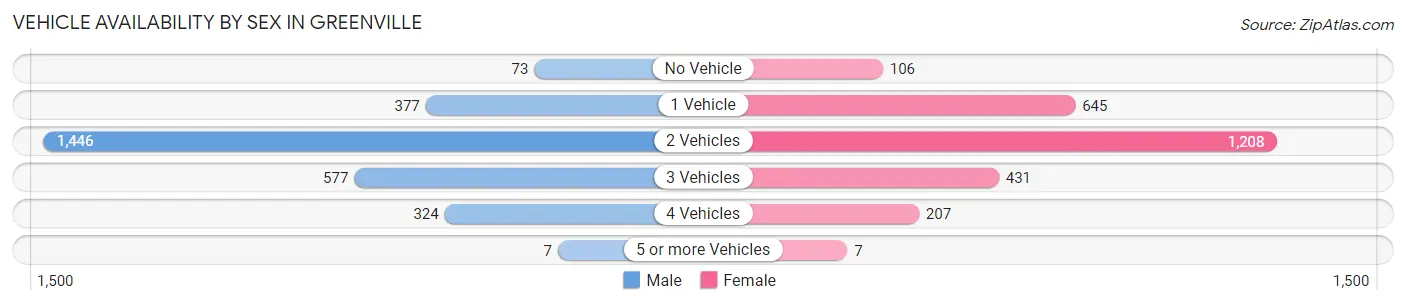
| Vehicles Available | Male | Female |
| No Vehicle | 73 (2.6%) | 106 (4.1%) |
| 1 Vehicle | 377 (13.5%) | 645 (24.8%) |
| 2 Vehicles | 1,446 (51.6%) | 1,208 (46.4%) |
| 3 Vehicles | 577 (20.6%) | 431 (16.6%) |
| 4 Vehicles | 324 (11.6%) | 207 (8.0%) |
| 5 or more Vehicles | 7 (0.3%) | 7 (0.3%) |
| Total | 2,804 (100.0%) | 2,604 (100.0%) |
Commute Time in Greenville
The most frequently occuring commute durations in Greenville are 5 to 9 minutes (1,605 commuters, 31.0%), 10 to 14 minutes (918 commuters, 17.7%), and less than 5 minutes (499 commuters, 9.6%).
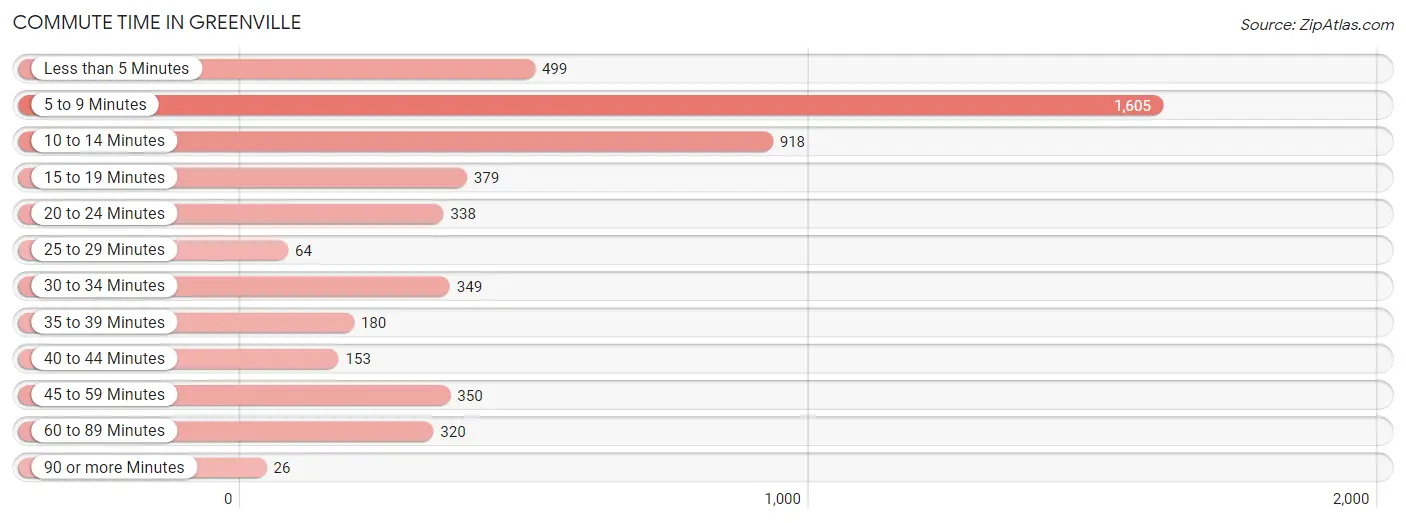
| Commute Time | # Commuters | % Commuters |
| Less than 5 Minutes | 499 | 9.6% |
| 5 to 9 Minutes | 1,605 | 31.0% |
| 10 to 14 Minutes | 918 | 17.7% |
| 15 to 19 Minutes | 379 | 7.3% |
| 20 to 24 Minutes | 338 | 6.5% |
| 25 to 29 Minutes | 64 | 1.2% |
| 30 to 34 Minutes | 349 | 6.7% |
| 35 to 39 Minutes | 180 | 3.5% |
| 40 to 44 Minutes | 153 | 2.9% |
| 45 to 59 Minutes | 350 | 6.8% |
| 60 to 89 Minutes | 320 | 6.2% |
| 90 or more Minutes | 26 | 0.5% |
Commute Time by Sex in Greenville
The most common commute times in Greenville are 5 to 9 minutes (881 commuters, 32.5%) for males and 5 to 9 minutes (724 commuters, 29.3%) for females.
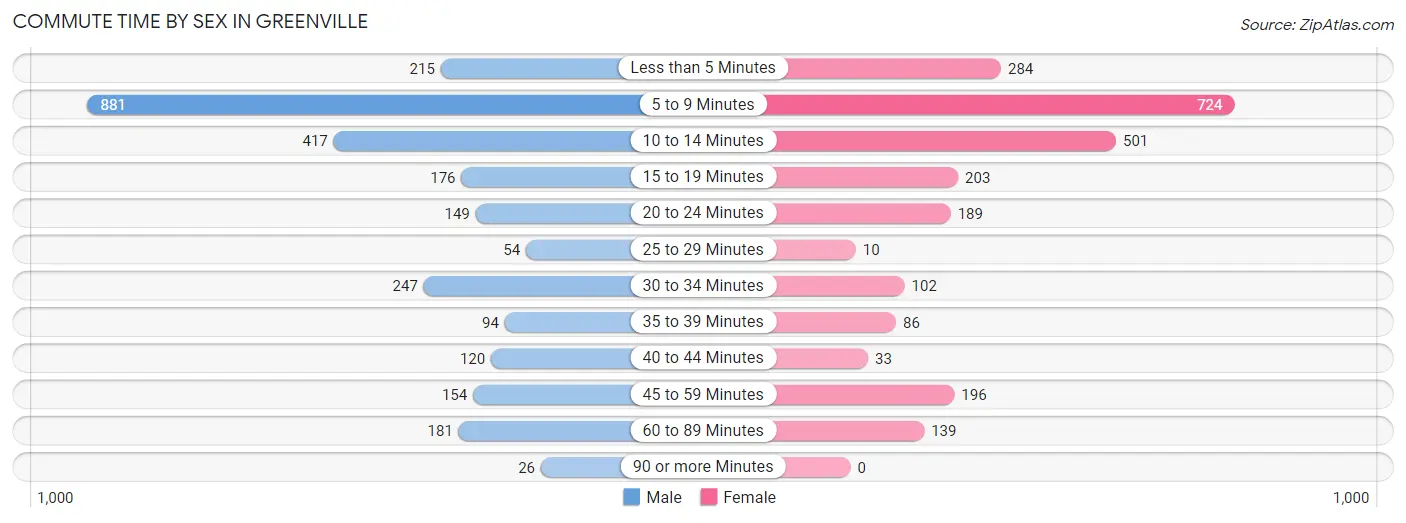
| Commute Time | Male | Female |
| Less than 5 Minutes | 215 (7.9%) | 284 (11.5%) |
| 5 to 9 Minutes | 881 (32.5%) | 724 (29.3%) |
| 10 to 14 Minutes | 417 (15.4%) | 501 (20.3%) |
| 15 to 19 Minutes | 176 (6.5%) | 203 (8.2%) |
| 20 to 24 Minutes | 149 (5.5%) | 189 (7.7%) |
| 25 to 29 Minutes | 54 (2.0%) | 10 (0.4%) |
| 30 to 34 Minutes | 247 (9.1%) | 102 (4.1%) |
| 35 to 39 Minutes | 94 (3.5%) | 86 (3.5%) |
| 40 to 44 Minutes | 120 (4.4%) | 33 (1.3%) |
| 45 to 59 Minutes | 154 (5.7%) | 196 (7.9%) |
| 60 to 89 Minutes | 181 (6.7%) | 139 (5.6%) |
| 90 or more Minutes | 26 (1.0%) | 0 (0.0%) |
Time of Departure to Work by Sex in Greenville
The most frequent times of departure to work in Greenville are 4:00 PM to 11:59 PM (401, 14.8%) for males and 7:30 AM to 7:59 AM (354, 14.3%) for females.
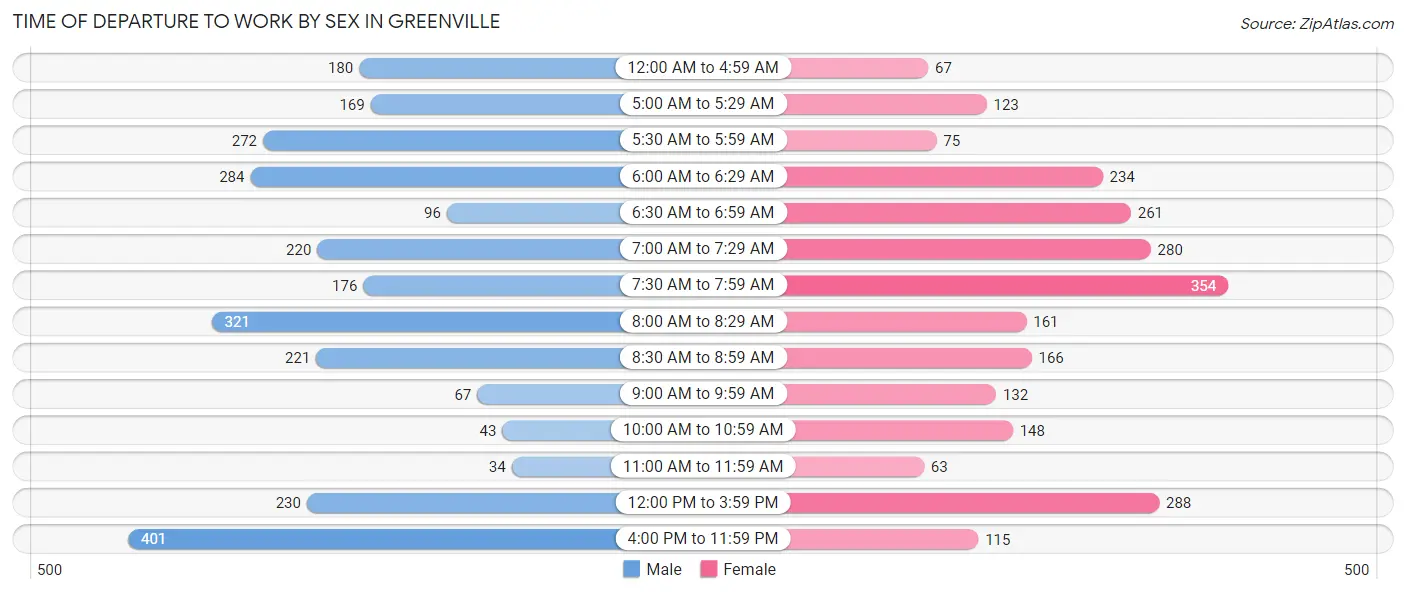
| Time of Departure | Male | Female |
| 12:00 AM to 4:59 AM | 180 (6.6%) | 67 (2.7%) |
| 5:00 AM to 5:29 AM | 169 (6.2%) | 123 (5.0%) |
| 5:30 AM to 5:59 AM | 272 (10.0%) | 75 (3.0%) |
| 6:00 AM to 6:29 AM | 284 (10.5%) | 234 (9.5%) |
| 6:30 AM to 6:59 AM | 96 (3.5%) | 261 (10.6%) |
| 7:00 AM to 7:29 AM | 220 (8.1%) | 280 (11.4%) |
| 7:30 AM to 7:59 AM | 176 (6.5%) | 354 (14.3%) |
| 8:00 AM to 8:29 AM | 321 (11.8%) | 161 (6.5%) |
| 8:30 AM to 8:59 AM | 221 (8.1%) | 166 (6.7%) |
| 9:00 AM to 9:59 AM | 67 (2.5%) | 132 (5.3%) |
| 10:00 AM to 10:59 AM | 43 (1.6%) | 148 (6.0%) |
| 11:00 AM to 11:59 AM | 34 (1.3%) | 63 (2.5%) |
| 12:00 PM to 3:59 PM | 230 (8.5%) | 288 (11.7%) |
| 4:00 PM to 11:59 PM | 401 (14.8%) | 115 (4.7%) |
| Total | 2,714 (100.0%) | 2,467 (100.0%) |
Housing Occupancy in Greenville
Occupancy by Ownership in Greenville
Of the total 5,869 dwellings in Greenville, owner-occupied units account for 3,233 (55.1%), while renter-occupied units make up 2,636 (44.9%).
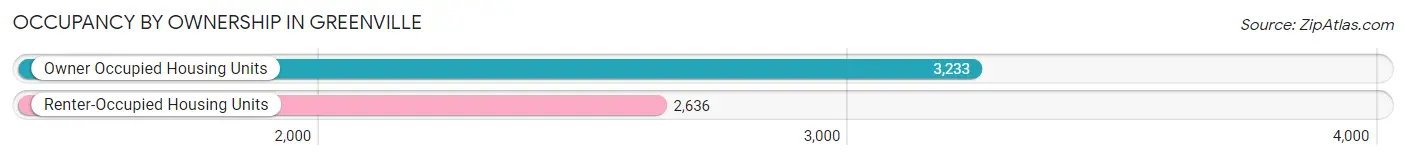
| Occupancy | # Housing Units | % Housing Units |
| Owner Occupied Housing Units | 3,233 | 55.1% |
| Renter-Occupied Housing Units | 2,636 | 44.9% |
| Total Occupied Housing Units | 5,869 | 100.0% |
Occupancy by Household Size in Greenville
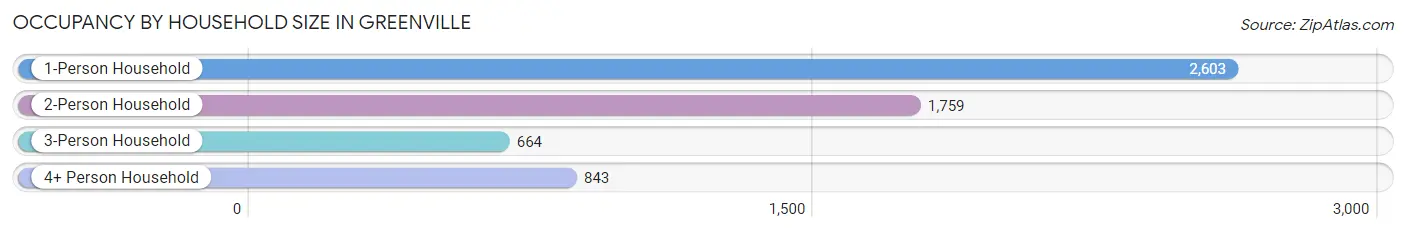
| Household Size | # Housing Units | % Housing Units |
| 1-Person Household | 2,603 | 44.4% |
| 2-Person Household | 1,759 | 30.0% |
| 3-Person Household | 664 | 11.3% |
| 4+ Person Household | 843 | 14.4% |
| Total Housing Units | 5,869 | 100.0% |
Occupancy by Ownership by Household Size in Greenville
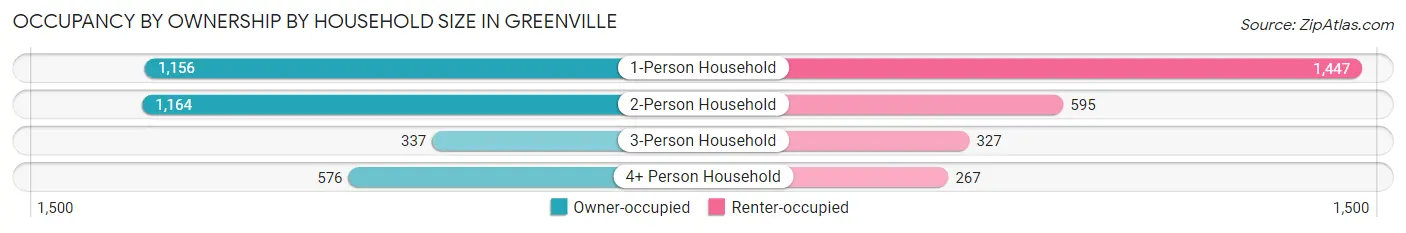
| Household Size | Owner-occupied | Renter-occupied |
| 1-Person Household | 1,156 (44.4%) | 1,447 (55.6%) |
| 2-Person Household | 1,164 (66.2%) | 595 (33.8%) |
| 3-Person Household | 337 (50.7%) | 327 (49.2%) |
| 4+ Person Household | 576 (68.3%) | 267 (31.7%) |
| Total Housing Units | 3,233 (55.1%) | 2,636 (44.9%) |
Occupancy by Educational Attainment in Greenville
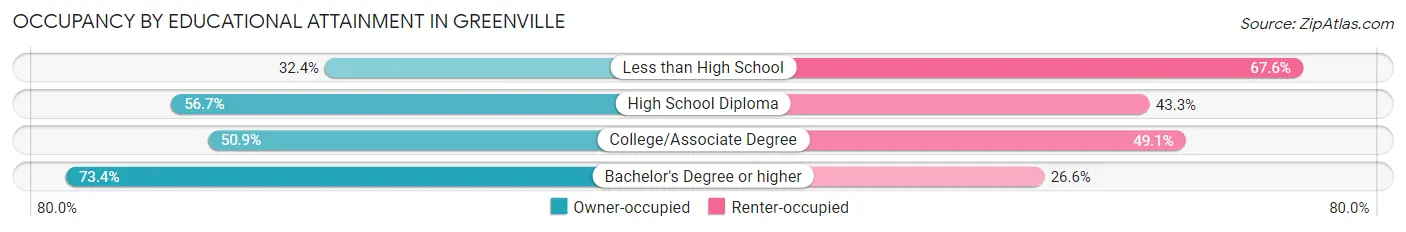
| Household Size | Owner-occupied | Renter-occupied |
| Less than High School | 188 (32.4%) | 393 (67.6%) |
| High School Diploma | 1,473 (56.7%) | 1,123 (43.3%) |
| College/Associate Degree | 917 (50.9%) | 883 (49.1%) |
| Bachelor's Degree or higher | 655 (73.4%) | 237 (26.6%) |
Occupancy by Age of Householder in Greenville
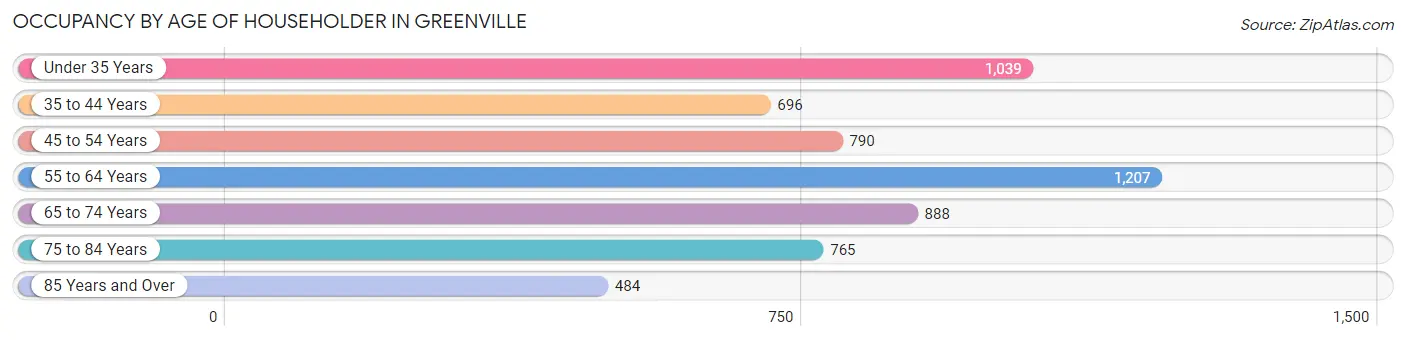
| Age Bracket | # Households | % Households |
| Under 35 Years | 1,039 | 17.7% |
| 35 to 44 Years | 696 | 11.9% |
| 45 to 54 Years | 790 | 13.5% |
| 55 to 64 Years | 1,207 | 20.6% |
| 65 to 74 Years | 888 | 15.1% |
| 75 to 84 Years | 765 | 13.0% |
| 85 Years and Over | 484 | 8.3% |
| Total | 5,869 | 100.0% |
Housing Finances in Greenville
Median Income by Occupancy in Greenville
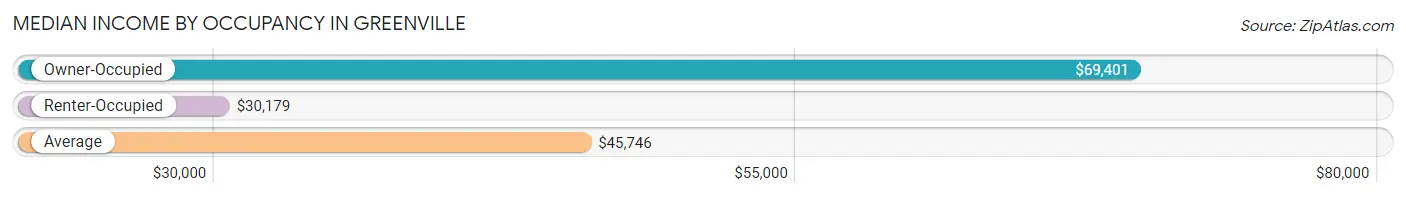
| Occupancy Type | # Households | Median Income |
| Owner-Occupied | 3,233 (55.1%) | $69,401 |
| Renter-Occupied | 2,636 (44.9%) | $30,179 |
| Average | 5,869 (100.0%) | $45,746 |
Occupancy by Householder Income Bracket in Greenville
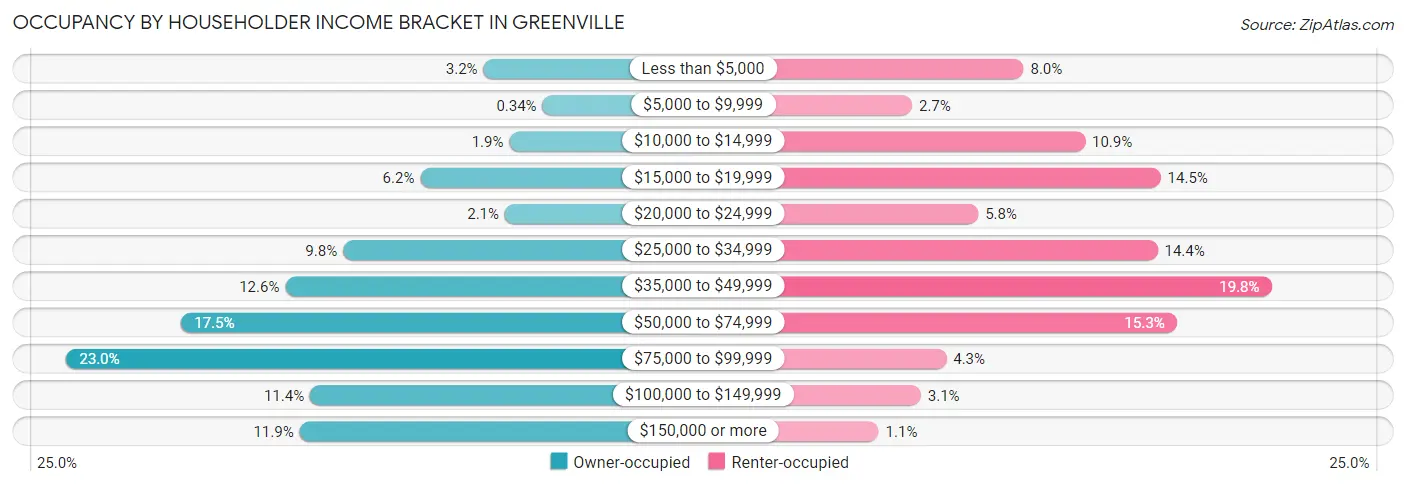
| Income Bracket | Owner-occupied | Renter-occupied |
| Less than $5,000 | 102 (3.2%) | 211 (8.0%) |
| $5,000 to $9,999 | 11 (0.3%) | 71 (2.7%) |
| $10,000 to $14,999 | 62 (1.9%) | 288 (10.9%) |
| $15,000 to $19,999 | 199 (6.2%) | 383 (14.5%) |
| $20,000 to $24,999 | 69 (2.1%) | 154 (5.8%) |
| $25,000 to $34,999 | 318 (9.8%) | 379 (14.4%) |
| $35,000 to $49,999 | 407 (12.6%) | 522 (19.8%) |
| $50,000 to $74,999 | 567 (17.5%) | 403 (15.3%) |
| $75,000 to $99,999 | 744 (23.0%) | 114 (4.3%) |
| $100,000 to $149,999 | 369 (11.4%) | 82 (3.1%) |
| $150,000 or more | 385 (11.9%) | 29 (1.1%) |
| Total | 3,233 (100.0%) | 2,636 (100.0%) |
Monthly Housing Cost Tiers in Greenville
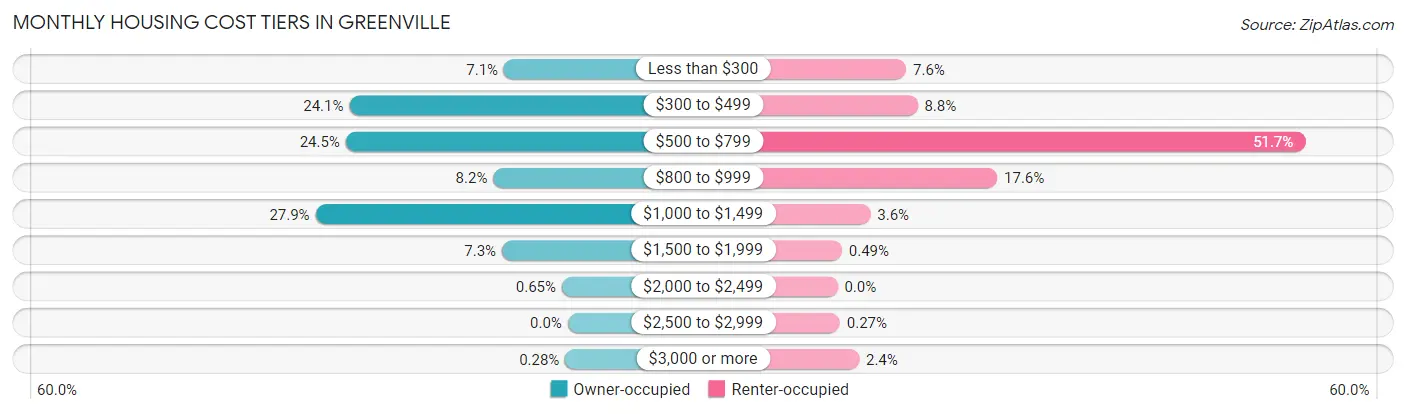
| Monthly Cost | Owner-occupied | Renter-occupied |
| Less than $300 | 228 (7.0%) | 200 (7.6%) |
| $300 to $499 | 780 (24.1%) | 233 (8.8%) |
| $500 to $799 | 793 (24.5%) | 1,362 (51.7%) |
| $800 to $999 | 266 (8.2%) | 465 (17.6%) |
| $1,000 to $1,499 | 901 (27.9%) | 96 (3.6%) |
| $1,500 to $1,999 | 235 (7.3%) | 13 (0.5%) |
| $2,000 to $2,499 | 21 (0.6%) | 0 (0.0%) |
| $2,500 to $2,999 | 0 (0.0%) | 7 (0.3%) |
| $3,000 or more | 9 (0.3%) | 63 (2.4%) |
| Total | 3,233 (100.0%) | 2,636 (100.0%) |
Physical Housing Characteristics in Greenville
Housing Structures in Greenville
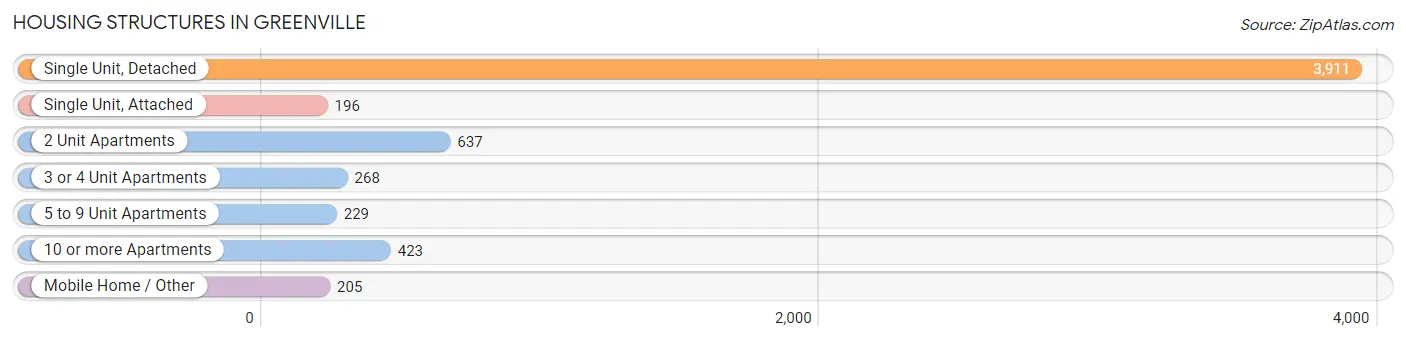
| Structure Type | # Housing Units | % Housing Units |
| Single Unit, Detached | 3,911 | 66.6% |
| Single Unit, Attached | 196 | 3.3% |
| 2 Unit Apartments | 637 | 10.8% |
| 3 or 4 Unit Apartments | 268 | 4.6% |
| 5 to 9 Unit Apartments | 229 | 3.9% |
| 10 or more Apartments | 423 | 7.2% |
| Mobile Home / Other | 205 | 3.5% |
| Total | 5,869 | 100.0% |
Housing Structures by Occupancy in Greenville
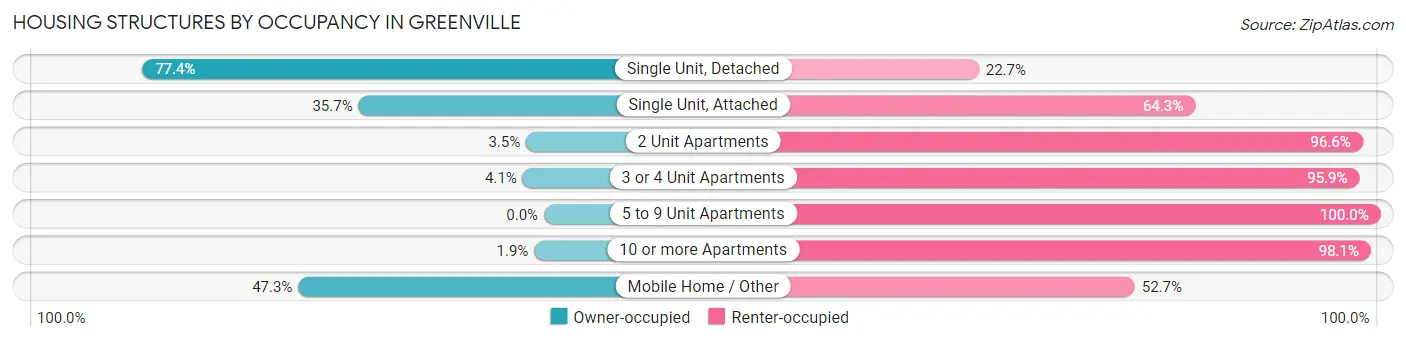
| Structure Type | Owner-occupied | Renter-occupied |
| Single Unit, Detached | 3,025 (77.3%) | 886 (22.7%) |
| Single Unit, Attached | 70 (35.7%) | 126 (64.3%) |
| 2 Unit Apartments | 22 (3.5%) | 615 (96.6%) |
| 3 or 4 Unit Apartments | 11 (4.1%) | 257 (95.9%) |
| 5 to 9 Unit Apartments | 0 (0.0%) | 229 (100.0%) |
| 10 or more Apartments | 8 (1.9%) | 415 (98.1%) |
| Mobile Home / Other | 97 (47.3%) | 108 (52.7%) |
| Total | 3,233 (55.1%) | 2,636 (44.9%) |
Housing Structures by Number of Rooms in Greenville
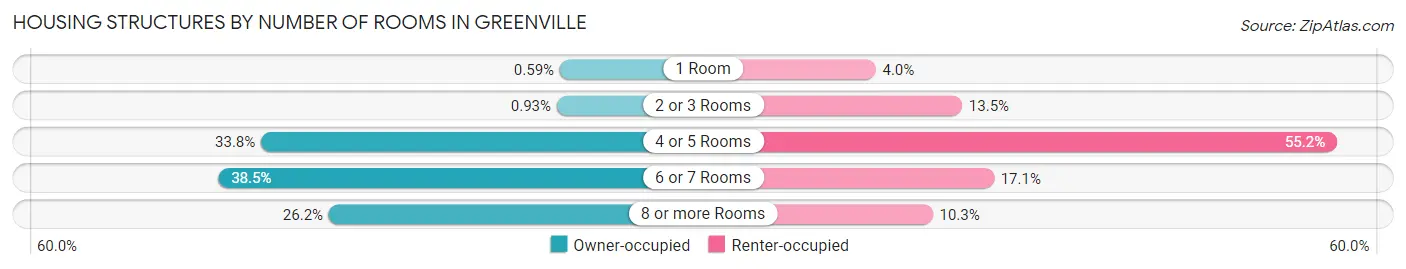
| Number of Rooms | Owner-occupied | Renter-occupied |
| 1 Room | 19 (0.6%) | 104 (4.0%) |
| 2 or 3 Rooms | 30 (0.9%) | 357 (13.5%) |
| 4 or 5 Rooms | 1,091 (33.8%) | 1,454 (55.2%) |
| 6 or 7 Rooms | 1,245 (38.5%) | 450 (17.1%) |
| 8 or more Rooms | 848 (26.2%) | 271 (10.3%) |
| Total | 3,233 (100.0%) | 2,636 (100.0%) |
Housing Structure by Heating Type in Greenville
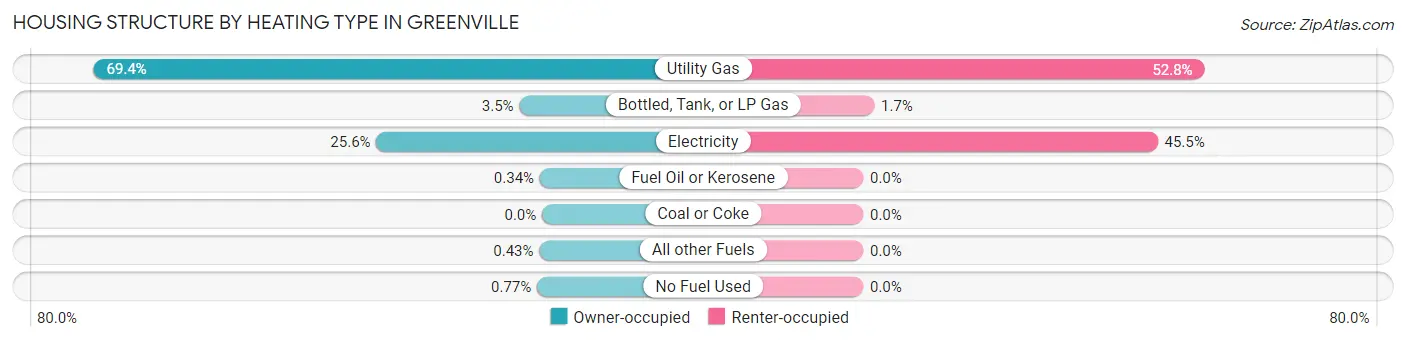
| Heating Type | Owner-occupied | Renter-occupied |
| Utility Gas | 2,242 (69.4%) | 1,391 (52.8%) |
| Bottled, Tank, or LP Gas | 113 (3.5%) | 45 (1.7%) |
| Electricity | 828 (25.6%) | 1,200 (45.5%) |
| Fuel Oil or Kerosene | 11 (0.3%) | 0 (0.0%) |
| Coal or Coke | 0 (0.0%) | 0 (0.0%) |
| All other Fuels | 14 (0.4%) | 0 (0.0%) |
| No Fuel Used | 25 (0.8%) | 0 (0.0%) |
| Total | 3,233 (100.0%) | 2,636 (100.0%) |
Household Vehicle Usage in Greenville
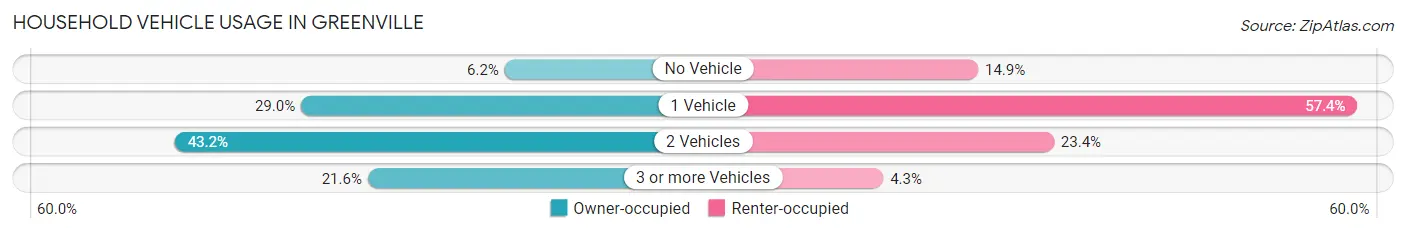
| Vehicles per Household | Owner-occupied | Renter-occupied |
| No Vehicle | 201 (6.2%) | 393 (14.9%) |
| 1 Vehicle | 939 (29.0%) | 1,513 (57.4%) |
| 2 Vehicles | 1,396 (43.2%) | 617 (23.4%) |
| 3 or more Vehicles | 697 (21.6%) | 113 (4.3%) |
| Total | 3,233 (100.0%) | 2,636 (100.0%) |
Real Estate & Mortgages in Greenville
Real Estate and Mortgage Overview in Greenville
| Characteristic | Without Mortgage | With Mortgage |
| Housing Units | 1,375 | 1,858 |
| Median Property Value | $128,000 | $145,000 |
| Median Household Income | $49,309 | $256 |
| Monthly Housing Costs | $426 | $9 |
| Real Estate Taxes | $1,311 | $34 |
Property Value by Mortgage Status in Greenville
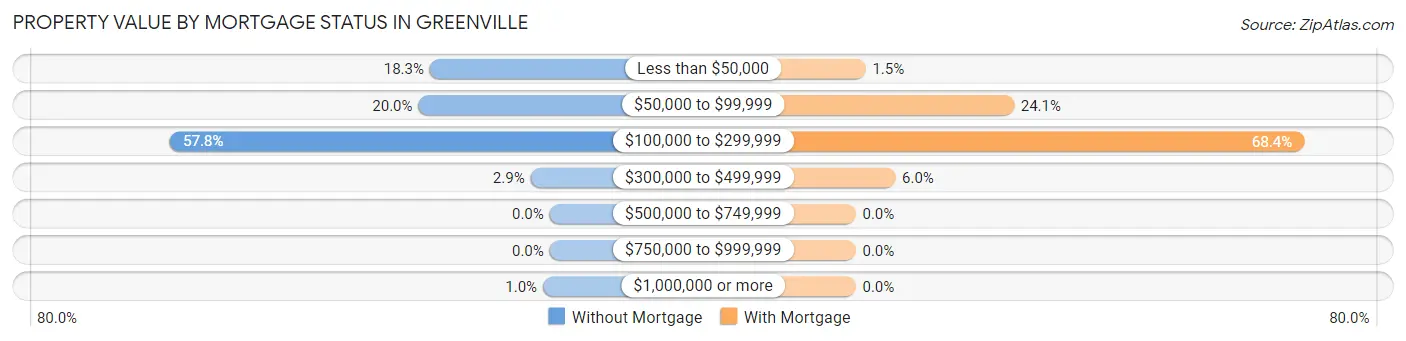
| Property Value | Without Mortgage | With Mortgage |
| Less than $50,000 | 251 (18.2%) | 28 (1.5%) |
| $50,000 to $99,999 | 275 (20.0%) | 448 (24.1%) |
| $100,000 to $299,999 | 795 (57.8%) | 1,270 (68.3%) |
| $300,000 to $499,999 | 40 (2.9%) | 112 (6.0%) |
| $500,000 to $749,999 | 0 (0.0%) | 0 (0.0%) |
| $750,000 to $999,999 | 0 (0.0%) | 0 (0.0%) |
| $1,000,000 or more | 14 (1.0%) | 0 (0.0%) |
| Total | 1,375 (100.0%) | 1,858 (100.0%) |
Household Income by Mortgage Status in Greenville
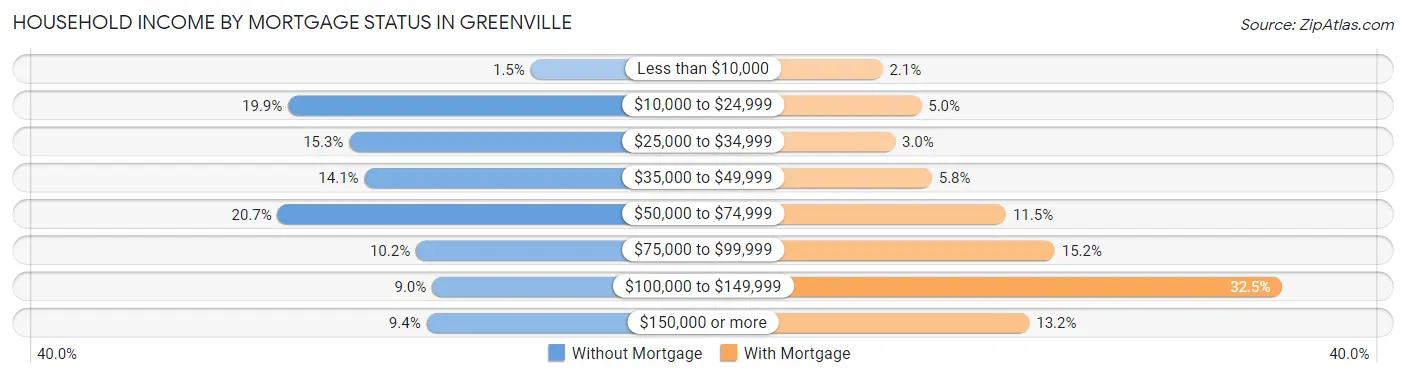
| Household Income | Without Mortgage | With Mortgage |
| Less than $10,000 | 20 (1.5%) | 38 (2.1%) |
| $10,000 to $24,999 | 274 (19.9%) | 93 (5.0%) |
| $25,000 to $34,999 | 210 (15.3%) | 56 (3.0%) |
| $35,000 to $49,999 | 194 (14.1%) | 108 (5.8%) |
| $50,000 to $74,999 | 285 (20.7%) | 213 (11.5%) |
| $75,000 to $99,999 | 140 (10.2%) | 282 (15.2%) |
| $100,000 to $149,999 | 123 (8.9%) | 604 (32.5%) |
| $150,000 or more | 129 (9.4%) | 246 (13.2%) |
| Total | 1,375 (100.0%) | 1,858 (100.0%) |
Property Value to Household Income Ratio in Greenville
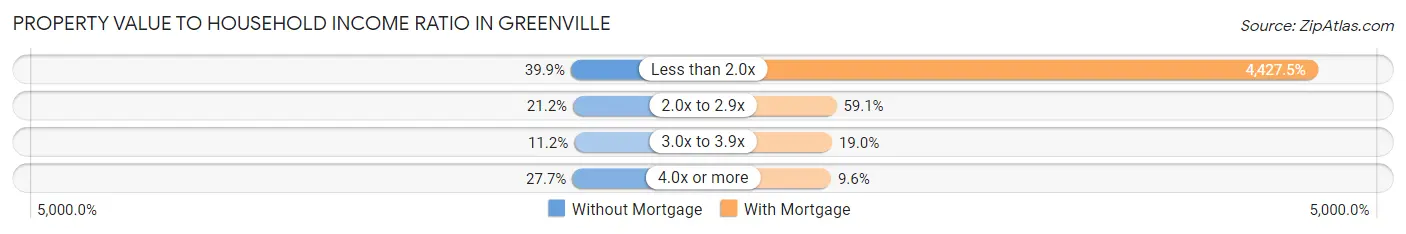
| Value-to-Income Ratio | Without Mortgage | With Mortgage |
| Less than 2.0x | 548 (39.9%) | 82,262 (4,427.5%) |
| 2.0x to 2.9x | 292 (21.2%) | 1,098 (59.1%) |
| 3.0x to 3.9x | 154 (11.2%) | 352 (19.0%) |
| 4.0x or more | 381 (27.7%) | 178 (9.6%) |
| Total | 1,375 (100.0%) | 1,858 (100.0%) |
Real Estate Taxes by Mortgage Status in Greenville
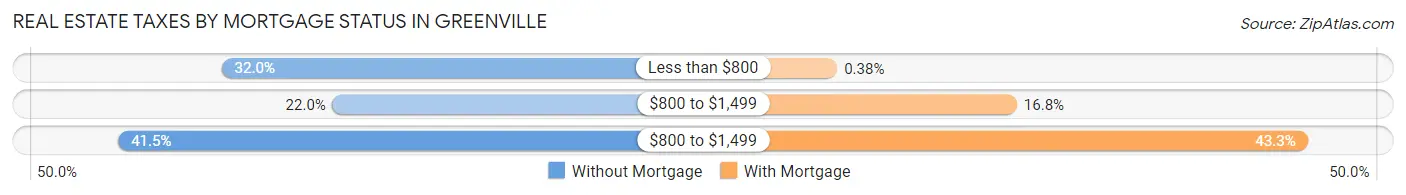
| Property Taxes | Without Mortgage | With Mortgage |
| Less than $800 | 440 (32.0%) | 7 (0.4%) |
| $800 to $1,499 | 302 (22.0%) | 312 (16.8%) |
| $800 to $1,499 | 570 (41.4%) | 805 (43.3%) |
| Total | 1,375 (100.0%) | 1,858 (100.0%) |
Health & Disability in Greenville
Health Insurance Coverage by Age in Greenville
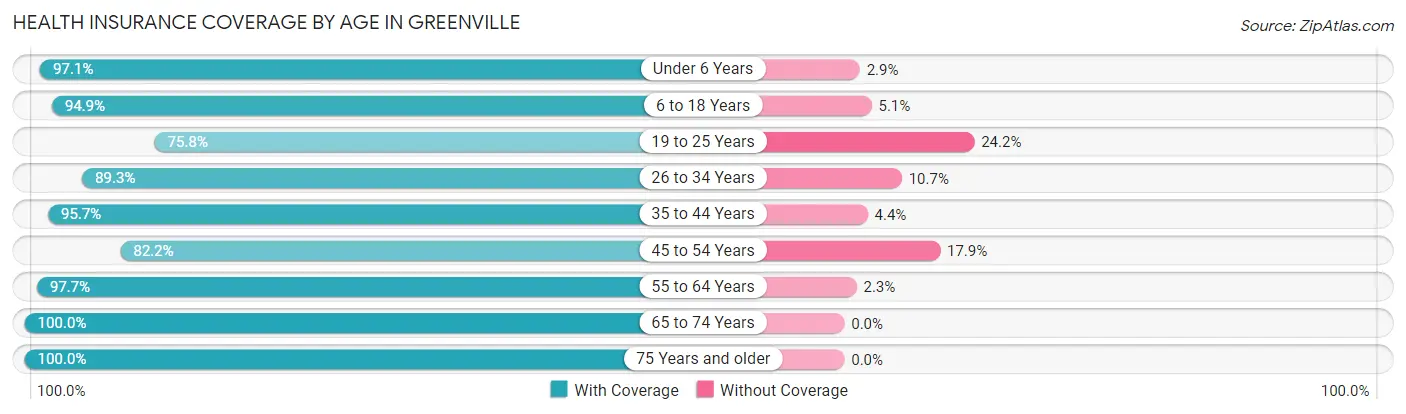
| Age Bracket | With Coverage | Without Coverage |
| Under 6 Years | 945 (97.1%) | 28 (2.9%) |
| 6 to 18 Years | 1,867 (94.9%) | 100 (5.1%) |
| 19 to 25 Years | 760 (75.8%) | 243 (24.2%) |
| 26 to 34 Years | 1,092 (89.3%) | 131 (10.7%) |
| 35 to 44 Years | 1,254 (95.7%) | 57 (4.3%) |
| 45 to 54 Years | 902 (82.2%) | 196 (17.8%) |
| 55 to 64 Years | 1,842 (97.7%) | 43 (2.3%) |
| 65 to 74 Years | 1,279 (100.0%) | 0 (0.0%) |
| 75 Years and older | 1,701 (100.0%) | 0 (0.0%) |
| Total | 11,642 (93.6%) | 798 (6.4%) |
Health Insurance Coverage by Citizenship Status in Greenville
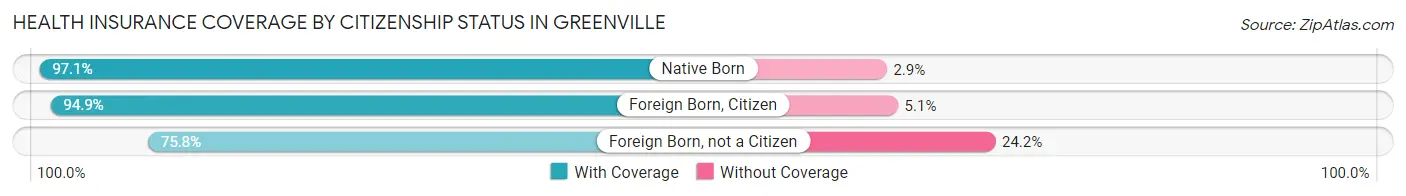
| Citizenship Status | With Coverage | Without Coverage |
| Native Born | 945 (97.1%) | 28 (2.9%) |
| Foreign Born, Citizen | 1,867 (94.9%) | 100 (5.1%) |
| Foreign Born, not a Citizen | 760 (75.8%) | 243 (24.2%) |
Health Insurance Coverage by Household Income in Greenville
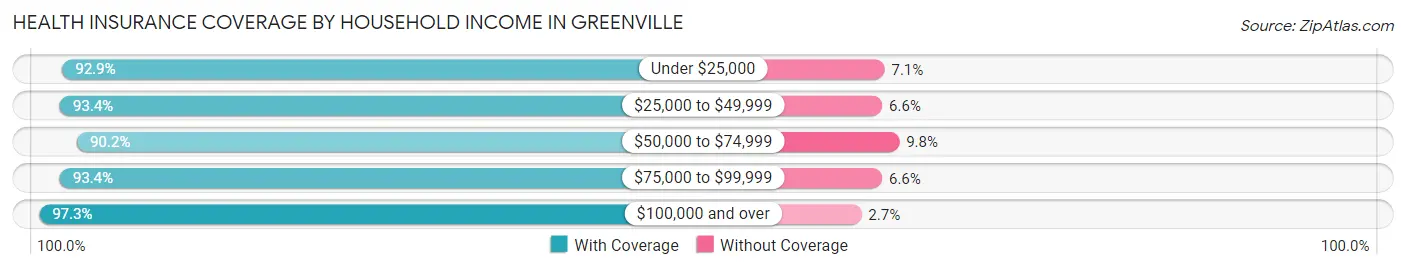
| Household Income | With Coverage | Without Coverage |
| Under $25,000 | 1,840 (92.9%) | 140 (7.1%) |
| $25,000 to $49,999 | 2,751 (93.4%) | 195 (6.6%) |
| $50,000 to $74,999 | 2,003 (90.2%) | 218 (9.8%) |
| $75,000 to $99,999 | 2,421 (93.4%) | 171 (6.6%) |
| $100,000 and over | 2,622 (97.3%) | 74 (2.7%) |
Public vs Private Health Insurance Coverage by Age in Greenville
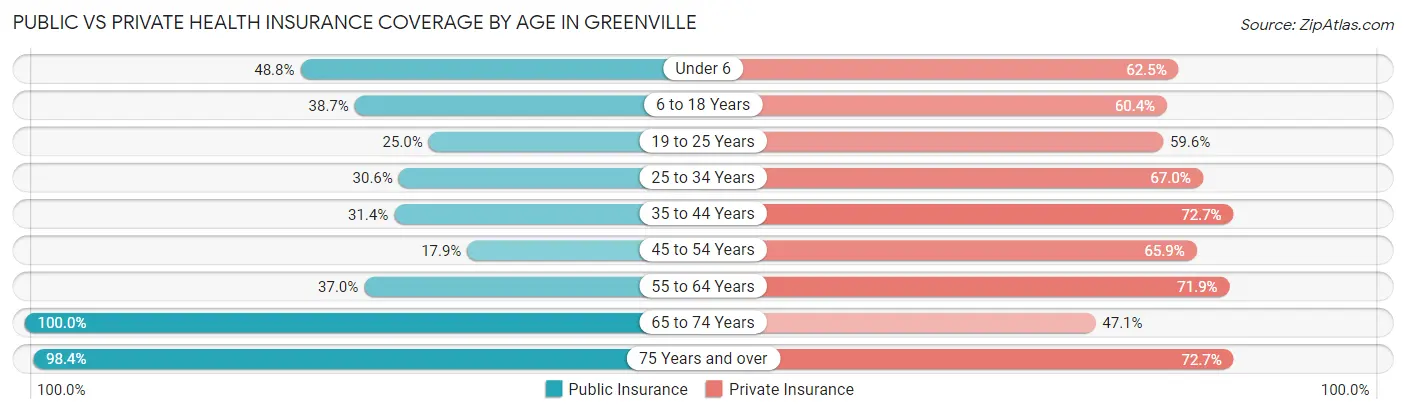
| Age Bracket | Public Insurance | Private Insurance |
| Under 6 | 475 (48.8%) | 608 (62.5%) |
| 6 to 18 Years | 762 (38.7%) | 1,187 (60.4%) |
| 19 to 25 Years | 251 (25.0%) | 598 (59.6%) |
| 25 to 34 Years | 374 (30.6%) | 819 (67.0%) |
| 35 to 44 Years | 412 (31.4%) | 953 (72.7%) |
| 45 to 54 Years | 196 (17.8%) | 723 (65.8%) |
| 55 to 64 Years | 697 (37.0%) | 1,356 (71.9%) |
| 65 to 74 Years | 1,279 (100.0%) | 602 (47.1%) |
| 75 Years and over | 1,674 (98.4%) | 1,237 (72.7%) |
| Total | 6,120 (49.2%) | 8,083 (65.0%) |
Disability Status by Sex by Age in Greenville
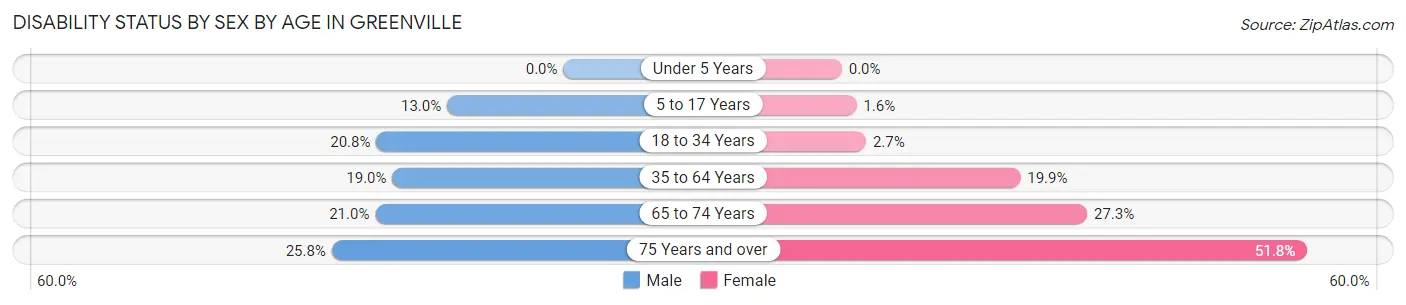
| Age Bracket | Male | Female |
| Under 5 Years | 0 (0.0%) | 0 (0.0%) |
| 5 to 17 Years | 129 (13.0%) | 18 (1.6%) |
| 18 to 34 Years | 260 (20.8%) | 32 (2.7%) |
| 35 to 64 Years | 399 (19.0%) | 437 (19.9%) |
| 65 to 74 Years | 123 (20.9%) | 189 (27.3%) |
| 75 Years and over | 162 (25.8%) | 556 (51.8%) |
Disability Class by Sex by Age in Greenville
Disability Class: Hearing Difficulty
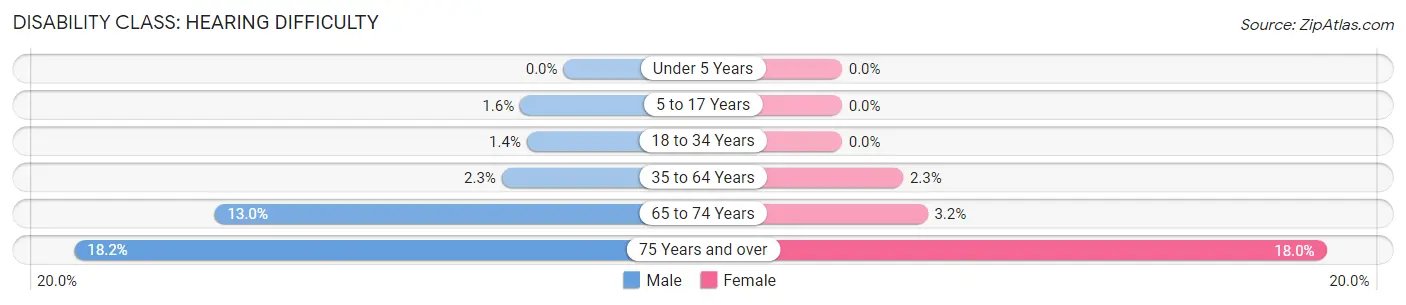
| Age Bracket | Male | Female |
| Under 5 Years | 0 (0.0%) | 0 (0.0%) |
| 5 to 17 Years | 16 (1.6%) | 0 (0.0%) |
| 18 to 34 Years | 17 (1.4%) | 0 (0.0%) |
| 35 to 64 Years | 48 (2.3%) | 50 (2.3%) |
| 65 to 74 Years | 76 (13.0%) | 22 (3.2%) |
| 75 Years and over | 114 (18.1%) | 193 (18.0%) |
Disability Class: Vision Difficulty
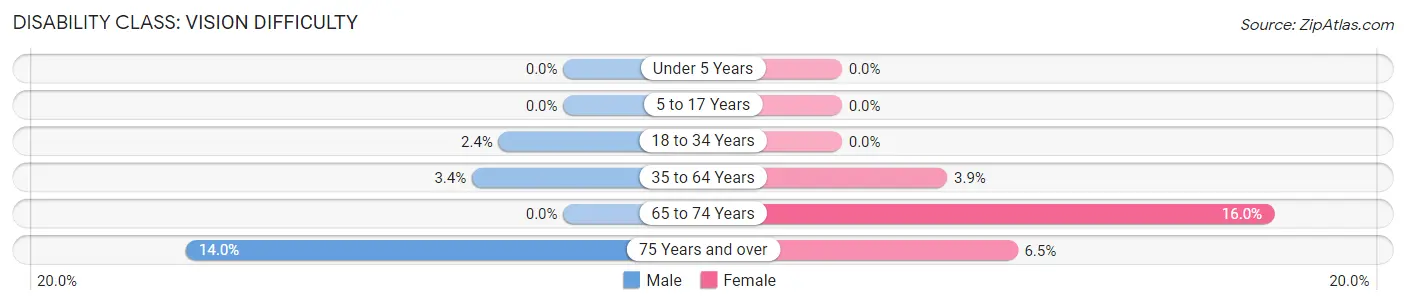
| Age Bracket | Male | Female |
| Under 5 Years | 0 (0.0%) | 0 (0.0%) |
| 5 to 17 Years | 0 (0.0%) | 0 (0.0%) |
| 18 to 34 Years | 30 (2.4%) | 0 (0.0%) |
| 35 to 64 Years | 71 (3.4%) | 86 (3.9%) |
| 65 to 74 Years | 0 (0.0%) | 111 (16.0%) |
| 75 Years and over | 88 (14.0%) | 70 (6.5%) |
Disability Class: Cognitive Difficulty
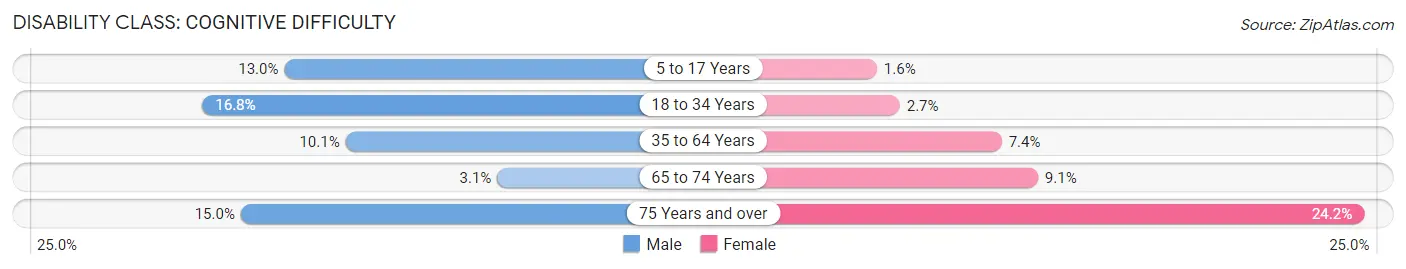
| Age Bracket | Male | Female |
| 5 to 17 Years | 129 (13.0%) | 18 (1.6%) |
| 18 to 34 Years | 209 (16.8%) | 32 (2.7%) |
| 35 to 64 Years | 212 (10.1%) | 163 (7.4%) |
| 65 to 74 Years | 18 (3.1%) | 63 (9.1%) |
| 75 Years and over | 94 (15.0%) | 260 (24.2%) |
Disability Class: Ambulatory Difficulty
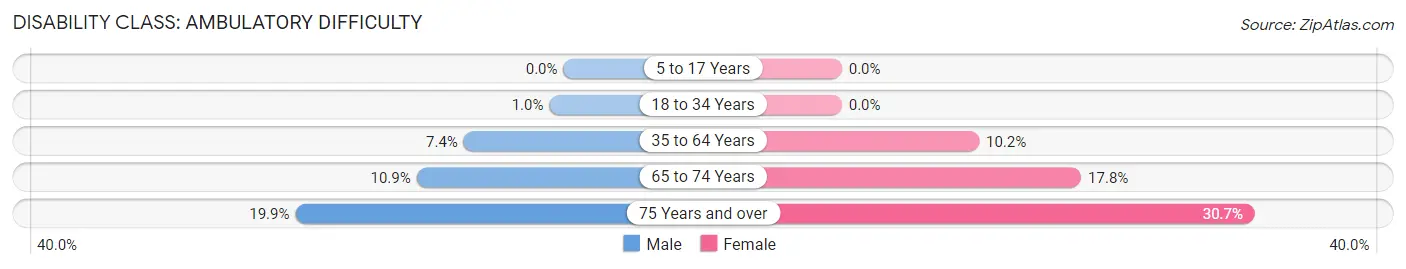
| Age Bracket | Male | Female |
| 5 to 17 Years | 0 (0.0%) | 0 (0.0%) |
| 18 to 34 Years | 13 (1.0%) | 0 (0.0%) |
| 35 to 64 Years | 155 (7.4%) | 224 (10.2%) |
| 65 to 74 Years | 64 (10.9%) | 123 (17.8%) |
| 75 Years and over | 125 (19.9%) | 329 (30.7%) |
Disability Class: Self-Care Difficulty
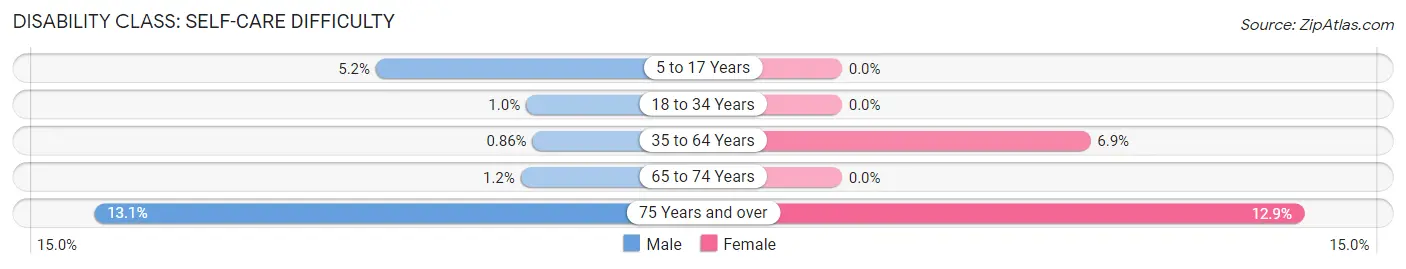
| Age Bracket | Male | Female |
| 5 to 17 Years | 52 (5.2%) | 0 (0.0%) |
| 18 to 34 Years | 13 (1.0%) | 0 (0.0%) |
| 35 to 64 Years | 18 (0.9%) | 152 (6.9%) |
| 65 to 74 Years | 7 (1.2%) | 0 (0.0%) |
| 75 Years and over | 82 (13.1%) | 138 (12.9%) |
Technology Access in Greenville
Computing Device Access in Greenville
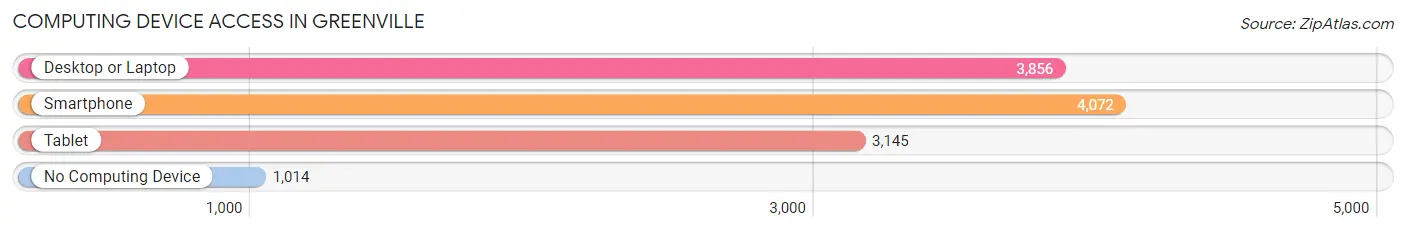
| Device Type | # Households | % Households |
| Desktop or Laptop | 3,856 | 65.7% |
| Smartphone | 4,072 | 69.4% |
| Tablet | 3,145 | 53.6% |
| No Computing Device | 1,014 | 17.3% |
| Total | 5,869 | 100.0% |
Internet Access in Greenville
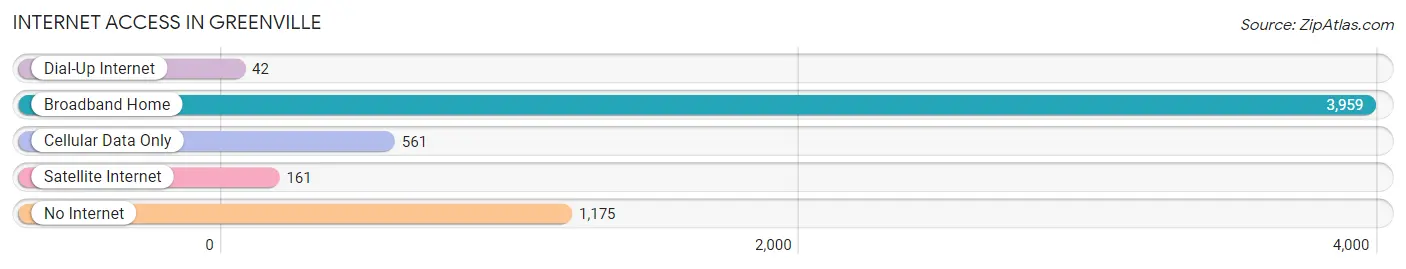
| Internet Type | # Households | % Households |
| Dial-Up Internet | 42 | 0.7% |
| Broadband Home | 3,959 | 67.5% |
| Cellular Data Only | 561 | 9.6% |
| Satellite Internet | 161 | 2.7% |
| No Internet | 1,175 | 20.0% |
| Total | 5,869 | 100.0% |
Greenville Summary
Introduction
Greenville is a city located in Darke County, Ohio, United States. It is the county seat of Darke County and is located in the western part of the state. The city is situated along the Greenville Creek, a tributary of the Great Miami River. The population of Greenville was 13,227 at the 2010 census.
History
Greenville was founded in 1808 by a group of settlers from North Carolina. The town was named after Revolutionary War hero Nathanael Greene. The first post office in Greenville was established in 1809. The town was incorporated in 1817 and became the county seat of Darke County in 1820.
Greenville was a major stop on the Underground Railroad, with many of the town's residents helping to hide and transport escaped slaves. The town was also a major center of the abolitionist movement in the mid-1800s.
In the late 1800s, Greenville became a major industrial center, with several factories and mills being built in the area. The town was also home to several railroads, which helped to transport goods and people to and from the city.
Geography
Greenville is located at 40°6'25" North, 84°37'25" West (40.106944, -84.623889). The city is situated along the Greenville Creek, a tributary of the Great Miami River. The city has a total area of 5.3 square miles, all of which is land.
The city is located in the western part of Ohio, about 50 miles west of Dayton and about 70 miles east of Indianapolis, Indiana. The city is located in the Miami Valley region of Ohio, which is known for its rolling hills and lush farmland.
Economy
Greenville's economy is largely based on manufacturing and agriculture. The city is home to several factories and mills, including a paper mill, a steel mill, and a plastics plant. The city is also home to several agricultural businesses, including a dairy farm, a hog farm, and a poultry farm.
The city is also home to several retail businesses, including several restaurants, a grocery store, and several clothing stores. The city is also home to several banks and financial institutions.
Demographics
As of the 2010 census, the population of Greenville was 13,227. The racial makeup of the city was 95.3% White, 1.2% African American, 0.3% Native American, 0.7% Asian, 0.1% Pacific Islander, 0.7% from other races, and 1.7% from two or more races. Hispanic or Latino of any race were 2.2% of the population.
The median income for a household in Greenville was $41,945, and the median income for a family was $50,945. The per capita income for the city was $20,845. About 11.2% of families and 14.2% of the population were below the poverty line, including 19.2% of those under age 18 and 8.2% of those age 65 or over.
Conclusion
Greenville is a city located in Darke County, Ohio, United States. It is the county seat of Darke County and is located in the western part of the state. The city is situated along the Greenville Creek, a tributary of the Great Miami River. The population of Greenville was 13,227 at the 2010 census. The city's economy is largely based on manufacturing and agriculture, and the city is home to several factories and mills, as well as several agricultural businesses. The racial makeup of the city is predominantly White, with African Americans, Native Americans, Asians, and Pacific Islanders making up the remainder of the population. The median income for a household in Greenville was $41,945, and the median income for a family was $50,945. The city is also home to several retail businesses, including several restaurants, a grocery store, and several clothing stores.
Common Questions
What is Per Capita Income in Greenville?
Per Capita income in Greenville is $28,285.
What is the Median Family Income in Greenville?
Median Family Income in Greenville is $70,481.
What is the Median Household income in Greenville?
Median Household Income in Greenville is $45,746.
What is Income or Wage Gap in Greenville?
Income or Wage Gap in Greenville is 23.9%.
Women in Greenville earn 76.1 cents for every dollar earned by a man.
What is Inequality or Gini Index in Greenville?
Inequality or Gini Index in Greenville is 0.45.
What is the Total Population of Greenville?
Total Population of Greenville is 12,768.
What is the Total Male Population of Greenville?
Total Male Population of Greenville is 5,931.
What is the Total Female Population of Greenville?
Total Female Population of Greenville is 6,837.
What is the Ratio of Males per 100 Females in Greenville?
There are 86.75 Males per 100 Females in Greenville.
What is the Ratio of Females per 100 Males in Greenville?
There are 115.28 Females per 100 Males in Greenville.
What is the Median Population Age in Greenville?
Median Population Age in Greenville is 44.2 Years.
What is the Average Family Size in Greenville
Average Family Size in Greenville is 3.0 People.
What is the Average Household Size in Greenville
Average Household Size in Greenville is 2.1 People.
How Large is the Labor Force in Greenville?
There are 5,705 People in the Labor Forcein in Greenville.
What is the Percentage of People in the Labor Force in Greenville?
55.2% of People are in the Labor Force in Greenville.
What is the Unemployment Rate in Greenville?
Unemployment Rate in Greenville is 4.0%.