Greenfield, OH Map & Demographics
Greenfield Map
Greenfield Overview
$22,162
PER CAPITA INCOME
$53,201
AVG FAMILY INCOME
$42,253
AVG HOUSEHOLD INCOME
24.7%
WAGE / INCOME GAP [ % ]
75.3¢/ $1
WAGE / INCOME GAP [ $ ]
0.44
INEQUALITY / GINI INDEX
4,237
TOTAL POPULATION
2,020
MALE POPULATION
2,217
FEMALE POPULATION
91.11
MALES / 100 FEMALES
109.75
FEMALES / 100 MALES
37.9
MEDIAN AGE
2.9
AVG FAMILY SIZE
2.4
AVG HOUSEHOLD SIZE
1,765
LABOR FORCE [ PEOPLE ]
53.0%
PERCENT IN LABOR FORCE
6.6%
UNEMPLOYMENT RATE
Greenfield Zip Codes
Greenfield Area Codes
Income in Greenfield
Income Overview in Greenfield
Per Capita Income in Greenfield is $22,162, while median incomes of families and households are $53,201 and $42,253 respectively.
| Characteristic | Number | Measure |
| Per Capita Income | 4,237 | $22,162 |
| Median Family Income | 1,075 | $53,201 |
| Mean Family Income | 1,075 | $63,580 |
| Median Household Income | 1,705 | $42,253 |
| Mean Household Income | 1,705 | $54,883 |
| Income Deficit | 1,075 | $0 |
| Wage / Income Gap (%) | 4,237 | 24.73% |
| Wage / Income Gap ($) | 4,237 | 75.27¢ per $1 |
| Gini / Inequality Index | 4,237 | 0.44 |
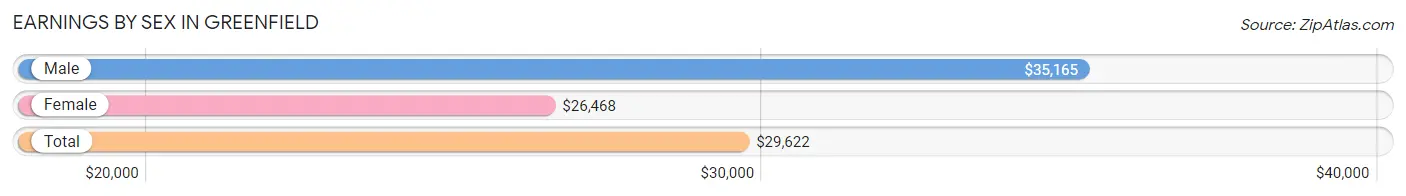
Earnings by Sex in Greenfield
Average Earnings in Greenfield are $29,622, $35,165 for men and $26,468 for women, a difference of 24.7%.
| Sex | Number | Average Earnings |
| Male | 1,003 (53.1%) | $35,165 |
| Female | 886 (46.9%) | $26,468 |
| Total | 1,889 (100.0%) | $29,622 |
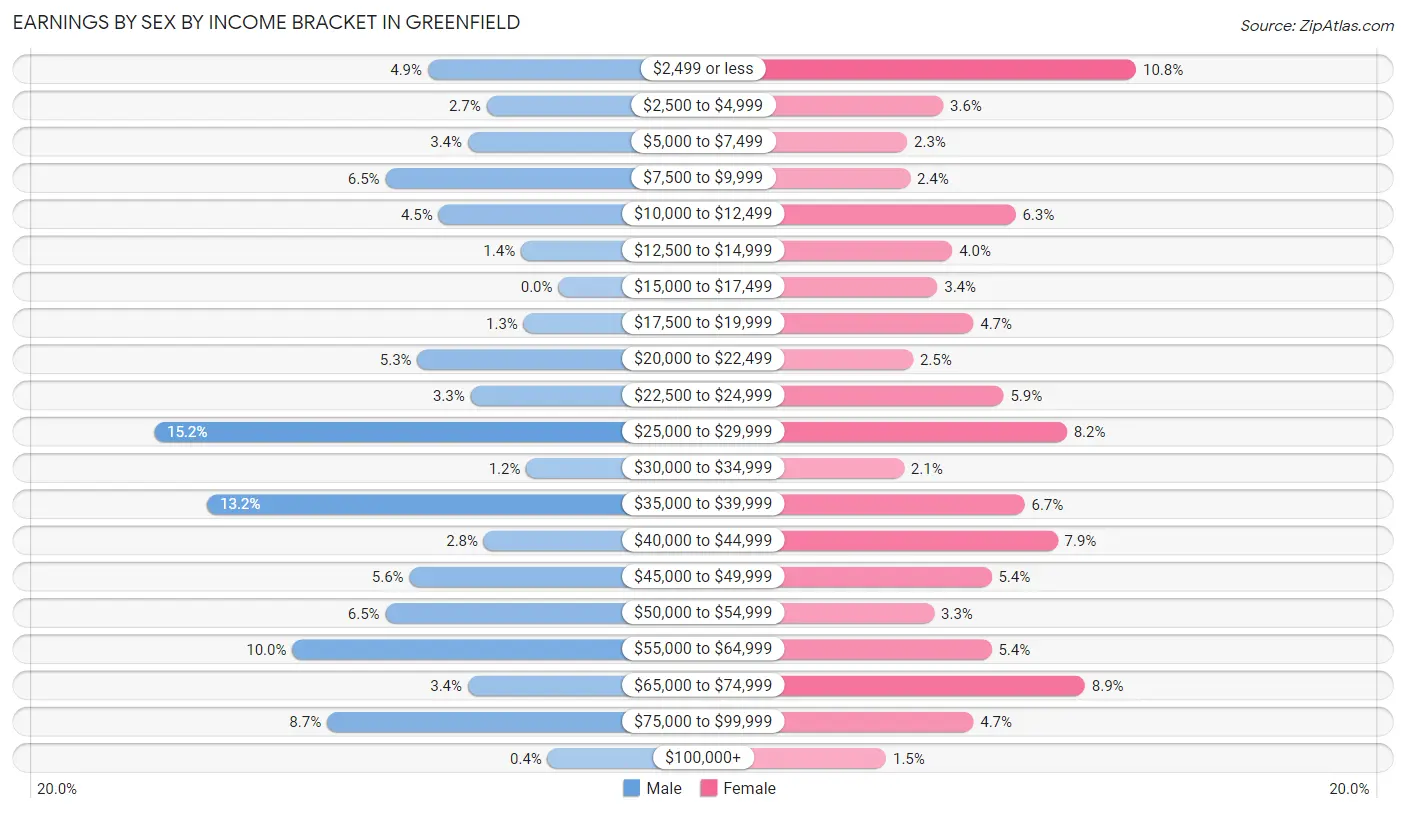
Earnings by Sex by Income Bracket in Greenfield
The most common earnings brackets in Greenfield are $25,000 to $29,999 for men (152 | 15.1%) and $2,499 or less for women (96 | 10.8%).
| Income | Male | Female |
| $2,499 or less | 49 (4.9%) | 96 (10.8%) |
| $2,500 to $4,999 | 27 (2.7%) | 32 (3.6%) |
| $5,000 to $7,499 | 34 (3.4%) | 20 (2.3%) |
| $7,500 to $9,999 | 65 (6.5%) | 21 (2.4%) |
| $10,000 to $12,499 | 45 (4.5%) | 56 (6.3%) |
| $12,500 to $14,999 | 14 (1.4%) | 35 (4.0%) |
| $15,000 to $17,499 | 0 (0.0%) | 30 (3.4%) |
| $17,500 to $19,999 | 13 (1.3%) | 42 (4.7%) |
| $20,000 to $22,499 | 53 (5.3%) | 22 (2.5%) |
| $22,500 to $24,999 | 33 (3.3%) | 52 (5.9%) |
| $25,000 to $29,999 | 152 (15.1%) | 73 (8.2%) |
| $30,000 to $34,999 | 12 (1.2%) | 19 (2.1%) |
| $35,000 to $39,999 | 132 (13.2%) | 59 (6.7%) |
| $40,000 to $44,999 | 28 (2.8%) | 70 (7.9%) |
| $45,000 to $49,999 | 56 (5.6%) | 48 (5.4%) |
| $50,000 to $54,999 | 65 (6.5%) | 29 (3.3%) |
| $55,000 to $64,999 | 100 (10.0%) | 48 (5.4%) |
| $65,000 to $74,999 | 34 (3.4%) | 79 (8.9%) |
| $75,000 to $99,999 | 87 (8.7%) | 42 (4.7%) |
| $100,000+ | 4 (0.4%) | 13 (1.5%) |
| Total | 1,003 (100.0%) | 886 (100.0%) |
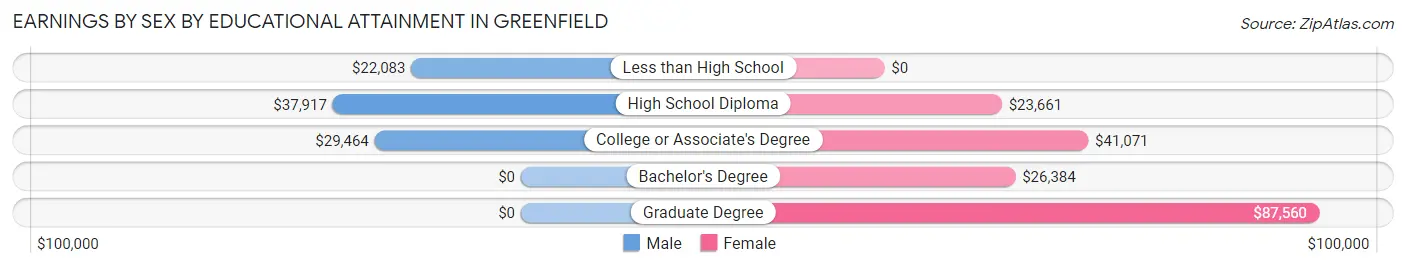
Earnings by Sex by Educational Attainment in Greenfield
Average earnings in Greenfield are $38,487 for men and $27,361 for women, a difference of 28.9%. Men with an educational attainment of high school diploma enjoy the highest average annual earnings of $37,917, while those with less than high school education earn the least with $22,083. Women with an educational attainment of graduate degree earn the most with the average annual earnings of $87,560, while those with high school diploma education have the smallest earnings of $23,661.
| Educational Attainment | Male Income | Female Income |
| Less than High School | $22,083 | $0 |
| High School Diploma | $37,917 | $23,661 |
| College or Associate's Degree | $29,464 | $41,071 |
| Bachelor's Degree | - | - |
| Graduate Degree | - | - |
| Total | $38,487 | $27,361 |
Family Income in Greenfield
Family Income Brackets in Greenfield
According to the Greenfield family income data, there are 218 families falling into the $35,000 to $49,999 income range, which is the most common income bracket and makes up 20.3% of all families. Conversely, the $200,000+ income bracket is the least frequent group with only 11 families (1.0%) belonging to this category.
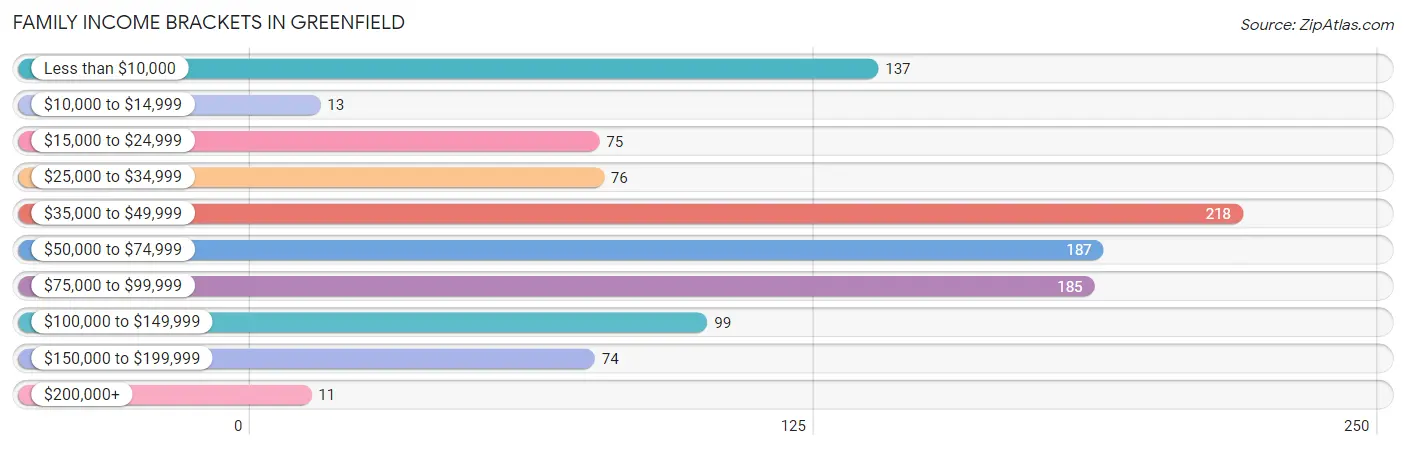
| Income Bracket | # Families | % Families |
| Less than $10,000 | 137 | 12.7% |
| $10,000 to $14,999 | 13 | 1.2% |
| $15,000 to $24,999 | 75 | 7.0% |
| $25,000 to $34,999 | 76 | 7.1% |
| $35,000 to $49,999 | 218 | 20.3% |
| $50,000 to $74,999 | 187 | 17.4% |
| $75,000 to $99,999 | 185 | 17.2% |
| $100,000 to $149,999 | 99 | 9.2% |
| $150,000 to $199,999 | 74 | 6.9% |
| $200,000+ | 11 | 1.0% |
Family Income by Famaliy Size in Greenfield
2-person families (595 | 55.3%) account for the highest median family income in Greenfield with $58,315 per family, while 2-person families (595 | 55.3%) have the highest median income of $29,158 per family member.
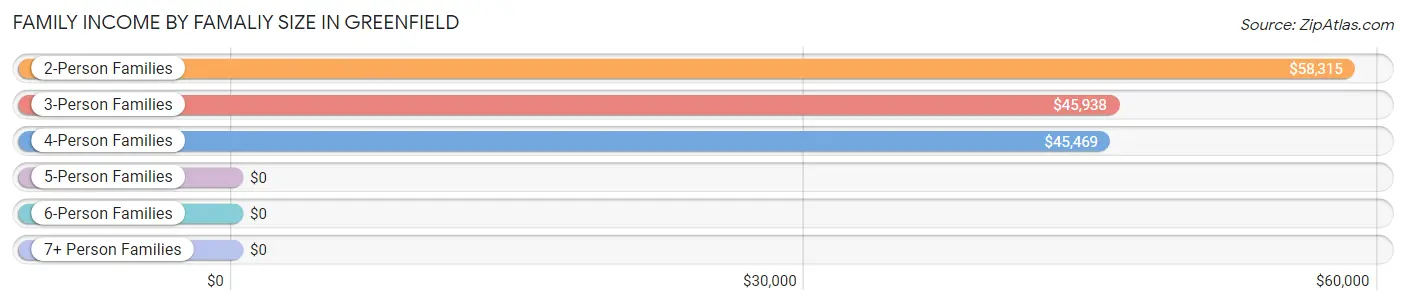
| Income Bracket | # Families | Median Income |
| 2-Person Families | 595 (55.3%) | $58,315 |
| 3-Person Families | 177 (16.5%) | $45,938 |
| 4-Person Families | 151 (14.1%) | $45,469 |
| 5-Person Families | 123 (11.4%) | $0 |
| 6-Person Families | 29 (2.7%) | $0 |
| 7+ Person Families | 0 (0.0%) | $0 |
| Total | 1,075 (100.0%) | $53,201 |
Family Income by Number of Earners in Greenfield
The median family income in Greenfield is $53,201, with families comprising 3+ earners (66) having the highest median family income of $103,333, while families with no earners (247) have the lowest median family income of $33,750, accounting for 6.1% and 23.0% of families, respectively.
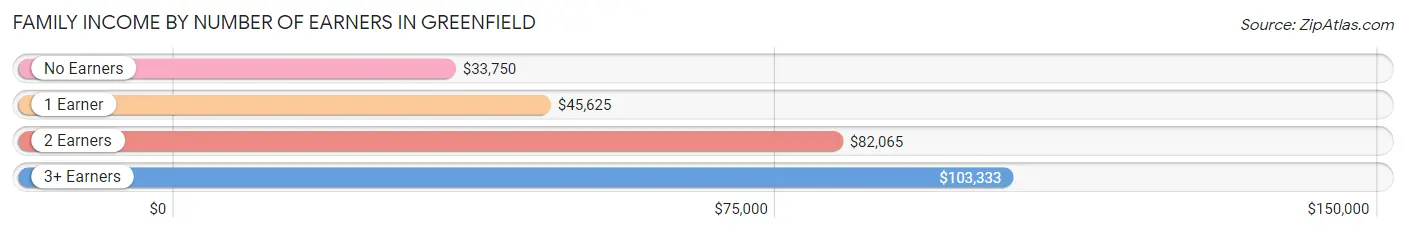
| Number of Earners | # Families | Median Income |
| No Earners | 247 (23.0%) | $33,750 |
| 1 Earner | 378 (35.2%) | $45,625 |
| 2 Earners | 384 (35.7%) | $82,065 |
| 3+ Earners | 66 (6.1%) | $103,333 |
| Total | 1,075 (100.0%) | $53,201 |
Household Income in Greenfield
Household Income Brackets in Greenfield
With 317 households falling in the category, the $35,000 to $49,999 income range is the most frequent in Greenfield, accounting for 18.6% of all households. In contrast, only 10 households (0.6%) fall into the $200,000+ income bracket, making it the least populous group.
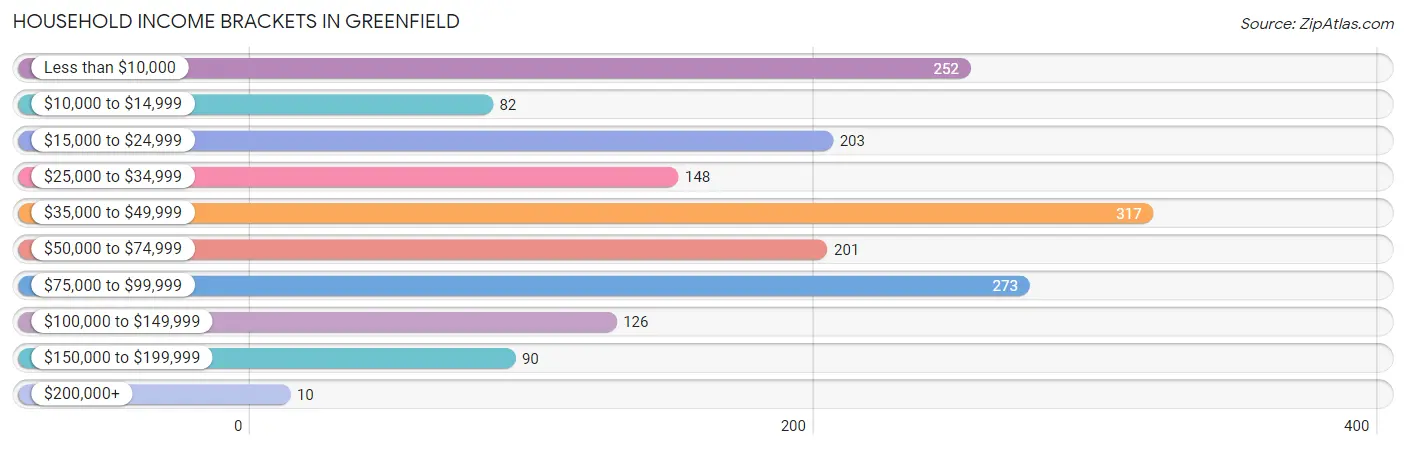
| Income Bracket | # Households | % Households |
| Less than $10,000 | 252 | 14.8% |
| $10,000 to $14,999 | 82 | 4.8% |
| $15,000 to $24,999 | 203 | 11.9% |
| $25,000 to $34,999 | 148 | 8.7% |
| $35,000 to $49,999 | 317 | 18.6% |
| $50,000 to $74,999 | 201 | 11.8% |
| $75,000 to $99,999 | 273 | 16.0% |
| $100,000 to $149,999 | 126 | 7.4% |
| $150,000 to $199,999 | 90 | 5.3% |
| $200,000+ | 10 | 0.6% |
Household Income by Householder Age in Greenfield
The median household income in Greenfield is $42,253, with the highest median household income of $60,761 found in the 45 to 64 years age bracket for the primary householder. A total of 476 households (27.9%) fall into this category. Meanwhile, the 65+ years age bracket for the primary householder has the lowest median household income of $26,354, with 619 households (36.3%) in this group.
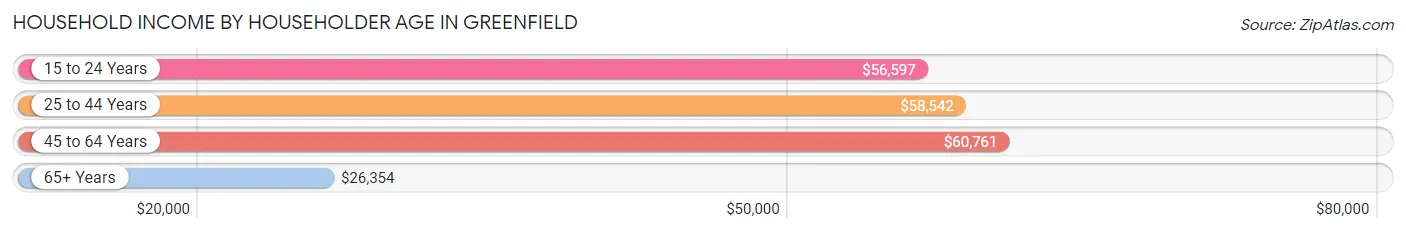
| Income Bracket | # Households | Median Income |
| 15 to 24 Years | 101 (5.9%) | $56,597 |
| 25 to 44 Years | 509 (29.8%) | $58,542 |
| 45 to 64 Years | 476 (27.9%) | $60,761 |
| 65+ Years | 619 (36.3%) | $26,354 |
| Total | 1,705 (100.0%) | $42,253 |
Poverty in Greenfield
Income Below Poverty by Sex and Age in Greenfield
With 23.5% poverty level for males and 34.6% for females among the residents of Greenfield, 5 year old males and 6 to 11 year old females are the most vulnerable to poverty, with 30 males (100.0%) and 96 females (84.2%) in their respective age groups living below the poverty level.
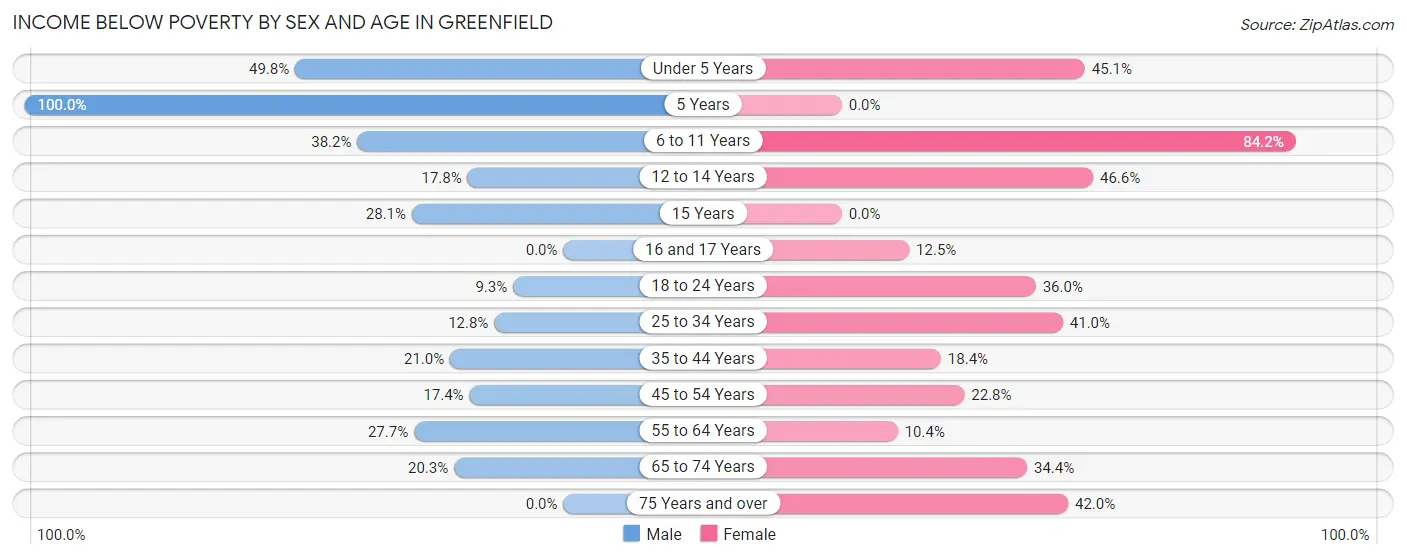
| Age Bracket | Male | Female |
| Under 5 Years | 119 (49.8%) | 74 (45.1%) |
| 5 Years | 30 (100.0%) | 0 (0.0%) |
| 6 to 11 Years | 26 (38.2%) | 96 (84.2%) |
| 12 to 14 Years | 8 (17.8%) | 83 (46.6%) |
| 15 Years | 9 (28.1%) | 0 (0.0%) |
| 16 and 17 Years | 0 (0.0%) | 7 (12.5%) |
| 18 to 24 Years | 18 (9.3%) | 72 (36.0%) |
| 25 to 34 Years | 28 (12.8%) | 144 (41.0%) |
| 35 to 44 Years | 45 (21.0%) | 46 (18.4%) |
| 45 to 54 Years | 42 (17.4%) | 43 (22.8%) |
| 55 to 64 Years | 79 (27.7%) | 19 (10.4%) |
| 65 to 74 Years | 58 (20.3%) | 119 (34.4%) |
| 75 Years and over | 0 (0.0%) | 42 (42.0%) |
| Total | 462 (23.5%) | 745 (34.6%) |
Income Above Poverty by Sex and Age in Greenfield
According to the poverty statistics in Greenfield, males aged 16 and 17 years and females aged 15 years are the age groups that are most secure financially, with 100.0% of males and 100.0% of females in these age groups living above the poverty line.
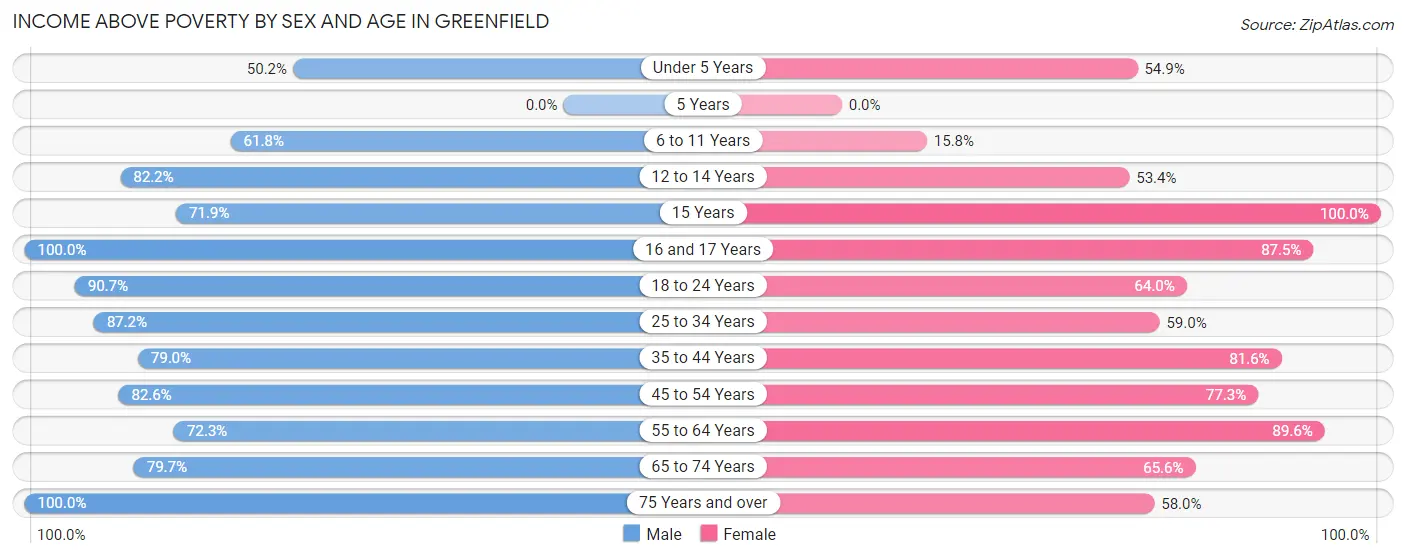
| Age Bracket | Male | Female |
| Under 5 Years | 120 (50.2%) | 90 (54.9%) |
| 5 Years | 0 (0.0%) | 0 (0.0%) |
| 6 to 11 Years | 42 (61.8%) | 18 (15.8%) |
| 12 to 14 Years | 37 (82.2%) | 95 (53.4%) |
| 15 Years | 23 (71.9%) | 22 (100.0%) |
| 16 and 17 Years | 38 (100.0%) | 49 (87.5%) |
| 18 to 24 Years | 175 (90.7%) | 128 (64.0%) |
| 25 to 34 Years | 190 (87.2%) | 207 (59.0%) |
| 35 to 44 Years | 169 (79.0%) | 204 (81.6%) |
| 45 to 54 Years | 199 (82.6%) | 146 (77.2%) |
| 55 to 64 Years | 206 (72.3%) | 164 (89.6%) |
| 65 to 74 Years | 228 (79.7%) | 227 (65.6%) |
| 75 Years and over | 78 (100.0%) | 58 (58.0%) |
| Total | 1,505 (76.5%) | 1,408 (65.4%) |
Income Below Poverty Among Married-Couple Families in Greenfield
The poverty statistics for married-couple families in Greenfield show that 13.5% or 87 of the total 645 families live below the poverty line. Families with no children have the highest poverty rate of 16.3%, comprising of 76 families. On the other hand, families with 1 or 2 children have the lowest poverty rate of 5.8%, which includes 9 families.
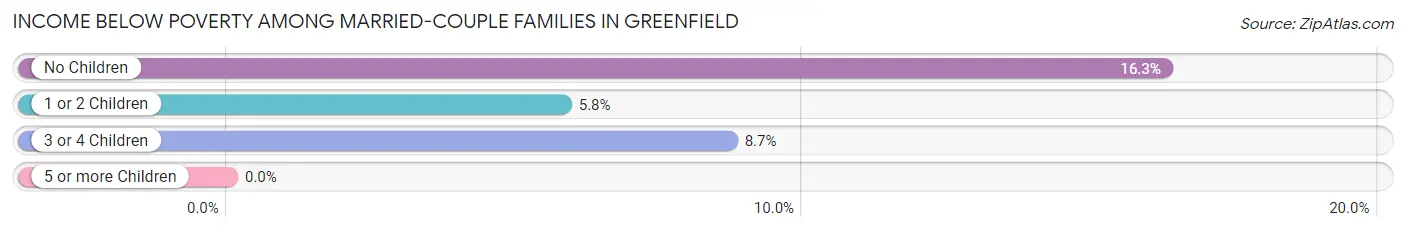
| Children | Above Poverty | Below Poverty |
| No Children | 391 (83.7%) | 76 (16.3%) |
| 1 or 2 Children | 146 (94.2%) | 9 (5.8%) |
| 3 or 4 Children | 21 (91.3%) | 2 (8.7%) |
| 5 or more Children | 0 (0.0%) | 0 (0.0%) |
| Total | 558 (86.5%) | 87 (13.5%) |
Income Below Poverty Among Single-Parent Households in Greenfield
According to the poverty data in Greenfield, 12.5% or 20 single-father households and 50.0% or 135 single-mother households are living below the poverty line. Among single-father households, those with 5 or more children have the highest poverty rate, with 20 households (100.0%) experiencing poverty. Likewise, among single-mother households, those with 3 or 4 children have the highest poverty rate, with 75 households (68.2%) falling below the poverty line.
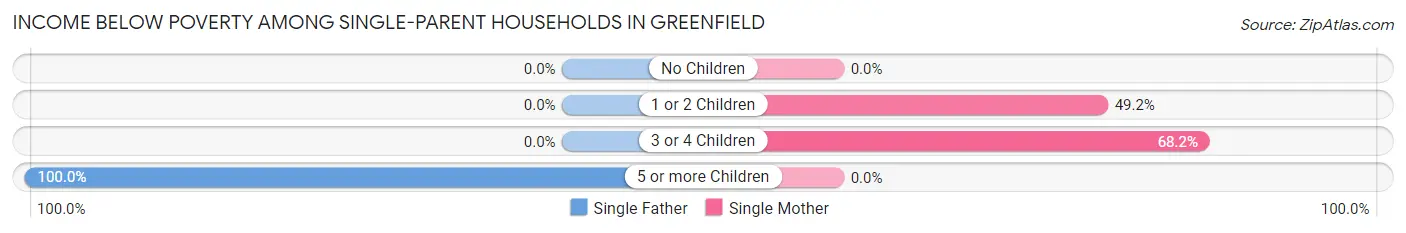
| Children | Single Father | Single Mother |
| No Children | 0 (0.0%) | 0 (0.0%) |
| 1 or 2 Children | 0 (0.0%) | 60 (49.2%) |
| 3 or 4 Children | 0 (0.0%) | 75 (68.2%) |
| 5 or more Children | 20 (100.0%) | 0 (0.0%) |
| Total | 20 (12.5%) | 135 (50.0%) |
Income Below Poverty Among Married-Couple vs Single-Parent Households in Greenfield
The poverty data for Greenfield shows that 87 of the married-couple family households (13.5%) and 155 of the single-parent households (36.0%) are living below the poverty level. Within the married-couple family households, those with no children have the highest poverty rate, with 76 households (16.3%) falling below the poverty line. Among the single-parent households, those with 5 or more children have the highest poverty rate, with 20 household (100.0%) living below poverty.
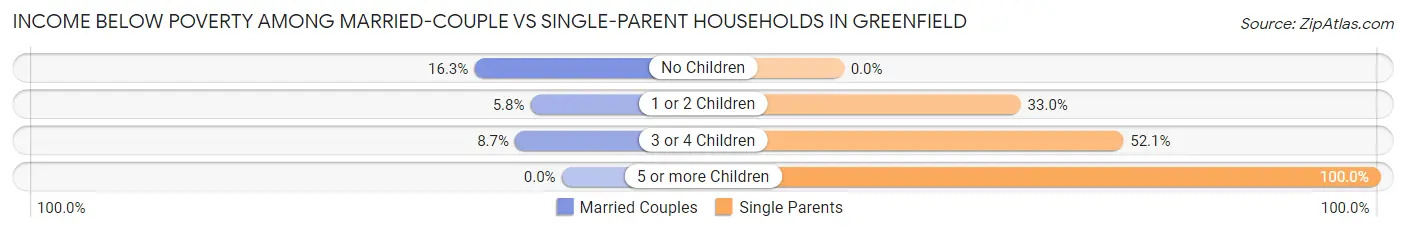
| Children | Married-Couple Families | Single-Parent Households |
| No Children | 76 (16.3%) | 0 (0.0%) |
| 1 or 2 Children | 9 (5.8%) | 60 (33.0%) |
| 3 or 4 Children | 2 (8.7%) | 75 (52.1%) |
| 5 or more Children | 0 (0.0%) | 20 (100.0%) |
| Total | 87 (13.5%) | 155 (36.0%) |
Race in Greenfield
The most populous races in Greenfield are White / Caucasian (3,854 | 91.0%), Black / African American (188 | 4.4%), and Two or more Races (174 | 4.1%).
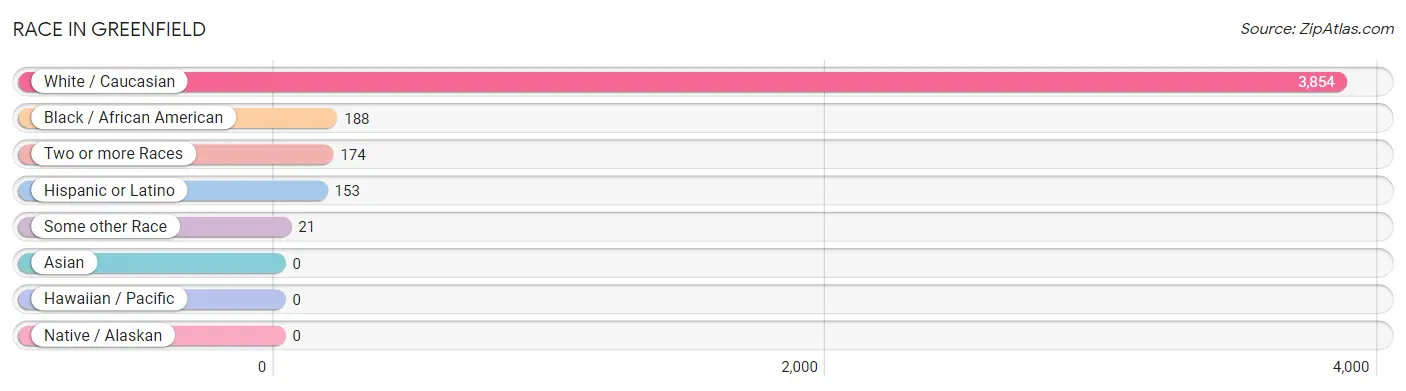
| Race | # Population | % Population |
| Asian | 0 | 0.0% |
| Black / African American | 188 | 4.4% |
| Hawaiian / Pacific | 0 | 0.0% |
| Hispanic or Latino | 153 | 3.6% |
| Native / Alaskan | 0 | 0.0% |
| White / Caucasian | 3,854 | 91.0% |
| Two or more Races | 174 | 4.1% |
| Some other Race | 21 | 0.5% |
| Total | 4,237 | 100.0% |
Ancestry in Greenfield
The most populous ancestries reported in Greenfield are Irish (672 | 15.9%), German (624 | 14.7%), American (536 | 12.7%), English (381 | 9.0%), and European (88 | 2.1%), together accounting for 54.3% of all Greenfield residents.
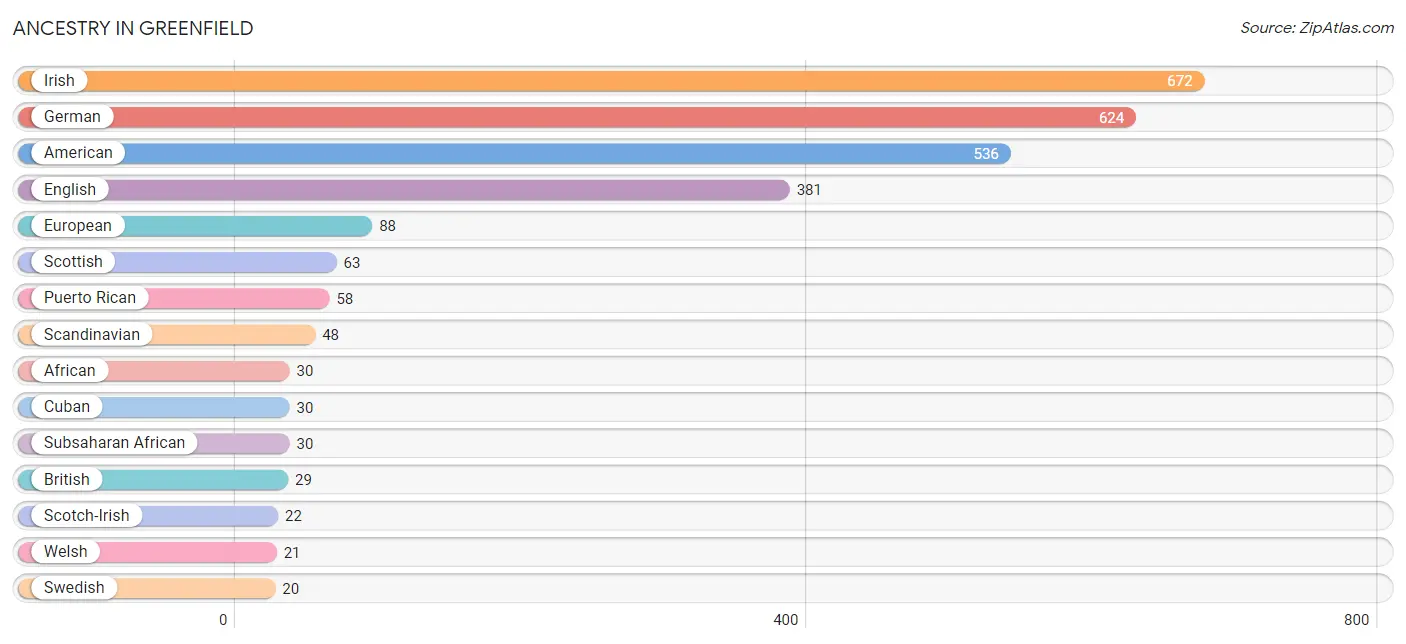
| Ancestry | # Population | % Population |
| African | 30 | 0.7% |
| Alsatian | 12 | 0.3% |
| American | 536 | 12.7% |
| British | 29 | 0.7% |
| Cherokee | 15 | 0.4% |
| Cuban | 30 | 0.7% |
| Danish | 11 | 0.3% |
| English | 381 | 9.0% |
| European | 88 | 2.1% |
| French | 3 | 0.1% |
| German | 624 | 14.7% |
| Irish | 672 | 15.9% |
| Northern European | 10 | 0.2% |
| Norwegian | 10 | 0.2% |
| Polish | 14 | 0.3% |
| Puerto Rican | 58 | 1.4% |
| Scandinavian | 48 | 1.1% |
| Scotch-Irish | 22 | 0.5% |
| Scottish | 63 | 1.5% |
| Subsaharan African | 30 | 0.7% |
| Swedish | 20 | 0.5% |
| Welsh | 21 | 0.5% | View All 22 Rows |
Immigrants in Greenfield
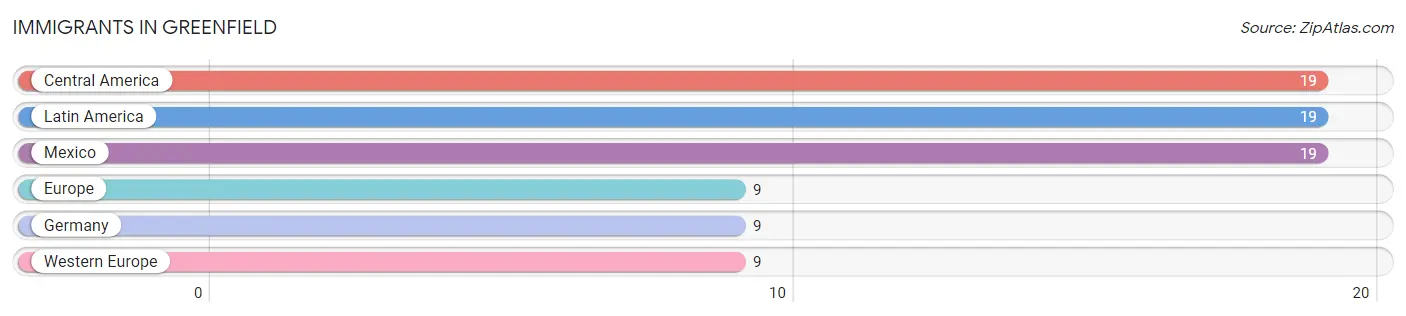
The most numerous immigrant groups reported in Greenfield came from Central America (19 | 0.4%), Latin America (19 | 0.4%), Mexico (19 | 0.4%), Europe (9 | 0.2%), and Germany (9 | 0.2%), together accounting for 1.8% of all Greenfield residents.
| Immigration Origin | # Population | % Population |
| Central America | 19 | 0.4% |
| Europe | 9 | 0.2% |
| Germany | 9 | 0.2% |
| Latin America | 19 | 0.4% |
| Mexico | 19 | 0.4% |
| Western Europe | 9 | 0.2% | View All 6 Rows |
Sex and Age in Greenfield
Sex and Age in Greenfield
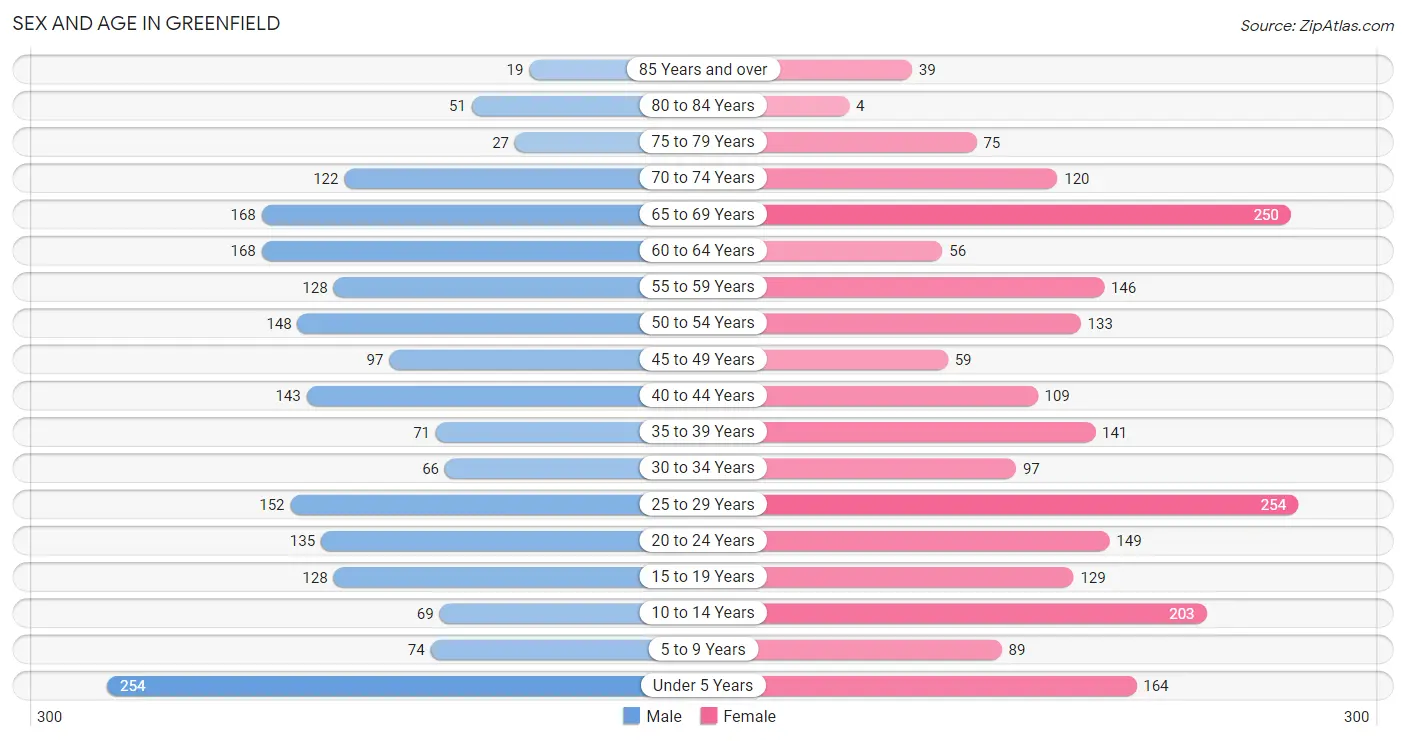
The most populous age groups in Greenfield are Under 5 Years (254 | 12.6%) for men and 25 to 29 Years (254 | 11.5%) for women.
| Age Bracket | Male | Female |
| Under 5 Years | 254 (12.6%) | 164 (7.4%) |
| 5 to 9 Years | 74 (3.7%) | 89 (4.0%) |
| 10 to 14 Years | 69 (3.4%) | 203 (9.2%) |
| 15 to 19 Years | 128 (6.3%) | 129 (5.8%) |
| 20 to 24 Years | 135 (6.7%) | 149 (6.7%) |
| 25 to 29 Years | 152 (7.5%) | 254 (11.5%) |
| 30 to 34 Years | 66 (3.3%) | 97 (4.4%) |
| 35 to 39 Years | 71 (3.5%) | 141 (6.4%) |
| 40 to 44 Years | 143 (7.1%) | 109 (4.9%) |
| 45 to 49 Years | 97 (4.8%) | 59 (2.7%) |
| 50 to 54 Years | 148 (7.3%) | 133 (6.0%) |
| 55 to 59 Years | 128 (6.3%) | 146 (6.6%) |
| 60 to 64 Years | 168 (8.3%) | 56 (2.5%) |
| 65 to 69 Years | 168 (8.3%) | 250 (11.3%) |
| 70 to 74 Years | 122 (6.0%) | 120 (5.4%) |
| 75 to 79 Years | 27 (1.3%) | 75 (3.4%) |
| 80 to 84 Years | 51 (2.5%) | 4 (0.2%) |
| 85 Years and over | 19 (0.9%) | 39 (1.8%) |
| Total | 2,020 (100.0%) | 2,217 (100.0%) |
Families and Households in Greenfield
Median Family Size in Greenfield
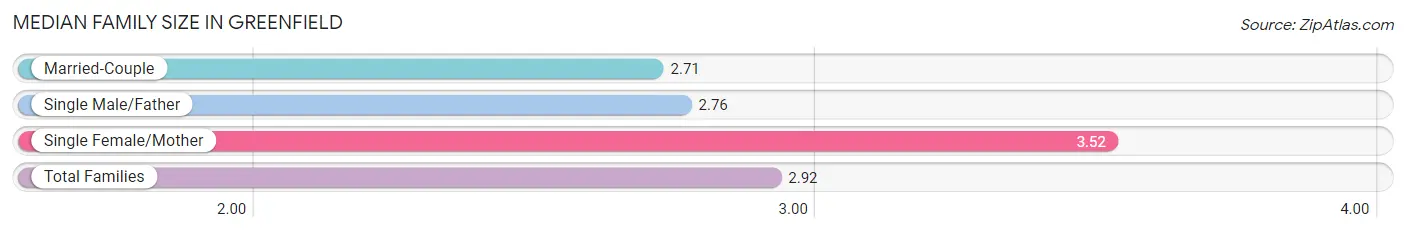
The median family size in Greenfield is 2.92 persons per family, with single female/mother families (270 | 25.1%) accounting for the largest median family size of 3.52 persons per family. On the other hand, married-couple families (645 | 60.0%) represent the smallest median family size with 2.71 persons per family.
| Family Type | # Families | Family Size |
| Married-Couple | 645 (60.0%) | 2.71 |
| Single Male/Father | 160 (14.9%) | 2.76 |
| Single Female/Mother | 270 (25.1%) | 3.52 |
| Total Families | 1,075 (100.0%) | 2.92 |
Median Household Size in Greenfield
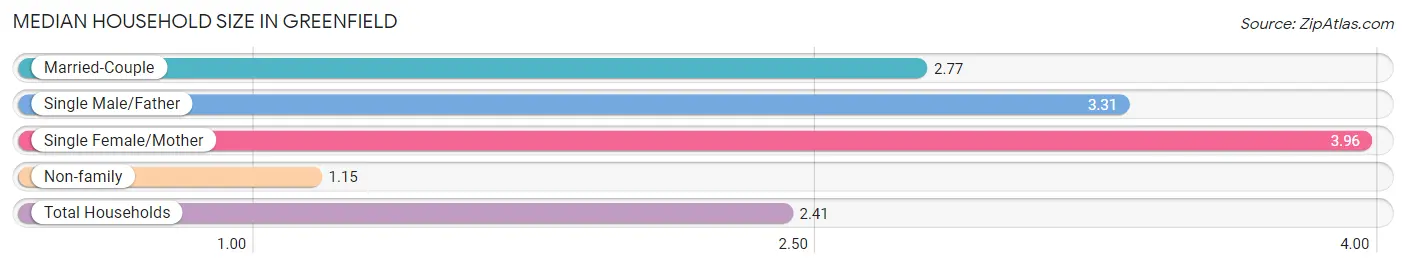
The median household size in Greenfield is 2.41 persons per household, with single female/mother households (270 | 15.8%) accounting for the largest median household size of 3.96 persons per household. non-family households (630 | 36.9%) represent the smallest median household size with 1.15 persons per household.
| Household Type | # Households | Household Size |
| Married-Couple | 645 (37.8%) | 2.77 |
| Single Male/Father | 160 (9.4%) | 3.31 |
| Single Female/Mother | 270 (15.8%) | 3.96 |
| Non-family | 630 (36.9%) | 1.15 |
| Total Households | 1,705 (100.0%) | 2.41 |
Household Size by Marriage Status in Greenfield
Out of a total of 1,705 households in Greenfield, 1,075 (63.0%) are family households, while 630 (36.9%) are nonfamily households. The most numerous type of family households are 2-person households, comprising 543, and the most common type of nonfamily households are 1-person households, comprising 522.
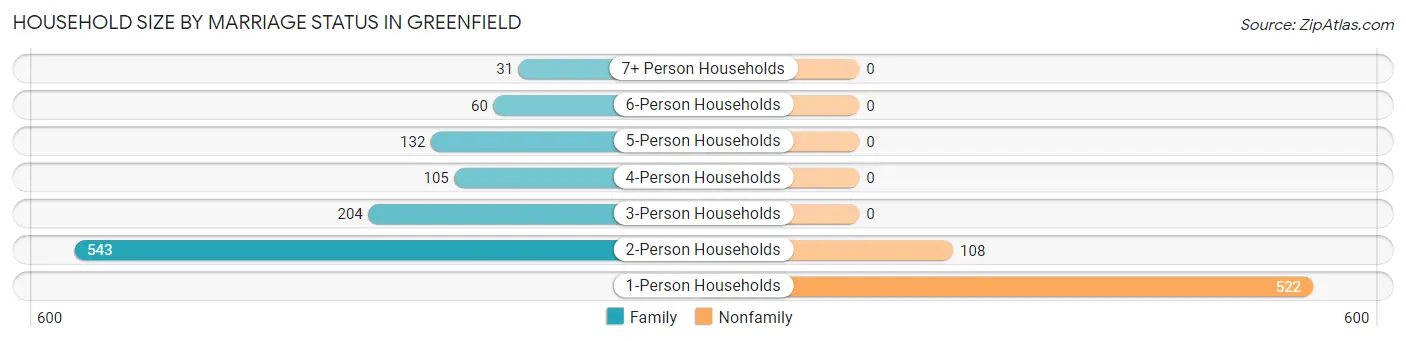
| Household Size | Family Households | Nonfamily Households |
| 1-Person Households | - | 522 (30.6%) |
| 2-Person Households | 543 (31.9%) | 108 (6.3%) |
| 3-Person Households | 204 (12.0%) | 0 (0.0%) |
| 4-Person Households | 105 (6.2%) | 0 (0.0%) |
| 5-Person Households | 132 (7.7%) | 0 (0.0%) |
| 6-Person Households | 60 (3.5%) | 0 (0.0%) |
| 7+ Person Households | 31 (1.8%) | 0 (0.0%) |
| Total | 1,075 (63.0%) | 630 (36.9%) |
Female Fertility in Greenfield
Fertility by Age in Greenfield
Average fertility rate in Greenfield is 64.0 births per 1,000 women. Women in the age bracket of 20 to 34 years have the highest fertility rate with 122.0 births per 1,000 women. Women in the age bracket of 20 to 34 years acount for 100.0% of all women with births.
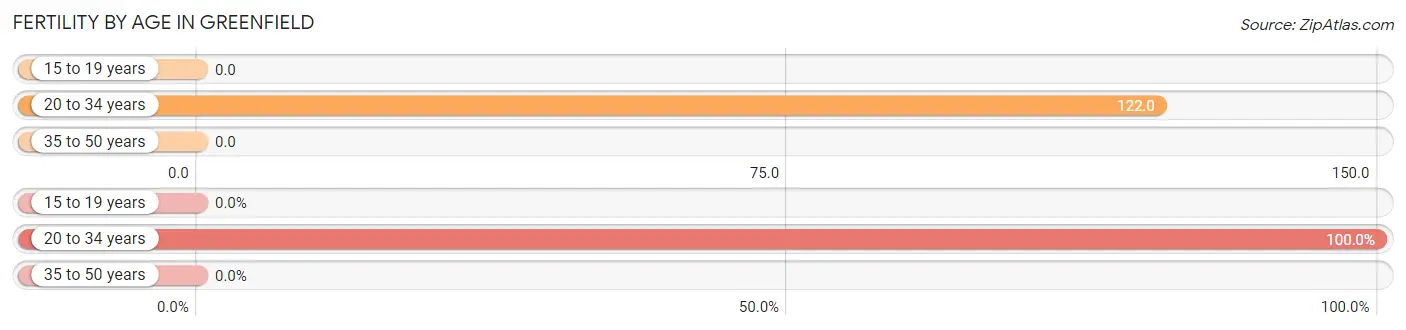
| Age Bracket | Women with Births | Births / 1,000 Women |
| 15 to 19 years | 0 (0.0%) | 0.0 |
| 20 to 34 years | 61 (100.0%) | 122.0 |
| 35 to 50 years | 0 (0.0%) | 0.0 |
| Total | 61 (100.0%) | 64.0 |
Fertility by Age by Marriage Status in Greenfield
16.4% of women with births (61) in Greenfield are married. The highest percentage of unmarried women with births falls into 20 to 34 years age bracket with 83.6% of them unmarried at the time of birth, while the lowest percentage of unmarried women with births belong to 20 to 34 years age bracket with 83.6% of them unmarried.
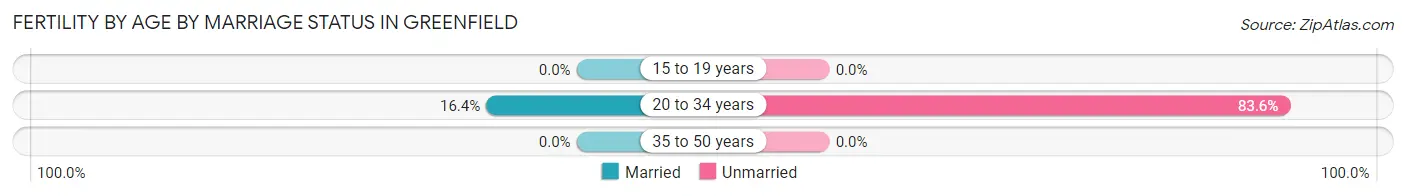
| Age Bracket | Married | Unmarried |
| 15 to 19 years | 0 (0.0%) | 0 (0.0%) |
| 20 to 34 years | 10 (16.4%) | 51 (83.6%) |
| 35 to 50 years | 0 (0.0%) | 0 (0.0%) |
| Total | 10 (16.4%) | 51 (83.6%) |
Fertility by Education in Greenfield
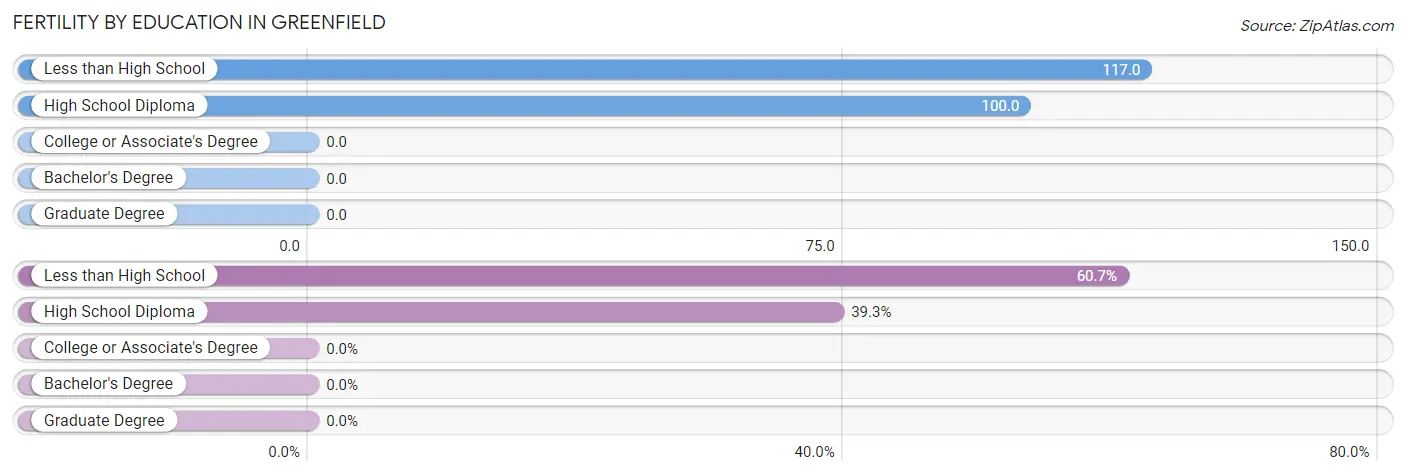
| Educational Attainment | Women with Births | Births / 1,000 Women |
| Less than High School | 37 (60.7%) | 117.0 |
| High School Diploma | 24 (39.3%) | 100.0 |
| College or Associate's Degree | 0 (0.0%) | 0.0 |
| Bachelor's Degree | 0 (0.0%) | 0.0 |
| Graduate Degree | 0 (0.0%) | 0.0 |
| Total | 61 (100.0%) | 64.0 |
Fertility by Education by Marriage Status in Greenfield
83.6% of women with births in Greenfield are unmarried. Women with the educational attainment of less than high school are most likely to be married with 27.0% of them married at childbirth, while women with the educational attainment of high school diploma are least likely to be married with 100.0% of them unmarried at childbirth.
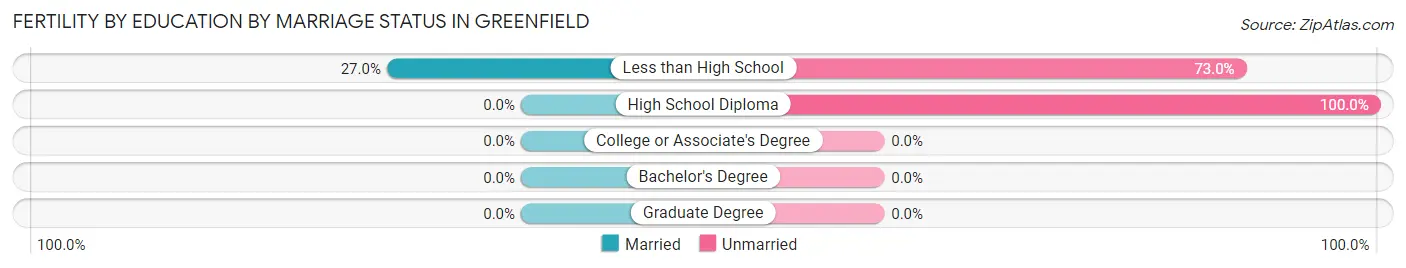
| Educational Attainment | Married | Unmarried |
| Less than High School | 10 (27.0%) | 27 (73.0%) |
| High School Diploma | 0 (0.0%) | 24 (100.0%) |
| College or Associate's Degree | 0 (0.0%) | 0 (0.0%) |
| Bachelor's Degree | 0 (0.0%) | 0 (0.0%) |
| Graduate Degree | 0 (0.0%) | 0 (0.0%) |
| Total | 10 (16.4%) | 51 (83.6%) |
Employment Characteristics in Greenfield
Employment by Class of Employer in Greenfield
Among the 1,591 employed individuals in Greenfield, private company employees (1,137 | 71.5%), local government employees (215 | 13.5%), and self-employed (not incorporated) (97 | 6.1%) make up the most common classes of employment.
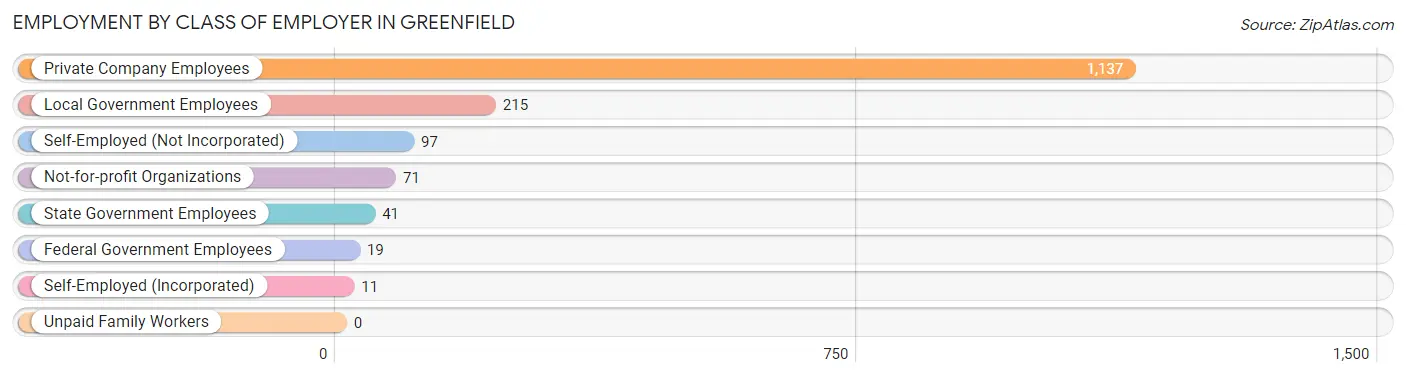
| Employer Class | # Employees | % Employees |
| Private Company Employees | 1,137 | 71.5% |
| Self-Employed (Incorporated) | 11 | 0.7% |
| Self-Employed (Not Incorporated) | 97 | 6.1% |
| Not-for-profit Organizations | 71 | 4.5% |
| Local Government Employees | 215 | 13.5% |
| State Government Employees | 41 | 2.6% |
| Federal Government Employees | 19 | 1.2% |
| Unpaid Family Workers | 0 | 0.0% |
| Total | 1,591 | 100.0% |
Employment Status by Age in Greenfield
According to the labor force statistics for Greenfield, out of the total population over 16 years of age (3,330), 53.0% or 1,765 individuals are in the labor force, with 6.6% or 116 of them unemployed. The age group with the highest labor force participation rate is 35 to 44 years, with 81.7% or 379 individuals in the labor force. Within the labor force, the 16 to 19 years age range has the highest percentage of unemployed individuals, with 40.5% or 60 of them being unemployed.
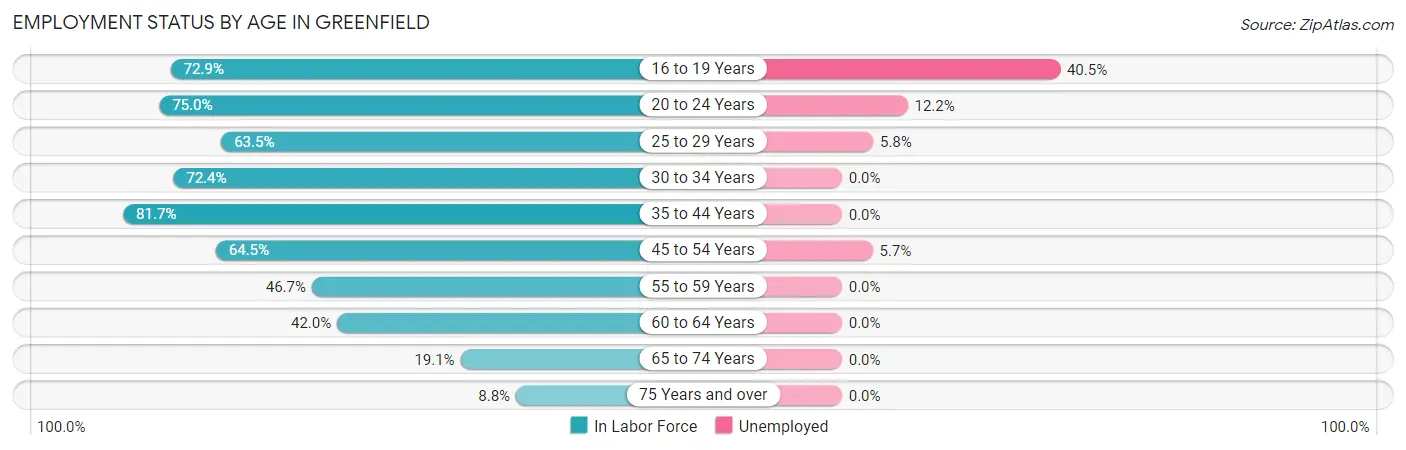
| Age Bracket | In Labor Force | Unemployed |
| 16 to 19 Years | 148 (72.9%) | 60 (40.5%) |
| 20 to 24 Years | 213 (75.0%) | 26 (12.2%) |
| 25 to 29 Years | 258 (63.5%) | 15 (5.8%) |
| 30 to 34 Years | 118 (72.4%) | 0 (0.0%) |
| 35 to 44 Years | 379 (81.7%) | 0 (0.0%) |
| 45 to 54 Years | 282 (64.5%) | 16 (5.7%) |
| 55 to 59 Years | 128 (46.7%) | 0 (0.0%) |
| 60 to 64 Years | 94 (42.0%) | 0 (0.0%) |
| 65 to 74 Years | 126 (19.1%) | 0 (0.0%) |
| 75 Years and over | 19 (8.8%) | 0 (0.0%) |
| Total | 1,765 (53.0%) | 116 (6.6%) |
Employment Status by Educational Attainment in Greenfield
According to labor force statistics for Greenfield, 64.0% of individuals (1,260) out of the total population between 25 and 64 years of age (1,968) are in the labor force, with 2.5% or 32 of them being unemployed. The group with the highest labor force participation rate are those with the educational attainment of bachelor's degree or higher, with 83.7% or 261 individuals in the labor force. Within the labor force, individuals with college / associate degree education have the highest percentage of unemployment, with 7.0% or 23 of them being unemployed.
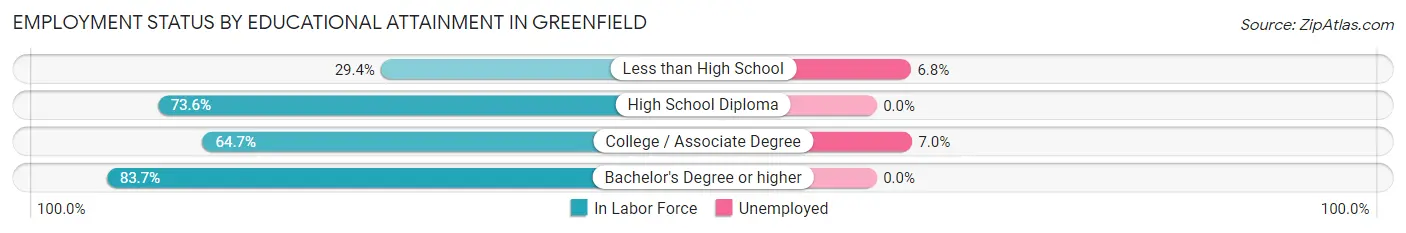
| Educational Attainment | In Labor Force | Unemployed |
| Less than High School | 117 (29.4%) | 27 (6.8%) |
| High School Diploma | 553 (73.6%) | 0 (0.0%) |
| College / Associate Degree | 328 (64.7%) | 35 (7.0%) |
| Bachelor's Degree or higher | 261 (83.7%) | 0 (0.0%) |
| Total | 1,260 (64.0%) | 49 (2.5%) |
Employment Occupations by Sex in Greenfield
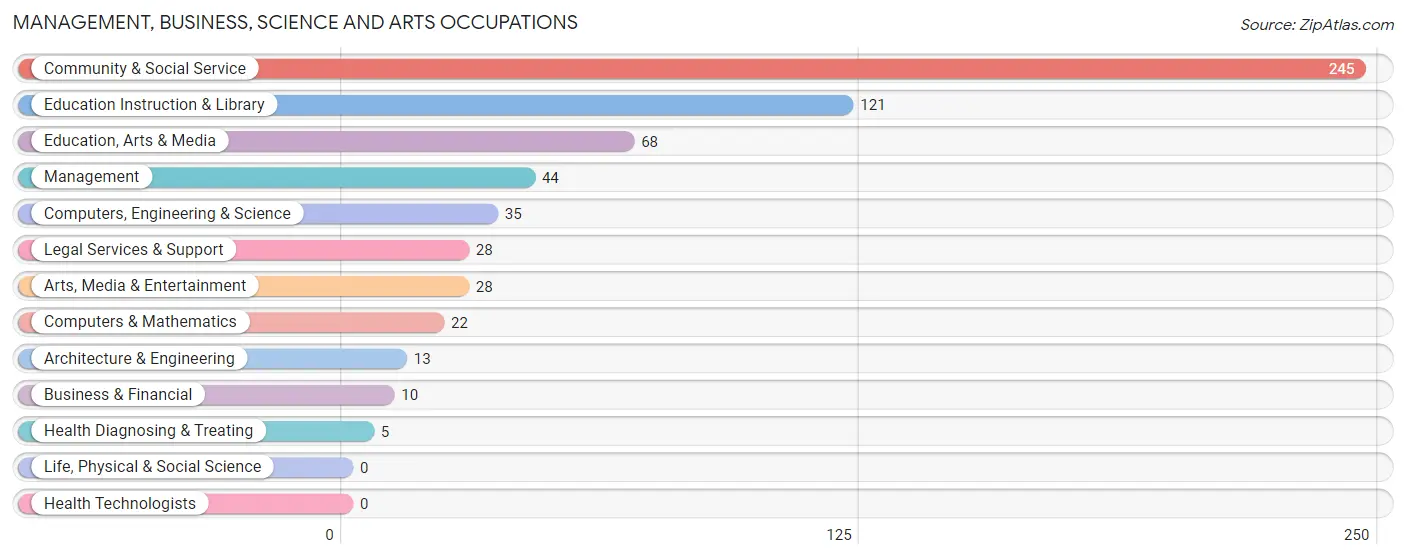
Management, Business, Science and Arts Occupations
The most common Management, Business, Science and Arts occupations in Greenfield are Community & Social Service (245 | 14.9%), Education Instruction & Library (121 | 7.3%), Education, Arts & Media (68 | 4.1%), Management (44 | 2.7%), and Computers, Engineering & Science (35 | 2.1%).
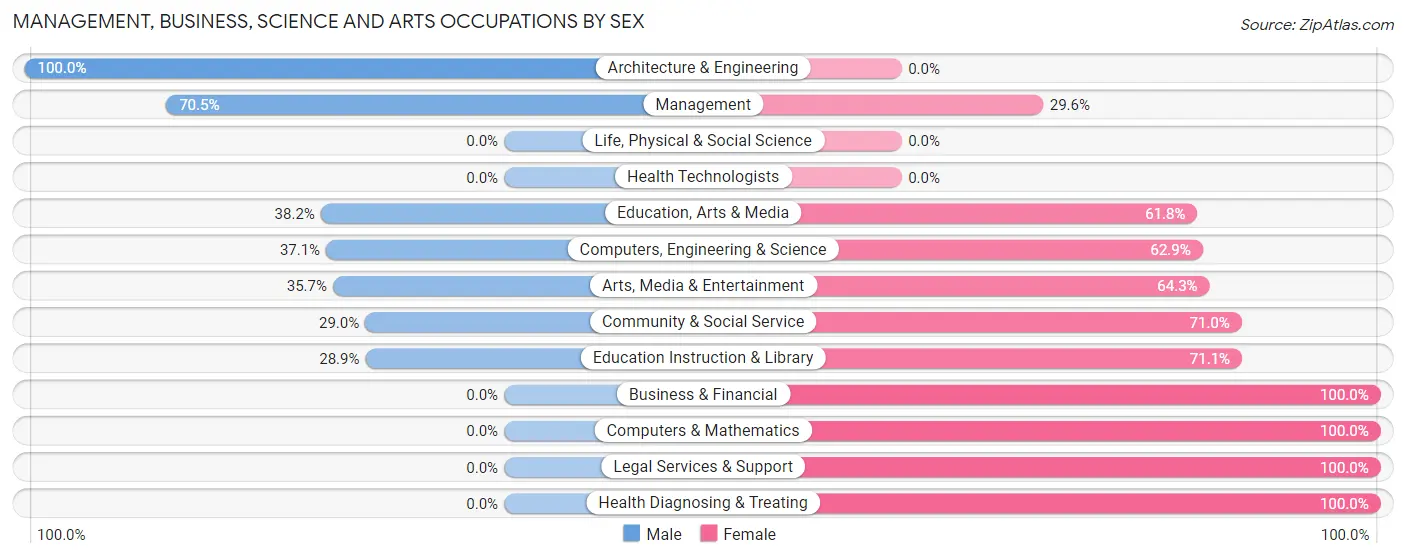
Management, Business, Science and Arts Occupations by Sex
Within the Management, Business, Science and Arts occupations in Greenfield, the most male-oriented occupations are Architecture & Engineering (100.0%), Management (70.5%), and Education, Arts & Media (38.2%), while the most female-oriented occupations are Business & Financial (100.0%), Computers & Mathematics (100.0%), and Legal Services & Support (100.0%).
| Occupation | Male | Female |
| Management | 31 (70.5%) | 13 (29.5%) |
| Business & Financial | 0 (0.0%) | 10 (100.0%) |
| Computers, Engineering & Science | 13 (37.1%) | 22 (62.9%) |
| Computers & Mathematics | 0 (0.0%) | 22 (100.0%) |
| Architecture & Engineering | 13 (100.0%) | 0 (0.0%) |
| Life, Physical & Social Science | 0 (0.0%) | 0 (0.0%) |
| Community & Social Service | 71 (29.0%) | 174 (71.0%) |
| Education, Arts & Media | 26 (38.2%) | 42 (61.8%) |
| Legal Services & Support | 0 (0.0%) | 28 (100.0%) |
| Education Instruction & Library | 35 (28.9%) | 86 (71.1%) |
| Arts, Media & Entertainment | 10 (35.7%) | 18 (64.3%) |
| Health Diagnosing & Treating | 0 (0.0%) | 5 (100.0%) |
| Health Technologists | 0 (0.0%) | 0 (0.0%) |
| Total (Category) | 115 (33.9%) | 224 (66.1%) |
| Total (Overall) | 910 (55.2%) | 738 (44.8%) |
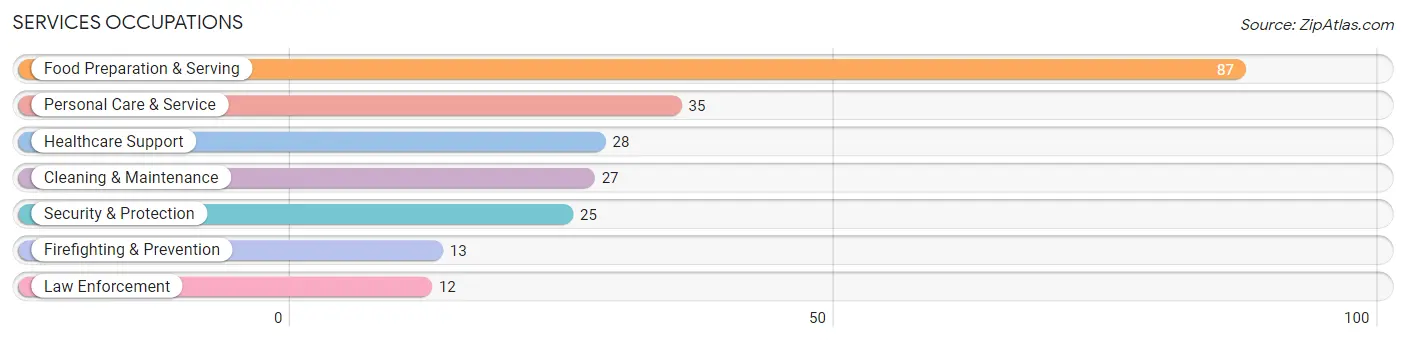
Services Occupations
The most common Services occupations in Greenfield are Food Preparation & Serving (87 | 5.3%), Personal Care & Service (35 | 2.1%), Healthcare Support (28 | 1.7%), Cleaning & Maintenance (27 | 1.6%), and Security & Protection (25 | 1.5%).
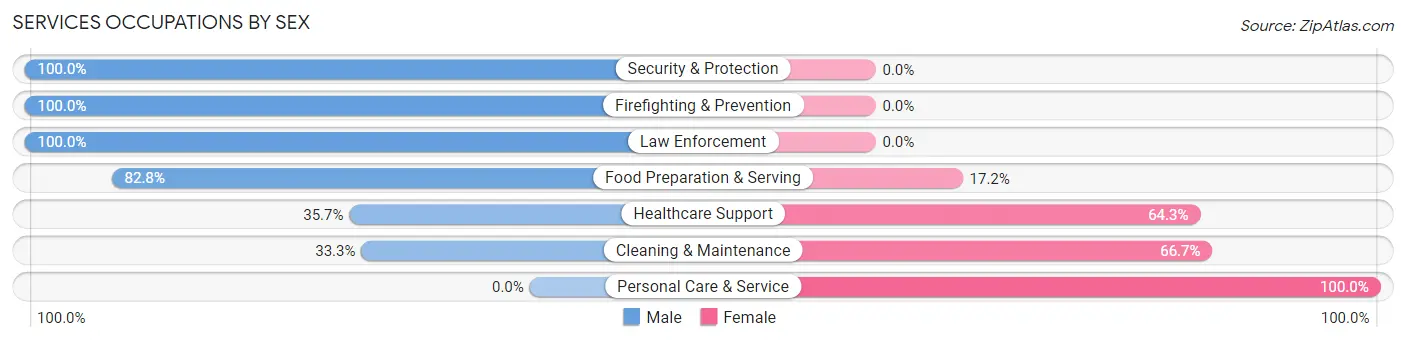
Services Occupations by Sex
Within the Services occupations in Greenfield, the most male-oriented occupations are Security & Protection (100.0%), Firefighting & Prevention (100.0%), and Law Enforcement (100.0%), while the most female-oriented occupations are Personal Care & Service (100.0%), Cleaning & Maintenance (66.7%), and Healthcare Support (64.3%).
| Occupation | Male | Female |
| Healthcare Support | 10 (35.7%) | 18 (64.3%) |
| Security & Protection | 25 (100.0%) | 0 (0.0%) |
| Firefighting & Prevention | 13 (100.0%) | 0 (0.0%) |
| Law Enforcement | 12 (100.0%) | 0 (0.0%) |
| Food Preparation & Serving | 72 (82.8%) | 15 (17.2%) |
| Cleaning & Maintenance | 9 (33.3%) | 18 (66.7%) |
| Personal Care & Service | 0 (0.0%) | 35 (100.0%) |
| Total (Category) | 116 (57.4%) | 86 (42.6%) |
| Total (Overall) | 910 (55.2%) | 738 (44.8%) |
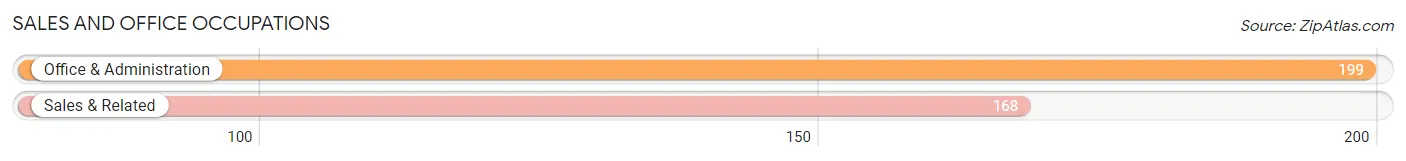
Sales and Office Occupations
The most common Sales and Office occupations in Greenfield are Office & Administration (199 | 12.1%), and Sales & Related (168 | 10.2%).
Sales and Office Occupations by Sex
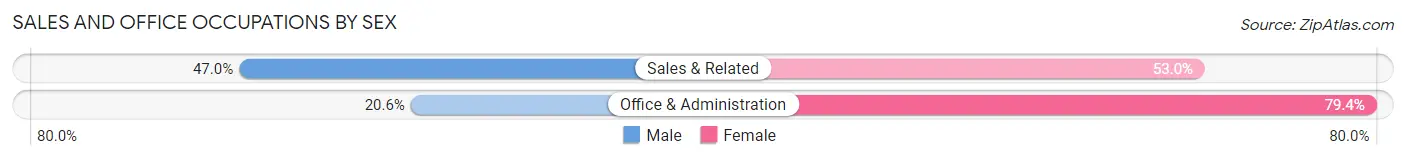
| Occupation | Male | Female |
| Sales & Related | 79 (47.0%) | 89 (53.0%) |
| Office & Administration | 41 (20.6%) | 158 (79.4%) |
| Total (Category) | 120 (32.7%) | 247 (67.3%) |
| Total (Overall) | 910 (55.2%) | 738 (44.8%) |
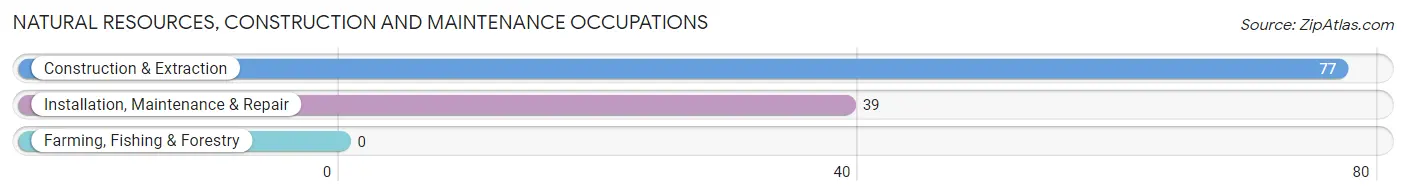
Natural Resources, Construction and Maintenance Occupations
The most common Natural Resources, Construction and Maintenance occupations in Greenfield are Construction & Extraction (77 | 4.7%), and Installation, Maintenance & Repair (39 | 2.4%).
Natural Resources, Construction and Maintenance Occupations by Sex
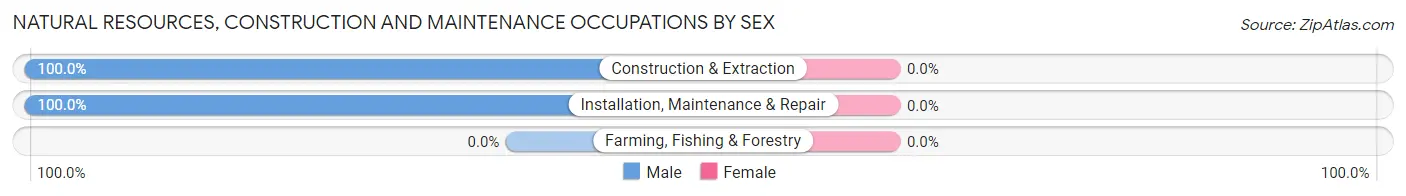
| Occupation | Male | Female |
| Farming, Fishing & Forestry | 0 (0.0%) | 0 (0.0%) |
| Construction & Extraction | 77 (100.0%) | 0 (0.0%) |
| Installation, Maintenance & Repair | 39 (100.0%) | 0 (0.0%) |
| Total (Category) | 116 (100.0%) | 0 (0.0%) |
| Total (Overall) | 910 (55.2%) | 738 (44.8%) |
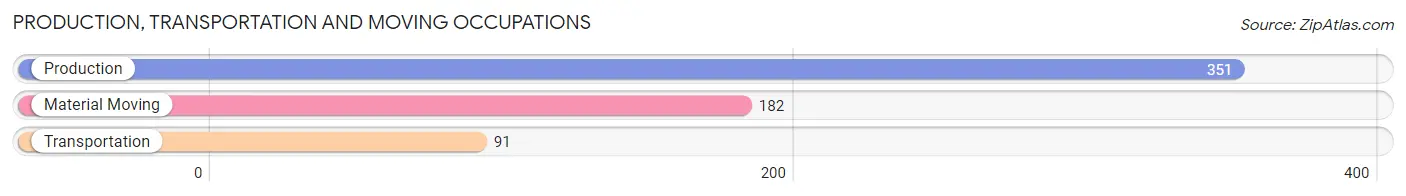
Production, Transportation and Moving Occupations
The most common Production, Transportation and Moving occupations in Greenfield are Production (351 | 21.3%), Material Moving (182 | 11.0%), and Transportation (91 | 5.5%).
Production, Transportation and Moving Occupations by Sex
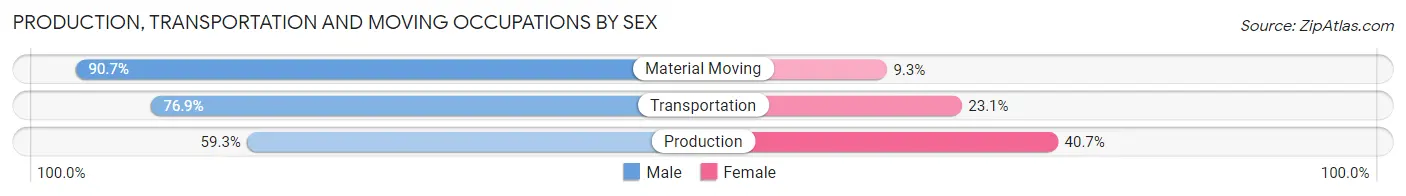
| Occupation | Male | Female |
| Production | 208 (59.3%) | 143 (40.7%) |
| Transportation | 70 (76.9%) | 21 (23.1%) |
| Material Moving | 165 (90.7%) | 17 (9.3%) |
| Total (Category) | 443 (71.0%) | 181 (29.0%) |
| Total (Overall) | 910 (55.2%) | 738 (44.8%) |
Employment Industries by Sex in Greenfield
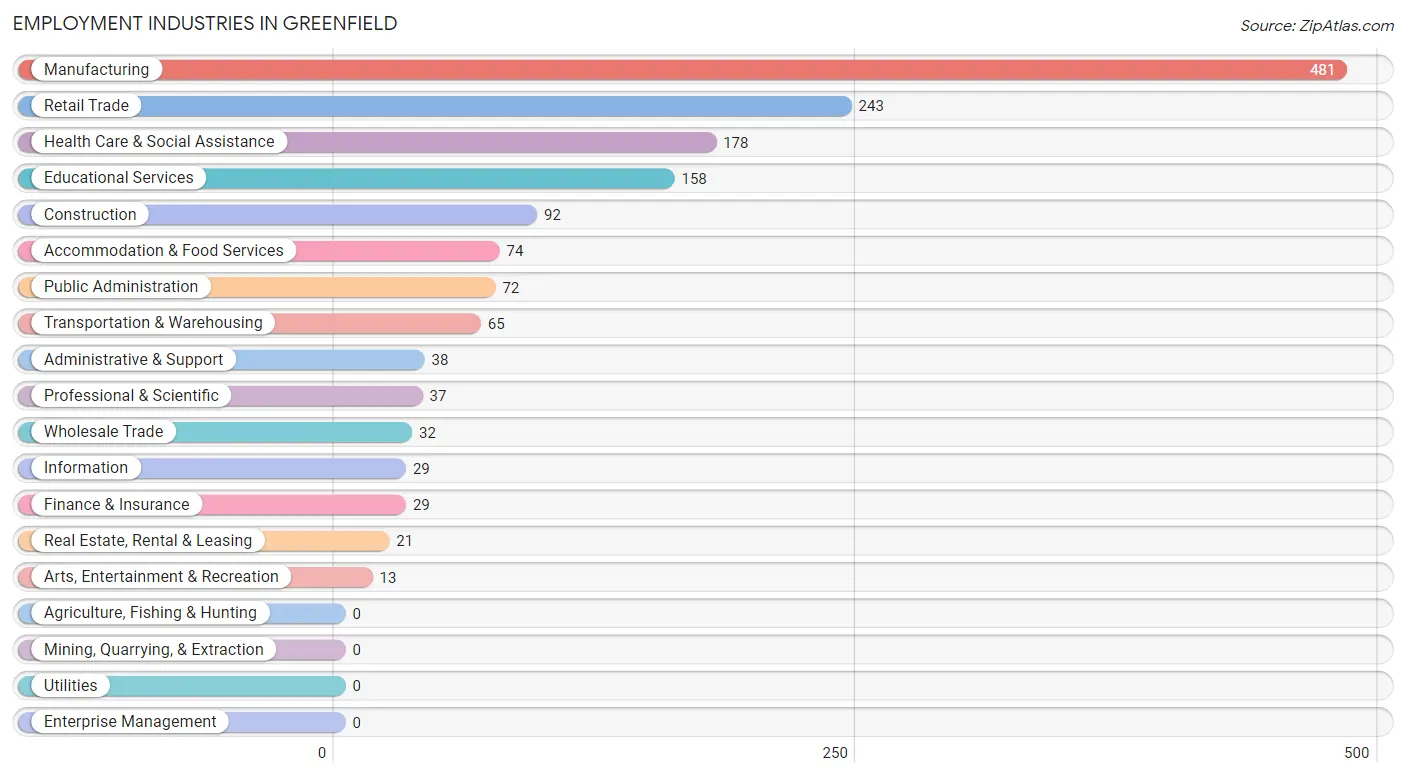
Employment Industries in Greenfield
The major employment industries in Greenfield include Manufacturing (481 | 29.2%), Retail Trade (243 | 14.7%), Health Care & Social Assistance (178 | 10.8%), Educational Services (158 | 9.6%), and Construction (92 | 5.6%).
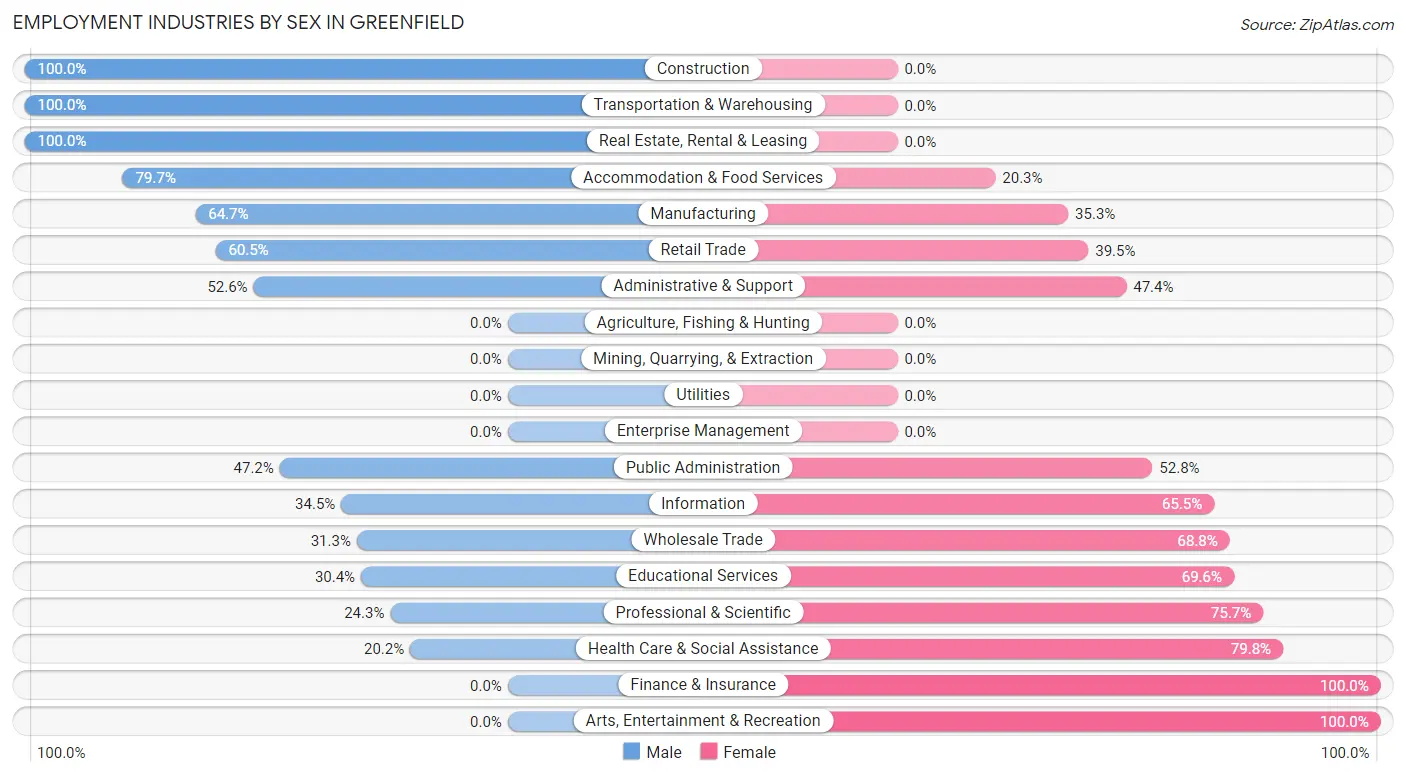
Employment Industries by Sex in Greenfield
The Greenfield industries that see more men than women are Construction (100.0%), Transportation & Warehousing (100.0%), and Real Estate, Rental & Leasing (100.0%), whereas the industries that tend to have a higher number of women are Finance & Insurance (100.0%), Arts, Entertainment & Recreation (100.0%), and Health Care & Social Assistance (79.8%).
| Industry | Male | Female |
| Agriculture, Fishing & Hunting | 0 (0.0%) | 0 (0.0%) |
| Mining, Quarrying, & Extraction | 0 (0.0%) | 0 (0.0%) |
| Construction | 92 (100.0%) | 0 (0.0%) |
| Manufacturing | 311 (64.7%) | 170 (35.3%) |
| Wholesale Trade | 10 (31.2%) | 22 (68.8%) |
| Retail Trade | 147 (60.5%) | 96 (39.5%) |
| Transportation & Warehousing | 65 (100.0%) | 0 (0.0%) |
| Utilities | 0 (0.0%) | 0 (0.0%) |
| Information | 10 (34.5%) | 19 (65.5%) |
| Finance & Insurance | 0 (0.0%) | 29 (100.0%) |
| Real Estate, Rental & Leasing | 21 (100.0%) | 0 (0.0%) |
| Professional & Scientific | 9 (24.3%) | 28 (75.7%) |
| Enterprise Management | 0 (0.0%) | 0 (0.0%) |
| Administrative & Support | 20 (52.6%) | 18 (47.4%) |
| Educational Services | 48 (30.4%) | 110 (69.6%) |
| Health Care & Social Assistance | 36 (20.2%) | 142 (79.8%) |
| Arts, Entertainment & Recreation | 0 (0.0%) | 13 (100.0%) |
| Accommodation & Food Services | 59 (79.7%) | 15 (20.3%) |
| Public Administration | 34 (47.2%) | 38 (52.8%) |
| Total | 910 (55.2%) | 738 (44.8%) |
Education in Greenfield
School Enrollment in Greenfield
The most common levels of schooling among the 783 students in Greenfield are high school (240 | 30.6%), middle school (160 | 20.4%), and elementary school (145 | 18.5%).
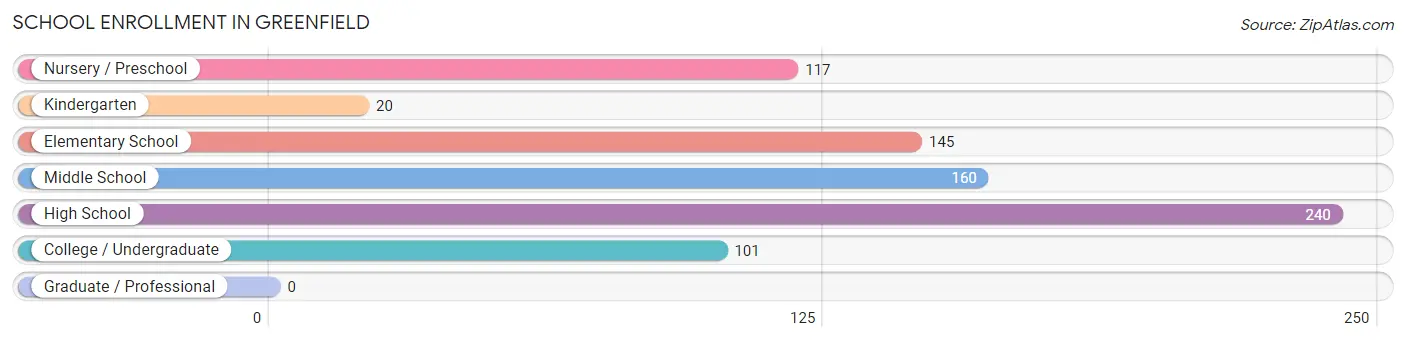
| School Level | # Students | % Students |
| Nursery / Preschool | 117 | 14.9% |
| Kindergarten | 20 | 2.5% |
| Elementary School | 145 | 18.5% |
| Middle School | 160 | 20.4% |
| High School | 240 | 30.6% |
| College / Undergraduate | 101 | 12.9% |
| Graduate / Professional | 0 | 0.0% |
| Total | 783 | 100.0% |
School Enrollment by Age by Funding Source in Greenfield
Out of a total of 783 students who are enrolled in schools in Greenfield, 47 (6.0%) attend a private institution, while the remaining 736 (94.0%) are enrolled in public schools. The age group of 3 to 4 year olds has the highest likelihood of being enrolled in private schools, with 28 (22.6% in the age bracket) enrolled. Conversely, the age group of 5 to 9 year old has the lowest likelihood of being enrolled in a private school, with 133 (100.0% in the age bracket) attending a public institution.
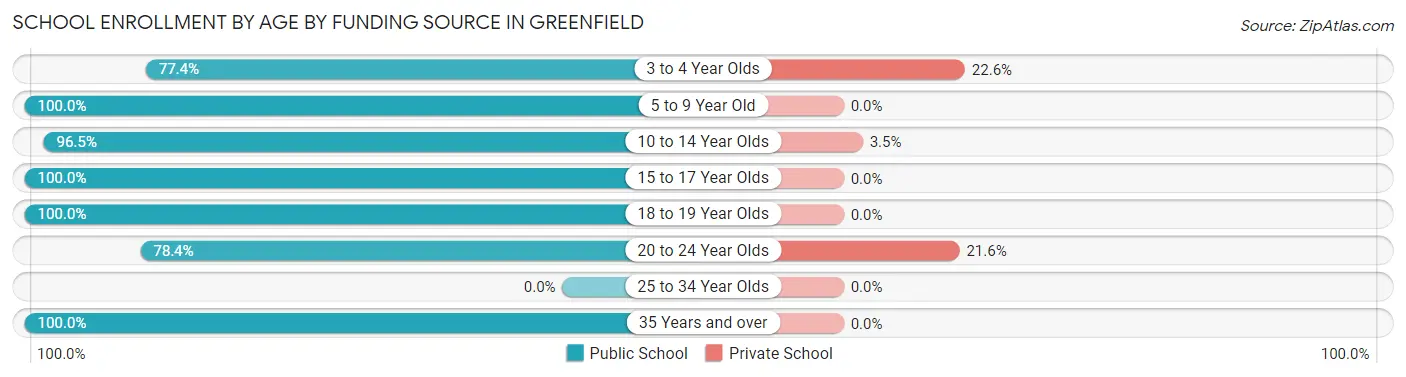
| Age Bracket | Public School | Private School |
| 3 to 4 Year Olds | 96 (77.4%) | 28 (22.6%) |
| 5 to 9 Year Old | 133 (100.0%) | 0 (0.0%) |
| 10 to 14 Year Olds | 218 (96.5%) | 8 (3.5%) |
| 15 to 17 Year Olds | 148 (100.0%) | 0 (0.0%) |
| 18 to 19 Year Olds | 51 (100.0%) | 0 (0.0%) |
| 20 to 24 Year Olds | 40 (78.4%) | 11 (21.6%) |
| 25 to 34 Year Olds | 0 (0.0%) | 0 (0.0%) |
| 35 Years and over | 50 (100.0%) | 0 (0.0%) |
| Total | 736 (94.0%) | 47 (6.0%) |
Educational Attainment by Field of Study in Greenfield
Bio, nature & agricultural (77 | 20.2%), business (70 | 18.4%), social sciences (53 | 13.9%), arts & humanities (41 | 10.8%), and science & technology (35 | 9.2%) are the most common fields of study among 381 individuals in Greenfield who have obtained a bachelor's degree or higher.
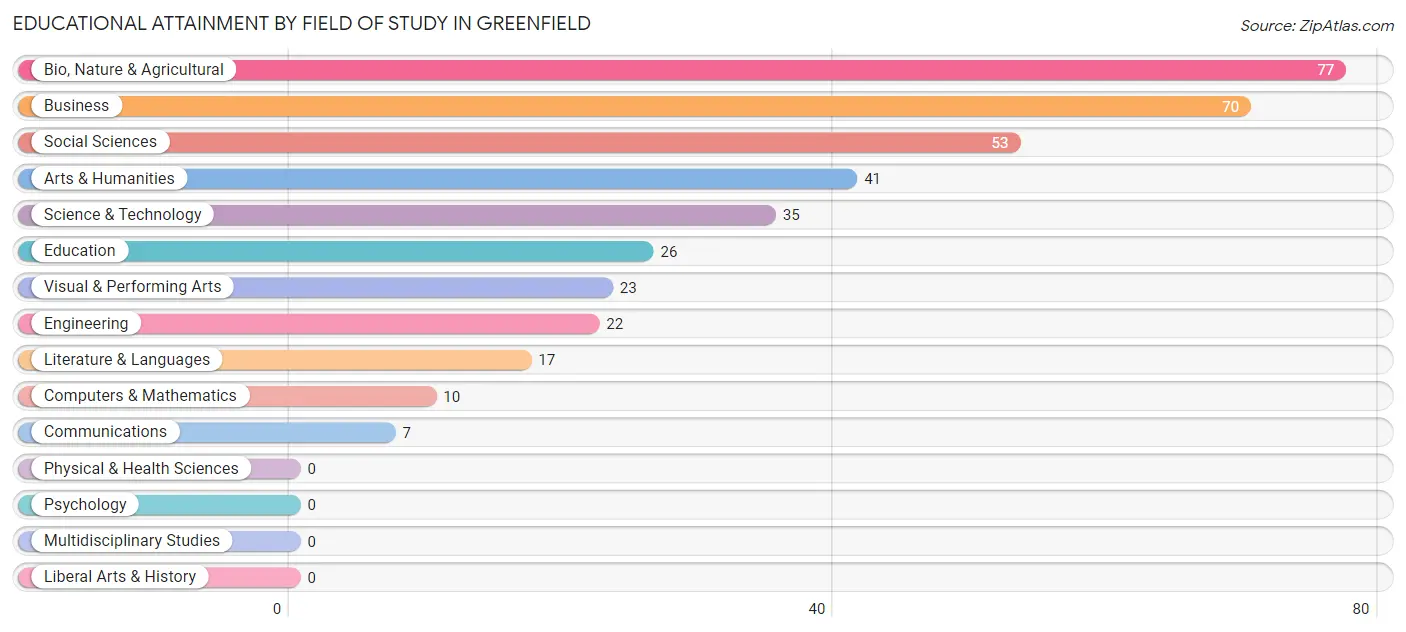
| Field of Study | # Graduates | % Graduates |
| Computers & Mathematics | 10 | 2.6% |
| Bio, Nature & Agricultural | 77 | 20.2% |
| Physical & Health Sciences | 0 | 0.0% |
| Psychology | 0 | 0.0% |
| Social Sciences | 53 | 13.9% |
| Engineering | 22 | 5.8% |
| Multidisciplinary Studies | 0 | 0.0% |
| Science & Technology | 35 | 9.2% |
| Business | 70 | 18.4% |
| Education | 26 | 6.8% |
| Literature & Languages | 17 | 4.5% |
| Liberal Arts & History | 0 | 0.0% |
| Visual & Performing Arts | 23 | 6.0% |
| Communications | 7 | 1.8% |
| Arts & Humanities | 41 | 10.8% |
| Total | 381 | 100.0% |
Transportation & Commute in Greenfield
Vehicle Availability by Sex in Greenfield
The most prevalent vehicle ownership categories in Greenfield are males with 2 vehicles (436, accounting for 47.9%) and females with 2 vehicles (311, making up 64.0%).
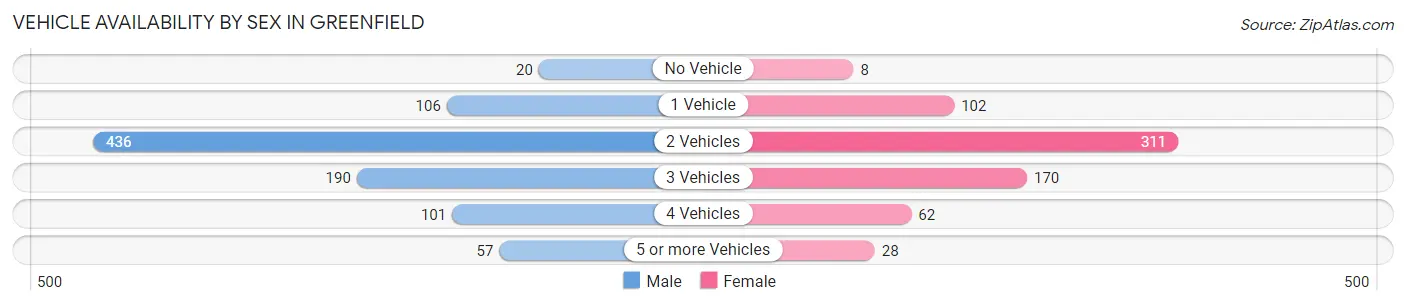
| Vehicles Available | Male | Female |
| No Vehicle | 20 (2.2%) | 8 (1.2%) |
| 1 Vehicle | 106 (11.7%) | 102 (15.0%) |
| 2 Vehicles | 436 (47.9%) | 311 (45.7%) |
| 3 Vehicles | 190 (20.9%) | 170 (25.0%) |
| 4 Vehicles | 101 (11.1%) | 62 (9.1%) |
| 5 or more Vehicles | 57 (6.3%) | 28 (4.1%) |
| Total | 910 (100.0%) | 681 (100.0%) |
Commute Time in Greenfield
The most frequently occuring commute durations in Greenfield are 5 to 9 minutes (305 commuters, 20.1%), 20 to 24 minutes (196 commuters, 12.9%), and less than 5 minutes (170 commuters, 11.2%).
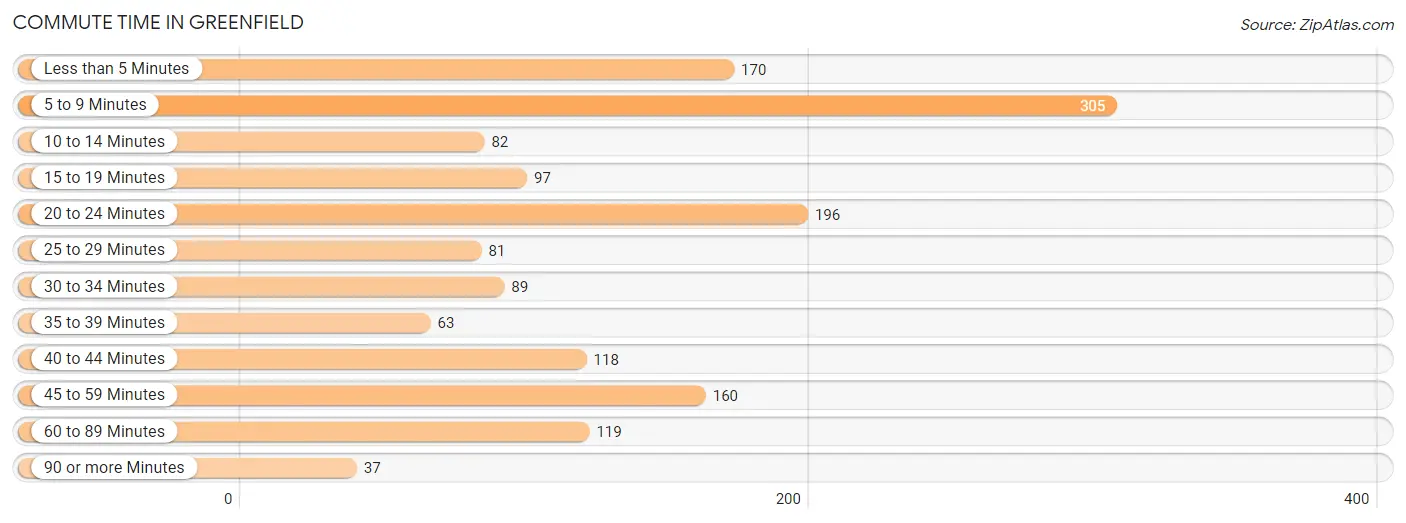
| Commute Time | # Commuters | % Commuters |
| Less than 5 Minutes | 170 | 11.2% |
| 5 to 9 Minutes | 305 | 20.1% |
| 10 to 14 Minutes | 82 | 5.4% |
| 15 to 19 Minutes | 97 | 6.4% |
| 20 to 24 Minutes | 196 | 12.9% |
| 25 to 29 Minutes | 81 | 5.3% |
| 30 to 34 Minutes | 89 | 5.9% |
| 35 to 39 Minutes | 63 | 4.2% |
| 40 to 44 Minutes | 118 | 7.8% |
| 45 to 59 Minutes | 160 | 10.5% |
| 60 to 89 Minutes | 119 | 7.8% |
| 90 or more Minutes | 37 | 2.4% |
Commute Time by Sex in Greenfield
The most common commute times in Greenfield are 5 to 9 minutes (139 commuters, 15.6%) for males and 5 to 9 minutes (166 commuters, 26.6%) for females.
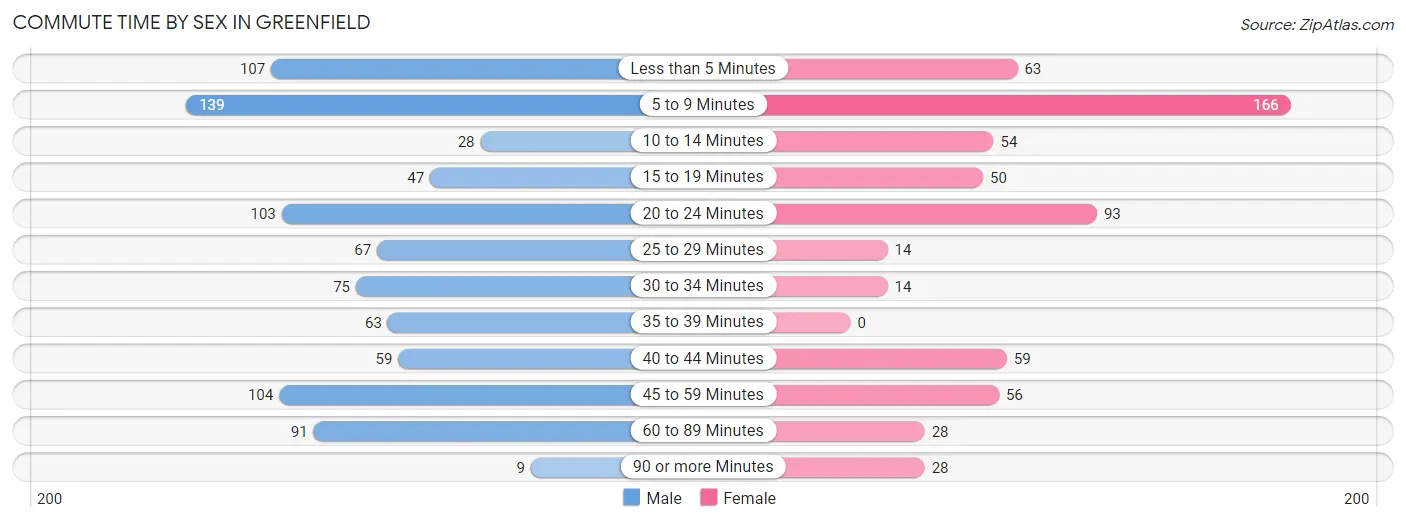
| Commute Time | Male | Female |
| Less than 5 Minutes | 107 (12.0%) | 63 (10.1%) |
| 5 to 9 Minutes | 139 (15.6%) | 166 (26.6%) |
| 10 to 14 Minutes | 28 (3.1%) | 54 (8.6%) |
| 15 to 19 Minutes | 47 (5.3%) | 50 (8.0%) |
| 20 to 24 Minutes | 103 (11.6%) | 93 (14.9%) |
| 25 to 29 Minutes | 67 (7.5%) | 14 (2.2%) |
| 30 to 34 Minutes | 75 (8.4%) | 14 (2.2%) |
| 35 to 39 Minutes | 63 (7.1%) | 0 (0.0%) |
| 40 to 44 Minutes | 59 (6.6%) | 59 (9.4%) |
| 45 to 59 Minutes | 104 (11.7%) | 56 (9.0%) |
| 60 to 89 Minutes | 91 (10.2%) | 28 (4.5%) |
| 90 or more Minutes | 9 (1.0%) | 28 (4.5%) |
Time of Departure to Work by Sex in Greenfield
The most frequent times of departure to work in Greenfield are 12:00 PM to 3:59 PM (138, 15.5%) for males and 6:30 AM to 6:59 AM (106, 17.0%) for females.
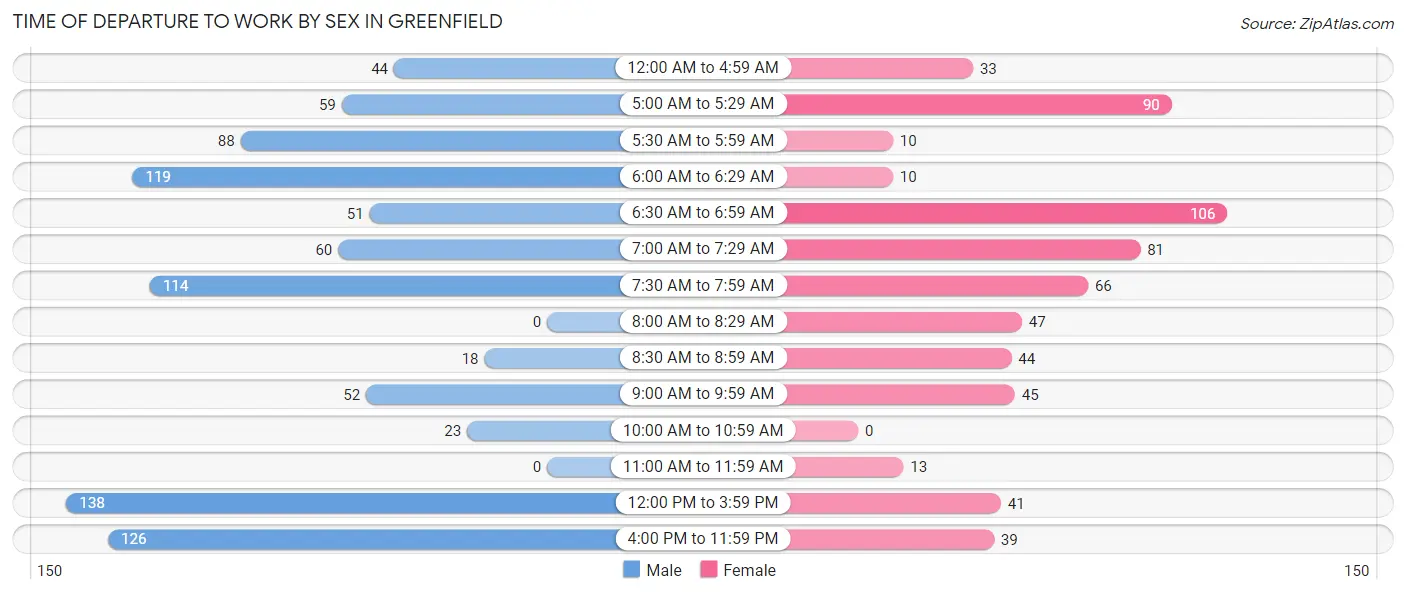
| Time of Departure | Male | Female |
| 12:00 AM to 4:59 AM | 44 (4.9%) | 33 (5.3%) |
| 5:00 AM to 5:29 AM | 59 (6.6%) | 90 (14.4%) |
| 5:30 AM to 5:59 AM | 88 (9.9%) | 10 (1.6%) |
| 6:00 AM to 6:29 AM | 119 (13.3%) | 10 (1.6%) |
| 6:30 AM to 6:59 AM | 51 (5.7%) | 106 (17.0%) |
| 7:00 AM to 7:29 AM | 60 (6.7%) | 81 (13.0%) |
| 7:30 AM to 7:59 AM | 114 (12.8%) | 66 (10.6%) |
| 8:00 AM to 8:29 AM | 0 (0.0%) | 47 (7.5%) |
| 8:30 AM to 8:59 AM | 18 (2.0%) | 44 (7.0%) |
| 9:00 AM to 9:59 AM | 52 (5.8%) | 45 (7.2%) |
| 10:00 AM to 10:59 AM | 23 (2.6%) | 0 (0.0%) |
| 11:00 AM to 11:59 AM | 0 (0.0%) | 13 (2.1%) |
| 12:00 PM to 3:59 PM | 138 (15.5%) | 41 (6.6%) |
| 4:00 PM to 11:59 PM | 126 (14.1%) | 39 (6.2%) |
| Total | 892 (100.0%) | 625 (100.0%) |
Housing Occupancy in Greenfield
Occupancy by Ownership in Greenfield
Of the total 1,705 dwellings in Greenfield, owner-occupied units account for 820 (48.1%), while renter-occupied units make up 885 (51.9%).
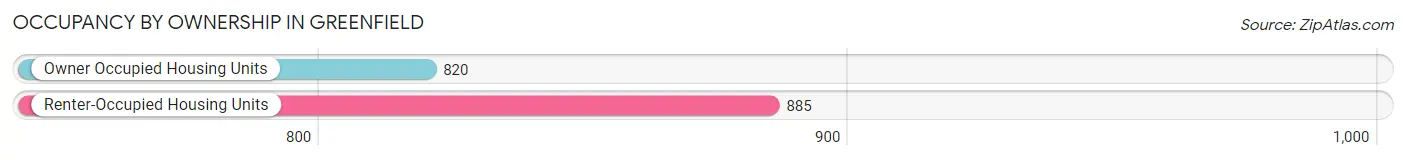
| Occupancy | # Housing Units | % Housing Units |
| Owner Occupied Housing Units | 820 | 48.1% |
| Renter-Occupied Housing Units | 885 | 51.9% |
| Total Occupied Housing Units | 1,705 | 100.0% |
Occupancy by Household Size in Greenfield
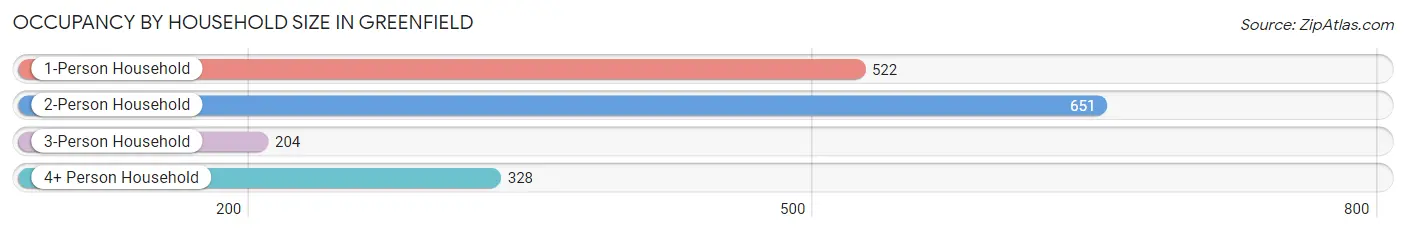
| Household Size | # Housing Units | % Housing Units |
| 1-Person Household | 522 | 30.6% |
| 2-Person Household | 651 | 38.2% |
| 3-Person Household | 204 | 12.0% |
| 4+ Person Household | 328 | 19.2% |
| Total Housing Units | 1,705 | 100.0% |
Occupancy by Ownership by Household Size in Greenfield
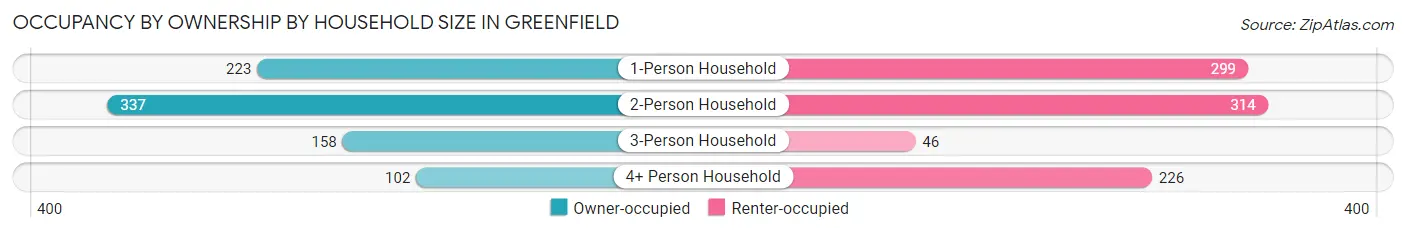
| Household Size | Owner-occupied | Renter-occupied |
| 1-Person Household | 223 (42.7%) | 299 (57.3%) |
| 2-Person Household | 337 (51.8%) | 314 (48.2%) |
| 3-Person Household | 158 (77.4%) | 46 (22.6%) |
| 4+ Person Household | 102 (31.1%) | 226 (68.9%) |
| Total Housing Units | 820 (48.1%) | 885 (51.9%) |
Occupancy by Educational Attainment in Greenfield
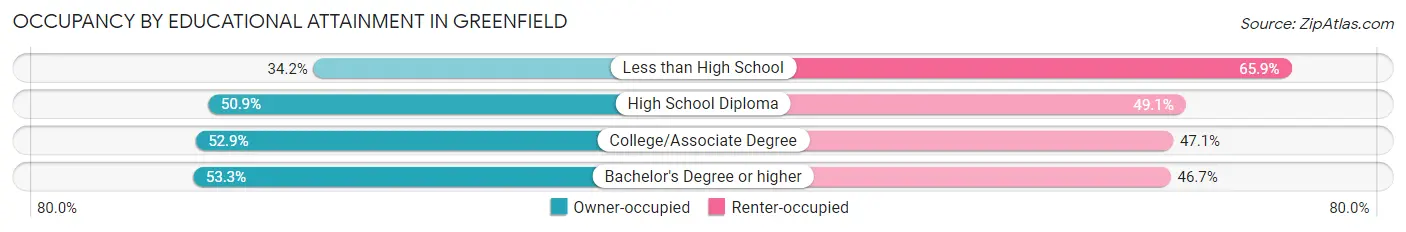
| Household Size | Owner-occupied | Renter-occupied |
| Less than High School | 126 (34.2%) | 243 (65.8%) |
| High School Diploma | 357 (50.9%) | 344 (49.1%) |
| College/Associate Degree | 208 (52.9%) | 185 (47.1%) |
| Bachelor's Degree or higher | 129 (53.3%) | 113 (46.7%) |
Occupancy by Age of Householder in Greenfield
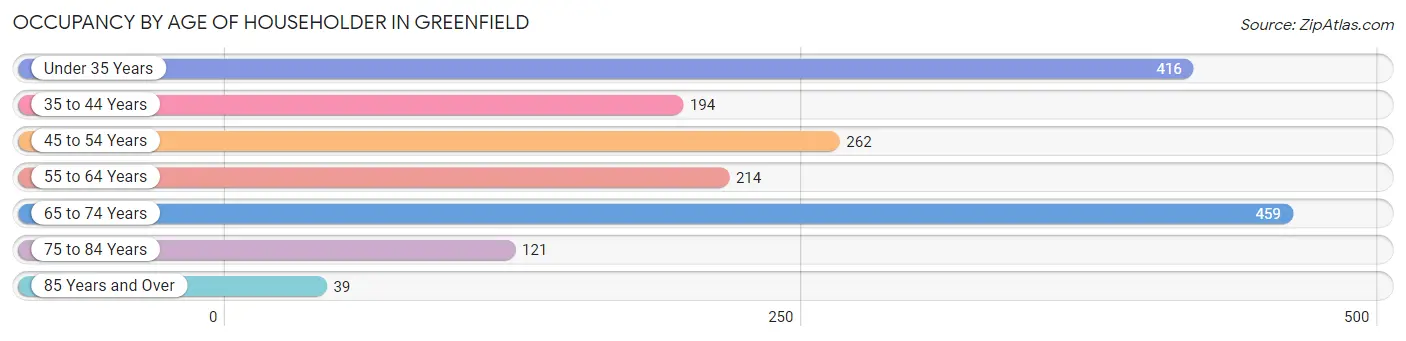
| Age Bracket | # Households | % Households |
| Under 35 Years | 416 | 24.4% |
| 35 to 44 Years | 194 | 11.4% |
| 45 to 54 Years | 262 | 15.4% |
| 55 to 64 Years | 214 | 12.6% |
| 65 to 74 Years | 459 | 26.9% |
| 75 to 84 Years | 121 | 7.1% |
| 85 Years and Over | 39 | 2.3% |
| Total | 1,705 | 100.0% |
Housing Finances in Greenfield
Median Income by Occupancy in Greenfield
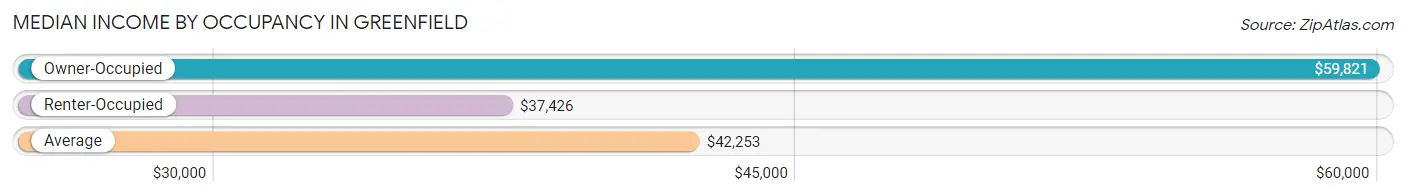
| Occupancy Type | # Households | Median Income |
| Owner-Occupied | 820 (48.1%) | $59,821 |
| Renter-Occupied | 885 (51.9%) | $37,426 |
| Average | 1,705 (100.0%) | $42,253 |
Occupancy by Householder Income Bracket in Greenfield
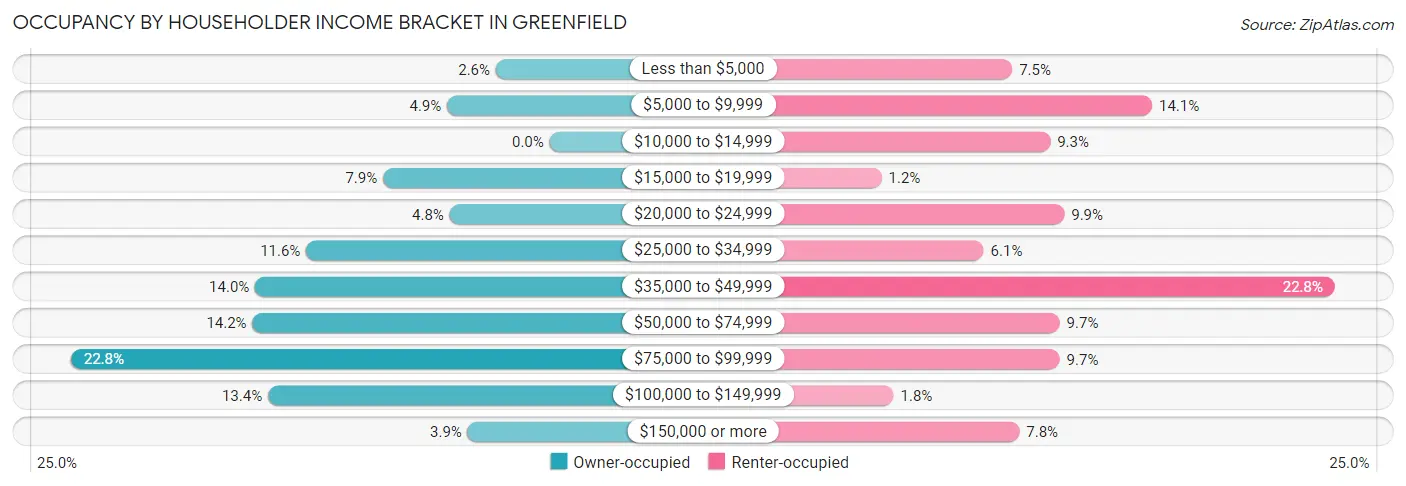
| Income Bracket | Owner-occupied | Renter-occupied |
| Less than $5,000 | 21 (2.6%) | 66 (7.5%) |
| $5,000 to $9,999 | 40 (4.9%) | 125 (14.1%) |
| $10,000 to $14,999 | 0 (0.0%) | 82 (9.3%) |
| $15,000 to $19,999 | 65 (7.9%) | 11 (1.2%) |
| $20,000 to $24,999 | 39 (4.8%) | 88 (9.9%) |
| $25,000 to $34,999 | 95 (11.6%) | 54 (6.1%) |
| $35,000 to $49,999 | 115 (14.0%) | 202 (22.8%) |
| $50,000 to $74,999 | 116 (14.1%) | 86 (9.7%) |
| $75,000 to $99,999 | 187 (22.8%) | 86 (9.7%) |
| $100,000 to $149,999 | 110 (13.4%) | 16 (1.8%) |
| $150,000 or more | 32 (3.9%) | 69 (7.8%) |
| Total | 820 (100.0%) | 885 (100.0%) |
Monthly Housing Cost Tiers in Greenfield
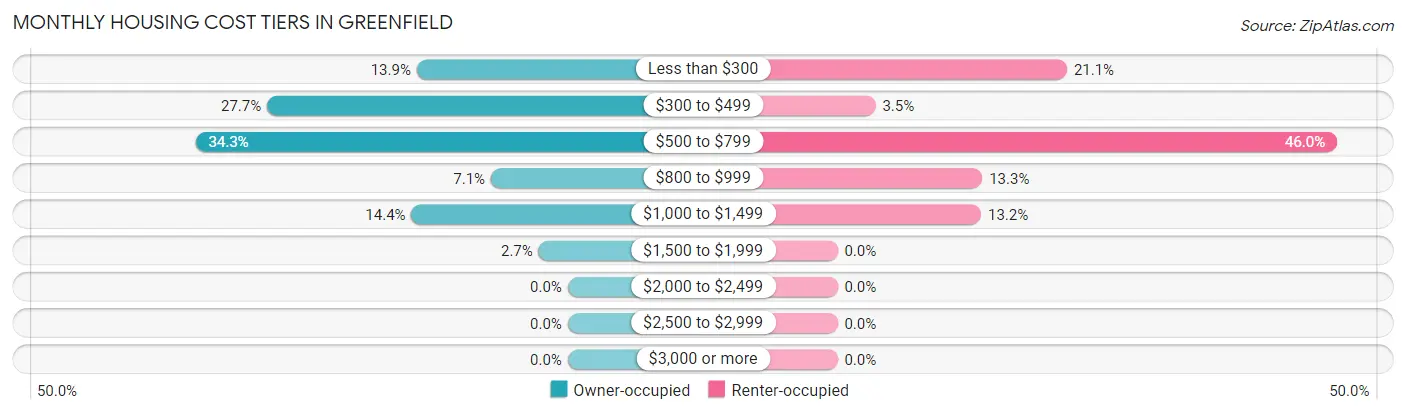
| Monthly Cost | Owner-occupied | Renter-occupied |
| Less than $300 | 114 (13.9%) | 187 (21.1%) |
| $300 to $499 | 227 (27.7%) | 31 (3.5%) |
| $500 to $799 | 281 (34.3%) | 407 (46.0%) |
| $800 to $999 | 58 (7.1%) | 118 (13.3%) |
| $1,000 to $1,499 | 118 (14.4%) | 117 (13.2%) |
| $1,500 to $1,999 | 22 (2.7%) | 0 (0.0%) |
| $2,000 to $2,499 | 0 (0.0%) | 0 (0.0%) |
| $2,500 to $2,999 | 0 (0.0%) | 0 (0.0%) |
| $3,000 or more | 0 (0.0%) | 0 (0.0%) |
| Total | 820 (100.0%) | 885 (100.0%) |
Physical Housing Characteristics in Greenfield
Housing Structures in Greenfield
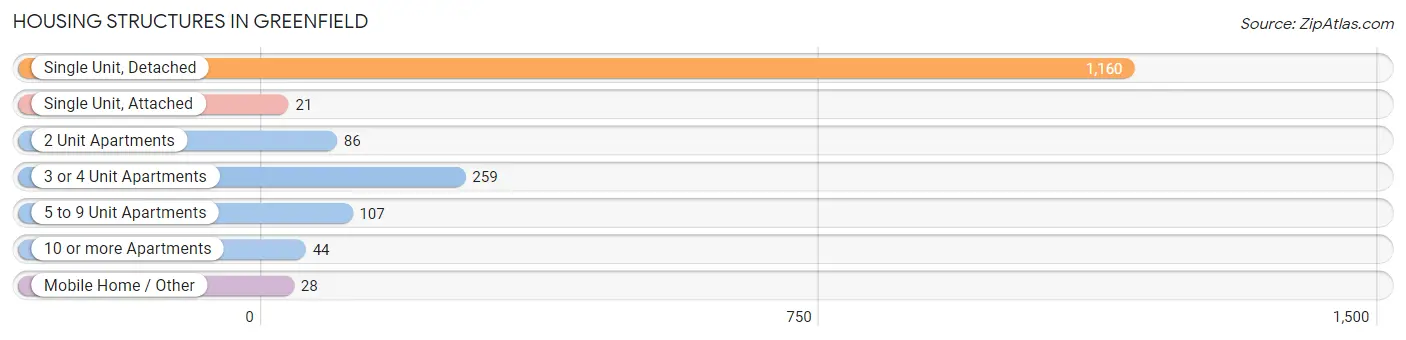
| Structure Type | # Housing Units | % Housing Units |
| Single Unit, Detached | 1,160 | 68.0% |
| Single Unit, Attached | 21 | 1.2% |
| 2 Unit Apartments | 86 | 5.0% |
| 3 or 4 Unit Apartments | 259 | 15.2% |
| 5 to 9 Unit Apartments | 107 | 6.3% |
| 10 or more Apartments | 44 | 2.6% |
| Mobile Home / Other | 28 | 1.6% |
| Total | 1,705 | 100.0% |
Housing Structures by Occupancy in Greenfield
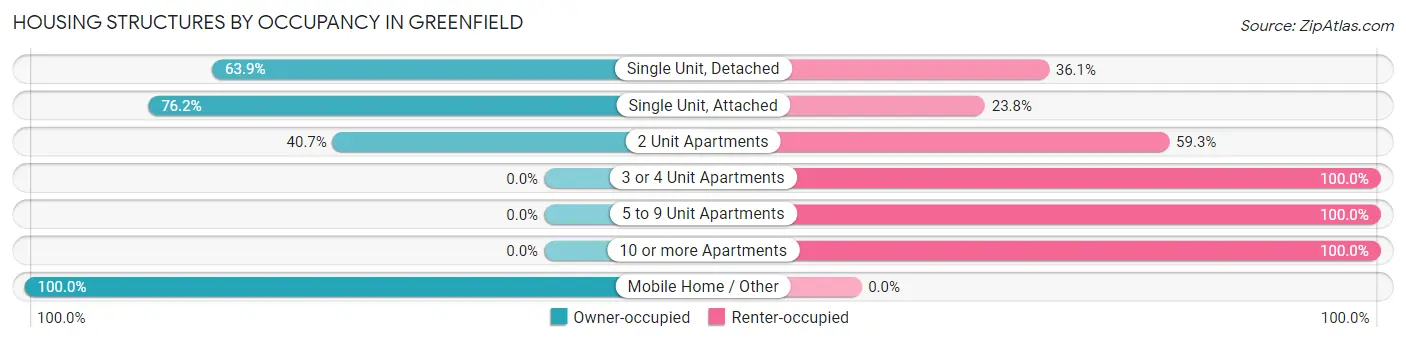
| Structure Type | Owner-occupied | Renter-occupied |
| Single Unit, Detached | 741 (63.9%) | 419 (36.1%) |
| Single Unit, Attached | 16 (76.2%) | 5 (23.8%) |
| 2 Unit Apartments | 35 (40.7%) | 51 (59.3%) |
| 3 or 4 Unit Apartments | 0 (0.0%) | 259 (100.0%) |
| 5 to 9 Unit Apartments | 0 (0.0%) | 107 (100.0%) |
| 10 or more Apartments | 0 (0.0%) | 44 (100.0%) |
| Mobile Home / Other | 28 (100.0%) | 0 (0.0%) |
| Total | 820 (48.1%) | 885 (51.9%) |
Housing Structures by Number of Rooms in Greenfield
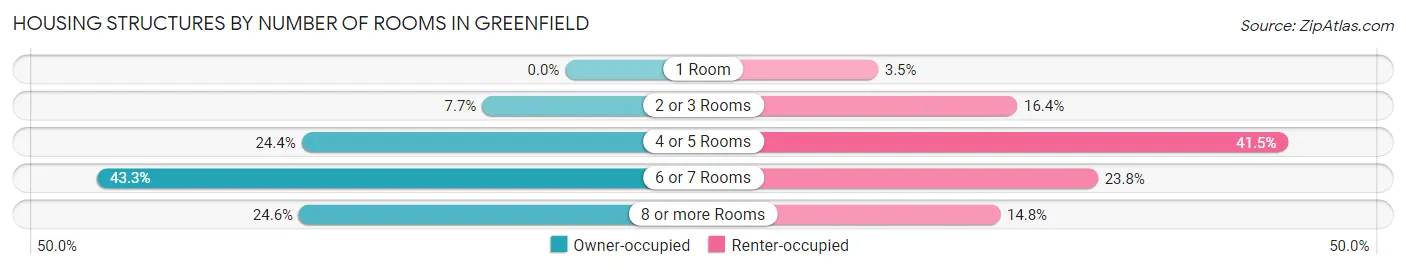
| Number of Rooms | Owner-occupied | Renter-occupied |
| 1 Room | 0 (0.0%) | 31 (3.5%) |
| 2 or 3 Rooms | 63 (7.7%) | 145 (16.4%) |
| 4 or 5 Rooms | 200 (24.4%) | 367 (41.5%) |
| 6 or 7 Rooms | 355 (43.3%) | 211 (23.8%) |
| 8 or more Rooms | 202 (24.6%) | 131 (14.8%) |
| Total | 820 (100.0%) | 885 (100.0%) |
Housing Structure by Heating Type in Greenfield
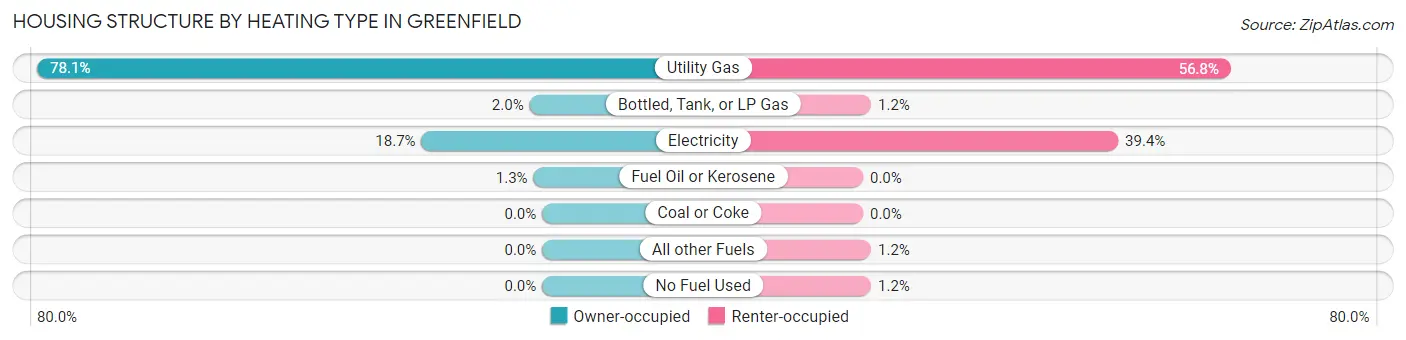
| Heating Type | Owner-occupied | Renter-occupied |
| Utility Gas | 640 (78.0%) | 503 (56.8%) |
| Bottled, Tank, or LP Gas | 16 (1.9%) | 11 (1.2%) |
| Electricity | 153 (18.7%) | 349 (39.4%) |
| Fuel Oil or Kerosene | 11 (1.3%) | 0 (0.0%) |
| Coal or Coke | 0 (0.0%) | 0 (0.0%) |
| All other Fuels | 0 (0.0%) | 11 (1.2%) |
| No Fuel Used | 0 (0.0%) | 11 (1.2%) |
| Total | 820 (100.0%) | 885 (100.0%) |
Household Vehicle Usage in Greenfield
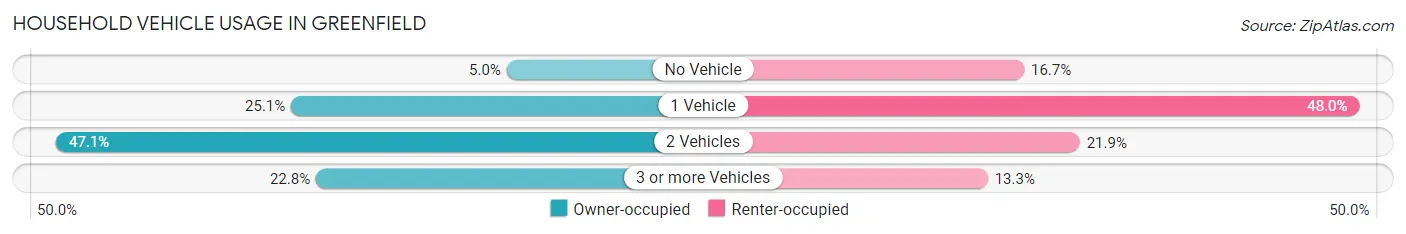
| Vehicles per Household | Owner-occupied | Renter-occupied |
| No Vehicle | 41 (5.0%) | 148 (16.7%) |
| 1 Vehicle | 206 (25.1%) | 425 (48.0%) |
| 2 Vehicles | 386 (47.1%) | 194 (21.9%) |
| 3 or more Vehicles | 187 (22.8%) | 118 (13.3%) |
| Total | 820 (100.0%) | 885 (100.0%) |
Real Estate & Mortgages in Greenfield
Real Estate and Mortgage Overview in Greenfield
| Characteristic | Without Mortgage | With Mortgage |
| Housing Units | 412 | 408 |
| Median Property Value | $96,000 | $88,500 |
| Median Household Income | $42,344 | $16 |
| Monthly Housing Costs | $367 | $0 |
| Real Estate Taxes | $762 | $11 |
Property Value by Mortgage Status in Greenfield
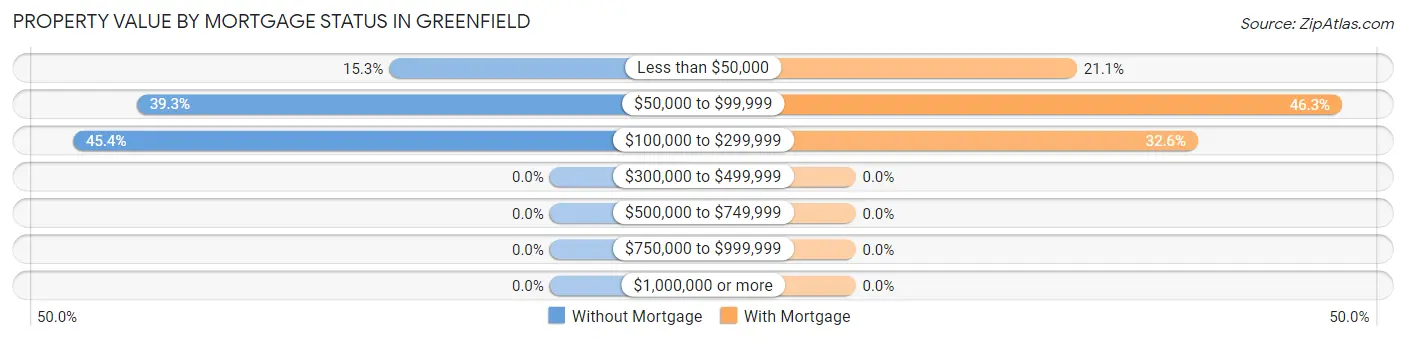
| Property Value | Without Mortgage | With Mortgage |
| Less than $50,000 | 63 (15.3%) | 86 (21.1%) |
| $50,000 to $99,999 | 162 (39.3%) | 189 (46.3%) |
| $100,000 to $299,999 | 187 (45.4%) | 133 (32.6%) |
| $300,000 to $499,999 | 0 (0.0%) | 0 (0.0%) |
| $500,000 to $749,999 | 0 (0.0%) | 0 (0.0%) |
| $750,000 to $999,999 | 0 (0.0%) | 0 (0.0%) |
| $1,000,000 or more | 0 (0.0%) | 0 (0.0%) |
| Total | 412 (100.0%) | 408 (100.0%) |
Household Income by Mortgage Status in Greenfield
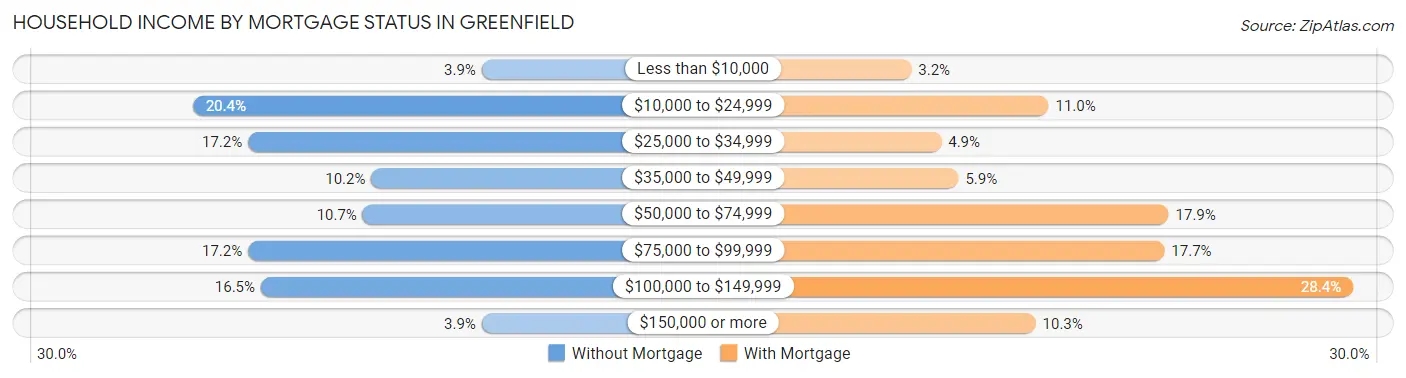
| Household Income | Without Mortgage | With Mortgage |
| Less than $10,000 | 16 (3.9%) | 13 (3.2%) |
| $10,000 to $24,999 | 84 (20.4%) | 45 (11.0%) |
| $25,000 to $34,999 | 71 (17.2%) | 20 (4.9%) |
| $35,000 to $49,999 | 42 (10.2%) | 24 (5.9%) |
| $50,000 to $74,999 | 44 (10.7%) | 73 (17.9%) |
| $75,000 to $99,999 | 71 (17.2%) | 72 (17.6%) |
| $100,000 to $149,999 | 68 (16.5%) | 116 (28.4%) |
| $150,000 or more | 16 (3.9%) | 42 (10.3%) |
| Total | 412 (100.0%) | 408 (100.0%) |
Property Value to Household Income Ratio in Greenfield
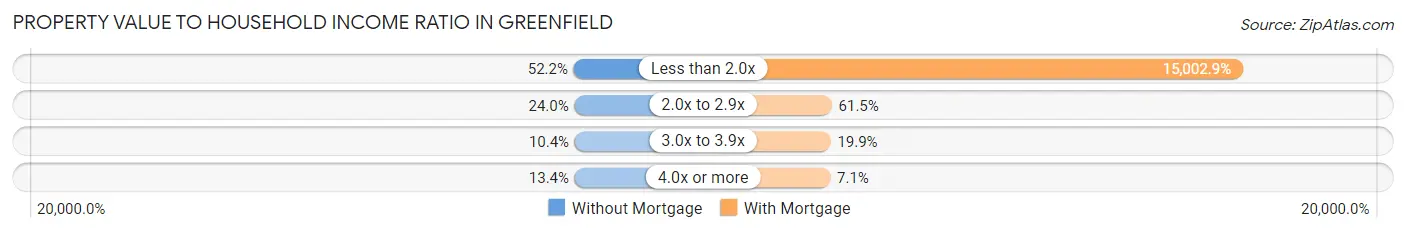
| Value-to-Income Ratio | Without Mortgage | With Mortgage |
| Less than 2.0x | 215 (52.2%) | 61,212 (15,002.9%) |
| 2.0x to 2.9x | 99 (24.0%) | 251 (61.5%) |
| 3.0x to 3.9x | 43 (10.4%) | 81 (19.9%) |
| 4.0x or more | 55 (13.4%) | 29 (7.1%) |
| Total | 412 (100.0%) | 408 (100.0%) |
Real Estate Taxes by Mortgage Status in Greenfield
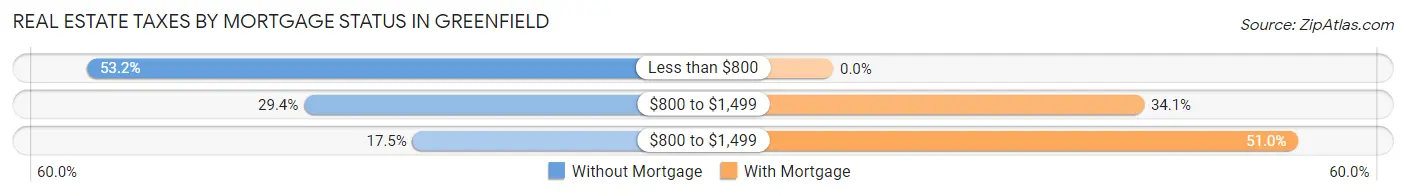
| Property Taxes | Without Mortgage | With Mortgage |
| Less than $800 | 219 (53.2%) | 0 (0.0%) |
| $800 to $1,499 | 121 (29.4%) | 139 (34.1%) |
| $800 to $1,499 | 72 (17.5%) | 208 (51.0%) |
| Total | 412 (100.0%) | 408 (100.0%) |
Health & Disability in Greenfield
Health Insurance Coverage by Age in Greenfield
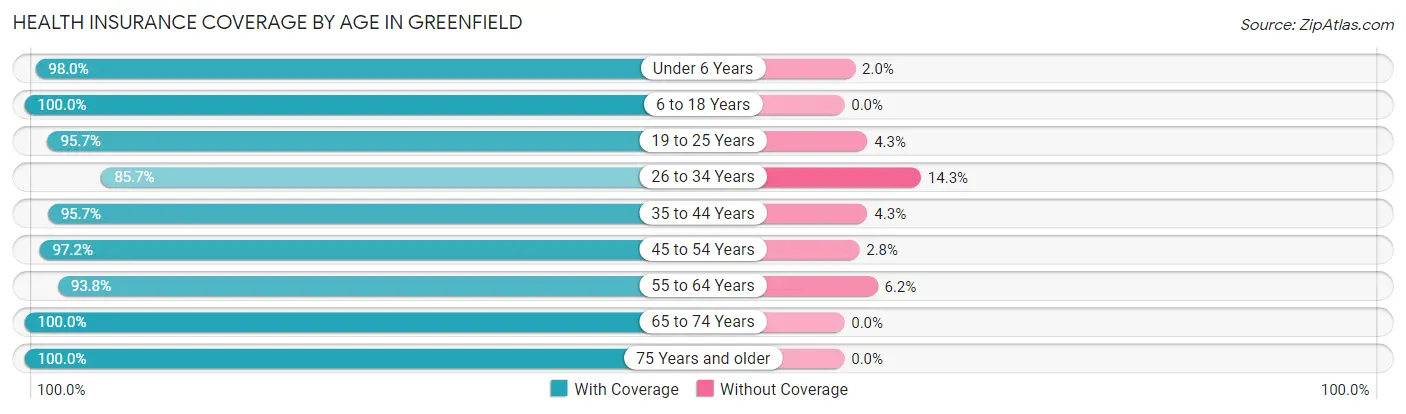
| Age Bracket | With Coverage | Without Coverage |
| Under 6 Years | 439 (98.0%) | 9 (2.0%) |
| 6 to 18 Years | 587 (100.0%) | 0 (0.0%) |
| 19 to 25 Years | 426 (95.7%) | 19 (4.3%) |
| 26 to 34 Years | 414 (85.7%) | 69 (14.3%) |
| 35 to 44 Years | 444 (95.7%) | 20 (4.3%) |
| 45 to 54 Years | 418 (97.2%) | 12 (2.8%) |
| 55 to 64 Years | 439 (93.8%) | 29 (6.2%) |
| 65 to 74 Years | 632 (100.0%) | 0 (0.0%) |
| 75 Years and older | 178 (100.0%) | 0 (0.0%) |
| Total | 3,977 (96.2%) | 158 (3.8%) |
Health Insurance Coverage by Citizenship Status in Greenfield
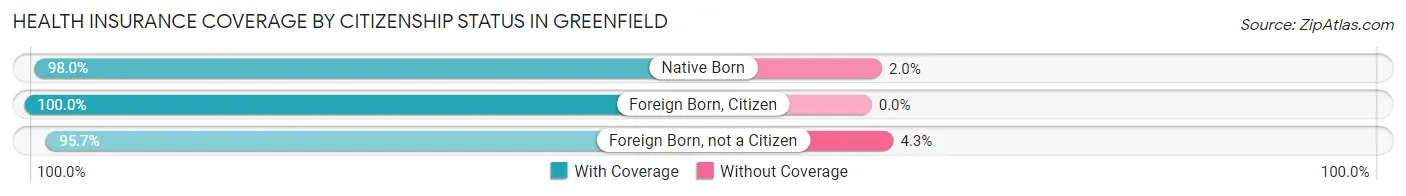
| Citizenship Status | With Coverage | Without Coverage |
| Native Born | 439 (98.0%) | 9 (2.0%) |
| Foreign Born, Citizen | 587 (100.0%) | 0 (0.0%) |
| Foreign Born, not a Citizen | 426 (95.7%) | 19 (4.3%) |
Health Insurance Coverage by Household Income in Greenfield
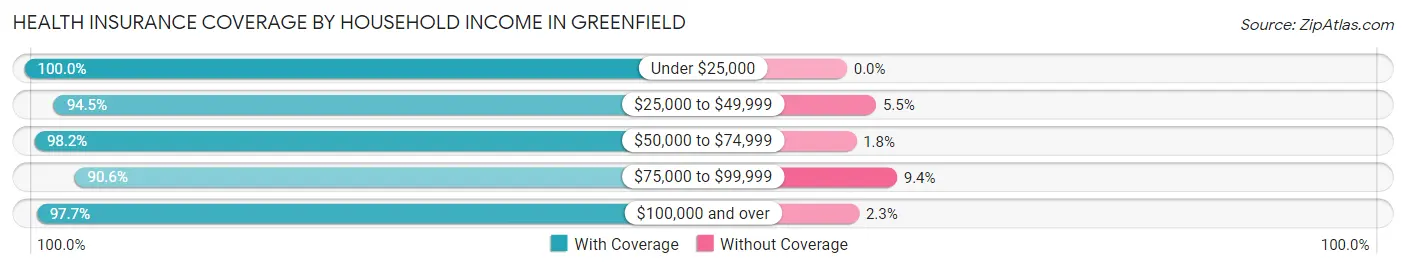
| Household Income | With Coverage | Without Coverage |
| Under $25,000 | 982 (100.0%) | 0 (0.0%) |
| $25,000 to $49,999 | 1,021 (94.5%) | 59 (5.5%) |
| $50,000 to $74,999 | 557 (98.2%) | 10 (1.8%) |
| $75,000 to $99,999 | 706 (90.6%) | 73 (9.4%) |
| $100,000 and over | 686 (97.7%) | 16 (2.3%) |
Public vs Private Health Insurance Coverage by Age in Greenfield
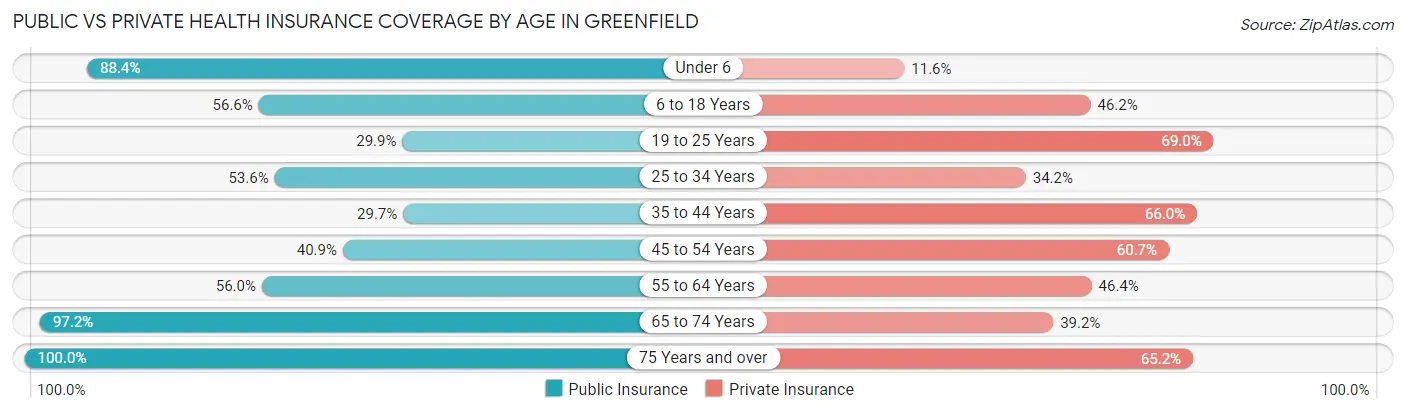
| Age Bracket | Public Insurance | Private Insurance |
| Under 6 | 396 (88.4%) | 52 (11.6%) |
| 6 to 18 Years | 332 (56.6%) | 271 (46.2%) |
| 19 to 25 Years | 133 (29.9%) | 307 (69.0%) |
| 25 to 34 Years | 259 (53.6%) | 165 (34.2%) |
| 35 to 44 Years | 138 (29.7%) | 306 (65.9%) |
| 45 to 54 Years | 176 (40.9%) | 261 (60.7%) |
| 55 to 64 Years | 262 (56.0%) | 217 (46.4%) |
| 65 to 74 Years | 614 (97.2%) | 248 (39.2%) |
| 75 Years and over | 178 (100.0%) | 116 (65.2%) |
| Total | 2,488 (60.2%) | 1,943 (47.0%) |
Disability Status by Sex by Age in Greenfield
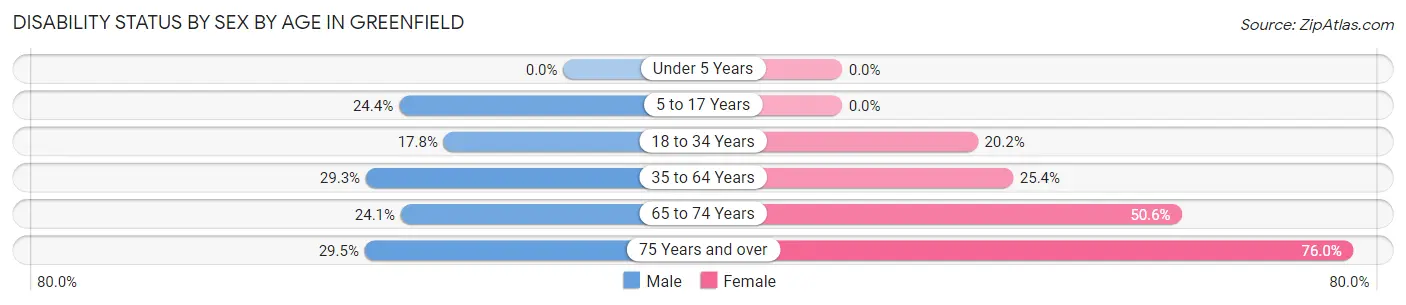
| Age Bracket | Male | Female |
| Under 5 Years | 0 (0.0%) | 0 (0.0%) |
| 5 to 17 Years | 52 (24.4%) | 0 (0.0%) |
| 18 to 34 Years | 73 (17.8%) | 111 (20.2%) |
| 35 to 64 Years | 217 (29.3%) | 158 (25.4%) |
| 65 to 74 Years | 69 (24.1%) | 175 (50.6%) |
| 75 Years and over | 23 (29.5%) | 76 (76.0%) |
Disability Class by Sex by Age in Greenfield
Disability Class: Hearing Difficulty
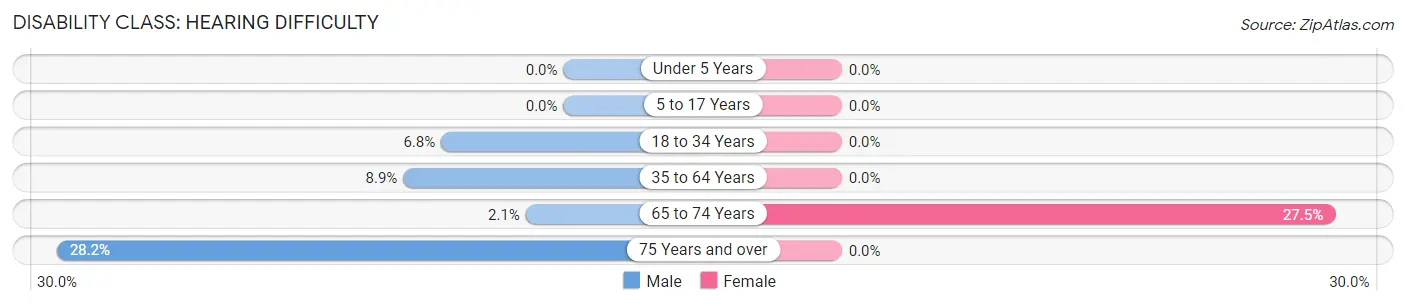
| Age Bracket | Male | Female |
| Under 5 Years | 0 (0.0%) | 0 (0.0%) |
| 5 to 17 Years | 0 (0.0%) | 0 (0.0%) |
| 18 to 34 Years | 28 (6.8%) | 0 (0.0%) |
| 35 to 64 Years | 66 (8.9%) | 0 (0.0%) |
| 65 to 74 Years | 6 (2.1%) | 95 (27.5%) |
| 75 Years and over | 22 (28.2%) | 0 (0.0%) |
Disability Class: Vision Difficulty
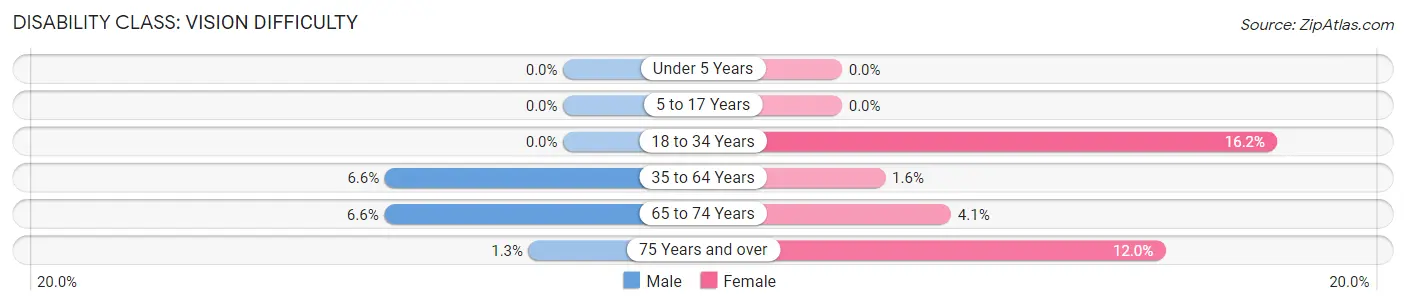
| Age Bracket | Male | Female |
| Under 5 Years | 0 (0.0%) | 0 (0.0%) |
| 5 to 17 Years | 0 (0.0%) | 0 (0.0%) |
| 18 to 34 Years | 0 (0.0%) | 89 (16.2%) |
| 35 to 64 Years | 49 (6.6%) | 10 (1.6%) |
| 65 to 74 Years | 19 (6.6%) | 14 (4.1%) |
| 75 Years and over | 1 (1.3%) | 12 (12.0%) |
Disability Class: Cognitive Difficulty
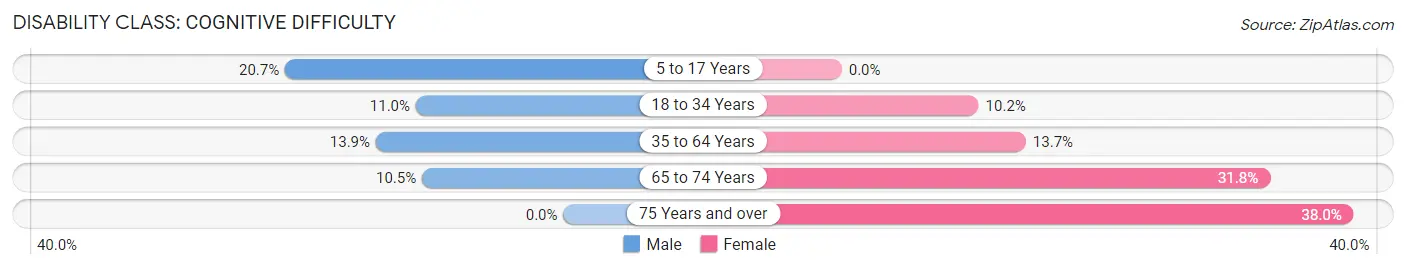
| Age Bracket | Male | Female |
| 5 to 17 Years | 44 (20.7%) | 0 (0.0%) |
| 18 to 34 Years | 45 (11.0%) | 56 (10.2%) |
| 35 to 64 Years | 103 (13.9%) | 85 (13.7%) |
| 65 to 74 Years | 30 (10.5%) | 110 (31.8%) |
| 75 Years and over | 0 (0.0%) | 38 (38.0%) |
Disability Class: Ambulatory Difficulty
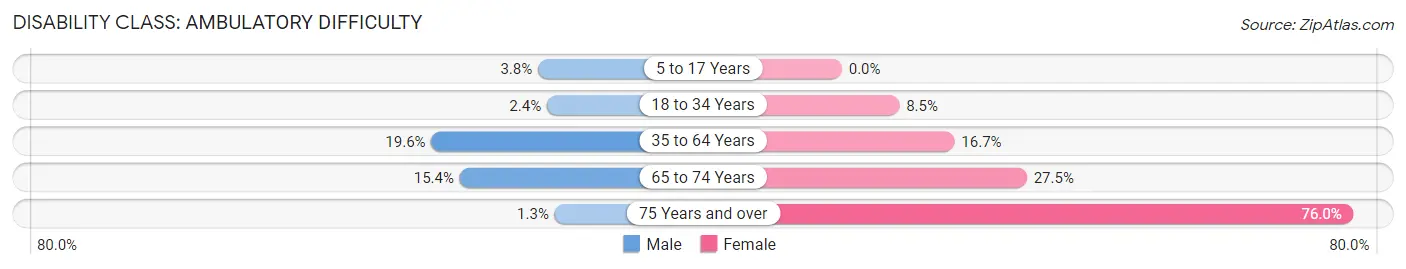
| Age Bracket | Male | Female |
| 5 to 17 Years | 8 (3.8%) | 0 (0.0%) |
| 18 to 34 Years | 10 (2.4%) | 47 (8.5%) |
| 35 to 64 Years | 145 (19.6%) | 104 (16.7%) |
| 65 to 74 Years | 44 (15.4%) | 95 (27.5%) |
| 75 Years and over | 1 (1.3%) | 76 (76.0%) |
Disability Class: Self-Care Difficulty
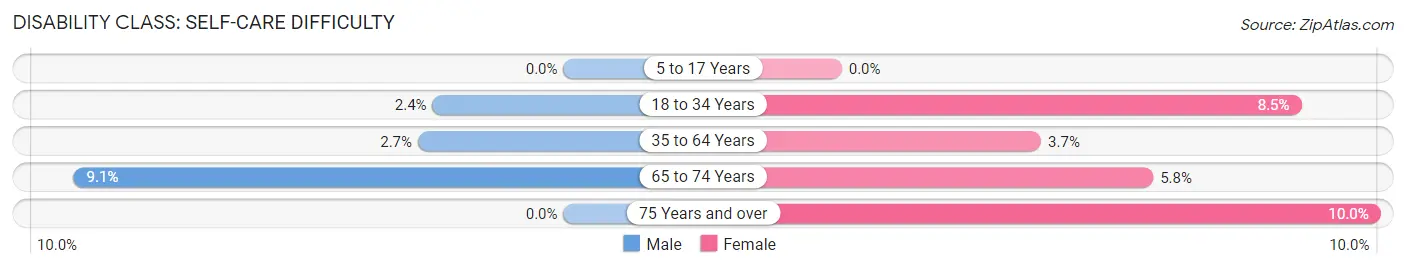
| Age Bracket | Male | Female |
| 5 to 17 Years | 0 (0.0%) | 0 (0.0%) |
| 18 to 34 Years | 10 (2.4%) | 47 (8.5%) |
| 35 to 64 Years | 20 (2.7%) | 23 (3.7%) |
| 65 to 74 Years | 26 (9.1%) | 20 (5.8%) |
| 75 Years and over | 0 (0.0%) | 10 (10.0%) |
Technology Access in Greenfield
Computing Device Access in Greenfield
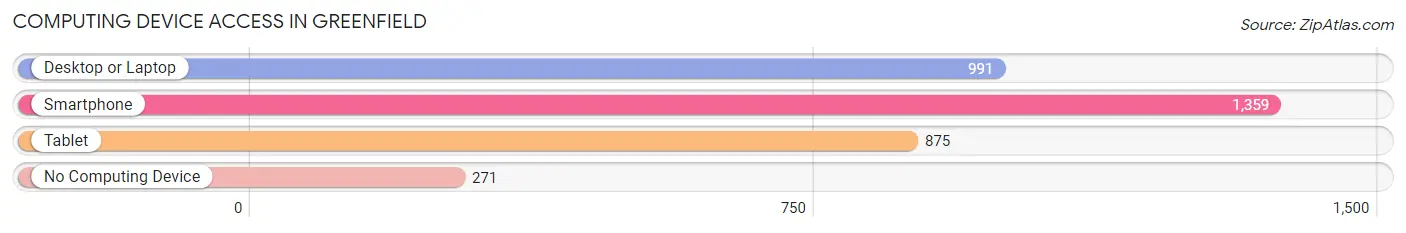
| Device Type | # Households | % Households |
| Desktop or Laptop | 991 | 58.1% |
| Smartphone | 1,359 | 79.7% |
| Tablet | 875 | 51.3% |
| No Computing Device | 271 | 15.9% |
| Total | 1,705 | 100.0% |
Internet Access in Greenfield
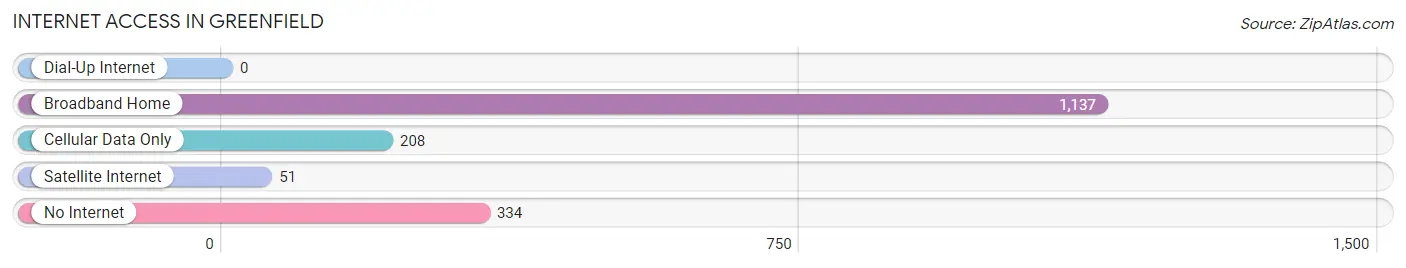
| Internet Type | # Households | % Households |
| Dial-Up Internet | 0 | 0.0% |
| Broadband Home | 1,137 | 66.7% |
| Cellular Data Only | 208 | 12.2% |
| Satellite Internet | 51 | 3.0% |
| No Internet | 334 | 19.6% |
| Total | 1,705 | 100.0% |
Greenfield Summary
Greenfield, Ohio is a small city located in the southeastern part of the state, in Highland County. It is situated along the banks of the Little Miami River, and is part of the Cincinnati metropolitan area. The city has a population of approximately 8,000 people, and is the county seat of Highland County.
History
Greenfield was founded in 1810 by a group of settlers from Pennsylvania. The town was named after Greenfield Township, which was named after the green fields that surrounded the area. The town was incorporated in 1817, and the first post office was established in 1818.
The town grew slowly, but steadily, and by the mid-1800s, it had become a thriving agricultural center. The town was also home to several mills, including a woolen mill, a flour mill, and a sawmill.
In the late 1800s, the town began to experience a period of industrial growth. The first railroad line was built in 1881, and the town soon became a hub for the surrounding area. The town also became a center for the production of furniture, and several furniture factories were established in the area.
In the early 1900s, the town experienced a period of decline. The furniture industry began to decline, and the railroad line was abandoned. The town also suffered from a series of floods, which caused significant damage to the town.
In the late 1900s, the town began to experience a period of revitalization. The furniture industry was revived, and the town began to attract new businesses. The town also began to attract new residents, and the population began to grow.
Geography
Greenfield is located in the southeastern part of the state, in Highland County. It is situated along the banks of the Little Miami River, and is part of the Cincinnati metropolitan area. The city has a total area of 4.2 square miles, all of which is land.
The city is located in a hilly region, and the terrain is mostly flat. The city is located in a humid continental climate zone, and the average temperature in the summer is around 75 degrees Fahrenheit. The average temperature in the winter is around 35 degrees Fahrenheit.
Economy
Greenfield’s economy is largely based on agriculture and manufacturing. The city is home to several furniture factories, and the furniture industry is a major employer in the area. The city is also home to several small businesses, including restaurants, retail stores, and service providers.
The city is also home to several educational institutions, including a community college and a vocational school. The city is also home to several medical facilities, including a hospital and several clinics.
Demographics
As of the 2010 census, the population of Greenfield was 8,000 people. The racial makeup of the city was 95.3% White, 1.2% African American, 0.3% Native American, 0.7% Asian, 0.1% Pacific Islander, 0.7% from other races, and 1.9% from two or more races. Hispanic or Latino of any race were 2.2% of the population.
The median income for a household in the city was $37,500, and the median income for a family was $45,000. The per capita income for the city was $19,000. About 15.3% of the population was below the poverty line.
Common Questions
What is Per Capita Income in Greenfield?
Per Capita income in Greenfield is $22,162.
What is the Median Family Income in Greenfield?
Median Family Income in Greenfield is $53,201.
What is the Median Household income in Greenfield?
Median Household Income in Greenfield is $42,253.
What is Income or Wage Gap in Greenfield?
Income or Wage Gap in Greenfield is 24.7%.
Women in Greenfield earn 75.3 cents for every dollar earned by a man.
What is Inequality or Gini Index in Greenfield?
Inequality or Gini Index in Greenfield is 0.44.
What is the Total Population of Greenfield?
Total Population of Greenfield is 4,237.
What is the Total Male Population of Greenfield?
Total Male Population of Greenfield is 2,020.
What is the Total Female Population of Greenfield?
Total Female Population of Greenfield is 2,217.
What is the Ratio of Males per 100 Females in Greenfield?
There are 91.11 Males per 100 Females in Greenfield.
What is the Ratio of Females per 100 Males in Greenfield?
There are 109.75 Females per 100 Males in Greenfield.
What is the Median Population Age in Greenfield?
Median Population Age in Greenfield is 37.9 Years.
What is the Average Family Size in Greenfield
Average Family Size in Greenfield is 2.9 People.
What is the Average Household Size in Greenfield
Average Household Size in Greenfield is 2.4 People.
How Large is the Labor Force in Greenfield?
There are 1,765 People in the Labor Forcein in Greenfield.
What is the Percentage of People in the Labor Force in Greenfield?
53.0% of People are in the Labor Force in Greenfield.
What is the Unemployment Rate in Greenfield?
Unemployment Rate in Greenfield is 6.6%.