Green Springs, OH Map & Demographics
Green Springs Map
Green Springs Overview
$30,439
PER CAPITA INCOME
$64,643
AVG FAMILY INCOME
$72,861
AVG HOUSEHOLD INCOME
37.1%
WAGE / INCOME GAP [ % ]
62.9¢/ $1
WAGE / INCOME GAP [ $ ]
0.33
INEQUALITY / GINI INDEX
1,309
TOTAL POPULATION
665
MALE POPULATION
644
FEMALE POPULATION
103.26
MALES / 100 FEMALES
96.84
FEMALES / 100 MALES
37.8
MEDIAN AGE
2.9
AVG FAMILY SIZE
2.5
AVG HOUSEHOLD SIZE
701
LABOR FORCE [ PEOPLE ]
66.6%
PERCENT IN LABOR FORCE
2.1%
UNEMPLOYMENT RATE
Green Springs Zip Codes
Income in Green Springs
Income Overview in Green Springs
Per Capita Income in Green Springs is $30,439, while median incomes of families and households are $64,643 and $72,861 respectively.
| Characteristic | Number | Measure |
| Per Capita Income | 1,309 | $30,439 |
| Median Family Income | 318 | $64,643 |
| Mean Family Income | 318 | $79,626 |
| Median Household Income | 489 | $72,861 |
| Mean Household Income | 489 | $77,631 |
| Income Deficit | 318 | $0 |
| Wage / Income Gap (%) | 1,309 | 37.15% |
| Wage / Income Gap ($) | 1,309 | 62.85¢ per $1 |
| Gini / Inequality Index | 1,309 | 0.33 |
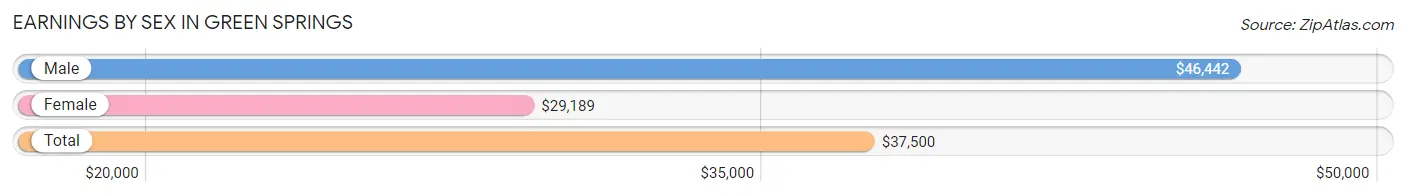
Earnings by Sex in Green Springs
Average Earnings in Green Springs are $37,500, $46,442 for men and $29,189 for women, a difference of 37.1%.
| Sex | Number | Average Earnings |
| Male | 426 (58.2%) | $46,442 |
| Female | 306 (41.8%) | $29,189 |
| Total | 732 (100.0%) | $37,500 |
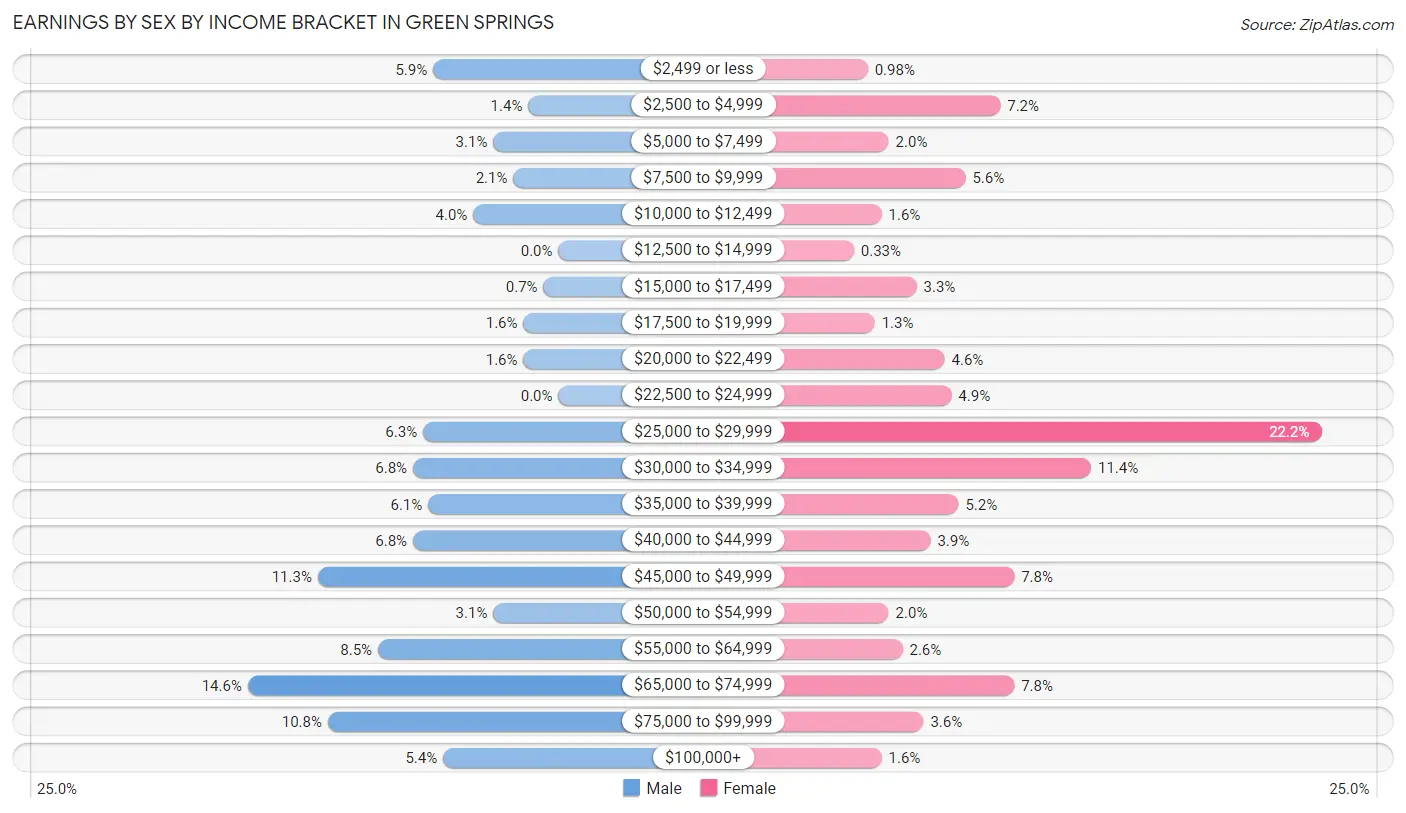
Earnings by Sex by Income Bracket in Green Springs
The most common earnings brackets in Green Springs are $65,000 to $74,999 for men (62 | 14.5%) and $25,000 to $29,999 for women (68 | 22.2%).
| Income | Male | Female |
| $2,499 or less | 25 (5.9%) | 3 (1.0%) |
| $2,500 to $4,999 | 6 (1.4%) | 22 (7.2%) |
| $5,000 to $7,499 | 13 (3.0%) | 6 (2.0%) |
| $7,500 to $9,999 | 9 (2.1%) | 17 (5.6%) |
| $10,000 to $12,499 | 17 (4.0%) | 5 (1.6%) |
| $12,500 to $14,999 | 0 (0.0%) | 1 (0.3%) |
| $15,000 to $17,499 | 3 (0.7%) | 10 (3.3%) |
| $17,500 to $19,999 | 7 (1.6%) | 4 (1.3%) |
| $20,000 to $22,499 | 7 (1.6%) | 14 (4.6%) |
| $22,500 to $24,999 | 0 (0.0%) | 15 (4.9%) |
| $25,000 to $29,999 | 27 (6.3%) | 68 (22.2%) |
| $30,000 to $34,999 | 29 (6.8%) | 35 (11.4%) |
| $35,000 to $39,999 | 26 (6.1%) | 16 (5.2%) |
| $40,000 to $44,999 | 29 (6.8%) | 12 (3.9%) |
| $45,000 to $49,999 | 48 (11.3%) | 24 (7.8%) |
| $50,000 to $54,999 | 13 (3.0%) | 6 (2.0%) |
| $55,000 to $64,999 | 36 (8.5%) | 8 (2.6%) |
| $65,000 to $74,999 | 62 (14.5%) | 24 (7.8%) |
| $75,000 to $99,999 | 46 (10.8%) | 11 (3.6%) |
| $100,000+ | 23 (5.4%) | 5 (1.6%) |
| Total | 426 (100.0%) | 306 (100.0%) |
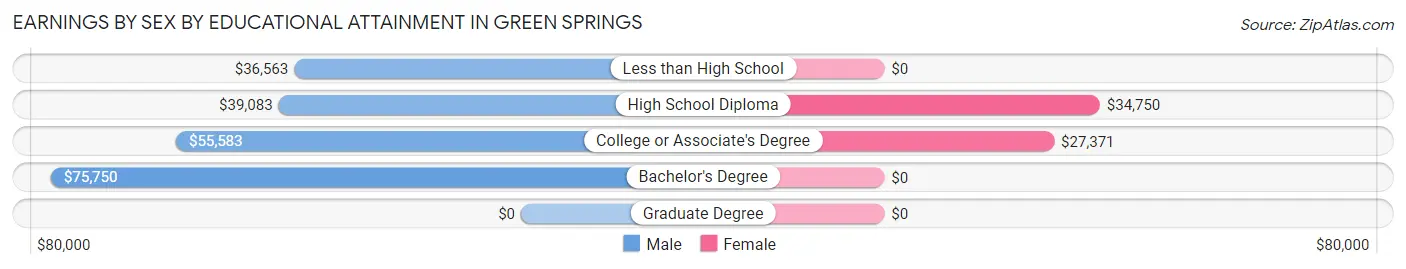
Earnings by Sex by Educational Attainment in Green Springs
Average earnings in Green Springs are $49,659 for men and $33,060 for women, a difference of 33.4%. Men with an educational attainment of bachelor's degree enjoy the highest average annual earnings of $75,750, while those with less than high school education earn the least with $36,563. Women with an educational attainment of high school diploma earn the most with the average annual earnings of $34,750, while those with college or associate's degree education have the smallest earnings of $27,371.
| Educational Attainment | Male Income | Female Income |
| Less than High School | $36,563 | $0 |
| High School Diploma | $39,083 | $34,750 |
| College or Associate's Degree | $55,583 | $27,371 |
| Bachelor's Degree | $75,750 | $0 |
| Graduate Degree | - | - |
| Total | $49,659 | $33,060 |
Family Income in Green Springs
Family Income Brackets in Green Springs
According to the Green Springs family income data, there are 77 families falling into the $50,000 to $74,999 income range, which is the most common income bracket and makes up 24.2% of all families.
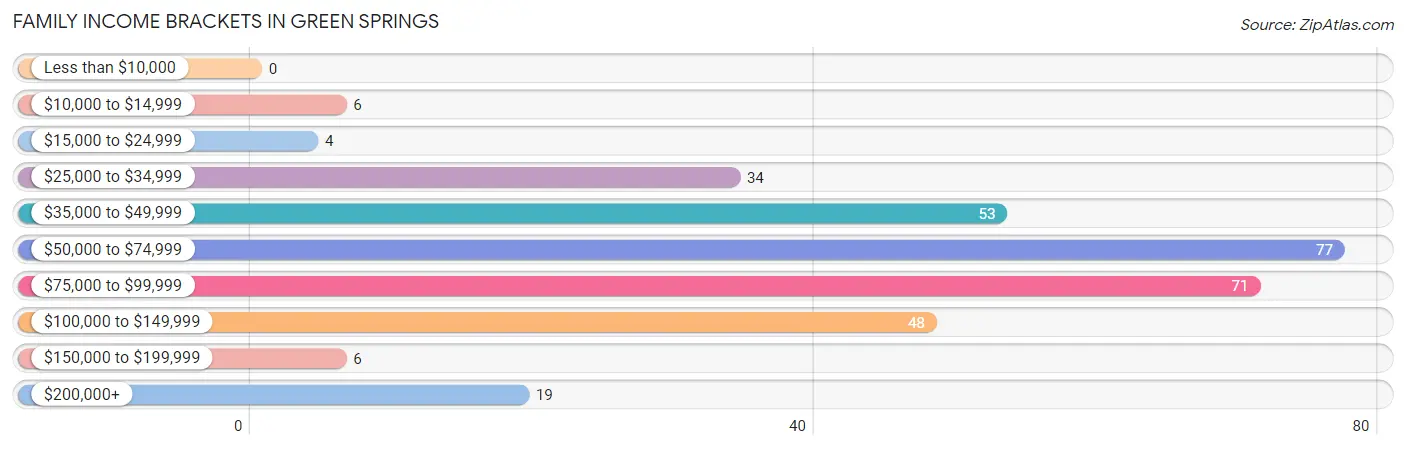
| Income Bracket | # Families | % Families |
| Less than $10,000 | 0 | 0.0% |
| $10,000 to $14,999 | 6 | 1.9% |
| $15,000 to $24,999 | 4 | 1.3% |
| $25,000 to $34,999 | 34 | 10.7% |
| $35,000 to $49,999 | 53 | 16.7% |
| $50,000 to $74,999 | 77 | 24.2% |
| $75,000 to $99,999 | 71 | 22.3% |
| $100,000 to $149,999 | 48 | 15.1% |
| $150,000 to $199,999 | 6 | 1.9% |
| $200,000+ | 19 | 6.0% |
Family Income by Famaliy Size in Green Springs
5-person families (17 | 5.3%) account for the highest median family income in Green Springs with $122,361 per family, while 2-person families (175 | 55.0%) have the highest median income of $29,375 per family member.
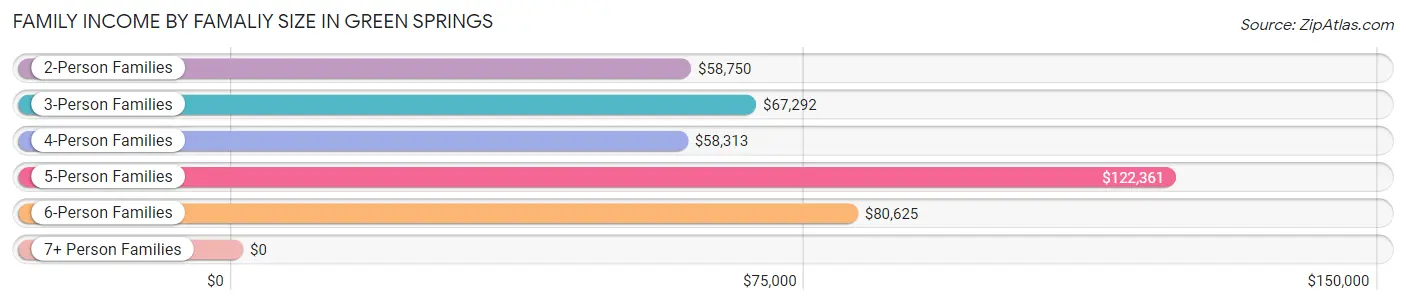
| Income Bracket | # Families | Median Income |
| 2-Person Families | 175 (55.0%) | $58,750 |
| 3-Person Families | 63 (19.8%) | $67,292 |
| 4-Person Families | 49 (15.4%) | $58,313 |
| 5-Person Families | 17 (5.3%) | $122,361 |
| 6-Person Families | 11 (3.5%) | $80,625 |
| 7+ Person Families | 3 (0.9%) | $0 |
| Total | 318 (100.0%) | $64,643 |
Family Income by Number of Earners in Green Springs
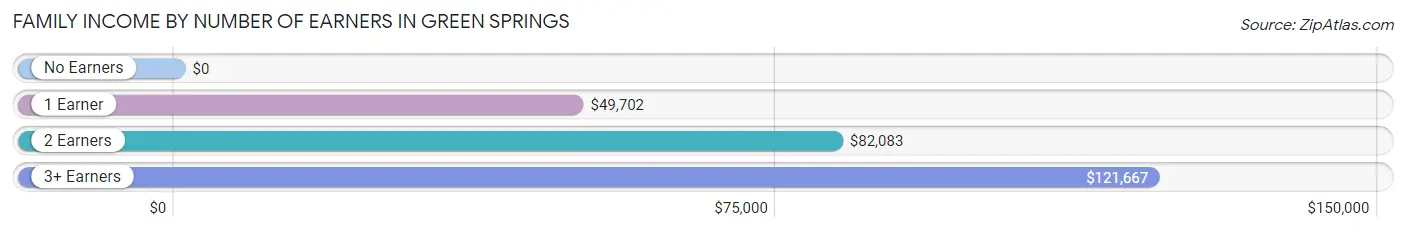
| Number of Earners | # Families | Median Income |
| No Earners | 40 (12.6%) | $0 |
| 1 Earner | 133 (41.8%) | $49,702 |
| 2 Earners | 117 (36.8%) | $82,083 |
| 3+ Earners | 28 (8.8%) | $121,667 |
| Total | 318 (100.0%) | $64,643 |
Household Income in Green Springs
Household Income Brackets in Green Springs
With 130 households falling in the category, the $50,000 to $74,999 income range is the most frequent in Green Springs, accounting for 26.6% of all households. In contrast, only 6 households (1.2%) fall into the $150,000 to $199,999 income bracket, making it the least populous group.
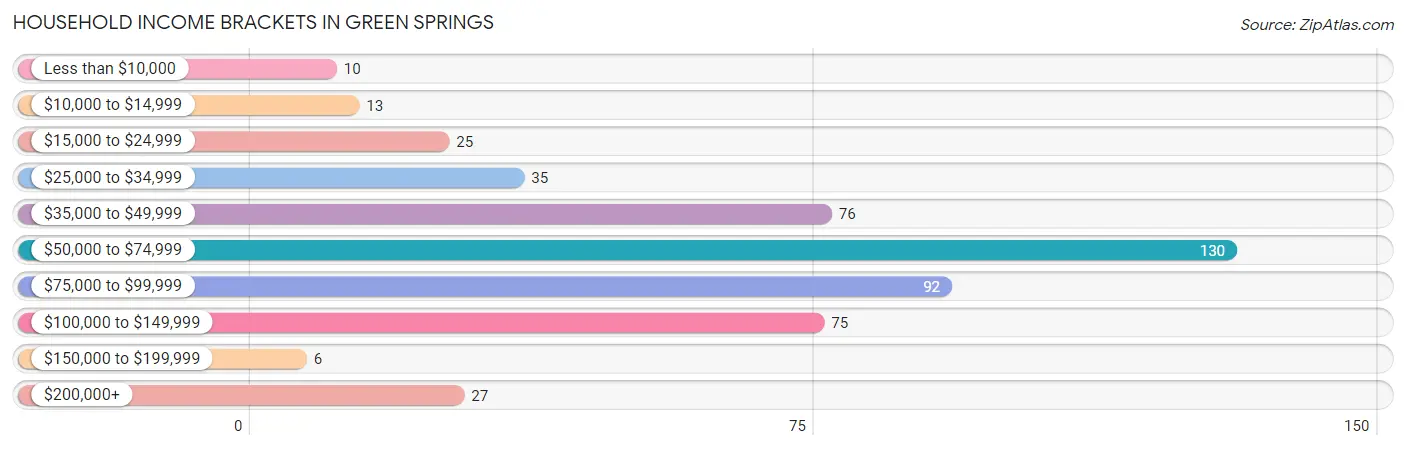
| Income Bracket | # Households | % Households |
| Less than $10,000 | 10 | 2.0% |
| $10,000 to $14,999 | 13 | 2.7% |
| $15,000 to $24,999 | 25 | 5.1% |
| $25,000 to $34,999 | 35 | 7.2% |
| $35,000 to $49,999 | 76 | 15.5% |
| $50,000 to $74,999 | 130 | 26.6% |
| $75,000 to $99,999 | 92 | 18.8% |
| $100,000 to $149,999 | 75 | 15.3% |
| $150,000 to $199,999 | 6 | 1.2% |
| $200,000+ | 27 | 5.5% |
Household Income by Householder Age in Green Springs
The median household income in Green Springs is $72,861, with the highest median household income of $74,333 found in the 25 to 44 years age bracket for the primary householder. A total of 212 households (43.3%) fall into this category. Meanwhile, the 15 to 24 years age bracket for the primary householder has the lowest median household income of $0, with 25 households (5.1%) in this group.
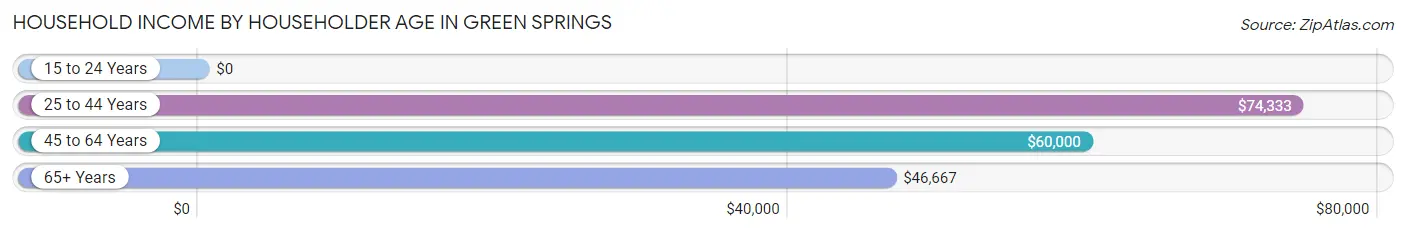
| Income Bracket | # Households | Median Income |
| 15 to 24 Years | 25 (5.1%) | $0 |
| 25 to 44 Years | 212 (43.3%) | $74,333 |
| 45 to 64 Years | 156 (31.9%) | $60,000 |
| 65+ Years | 96 (19.6%) | $46,667 |
| Total | 489 (100.0%) | $72,861 |
Poverty in Green Springs
Income Below Poverty by Sex and Age in Green Springs
With 5.1% poverty level for males and 7.7% for females among the residents of Green Springs, 75 year old and over males and 25 to 34 year old females are the most vulnerable to poverty, with 6 males (40.0%) and 23 females (33.3%) in their respective age groups living below the poverty level.
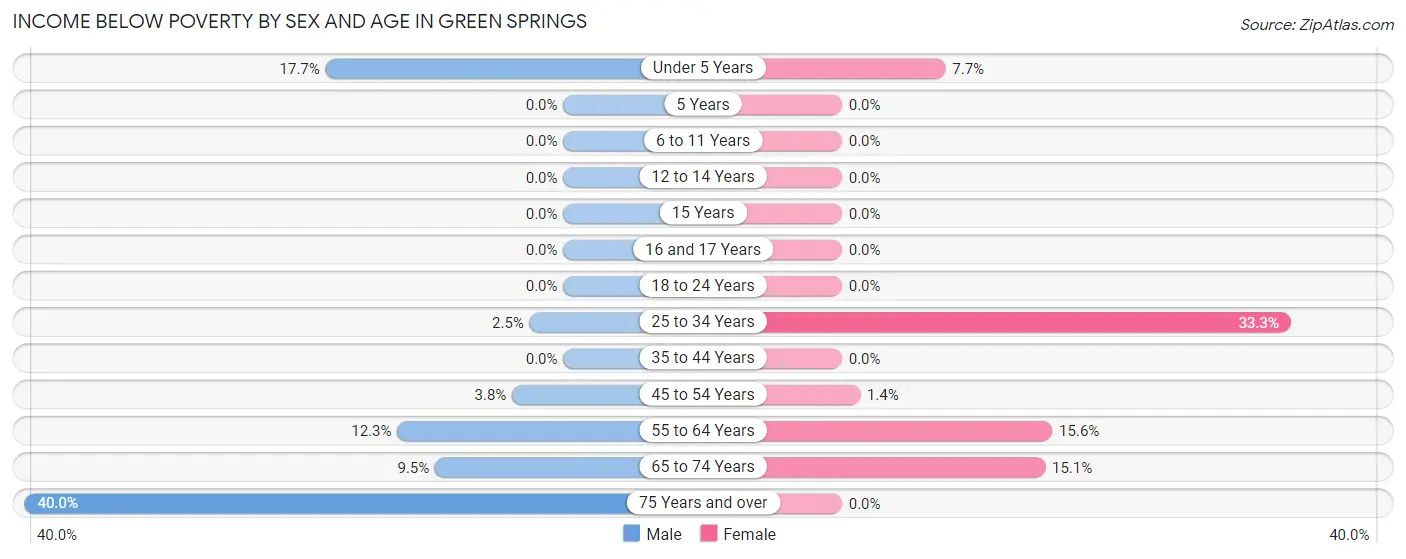
| Age Bracket | Male | Female |
| Under 5 Years | 6 (17.6%) | 4 (7.7%) |
| 5 Years | 0 (0.0%) | 0 (0.0%) |
| 6 to 11 Years | 0 (0.0%) | 0 (0.0%) |
| 12 to 14 Years | 0 (0.0%) | 0 (0.0%) |
| 15 Years | 0 (0.0%) | 0 (0.0%) |
| 16 and 17 Years | 0 (0.0%) | 0 (0.0%) |
| 18 to 24 Years | 0 (0.0%) | 0 (0.0%) |
| 25 to 34 Years | 3 (2.5%) | 23 (33.3%) |
| 35 to 44 Years | 0 (0.0%) | 0 (0.0%) |
| 45 to 54 Years | 3 (3.8%) | 1 (1.3%) |
| 55 to 64 Years | 9 (12.3%) | 10 (15.6%) |
| 65 to 74 Years | 6 (9.5%) | 8 (15.1%) |
| 75 Years and over | 6 (40.0%) | 0 (0.0%) |
| Total | 33 (5.1%) | 46 (7.7%) |
Income Above Poverty by Sex and Age in Green Springs
According to the poverty statistics in Green Springs, males aged 5 years and females aged 5 years are the age groups that are most secure financially, with 100.0% of males and 100.0% of females in these age groups living above the poverty line.
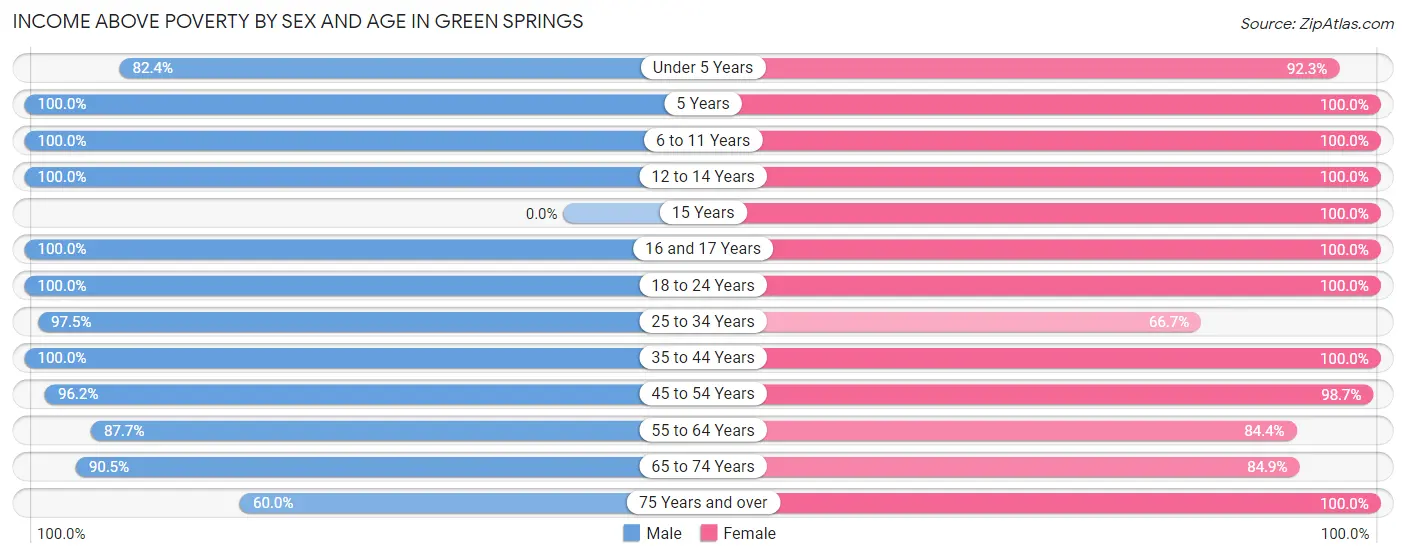
| Age Bracket | Male | Female |
| Under 5 Years | 28 (82.4%) | 48 (92.3%) |
| 5 Years | 2 (100.0%) | 24 (100.0%) |
| 6 to 11 Years | 50 (100.0%) | 47 (100.0%) |
| 12 to 14 Years | 32 (100.0%) | 14 (100.0%) |
| 15 Years | 0 (0.0%) | 1 (100.0%) |
| 16 and 17 Years | 26 (100.0%) | 1 (100.0%) |
| 18 to 24 Years | 56 (100.0%) | 82 (100.0%) |
| 25 to 34 Years | 117 (97.5%) | 46 (66.7%) |
| 35 to 44 Years | 96 (100.0%) | 87 (100.0%) |
| 45 to 54 Years | 76 (96.2%) | 73 (98.7%) |
| 55 to 64 Years | 64 (87.7%) | 54 (84.4%) |
| 65 to 74 Years | 57 (90.5%) | 45 (84.9%) |
| 75 Years and over | 9 (60.0%) | 26 (100.0%) |
| Total | 613 (94.9%) | 548 (92.3%) |
Income Below Poverty Among Married-Couple Families in Green Springs
The poverty statistics for married-couple families in Green Springs show that 2.7% or 5 of the total 187 families live below the poverty line. Families with no children have the highest poverty rate of 4.0%, comprising of 5 families. On the other hand, families with 1 or 2 children have the lowest poverty rate of 0.0%, which includes 0 families.
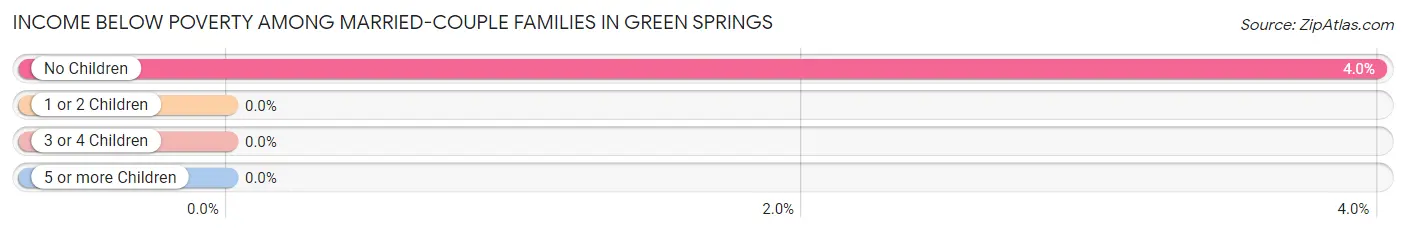
| Children | Above Poverty | Below Poverty |
| No Children | 120 (96.0%) | 5 (4.0%) |
| 1 or 2 Children | 52 (100.0%) | 0 (0.0%) |
| 3 or 4 Children | 7 (100.0%) | 0 (0.0%) |
| 5 or more Children | 3 (100.0%) | 0 (0.0%) |
| Total | 182 (97.3%) | 5 (2.7%) |
Income Below Poverty Among Single-Parent Households in Green Springs
According to the poverty data in Green Springs, 3.6% or 3 single-father households and 2.1% or 1 single-mother households are living below the poverty line. Among single-father households, those with 3 or 4 children have the highest poverty rate, with 3 households (33.3%) experiencing poverty. Likewise, among single-mother households, those with no children have the highest poverty rate, with 1 households (4.8%) falling below the poverty line.
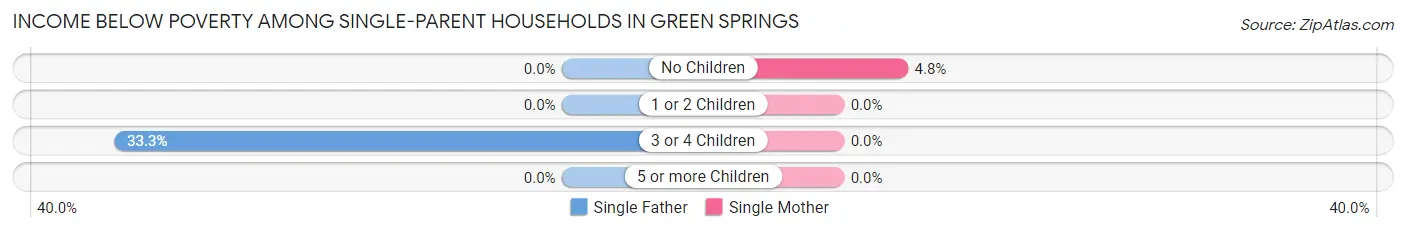
| Children | Single Father | Single Mother |
| No Children | 0 (0.0%) | 1 (4.8%) |
| 1 or 2 Children | 0 (0.0%) | 0 (0.0%) |
| 3 or 4 Children | 3 (33.3%) | 0 (0.0%) |
| 5 or more Children | 0 (0.0%) | 0 (0.0%) |
| Total | 3 (3.6%) | 1 (2.1%) |
Income Below Poverty Among Married-Couple vs Single-Parent Households in Green Springs
The poverty data for Green Springs shows that 5 of the married-couple family households (2.7%) and 4 of the single-parent households (3.0%) are living below the poverty level. Within the married-couple family households, those with no children have the highest poverty rate, with 5 households (4.0%) falling below the poverty line. Among the single-parent households, those with 3 or 4 children have the highest poverty rate, with 3 household (21.4%) living below poverty.
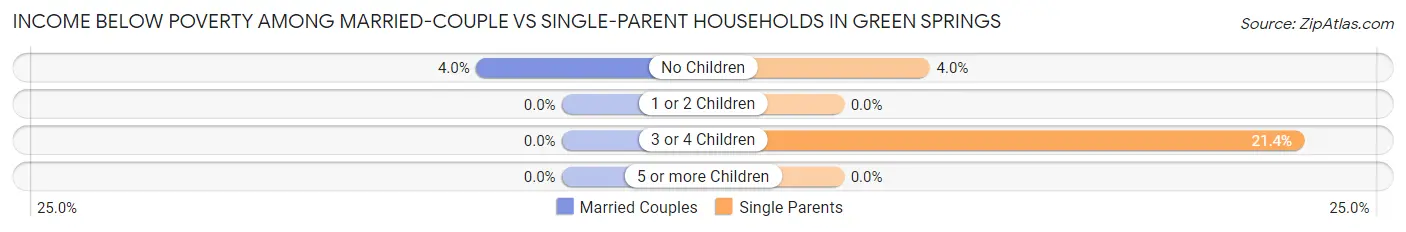
| Children | Married-Couple Families | Single-Parent Households |
| No Children | 5 (4.0%) | 1 (4.0%) |
| 1 or 2 Children | 0 (0.0%) | 0 (0.0%) |
| 3 or 4 Children | 0 (0.0%) | 3 (21.4%) |
| 5 or more Children | 0 (0.0%) | 0 (0.0%) |
| Total | 5 (2.7%) | 4 (3.0%) |
Race in Green Springs
The most populous races in Green Springs are White / Caucasian (1,295 | 98.9%), Hispanic or Latino (44 | 3.4%), and Black / African American (7 | 0.5%).
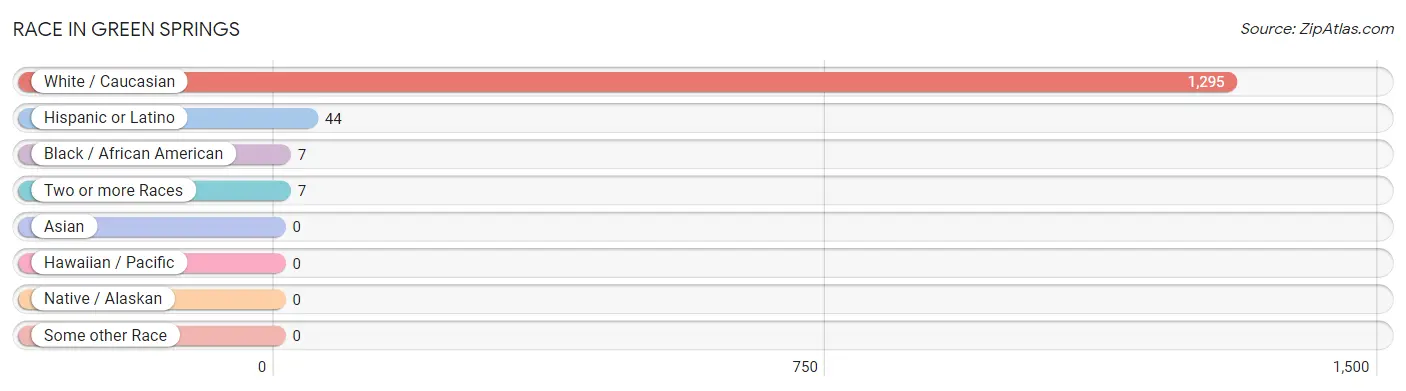
| Race | # Population | % Population |
| Asian | 0 | 0.0% |
| Black / African American | 7 | 0.5% |
| Hawaiian / Pacific | 0 | 0.0% |
| Hispanic or Latino | 44 | 3.4% |
| Native / Alaskan | 0 | 0.0% |
| White / Caucasian | 1,295 | 98.9% |
| Two or more Races | 7 | 0.5% |
| Some other Race | 0 | 0.0% |
| Total | 1,309 | 100.0% |
Ancestry in Green Springs
The most populous ancestries reported in Green Springs are German (398 | 30.4%), Irish (127 | 9.7%), English (120 | 9.2%), American (68 | 5.2%), and French (54 | 4.1%), together accounting for 58.6% of all Green Springs residents.
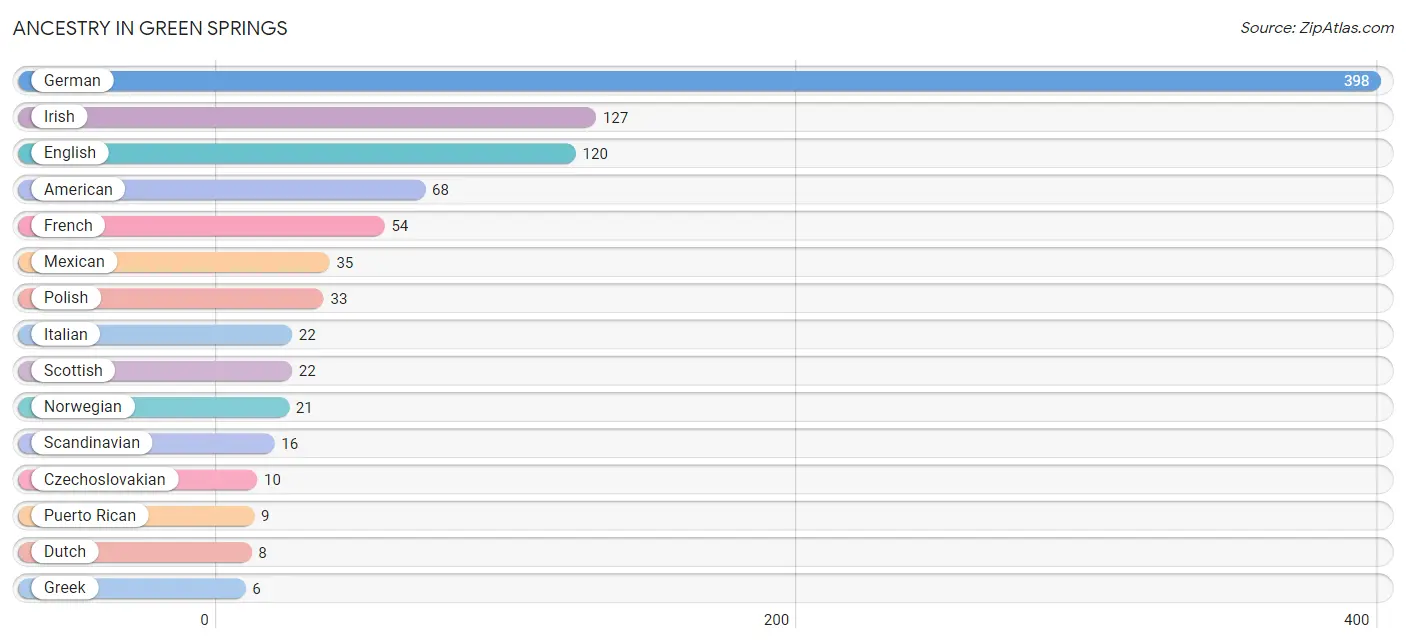
| Ancestry | # Population | % Population |
| American | 68 | 5.2% |
| Austrian | 5 | 0.4% |
| Bulgarian | 3 | 0.2% |
| Cherokee | 2 | 0.2% |
| Czech | 2 | 0.2% |
| Czechoslovakian | 10 | 0.8% |
| Dutch | 8 | 0.6% |
| English | 120 | 9.2% |
| European | 5 | 0.4% |
| French | 54 | 4.1% |
| German | 398 | 30.4% |
| Greek | 6 | 0.5% |
| Hungarian | 5 | 0.4% |
| Irish | 127 | 9.7% |
| Italian | 22 | 1.7% |
| Mexican | 35 | 2.7% |
| Norwegian | 21 | 1.6% |
| Ottawa | 4 | 0.3% |
| Polish | 33 | 2.5% |
| Puerto Rican | 9 | 0.7% |
| Scandinavian | 16 | 1.2% |
| Scotch-Irish | 2 | 0.2% |
| Scottish | 22 | 1.7% |
| Swedish | 3 | 0.2% | View All 24 Rows |
Immigrants in Green Springs

| Immigration Origin | # Population | % Population | View All 0 Rows |
Sex and Age in Green Springs
Sex and Age in Green Springs
The most populous age groups in Green Springs are 30 to 34 Years (80 | 12.0%) for men and 20 to 24 Years (75 | 11.7%) for women.
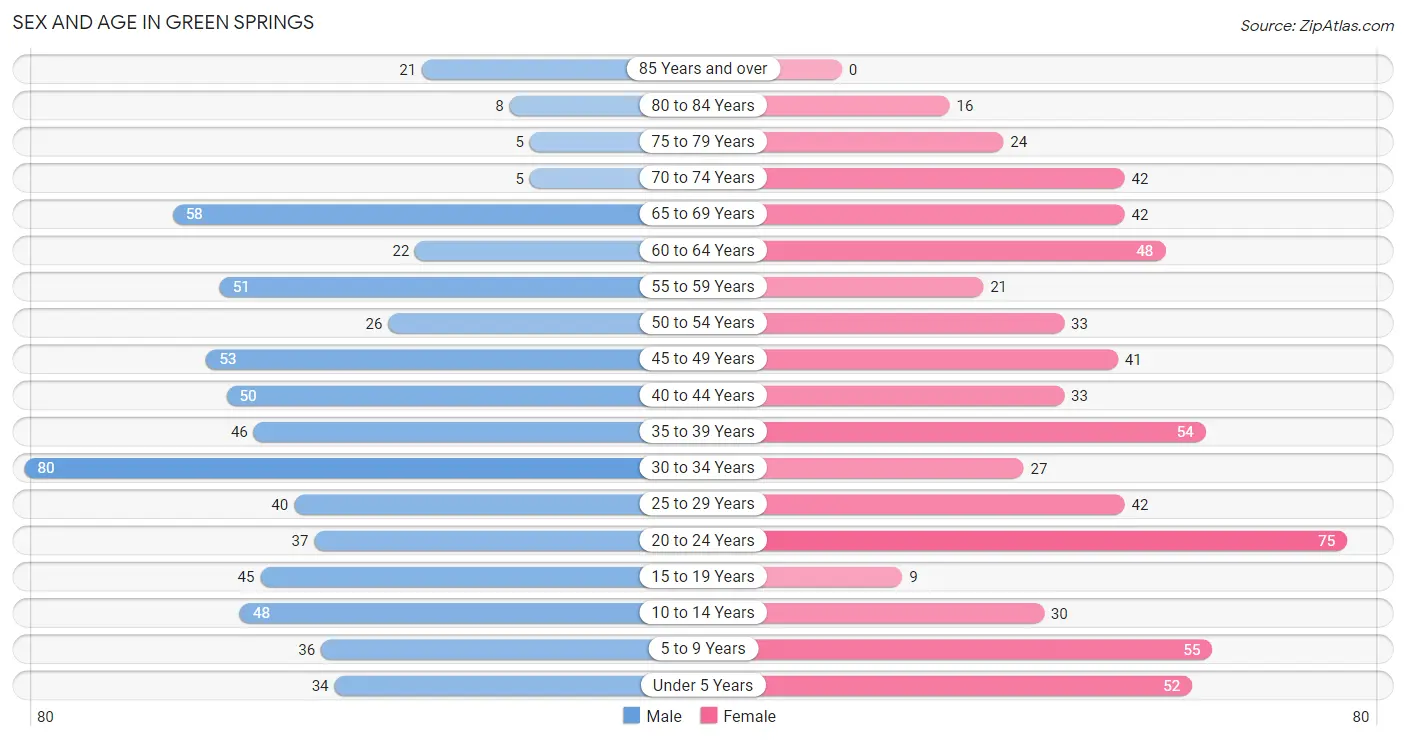
| Age Bracket | Male | Female |
| Under 5 Years | 34 (5.1%) | 52 (8.1%) |
| 5 to 9 Years | 36 (5.4%) | 55 (8.5%) |
| 10 to 14 Years | 48 (7.2%) | 30 (4.7%) |
| 15 to 19 Years | 45 (6.8%) | 9 (1.4%) |
| 20 to 24 Years | 37 (5.6%) | 75 (11.7%) |
| 25 to 29 Years | 40 (6.0%) | 42 (6.5%) |
| 30 to 34 Years | 80 (12.0%) | 27 (4.2%) |
| 35 to 39 Years | 46 (6.9%) | 54 (8.4%) |
| 40 to 44 Years | 50 (7.5%) | 33 (5.1%) |
| 45 to 49 Years | 53 (8.0%) | 41 (6.4%) |
| 50 to 54 Years | 26 (3.9%) | 33 (5.1%) |
| 55 to 59 Years | 51 (7.7%) | 21 (3.3%) |
| 60 to 64 Years | 22 (3.3%) | 48 (7.4%) |
| 65 to 69 Years | 58 (8.7%) | 42 (6.5%) |
| 70 to 74 Years | 5 (0.7%) | 42 (6.5%) |
| 75 to 79 Years | 5 (0.7%) | 24 (3.7%) |
| 80 to 84 Years | 8 (1.2%) | 16 (2.5%) |
| 85 Years and over | 21 (3.2%) | 0 (0.0%) |
| Total | 665 (100.0%) | 644 (100.0%) |
Families and Households in Green Springs
Median Family Size in Green Springs
The median family size in Green Springs is 2.93 persons per family, with single female/mother families (47 | 14.8%) accounting for the largest median family size of 3.06 persons per family. On the other hand, single male/father families (84 | 26.4%) represent the smallest median family size with 2.65 persons per family.
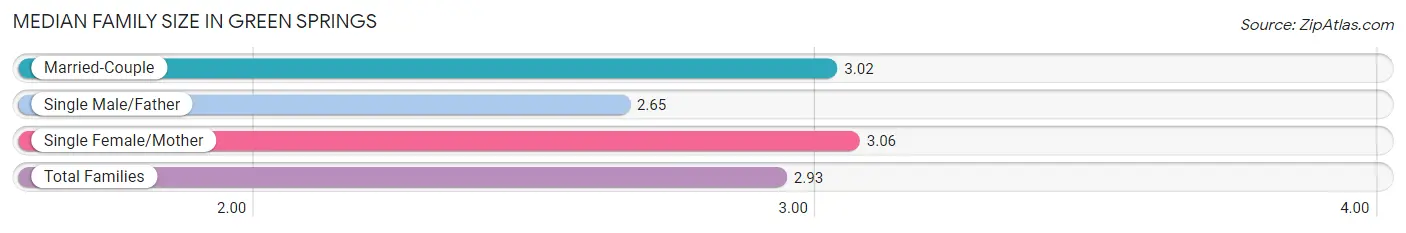
| Family Type | # Families | Family Size |
| Married-Couple | 187 (58.8%) | 3.02 |
| Single Male/Father | 84 (26.4%) | 2.65 |
| Single Female/Mother | 47 (14.8%) | 3.06 |
| Total Families | 318 (100.0%) | 2.93 |
Median Household Size in Green Springs
The median household size in Green Springs is 2.52 persons per household, with single female/mother households (47 | 9.6%) accounting for the largest median household size of 3.57 persons per household. non-family households (171 | 35.0%) represent the smallest median household size with 1.22 persons per household.
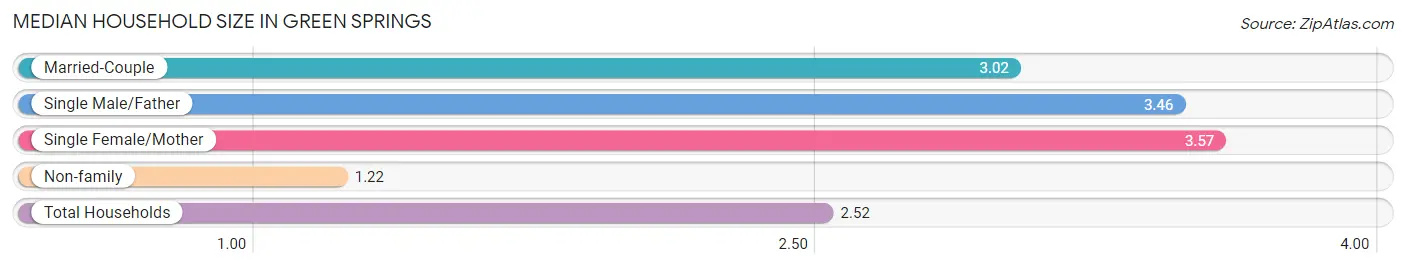
| Household Type | # Households | Household Size |
| Married-Couple | 187 (38.2%) | 3.02 |
| Single Male/Father | 84 (17.2%) | 3.46 |
| Single Female/Mother | 47 (9.6%) | 3.57 |
| Non-family | 171 (35.0%) | 1.22 |
| Total Households | 489 (100.0%) | 2.52 |
Household Size by Marriage Status in Green Springs
Out of a total of 489 households in Green Springs, 318 (65.0%) are family households, while 171 (35.0%) are nonfamily households. The most numerous type of family households are 2-person households, comprising 134, and the most common type of nonfamily households are 1-person households, comprising 142.
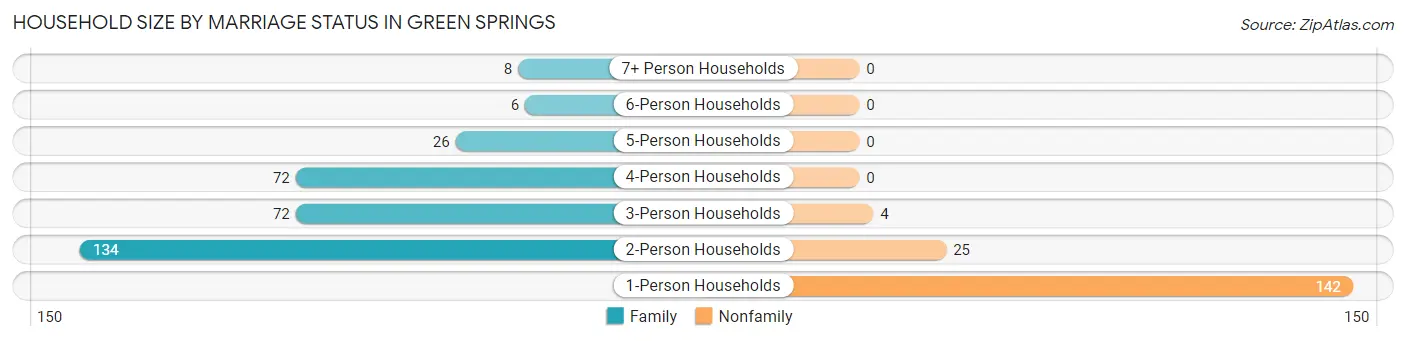
| Household Size | Family Households | Nonfamily Households |
| 1-Person Households | - | 142 (29.0%) |
| 2-Person Households | 134 (27.4%) | 25 (5.1%) |
| 3-Person Households | 72 (14.7%) | 4 (0.8%) |
| 4-Person Households | 72 (14.7%) | 0 (0.0%) |
| 5-Person Households | 26 (5.3%) | 0 (0.0%) |
| 6-Person Households | 6 (1.2%) | 0 (0.0%) |
| 7+ Person Households | 8 (1.6%) | 0 (0.0%) |
| Total | 318 (65.0%) | 171 (35.0%) |
Female Fertility in Green Springs
Fertility by Age in Green Springs
Average fertility rate in Green Springs is 142.0 births per 1,000 women. Women in the age bracket of 20 to 34 years have the highest fertility rate with 236.0 births per 1,000 women. Women in the age bracket of 20 to 34 years acount for 85.0% of all women with births.
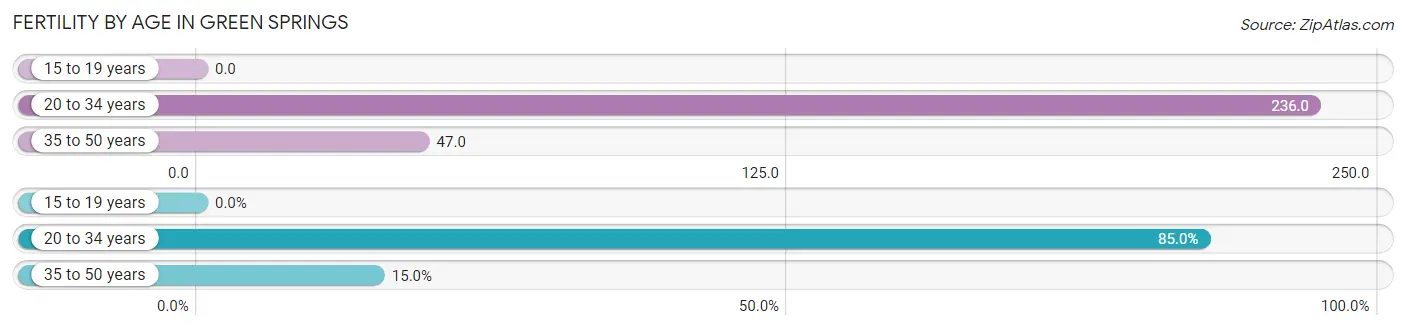
| Age Bracket | Women with Births | Births / 1,000 Women |
| 15 to 19 years | 0 (0.0%) | 0.0 |
| 20 to 34 years | 34 (85.0%) | 236.0 |
| 35 to 50 years | 6 (15.0%) | 47.0 |
| Total | 40 (100.0%) | 142.0 |
Fertility by Age by Marriage Status in Green Springs
72.5% of women with births (40) in Green Springs are married. The highest percentage of unmarried women with births falls into 35 to 50 years age bracket with 100.0% of them unmarried at the time of birth, while the lowest percentage of unmarried women with births belong to 20 to 34 years age bracket with 14.7% of them unmarried.
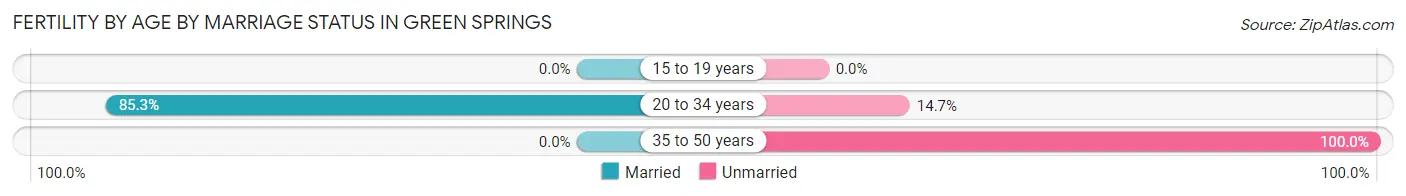
| Age Bracket | Married | Unmarried |
| 15 to 19 years | 0 (0.0%) | 0 (0.0%) |
| 20 to 34 years | 29 (85.3%) | 5 (14.7%) |
| 35 to 50 years | 0 (0.0%) | 6 (100.0%) |
| Total | 29 (72.5%) | 11 (27.5%) |
Fertility by Education in Green Springs
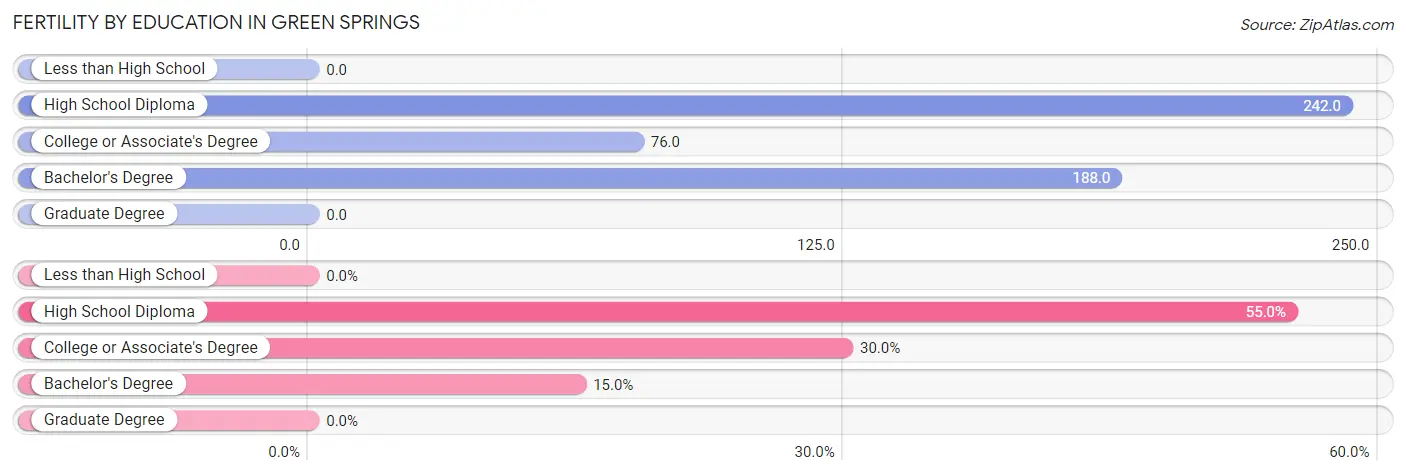
| Educational Attainment | Women with Births | Births / 1,000 Women |
| Less than High School | 0 (0.0%) | 0.0 |
| High School Diploma | 22 (55.0%) | 242.0 |
| College or Associate's Degree | 12 (30.0%) | 76.0 |
| Bachelor's Degree | 6 (15.0%) | 188.0 |
| Graduate Degree | 0 (0.0%) | 0.0 |
| Total | 40 (100.0%) | 142.0 |
Fertility by Education by Marriage Status in Green Springs
27.5% of women with births in Green Springs are unmarried. Women with the educational attainment of high school diploma are most likely to be married with 100.0% of them married at childbirth, while women with the educational attainment of bachelor's degree are least likely to be married with 100.0% of them unmarried at childbirth.
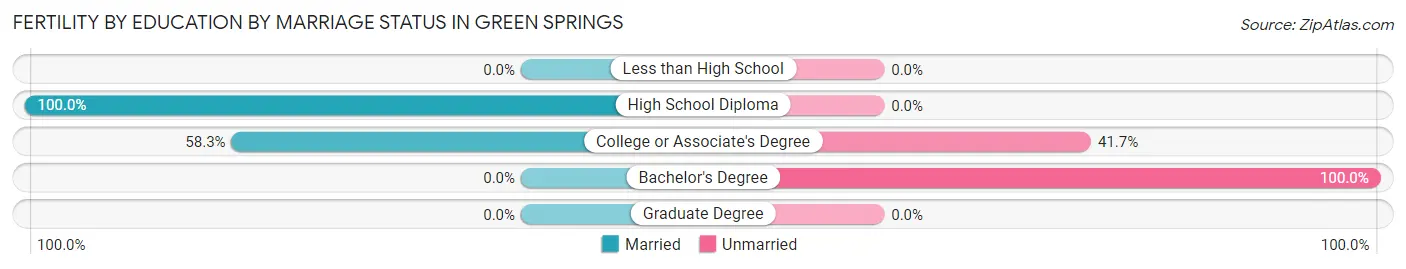
| Educational Attainment | Married | Unmarried |
| Less than High School | 0 (0.0%) | 0 (0.0%) |
| High School Diploma | 22 (100.0%) | 0 (0.0%) |
| College or Associate's Degree | 7 (58.3%) | 5 (41.7%) |
| Bachelor's Degree | 0 (0.0%) | 6 (100.0%) |
| Graduate Degree | 0 (0.0%) | 0 (0.0%) |
| Total | 29 (72.5%) | 11 (27.5%) |
Employment Characteristics in Green Springs
Employment by Class of Employer in Green Springs
Among the 684 employed individuals in Green Springs, private company employees (568 | 83.0%), local government employees (56 | 8.2%), and not-for-profit organizations (18 | 2.6%) make up the most common classes of employment.
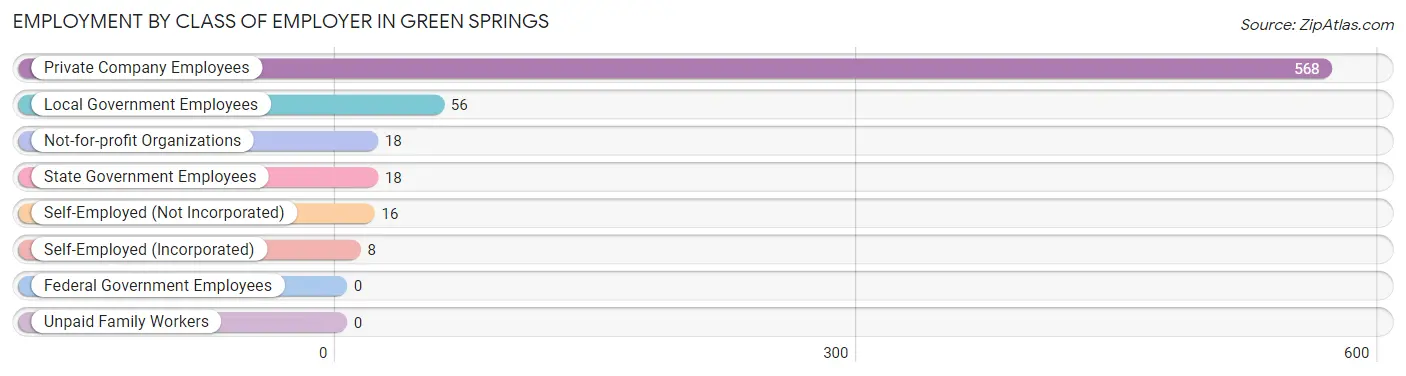
| Employer Class | # Employees | % Employees |
| Private Company Employees | 568 | 83.0% |
| Self-Employed (Incorporated) | 8 | 1.2% |
| Self-Employed (Not Incorporated) | 16 | 2.3% |
| Not-for-profit Organizations | 18 | 2.6% |
| Local Government Employees | 56 | 8.2% |
| State Government Employees | 18 | 2.6% |
| Federal Government Employees | 0 | 0.0% |
| Unpaid Family Workers | 0 | 0.0% |
| Total | 684 | 100.0% |
Employment Status by Age in Green Springs
According to the labor force statistics for Green Springs, out of the total population over 16 years of age (1,053), 66.6% or 701 individuals are in the labor force, with 2.1% or 15 of them unemployed. The age group with the highest labor force participation rate is 30 to 34 years, with 96.3% or 103 individuals in the labor force. Within the labor force, the 16 to 19 years age range has the highest percentage of unemployed individuals, with 12.0% or 3 of them being unemployed.
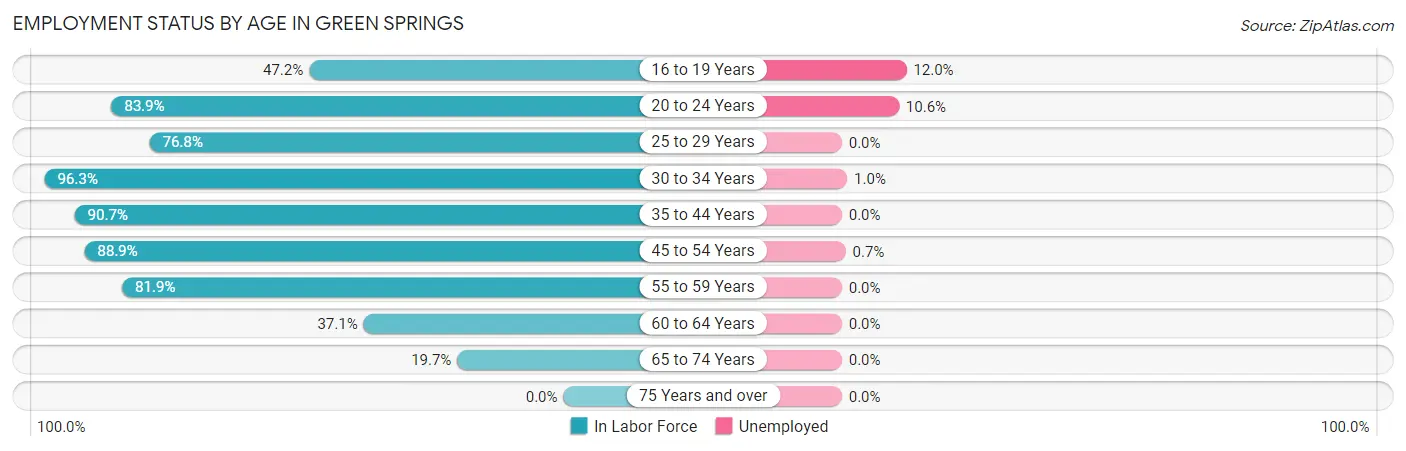
| Age Bracket | In Labor Force | Unemployed |
| 16 to 19 Years | 25 (47.2%) | 3 (12.0%) |
| 20 to 24 Years | 94 (83.9%) | 10 (10.6%) |
| 25 to 29 Years | 63 (76.8%) | 0 (0.0%) |
| 30 to 34 Years | 103 (96.3%) | 1 (1.0%) |
| 35 to 44 Years | 166 (90.7%) | 0 (0.0%) |
| 45 to 54 Years | 136 (88.9%) | 1 (0.7%) |
| 55 to 59 Years | 59 (81.9%) | 0 (0.0%) |
| 60 to 64 Years | 26 (37.1%) | 0 (0.0%) |
| 65 to 74 Years | 29 (19.7%) | 0 (0.0%) |
| 75 Years and over | 0 (0.0%) | 0 (0.0%) |
| Total | 701 (66.6%) | 15 (2.1%) |
Employment Status by Educational Attainment in Green Springs
According to labor force statistics for Green Springs, 82.9% of individuals (553) out of the total population between 25 and 64 years of age (667) are in the labor force, with 0.4% or 2 of them being unemployed. The group with the highest labor force participation rate are those with the educational attainment of college / associate degree, with 89.4% or 319 individuals in the labor force. Within the labor force, individuals with high school diploma education have the highest percentage of unemployment, with 0.6% or 1 of them being unemployed.
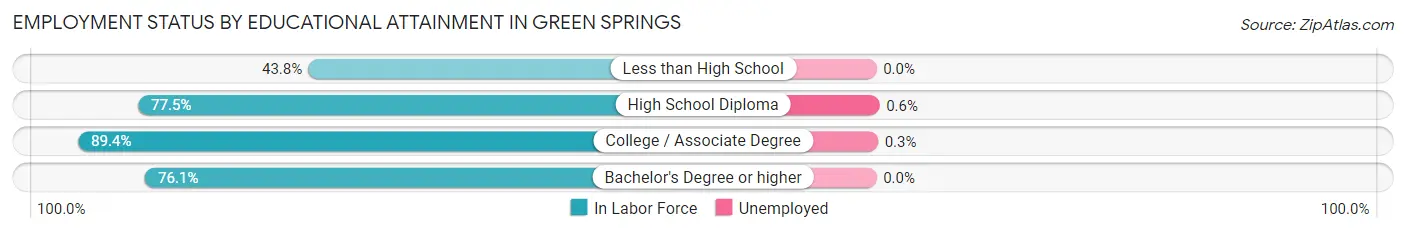
| Educational Attainment | In Labor Force | Unemployed |
| Less than High School | 7 (43.8%) | 0 (0.0%) |
| High School Diploma | 176 (77.5%) | 1 (0.6%) |
| College / Associate Degree | 319 (89.4%) | 1 (0.3%) |
| Bachelor's Degree or higher | 51 (76.1%) | 0 (0.0%) |
| Total | 553 (82.9%) | 3 (0.4%) |
Employment Occupations by Sex in Green Springs
Management, Business, Science and Arts Occupations
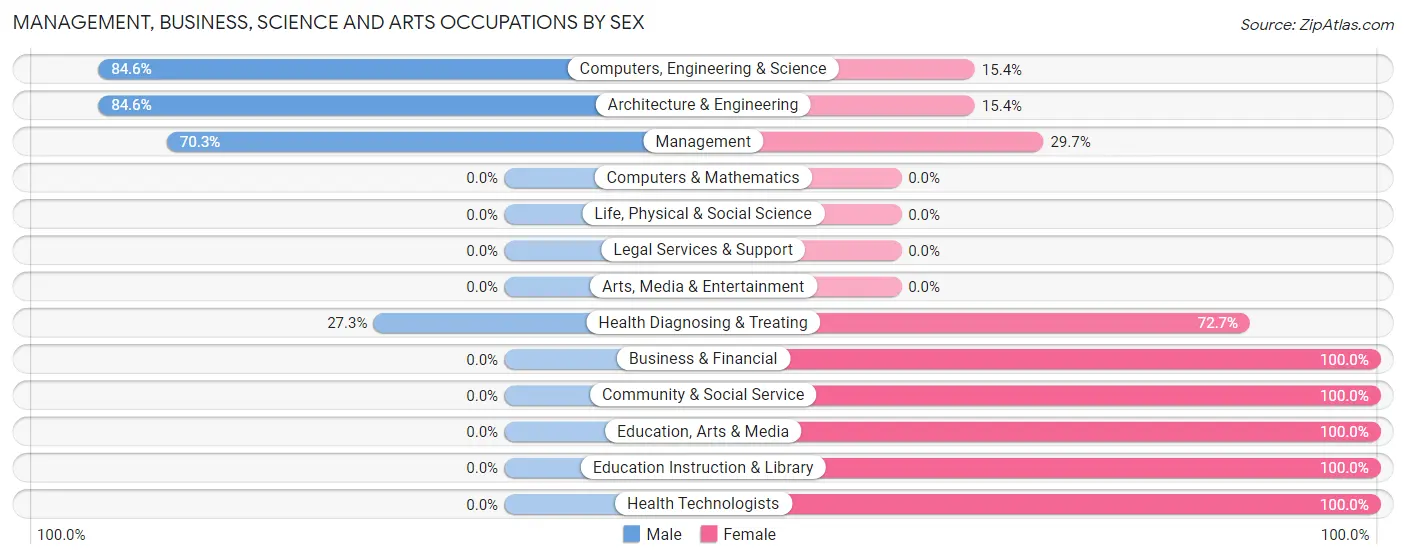
The most common Management, Business, Science and Arts occupations in Green Springs are Computers, Engineering & Science (65 | 9.5%), Architecture & Engineering (65 | 9.5%), Management (64 | 9.3%), Health Diagnosing & Treating (22 | 3.2%), and Community & Social Service (21 | 3.1%).
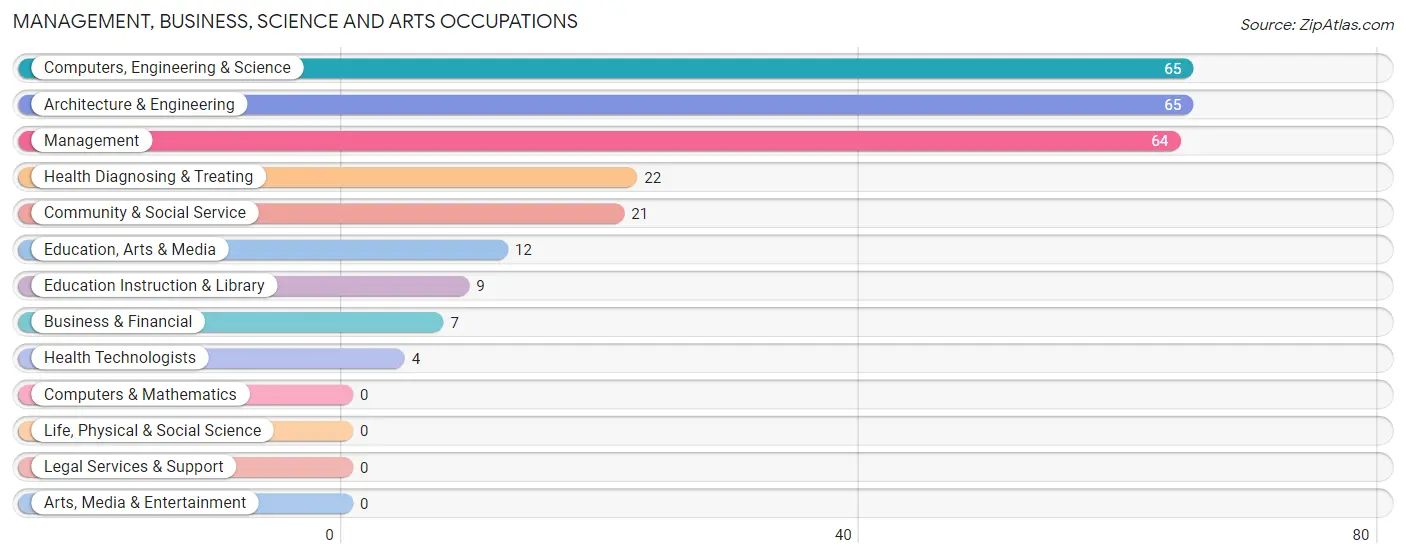
Management, Business, Science and Arts Occupations by Sex
Within the Management, Business, Science and Arts occupations in Green Springs, the most male-oriented occupations are Computers, Engineering & Science (84.6%), Architecture & Engineering (84.6%), and Management (70.3%), while the most female-oriented occupations are Business & Financial (100.0%), Community & Social Service (100.0%), and Education, Arts & Media (100.0%).
| Occupation | Male | Female |
| Management | 45 (70.3%) | 19 (29.7%) |
| Business & Financial | 0 (0.0%) | 7 (100.0%) |
| Computers, Engineering & Science | 55 (84.6%) | 10 (15.4%) |
| Computers & Mathematics | 0 (0.0%) | 0 (0.0%) |
| Architecture & Engineering | 55 (84.6%) | 10 (15.4%) |
| Life, Physical & Social Science | 0 (0.0%) | 0 (0.0%) |
| Community & Social Service | 0 (0.0%) | 21 (100.0%) |
| Education, Arts & Media | 0 (0.0%) | 12 (100.0%) |
| Legal Services & Support | 0 (0.0%) | 0 (0.0%) |
| Education Instruction & Library | 0 (0.0%) | 9 (100.0%) |
| Arts, Media & Entertainment | 0 (0.0%) | 0 (0.0%) |
| Health Diagnosing & Treating | 6 (27.3%) | 16 (72.7%) |
| Health Technologists | 0 (0.0%) | 4 (100.0%) |
| Total (Category) | 106 (59.2%) | 73 (40.8%) |
| Total (Overall) | 407 (59.3%) | 279 (40.7%) |
Services Occupations
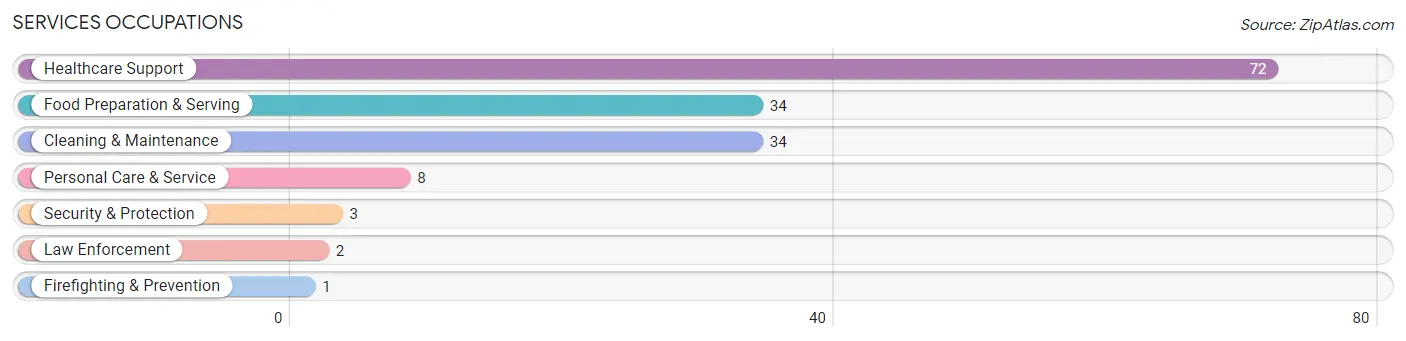
The most common Services occupations in Green Springs are Healthcare Support (72 | 10.5%), Food Preparation & Serving (34 | 5.0%), Cleaning & Maintenance (34 | 5.0%), Personal Care & Service (8 | 1.2%), and Security & Protection (3 | 0.4%).
Services Occupations by Sex
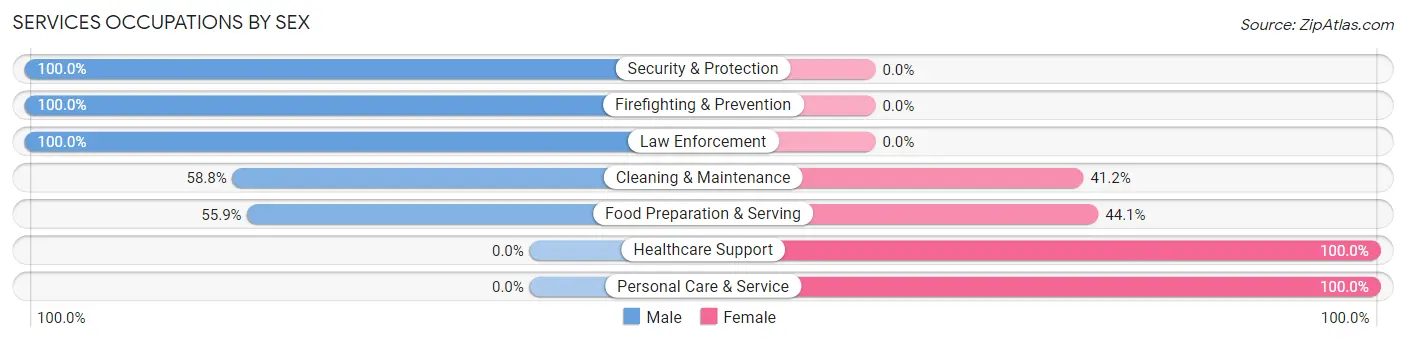
Within the Services occupations in Green Springs, the most male-oriented occupations are Security & Protection (100.0%), Firefighting & Prevention (100.0%), and Law Enforcement (100.0%), while the most female-oriented occupations are Healthcare Support (100.0%), Personal Care & Service (100.0%), and Food Preparation & Serving (44.1%).
| Occupation | Male | Female |
| Healthcare Support | 0 (0.0%) | 72 (100.0%) |
| Security & Protection | 3 (100.0%) | 0 (0.0%) |
| Firefighting & Prevention | 1 (100.0%) | 0 (0.0%) |
| Law Enforcement | 2 (100.0%) | 0 (0.0%) |
| Food Preparation & Serving | 19 (55.9%) | 15 (44.1%) |
| Cleaning & Maintenance | 20 (58.8%) | 14 (41.2%) |
| Personal Care & Service | 0 (0.0%) | 8 (100.0%) |
| Total (Category) | 42 (27.8%) | 109 (72.2%) |
| Total (Overall) | 407 (59.3%) | 279 (40.7%) |
Sales and Office Occupations
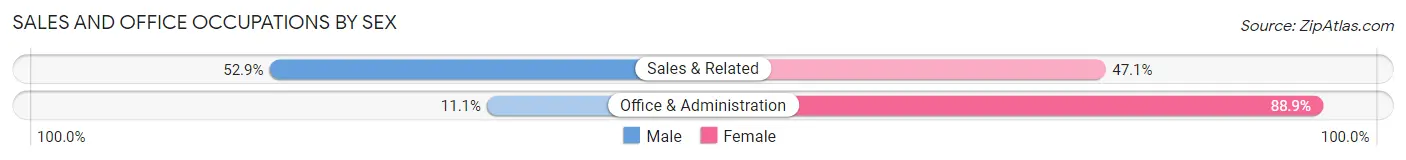
The most common Sales and Office occupations in Green Springs are Sales & Related (51 | 7.4%), and Office & Administration (27 | 3.9%).

Sales and Office Occupations by Sex
| Occupation | Male | Female |
| Sales & Related | 27 (52.9%) | 24 (47.1%) |
| Office & Administration | 3 (11.1%) | 24 (88.9%) |
| Total (Category) | 30 (38.5%) | 48 (61.5%) |
| Total (Overall) | 407 (59.3%) | 279 (40.7%) |
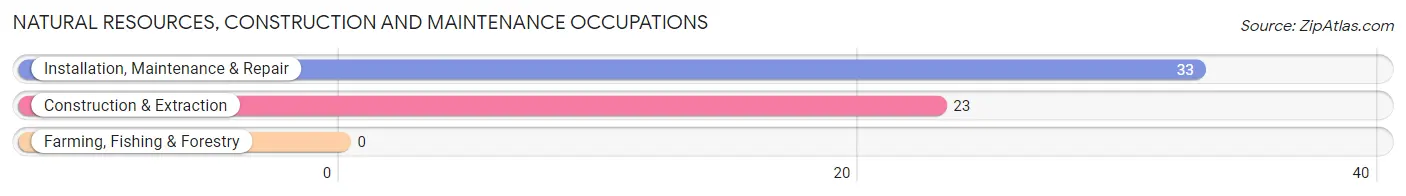
Natural Resources, Construction and Maintenance Occupations
The most common Natural Resources, Construction and Maintenance occupations in Green Springs are Installation, Maintenance & Repair (33 | 4.8%), and Construction & Extraction (23 | 3.4%).
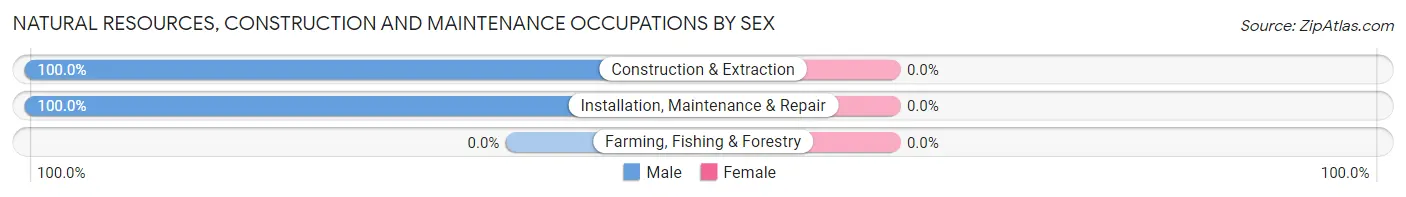
Natural Resources, Construction and Maintenance Occupations by Sex
| Occupation | Male | Female |
| Farming, Fishing & Forestry | 0 (0.0%) | 0 (0.0%) |
| Construction & Extraction | 23 (100.0%) | 0 (0.0%) |
| Installation, Maintenance & Repair | 33 (100.0%) | 0 (0.0%) |
| Total (Category) | 56 (100.0%) | 0 (0.0%) |
| Total (Overall) | 407 (59.3%) | 279 (40.7%) |
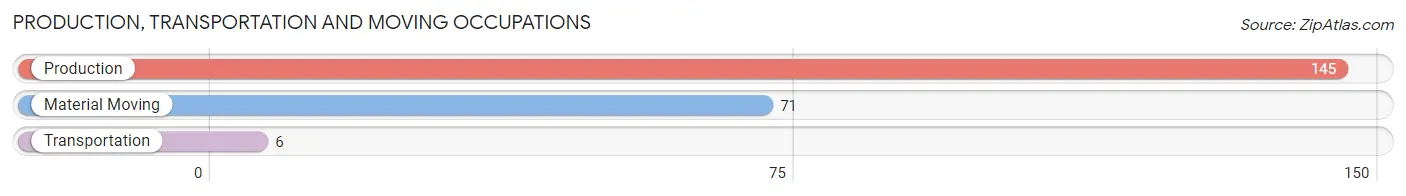
Production, Transportation and Moving Occupations
The most common Production, Transportation and Moving occupations in Green Springs are Production (145 | 21.1%), Material Moving (71 | 10.3%), and Transportation (6 | 0.9%).
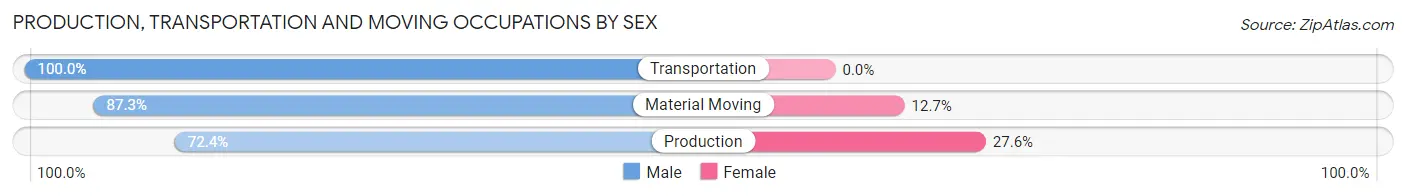
Production, Transportation and Moving Occupations by Sex
| Occupation | Male | Female |
| Production | 105 (72.4%) | 40 (27.6%) |
| Transportation | 6 (100.0%) | 0 (0.0%) |
| Material Moving | 62 (87.3%) | 9 (12.7%) |
| Total (Category) | 173 (77.9%) | 49 (22.1%) |
| Total (Overall) | 407 (59.3%) | 279 (40.7%) |
Employment Industries by Sex in Green Springs
Employment Industries in Green Springs
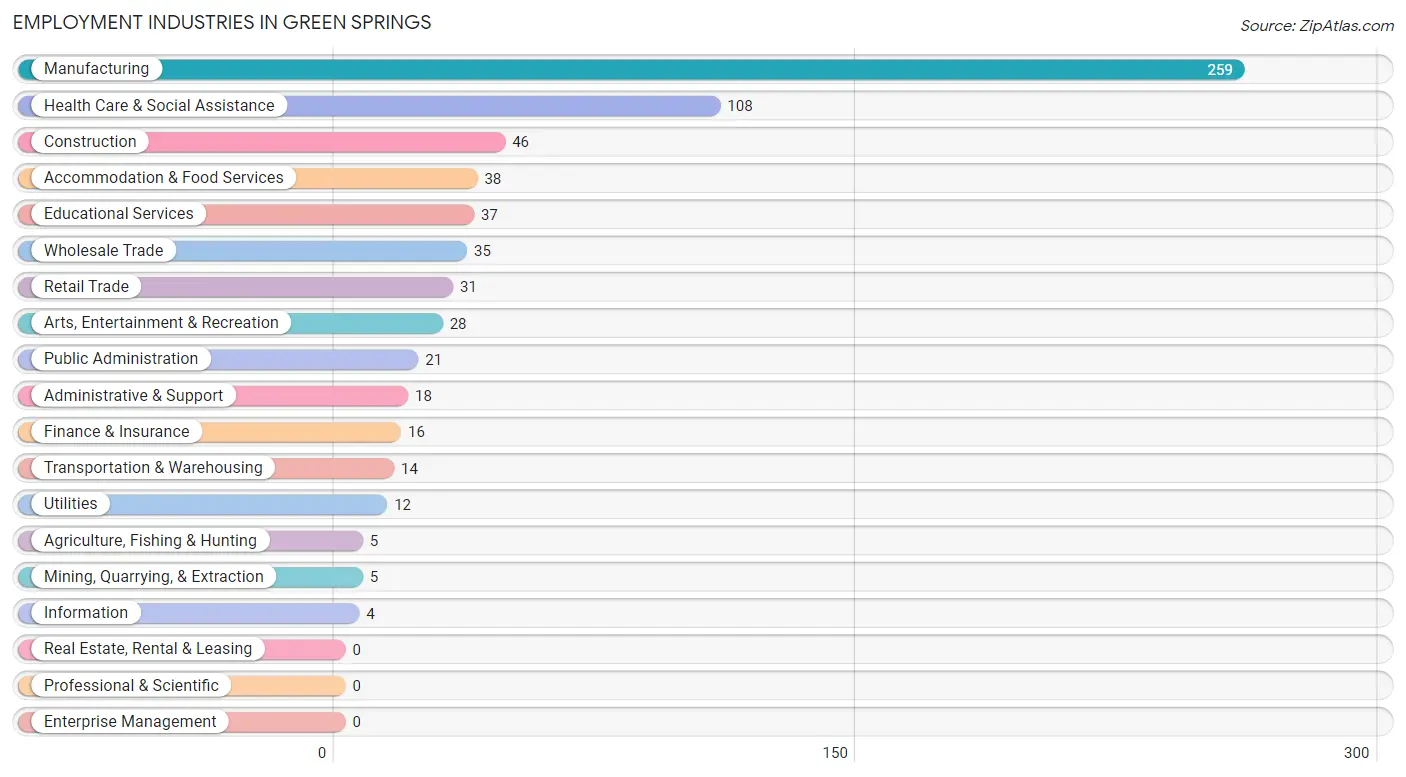
The major employment industries in Green Springs include Manufacturing (259 | 37.8%), Health Care & Social Assistance (108 | 15.7%), Construction (46 | 6.7%), Accommodation & Food Services (38 | 5.5%), and Educational Services (37 | 5.4%).
Employment Industries by Sex in Green Springs
The Green Springs industries that see more men than women are Mining, Quarrying, & Extraction (100.0%), Construction (100.0%), and Transportation & Warehousing (100.0%), whereas the industries that tend to have a higher number of women are Agriculture, Fishing & Hunting (100.0%), Public Administration (90.5%), and Health Care & Social Assistance (88.9%).
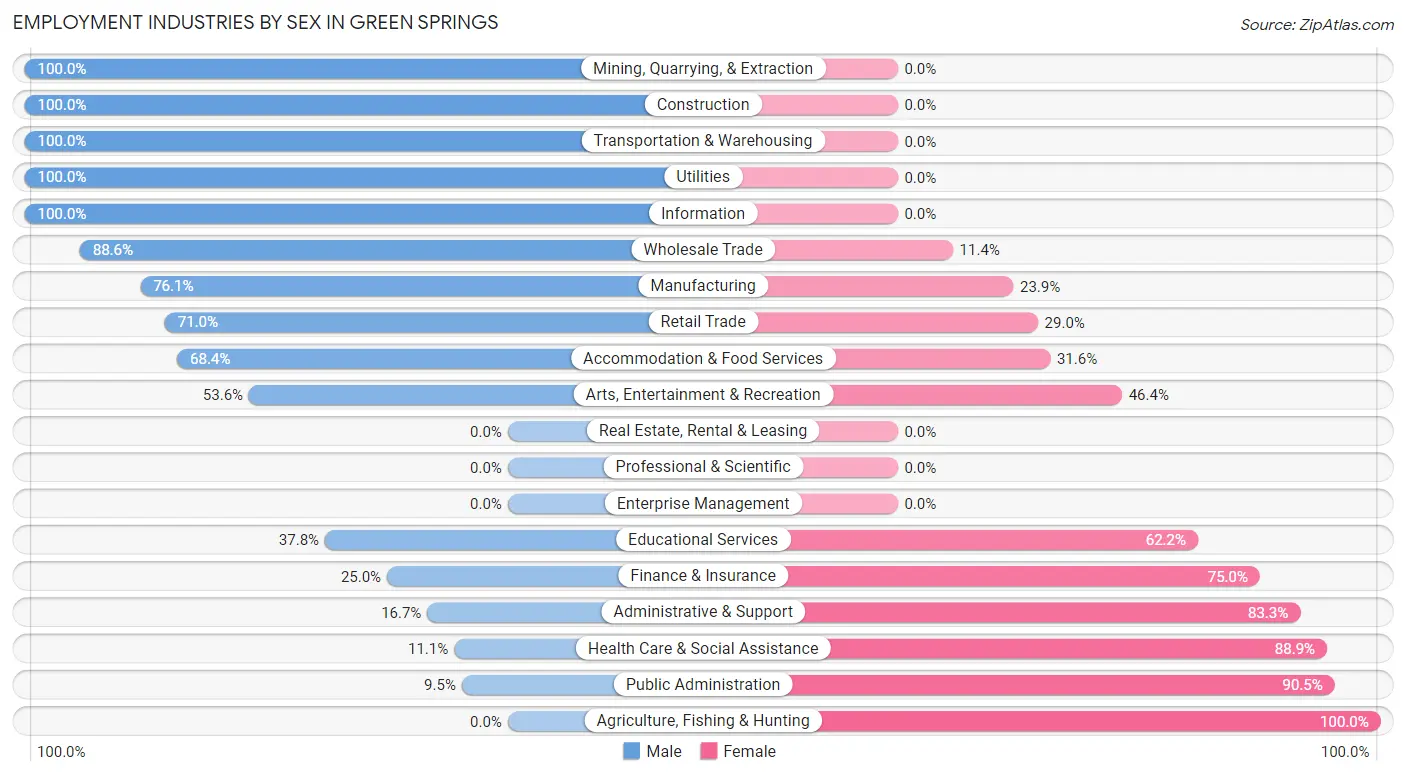
| Industry | Male | Female |
| Agriculture, Fishing & Hunting | 0 (0.0%) | 5 (100.0%) |
| Mining, Quarrying, & Extraction | 5 (100.0%) | 0 (0.0%) |
| Construction | 46 (100.0%) | 0 (0.0%) |
| Manufacturing | 197 (76.1%) | 62 (23.9%) |
| Wholesale Trade | 31 (88.6%) | 4 (11.4%) |
| Retail Trade | 22 (71.0%) | 9 (29.0%) |
| Transportation & Warehousing | 14 (100.0%) | 0 (0.0%) |
| Utilities | 12 (100.0%) | 0 (0.0%) |
| Information | 4 (100.0%) | 0 (0.0%) |
| Finance & Insurance | 4 (25.0%) | 12 (75.0%) |
| Real Estate, Rental & Leasing | 0 (0.0%) | 0 (0.0%) |
| Professional & Scientific | 0 (0.0%) | 0 (0.0%) |
| Enterprise Management | 0 (0.0%) | 0 (0.0%) |
| Administrative & Support | 3 (16.7%) | 15 (83.3%) |
| Educational Services | 14 (37.8%) | 23 (62.2%) |
| Health Care & Social Assistance | 12 (11.1%) | 96 (88.9%) |
| Arts, Entertainment & Recreation | 15 (53.6%) | 13 (46.4%) |
| Accommodation & Food Services | 26 (68.4%) | 12 (31.6%) |
| Public Administration | 2 (9.5%) | 19 (90.5%) |
| Total | 407 (59.3%) | 279 (40.7%) |
Education in Green Springs
School Enrollment in Green Springs
The most common levels of schooling among the 273 students in Green Springs are elementary school (70 | 25.6%), college / undergraduate (69 | 25.3%), and middle school (56 | 20.5%).
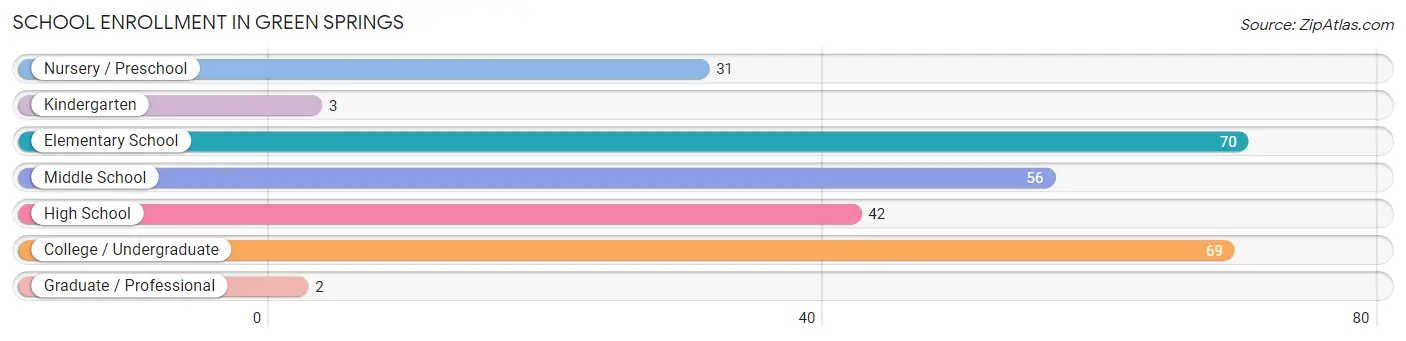
| School Level | # Students | % Students |
| Nursery / Preschool | 31 | 11.4% |
| Kindergarten | 3 | 1.1% |
| Elementary School | 70 | 25.6% |
| Middle School | 56 | 20.5% |
| High School | 42 | 15.4% |
| College / Undergraduate | 69 | 25.3% |
| Graduate / Professional | 2 | 0.7% |
| Total | 273 | 100.0% |
School Enrollment by Age by Funding Source in Green Springs
Out of a total of 273 students who are enrolled in schools in Green Springs, 20 (7.3%) attend a private institution, while the remaining 253 (92.7%) are enrolled in public schools. The age group of 20 to 24 year olds has the highest likelihood of being enrolled in private schools, with 5 (23.8% in the age bracket) enrolled. Conversely, the age group of 3 to 4 year olds has the lowest likelihood of being enrolled in a private school, with 15 (100.0% in the age bracket) attending a public institution.
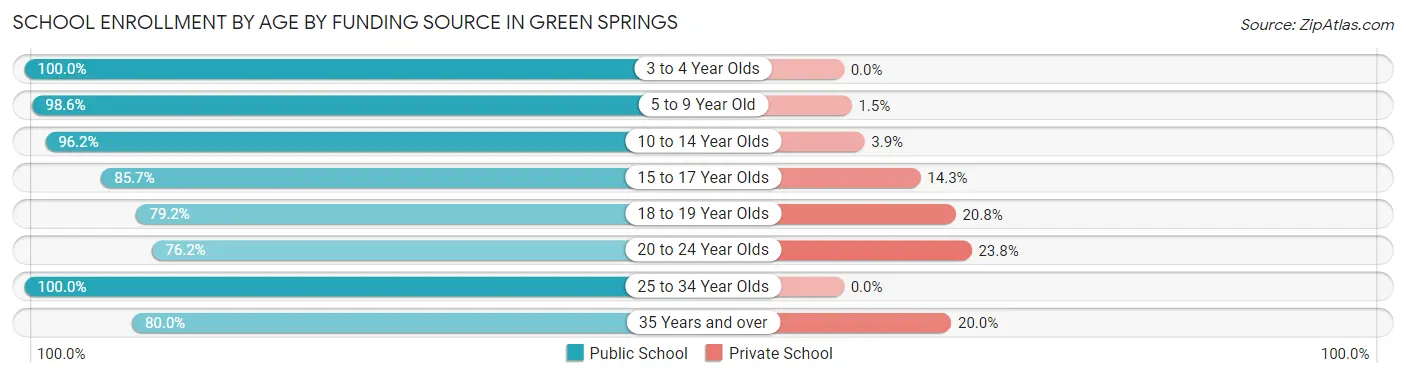
| Age Bracket | Public School | Private School |
| 3 to 4 Year Olds | 15 (100.0%) | 0 (0.0%) |
| 5 to 9 Year Old | 68 (98.6%) | 1 (1.5%) |
| 10 to 14 Year Olds | 75 (96.2%) | 3 (3.8%) |
| 15 to 17 Year Olds | 24 (85.7%) | 4 (14.3%) |
| 18 to 19 Year Olds | 19 (79.2%) | 5 (20.8%) |
| 20 to 24 Year Olds | 16 (76.2%) | 5 (23.8%) |
| 25 to 34 Year Olds | 28 (100.0%) | 0 (0.0%) |
| 35 Years and over | 8 (80.0%) | 2 (20.0%) |
| Total | 253 (92.7%) | 20 (7.3%) |
Educational Attainment by Field of Study in Green Springs
Arts & humanities (20 | 22.0%), social sciences (17 | 18.7%), business (14 | 15.4%), education (14 | 15.4%), and liberal arts & history (12 | 13.2%) are the most common fields of study among 91 individuals in Green Springs who have obtained a bachelor's degree or higher.
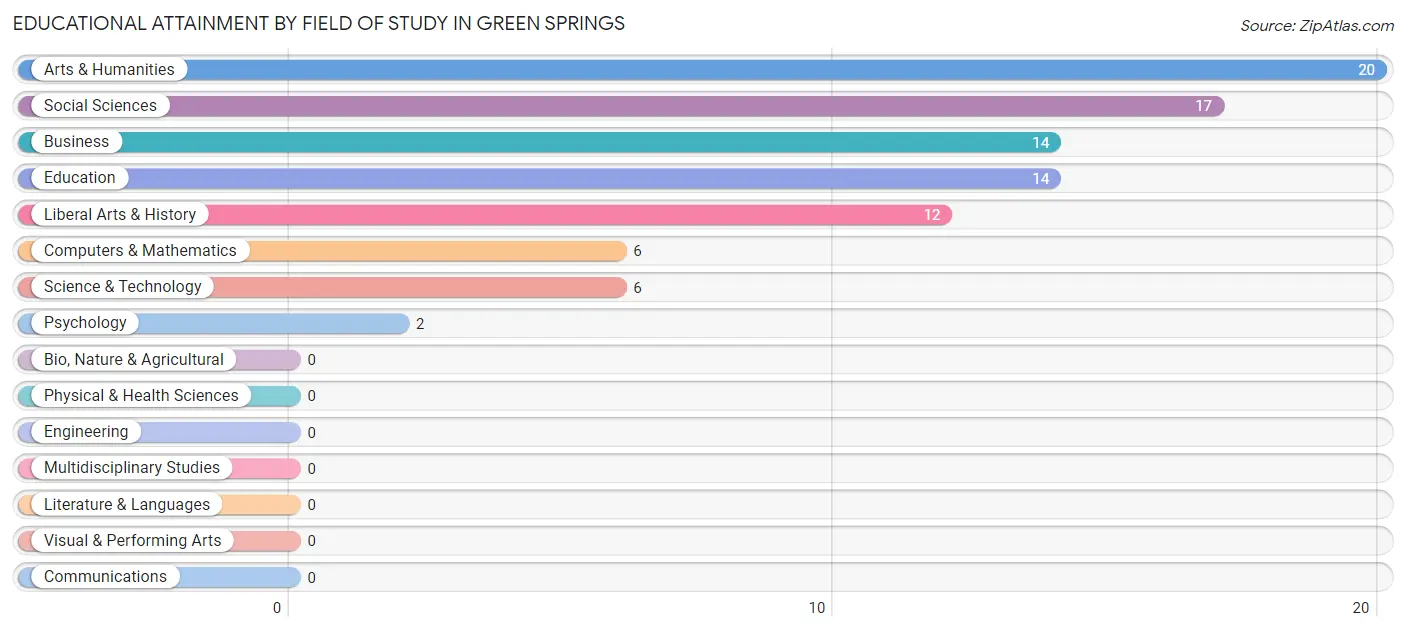
| Field of Study | # Graduates | % Graduates |
| Computers & Mathematics | 6 | 6.6% |
| Bio, Nature & Agricultural | 0 | 0.0% |
| Physical & Health Sciences | 0 | 0.0% |
| Psychology | 2 | 2.2% |
| Social Sciences | 17 | 18.7% |
| Engineering | 0 | 0.0% |
| Multidisciplinary Studies | 0 | 0.0% |
| Science & Technology | 6 | 6.6% |
| Business | 14 | 15.4% |
| Education | 14 | 15.4% |
| Literature & Languages | 0 | 0.0% |
| Liberal Arts & History | 12 | 13.2% |
| Visual & Performing Arts | 0 | 0.0% |
| Communications | 0 | 0.0% |
| Arts & Humanities | 20 | 22.0% |
| Total | 91 | 100.0% |
Transportation & Commute in Green Springs
Vehicle Availability by Sex in Green Springs
The most prevalent vehicle ownership categories in Green Springs are males with 2 vehicles (195, accounting for 47.9%) and females with 2 vehicles (134, making up 70.4%).
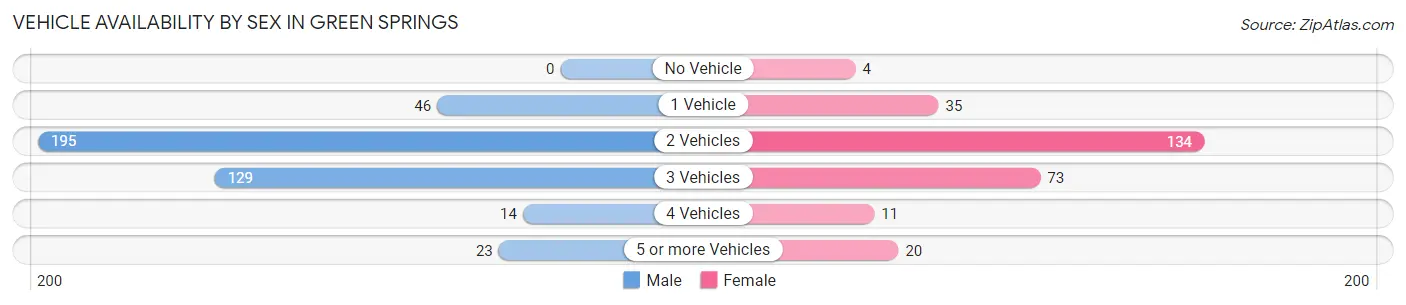
| Vehicles Available | Male | Female |
| No Vehicle | 0 (0.0%) | 4 (1.4%) |
| 1 Vehicle | 46 (11.3%) | 35 (12.6%) |
| 2 Vehicles | 195 (47.9%) | 134 (48.4%) |
| 3 Vehicles | 129 (31.7%) | 73 (26.4%) |
| 4 Vehicles | 14 (3.4%) | 11 (4.0%) |
| 5 or more Vehicles | 23 (5.7%) | 20 (7.2%) |
| Total | 407 (100.0%) | 277 (100.0%) |
Commute Time in Green Springs
The most frequently occuring commute durations in Green Springs are 15 to 19 minutes (113 commuters, 17.6%), 20 to 24 minutes (112 commuters, 17.4%), and 25 to 29 minutes (76 commuters, 11.8%).
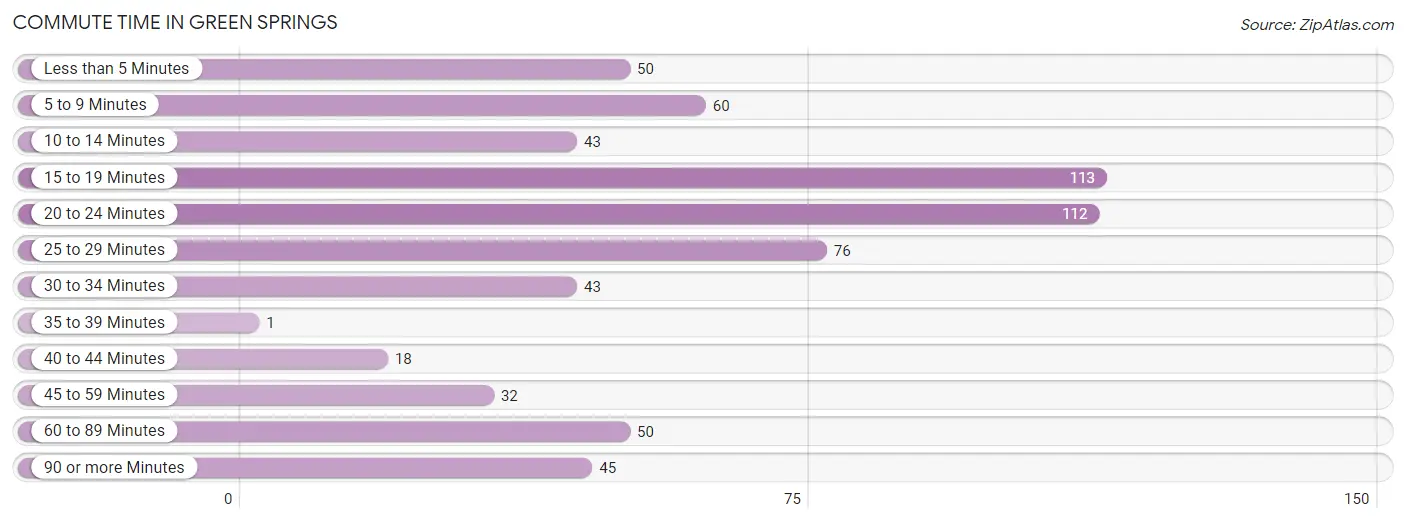
| Commute Time | # Commuters | % Commuters |
| Less than 5 Minutes | 50 | 7.8% |
| 5 to 9 Minutes | 60 | 9.3% |
| 10 to 14 Minutes | 43 | 6.7% |
| 15 to 19 Minutes | 113 | 17.6% |
| 20 to 24 Minutes | 112 | 17.4% |
| 25 to 29 Minutes | 76 | 11.8% |
| 30 to 34 Minutes | 43 | 6.7% |
| 35 to 39 Minutes | 1 | 0.2% |
| 40 to 44 Minutes | 18 | 2.8% |
| 45 to 59 Minutes | 32 | 5.0% |
| 60 to 89 Minutes | 50 | 7.8% |
| 90 or more Minutes | 45 | 7.0% |
Commute Time by Sex in Green Springs
The most common commute times in Green Springs are 15 to 19 minutes (76 commuters, 19.6%) for males and 20 to 24 minutes (63 commuters, 24.6%) for females.
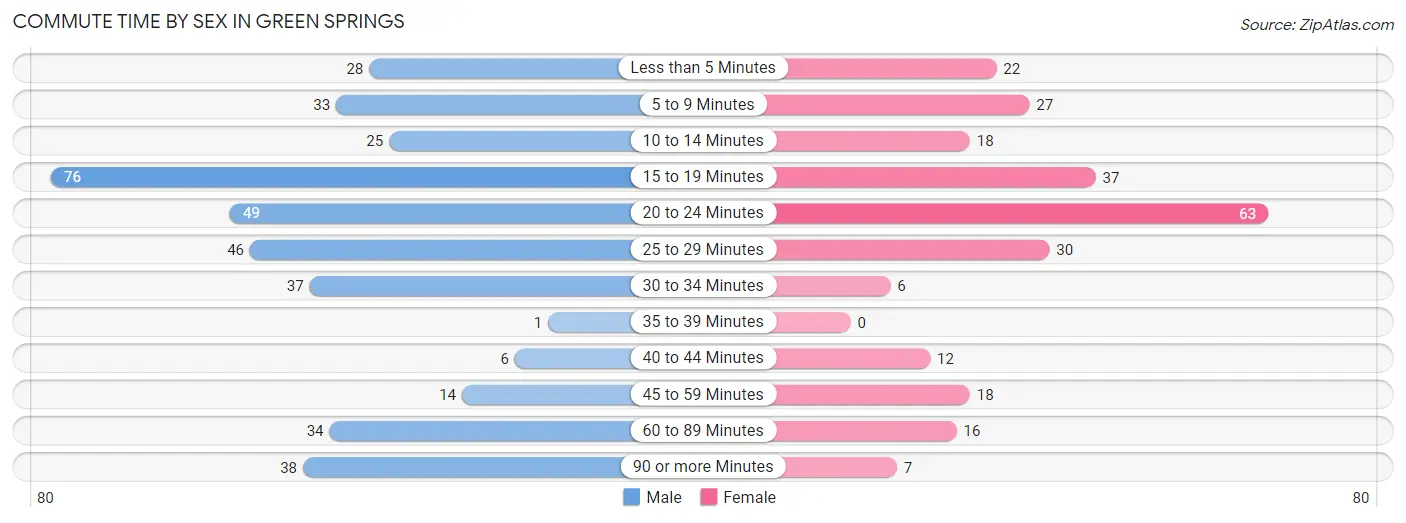
| Commute Time | Male | Female |
| Less than 5 Minutes | 28 (7.2%) | 22 (8.6%) |
| 5 to 9 Minutes | 33 (8.5%) | 27 (10.5%) |
| 10 to 14 Minutes | 25 (6.5%) | 18 (7.0%) |
| 15 to 19 Minutes | 76 (19.6%) | 37 (14.4%) |
| 20 to 24 Minutes | 49 (12.7%) | 63 (24.6%) |
| 25 to 29 Minutes | 46 (11.9%) | 30 (11.7%) |
| 30 to 34 Minutes | 37 (9.6%) | 6 (2.3%) |
| 35 to 39 Minutes | 1 (0.3%) | 0 (0.0%) |
| 40 to 44 Minutes | 6 (1.5%) | 12 (4.7%) |
| 45 to 59 Minutes | 14 (3.6%) | 18 (7.0%) |
| 60 to 89 Minutes | 34 (8.8%) | 16 (6.2%) |
| 90 or more Minutes | 38 (9.8%) | 7 (2.7%) |
Time of Departure to Work by Sex in Green Springs
The most frequent times of departure to work in Green Springs are 12:00 PM to 3:59 PM (61, 15.8%) for males and 6:30 AM to 6:59 AM (35, 13.7%) for females.
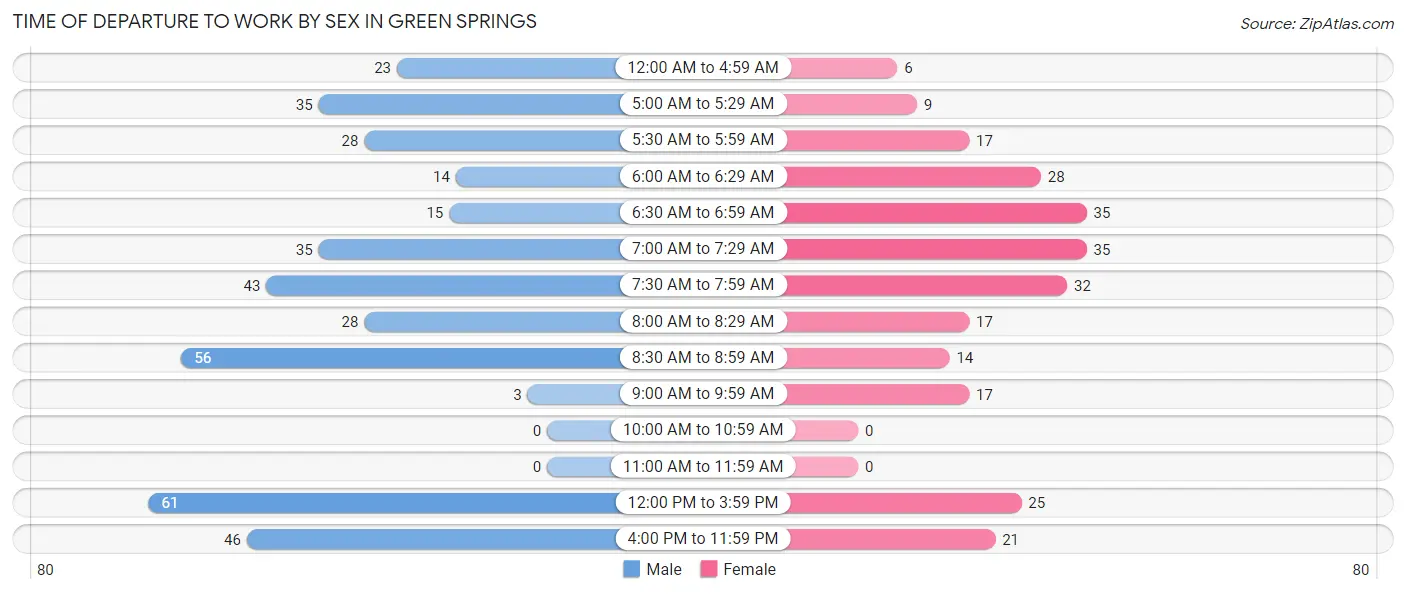
| Time of Departure | Male | Female |
| 12:00 AM to 4:59 AM | 23 (5.9%) | 6 (2.3%) |
| 5:00 AM to 5:29 AM | 35 (9.0%) | 9 (3.5%) |
| 5:30 AM to 5:59 AM | 28 (7.2%) | 17 (6.6%) |
| 6:00 AM to 6:29 AM | 14 (3.6%) | 28 (10.9%) |
| 6:30 AM to 6:59 AM | 15 (3.9%) | 35 (13.7%) |
| 7:00 AM to 7:29 AM | 35 (9.0%) | 35 (13.7%) |
| 7:30 AM to 7:59 AM | 43 (11.1%) | 32 (12.5%) |
| 8:00 AM to 8:29 AM | 28 (7.2%) | 17 (6.6%) |
| 8:30 AM to 8:59 AM | 56 (14.5%) | 14 (5.5%) |
| 9:00 AM to 9:59 AM | 3 (0.8%) | 17 (6.6%) |
| 10:00 AM to 10:59 AM | 0 (0.0%) | 0 (0.0%) |
| 11:00 AM to 11:59 AM | 0 (0.0%) | 0 (0.0%) |
| 12:00 PM to 3:59 PM | 61 (15.8%) | 25 (9.8%) |
| 4:00 PM to 11:59 PM | 46 (11.9%) | 21 (8.2%) |
| Total | 387 (100.0%) | 256 (100.0%) |
Housing Occupancy in Green Springs
Occupancy by Ownership in Green Springs
Of the total 489 dwellings in Green Springs, owner-occupied units account for 403 (82.4%), while renter-occupied units make up 86 (17.6%).
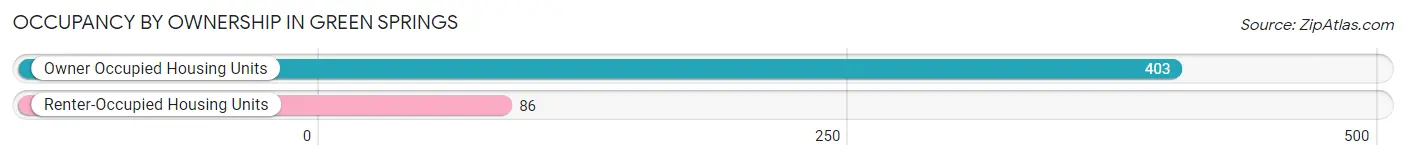
| Occupancy | # Housing Units | % Housing Units |
| Owner Occupied Housing Units | 403 | 82.4% |
| Renter-Occupied Housing Units | 86 | 17.6% |
| Total Occupied Housing Units | 489 | 100.0% |
Occupancy by Household Size in Green Springs
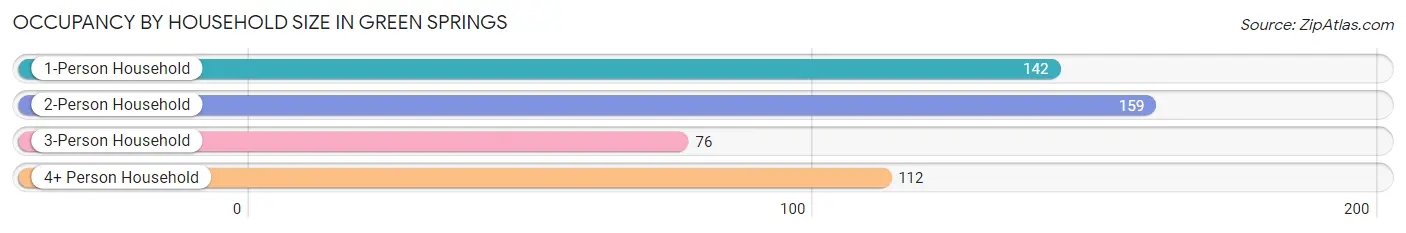
| Household Size | # Housing Units | % Housing Units |
| 1-Person Household | 142 | 29.0% |
| 2-Person Household | 159 | 32.5% |
| 3-Person Household | 76 | 15.5% |
| 4+ Person Household | 112 | 22.9% |
| Total Housing Units | 489 | 100.0% |
Occupancy by Ownership by Household Size in Green Springs
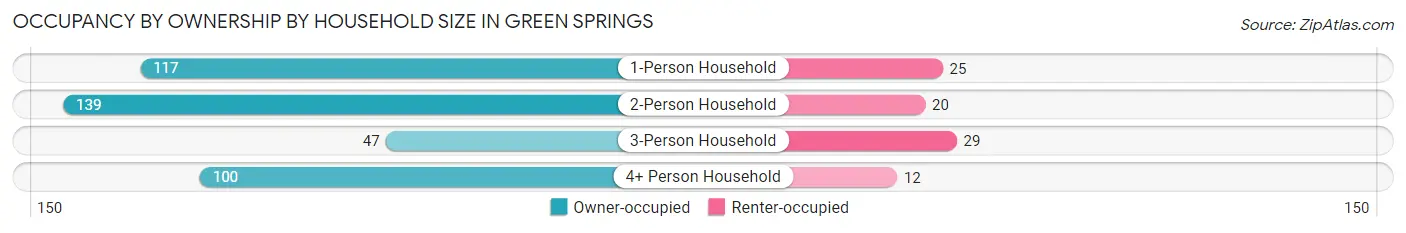
| Household Size | Owner-occupied | Renter-occupied |
| 1-Person Household | 117 (82.4%) | 25 (17.6%) |
| 2-Person Household | 139 (87.4%) | 20 (12.6%) |
| 3-Person Household | 47 (61.8%) | 29 (38.2%) |
| 4+ Person Household | 100 (89.3%) | 12 (10.7%) |
| Total Housing Units | 403 (82.4%) | 86 (17.6%) |
Occupancy by Educational Attainment in Green Springs
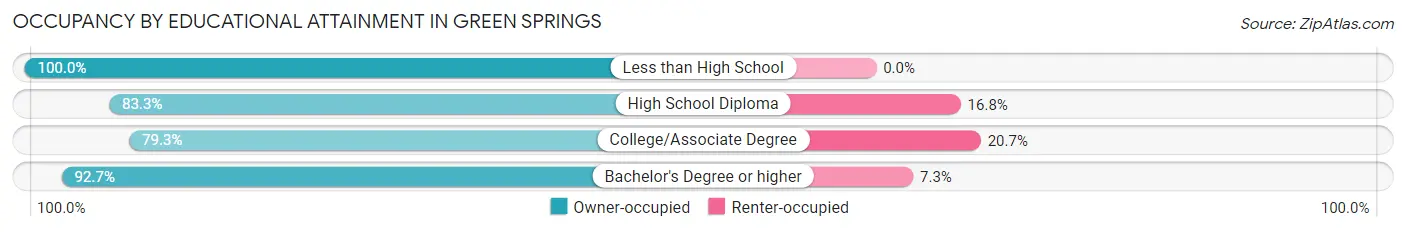
| Household Size | Owner-occupied | Renter-occupied |
| Less than High School | 11 (100.0%) | 0 (0.0%) |
| High School Diploma | 159 (83.3%) | 32 (16.8%) |
| College/Associate Degree | 195 (79.3%) | 51 (20.7%) |
| Bachelor's Degree or higher | 38 (92.7%) | 3 (7.3%) |
Occupancy by Age of Householder in Green Springs
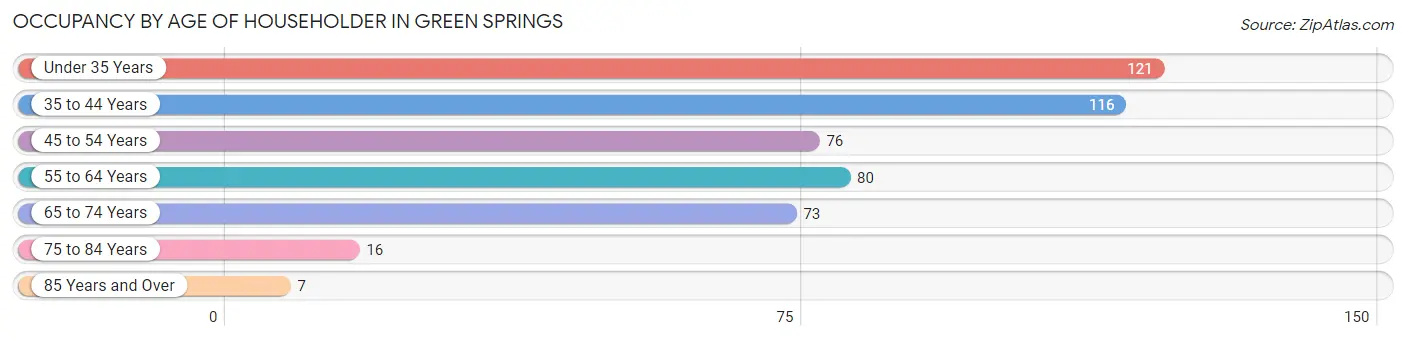
| Age Bracket | # Households | % Households |
| Under 35 Years | 121 | 24.7% |
| 35 to 44 Years | 116 | 23.7% |
| 45 to 54 Years | 76 | 15.5% |
| 55 to 64 Years | 80 | 16.4% |
| 65 to 74 Years | 73 | 14.9% |
| 75 to 84 Years | 16 | 3.3% |
| 85 Years and Over | 7 | 1.4% |
| Total | 489 | 100.0% |
Housing Finances in Green Springs
Median Income by Occupancy in Green Springs
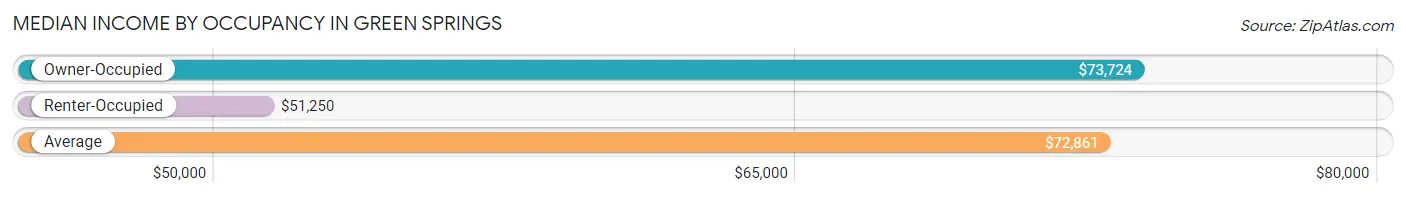
| Occupancy Type | # Households | Median Income |
| Owner-Occupied | 403 (82.4%) | $73,724 |
| Renter-Occupied | 86 (17.6%) | $51,250 |
| Average | 489 (100.0%) | $72,861 |
Occupancy by Householder Income Bracket in Green Springs
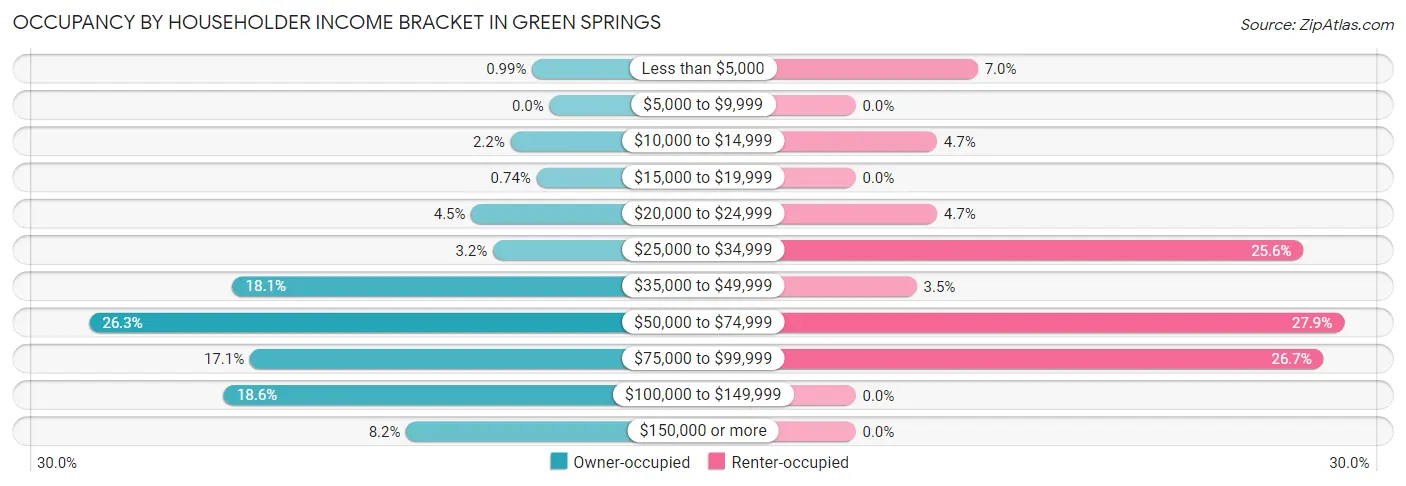
| Income Bracket | Owner-occupied | Renter-occupied |
| Less than $5,000 | 4 (1.0%) | 6 (7.0%) |
| $5,000 to $9,999 | 0 (0.0%) | 0 (0.0%) |
| $10,000 to $14,999 | 9 (2.2%) | 4 (4.6%) |
| $15,000 to $19,999 | 3 (0.7%) | 0 (0.0%) |
| $20,000 to $24,999 | 18 (4.5%) | 4 (4.6%) |
| $25,000 to $34,999 | 13 (3.2%) | 22 (25.6%) |
| $35,000 to $49,999 | 73 (18.1%) | 3 (3.5%) |
| $50,000 to $74,999 | 106 (26.3%) | 24 (27.9%) |
| $75,000 to $99,999 | 69 (17.1%) | 23 (26.7%) |
| $100,000 to $149,999 | 75 (18.6%) | 0 (0.0%) |
| $150,000 or more | 33 (8.2%) | 0 (0.0%) |
| Total | 403 (100.0%) | 86 (100.0%) |
Monthly Housing Cost Tiers in Green Springs
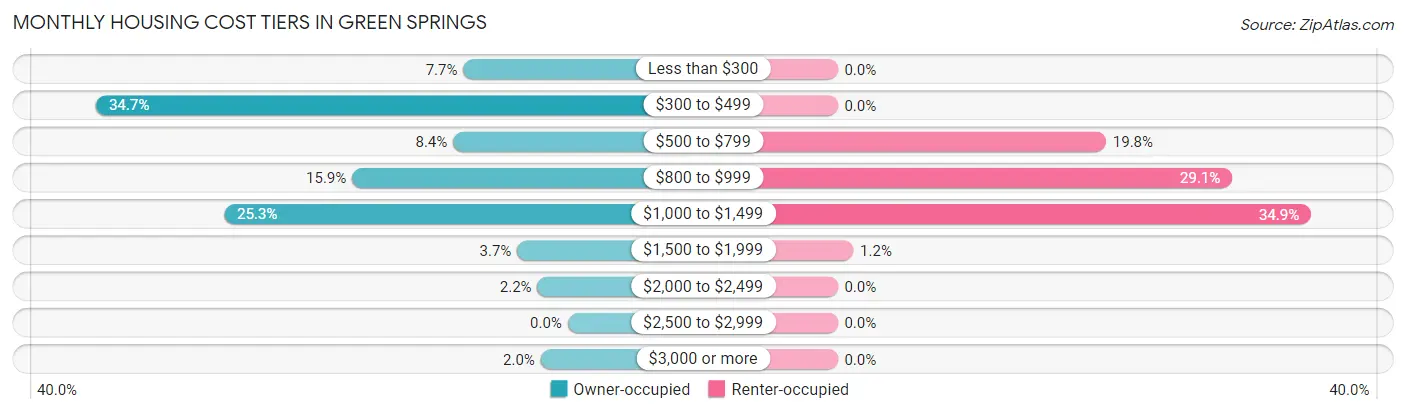
| Monthly Cost | Owner-occupied | Renter-occupied |
| Less than $300 | 31 (7.7%) | 0 (0.0%) |
| $300 to $499 | 140 (34.7%) | 0 (0.0%) |
| $500 to $799 | 34 (8.4%) | 17 (19.8%) |
| $800 to $999 | 64 (15.9%) | 25 (29.1%) |
| $1,000 to $1,499 | 102 (25.3%) | 30 (34.9%) |
| $1,500 to $1,999 | 15 (3.7%) | 1 (1.2%) |
| $2,000 to $2,499 | 9 (2.2%) | 0 (0.0%) |
| $2,500 to $2,999 | 0 (0.0%) | 0 (0.0%) |
| $3,000 or more | 8 (2.0%) | 0 (0.0%) |
| Total | 403 (100.0%) | 86 (100.0%) |
Physical Housing Characteristics in Green Springs
Housing Structures in Green Springs
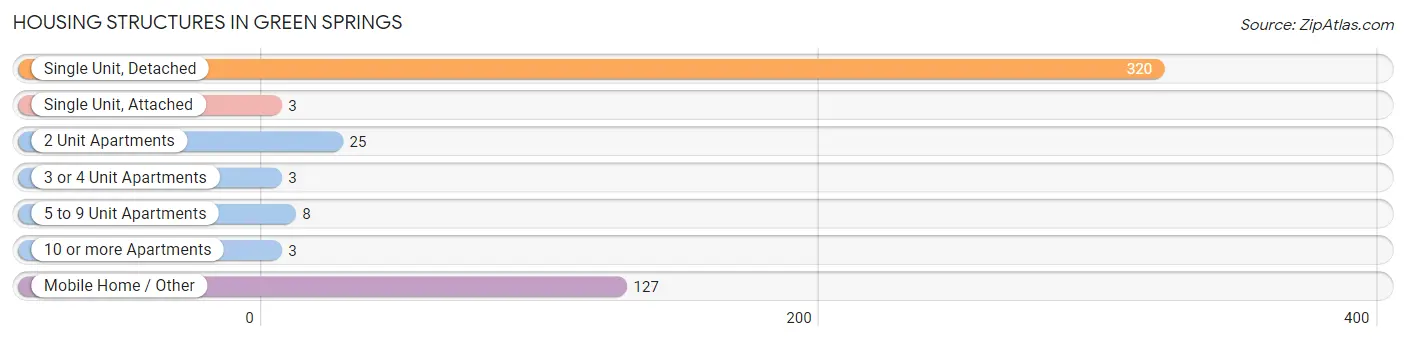
| Structure Type | # Housing Units | % Housing Units |
| Single Unit, Detached | 320 | 65.4% |
| Single Unit, Attached | 3 | 0.6% |
| 2 Unit Apartments | 25 | 5.1% |
| 3 or 4 Unit Apartments | 3 | 0.6% |
| 5 to 9 Unit Apartments | 8 | 1.6% |
| 10 or more Apartments | 3 | 0.6% |
| Mobile Home / Other | 127 | 26.0% |
| Total | 489 | 100.0% |
Housing Structures by Occupancy in Green Springs
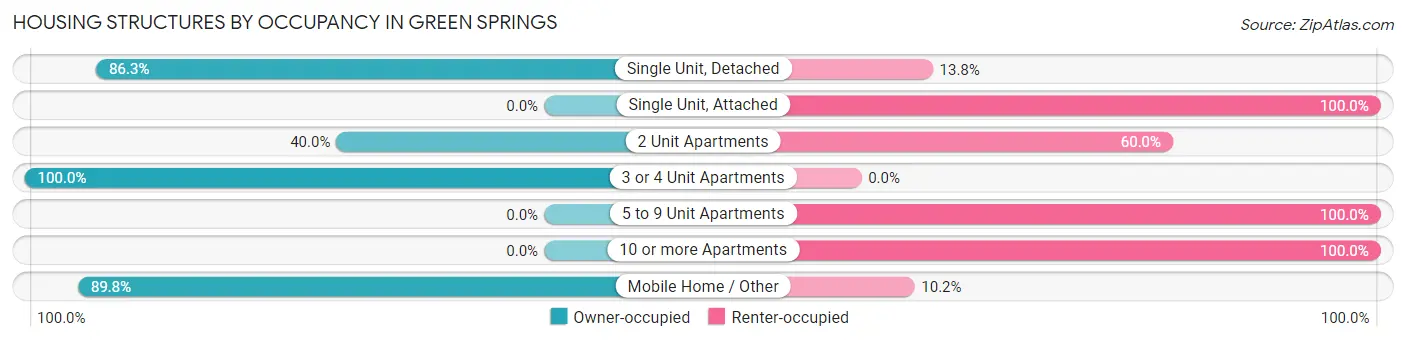
| Structure Type | Owner-occupied | Renter-occupied |
| Single Unit, Detached | 276 (86.3%) | 44 (13.8%) |
| Single Unit, Attached | 0 (0.0%) | 3 (100.0%) |
| 2 Unit Apartments | 10 (40.0%) | 15 (60.0%) |
| 3 or 4 Unit Apartments | 3 (100.0%) | 0 (0.0%) |
| 5 to 9 Unit Apartments | 0 (0.0%) | 8 (100.0%) |
| 10 or more Apartments | 0 (0.0%) | 3 (100.0%) |
| Mobile Home / Other | 114 (89.8%) | 13 (10.2%) |
| Total | 403 (82.4%) | 86 (17.6%) |
Housing Structures by Number of Rooms in Green Springs
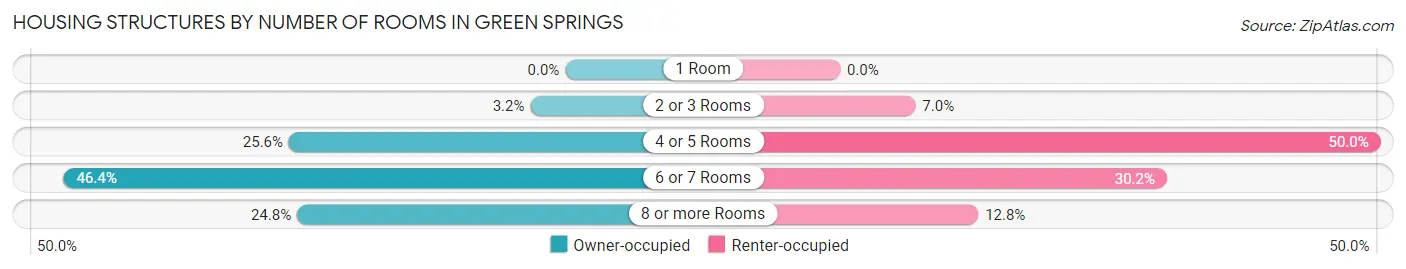
| Number of Rooms | Owner-occupied | Renter-occupied |
| 1 Room | 0 (0.0%) | 0 (0.0%) |
| 2 or 3 Rooms | 13 (3.2%) | 6 (7.0%) |
| 4 or 5 Rooms | 103 (25.6%) | 43 (50.0%) |
| 6 or 7 Rooms | 187 (46.4%) | 26 (30.2%) |
| 8 or more Rooms | 100 (24.8%) | 11 (12.8%) |
| Total | 403 (100.0%) | 86 (100.0%) |
Housing Structure by Heating Type in Green Springs
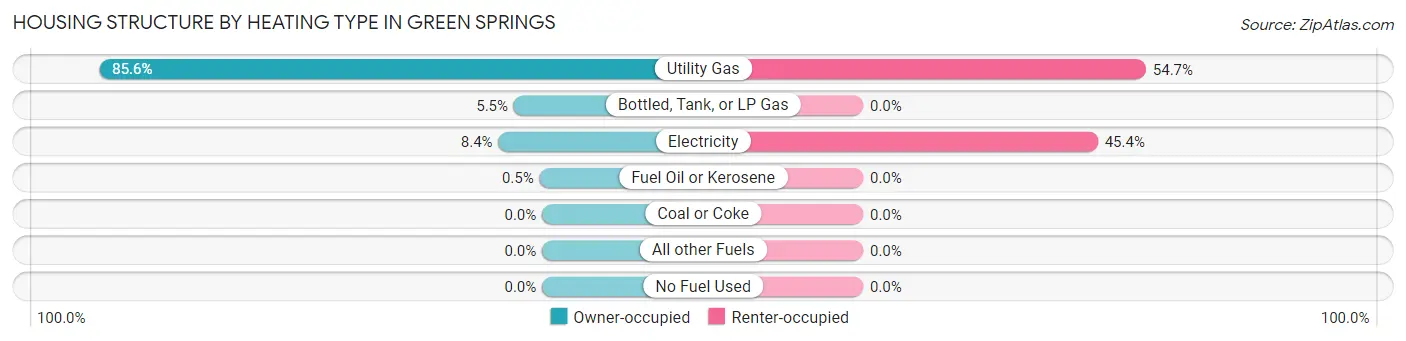
| Heating Type | Owner-occupied | Renter-occupied |
| Utility Gas | 345 (85.6%) | 47 (54.6%) |
| Bottled, Tank, or LP Gas | 22 (5.5%) | 0 (0.0%) |
| Electricity | 34 (8.4%) | 39 (45.4%) |
| Fuel Oil or Kerosene | 2 (0.5%) | 0 (0.0%) |
| Coal or Coke | 0 (0.0%) | 0 (0.0%) |
| All other Fuels | 0 (0.0%) | 0 (0.0%) |
| No Fuel Used | 0 (0.0%) | 0 (0.0%) |
| Total | 403 (100.0%) | 86 (100.0%) |
Household Vehicle Usage in Green Springs
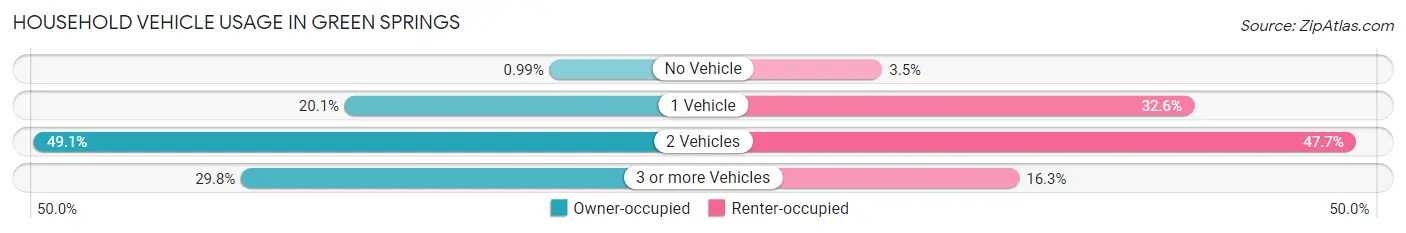
| Vehicles per Household | Owner-occupied | Renter-occupied |
| No Vehicle | 4 (1.0%) | 3 (3.5%) |
| 1 Vehicle | 81 (20.1%) | 28 (32.6%) |
| 2 Vehicles | 198 (49.1%) | 41 (47.7%) |
| 3 or more Vehicles | 120 (29.8%) | 14 (16.3%) |
| Total | 403 (100.0%) | 86 (100.0%) |
Real Estate & Mortgages in Green Springs
Real Estate and Mortgage Overview in Green Springs
| Characteristic | Without Mortgage | With Mortgage |
| Housing Units | 188 | 215 |
| Median Property Value | - | - |
| Median Household Income | $73,333 | $25 |
| Monthly Housing Costs | $364 | $8 |
| Real Estate Taxes | $760 | $3 |
Property Value by Mortgage Status in Green Springs
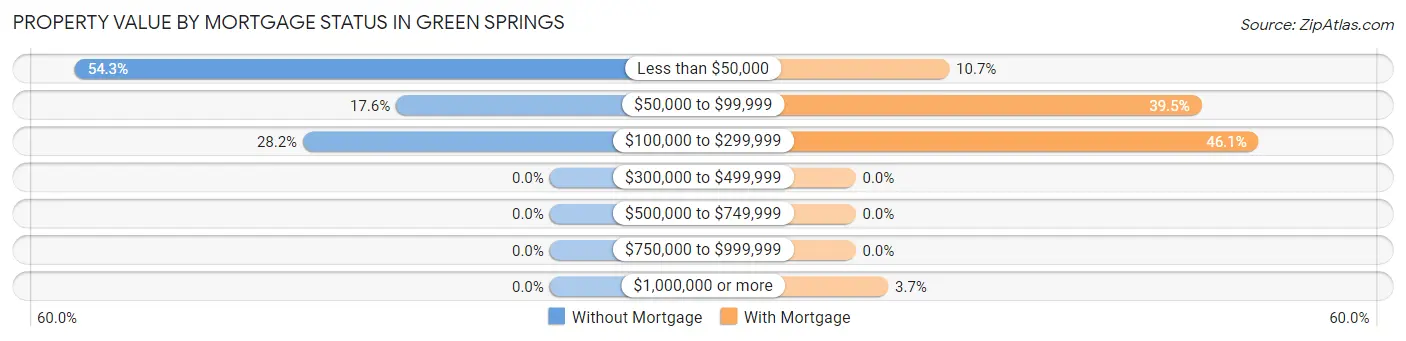
| Property Value | Without Mortgage | With Mortgage |
| Less than $50,000 | 102 (54.3%) | 23 (10.7%) |
| $50,000 to $99,999 | 33 (17.5%) | 85 (39.5%) |
| $100,000 to $299,999 | 53 (28.2%) | 99 (46.1%) |
| $300,000 to $499,999 | 0 (0.0%) | 0 (0.0%) |
| $500,000 to $749,999 | 0 (0.0%) | 0 (0.0%) |
| $750,000 to $999,999 | 0 (0.0%) | 0 (0.0%) |
| $1,000,000 or more | 0 (0.0%) | 8 (3.7%) |
| Total | 188 (100.0%) | 215 (100.0%) |
Household Income by Mortgage Status in Green Springs
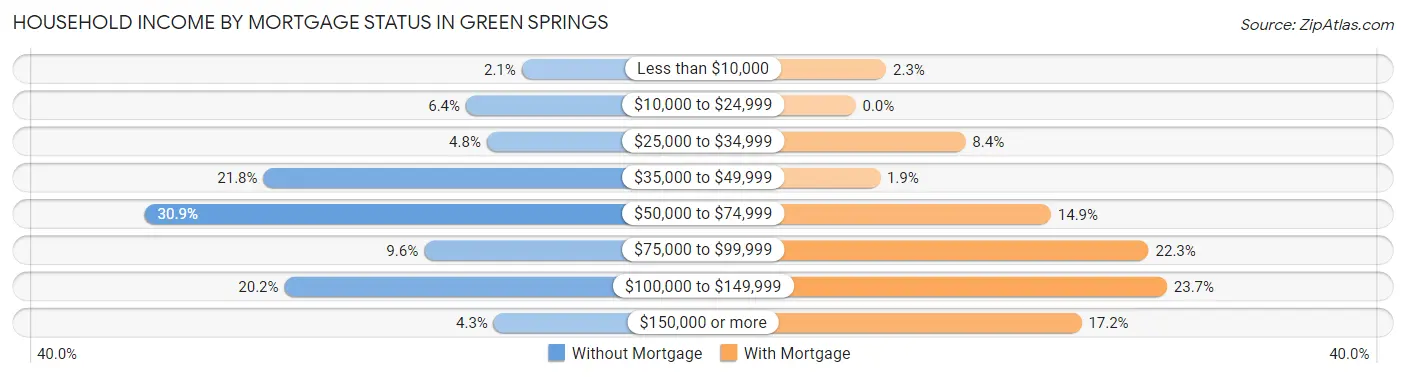
| Household Income | Without Mortgage | With Mortgage |
| Less than $10,000 | 4 (2.1%) | 5 (2.3%) |
| $10,000 to $24,999 | 12 (6.4%) | 0 (0.0%) |
| $25,000 to $34,999 | 9 (4.8%) | 18 (8.4%) |
| $35,000 to $49,999 | 41 (21.8%) | 4 (1.9%) |
| $50,000 to $74,999 | 58 (30.8%) | 32 (14.9%) |
| $75,000 to $99,999 | 18 (9.6%) | 48 (22.3%) |
| $100,000 to $149,999 | 38 (20.2%) | 51 (23.7%) |
| $150,000 or more | 8 (4.3%) | 37 (17.2%) |
| Total | 188 (100.0%) | 215 (100.0%) |
Property Value to Household Income Ratio in Green Springs
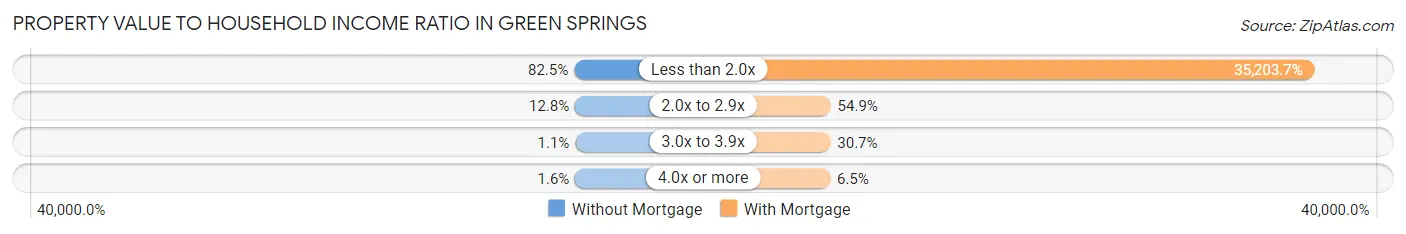
| Value-to-Income Ratio | Without Mortgage | With Mortgage |
| Less than 2.0x | 155 (82.5%) | 75,688 (35,203.7%) |
| 2.0x to 2.9x | 24 (12.8%) | 118 (54.9%) |
| 3.0x to 3.9x | 2 (1.1%) | 66 (30.7%) |
| 4.0x or more | 3 (1.6%) | 14 (6.5%) |
| Total | 188 (100.0%) | 215 (100.0%) |
Real Estate Taxes by Mortgage Status in Green Springs
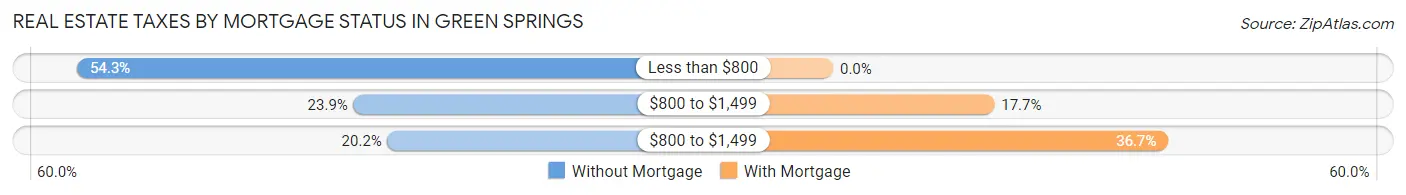
| Property Taxes | Without Mortgage | With Mortgage |
| Less than $800 | 102 (54.3%) | 0 (0.0%) |
| $800 to $1,499 | 45 (23.9%) | 38 (17.7%) |
| $800 to $1,499 | 38 (20.2%) | 79 (36.7%) |
| Total | 188 (100.0%) | 215 (100.0%) |
Health & Disability in Green Springs
Health Insurance Coverage by Age in Green Springs
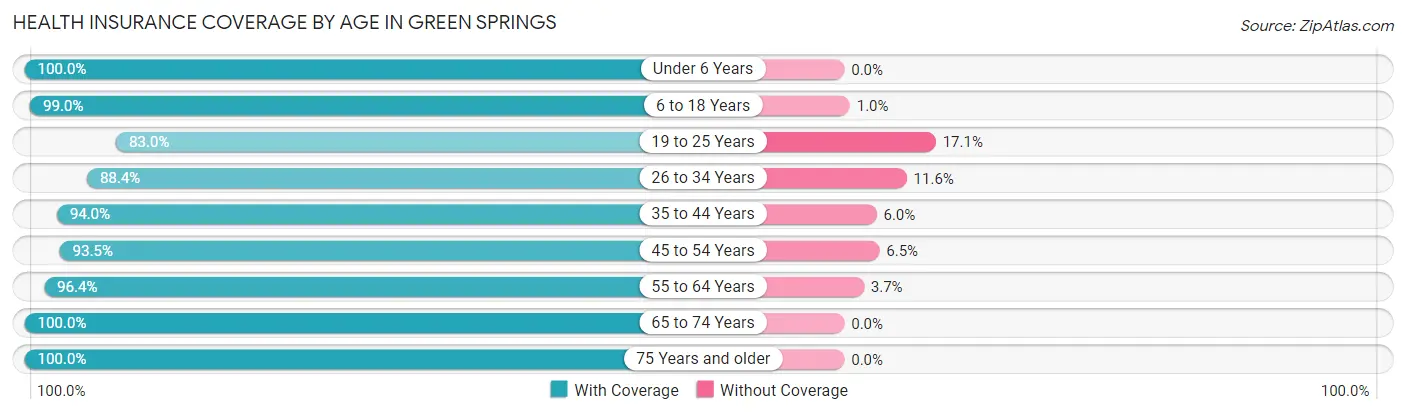
| Age Bracket | With Coverage | Without Coverage |
| Under 6 Years | 112 (100.0%) | 0 (0.0%) |
| 6 to 18 Years | 195 (99.0%) | 2 (1.0%) |
| 19 to 25 Years | 107 (83.0%) | 22 (17.1%) |
| 26 to 34 Years | 152 (88.4%) | 20 (11.6%) |
| 35 to 44 Years | 172 (94.0%) | 11 (6.0%) |
| 45 to 54 Years | 143 (93.5%) | 10 (6.5%) |
| 55 to 64 Years | 132 (96.4%) | 5 (3.6%) |
| 65 to 74 Years | 116 (100.0%) | 0 (0.0%) |
| 75 Years and older | 41 (100.0%) | 0 (0.0%) |
| Total | 1,170 (94.4%) | 70 (5.7%) |
Health Insurance Coverage by Citizenship Status in Green Springs
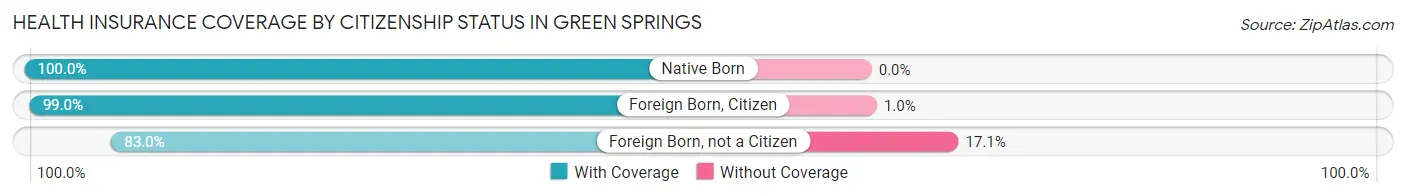
| Citizenship Status | With Coverage | Without Coverage |
| Native Born | 112 (100.0%) | 0 (0.0%) |
| Foreign Born, Citizen | 195 (99.0%) | 2 (1.0%) |
| Foreign Born, not a Citizen | 107 (83.0%) | 22 (17.1%) |
Health Insurance Coverage by Household Income in Green Springs
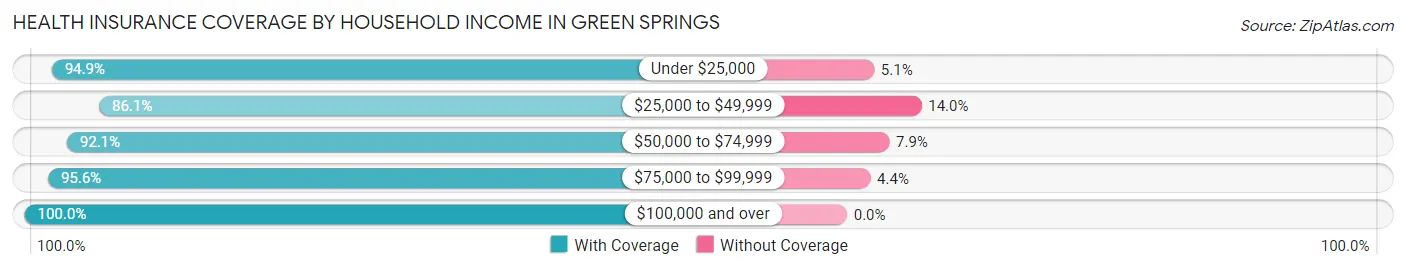
| Household Income | With Coverage | Without Coverage |
| Under $25,000 | 56 (94.9%) | 3 (5.1%) |
| $25,000 to $49,999 | 185 (86.1%) | 30 (14.0%) |
| $50,000 to $74,999 | 279 (92.1%) | 24 (7.9%) |
| $75,000 to $99,999 | 262 (95.6%) | 12 (4.4%) |
| $100,000 and over | 382 (100.0%) | 0 (0.0%) |
Public vs Private Health Insurance Coverage by Age in Green Springs
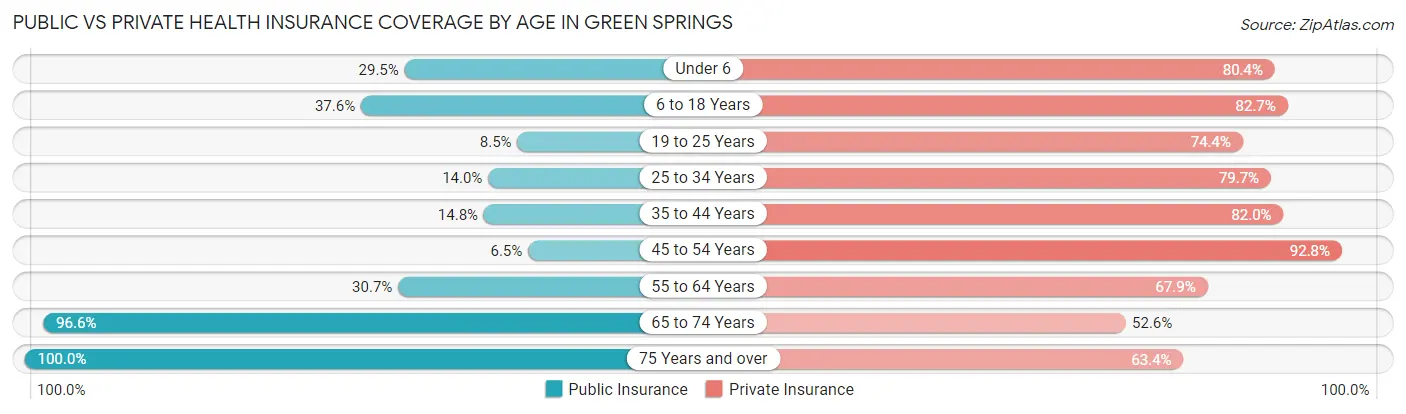
| Age Bracket | Public Insurance | Private Insurance |
| Under 6 | 33 (29.5%) | 90 (80.4%) |
| 6 to 18 Years | 74 (37.6%) | 163 (82.7%) |
| 19 to 25 Years | 11 (8.5%) | 96 (74.4%) |
| 25 to 34 Years | 24 (14.0%) | 137 (79.6%) |
| 35 to 44 Years | 27 (14.7%) | 150 (82.0%) |
| 45 to 54 Years | 10 (6.5%) | 142 (92.8%) |
| 55 to 64 Years | 42 (30.7%) | 93 (67.9%) |
| 65 to 74 Years | 112 (96.6%) | 61 (52.6%) |
| 75 Years and over | 41 (100.0%) | 26 (63.4%) |
| Total | 374 (30.2%) | 958 (77.3%) |
Disability Status by Sex by Age in Green Springs
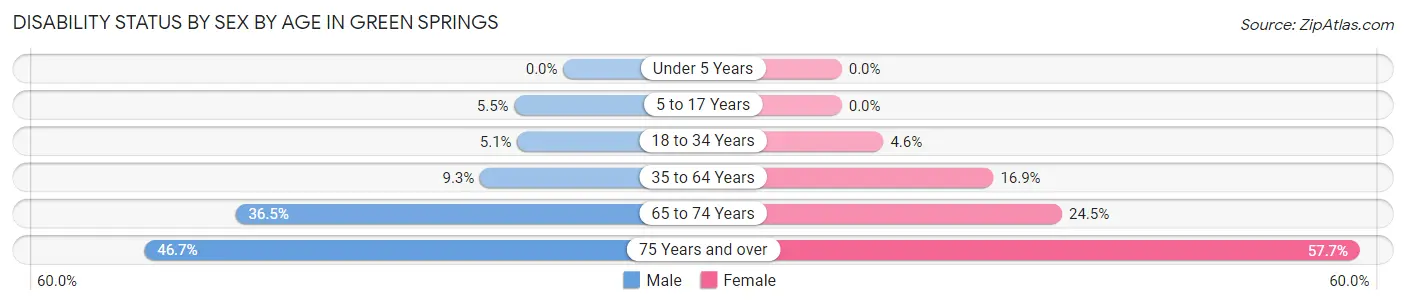
| Age Bracket | Male | Female |
| Under 5 Years | 0 (0.0%) | 0 (0.0%) |
| 5 to 17 Years | 6 (5.4%) | 0 (0.0%) |
| 18 to 34 Years | 9 (5.1%) | 7 (4.6%) |
| 35 to 64 Years | 23 (9.3%) | 38 (16.9%) |
| 65 to 74 Years | 23 (36.5%) | 13 (24.5%) |
| 75 Years and over | 7 (46.7%) | 15 (57.7%) |
Disability Class by Sex by Age in Green Springs
Disability Class: Hearing Difficulty
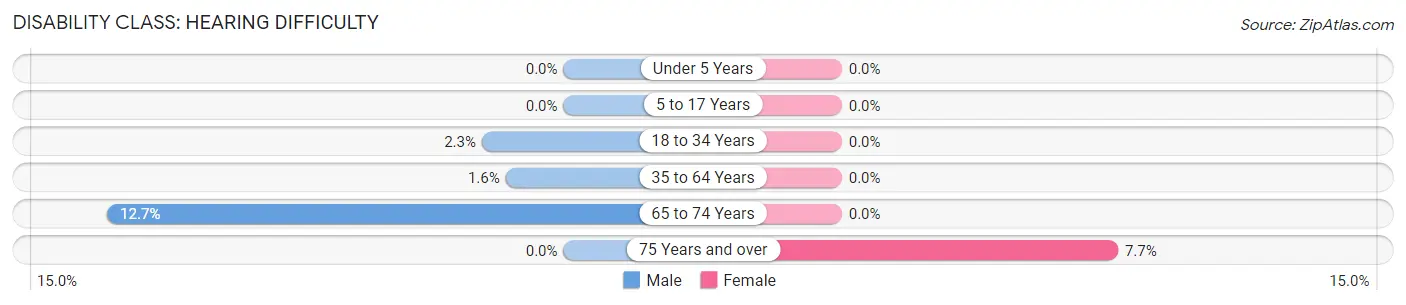
| Age Bracket | Male | Female |
| Under 5 Years | 0 (0.0%) | 0 (0.0%) |
| 5 to 17 Years | 0 (0.0%) | 0 (0.0%) |
| 18 to 34 Years | 4 (2.3%) | 0 (0.0%) |
| 35 to 64 Years | 4 (1.6%) | 0 (0.0%) |
| 65 to 74 Years | 8 (12.7%) | 0 (0.0%) |
| 75 Years and over | 0 (0.0%) | 2 (7.7%) |
Disability Class: Vision Difficulty
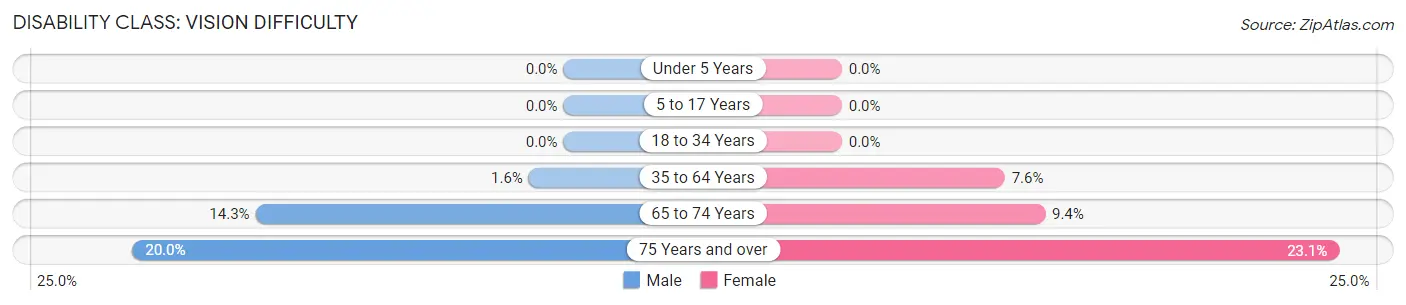
| Age Bracket | Male | Female |
| Under 5 Years | 0 (0.0%) | 0 (0.0%) |
| 5 to 17 Years | 0 (0.0%) | 0 (0.0%) |
| 18 to 34 Years | 0 (0.0%) | 0 (0.0%) |
| 35 to 64 Years | 4 (1.6%) | 17 (7.6%) |
| 65 to 74 Years | 9 (14.3%) | 5 (9.4%) |
| 75 Years and over | 3 (20.0%) | 6 (23.1%) |
Disability Class: Cognitive Difficulty
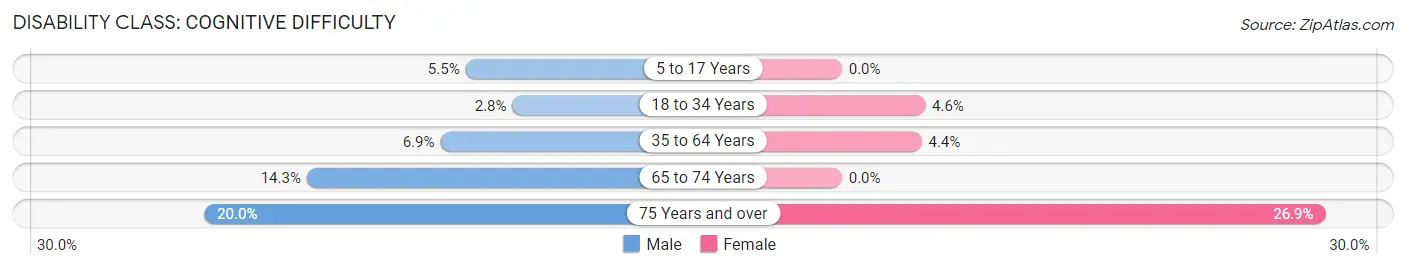
| Age Bracket | Male | Female |
| 5 to 17 Years | 6 (5.4%) | 0 (0.0%) |
| 18 to 34 Years | 5 (2.8%) | 7 (4.6%) |
| 35 to 64 Years | 17 (6.9%) | 10 (4.4%) |
| 65 to 74 Years | 9 (14.3%) | 0 (0.0%) |
| 75 Years and over | 3 (20.0%) | 7 (26.9%) |
Disability Class: Ambulatory Difficulty
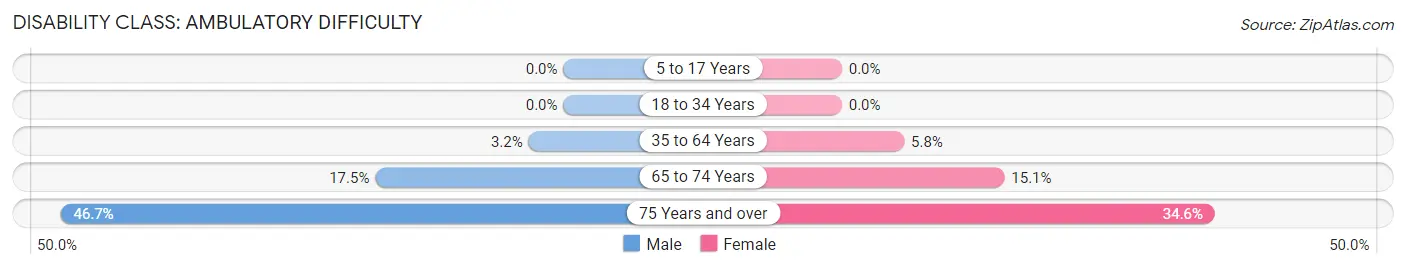
| Age Bracket | Male | Female |
| 5 to 17 Years | 0 (0.0%) | 0 (0.0%) |
| 18 to 34 Years | 0 (0.0%) | 0 (0.0%) |
| 35 to 64 Years | 8 (3.2%) | 13 (5.8%) |
| 65 to 74 Years | 11 (17.5%) | 8 (15.1%) |
| 75 Years and over | 7 (46.7%) | 9 (34.6%) |
Disability Class: Self-Care Difficulty
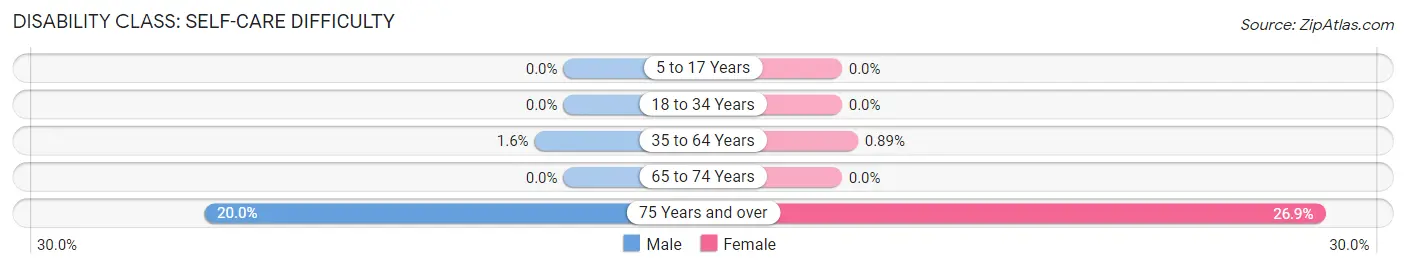
| Age Bracket | Male | Female |
| 5 to 17 Years | 0 (0.0%) | 0 (0.0%) |
| 18 to 34 Years | 0 (0.0%) | 0 (0.0%) |
| 35 to 64 Years | 4 (1.6%) | 2 (0.9%) |
| 65 to 74 Years | 0 (0.0%) | 0 (0.0%) |
| 75 Years and over | 3 (20.0%) | 7 (26.9%) |
Technology Access in Green Springs
Computing Device Access in Green Springs
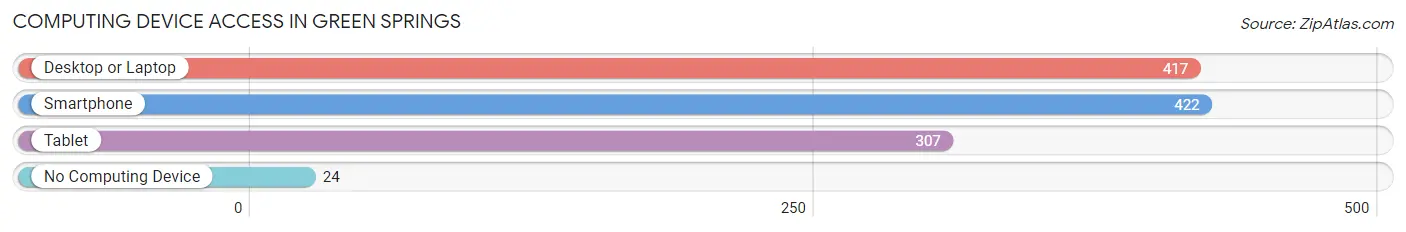
| Device Type | # Households | % Households |
| Desktop or Laptop | 417 | 85.3% |
| Smartphone | 422 | 86.3% |
| Tablet | 307 | 62.8% |
| No Computing Device | 24 | 4.9% |
| Total | 489 | 100.0% |
Internet Access in Green Springs
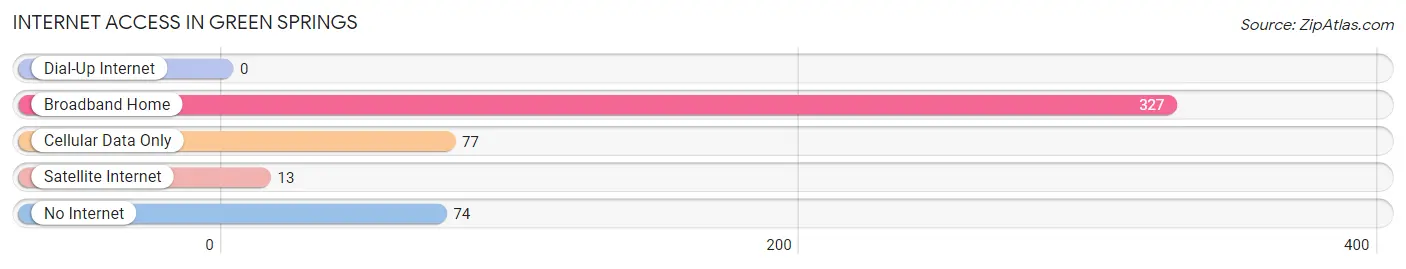
| Internet Type | # Households | % Households |
| Dial-Up Internet | 0 | 0.0% |
| Broadband Home | 327 | 66.9% |
| Cellular Data Only | 77 | 15.8% |
| Satellite Internet | 13 | 2.7% |
| No Internet | 74 | 15.1% |
| Total | 489 | 100.0% |
Green Springs Summary
History
Green Springs is a small village located in Sandusky County, Ohio. It is situated on the banks of the Sandusky River, approximately 20 miles southeast of Toledo. The village was founded in 1837 by a group of settlers from Pennsylvania and New York. The settlers were attracted to the area due to its fertile soil and abundant natural resources.
The village was originally known as “Green Springs Station” due to its proximity to the railroad station. The village was officially incorporated in 1867 and the name was changed to Green Springs.
The village was a popular destination for tourists in the late 19th and early 20th centuries. It was known for its mineral springs, which were believed to have healing properties. The village also had a number of resorts and hotels, which attracted visitors from all over the country.
The village was also home to a number of factories, including a glass factory, a brickyard, and a furniture factory. These factories provided employment for many of the residents of Green Springs.
Geography
Green Springs is located in Sandusky County, Ohio. It is situated on the banks of the Sandusky River, approximately 20 miles southeast of Toledo. The village is located in a rural area, surrounded by farmland and woodlands.
The village has a total area of 0.8 square miles, all of which is land. The village is located at an elevation of 825 feet above sea level.
Economy
The economy of Green Springs is largely based on agriculture and tourism. The village is home to a number of farms, which produce a variety of crops, including corn, soybeans, and wheat. The village also has a number of tourist attractions, including the mineral springs, which attract visitors from all over the country.
The village is also home to a number of small businesses, including restaurants, shops, and other services. The village also has a number of manufacturing businesses, including a glass factory, a brickyard, and a furniture factory.
Demographics
As of the 2010 census, the population of Green Springs was 1,845. The population density was 2,323.7 people per square mile. The racial makeup of the village was 97.3% White, 0.7% African American, 0.2% Native American, 0.2% Asian, 0.1% from other races, and 1.5% from two or more races. Hispanic or Latino of any race were 0.7% of the population.
The median income for a household in the village was $41,250, and the median income for a family was $50,000. The per capita income for the village was $20,845. About 8.3% of families and 10.2% of the population were below the poverty line, including 14.3% of those under age 18 and 5.2% of those age 65 or over.
Common Questions
What is Per Capita Income in Green Springs?
Per Capita income in Green Springs is $30,439.
What is the Median Family Income in Green Springs?
Median Family Income in Green Springs is $64,643.
What is the Median Household income in Green Springs?
Median Household Income in Green Springs is $72,861.
What is Income or Wage Gap in Green Springs?
Income or Wage Gap in Green Springs is 37.1%.
Women in Green Springs earn 62.9 cents for every dollar earned by a man.
What is Inequality or Gini Index in Green Springs?
Inequality or Gini Index in Green Springs is 0.33.
What is the Total Population of Green Springs?
Total Population of Green Springs is 1,309.
What is the Total Male Population of Green Springs?
Total Male Population of Green Springs is 665.
What is the Total Female Population of Green Springs?
Total Female Population of Green Springs is 644.
What is the Ratio of Males per 100 Females in Green Springs?
There are 103.26 Males per 100 Females in Green Springs.
What is the Ratio of Females per 100 Males in Green Springs?
There are 96.84 Females per 100 Males in Green Springs.
What is the Median Population Age in Green Springs?
Median Population Age in Green Springs is 37.8 Years.
What is the Average Family Size in Green Springs
Average Family Size in Green Springs is 2.9 People.
What is the Average Household Size in Green Springs
Average Household Size in Green Springs is 2.5 People.
How Large is the Labor Force in Green Springs?
There are 701 People in the Labor Forcein in Green Springs.
What is the Percentage of People in the Labor Force in Green Springs?
66.6% of People are in the Labor Force in Green Springs.
What is the Unemployment Rate in Green Springs?
Unemployment Rate in Green Springs is 2.1%.