Gordon, OH Map & Demographics
Gordon Map
Gordon Overview
$33,275
PER CAPITA INCOME
$88,333
AVG FAMILY INCOME
$69,250
AVG HOUSEHOLD INCOME
56.7%
WAGE / INCOME GAP [ % ]
43.3¢/ $1
WAGE / INCOME GAP [ $ ]
0.37
INEQUALITY / GINI INDEX
247
TOTAL POPULATION
128
MALE POPULATION
119
FEMALE POPULATION
107.56
MALES / 100 FEMALES
92.97
FEMALES / 100 MALES
41.4
MEDIAN AGE
2.6
AVG FAMILY SIZE
2.2
AVG HOUSEHOLD SIZE
135
LABOR FORCE [ PEOPLE ]
65.5%
PERCENT IN LABOR FORCE
8.1%
UNEMPLOYMENT RATE
Gordon Area Codes
Income in Gordon
Income Overview in Gordon
Per Capita Income in Gordon is $33,275, while median incomes of families and households are $88,333 and $69,250 respectively.
| Characteristic | Number | Measure |
| Per Capita Income | 247 | $33,275 |
| Median Family Income | 78 | $88,333 |
| Mean Family Income | 78 | $90,937 |
| Median Household Income | 113 | $69,250 |
| Mean Household Income | 113 | $72,363 |
| Income Deficit | 78 | $0 |
| Wage / Income Gap (%) | 247 | 56.69% |
| Wage / Income Gap ($) | 247 | 43.31¢ per $1 |
| Gini / Inequality Index | 247 | 0.37 |
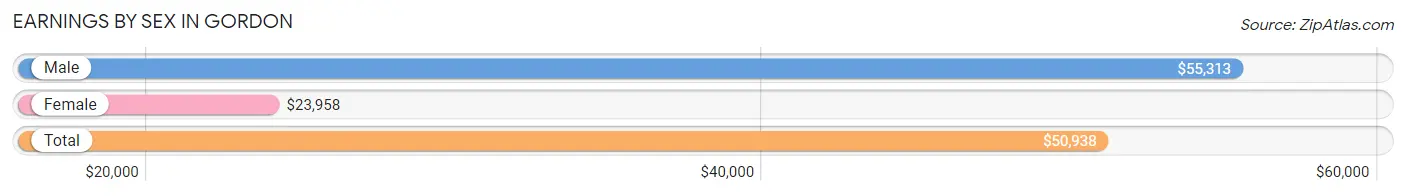
Earnings by Sex in Gordon
Average Earnings in Gordon are $50,938, $55,313 for men and $23,958 for women, a difference of 56.7%.
| Sex | Number | Average Earnings |
| Male | 81 (57.9%) | $55,313 |
| Female | 59 (42.1%) | $23,958 |
| Total | 140 (100.0%) | $50,938 |
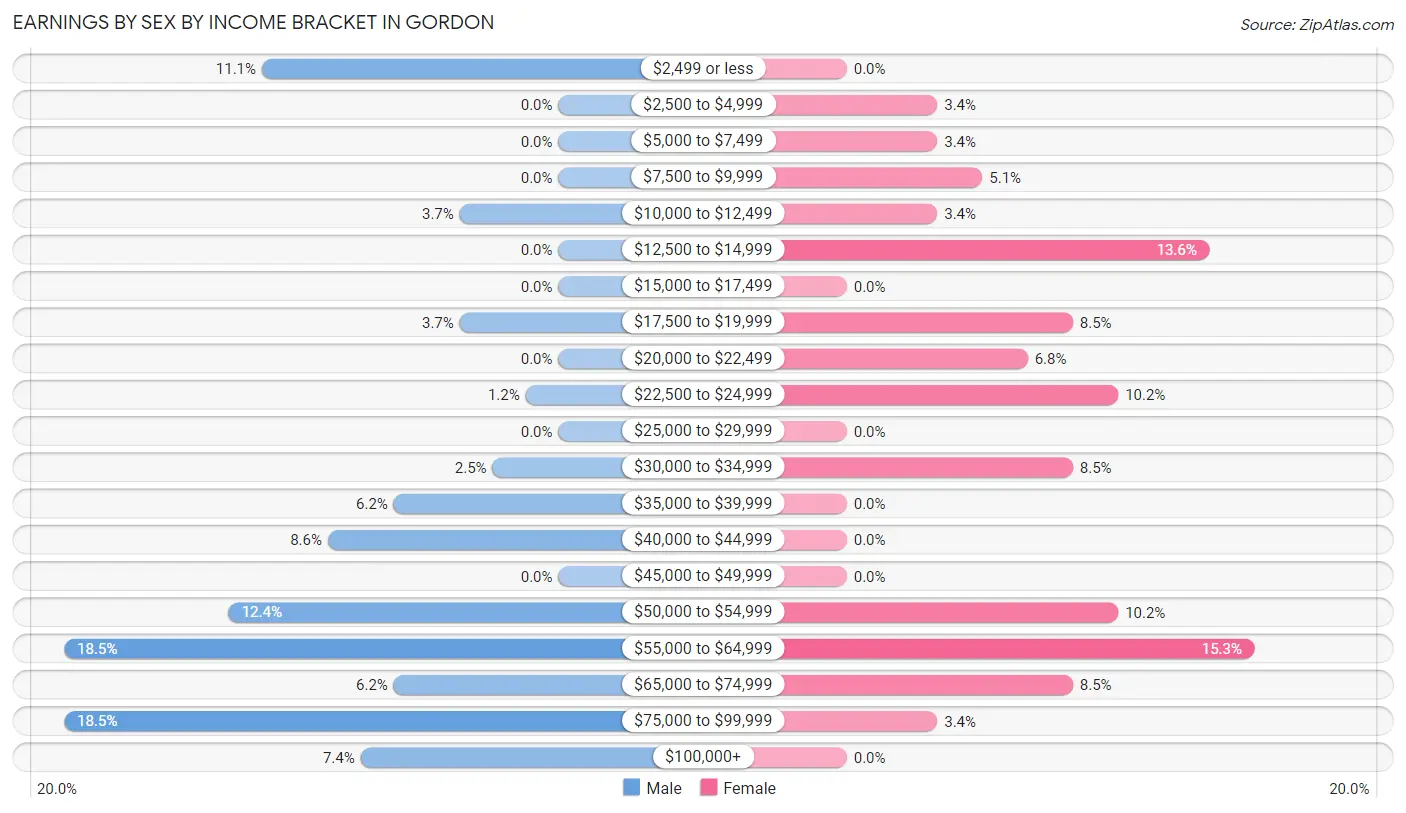
Earnings by Sex by Income Bracket in Gordon
The most common earnings brackets in Gordon are $55,000 to $64,999 for men (15 | 18.5%) and $55,000 to $64,999 for women (9 | 15.2%).
| Income | Male | Female |
| $2,499 or less | 9 (11.1%) | 0 (0.0%) |
| $2,500 to $4,999 | 0 (0.0%) | 2 (3.4%) |
| $5,000 to $7,499 | 0 (0.0%) | 2 (3.4%) |
| $7,500 to $9,999 | 0 (0.0%) | 3 (5.1%) |
| $10,000 to $12,499 | 3 (3.7%) | 2 (3.4%) |
| $12,500 to $14,999 | 0 (0.0%) | 8 (13.6%) |
| $15,000 to $17,499 | 0 (0.0%) | 0 (0.0%) |
| $17,500 to $19,999 | 3 (3.7%) | 5 (8.5%) |
| $20,000 to $22,499 | 0 (0.0%) | 4 (6.8%) |
| $22,500 to $24,999 | 1 (1.2%) | 6 (10.2%) |
| $25,000 to $29,999 | 0 (0.0%) | 0 (0.0%) |
| $30,000 to $34,999 | 2 (2.5%) | 5 (8.5%) |
| $35,000 to $39,999 | 5 (6.2%) | 0 (0.0%) |
| $40,000 to $44,999 | 7 (8.6%) | 0 (0.0%) |
| $45,000 to $49,999 | 0 (0.0%) | 0 (0.0%) |
| $50,000 to $54,999 | 10 (12.3%) | 6 (10.2%) |
| $55,000 to $64,999 | 15 (18.5%) | 9 (15.2%) |
| $65,000 to $74,999 | 5 (6.2%) | 5 (8.5%) |
| $75,000 to $99,999 | 15 (18.5%) | 2 (3.4%) |
| $100,000+ | 6 (7.4%) | 0 (0.0%) |
| Total | 81 (100.0%) | 59 (100.0%) |
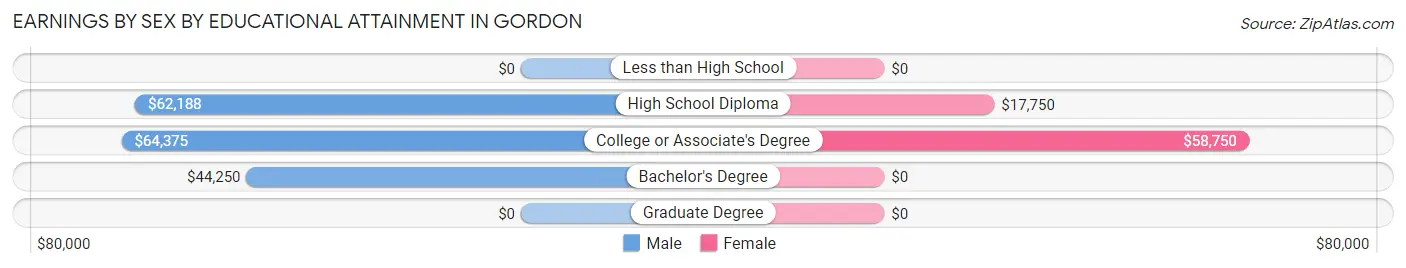
Earnings by Sex by Educational Attainment in Gordon
Average earnings in Gordon are $60,938 for men and $27,500 for women, a difference of 54.9%. Men with an educational attainment of college or associate's degree enjoy the highest average annual earnings of $64,375, while those with bachelor's degree education earn the least with $44,250. Women with an educational attainment of college or associate's degree earn the most with the average annual earnings of $58,750, while those with high school diploma education have the smallest earnings of $17,750.
| Educational Attainment | Male Income | Female Income |
| Less than High School | - | - |
| High School Diploma | $62,188 | $17,750 |
| College or Associate's Degree | $64,375 | $58,750 |
| Bachelor's Degree | $44,250 | $0 |
| Graduate Degree | - | - |
| Total | $60,938 | $27,500 |
Family Income in Gordon
Family Income Brackets in Gordon
According to the Gordon family income data, there are 22 families falling into the $75,000 to $99,999 income range, which is the most common income bracket and makes up 28.2% of all families. Conversely, the less than $10,000 income bracket is the least frequent group with only 1 families (1.3%) belonging to this category.
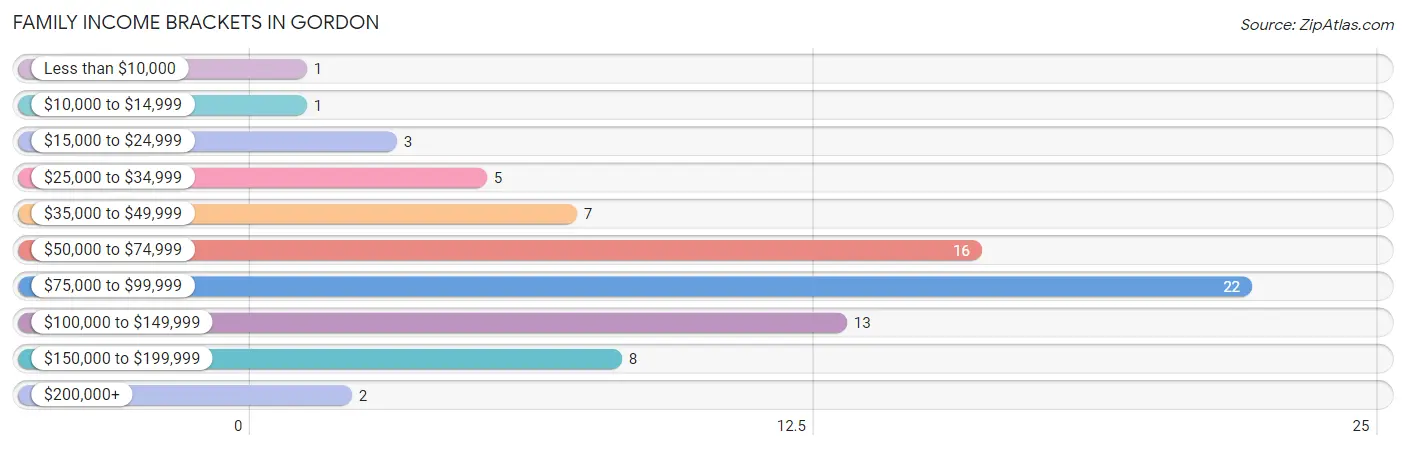
| Income Bracket | # Families | % Families |
| Less than $10,000 | 1 | 1.3% |
| $10,000 to $14,999 | 1 | 1.3% |
| $15,000 to $24,999 | 3 | 3.8% |
| $25,000 to $34,999 | 5 | 6.4% |
| $35,000 to $49,999 | 7 | 9.0% |
| $50,000 to $74,999 | 16 | 20.5% |
| $75,000 to $99,999 | 22 | 28.2% |
| $100,000 to $149,999 | 13 | 16.7% |
| $150,000 to $199,999 | 8 | 10.3% |
| $200,000+ | 2 | 2.6% |
Family Income by Famaliy Size in Gordon
2-person families (40 | 51.3%) account for the highest median family income in Gordon with $87,500 per family, while 2-person families (40 | 51.3%) have the highest median income of $43,750 per family member.
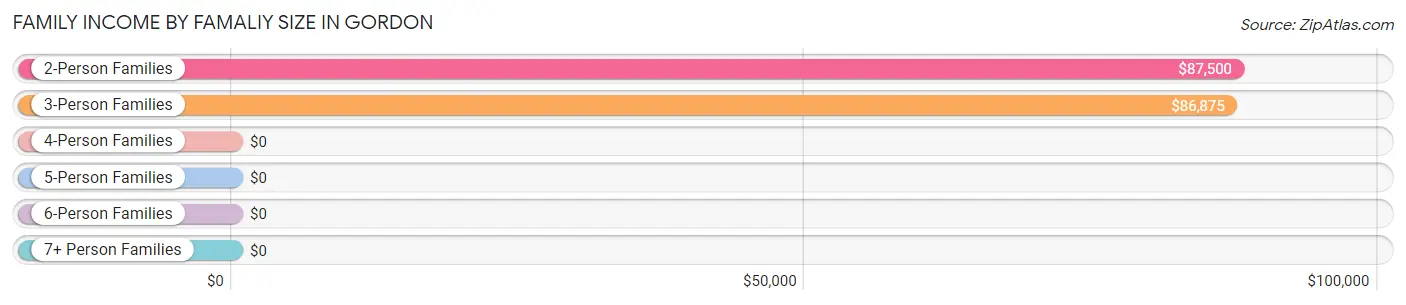
| Income Bracket | # Families | Median Income |
| 2-Person Families | 40 (51.3%) | $87,500 |
| 3-Person Families | 25 (32.1%) | $86,875 |
| 4-Person Families | 9 (11.5%) | $0 |
| 5-Person Families | 0 (0.0%) | $0 |
| 6-Person Families | 0 (0.0%) | $0 |
| 7+ Person Families | 4 (5.1%) | $0 |
| Total | 78 (100.0%) | $88,333 |
Family Income by Number of Earners in Gordon
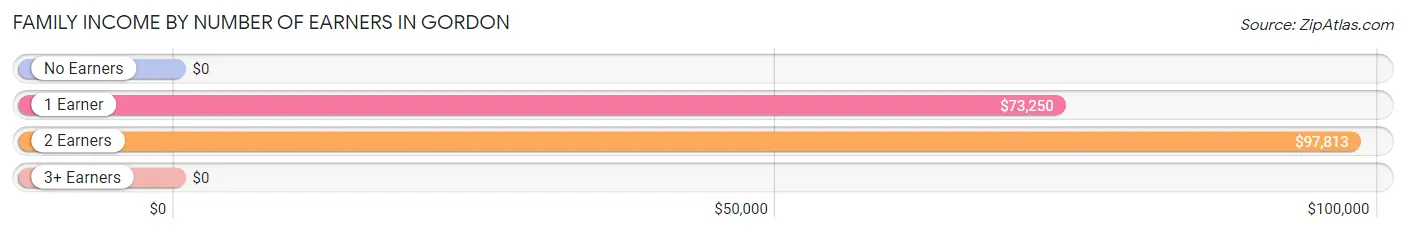
| Number of Earners | # Families | Median Income |
| No Earners | 3 (3.8%) | $0 |
| 1 Earner | 33 (42.3%) | $73,250 |
| 2 Earners | 38 (48.7%) | $97,813 |
| 3+ Earners | 4 (5.1%) | $0 |
| Total | 78 (100.0%) | $88,333 |
Household Income in Gordon
Household Income Brackets in Gordon
With 22 households falling in the category, the $75,000 to $99,999 income range is the most frequent in Gordon, accounting for 19.5% of all households. In contrast, only 1 households (0.9%) fall into the $10,000 to $14,999 income bracket, making it the least populous group.
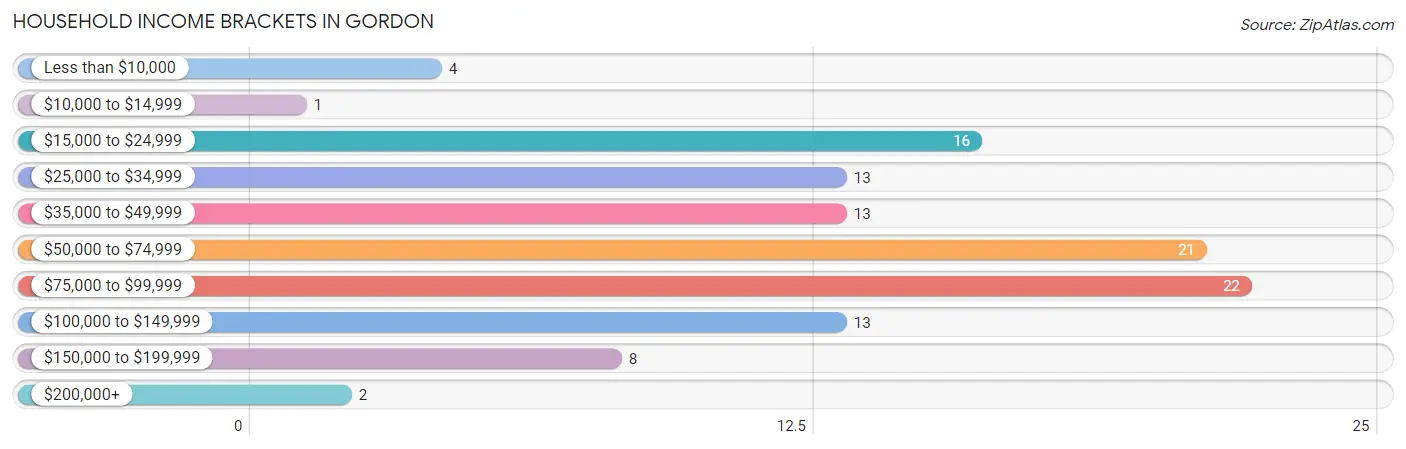
| Income Bracket | # Households | % Households |
| Less than $10,000 | 4 | 3.5% |
| $10,000 to $14,999 | 1 | 0.9% |
| $15,000 to $24,999 | 16 | 14.2% |
| $25,000 to $34,999 | 13 | 11.5% |
| $35,000 to $49,999 | 13 | 11.5% |
| $50,000 to $74,999 | 21 | 18.6% |
| $75,000 to $99,999 | 22 | 19.5% |
| $100,000 to $149,999 | 13 | 11.5% |
| $150,000 to $199,999 | 8 | 7.1% |
| $200,000+ | 2 | 1.8% |
Household Income by Householder Age in Gordon
The median household income in Gordon is $69,250, with the highest median household income of $86,875 found in the 45 to 64 years age bracket for the primary householder. A total of 35 households (31.0%) fall into this category. Meanwhile, the 15 to 24 years age bracket for the primary householder has the lowest median household income of $0, with 5 households (4.4%) in this group.
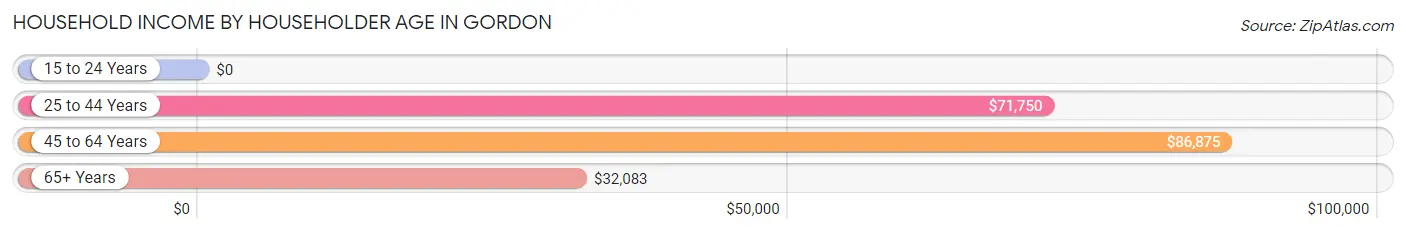
| Income Bracket | # Households | Median Income |
| 15 to 24 Years | 5 (4.4%) | $0 |
| 25 to 44 Years | 43 (38.1%) | $71,750 |
| 45 to 64 Years | 35 (31.0%) | $86,875 |
| 65+ Years | 30 (26.6%) | $32,083 |
| Total | 113 (100.0%) | $69,250 |
Poverty in Gordon
Income Below Poverty by Sex and Age in Gordon
With 3.1% poverty level for males and 5.9% for females among the residents of Gordon, 45 to 54 year old males and 6 to 11 year old females are the most vulnerable to poverty, with 1 males (12.5%) and 1 females (100.0%) in their respective age groups living below the poverty level.
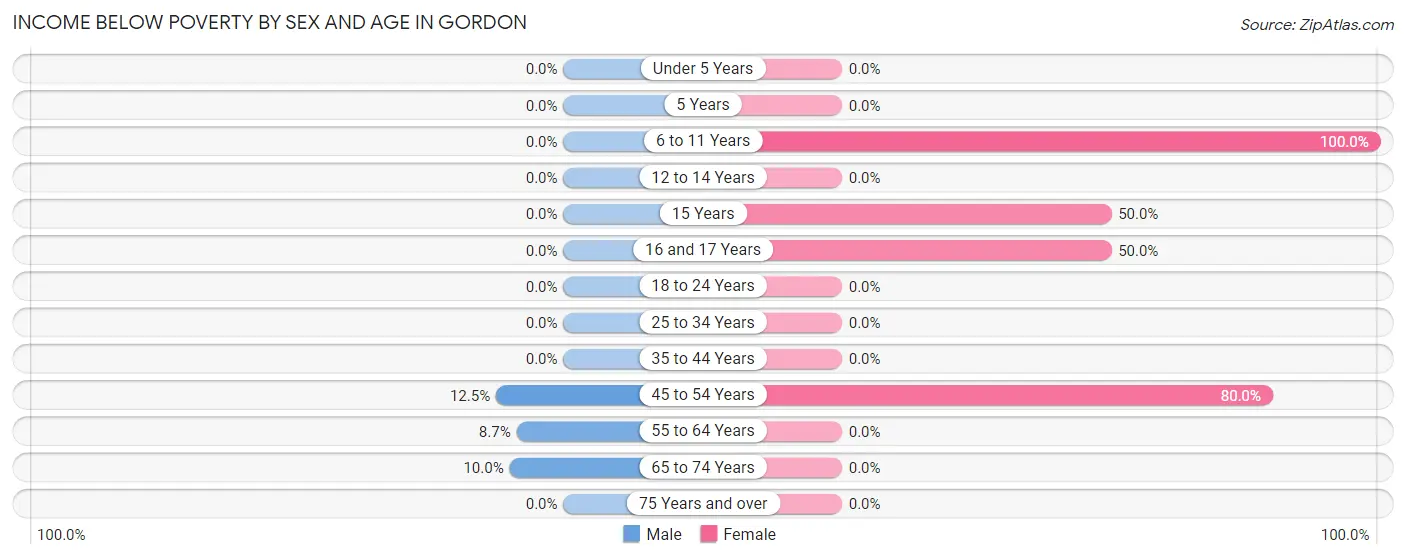
| Age Bracket | Male | Female |
| Under 5 Years | 0 (0.0%) | 0 (0.0%) |
| 5 Years | 0 (0.0%) | 0 (0.0%) |
| 6 to 11 Years | 0 (0.0%) | 1 (100.0%) |
| 12 to 14 Years | 0 (0.0%) | 0 (0.0%) |
| 15 Years | 0 (0.0%) | 1 (50.0%) |
| 16 and 17 Years | 0 (0.0%) | 1 (50.0%) |
| 18 to 24 Years | 0 (0.0%) | 0 (0.0%) |
| 25 to 34 Years | 0 (0.0%) | 0 (0.0%) |
| 35 to 44 Years | 0 (0.0%) | 0 (0.0%) |
| 45 to 54 Years | 1 (12.5%) | 4 (80.0%) |
| 55 to 64 Years | 2 (8.7%) | 0 (0.0%) |
| 65 to 74 Years | 1 (10.0%) | 0 (0.0%) |
| 75 Years and over | 0 (0.0%) | 0 (0.0%) |
| Total | 4 (3.1%) | 7 (5.9%) |
Income Above Poverty by Sex and Age in Gordon
According to the poverty statistics in Gordon, males aged under 5 years and females aged under 5 years are the age groups that are most secure financially, with 100.0% of males and 100.0% of females in these age groups living above the poverty line.
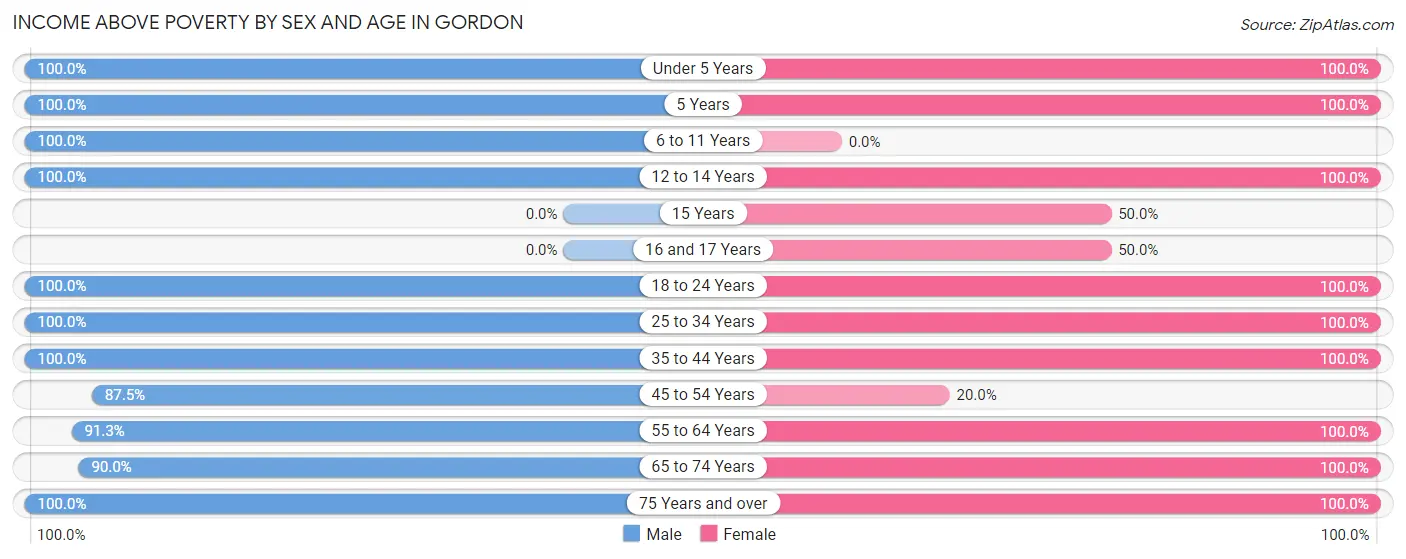
| Age Bracket | Male | Female |
| Under 5 Years | 5 (100.0%) | 7 (100.0%) |
| 5 Years | 1 (100.0%) | 1 (100.0%) |
| 6 to 11 Years | 13 (100.0%) | 0 (0.0%) |
| 12 to 14 Years | 5 (100.0%) | 6 (100.0%) |
| 15 Years | 0 (0.0%) | 1 (50.0%) |
| 16 and 17 Years | 0 (0.0%) | 1 (50.0%) |
| 18 to 24 Years | 20 (100.0%) | 9 (100.0%) |
| 25 to 34 Years | 15 (100.0%) | 13 (100.0%) |
| 35 to 44 Years | 25 (100.0%) | 20 (100.0%) |
| 45 to 54 Years | 7 (87.5%) | 1 (20.0%) |
| 55 to 64 Years | 21 (91.3%) | 28 (100.0%) |
| 65 to 74 Years | 9 (90.0%) | 13 (100.0%) |
| 75 Years and over | 3 (100.0%) | 12 (100.0%) |
| Total | 124 (96.9%) | 112 (94.1%) |
Income Below Poverty Among Married-Couple Families in Gordon
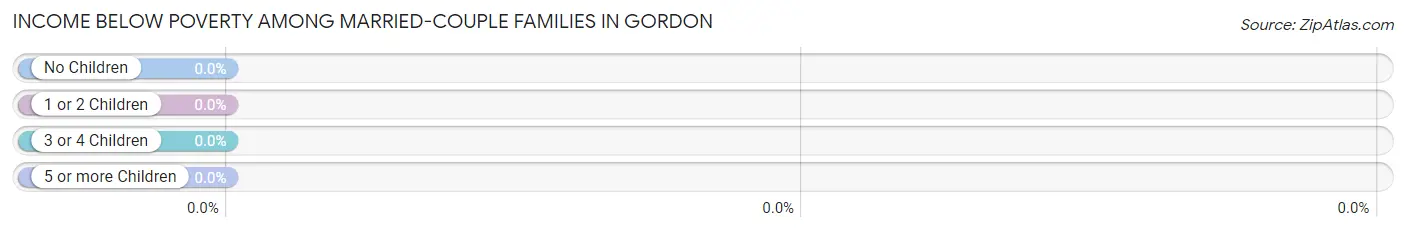
| Children | Above Poverty | Below Poverty |
| No Children | 39 (100.0%) | 0 (0.0%) |
| 1 or 2 Children | 11 (100.0%) | 0 (0.0%) |
| 3 or 4 Children | 0 (0.0%) | 0 (0.0%) |
| 5 or more Children | 4 (100.0%) | 0 (0.0%) |
| Total | 54 (100.0%) | 0 (0.0%) |
Income Below Poverty Among Single-Parent Households in Gordon
According to the poverty data in Gordon, 10.0% or 1 single-father households and 7.1% or 1 single-mother households are living below the poverty line. Among single-father households, those with 1 or 2 children have the highest poverty rate, with 1 households (100.0%) experiencing poverty. Likewise, among single-mother households, those with 1 or 2 children have the highest poverty rate, with 1 households (20.0%) falling below the poverty line.
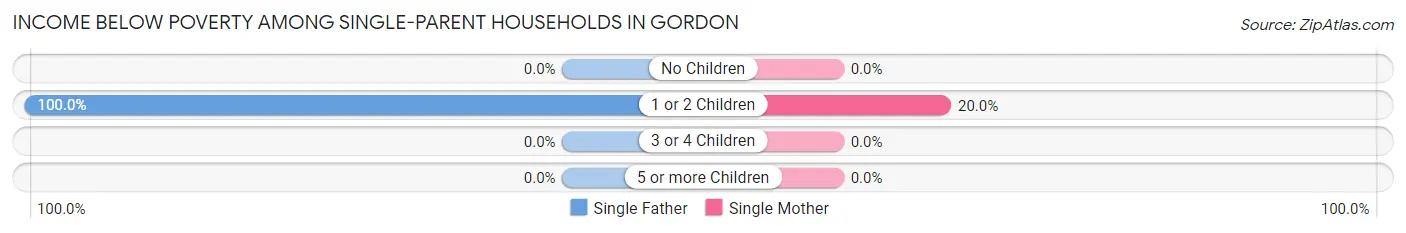
| Children | Single Father | Single Mother |
| No Children | 0 (0.0%) | 0 (0.0%) |
| 1 or 2 Children | 1 (100.0%) | 1 (20.0%) |
| 3 or 4 Children | 0 (0.0%) | 0 (0.0%) |
| 5 or more Children | 0 (0.0%) | 0 (0.0%) |
| Total | 1 (10.0%) | 1 (7.1%) |
Income Below Poverty Among Married-Couple vs Single-Parent Households in Gordon
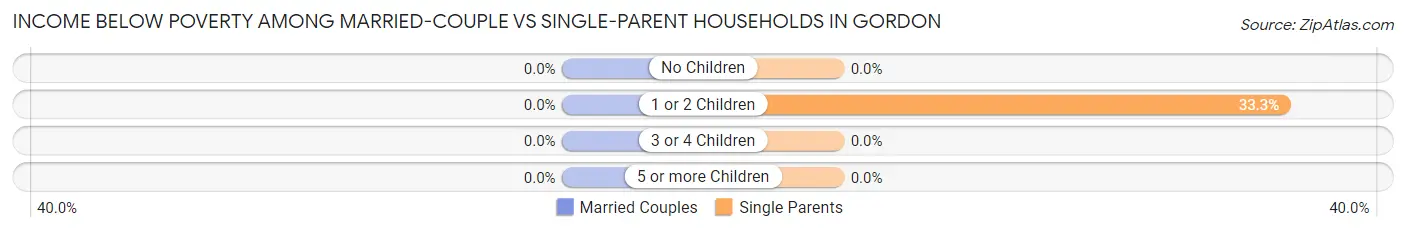
| Children | Married-Couple Families | Single-Parent Households |
| No Children | 0 (0.0%) | 0 (0.0%) |
| 1 or 2 Children | 0 (0.0%) | 2 (33.3%) |
| 3 or 4 Children | 0 (0.0%) | 0 (0.0%) |
| 5 or more Children | 0 (0.0%) | 0 (0.0%) |
| Total | 0 (0.0%) | 2 (8.3%) |
Race in Gordon
The most populous races in Gordon are White / Caucasian (244 | 98.8%), and Two or more Races (3 | 1.2%).
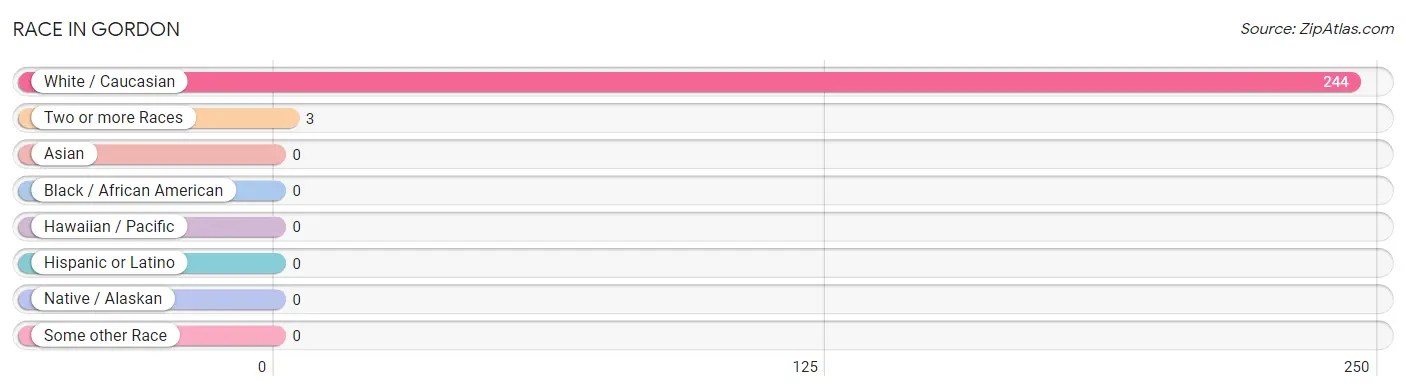
| Race | # Population | % Population |
| Asian | 0 | 0.0% |
| Black / African American | 0 | 0.0% |
| Hawaiian / Pacific | 0 | 0.0% |
| Hispanic or Latino | 0 | 0.0% |
| Native / Alaskan | 0 | 0.0% |
| White / Caucasian | 244 | 98.8% |
| Two or more Races | 3 | 1.2% |
| Some other Race | 0 | 0.0% |
| Total | 247 | 100.0% |
Ancestry in Gordon
The most populous ancestries reported in Gordon are German (74 | 30.0%), English (46 | 18.6%), American (28 | 11.3%), Scottish (16 | 6.5%), and European (15 | 6.1%), together accounting for 72.5% of all Gordon residents.
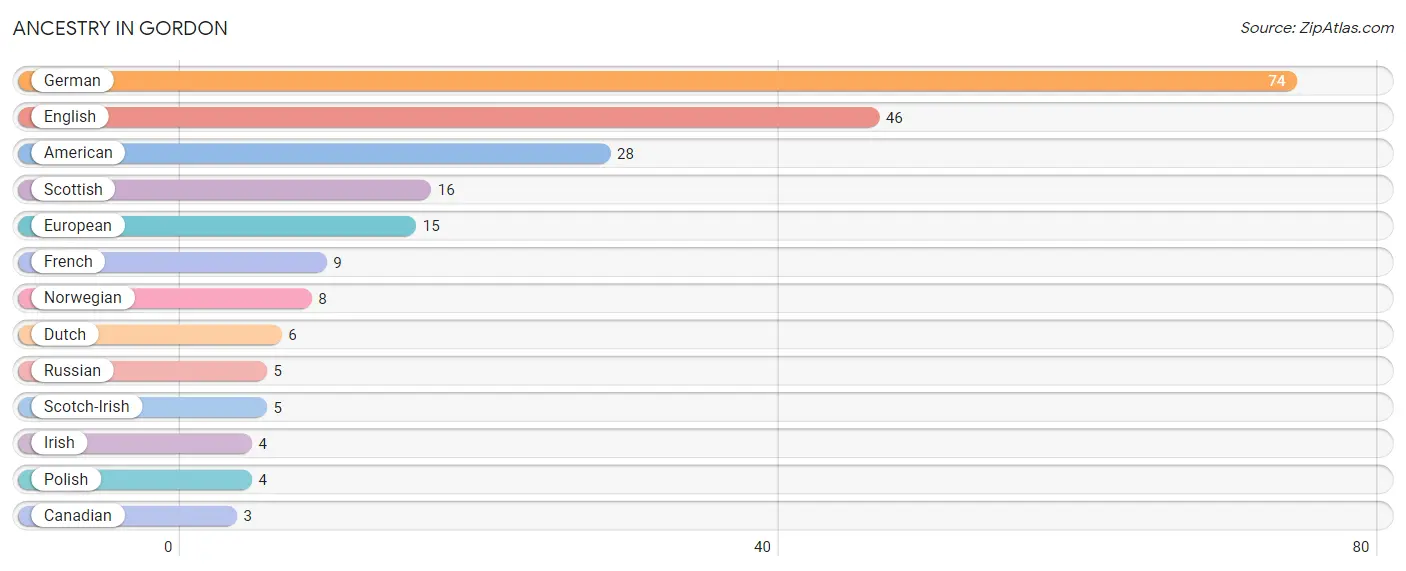
| Ancestry | # Population | % Population |
| American | 28 | 11.3% |
| Canadian | 3 | 1.2% |
| Dutch | 6 | 2.4% |
| English | 46 | 18.6% |
| European | 15 | 6.1% |
| French | 9 | 3.6% |
| German | 74 | 30.0% |
| Irish | 4 | 1.6% |
| Norwegian | 8 | 3.2% |
| Polish | 4 | 1.6% |
| Russian | 5 | 2.0% |
| Scotch-Irish | 5 | 2.0% |
| Scottish | 16 | 6.5% | View All 13 Rows |
Immigrants in Gordon

| Immigration Origin | # Population | % Population | View All 0 Rows |
Sex and Age in Gordon
Sex and Age in Gordon
The most populous age groups in Gordon are 40 to 44 Years (21 | 16.4%) for men and 55 to 59 Years (20 | 16.8%) for women.
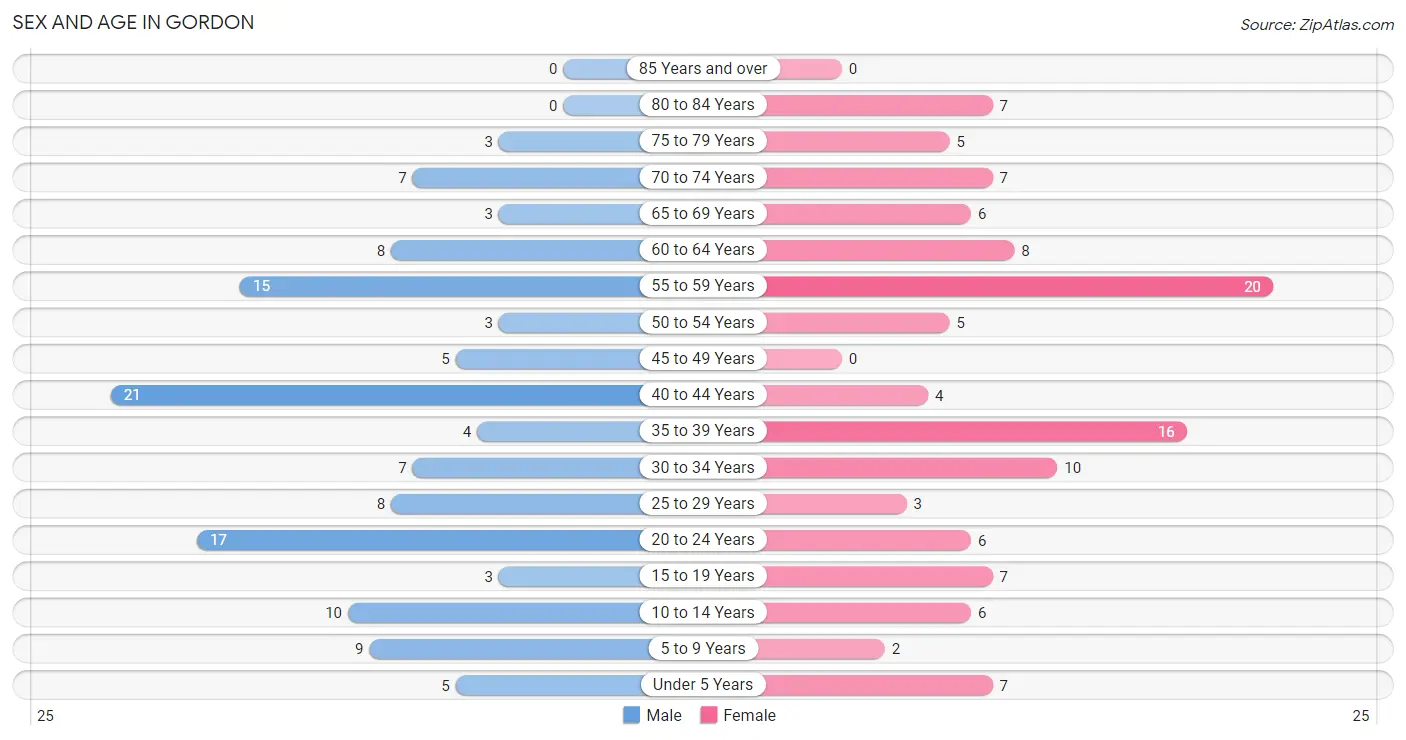
| Age Bracket | Male | Female |
| Under 5 Years | 5 (3.9%) | 7 (5.9%) |
| 5 to 9 Years | 9 (7.0%) | 2 (1.7%) |
| 10 to 14 Years | 10 (7.8%) | 6 (5.0%) |
| 15 to 19 Years | 3 (2.3%) | 7 (5.9%) |
| 20 to 24 Years | 17 (13.3%) | 6 (5.0%) |
| 25 to 29 Years | 8 (6.2%) | 3 (2.5%) |
| 30 to 34 Years | 7 (5.5%) | 10 (8.4%) |
| 35 to 39 Years | 4 (3.1%) | 16 (13.5%) |
| 40 to 44 Years | 21 (16.4%) | 4 (3.4%) |
| 45 to 49 Years | 5 (3.9%) | 0 (0.0%) |
| 50 to 54 Years | 3 (2.3%) | 5 (4.2%) |
| 55 to 59 Years | 15 (11.7%) | 20 (16.8%) |
| 60 to 64 Years | 8 (6.2%) | 8 (6.7%) |
| 65 to 69 Years | 3 (2.3%) | 6 (5.0%) |
| 70 to 74 Years | 7 (5.5%) | 7 (5.9%) |
| 75 to 79 Years | 3 (2.3%) | 5 (4.2%) |
| 80 to 84 Years | 0 (0.0%) | 7 (5.9%) |
| 85 Years and over | 0 (0.0%) | 0 (0.0%) |
| Total | 128 (100.0%) | 119 (100.0%) |
Families and Households in Gordon
Median Family Size in Gordon
The median family size in Gordon is 2.65 persons per family, with single female/mother families (14 | 17.9%) accounting for the largest median family size of 2.79 persons per family. On the other hand, single male/father families (10 | 12.8%) represent the smallest median family size with 2.10 persons per family.
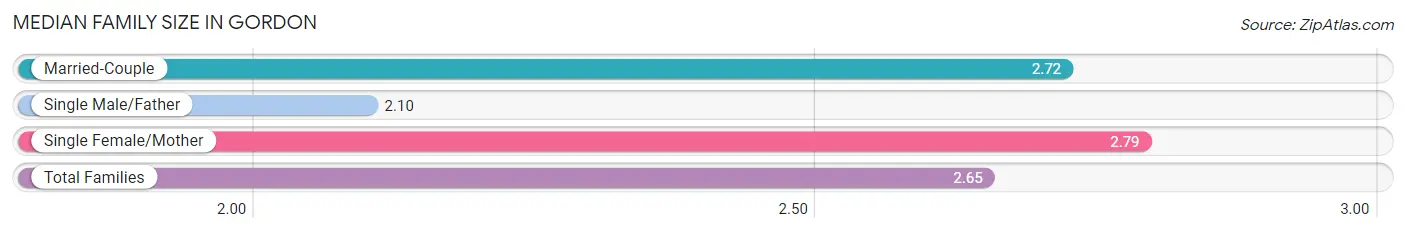
| Family Type | # Families | Family Size |
| Married-Couple | 54 (69.2%) | 2.72 |
| Single Male/Father | 10 (12.8%) | 2.10 |
| Single Female/Mother | 14 (17.9%) | 2.79 |
| Total Families | 78 (100.0%) | 2.65 |
Median Household Size in Gordon
The median household size in Gordon is 2.19 persons per household, with single female/mother households (14 | 12.4%) accounting for the largest median household size of 2.79 persons per household. non-family households (35 | 31.0%) represent the smallest median household size with 1.14 persons per household.
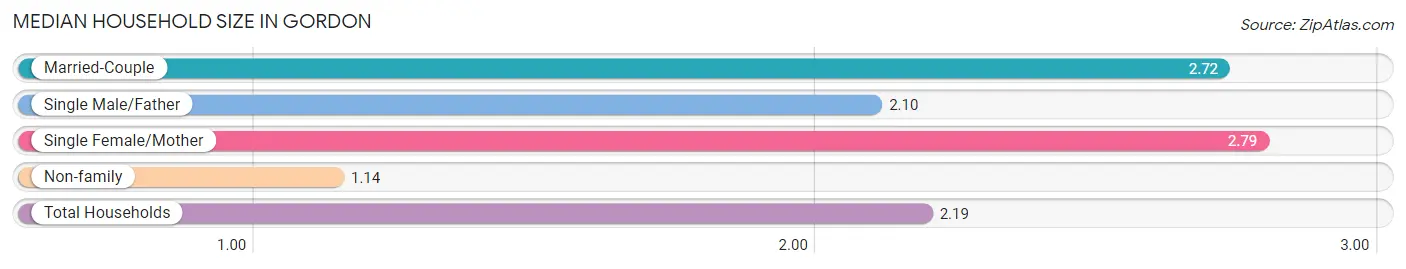
| Household Type | # Households | Household Size |
| Married-Couple | 54 (47.8%) | 2.72 |
| Single Male/Father | 10 (8.8%) | 2.10 |
| Single Female/Mother | 14 (12.4%) | 2.79 |
| Non-family | 35 (31.0%) | 1.14 |
| Total Households | 113 (100.0%) | 2.19 |
Household Size by Marriage Status in Gordon
Out of a total of 113 households in Gordon, 78 (69.0%) are family households, while 35 (31.0%) are nonfamily households. The most numerous type of family households are 2-person households, comprising 40, and the most common type of nonfamily households are 1-person households, comprising 30.
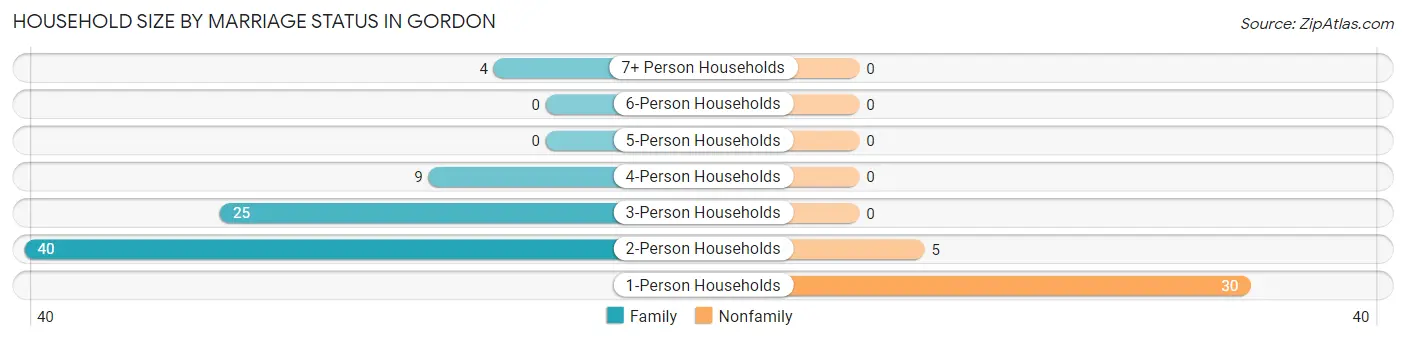
| Household Size | Family Households | Nonfamily Households |
| 1-Person Households | - | 30 (26.6%) |
| 2-Person Households | 40 (35.4%) | 5 (4.4%) |
| 3-Person Households | 25 (22.1%) | 0 (0.0%) |
| 4-Person Households | 9 (8.0%) | 0 (0.0%) |
| 5-Person Households | 0 (0.0%) | 0 (0.0%) |
| 6-Person Households | 0 (0.0%) | 0 (0.0%) |
| 7+ Person Households | 4 (3.5%) | 0 (0.0%) |
| Total | 78 (69.0%) | 35 (31.0%) |
Female Fertility in Gordon
Fertility by Age in Gordon
| Age Bracket | Women with Births | Births / 1,000 Women |
| 15 to 19 years | 0 (0.0%) | 0.0 |
| 20 to 34 years | 0 (0.0%) | 0.0 |
| 35 to 50 years | 0 (0.0%) | 0.0 |
| Total | 0 (0.0%) | 0.0 |
Fertility by Age by Marriage Status in Gordon
| Age Bracket | Married | Unmarried |
| 15 to 19 years | 0 (0.0%) | 0 (0.0%) |
| 20 to 34 years | 0 (0.0%) | 0 (0.0%) |
| 35 to 50 years | 0 (0.0%) | 0 (0.0%) |
| Total | 0 (0.0%) | 0 (0.0%) |
Fertility by Education in Gordon
| Educational Attainment | Women with Births | Births / 1,000 Women |
| Less than High School | 0 (0.0%) | 0.0 |
| High School Diploma | 0 (0.0%) | 0.0 |
| College or Associate's Degree | 0 (0.0%) | 0.0 |
| Bachelor's Degree | 0 (0.0%) | 0.0 |
| Graduate Degree | 0 (0.0%) | 0.0 |
| Total | 0 (0.0%) | 0.0 |
Fertility by Education by Marriage Status in Gordon
| Educational Attainment | Married | Unmarried |
| Less than High School | 0 (0.0%) | 0 (0.0%) |
| High School Diploma | 0 (0.0%) | 0 (0.0%) |
| College or Associate's Degree | 0 (0.0%) | 0 (0.0%) |
| Bachelor's Degree | 0 (0.0%) | 0 (0.0%) |
| Graduate Degree | 0 (0.0%) | 0 (0.0%) |
| Total | 0 (0.0%) | 0 (0.0%) |
Employment Characteristics in Gordon
Employment by Class of Employer in Gordon
Among the 122 employed individuals in Gordon, private company employees (106 | 86.9%), local government employees (7 | 5.7%), and not-for-profit organizations (4 | 3.3%) make up the most common classes of employment.
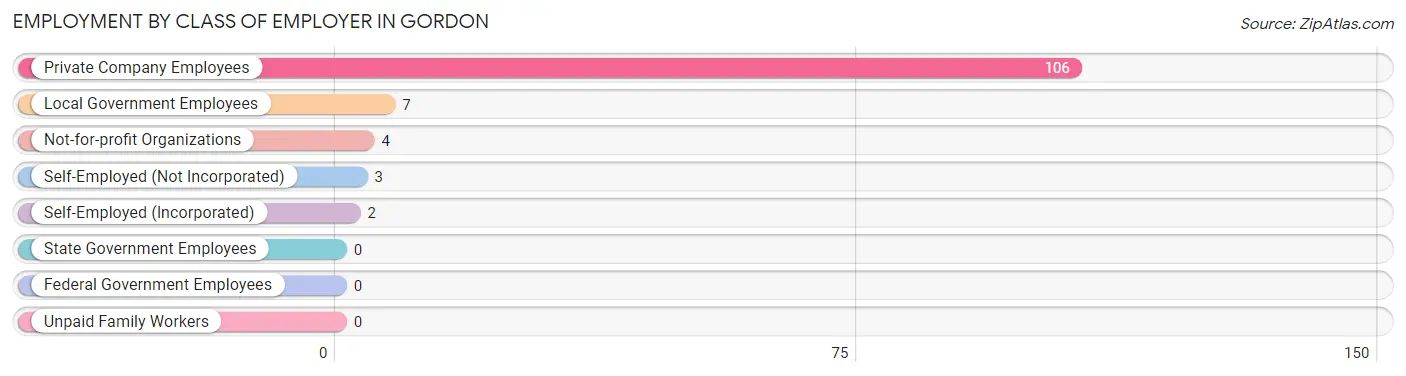
| Employer Class | # Employees | % Employees |
| Private Company Employees | 106 | 86.9% |
| Self-Employed (Incorporated) | 2 | 1.6% |
| Self-Employed (Not Incorporated) | 3 | 2.5% |
| Not-for-profit Organizations | 4 | 3.3% |
| Local Government Employees | 7 | 5.7% |
| State Government Employees | 0 | 0.0% |
| Federal Government Employees | 0 | 0.0% |
| Unpaid Family Workers | 0 | 0.0% |
| Total | 122 | 100.0% |
Employment Status by Age in Gordon
According to the labor force statistics for Gordon, out of the total population over 16 years of age (206), 65.5% or 135 individuals are in the labor force, with 8.1% or 11 of them unemployed. The age group with the highest labor force participation rate is 55 to 59 years, with 82.9% or 29 individuals in the labor force. Within the labor force, the 35 to 44 years age range has the highest percentage of unemployed individuals, with 17.6% or 6 of them being unemployed.
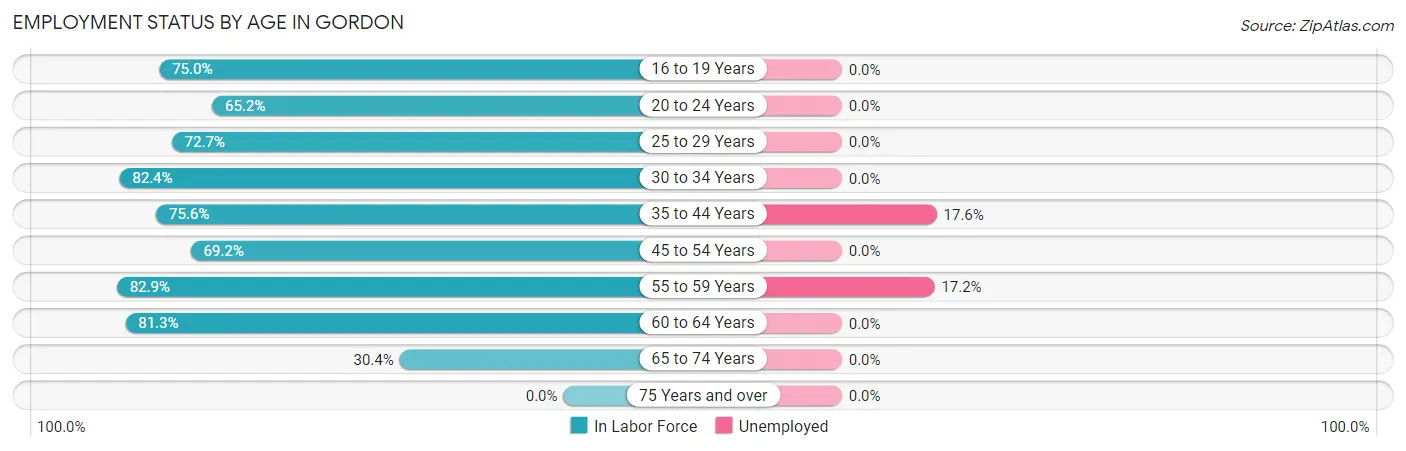
| Age Bracket | In Labor Force | Unemployed |
| 16 to 19 Years | 6 (75.0%) | 0 (0.0%) |
| 20 to 24 Years | 15 (65.2%) | 0 (0.0%) |
| 25 to 29 Years | 8 (72.7%) | 0 (0.0%) |
| 30 to 34 Years | 14 (82.4%) | 0 (0.0%) |
| 35 to 44 Years | 34 (75.6%) | 6 (17.6%) |
| 45 to 54 Years | 9 (69.2%) | 0 (0.0%) |
| 55 to 59 Years | 29 (82.9%) | 5 (17.2%) |
| 60 to 64 Years | 13 (81.3%) | 0 (0.0%) |
| 65 to 74 Years | 7 (30.4%) | 0 (0.0%) |
| 75 Years and over | 0 (0.0%) | 0 (0.0%) |
| Total | 135 (65.5%) | 11 (8.1%) |
Employment Status by Educational Attainment in Gordon
According to labor force statistics for Gordon, 78.1% of individuals (107) out of the total population between 25 and 64 years of age (137) are in the labor force, with 10.3% or 11 of them being unemployed. The group with the highest labor force participation rate are those with the educational attainment of bachelor's degree or higher, with 82.4% or 14 individuals in the labor force. Within the labor force, individuals with high school diploma education have the highest percentage of unemployment, with 12.0% or 6 of them being unemployed.
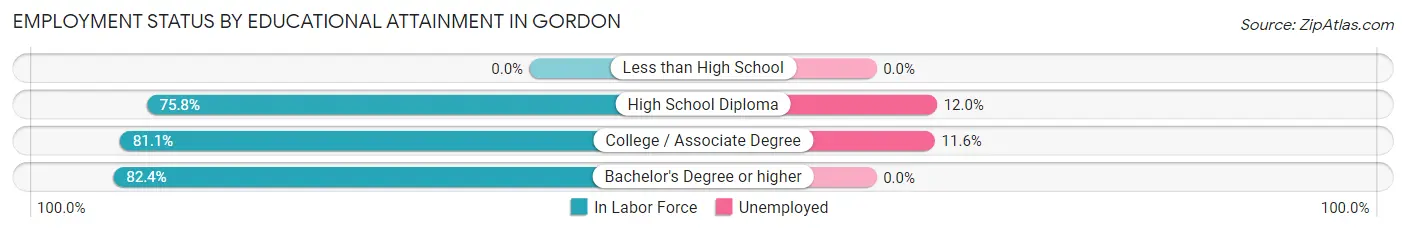
| Educational Attainment | In Labor Force | Unemployed |
| Less than High School | 0 (0.0%) | 0 (0.0%) |
| High School Diploma | 50 (75.8%) | 8 (12.0%) |
| College / Associate Degree | 43 (81.1%) | 6 (11.6%) |
| Bachelor's Degree or higher | 14 (82.4%) | 0 (0.0%) |
| Total | 107 (78.1%) | 14 (10.3%) |
Employment Occupations by Sex in Gordon
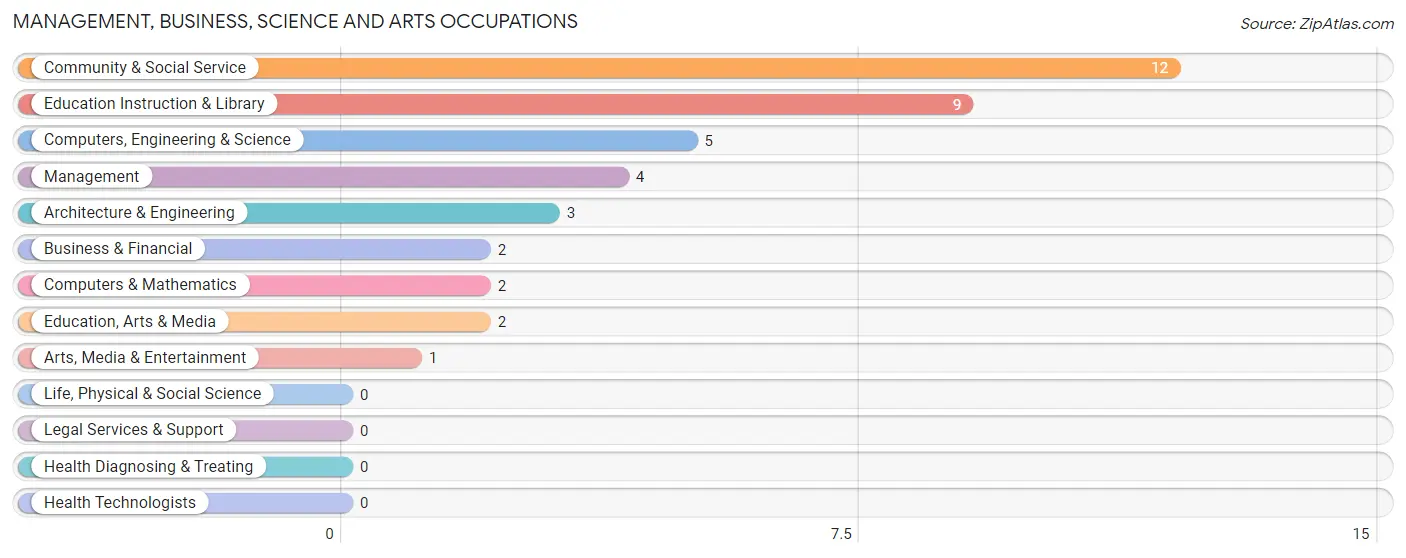
Management, Business, Science and Arts Occupations
The most common Management, Business, Science and Arts occupations in Gordon are Community & Social Service (12 | 9.7%), Education Instruction & Library (9 | 7.3%), Computers, Engineering & Science (5 | 4.0%), Management (4 | 3.2%), and Architecture & Engineering (3 | 2.4%).
Management, Business, Science and Arts Occupations by Sex
Within the Management, Business, Science and Arts occupations in Gordon, the most male-oriented occupations are Business & Financial (100.0%), Architecture & Engineering (100.0%), and Education, Arts & Media (100.0%), while the most female-oriented occupations are Computers & Mathematics (100.0%), Education Instruction & Library (100.0%), and Arts, Media & Entertainment (100.0%).
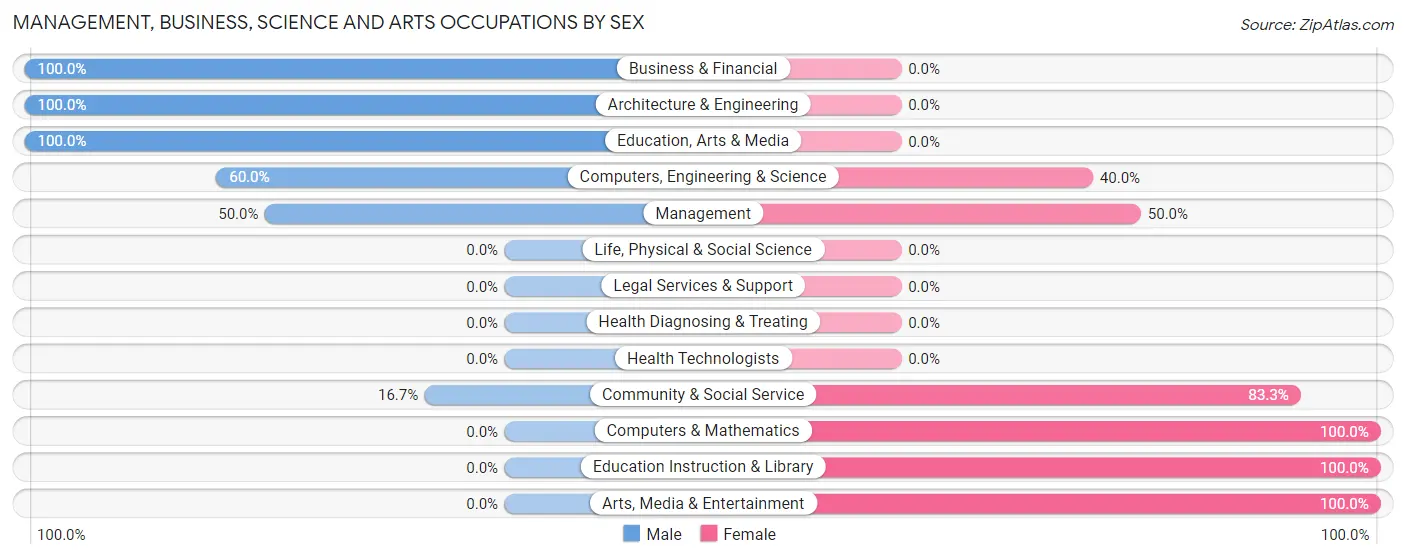
| Occupation | Male | Female |
| Management | 2 (50.0%) | 2 (50.0%) |
| Business & Financial | 2 (100.0%) | 0 (0.0%) |
| Computers, Engineering & Science | 3 (60.0%) | 2 (40.0%) |
| Computers & Mathematics | 0 (0.0%) | 2 (100.0%) |
| Architecture & Engineering | 3 (100.0%) | 0 (0.0%) |
| Life, Physical & Social Science | 0 (0.0%) | 0 (0.0%) |
| Community & Social Service | 2 (16.7%) | 10 (83.3%) |
| Education, Arts & Media | 2 (100.0%) | 0 (0.0%) |
| Legal Services & Support | 0 (0.0%) | 0 (0.0%) |
| Education Instruction & Library | 0 (0.0%) | 9 (100.0%) |
| Arts, Media & Entertainment | 0 (0.0%) | 1 (100.0%) |
| Health Diagnosing & Treating | 0 (0.0%) | 0 (0.0%) |
| Health Technologists | 0 (0.0%) | 0 (0.0%) |
| Total (Category) | 9 (39.1%) | 14 (60.9%) |
| Total (Overall) | 73 (58.9%) | 51 (41.1%) |
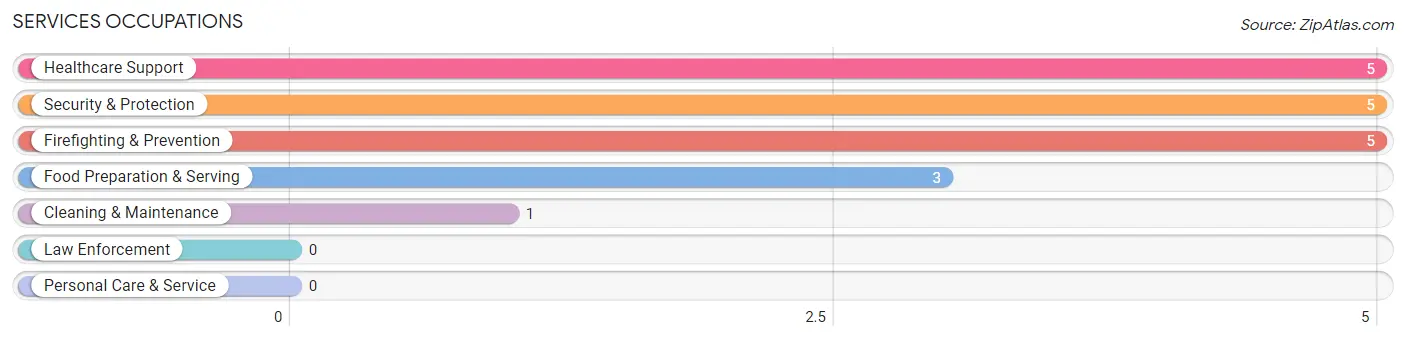
Services Occupations
The most common Services occupations in Gordon are Healthcare Support (5 | 4.0%), Security & Protection (5 | 4.0%), Firefighting & Prevention (5 | 4.0%), Food Preparation & Serving (3 | 2.4%), and Cleaning & Maintenance (1 | 0.8%).
Services Occupations by Sex
Within the Services occupations in Gordon, the most male-oriented occupations are Security & Protection (100.0%), Firefighting & Prevention (100.0%), and Cleaning & Maintenance (100.0%), while the most female-oriented occupations are Healthcare Support (100.0%), and Food Preparation & Serving (100.0%).
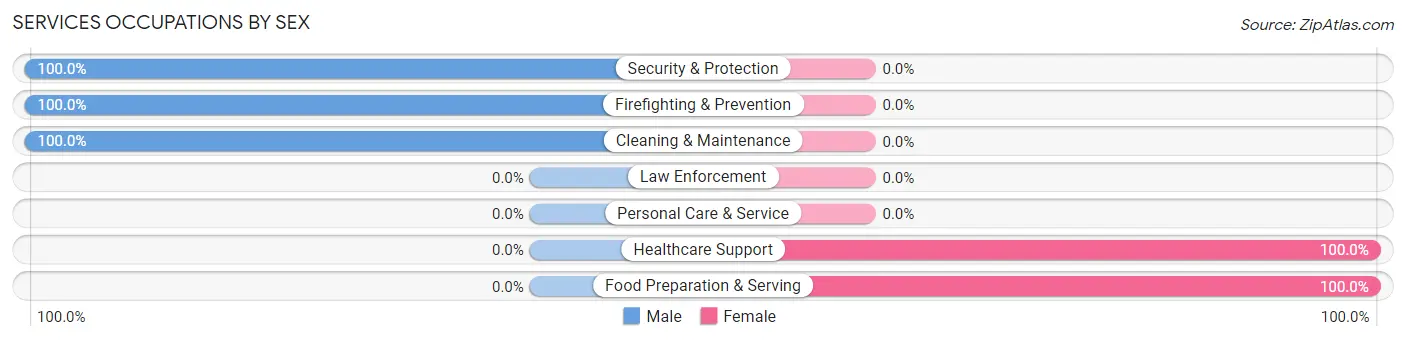
| Occupation | Male | Female |
| Healthcare Support | 0 (0.0%) | 5 (100.0%) |
| Security & Protection | 5 (100.0%) | 0 (0.0%) |
| Firefighting & Prevention | 5 (100.0%) | 0 (0.0%) |
| Law Enforcement | 0 (0.0%) | 0 (0.0%) |
| Food Preparation & Serving | 0 (0.0%) | 3 (100.0%) |
| Cleaning & Maintenance | 1 (100.0%) | 0 (0.0%) |
| Personal Care & Service | 0 (0.0%) | 0 (0.0%) |
| Total (Category) | 6 (42.9%) | 8 (57.1%) |
| Total (Overall) | 73 (58.9%) | 51 (41.1%) |
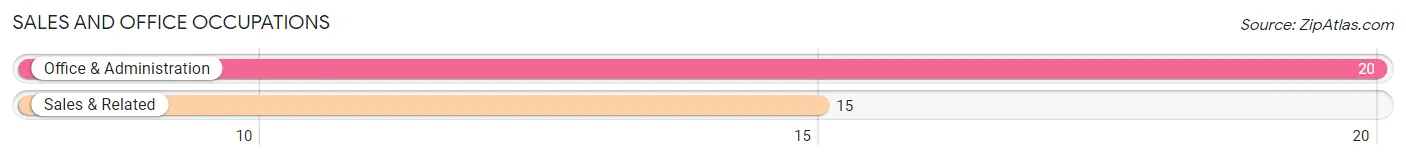
Sales and Office Occupations
The most common Sales and Office occupations in Gordon are Office & Administration (20 | 16.1%), and Sales & Related (15 | 12.1%).
Sales and Office Occupations by Sex
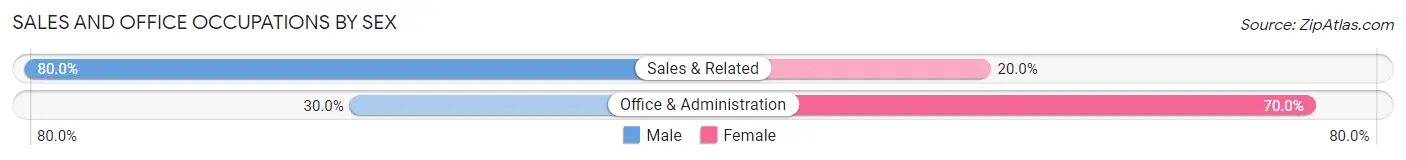
| Occupation | Male | Female |
| Sales & Related | 12 (80.0%) | 3 (20.0%) |
| Office & Administration | 6 (30.0%) | 14 (70.0%) |
| Total (Category) | 18 (51.4%) | 17 (48.6%) |
| Total (Overall) | 73 (58.9%) | 51 (41.1%) |
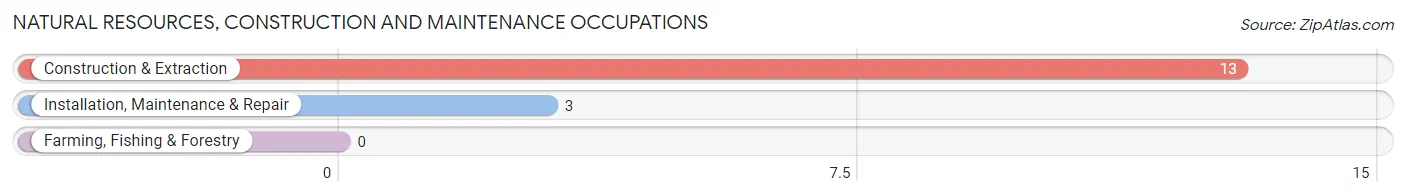
Natural Resources, Construction and Maintenance Occupations
The most common Natural Resources, Construction and Maintenance occupations in Gordon are Construction & Extraction (13 | 10.5%), and Installation, Maintenance & Repair (3 | 2.4%).
Natural Resources, Construction and Maintenance Occupations by Sex
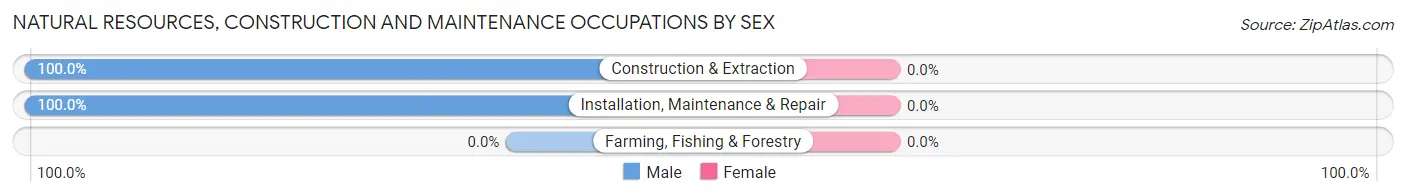
| Occupation | Male | Female |
| Farming, Fishing & Forestry | 0 (0.0%) | 0 (0.0%) |
| Construction & Extraction | 13 (100.0%) | 0 (0.0%) |
| Installation, Maintenance & Repair | 3 (100.0%) | 0 (0.0%) |
| Total (Category) | 16 (100.0%) | 0 (0.0%) |
| Total (Overall) | 73 (58.9%) | 51 (41.1%) |
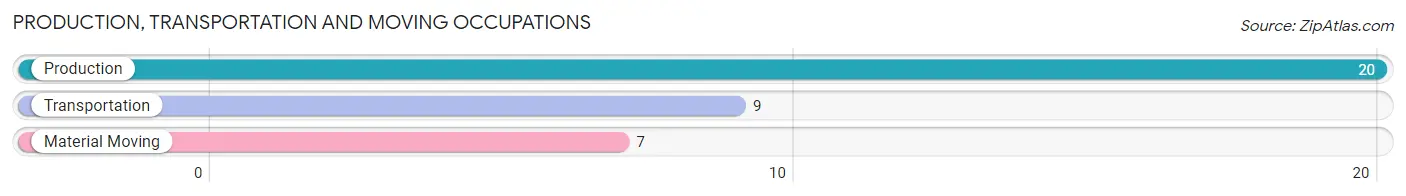
Production, Transportation and Moving Occupations
The most common Production, Transportation and Moving occupations in Gordon are Production (20 | 16.1%), Transportation (9 | 7.3%), and Material Moving (7 | 5.7%).
Production, Transportation and Moving Occupations by Sex
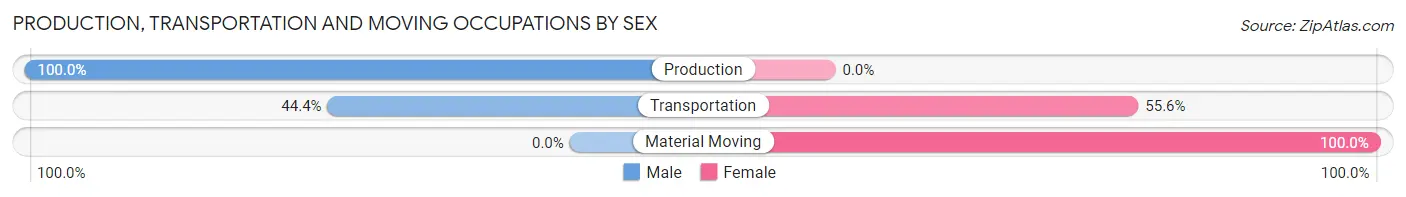
| Occupation | Male | Female |
| Production | 20 (100.0%) | 0 (0.0%) |
| Transportation | 4 (44.4%) | 5 (55.6%) |
| Material Moving | 0 (0.0%) | 7 (100.0%) |
| Total (Category) | 24 (66.7%) | 12 (33.3%) |
| Total (Overall) | 73 (58.9%) | 51 (41.1%) |
Employment Industries by Sex in Gordon
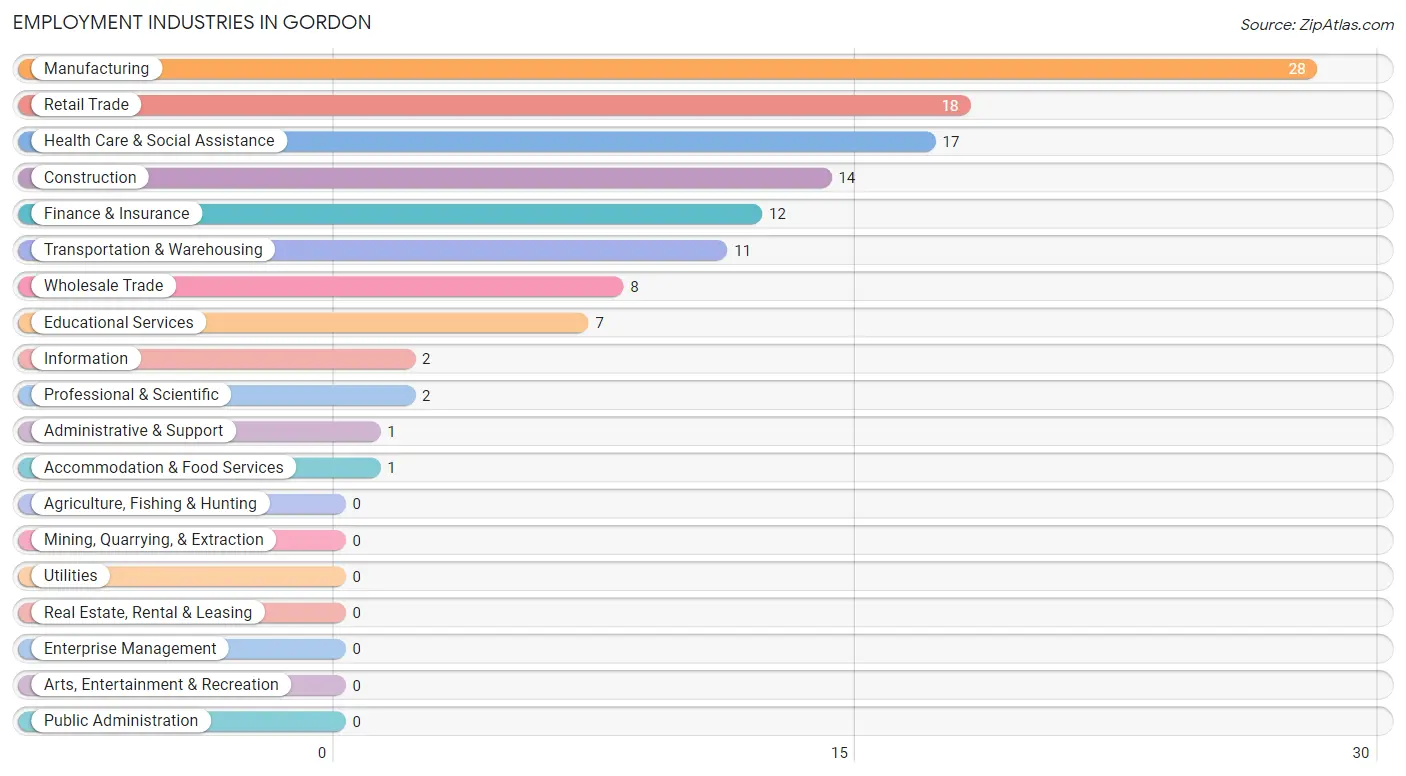
Employment Industries in Gordon
The major employment industries in Gordon include Manufacturing (28 | 22.6%), Retail Trade (18 | 14.5%), Health Care & Social Assistance (17 | 13.7%), Construction (14 | 11.3%), and Finance & Insurance (12 | 9.7%).
Employment Industries by Sex in Gordon
The Gordon industries that see more men than women are Manufacturing (100.0%), Administrative & Support (100.0%), and Construction (85.7%), whereas the industries that tend to have a higher number of women are Information (100.0%), Educational Services (100.0%), and Accommodation & Food Services (100.0%).
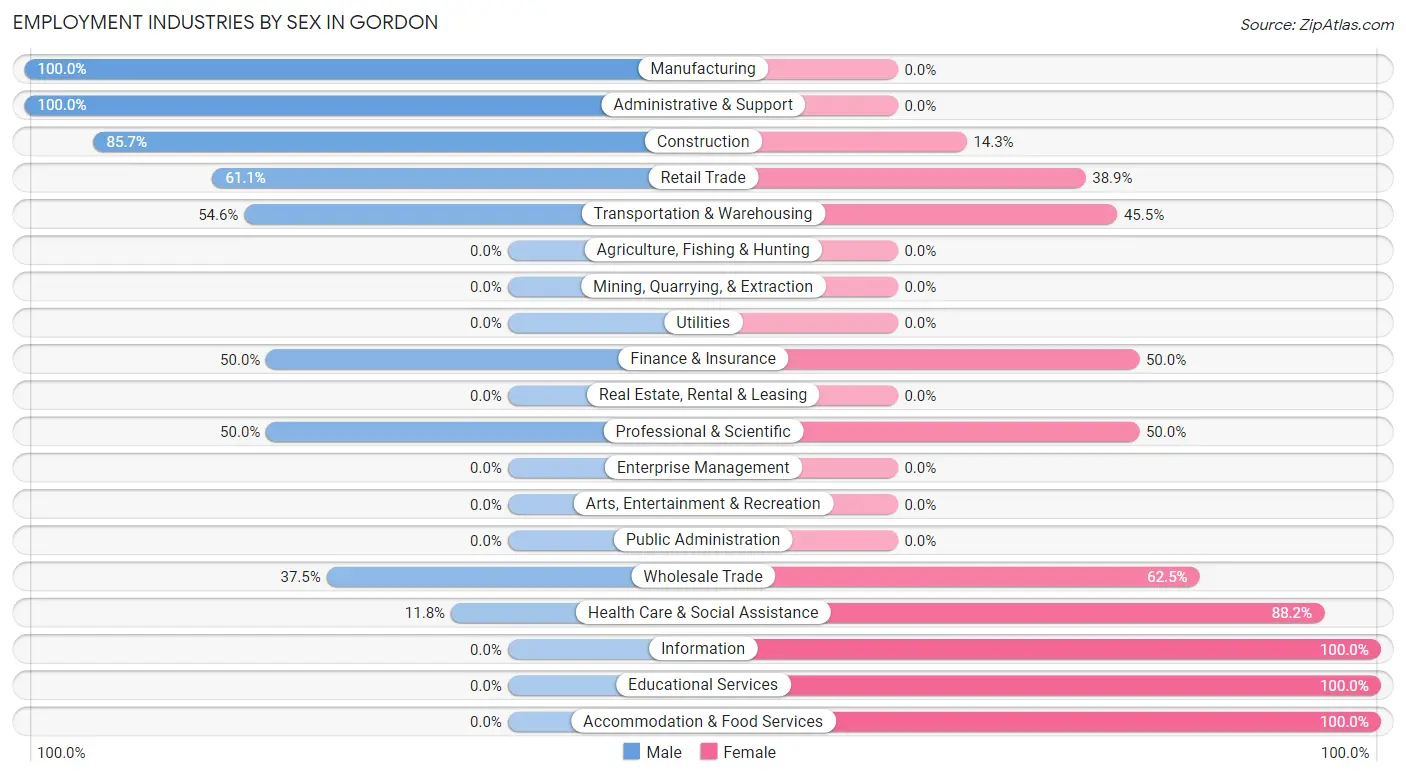
| Industry | Male | Female |
| Agriculture, Fishing & Hunting | 0 (0.0%) | 0 (0.0%) |
| Mining, Quarrying, & Extraction | 0 (0.0%) | 0 (0.0%) |
| Construction | 12 (85.7%) | 2 (14.3%) |
| Manufacturing | 28 (100.0%) | 0 (0.0%) |
| Wholesale Trade | 3 (37.5%) | 5 (62.5%) |
| Retail Trade | 11 (61.1%) | 7 (38.9%) |
| Transportation & Warehousing | 6 (54.5%) | 5 (45.5%) |
| Utilities | 0 (0.0%) | 0 (0.0%) |
| Information | 0 (0.0%) | 2 (100.0%) |
| Finance & Insurance | 6 (50.0%) | 6 (50.0%) |
| Real Estate, Rental & Leasing | 0 (0.0%) | 0 (0.0%) |
| Professional & Scientific | 1 (50.0%) | 1 (50.0%) |
| Enterprise Management | 0 (0.0%) | 0 (0.0%) |
| Administrative & Support | 1 (100.0%) | 0 (0.0%) |
| Educational Services | 0 (0.0%) | 7 (100.0%) |
| Health Care & Social Assistance | 2 (11.8%) | 15 (88.2%) |
| Arts, Entertainment & Recreation | 0 (0.0%) | 0 (0.0%) |
| Accommodation & Food Services | 0 (0.0%) | 1 (100.0%) |
| Public Administration | 0 (0.0%) | 0 (0.0%) |
| Total | 73 (58.9%) | 51 (41.1%) |
Education in Gordon
School Enrollment in Gordon
The most common levels of schooling among the 39 students in Gordon are middle school (12 | 30.8%), elementary school (7 | 17.9%), and high school (7 | 17.9%).
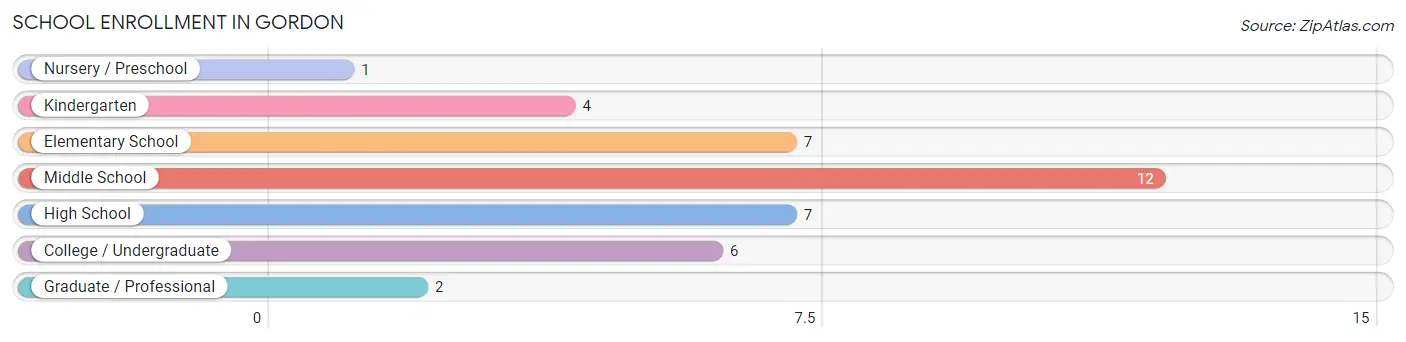
| School Level | # Students | % Students |
| Nursery / Preschool | 1 | 2.6% |
| Kindergarten | 4 | 10.3% |
| Elementary School | 7 | 17.9% |
| Middle School | 12 | 30.8% |
| High School | 7 | 17.9% |
| College / Undergraduate | 6 | 15.4% |
| Graduate / Professional | 2 | 5.1% |
| Total | 39 | 100.0% |
School Enrollment by Age by Funding Source in Gordon
Out of a total of 39 students who are enrolled in schools in Gordon, 2 (5.1%) attend a private institution, while the remaining 37 (94.9%) are enrolled in public schools. The age group of 20 to 24 year olds has the highest likelihood of being enrolled in private schools, with 2 (50.0% in the age bracket) enrolled. Conversely, the age group of 3 to 4 year olds has the lowest likelihood of being enrolled in a private school, with 1 (100.0% in the age bracket) attending a public institution.
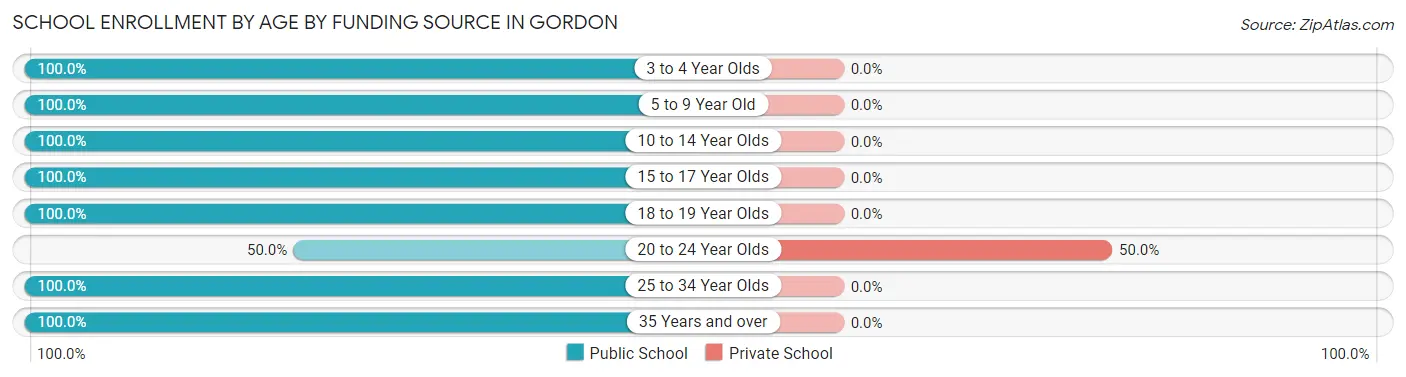
| Age Bracket | Public School | Private School |
| 3 to 4 Year Olds | 1 (100.0%) | 0 (0.0%) |
| 5 to 9 Year Old | 11 (100.0%) | 0 (0.0%) |
| 10 to 14 Year Olds | 12 (100.0%) | 0 (0.0%) |
| 15 to 17 Year Olds | 4 (100.0%) | 0 (0.0%) |
| 18 to 19 Year Olds | 3 (100.0%) | 0 (0.0%) |
| 20 to 24 Year Olds | 2 (50.0%) | 2 (50.0%) |
| 25 to 34 Year Olds | 3 (100.0%) | 0 (0.0%) |
| 35 Years and over | 1 (100.0%) | 0 (0.0%) |
| Total | 37 (94.9%) | 2 (5.1%) |
Educational Attainment by Field of Study in Gordon
Social sciences (7 | 41.2%), business (3 | 17.6%), liberal arts & history (3 | 17.6%), education (2 | 11.8%), and arts & humanities (2 | 11.8%) are the most common fields of study among 17 individuals in Gordon who have obtained a bachelor's degree or higher.
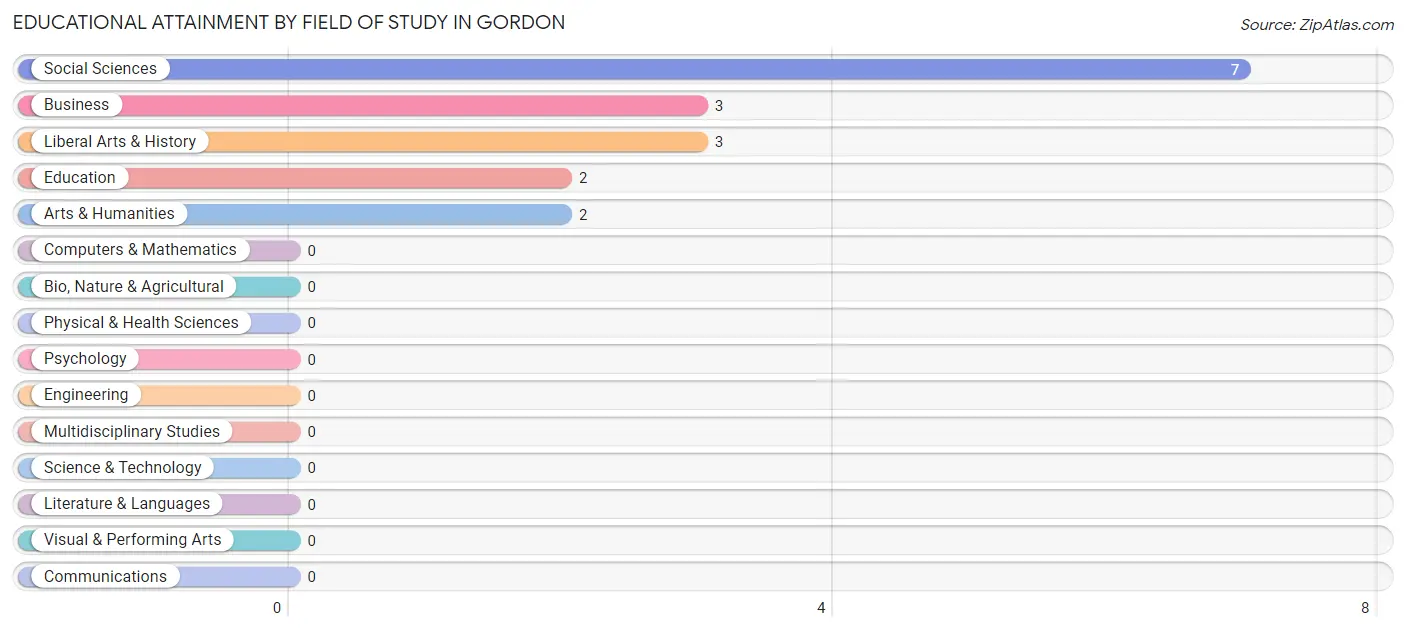
| Field of Study | # Graduates | % Graduates |
| Computers & Mathematics | 0 | 0.0% |
| Bio, Nature & Agricultural | 0 | 0.0% |
| Physical & Health Sciences | 0 | 0.0% |
| Psychology | 0 | 0.0% |
| Social Sciences | 7 | 41.2% |
| Engineering | 0 | 0.0% |
| Multidisciplinary Studies | 0 | 0.0% |
| Science & Technology | 0 | 0.0% |
| Business | 3 | 17.6% |
| Education | 2 | 11.8% |
| Literature & Languages | 0 | 0.0% |
| Liberal Arts & History | 3 | 17.6% |
| Visual & Performing Arts | 0 | 0.0% |
| Communications | 0 | 0.0% |
| Arts & Humanities | 2 | 11.8% |
| Total | 17 | 100.0% |
Transportation & Commute in Gordon
Vehicle Availability by Sex in Gordon
The most prevalent vehicle ownership categories in Gordon are males with 3 vehicles (33, accounting for 46.5%) and females with 3 vehicles (13, making up 64.7%).
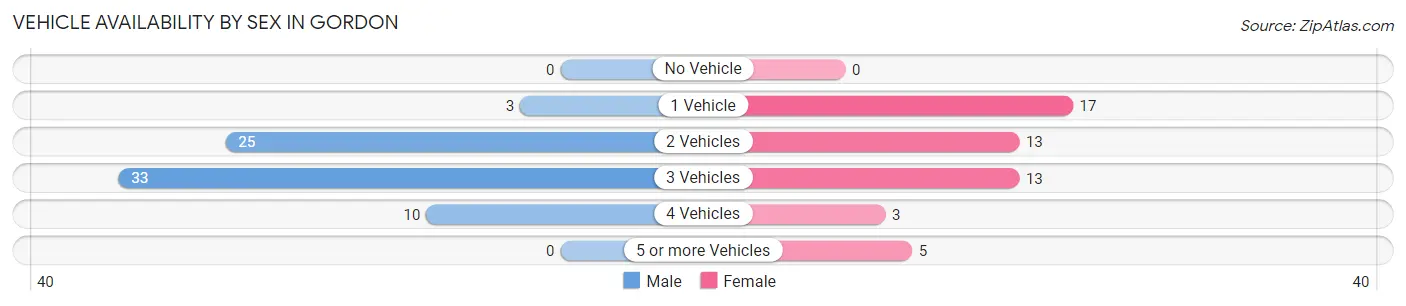
| Vehicles Available | Male | Female |
| No Vehicle | 0 (0.0%) | 0 (0.0%) |
| 1 Vehicle | 3 (4.2%) | 17 (33.3%) |
| 2 Vehicles | 25 (35.2%) | 13 (25.5%) |
| 3 Vehicles | 33 (46.5%) | 13 (25.5%) |
| 4 Vehicles | 10 (14.1%) | 3 (5.9%) |
| 5 or more Vehicles | 0 (0.0%) | 5 (9.8%) |
| Total | 71 (100.0%) | 51 (100.0%) |
Commute Time in Gordon
The most frequently occuring commute durations in Gordon are 30 to 34 minutes (31 commuters, 27.4%), 25 to 29 minutes (16 commuters, 14.2%), and 45 to 59 minutes (16 commuters, 14.2%).
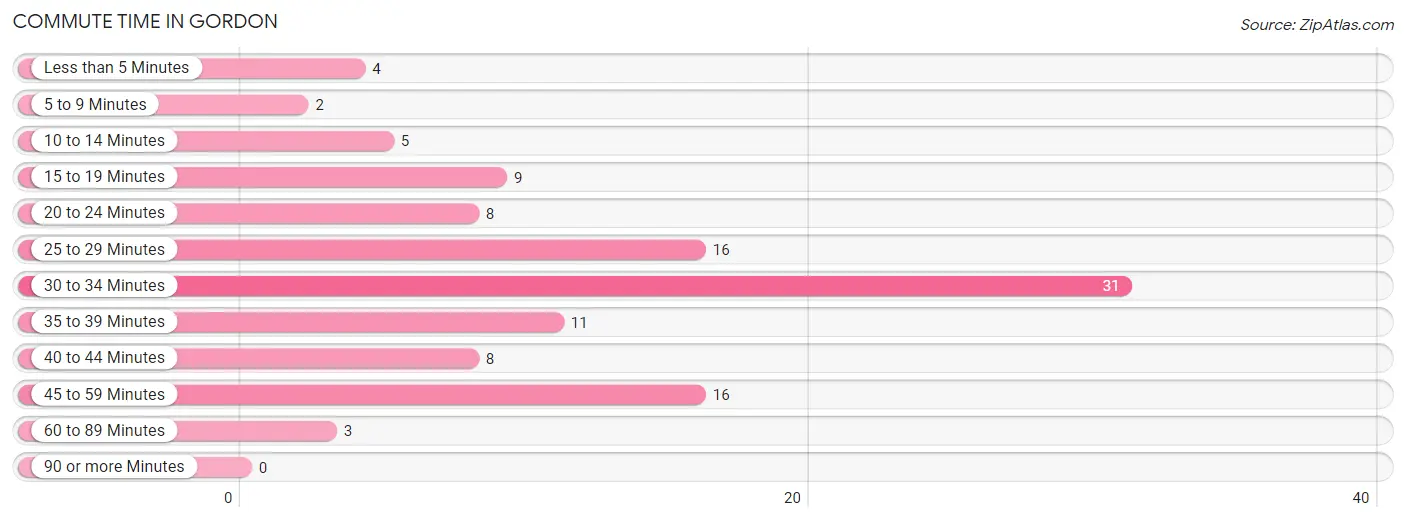
| Commute Time | # Commuters | % Commuters |
| Less than 5 Minutes | 4 | 3.5% |
| 5 to 9 Minutes | 2 | 1.8% |
| 10 to 14 Minutes | 5 | 4.4% |
| 15 to 19 Minutes | 9 | 8.0% |
| 20 to 24 Minutes | 8 | 7.1% |
| 25 to 29 Minutes | 16 | 14.2% |
| 30 to 34 Minutes | 31 | 27.4% |
| 35 to 39 Minutes | 11 | 9.7% |
| 40 to 44 Minutes | 8 | 7.1% |
| 45 to 59 Minutes | 16 | 14.2% |
| 60 to 89 Minutes | 3 | 2.6% |
| 90 or more Minutes | 0 | 0.0% |
Commute Time by Sex in Gordon
The most common commute times in Gordon are 30 to 34 minutes (23 commuters, 36.5%) for males and 25 to 29 minutes (10 commuters, 20.0%) for females.
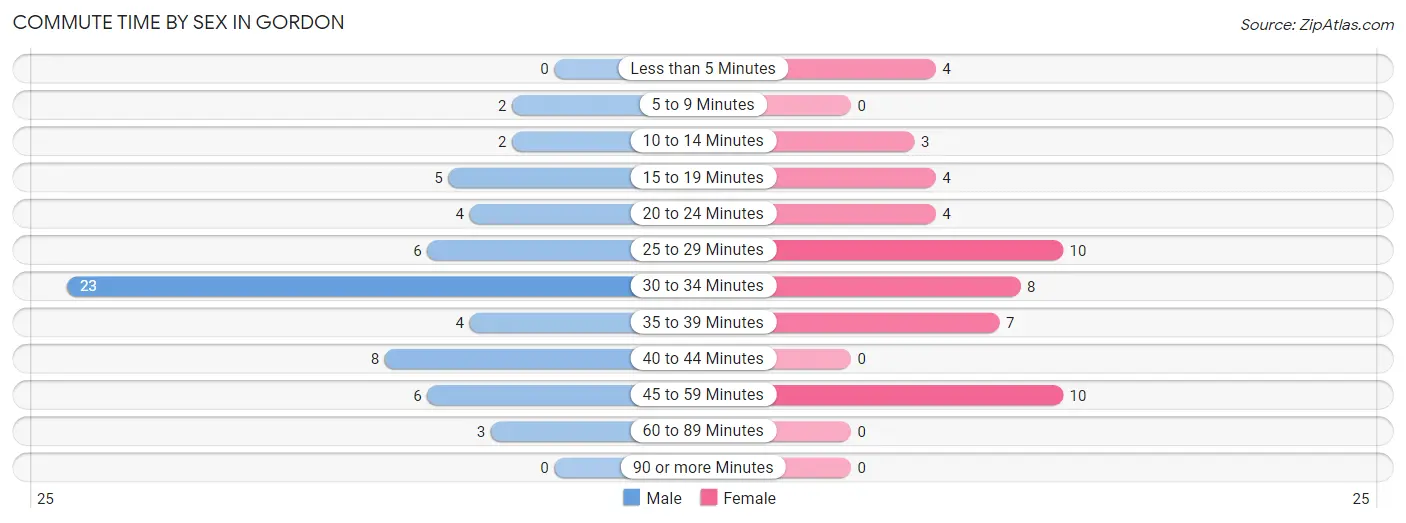
| Commute Time | Male | Female |
| Less than 5 Minutes | 0 (0.0%) | 4 (8.0%) |
| 5 to 9 Minutes | 2 (3.2%) | 0 (0.0%) |
| 10 to 14 Minutes | 2 (3.2%) | 3 (6.0%) |
| 15 to 19 Minutes | 5 (7.9%) | 4 (8.0%) |
| 20 to 24 Minutes | 4 (6.4%) | 4 (8.0%) |
| 25 to 29 Minutes | 6 (9.5%) | 10 (20.0%) |
| 30 to 34 Minutes | 23 (36.5%) | 8 (16.0%) |
| 35 to 39 Minutes | 4 (6.4%) | 7 (14.0%) |
| 40 to 44 Minutes | 8 (12.7%) | 0 (0.0%) |
| 45 to 59 Minutes | 6 (9.5%) | 10 (20.0%) |
| 60 to 89 Minutes | 3 (4.8%) | 0 (0.0%) |
| 90 or more Minutes | 0 (0.0%) | 0 (0.0%) |
Time of Departure to Work by Sex in Gordon
The most frequent times of departure to work in Gordon are 7:00 AM to 7:29 AM (15, 23.8%) for males and 8:00 AM to 8:29 AM (16, 32.0%) for females.
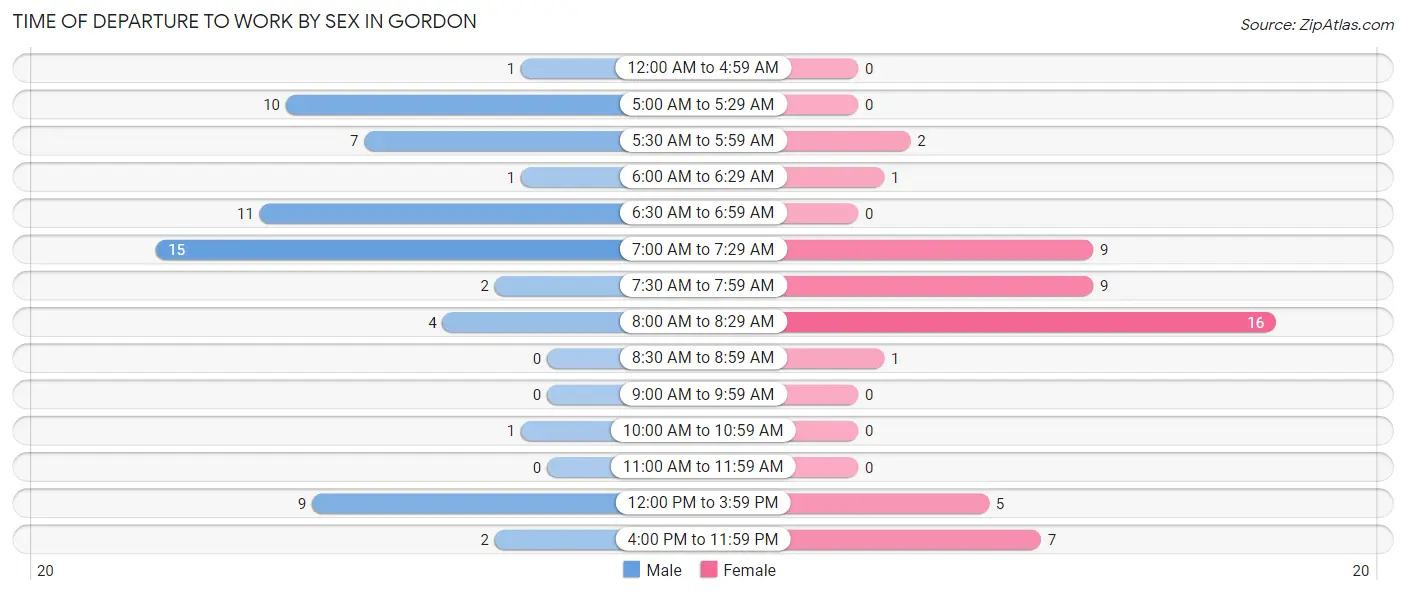
| Time of Departure | Male | Female |
| 12:00 AM to 4:59 AM | 1 (1.6%) | 0 (0.0%) |
| 5:00 AM to 5:29 AM | 10 (15.9%) | 0 (0.0%) |
| 5:30 AM to 5:59 AM | 7 (11.1%) | 2 (4.0%) |
| 6:00 AM to 6:29 AM | 1 (1.6%) | 1 (2.0%) |
| 6:30 AM to 6:59 AM | 11 (17.5%) | 0 (0.0%) |
| 7:00 AM to 7:29 AM | 15 (23.8%) | 9 (18.0%) |
| 7:30 AM to 7:59 AM | 2 (3.2%) | 9 (18.0%) |
| 8:00 AM to 8:29 AM | 4 (6.4%) | 16 (32.0%) |
| 8:30 AM to 8:59 AM | 0 (0.0%) | 1 (2.0%) |
| 9:00 AM to 9:59 AM | 0 (0.0%) | 0 (0.0%) |
| 10:00 AM to 10:59 AM | 1 (1.6%) | 0 (0.0%) |
| 11:00 AM to 11:59 AM | 0 (0.0%) | 0 (0.0%) |
| 12:00 PM to 3:59 PM | 9 (14.3%) | 5 (10.0%) |
| 4:00 PM to 11:59 PM | 2 (3.2%) | 7 (14.0%) |
| Total | 63 (100.0%) | 50 (100.0%) |
Housing Occupancy in Gordon
Occupancy by Ownership in Gordon
Of the total 113 dwellings in Gordon, owner-occupied units account for 85 (75.2%), while renter-occupied units make up 28 (24.8%).
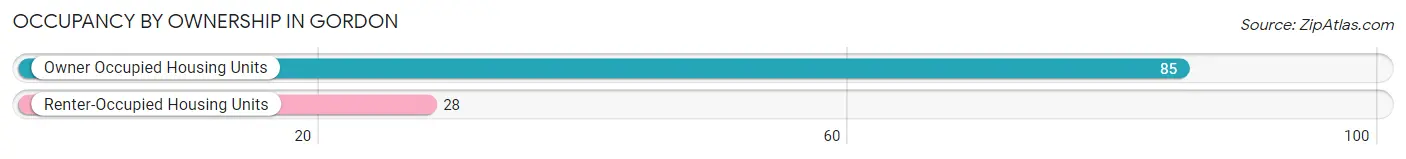
| Occupancy | # Housing Units | % Housing Units |
| Owner Occupied Housing Units | 85 | 75.2% |
| Renter-Occupied Housing Units | 28 | 24.8% |
| Total Occupied Housing Units | 113 | 100.0% |
Occupancy by Household Size in Gordon
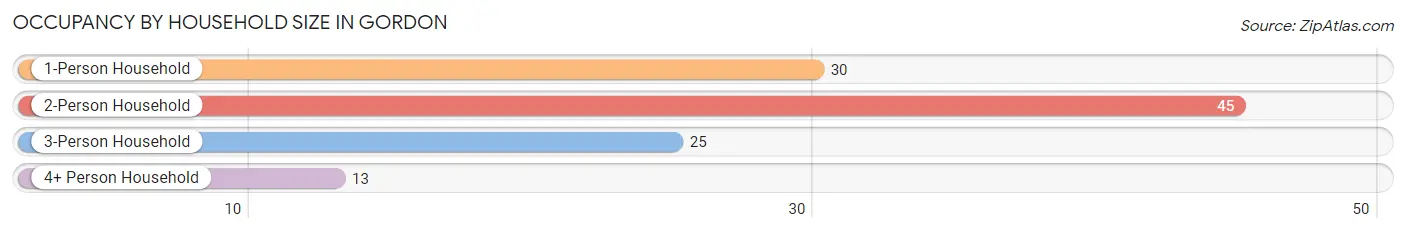
| Household Size | # Housing Units | % Housing Units |
| 1-Person Household | 30 | 26.6% |
| 2-Person Household | 45 | 39.8% |
| 3-Person Household | 25 | 22.1% |
| 4+ Person Household | 13 | 11.5% |
| Total Housing Units | 113 | 100.0% |
Occupancy by Ownership by Household Size in Gordon
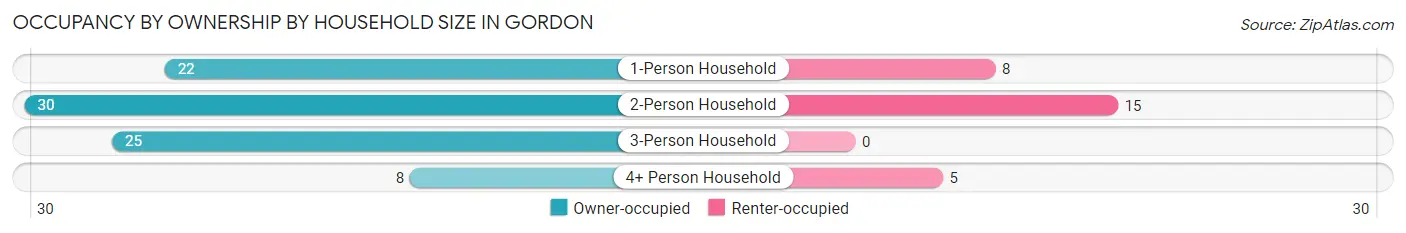
| Household Size | Owner-occupied | Renter-occupied |
| 1-Person Household | 22 (73.3%) | 8 (26.7%) |
| 2-Person Household | 30 (66.7%) | 15 (33.3%) |
| 3-Person Household | 25 (100.0%) | 0 (0.0%) |
| 4+ Person Household | 8 (61.5%) | 5 (38.5%) |
| Total Housing Units | 85 (75.2%) | 28 (24.8%) |
Occupancy by Educational Attainment in Gordon
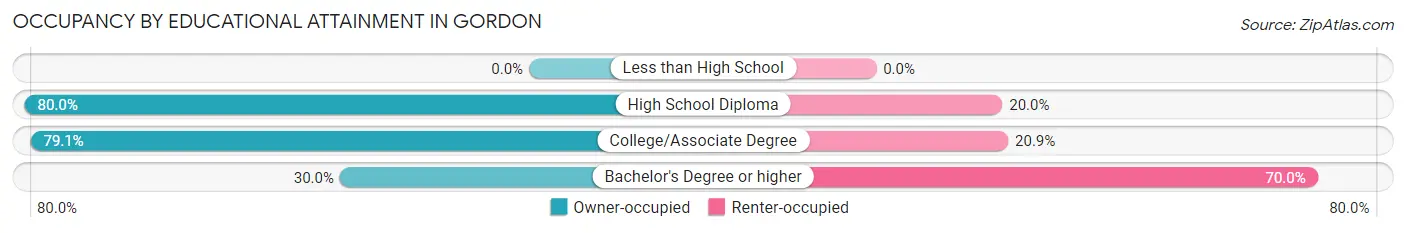
| Household Size | Owner-occupied | Renter-occupied |
| Less than High School | 0 (0.0%) | 0 (0.0%) |
| High School Diploma | 48 (80.0%) | 12 (20.0%) |
| College/Associate Degree | 34 (79.1%) | 9 (20.9%) |
| Bachelor's Degree or higher | 3 (30.0%) | 7 (70.0%) |
Occupancy by Age of Householder in Gordon
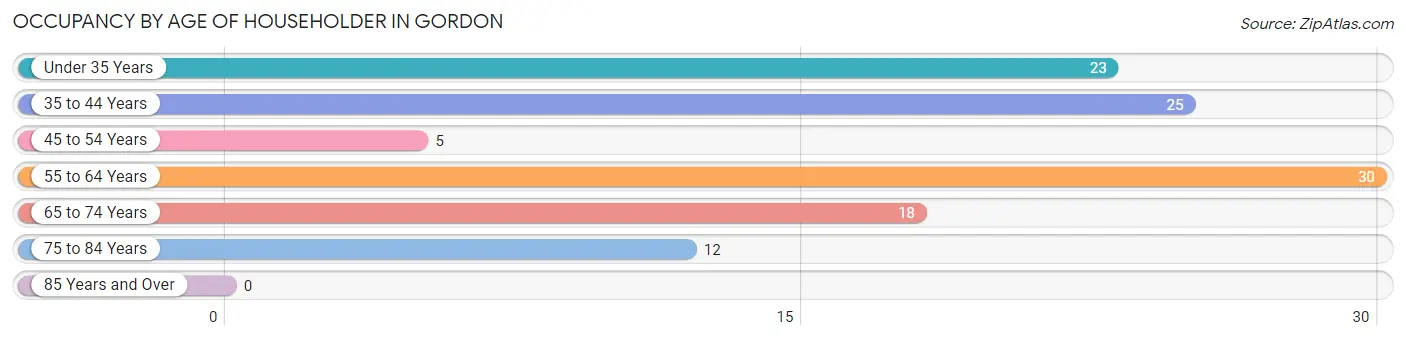
| Age Bracket | # Households | % Households |
| Under 35 Years | 23 | 20.3% |
| 35 to 44 Years | 25 | 22.1% |
| 45 to 54 Years | 5 | 4.4% |
| 55 to 64 Years | 30 | 26.6% |
| 65 to 74 Years | 18 | 15.9% |
| 75 to 84 Years | 12 | 10.6% |
| 85 Years and Over | 0 | 0.0% |
| Total | 113 | 100.0% |
Housing Finances in Gordon
Median Income by Occupancy in Gordon
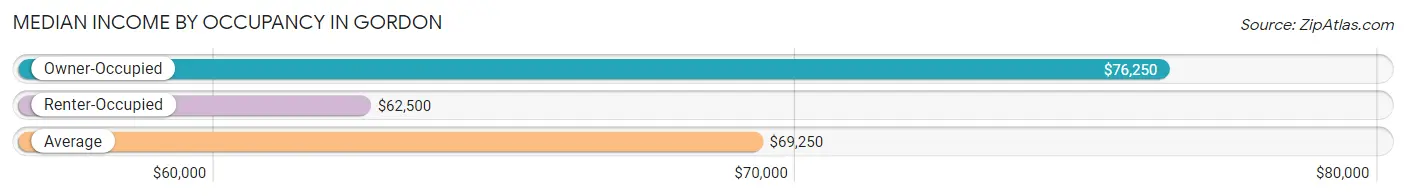
| Occupancy Type | # Households | Median Income |
| Owner-Occupied | 85 (75.2%) | $76,250 |
| Renter-Occupied | 28 (24.8%) | $62,500 |
| Average | 113 (100.0%) | $69,250 |
Occupancy by Householder Income Bracket in Gordon
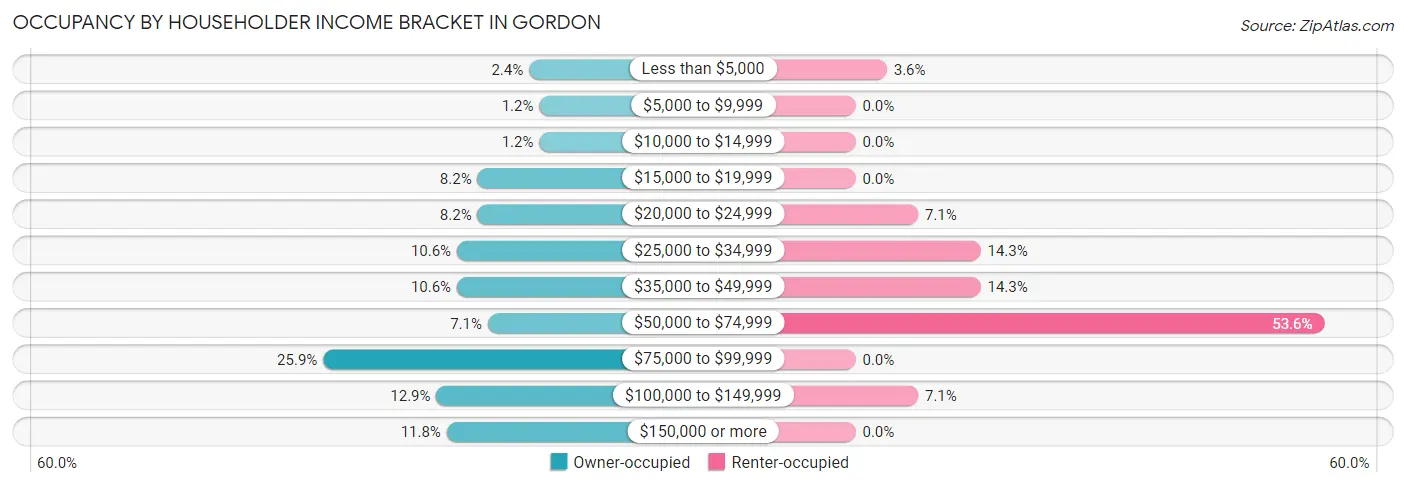
| Income Bracket | Owner-occupied | Renter-occupied |
| Less than $5,000 | 2 (2.4%) | 1 (3.6%) |
| $5,000 to $9,999 | 1 (1.2%) | 0 (0.0%) |
| $10,000 to $14,999 | 1 (1.2%) | 0 (0.0%) |
| $15,000 to $19,999 | 7 (8.2%) | 0 (0.0%) |
| $20,000 to $24,999 | 7 (8.2%) | 2 (7.1%) |
| $25,000 to $34,999 | 9 (10.6%) | 4 (14.3%) |
| $35,000 to $49,999 | 9 (10.6%) | 4 (14.3%) |
| $50,000 to $74,999 | 6 (7.1%) | 15 (53.6%) |
| $75,000 to $99,999 | 22 (25.9%) | 0 (0.0%) |
| $100,000 to $149,999 | 11 (12.9%) | 2 (7.1%) |
| $150,000 or more | 10 (11.8%) | 0 (0.0%) |
| Total | 85 (100.0%) | 28 (100.0%) |
Monthly Housing Cost Tiers in Gordon
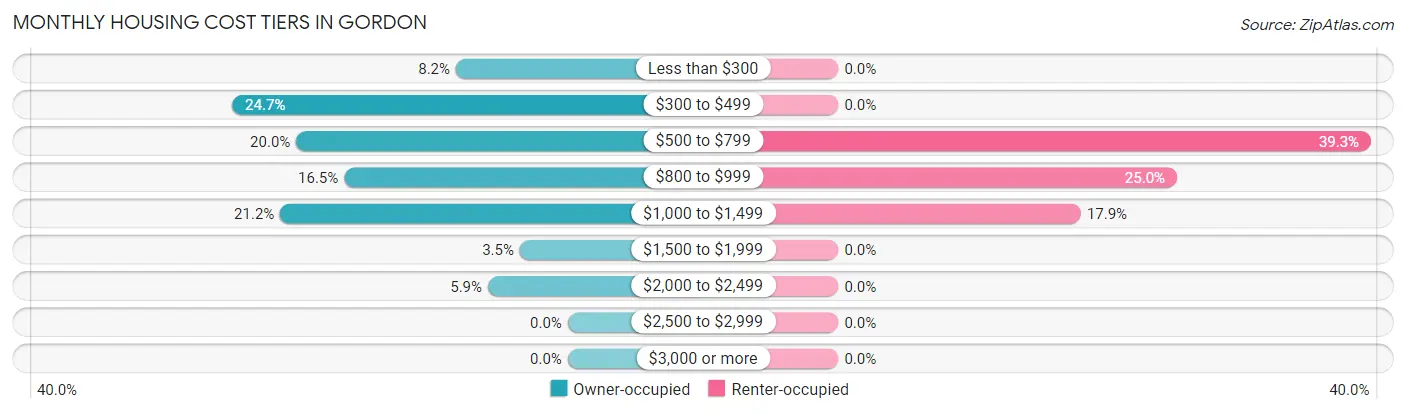
| Monthly Cost | Owner-occupied | Renter-occupied |
| Less than $300 | 7 (8.2%) | 0 (0.0%) |
| $300 to $499 | 21 (24.7%) | 0 (0.0%) |
| $500 to $799 | 17 (20.0%) | 11 (39.3%) |
| $800 to $999 | 14 (16.5%) | 7 (25.0%) |
| $1,000 to $1,499 | 18 (21.2%) | 5 (17.9%) |
| $1,500 to $1,999 | 3 (3.5%) | 0 (0.0%) |
| $2,000 to $2,499 | 5 (5.9%) | 0 (0.0%) |
| $2,500 to $2,999 | 0 (0.0%) | 0 (0.0%) |
| $3,000 or more | 0 (0.0%) | 0 (0.0%) |
| Total | 85 (100.0%) | 28 (100.0%) |
Physical Housing Characteristics in Gordon
Housing Structures in Gordon
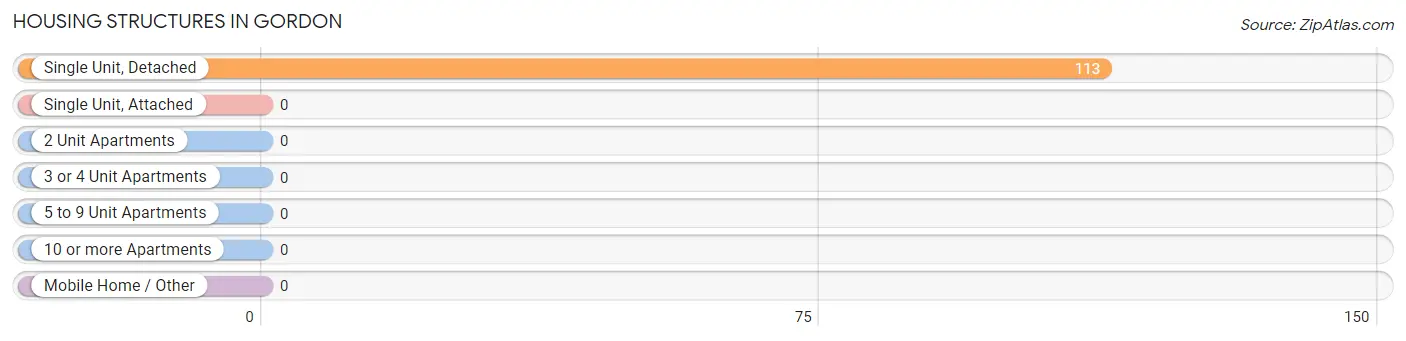
| Structure Type | # Housing Units | % Housing Units |
| Single Unit, Detached | 113 | 100.0% |
| Single Unit, Attached | 0 | 0.0% |
| 2 Unit Apartments | 0 | 0.0% |
| 3 or 4 Unit Apartments | 0 | 0.0% |
| 5 to 9 Unit Apartments | 0 | 0.0% |
| 10 or more Apartments | 0 | 0.0% |
| Mobile Home / Other | 0 | 0.0% |
| Total | 113 | 100.0% |
Housing Structures by Occupancy in Gordon
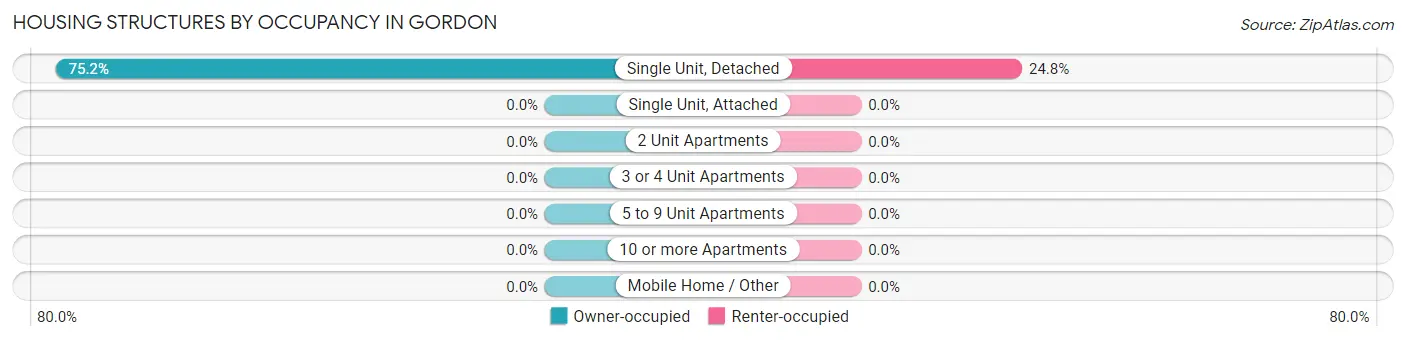
| Structure Type | Owner-occupied | Renter-occupied |
| Single Unit, Detached | 85 (75.2%) | 28 (24.8%) |
| Single Unit, Attached | 0 (0.0%) | 0 (0.0%) |
| 2 Unit Apartments | 0 (0.0%) | 0 (0.0%) |
| 3 or 4 Unit Apartments | 0 (0.0%) | 0 (0.0%) |
| 5 to 9 Unit Apartments | 0 (0.0%) | 0 (0.0%) |
| 10 or more Apartments | 0 (0.0%) | 0 (0.0%) |
| Mobile Home / Other | 0 (0.0%) | 0 (0.0%) |
| Total | 85 (75.2%) | 28 (24.8%) |
Housing Structures by Number of Rooms in Gordon
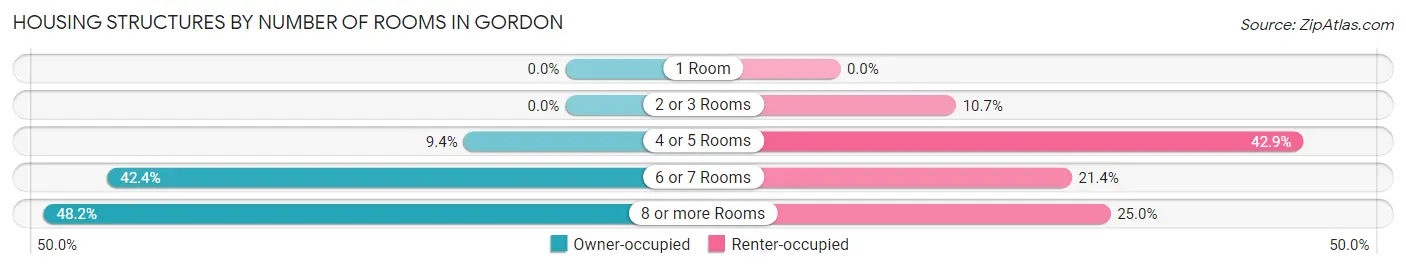
| Number of Rooms | Owner-occupied | Renter-occupied |
| 1 Room | 0 (0.0%) | 0 (0.0%) |
| 2 or 3 Rooms | 0 (0.0%) | 3 (10.7%) |
| 4 or 5 Rooms | 8 (9.4%) | 12 (42.9%) |
| 6 or 7 Rooms | 36 (42.3%) | 6 (21.4%) |
| 8 or more Rooms | 41 (48.2%) | 7 (25.0%) |
| Total | 85 (100.0%) | 28 (100.0%) |
Housing Structure by Heating Type in Gordon
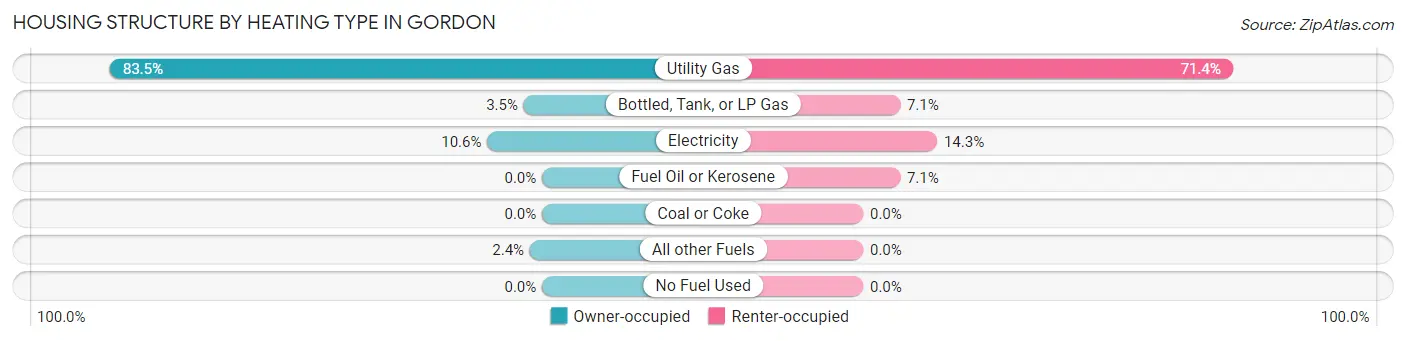
| Heating Type | Owner-occupied | Renter-occupied |
| Utility Gas | 71 (83.5%) | 20 (71.4%) |
| Bottled, Tank, or LP Gas | 3 (3.5%) | 2 (7.1%) |
| Electricity | 9 (10.6%) | 4 (14.3%) |
| Fuel Oil or Kerosene | 0 (0.0%) | 2 (7.1%) |
| Coal or Coke | 0 (0.0%) | 0 (0.0%) |
| All other Fuels | 2 (2.4%) | 0 (0.0%) |
| No Fuel Used | 0 (0.0%) | 0 (0.0%) |
| Total | 85 (100.0%) | 28 (100.0%) |
Household Vehicle Usage in Gordon
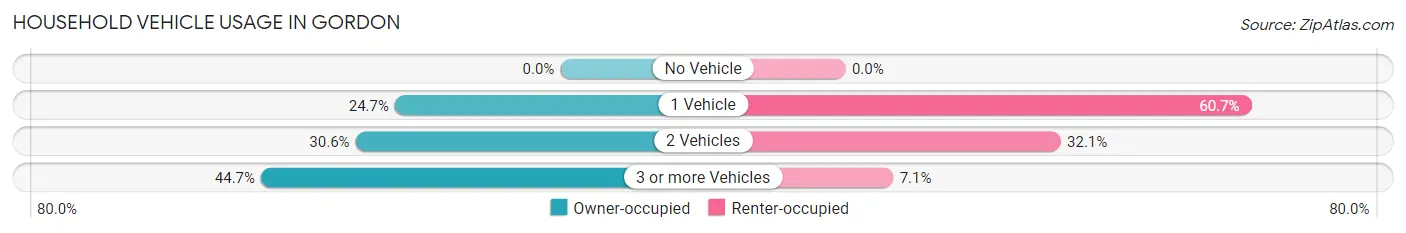
| Vehicles per Household | Owner-occupied | Renter-occupied |
| No Vehicle | 0 (0.0%) | 0 (0.0%) |
| 1 Vehicle | 21 (24.7%) | 17 (60.7%) |
| 2 Vehicles | 26 (30.6%) | 9 (32.1%) |
| 3 or more Vehicles | 38 (44.7%) | 2 (7.1%) |
| Total | 85 (100.0%) | 28 (100.0%) |
Real Estate & Mortgages in Gordon
Real Estate and Mortgage Overview in Gordon
| Characteristic | Without Mortgage | With Mortgage |
| Housing Units | 39 | 46 |
| Median Property Value | $109,000 | $137,500 |
| Median Household Income | - | - |
| Monthly Housing Costs | $408 | $0 |
| Real Estate Taxes | $1,804 | $0 |
Property Value by Mortgage Status in Gordon
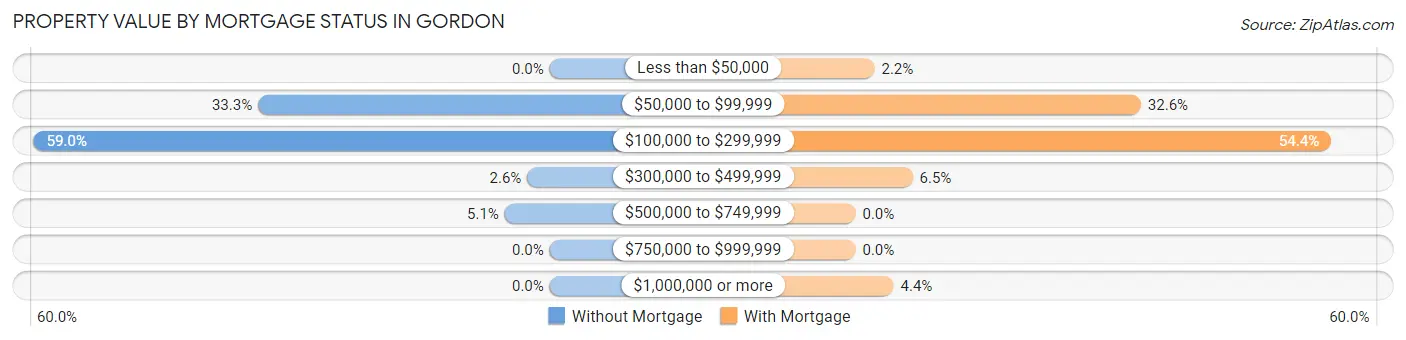
| Property Value | Without Mortgage | With Mortgage |
| Less than $50,000 | 0 (0.0%) | 1 (2.2%) |
| $50,000 to $99,999 | 13 (33.3%) | 15 (32.6%) |
| $100,000 to $299,999 | 23 (59.0%) | 25 (54.3%) |
| $300,000 to $499,999 | 1 (2.6%) | 3 (6.5%) |
| $500,000 to $749,999 | 2 (5.1%) | 0 (0.0%) |
| $750,000 to $999,999 | 0 (0.0%) | 0 (0.0%) |
| $1,000,000 or more | 0 (0.0%) | 2 (4.3%) |
| Total | 39 (100.0%) | 46 (100.0%) |
Household Income by Mortgage Status in Gordon
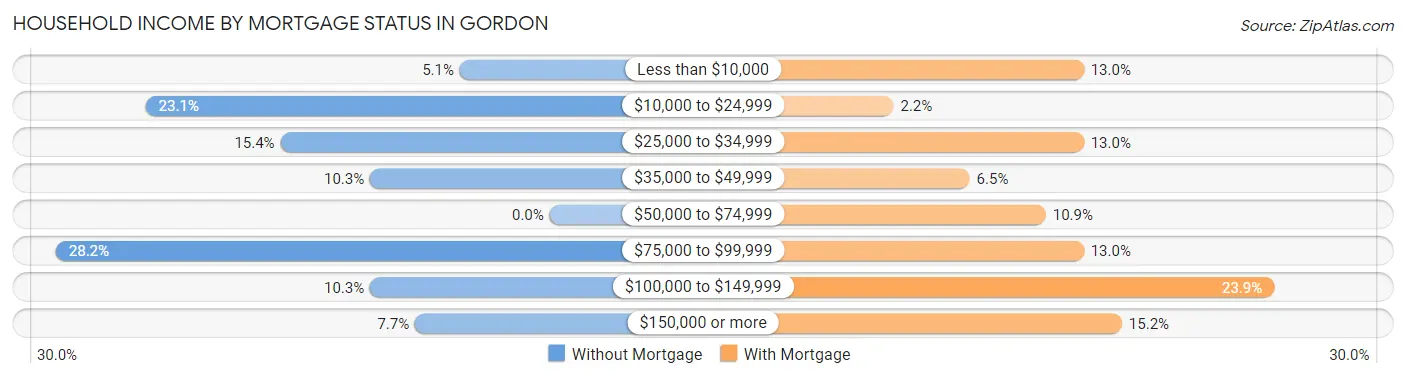
| Household Income | Without Mortgage | With Mortgage |
| Less than $10,000 | 2 (5.1%) | 6 (13.0%) |
| $10,000 to $24,999 | 9 (23.1%) | 1 (2.2%) |
| $25,000 to $34,999 | 6 (15.4%) | 6 (13.0%) |
| $35,000 to $49,999 | 4 (10.3%) | 3 (6.5%) |
| $50,000 to $74,999 | 0 (0.0%) | 5 (10.9%) |
| $75,000 to $99,999 | 11 (28.2%) | 6 (13.0%) |
| $100,000 to $149,999 | 4 (10.3%) | 11 (23.9%) |
| $150,000 or more | 3 (7.7%) | 7 (15.2%) |
| Total | 39 (100.0%) | 46 (100.0%) |
Property Value to Household Income Ratio in Gordon
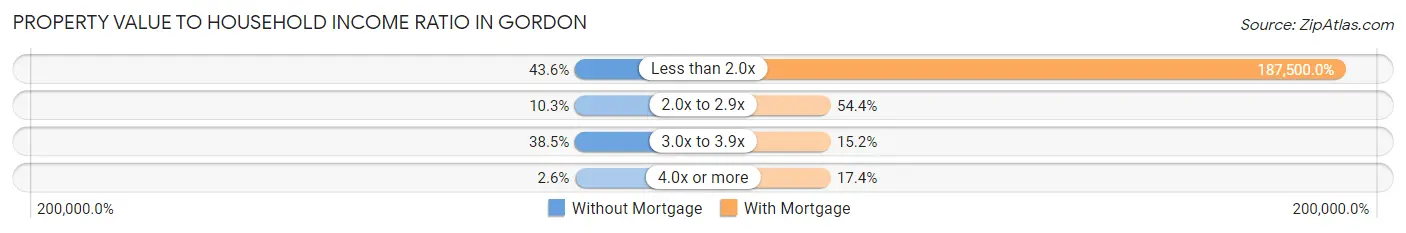
| Value-to-Income Ratio | Without Mortgage | With Mortgage |
| Less than 2.0x | 17 (43.6%) | 86,250 (187,500.0%) |
| 2.0x to 2.9x | 4 (10.3%) | 25 (54.3%) |
| 3.0x to 3.9x | 15 (38.5%) | 7 (15.2%) |
| 4.0x or more | 1 (2.6%) | 8 (17.4%) |
| Total | 39 (100.0%) | 46 (100.0%) |
Real Estate Taxes by Mortgage Status in Gordon
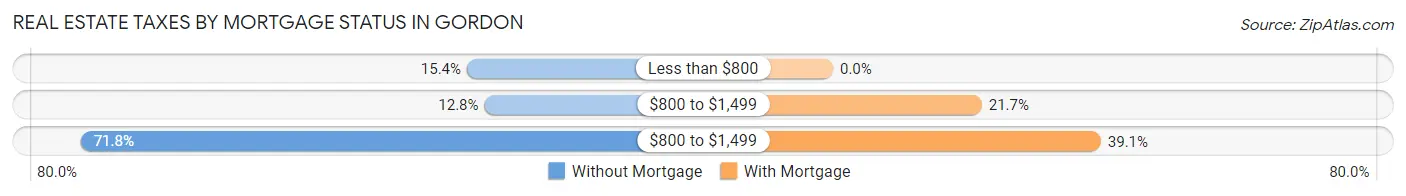
| Property Taxes | Without Mortgage | With Mortgage |
| Less than $800 | 6 (15.4%) | 0 (0.0%) |
| $800 to $1,499 | 5 (12.8%) | 10 (21.7%) |
| $800 to $1,499 | 28 (71.8%) | 18 (39.1%) |
| Total | 39 (100.0%) | 46 (100.0%) |
Health & Disability in Gordon
Health Insurance Coverage by Age in Gordon
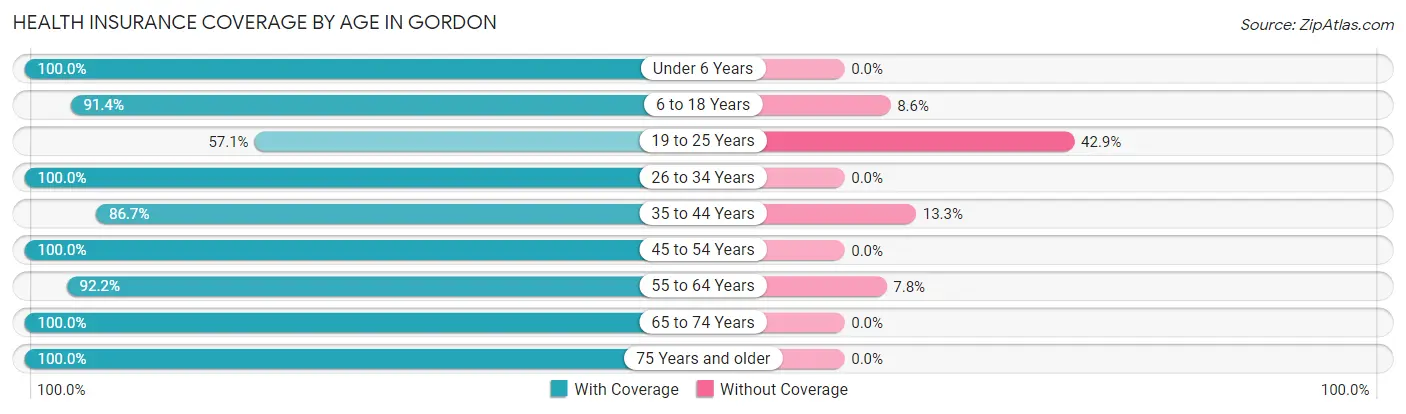
| Age Bracket | With Coverage | Without Coverage |
| Under 6 Years | 14 (100.0%) | 0 (0.0%) |
| 6 to 18 Years | 32 (91.4%) | 3 (8.6%) |
| 19 to 25 Years | 16 (57.1%) | 12 (42.9%) |
| 26 to 34 Years | 23 (100.0%) | 0 (0.0%) |
| 35 to 44 Years | 39 (86.7%) | 6 (13.3%) |
| 45 to 54 Years | 13 (100.0%) | 0 (0.0%) |
| 55 to 64 Years | 47 (92.2%) | 4 (7.8%) |
| 65 to 74 Years | 23 (100.0%) | 0 (0.0%) |
| 75 Years and older | 15 (100.0%) | 0 (0.0%) |
| Total | 222 (89.9%) | 25 (10.1%) |
Health Insurance Coverage by Citizenship Status in Gordon
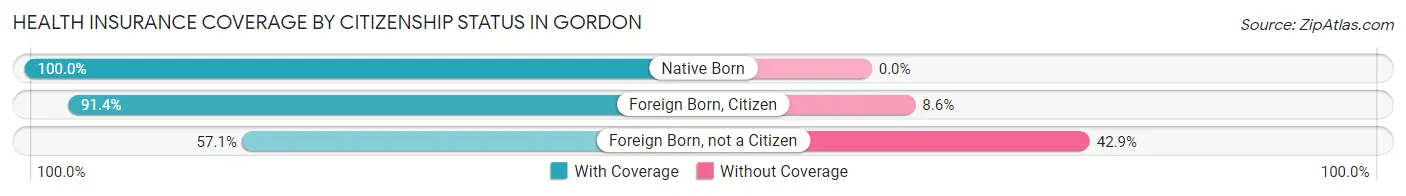
| Citizenship Status | With Coverage | Without Coverage |
| Native Born | 14 (100.0%) | 0 (0.0%) |
| Foreign Born, Citizen | 32 (91.4%) | 3 (8.6%) |
| Foreign Born, not a Citizen | 16 (57.1%) | 12 (42.9%) |
Health Insurance Coverage by Household Income in Gordon
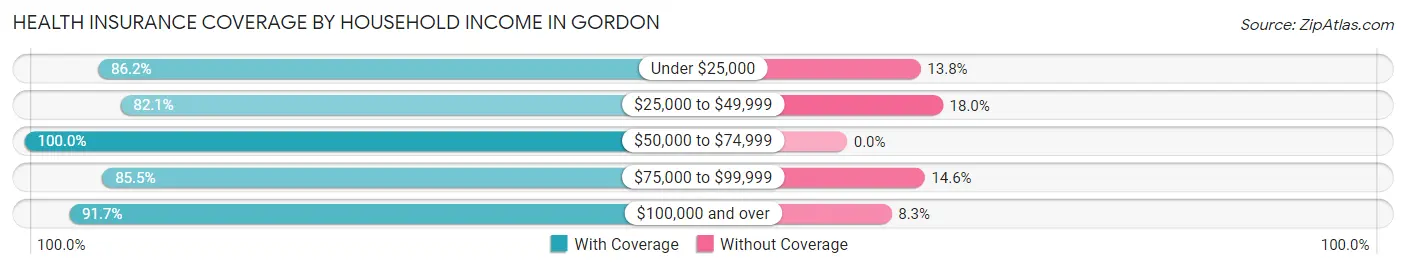
| Household Income | With Coverage | Without Coverage |
| Under $25,000 | 25 (86.2%) | 4 (13.8%) |
| $25,000 to $49,999 | 32 (82.1%) | 7 (17.9%) |
| $50,000 to $74,999 | 52 (100.0%) | 0 (0.0%) |
| $75,000 to $99,999 | 47 (85.5%) | 8 (14.5%) |
| $100,000 and over | 66 (91.7%) | 6 (8.3%) |
Public vs Private Health Insurance Coverage by Age in Gordon
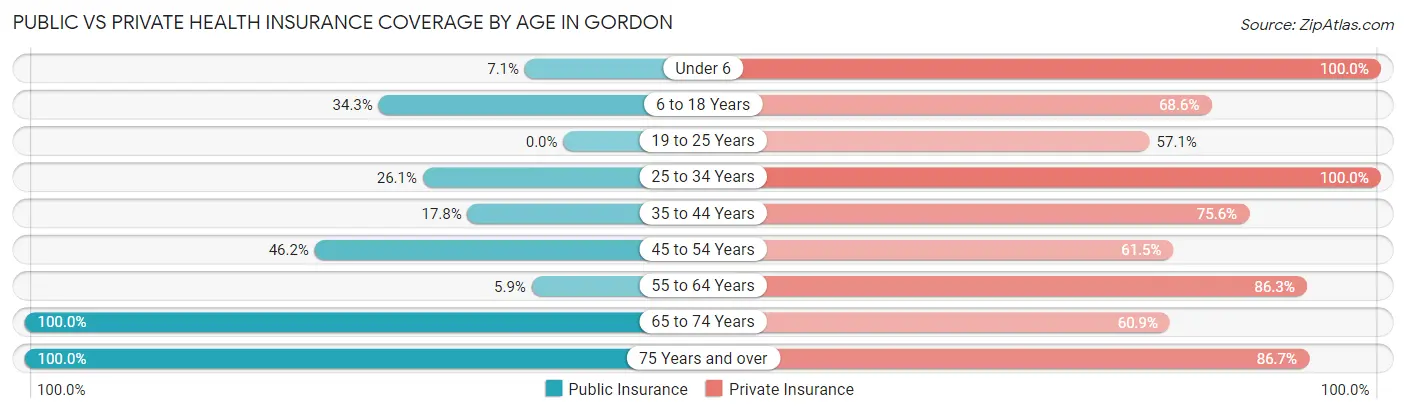
| Age Bracket | Public Insurance | Private Insurance |
| Under 6 | 1 (7.1%) | 14 (100.0%) |
| 6 to 18 Years | 12 (34.3%) | 24 (68.6%) |
| 19 to 25 Years | 0 (0.0%) | 16 (57.1%) |
| 25 to 34 Years | 6 (26.1%) | 23 (100.0%) |
| 35 to 44 Years | 8 (17.8%) | 34 (75.6%) |
| 45 to 54 Years | 6 (46.2%) | 8 (61.5%) |
| 55 to 64 Years | 3 (5.9%) | 44 (86.3%) |
| 65 to 74 Years | 23 (100.0%) | 14 (60.9%) |
| 75 Years and over | 15 (100.0%) | 13 (86.7%) |
| Total | 74 (30.0%) | 190 (76.9%) |
Disability Status by Sex by Age in Gordon
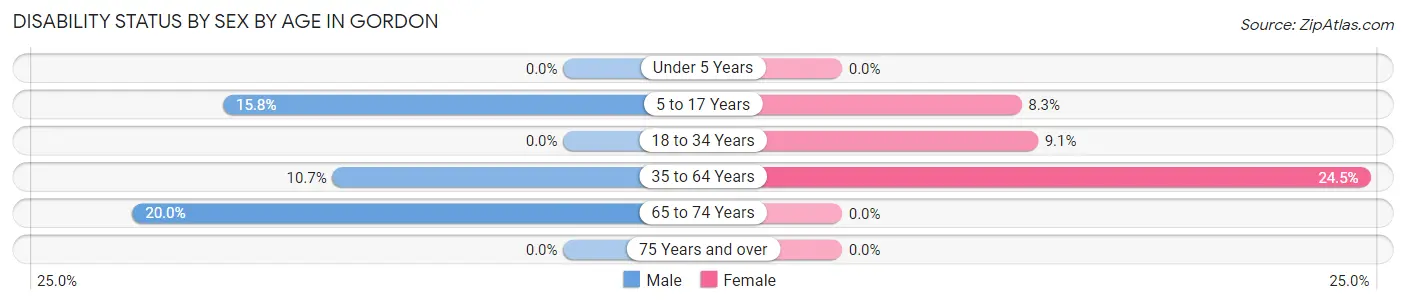
| Age Bracket | Male | Female |
| Under 5 Years | 0 (0.0%) | 0 (0.0%) |
| 5 to 17 Years | 3 (15.8%) | 1 (8.3%) |
| 18 to 34 Years | 0 (0.0%) | 2 (9.1%) |
| 35 to 64 Years | 6 (10.7%) | 13 (24.5%) |
| 65 to 74 Years | 2 (20.0%) | 0 (0.0%) |
| 75 Years and over | 0 (0.0%) | 0 (0.0%) |
Disability Class by Sex by Age in Gordon
Disability Class: Hearing Difficulty
| Age Bracket | Male | Female |
| Under 5 Years | 0 (0.0%) | 0 (0.0%) |
| 5 to 17 Years | 0 (0.0%) | 0 (0.0%) |
| 18 to 34 Years | 0 (0.0%) | 0 (0.0%) |
| 35 to 64 Years | 0 (0.0%) | 0 (0.0%) |
| 65 to 74 Years | 0 (0.0%) | 0 (0.0%) |
| 75 Years and over | 0 (0.0%) | 0 (0.0%) |
Disability Class: Vision Difficulty
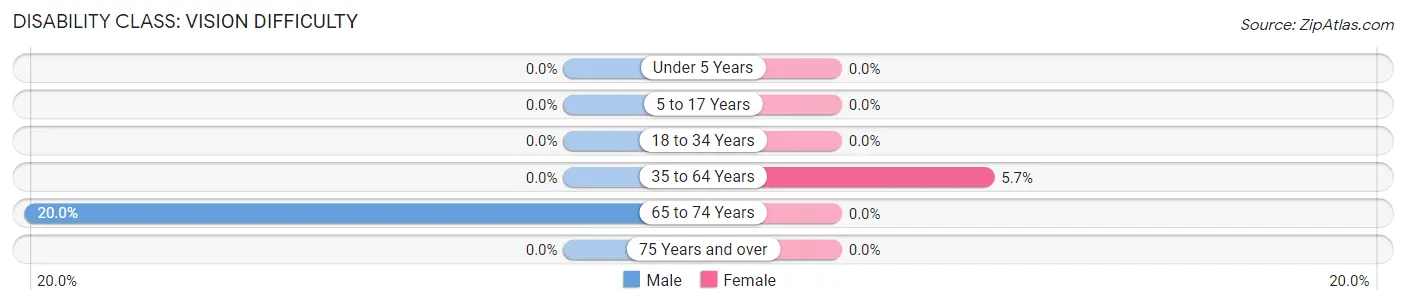
| Age Bracket | Male | Female |
| Under 5 Years | 0 (0.0%) | 0 (0.0%) |
| 5 to 17 Years | 0 (0.0%) | 0 (0.0%) |
| 18 to 34 Years | 0 (0.0%) | 0 (0.0%) |
| 35 to 64 Years | 0 (0.0%) | 3 (5.7%) |
| 65 to 74 Years | 2 (20.0%) | 0 (0.0%) |
| 75 Years and over | 0 (0.0%) | 0 (0.0%) |
Disability Class: Cognitive Difficulty
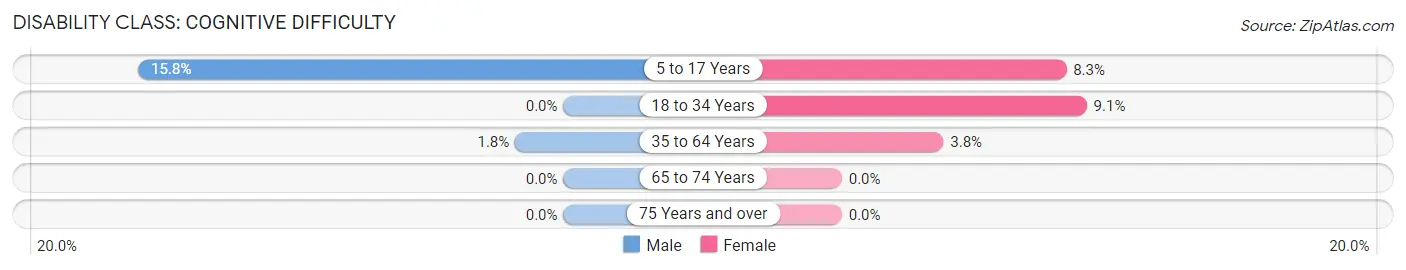
| Age Bracket | Male | Female |
| 5 to 17 Years | 3 (15.8%) | 1 (8.3%) |
| 18 to 34 Years | 0 (0.0%) | 2 (9.1%) |
| 35 to 64 Years | 1 (1.8%) | 2 (3.8%) |
| 65 to 74 Years | 0 (0.0%) | 0 (0.0%) |
| 75 Years and over | 0 (0.0%) | 0 (0.0%) |
Disability Class: Ambulatory Difficulty
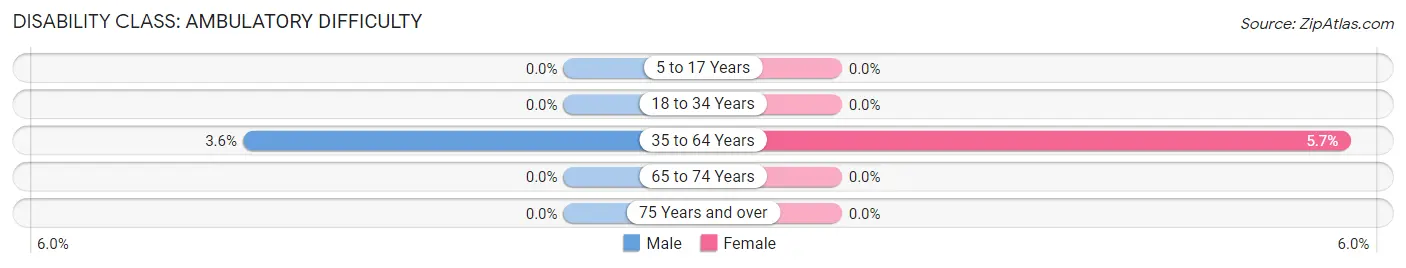
| Age Bracket | Male | Female |
| 5 to 17 Years | 0 (0.0%) | 0 (0.0%) |
| 18 to 34 Years | 0 (0.0%) | 0 (0.0%) |
| 35 to 64 Years | 2 (3.6%) | 3 (5.7%) |
| 65 to 74 Years | 0 (0.0%) | 0 (0.0%) |
| 75 Years and over | 0 (0.0%) | 0 (0.0%) |
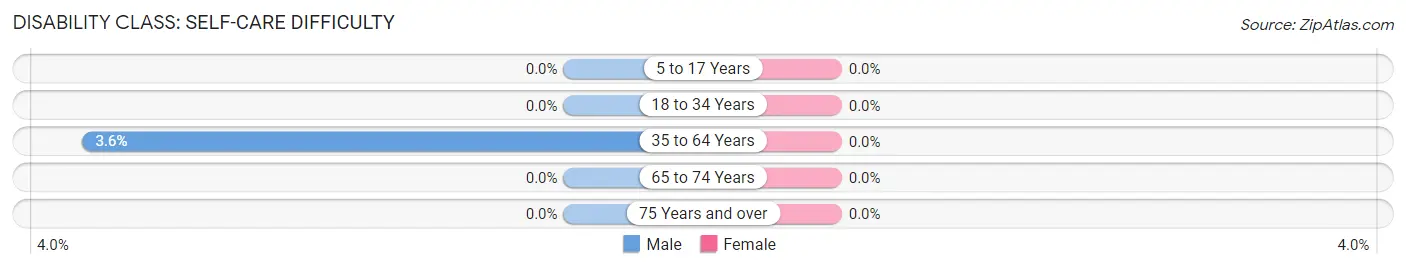
Disability Class: Self-Care Difficulty
| Age Bracket | Male | Female |
| 5 to 17 Years | 0 (0.0%) | 0 (0.0%) |
| 18 to 34 Years | 0 (0.0%) | 0 (0.0%) |
| 35 to 64 Years | 2 (3.6%) | 0 (0.0%) |
| 65 to 74 Years | 0 (0.0%) | 0 (0.0%) |
| 75 Years and over | 0 (0.0%) | 0 (0.0%) |
Technology Access in Gordon
Computing Device Access in Gordon
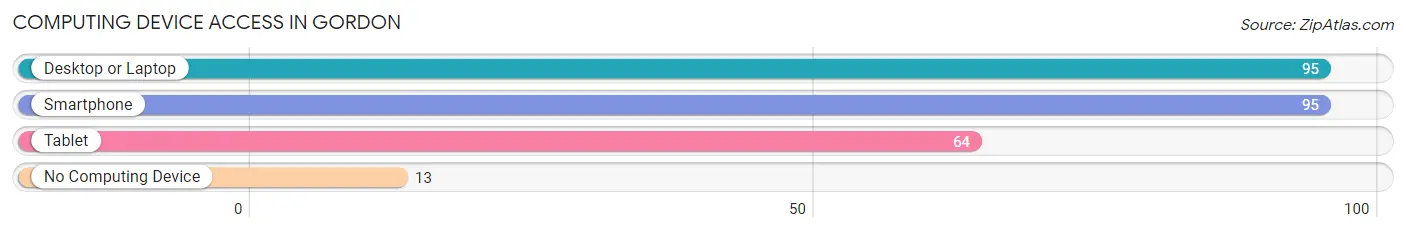
| Device Type | # Households | % Households |
| Desktop or Laptop | 95 | 84.1% |
| Smartphone | 95 | 84.1% |
| Tablet | 64 | 56.6% |
| No Computing Device | 13 | 11.5% |
| Total | 113 | 100.0% |
Internet Access in Gordon
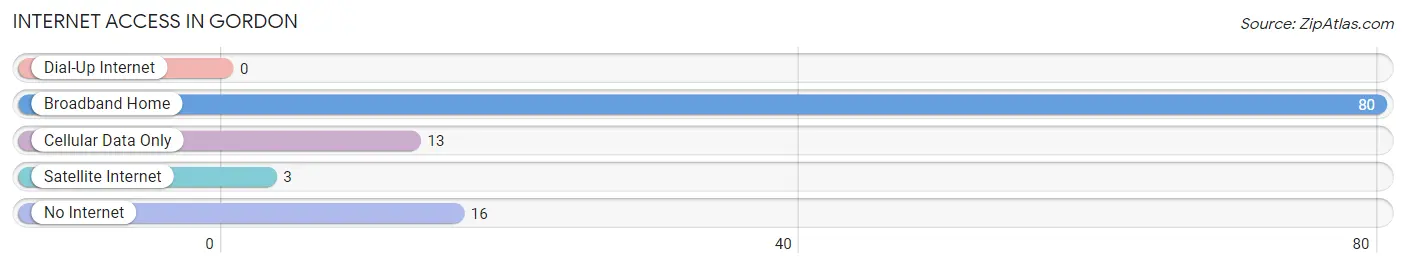
| Internet Type | # Households | % Households |
| Dial-Up Internet | 0 | 0.0% |
| Broadband Home | 80 | 70.8% |
| Cellular Data Only | 13 | 11.5% |
| Satellite Internet | 3 | 2.6% |
| No Internet | 16 | 14.2% |
| Total | 113 | 100.0% |
Gordon Summary
Gordon, Ohio is a small village located in the southeastern corner of the state, in the Appalachian region. It is situated in the foothills of the Appalachian Mountains, and is surrounded by rolling hills and lush forests. The village is located in Vinton County, and is part of the McArthur Micropolitan Statistical Area. The population of Gordon was estimated to be 545 in the year 2000.
Geography
Gordon is located at 39°17'N, 82°25'W, and is situated in the Appalachian region of Ohio. The village is located in the foothills of the Appalachian Mountains, and is surrounded by rolling hills and lush forests. The village is located in Vinton County, and is part of the McArthur Micropolitan Statistical Area. The nearest major city is Columbus, which is located approximately 70 miles to the north.
The terrain of Gordon is mostly hilly, with some flat areas. The village is located in the Appalachian Plateau, which is characterized by steep hills and deep valleys. The climate of Gordon is humid continental, with hot summers and cold winters. The average annual temperature is around 50°F, and the average annual precipitation is around 40 inches.
Economy
The economy of Gordon is largely based on agriculture and forestry. The village is home to several small farms, which produce a variety of crops, including corn, soybeans, wheat, and hay. The village also has several sawmills, which produce lumber for the local market.
In addition to agriculture and forestry, Gordon also has a small manufacturing sector. The village is home to several small factories, which produce a variety of products, including furniture, clothing, and automotive parts.
Demographics
The population of Gordon was estimated to be 545 in the year 2000. The population is predominantly white, with a small minority of African Americans. The median household income in Gordon is around $30,000, and the median home value is around $90,000.
The village is served by the Vinton County School District, which includes two elementary schools, one middle school, and one high school. The village also has a public library, a post office, and several churches.
Conclusion
Gordon, Ohio is a small village located in the southeastern corner of the state, in the Appalachian region. It is situated in the foothills of the Appalachian Mountains, and is surrounded by rolling hills and lush forests. The village is located in Vinton County, and is part of the McArthur Micropolitan Statistical Area. The population of Gordon was estimated to be 545 in the year 2000. The economy of Gordon is largely based on agriculture and forestry, and the village also has a small manufacturing sector. The population is predominantly white, with a small minority of African Americans. The village is served by the Vinton County School District, and has a public library, a post office, and several churches.
Common Questions
What is Per Capita Income in Gordon?
Per Capita income in Gordon is $33,275.
What is the Median Family Income in Gordon?
Median Family Income in Gordon is $88,333.
What is the Median Household income in Gordon?
Median Household Income in Gordon is $69,250.
What is Income or Wage Gap in Gordon?
Income or Wage Gap in Gordon is 56.7%.
Women in Gordon earn 43.3 cents for every dollar earned by a man.
What is Inequality or Gini Index in Gordon?
Inequality or Gini Index in Gordon is 0.37.
What is the Total Population of Gordon?
Total Population of Gordon is 247.
What is the Total Male Population of Gordon?
Total Male Population of Gordon is 128.
What is the Total Female Population of Gordon?
Total Female Population of Gordon is 119.
What is the Ratio of Males per 100 Females in Gordon?
There are 107.56 Males per 100 Females in Gordon.
What is the Ratio of Females per 100 Males in Gordon?
There are 92.97 Females per 100 Males in Gordon.
What is the Median Population Age in Gordon?
Median Population Age in Gordon is 41.4 Years.
What is the Average Family Size in Gordon
Average Family Size in Gordon is 2.6 People.
What is the Average Household Size in Gordon
Average Household Size in Gordon is 2.2 People.
How Large is the Labor Force in Gordon?
There are 135 People in the Labor Forcein in Gordon.
What is the Percentage of People in the Labor Force in Gordon?
65.5% of People are in the Labor Force in Gordon.
What is the Unemployment Rate in Gordon?
Unemployment Rate in Gordon is 8.1%.