Frazeysburg, OH Map & Demographics
Frazeysburg Map
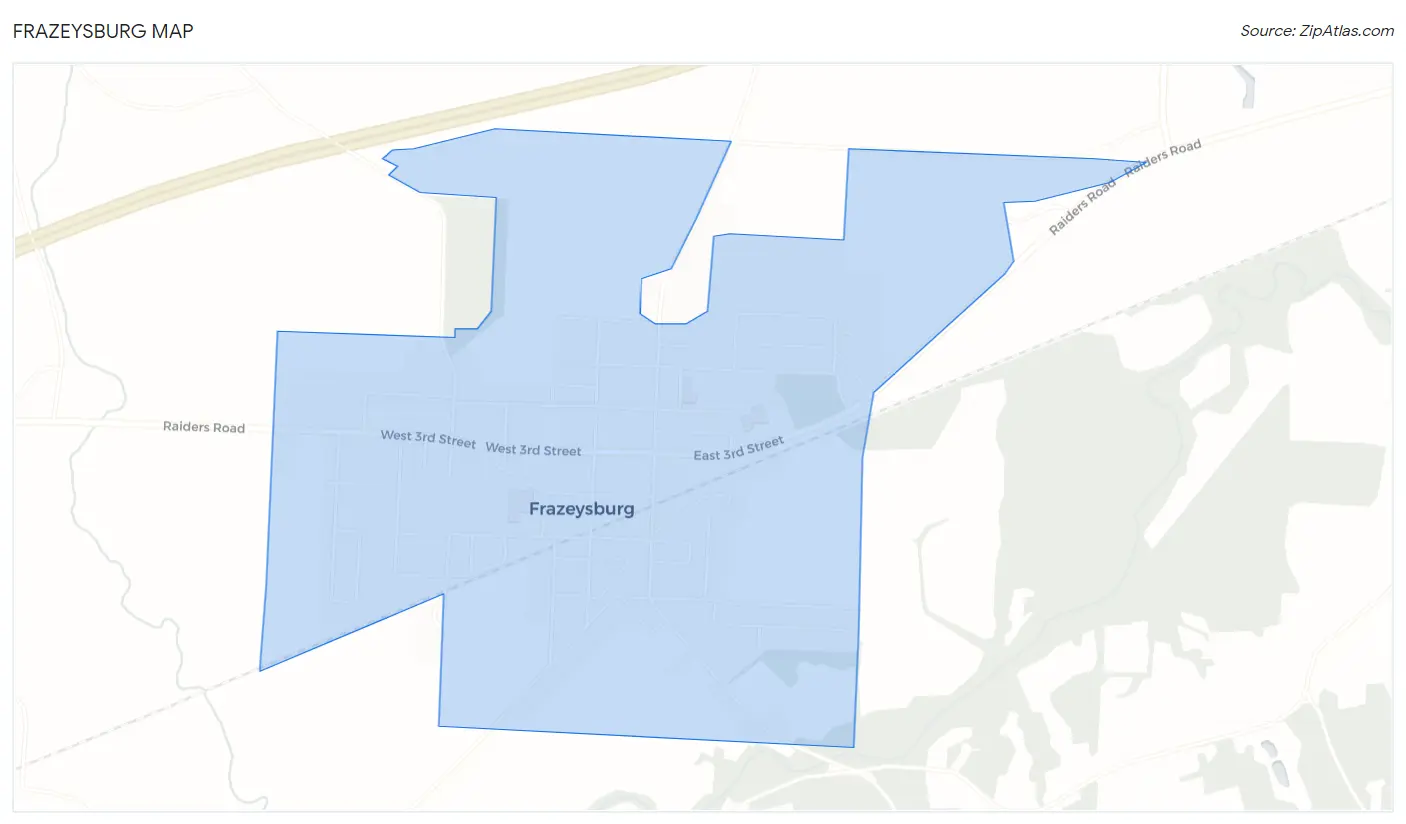
Frazeysburg Overview
$27,594
PER CAPITA INCOME
$62,232
AVG FAMILY INCOME
$49,118
AVG HOUSEHOLD INCOME
13.3%
WAGE / INCOME GAP [ % ]
86.7¢/ $1
WAGE / INCOME GAP [ $ ]
0.41
INEQUALITY / GINI INDEX
1,335
TOTAL POPULATION
620
MALE POPULATION
715
FEMALE POPULATION
86.71
MALES / 100 FEMALES
115.32
FEMALES / 100 MALES
48.6
MEDIAN AGE
2.8
AVG FAMILY SIZE
2.5
AVG HOUSEHOLD SIZE
622
LABOR FORCE [ PEOPLE ]
55.6%
PERCENT IN LABOR FORCE
6.1%
UNEMPLOYMENT RATE
Frazeysburg Zip Codes
Frazeysburg Area Codes
Income in Frazeysburg
Income Overview in Frazeysburg
Per Capita Income in Frazeysburg is $27,594, while median incomes of families and households are $62,232 and $49,118 respectively.
| Characteristic | Number | Measure |
| Per Capita Income | 1,335 | $27,594 |
| Median Family Income | 349 | $62,232 |
| Mean Family Income | 349 | $76,736 |
| Median Household Income | 546 | $49,118 |
| Mean Household Income | 546 | $65,163 |
| Income Deficit | 349 | $0 |
| Wage / Income Gap (%) | 1,335 | 13.28% |
| Wage / Income Gap ($) | 1,335 | 86.72¢ per $1 |
| Gini / Inequality Index | 1,335 | 0.41 |
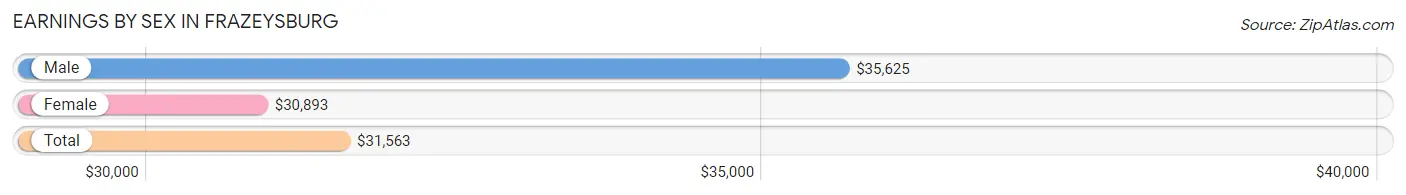
Earnings by Sex in Frazeysburg
Average Earnings in Frazeysburg are $31,563, $35,625 for men and $30,893 for women, a difference of 13.3%.
| Sex | Number | Average Earnings |
| Male | 373 (55.7%) | $35,625 |
| Female | 297 (44.3%) | $30,893 |
| Total | 670 (100.0%) | $31,563 |
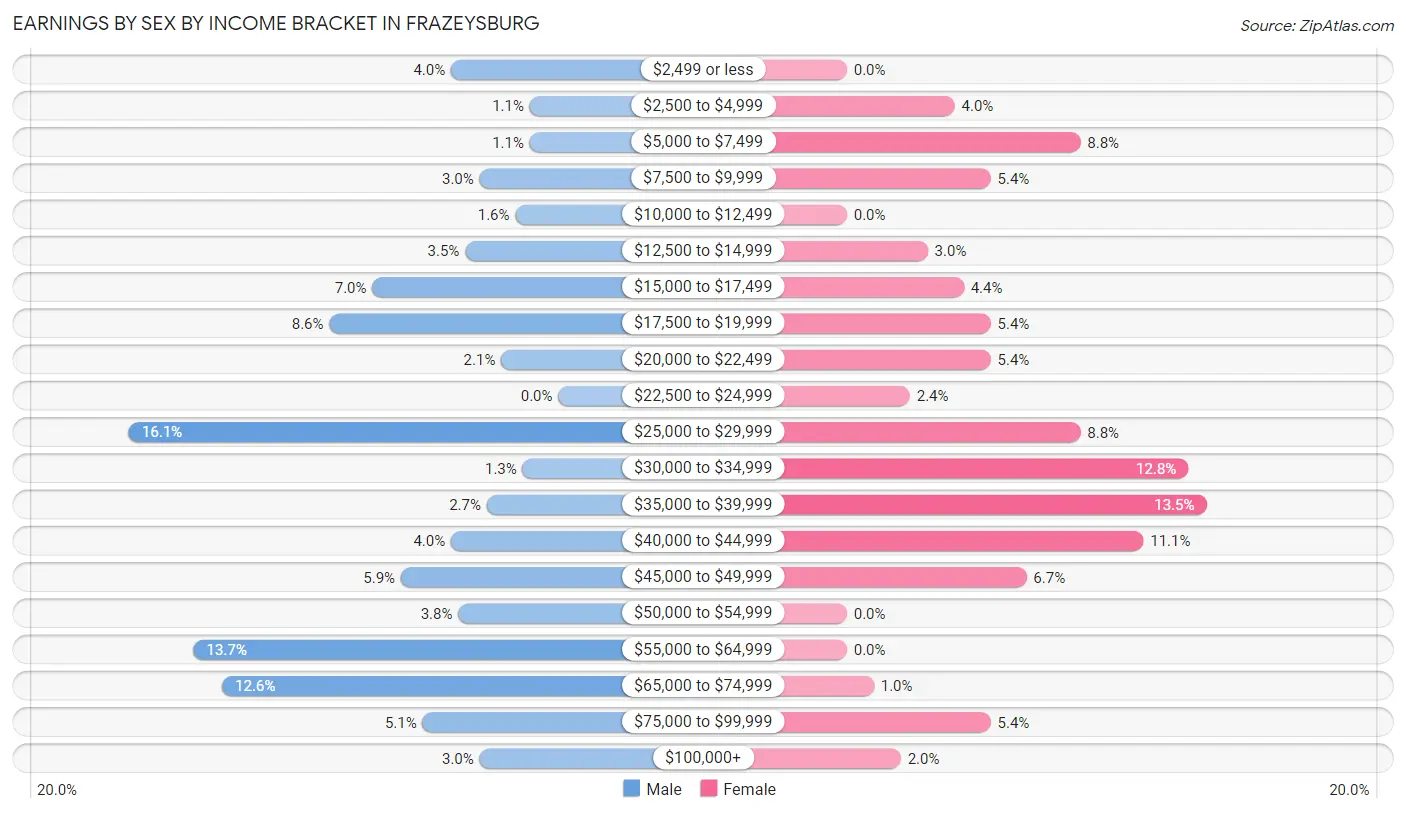
Earnings by Sex by Income Bracket in Frazeysburg
The most common earnings brackets in Frazeysburg are $25,000 to $29,999 for men (60 | 16.1%) and $35,000 to $39,999 for women (40 | 13.5%).
| Income | Male | Female |
| $2,499 or less | 15 (4.0%) | 0 (0.0%) |
| $2,500 to $4,999 | 4 (1.1%) | 12 (4.0%) |
| $5,000 to $7,499 | 4 (1.1%) | 26 (8.7%) |
| $7,500 to $9,999 | 11 (2.9%) | 16 (5.4%) |
| $10,000 to $12,499 | 6 (1.6%) | 0 (0.0%) |
| $12,500 to $14,999 | 13 (3.5%) | 9 (3.0%) |
| $15,000 to $17,499 | 26 (7.0%) | 13 (4.4%) |
| $17,500 to $19,999 | 32 (8.6%) | 16 (5.4%) |
| $20,000 to $22,499 | 8 (2.1%) | 16 (5.4%) |
| $22,500 to $24,999 | 0 (0.0%) | 7 (2.4%) |
| $25,000 to $29,999 | 60 (16.1%) | 26 (8.7%) |
| $30,000 to $34,999 | 5 (1.3%) | 38 (12.8%) |
| $35,000 to $39,999 | 10 (2.7%) | 40 (13.5%) |
| $40,000 to $44,999 | 15 (4.0%) | 33 (11.1%) |
| $45,000 to $49,999 | 22 (5.9%) | 20 (6.7%) |
| $50,000 to $54,999 | 14 (3.7%) | 0 (0.0%) |
| $55,000 to $64,999 | 51 (13.7%) | 0 (0.0%) |
| $65,000 to $74,999 | 47 (12.6%) | 3 (1.0%) |
| $75,000 to $99,999 | 19 (5.1%) | 16 (5.4%) |
| $100,000+ | 11 (2.9%) | 6 (2.0%) |
| Total | 373 (100.0%) | 297 (100.0%) |
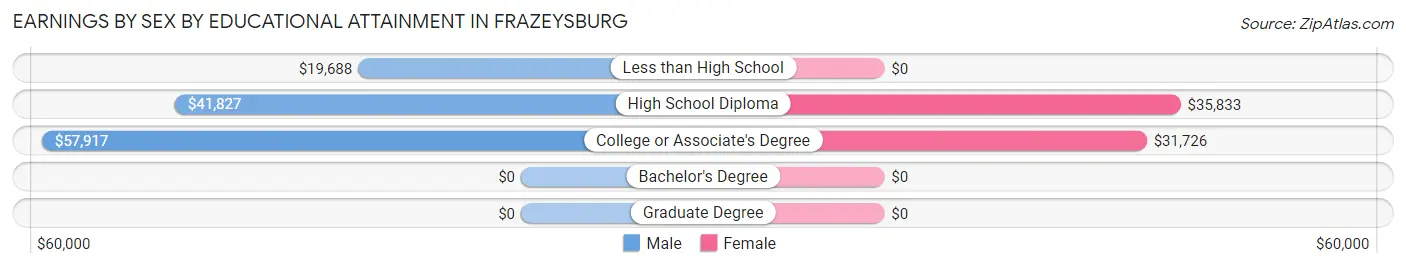
Earnings by Sex by Educational Attainment in Frazeysburg
Average earnings in Frazeysburg are $42,333 for men and $32,647 for women, a difference of 22.9%. Men with an educational attainment of college or associate's degree enjoy the highest average annual earnings of $57,917, while those with less than high school education earn the least with $19,688. Women with an educational attainment of high school diploma earn the most with the average annual earnings of $35,833, while those with college or associate's degree education have the smallest earnings of $31,726.
| Educational Attainment | Male Income | Female Income |
| Less than High School | $19,688 | $0 |
| High School Diploma | $41,827 | $35,833 |
| College or Associate's Degree | $57,917 | $31,726 |
| Bachelor's Degree | - | - |
| Graduate Degree | - | - |
| Total | $42,333 | $32,647 |
Family Income in Frazeysburg
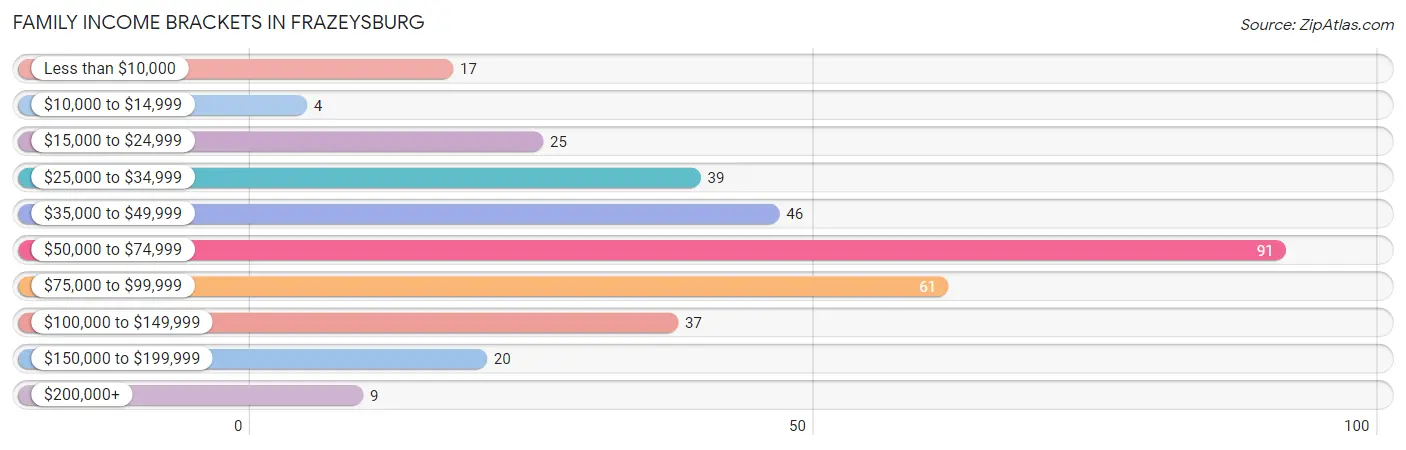
Family Income Brackets in Frazeysburg
According to the Frazeysburg family income data, there are 91 families falling into the $50,000 to $74,999 income range, which is the most common income bracket and makes up 26.1% of all families. Conversely, the $10,000 to $14,999 income bracket is the least frequent group with only 4 families (1.1%) belonging to this category.
| Income Bracket | # Families | % Families |
| Less than $10,000 | 17 | 4.9% |
| $10,000 to $14,999 | 4 | 1.1% |
| $15,000 to $24,999 | 25 | 7.2% |
| $25,000 to $34,999 | 39 | 11.2% |
| $35,000 to $49,999 | 46 | 13.2% |
| $50,000 to $74,999 | 91 | 26.1% |
| $75,000 to $99,999 | 61 | 17.5% |
| $100,000 to $149,999 | 37 | 10.6% |
| $150,000 to $199,999 | 20 | 5.7% |
| $200,000+ | 9 | 2.6% |
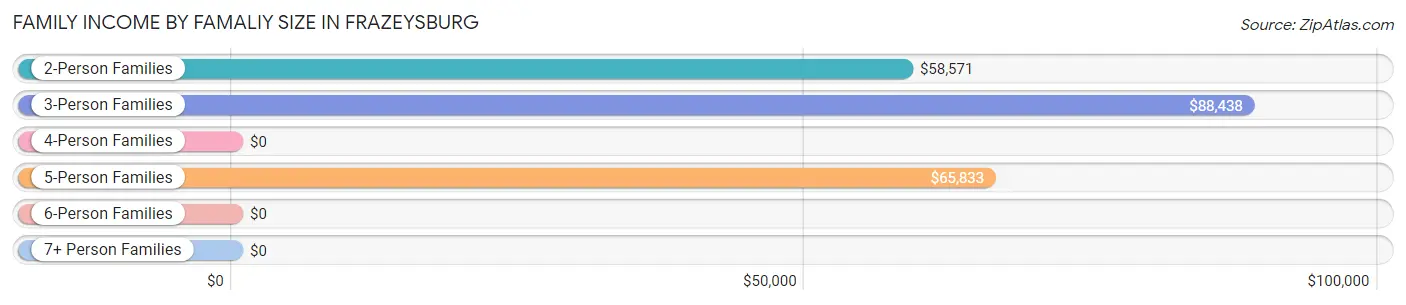
Family Income by Famaliy Size in Frazeysburg
3-person families (56 | 16.1%) account for the highest median family income in Frazeysburg with $88,438 per family, while 3-person families (56 | 16.1%) have the highest median income of $29,479 per family member.
| Income Bracket | # Families | Median Income |
| 2-Person Families | 224 (64.2%) | $58,571 |
| 3-Person Families | 56 (16.1%) | $88,438 |
| 4-Person Families | 43 (12.3%) | $0 |
| 5-Person Families | 20 (5.7%) | $65,833 |
| 6-Person Families | 6 (1.7%) | $0 |
| 7+ Person Families | 0 (0.0%) | $0 |
| Total | 349 (100.0%) | $62,232 |
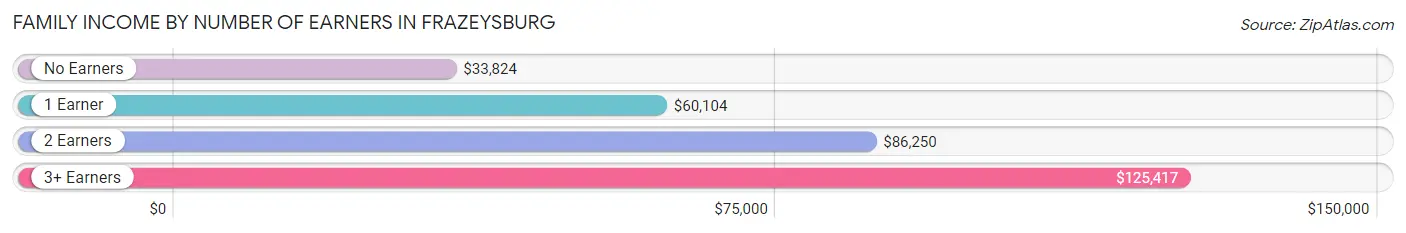
Family Income by Number of Earners in Frazeysburg
The median family income in Frazeysburg is $62,232, with families comprising 3+ earners (52) having the highest median family income of $125,417, while families with no earners (80) have the lowest median family income of $33,824, accounting for 14.9% and 22.9% of families, respectively.
| Number of Earners | # Families | Median Income |
| No Earners | 80 (22.9%) | $33,824 |
| 1 Earner | 135 (38.7%) | $60,104 |
| 2 Earners | 82 (23.5%) | $86,250 |
| 3+ Earners | 52 (14.9%) | $125,417 |
| Total | 349 (100.0%) | $62,232 |
Household Income in Frazeysburg
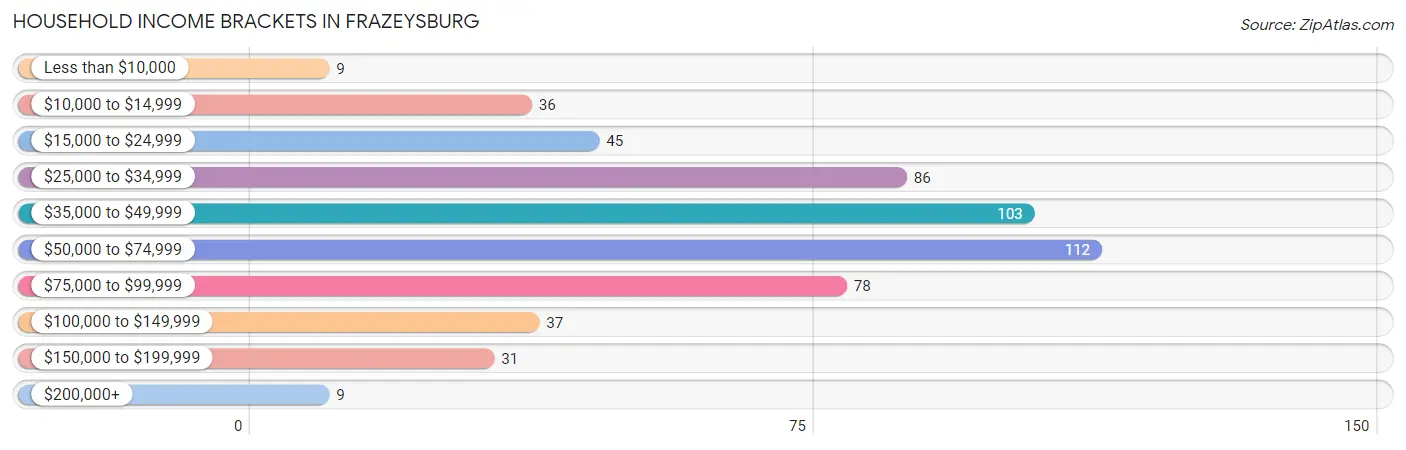
Household Income Brackets in Frazeysburg
With 112 households falling in the category, the $50,000 to $74,999 income range is the most frequent in Frazeysburg, accounting for 20.5% of all households. In contrast, only 9 households (1.7%) fall into the less than $10,000 income bracket, making it the least populous group.
| Income Bracket | # Households | % Households |
| Less than $10,000 | 9 | 1.6% |
| $10,000 to $14,999 | 36 | 6.6% |
| $15,000 to $24,999 | 45 | 8.2% |
| $25,000 to $34,999 | 86 | 15.8% |
| $35,000 to $49,999 | 103 | 18.9% |
| $50,000 to $74,999 | 112 | 20.5% |
| $75,000 to $99,999 | 78 | 14.3% |
| $100,000 to $149,999 | 37 | 6.8% |
| $150,000 to $199,999 | 31 | 5.7% |
| $200,000+ | 9 | 1.6% |
Household Income by Householder Age in Frazeysburg
The median household income in Frazeysburg is $49,118, with the highest median household income of $69,583 found in the 15 to 24 years age bracket for the primary householder. A total of 13 households (2.4%) fall into this category. Meanwhile, the 65+ years age bracket for the primary householder has the lowest median household income of $40,833, with 198 households (36.3%) in this group.
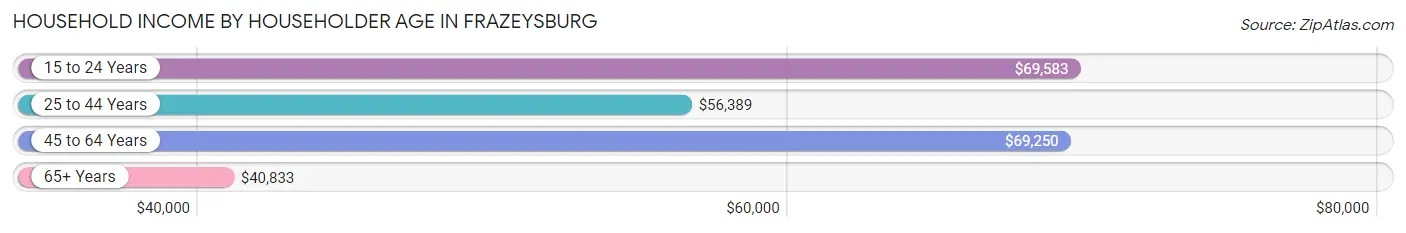
| Income Bracket | # Households | Median Income |
| 15 to 24 Years | 13 (2.4%) | $69,583 |
| 25 to 44 Years | 126 (23.1%) | $56,389 |
| 45 to 64 Years | 209 (38.3%) | $69,250 |
| 65+ Years | 198 (36.3%) | $40,833 |
| Total | 546 (100.0%) | $49,118 |
Poverty in Frazeysburg
Income Below Poverty by Sex and Age in Frazeysburg
With 9.6% poverty level for males and 22.8% for females among the residents of Frazeysburg, under 5 year old males and 5 year old females are the most vulnerable to poverty, with 18 males (75.0%) and 9 females (81.8%) in their respective age groups living below the poverty level.
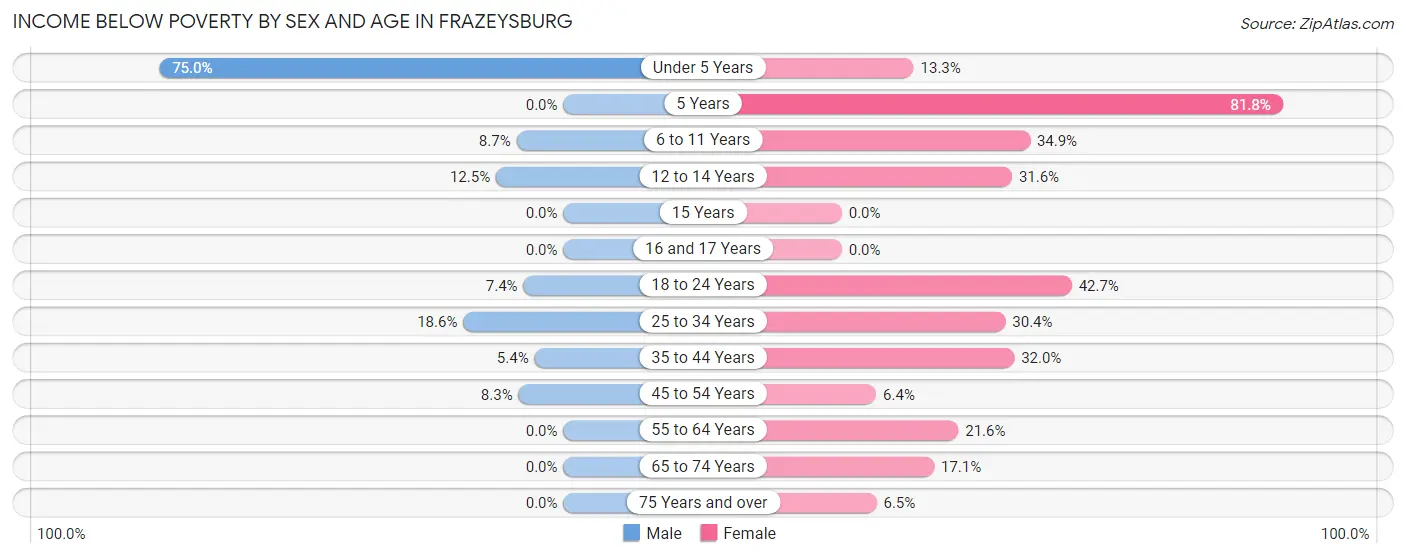
| Age Bracket | Male | Female |
| Under 5 Years | 18 (75.0%) | 2 (13.3%) |
| 5 Years | 0 (0.0%) | 9 (81.8%) |
| 6 to 11 Years | 2 (8.7%) | 22 (34.9%) |
| 12 to 14 Years | 4 (12.5%) | 6 (31.6%) |
| 15 Years | 0 (0.0%) | 0 (0.0%) |
| 16 and 17 Years | 0 (0.0%) | 0 (0.0%) |
| 18 to 24 Years | 4 (7.4%) | 32 (42.7%) |
| 25 to 34 Years | 21 (18.6%) | 17 (30.4%) |
| 35 to 44 Years | 3 (5.4%) | 16 (32.0%) |
| 45 to 54 Years | 7 (8.3%) | 6 (6.4%) |
| 55 to 64 Years | 0 (0.0%) | 24 (21.6%) |
| 65 to 74 Years | 0 (0.0%) | 19 (17.1%) |
| 75 Years and over | 0 (0.0%) | 6 (6.5%) |
| Total | 59 (9.6%) | 159 (22.8%) |
Income Above Poverty by Sex and Age in Frazeysburg
According to the poverty statistics in Frazeysburg, males aged 5 years and females aged 45 to 54 years are the age groups that are most secure financially, with 100.0% of males and 93.6% of females in these age groups living above the poverty line.
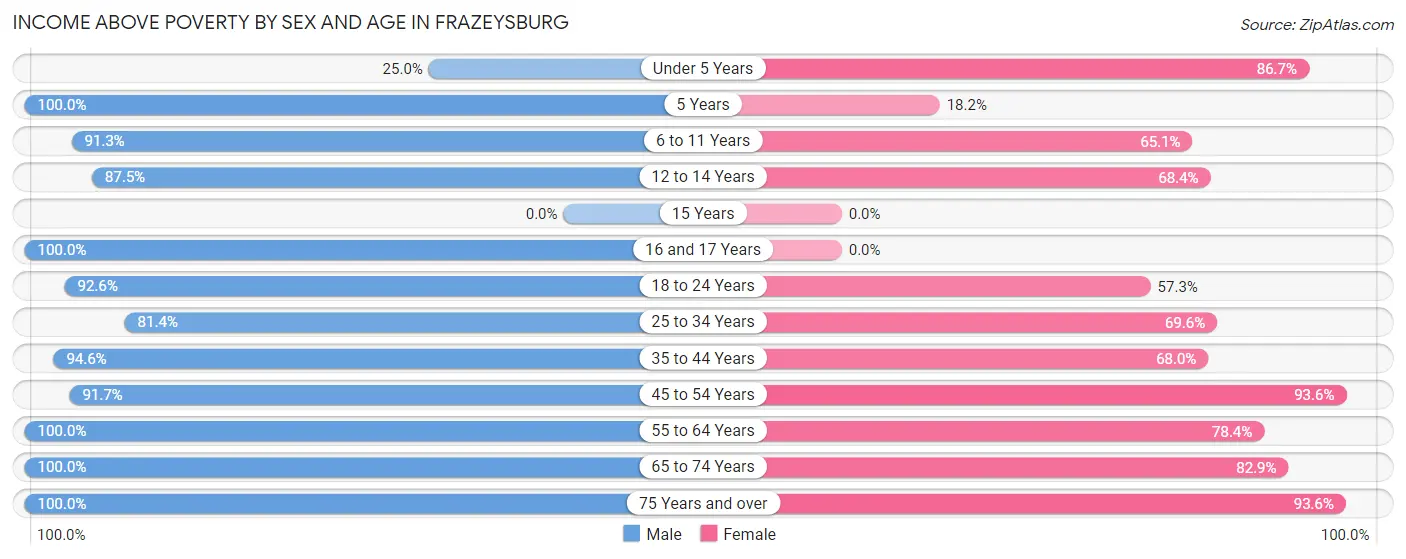
| Age Bracket | Male | Female |
| Under 5 Years | 6 (25.0%) | 13 (86.7%) |
| 5 Years | 4 (100.0%) | 2 (18.2%) |
| 6 to 11 Years | 21 (91.3%) | 41 (65.1%) |
| 12 to 14 Years | 28 (87.5%) | 13 (68.4%) |
| 15 Years | 0 (0.0%) | 0 (0.0%) |
| 16 and 17 Years | 8 (100.0%) | 0 (0.0%) |
| 18 to 24 Years | 50 (92.6%) | 43 (57.3%) |
| 25 to 34 Years | 92 (81.4%) | 39 (69.6%) |
| 35 to 44 Years | 53 (94.6%) | 34 (68.0%) |
| 45 to 54 Years | 77 (91.7%) | 88 (93.6%) |
| 55 to 64 Years | 76 (100.0%) | 87 (78.4%) |
| 65 to 74 Years | 65 (100.0%) | 92 (82.9%) |
| 75 Years and over | 73 (100.0%) | 87 (93.5%) |
| Total | 553 (90.4%) | 539 (77.2%) |
Income Below Poverty Among Married-Couple Families in Frazeysburg
The poverty statistics for married-couple families in Frazeysburg show that 4.1% or 10 of the total 244 families live below the poverty line. Families with 1 or 2 children have the highest poverty rate of 19.2%, comprising of 10 families. On the other hand, families with no children have the lowest poverty rate of 0.0%, which includes 0 families.
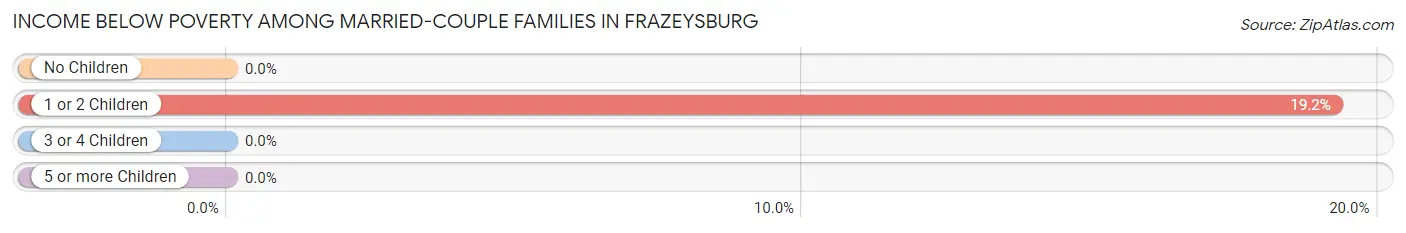
| Children | Above Poverty | Below Poverty |
| No Children | 177 (100.0%) | 0 (0.0%) |
| 1 or 2 Children | 42 (80.8%) | 10 (19.2%) |
| 3 or 4 Children | 15 (100.0%) | 0 (0.0%) |
| 5 or more Children | 0 (0.0%) | 0 (0.0%) |
| Total | 234 (95.9%) | 10 (4.1%) |
Income Below Poverty Among Single-Parent Households in Frazeysburg
According to the poverty data in Frazeysburg, 9.1% or 3 single-father households and 41.7% or 30 single-mother households are living below the poverty line. Among single-father households, those with 1 or 2 children have the highest poverty rate, with 3 households (23.1%) experiencing poverty. Likewise, among single-mother households, those with 1 or 2 children have the highest poverty rate, with 23 households (85.2%) falling below the poverty line.
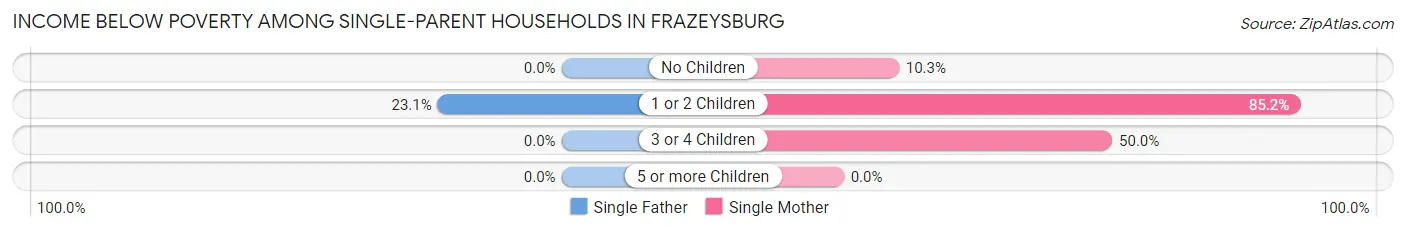
| Children | Single Father | Single Mother |
| No Children | 0 (0.0%) | 4 (10.3%) |
| 1 or 2 Children | 3 (23.1%) | 23 (85.2%) |
| 3 or 4 Children | 0 (0.0%) | 3 (50.0%) |
| 5 or more Children | 0 (0.0%) | 0 (0.0%) |
| Total | 3 (9.1%) | 30 (41.7%) |
Income Below Poverty Among Married-Couple vs Single-Parent Households in Frazeysburg
The poverty data for Frazeysburg shows that 10 of the married-couple family households (4.1%) and 33 of the single-parent households (31.4%) are living below the poverty level. Within the married-couple family households, those with 1 or 2 children have the highest poverty rate, with 10 households (19.2%) falling below the poverty line. Among the single-parent households, those with 1 or 2 children have the highest poverty rate, with 26 household (65.0%) living below poverty.
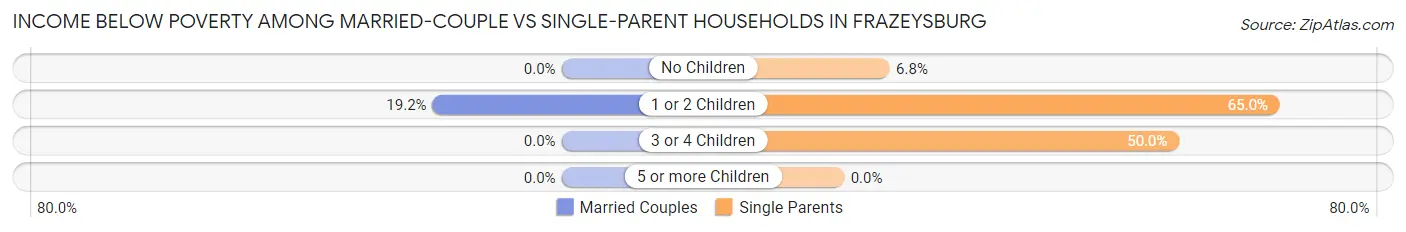
| Children | Married-Couple Families | Single-Parent Households |
| No Children | 0 (0.0%) | 4 (6.8%) |
| 1 or 2 Children | 10 (19.2%) | 26 (65.0%) |
| 3 or 4 Children | 0 (0.0%) | 3 (50.0%) |
| 5 or more Children | 0 (0.0%) | 0 (0.0%) |
| Total | 10 (4.1%) | 33 (31.4%) |
Race in Frazeysburg
The most populous races in Frazeysburg are White / Caucasian (1,300 | 97.4%), Two or more Races (34 | 2.5%), and Asian (1 | 0.1%).
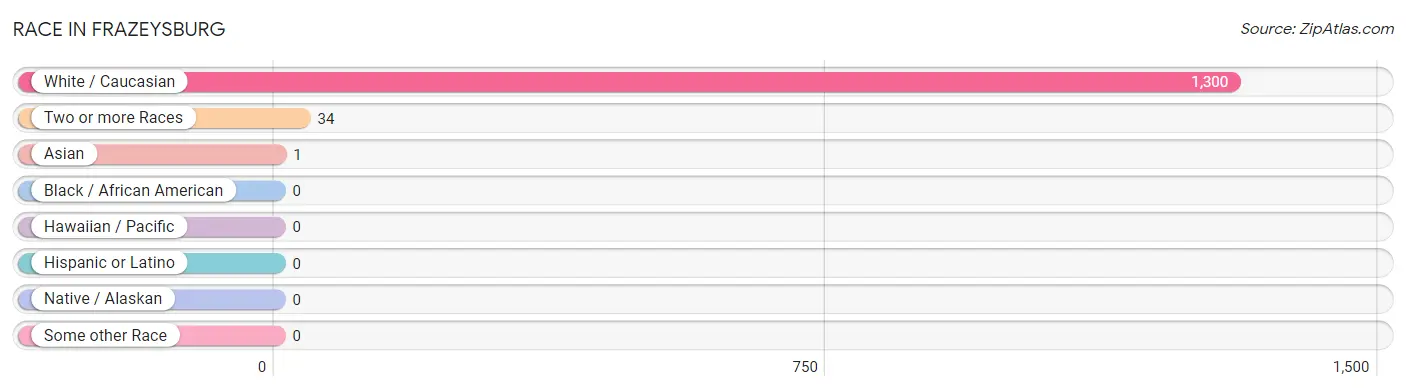
| Race | # Population | % Population |
| Asian | 1 | 0.1% |
| Black / African American | 0 | 0.0% |
| Hawaiian / Pacific | 0 | 0.0% |
| Hispanic or Latino | 0 | 0.0% |
| Native / Alaskan | 0 | 0.0% |
| White / Caucasian | 1,300 | 97.4% |
| Two or more Races | 34 | 2.5% |
| Some other Race | 0 | 0.0% |
| Total | 1,335 | 100.0% |
Ancestry in Frazeysburg
The most populous ancestries reported in Frazeysburg are German (382 | 28.6%), Irish (271 | 20.3%), English (112 | 8.4%), American (96 | 7.2%), and Italian (54 | 4.0%), together accounting for 68.5% of all Frazeysburg residents.
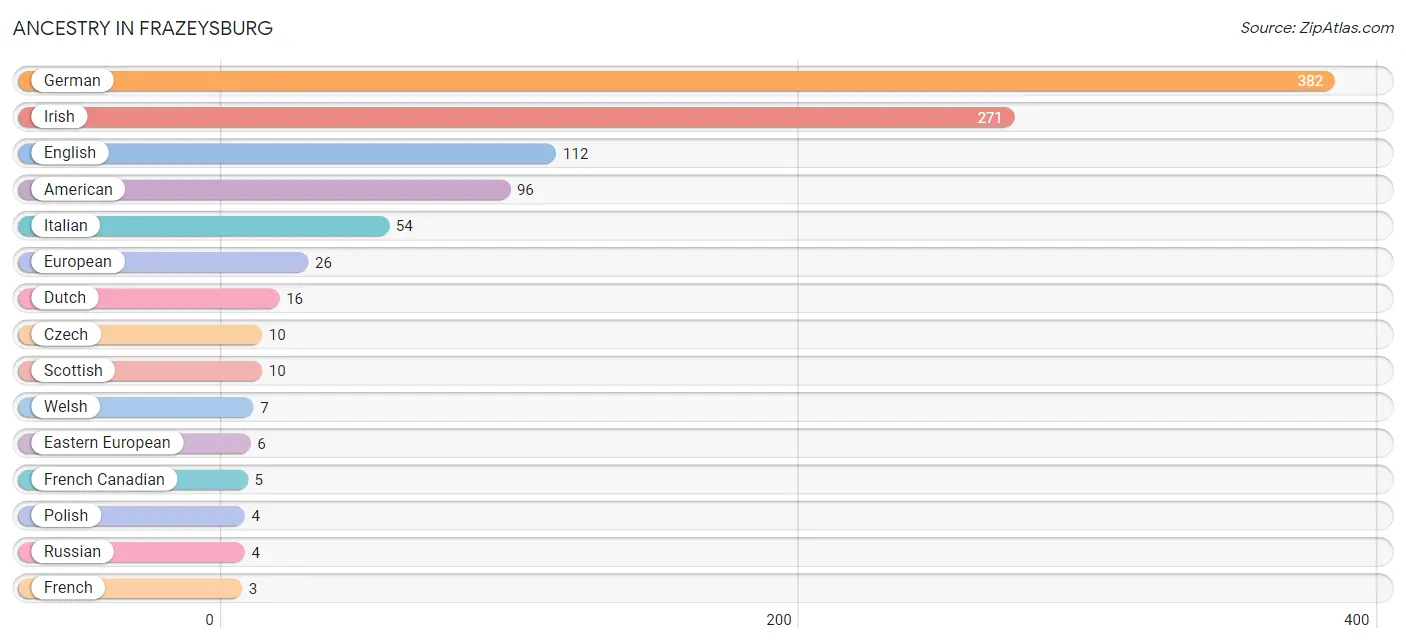
| Ancestry | # Population | % Population |
| American | 96 | 7.2% |
| British | 2 | 0.2% |
| Czech | 10 | 0.7% |
| Czechoslovakian | 2 | 0.2% |
| Dutch | 16 | 1.2% |
| Eastern European | 6 | 0.4% |
| English | 112 | 8.4% |
| European | 26 | 1.9% |
| French | 3 | 0.2% |
| French Canadian | 5 | 0.4% |
| German | 382 | 28.6% |
| Haitian | 3 | 0.2% |
| Hungarian | 3 | 0.2% |
| Irish | 271 | 20.3% |
| Italian | 54 | 4.0% |
| Korean | 1 | 0.1% |
| Polish | 4 | 0.3% |
| Russian | 4 | 0.3% |
| Scandinavian | 2 | 0.2% |
| Scottish | 10 | 0.7% |
| Welsh | 7 | 0.5% | View All 21 Rows |
Immigrants in Frazeysburg
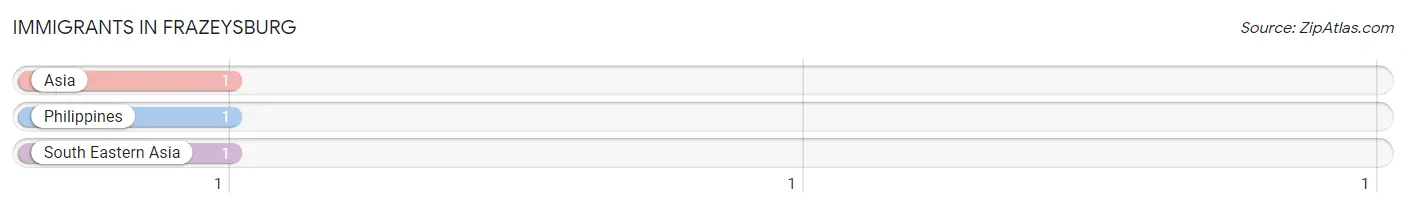
The most numerous immigrant groups reported in Frazeysburg came from Asia (1 | 0.1%), Philippines (1 | 0.1%), and South Eastern Asia (1 | 0.1%), together accounting for 0.2% of all Frazeysburg residents.
| Immigration Origin | # Population | % Population |
| Asia | 1 | 0.1% |
| Philippines | 1 | 0.1% |
| South Eastern Asia | 1 | 0.1% | View All 3 Rows |
Sex and Age in Frazeysburg
Sex and Age in Frazeysburg
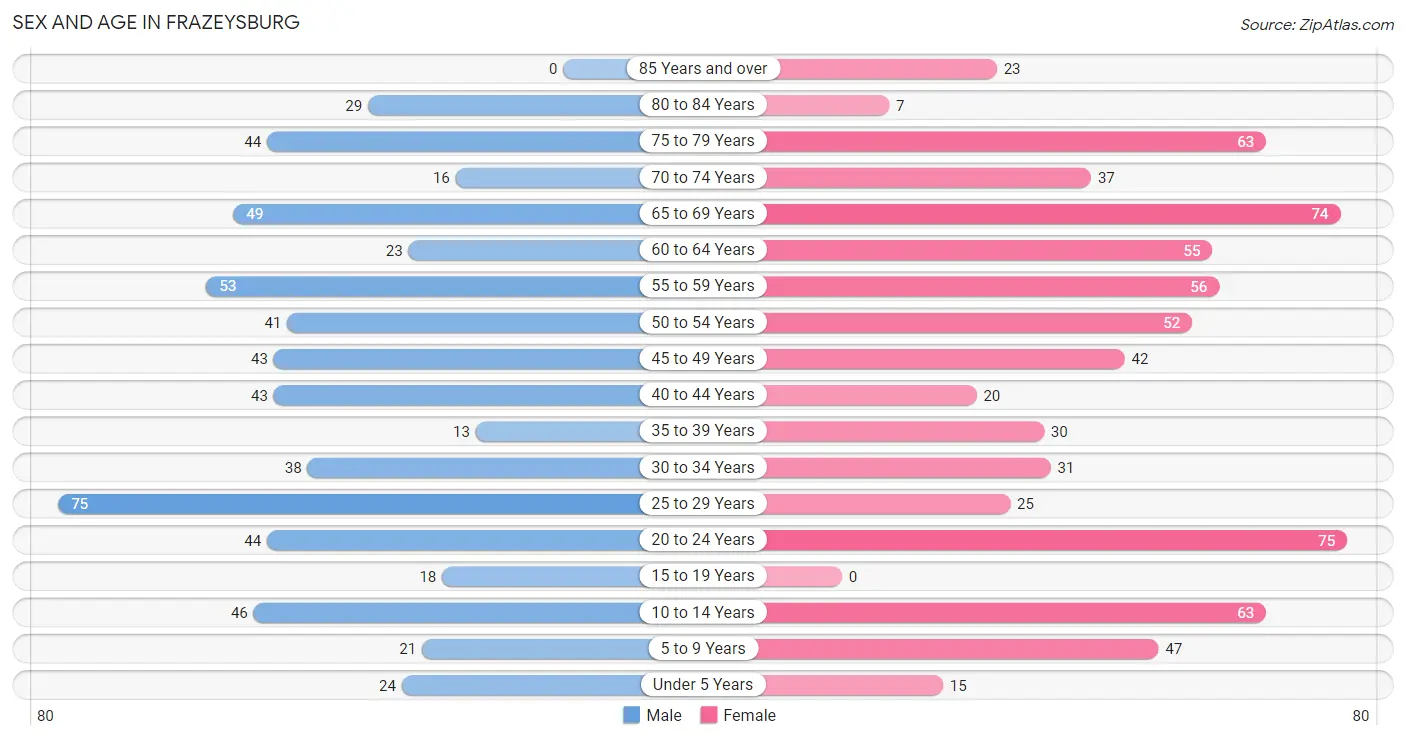
The most populous age groups in Frazeysburg are 25 to 29 Years (75 | 12.1%) for men and 20 to 24 Years (75 | 10.5%) for women.
| Age Bracket | Male | Female |
| Under 5 Years | 24 (3.9%) | 15 (2.1%) |
| 5 to 9 Years | 21 (3.4%) | 47 (6.6%) |
| 10 to 14 Years | 46 (7.4%) | 63 (8.8%) |
| 15 to 19 Years | 18 (2.9%) | 0 (0.0%) |
| 20 to 24 Years | 44 (7.1%) | 75 (10.5%) |
| 25 to 29 Years | 75 (12.1%) | 25 (3.5%) |
| 30 to 34 Years | 38 (6.1%) | 31 (4.3%) |
| 35 to 39 Years | 13 (2.1%) | 30 (4.2%) |
| 40 to 44 Years | 43 (6.9%) | 20 (2.8%) |
| 45 to 49 Years | 43 (6.9%) | 42 (5.9%) |
| 50 to 54 Years | 41 (6.6%) | 52 (7.3%) |
| 55 to 59 Years | 53 (8.6%) | 56 (7.8%) |
| 60 to 64 Years | 23 (3.7%) | 55 (7.7%) |
| 65 to 69 Years | 49 (7.9%) | 74 (10.3%) |
| 70 to 74 Years | 16 (2.6%) | 37 (5.2%) |
| 75 to 79 Years | 44 (7.1%) | 63 (8.8%) |
| 80 to 84 Years | 29 (4.7%) | 7 (1.0%) |
| 85 Years and over | 0 (0.0%) | 23 (3.2%) |
| Total | 620 (100.0%) | 715 (100.0%) |
Families and Households in Frazeysburg
Median Family Size in Frazeysburg
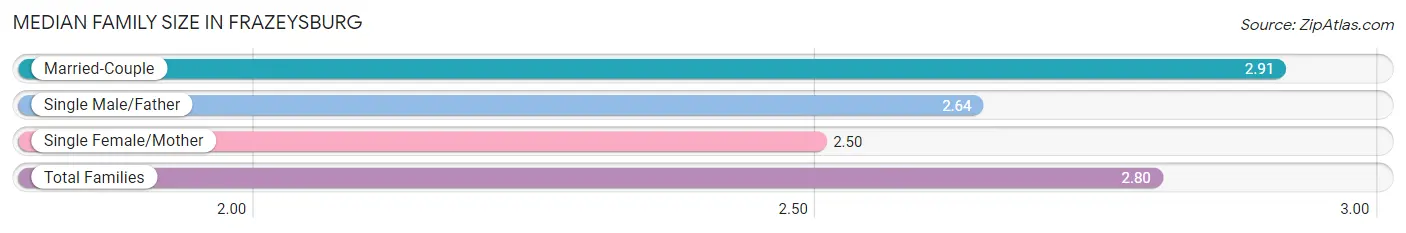
The median family size in Frazeysburg is 2.80 persons per family, with married-couple families (244 | 69.9%) accounting for the largest median family size of 2.91 persons per family. On the other hand, single female/mother families (72 | 20.6%) represent the smallest median family size with 2.50 persons per family.
| Family Type | # Families | Family Size |
| Married-Couple | 244 (69.9%) | 2.91 |
| Single Male/Father | 33 (9.5%) | 2.64 |
| Single Female/Mother | 72 (20.6%) | 2.50 |
| Total Families | 349 (100.0%) | 2.80 |
Median Household Size in Frazeysburg
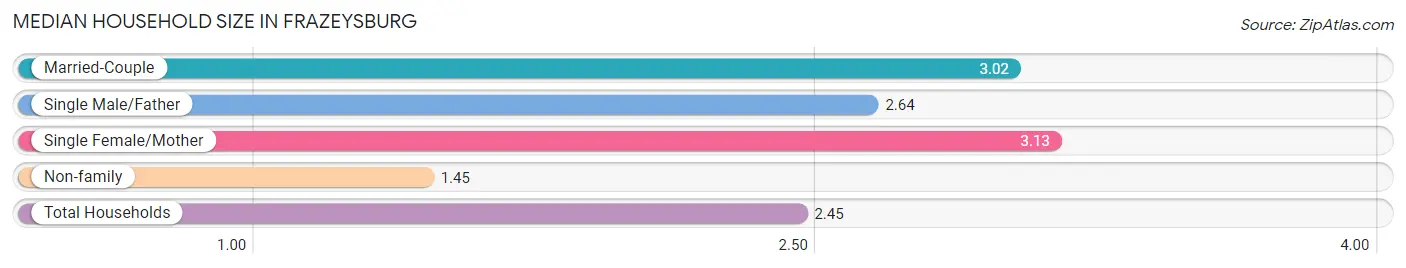
The median household size in Frazeysburg is 2.45 persons per household, with single female/mother households (72 | 13.2%) accounting for the largest median household size of 3.13 persons per household. non-family households (197 | 36.1%) represent the smallest median household size with 1.45 persons per household.
| Household Type | # Households | Household Size |
| Married-Couple | 244 (44.7%) | 3.02 |
| Single Male/Father | 33 (6.0%) | 2.64 |
| Single Female/Mother | 72 (13.2%) | 3.13 |
| Non-family | 197 (36.1%) | 1.45 |
| Total Households | 546 (100.0%) | 2.45 |
Household Size by Marriage Status in Frazeysburg
Out of a total of 546 households in Frazeysburg, 349 (63.9%) are family households, while 197 (36.1%) are nonfamily households. The most numerous type of family households are 2-person households, comprising 188, and the most common type of nonfamily households are 1-person households, comprising 144.
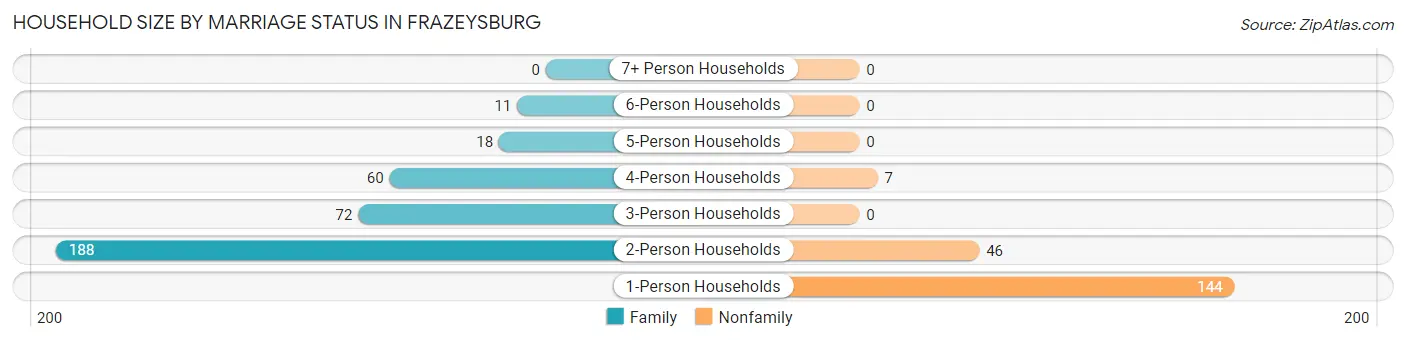
| Household Size | Family Households | Nonfamily Households |
| 1-Person Households | - | 144 (26.4%) |
| 2-Person Households | 188 (34.4%) | 46 (8.4%) |
| 3-Person Households | 72 (13.2%) | 0 (0.0%) |
| 4-Person Households | 60 (11.0%) | 7 (1.3%) |
| 5-Person Households | 18 (3.3%) | 0 (0.0%) |
| 6-Person Households | 11 (2.0%) | 0 (0.0%) |
| 7+ Person Households | 0 (0.0%) | 0 (0.0%) |
| Total | 349 (63.9%) | 197 (36.1%) |
Female Fertility in Frazeysburg
Fertility by Age in Frazeysburg
Average fertility rate in Frazeysburg is 40.0 births per 1,000 women. Women in the age bracket of 20 to 34 years have the highest fertility rate with 69.0 births per 1,000 women. Women in the age bracket of 20 to 34 years acount for 100.0% of all women with births.
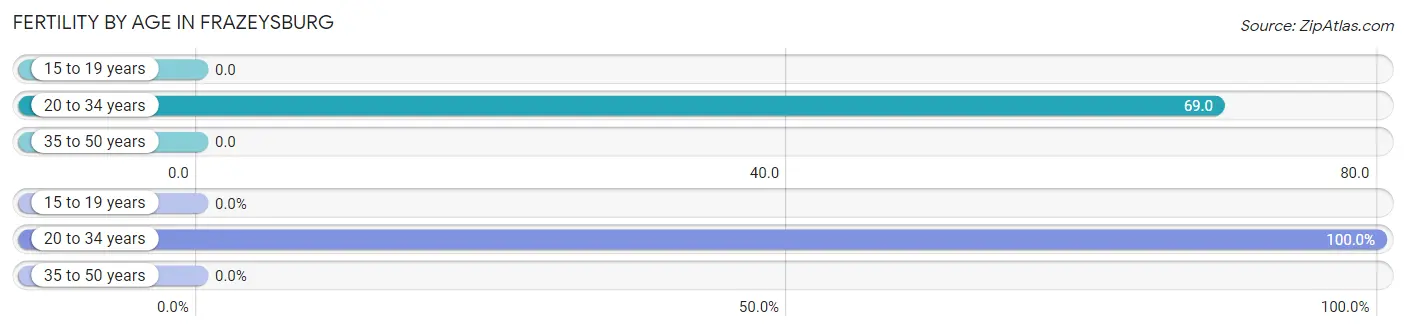
| Age Bracket | Women with Births | Births / 1,000 Women |
| 15 to 19 years | 0 (0.0%) | 0.0 |
| 20 to 34 years | 9 (100.0%) | 69.0 |
| 35 to 50 years | 0 (0.0%) | 0.0 |
| Total | 9 (100.0%) | 40.0 |
Fertility by Age by Marriage Status in Frazeysburg
22.2% of women with births (9) in Frazeysburg are married. The highest percentage of unmarried women with births falls into 20 to 34 years age bracket with 77.8% of them unmarried at the time of birth, while the lowest percentage of unmarried women with births belong to 20 to 34 years age bracket with 77.8% of them unmarried.
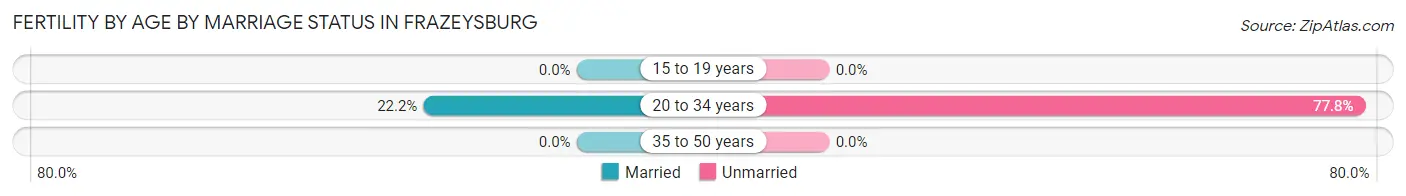
| Age Bracket | Married | Unmarried |
| 15 to 19 years | 0 (0.0%) | 0 (0.0%) |
| 20 to 34 years | 2 (22.2%) | 7 (77.8%) |
| 35 to 50 years | 0 (0.0%) | 0 (0.0%) |
| Total | 2 (22.2%) | 7 (77.8%) |
Fertility by Education in Frazeysburg
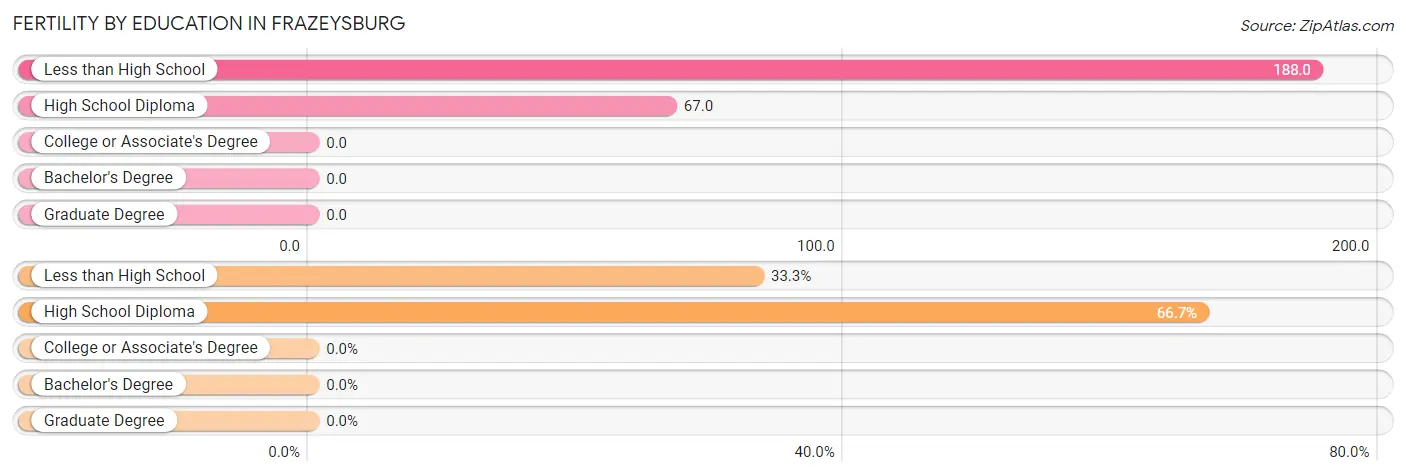
| Educational Attainment | Women with Births | Births / 1,000 Women |
| Less than High School | 3 (33.3%) | 188.0 |
| High School Diploma | 6 (66.7%) | 67.0 |
| College or Associate's Degree | 0 (0.0%) | 0.0 |
| Bachelor's Degree | 0 (0.0%) | 0.0 |
| Graduate Degree | 0 (0.0%) | 0.0 |
| Total | 9 (100.0%) | 40.0 |
Fertility by Education by Marriage Status in Frazeysburg
77.8% of women with births in Frazeysburg are unmarried. Women with the educational attainment of high school diploma are most likely to be married with 33.3% of them married at childbirth, while women with the educational attainment of less than high school are least likely to be married with 100.0% of them unmarried at childbirth.
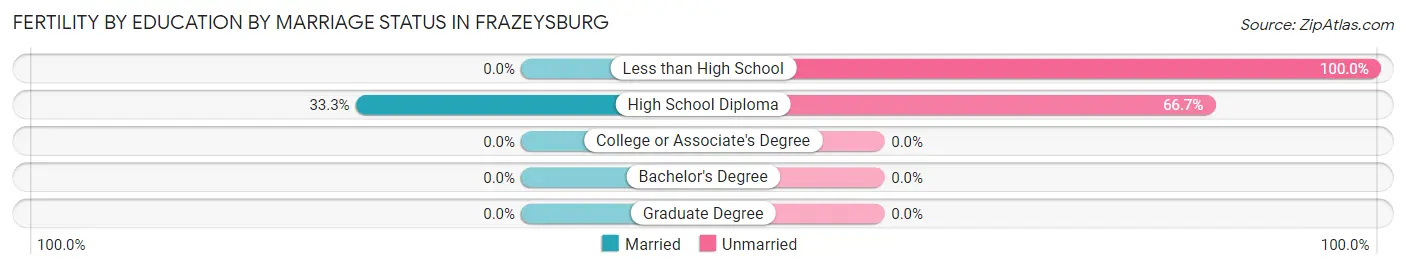
| Educational Attainment | Married | Unmarried |
| Less than High School | 0 (0.0%) | 3 (100.0%) |
| High School Diploma | 2 (33.3%) | 4 (66.7%) |
| College or Associate's Degree | 0 (0.0%) | 0 (0.0%) |
| Bachelor's Degree | 0 (0.0%) | 0 (0.0%) |
| Graduate Degree | 0 (0.0%) | 0 (0.0%) |
| Total | 2 (22.2%) | 7 (77.8%) |
Employment Characteristics in Frazeysburg
Employment by Class of Employer in Frazeysburg
Among the 560 employed individuals in Frazeysburg, private company employees (443 | 79.1%), local government employees (42 | 7.5%), and self-employed (not incorporated) (34 | 6.1%) make up the most common classes of employment.
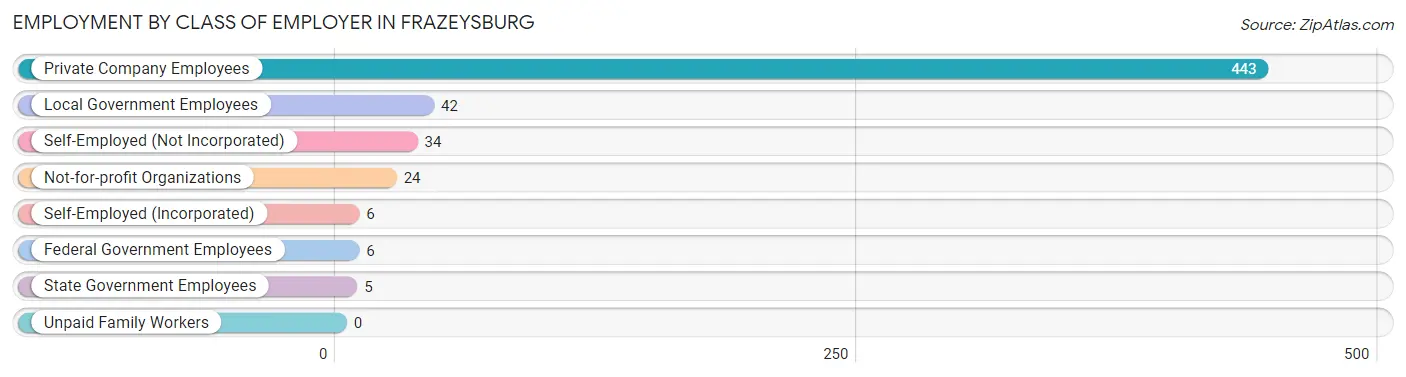
| Employer Class | # Employees | % Employees |
| Private Company Employees | 443 | 79.1% |
| Self-Employed (Incorporated) | 6 | 1.1% |
| Self-Employed (Not Incorporated) | 34 | 6.1% |
| Not-for-profit Organizations | 24 | 4.3% |
| Local Government Employees | 42 | 7.5% |
| State Government Employees | 5 | 0.9% |
| Federal Government Employees | 6 | 1.1% |
| Unpaid Family Workers | 0 | 0.0% |
| Total | 560 | 100.0% |
Employment Status by Age in Frazeysburg
According to the labor force statistics for Frazeysburg, out of the total population over 16 years of age (1,119), 55.6% or 622 individuals are in the labor force, with 6.1% or 38 of them unemployed. The age group with the highest labor force participation rate is 45 to 54 years, with 83.7% or 149 individuals in the labor force. Within the labor force, the 35 to 44 years age range has the highest percentage of unemployed individuals, with 18.4% or 16 of them being unemployed.
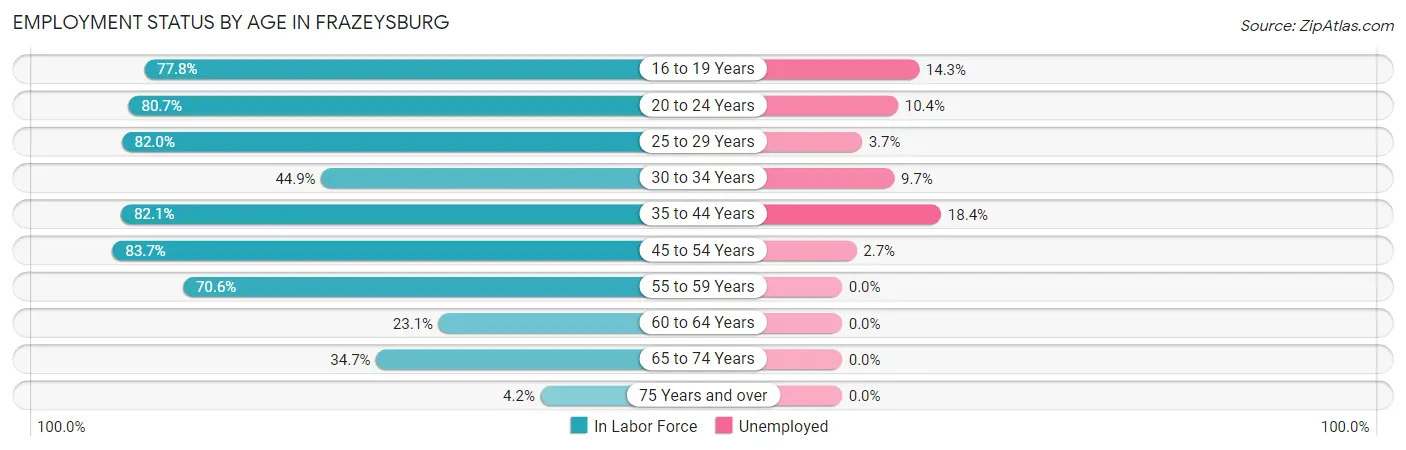
| Age Bracket | In Labor Force | Unemployed |
| 16 to 19 Years | 14 (77.8%) | 2 (14.3%) |
| 20 to 24 Years | 96 (80.7%) | 10 (10.4%) |
| 25 to 29 Years | 82 (82.0%) | 3 (3.7%) |
| 30 to 34 Years | 31 (44.9%) | 3 (9.7%) |
| 35 to 44 Years | 87 (82.1%) | 16 (18.4%) |
| 45 to 54 Years | 149 (83.7%) | 4 (2.7%) |
| 55 to 59 Years | 77 (70.6%) | 0 (0.0%) |
| 60 to 64 Years | 18 (23.1%) | 0 (0.0%) |
| 65 to 74 Years | 61 (34.7%) | 0 (0.0%) |
| 75 Years and over | 7 (4.2%) | 0 (0.0%) |
| Total | 622 (55.6%) | 38 (6.1%) |
Employment Status by Educational Attainment in Frazeysburg
According to labor force statistics for Frazeysburg, 69.4% of individuals (444) out of the total population between 25 and 64 years of age (640) are in the labor force, with 5.9% or 26 of them being unemployed. The group with the highest labor force participation rate are those with the educational attainment of bachelor's degree or higher, with 92.9% or 26 individuals in the labor force. Within the labor force, individuals with less than high school education have the highest percentage of unemployment, with 12.0% or 3 of them being unemployed.
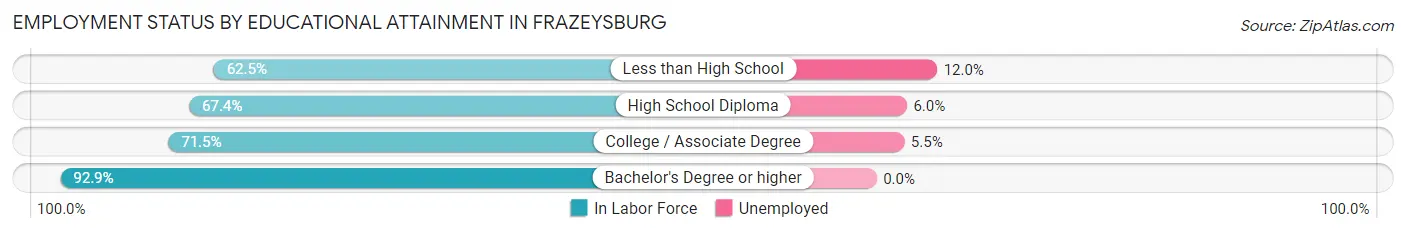
| Educational Attainment | In Labor Force | Unemployed |
| Less than High School | 25 (62.5%) | 5 (12.0%) |
| High School Diploma | 265 (67.4%) | 24 (6.0%) |
| College / Associate Degree | 128 (71.5%) | 10 (5.5%) |
| Bachelor's Degree or higher | 26 (92.9%) | 0 (0.0%) |
| Total | 444 (69.4%) | 38 (5.9%) |
Employment Occupations by Sex in Frazeysburg
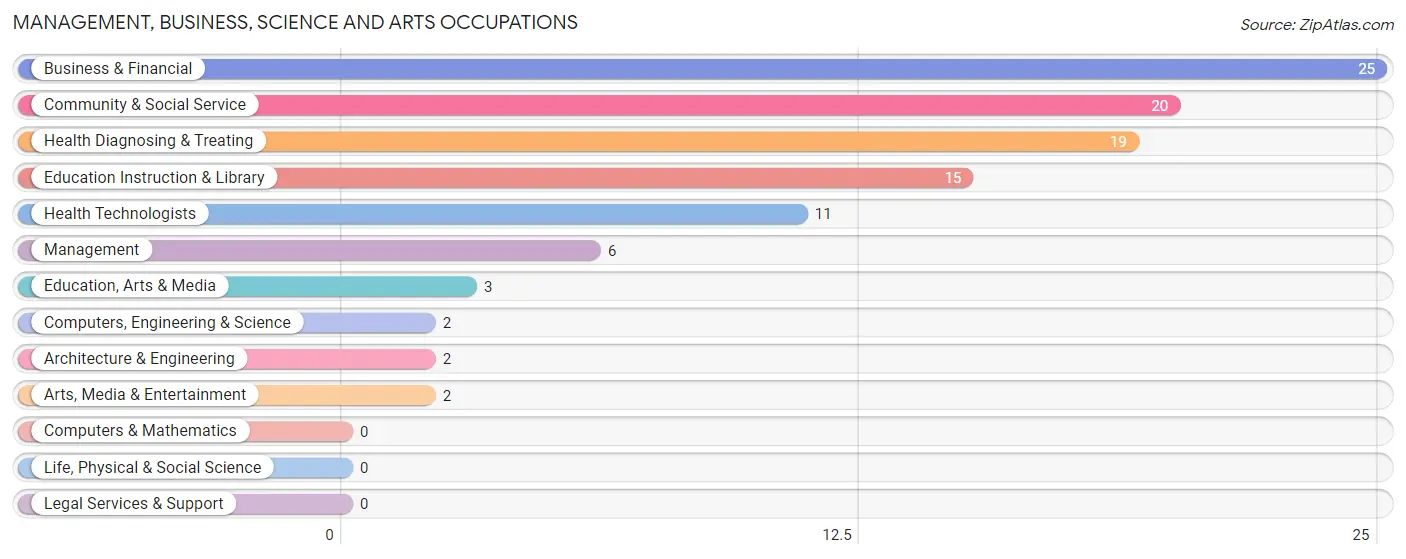
Management, Business, Science and Arts Occupations
The most common Management, Business, Science and Arts occupations in Frazeysburg are Business & Financial (25 | 4.3%), Community & Social Service (20 | 3.4%), Health Diagnosing & Treating (19 | 3.3%), Education Instruction & Library (15 | 2.6%), and Health Technologists (11 | 1.9%).
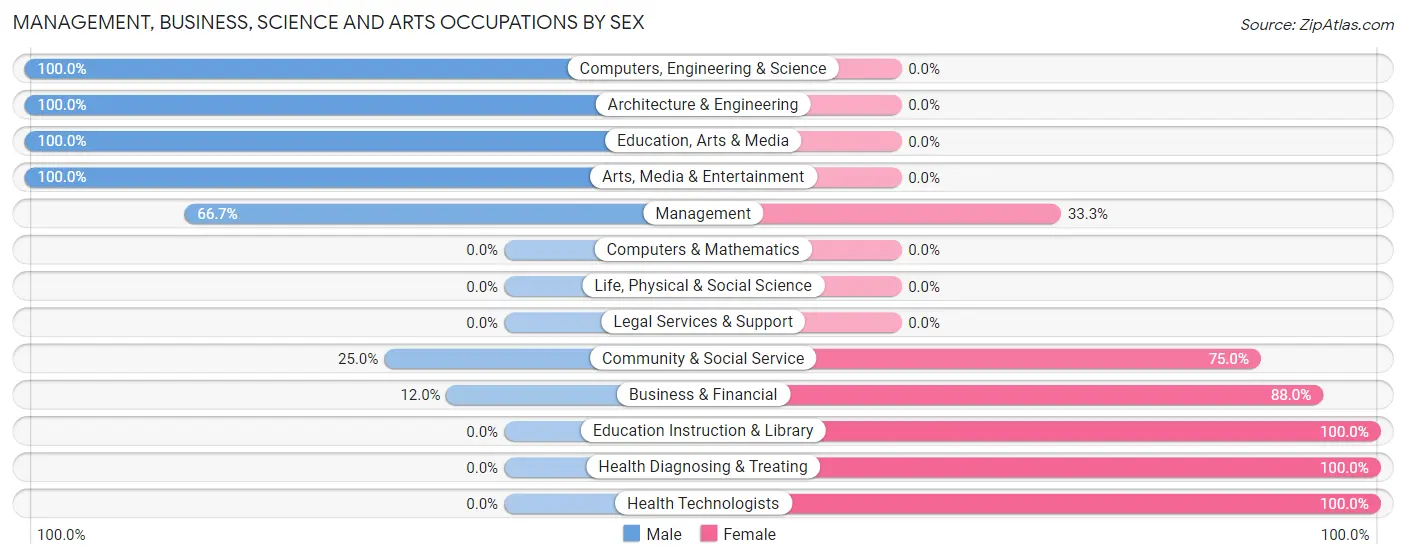
Management, Business, Science and Arts Occupations by Sex
Within the Management, Business, Science and Arts occupations in Frazeysburg, the most male-oriented occupations are Computers, Engineering & Science (100.0%), Architecture & Engineering (100.0%), and Education, Arts & Media (100.0%), while the most female-oriented occupations are Education Instruction & Library (100.0%), Health Diagnosing & Treating (100.0%), and Health Technologists (100.0%).
| Occupation | Male | Female |
| Management | 4 (66.7%) | 2 (33.3%) |
| Business & Financial | 3 (12.0%) | 22 (88.0%) |
| Computers, Engineering & Science | 2 (100.0%) | 0 (0.0%) |
| Computers & Mathematics | 0 (0.0%) | 0 (0.0%) |
| Architecture & Engineering | 2 (100.0%) | 0 (0.0%) |
| Life, Physical & Social Science | 0 (0.0%) | 0 (0.0%) |
| Community & Social Service | 5 (25.0%) | 15 (75.0%) |
| Education, Arts & Media | 3 (100.0%) | 0 (0.0%) |
| Legal Services & Support | 0 (0.0%) | 0 (0.0%) |
| Education Instruction & Library | 0 (0.0%) | 15 (100.0%) |
| Arts, Media & Entertainment | 2 (100.0%) | 0 (0.0%) |
| Health Diagnosing & Treating | 0 (0.0%) | 19 (100.0%) |
| Health Technologists | 0 (0.0%) | 11 (100.0%) |
| Total (Category) | 14 (19.4%) | 58 (80.6%) |
| Total (Overall) | 309 (52.9%) | 275 (47.1%) |
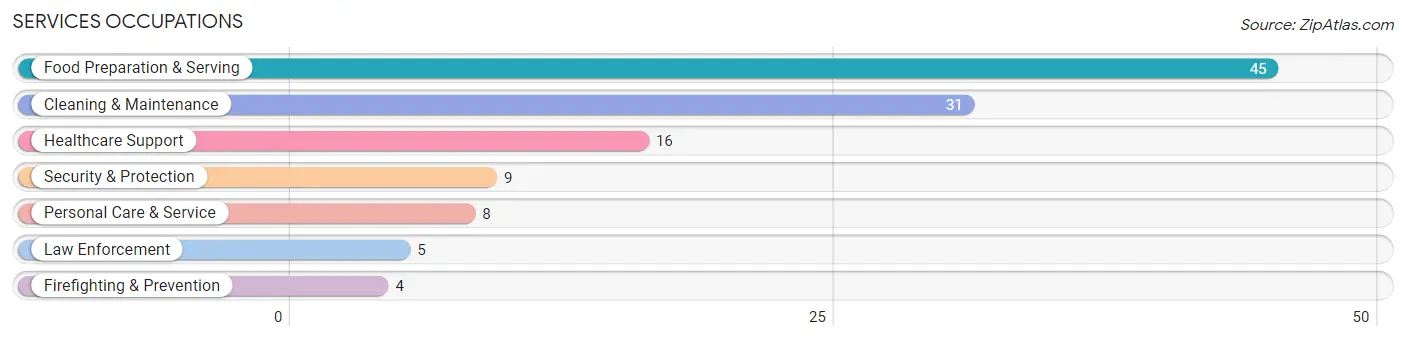
Services Occupations
The most common Services occupations in Frazeysburg are Food Preparation & Serving (45 | 7.7%), Cleaning & Maintenance (31 | 5.3%), Healthcare Support (16 | 2.7%), Security & Protection (9 | 1.5%), and Personal Care & Service (8 | 1.4%).
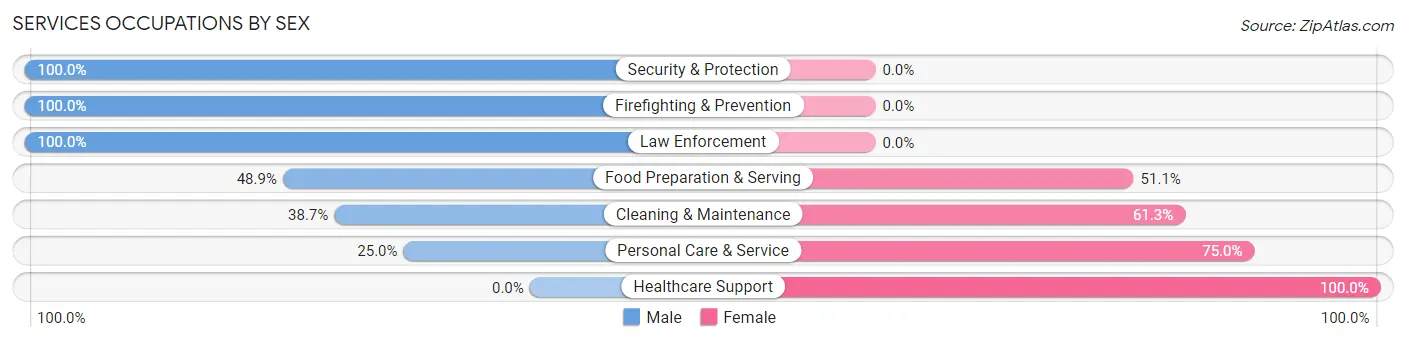
Services Occupations by Sex
Within the Services occupations in Frazeysburg, the most male-oriented occupations are Security & Protection (100.0%), Firefighting & Prevention (100.0%), and Law Enforcement (100.0%), while the most female-oriented occupations are Healthcare Support (100.0%), Personal Care & Service (75.0%), and Cleaning & Maintenance (61.3%).
| Occupation | Male | Female |
| Healthcare Support | 0 (0.0%) | 16 (100.0%) |
| Security & Protection | 9 (100.0%) | 0 (0.0%) |
| Firefighting & Prevention | 4 (100.0%) | 0 (0.0%) |
| Law Enforcement | 5 (100.0%) | 0 (0.0%) |
| Food Preparation & Serving | 22 (48.9%) | 23 (51.1%) |
| Cleaning & Maintenance | 12 (38.7%) | 19 (61.3%) |
| Personal Care & Service | 2 (25.0%) | 6 (75.0%) |
| Total (Category) | 45 (41.3%) | 64 (58.7%) |
| Total (Overall) | 309 (52.9%) | 275 (47.1%) |
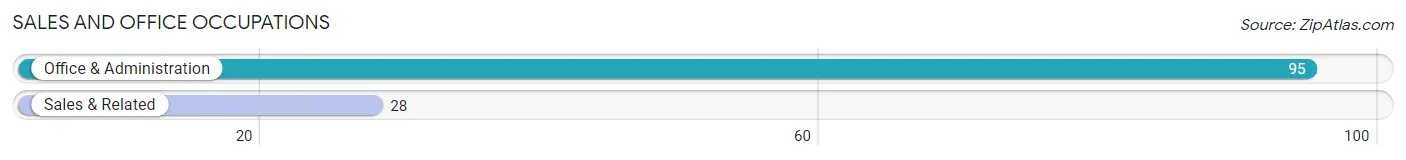
Sales and Office Occupations
The most common Sales and Office occupations in Frazeysburg are Office & Administration (95 | 16.3%), and Sales & Related (28 | 4.8%).
Sales and Office Occupations by Sex
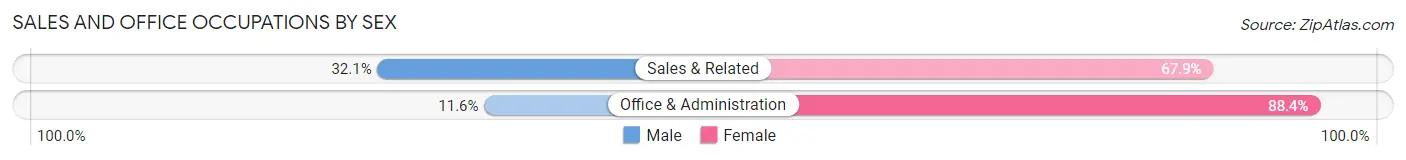
| Occupation | Male | Female |
| Sales & Related | 9 (32.1%) | 19 (67.9%) |
| Office & Administration | 11 (11.6%) | 84 (88.4%) |
| Total (Category) | 20 (16.3%) | 103 (83.7%) |
| Total (Overall) | 309 (52.9%) | 275 (47.1%) |
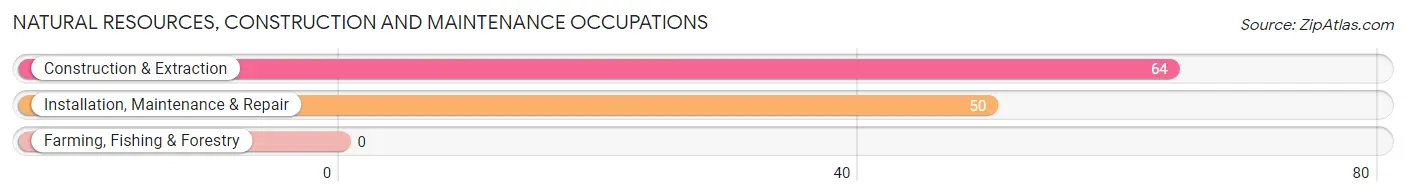
Natural Resources, Construction and Maintenance Occupations
The most common Natural Resources, Construction and Maintenance occupations in Frazeysburg are Construction & Extraction (64 | 11.0%), and Installation, Maintenance & Repair (50 | 8.6%).
Natural Resources, Construction and Maintenance Occupations by Sex
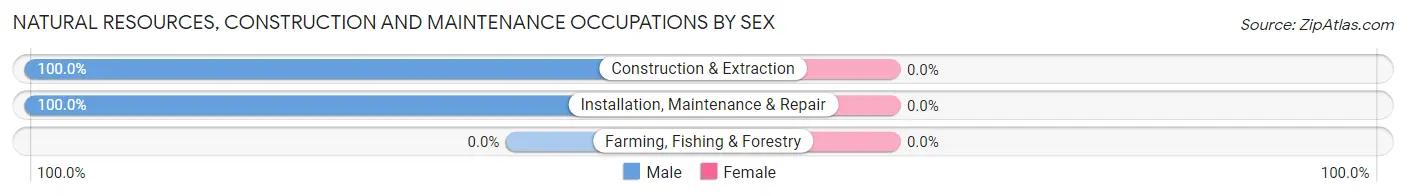
| Occupation | Male | Female |
| Farming, Fishing & Forestry | 0 (0.0%) | 0 (0.0%) |
| Construction & Extraction | 64 (100.0%) | 0 (0.0%) |
| Installation, Maintenance & Repair | 50 (100.0%) | 0 (0.0%) |
| Total (Category) | 114 (100.0%) | 0 (0.0%) |
| Total (Overall) | 309 (52.9%) | 275 (47.1%) |
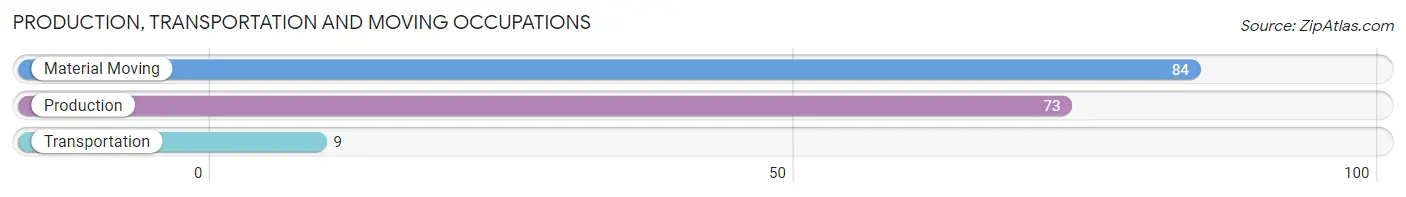
Production, Transportation and Moving Occupations
The most common Production, Transportation and Moving occupations in Frazeysburg are Material Moving (84 | 14.4%), Production (73 | 12.5%), and Transportation (9 | 1.5%).
Production, Transportation and Moving Occupations by Sex
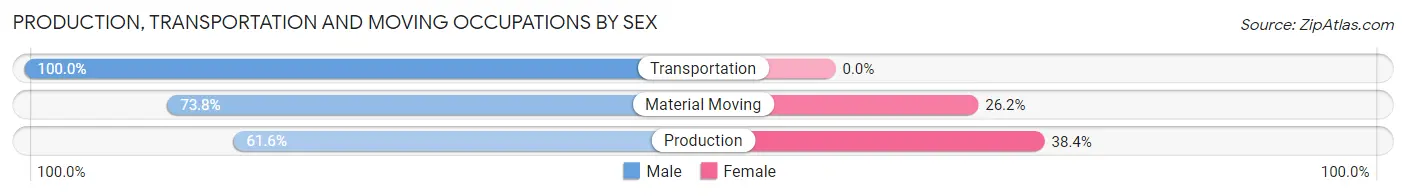
| Occupation | Male | Female |
| Production | 45 (61.6%) | 28 (38.4%) |
| Transportation | 9 (100.0%) | 0 (0.0%) |
| Material Moving | 62 (73.8%) | 22 (26.2%) |
| Total (Category) | 116 (69.9%) | 50 (30.1%) |
| Total (Overall) | 309 (52.9%) | 275 (47.1%) |
Employment Industries by Sex in Frazeysburg
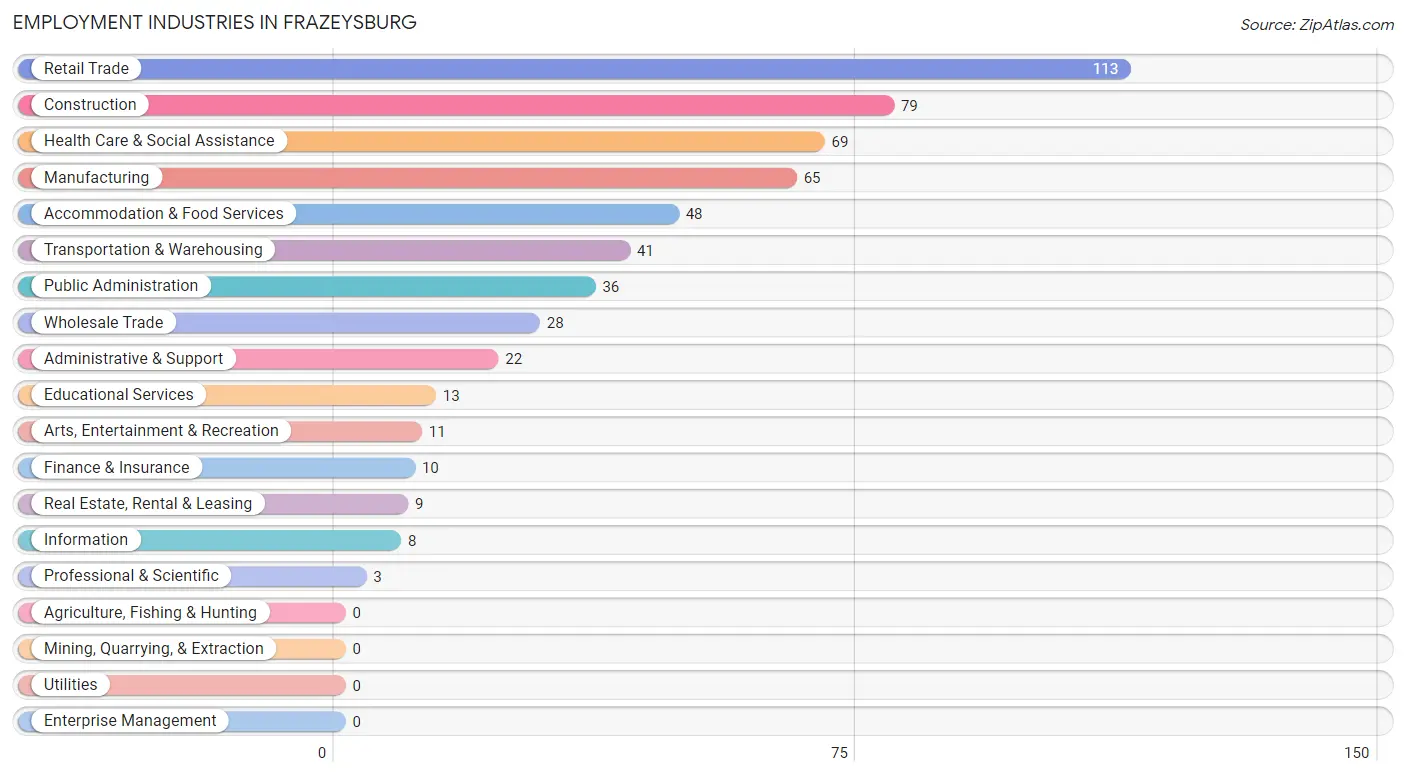
Employment Industries in Frazeysburg
The major employment industries in Frazeysburg include Retail Trade (113 | 19.4%), Construction (79 | 13.5%), Health Care & Social Assistance (69 | 11.8%), Manufacturing (65 | 11.1%), and Accommodation & Food Services (48 | 8.2%).
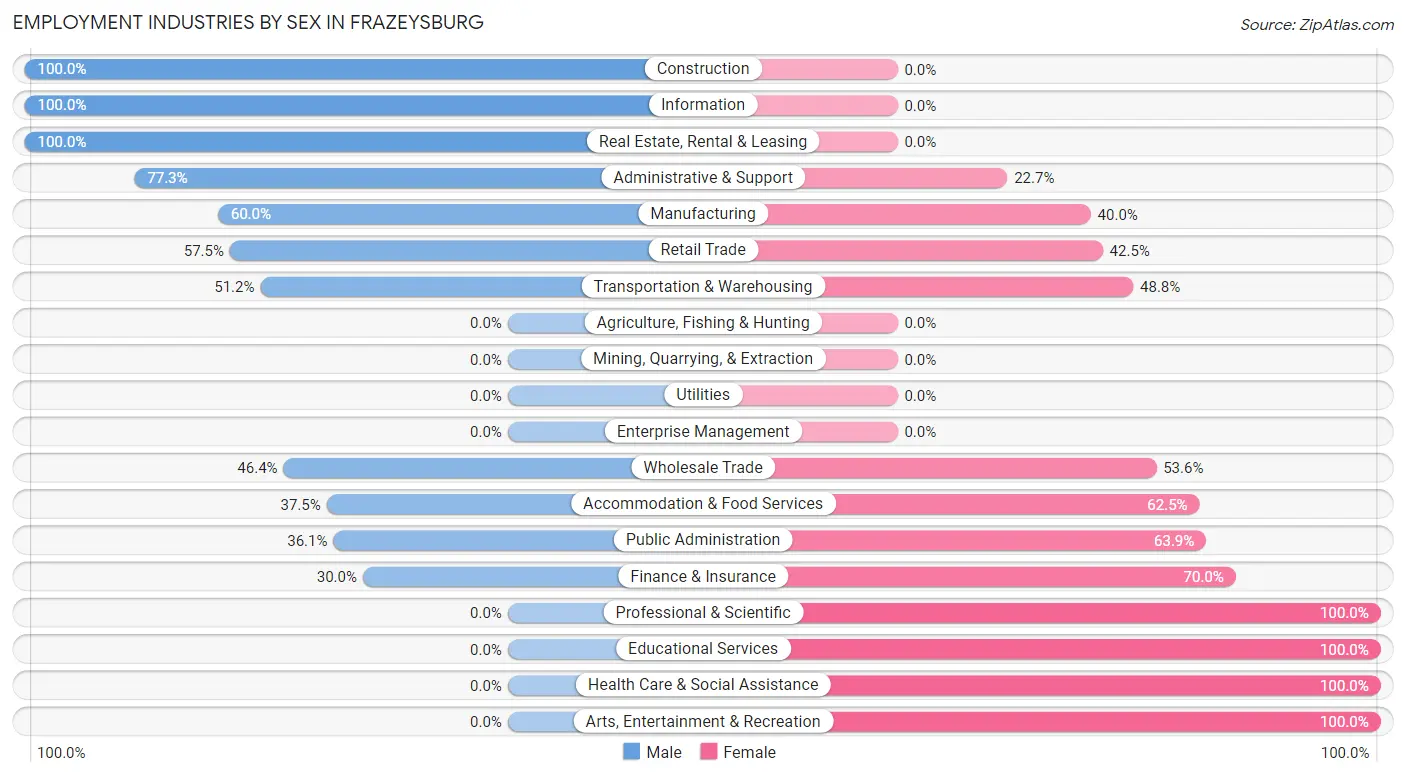
Employment Industries by Sex in Frazeysburg
The Frazeysburg industries that see more men than women are Construction (100.0%), Information (100.0%), and Real Estate, Rental & Leasing (100.0%), whereas the industries that tend to have a higher number of women are Professional & Scientific (100.0%), Educational Services (100.0%), and Health Care & Social Assistance (100.0%).
| Industry | Male | Female |
| Agriculture, Fishing & Hunting | 0 (0.0%) | 0 (0.0%) |
| Mining, Quarrying, & Extraction | 0 (0.0%) | 0 (0.0%) |
| Construction | 79 (100.0%) | 0 (0.0%) |
| Manufacturing | 39 (60.0%) | 26 (40.0%) |
| Wholesale Trade | 13 (46.4%) | 15 (53.6%) |
| Retail Trade | 65 (57.5%) | 48 (42.5%) |
| Transportation & Warehousing | 21 (51.2%) | 20 (48.8%) |
| Utilities | 0 (0.0%) | 0 (0.0%) |
| Information | 8 (100.0%) | 0 (0.0%) |
| Finance & Insurance | 3 (30.0%) | 7 (70.0%) |
| Real Estate, Rental & Leasing | 9 (100.0%) | 0 (0.0%) |
| Professional & Scientific | 0 (0.0%) | 3 (100.0%) |
| Enterprise Management | 0 (0.0%) | 0 (0.0%) |
| Administrative & Support | 17 (77.3%) | 5 (22.7%) |
| Educational Services | 0 (0.0%) | 13 (100.0%) |
| Health Care & Social Assistance | 0 (0.0%) | 69 (100.0%) |
| Arts, Entertainment & Recreation | 0 (0.0%) | 11 (100.0%) |
| Accommodation & Food Services | 18 (37.5%) | 30 (62.5%) |
| Public Administration | 13 (36.1%) | 23 (63.9%) |
| Total | 309 (52.9%) | 275 (47.1%) |
Education in Frazeysburg
School Enrollment in Frazeysburg
The most common levels of schooling among the 221 students in Frazeysburg are middle school (94 | 42.5%), elementary school (68 | 30.8%), and high school (23 | 10.4%).
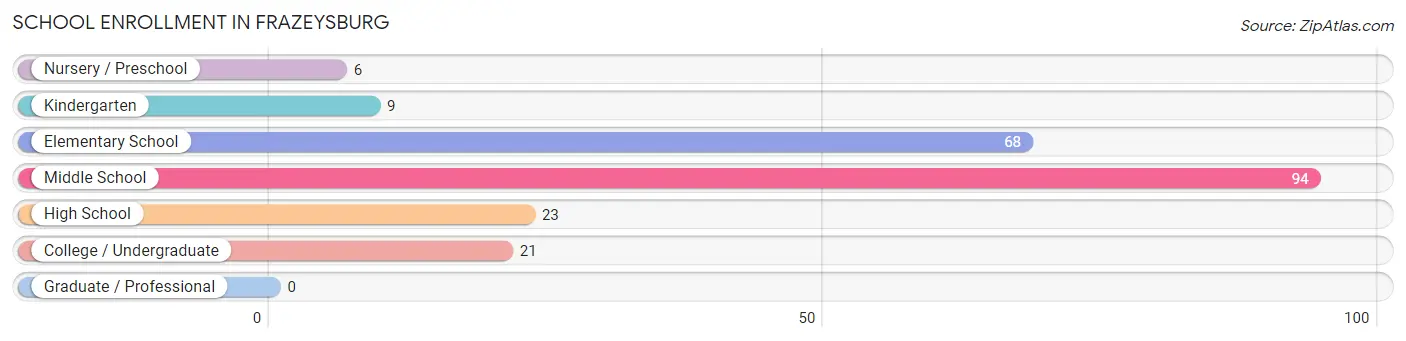
| School Level | # Students | % Students |
| Nursery / Preschool | 6 | 2.7% |
| Kindergarten | 9 | 4.1% |
| Elementary School | 68 | 30.8% |
| Middle School | 94 | 42.5% |
| High School | 23 | 10.4% |
| College / Undergraduate | 21 | 9.5% |
| Graduate / Professional | 0 | 0.0% |
| Total | 221 | 100.0% |
School Enrollment by Age by Funding Source in Frazeysburg
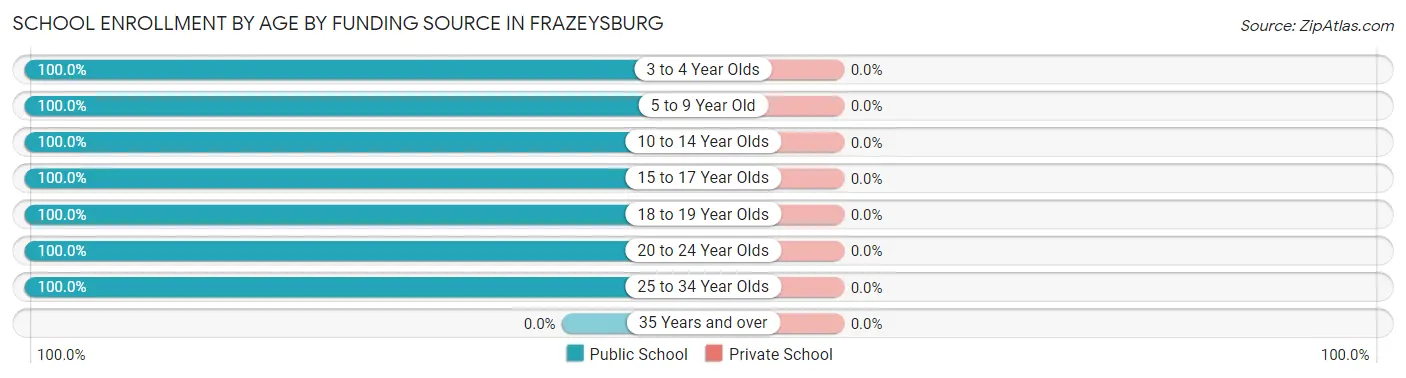
| Age Bracket | Public School | Private School |
| 3 to 4 Year Olds | 4 (100.0%) | 0 (0.0%) |
| 5 to 9 Year Old | 64 (100.0%) | 0 (0.0%) |
| 10 to 14 Year Olds | 109 (100.0%) | 0 (0.0%) |
| 15 to 17 Year Olds | 8 (100.0%) | 0 (0.0%) |
| 18 to 19 Year Olds | 10 (100.0%) | 0 (0.0%) |
| 20 to 24 Year Olds | 22 (100.0%) | 0 (0.0%) |
| 25 to 34 Year Olds | 4 (100.0%) | 0 (0.0%) |
| 35 Years and over | 0 (0.0%) | 0 (0.0%) |
| Total | 221 (100.0%) | 0 (0.0%) |
Educational Attainment by Field of Study in Frazeysburg
Business (39 | 46.4%), education (28 | 33.3%), arts & humanities (10 | 11.9%), science & technology (4 | 4.8%), and liberal arts & history (2 | 2.4%) are the most common fields of study among 84 individuals in Frazeysburg who have obtained a bachelor's degree or higher.
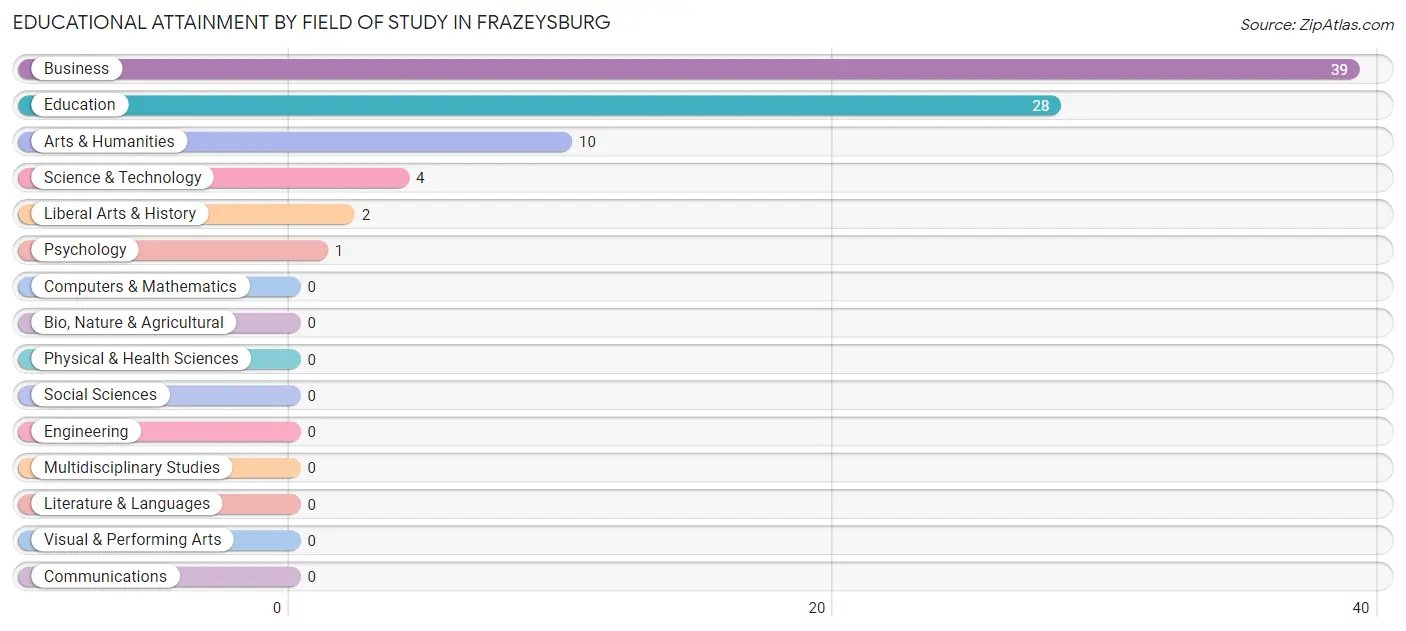
| Field of Study | # Graduates | % Graduates |
| Computers & Mathematics | 0 | 0.0% |
| Bio, Nature & Agricultural | 0 | 0.0% |
| Physical & Health Sciences | 0 | 0.0% |
| Psychology | 1 | 1.2% |
| Social Sciences | 0 | 0.0% |
| Engineering | 0 | 0.0% |
| Multidisciplinary Studies | 0 | 0.0% |
| Science & Technology | 4 | 4.8% |
| Business | 39 | 46.4% |
| Education | 28 | 33.3% |
| Literature & Languages | 0 | 0.0% |
| Liberal Arts & History | 2 | 2.4% |
| Visual & Performing Arts | 0 | 0.0% |
| Communications | 0 | 0.0% |
| Arts & Humanities | 10 | 11.9% |
| Total | 84 | 100.0% |
Transportation & Commute in Frazeysburg
Vehicle Availability by Sex in Frazeysburg
The most prevalent vehicle ownership categories in Frazeysburg are males with 2 vehicles (122, accounting for 39.5%) and females with 2 vehicles (82, making up 48.6%).
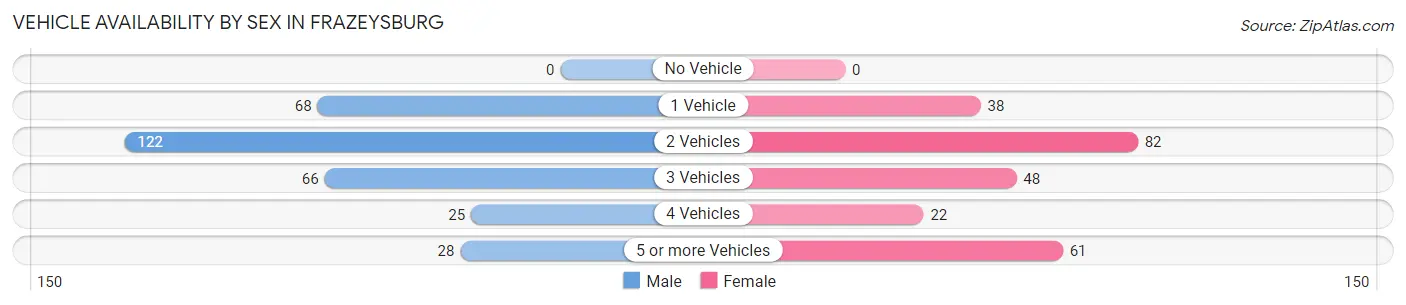
| Vehicles Available | Male | Female |
| No Vehicle | 0 (0.0%) | 0 (0.0%) |
| 1 Vehicle | 68 (22.0%) | 38 (15.1%) |
| 2 Vehicles | 122 (39.5%) | 82 (32.7%) |
| 3 Vehicles | 66 (21.4%) | 48 (19.1%) |
| 4 Vehicles | 25 (8.1%) | 22 (8.8%) |
| 5 or more Vehicles | 28 (9.1%) | 61 (24.3%) |
| Total | 309 (100.0%) | 251 (100.0%) |
Commute Time in Frazeysburg
The most frequently occuring commute durations in Frazeysburg are 25 to 29 minutes (91 commuters, 17.2%), 20 to 24 minutes (84 commuters, 15.9%), and 5 to 9 minutes (74 commuters, 14.0%).
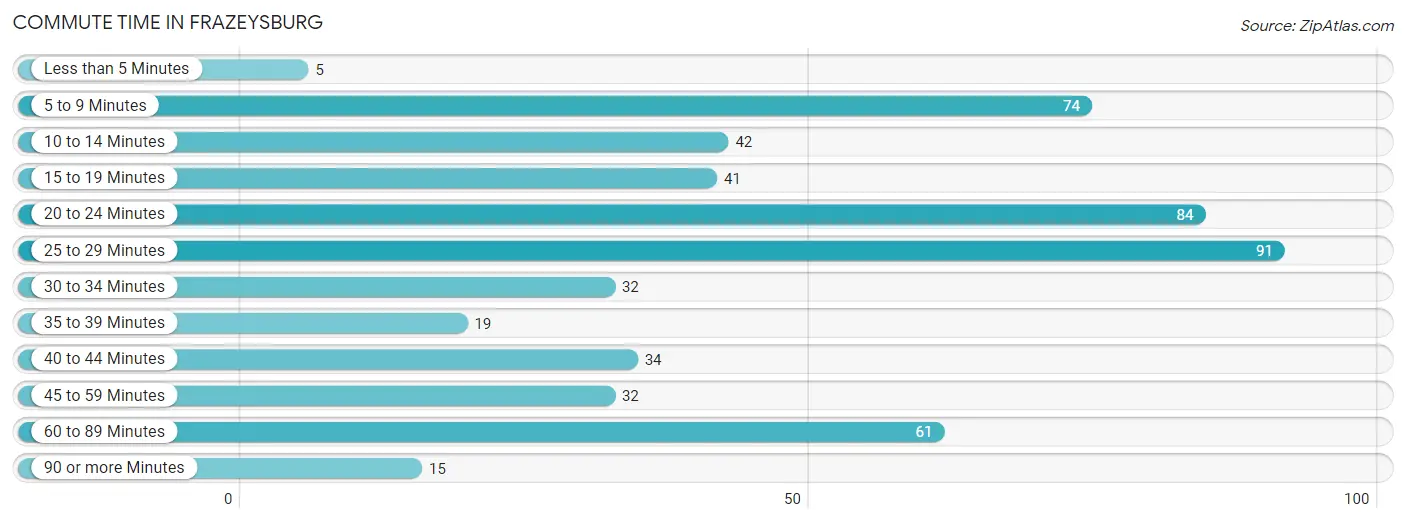
| Commute Time | # Commuters | % Commuters |
| Less than 5 Minutes | 5 | 0.9% |
| 5 to 9 Minutes | 74 | 14.0% |
| 10 to 14 Minutes | 42 | 7.9% |
| 15 to 19 Minutes | 41 | 7.7% |
| 20 to 24 Minutes | 84 | 15.9% |
| 25 to 29 Minutes | 91 | 17.2% |
| 30 to 34 Minutes | 32 | 6.0% |
| 35 to 39 Minutes | 19 | 3.6% |
| 40 to 44 Minutes | 34 | 6.4% |
| 45 to 59 Minutes | 32 | 6.0% |
| 60 to 89 Minutes | 61 | 11.5% |
| 90 or more Minutes | 15 | 2.8% |
Commute Time by Sex in Frazeysburg
The most common commute times in Frazeysburg are 25 to 29 minutes (63 commuters, 20.6%) for males and 5 to 9 minutes (38 commuters, 17.0%) for females.
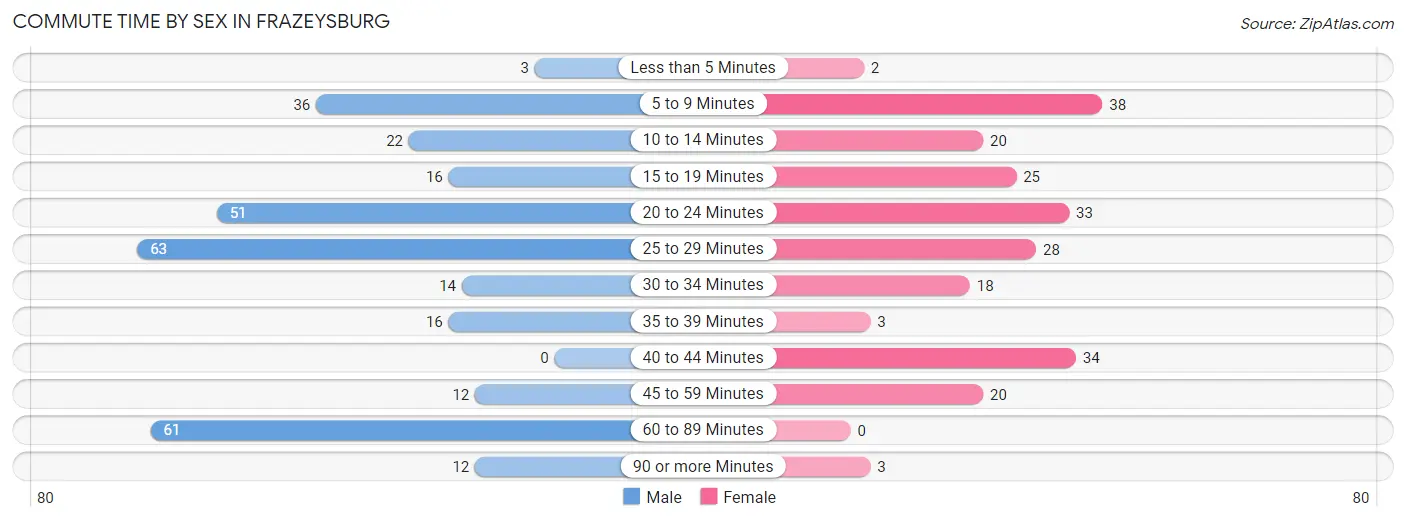
| Commute Time | Male | Female |
| Less than 5 Minutes | 3 (1.0%) | 2 (0.9%) |
| 5 to 9 Minutes | 36 (11.8%) | 38 (17.0%) |
| 10 to 14 Minutes | 22 (7.2%) | 20 (8.9%) |
| 15 to 19 Minutes | 16 (5.2%) | 25 (11.2%) |
| 20 to 24 Minutes | 51 (16.7%) | 33 (14.7%) |
| 25 to 29 Minutes | 63 (20.6%) | 28 (12.5%) |
| 30 to 34 Minutes | 14 (4.6%) | 18 (8.0%) |
| 35 to 39 Minutes | 16 (5.2%) | 3 (1.3%) |
| 40 to 44 Minutes | 0 (0.0%) | 34 (15.2%) |
| 45 to 59 Minutes | 12 (3.9%) | 20 (8.9%) |
| 60 to 89 Minutes | 61 (19.9%) | 0 (0.0%) |
| 90 or more Minutes | 12 (3.9%) | 3 (1.3%) |
Time of Departure to Work by Sex in Frazeysburg
The most frequent times of departure to work in Frazeysburg are 6:00 AM to 6:29 AM (54, 17.6%) for males and 6:00 AM to 6:29 AM (62, 27.7%) for females.
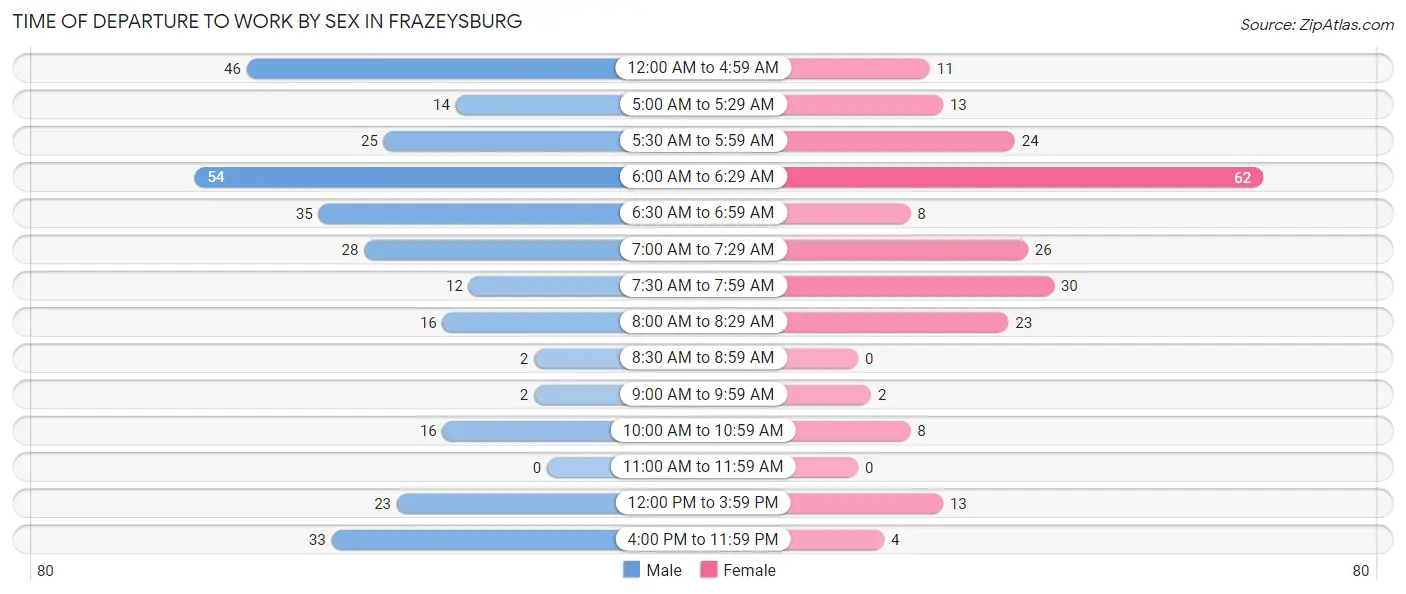
| Time of Departure | Male | Female |
| 12:00 AM to 4:59 AM | 46 (15.0%) | 11 (4.9%) |
| 5:00 AM to 5:29 AM | 14 (4.6%) | 13 (5.8%) |
| 5:30 AM to 5:59 AM | 25 (8.2%) | 24 (10.7%) |
| 6:00 AM to 6:29 AM | 54 (17.6%) | 62 (27.7%) |
| 6:30 AM to 6:59 AM | 35 (11.4%) | 8 (3.6%) |
| 7:00 AM to 7:29 AM | 28 (9.1%) | 26 (11.6%) |
| 7:30 AM to 7:59 AM | 12 (3.9%) | 30 (13.4%) |
| 8:00 AM to 8:29 AM | 16 (5.2%) | 23 (10.3%) |
| 8:30 AM to 8:59 AM | 2 (0.6%) | 0 (0.0%) |
| 9:00 AM to 9:59 AM | 2 (0.6%) | 2 (0.9%) |
| 10:00 AM to 10:59 AM | 16 (5.2%) | 8 (3.6%) |
| 11:00 AM to 11:59 AM | 0 (0.0%) | 0 (0.0%) |
| 12:00 PM to 3:59 PM | 23 (7.5%) | 13 (5.8%) |
| 4:00 PM to 11:59 PM | 33 (10.8%) | 4 (1.8%) |
| Total | 306 (100.0%) | 224 (100.0%) |
Housing Occupancy in Frazeysburg
Occupancy by Ownership in Frazeysburg
Of the total 546 dwellings in Frazeysburg, owner-occupied units account for 286 (52.4%), while renter-occupied units make up 260 (47.6%).
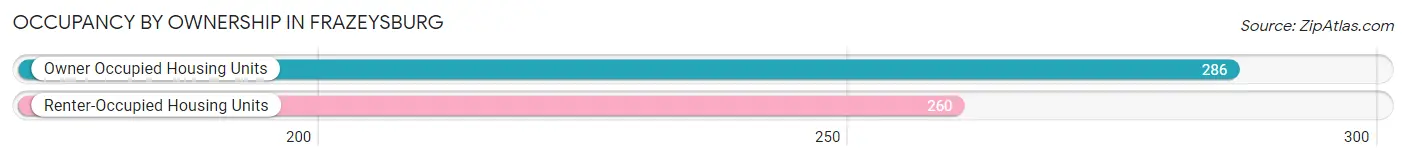
| Occupancy | # Housing Units | % Housing Units |
| Owner Occupied Housing Units | 286 | 52.4% |
| Renter-Occupied Housing Units | 260 | 47.6% |
| Total Occupied Housing Units | 546 | 100.0% |
Occupancy by Household Size in Frazeysburg
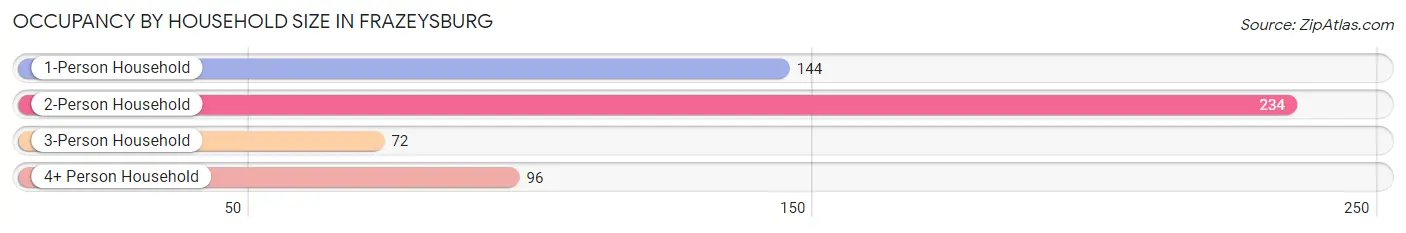
| Household Size | # Housing Units | % Housing Units |
| 1-Person Household | 144 | 26.4% |
| 2-Person Household | 234 | 42.9% |
| 3-Person Household | 72 | 13.2% |
| 4+ Person Household | 96 | 17.6% |
| Total Housing Units | 546 | 100.0% |
Occupancy by Ownership by Household Size in Frazeysburg
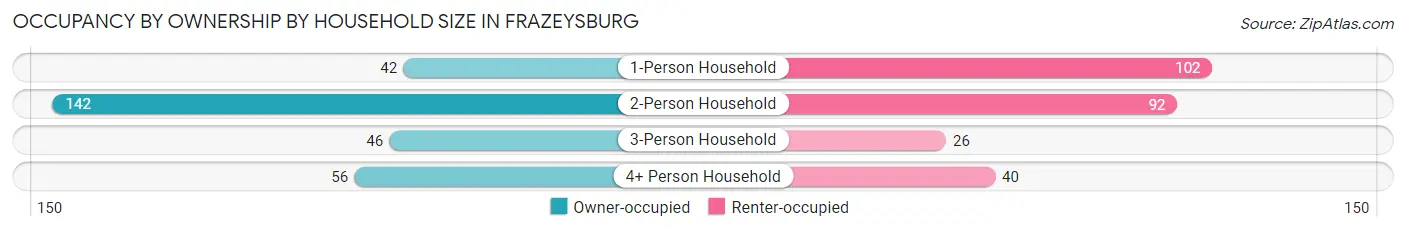
| Household Size | Owner-occupied | Renter-occupied |
| 1-Person Household | 42 (29.2%) | 102 (70.8%) |
| 2-Person Household | 142 (60.7%) | 92 (39.3%) |
| 3-Person Household | 46 (63.9%) | 26 (36.1%) |
| 4+ Person Household | 56 (58.3%) | 40 (41.7%) |
| Total Housing Units | 286 (52.4%) | 260 (47.6%) |
Occupancy by Educational Attainment in Frazeysburg
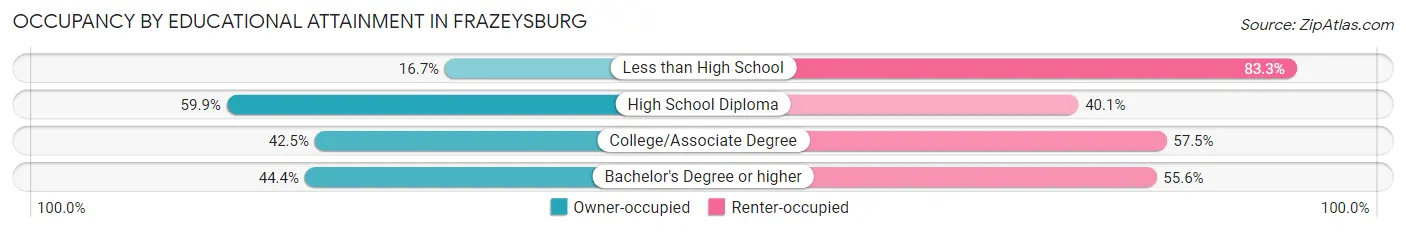
| Household Size | Owner-occupied | Renter-occupied |
| Less than High School | 5 (16.7%) | 25 (83.3%) |
| High School Diploma | 211 (59.9%) | 141 (40.1%) |
| College/Associate Degree | 62 (42.5%) | 84 (57.5%) |
| Bachelor's Degree or higher | 8 (44.4%) | 10 (55.6%) |
Occupancy by Age of Householder in Frazeysburg
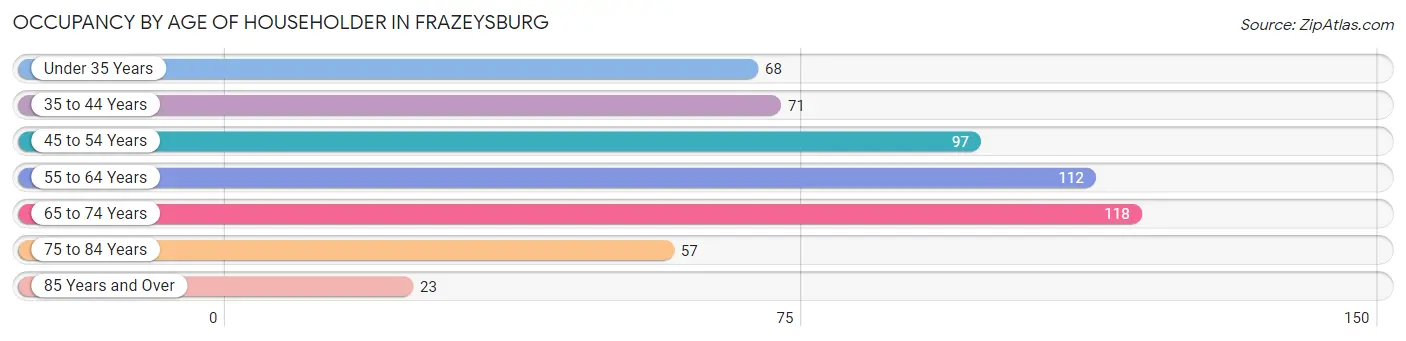
| Age Bracket | # Households | % Households |
| Under 35 Years | 68 | 12.4% |
| 35 to 44 Years | 71 | 13.0% |
| 45 to 54 Years | 97 | 17.8% |
| 55 to 64 Years | 112 | 20.5% |
| 65 to 74 Years | 118 | 21.6% |
| 75 to 84 Years | 57 | 10.4% |
| 85 Years and Over | 23 | 4.2% |
| Total | 546 | 100.0% |
Housing Finances in Frazeysburg
Median Income by Occupancy in Frazeysburg
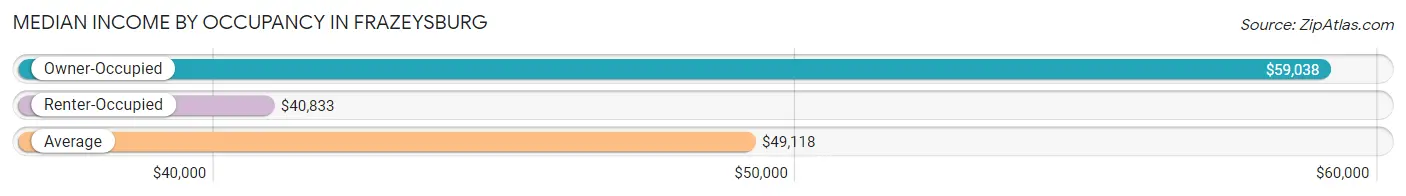
| Occupancy Type | # Households | Median Income |
| Owner-Occupied | 286 (52.4%) | $59,038 |
| Renter-Occupied | 260 (47.6%) | $40,833 |
| Average | 546 (100.0%) | $49,118 |
Occupancy by Householder Income Bracket in Frazeysburg
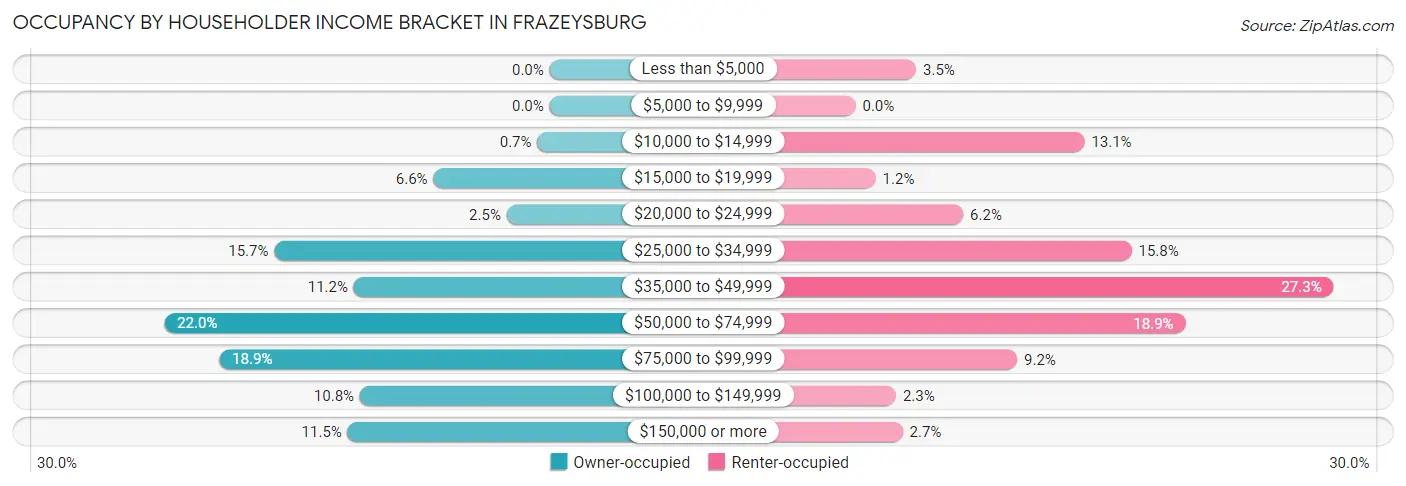
| Income Bracket | Owner-occupied | Renter-occupied |
| Less than $5,000 | 0 (0.0%) | 9 (3.5%) |
| $5,000 to $9,999 | 0 (0.0%) | 0 (0.0%) |
| $10,000 to $14,999 | 2 (0.7%) | 34 (13.1%) |
| $15,000 to $19,999 | 19 (6.6%) | 3 (1.1%) |
| $20,000 to $24,999 | 7 (2.5%) | 16 (6.1%) |
| $25,000 to $34,999 | 45 (15.7%) | 41 (15.8%) |
| $35,000 to $49,999 | 32 (11.2%) | 71 (27.3%) |
| $50,000 to $74,999 | 63 (22.0%) | 49 (18.9%) |
| $75,000 to $99,999 | 54 (18.9%) | 24 (9.2%) |
| $100,000 to $149,999 | 31 (10.8%) | 6 (2.3%) |
| $150,000 or more | 33 (11.5%) | 7 (2.7%) |
| Total | 286 (100.0%) | 260 (100.0%) |
Monthly Housing Cost Tiers in Frazeysburg
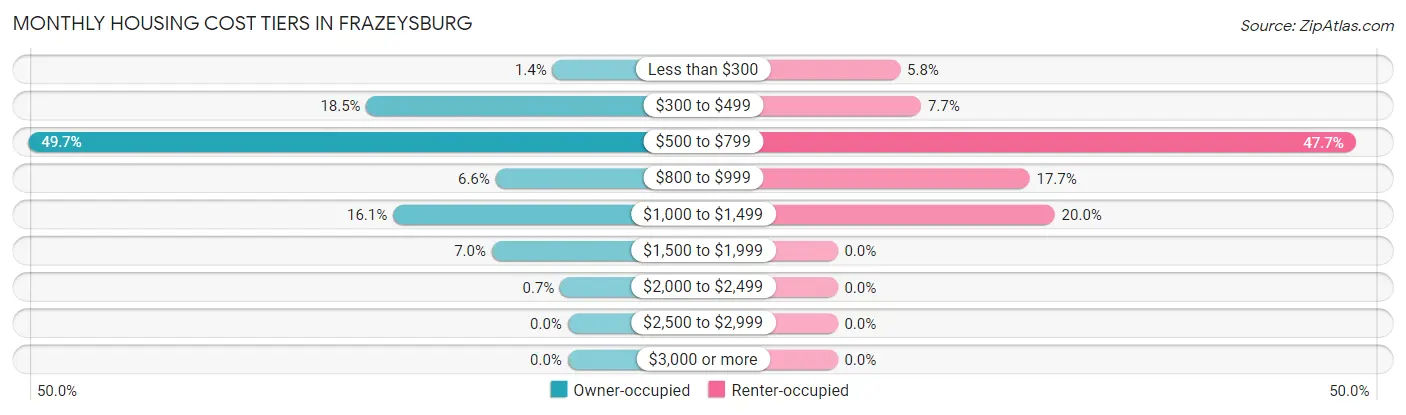
| Monthly Cost | Owner-occupied | Renter-occupied |
| Less than $300 | 4 (1.4%) | 15 (5.8%) |
| $300 to $499 | 53 (18.5%) | 20 (7.7%) |
| $500 to $799 | 142 (49.6%) | 124 (47.7%) |
| $800 to $999 | 19 (6.6%) | 46 (17.7%) |
| $1,000 to $1,499 | 46 (16.1%) | 52 (20.0%) |
| $1,500 to $1,999 | 20 (7.0%) | 0 (0.0%) |
| $2,000 to $2,499 | 2 (0.7%) | 0 (0.0%) |
| $2,500 to $2,999 | 0 (0.0%) | 0 (0.0%) |
| $3,000 or more | 0 (0.0%) | 0 (0.0%) |
| Total | 286 (100.0%) | 260 (100.0%) |
Physical Housing Characteristics in Frazeysburg
Housing Structures in Frazeysburg
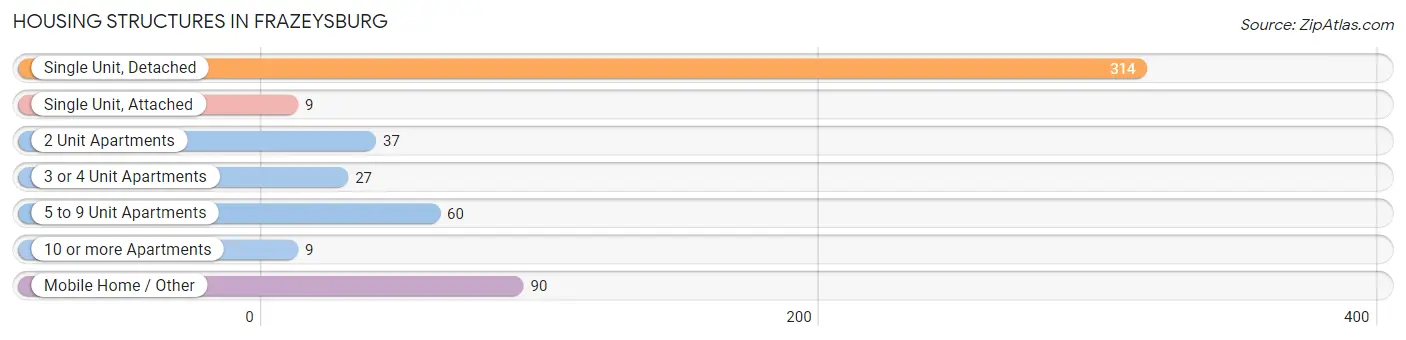
| Structure Type | # Housing Units | % Housing Units |
| Single Unit, Detached | 314 | 57.5% |
| Single Unit, Attached | 9 | 1.7% |
| 2 Unit Apartments | 37 | 6.8% |
| 3 or 4 Unit Apartments | 27 | 5.0% |
| 5 to 9 Unit Apartments | 60 | 11.0% |
| 10 or more Apartments | 9 | 1.7% |
| Mobile Home / Other | 90 | 16.5% |
| Total | 546 | 100.0% |
Housing Structures by Occupancy in Frazeysburg
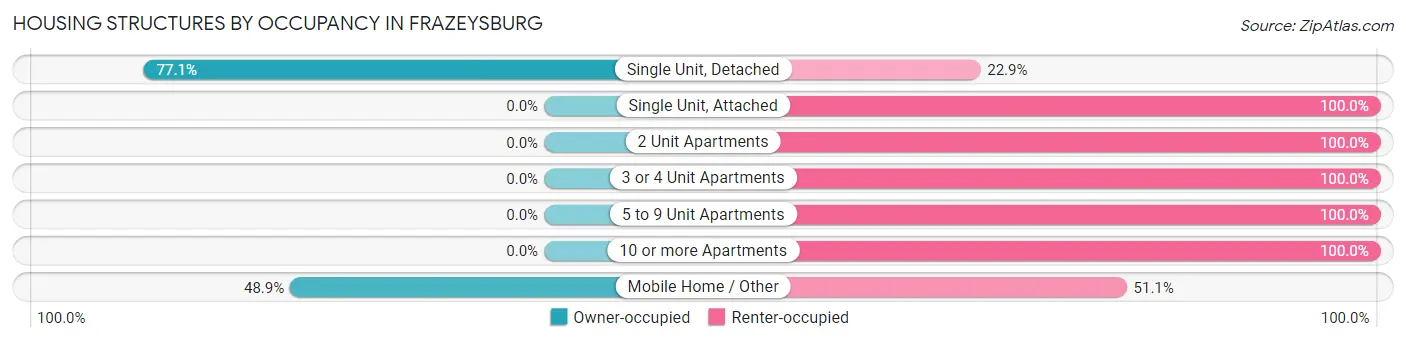
| Structure Type | Owner-occupied | Renter-occupied |
| Single Unit, Detached | 242 (77.1%) | 72 (22.9%) |
| Single Unit, Attached | 0 (0.0%) | 9 (100.0%) |
| 2 Unit Apartments | 0 (0.0%) | 37 (100.0%) |
| 3 or 4 Unit Apartments | 0 (0.0%) | 27 (100.0%) |
| 5 to 9 Unit Apartments | 0 (0.0%) | 60 (100.0%) |
| 10 or more Apartments | 0 (0.0%) | 9 (100.0%) |
| Mobile Home / Other | 44 (48.9%) | 46 (51.1%) |
| Total | 286 (52.4%) | 260 (47.6%) |
Housing Structures by Number of Rooms in Frazeysburg
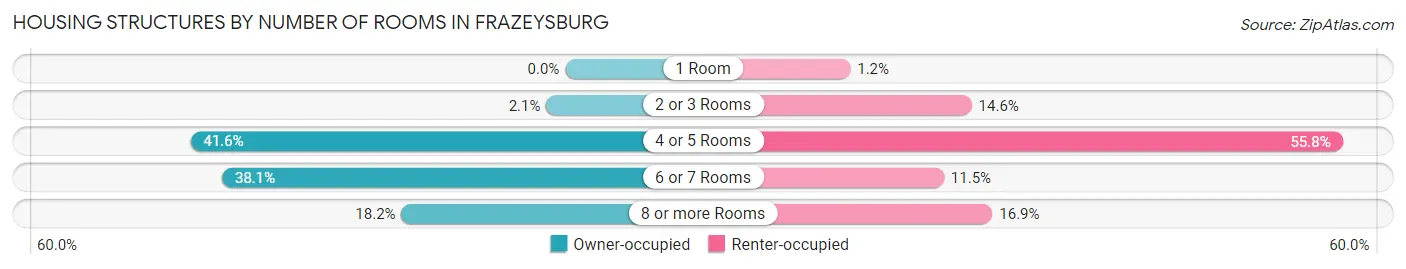
| Number of Rooms | Owner-occupied | Renter-occupied |
| 1 Room | 0 (0.0%) | 3 (1.1%) |
| 2 or 3 Rooms | 6 (2.1%) | 38 (14.6%) |
| 4 or 5 Rooms | 119 (41.6%) | 145 (55.8%) |
| 6 or 7 Rooms | 109 (38.1%) | 30 (11.5%) |
| 8 or more Rooms | 52 (18.2%) | 44 (16.9%) |
| Total | 286 (100.0%) | 260 (100.0%) |
Housing Structure by Heating Type in Frazeysburg
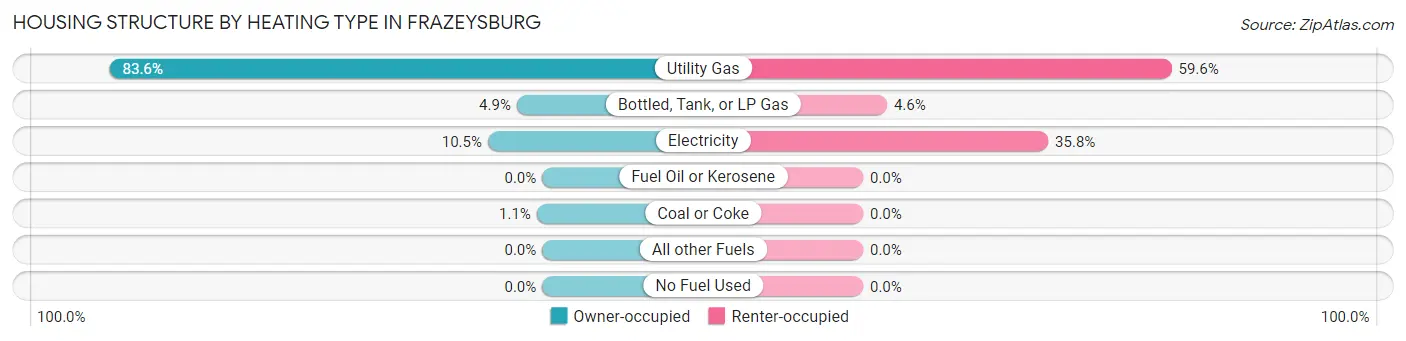
| Heating Type | Owner-occupied | Renter-occupied |
| Utility Gas | 239 (83.6%) | 155 (59.6%) |
| Bottled, Tank, or LP Gas | 14 (4.9%) | 12 (4.6%) |
| Electricity | 30 (10.5%) | 93 (35.8%) |
| Fuel Oil or Kerosene | 0 (0.0%) | 0 (0.0%) |
| Coal or Coke | 3 (1.1%) | 0 (0.0%) |
| All other Fuels | 0 (0.0%) | 0 (0.0%) |
| No Fuel Used | 0 (0.0%) | 0 (0.0%) |
| Total | 286 (100.0%) | 260 (100.0%) |
Household Vehicle Usage in Frazeysburg
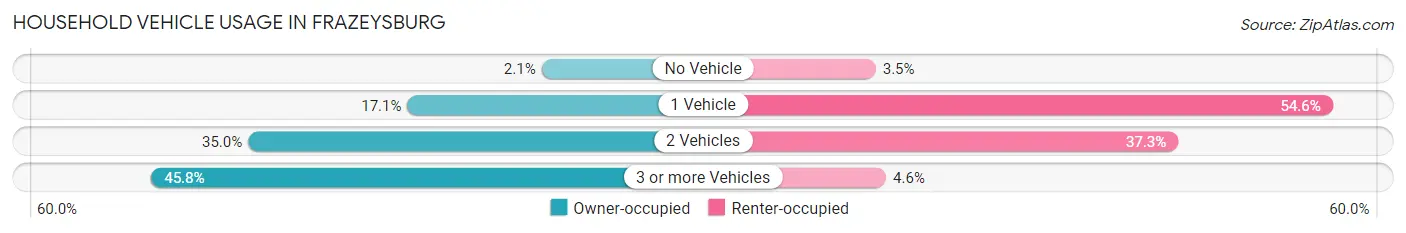
| Vehicles per Household | Owner-occupied | Renter-occupied |
| No Vehicle | 6 (2.1%) | 9 (3.5%) |
| 1 Vehicle | 49 (17.1%) | 142 (54.6%) |
| 2 Vehicles | 100 (35.0%) | 97 (37.3%) |
| 3 or more Vehicles | 131 (45.8%) | 12 (4.6%) |
| Total | 286 (100.0%) | 260 (100.0%) |
Real Estate & Mortgages in Frazeysburg
Real Estate and Mortgage Overview in Frazeysburg
| Characteristic | Without Mortgage | With Mortgage |
| Housing Units | 132 | 154 |
| Median Property Value | $116,100 | $104,200 |
| Median Household Income | $46,875 | $31 |
| Monthly Housing Costs | $527 | $0 |
| Real Estate Taxes | $942 | $0 |
Property Value by Mortgage Status in Frazeysburg
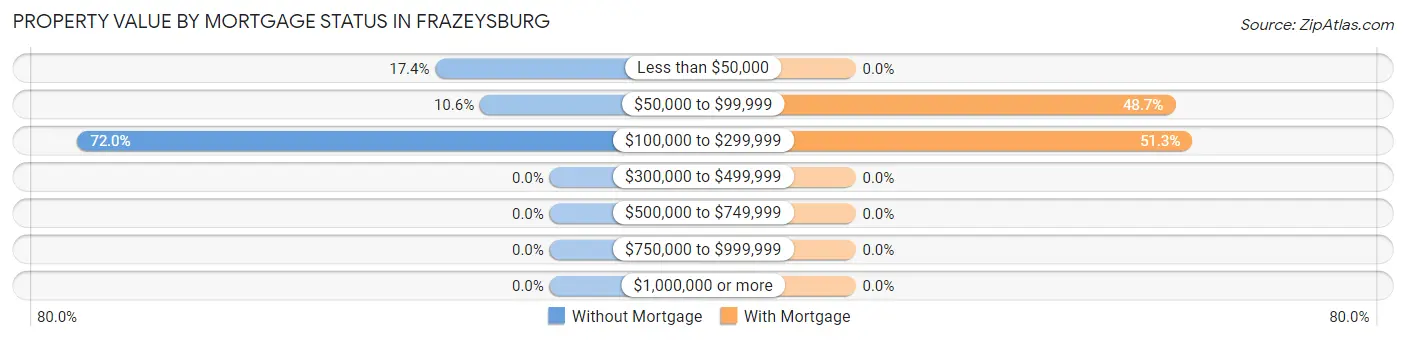
| Property Value | Without Mortgage | With Mortgage |
| Less than $50,000 | 23 (17.4%) | 0 (0.0%) |
| $50,000 to $99,999 | 14 (10.6%) | 75 (48.7%) |
| $100,000 to $299,999 | 95 (72.0%) | 79 (51.3%) |
| $300,000 to $499,999 | 0 (0.0%) | 0 (0.0%) |
| $500,000 to $749,999 | 0 (0.0%) | 0 (0.0%) |
| $750,000 to $999,999 | 0 (0.0%) | 0 (0.0%) |
| $1,000,000 or more | 0 (0.0%) | 0 (0.0%) |
| Total | 132 (100.0%) | 154 (100.0%) |
Household Income by Mortgage Status in Frazeysburg
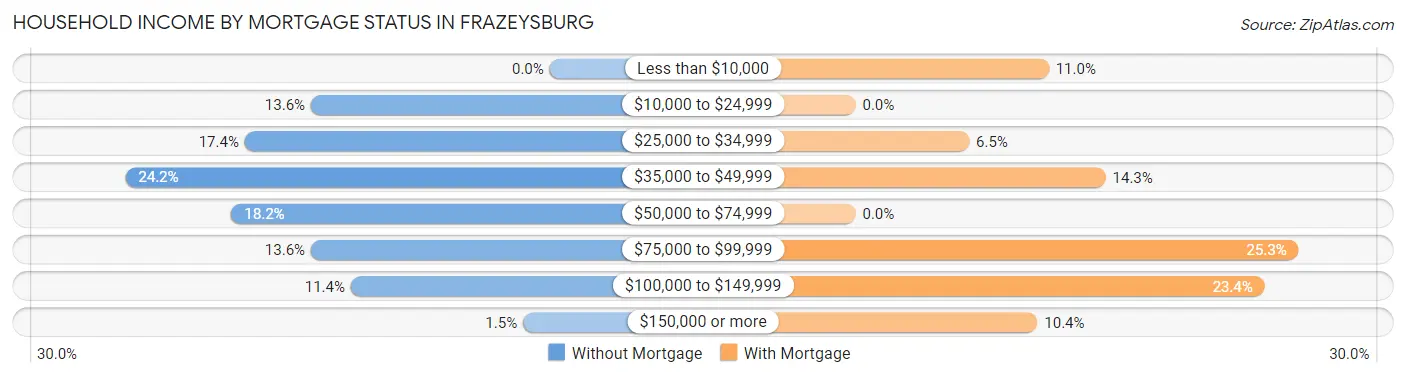
| Household Income | Without Mortgage | With Mortgage |
| Less than $10,000 | 0 (0.0%) | 17 (11.0%) |
| $10,000 to $24,999 | 18 (13.6%) | 0 (0.0%) |
| $25,000 to $34,999 | 23 (17.4%) | 10 (6.5%) |
| $35,000 to $49,999 | 32 (24.2%) | 22 (14.3%) |
| $50,000 to $74,999 | 24 (18.2%) | 0 (0.0%) |
| $75,000 to $99,999 | 18 (13.6%) | 39 (25.3%) |
| $100,000 to $149,999 | 15 (11.4%) | 36 (23.4%) |
| $150,000 or more | 2 (1.5%) | 16 (10.4%) |
| Total | 132 (100.0%) | 154 (100.0%) |
Property Value to Household Income Ratio in Frazeysburg
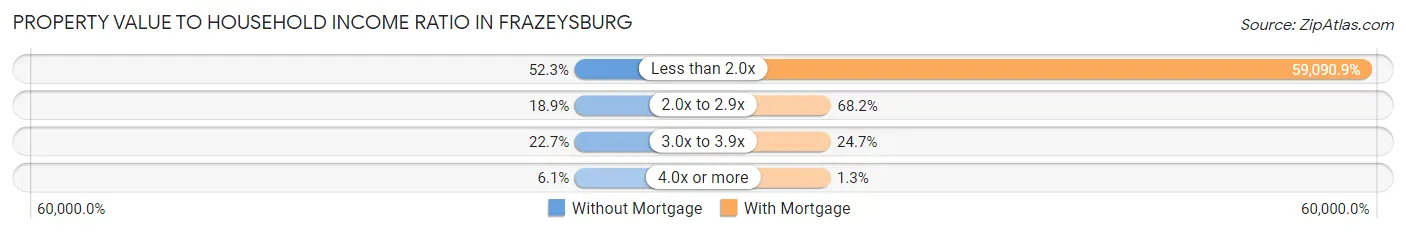
| Value-to-Income Ratio | Without Mortgage | With Mortgage |
| Less than 2.0x | 69 (52.3%) | 91,000 (59,090.9%) |
| 2.0x to 2.9x | 25 (18.9%) | 105 (68.2%) |
| 3.0x to 3.9x | 30 (22.7%) | 38 (24.7%) |
| 4.0x or more | 8 (6.1%) | 2 (1.3%) |
| Total | 132 (100.0%) | 154 (100.0%) |
Real Estate Taxes by Mortgage Status in Frazeysburg
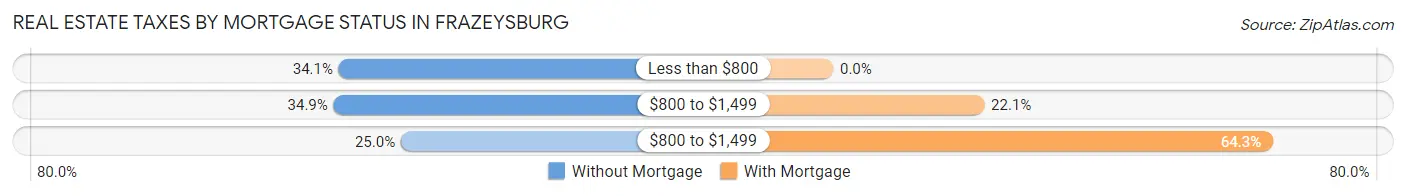
| Property Taxes | Without Mortgage | With Mortgage |
| Less than $800 | 45 (34.1%) | 0 (0.0%) |
| $800 to $1,499 | 46 (34.8%) | 34 (22.1%) |
| $800 to $1,499 | 33 (25.0%) | 99 (64.3%) |
| Total | 132 (100.0%) | 154 (100.0%) |
Health & Disability in Frazeysburg
Health Insurance Coverage by Age in Frazeysburg
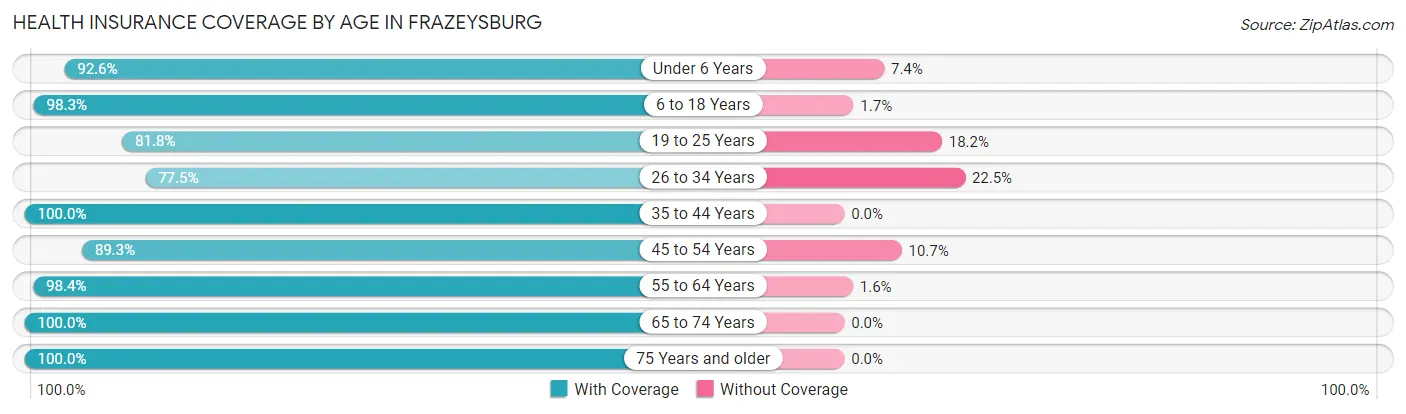
| Age Bracket | With Coverage | Without Coverage |
| Under 6 Years | 50 (92.6%) | 4 (7.4%) |
| 6 to 18 Years | 173 (98.3%) | 3 (1.7%) |
| 19 to 25 Years | 108 (81.8%) | 24 (18.2%) |
| 26 to 34 Years | 124 (77.5%) | 36 (22.5%) |
| 35 to 44 Years | 106 (100.0%) | 0 (0.0%) |
| 45 to 54 Years | 159 (89.3%) | 19 (10.7%) |
| 55 to 64 Years | 184 (98.4%) | 3 (1.6%) |
| 65 to 74 Years | 176 (100.0%) | 0 (0.0%) |
| 75 Years and older | 166 (100.0%) | 0 (0.0%) |
| Total | 1,246 (93.3%) | 89 (6.7%) |
Health Insurance Coverage by Citizenship Status in Frazeysburg
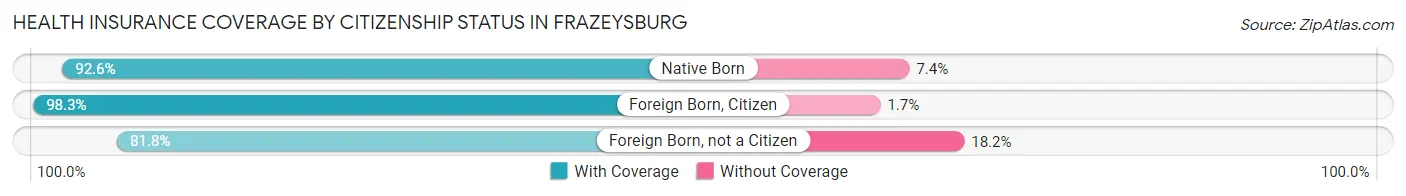
| Citizenship Status | With Coverage | Without Coverage |
| Native Born | 50 (92.6%) | 4 (7.4%) |
| Foreign Born, Citizen | 173 (98.3%) | 3 (1.7%) |
| Foreign Born, not a Citizen | 108 (81.8%) | 24 (18.2%) |
Health Insurance Coverage by Household Income in Frazeysburg
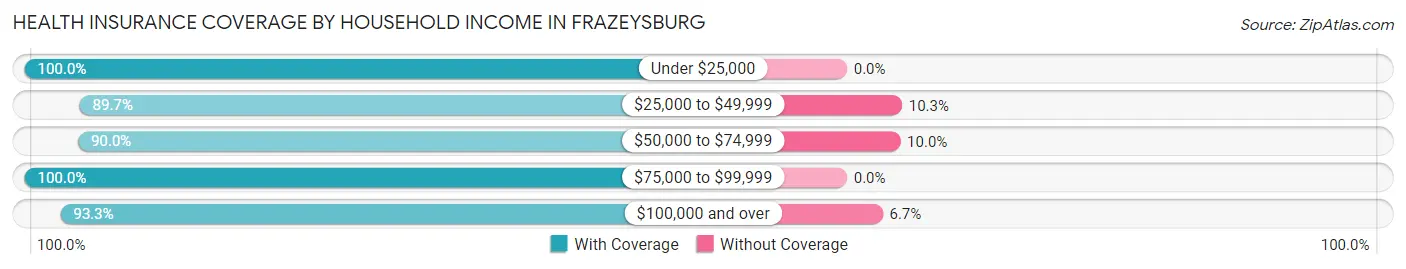
| Household Income | With Coverage | Without Coverage |
| Under $25,000 | 143 (100.0%) | 0 (0.0%) |
| $25,000 to $49,999 | 400 (89.7%) | 46 (10.3%) |
| $50,000 to $74,999 | 243 (90.0%) | 27 (10.0%) |
| $75,000 to $99,999 | 237 (100.0%) | 0 (0.0%) |
| $100,000 and over | 223 (93.3%) | 16 (6.7%) |
Public vs Private Health Insurance Coverage by Age in Frazeysburg
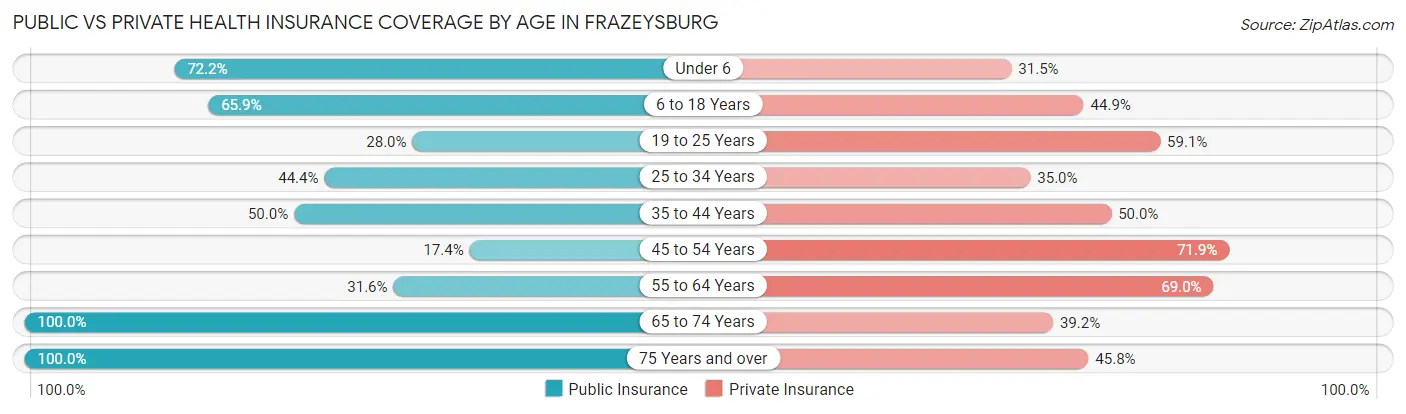
| Age Bracket | Public Insurance | Private Insurance |
| Under 6 | 39 (72.2%) | 17 (31.5%) |
| 6 to 18 Years | 116 (65.9%) | 79 (44.9%) |
| 19 to 25 Years | 37 (28.0%) | 78 (59.1%) |
| 25 to 34 Years | 71 (44.4%) | 56 (35.0%) |
| 35 to 44 Years | 53 (50.0%) | 53 (50.0%) |
| 45 to 54 Years | 31 (17.4%) | 128 (71.9%) |
| 55 to 64 Years | 59 (31.6%) | 129 (69.0%) |
| 65 to 74 Years | 176 (100.0%) | 69 (39.2%) |
| 75 Years and over | 166 (100.0%) | 76 (45.8%) |
| Total | 748 (56.0%) | 685 (51.3%) |
Disability Status by Sex by Age in Frazeysburg
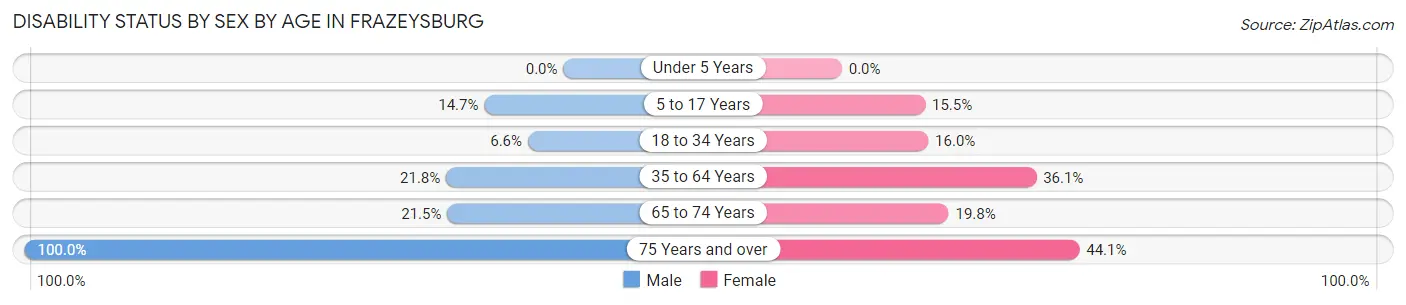
| Age Bracket | Male | Female |
| Under 5 Years | 0 (0.0%) | 0 (0.0%) |
| 5 to 17 Years | 11 (14.7%) | 17 (15.4%) |
| 18 to 34 Years | 11 (6.6%) | 21 (16.0%) |
| 35 to 64 Years | 47 (21.8%) | 92 (36.1%) |
| 65 to 74 Years | 14 (21.5%) | 22 (19.8%) |
| 75 Years and over | 73 (100.0%) | 41 (44.1%) |
Disability Class by Sex by Age in Frazeysburg
Disability Class: Hearing Difficulty
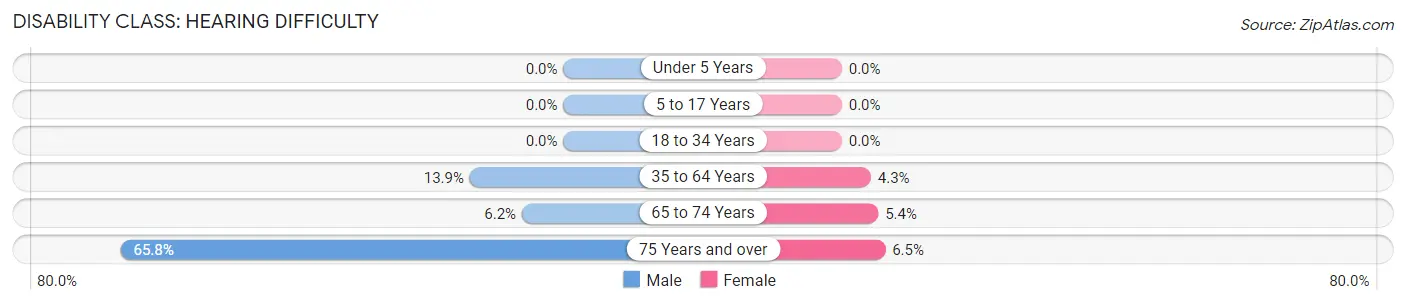
| Age Bracket | Male | Female |
| Under 5 Years | 0 (0.0%) | 0 (0.0%) |
| 5 to 17 Years | 0 (0.0%) | 0 (0.0%) |
| 18 to 34 Years | 0 (0.0%) | 0 (0.0%) |
| 35 to 64 Years | 30 (13.9%) | 11 (4.3%) |
| 65 to 74 Years | 4 (6.1%) | 6 (5.4%) |
| 75 Years and over | 48 (65.7%) | 6 (6.5%) |
Disability Class: Vision Difficulty
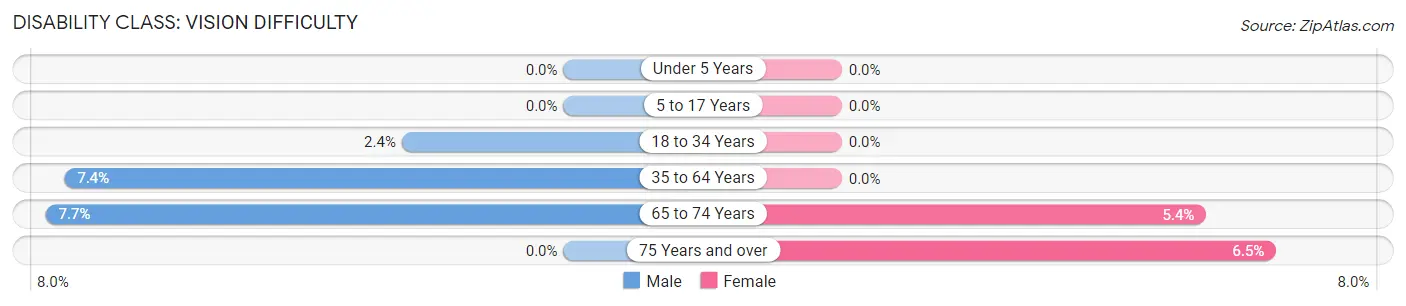
| Age Bracket | Male | Female |
| Under 5 Years | 0 (0.0%) | 0 (0.0%) |
| 5 to 17 Years | 0 (0.0%) | 0 (0.0%) |
| 18 to 34 Years | 4 (2.4%) | 0 (0.0%) |
| 35 to 64 Years | 16 (7.4%) | 0 (0.0%) |
| 65 to 74 Years | 5 (7.7%) | 6 (5.4%) |
| 75 Years and over | 0 (0.0%) | 6 (6.5%) |
Disability Class: Cognitive Difficulty
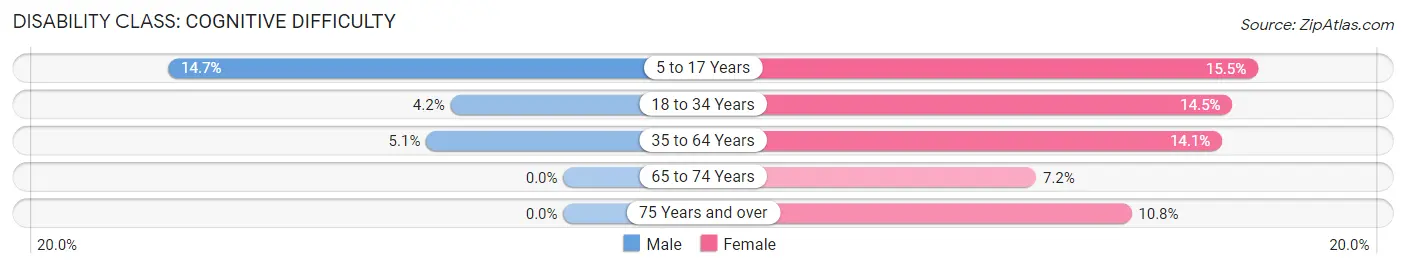
| Age Bracket | Male | Female |
| 5 to 17 Years | 11 (14.7%) | 17 (15.4%) |
| 18 to 34 Years | 7 (4.2%) | 19 (14.5%) |
| 35 to 64 Years | 11 (5.1%) | 36 (14.1%) |
| 65 to 74 Years | 0 (0.0%) | 8 (7.2%) |
| 75 Years and over | 0 (0.0%) | 10 (10.7%) |
Disability Class: Ambulatory Difficulty
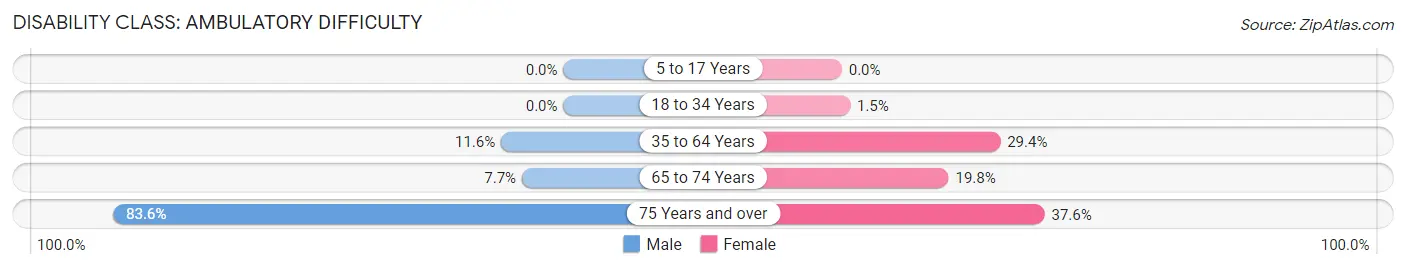
| Age Bracket | Male | Female |
| 5 to 17 Years | 0 (0.0%) | 0 (0.0%) |
| 18 to 34 Years | 0 (0.0%) | 2 (1.5%) |
| 35 to 64 Years | 25 (11.6%) | 75 (29.4%) |
| 65 to 74 Years | 5 (7.7%) | 22 (19.8%) |
| 75 Years and over | 61 (83.6%) | 35 (37.6%) |
Disability Class: Self-Care Difficulty
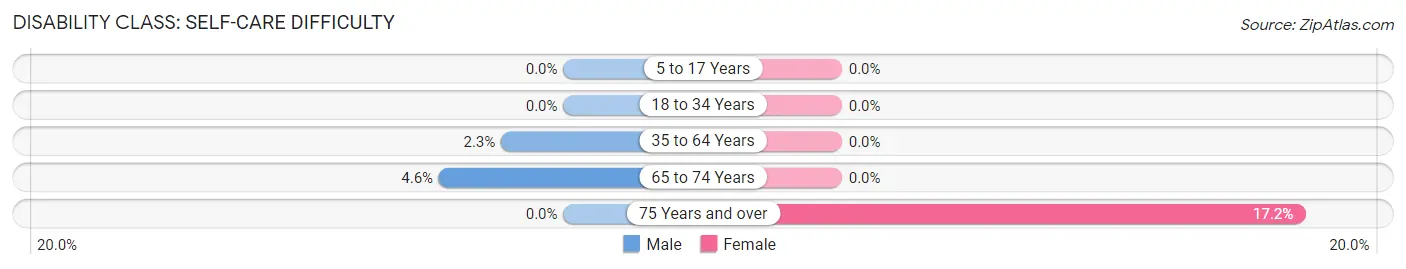
| Age Bracket | Male | Female |
| 5 to 17 Years | 0 (0.0%) | 0 (0.0%) |
| 18 to 34 Years | 0 (0.0%) | 0 (0.0%) |
| 35 to 64 Years | 5 (2.3%) | 0 (0.0%) |
| 65 to 74 Years | 3 (4.6%) | 0 (0.0%) |
| 75 Years and over | 0 (0.0%) | 16 (17.2%) |
Technology Access in Frazeysburg
Computing Device Access in Frazeysburg
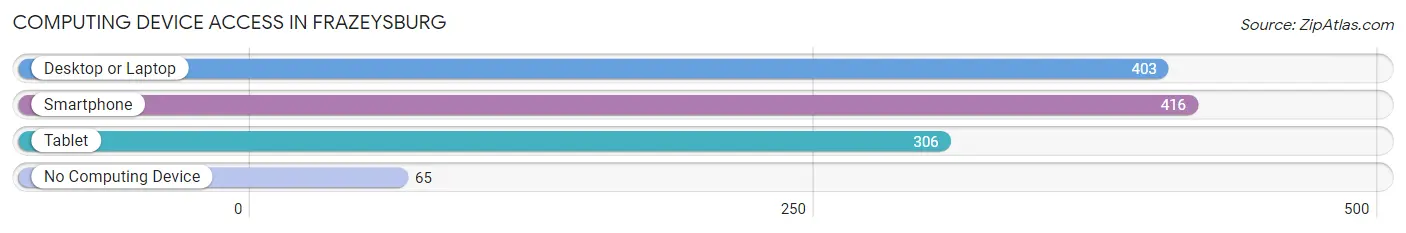
| Device Type | # Households | % Households |
| Desktop or Laptop | 403 | 73.8% |
| Smartphone | 416 | 76.2% |
| Tablet | 306 | 56.0% |
| No Computing Device | 65 | 11.9% |
| Total | 546 | 100.0% |
Internet Access in Frazeysburg
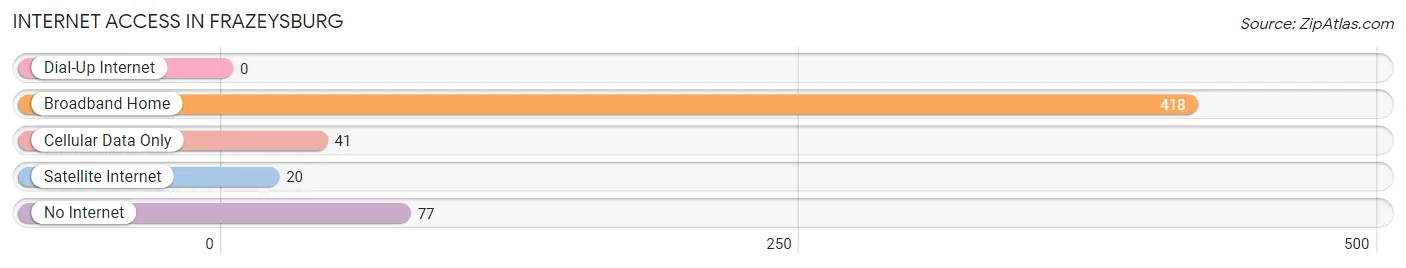
| Internet Type | # Households | % Households |
| Dial-Up Internet | 0 | 0.0% |
| Broadband Home | 418 | 76.6% |
| Cellular Data Only | 41 | 7.5% |
| Satellite Internet | 20 | 3.7% |
| No Internet | 77 | 14.1% |
| Total | 546 | 100.0% |
Frazeysburg Summary
History
The small village of Frazeysburg, Ohio is located in Muskingum County, Ohio. It was founded in 1815 by John Frazey, a Revolutionary War veteran. The village was originally known as Frazeysburgh, but the name was changed to Frazeysburg in 1837. The village was incorporated in 1845.
Frazeysburg was a small farming community in the early days, but it soon became a center for industry. The first industry to come to the village was a sawmill, which was built in 1820. This was followed by a gristmill in 1825, a woolen mill in 1835, and a paper mill in 1845. These industries provided employment for many of the villagers, and helped to make Frazeysburg a prosperous community.
The village was also home to several churches, including the Methodist Episcopal Church, the Presbyterian Church, and the United Brethren Church. The village also had a school, which was established in 1820.
Geography
Frazeysburg is located in Muskingum County, Ohio, in the southeastern part of the state. It is situated on the banks of the Muskingum River, about 25 miles east of the city of Zanesville. The village is surrounded by rolling hills and farmland, and is located in the Appalachian Plateau region of Ohio.
The climate in Frazeysburg is humid continental, with hot summers and cold winters. The average annual temperature is around 50 degrees Fahrenheit, and the average annual precipitation is around 40 inches.
Economy
The economy of Frazeysburg is largely based on agriculture and manufacturing. The village is home to several small businesses, including a sawmill, a gristmill, a woolen mill, and a paper mill. These businesses provide employment for many of the villagers.
The village also has a few retail stores, including a grocery store, a hardware store, and a few restaurants. There is also a post office in the village.
Demographics
As of the 2010 census, the population of Frazeysburg was 1,845. The racial makeup of the village was 97.3% White, 0.7% African American, 0.2% Native American, 0.2% Asian, and 1.6% from other races. The median household income was $37,917, and the median family income was $45,938.
The village is served by the Frazeysburg Local School District, which consists of one elementary school, one middle school, and one high school. The village also has a public library, which is part of the Muskingum County Library System.
Common Questions
What is Per Capita Income in Frazeysburg?
Per Capita income in Frazeysburg is $27,594.
What is the Median Family Income in Frazeysburg?
Median Family Income in Frazeysburg is $62,232.
What is the Median Household income in Frazeysburg?
Median Household Income in Frazeysburg is $49,118.
What is Income or Wage Gap in Frazeysburg?
Income or Wage Gap in Frazeysburg is 13.3%.
Women in Frazeysburg earn 86.7 cents for every dollar earned by a man.
What is Inequality or Gini Index in Frazeysburg?
Inequality or Gini Index in Frazeysburg is 0.41.
What is the Total Population of Frazeysburg?
Total Population of Frazeysburg is 1,335.
What is the Total Male Population of Frazeysburg?
Total Male Population of Frazeysburg is 620.
What is the Total Female Population of Frazeysburg?
Total Female Population of Frazeysburg is 715.
What is the Ratio of Males per 100 Females in Frazeysburg?
There are 86.71 Males per 100 Females in Frazeysburg.
What is the Ratio of Females per 100 Males in Frazeysburg?
There are 115.32 Females per 100 Males in Frazeysburg.
What is the Median Population Age in Frazeysburg?
Median Population Age in Frazeysburg is 48.6 Years.
What is the Average Family Size in Frazeysburg
Average Family Size in Frazeysburg is 2.8 People.
What is the Average Household Size in Frazeysburg
Average Household Size in Frazeysburg is 2.5 People.
How Large is the Labor Force in Frazeysburg?
There are 622 People in the Labor Forcein in Frazeysburg.
What is the Percentage of People in the Labor Force in Frazeysburg?
55.6% of People are in the Labor Force in Frazeysburg.
What is the Unemployment Rate in Frazeysburg?
Unemployment Rate in Frazeysburg is 6.1%.