Fort Loramie, OH Map & Demographics
Fort Loramie Map
Fort Loramie Overview
$39,267
PER CAPITA INCOME
$106,389
AVG FAMILY INCOME
$82,917
AVG HOUSEHOLD INCOME
35.1%
WAGE / INCOME GAP [ % ]
64.9¢/ $1
WAGE / INCOME GAP [ $ ]
0.38
INEQUALITY / GINI INDEX
1,494
TOTAL POPULATION
777
MALE POPULATION
717
FEMALE POPULATION
108.37
MALES / 100 FEMALES
92.28
FEMALES / 100 MALES
33.0
MEDIAN AGE
3.3
AVG FAMILY SIZE
2.5
AVG HOUSEHOLD SIZE
803
LABOR FORCE [ PEOPLE ]
72.5%
PERCENT IN LABOR FORCE
1.2%
UNEMPLOYMENT RATE
Fort Loramie Zip Codes
Fort Loramie Area Codes
Income in Fort Loramie
Income Overview in Fort Loramie
Per Capita Income in Fort Loramie is $39,267, while median incomes of families and households are $106,389 and $82,917 respectively.
| Characteristic | Number | Measure |
| Per Capita Income | 1,494 | $39,267 |
| Median Family Income | 392 | $106,389 |
| Mean Family Income | 392 | $119,837 |
| Median Household Income | 587 | $82,917 |
| Mean Household Income | 587 | $98,497 |
| Income Deficit | 392 | $0 |
| Wage / Income Gap (%) | 1,494 | 35.05% |
| Wage / Income Gap ($) | 1,494 | 64.95¢ per $1 |
| Gini / Inequality Index | 1,494 | 0.38 |
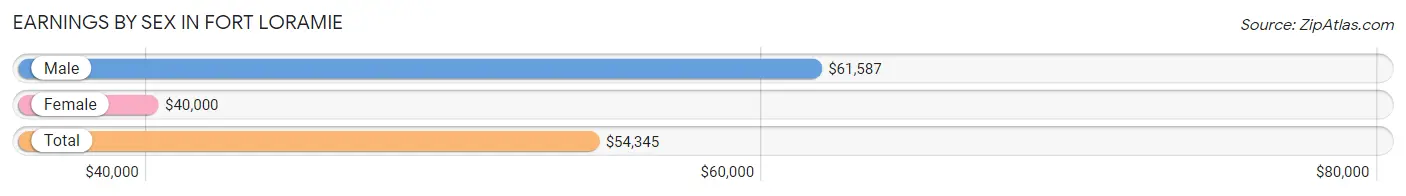
Earnings by Sex in Fort Loramie
Average Earnings in Fort Loramie are $54,345, $61,587 for men and $40,000 for women, a difference of 35.0%.
| Sex | Number | Average Earnings |
| Male | 473 (57.1%) | $61,587 |
| Female | 356 (42.9%) | $40,000 |
| Total | 829 (100.0%) | $54,345 |
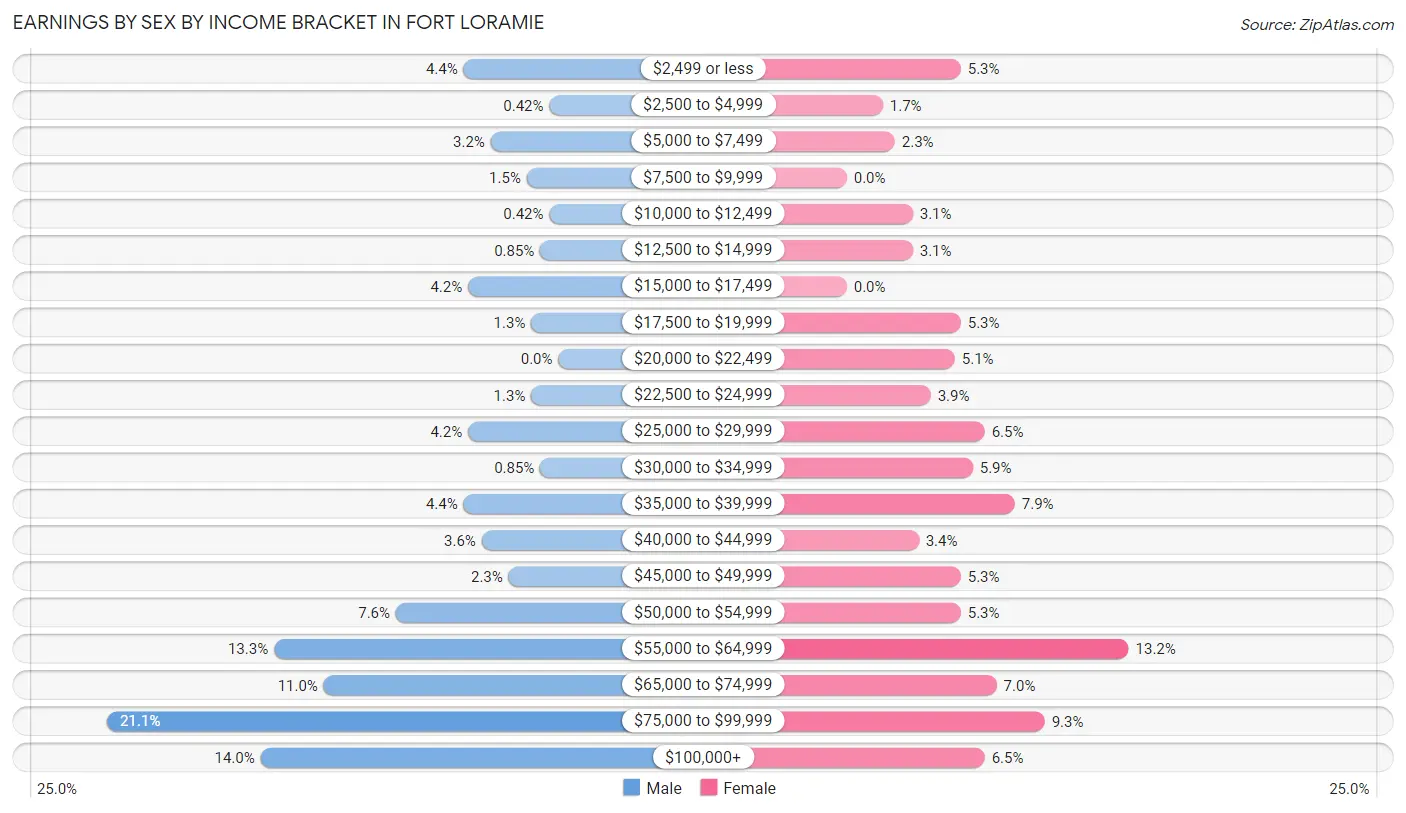
Earnings by Sex by Income Bracket in Fort Loramie
The most common earnings brackets in Fort Loramie are $75,000 to $99,999 for men (100 | 21.1%) and $55,000 to $64,999 for women (47 | 13.2%).
| Income | Male | Female |
| $2,499 or less | 21 (4.4%) | 19 (5.3%) |
| $2,500 to $4,999 | 2 (0.4%) | 6 (1.7%) |
| $5,000 to $7,499 | 15 (3.2%) | 8 (2.2%) |
| $7,500 to $9,999 | 7 (1.5%) | 0 (0.0%) |
| $10,000 to $12,499 | 2 (0.4%) | 11 (3.1%) |
| $12,500 to $14,999 | 4 (0.9%) | 11 (3.1%) |
| $15,000 to $17,499 | 20 (4.2%) | 0 (0.0%) |
| $17,500 to $19,999 | 6 (1.3%) | 19 (5.3%) |
| $20,000 to $22,499 | 0 (0.0%) | 18 (5.1%) |
| $22,500 to $24,999 | 6 (1.3%) | 14 (3.9%) |
| $25,000 to $29,999 | 20 (4.2%) | 23 (6.5%) |
| $30,000 to $34,999 | 4 (0.9%) | 21 (5.9%) |
| $35,000 to $39,999 | 21 (4.4%) | 28 (7.9%) |
| $40,000 to $44,999 | 17 (3.6%) | 12 (3.4%) |
| $45,000 to $49,999 | 11 (2.3%) | 19 (5.3%) |
| $50,000 to $54,999 | 36 (7.6%) | 19 (5.3%) |
| $55,000 to $64,999 | 63 (13.3%) | 47 (13.2%) |
| $65,000 to $74,999 | 52 (11.0%) | 25 (7.0%) |
| $75,000 to $99,999 | 100 (21.1%) | 33 (9.3%) |
| $100,000+ | 66 (14.0%) | 23 (6.5%) |
| Total | 473 (100.0%) | 356 (100.0%) |
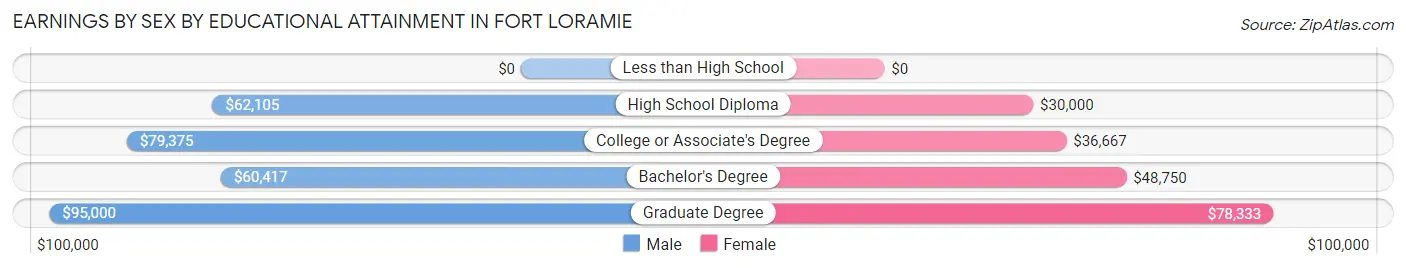
Earnings by Sex by Educational Attainment in Fort Loramie
Average earnings in Fort Loramie are $67,386 for men and $46,705 for women, a difference of 30.7%. Men with an educational attainment of graduate degree enjoy the highest average annual earnings of $95,000, while those with bachelor's degree education earn the least with $60,417. Women with an educational attainment of graduate degree earn the most with the average annual earnings of $78,333, while those with high school diploma education have the smallest earnings of $30,000.
| Educational Attainment | Male Income | Female Income |
| Less than High School | - | - |
| High School Diploma | $62,105 | $30,000 |
| College or Associate's Degree | $79,375 | $36,667 |
| Bachelor's Degree | $60,417 | $48,750 |
| Graduate Degree | $95,000 | $78,333 |
| Total | $67,386 | $46,705 |
Family Income in Fort Loramie
Family Income Brackets in Fort Loramie
According to the Fort Loramie family income data, there are 104 families falling into the $100,000 to $149,999 income range, which is the most common income bracket and makes up 26.5% of all families. Conversely, the $10,000 to $14,999 income bracket is the least frequent group with only 1 families (0.3%) belonging to this category.
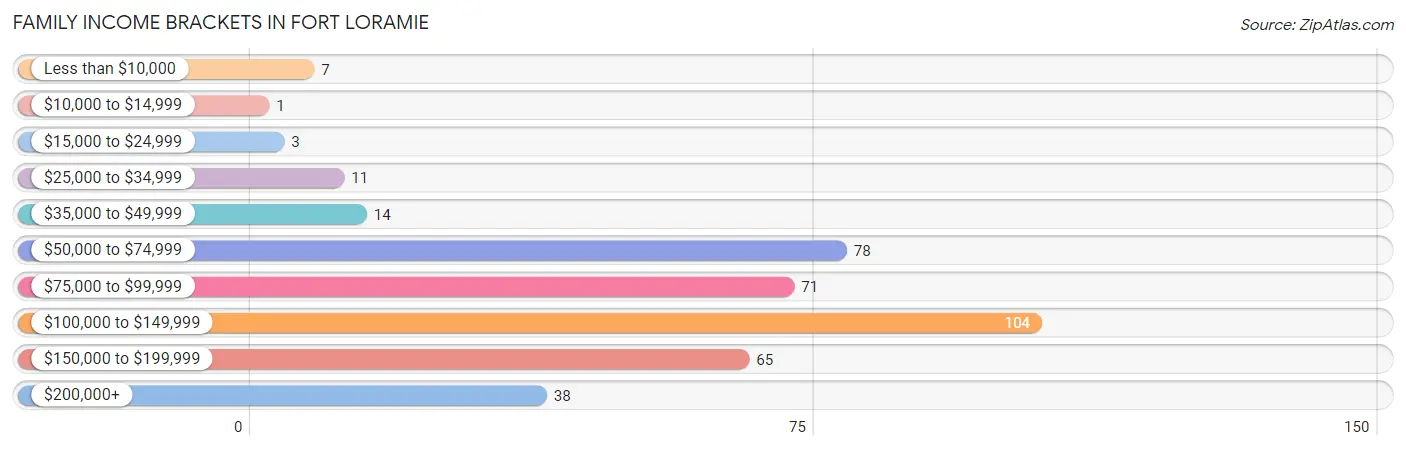
| Income Bracket | # Families | % Families |
| Less than $10,000 | 7 | 1.8% |
| $10,000 to $14,999 | 1 | 0.3% |
| $15,000 to $24,999 | 3 | 0.8% |
| $25,000 to $34,999 | 11 | 2.8% |
| $35,000 to $49,999 | 14 | 3.6% |
| $50,000 to $74,999 | 78 | 19.9% |
| $75,000 to $99,999 | 71 | 18.1% |
| $100,000 to $149,999 | 104 | 26.5% |
| $150,000 to $199,999 | 65 | 16.6% |
| $200,000+ | 38 | 9.7% |
Family Income by Famaliy Size in Fort Loramie
7+ person families (9 | 2.3%) account for the highest median family income in Fort Loramie with $154,063 per family, while 2-person families (167 | 42.6%) have the highest median income of $40,375 per family member.
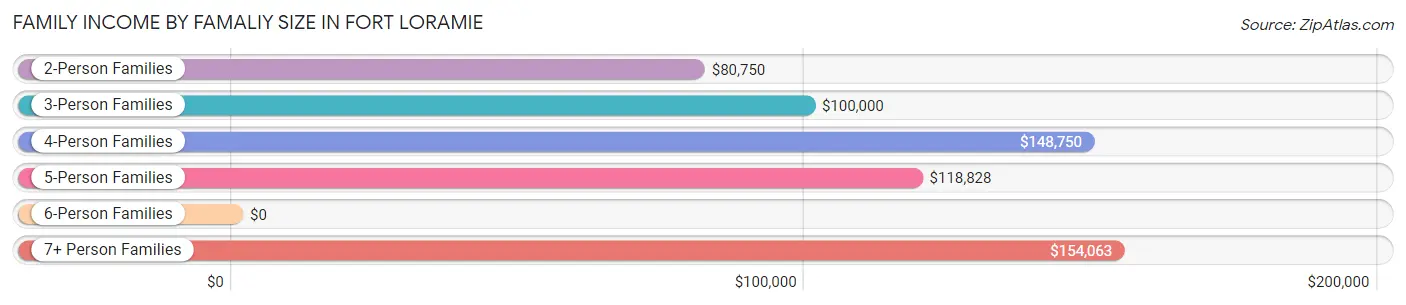
| Income Bracket | # Families | Median Income |
| 2-Person Families | 167 (42.6%) | $80,750 |
| 3-Person Families | 42 (10.7%) | $100,000 |
| 4-Person Families | 63 (16.1%) | $148,750 |
| 5-Person Families | 105 (26.8%) | $118,828 |
| 6-Person Families | 6 (1.5%) | $0 |
| 7+ Person Families | 9 (2.3%) | $154,063 |
| Total | 392 (100.0%) | $106,389 |
Family Income by Number of Earners in Fort Loramie
The median family income in Fort Loramie is $106,389, with families comprising 3+ earners (64) having the highest median family income of $154,167, while families with 1 earner (81) have the lowest median family income of $61,736, accounting for 16.3% and 20.7% of families, respectively.
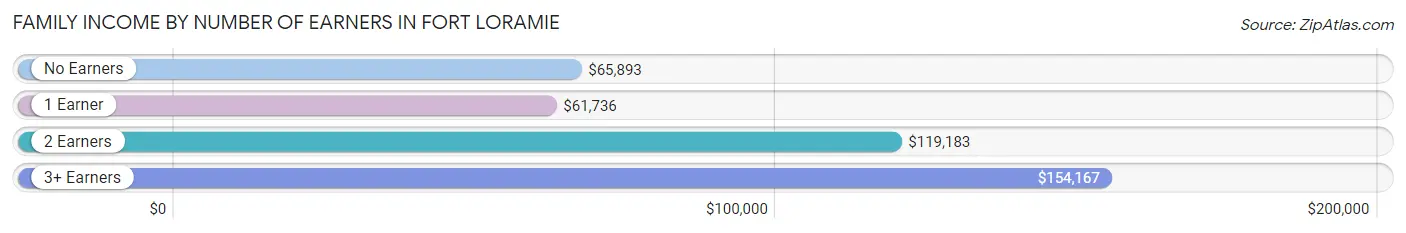
| Number of Earners | # Families | Median Income |
| No Earners | 52 (13.3%) | $65,893 |
| 1 Earner | 81 (20.7%) | $61,736 |
| 2 Earners | 195 (49.7%) | $119,183 |
| 3+ Earners | 64 (16.3%) | $154,167 |
| Total | 392 (100.0%) | $106,389 |
Household Income in Fort Loramie
Household Income Brackets in Fort Loramie
With 141 households falling in the category, the $50,000 to $74,999 income range is the most frequent in Fort Loramie, accounting for 24.0% of all households. In contrast, only 4 households (0.7%) fall into the $10,000 to $14,999 income bracket, making it the least populous group.
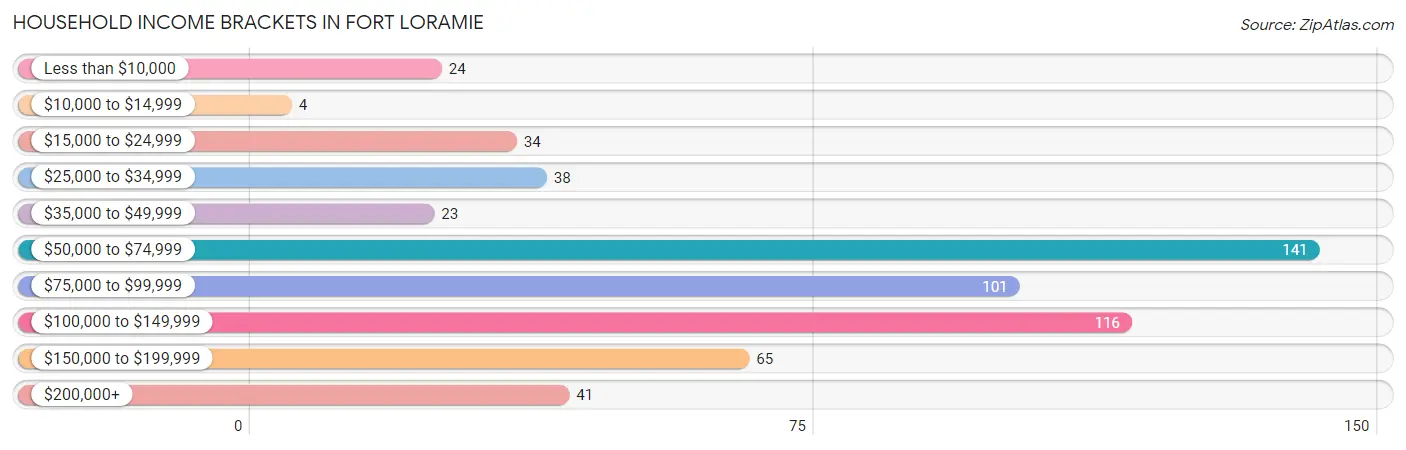
| Income Bracket | # Households | % Households |
| Less than $10,000 | 24 | 4.1% |
| $10,000 to $14,999 | 4 | 0.7% |
| $15,000 to $24,999 | 34 | 5.8% |
| $25,000 to $34,999 | 38 | 6.5% |
| $35,000 to $49,999 | 23 | 3.9% |
| $50,000 to $74,999 | 141 | 24.0% |
| $75,000 to $99,999 | 101 | 17.2% |
| $100,000 to $149,999 | 116 | 19.8% |
| $150,000 to $199,999 | 65 | 11.1% |
| $200,000+ | 41 | 7.0% |
Household Income by Householder Age in Fort Loramie
The median household income in Fort Loramie is $82,917, with the highest median household income of $120,000 found in the 45 to 64 years age bracket for the primary householder. A total of 168 households (28.6%) fall into this category. Meanwhile, the 15 to 24 years age bracket for the primary householder has the lowest median household income of $0, with 5 households (0.9%) in this group.
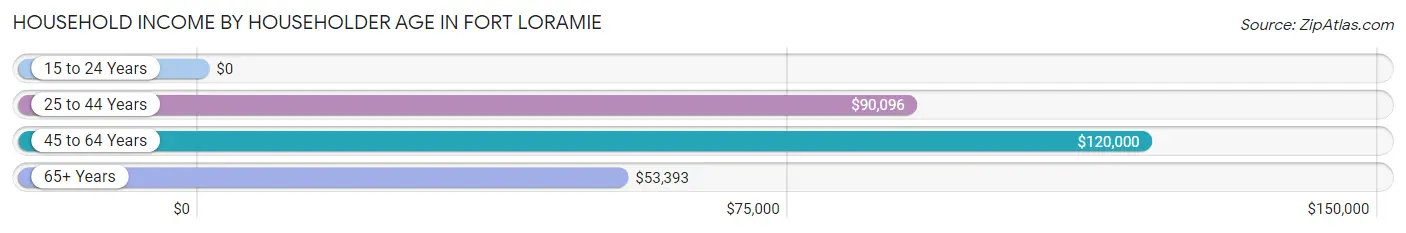
| Income Bracket | # Households | Median Income |
| 15 to 24 Years | 5 (0.9%) | $0 |
| 25 to 44 Years | 237 (40.4%) | $90,096 |
| 45 to 64 Years | 168 (28.6%) | $120,000 |
| 65+ Years | 177 (30.1%) | $53,393 |
| Total | 587 (100.0%) | $82,917 |
Poverty in Fort Loramie
Income Below Poverty by Sex and Age in Fort Loramie
With 2.7% poverty level for males and 4.2% for females among the residents of Fort Loramie, 65 to 74 year old males and 75 year old and over females are the most vulnerable to poverty, with 10 males (12.7%) and 12 females (15.4%) in their respective age groups living below the poverty level.
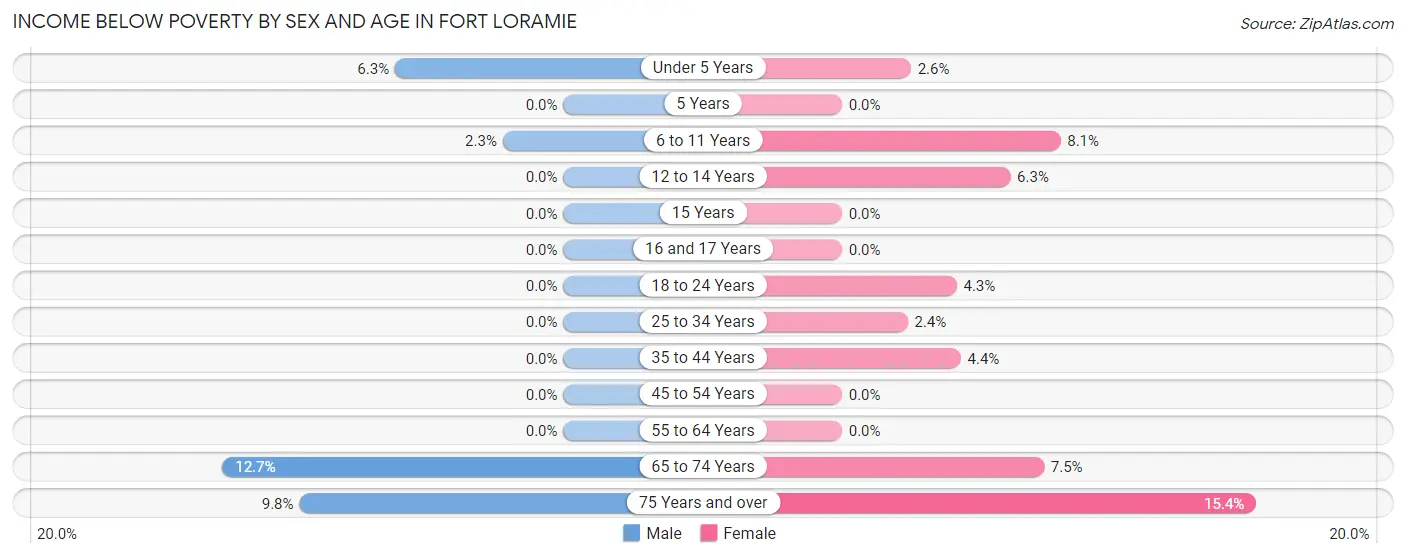
| Age Bracket | Male | Female |
| Under 5 Years | 4 (6.2%) | 2 (2.6%) |
| 5 Years | 0 (0.0%) | 0 (0.0%) |
| 6 to 11 Years | 2 (2.2%) | 3 (8.1%) |
| 12 to 14 Years | 0 (0.0%) | 2 (6.2%) |
| 15 Years | 0 (0.0%) | 0 (0.0%) |
| 16 and 17 Years | 0 (0.0%) | 0 (0.0%) |
| 18 to 24 Years | 0 (0.0%) | 2 (4.3%) |
| 25 to 34 Years | 0 (0.0%) | 3 (2.4%) |
| 35 to 44 Years | 0 (0.0%) | 3 (4.4%) |
| 45 to 54 Years | 0 (0.0%) | 0 (0.0%) |
| 55 to 64 Years | 0 (0.0%) | 0 (0.0%) |
| 65 to 74 Years | 10 (12.7%) | 3 (7.5%) |
| 75 Years and over | 5 (9.8%) | 12 (15.4%) |
| Total | 21 (2.7%) | 30 (4.2%) |
Income Above Poverty by Sex and Age in Fort Loramie
According to the poverty statistics in Fort Loramie, males aged 5 years and females aged 5 years are the age groups that are most secure financially, with 100.0% of males and 100.0% of females in these age groups living above the poverty line.
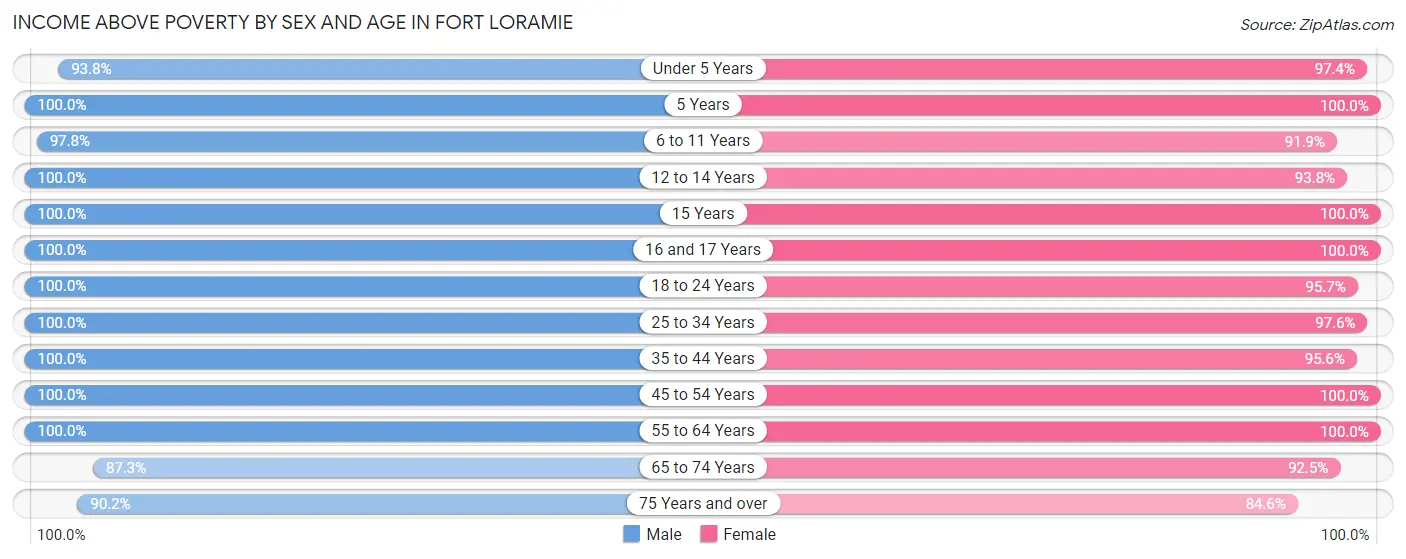
| Age Bracket | Male | Female |
| Under 5 Years | 60 (93.8%) | 76 (97.4%) |
| 5 Years | 14 (100.0%) | 24 (100.0%) |
| 6 to 11 Years | 87 (97.8%) | 34 (91.9%) |
| 12 to 14 Years | 13 (100.0%) | 30 (93.8%) |
| 15 Years | 10 (100.0%) | 26 (100.0%) |
| 16 and 17 Years | 14 (100.0%) | 23 (100.0%) |
| 18 to 24 Years | 62 (100.0%) | 45 (95.7%) |
| 25 to 34 Years | 132 (100.0%) | 120 (97.6%) |
| 35 to 44 Years | 87 (100.0%) | 65 (95.6%) |
| 45 to 54 Years | 87 (100.0%) | 78 (100.0%) |
| 55 to 64 Years | 75 (100.0%) | 63 (100.0%) |
| 65 to 74 Years | 69 (87.3%) | 37 (92.5%) |
| 75 Years and over | 46 (90.2%) | 66 (84.6%) |
| Total | 756 (97.3%) | 687 (95.8%) |
Income Below Poverty Among Married-Couple Families in Fort Loramie
The poverty statistics for married-couple families in Fort Loramie show that 1.5% or 5 of the total 338 families live below the poverty line. Families with no children have the highest poverty rate of 3.0%, comprising of 5 families. On the other hand, families with 1 or 2 children have the lowest poverty rate of 0.0%, which includes 0 families.
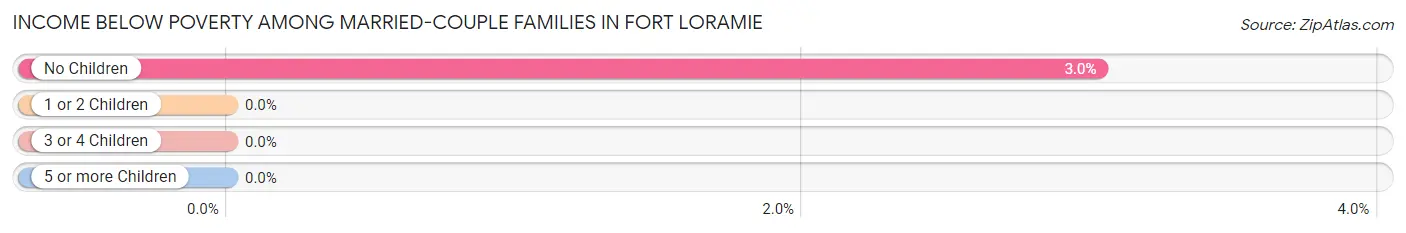
| Children | Above Poverty | Below Poverty |
| No Children | 160 (97.0%) | 5 (3.0%) |
| 1 or 2 Children | 84 (100.0%) | 0 (0.0%) |
| 3 or 4 Children | 83 (100.0%) | 0 (0.0%) |
| 5 or more Children | 6 (100.0%) | 0 (0.0%) |
| Total | 333 (98.5%) | 5 (1.5%) |
Income Below Poverty Among Single-Parent Households in Fort Loramie
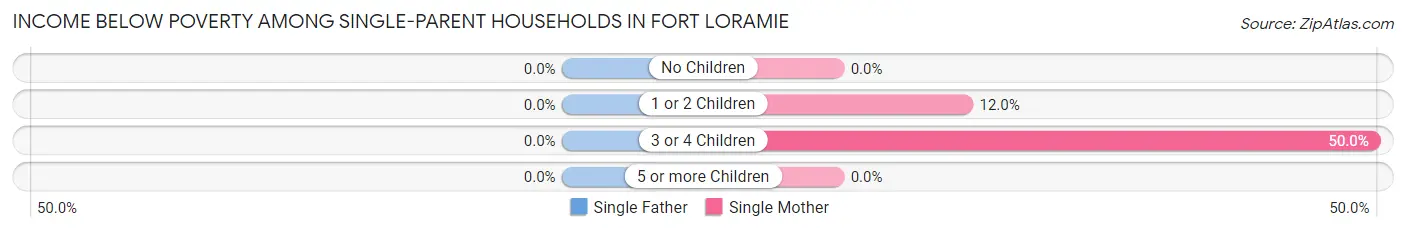
| Children | Single Father | Single Mother |
| No Children | 0 (0.0%) | 0 (0.0%) |
| 1 or 2 Children | 0 (0.0%) | 3 (12.0%) |
| 3 or 4 Children | 0 (0.0%) | 3 (50.0%) |
| 5 or more Children | 0 (0.0%) | 0 (0.0%) |
| Total | 0 (0.0%) | 6 (14.0%) |
Income Below Poverty Among Married-Couple vs Single-Parent Households in Fort Loramie
The poverty data for Fort Loramie shows that 5 of the married-couple family households (1.5%) and 6 of the single-parent households (11.1%) are living below the poverty level. Within the married-couple family households, those with no children have the highest poverty rate, with 5 households (3.0%) falling below the poverty line. Among the single-parent households, those with 3 or 4 children have the highest poverty rate, with 3 household (50.0%) living below poverty.
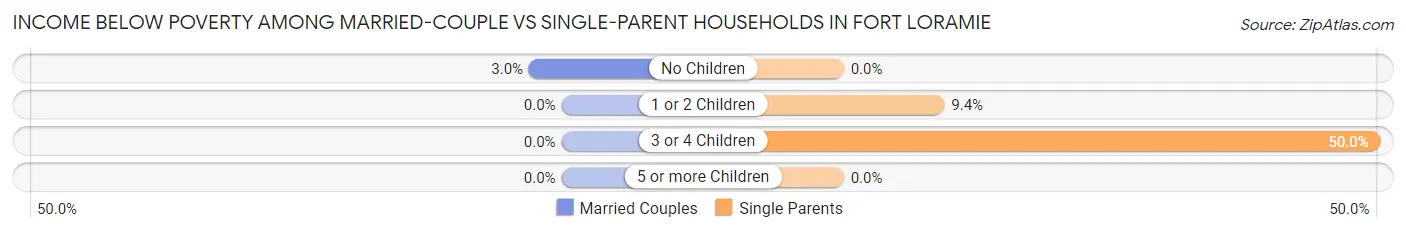
| Children | Married-Couple Families | Single-Parent Households |
| No Children | 5 (3.0%) | 0 (0.0%) |
| 1 or 2 Children | 0 (0.0%) | 3 (9.4%) |
| 3 or 4 Children | 0 (0.0%) | 3 (50.0%) |
| 5 or more Children | 0 (0.0%) | 0 (0.0%) |
| Total | 5 (1.5%) | 6 (11.1%) |
Race in Fort Loramie
The most populous races in Fort Loramie are White / Caucasian (1,481 | 99.1%), Two or more Races (13 | 0.9%), and Hispanic or Latino (3 | 0.2%).
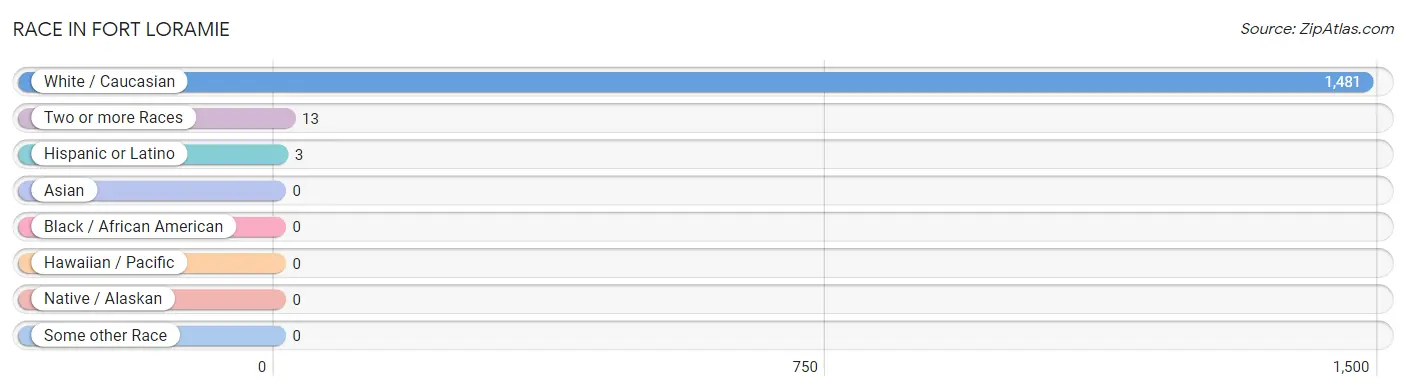
| Race | # Population | % Population |
| Asian | 0 | 0.0% |
| Black / African American | 0 | 0.0% |
| Hawaiian / Pacific | 0 | 0.0% |
| Hispanic or Latino | 3 | 0.2% |
| Native / Alaskan | 0 | 0.0% |
| White / Caucasian | 1,481 | 99.1% |
| Two or more Races | 13 | 0.9% |
| Some other Race | 0 | 0.0% |
| Total | 1,494 | 100.0% |
Ancestry in Fort Loramie
The most populous ancestries reported in Fort Loramie are German (905 | 60.6%), French (127 | 8.5%), American (91 | 6.1%), Irish (78 | 5.2%), and Italian (52 | 3.5%), together accounting for 83.9% of all Fort Loramie residents.
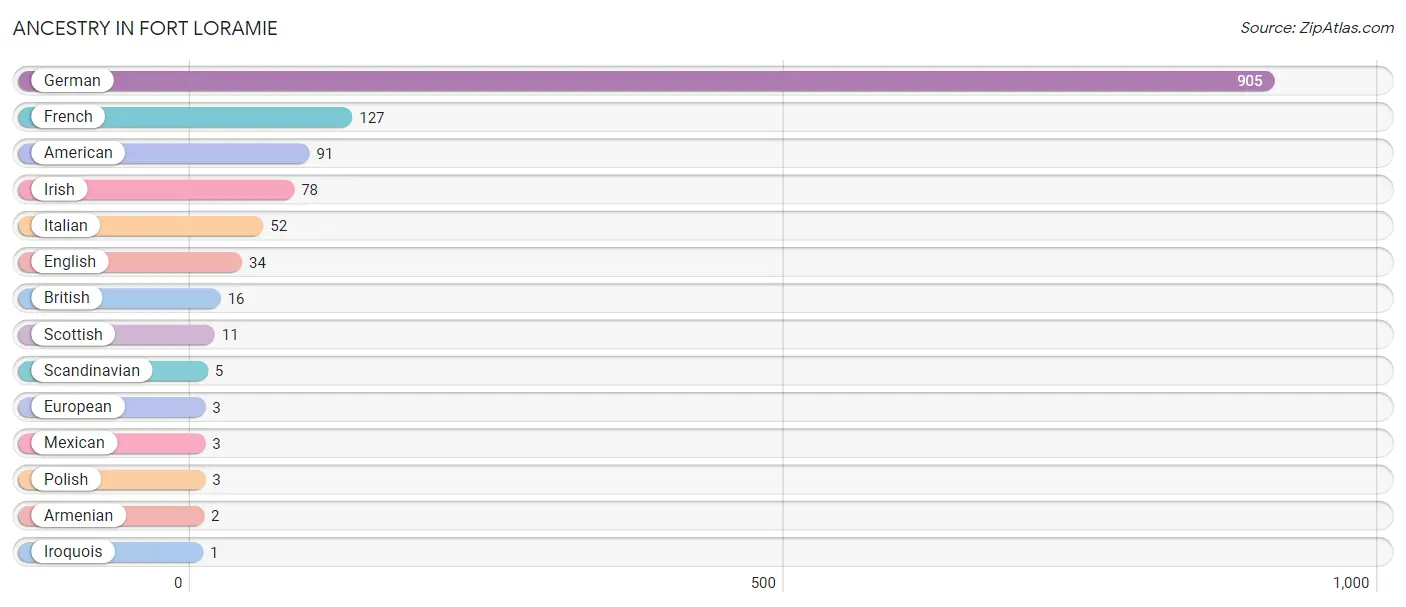
| Ancestry | # Population | % Population |
| American | 91 | 6.1% |
| Armenian | 2 | 0.1% |
| British | 16 | 1.1% |
| English | 34 | 2.3% |
| European | 3 | 0.2% |
| French | 127 | 8.5% |
| German | 905 | 60.6% |
| Irish | 78 | 5.2% |
| Iroquois | 1 | 0.1% |
| Italian | 52 | 3.5% |
| Mexican | 3 | 0.2% |
| Polish | 3 | 0.2% |
| Scandinavian | 5 | 0.3% |
| Scottish | 11 | 0.7% | View All 14 Rows |
Immigrants in Fort Loramie

| Immigration Origin | # Population | % Population | View All 0 Rows |
Sex and Age in Fort Loramie
Sex and Age in Fort Loramie
The most populous age groups in Fort Loramie are 5 to 9 Years (73 | 9.4%) for men and Under 5 Years (78 | 10.9%) for women.
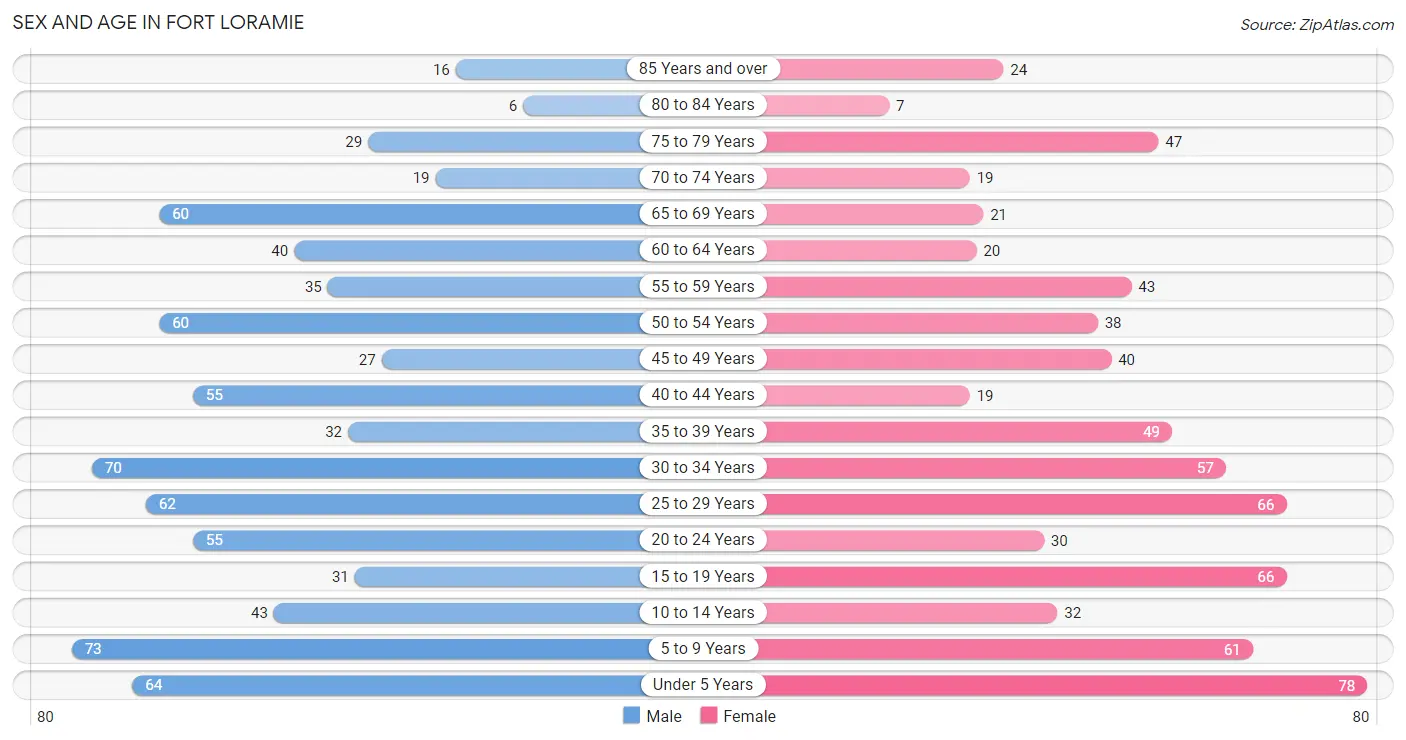
| Age Bracket | Male | Female |
| Under 5 Years | 64 (8.2%) | 78 (10.9%) |
| 5 to 9 Years | 73 (9.4%) | 61 (8.5%) |
| 10 to 14 Years | 43 (5.5%) | 32 (4.5%) |
| 15 to 19 Years | 31 (4.0%) | 66 (9.2%) |
| 20 to 24 Years | 55 (7.1%) | 30 (4.2%) |
| 25 to 29 Years | 62 (8.0%) | 66 (9.2%) |
| 30 to 34 Years | 70 (9.0%) | 57 (8.0%) |
| 35 to 39 Years | 32 (4.1%) | 49 (6.8%) |
| 40 to 44 Years | 55 (7.1%) | 19 (2.6%) |
| 45 to 49 Years | 27 (3.5%) | 40 (5.6%) |
| 50 to 54 Years | 60 (7.7%) | 38 (5.3%) |
| 55 to 59 Years | 35 (4.5%) | 43 (6.0%) |
| 60 to 64 Years | 40 (5.1%) | 20 (2.8%) |
| 65 to 69 Years | 60 (7.7%) | 21 (2.9%) |
| 70 to 74 Years | 19 (2.5%) | 19 (2.6%) |
| 75 to 79 Years | 29 (3.7%) | 47 (6.6%) |
| 80 to 84 Years | 6 (0.8%) | 7 (1.0%) |
| 85 Years and over | 16 (2.1%) | 24 (3.4%) |
| Total | 777 (100.0%) | 717 (100.0%) |
Families and Households in Fort Loramie
Median Family Size in Fort Loramie
The median family size in Fort Loramie is 3.28 persons per family, with married-couple families (338 | 86.2%) accounting for the largest median family size of 3.39 persons per family. On the other hand, single female/mother families (43 | 11.0%) represent the smallest median family size with 2.49 persons per family.
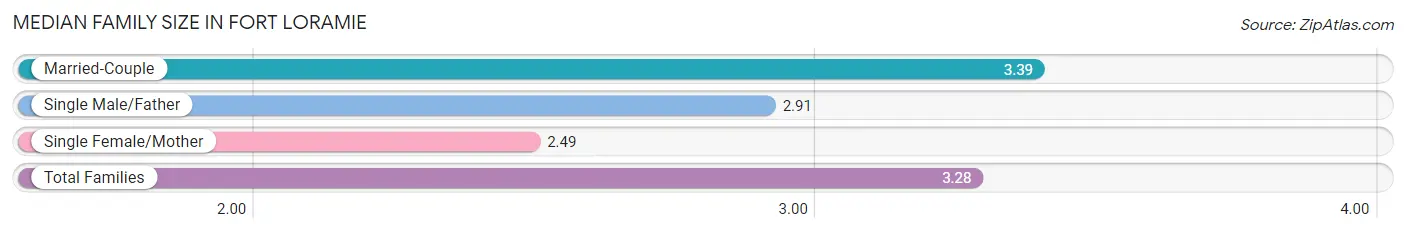
| Family Type | # Families | Family Size |
| Married-Couple | 338 (86.2%) | 3.39 |
| Single Male/Father | 11 (2.8%) | 2.91 |
| Single Female/Mother | 43 (11.0%) | 2.49 |
| Total Families | 392 (100.0%) | 3.28 |
Median Household Size in Fort Loramie
The median household size in Fort Loramie is 2.55 persons per household, with married-couple households (338 | 57.6%) accounting for the largest median household size of 3.39 persons per household. non-family households (195 | 33.2%) represent the smallest median household size with 1.05 persons per household.
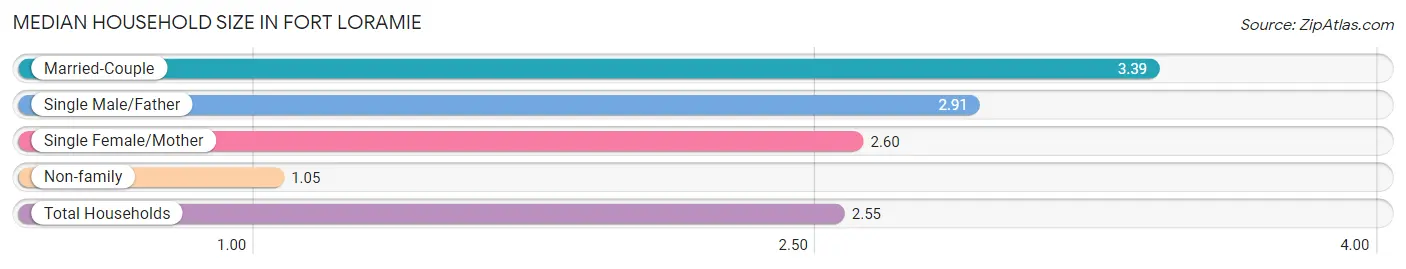
| Household Type | # Households | Household Size |
| Married-Couple | 338 (57.6%) | 3.39 |
| Single Male/Father | 11 (1.9%) | 2.91 |
| Single Female/Mother | 43 (7.3%) | 2.60 |
| Non-family | 195 (33.2%) | 1.05 |
| Total Households | 587 (100.0%) | 2.55 |
Household Size by Marriage Status in Fort Loramie
Out of a total of 587 households in Fort Loramie, 392 (66.8%) are family households, while 195 (33.2%) are nonfamily households. The most numerous type of family households are 2-person households, comprising 167, and the most common type of nonfamily households are 1-person households, comprising 185.
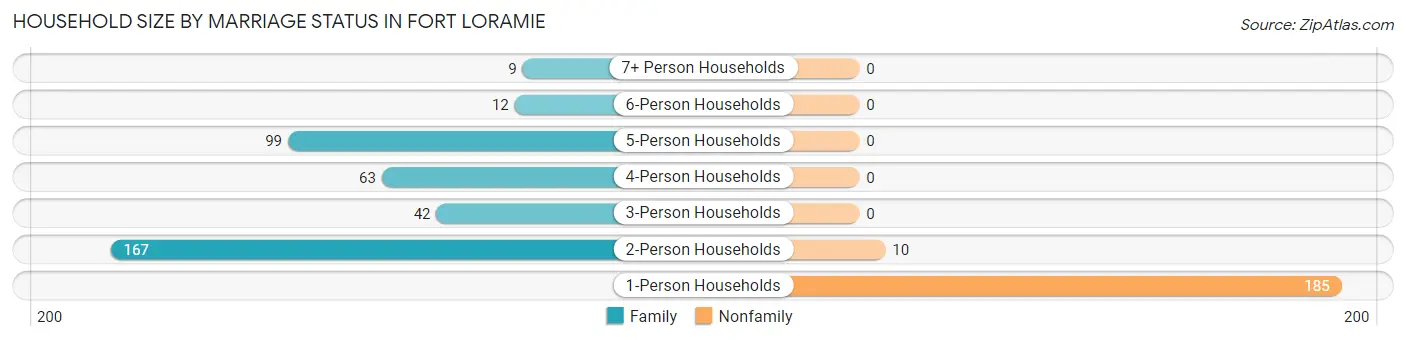
| Household Size | Family Households | Nonfamily Households |
| 1-Person Households | - | 185 (31.5%) |
| 2-Person Households | 167 (28.4%) | 10 (1.7%) |
| 3-Person Households | 42 (7.2%) | 0 (0.0%) |
| 4-Person Households | 63 (10.7%) | 0 (0.0%) |
| 5-Person Households | 99 (16.9%) | 0 (0.0%) |
| 6-Person Households | 12 (2.0%) | 0 (0.0%) |
| 7+ Person Households | 9 (1.5%) | 0 (0.0%) |
| Total | 392 (66.8%) | 195 (33.2%) |
Female Fertility in Fort Loramie
Fertility by Age in Fort Loramie
Average fertility rate in Fort Loramie is 18.0 births per 1,000 women. Women in the age bracket of 20 to 34 years have the highest fertility rate with 39.0 births per 1,000 women. Women in the age bracket of 20 to 34 years acount for 100.0% of all women with births.
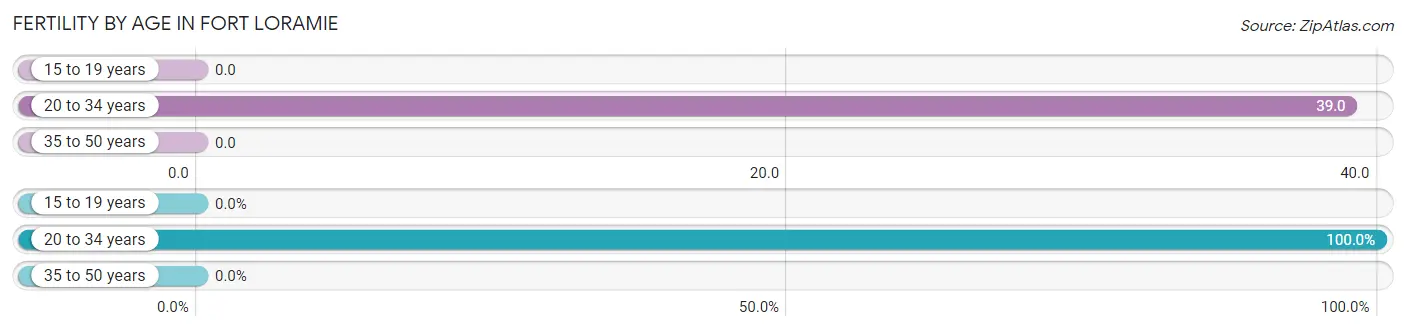
| Age Bracket | Women with Births | Births / 1,000 Women |
| 15 to 19 years | 0 (0.0%) | 0.0 |
| 20 to 34 years | 6 (100.0%) | 39.0 |
| 35 to 50 years | 0 (0.0%) | 0.0 |
| Total | 6 (100.0%) | 18.0 |
Fertility by Age by Marriage Status in Fort Loramie
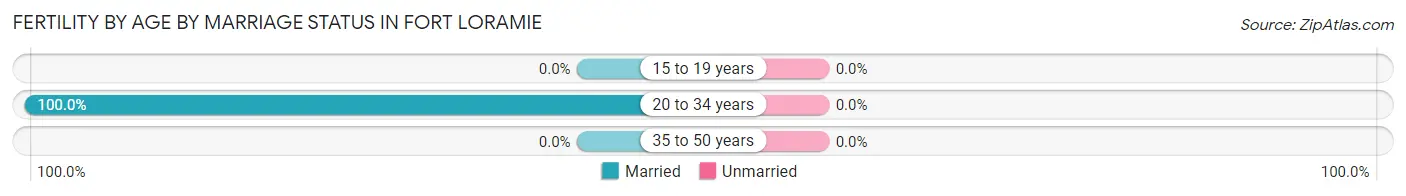
| Age Bracket | Married | Unmarried |
| 15 to 19 years | 0 (0.0%) | 0 (0.0%) |
| 20 to 34 years | 6 (100.0%) | 0 (0.0%) |
| 35 to 50 years | 0 (0.0%) | 0 (0.0%) |
| Total | 6 (100.0%) | 0 (0.0%) |
Fertility by Education in Fort Loramie
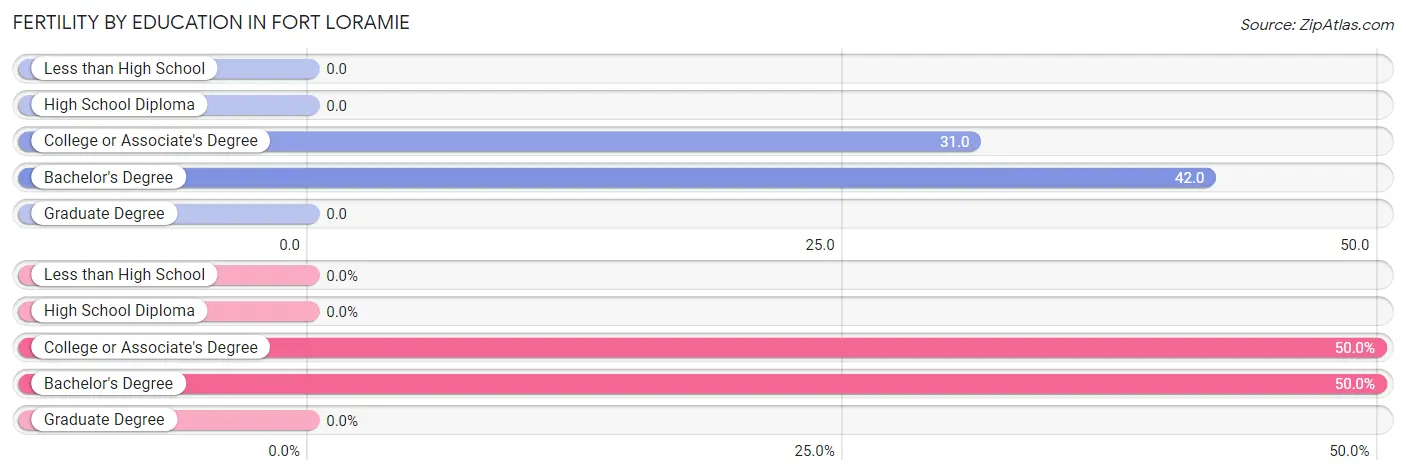
| Educational Attainment | Women with Births | Births / 1,000 Women |
| Less than High School | 0 (0.0%) | 0.0 |
| High School Diploma | 0 (0.0%) | 0.0 |
| College or Associate's Degree | 3 (50.0%) | 31.0 |
| Bachelor's Degree | 3 (50.0%) | 42.0 |
| Graduate Degree | 0 (0.0%) | 0.0 |
| Total | 6 (100.0%) | 18.0 |
Fertility by Education by Marriage Status in Fort Loramie
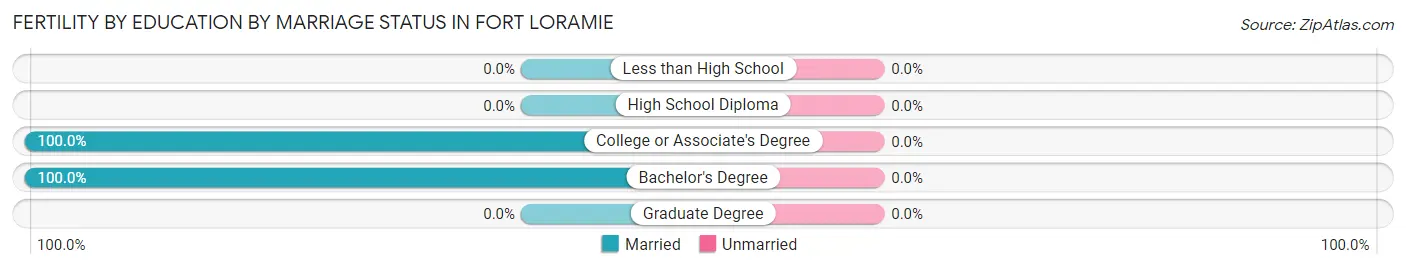
| Educational Attainment | Married | Unmarried |
| Less than High School | 0 (0.0%) | 0 (0.0%) |
| High School Diploma | 0 (0.0%) | 0 (0.0%) |
| College or Associate's Degree | 3 (100.0%) | 0 (0.0%) |
| Bachelor's Degree | 3 (100.0%) | 0 (0.0%) |
| Graduate Degree | 0 (0.0%) | 0 (0.0%) |
| Total | 6 (100.0%) | 0 (0.0%) |
Employment Characteristics in Fort Loramie
Employment by Class of Employer in Fort Loramie
Among the 788 employed individuals in Fort Loramie, private company employees (591 | 75.0%), local government employees (103 | 13.1%), and not-for-profit organizations (37 | 4.7%) make up the most common classes of employment.
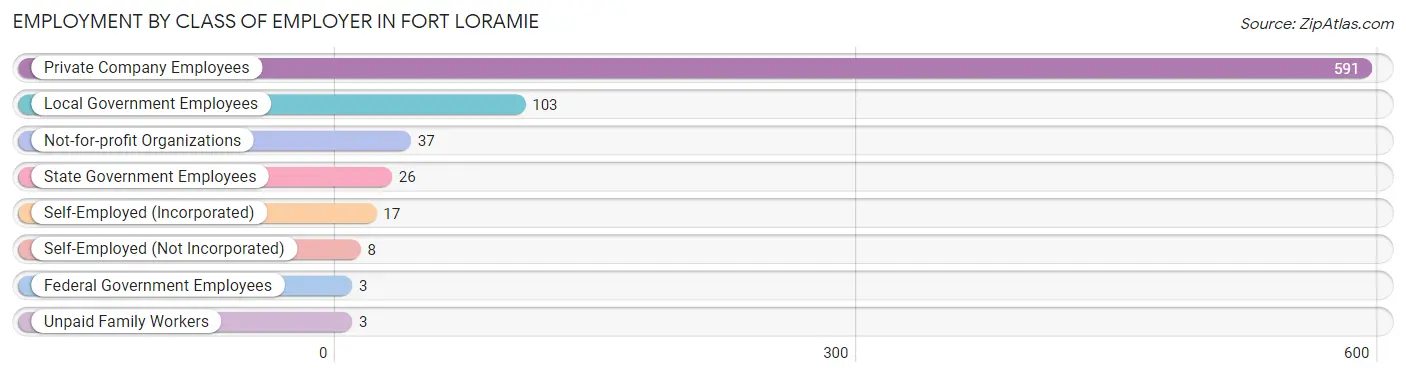
| Employer Class | # Employees | % Employees |
| Private Company Employees | 591 | 75.0% |
| Self-Employed (Incorporated) | 17 | 2.2% |
| Self-Employed (Not Incorporated) | 8 | 1.0% |
| Not-for-profit Organizations | 37 | 4.7% |
| Local Government Employees | 103 | 13.1% |
| State Government Employees | 26 | 3.3% |
| Federal Government Employees | 3 | 0.4% |
| Unpaid Family Workers | 3 | 0.4% |
| Total | 788 | 100.0% |
Employment Status by Age in Fort Loramie
According to the labor force statistics for Fort Loramie, out of the total population over 16 years of age (1,107), 72.5% or 803 individuals are in the labor force, with 1.2% or 10 of them unemployed. The age group with the highest labor force participation rate is 30 to 34 years, with 100.0% or 127 individuals in the labor force. Within the labor force, the 16 to 19 years age range has the highest percentage of unemployed individuals, with 21.4% or 6 of them being unemployed.
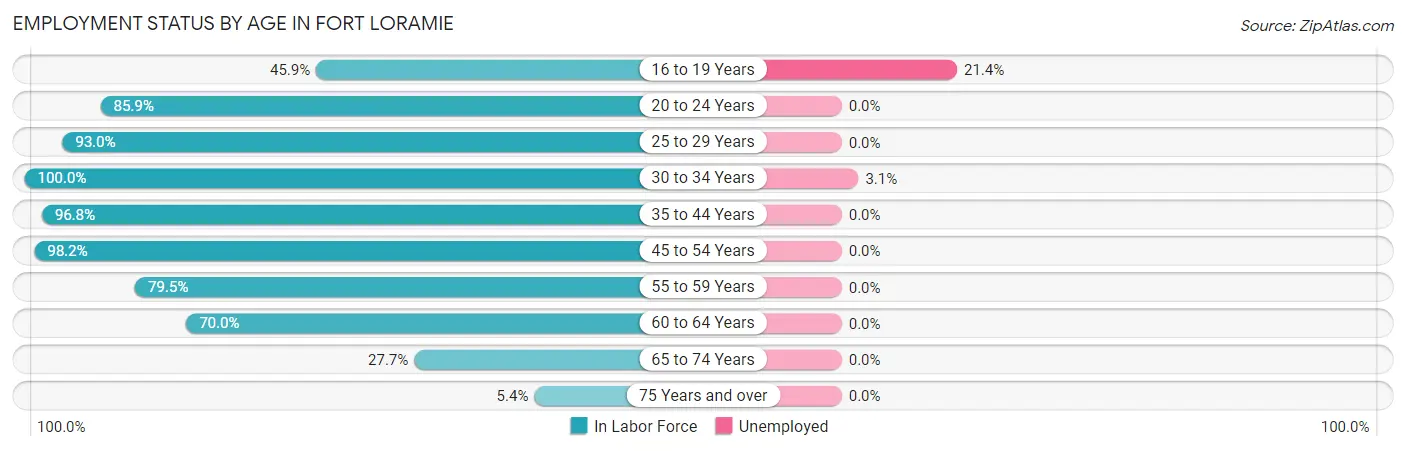
| Age Bracket | In Labor Force | Unemployed |
| 16 to 19 Years | 28 (45.9%) | 6 (21.4%) |
| 20 to 24 Years | 73 (85.9%) | 0 (0.0%) |
| 25 to 29 Years | 119 (93.0%) | 0 (0.0%) |
| 30 to 34 Years | 127 (100.0%) | 4 (3.1%) |
| 35 to 44 Years | 150 (96.8%) | 0 (0.0%) |
| 45 to 54 Years | 162 (98.2%) | 0 (0.0%) |
| 55 to 59 Years | 62 (79.5%) | 0 (0.0%) |
| 60 to 64 Years | 42 (70.0%) | 0 (0.0%) |
| 65 to 74 Years | 33 (27.7%) | 0 (0.0%) |
| 75 Years and over | 7 (5.4%) | 0 (0.0%) |
| Total | 803 (72.5%) | 10 (1.2%) |
Employment Status by Educational Attainment in Fort Loramie
According to labor force statistics for Fort Loramie, 92.8% of individuals (662) out of the total population between 25 and 64 years of age (713) are in the labor force, with 0.6% or 4 of them being unemployed. The group with the highest labor force participation rate are those with the educational attainment of less than high school, with 100.0% or 3 individuals in the labor force. Within the labor force, individuals with bachelor's degree or higher education have the highest percentage of unemployment, with 1.6% or 4 of them being unemployed.
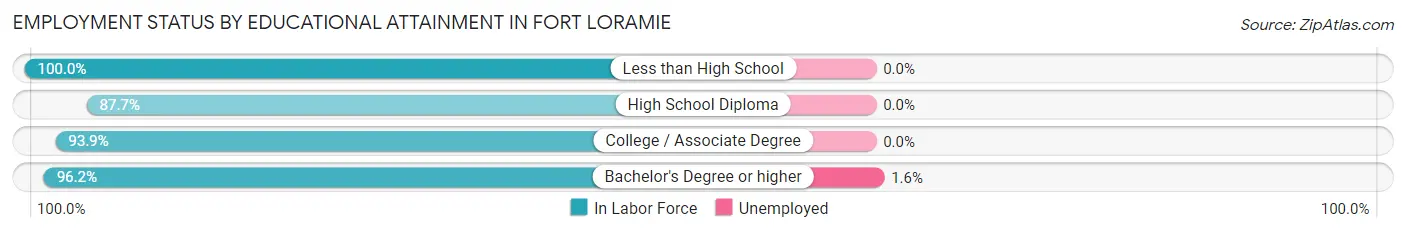
| Educational Attainment | In Labor Force | Unemployed |
| Less than High School | 3 (100.0%) | 0 (0.0%) |
| High School Diploma | 192 (87.7%) | 0 (0.0%) |
| College / Associate Degree | 217 (93.9%) | 0 (0.0%) |
| Bachelor's Degree or higher | 250 (96.2%) | 4 (1.6%) |
| Total | 662 (92.8%) | 4 (0.6%) |
Employment Occupations by Sex in Fort Loramie
Management, Business, Science and Arts Occupations
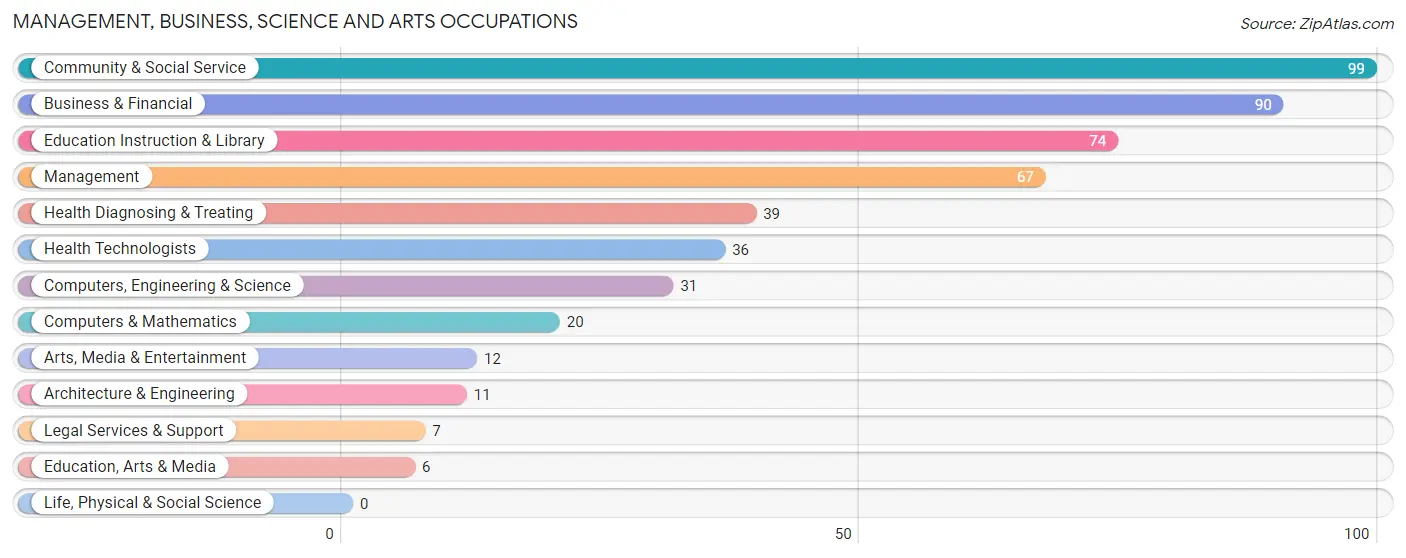
The most common Management, Business, Science and Arts occupations in Fort Loramie are Community & Social Service (99 | 12.5%), Business & Financial (90 | 11.4%), Education Instruction & Library (74 | 9.3%), Management (67 | 8.5%), and Health Diagnosing & Treating (39 | 4.9%).
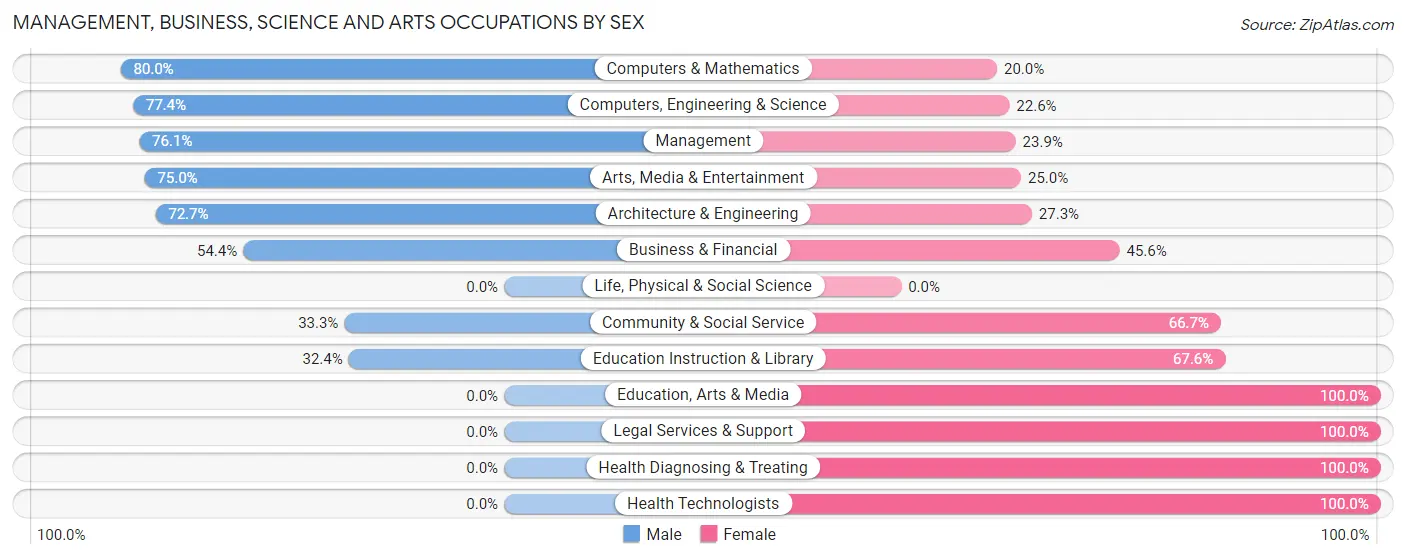
Management, Business, Science and Arts Occupations by Sex
Within the Management, Business, Science and Arts occupations in Fort Loramie, the most male-oriented occupations are Computers & Mathematics (80.0%), Computers, Engineering & Science (77.4%), and Management (76.1%), while the most female-oriented occupations are Education, Arts & Media (100.0%), Legal Services & Support (100.0%), and Health Diagnosing & Treating (100.0%).
| Occupation | Male | Female |
| Management | 51 (76.1%) | 16 (23.9%) |
| Business & Financial | 49 (54.4%) | 41 (45.6%) |
| Computers, Engineering & Science | 24 (77.4%) | 7 (22.6%) |
| Computers & Mathematics | 16 (80.0%) | 4 (20.0%) |
| Architecture & Engineering | 8 (72.7%) | 3 (27.3%) |
| Life, Physical & Social Science | 0 (0.0%) | 0 (0.0%) |
| Community & Social Service | 33 (33.3%) | 66 (66.7%) |
| Education, Arts & Media | 0 (0.0%) | 6 (100.0%) |
| Legal Services & Support | 0 (0.0%) | 7 (100.0%) |
| Education Instruction & Library | 24 (32.4%) | 50 (67.6%) |
| Arts, Media & Entertainment | 9 (75.0%) | 3 (25.0%) |
| Health Diagnosing & Treating | 0 (0.0%) | 39 (100.0%) |
| Health Technologists | 0 (0.0%) | 36 (100.0%) |
| Total (Category) | 157 (48.2%) | 169 (51.8%) |
| Total (Overall) | 452 (57.0%) | 341 (43.0%) |
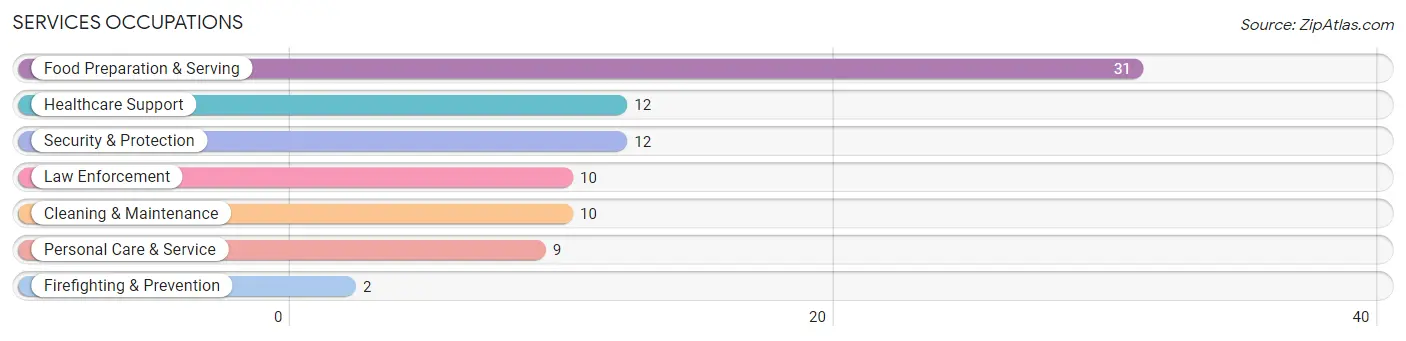
Services Occupations
The most common Services occupations in Fort Loramie are Food Preparation & Serving (31 | 3.9%), Healthcare Support (12 | 1.5%), Security & Protection (12 | 1.5%), Law Enforcement (10 | 1.3%), and Cleaning & Maintenance (10 | 1.3%).
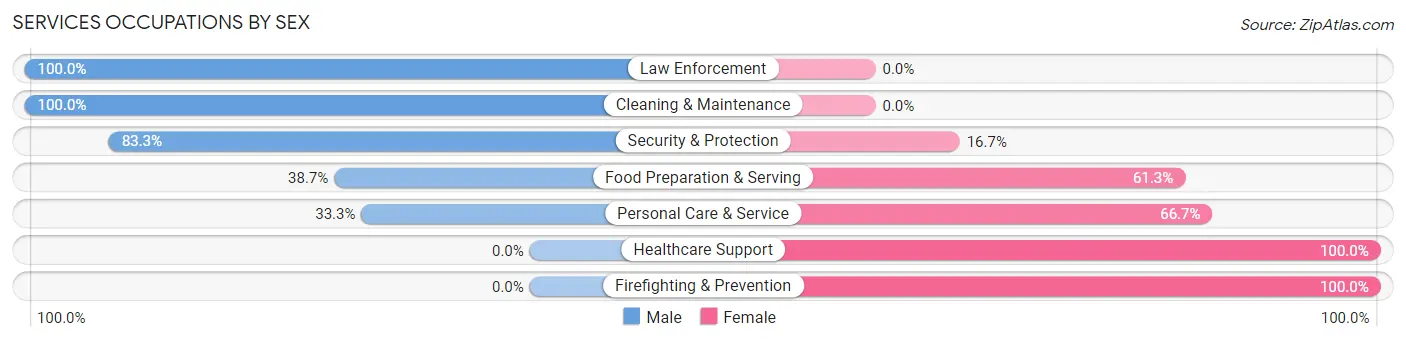
Services Occupations by Sex
Within the Services occupations in Fort Loramie, the most male-oriented occupations are Law Enforcement (100.0%), Cleaning & Maintenance (100.0%), and Security & Protection (83.3%), while the most female-oriented occupations are Healthcare Support (100.0%), Firefighting & Prevention (100.0%), and Personal Care & Service (66.7%).
| Occupation | Male | Female |
| Healthcare Support | 0 (0.0%) | 12 (100.0%) |
| Security & Protection | 10 (83.3%) | 2 (16.7%) |
| Firefighting & Prevention | 0 (0.0%) | 2 (100.0%) |
| Law Enforcement | 10 (100.0%) | 0 (0.0%) |
| Food Preparation & Serving | 12 (38.7%) | 19 (61.3%) |
| Cleaning & Maintenance | 10 (100.0%) | 0 (0.0%) |
| Personal Care & Service | 3 (33.3%) | 6 (66.7%) |
| Total (Category) | 35 (47.3%) | 39 (52.7%) |
| Total (Overall) | 452 (57.0%) | 341 (43.0%) |
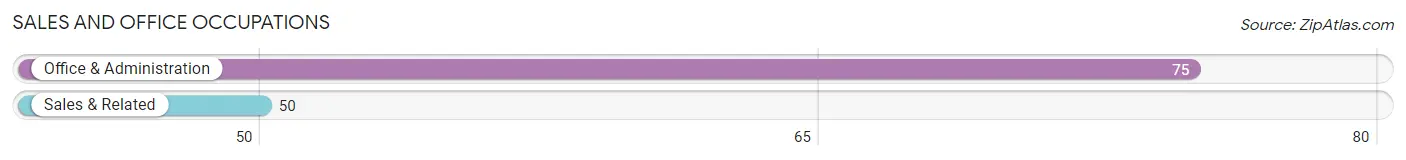
Sales and Office Occupations
The most common Sales and Office occupations in Fort Loramie are Office & Administration (75 | 9.5%), and Sales & Related (50 | 6.3%).
Sales and Office Occupations by Sex
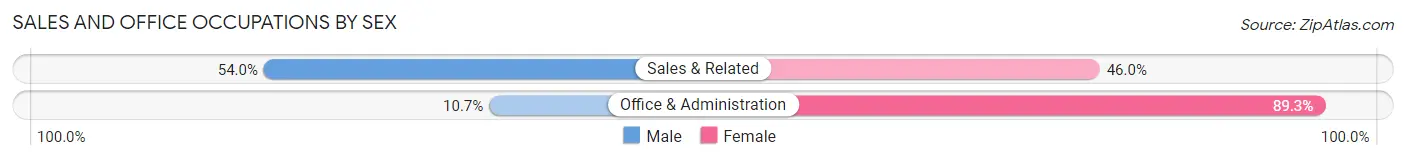
| Occupation | Male | Female |
| Sales & Related | 27 (54.0%) | 23 (46.0%) |
| Office & Administration | 8 (10.7%) | 67 (89.3%) |
| Total (Category) | 35 (28.0%) | 90 (72.0%) |
| Total (Overall) | 452 (57.0%) | 341 (43.0%) |
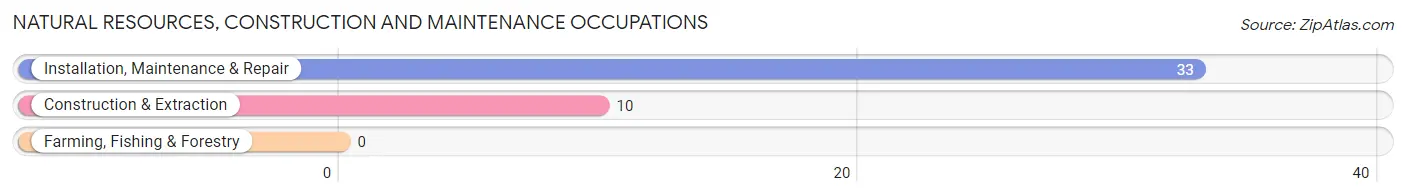
Natural Resources, Construction and Maintenance Occupations
The most common Natural Resources, Construction and Maintenance occupations in Fort Loramie are Installation, Maintenance & Repair (33 | 4.2%), and Construction & Extraction (10 | 1.3%).
Natural Resources, Construction and Maintenance Occupations by Sex
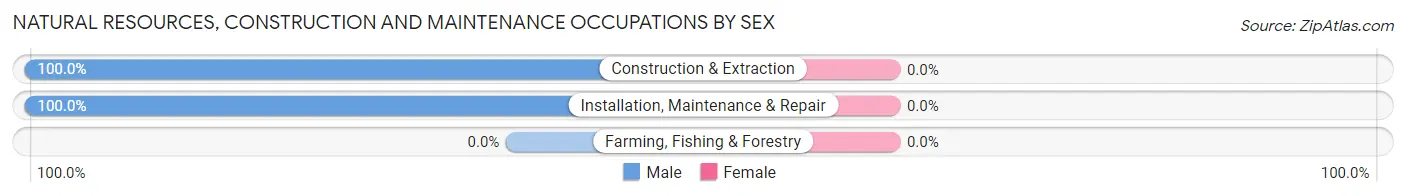
| Occupation | Male | Female |
| Farming, Fishing & Forestry | 0 (0.0%) | 0 (0.0%) |
| Construction & Extraction | 10 (100.0%) | 0 (0.0%) |
| Installation, Maintenance & Repair | 33 (100.0%) | 0 (0.0%) |
| Total (Category) | 43 (100.0%) | 0 (0.0%) |
| Total (Overall) | 452 (57.0%) | 341 (43.0%) |
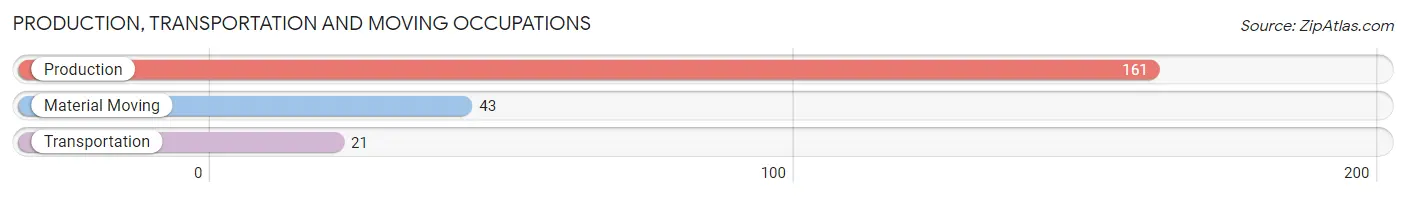
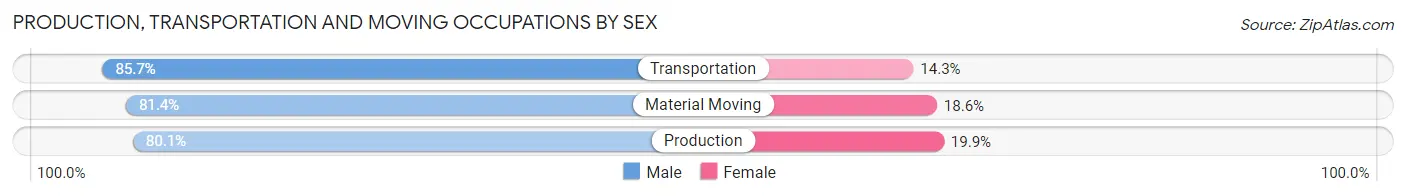
Production, Transportation and Moving Occupations
The most common Production, Transportation and Moving occupations in Fort Loramie are Production (161 | 20.3%), Material Moving (43 | 5.4%), and Transportation (21 | 2.6%).
Production, Transportation and Moving Occupations by Sex
| Occupation | Male | Female |
| Production | 129 (80.1%) | 32 (19.9%) |
| Transportation | 18 (85.7%) | 3 (14.3%) |
| Material Moving | 35 (81.4%) | 8 (18.6%) |
| Total (Category) | 182 (80.9%) | 43 (19.1%) |
| Total (Overall) | 452 (57.0%) | 341 (43.0%) |
Employment Industries by Sex in Fort Loramie
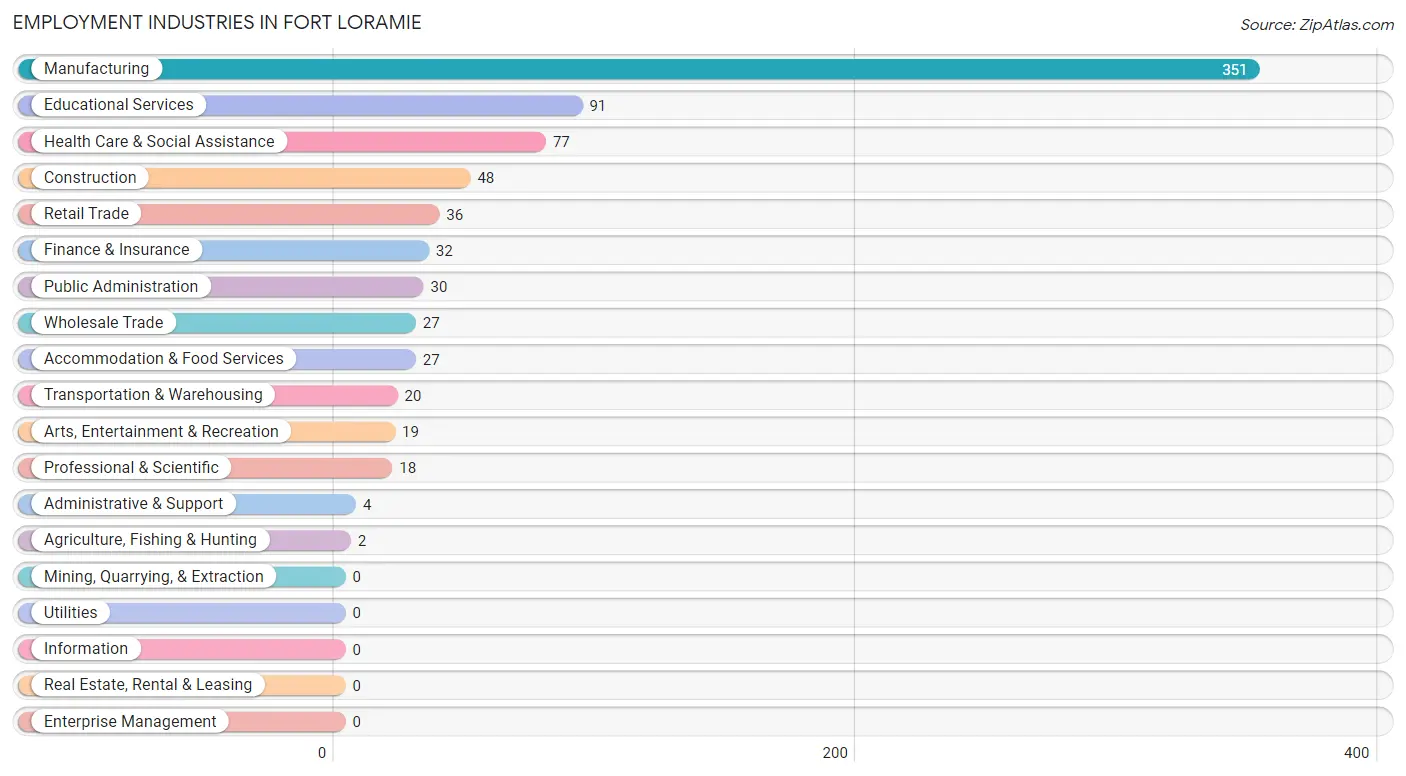
Employment Industries in Fort Loramie
The major employment industries in Fort Loramie include Manufacturing (351 | 44.3%), Educational Services (91 | 11.5%), Health Care & Social Assistance (77 | 9.7%), Construction (48 | 6.0%), and Retail Trade (36 | 4.5%).
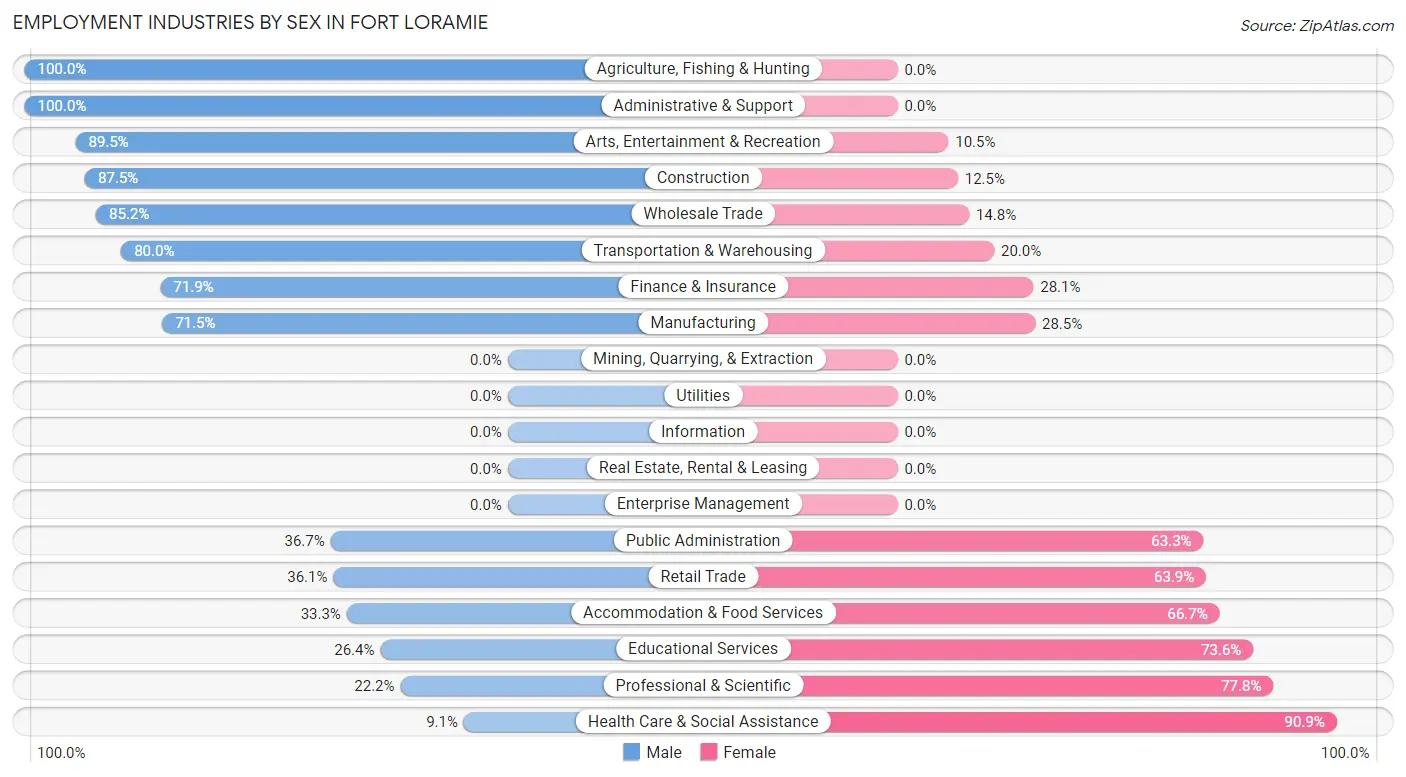
Employment Industries by Sex in Fort Loramie
The Fort Loramie industries that see more men than women are Agriculture, Fishing & Hunting (100.0%), Administrative & Support (100.0%), and Arts, Entertainment & Recreation (89.5%), whereas the industries that tend to have a higher number of women are Health Care & Social Assistance (90.9%), Professional & Scientific (77.8%), and Educational Services (73.6%).
| Industry | Male | Female |
| Agriculture, Fishing & Hunting | 2 (100.0%) | 0 (0.0%) |
| Mining, Quarrying, & Extraction | 0 (0.0%) | 0 (0.0%) |
| Construction | 42 (87.5%) | 6 (12.5%) |
| Manufacturing | 251 (71.5%) | 100 (28.5%) |
| Wholesale Trade | 23 (85.2%) | 4 (14.8%) |
| Retail Trade | 13 (36.1%) | 23 (63.9%) |
| Transportation & Warehousing | 16 (80.0%) | 4 (20.0%) |
| Utilities | 0 (0.0%) | 0 (0.0%) |
| Information | 0 (0.0%) | 0 (0.0%) |
| Finance & Insurance | 23 (71.9%) | 9 (28.1%) |
| Real Estate, Rental & Leasing | 0 (0.0%) | 0 (0.0%) |
| Professional & Scientific | 4 (22.2%) | 14 (77.8%) |
| Enterprise Management | 0 (0.0%) | 0 (0.0%) |
| Administrative & Support | 4 (100.0%) | 0 (0.0%) |
| Educational Services | 24 (26.4%) | 67 (73.6%) |
| Health Care & Social Assistance | 7 (9.1%) | 70 (90.9%) |
| Arts, Entertainment & Recreation | 17 (89.5%) | 2 (10.5%) |
| Accommodation & Food Services | 9 (33.3%) | 18 (66.7%) |
| Public Administration | 11 (36.7%) | 19 (63.3%) |
| Total | 452 (57.0%) | 341 (43.0%) |
Education in Fort Loramie
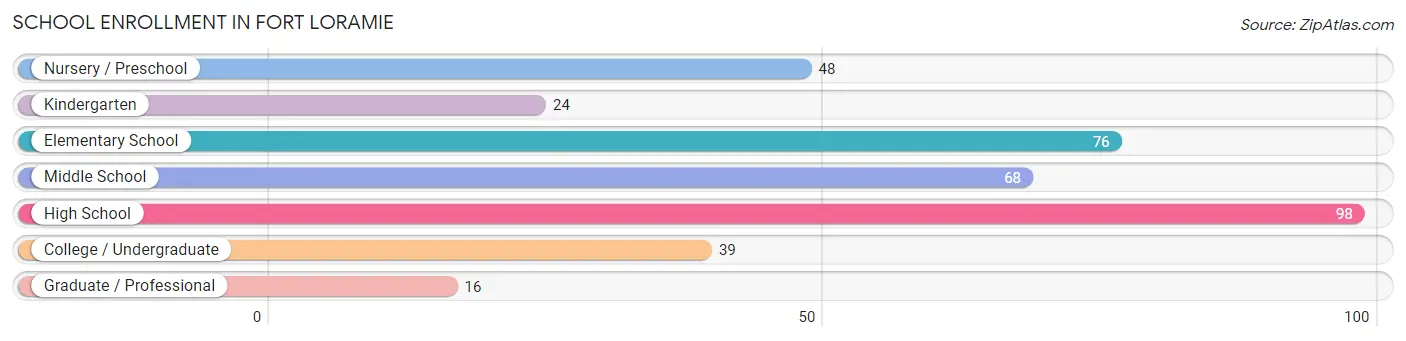
School Enrollment in Fort Loramie
The most common levels of schooling among the 369 students in Fort Loramie are high school (98 | 26.6%), elementary school (76 | 20.6%), and middle school (68 | 18.4%).
| School Level | # Students | % Students |
| Nursery / Preschool | 48 | 13.0% |
| Kindergarten | 24 | 6.5% |
| Elementary School | 76 | 20.6% |
| Middle School | 68 | 18.4% |
| High School | 98 | 26.6% |
| College / Undergraduate | 39 | 10.6% |
| Graduate / Professional | 16 | 4.3% |
| Total | 369 | 100.0% |
School Enrollment by Age by Funding Source in Fort Loramie
Out of a total of 369 students who are enrolled in schools in Fort Loramie, 33 (8.9%) attend a private institution, while the remaining 336 (91.1%) are enrolled in public schools. The age group of 35 years and over has the highest likelihood of being enrolled in private schools, with 8 (100.0% in the age bracket) enrolled. Conversely, the age group of 3 to 4 year olds has the lowest likelihood of being enrolled in a private school, with 25 (100.0% in the age bracket) attending a public institution.
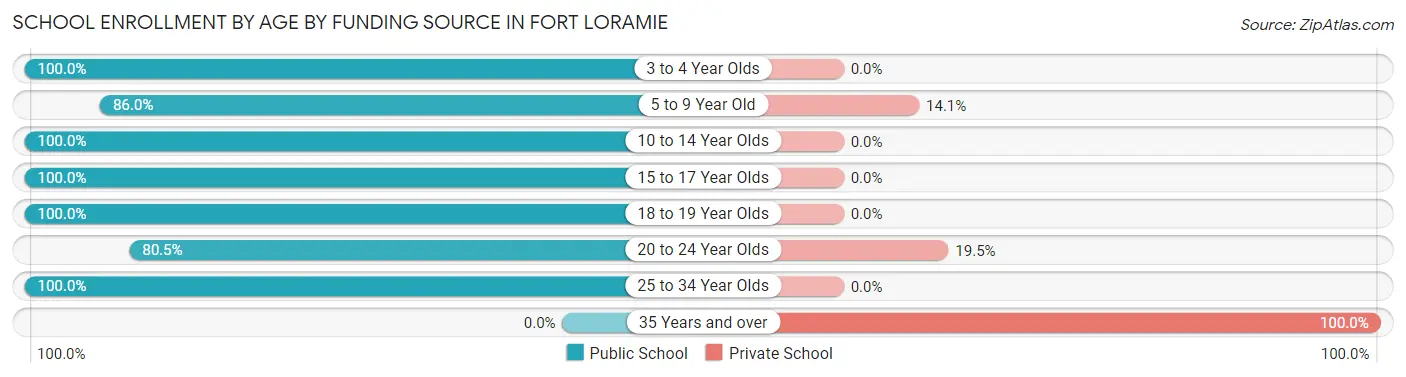
| Age Bracket | Public School | Private School |
| 3 to 4 Year Olds | 25 (100.0%) | 0 (0.0%) |
| 5 to 9 Year Old | 104 (86.0%) | 17 (14.1%) |
| 10 to 14 Year Olds | 75 (100.0%) | 0 (0.0%) |
| 15 to 17 Year Olds | 70 (100.0%) | 0 (0.0%) |
| 18 to 19 Year Olds | 21 (100.0%) | 0 (0.0%) |
| 20 to 24 Year Olds | 33 (80.5%) | 8 (19.5%) |
| 25 to 34 Year Olds | 8 (100.0%) | 0 (0.0%) |
| 35 Years and over | 0 (0.0%) | 8 (100.0%) |
| Total | 336 (91.1%) | 33 (8.9%) |
Educational Attainment by Field of Study in Fort Loramie
Education (88 | 28.1%), business (79 | 25.2%), science & technology (53 | 16.9%), engineering (24 | 7.7%), and bio, nature & agricultural (17 | 5.4%) are the most common fields of study among 313 individuals in Fort Loramie who have obtained a bachelor's degree or higher.
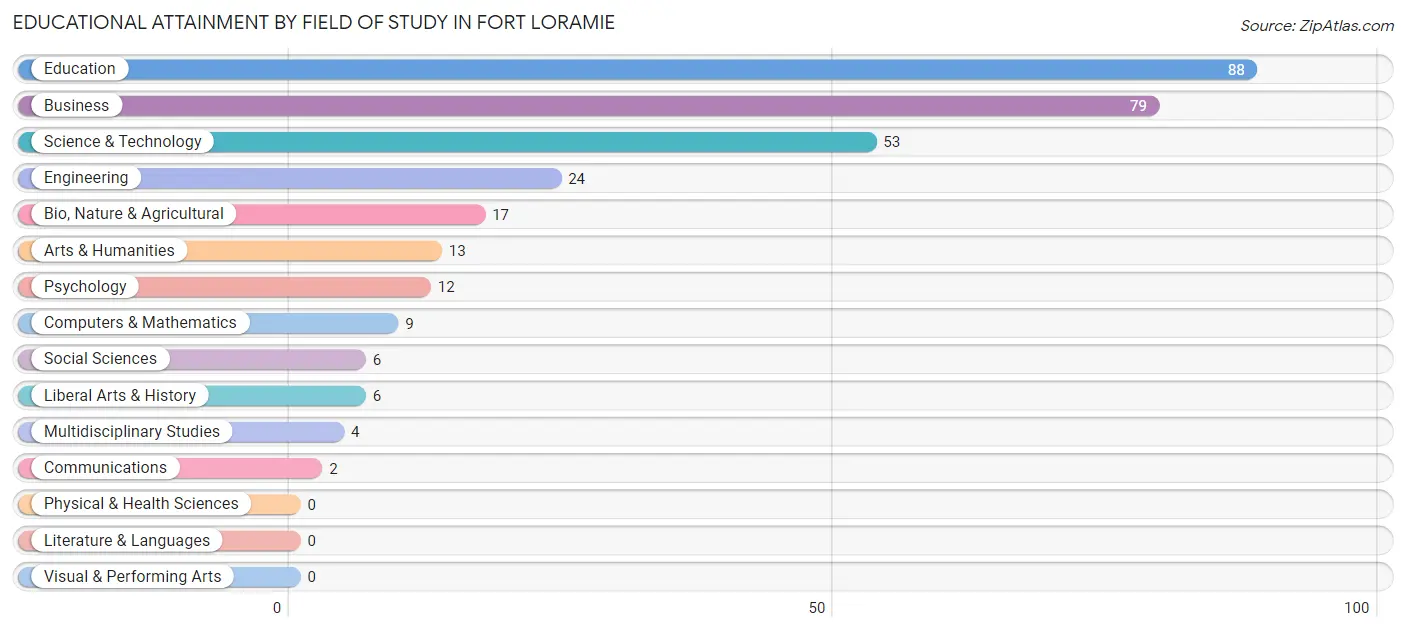
| Field of Study | # Graduates | % Graduates |
| Computers & Mathematics | 9 | 2.9% |
| Bio, Nature & Agricultural | 17 | 5.4% |
| Physical & Health Sciences | 0 | 0.0% |
| Psychology | 12 | 3.8% |
| Social Sciences | 6 | 1.9% |
| Engineering | 24 | 7.7% |
| Multidisciplinary Studies | 4 | 1.3% |
| Science & Technology | 53 | 16.9% |
| Business | 79 | 25.2% |
| Education | 88 | 28.1% |
| Literature & Languages | 0 | 0.0% |
| Liberal Arts & History | 6 | 1.9% |
| Visual & Performing Arts | 0 | 0.0% |
| Communications | 2 | 0.6% |
| Arts & Humanities | 13 | 4.2% |
| Total | 313 | 100.0% |
Transportation & Commute in Fort Loramie
Vehicle Availability by Sex in Fort Loramie
The most prevalent vehicle ownership categories in Fort Loramie are males with 2 vehicles (208, accounting for 46.5%) and females with 2 vehicles (166, making up 61.0%).
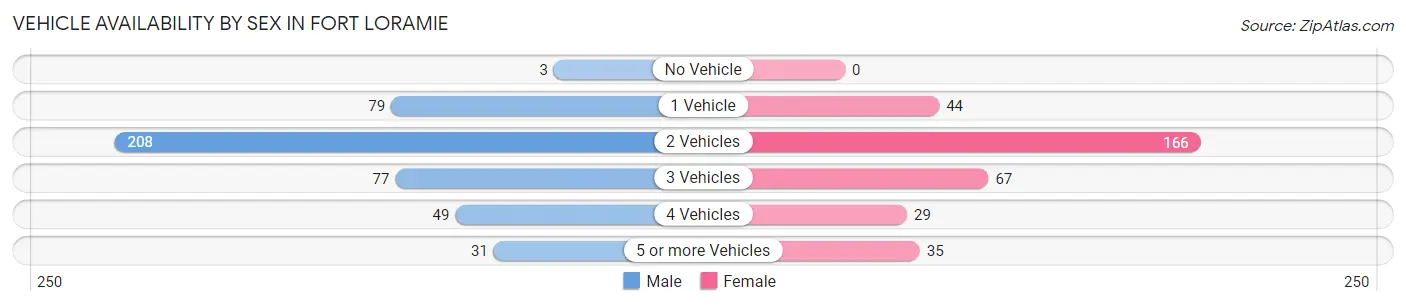
| Vehicles Available | Male | Female |
| No Vehicle | 3 (0.7%) | 0 (0.0%) |
| 1 Vehicle | 79 (17.7%) | 44 (12.9%) |
| 2 Vehicles | 208 (46.5%) | 166 (48.7%) |
| 3 Vehicles | 77 (17.2%) | 67 (19.7%) |
| 4 Vehicles | 49 (11.0%) | 29 (8.5%) |
| 5 or more Vehicles | 31 (6.9%) | 35 (10.3%) |
| Total | 447 (100.0%) | 341 (100.0%) |
Commute Time in Fort Loramie
The most frequently occuring commute durations in Fort Loramie are 20 to 24 minutes (143 commuters, 19.3%), less than 5 minutes (123 commuters, 16.6%), and 15 to 19 minutes (121 commuters, 16.4%).
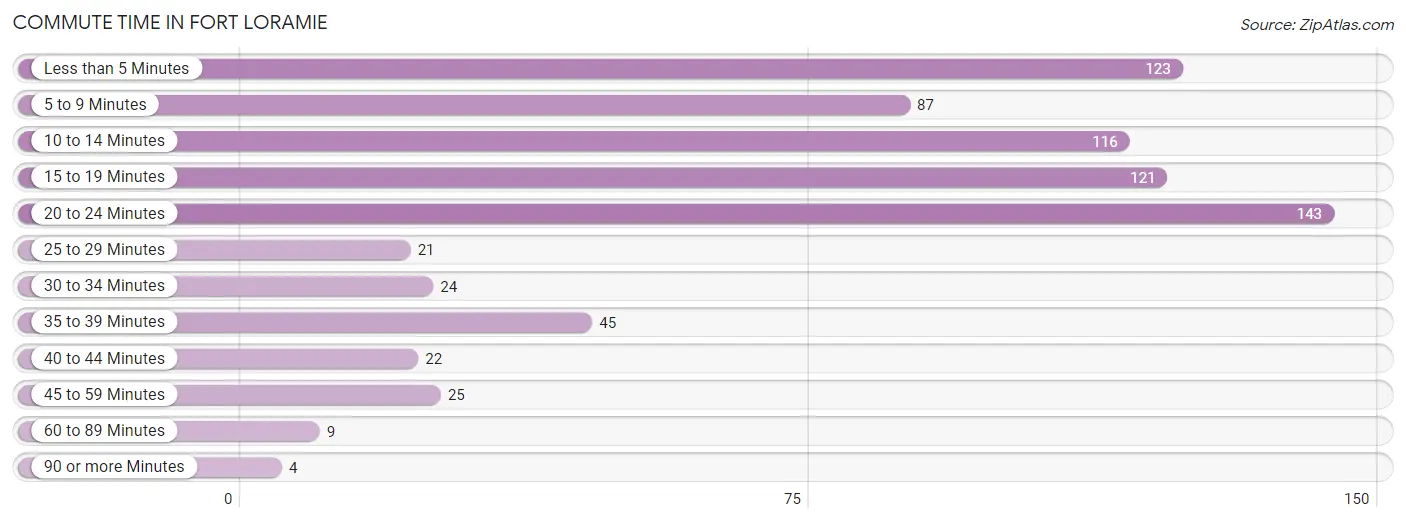
| Commute Time | # Commuters | % Commuters |
| Less than 5 Minutes | 123 | 16.6% |
| 5 to 9 Minutes | 87 | 11.8% |
| 10 to 14 Minutes | 116 | 15.7% |
| 15 to 19 Minutes | 121 | 16.4% |
| 20 to 24 Minutes | 143 | 19.3% |
| 25 to 29 Minutes | 21 | 2.8% |
| 30 to 34 Minutes | 24 | 3.2% |
| 35 to 39 Minutes | 45 | 6.1% |
| 40 to 44 Minutes | 22 | 3.0% |
| 45 to 59 Minutes | 25 | 3.4% |
| 60 to 89 Minutes | 9 | 1.2% |
| 90 or more Minutes | 4 | 0.5% |
Commute Time by Sex in Fort Loramie
The most common commute times in Fort Loramie are 20 to 24 minutes (96 commuters, 23.0%) for males and 15 to 19 minutes (66 commuters, 20.5%) for females.
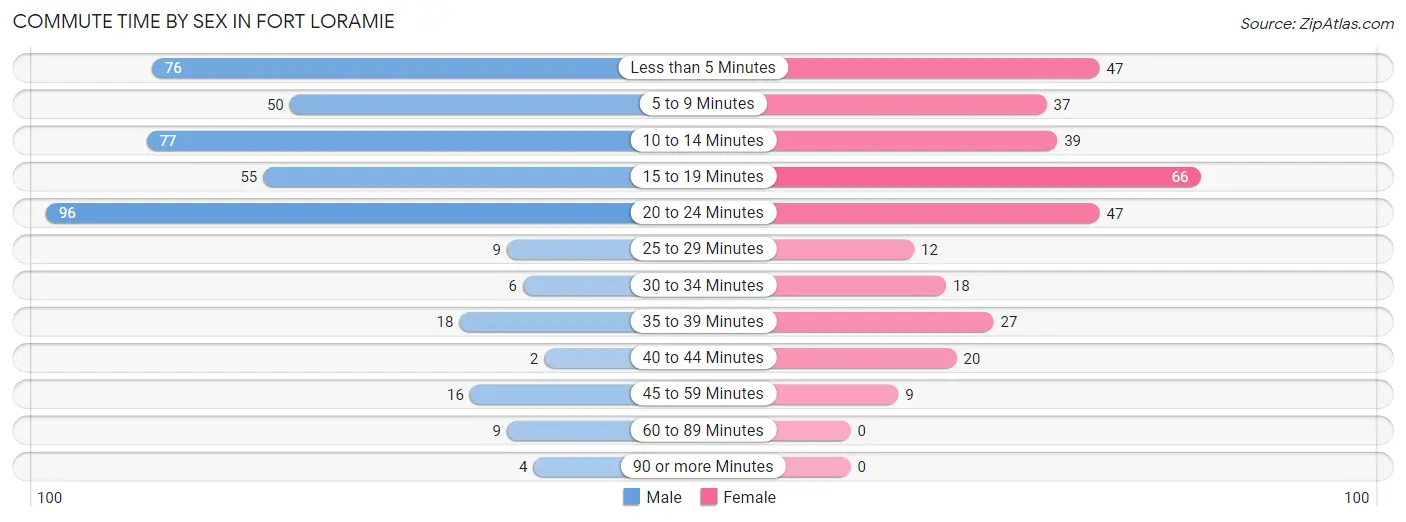
| Commute Time | Male | Female |
| Less than 5 Minutes | 76 (18.2%) | 47 (14.6%) |
| 5 to 9 Minutes | 50 (12.0%) | 37 (11.5%) |
| 10 to 14 Minutes | 77 (18.4%) | 39 (12.1%) |
| 15 to 19 Minutes | 55 (13.2%) | 66 (20.5%) |
| 20 to 24 Minutes | 96 (23.0%) | 47 (14.6%) |
| 25 to 29 Minutes | 9 (2.1%) | 12 (3.7%) |
| 30 to 34 Minutes | 6 (1.4%) | 18 (5.6%) |
| 35 to 39 Minutes | 18 (4.3%) | 27 (8.4%) |
| 40 to 44 Minutes | 2 (0.5%) | 20 (6.2%) |
| 45 to 59 Minutes | 16 (3.8%) | 9 (2.8%) |
| 60 to 89 Minutes | 9 (2.1%) | 0 (0.0%) |
| 90 or more Minutes | 4 (1.0%) | 0 (0.0%) |
Time of Departure to Work by Sex in Fort Loramie
The most frequent times of departure to work in Fort Loramie are 5:30 AM to 5:59 AM (62, 14.8%) for males and 7:00 AM to 7:29 AM (93, 28.9%) for females.
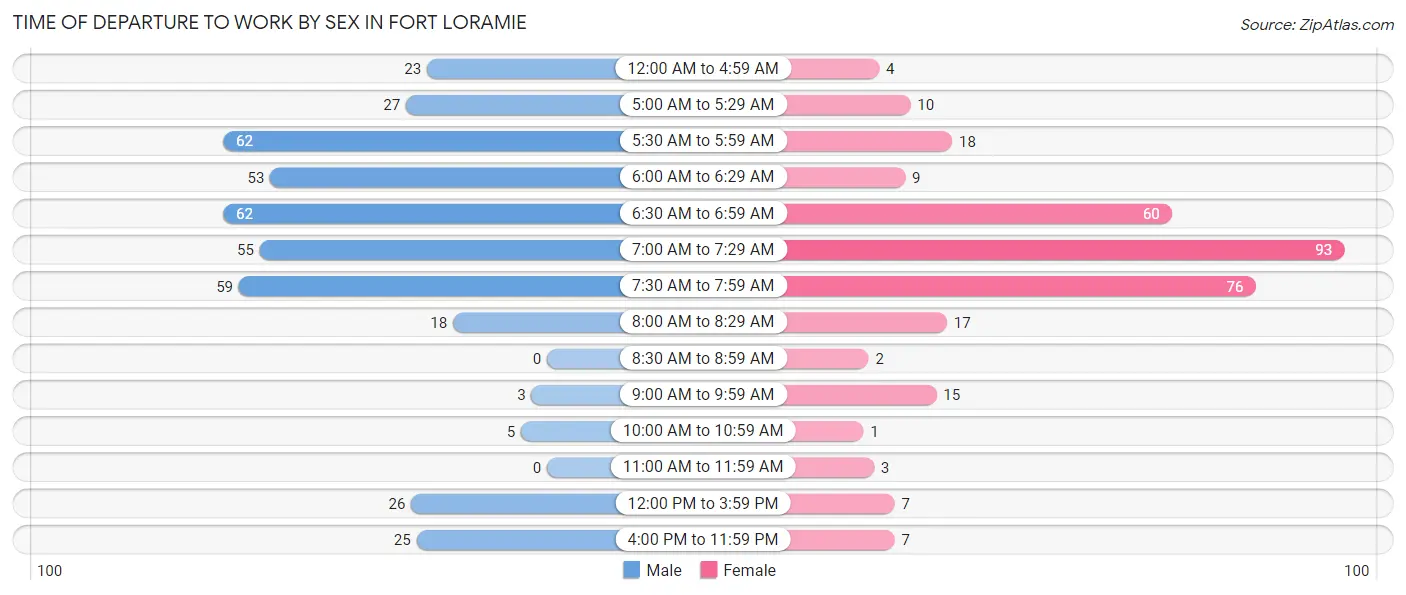
| Time of Departure | Male | Female |
| 12:00 AM to 4:59 AM | 23 (5.5%) | 4 (1.2%) |
| 5:00 AM to 5:29 AM | 27 (6.5%) | 10 (3.1%) |
| 5:30 AM to 5:59 AM | 62 (14.8%) | 18 (5.6%) |
| 6:00 AM to 6:29 AM | 53 (12.7%) | 9 (2.8%) |
| 6:30 AM to 6:59 AM | 62 (14.8%) | 60 (18.6%) |
| 7:00 AM to 7:29 AM | 55 (13.2%) | 93 (28.9%) |
| 7:30 AM to 7:59 AM | 59 (14.1%) | 76 (23.6%) |
| 8:00 AM to 8:29 AM | 18 (4.3%) | 17 (5.3%) |
| 8:30 AM to 8:59 AM | 0 (0.0%) | 2 (0.6%) |
| 9:00 AM to 9:59 AM | 3 (0.7%) | 15 (4.7%) |
| 10:00 AM to 10:59 AM | 5 (1.2%) | 1 (0.3%) |
| 11:00 AM to 11:59 AM | 0 (0.0%) | 3 (0.9%) |
| 12:00 PM to 3:59 PM | 26 (6.2%) | 7 (2.2%) |
| 4:00 PM to 11:59 PM | 25 (6.0%) | 7 (2.2%) |
| Total | 418 (100.0%) | 322 (100.0%) |
Housing Occupancy in Fort Loramie
Occupancy by Ownership in Fort Loramie
Of the total 587 dwellings in Fort Loramie, owner-occupied units account for 480 (81.8%), while renter-occupied units make up 107 (18.2%).
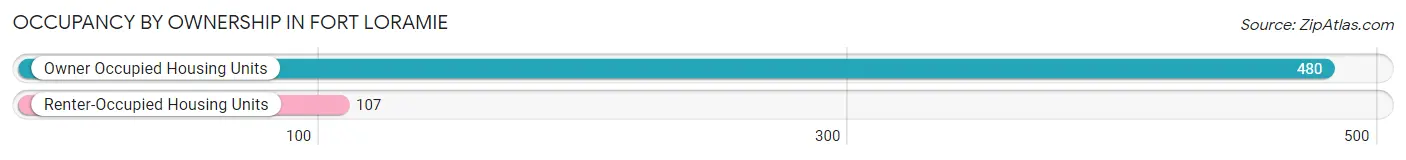
| Occupancy | # Housing Units | % Housing Units |
| Owner Occupied Housing Units | 480 | 81.8% |
| Renter-Occupied Housing Units | 107 | 18.2% |
| Total Occupied Housing Units | 587 | 100.0% |
Occupancy by Household Size in Fort Loramie
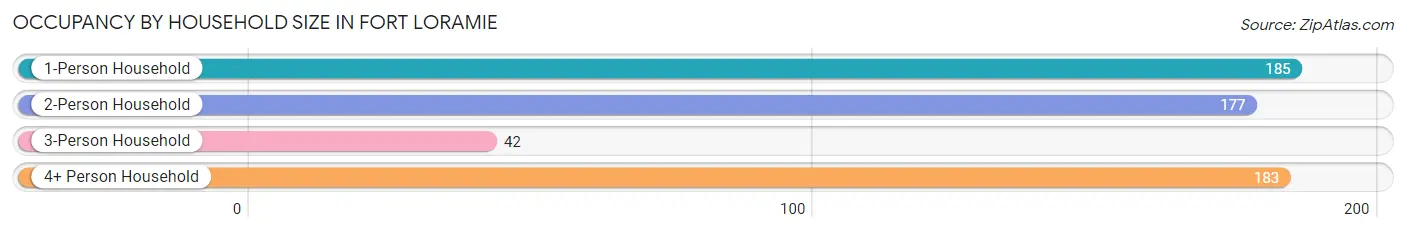
| Household Size | # Housing Units | % Housing Units |
| 1-Person Household | 185 | 31.5% |
| 2-Person Household | 177 | 30.1% |
| 3-Person Household | 42 | 7.2% |
| 4+ Person Household | 183 | 31.2% |
| Total Housing Units | 587 | 100.0% |
Occupancy by Ownership by Household Size in Fort Loramie
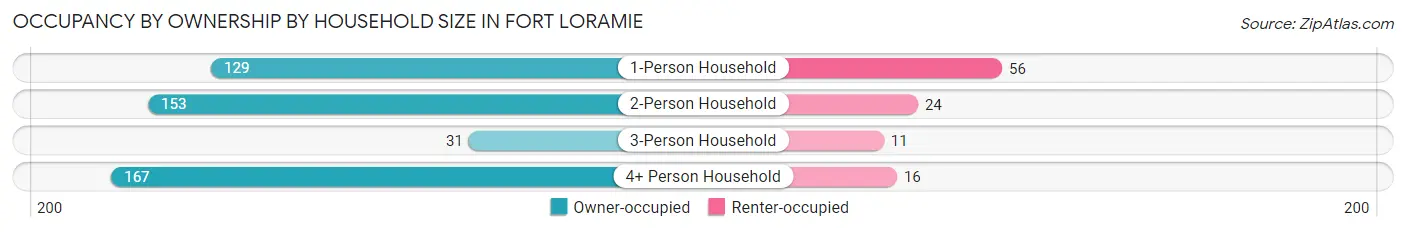
| Household Size | Owner-occupied | Renter-occupied |
| 1-Person Household | 129 (69.7%) | 56 (30.3%) |
| 2-Person Household | 153 (86.4%) | 24 (13.6%) |
| 3-Person Household | 31 (73.8%) | 11 (26.2%) |
| 4+ Person Household | 167 (91.3%) | 16 (8.7%) |
| Total Housing Units | 480 (81.8%) | 107 (18.2%) |
Occupancy by Educational Attainment in Fort Loramie
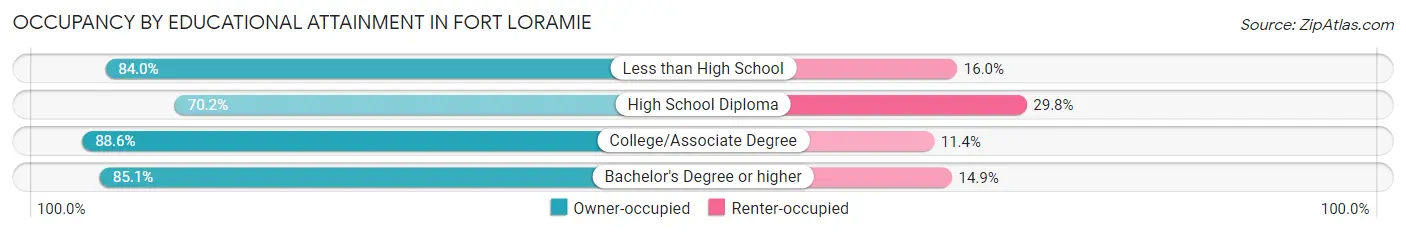
| Household Size | Owner-occupied | Renter-occupied |
| Less than High School | 21 (84.0%) | 4 (16.0%) |
| High School Diploma | 125 (70.2%) | 53 (29.8%) |
| College/Associate Degree | 186 (88.6%) | 24 (11.4%) |
| Bachelor's Degree or higher | 148 (85.1%) | 26 (14.9%) |
Occupancy by Age of Householder in Fort Loramie
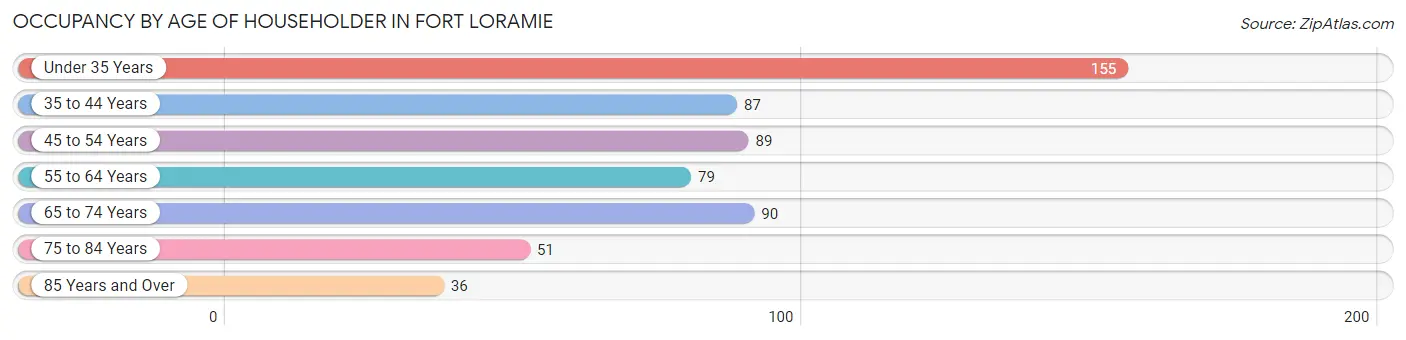
| Age Bracket | # Households | % Households |
| Under 35 Years | 155 | 26.4% |
| 35 to 44 Years | 87 | 14.8% |
| 45 to 54 Years | 89 | 15.2% |
| 55 to 64 Years | 79 | 13.5% |
| 65 to 74 Years | 90 | 15.3% |
| 75 to 84 Years | 51 | 8.7% |
| 85 Years and Over | 36 | 6.1% |
| Total | 587 | 100.0% |
Housing Finances in Fort Loramie
Median Income by Occupancy in Fort Loramie
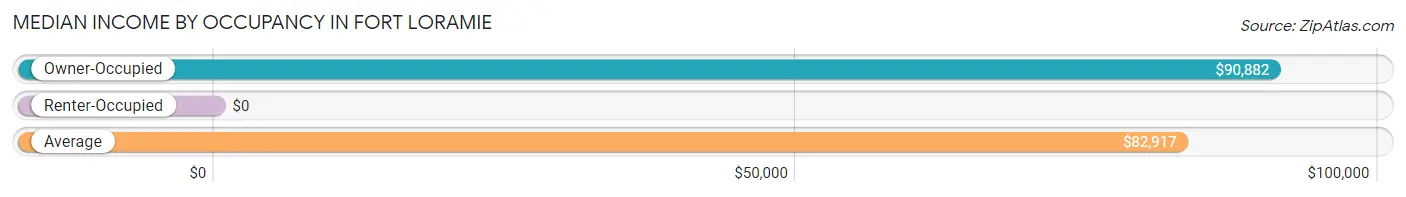
| Occupancy Type | # Households | Median Income |
| Owner-Occupied | 480 (81.8%) | $90,882 |
| Renter-Occupied | 107 (18.2%) | $0 |
| Average | 587 (100.0%) | $82,917 |
Occupancy by Householder Income Bracket in Fort Loramie
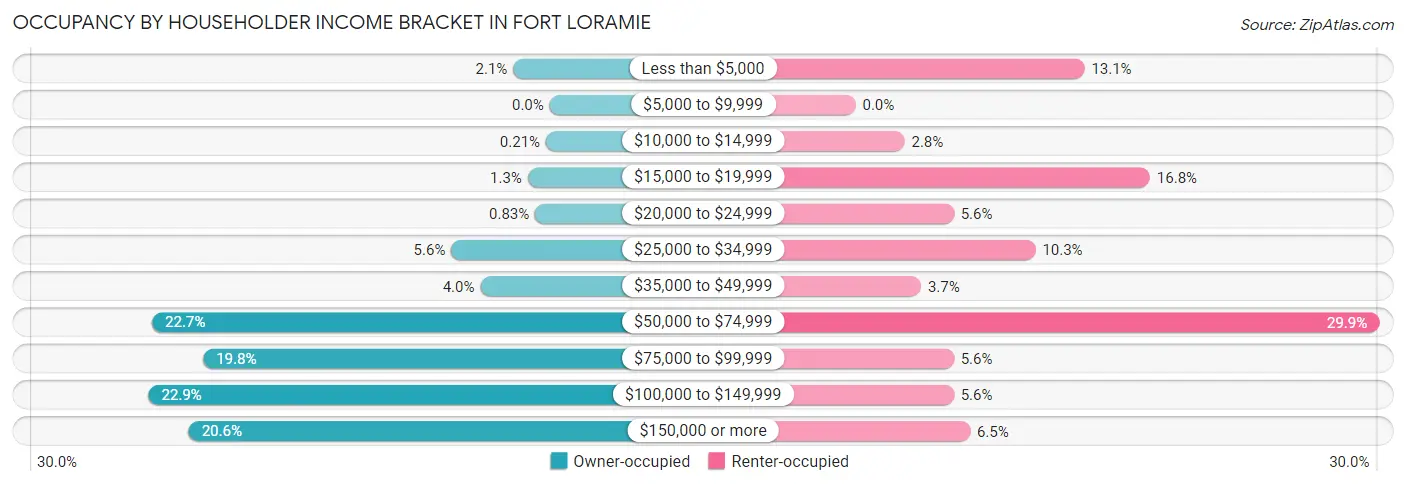
| Income Bracket | Owner-occupied | Renter-occupied |
| Less than $5,000 | 10 (2.1%) | 14 (13.1%) |
| $5,000 to $9,999 | 0 (0.0%) | 0 (0.0%) |
| $10,000 to $14,999 | 1 (0.2%) | 3 (2.8%) |
| $15,000 to $19,999 | 6 (1.3%) | 18 (16.8%) |
| $20,000 to $24,999 | 4 (0.8%) | 6 (5.6%) |
| $25,000 to $34,999 | 27 (5.6%) | 11 (10.3%) |
| $35,000 to $49,999 | 19 (4.0%) | 4 (3.7%) |
| $50,000 to $74,999 | 109 (22.7%) | 32 (29.9%) |
| $75,000 to $99,999 | 95 (19.8%) | 6 (5.6%) |
| $100,000 to $149,999 | 110 (22.9%) | 6 (5.6%) |
| $150,000 or more | 99 (20.6%) | 7 (6.5%) |
| Total | 480 (100.0%) | 107 (100.0%) |
Monthly Housing Cost Tiers in Fort Loramie
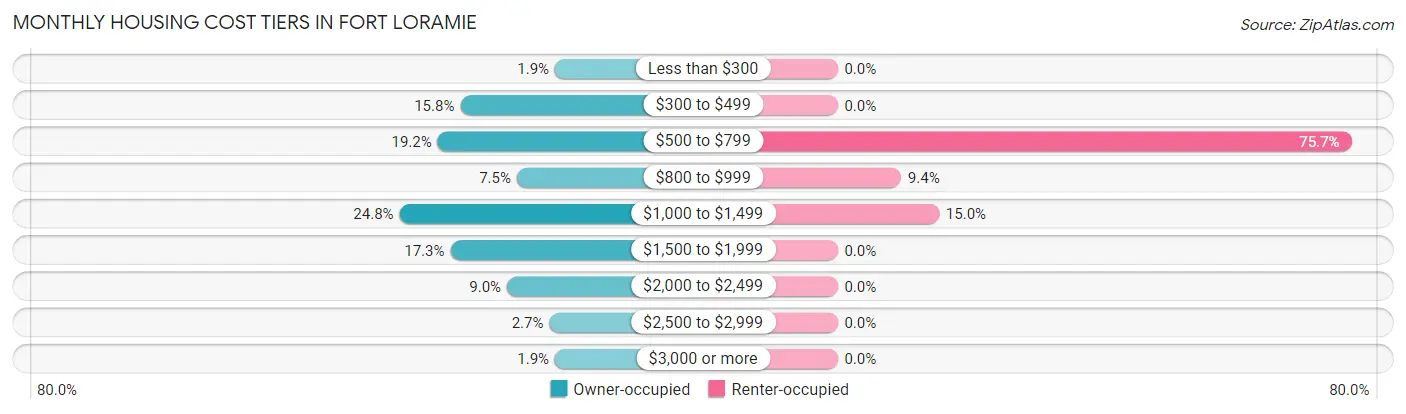
| Monthly Cost | Owner-occupied | Renter-occupied |
| Less than $300 | 9 (1.9%) | 0 (0.0%) |
| $300 to $499 | 76 (15.8%) | 0 (0.0%) |
| $500 to $799 | 92 (19.2%) | 81 (75.7%) |
| $800 to $999 | 36 (7.5%) | 10 (9.3%) |
| $1,000 to $1,499 | 119 (24.8%) | 16 (14.9%) |
| $1,500 to $1,999 | 83 (17.3%) | 0 (0.0%) |
| $2,000 to $2,499 | 43 (9.0%) | 0 (0.0%) |
| $2,500 to $2,999 | 13 (2.7%) | 0 (0.0%) |
| $3,000 or more | 9 (1.9%) | 0 (0.0%) |
| Total | 480 (100.0%) | 107 (100.0%) |
Physical Housing Characteristics in Fort Loramie
Housing Structures in Fort Loramie
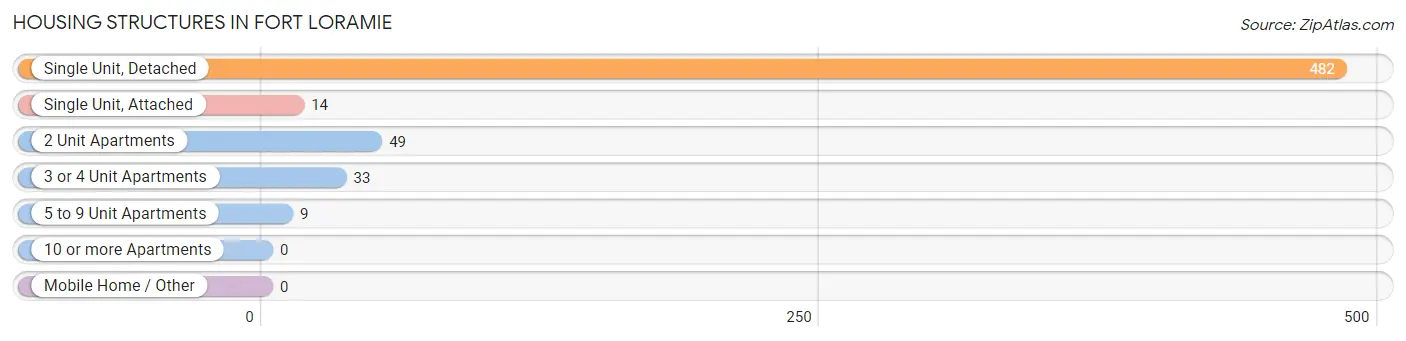
| Structure Type | # Housing Units | % Housing Units |
| Single Unit, Detached | 482 | 82.1% |
| Single Unit, Attached | 14 | 2.4% |
| 2 Unit Apartments | 49 | 8.4% |
| 3 or 4 Unit Apartments | 33 | 5.6% |
| 5 to 9 Unit Apartments | 9 | 1.5% |
| 10 or more Apartments | 0 | 0.0% |
| Mobile Home / Other | 0 | 0.0% |
| Total | 587 | 100.0% |
Housing Structures by Occupancy in Fort Loramie
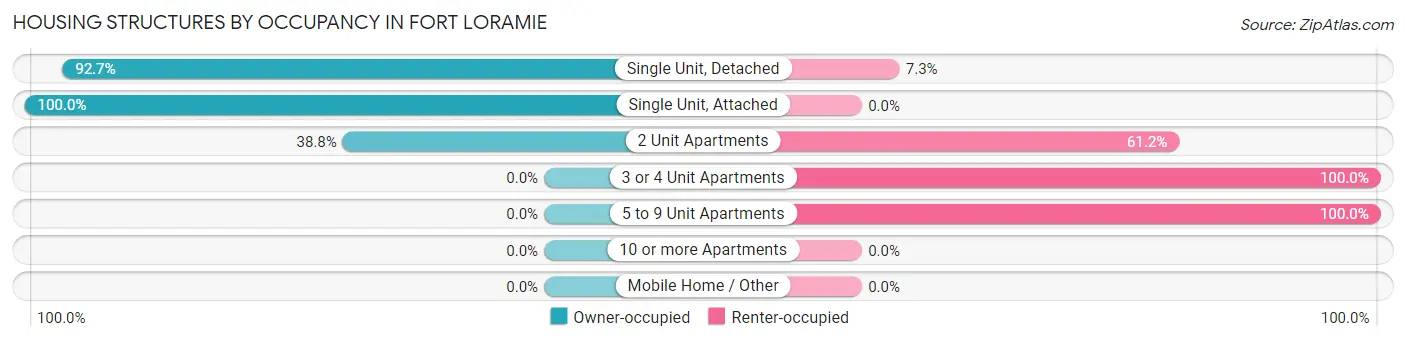
| Structure Type | Owner-occupied | Renter-occupied |
| Single Unit, Detached | 447 (92.7%) | 35 (7.3%) |
| Single Unit, Attached | 14 (100.0%) | 0 (0.0%) |
| 2 Unit Apartments | 19 (38.8%) | 30 (61.2%) |
| 3 or 4 Unit Apartments | 0 (0.0%) | 33 (100.0%) |
| 5 to 9 Unit Apartments | 0 (0.0%) | 9 (100.0%) |
| 10 or more Apartments | 0 (0.0%) | 0 (0.0%) |
| Mobile Home / Other | 0 (0.0%) | 0 (0.0%) |
| Total | 480 (81.8%) | 107 (18.2%) |
Housing Structures by Number of Rooms in Fort Loramie
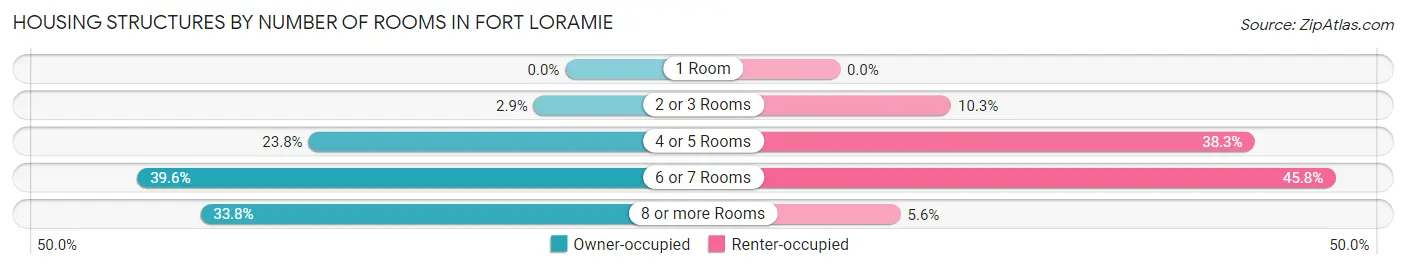
| Number of Rooms | Owner-occupied | Renter-occupied |
| 1 Room | 0 (0.0%) | 0 (0.0%) |
| 2 or 3 Rooms | 14 (2.9%) | 11 (10.3%) |
| 4 or 5 Rooms | 114 (23.7%) | 41 (38.3%) |
| 6 or 7 Rooms | 190 (39.6%) | 49 (45.8%) |
| 8 or more Rooms | 162 (33.8%) | 6 (5.6%) |
| Total | 480 (100.0%) | 107 (100.0%) |
Housing Structure by Heating Type in Fort Loramie
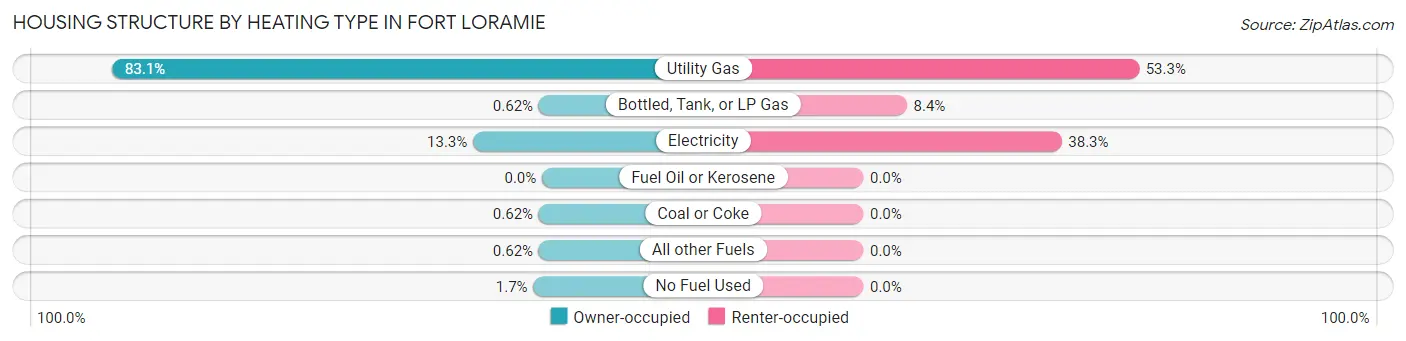
| Heating Type | Owner-occupied | Renter-occupied |
| Utility Gas | 399 (83.1%) | 57 (53.3%) |
| Bottled, Tank, or LP Gas | 3 (0.6%) | 9 (8.4%) |
| Electricity | 64 (13.3%) | 41 (38.3%) |
| Fuel Oil or Kerosene | 0 (0.0%) | 0 (0.0%) |
| Coal or Coke | 3 (0.6%) | 0 (0.0%) |
| All other Fuels | 3 (0.6%) | 0 (0.0%) |
| No Fuel Used | 8 (1.7%) | 0 (0.0%) |
| Total | 480 (100.0%) | 107 (100.0%) |
Household Vehicle Usage in Fort Loramie
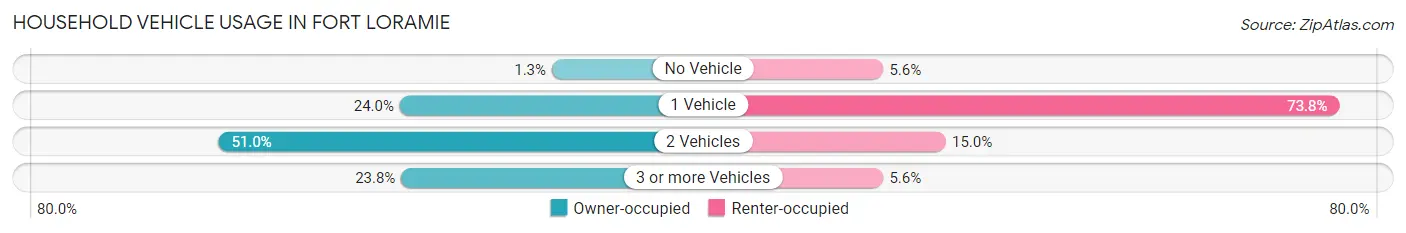
| Vehicles per Household | Owner-occupied | Renter-occupied |
| No Vehicle | 6 (1.3%) | 6 (5.6%) |
| 1 Vehicle | 115 (24.0%) | 79 (73.8%) |
| 2 Vehicles | 245 (51.0%) | 16 (14.9%) |
| 3 or more Vehicles | 114 (23.7%) | 6 (5.6%) |
| Total | 480 (100.0%) | 107 (100.0%) |
Real Estate & Mortgages in Fort Loramie
Real Estate and Mortgage Overview in Fort Loramie
| Characteristic | Without Mortgage | With Mortgage |
| Housing Units | 199 | 281 |
| Median Property Value | $236,500 | $244,100 |
| Median Household Income | $70,069 | $69 |
| Monthly Housing Costs | $544 | $9 |
| Real Estate Taxes | $2,402 | $4 |
Property Value by Mortgage Status in Fort Loramie
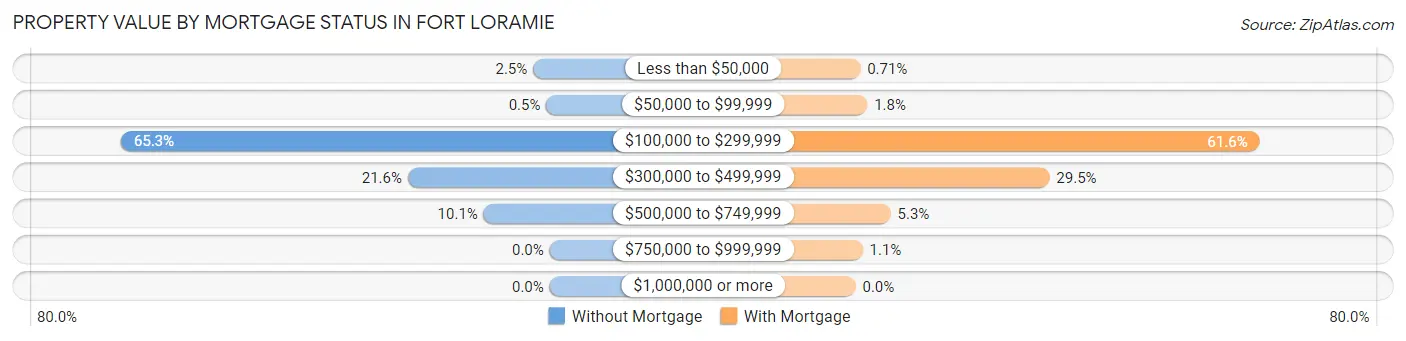
| Property Value | Without Mortgage | With Mortgage |
| Less than $50,000 | 5 (2.5%) | 2 (0.7%) |
| $50,000 to $99,999 | 1 (0.5%) | 5 (1.8%) |
| $100,000 to $299,999 | 130 (65.3%) | 173 (61.6%) |
| $300,000 to $499,999 | 43 (21.6%) | 83 (29.5%) |
| $500,000 to $749,999 | 20 (10.1%) | 15 (5.3%) |
| $750,000 to $999,999 | 0 (0.0%) | 3 (1.1%) |
| $1,000,000 or more | 0 (0.0%) | 0 (0.0%) |
| Total | 199 (100.0%) | 281 (100.0%) |
Household Income by Mortgage Status in Fort Loramie
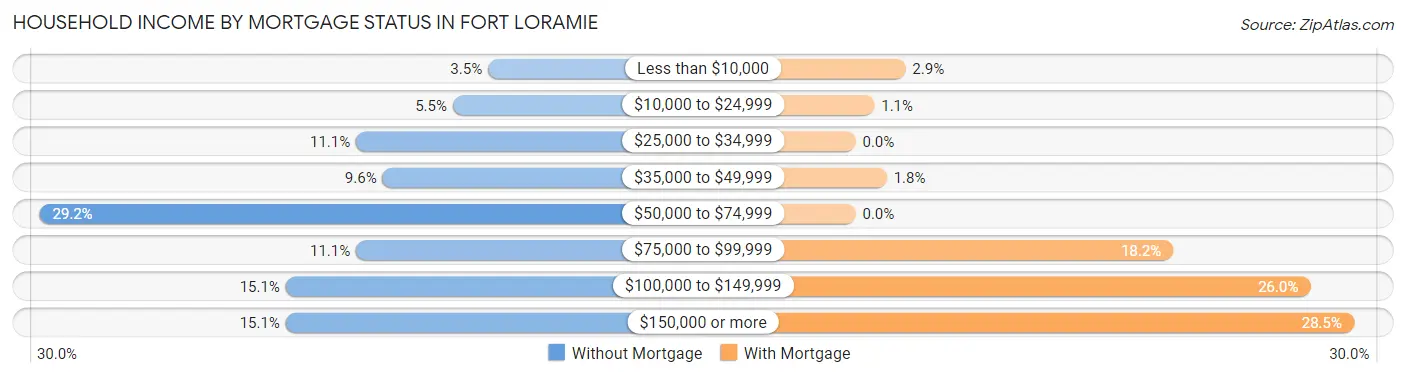
| Household Income | Without Mortgage | With Mortgage |
| Less than $10,000 | 7 (3.5%) | 8 (2.9%) |
| $10,000 to $24,999 | 11 (5.5%) | 3 (1.1%) |
| $25,000 to $34,999 | 22 (11.1%) | 0 (0.0%) |
| $35,000 to $49,999 | 19 (9.6%) | 5 (1.8%) |
| $50,000 to $74,999 | 58 (29.1%) | 0 (0.0%) |
| $75,000 to $99,999 | 22 (11.1%) | 51 (18.1%) |
| $100,000 to $149,999 | 30 (15.1%) | 73 (26.0%) |
| $150,000 or more | 30 (15.1%) | 80 (28.5%) |
| Total | 199 (100.0%) | 281 (100.0%) |
Property Value to Household Income Ratio in Fort Loramie
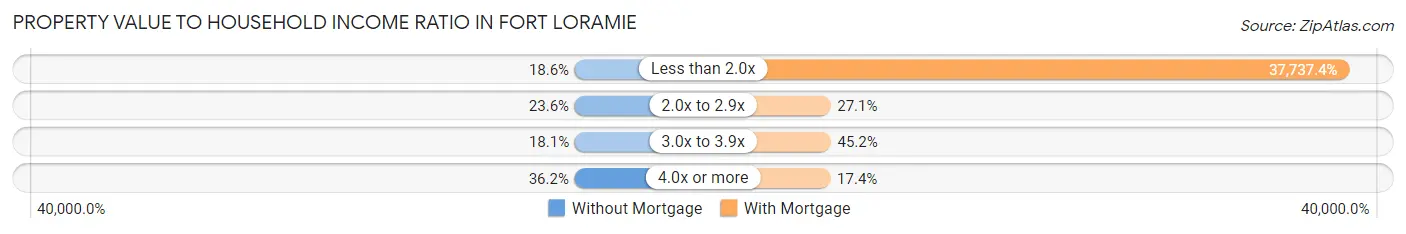
| Value-to-Income Ratio | Without Mortgage | With Mortgage |
| Less than 2.0x | 37 (18.6%) | 106,042 (37,737.4%) |
| 2.0x to 2.9x | 47 (23.6%) | 76 (27.1%) |
| 3.0x to 3.9x | 36 (18.1%) | 127 (45.2%) |
| 4.0x or more | 72 (36.2%) | 49 (17.4%) |
| Total | 199 (100.0%) | 281 (100.0%) |
Real Estate Taxes by Mortgage Status in Fort Loramie
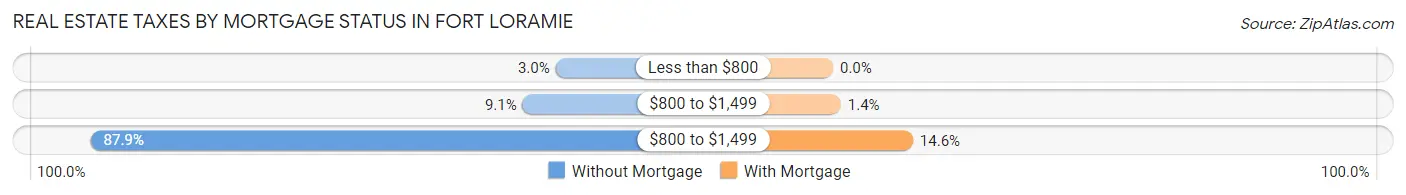
| Property Taxes | Without Mortgage | With Mortgage |
| Less than $800 | 6 (3.0%) | 0 (0.0%) |
| $800 to $1,499 | 18 (9.0%) | 4 (1.4%) |
| $800 to $1,499 | 175 (87.9%) | 41 (14.6%) |
| Total | 199 (100.0%) | 281 (100.0%) |
Health & Disability in Fort Loramie
Health Insurance Coverage by Age in Fort Loramie
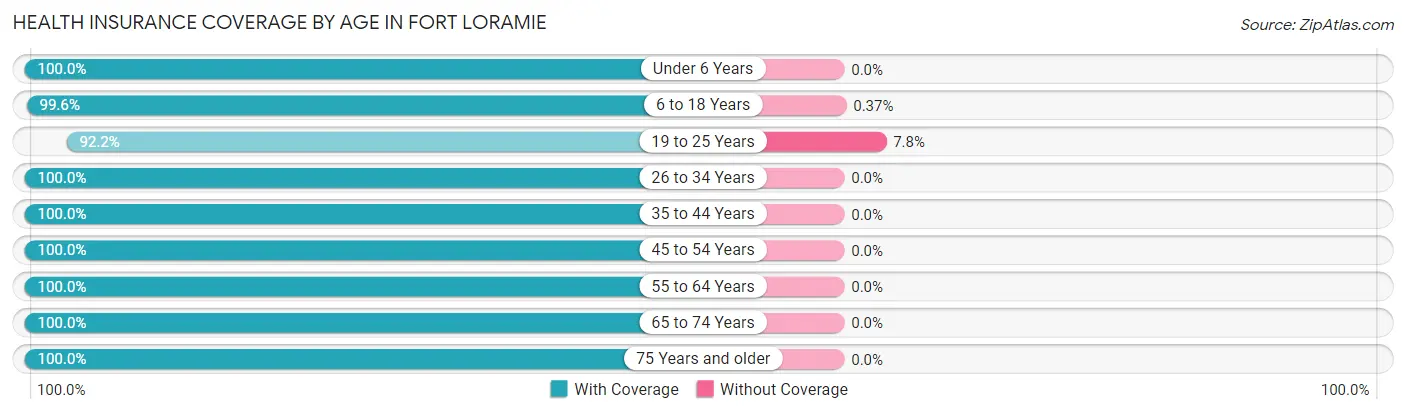
| Age Bracket | With Coverage | Without Coverage |
| Under 6 Years | 180 (100.0%) | 0 (0.0%) |
| 6 to 18 Years | 266 (99.6%) | 1 (0.4%) |
| 19 to 25 Years | 118 (92.2%) | 10 (7.8%) |
| 26 to 34 Years | 213 (100.0%) | 0 (0.0%) |
| 35 to 44 Years | 155 (100.0%) | 0 (0.0%) |
| 45 to 54 Years | 165 (100.0%) | 0 (0.0%) |
| 55 to 64 Years | 138 (100.0%) | 0 (0.0%) |
| 65 to 74 Years | 119 (100.0%) | 0 (0.0%) |
| 75 Years and older | 129 (100.0%) | 0 (0.0%) |
| Total | 1,483 (99.3%) | 11 (0.7%) |
Health Insurance Coverage by Citizenship Status in Fort Loramie
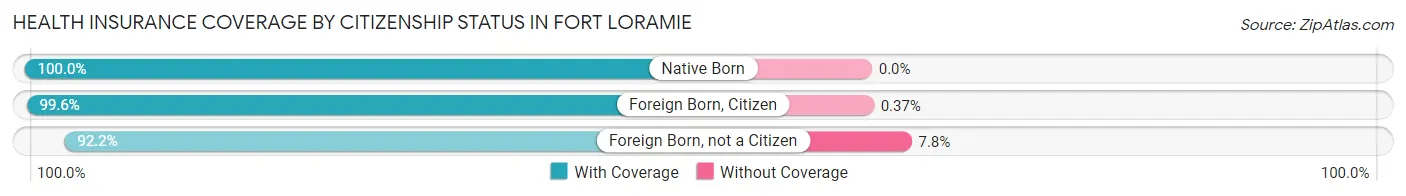
| Citizenship Status | With Coverage | Without Coverage |
| Native Born | 180 (100.0%) | 0 (0.0%) |
| Foreign Born, Citizen | 266 (99.6%) | 1 (0.4%) |
| Foreign Born, not a Citizen | 118 (92.2%) | 10 (7.8%) |
Health Insurance Coverage by Household Income in Fort Loramie
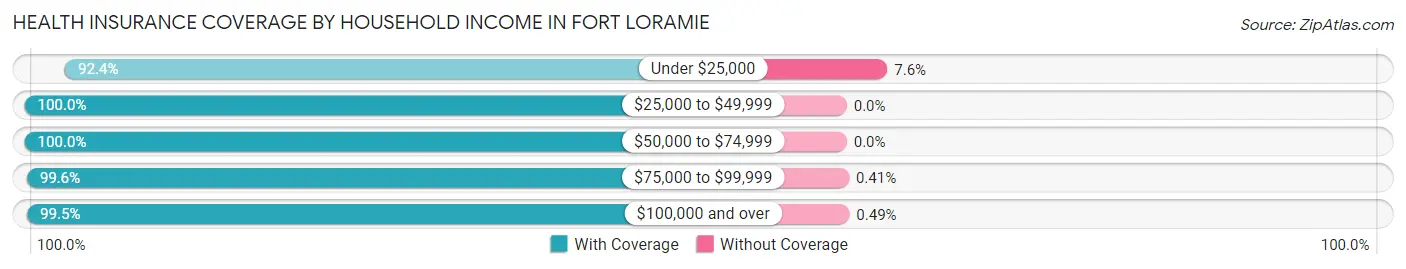
| Household Income | With Coverage | Without Coverage |
| Under $25,000 | 73 (92.4%) | 6 (7.6%) |
| $25,000 to $49,999 | 86 (100.0%) | 0 (0.0%) |
| $50,000 to $74,999 | 264 (100.0%) | 0 (0.0%) |
| $75,000 to $99,999 | 244 (99.6%) | 1 (0.4%) |
| $100,000 and over | 816 (99.5%) | 4 (0.5%) |
Public vs Private Health Insurance Coverage by Age in Fort Loramie
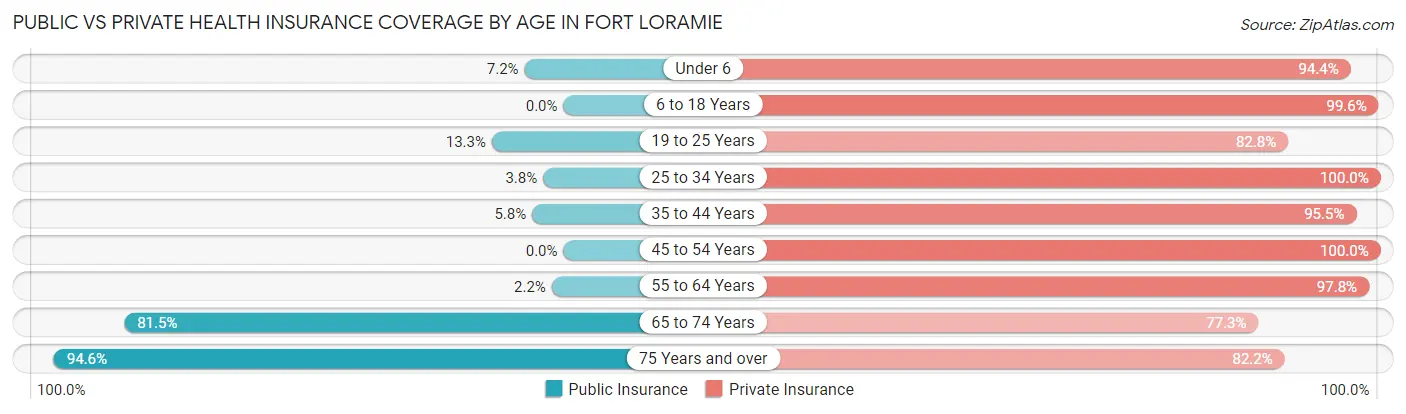
| Age Bracket | Public Insurance | Private Insurance |
| Under 6 | 13 (7.2%) | 170 (94.4%) |
| 6 to 18 Years | 0 (0.0%) | 266 (99.6%) |
| 19 to 25 Years | 17 (13.3%) | 106 (82.8%) |
| 25 to 34 Years | 8 (3.8%) | 213 (100.0%) |
| 35 to 44 Years | 9 (5.8%) | 148 (95.5%) |
| 45 to 54 Years | 0 (0.0%) | 165 (100.0%) |
| 55 to 64 Years | 3 (2.2%) | 135 (97.8%) |
| 65 to 74 Years | 97 (81.5%) | 92 (77.3%) |
| 75 Years and over | 122 (94.6%) | 106 (82.2%) |
| Total | 269 (18.0%) | 1,401 (93.8%) |
Disability Status by Sex by Age in Fort Loramie
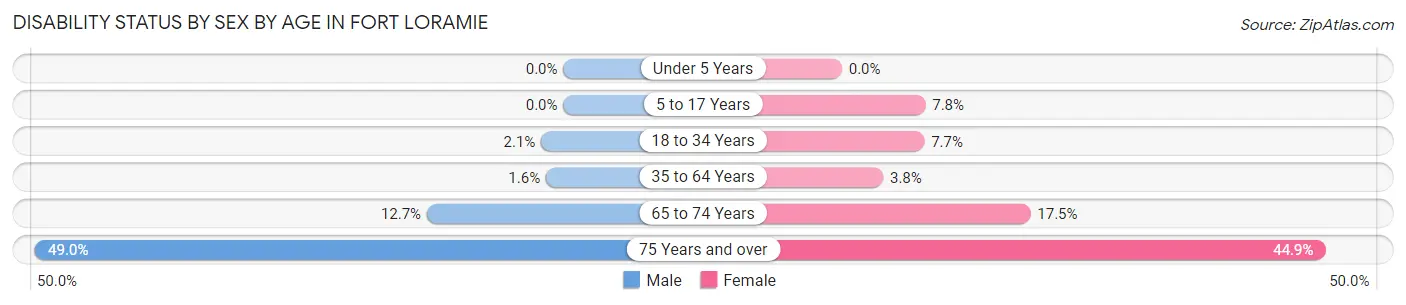
| Age Bracket | Male | Female |
| Under 5 Years | 0 (0.0%) | 0 (0.0%) |
| 5 to 17 Years | 0 (0.0%) | 11 (7.7%) |
| 18 to 34 Years | 4 (2.1%) | 13 (7.6%) |
| 35 to 64 Years | 4 (1.6%) | 8 (3.8%) |
| 65 to 74 Years | 10 (12.7%) | 7 (17.5%) |
| 75 Years and over | 25 (49.0%) | 35 (44.9%) |
Disability Class by Sex by Age in Fort Loramie
Disability Class: Hearing Difficulty
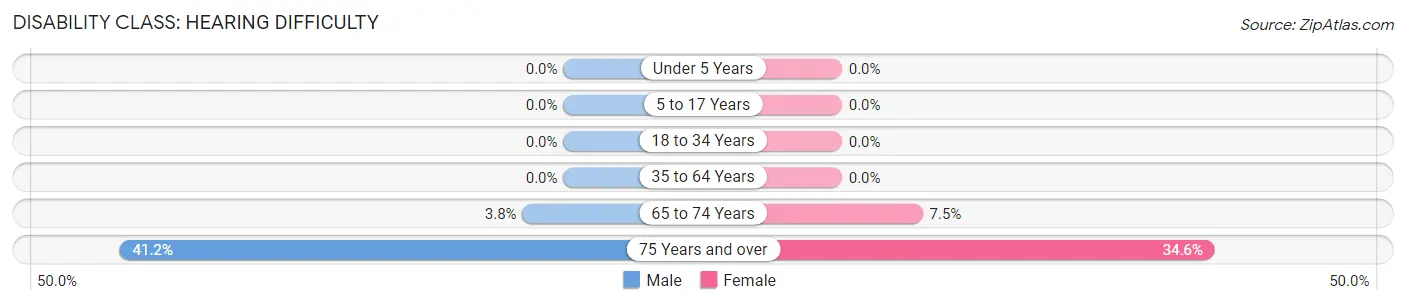
| Age Bracket | Male | Female |
| Under 5 Years | 0 (0.0%) | 0 (0.0%) |
| 5 to 17 Years | 0 (0.0%) | 0 (0.0%) |
| 18 to 34 Years | 0 (0.0%) | 0 (0.0%) |
| 35 to 64 Years | 0 (0.0%) | 0 (0.0%) |
| 65 to 74 Years | 3 (3.8%) | 3 (7.5%) |
| 75 Years and over | 21 (41.2%) | 27 (34.6%) |
Disability Class: Vision Difficulty
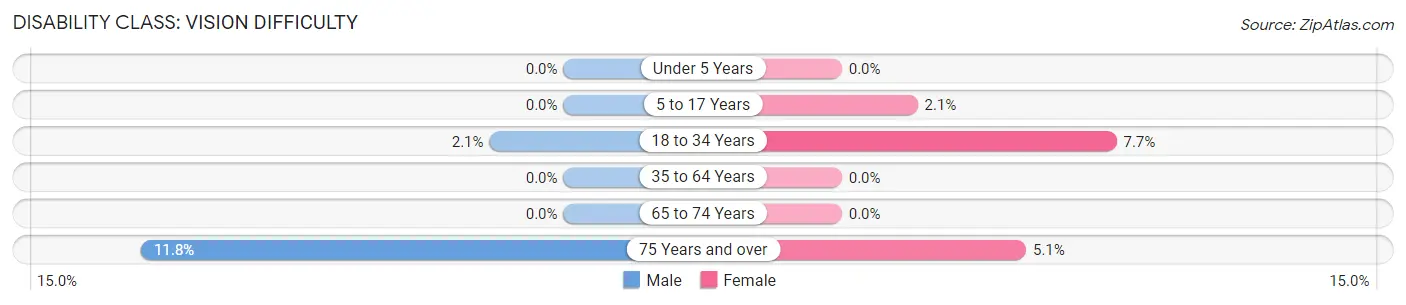
| Age Bracket | Male | Female |
| Under 5 Years | 0 (0.0%) | 0 (0.0%) |
| 5 to 17 Years | 0 (0.0%) | 3 (2.1%) |
| 18 to 34 Years | 4 (2.1%) | 13 (7.6%) |
| 35 to 64 Years | 0 (0.0%) | 0 (0.0%) |
| 65 to 74 Years | 0 (0.0%) | 0 (0.0%) |
| 75 Years and over | 6 (11.8%) | 4 (5.1%) |
Disability Class: Cognitive Difficulty
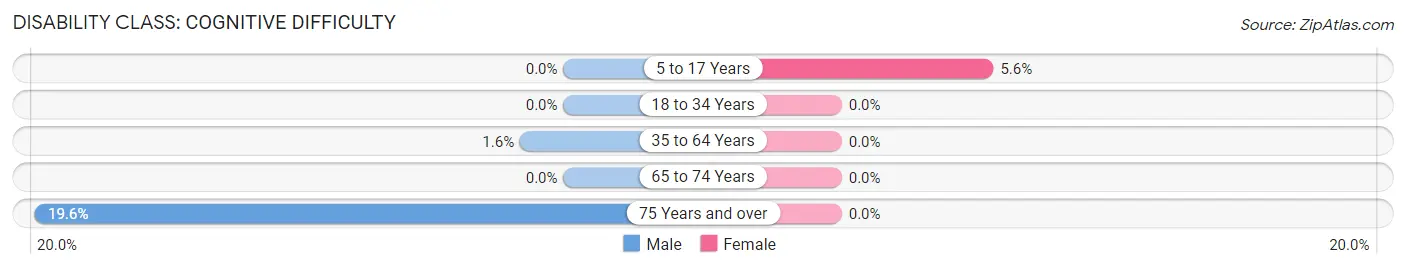
| Age Bracket | Male | Female |
| 5 to 17 Years | 0 (0.0%) | 8 (5.6%) |
| 18 to 34 Years | 0 (0.0%) | 0 (0.0%) |
| 35 to 64 Years | 4 (1.6%) | 0 (0.0%) |
| 65 to 74 Years | 0 (0.0%) | 0 (0.0%) |
| 75 Years and over | 10 (19.6%) | 0 (0.0%) |
Disability Class: Ambulatory Difficulty
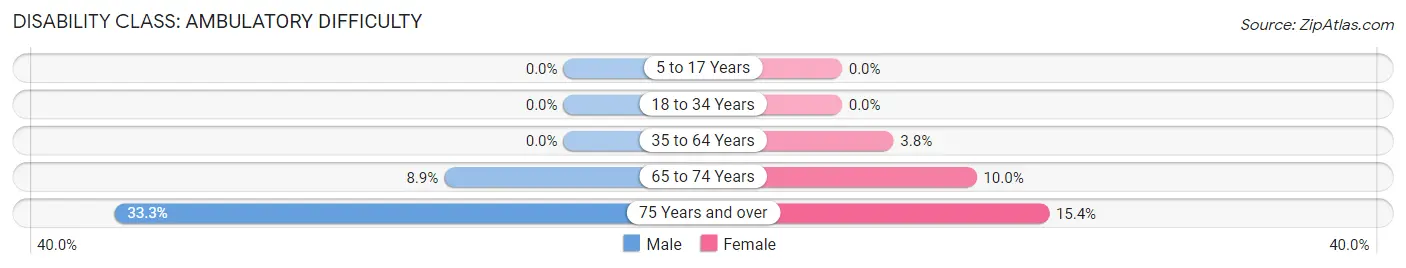
| Age Bracket | Male | Female |
| 5 to 17 Years | 0 (0.0%) | 0 (0.0%) |
| 18 to 34 Years | 0 (0.0%) | 0 (0.0%) |
| 35 to 64 Years | 0 (0.0%) | 8 (3.8%) |
| 65 to 74 Years | 7 (8.9%) | 4 (10.0%) |
| 75 Years and over | 17 (33.3%) | 12 (15.4%) |
Disability Class: Self-Care Difficulty
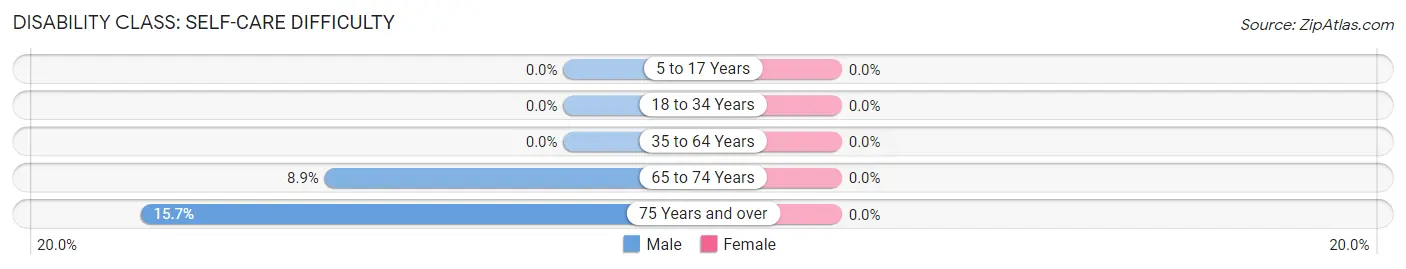
| Age Bracket | Male | Female |
| 5 to 17 Years | 0 (0.0%) | 0 (0.0%) |
| 18 to 34 Years | 0 (0.0%) | 0 (0.0%) |
| 35 to 64 Years | 0 (0.0%) | 0 (0.0%) |
| 65 to 74 Years | 7 (8.9%) | 0 (0.0%) |
| 75 Years and over | 8 (15.7%) | 0 (0.0%) |
Technology Access in Fort Loramie
Computing Device Access in Fort Loramie
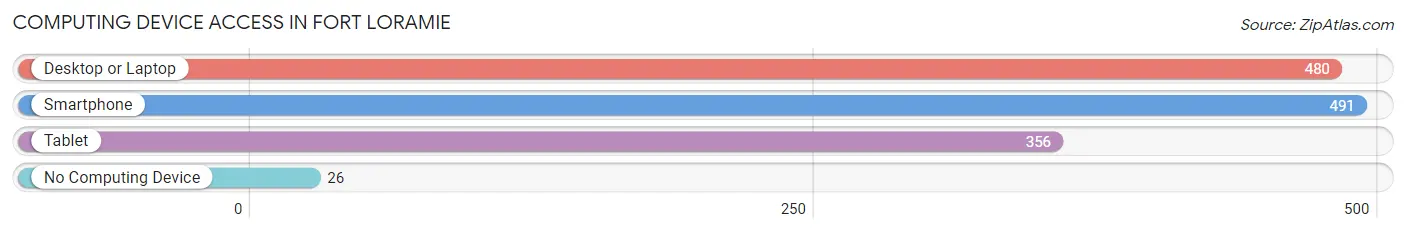
| Device Type | # Households | % Households |
| Desktop or Laptop | 480 | 81.8% |
| Smartphone | 491 | 83.7% |
| Tablet | 356 | 60.7% |
| No Computing Device | 26 | 4.4% |
| Total | 587 | 100.0% |
Internet Access in Fort Loramie
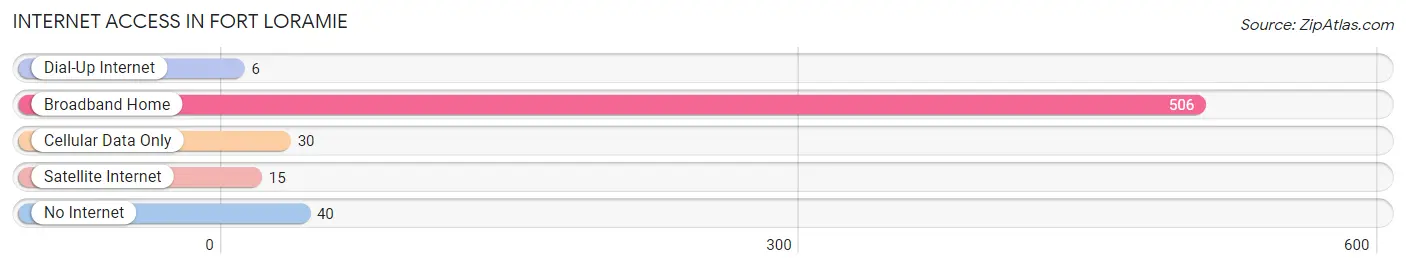
| Internet Type | # Households | % Households |
| Dial-Up Internet | 6 | 1.0% |
| Broadband Home | 506 | 86.2% |
| Cellular Data Only | 30 | 5.1% |
| Satellite Internet | 15 | 2.6% |
| No Internet | 40 | 6.8% |
| Total | 587 | 100.0% |
Fort Loramie Summary
History
Fort Loramie is a village located in Shelby County, Ohio, United States. It is situated along the Great Miami River, approximately 25 miles north of Dayton. The village was founded in 1817 by General William Henry Harrison, who named it after his friend, General Charles C. Loramie. The village was originally a military outpost, but it soon became a trading post and a center of commerce for the surrounding area.
The village was incorporated in 1837 and has since grown to a population of 1,541 as of the 2010 census. The village is home to a variety of businesses, including a grocery store, a bank, a post office, and several restaurants.
Geography
Fort Loramie is located at 40°25'25" North, 84°25'45" West (40.423, -84.429). The village is situated along the Great Miami River, approximately 25 miles north of Dayton. The village is located in the Miami Valley region of Ohio, and is part of the Dayton Metropolitan Statistical Area.
The village has a total area of 1.2 square miles, all of which is land. The village is located in a rural area, and is surrounded by farmland.
Economy
Fort Loramie is a small village with a population of 1,541 as of the 2010 census. The village is home to a variety of businesses, including a grocery store, a bank, a post office, and several restaurants.
The village is also home to several manufacturing companies, including a plastics manufacturer, a metal fabricator, and a machine shop. The village is also home to a number of small businesses, including a bakery, a florist, and a furniture store.
Demographics
As of the 2010 census, the village had a population of 1,541. The racial makeup of the village was 97.3% White, 0.3% African American, 0.2% Native American, 0.4% Asian, 0.1% Pacific Islander, 0.7% from other races, and 0.9% from two or more races. Hispanic or Latino of any race were 1.3% of the population.
The median income for a household in the village was $45,938, and the median income for a family was $51,250. Males had a median income of $37,500 versus $25,000 for females. The per capita income for the village was $20,945. About 4.3% of families and 5.2% of the population were below the poverty line, including 6.2% of those under age 18 and 4.2% of those age 65 or over.
Common Questions
What is Per Capita Income in Fort Loramie?
Per Capita income in Fort Loramie is $39,267.
What is the Median Family Income in Fort Loramie?
Median Family Income in Fort Loramie is $106,389.
What is the Median Household income in Fort Loramie?
Median Household Income in Fort Loramie is $82,917.
What is Income or Wage Gap in Fort Loramie?
Income or Wage Gap in Fort Loramie is 35.1%.
Women in Fort Loramie earn 64.9 cents for every dollar earned by a man.
What is Inequality or Gini Index in Fort Loramie?
Inequality or Gini Index in Fort Loramie is 0.38.
What is the Total Population of Fort Loramie?
Total Population of Fort Loramie is 1,494.
What is the Total Male Population of Fort Loramie?
Total Male Population of Fort Loramie is 777.
What is the Total Female Population of Fort Loramie?
Total Female Population of Fort Loramie is 717.
What is the Ratio of Males per 100 Females in Fort Loramie?
There are 108.37 Males per 100 Females in Fort Loramie.
What is the Ratio of Females per 100 Males in Fort Loramie?
There are 92.28 Females per 100 Males in Fort Loramie.
What is the Median Population Age in Fort Loramie?
Median Population Age in Fort Loramie is 33.0 Years.
What is the Average Family Size in Fort Loramie
Average Family Size in Fort Loramie is 3.3 People.
What is the Average Household Size in Fort Loramie
Average Household Size in Fort Loramie is 2.5 People.
How Large is the Labor Force in Fort Loramie?
There are 803 People in the Labor Forcein in Fort Loramie.
What is the Percentage of People in the Labor Force in Fort Loramie?
72.5% of People are in the Labor Force in Fort Loramie.
What is the Unemployment Rate in Fort Loramie?
Unemployment Rate in Fort Loramie is 1.2%.