Elmore, OH Map & Demographics
Elmore Map
Elmore Overview
$31,669
PER CAPITA INCOME
$104,583
AVG FAMILY INCOME
$69,583
AVG HOUSEHOLD INCOME
53.5%
WAGE / INCOME GAP [ % ]
46.5¢/ $1
WAGE / INCOME GAP [ $ ]
0.42
INEQUALITY / GINI INDEX
1,601
TOTAL POPULATION
793
MALE POPULATION
808
FEMALE POPULATION
98.14
MALES / 100 FEMALES
101.89
FEMALES / 100 MALES
37.3
MEDIAN AGE
3.3
AVG FAMILY SIZE
2.6
AVG HOUSEHOLD SIZE
764
LABOR FORCE [ PEOPLE ]
61.7%
PERCENT IN LABOR FORCE
Elmore Zip Codes
Income in Elmore
Income Overview in Elmore
Per Capita Income in Elmore is $31,669, while median incomes of families and households are $104,583 and $69,583 respectively.
| Characteristic | Number | Measure |
| Per Capita Income | 1,601 | $31,669 |
| Median Family Income | 419 | $104,583 |
| Mean Family Income | 419 | $101,994 |
| Median Household Income | 607 | $69,583 |
| Mean Household Income | 607 | $80,504 |
| Income Deficit | 419 | $0 |
| Wage / Income Gap (%) | 1,601 | 53.52% |
| Wage / Income Gap ($) | 1,601 | 46.48¢ per $1 |
| Gini / Inequality Index | 1,601 | 0.42 |
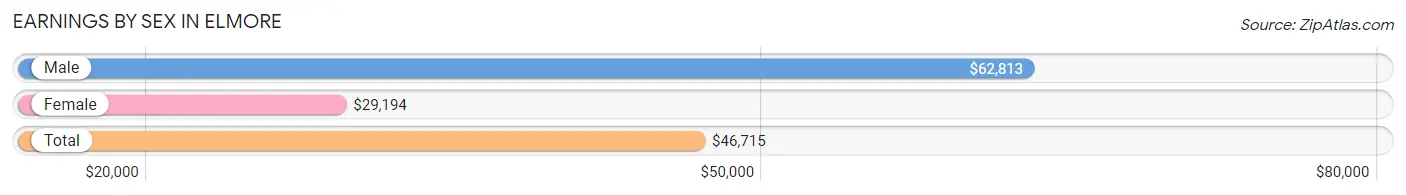
Earnings by Sex in Elmore
Average Earnings in Elmore are $46,715, $62,813 for men and $29,194 for women, a difference of 53.5%.
| Sex | Number | Average Earnings |
| Male | 423 (51.5%) | $62,813 |
| Female | 398 (48.5%) | $29,194 |
| Total | 821 (100.0%) | $46,715 |
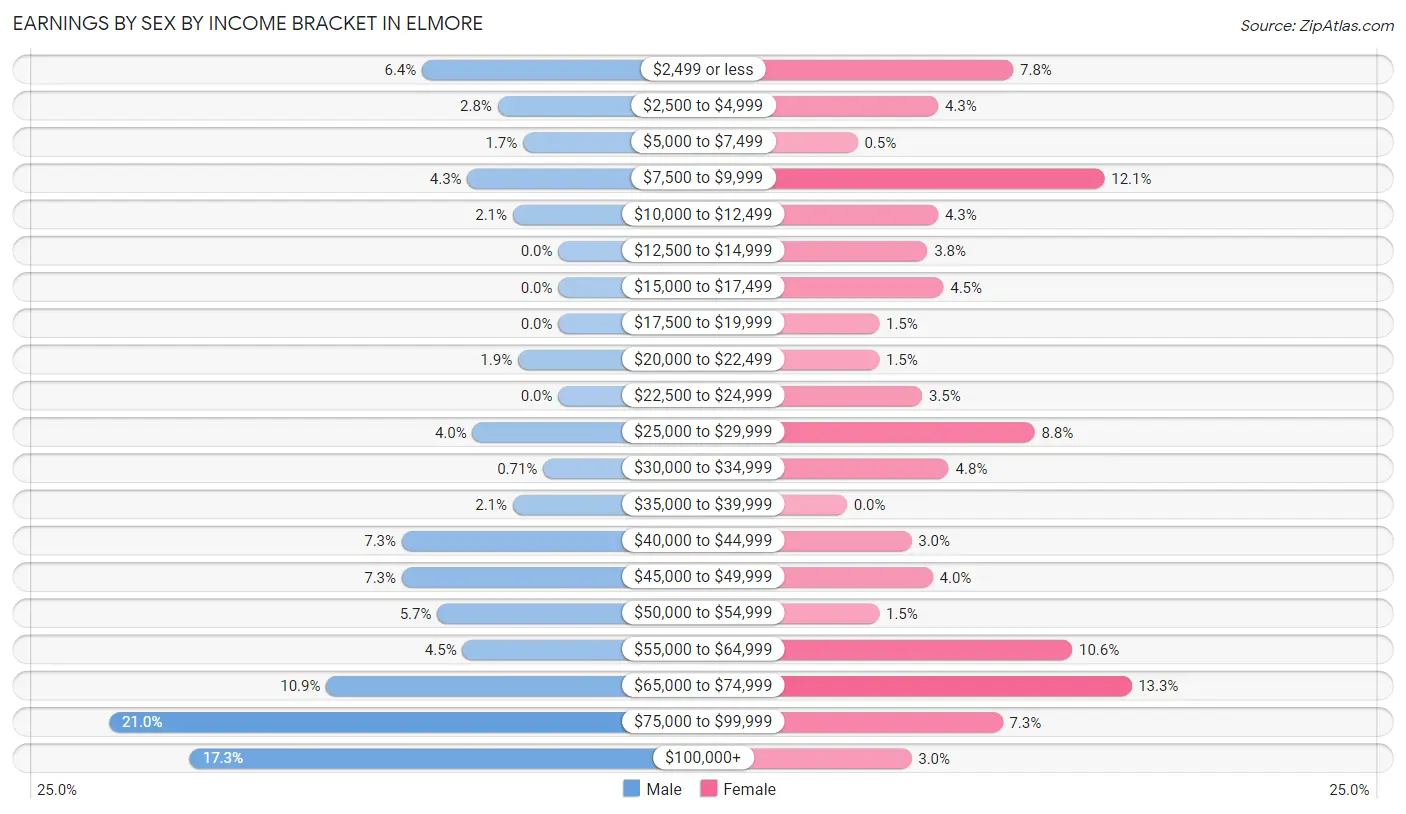
Earnings by Sex by Income Bracket in Elmore
The most common earnings brackets in Elmore are $75,000 to $99,999 for men (89 | 21.0%) and $65,000 to $74,999 for women (53 | 13.3%).
| Income | Male | Female |
| $2,499 or less | 27 (6.4%) | 31 (7.8%) |
| $2,500 to $4,999 | 12 (2.8%) | 17 (4.3%) |
| $5,000 to $7,499 | 7 (1.7%) | 2 (0.5%) |
| $7,500 to $9,999 | 18 (4.3%) | 48 (12.1%) |
| $10,000 to $12,499 | 9 (2.1%) | 17 (4.3%) |
| $12,500 to $14,999 | 0 (0.0%) | 15 (3.8%) |
| $15,000 to $17,499 | 0 (0.0%) | 18 (4.5%) |
| $17,500 to $19,999 | 0 (0.0%) | 6 (1.5%) |
| $20,000 to $22,499 | 8 (1.9%) | 6 (1.5%) |
| $22,500 to $24,999 | 0 (0.0%) | 14 (3.5%) |
| $25,000 to $29,999 | 17 (4.0%) | 35 (8.8%) |
| $30,000 to $34,999 | 3 (0.7%) | 19 (4.8%) |
| $35,000 to $39,999 | 9 (2.1%) | 0 (0.0%) |
| $40,000 to $44,999 | 31 (7.3%) | 12 (3.0%) |
| $45,000 to $49,999 | 31 (7.3%) | 16 (4.0%) |
| $50,000 to $54,999 | 24 (5.7%) | 6 (1.5%) |
| $55,000 to $64,999 | 19 (4.5%) | 42 (10.5%) |
| $65,000 to $74,999 | 46 (10.9%) | 53 (13.3%) |
| $75,000 to $99,999 | 89 (21.0%) | 29 (7.3%) |
| $100,000+ | 73 (17.3%) | 12 (3.0%) |
| Total | 423 (100.0%) | 398 (100.0%) |
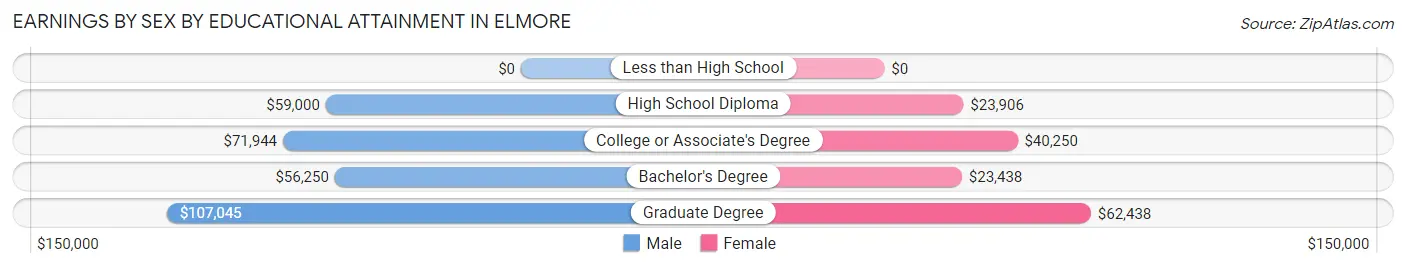
Earnings by Sex by Educational Attainment in Elmore
Average earnings in Elmore are $71,204 for men and $43,750 for women, a difference of 38.6%. Men with an educational attainment of graduate degree enjoy the highest average annual earnings of $107,045, while those with bachelor's degree education earn the least with $56,250. Women with an educational attainment of graduate degree earn the most with the average annual earnings of $62,438, while those with bachelor's degree education have the smallest earnings of $23,438.
| Educational Attainment | Male Income | Female Income |
| Less than High School | - | - |
| High School Diploma | $59,000 | $23,906 |
| College or Associate's Degree | $71,944 | $40,250 |
| Bachelor's Degree | $56,250 | $23,438 |
| Graduate Degree | $107,045 | $62,438 |
| Total | $71,204 | $43,750 |
Family Income in Elmore
Family Income Brackets in Elmore
According to the Elmore family income data, there are 137 families falling into the $100,000 to $149,999 income range, which is the most common income bracket and makes up 32.7% of all families. Conversely, the less than $10,000 income bracket is the least frequent group with only 11 families (2.6%) belonging to this category.
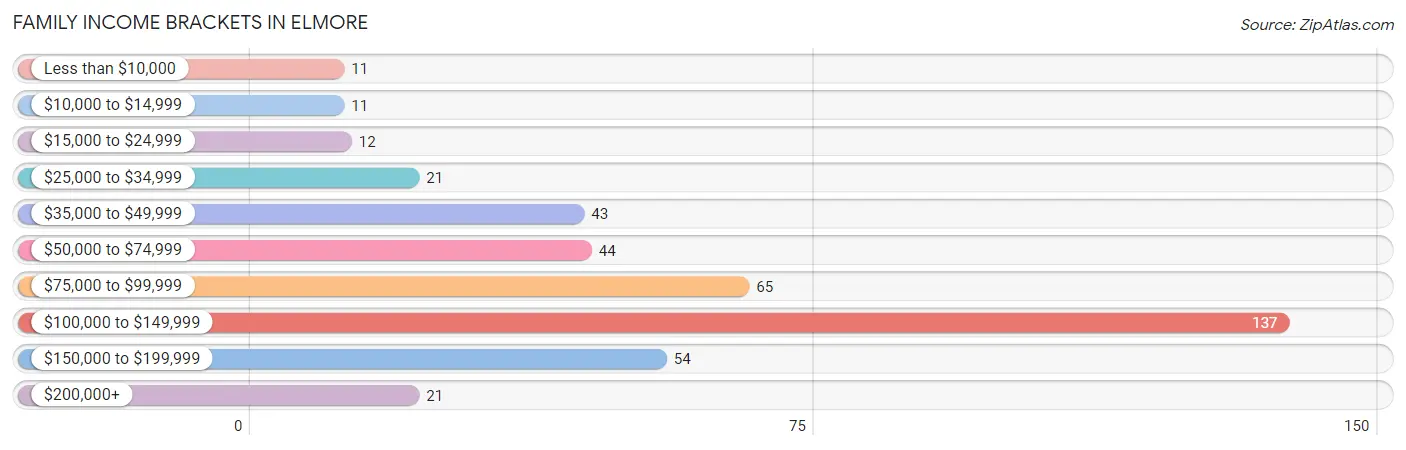
| Income Bracket | # Families | % Families |
| Less than $10,000 | 11 | 2.6% |
| $10,000 to $14,999 | 11 | 2.6% |
| $15,000 to $24,999 | 12 | 2.9% |
| $25,000 to $34,999 | 21 | 5.0% |
| $35,000 to $49,999 | 43 | 10.3% |
| $50,000 to $74,999 | 44 | 10.5% |
| $75,000 to $99,999 | 65 | 15.5% |
| $100,000 to $149,999 | 137 | 32.7% |
| $150,000 to $199,999 | 54 | 12.9% |
| $200,000+ | 21 | 5.0% |
Family Income by Famaliy Size in Elmore
4-person families (79 | 18.9%) account for the highest median family income in Elmore with $140,139 per family, while 2-person families (198 | 47.3%) have the highest median income of $43,750 per family member.
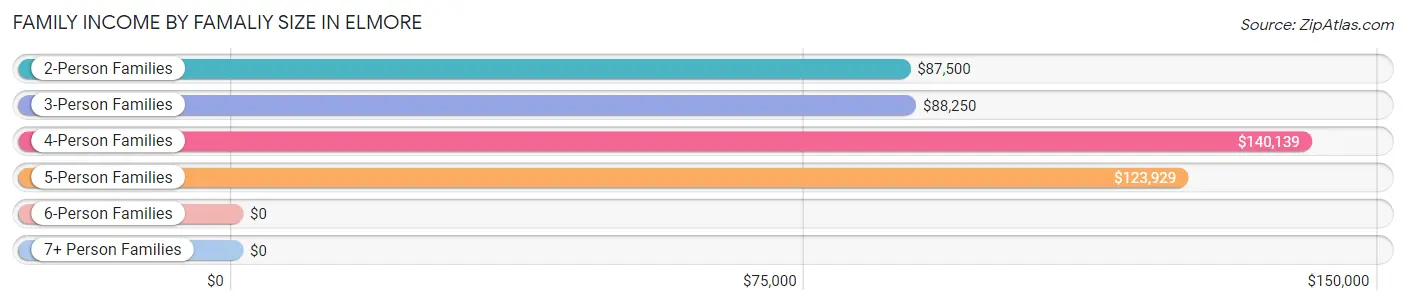
| Income Bracket | # Families | Median Income |
| 2-Person Families | 198 (47.3%) | $87,500 |
| 3-Person Families | 82 (19.6%) | $88,250 |
| 4-Person Families | 79 (18.9%) | $140,139 |
| 5-Person Families | 40 (9.6%) | $123,929 |
| 6-Person Families | 4 (0.9%) | $0 |
| 7+ Person Families | 16 (3.8%) | $0 |
| Total | 419 (100.0%) | $104,583 |
Family Income by Number of Earners in Elmore
The median family income in Elmore is $104,583, with families comprising 3+ earners (45) having the highest median family income of $125,893, while families with 1 earner (90) have the lowest median family income of $44,107, accounting for 10.7% and 21.5% of families, respectively.
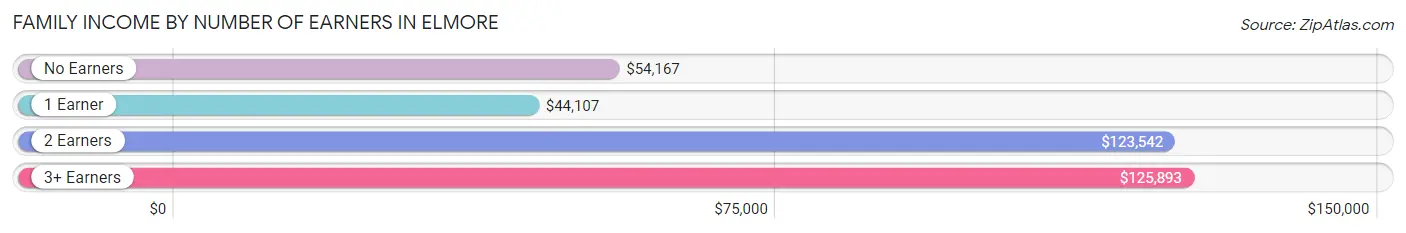
| Number of Earners | # Families | Median Income |
| No Earners | 64 (15.3%) | $54,167 |
| 1 Earner | 90 (21.5%) | $44,107 |
| 2 Earners | 220 (52.5%) | $123,542 |
| 3+ Earners | 45 (10.7%) | $125,893 |
| Total | 419 (100.0%) | $104,583 |
Household Income in Elmore
Household Income Brackets in Elmore
With 153 households falling in the category, the $100,000 to $149,999 income range is the most frequent in Elmore, accounting for 25.2% of all households. In contrast, only 21 households (3.5%) fall into the $200,000+ income bracket, making it the least populous group.
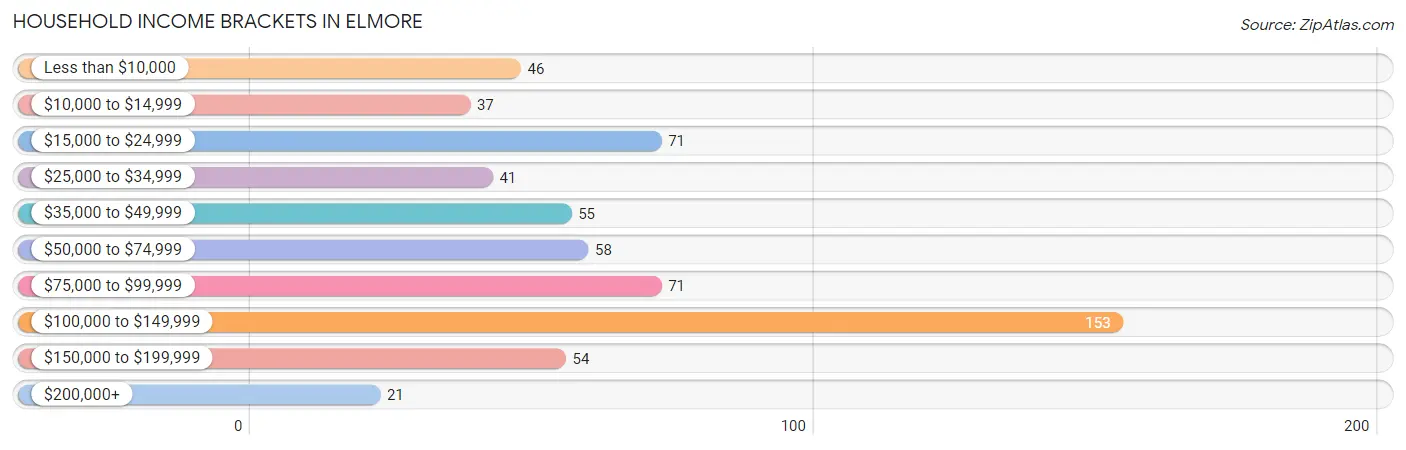
| Income Bracket | # Households | % Households |
| Less than $10,000 | 46 | 7.6% |
| $10,000 to $14,999 | 37 | 6.1% |
| $15,000 to $24,999 | 71 | 11.7% |
| $25,000 to $34,999 | 41 | 6.8% |
| $35,000 to $49,999 | 55 | 9.1% |
| $50,000 to $74,999 | 58 | 9.6% |
| $75,000 to $99,999 | 71 | 11.7% |
| $100,000 to $149,999 | 153 | 25.2% |
| $150,000 to $199,999 | 54 | 8.9% |
| $200,000+ | 21 | 3.5% |
Household Income by Householder Age in Elmore
The median household income in Elmore is $69,583, with the highest median household income of $125,893 found in the 25 to 44 years age bracket for the primary householder. A total of 153 households (25.2%) fall into this category. Meanwhile, the 15 to 24 years age bracket for the primary householder has the lowest median household income of $0, with 24 households (4.0%) in this group.
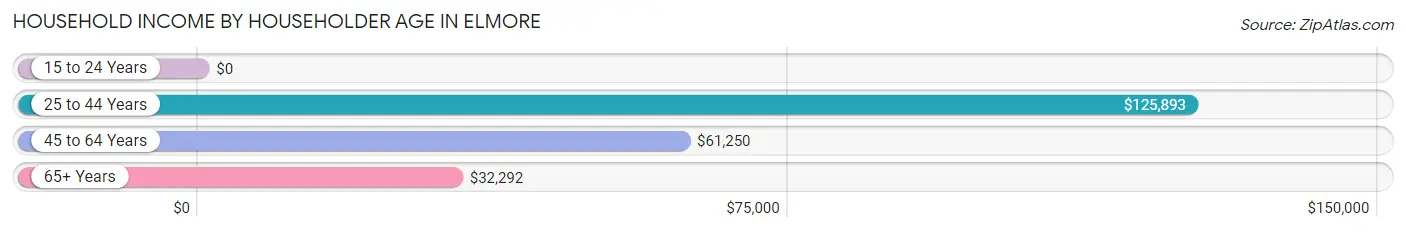
| Income Bracket | # Households | Median Income |
| 15 to 24 Years | 24 (4.0%) | $0 |
| 25 to 44 Years | 153 (25.2%) | $125,893 |
| 45 to 64 Years | 297 (48.9%) | $61,250 |
| 65+ Years | 133 (21.9%) | $32,292 |
| Total | 607 (100.0%) | $69,583 |
Poverty in Elmore
Income Below Poverty by Sex and Age in Elmore
With 6.0% poverty level for males and 13.5% for females among the residents of Elmore, 12 to 14 year old males and 15 year old females are the most vulnerable to poverty, with 7 males (21.2%) and 10 females (71.4%) in their respective age groups living below the poverty level.
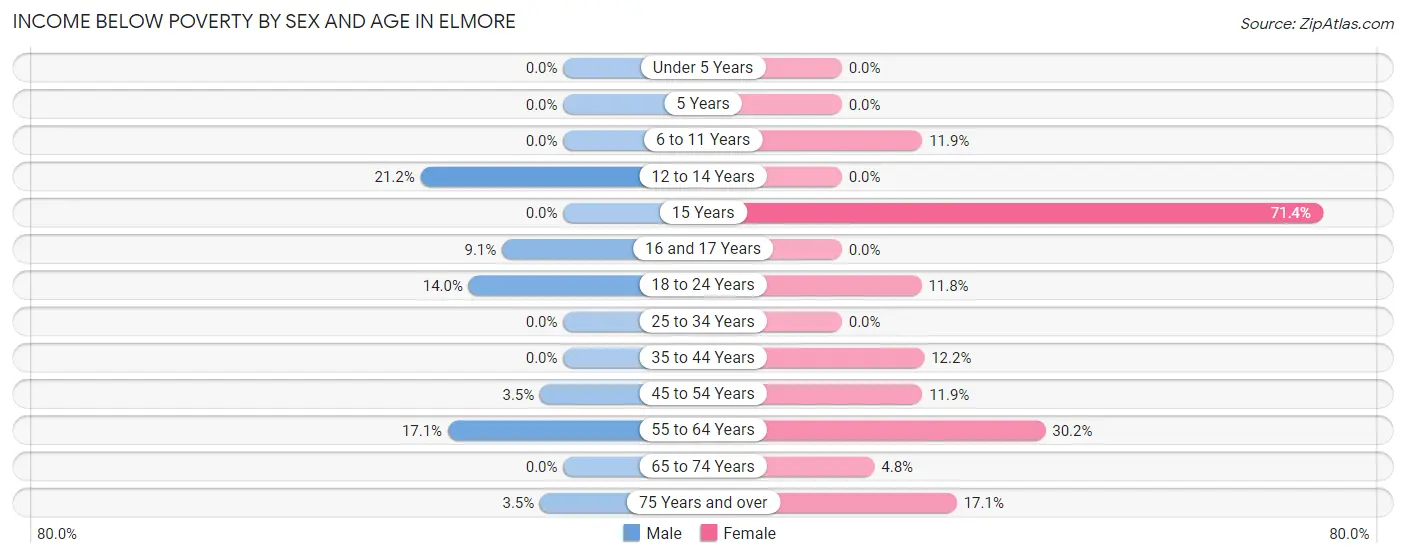
| Age Bracket | Male | Female |
| Under 5 Years | 0 (0.0%) | 0 (0.0%) |
| 5 Years | 0 (0.0%) | 0 (0.0%) |
| 6 to 11 Years | 0 (0.0%) | 8 (11.9%) |
| 12 to 14 Years | 7 (21.2%) | 0 (0.0%) |
| 15 Years | 0 (0.0%) | 10 (71.4%) |
| 16 and 17 Years | 3 (9.1%) | 0 (0.0%) |
| 18 to 24 Years | 16 (14.0%) | 11 (11.8%) |
| 25 to 34 Years | 0 (0.0%) | 0 (0.0%) |
| 35 to 44 Years | 0 (0.0%) | 12 (12.2%) |
| 45 to 54 Years | 3 (3.5%) | 16 (11.9%) |
| 55 to 64 Years | 18 (17.1%) | 42 (30.2%) |
| 65 to 74 Years | 0 (0.0%) | 3 (4.8%) |
| 75 Years and over | 1 (3.5%) | 7 (17.1%) |
| Total | 48 (6.0%) | 109 (13.5%) |
Income Above Poverty by Sex and Age in Elmore
According to the poverty statistics in Elmore, males aged under 5 years and females aged under 5 years are the age groups that are most secure financially, with 100.0% of males and 100.0% of females in these age groups living above the poverty line.
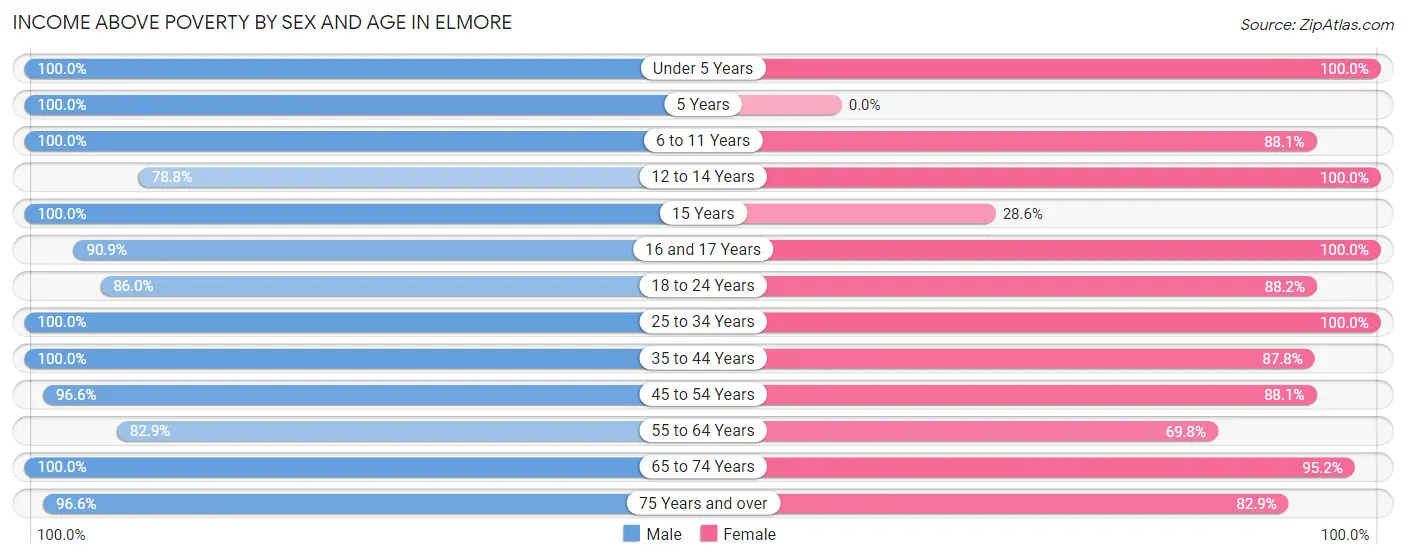
| Age Bracket | Male | Female |
| Under 5 Years | 40 (100.0%) | 41 (100.0%) |
| 5 Years | 8 (100.0%) | 0 (0.0%) |
| 6 to 11 Years | 118 (100.0%) | 59 (88.1%) |
| 12 to 14 Years | 26 (78.8%) | 28 (100.0%) |
| 15 Years | 10 (100.0%) | 4 (28.6%) |
| 16 and 17 Years | 30 (90.9%) | 20 (100.0%) |
| 18 to 24 Years | 98 (86.0%) | 82 (88.2%) |
| 25 to 34 Years | 57 (100.0%) | 68 (100.0%) |
| 35 to 44 Years | 100 (100.0%) | 86 (87.8%) |
| 45 to 54 Years | 84 (96.6%) | 118 (88.1%) |
| 55 to 64 Years | 87 (82.9%) | 97 (69.8%) |
| 65 to 74 Years | 59 (100.0%) | 59 (95.2%) |
| 75 Years and over | 28 (96.6%) | 34 (82.9%) |
| Total | 745 (94.0%) | 696 (86.5%) |
Income Below Poverty Among Married-Couple Families in Elmore
The poverty statistics for married-couple families in Elmore show that 2.4% or 9 of the total 378 families live below the poverty line. Families with no children have the highest poverty rate of 4.1%, comprising of 9 families. On the other hand, families with 1 or 2 children have the lowest poverty rate of 0.0%, which includes 0 families.
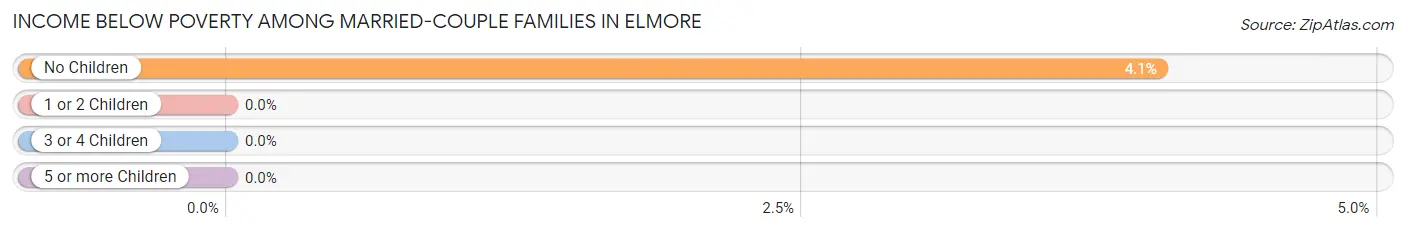
| Children | Above Poverty | Below Poverty |
| No Children | 213 (96.0%) | 9 (4.1%) |
| 1 or 2 Children | 102 (100.0%) | 0 (0.0%) |
| 3 or 4 Children | 38 (100.0%) | 0 (0.0%) |
| 5 or more Children | 16 (100.0%) | 0 (0.0%) |
| Total | 369 (97.6%) | 9 (2.4%) |
Income Below Poverty Among Single-Parent Households in Elmore
According to the poverty data in Elmore, 100.0% or 3 single-father households and 36.8% or 14 single-mother households are living below the poverty line. Among single-father households, those with 1 or 2 children have the highest poverty rate, with 3 households (100.0%) experiencing poverty. Likewise, among single-mother households, those with 1 or 2 children have the highest poverty rate, with 11 households (55.0%) falling below the poverty line.
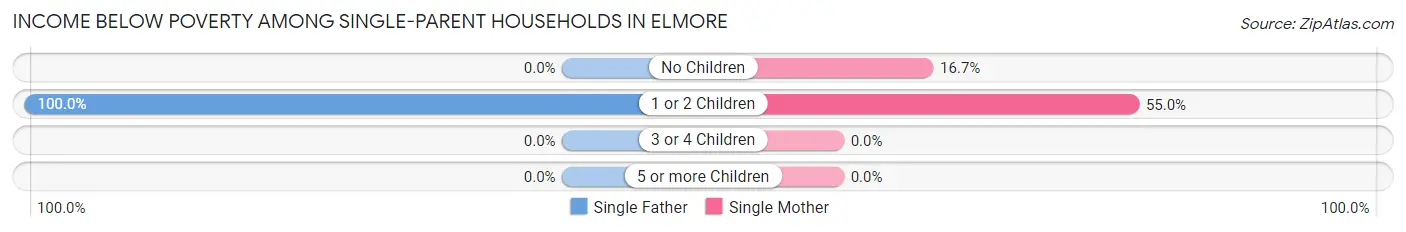
| Children | Single Father | Single Mother |
| No Children | 0 (0.0%) | 3 (16.7%) |
| 1 or 2 Children | 3 (100.0%) | 11 (55.0%) |
| 3 or 4 Children | 0 (0.0%) | 0 (0.0%) |
| 5 or more Children | 0 (0.0%) | 0 (0.0%) |
| Total | 3 (100.0%) | 14 (36.8%) |
Income Below Poverty Among Married-Couple vs Single-Parent Households in Elmore
The poverty data for Elmore shows that 9 of the married-couple family households (2.4%) and 17 of the single-parent households (41.5%) are living below the poverty level. Within the married-couple family households, those with no children have the highest poverty rate, with 9 households (4.1%) falling below the poverty line. Among the single-parent households, those with 1 or 2 children have the highest poverty rate, with 14 household (60.9%) living below poverty.
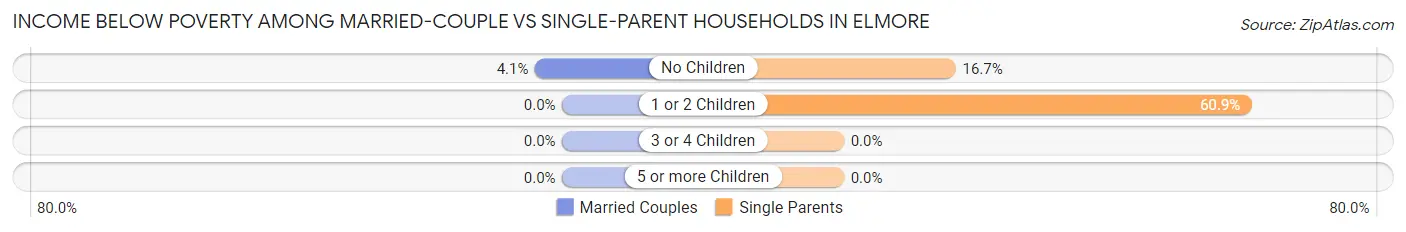
| Children | Married-Couple Families | Single-Parent Households |
| No Children | 9 (4.1%) | 3 (16.7%) |
| 1 or 2 Children | 0 (0.0%) | 14 (60.9%) |
| 3 or 4 Children | 0 (0.0%) | 0 (0.0%) |
| 5 or more Children | 0 (0.0%) | 0 (0.0%) |
| Total | 9 (2.4%) | 17 (41.5%) |
Race in Elmore
The most populous races in Elmore are White / Caucasian (1,364 | 85.2%), Hispanic or Latino (214 | 13.4%), and Two or more Races (136 | 8.5%).
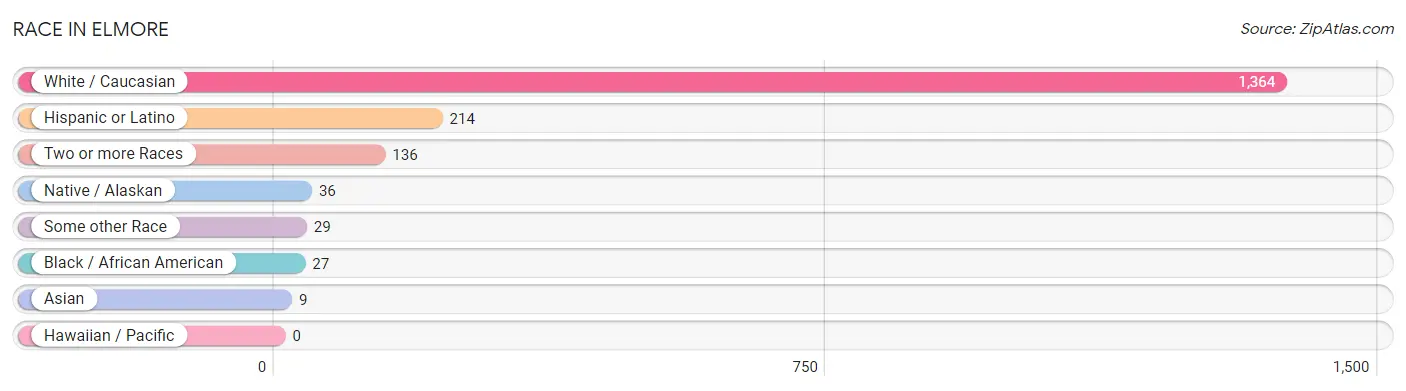
| Race | # Population | % Population |
| Asian | 9 | 0.6% |
| Black / African American | 27 | 1.7% |
| Hawaiian / Pacific | 0 | 0.0% |
| Hispanic or Latino | 214 | 13.4% |
| Native / Alaskan | 36 | 2.2% |
| White / Caucasian | 1,364 | 85.2% |
| Two or more Races | 136 | 8.5% |
| Some other Race | 29 | 1.8% |
| Total | 1,601 | 100.0% |
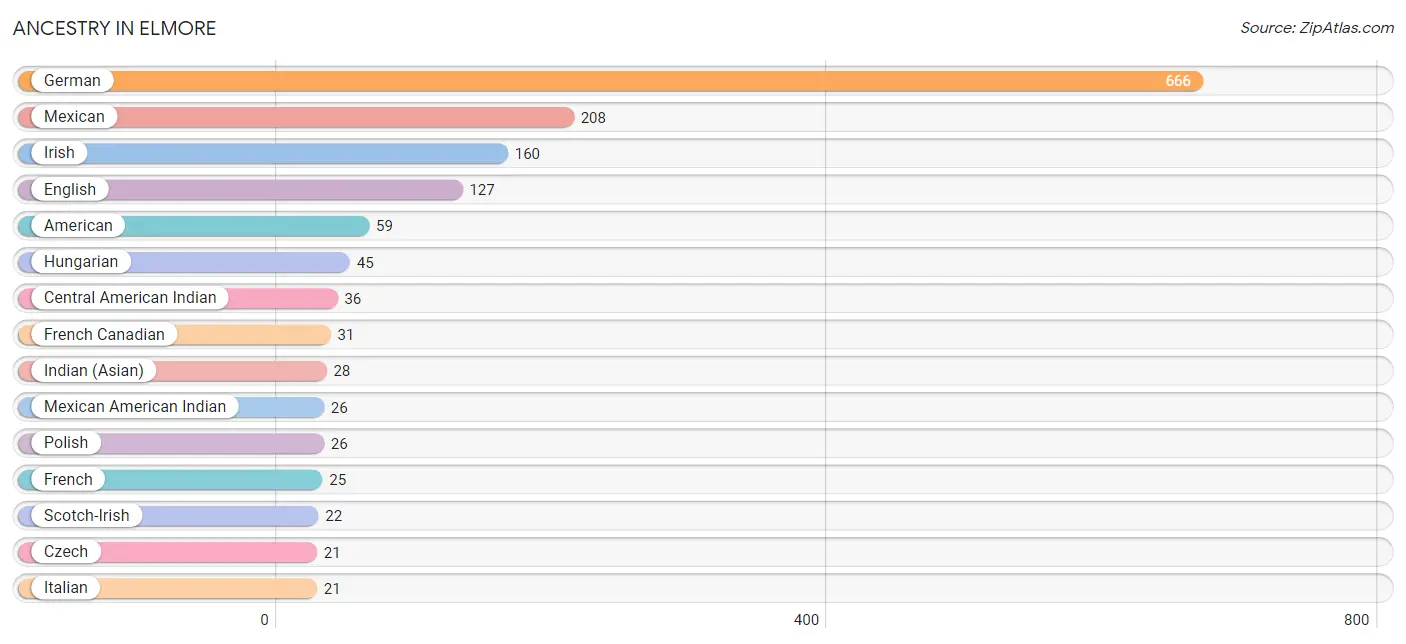
Ancestry in Elmore
The most populous ancestries reported in Elmore are German (666 | 41.6%), Mexican (208 | 13.0%), Irish (160 | 10.0%), English (127 | 7.9%), and American (59 | 3.7%), together accounting for 76.2% of all Elmore residents.
| Ancestry | # Population | % Population |
| African | 2 | 0.1% |
| American | 59 | 3.7% |
| Belgian | 3 | 0.2% |
| British | 14 | 0.9% |
| Canadian | 11 | 0.7% |
| Central American Indian | 36 | 2.2% |
| Czech | 21 | 1.3% |
| Dutch | 12 | 0.7% |
| English | 127 | 7.9% |
| European | 6 | 0.4% |
| Finnish | 4 | 0.3% |
| French | 25 | 1.6% |
| French Canadian | 31 | 1.9% |
| German | 666 | 41.6% |
| Hungarian | 45 | 2.8% |
| Indian (Asian) | 28 | 1.8% |
| Irish | 160 | 10.0% |
| Italian | 21 | 1.3% |
| Mexican | 208 | 13.0% |
| Mexican American Indian | 26 | 1.6% |
| Norwegian | 11 | 0.7% |
| Polish | 26 | 1.6% |
| Puerto Rican | 2 | 0.1% |
| Scandinavian | 16 | 1.0% |
| Scotch-Irish | 22 | 1.4% |
| Scottish | 15 | 0.9% |
| Slavic | 3 | 0.2% |
| Spanish | 4 | 0.3% |
| Subsaharan African | 2 | 0.1% |
| Swiss | 6 | 0.4% |
| Welsh | 15 | 0.9% | View All 31 Rows |
Immigrants in Elmore
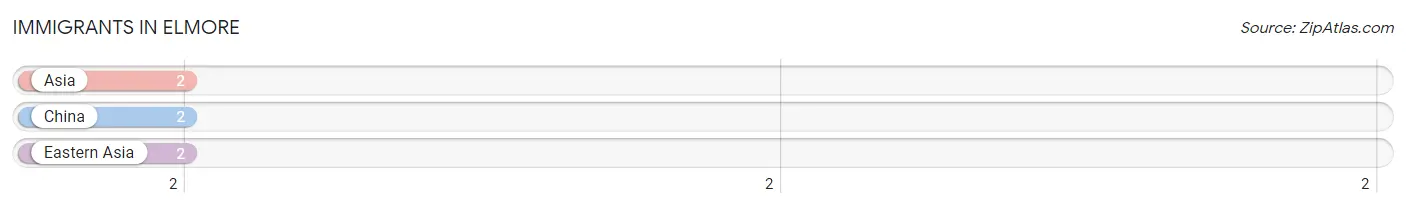
The most numerous immigrant groups reported in Elmore came from Asia (2 | 0.1%), China (2 | 0.1%), and Eastern Asia (2 | 0.1%), together accounting for 0.4% of all Elmore residents.
| Immigration Origin | # Population | % Population |
| Asia | 2 | 0.1% |
| China | 2 | 0.1% |
| Eastern Asia | 2 | 0.1% | View All 3 Rows |
Sex and Age in Elmore
Sex and Age in Elmore
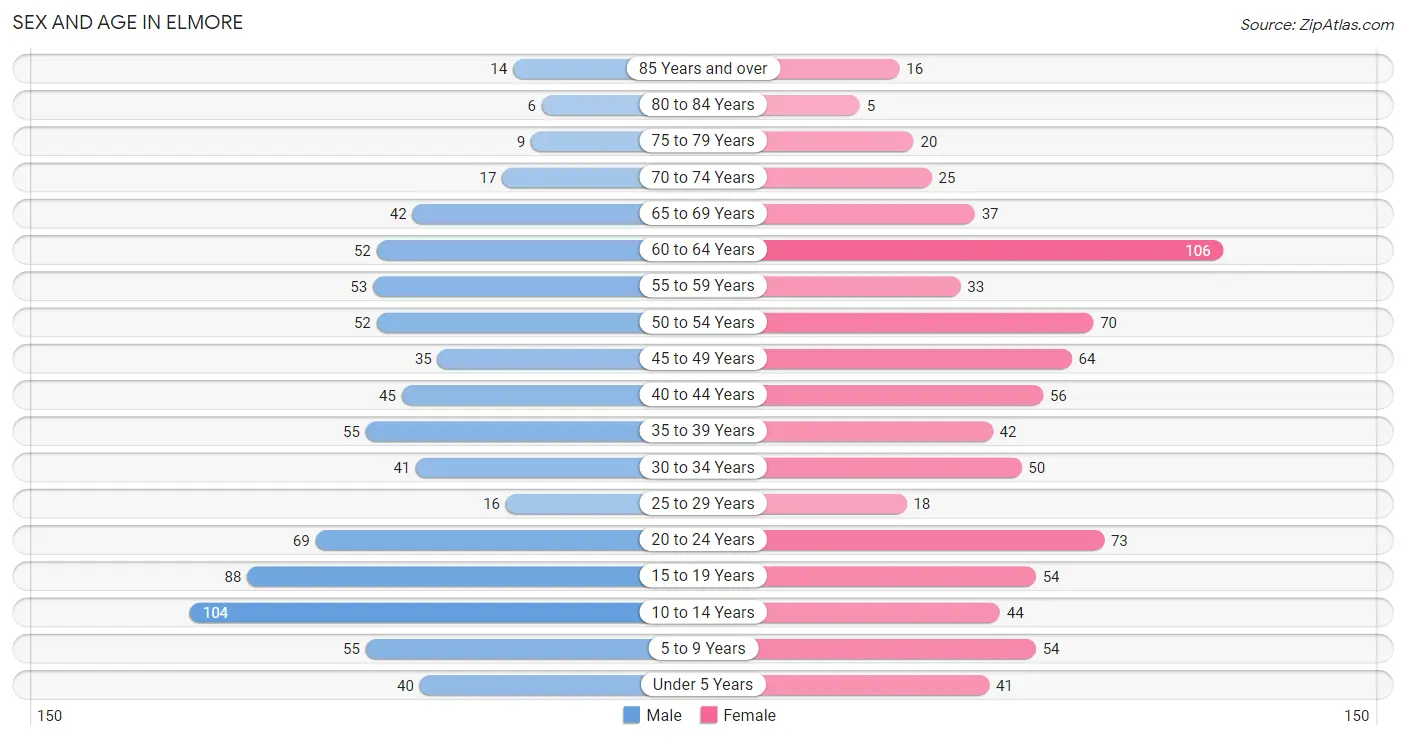
The most populous age groups in Elmore are 10 to 14 Years (104 | 13.1%) for men and 60 to 64 Years (106 | 13.1%) for women.
| Age Bracket | Male | Female |
| Under 5 Years | 40 (5.0%) | 41 (5.1%) |
| 5 to 9 Years | 55 (6.9%) | 54 (6.7%) |
| 10 to 14 Years | 104 (13.1%) | 44 (5.4%) |
| 15 to 19 Years | 88 (11.1%) | 54 (6.7%) |
| 20 to 24 Years | 69 (8.7%) | 73 (9.0%) |
| 25 to 29 Years | 16 (2.0%) | 18 (2.2%) |
| 30 to 34 Years | 41 (5.2%) | 50 (6.2%) |
| 35 to 39 Years | 55 (6.9%) | 42 (5.2%) |
| 40 to 44 Years | 45 (5.7%) | 56 (6.9%) |
| 45 to 49 Years | 35 (4.4%) | 64 (7.9%) |
| 50 to 54 Years | 52 (6.6%) | 70 (8.7%) |
| 55 to 59 Years | 53 (6.7%) | 33 (4.1%) |
| 60 to 64 Years | 52 (6.6%) | 106 (13.1%) |
| 65 to 69 Years | 42 (5.3%) | 37 (4.6%) |
| 70 to 74 Years | 17 (2.1%) | 25 (3.1%) |
| 75 to 79 Years | 9 (1.1%) | 20 (2.5%) |
| 80 to 84 Years | 6 (0.8%) | 5 (0.6%) |
| 85 Years and over | 14 (1.8%) | 16 (2.0%) |
| Total | 793 (100.0%) | 808 (100.0%) |
Families and Households in Elmore
Median Family Size in Elmore
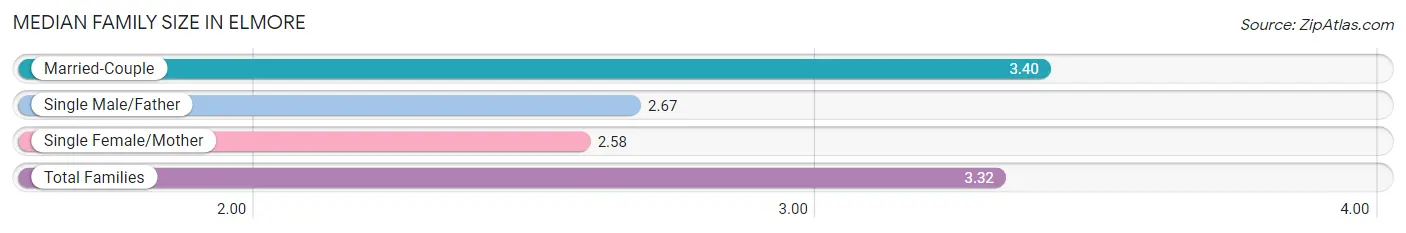
The median family size in Elmore is 3.32 persons per family, with married-couple families (378 | 90.2%) accounting for the largest median family size of 3.4 persons per family. On the other hand, single female/mother families (38 | 9.1%) represent the smallest median family size with 2.58 persons per family.
| Family Type | # Families | Family Size |
| Married-Couple | 378 (90.2%) | 3.40 |
| Single Male/Father | 3 (0.7%) | 2.67 |
| Single Female/Mother | 38 (9.1%) | 2.58 |
| Total Families | 419 (100.0%) | 3.32 |
Median Household Size in Elmore
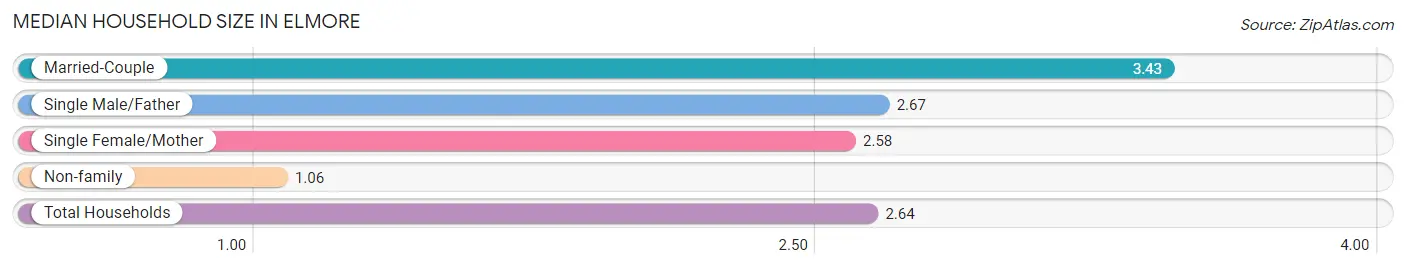
The median household size in Elmore is 2.64 persons per household, with married-couple households (378 | 62.3%) accounting for the largest median household size of 3.43 persons per household. non-family households (188 | 31.0%) represent the smallest median household size with 1.06 persons per household.
| Household Type | # Households | Household Size |
| Married-Couple | 378 (62.3%) | 3.43 |
| Single Male/Father | 3 (0.5%) | 2.67 |
| Single Female/Mother | 38 (6.3%) | 2.58 |
| Non-family | 188 (31.0%) | 1.06 |
| Total Households | 607 (100.0%) | 2.64 |
Household Size by Marriage Status in Elmore
Out of a total of 607 households in Elmore, 419 (69.0%) are family households, while 188 (31.0%) are nonfamily households. The most numerous type of family households are 2-person households, comprising 198, and the most common type of nonfamily households are 1-person households, comprising 182.
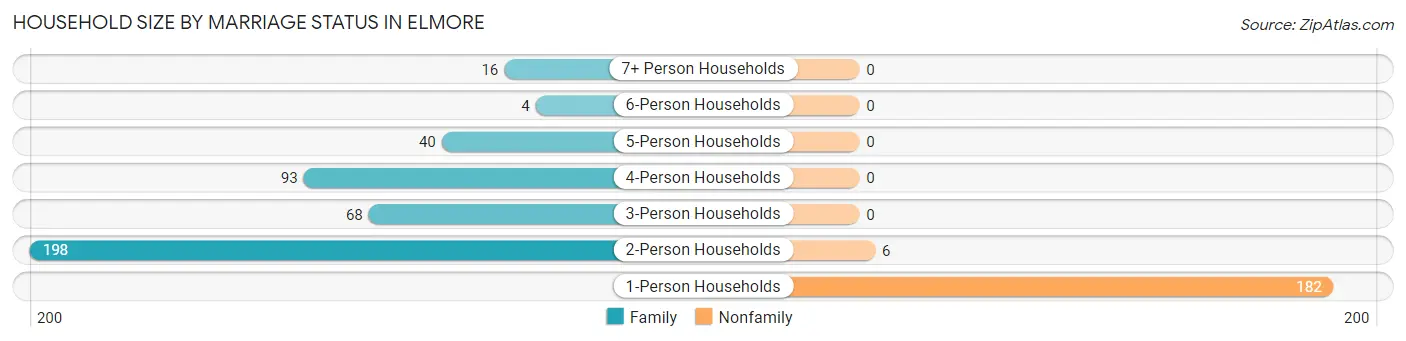
| Household Size | Family Households | Nonfamily Households |
| 1-Person Households | - | 182 (30.0%) |
| 2-Person Households | 198 (32.6%) | 6 (1.0%) |
| 3-Person Households | 68 (11.2%) | 0 (0.0%) |
| 4-Person Households | 93 (15.3%) | 0 (0.0%) |
| 5-Person Households | 40 (6.6%) | 0 (0.0%) |
| 6-Person Households | 4 (0.7%) | 0 (0.0%) |
| 7+ Person Households | 16 (2.6%) | 0 (0.0%) |
| Total | 419 (69.0%) | 188 (31.0%) |
Female Fertility in Elmore
Fertility by Age in Elmore
Average fertility rate in Elmore is 52.0 births per 1,000 women. Women in the age bracket of 20 to 34 years have the highest fertility rate with 121.0 births per 1,000 women. Women in the age bracket of 20 to 34 years acount for 89.5% of all women with births.
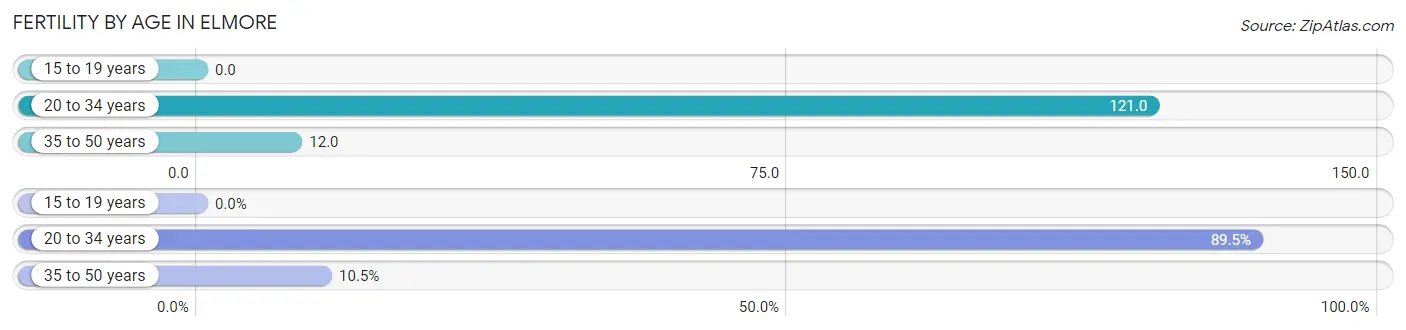
| Age Bracket | Women with Births | Births / 1,000 Women |
| 15 to 19 years | 0 (0.0%) | 0.0 |
| 20 to 34 years | 17 (89.5%) | 121.0 |
| 35 to 50 years | 2 (10.5%) | 12.0 |
| Total | 19 (100.0%) | 52.0 |
Fertility by Age by Marriage Status in Elmore
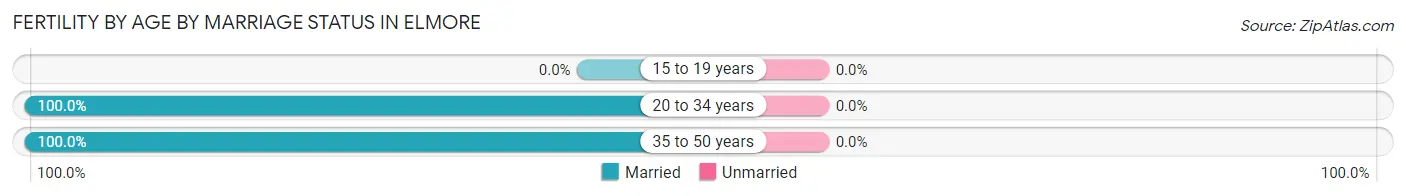
| Age Bracket | Married | Unmarried |
| 15 to 19 years | 0 (0.0%) | 0 (0.0%) |
| 20 to 34 years | 17 (100.0%) | 0 (0.0%) |
| 35 to 50 years | 2 (100.0%) | 0 (0.0%) |
| Total | 19 (100.0%) | 0 (0.0%) |
Fertility by Education in Elmore
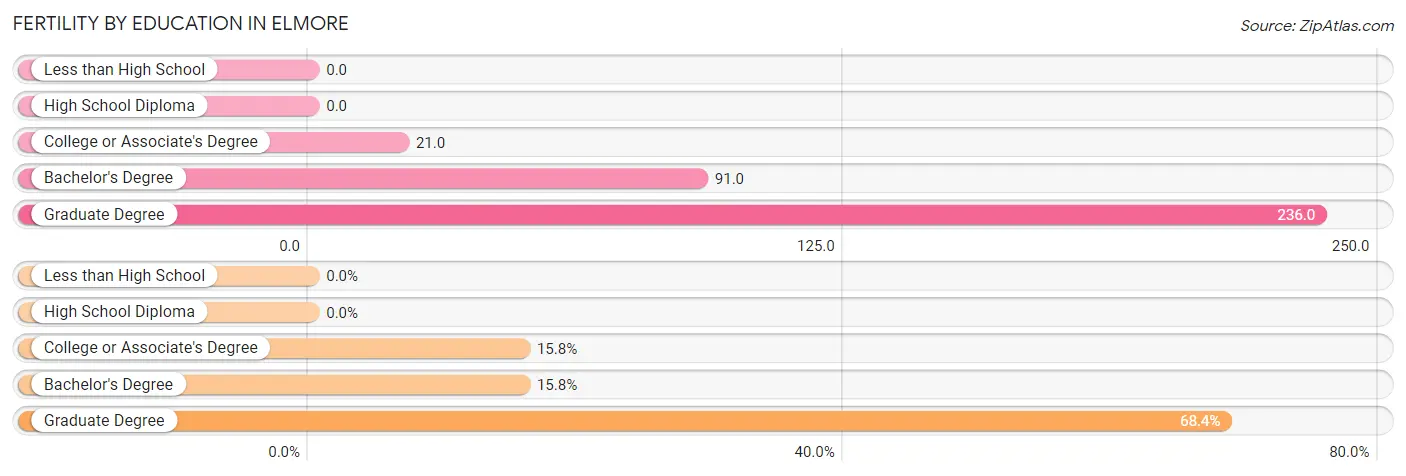
| Educational Attainment | Women with Births | Births / 1,000 Women |
| Less than High School | 0 (0.0%) | 0.0 |
| High School Diploma | 0 (0.0%) | 0.0 |
| College or Associate's Degree | 3 (15.8%) | 21.0 |
| Bachelor's Degree | 3 (15.8%) | 91.0 |
| Graduate Degree | 13 (68.4%) | 236.0 |
| Total | 19 (100.0%) | 52.0 |
Fertility by Education by Marriage Status in Elmore
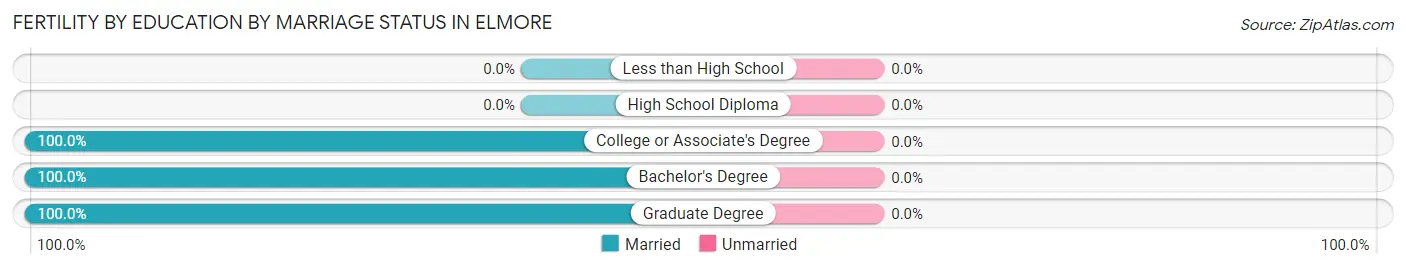
| Educational Attainment | Married | Unmarried |
| Less than High School | 0 (0.0%) | 0 (0.0%) |
| High School Diploma | 0 (0.0%) | 0 (0.0%) |
| College or Associate's Degree | 3 (100.0%) | 0 (0.0%) |
| Bachelor's Degree | 3 (100.0%) | 0 (0.0%) |
| Graduate Degree | 13 (100.0%) | 0 (0.0%) |
| Total | 19 (100.0%) | 0 (0.0%) |
Employment Characteristics in Elmore
Employment by Class of Employer in Elmore
Among the 761 employed individuals in Elmore, private company employees (450 | 59.1%), not-for-profit organizations (112 | 14.7%), and local government employees (86 | 11.3%) make up the most common classes of employment.
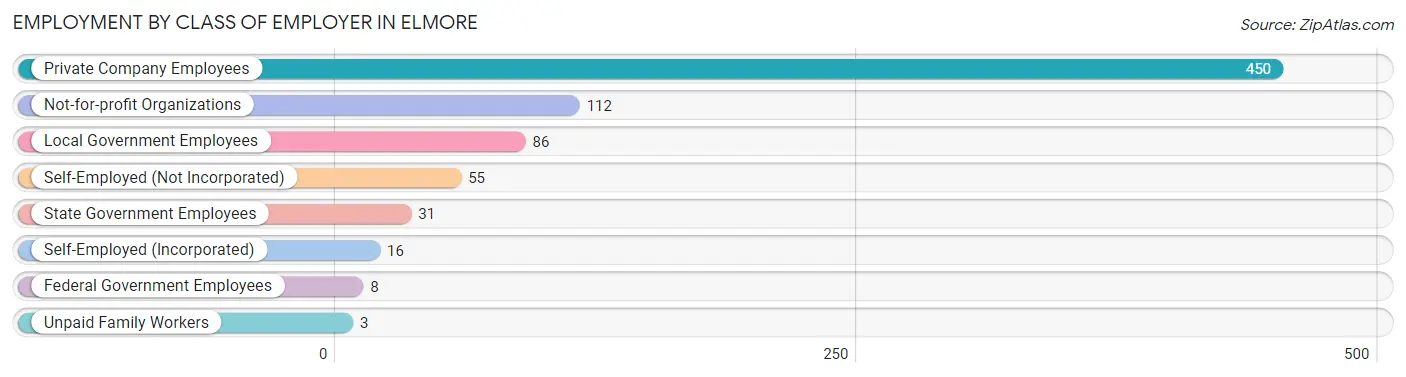
| Employer Class | # Employees | % Employees |
| Private Company Employees | 450 | 59.1% |
| Self-Employed (Incorporated) | 16 | 2.1% |
| Self-Employed (Not Incorporated) | 55 | 7.2% |
| Not-for-profit Organizations | 112 | 14.7% |
| Local Government Employees | 86 | 11.3% |
| State Government Employees | 31 | 4.1% |
| Federal Government Employees | 8 | 1.1% |
| Unpaid Family Workers | 3 | 0.4% |
| Total | 761 | 100.0% |
Employment Status by Age in Elmore
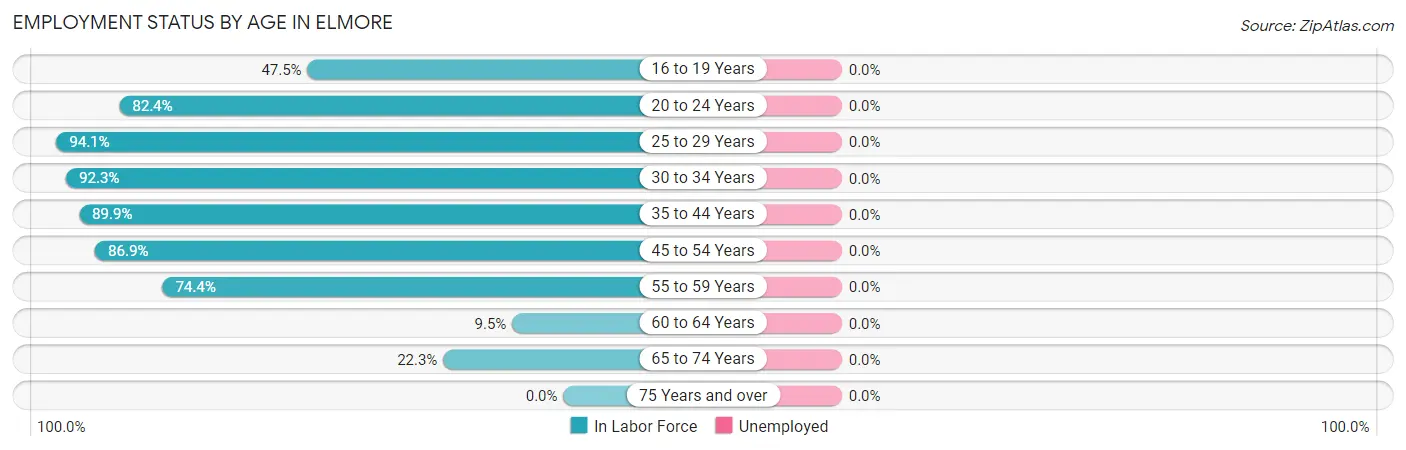
| Age Bracket | In Labor Force | Unemployed |
| 16 to 19 Years | 56 (47.5%) | 0 (0.0%) |
| 20 to 24 Years | 117 (82.4%) | 0 (0.0%) |
| 25 to 29 Years | 32 (94.1%) | 0 (0.0%) |
| 30 to 34 Years | 84 (92.3%) | 0 (0.0%) |
| 35 to 44 Years | 178 (89.9%) | 0 (0.0%) |
| 45 to 54 Years | 192 (86.9%) | 0 (0.0%) |
| 55 to 59 Years | 64 (74.4%) | 0 (0.0%) |
| 60 to 64 Years | 15 (9.5%) | 0 (0.0%) |
| 65 to 74 Years | 27 (22.3%) | 0 (0.0%) |
| 75 Years and over | 0 (0.0%) | 0 (0.0%) |
| Total | 764 (61.7%) | 0 (0.0%) |
Employment Status by Educational Attainment in Elmore
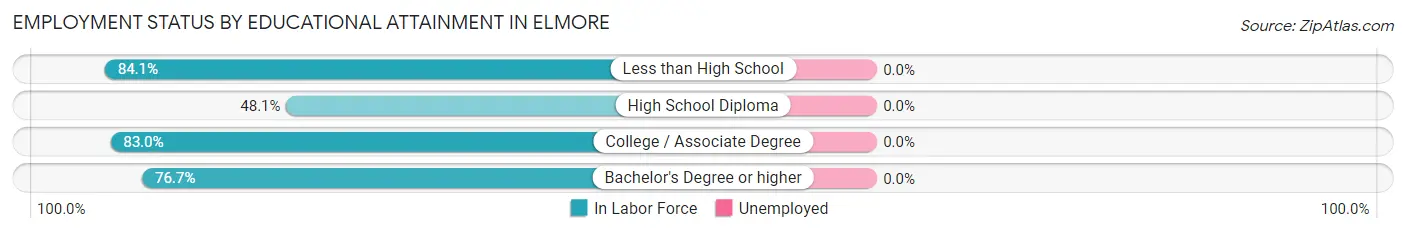
| Educational Attainment | In Labor Force | Unemployed |
| Less than High School | 37 (84.1%) | 0 (0.0%) |
| High School Diploma | 103 (48.1%) | 0 (0.0%) |
| College / Associate Degree | 244 (83.0%) | 0 (0.0%) |
| Bachelor's Degree or higher | 181 (76.7%) | 0 (0.0%) |
| Total | 565 (71.7%) | 0 (0.0%) |
Employment Occupations by Sex in Elmore
Management, Business, Science and Arts Occupations
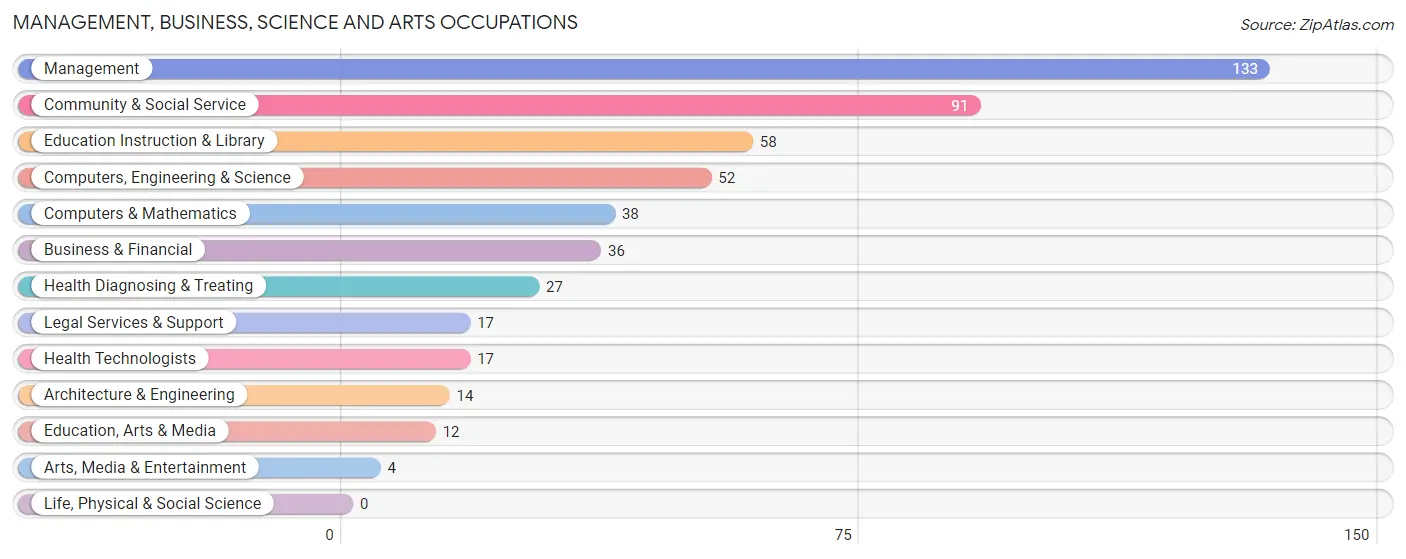
The most common Management, Business, Science and Arts occupations in Elmore are Management (133 | 17.5%), Community & Social Service (91 | 12.0%), Education Instruction & Library (58 | 7.6%), Computers, Engineering & Science (52 | 6.8%), and Computers & Mathematics (38 | 5.0%).
Management, Business, Science and Arts Occupations by Sex
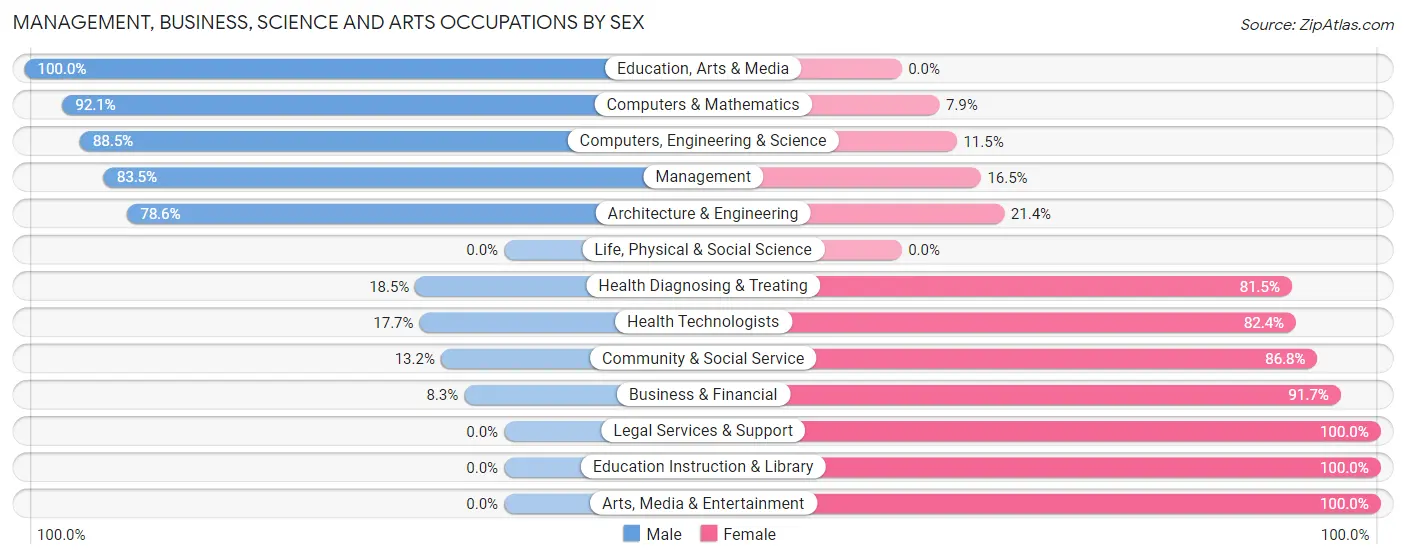
Within the Management, Business, Science and Arts occupations in Elmore, the most male-oriented occupations are Education, Arts & Media (100.0%), Computers & Mathematics (92.1%), and Computers, Engineering & Science (88.5%), while the most female-oriented occupations are Legal Services & Support (100.0%), Education Instruction & Library (100.0%), and Arts, Media & Entertainment (100.0%).
| Occupation | Male | Female |
| Management | 111 (83.5%) | 22 (16.5%) |
| Business & Financial | 3 (8.3%) | 33 (91.7%) |
| Computers, Engineering & Science | 46 (88.5%) | 6 (11.5%) |
| Computers & Mathematics | 35 (92.1%) | 3 (7.9%) |
| Architecture & Engineering | 11 (78.6%) | 3 (21.4%) |
| Life, Physical & Social Science | 0 (0.0%) | 0 (0.0%) |
| Community & Social Service | 12 (13.2%) | 79 (86.8%) |
| Education, Arts & Media | 12 (100.0%) | 0 (0.0%) |
| Legal Services & Support | 0 (0.0%) | 17 (100.0%) |
| Education Instruction & Library | 0 (0.0%) | 58 (100.0%) |
| Arts, Media & Entertainment | 0 (0.0%) | 4 (100.0%) |
| Health Diagnosing & Treating | 5 (18.5%) | 22 (81.5%) |
| Health Technologists | 3 (17.6%) | 14 (82.4%) |
| Total (Category) | 177 (52.2%) | 162 (47.8%) |
| Total (Overall) | 390 (51.2%) | 371 (48.7%) |
Services Occupations
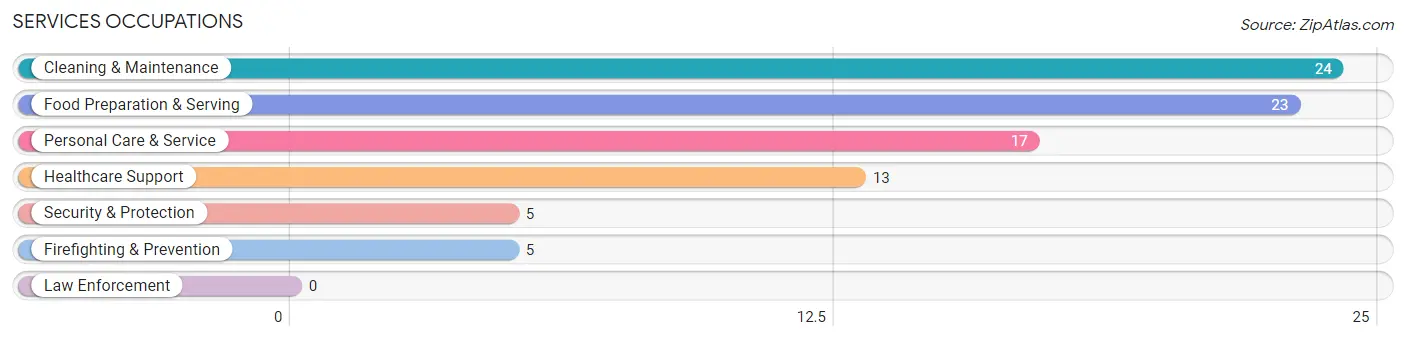
The most common Services occupations in Elmore are Cleaning & Maintenance (24 | 3.2%), Food Preparation & Serving (23 | 3.0%), Personal Care & Service (17 | 2.2%), Healthcare Support (13 | 1.7%), and Security & Protection (5 | 0.7%).
Services Occupations by Sex
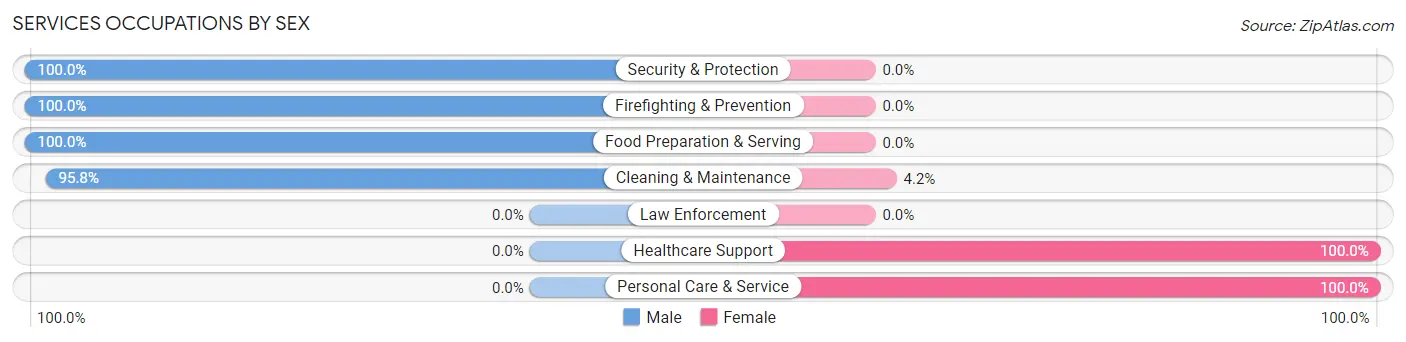
Within the Services occupations in Elmore, the most male-oriented occupations are Security & Protection (100.0%), Firefighting & Prevention (100.0%), and Food Preparation & Serving (100.0%), while the most female-oriented occupations are Healthcare Support (100.0%), Personal Care & Service (100.0%), and Cleaning & Maintenance (4.2%).
| Occupation | Male | Female |
| Healthcare Support | 0 (0.0%) | 13 (100.0%) |
| Security & Protection | 5 (100.0%) | 0 (0.0%) |
| Firefighting & Prevention | 5 (100.0%) | 0 (0.0%) |
| Law Enforcement | 0 (0.0%) | 0 (0.0%) |
| Food Preparation & Serving | 23 (100.0%) | 0 (0.0%) |
| Cleaning & Maintenance | 23 (95.8%) | 1 (4.2%) |
| Personal Care & Service | 0 (0.0%) | 17 (100.0%) |
| Total (Category) | 51 (62.2%) | 31 (37.8%) |
| Total (Overall) | 390 (51.2%) | 371 (48.7%) |
Sales and Office Occupations
The most common Sales and Office occupations in Elmore are Sales & Related (91 | 12.0%), and Office & Administration (89 | 11.7%).
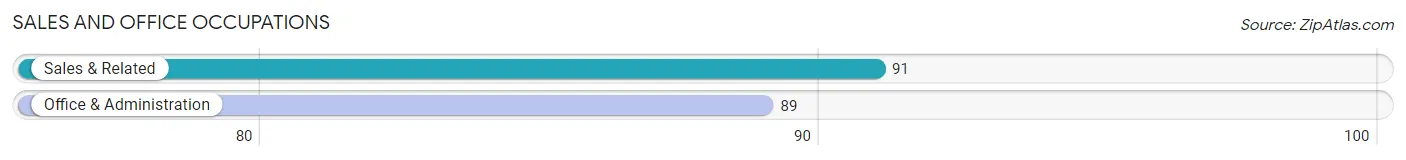
Sales and Office Occupations by Sex
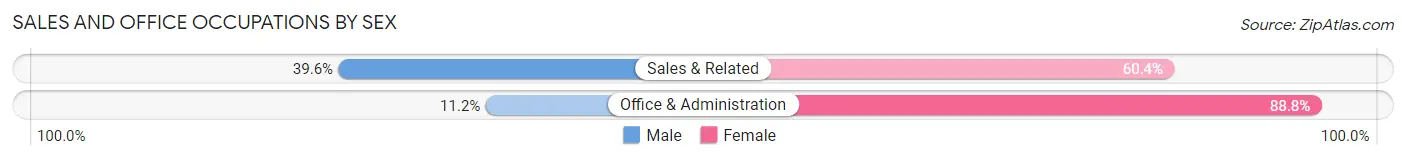
| Occupation | Male | Female |
| Sales & Related | 36 (39.6%) | 55 (60.4%) |
| Office & Administration | 10 (11.2%) | 79 (88.8%) |
| Total (Category) | 46 (25.6%) | 134 (74.4%) |
| Total (Overall) | 390 (51.2%) | 371 (48.7%) |
Natural Resources, Construction and Maintenance Occupations
The most common Natural Resources, Construction and Maintenance occupations in Elmore are Installation, Maintenance & Repair (28 | 3.7%), Construction & Extraction (24 | 3.2%), and Farming, Fishing & Forestry (7 | 0.9%).
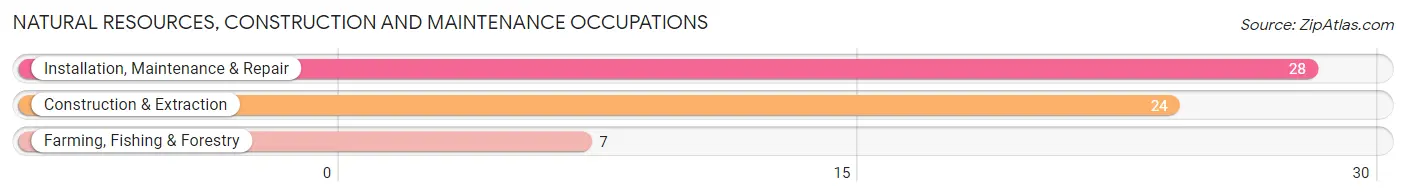
Natural Resources, Construction and Maintenance Occupations by Sex
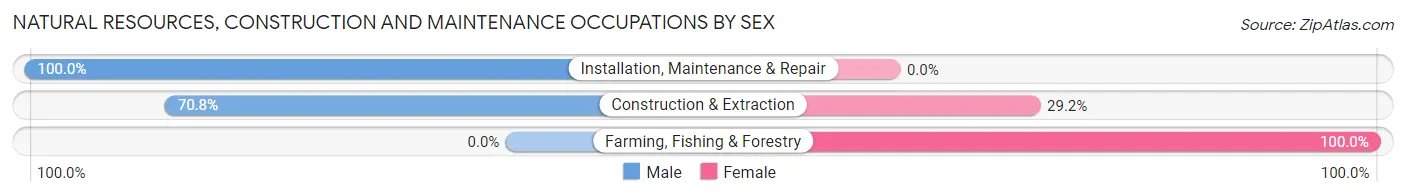
| Occupation | Male | Female |
| Farming, Fishing & Forestry | 0 (0.0%) | 7 (100.0%) |
| Construction & Extraction | 17 (70.8%) | 7 (29.2%) |
| Installation, Maintenance & Repair | 28 (100.0%) | 0 (0.0%) |
| Total (Category) | 45 (76.3%) | 14 (23.7%) |
| Total (Overall) | 390 (51.2%) | 371 (48.7%) |
Production, Transportation and Moving Occupations
The most common Production, Transportation and Moving occupations in Elmore are Production (46 | 6.0%), Transportation (42 | 5.5%), and Material Moving (13 | 1.7%).
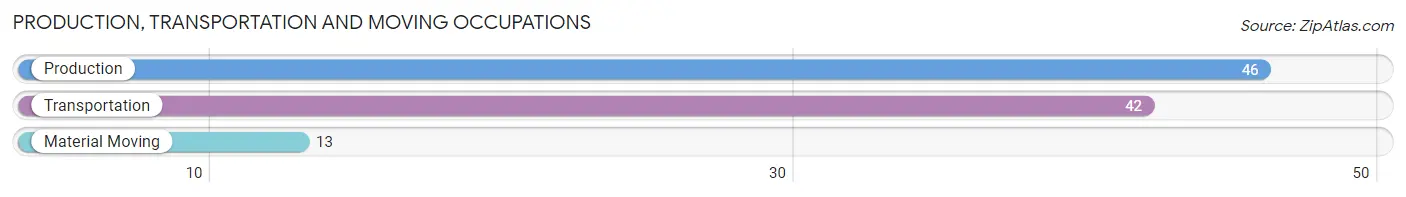
Production, Transportation and Moving Occupations by Sex
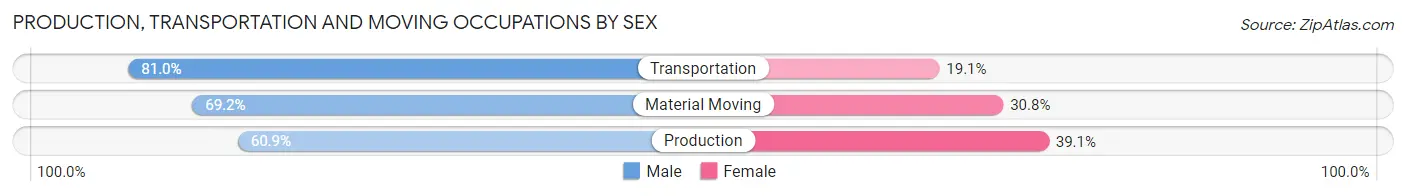
| Occupation | Male | Female |
| Production | 28 (60.9%) | 18 (39.1%) |
| Transportation | 34 (80.9%) | 8 (19.1%) |
| Material Moving | 9 (69.2%) | 4 (30.8%) |
| Total (Category) | 71 (70.3%) | 30 (29.7%) |
| Total (Overall) | 390 (51.2%) | 371 (48.7%) |
Employment Industries by Sex in Elmore
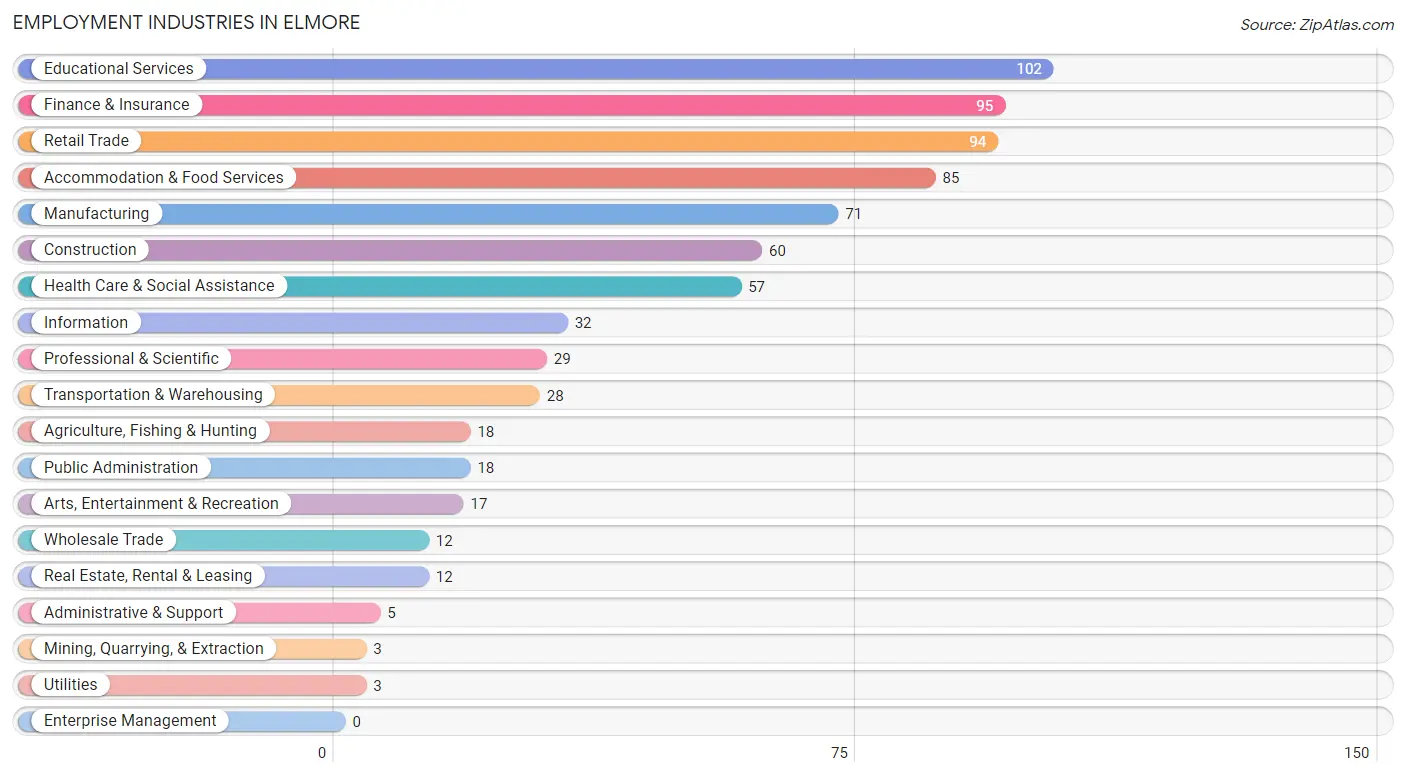
Employment Industries in Elmore
The major employment industries in Elmore include Educational Services (102 | 13.4%), Finance & Insurance (95 | 12.5%), Retail Trade (94 | 12.3%), Accommodation & Food Services (85 | 11.2%), and Manufacturing (71 | 9.3%).
Employment Industries by Sex in Elmore
The Elmore industries that see more men than women are Mining, Quarrying, & Extraction (100.0%), Transportation & Warehousing (100.0%), and Information (100.0%), whereas the industries that tend to have a higher number of women are Wholesale Trade (100.0%), Utilities (100.0%), and Health Care & Social Assistance (91.2%).
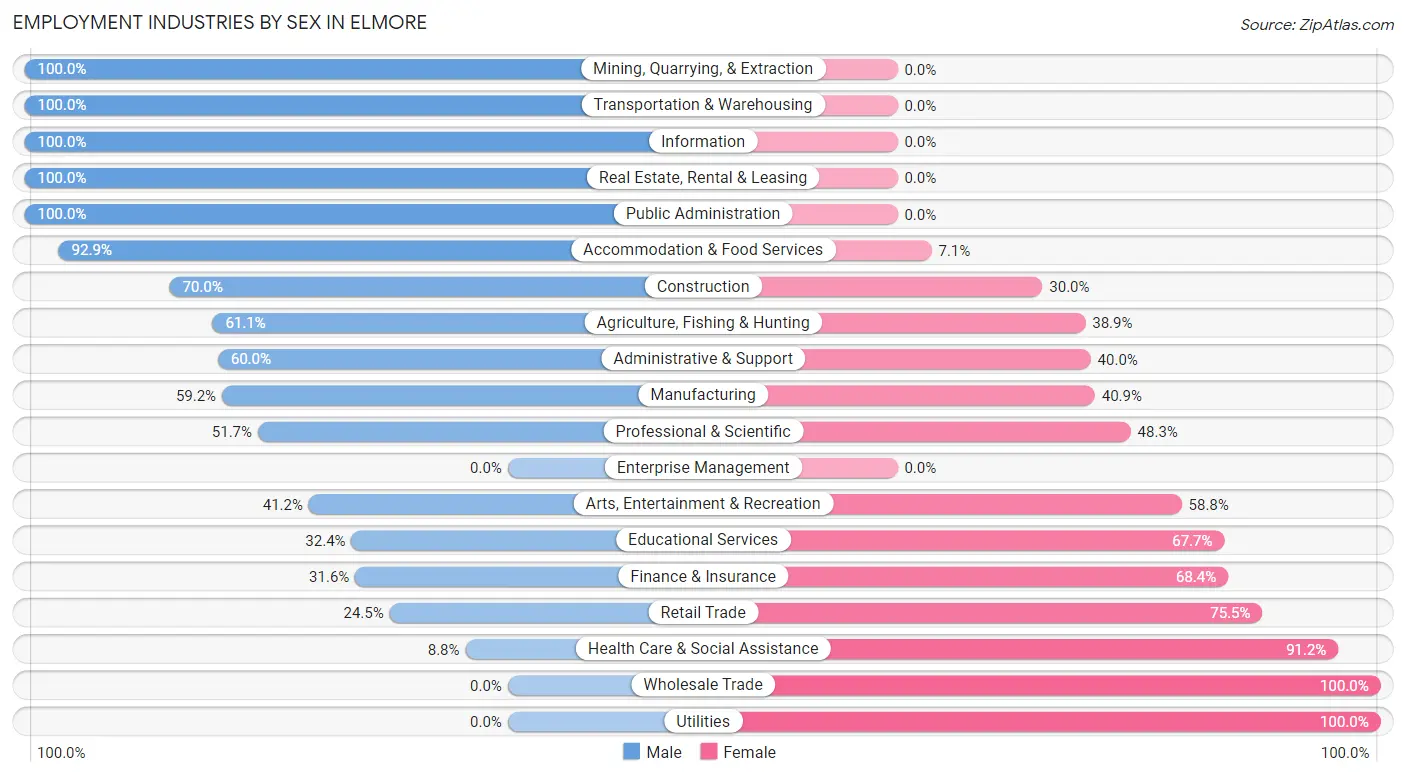
| Industry | Male | Female |
| Agriculture, Fishing & Hunting | 11 (61.1%) | 7 (38.9%) |
| Mining, Quarrying, & Extraction | 3 (100.0%) | 0 (0.0%) |
| Construction | 42 (70.0%) | 18 (30.0%) |
| Manufacturing | 42 (59.2%) | 29 (40.8%) |
| Wholesale Trade | 0 (0.0%) | 12 (100.0%) |
| Retail Trade | 23 (24.5%) | 71 (75.5%) |
| Transportation & Warehousing | 28 (100.0%) | 0 (0.0%) |
| Utilities | 0 (0.0%) | 3 (100.0%) |
| Information | 32 (100.0%) | 0 (0.0%) |
| Finance & Insurance | 30 (31.6%) | 65 (68.4%) |
| Real Estate, Rental & Leasing | 12 (100.0%) | 0 (0.0%) |
| Professional & Scientific | 15 (51.7%) | 14 (48.3%) |
| Enterprise Management | 0 (0.0%) | 0 (0.0%) |
| Administrative & Support | 3 (60.0%) | 2 (40.0%) |
| Educational Services | 33 (32.4%) | 69 (67.6%) |
| Health Care & Social Assistance | 5 (8.8%) | 52 (91.2%) |
| Arts, Entertainment & Recreation | 7 (41.2%) | 10 (58.8%) |
| Accommodation & Food Services | 79 (92.9%) | 6 (7.1%) |
| Public Administration | 18 (100.0%) | 0 (0.0%) |
| Total | 390 (51.2%) | 371 (48.7%) |
Education in Elmore
School Enrollment in Elmore
The most common levels of schooling among the 430 students in Elmore are middle school (135 | 31.4%), high school (102 | 23.7%), and elementary school (101 | 23.5%).
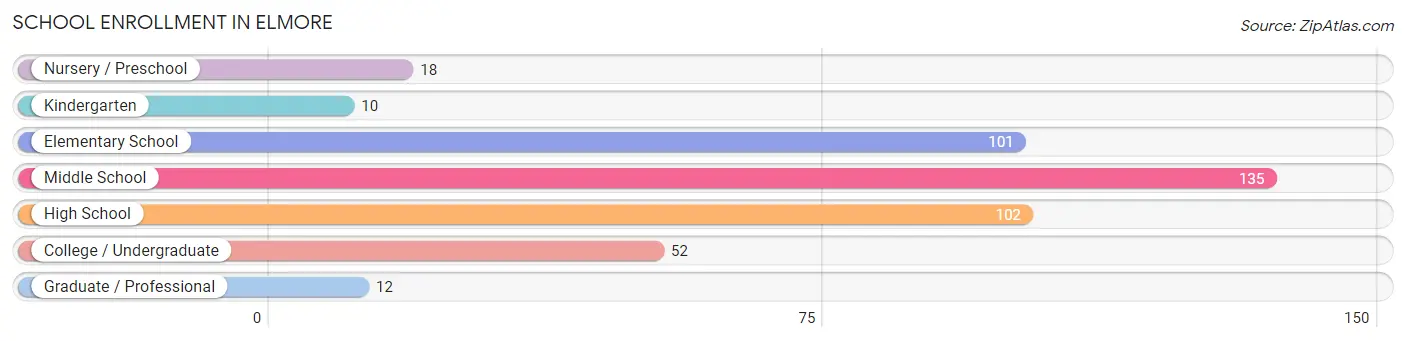
| School Level | # Students | % Students |
| Nursery / Preschool | 18 | 4.2% |
| Kindergarten | 10 | 2.3% |
| Elementary School | 101 | 23.5% |
| Middle School | 135 | 31.4% |
| High School | 102 | 23.7% |
| College / Undergraduate | 52 | 12.1% |
| Graduate / Professional | 12 | 2.8% |
| Total | 430 | 100.0% |
School Enrollment by Age by Funding Source in Elmore
Out of a total of 430 students who are enrolled in schools in Elmore, 97 (22.6%) attend a private institution, while the remaining 333 (77.4%) are enrolled in public schools. The age group of 25 to 34 year olds has the highest likelihood of being enrolled in private schools, with 3 (100.0% in the age bracket) enrolled. Conversely, the age group of 20 to 24 year olds has the lowest likelihood of being enrolled in a private school, with 28 (100.0% in the age bracket) attending a public institution.
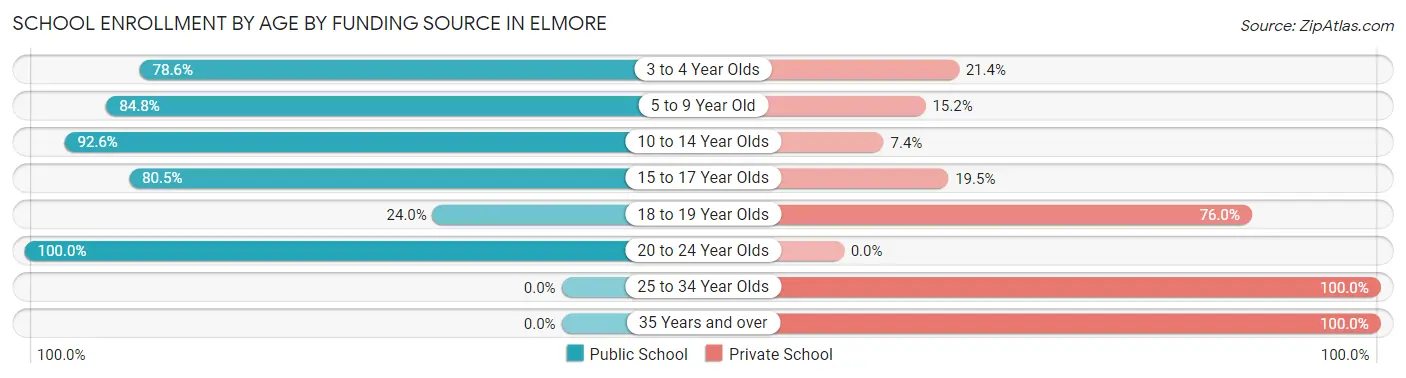
| Age Bracket | Public School | Private School |
| 3 to 4 Year Olds | 11 (78.6%) | 3 (21.4%) |
| 5 to 9 Year Old | 89 (84.8%) | 16 (15.2%) |
| 10 to 14 Year Olds | 137 (92.6%) | 11 (7.4%) |
| 15 to 17 Year Olds | 62 (80.5%) | 15 (19.5%) |
| 18 to 19 Year Olds | 6 (24.0%) | 19 (76.0%) |
| 20 to 24 Year Olds | 28 (100.0%) | 0 (0.0%) |
| 25 to 34 Year Olds | 0 (0.0%) | 3 (100.0%) |
| 35 Years and over | 0 (0.0%) | 30 (100.0%) |
| Total | 333 (77.4%) | 97 (22.6%) |
Educational Attainment by Field of Study in Elmore
Education (80 | 25.7%), science & technology (48 | 15.4%), business (29 | 9.3%), visual & performing arts (26 | 8.4%), and arts & humanities (20 | 6.4%) are the most common fields of study among 311 individuals in Elmore who have obtained a bachelor's degree or higher.
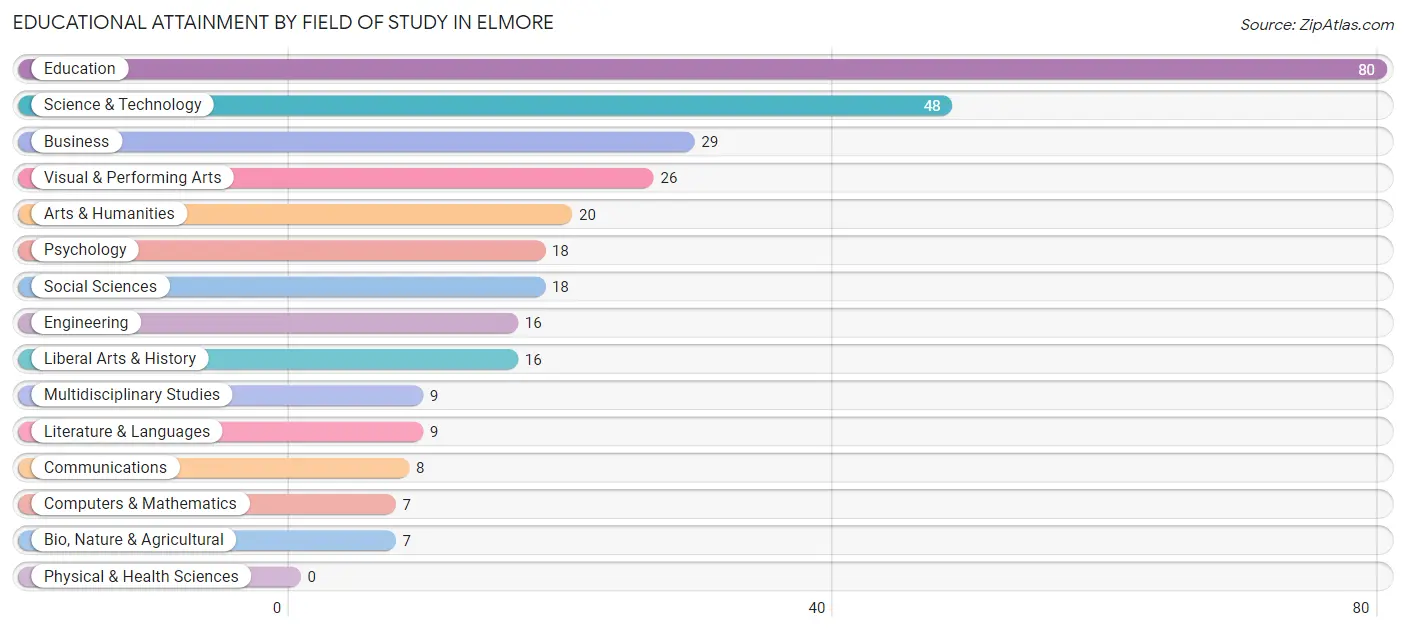
| Field of Study | # Graduates | % Graduates |
| Computers & Mathematics | 7 | 2.2% |
| Bio, Nature & Agricultural | 7 | 2.2% |
| Physical & Health Sciences | 0 | 0.0% |
| Psychology | 18 | 5.8% |
| Social Sciences | 18 | 5.8% |
| Engineering | 16 | 5.1% |
| Multidisciplinary Studies | 9 | 2.9% |
| Science & Technology | 48 | 15.4% |
| Business | 29 | 9.3% |
| Education | 80 | 25.7% |
| Literature & Languages | 9 | 2.9% |
| Liberal Arts & History | 16 | 5.1% |
| Visual & Performing Arts | 26 | 8.4% |
| Communications | 8 | 2.6% |
| Arts & Humanities | 20 | 6.4% |
| Total | 311 | 100.0% |
Transportation & Commute in Elmore
Vehicle Availability by Sex in Elmore
The most prevalent vehicle ownership categories in Elmore are males with 2 vehicles (226, accounting for 58.0%) and females with 2 vehicles (226, making up 60.9%).
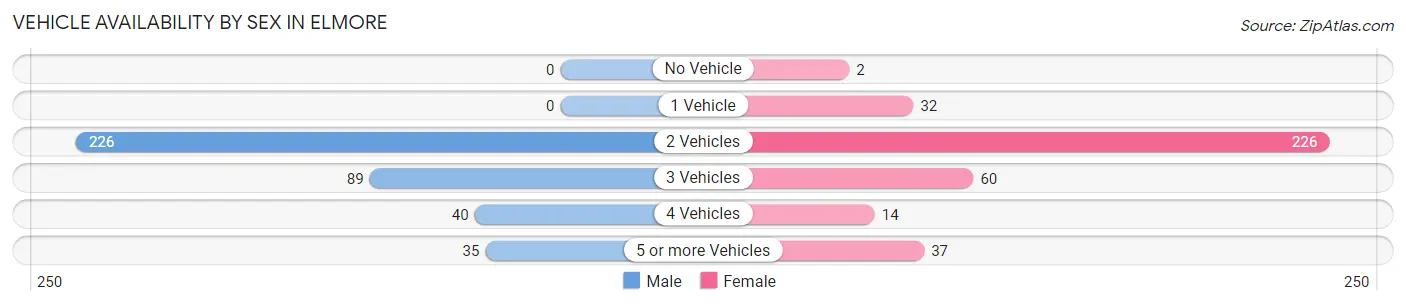
| Vehicles Available | Male | Female |
| No Vehicle | 0 (0.0%) | 2 (0.5%) |
| 1 Vehicle | 0 (0.0%) | 32 (8.6%) |
| 2 Vehicles | 226 (58.0%) | 226 (60.9%) |
| 3 Vehicles | 89 (22.8%) | 60 (16.2%) |
| 4 Vehicles | 40 (10.3%) | 14 (3.8%) |
| 5 or more Vehicles | 35 (9.0%) | 37 (10.0%) |
| Total | 390 (100.0%) | 371 (100.0%) |
Commute Time in Elmore
The most frequently occuring commute durations in Elmore are 25 to 29 minutes (129 commuters, 17.5%), 20 to 24 minutes (104 commuters, 14.1%), and 15 to 19 minutes (94 commuters, 12.7%).
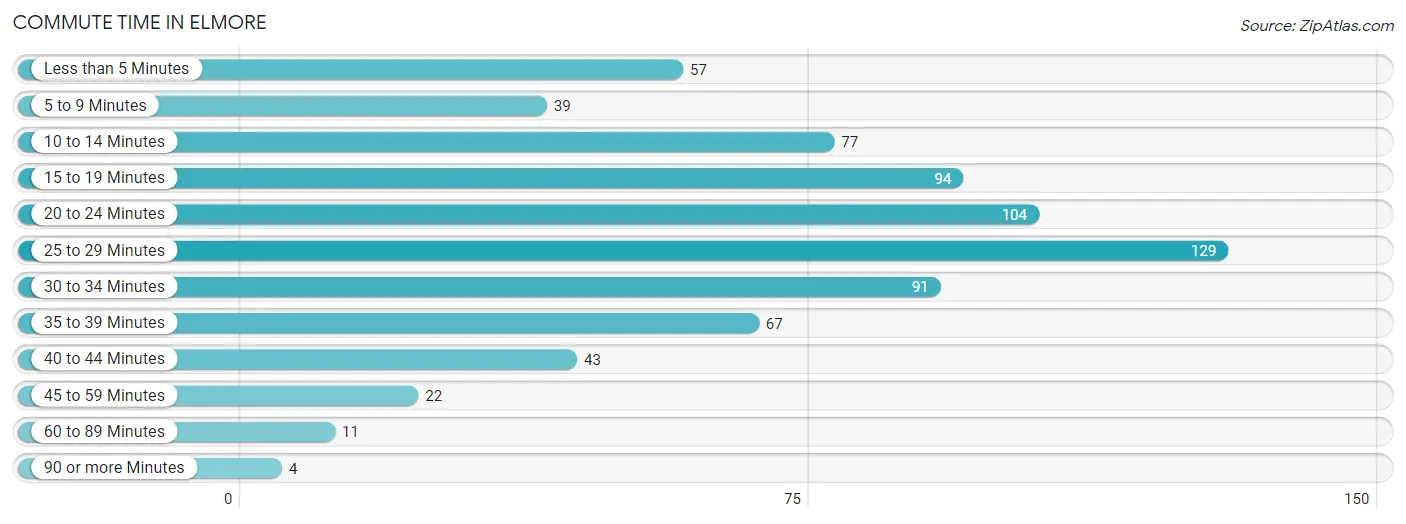
| Commute Time | # Commuters | % Commuters |
| Less than 5 Minutes | 57 | 7.7% |
| 5 to 9 Minutes | 39 | 5.3% |
| 10 to 14 Minutes | 77 | 10.4% |
| 15 to 19 Minutes | 94 | 12.7% |
| 20 to 24 Minutes | 104 | 14.1% |
| 25 to 29 Minutes | 129 | 17.5% |
| 30 to 34 Minutes | 91 | 12.3% |
| 35 to 39 Minutes | 67 | 9.1% |
| 40 to 44 Minutes | 43 | 5.8% |
| 45 to 59 Minutes | 22 | 3.0% |
| 60 to 89 Minutes | 11 | 1.5% |
| 90 or more Minutes | 4 | 0.5% |
Commute Time by Sex in Elmore
The most common commute times in Elmore are 25 to 29 minutes (64 commuters, 16.5%) for males and 25 to 29 minutes (65 commuters, 18.5%) for females.
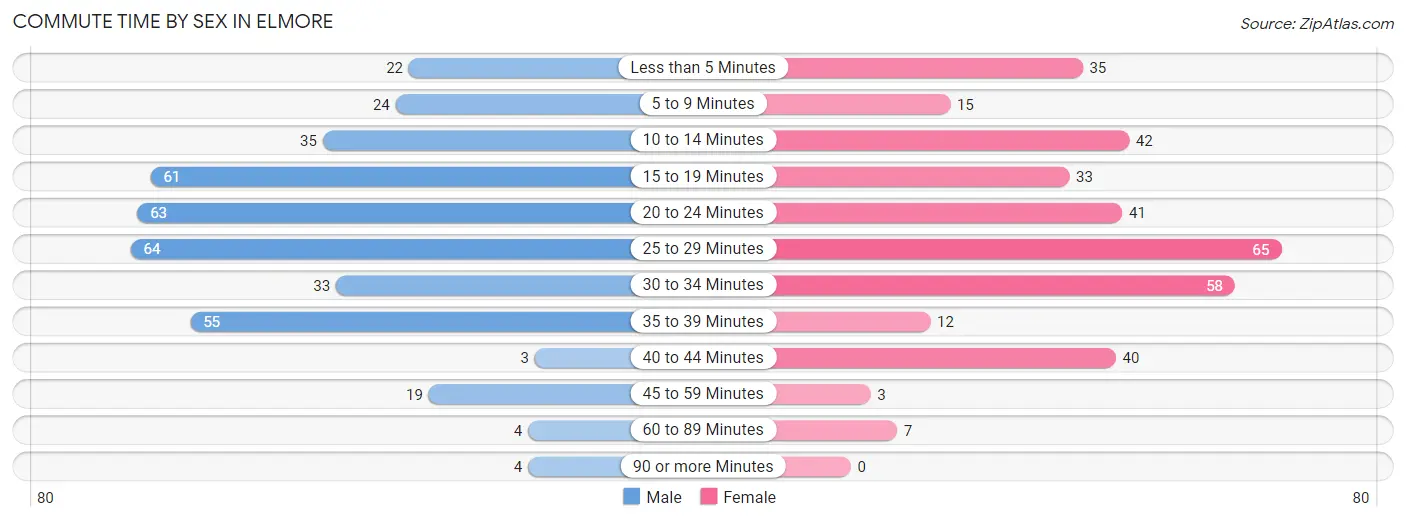
| Commute Time | Male | Female |
| Less than 5 Minutes | 22 (5.7%) | 35 (10.0%) |
| 5 to 9 Minutes | 24 (6.2%) | 15 (4.3%) |
| 10 to 14 Minutes | 35 (9.0%) | 42 (12.0%) |
| 15 to 19 Minutes | 61 (15.8%) | 33 (9.4%) |
| 20 to 24 Minutes | 63 (16.3%) | 41 (11.7%) |
| 25 to 29 Minutes | 64 (16.5%) | 65 (18.5%) |
| 30 to 34 Minutes | 33 (8.5%) | 58 (16.5%) |
| 35 to 39 Minutes | 55 (14.2%) | 12 (3.4%) |
| 40 to 44 Minutes | 3 (0.8%) | 40 (11.4%) |
| 45 to 59 Minutes | 19 (4.9%) | 3 (0.9%) |
| 60 to 89 Minutes | 4 (1.0%) | 7 (2.0%) |
| 90 or more Minutes | 4 (1.0%) | 0 (0.0%) |
Time of Departure to Work by Sex in Elmore
The most frequent times of departure to work in Elmore are 6:00 AM to 6:29 AM (69, 17.8%) for males and 6:30 AM to 6:59 AM (73, 20.8%) for females.
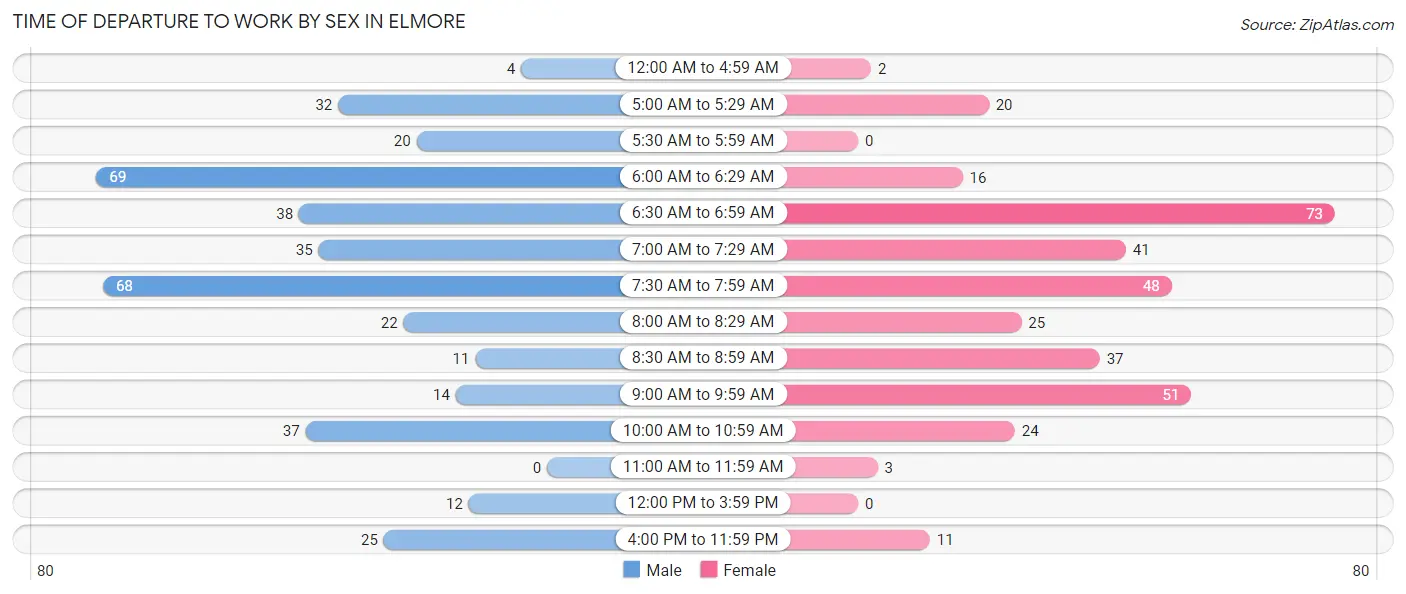
| Time of Departure | Male | Female |
| 12:00 AM to 4:59 AM | 4 (1.0%) | 2 (0.6%) |
| 5:00 AM to 5:29 AM | 32 (8.3%) | 20 (5.7%) |
| 5:30 AM to 5:59 AM | 20 (5.2%) | 0 (0.0%) |
| 6:00 AM to 6:29 AM | 69 (17.8%) | 16 (4.6%) |
| 6:30 AM to 6:59 AM | 38 (9.8%) | 73 (20.8%) |
| 7:00 AM to 7:29 AM | 35 (9.0%) | 41 (11.7%) |
| 7:30 AM to 7:59 AM | 68 (17.6%) | 48 (13.7%) |
| 8:00 AM to 8:29 AM | 22 (5.7%) | 25 (7.1%) |
| 8:30 AM to 8:59 AM | 11 (2.8%) | 37 (10.5%) |
| 9:00 AM to 9:59 AM | 14 (3.6%) | 51 (14.5%) |
| 10:00 AM to 10:59 AM | 37 (9.6%) | 24 (6.8%) |
| 11:00 AM to 11:59 AM | 0 (0.0%) | 3 (0.9%) |
| 12:00 PM to 3:59 PM | 12 (3.1%) | 0 (0.0%) |
| 4:00 PM to 11:59 PM | 25 (6.5%) | 11 (3.1%) |
| Total | 387 (100.0%) | 351 (100.0%) |
Housing Occupancy in Elmore
Occupancy by Ownership in Elmore
Of the total 607 dwellings in Elmore, owner-occupied units account for 472 (77.8%), while renter-occupied units make up 135 (22.2%).
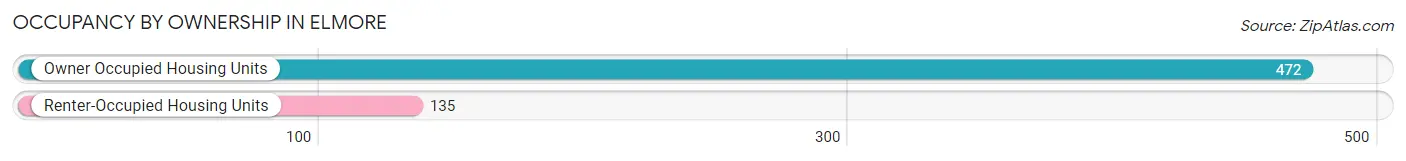
| Occupancy | # Housing Units | % Housing Units |
| Owner Occupied Housing Units | 472 | 77.8% |
| Renter-Occupied Housing Units | 135 | 22.2% |
| Total Occupied Housing Units | 607 | 100.0% |
Occupancy by Household Size in Elmore
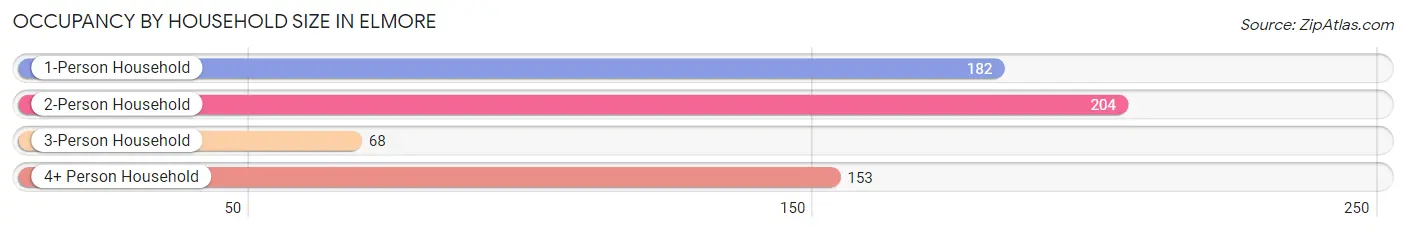
| Household Size | # Housing Units | % Housing Units |
| 1-Person Household | 182 | 30.0% |
| 2-Person Household | 204 | 33.6% |
| 3-Person Household | 68 | 11.2% |
| 4+ Person Household | 153 | 25.2% |
| Total Housing Units | 607 | 100.0% |
Occupancy by Ownership by Household Size in Elmore
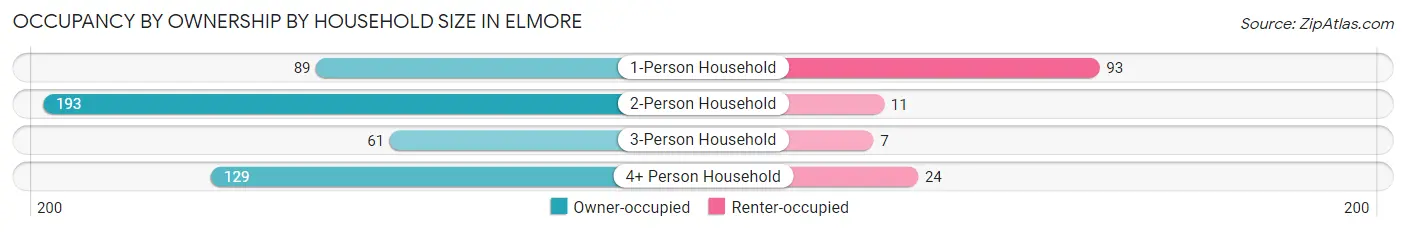
| Household Size | Owner-occupied | Renter-occupied |
| 1-Person Household | 89 (48.9%) | 93 (51.1%) |
| 2-Person Household | 193 (94.6%) | 11 (5.4%) |
| 3-Person Household | 61 (89.7%) | 7 (10.3%) |
| 4+ Person Household | 129 (84.3%) | 24 (15.7%) |
| Total Housing Units | 472 (77.8%) | 135 (22.2%) |
Occupancy by Educational Attainment in Elmore
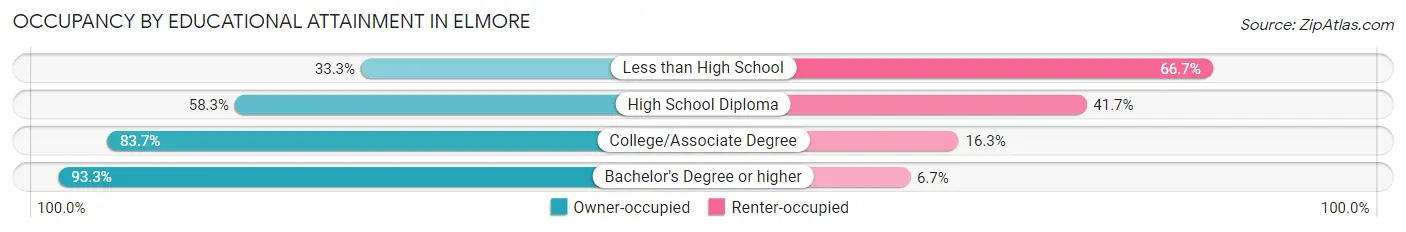
| Household Size | Owner-occupied | Renter-occupied |
| Less than High School | 4 (33.3%) | 8 (66.7%) |
| High School Diploma | 105 (58.3%) | 75 (41.7%) |
| College/Associate Degree | 210 (83.7%) | 41 (16.3%) |
| Bachelor's Degree or higher | 153 (93.3%) | 11 (6.7%) |
Occupancy by Age of Householder in Elmore
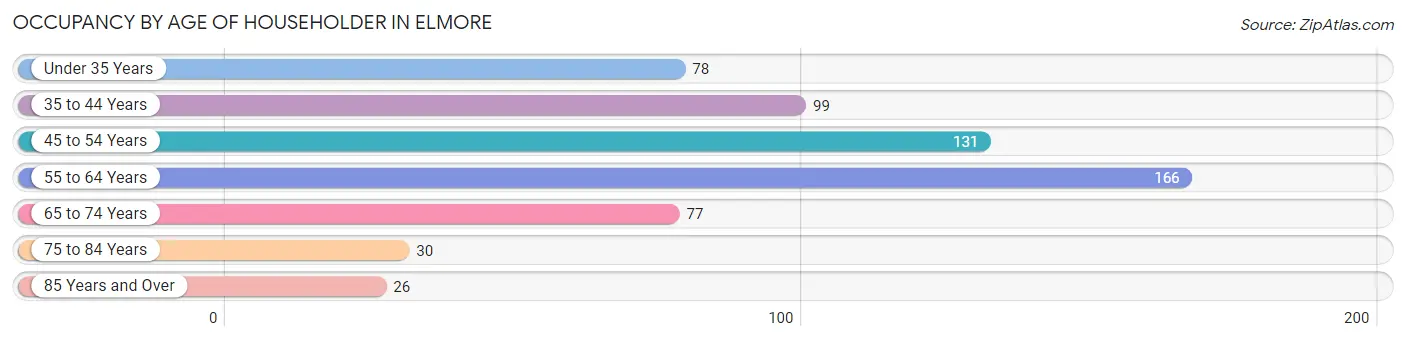
| Age Bracket | # Households | % Households |
| Under 35 Years | 78 | 12.9% |
| 35 to 44 Years | 99 | 16.3% |
| 45 to 54 Years | 131 | 21.6% |
| 55 to 64 Years | 166 | 27.4% |
| 65 to 74 Years | 77 | 12.7% |
| 75 to 84 Years | 30 | 4.9% |
| 85 Years and Over | 26 | 4.3% |
| Total | 607 | 100.0% |
Housing Finances in Elmore
Median Income by Occupancy in Elmore
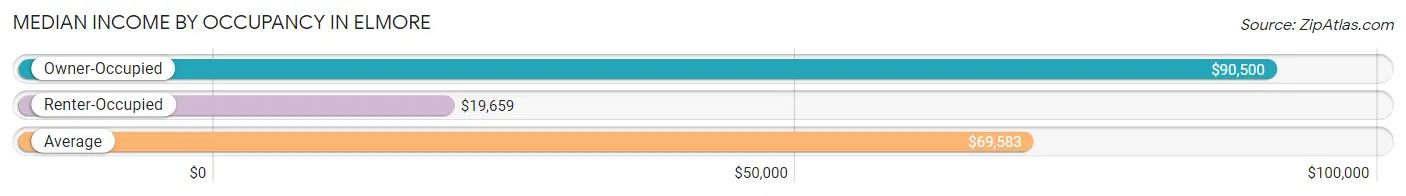
| Occupancy Type | # Households | Median Income |
| Owner-Occupied | 472 (77.8%) | $90,500 |
| Renter-Occupied | 135 (22.2%) | $19,659 |
| Average | 607 (100.0%) | $69,583 |
Occupancy by Householder Income Bracket in Elmore
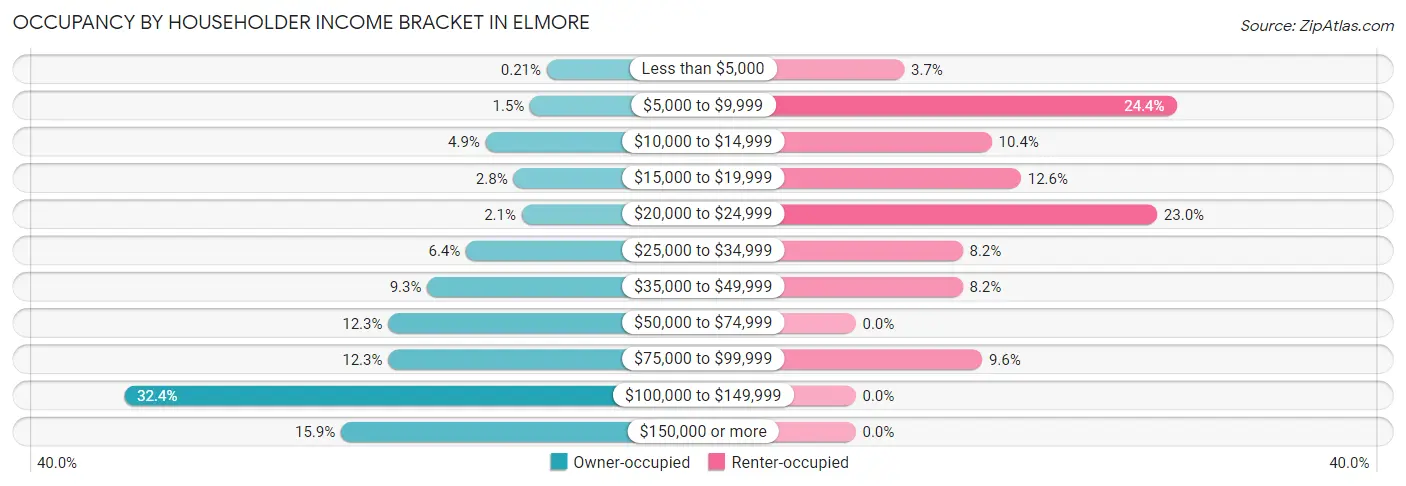
| Income Bracket | Owner-occupied | Renter-occupied |
| Less than $5,000 | 1 (0.2%) | 5 (3.7%) |
| $5,000 to $9,999 | 7 (1.5%) | 33 (24.4%) |
| $10,000 to $14,999 | 23 (4.9%) | 14 (10.4%) |
| $15,000 to $19,999 | 13 (2.8%) | 17 (12.6%) |
| $20,000 to $24,999 | 10 (2.1%) | 31 (23.0%) |
| $25,000 to $34,999 | 30 (6.4%) | 11 (8.2%) |
| $35,000 to $49,999 | 44 (9.3%) | 11 (8.2%) |
| $50,000 to $74,999 | 58 (12.3%) | 0 (0.0%) |
| $75,000 to $99,999 | 58 (12.3%) | 13 (9.6%) |
| $100,000 to $149,999 | 153 (32.4%) | 0 (0.0%) |
| $150,000 or more | 75 (15.9%) | 0 (0.0%) |
| Total | 472 (100.0%) | 135 (100.0%) |
Monthly Housing Cost Tiers in Elmore
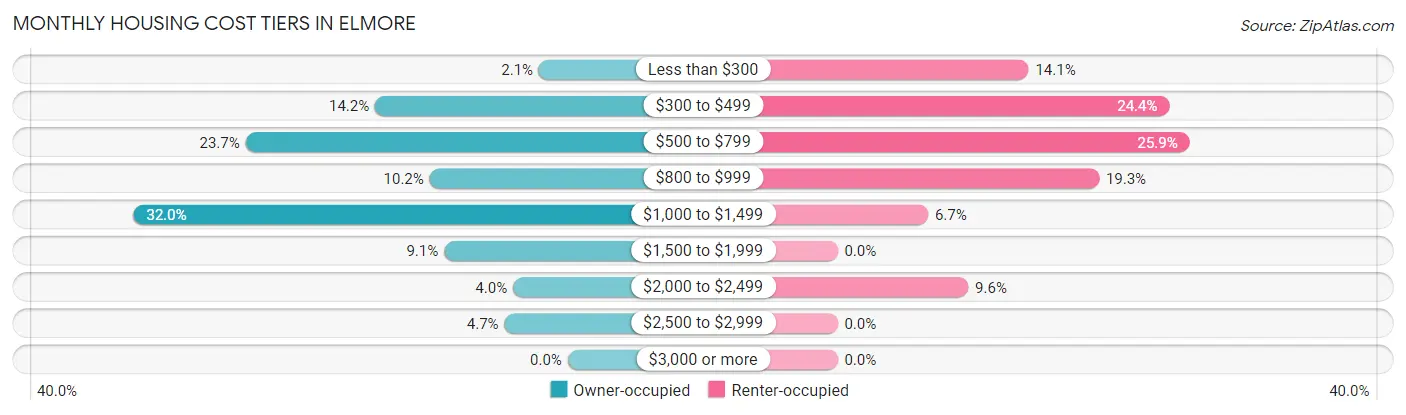
| Monthly Cost | Owner-occupied | Renter-occupied |
| Less than $300 | 10 (2.1%) | 19 (14.1%) |
| $300 to $499 | 67 (14.2%) | 33 (24.4%) |
| $500 to $799 | 112 (23.7%) | 35 (25.9%) |
| $800 to $999 | 48 (10.2%) | 26 (19.3%) |
| $1,000 to $1,499 | 151 (32.0%) | 9 (6.7%) |
| $1,500 to $1,999 | 43 (9.1%) | 0 (0.0%) |
| $2,000 to $2,499 | 19 (4.0%) | 13 (9.6%) |
| $2,500 to $2,999 | 22 (4.7%) | 0 (0.0%) |
| $3,000 or more | 0 (0.0%) | 0 (0.0%) |
| Total | 472 (100.0%) | 135 (100.0%) |
Physical Housing Characteristics in Elmore
Housing Structures in Elmore
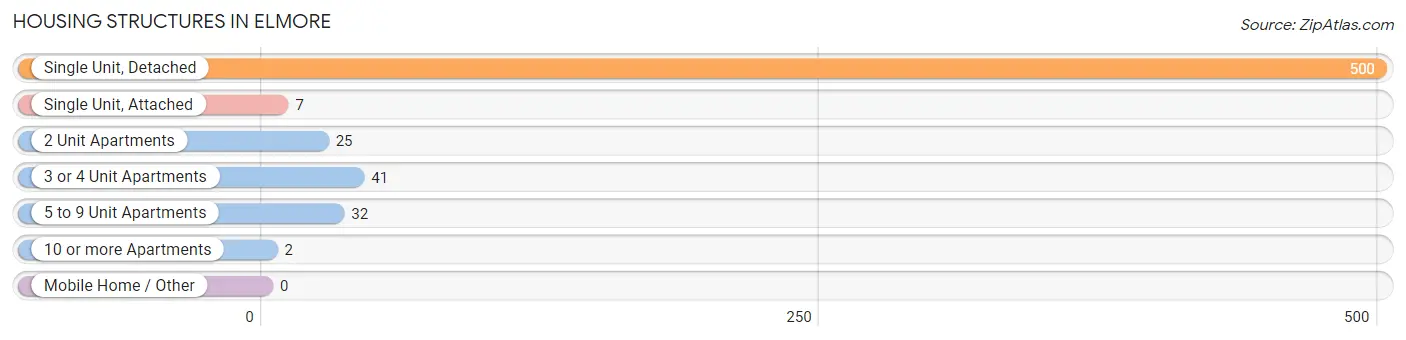
| Structure Type | # Housing Units | % Housing Units |
| Single Unit, Detached | 500 | 82.4% |
| Single Unit, Attached | 7 | 1.1% |
| 2 Unit Apartments | 25 | 4.1% |
| 3 or 4 Unit Apartments | 41 | 6.8% |
| 5 to 9 Unit Apartments | 32 | 5.3% |
| 10 or more Apartments | 2 | 0.3% |
| Mobile Home / Other | 0 | 0.0% |
| Total | 607 | 100.0% |
Housing Structures by Occupancy in Elmore
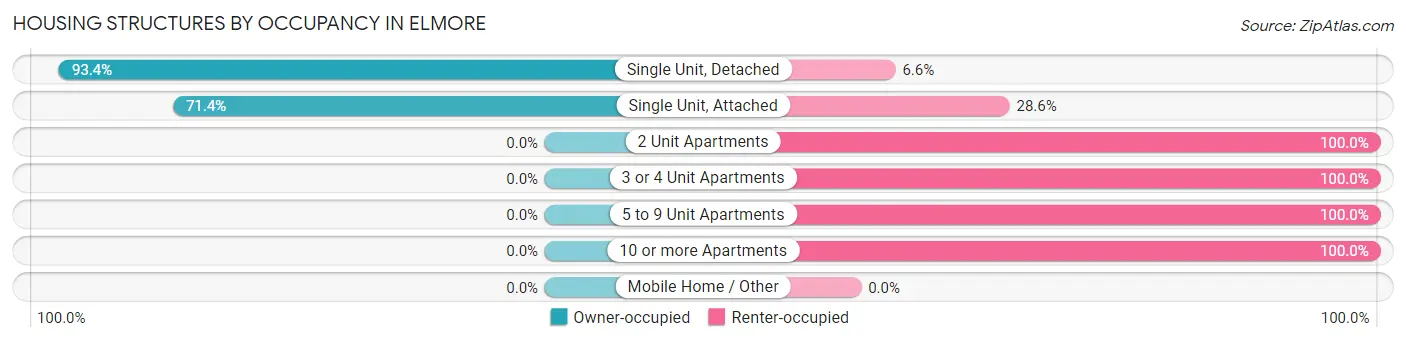
| Structure Type | Owner-occupied | Renter-occupied |
| Single Unit, Detached | 467 (93.4%) | 33 (6.6%) |
| Single Unit, Attached | 5 (71.4%) | 2 (28.6%) |
| 2 Unit Apartments | 0 (0.0%) | 25 (100.0%) |
| 3 or 4 Unit Apartments | 0 (0.0%) | 41 (100.0%) |
| 5 to 9 Unit Apartments | 0 (0.0%) | 32 (100.0%) |
| 10 or more Apartments | 0 (0.0%) | 2 (100.0%) |
| Mobile Home / Other | 0 (0.0%) | 0 (0.0%) |
| Total | 472 (77.8%) | 135 (22.2%) |
Housing Structures by Number of Rooms in Elmore
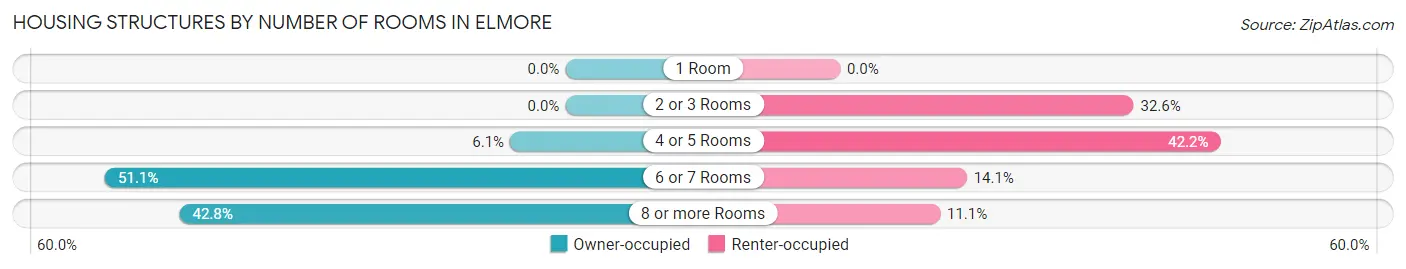
| Number of Rooms | Owner-occupied | Renter-occupied |
| 1 Room | 0 (0.0%) | 0 (0.0%) |
| 2 or 3 Rooms | 0 (0.0%) | 44 (32.6%) |
| 4 or 5 Rooms | 29 (6.1%) | 57 (42.2%) |
| 6 or 7 Rooms | 241 (51.1%) | 19 (14.1%) |
| 8 or more Rooms | 202 (42.8%) | 15 (11.1%) |
| Total | 472 (100.0%) | 135 (100.0%) |
Housing Structure by Heating Type in Elmore
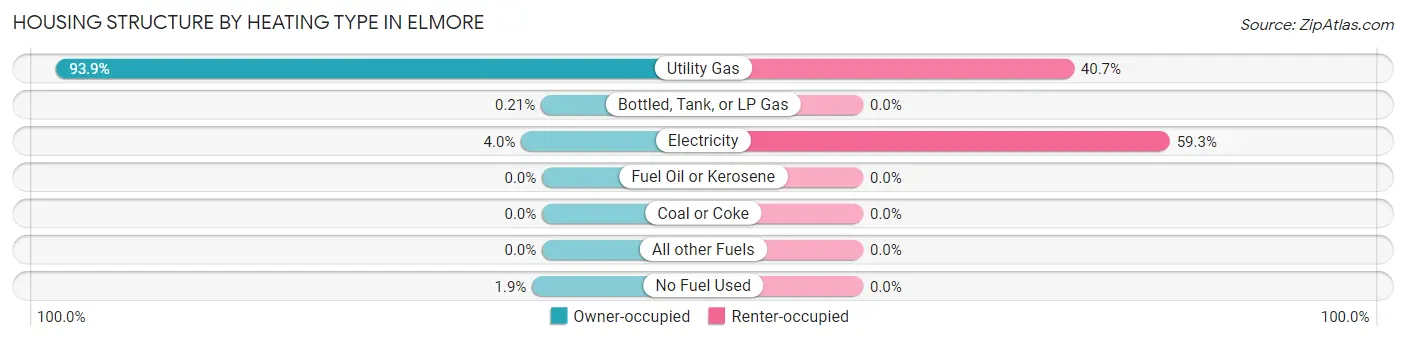
| Heating Type | Owner-occupied | Renter-occupied |
| Utility Gas | 443 (93.9%) | 55 (40.7%) |
| Bottled, Tank, or LP Gas | 1 (0.2%) | 0 (0.0%) |
| Electricity | 19 (4.0%) | 80 (59.3%) |
| Fuel Oil or Kerosene | 0 (0.0%) | 0 (0.0%) |
| Coal or Coke | 0 (0.0%) | 0 (0.0%) |
| All other Fuels | 0 (0.0%) | 0 (0.0%) |
| No Fuel Used | 9 (1.9%) | 0 (0.0%) |
| Total | 472 (100.0%) | 135 (100.0%) |
Household Vehicle Usage in Elmore
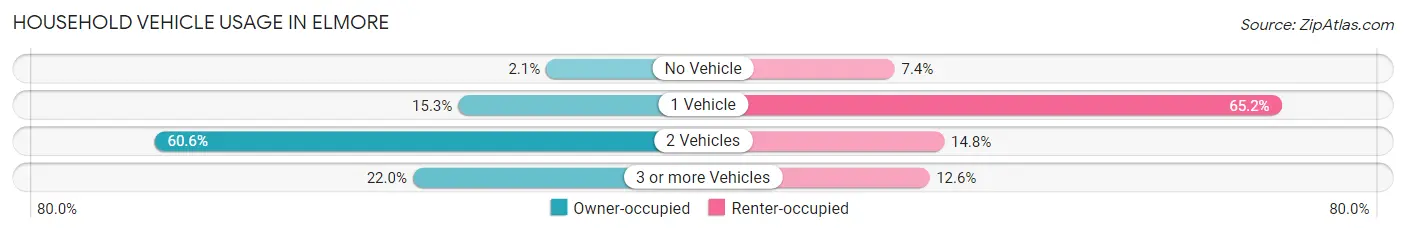
| Vehicles per Household | Owner-occupied | Renter-occupied |
| No Vehicle | 10 (2.1%) | 10 (7.4%) |
| 1 Vehicle | 72 (15.2%) | 88 (65.2%) |
| 2 Vehicles | 286 (60.6%) | 20 (14.8%) |
| 3 or more Vehicles | 104 (22.0%) | 17 (12.6%) |
| Total | 472 (100.0%) | 135 (100.0%) |
Real Estate & Mortgages in Elmore
Real Estate and Mortgage Overview in Elmore
| Characteristic | Without Mortgage | With Mortgage |
| Housing Units | 179 | 293 |
| Median Property Value | $136,900 | $157,300 |
| Median Household Income | $61,250 | $63 |
| Monthly Housing Costs | $550 | $0 |
| Real Estate Taxes | $2,085 | $6 |
Property Value by Mortgage Status in Elmore
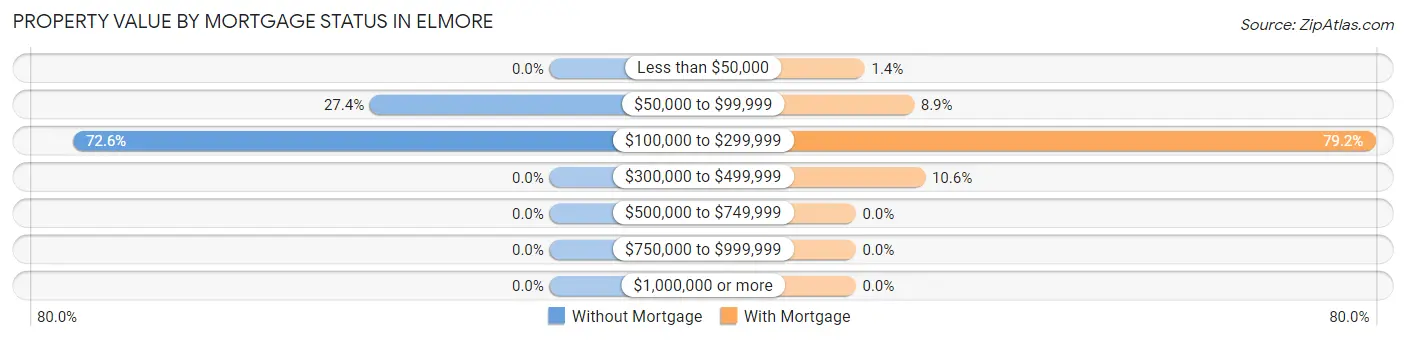
| Property Value | Without Mortgage | With Mortgage |
| Less than $50,000 | 0 (0.0%) | 4 (1.4%) |
| $50,000 to $99,999 | 49 (27.4%) | 26 (8.9%) |
| $100,000 to $299,999 | 130 (72.6%) | 232 (79.2%) |
| $300,000 to $499,999 | 0 (0.0%) | 31 (10.6%) |
| $500,000 to $749,999 | 0 (0.0%) | 0 (0.0%) |
| $750,000 to $999,999 | 0 (0.0%) | 0 (0.0%) |
| $1,000,000 or more | 0 (0.0%) | 0 (0.0%) |
| Total | 179 (100.0%) | 293 (100.0%) |
Household Income by Mortgage Status in Elmore
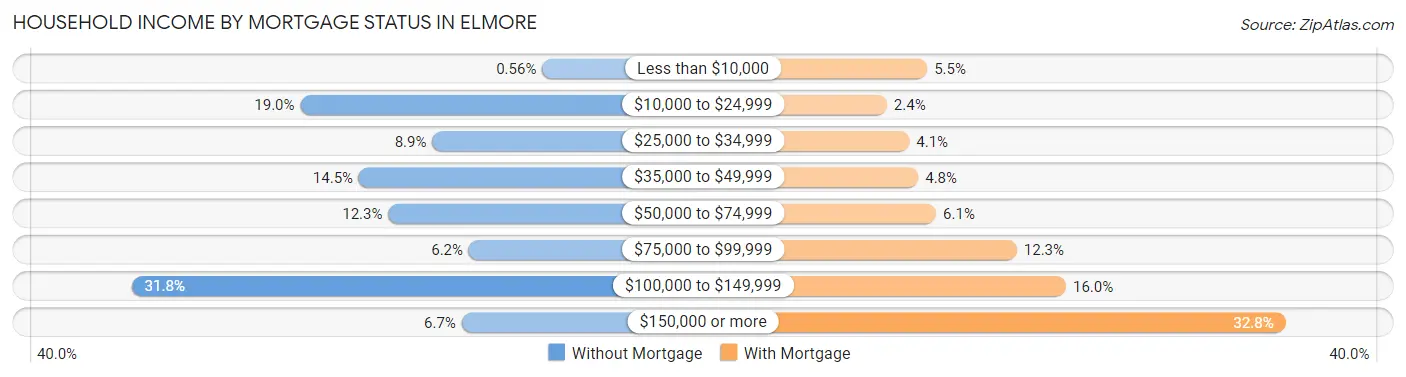
| Household Income | Without Mortgage | With Mortgage |
| Less than $10,000 | 1 (0.6%) | 16 (5.5%) |
| $10,000 to $24,999 | 34 (19.0%) | 7 (2.4%) |
| $25,000 to $34,999 | 16 (8.9%) | 12 (4.1%) |
| $35,000 to $49,999 | 26 (14.5%) | 14 (4.8%) |
| $50,000 to $74,999 | 22 (12.3%) | 18 (6.1%) |
| $75,000 to $99,999 | 11 (6.1%) | 36 (12.3%) |
| $100,000 to $149,999 | 57 (31.8%) | 47 (16.0%) |
| $150,000 or more | 12 (6.7%) | 96 (32.8%) |
| Total | 179 (100.0%) | 293 (100.0%) |
Property Value to Household Income Ratio in Elmore
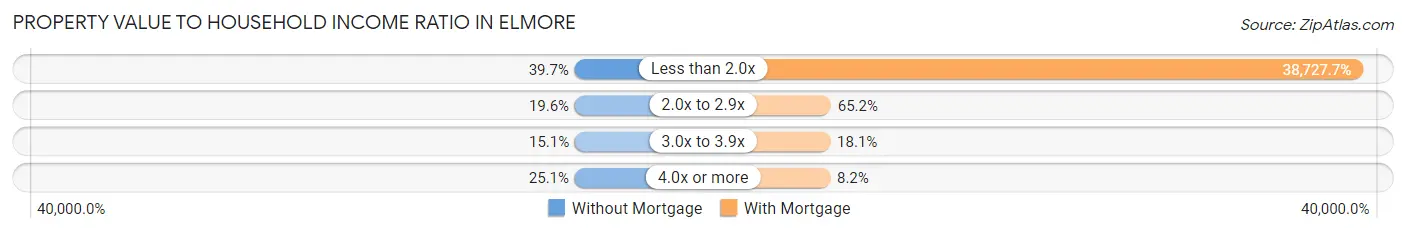
| Value-to-Income Ratio | Without Mortgage | With Mortgage |
| Less than 2.0x | 71 (39.7%) | 113,472 (38,727.6%) |
| 2.0x to 2.9x | 35 (19.6%) | 191 (65.2%) |
| 3.0x to 3.9x | 27 (15.1%) | 53 (18.1%) |
| 4.0x or more | 45 (25.1%) | 24 (8.2%) |
| Total | 179 (100.0%) | 293 (100.0%) |
Real Estate Taxes by Mortgage Status in Elmore
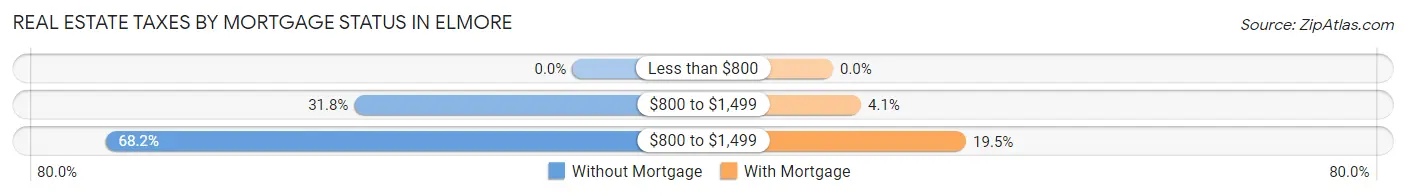
| Property Taxes | Without Mortgage | With Mortgage |
| Less than $800 | 0 (0.0%) | 0 (0.0%) |
| $800 to $1,499 | 57 (31.8%) | 12 (4.1%) |
| $800 to $1,499 | 122 (68.2%) | 57 (19.5%) |
| Total | 179 (100.0%) | 293 (100.0%) |
Health & Disability in Elmore
Health Insurance Coverage by Age in Elmore
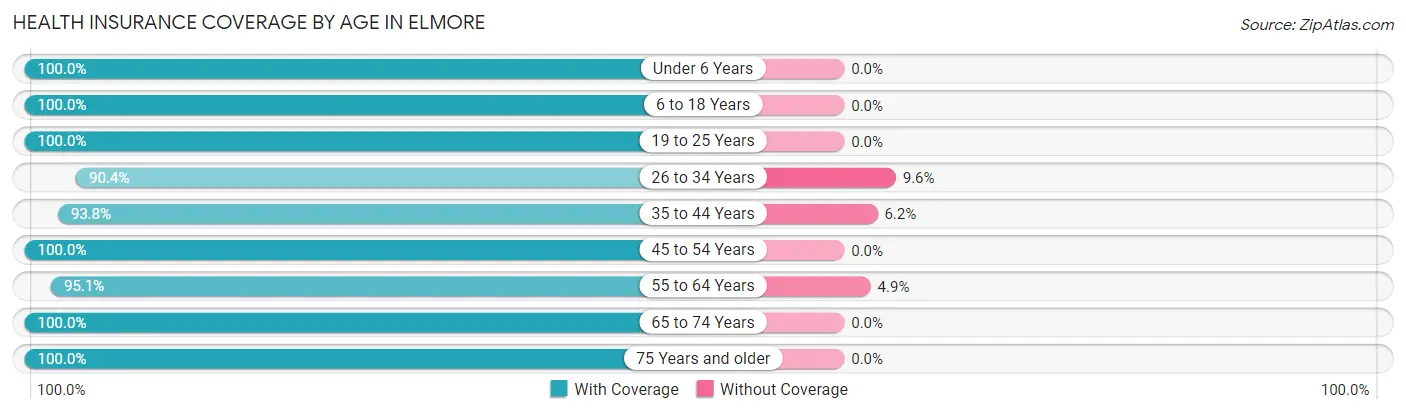
| Age Bracket | With Coverage | Without Coverage |
| Under 6 Years | 89 (100.0%) | 0 (0.0%) |
| 6 to 18 Years | 353 (100.0%) | 0 (0.0%) |
| 19 to 25 Years | 180 (100.0%) | 0 (0.0%) |
| 26 to 34 Years | 113 (90.4%) | 12 (9.6%) |
| 35 to 44 Years | 182 (93.8%) | 12 (6.2%) |
| 45 to 54 Years | 221 (100.0%) | 0 (0.0%) |
| 55 to 64 Years | 232 (95.1%) | 12 (4.9%) |
| 65 to 74 Years | 121 (100.0%) | 0 (0.0%) |
| 75 Years and older | 70 (100.0%) | 0 (0.0%) |
| Total | 1,561 (97.8%) | 36 (2.2%) |
Health Insurance Coverage by Citizenship Status in Elmore
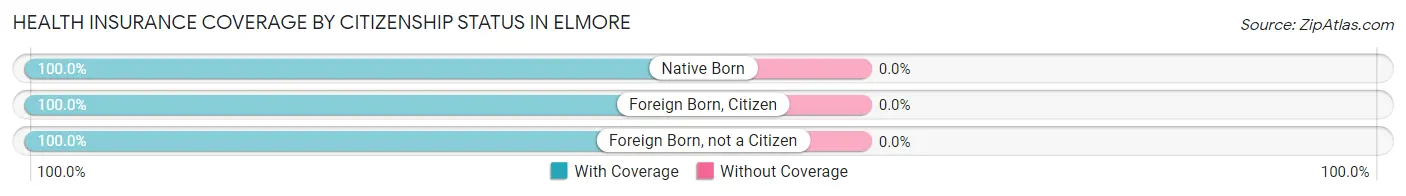
| Citizenship Status | With Coverage | Without Coverage |
| Native Born | 89 (100.0%) | 0 (0.0%) |
| Foreign Born, Citizen | 353 (100.0%) | 0 (0.0%) |
| Foreign Born, not a Citizen | 180 (100.0%) | 0 (0.0%) |
Health Insurance Coverage by Household Income in Elmore
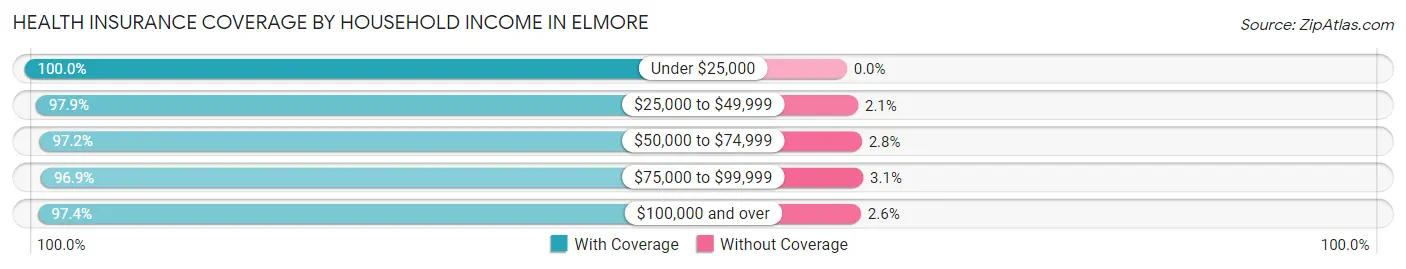
| Household Income | With Coverage | Without Coverage |
| Under $25,000 | 231 (100.0%) | 0 (0.0%) |
| $25,000 to $49,999 | 232 (97.9%) | 5 (2.1%) |
| $50,000 to $74,999 | 139 (97.2%) | 4 (2.8%) |
| $75,000 to $99,999 | 221 (96.9%) | 7 (3.1%) |
| $100,000 and over | 738 (97.4%) | 20 (2.6%) |
Public vs Private Health Insurance Coverage by Age in Elmore
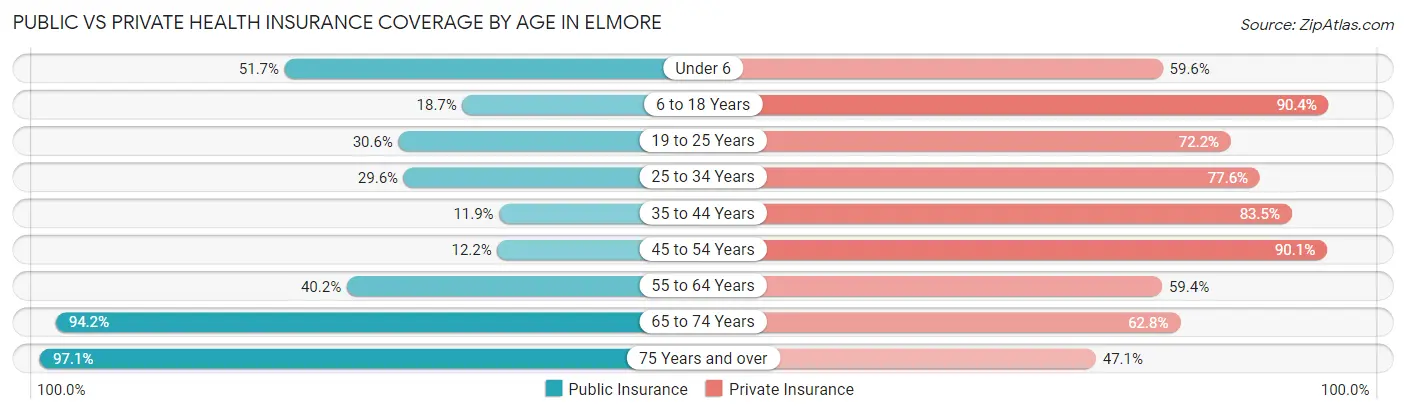
| Age Bracket | Public Insurance | Private Insurance |
| Under 6 | 46 (51.7%) | 53 (59.6%) |
| 6 to 18 Years | 66 (18.7%) | 319 (90.4%) |
| 19 to 25 Years | 55 (30.6%) | 130 (72.2%) |
| 25 to 34 Years | 37 (29.6%) | 97 (77.6%) |
| 35 to 44 Years | 23 (11.9%) | 162 (83.5%) |
| 45 to 54 Years | 27 (12.2%) | 199 (90.0%) |
| 55 to 64 Years | 98 (40.2%) | 145 (59.4%) |
| 65 to 74 Years | 114 (94.2%) | 76 (62.8%) |
| 75 Years and over | 68 (97.1%) | 33 (47.1%) |
| Total | 534 (33.4%) | 1,214 (76.0%) |
Disability Status by Sex by Age in Elmore
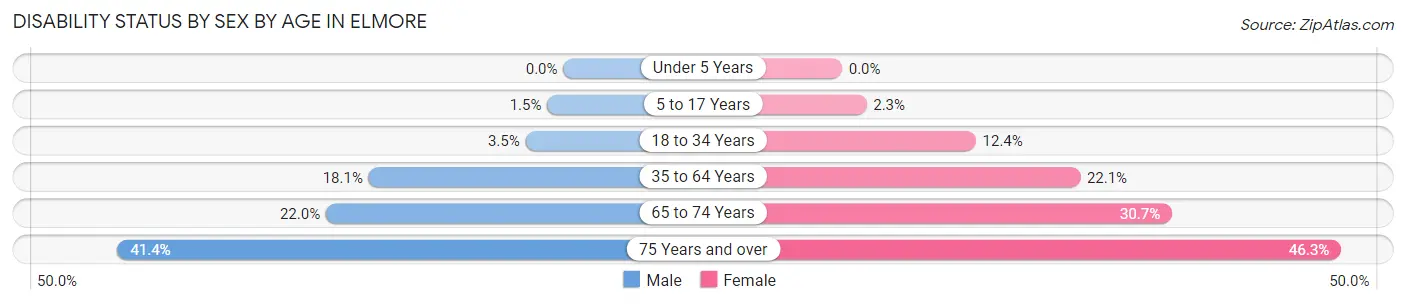
| Age Bracket | Male | Female |
| Under 5 Years | 0 (0.0%) | 0 (0.0%) |
| 5 to 17 Years | 3 (1.5%) | 3 (2.3%) |
| 18 to 34 Years | 6 (3.5%) | 20 (12.4%) |
| 35 to 64 Years | 52 (18.1%) | 82 (22.1%) |
| 65 to 74 Years | 13 (22.0%) | 19 (30.6%) |
| 75 Years and over | 12 (41.4%) | 19 (46.3%) |
Disability Class by Sex by Age in Elmore
Disability Class: Hearing Difficulty
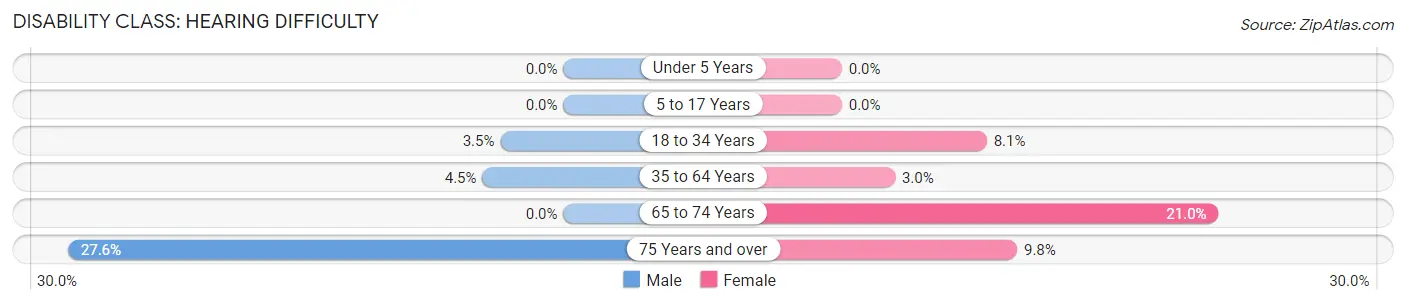
| Age Bracket | Male | Female |
| Under 5 Years | 0 (0.0%) | 0 (0.0%) |
| 5 to 17 Years | 0 (0.0%) | 0 (0.0%) |
| 18 to 34 Years | 6 (3.5%) | 13 (8.1%) |
| 35 to 64 Years | 13 (4.5%) | 11 (3.0%) |
| 65 to 74 Years | 0 (0.0%) | 13 (21.0%) |
| 75 Years and over | 8 (27.6%) | 4 (9.8%) |
Disability Class: Vision Difficulty
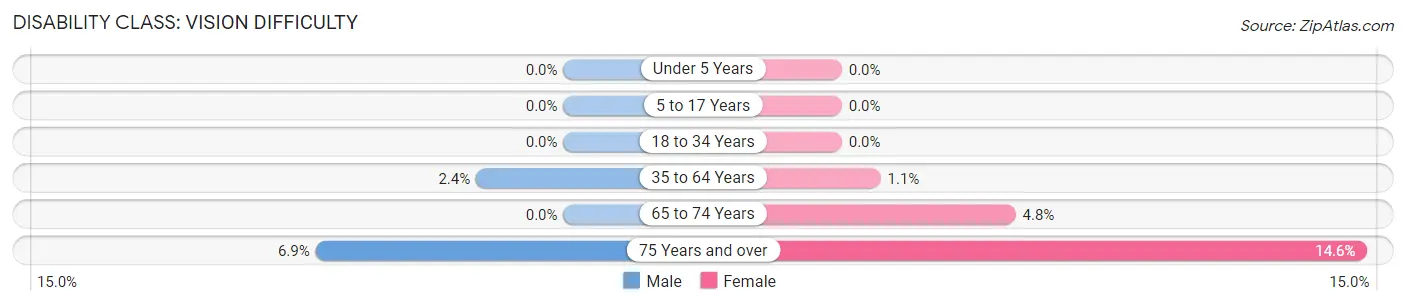
| Age Bracket | Male | Female |
| Under 5 Years | 0 (0.0%) | 0 (0.0%) |
| 5 to 17 Years | 0 (0.0%) | 0 (0.0%) |
| 18 to 34 Years | 0 (0.0%) | 0 (0.0%) |
| 35 to 64 Years | 7 (2.4%) | 4 (1.1%) |
| 65 to 74 Years | 0 (0.0%) | 3 (4.8%) |
| 75 Years and over | 2 (6.9%) | 6 (14.6%) |
Disability Class: Cognitive Difficulty
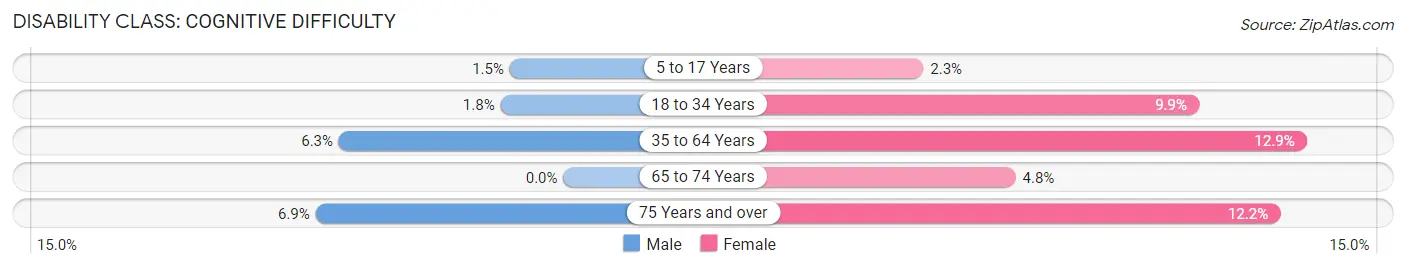
| Age Bracket | Male | Female |
| 5 to 17 Years | 3 (1.5%) | 3 (2.3%) |
| 18 to 34 Years | 3 (1.8%) | 16 (9.9%) |
| 35 to 64 Years | 18 (6.2%) | 48 (12.9%) |
| 65 to 74 Years | 0 (0.0%) | 3 (4.8%) |
| 75 Years and over | 2 (6.9%) | 5 (12.2%) |
Disability Class: Ambulatory Difficulty
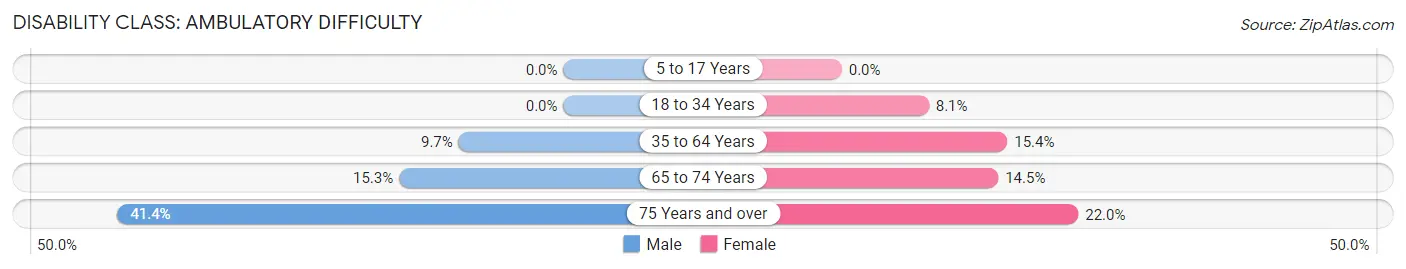
| Age Bracket | Male | Female |
| 5 to 17 Years | 0 (0.0%) | 0 (0.0%) |
| 18 to 34 Years | 0 (0.0%) | 13 (8.1%) |
| 35 to 64 Years | 28 (9.7%) | 57 (15.4%) |
| 65 to 74 Years | 9 (15.2%) | 9 (14.5%) |
| 75 Years and over | 12 (41.4%) | 9 (22.0%) |
Disability Class: Self-Care Difficulty
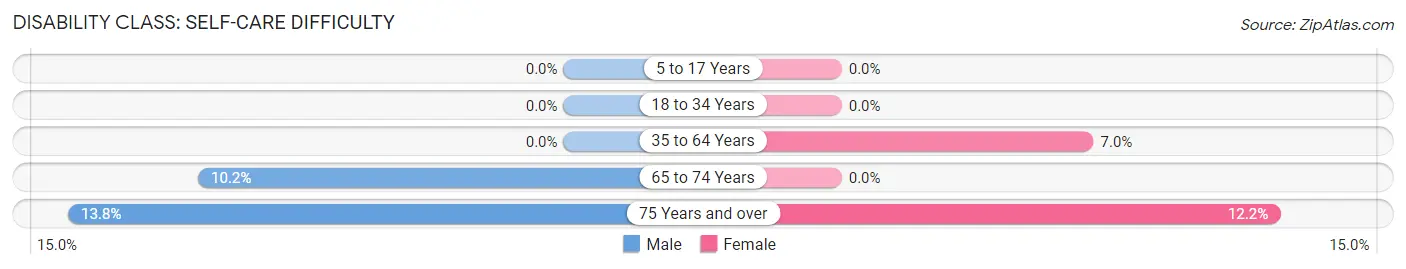
| Age Bracket | Male | Female |
| 5 to 17 Years | 0 (0.0%) | 0 (0.0%) |
| 18 to 34 Years | 0 (0.0%) | 0 (0.0%) |
| 35 to 64 Years | 0 (0.0%) | 26 (7.0%) |
| 65 to 74 Years | 6 (10.2%) | 0 (0.0%) |
| 75 Years and over | 4 (13.8%) | 5 (12.2%) |
Technology Access in Elmore
Computing Device Access in Elmore
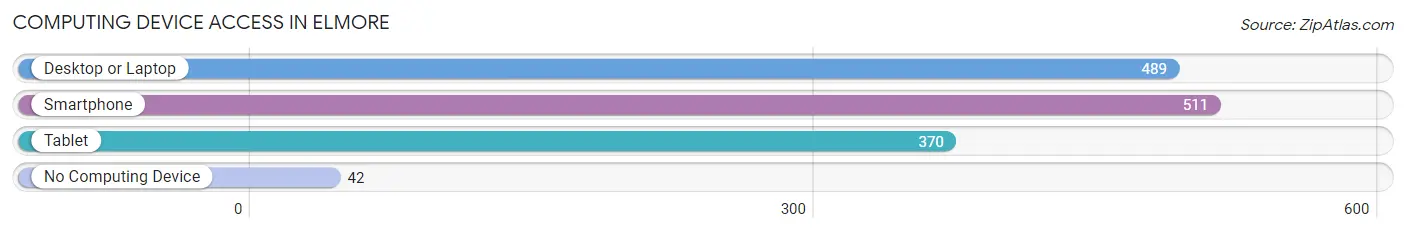
| Device Type | # Households | % Households |
| Desktop or Laptop | 489 | 80.6% |
| Smartphone | 511 | 84.2% |
| Tablet | 370 | 61.0% |
| No Computing Device | 42 | 6.9% |
| Total | 607 | 100.0% |
Internet Access in Elmore
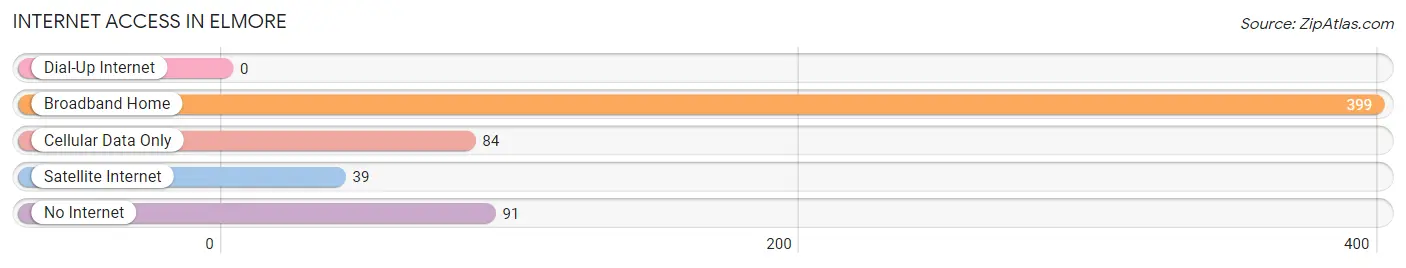
| Internet Type | # Households | % Households |
| Dial-Up Internet | 0 | 0.0% |
| Broadband Home | 399 | 65.7% |
| Cellular Data Only | 84 | 13.8% |
| Satellite Internet | 39 | 6.4% |
| No Internet | 91 | 15.0% |
| Total | 607 | 100.0% |
Elmore Summary
Elmore, Ohio is a small village located in Ottawa County in the northwest corner of the state. It is situated on the banks of the Portage River, which flows into Lake Erie. The village has a population of 1,717 people, according to the 2010 census.
Geography
Elmore is located in the northwest corner of Ottawa County, Ohio, on the banks of the Portage River. The village is situated on the eastern edge of the Great Black Swamp, a large marshy area that once covered much of northwestern Ohio. The village is bordered by the towns of Genoa, Clay Center, and Oak Harbor. The Portage River flows through the village, and Lake Erie is located just a few miles to the north.
The village is located in a flat, low-lying area, with an elevation of 645 feet above sea level. The climate is humid continental, with hot summers and cold winters. The average annual temperature is around 50 degrees Fahrenheit, and the average annual precipitation is around 36 inches.
History
Elmore was founded in 1837 by a group of settlers from New York. The village was named after a local Native American chief, Chief Elmore. The village was incorporated in 1854, and the first post office was established in 1855.
The village grew slowly over the years, and by the early 1900s, it had a population of around 500 people. The village was home to several small businesses, including a sawmill, a grist mill, a blacksmith shop, and a general store.
In the late 1800s, the village was connected to the outside world by the Toledo, St. Louis & Kansas City Railroad. This allowed the village to become a shipping point for local farmers and businesses.
Economy
The economy of Elmore is largely based on agriculture. The village is home to several farms, which produce a variety of crops, including corn, soybeans, wheat, and hay. The village also has several small businesses, including a grocery store, a hardware store, and a restaurant.
The village is also home to several manufacturing companies, including a plastics manufacturer, a metal fabricator, and a machine shop. The village is also home to a number of small service businesses, including a gas station, a car wash, and a barber shop.
Demographics
According to the 2010 census, the population of Elmore is 1,717 people. The median age is 43.7 years, and the median household income is $45,938. The village is predominantly white, with 95.3% of the population identifying as white. The remaining 4.7% of the population is made up of African Americans, Hispanics, and other races.
The village is home to a number of churches, including the Elmore United Methodist Church, the Elmore Baptist Church, and the Elmore Presbyterian Church. The village also has a public library, a post office, and a fire department.
Conclusion
Elmore, Ohio is a small village located in Ottawa County in the northwest corner of the state. It is situated on the banks of the Portage River, which flows into Lake Erie. The village has a population of 1,717 people, according to the 2010 census. The economy of Elmore is largely based on agriculture, and the village is home to several small businesses. The village is predominantly white, with 95.3% of the population identifying as white. The village is home to a number of churches, a public library, a post office, and a fire department.
Common Questions
What is Per Capita Income in Elmore?
Per Capita income in Elmore is $31,669.
What is the Median Family Income in Elmore?
Median Family Income in Elmore is $104,583.
What is the Median Household income in Elmore?
Median Household Income in Elmore is $69,583.
What is Income or Wage Gap in Elmore?
Income or Wage Gap in Elmore is 53.5%.
Women in Elmore earn 46.5 cents for every dollar earned by a man.
What is Inequality or Gini Index in Elmore?
Inequality or Gini Index in Elmore is 0.42.
What is the Total Population of Elmore?
Total Population of Elmore is 1,601.
What is the Total Male Population of Elmore?
Total Male Population of Elmore is 793.
What is the Total Female Population of Elmore?
Total Female Population of Elmore is 808.
What is the Ratio of Males per 100 Females in Elmore?
There are 98.14 Males per 100 Females in Elmore.
What is the Ratio of Females per 100 Males in Elmore?
There are 101.89 Females per 100 Males in Elmore.
What is the Median Population Age in Elmore?
Median Population Age in Elmore is 37.3 Years.
What is the Average Family Size in Elmore
Average Family Size in Elmore is 3.3 People.
What is the Average Household Size in Elmore
Average Household Size in Elmore is 2.6 People.
How Large is the Labor Force in Elmore?
There are 764 People in the Labor Forcein in Elmore.
What is the Percentage of People in the Labor Force in Elmore?
61.7% of People are in the Labor Force in Elmore.