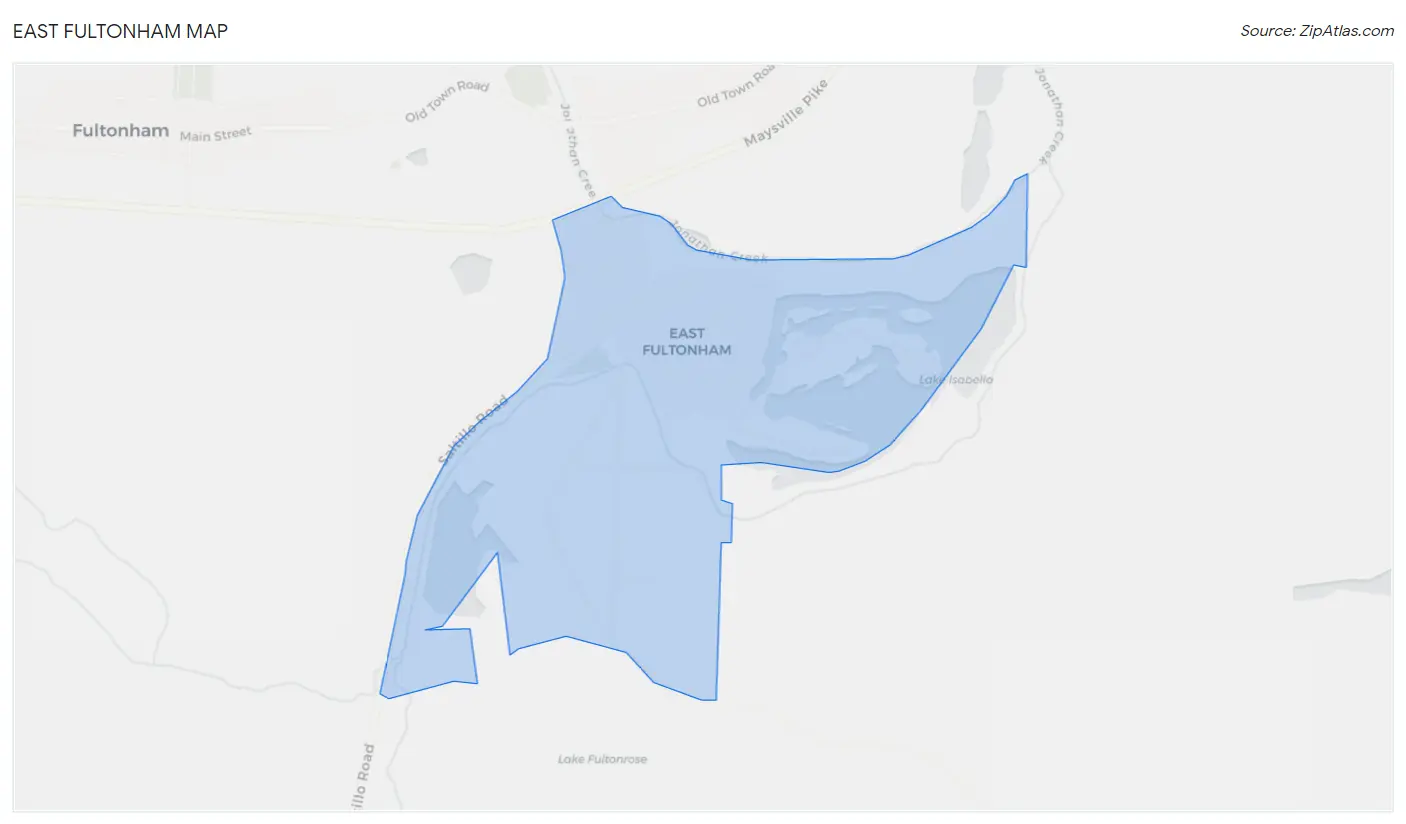
East Fultonham, OH Map & Demographics
East Fultonham Map
East Fultonham Overview
$22,555
PER CAPITA INCOME
0.38
INEQUALITY / GINI INDEX
143
TOTAL POPULATION
60
MALE POPULATION
83
FEMALE POPULATION
72.29
MALES / 100 FEMALES
138.33
FEMALES / 100 MALES
37.4
MEDIAN AGE
2.8
AVG FAMILY SIZE
2.5
AVG HOUSEHOLD SIZE
56
LABOR FORCE [ PEOPLE ]
47.9%
PERCENT IN LABOR FORCE
East Fultonham Zip Codes
East Fultonham Area Codes
Income in East Fultonham
Income Overview in East Fultonham
| Characteristic | Number | Measure |
| Per Capita Income | 143 | $22,555 |
| Median Family Income | 43 | $0 |
| Mean Family Income | 43 | $49,979 |
| Median Household Income | 58 | $0 |
| Mean Household Income | 58 | $61,553 |
| Income Deficit | 43 | $0 |
| Wage / Income Gap (%) | 143 | 0.00% |
| Wage / Income Gap ($) | 143 | 100.00¢ per $1 |
| Gini / Inequality Index | 143 | 0.38 |
Earnings by Sex in East Fultonham
| Sex | Number | Average Earnings |
| Male | 33 (50.0%) | $0 |
| Female | 33 (50.0%) | $0 |
| Total | 66 (100.0%) | $0 |
Earnings by Sex by Income Bracket in East Fultonham
The most common earnings brackets in East Fultonham are $12,500 to $14,999 for men (9 | 27.3%) and $35,000 to $39,999 for women (15 | 45.5%).
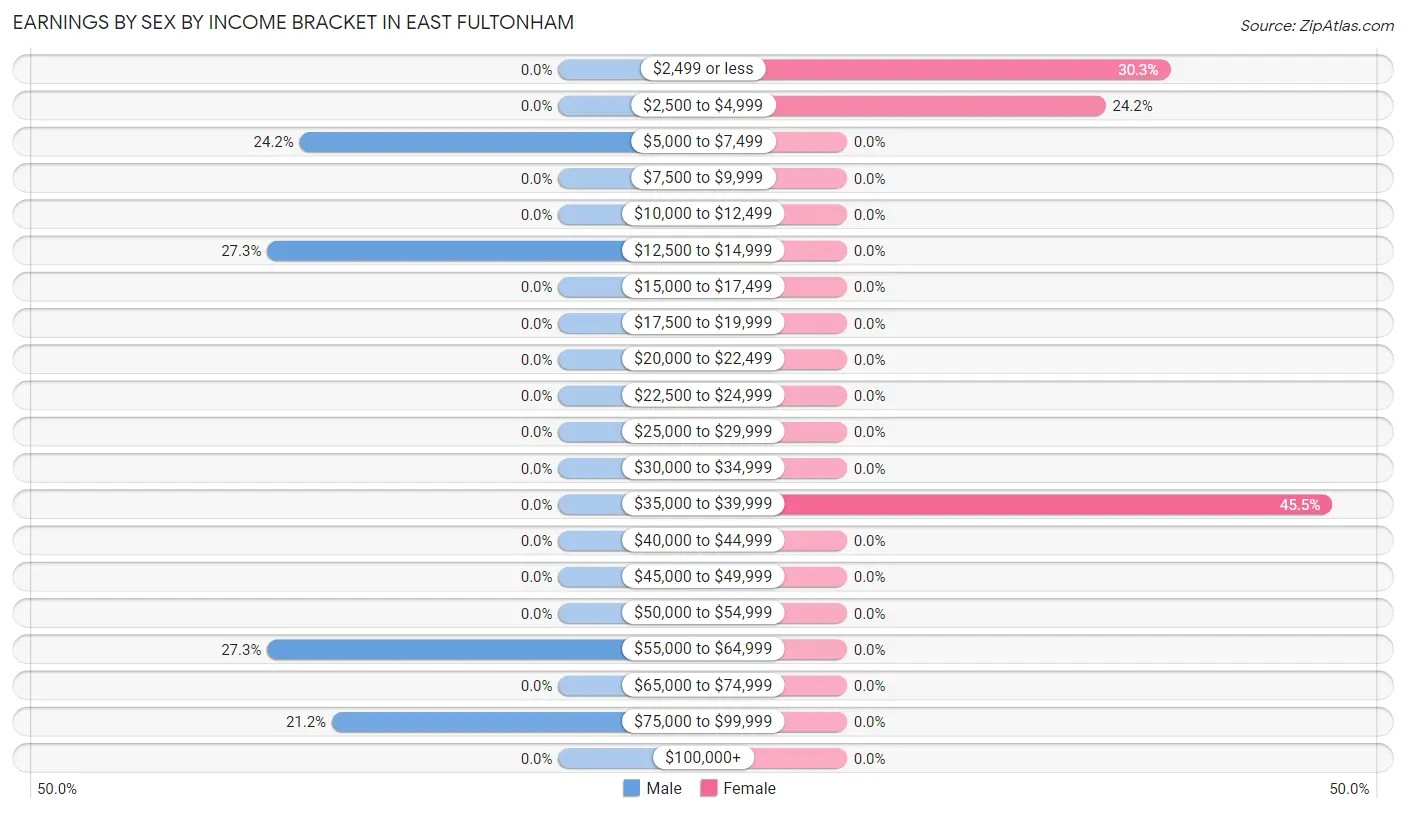
| Income | Male | Female |
| $2,499 or less | 0 (0.0%) | 10 (30.3%) |
| $2,500 to $4,999 | 0 (0.0%) | 8 (24.2%) |
| $5,000 to $7,499 | 8 (24.2%) | 0 (0.0%) |
| $7,500 to $9,999 | 0 (0.0%) | 0 (0.0%) |
| $10,000 to $12,499 | 0 (0.0%) | 0 (0.0%) |
| $12,500 to $14,999 | 9 (27.3%) | 0 (0.0%) |
| $15,000 to $17,499 | 0 (0.0%) | 0 (0.0%) |
| $17,500 to $19,999 | 0 (0.0%) | 0 (0.0%) |
| $20,000 to $22,499 | 0 (0.0%) | 0 (0.0%) |
| $22,500 to $24,999 | 0 (0.0%) | 0 (0.0%) |
| $25,000 to $29,999 | 0 (0.0%) | 0 (0.0%) |
| $30,000 to $34,999 | 0 (0.0%) | 0 (0.0%) |
| $35,000 to $39,999 | 0 (0.0%) | 15 (45.5%) |
| $40,000 to $44,999 | 0 (0.0%) | 0 (0.0%) |
| $45,000 to $49,999 | 0 (0.0%) | 0 (0.0%) |
| $50,000 to $54,999 | 0 (0.0%) | 0 (0.0%) |
| $55,000 to $64,999 | 9 (27.3%) | 0 (0.0%) |
| $65,000 to $74,999 | 0 (0.0%) | 0 (0.0%) |
| $75,000 to $99,999 | 7 (21.2%) | 0 (0.0%) |
| $100,000+ | 0 (0.0%) | 0 (0.0%) |
| Total | 33 (100.0%) | 33 (100.0%) |
Earnings by Sex by Educational Attainment in East Fultonham
| Educational Attainment | Male Income | Female Income |
| Less than High School | - | - |
| High School Diploma | - | - |
| College or Associate's Degree | - | - |
| Bachelor's Degree | - | - |
| Graduate Degree | - | - |
| Total | - | - |
Family Income in East Fultonham
Family Income Brackets in East Fultonham
According to the East Fultonham family income data, there are 18 families falling into the $25,000 to $34,999 income range, which is the most common income bracket and makes up 41.9% of all families.
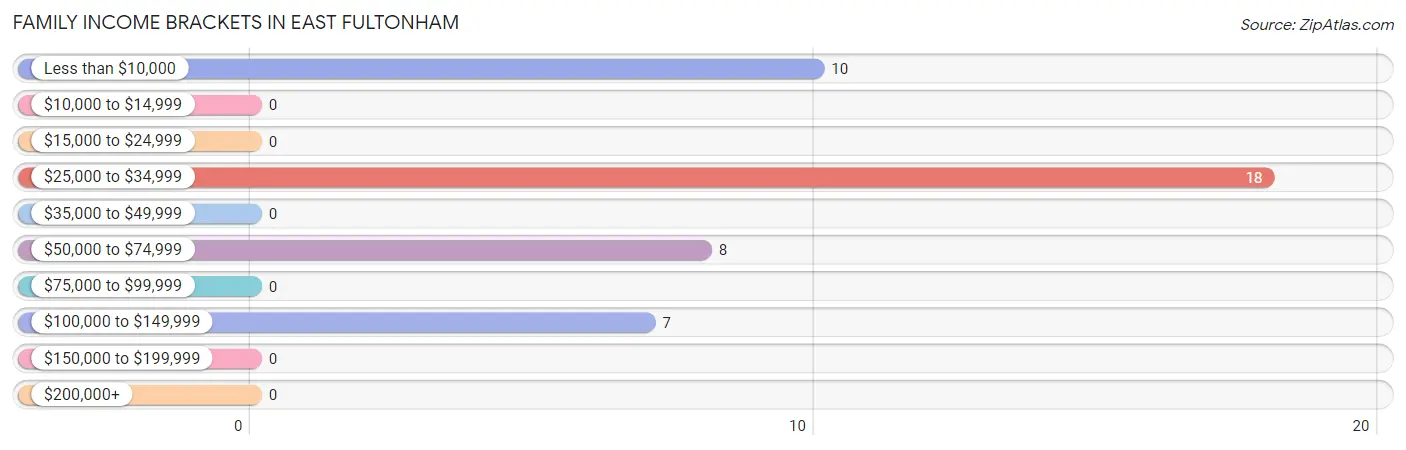
| Income Bracket | # Families | % Families |
| Less than $10,000 | 10 | 23.3% |
| $10,000 to $14,999 | 0 | 0.0% |
| $15,000 to $24,999 | 0 | 0.0% |
| $25,000 to $34,999 | 18 | 41.9% |
| $35,000 to $49,999 | 0 | 0.0% |
| $50,000 to $74,999 | 8 | 18.6% |
| $75,000 to $99,999 | 0 | 0.0% |
| $100,000 to $149,999 | 7 | 16.3% |
| $150,000 to $199,999 | 0 | 0.0% |
| $200,000+ | 0 | 0.0% |
Family Income by Famaliy Size in East Fultonham
2-person families (24 | 55.8%) account for the highest median family income in East Fultonham with $68,438 per family, while 2-person families (24 | 55.8%) have the highest median income of $34,219 per family member.
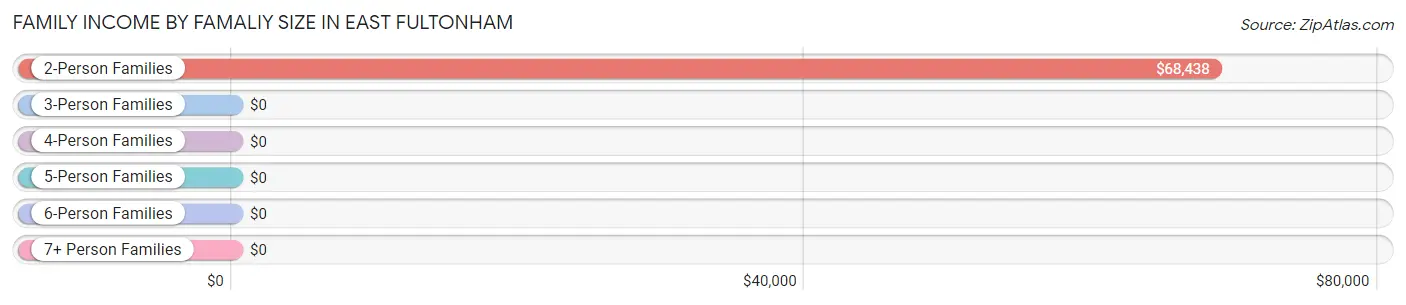
| Income Bracket | # Families | Median Income |
| 2-Person Families | 24 (55.8%) | $68,438 |
| 3-Person Families | 0 (0.0%) | $0 |
| 4-Person Families | 19 (44.2%) | $0 |
| 5-Person Families | 0 (0.0%) | $0 |
| 6-Person Families | 0 (0.0%) | $0 |
| 7+ Person Families | 0 (0.0%) | $0 |
| Total | 43 (100.0%) | $0 |
Family Income by Number of Earners in East Fultonham
| Number of Earners | # Families | Median Income |
| No Earners | 18 (41.9%) | $0 |
| 1 Earner | 16 (37.2%) | $0 |
| 2 Earners | 0 (0.0%) | $0 |
| 3+ Earners | 9 (20.9%) | $0 |
| Total | 43 (100.0%) | $0 |
Household Income in East Fultonham
Household Income Brackets in East Fultonham
With 18 households falling in the category, the $25,000 to $34,999 income range is the most frequent in East Fultonham, accounting for 31.0% of all households.
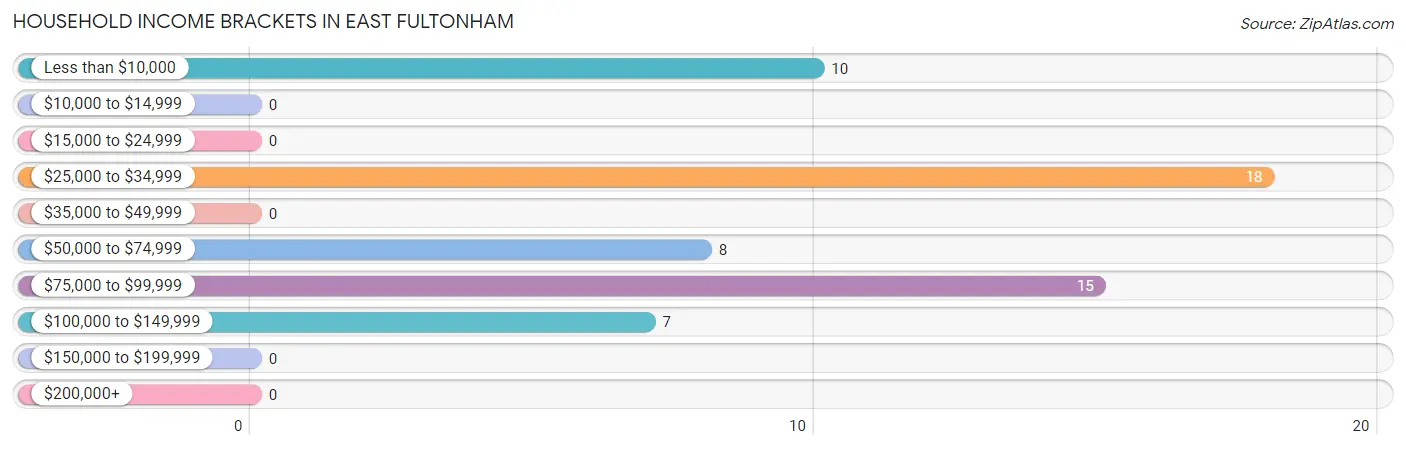
| Income Bracket | # Households | % Households |
| Less than $10,000 | 10 | 17.2% |
| $10,000 to $14,999 | 0 | 0.0% |
| $15,000 to $24,999 | 0 | 0.0% |
| $25,000 to $34,999 | 18 | 31.0% |
| $35,000 to $49,999 | 0 | 0.0% |
| $50,000 to $74,999 | 8 | 13.8% |
| $75,000 to $99,999 | 15 | 25.9% |
| $100,000 to $149,999 | 7 | 12.1% |
| $150,000 to $199,999 | 0 | 0.0% |
| $200,000+ | 0 | 0.0% |
Household Income by Householder Age in East Fultonham
The median household income in East Fultonham is $0, with the highest median household income of $68,438 found in the 65+ years age bracket for the primary householder. A total of 24 households (41.4%) fall into this category.
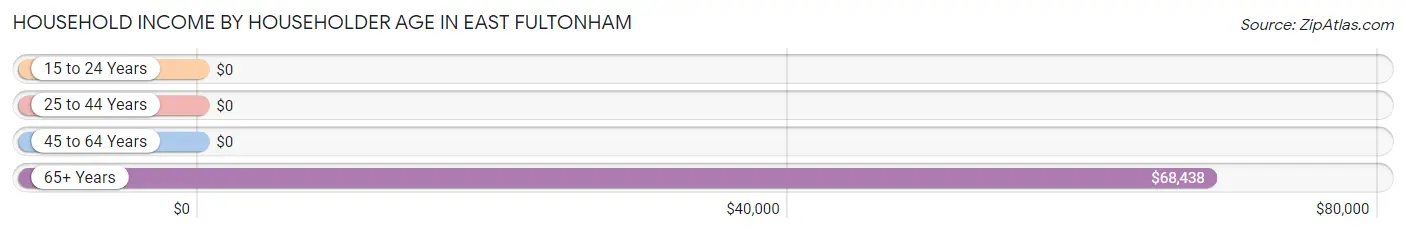
| Income Bracket | # Households | Median Income |
| 15 to 24 Years | 0 (0.0%) | $0 |
| 25 to 44 Years | 34 (58.6%) | $0 |
| 45 to 64 Years | 0 (0.0%) | $0 |
| 65+ Years | 24 (41.4%) | $68,438 |
| Total | 58 (100.0%) | $0 |
Poverty in East Fultonham
Income Below Poverty by Sex and Age in East Fultonham
With 60.0% poverty level for males and 42.2% for females among the residents of East Fultonham, 6 to 11 year old males and under 5 year old females are the most vulnerable to poverty, with 9 males (100.0%) and 9 females (100.0%) in their respective age groups living below the poverty level.
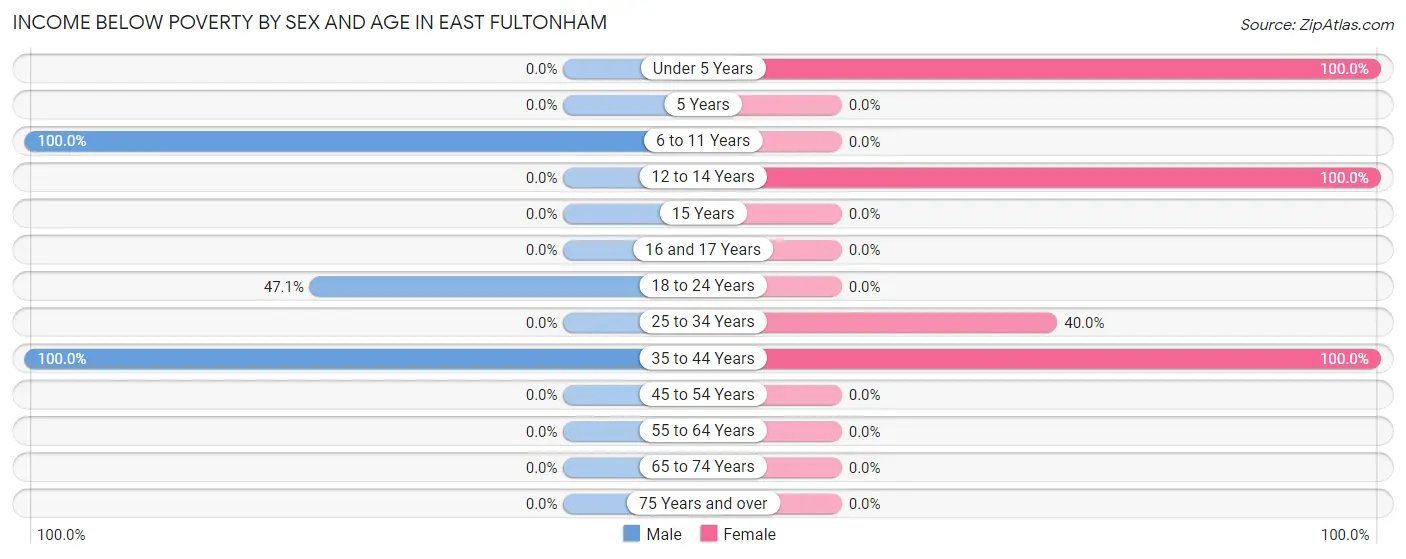
| Age Bracket | Male | Female |
| Under 5 Years | 0 (0.0%) | 9 (100.0%) |
| 5 Years | 0 (0.0%) | 0 (0.0%) |
| 6 to 11 Years | 9 (100.0%) | 0 (0.0%) |
| 12 to 14 Years | 0 (0.0%) | 8 (100.0%) |
| 15 Years | 0 (0.0%) | 0 (0.0%) |
| 16 and 17 Years | 0 (0.0%) | 0 (0.0%) |
| 18 to 24 Years | 8 (47.1%) | 0 (0.0%) |
| 25 to 34 Years | 0 (0.0%) | 10 (40.0%) |
| 35 to 44 Years | 19 (100.0%) | 8 (100.0%) |
| 45 to 54 Years | 0 (0.0%) | 0 (0.0%) |
| 55 to 64 Years | 0 (0.0%) | 0 (0.0%) |
| 65 to 74 Years | 0 (0.0%) | 0 (0.0%) |
| 75 Years and over | 0 (0.0%) | 0 (0.0%) |
| Total | 36 (60.0%) | 35 (42.2%) |
Income Above Poverty by Sex and Age in East Fultonham
According to the poverty statistics in East Fultonham, males aged 65 to 74 years and females aged 65 to 74 years are the age groups that are most secure financially, with 100.0% of males and 100.0% of females in these age groups living above the poverty line.
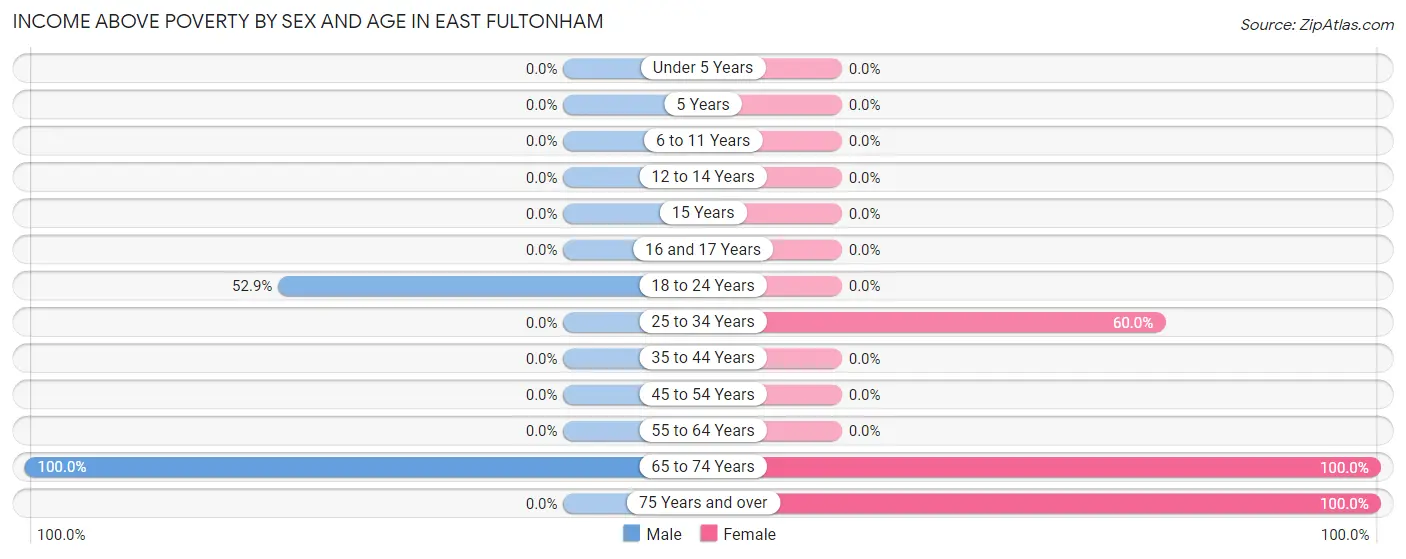
| Age Bracket | Male | Female |
| Under 5 Years | 0 (0.0%) | 0 (0.0%) |
| 5 Years | 0 (0.0%) | 0 (0.0%) |
| 6 to 11 Years | 0 (0.0%) | 0 (0.0%) |
| 12 to 14 Years | 0 (0.0%) | 0 (0.0%) |
| 15 Years | 0 (0.0%) | 0 (0.0%) |
| 16 and 17 Years | 0 (0.0%) | 0 (0.0%) |
| 18 to 24 Years | 9 (52.9%) | 0 (0.0%) |
| 25 to 34 Years | 0 (0.0%) | 15 (60.0%) |
| 35 to 44 Years | 0 (0.0%) | 0 (0.0%) |
| 45 to 54 Years | 0 (0.0%) | 0 (0.0%) |
| 55 to 64 Years | 0 (0.0%) | 0 (0.0%) |
| 65 to 74 Years | 15 (100.0%) | 24 (100.0%) |
| 75 Years and over | 0 (0.0%) | 9 (100.0%) |
| Total | 24 (40.0%) | 48 (57.8%) |
Income Below Poverty Among Married-Couple Families in East Fultonham
The poverty statistics for married-couple families in East Fultonham show that 55.9% or 19 of the total 34 families live below the poverty line. Families with 1 or 2 children have the highest poverty rate of 100.0%, comprising of 19 families. On the other hand, families with no children have the lowest poverty rate of 0.0%, which includes 0 families.
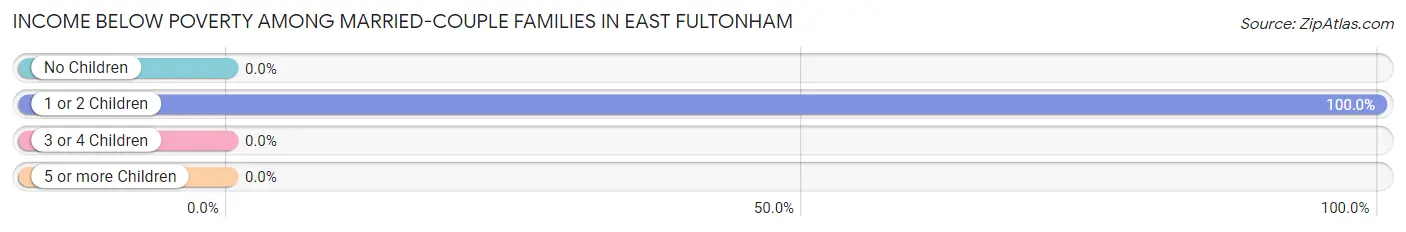
| Children | Above Poverty | Below Poverty |
| No Children | 15 (100.0%) | 0 (0.0%) |
| 1 or 2 Children | 0 (0.0%) | 19 (100.0%) |
| 3 or 4 Children | 0 (0.0%) | 0 (0.0%) |
| 5 or more Children | 0 (0.0%) | 0 (0.0%) |
| Total | 15 (44.1%) | 19 (55.9%) |
Income Below Poverty Among Single-Parent Households in East Fultonham
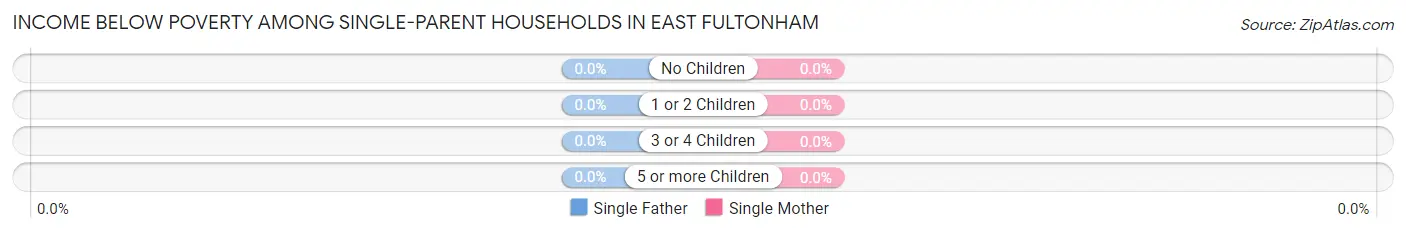
| Children | Single Father | Single Mother |
| No Children | 0 (0.0%) | 0 (0.0%) |
| 1 or 2 Children | 0 (0.0%) | 0 (0.0%) |
| 3 or 4 Children | 0 (0.0%) | 0 (0.0%) |
| 5 or more Children | 0 (0.0%) | 0 (0.0%) |
| Total | 0 (0.0%) | 0 (0.0%) |
Income Below Poverty Among Married-Couple vs Single-Parent Households in East Fultonham
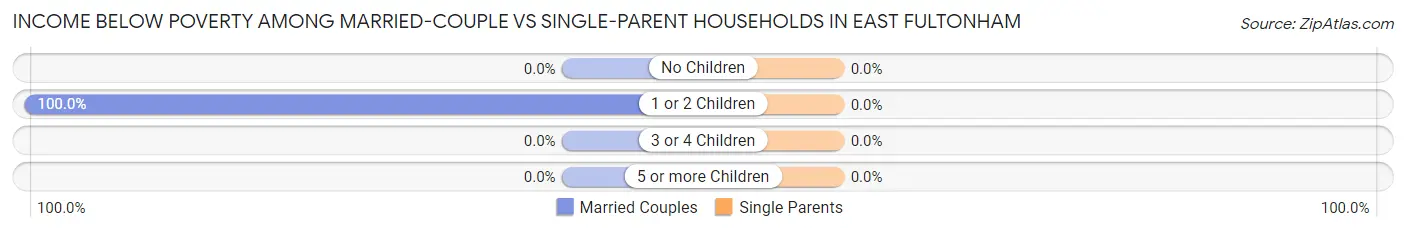
| Children | Married-Couple Families | Single-Parent Households |
| No Children | 0 (0.0%) | 0 (0.0%) |
| 1 or 2 Children | 19 (100.0%) | 0 (0.0%) |
| 3 or 4 Children | 0 (0.0%) | 0 (0.0%) |
| 5 or more Children | 0 (0.0%) | 0 (0.0%) |
| Total | 19 (55.9%) | 0 (0.0%) |
Race in East Fultonham
The most populous races in East Fultonham are White / Caucasian (128 | 89.5%), and Two or more Races (15 | 10.5%).
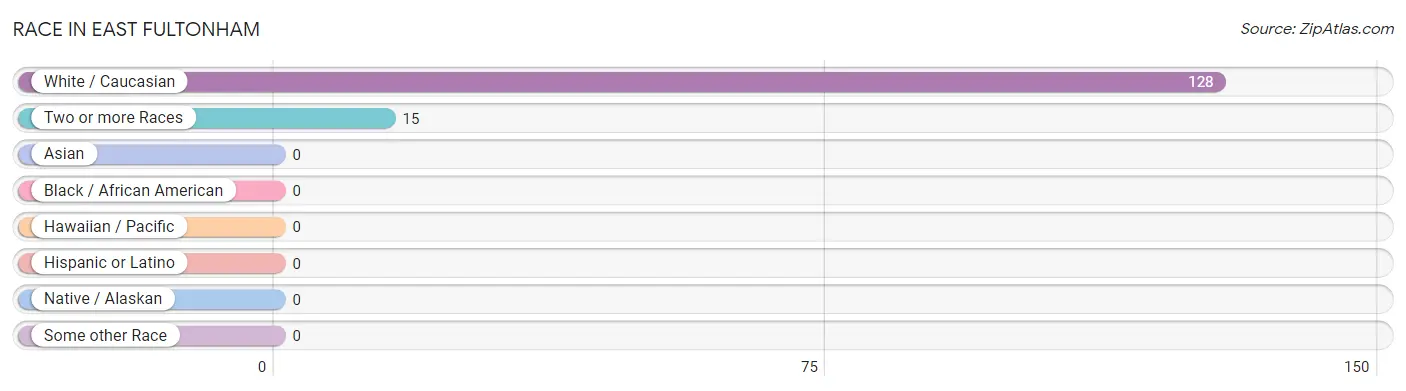
| Race | # Population | % Population |
| Asian | 0 | 0.0% |
| Black / African American | 0 | 0.0% |
| Hawaiian / Pacific | 0 | 0.0% |
| Hispanic or Latino | 0 | 0.0% |
| Native / Alaskan | 0 | 0.0% |
| White / Caucasian | 128 | 89.5% |
| Two or more Races | 15 | 10.5% |
| Some other Race | 0 | 0.0% |
| Total | 143 | 100.0% |
Ancestry in East Fultonham
The most populous ancestries reported in East Fultonham are American (33 | 23.1%), Irish (19 | 13.3%), Bhutanese (15 | 10.5%), and Native Hawaiian (15 | 10.5%), together accounting for 57.4% of all East Fultonham residents.
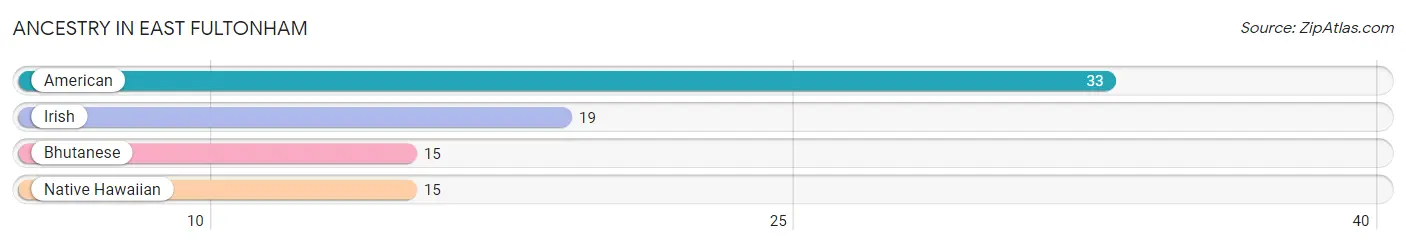
| Ancestry | # Population | % Population |
| American | 33 | 23.1% |
| Bhutanese | 15 | 10.5% |
| Irish | 19 | 13.3% |
| Native Hawaiian | 15 | 10.5% | View All 4 Rows |
Immigrants in East Fultonham

| Immigration Origin | # Population | % Population | View All 0 Rows |
Sex and Age in East Fultonham
Sex and Age in East Fultonham
The most populous age groups in East Fultonham are 40 to 44 Years (19 | 31.7%) for men and 25 to 29 Years (25 | 30.1%) for women.
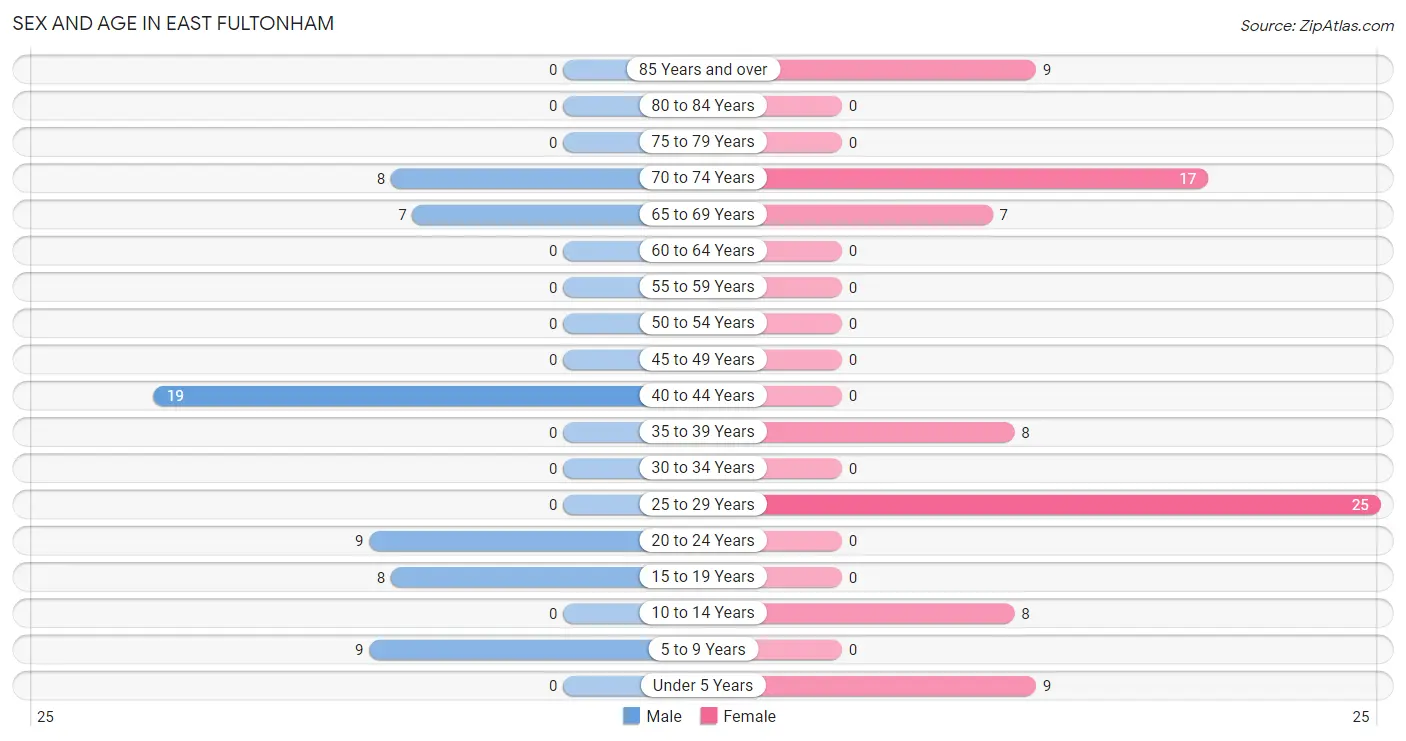
| Age Bracket | Male | Female |
| Under 5 Years | 0 (0.0%) | 9 (10.8%) |
| 5 to 9 Years | 9 (15.0%) | 0 (0.0%) |
| 10 to 14 Years | 0 (0.0%) | 8 (9.6%) |
| 15 to 19 Years | 8 (13.3%) | 0 (0.0%) |
| 20 to 24 Years | 9 (15.0%) | 0 (0.0%) |
| 25 to 29 Years | 0 (0.0%) | 25 (30.1%) |
| 30 to 34 Years | 0 (0.0%) | 0 (0.0%) |
| 35 to 39 Years | 0 (0.0%) | 8 (9.6%) |
| 40 to 44 Years | 19 (31.7%) | 0 (0.0%) |
| 45 to 49 Years | 0 (0.0%) | 0 (0.0%) |
| 50 to 54 Years | 0 (0.0%) | 0 (0.0%) |
| 55 to 59 Years | 0 (0.0%) | 0 (0.0%) |
| 60 to 64 Years | 0 (0.0%) | 0 (0.0%) |
| 65 to 69 Years | 7 (11.7%) | 7 (8.4%) |
| 70 to 74 Years | 8 (13.3%) | 17 (20.5%) |
| 75 to 79 Years | 0 (0.0%) | 0 (0.0%) |
| 80 to 84 Years | 0 (0.0%) | 0 (0.0%) |
| 85 Years and over | 0 (0.0%) | 9 (10.8%) |
| Total | 60 (100.0%) | 83 (100.0%) |
Families and Households in East Fultonham
Median Family Size in East Fultonham
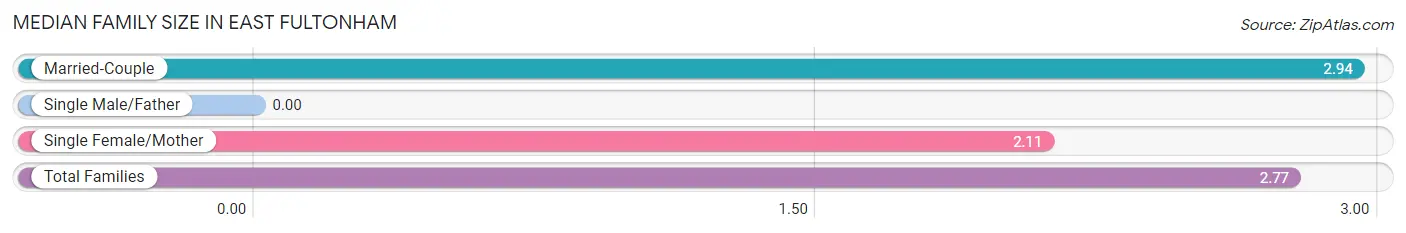
| Family Type | # Families | Family Size |
| Married-Couple | 34 (79.1%) | 2.94 |
| Single Male/Father | 0 (0.0%) | - |
| Single Female/Mother | 9 (20.9%) | 2.11 |
| Total Families | 43 (100.0%) | 2.77 |
Median Household Size in East Fultonham
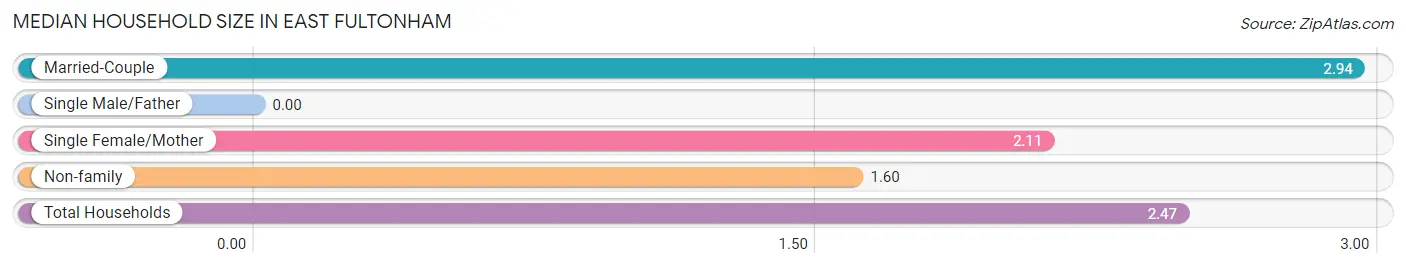
| Household Type | # Households | Household Size |
| Married-Couple | 34 (58.6%) | 2.94 |
| Single Male/Father | 0 (0.0%) | - |
| Single Female/Mother | 9 (15.5%) | 2.11 |
| Non-family | 15 (25.9%) | 1.60 |
| Total Households | 58 (100.0%) | 2.47 |
Household Size by Marriage Status in East Fultonham
Out of a total of 58 households in East Fultonham, 43 (74.1%) are family households, while 15 (25.9%) are nonfamily households. The most numerous type of family households are 2-person households, comprising 24, and the most common type of nonfamily households are 2-person households, comprising 15.
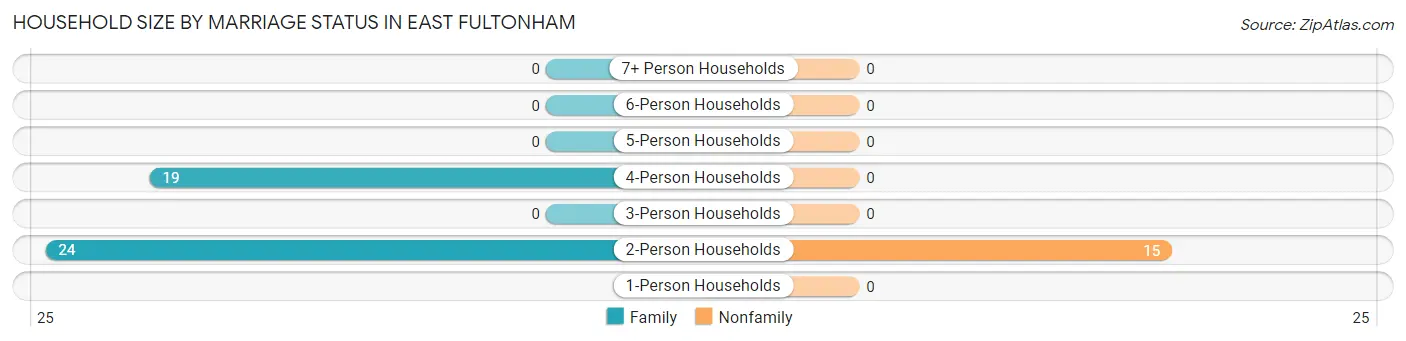
| Household Size | Family Households | Nonfamily Households |
| 1-Person Households | - | 0 (0.0%) |
| 2-Person Households | 24 (41.4%) | 15 (25.9%) |
| 3-Person Households | 0 (0.0%) | 0 (0.0%) |
| 4-Person Households | 19 (32.8%) | 0 (0.0%) |
| 5-Person Households | 0 (0.0%) | 0 (0.0%) |
| 6-Person Households | 0 (0.0%) | 0 (0.0%) |
| 7+ Person Households | 0 (0.0%) | 0 (0.0%) |
| Total | 43 (74.1%) | 15 (25.9%) |
Female Fertility in East Fultonham
Fertility by Age in East Fultonham
| Age Bracket | Women with Births | Births / 1,000 Women |
| 15 to 19 years | 0 (0.0%) | 0.0 |
| 20 to 34 years | 0 (0.0%) | 0.0 |
| 35 to 50 years | 0 (0.0%) | 0.0 |
| Total | 0 (0.0%) | 0.0 |
Fertility by Age by Marriage Status in East Fultonham
| Age Bracket | Married | Unmarried |
| 15 to 19 years | 0 (0.0%) | 0 (0.0%) |
| 20 to 34 years | 0 (0.0%) | 0 (0.0%) |
| 35 to 50 years | 0 (0.0%) | 0 (0.0%) |
| Total | 0 (0.0%) | 0 (0.0%) |
Fertility by Education in East Fultonham
| Educational Attainment | Women with Births | Births / 1,000 Women |
| Less than High School | 0 (0.0%) | 0.0 |
| High School Diploma | 0 (0.0%) | 0.0 |
| College or Associate's Degree | 0 (0.0%) | 0.0 |
| Bachelor's Degree | 0 (0.0%) | 0.0 |
| Graduate Degree | 0 (0.0%) | 0.0 |
| Total | 0 (0.0%) | 0.0 |
Fertility by Education by Marriage Status in East Fultonham
| Educational Attainment | Married | Unmarried |
| Less than High School | 0 (0.0%) | 0 (0.0%) |
| High School Diploma | 0 (0.0%) | 0 (0.0%) |
| College or Associate's Degree | 0 (0.0%) | 0 (0.0%) |
| Bachelor's Degree | 0 (0.0%) | 0 (0.0%) |
| Graduate Degree | 0 (0.0%) | 0 (0.0%) |
| Total | 0 (0.0%) | 0 (0.0%) |
Employment Characteristics in East Fultonham
Employment by Class of Employer in East Fultonham
Among the 56 employed individuals in East Fultonham, private company employees (32 | 57.1%), not-for-profit organizations (9 | 16.1%), and local government employees (8 | 14.3%) make up the most common classes of employment.
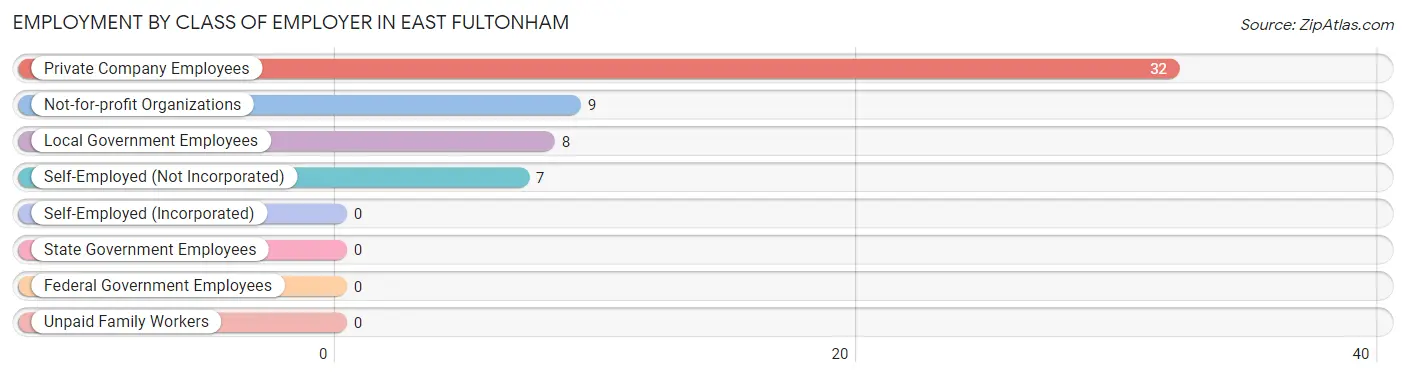
| Employer Class | # Employees | % Employees |
| Private Company Employees | 32 | 57.1% |
| Self-Employed (Incorporated) | 0 | 0.0% |
| Self-Employed (Not Incorporated) | 7 | 12.5% |
| Not-for-profit Organizations | 9 | 16.1% |
| Local Government Employees | 8 | 14.3% |
| State Government Employees | 0 | 0.0% |
| Federal Government Employees | 0 | 0.0% |
| Unpaid Family Workers | 0 | 0.0% |
| Total | 56 | 100.0% |
Employment Status by Age in East Fultonham
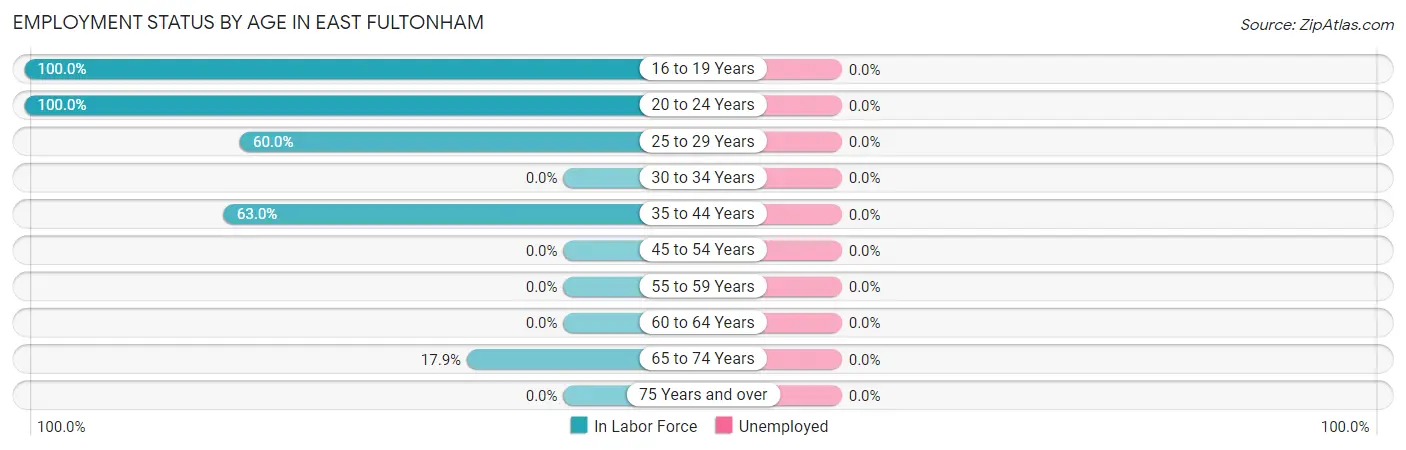
| Age Bracket | In Labor Force | Unemployed |
| 16 to 19 Years | 8 (100.0%) | 0 (0.0%) |
| 20 to 24 Years | 9 (100.0%) | 0 (0.0%) |
| 25 to 29 Years | 15 (60.0%) | 0 (0.0%) |
| 30 to 34 Years | 0 (0.0%) | 0 (0.0%) |
| 35 to 44 Years | 17 (63.0%) | 0 (0.0%) |
| 45 to 54 Years | 0 (0.0%) | 0 (0.0%) |
| 55 to 59 Years | 0 (0.0%) | 0 (0.0%) |
| 60 to 64 Years | 0 (0.0%) | 0 (0.0%) |
| 65 to 74 Years | 7 (17.9%) | 0 (0.0%) |
| 75 Years and over | 0 (0.0%) | 0 (0.0%) |
| Total | 56 (47.9%) | 0 (0.0%) |
Employment Status by Educational Attainment in East Fultonham
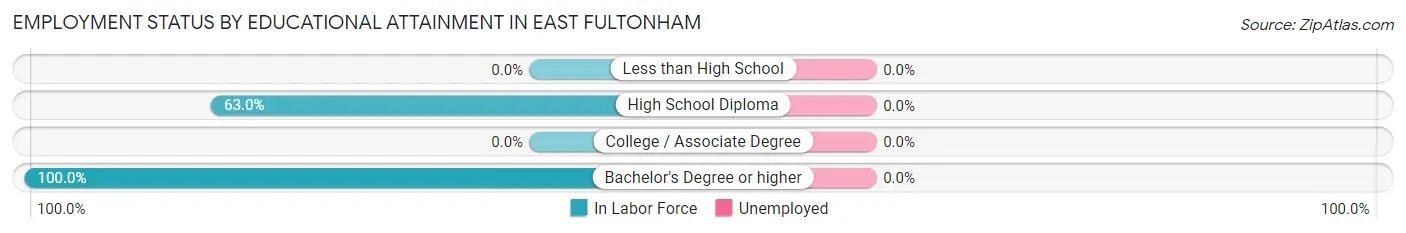
| Educational Attainment | In Labor Force | Unemployed |
| Less than High School | 0 (0.0%) | 0 (0.0%) |
| High School Diploma | 17 (63.0%) | 0 (0.0%) |
| College / Associate Degree | 0 (0.0%) | 0 (0.0%) |
| Bachelor's Degree or higher | 15 (100.0%) | 0 (0.0%) |
| Total | 32 (61.5%) | 0 (0.0%) |
Employment Occupations by Sex in East Fultonham
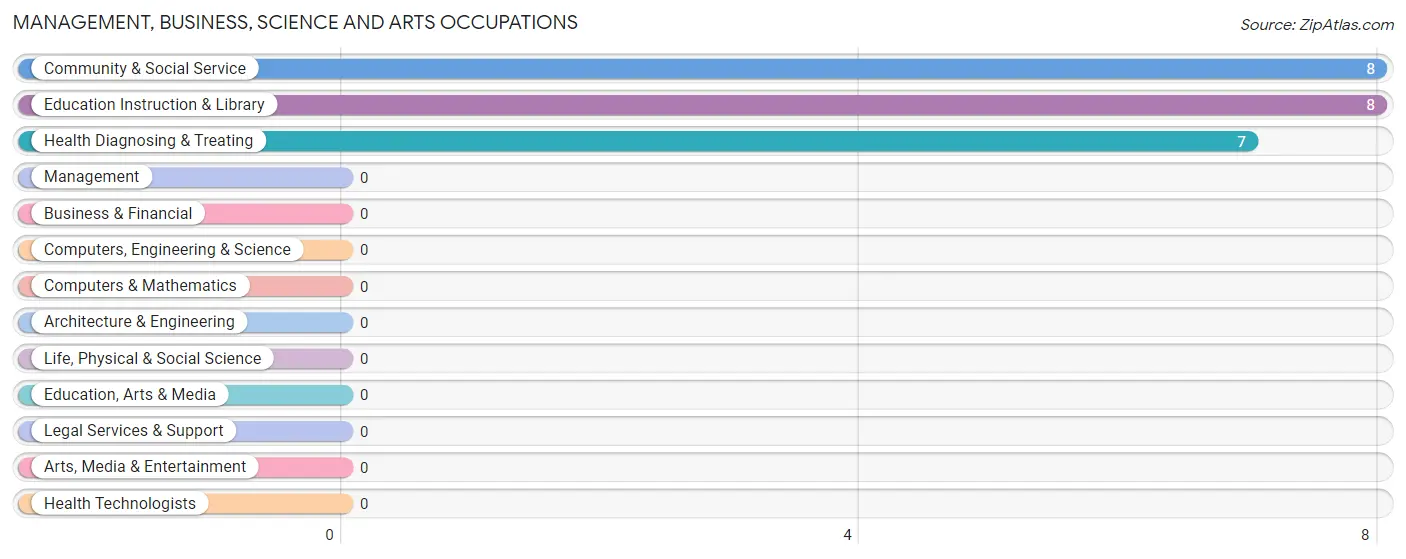
Management, Business, Science and Arts Occupations
The most common Management, Business, Science and Arts occupations in East Fultonham are Community & Social Service (8 | 14.3%), Education Instruction & Library (8 | 14.3%), and Health Diagnosing & Treating (7 | 12.5%).
Management, Business, Science and Arts Occupations by Sex
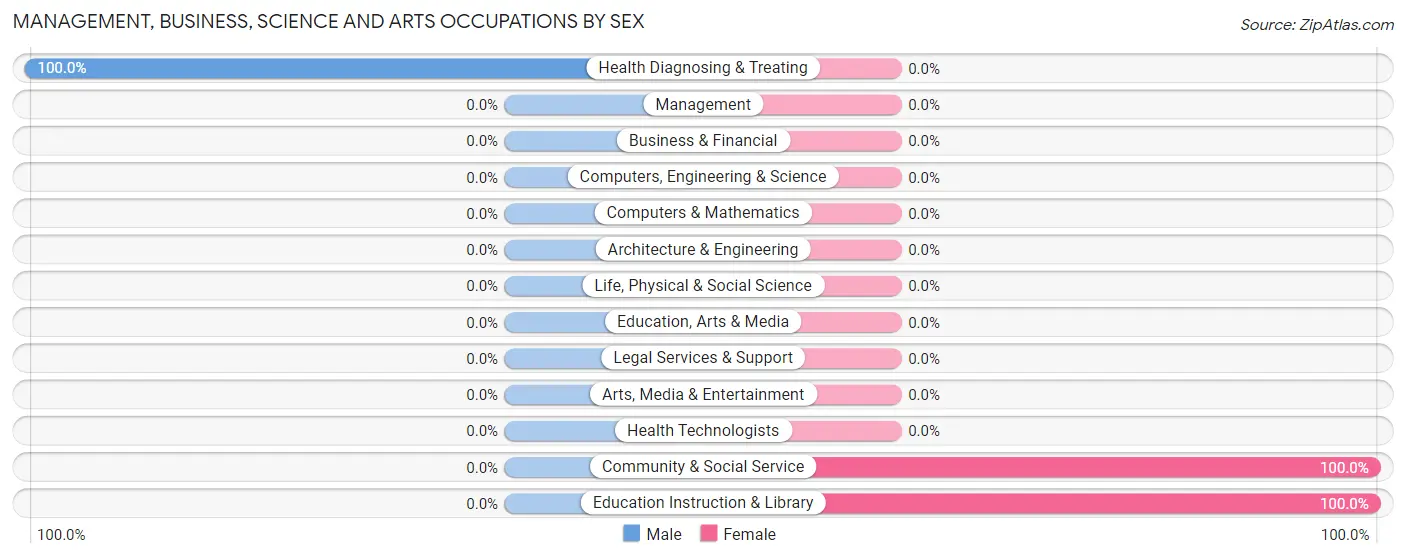
| Occupation | Male | Female |
| Management | 0 (0.0%) | 0 (0.0%) |
| Business & Financial | 0 (0.0%) | 0 (0.0%) |
| Computers, Engineering & Science | 0 (0.0%) | 0 (0.0%) |
| Computers & Mathematics | 0 (0.0%) | 0 (0.0%) |
| Architecture & Engineering | 0 (0.0%) | 0 (0.0%) |
| Life, Physical & Social Science | 0 (0.0%) | 0 (0.0%) |
| Community & Social Service | 0 (0.0%) | 8 (100.0%) |
| Education, Arts & Media | 0 (0.0%) | 0 (0.0%) |
| Legal Services & Support | 0 (0.0%) | 0 (0.0%) |
| Education Instruction & Library | 0 (0.0%) | 8 (100.0%) |
| Arts, Media & Entertainment | 0 (0.0%) | 0 (0.0%) |
| Health Diagnosing & Treating | 7 (100.0%) | 0 (0.0%) |
| Health Technologists | 0 (0.0%) | 0 (0.0%) |
| Total (Category) | 7 (46.7%) | 8 (53.3%) |
| Total (Overall) | 33 (58.9%) | 23 (41.1%) |
Services Occupations
The most common Services occupations in East Fultonham are Cleaning & Maintenance (9 | 16.1%), and Food Preparation & Serving (8 | 14.3%).
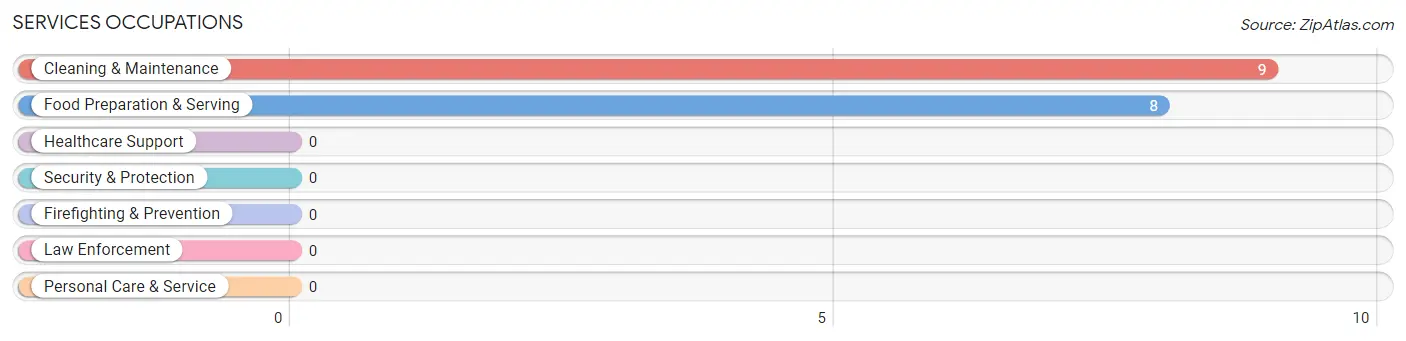
Services Occupations by Sex
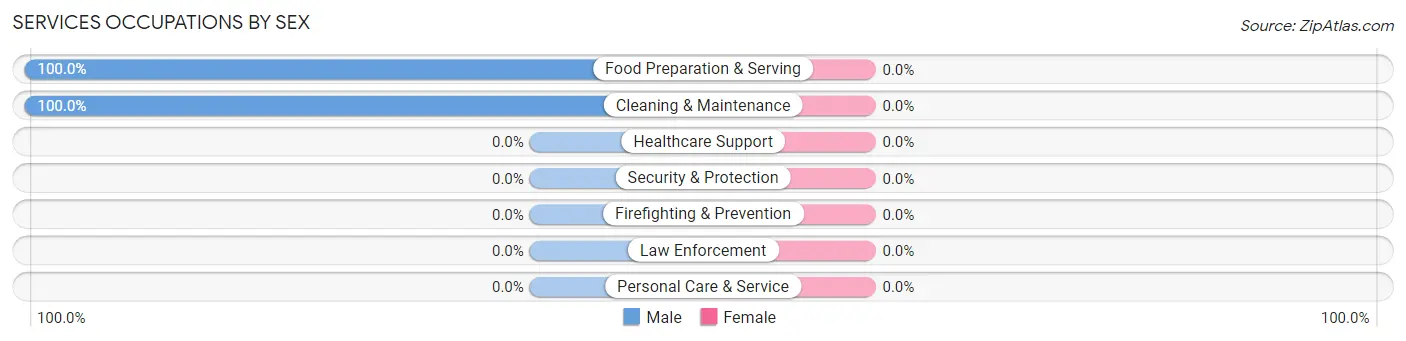
| Occupation | Male | Female |
| Healthcare Support | 0 (0.0%) | 0 (0.0%) |
| Security & Protection | 0 (0.0%) | 0 (0.0%) |
| Firefighting & Prevention | 0 (0.0%) | 0 (0.0%) |
| Law Enforcement | 0 (0.0%) | 0 (0.0%) |
| Food Preparation & Serving | 8 (100.0%) | 0 (0.0%) |
| Cleaning & Maintenance | 9 (100.0%) | 0 (0.0%) |
| Personal Care & Service | 0 (0.0%) | 0 (0.0%) |
| Total (Category) | 17 (100.0%) | 0 (0.0%) |
| Total (Overall) | 33 (58.9%) | 23 (41.1%) |
Sales and Office Occupations
The most common Sales and Office occupations in East Fultonham are , and Office & Administration (24 | 42.9%).
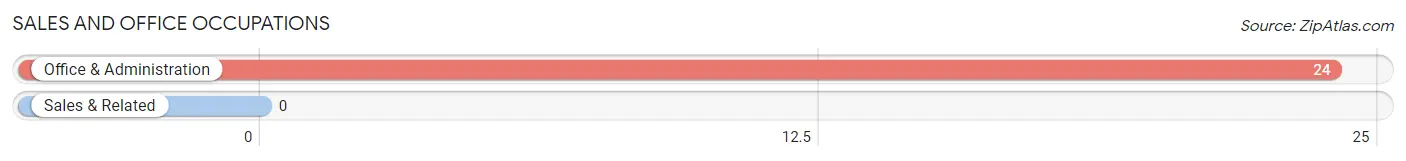
Sales and Office Occupations by Sex
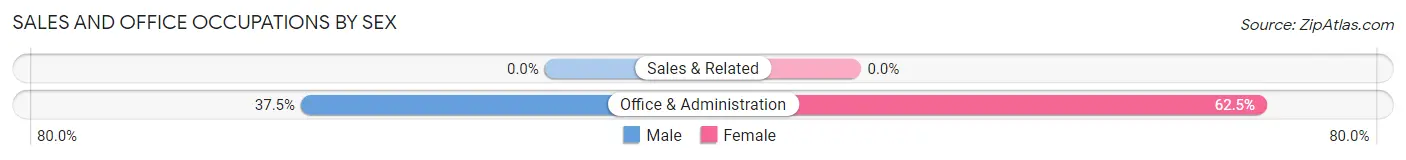
| Occupation | Male | Female |
| Sales & Related | 0 (0.0%) | 0 (0.0%) |
| Office & Administration | 9 (37.5%) | 15 (62.5%) |
| Total (Category) | 9 (37.5%) | 15 (62.5%) |
| Total (Overall) | 33 (58.9%) | 23 (41.1%) |
Natural Resources, Construction and Maintenance Occupations
Natural Resources, Construction and Maintenance Occupations by Sex
| Occupation | Male | Female |
| Farming, Fishing & Forestry | 0 (0.0%) | 0 (0.0%) |
| Construction & Extraction | 0 (0.0%) | 0 (0.0%) |
| Installation, Maintenance & Repair | 0 (0.0%) | 0 (0.0%) |
| Total (Category) | 0 (0.0%) | 0 (0.0%) |
| Total (Overall) | 33 (58.9%) | 23 (41.1%) |
Production, Transportation and Moving Occupations
Production, Transportation and Moving Occupations by Sex
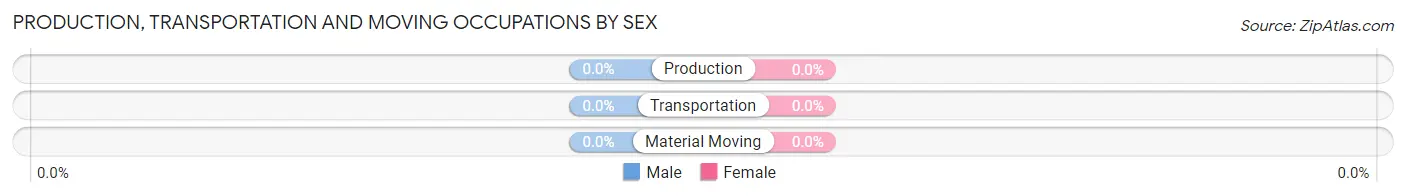
| Occupation | Male | Female |
| Production | 0 (0.0%) | 0 (0.0%) |
| Transportation | 0 (0.0%) | 0 (0.0%) |
| Material Moving | 0 (0.0%) | 0 (0.0%) |
| Total (Category) | 0 (0.0%) | 0 (0.0%) |
| Total (Overall) | 33 (58.9%) | 23 (41.1%) |
Employment Industries by Sex in East Fultonham
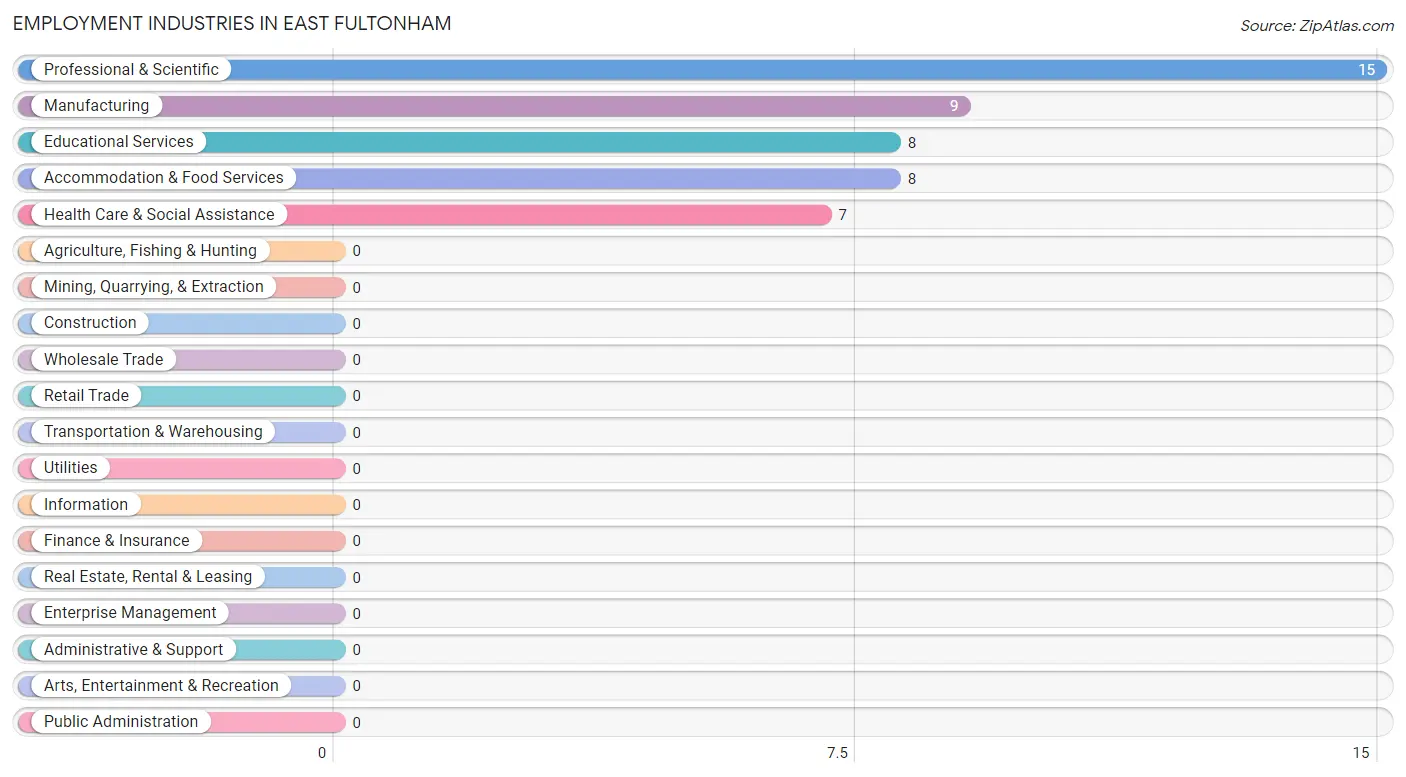
Employment Industries in East Fultonham
The major employment industries in East Fultonham include Professional & Scientific (15 | 26.8%), Manufacturing (9 | 16.1%), Educational Services (8 | 14.3%), Accommodation & Food Services (8 | 14.3%), and Health Care & Social Assistance (7 | 12.5%).
Employment Industries by Sex in East Fultonham
The East Fultonham industries that see more men than women are Manufacturing (100.0%), Health Care & Social Assistance (100.0%), and Accommodation & Food Services (100.0%), whereas the industries that tend to have a higher number of women are Professional & Scientific (100.0%), and Educational Services (100.0%).
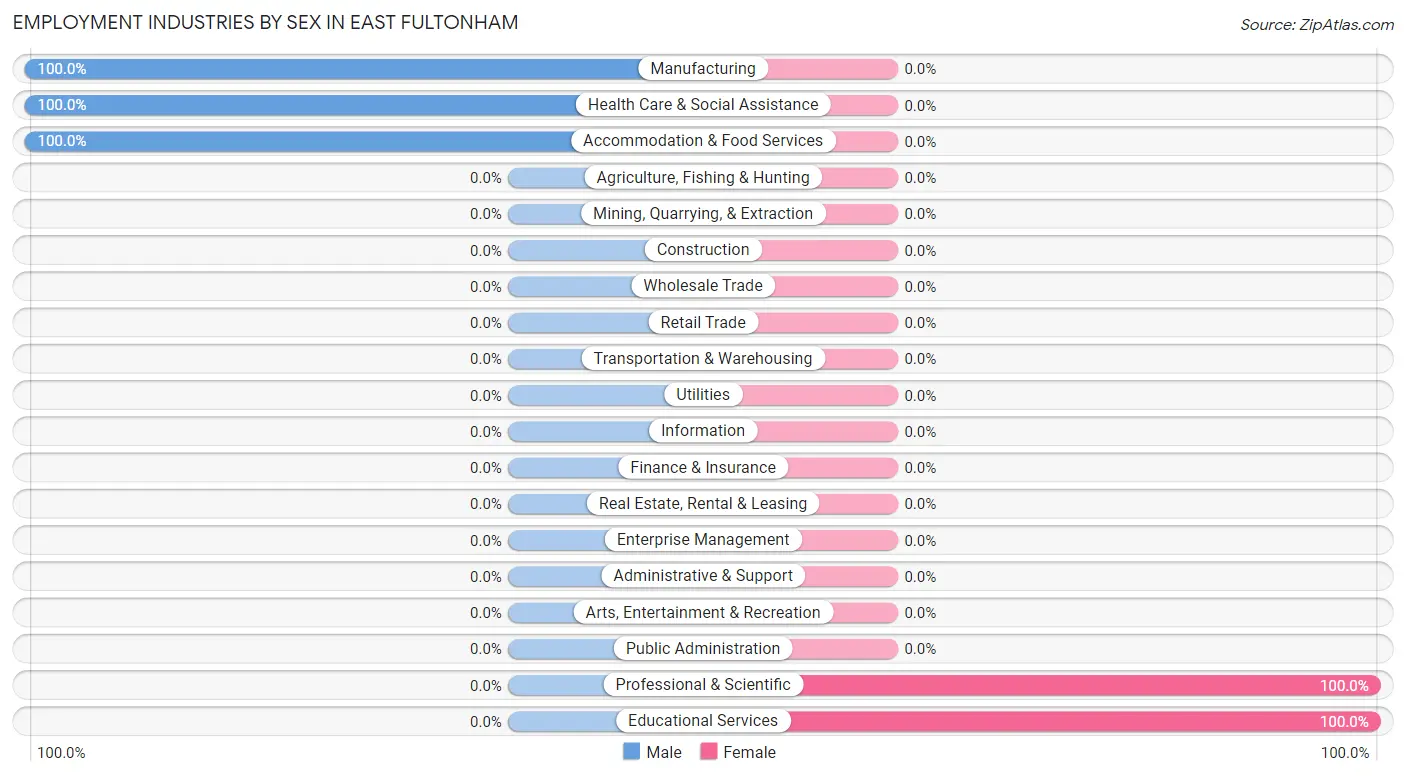
| Industry | Male | Female |
| Agriculture, Fishing & Hunting | 0 (0.0%) | 0 (0.0%) |
| Mining, Quarrying, & Extraction | 0 (0.0%) | 0 (0.0%) |
| Construction | 0 (0.0%) | 0 (0.0%) |
| Manufacturing | 9 (100.0%) | 0 (0.0%) |
| Wholesale Trade | 0 (0.0%) | 0 (0.0%) |
| Retail Trade | 0 (0.0%) | 0 (0.0%) |
| Transportation & Warehousing | 0 (0.0%) | 0 (0.0%) |
| Utilities | 0 (0.0%) | 0 (0.0%) |
| Information | 0 (0.0%) | 0 (0.0%) |
| Finance & Insurance | 0 (0.0%) | 0 (0.0%) |
| Real Estate, Rental & Leasing | 0 (0.0%) | 0 (0.0%) |
| Professional & Scientific | 0 (0.0%) | 15 (100.0%) |
| Enterprise Management | 0 (0.0%) | 0 (0.0%) |
| Administrative & Support | 0 (0.0%) | 0 (0.0%) |
| Educational Services | 0 (0.0%) | 8 (100.0%) |
| Health Care & Social Assistance | 7 (100.0%) | 0 (0.0%) |
| Arts, Entertainment & Recreation | 0 (0.0%) | 0 (0.0%) |
| Accommodation & Food Services | 8 (100.0%) | 0 (0.0%) |
| Public Administration | 0 (0.0%) | 0 (0.0%) |
| Total | 33 (58.9%) | 23 (41.1%) |
Education in East Fultonham
School Enrollment in East Fultonham
The most common levels of schooling among the 34 students in East Fultonham are nursery / preschool (9 | 26.5%), elementary school (9 | 26.5%), and middle school (8 | 23.5%).
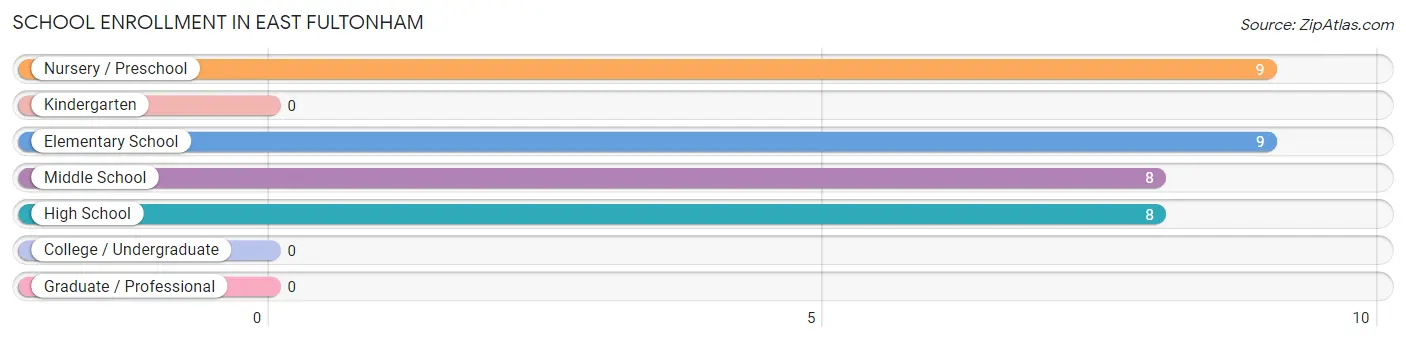
| School Level | # Students | % Students |
| Nursery / Preschool | 9 | 26.5% |
| Kindergarten | 0 | 0.0% |
| Elementary School | 9 | 26.5% |
| Middle School | 8 | 23.5% |
| High School | 8 | 23.5% |
| College / Undergraduate | 0 | 0.0% |
| Graduate / Professional | 0 | 0.0% |
| Total | 34 | 100.0% |
School Enrollment by Age by Funding Source in East Fultonham
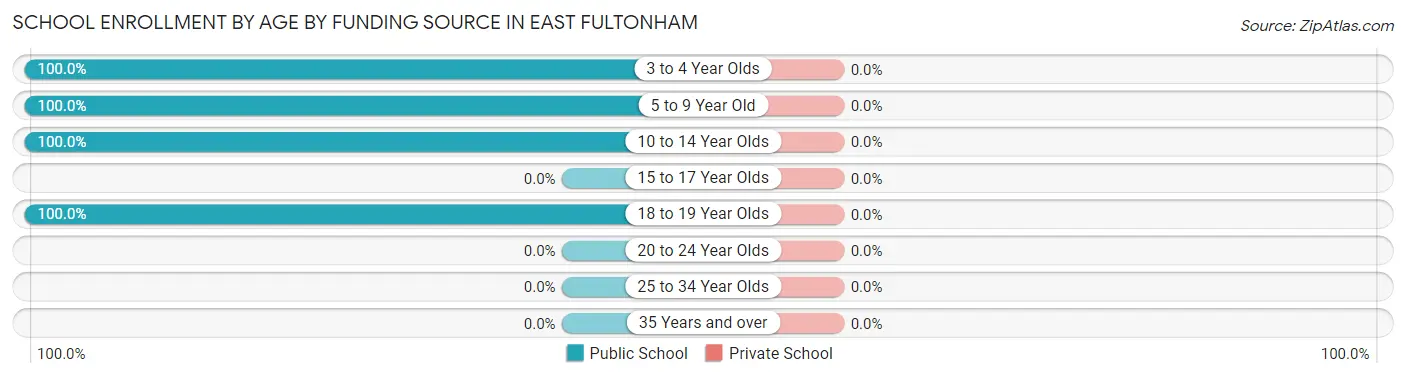
| Age Bracket | Public School | Private School |
| 3 to 4 Year Olds | 9 (100.0%) | 0 (0.0%) |
| 5 to 9 Year Old | 9 (100.0%) | 0 (0.0%) |
| 10 to 14 Year Olds | 8 (100.0%) | 0 (0.0%) |
| 15 to 17 Year Olds | 0 (0.0%) | 0 (0.0%) |
| 18 to 19 Year Olds | 8 (100.0%) | 0 (0.0%) |
| 20 to 24 Year Olds | 0 (0.0%) | 0 (0.0%) |
| 25 to 34 Year Olds | 0 (0.0%) | 0 (0.0%) |
| 35 Years and over | 0 (0.0%) | 0 (0.0%) |
| Total | 34 (100.0%) | 0 (0.0%) |
Educational Attainment by Field of Study in East Fultonham
Business (22 | 75.9%), and computers & mathematics (7 | 24.1%) are the most common fields of study among 29 individuals in East Fultonham who have obtained a bachelor's degree or higher.
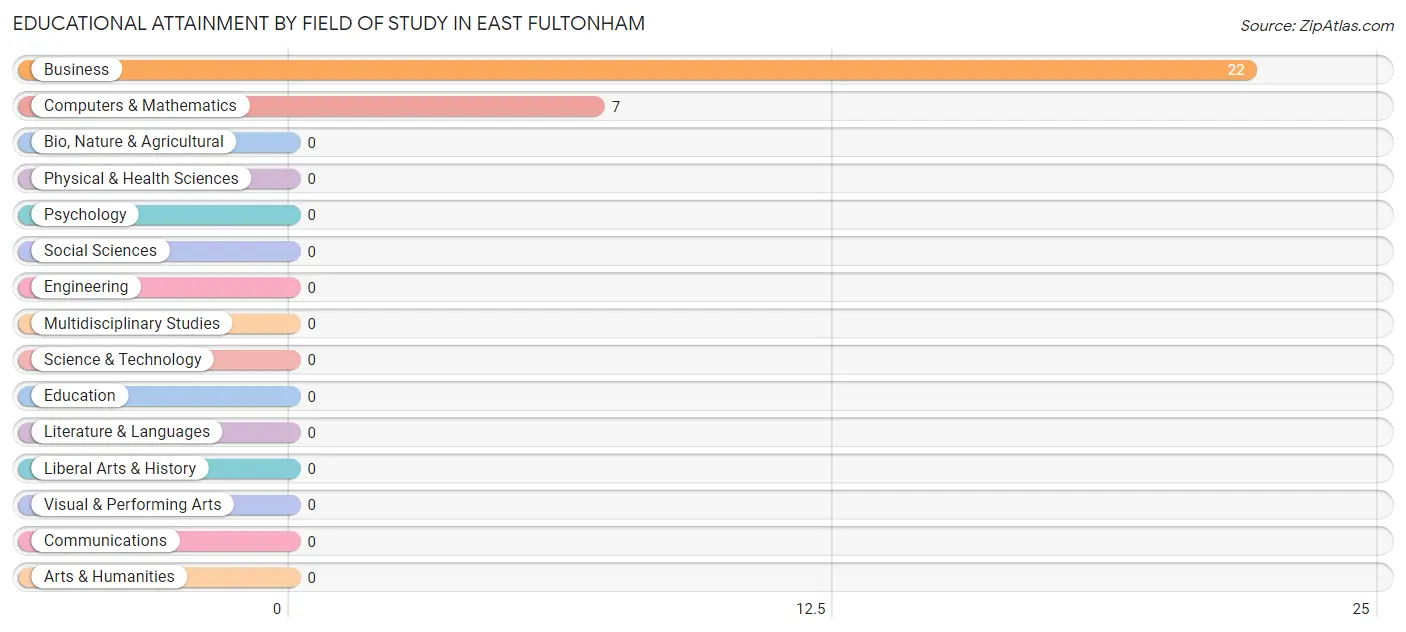
| Field of Study | # Graduates | % Graduates |
| Computers & Mathematics | 7 | 24.1% |
| Bio, Nature & Agricultural | 0 | 0.0% |
| Physical & Health Sciences | 0 | 0.0% |
| Psychology | 0 | 0.0% |
| Social Sciences | 0 | 0.0% |
| Engineering | 0 | 0.0% |
| Multidisciplinary Studies | 0 | 0.0% |
| Science & Technology | 0 | 0.0% |
| Business | 22 | 75.9% |
| Education | 0 | 0.0% |
| Literature & Languages | 0 | 0.0% |
| Liberal Arts & History | 0 | 0.0% |
| Visual & Performing Arts | 0 | 0.0% |
| Communications | 0 | 0.0% |
| Arts & Humanities | 0 | 0.0% |
| Total | 29 | 100.0% |
Transportation & Commute in East Fultonham
Vehicle Availability by Sex in East Fultonham
The most prevalent vehicle ownership categories in East Fultonham are males with 3 vehicles (17, accounting for 51.5%) and females with 3 vehicles (8, making up 73.9%).
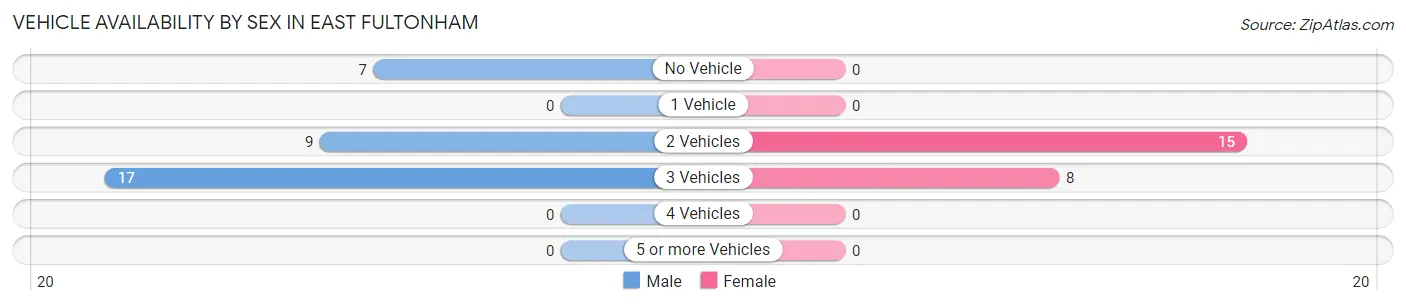
| Vehicles Available | Male | Female |
| No Vehicle | 7 (21.2%) | 0 (0.0%) |
| 1 Vehicle | 0 (0.0%) | 0 (0.0%) |
| 2 Vehicles | 9 (27.3%) | 15 (65.2%) |
| 3 Vehicles | 17 (51.5%) | 8 (34.8%) |
| 4 Vehicles | 0 (0.0%) | 0 (0.0%) |
| 5 or more Vehicles | 0 (0.0%) | 0 (0.0%) |
| Total | 33 (100.0%) | 23 (100.0%) |
Commute Time in East Fultonham
The most frequently occuring commute durations in East Fultonham are 15 to 19 minutes (17 commuters, 53.1%), 20 to 24 minutes (15 commuters, 46.9%), and less than 5 minutes (0 commuters, 0.0%).
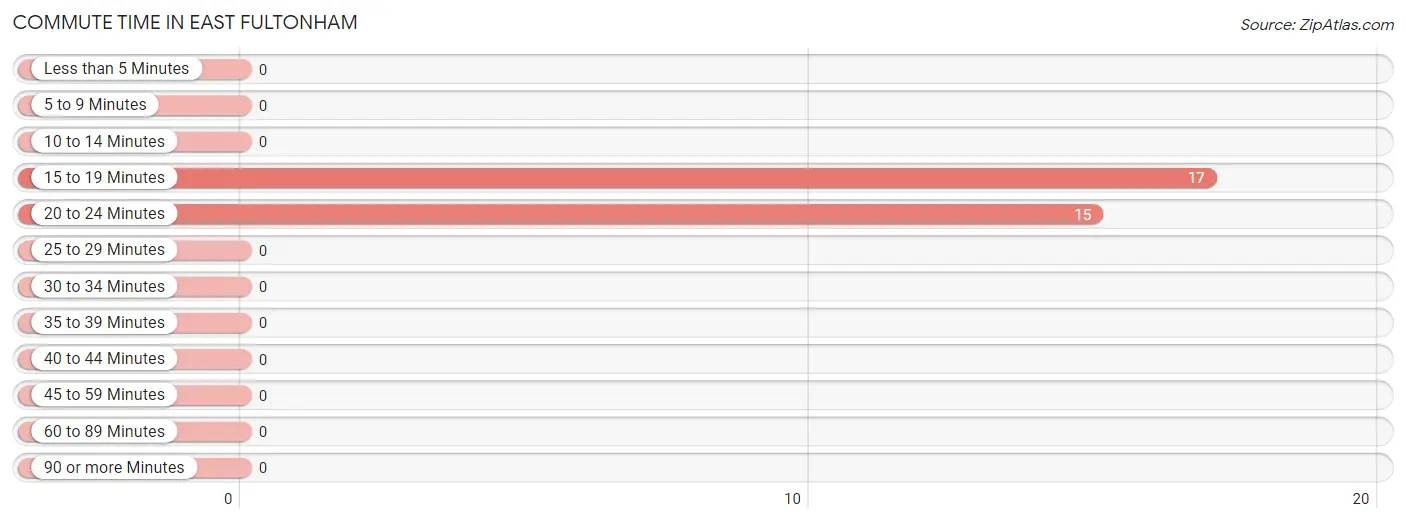
| Commute Time | # Commuters | % Commuters |
| Less than 5 Minutes | 0 | 0.0% |
| 5 to 9 Minutes | 0 | 0.0% |
| 10 to 14 Minutes | 0 | 0.0% |
| 15 to 19 Minutes | 17 | 53.1% |
| 20 to 24 Minutes | 15 | 46.9% |
| 25 to 29 Minutes | 0 | 0.0% |
| 30 to 34 Minutes | 0 | 0.0% |
| 35 to 39 Minutes | 0 | 0.0% |
| 40 to 44 Minutes | 0 | 0.0% |
| 45 to 59 Minutes | 0 | 0.0% |
| 60 to 89 Minutes | 0 | 0.0% |
| 90 or more Minutes | 0 | 0.0% |
Commute Time by Sex in East Fultonham
The most common commute times in East Fultonham are 15 to 19 minutes (17 commuters, 70.8%) for males and 20 to 24 minutes (8 commuters, 100.0%) for females.
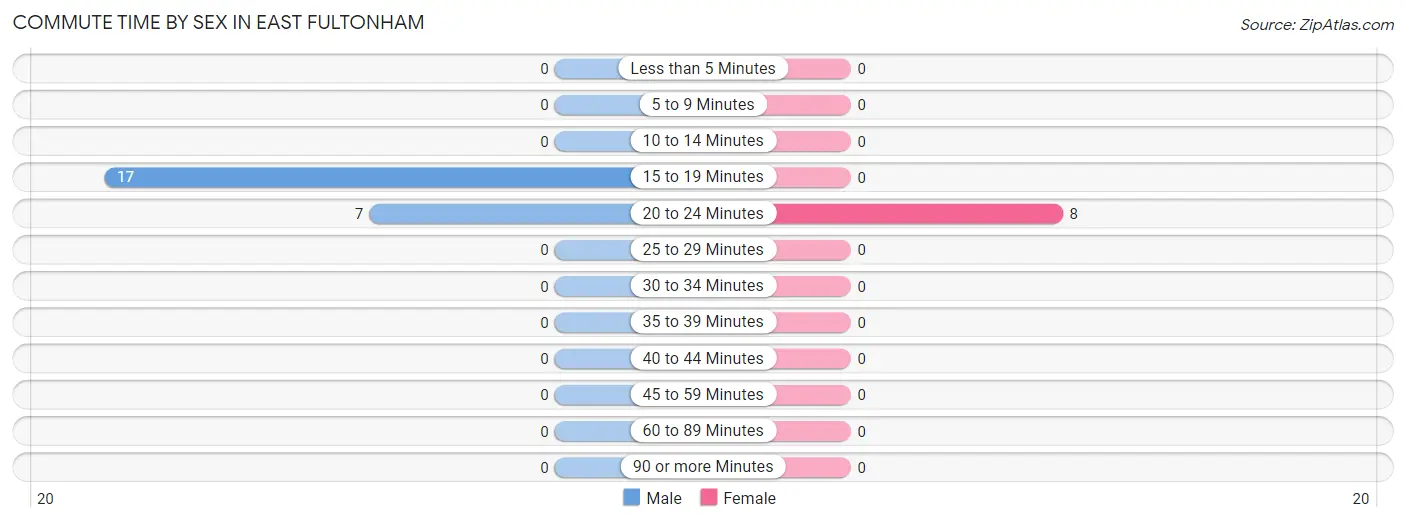
| Commute Time | Male | Female |
| Less than 5 Minutes | 0 (0.0%) | 0 (0.0%) |
| 5 to 9 Minutes | 0 (0.0%) | 0 (0.0%) |
| 10 to 14 Minutes | 0 (0.0%) | 0 (0.0%) |
| 15 to 19 Minutes | 17 (70.8%) | 0 (0.0%) |
| 20 to 24 Minutes | 7 (29.2%) | 8 (100.0%) |
| 25 to 29 Minutes | 0 (0.0%) | 0 (0.0%) |
| 30 to 34 Minutes | 0 (0.0%) | 0 (0.0%) |
| 35 to 39 Minutes | 0 (0.0%) | 0 (0.0%) |
| 40 to 44 Minutes | 0 (0.0%) | 0 (0.0%) |
| 45 to 59 Minutes | 0 (0.0%) | 0 (0.0%) |
| 60 to 89 Minutes | 0 (0.0%) | 0 (0.0%) |
| 90 or more Minutes | 0 (0.0%) | 0 (0.0%) |
Time of Departure to Work by Sex in East Fultonham
The most frequent times of departure to work in East Fultonham are 6:30 AM to 6:59 AM (9, 37.5%) for males and 7:00 AM to 7:29 AM (8, 100.0%) for females.
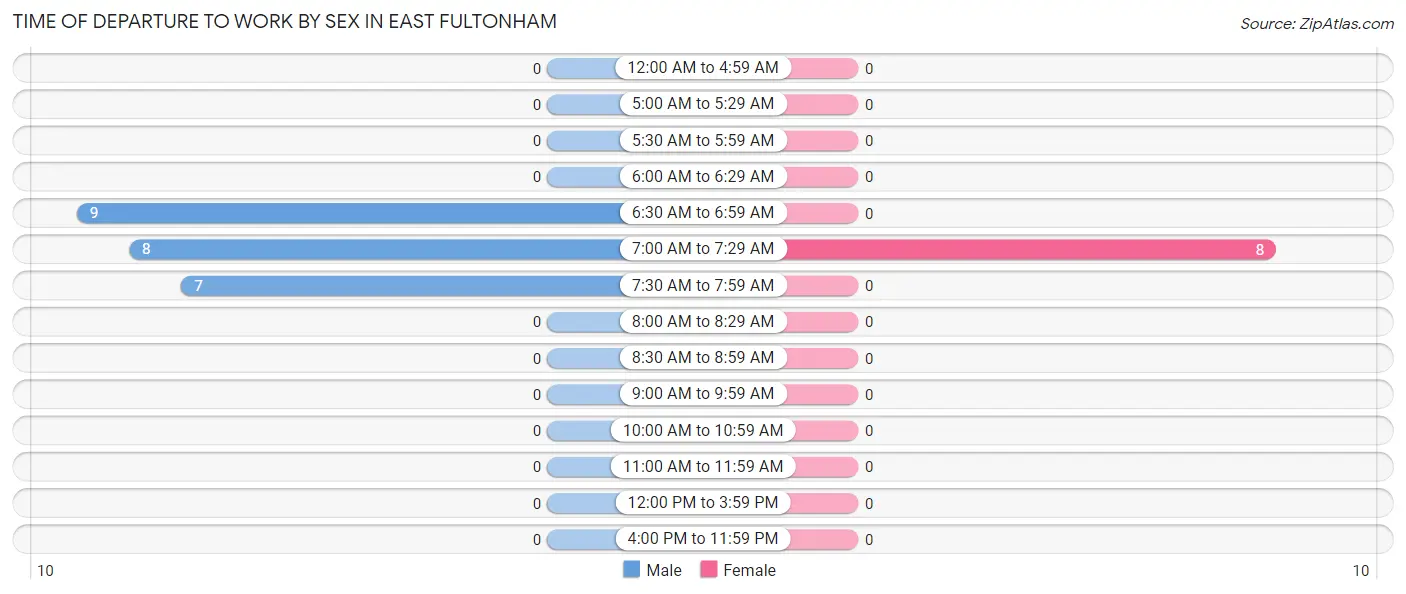
| Time of Departure | Male | Female |
| 12:00 AM to 4:59 AM | 0 (0.0%) | 0 (0.0%) |
| 5:00 AM to 5:29 AM | 0 (0.0%) | 0 (0.0%) |
| 5:30 AM to 5:59 AM | 0 (0.0%) | 0 (0.0%) |
| 6:00 AM to 6:29 AM | 0 (0.0%) | 0 (0.0%) |
| 6:30 AM to 6:59 AM | 9 (37.5%) | 0 (0.0%) |
| 7:00 AM to 7:29 AM | 8 (33.3%) | 8 (100.0%) |
| 7:30 AM to 7:59 AM | 7 (29.2%) | 0 (0.0%) |
| 8:00 AM to 8:29 AM | 0 (0.0%) | 0 (0.0%) |
| 8:30 AM to 8:59 AM | 0 (0.0%) | 0 (0.0%) |
| 9:00 AM to 9:59 AM | 0 (0.0%) | 0 (0.0%) |
| 10:00 AM to 10:59 AM | 0 (0.0%) | 0 (0.0%) |
| 11:00 AM to 11:59 AM | 0 (0.0%) | 0 (0.0%) |
| 12:00 PM to 3:59 PM | 0 (0.0%) | 0 (0.0%) |
| 4:00 PM to 11:59 PM | 0 (0.0%) | 0 (0.0%) |
| Total | 24 (100.0%) | 8 (100.0%) |
Housing Occupancy in East Fultonham
Occupancy by Ownership in East Fultonham
Of the total 58 dwellings in East Fultonham, owner-occupied units account for 39 (67.2%), while renter-occupied units make up 19 (32.8%).
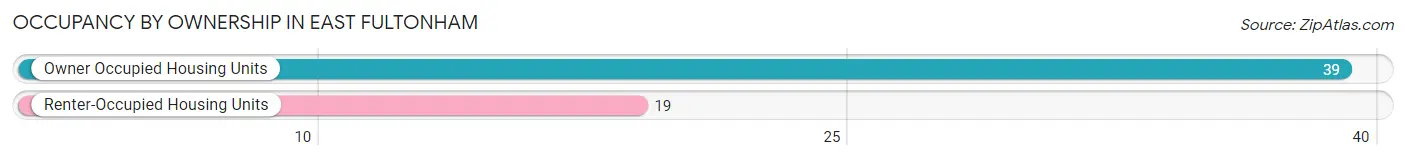
| Occupancy | # Housing Units | % Housing Units |
| Owner Occupied Housing Units | 39 | 67.2% |
| Renter-Occupied Housing Units | 19 | 32.8% |
| Total Occupied Housing Units | 58 | 100.0% |
Occupancy by Household Size in East Fultonham
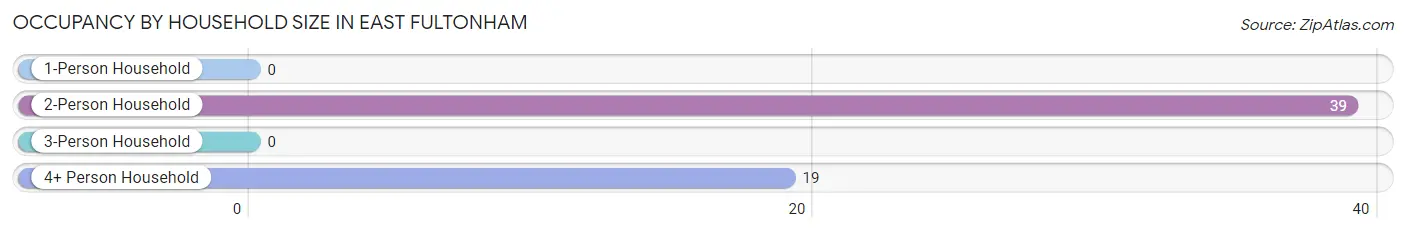
| Household Size | # Housing Units | % Housing Units |
| 1-Person Household | 0 | 0.0% |
| 2-Person Household | 39 | 67.2% |
| 3-Person Household | 0 | 0.0% |
| 4+ Person Household | 19 | 32.8% |
| Total Housing Units | 58 | 100.0% |
Occupancy by Ownership by Household Size in East Fultonham
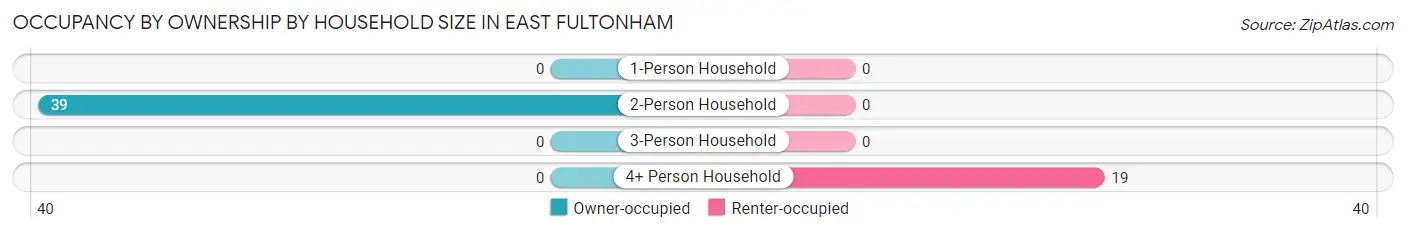
| Household Size | Owner-occupied | Renter-occupied |
| 1-Person Household | 0 (0.0%) | 0 (0.0%) |
| 2-Person Household | 39 (100.0%) | 0 (0.0%) |
| 3-Person Household | 0 (0.0%) | 0 (0.0%) |
| 4+ Person Household | 0 (0.0%) | 19 (100.0%) |
| Total Housing Units | 39 (67.2%) | 19 (32.8%) |
Occupancy by Educational Attainment in East Fultonham
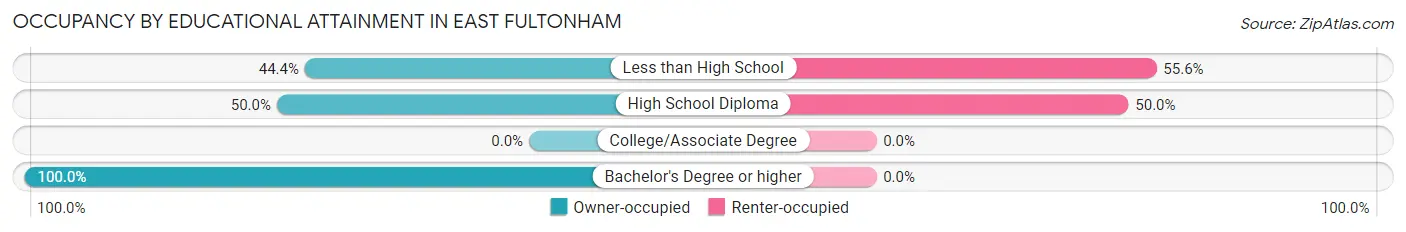
| Household Size | Owner-occupied | Renter-occupied |
| Less than High School | 8 (44.4%) | 10 (55.6%) |
| High School Diploma | 9 (50.0%) | 9 (50.0%) |
| College/Associate Degree | 0 (0.0%) | 0 (0.0%) |
| Bachelor's Degree or higher | 22 (100.0%) | 0 (0.0%) |
Occupancy by Age of Householder in East Fultonham
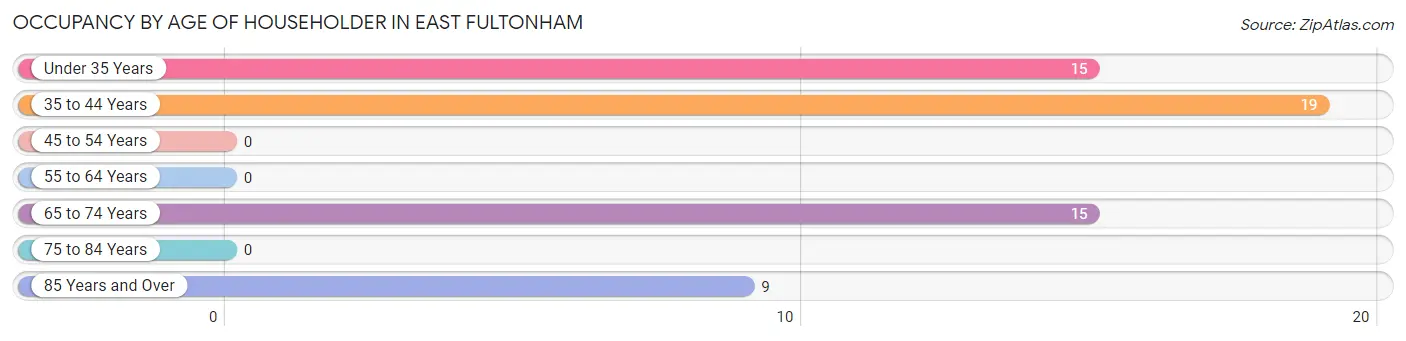
| Age Bracket | # Households | % Households |
| Under 35 Years | 15 | 25.9% |
| 35 to 44 Years | 19 | 32.8% |
| 45 to 54 Years | 0 | 0.0% |
| 55 to 64 Years | 0 | 0.0% |
| 65 to 74 Years | 15 | 25.9% |
| 75 to 84 Years | 0 | 0.0% |
| 85 Years and Over | 9 | 15.5% |
| Total | 58 | 100.0% |
Housing Finances in East Fultonham
Median Income by Occupancy in East Fultonham
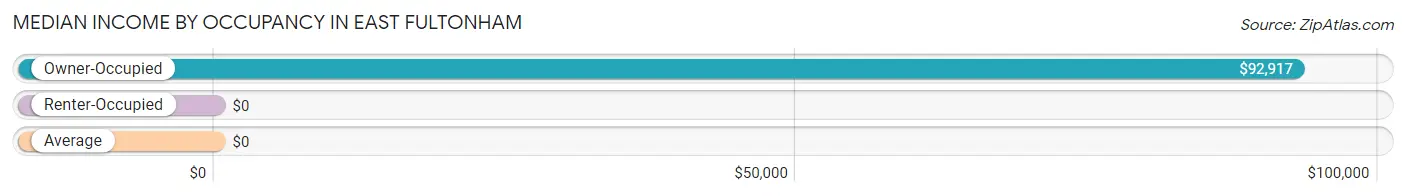
| Occupancy Type | # Households | Median Income |
| Owner-Occupied | 39 (67.2%) | $92,917 |
| Renter-Occupied | 19 (32.8%) | $0 |
| Average | 58 (100.0%) | $0 |
Occupancy by Householder Income Bracket in East Fultonham
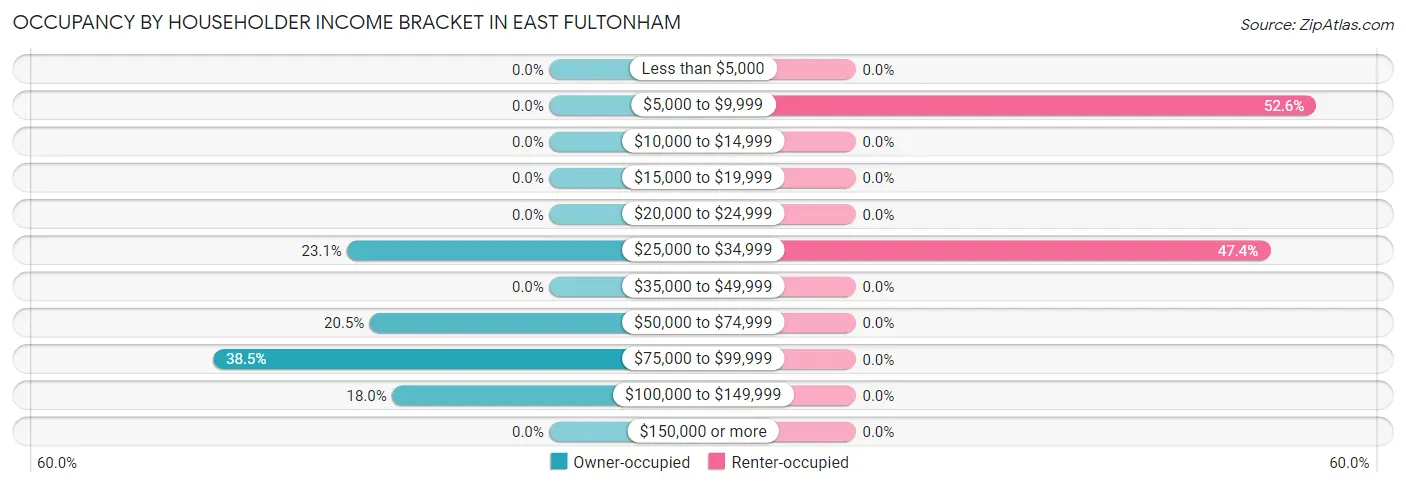
| Income Bracket | Owner-occupied | Renter-occupied |
| Less than $5,000 | 0 (0.0%) | 0 (0.0%) |
| $5,000 to $9,999 | 0 (0.0%) | 10 (52.6%) |
| $10,000 to $14,999 | 0 (0.0%) | 0 (0.0%) |
| $15,000 to $19,999 | 0 (0.0%) | 0 (0.0%) |
| $20,000 to $24,999 | 0 (0.0%) | 0 (0.0%) |
| $25,000 to $34,999 | 9 (23.1%) | 9 (47.4%) |
| $35,000 to $49,999 | 0 (0.0%) | 0 (0.0%) |
| $50,000 to $74,999 | 8 (20.5%) | 0 (0.0%) |
| $75,000 to $99,999 | 15 (38.5%) | 0 (0.0%) |
| $100,000 to $149,999 | 7 (17.9%) | 0 (0.0%) |
| $150,000 or more | 0 (0.0%) | 0 (0.0%) |
| Total | 39 (100.0%) | 19 (100.0%) |
Monthly Housing Cost Tiers in East Fultonham
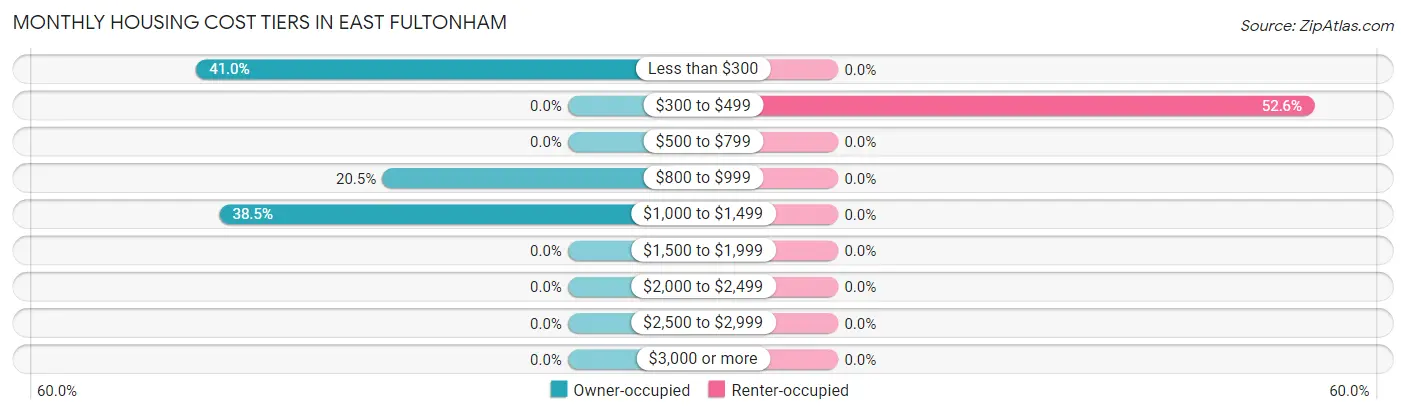
| Monthly Cost | Owner-occupied | Renter-occupied |
| Less than $300 | 16 (41.0%) | 0 (0.0%) |
| $300 to $499 | 0 (0.0%) | 10 (52.6%) |
| $500 to $799 | 0 (0.0%) | 0 (0.0%) |
| $800 to $999 | 8 (20.5%) | 0 (0.0%) |
| $1,000 to $1,499 | 15 (38.5%) | 0 (0.0%) |
| $1,500 to $1,999 | 0 (0.0%) | 0 (0.0%) |
| $2,000 to $2,499 | 0 (0.0%) | 0 (0.0%) |
| $2,500 to $2,999 | 0 (0.0%) | 0 (0.0%) |
| $3,000 or more | 0 (0.0%) | 0 (0.0%) |
| Total | 39 (100.0%) | 19 (100.0%) |
Physical Housing Characteristics in East Fultonham
Housing Structures in East Fultonham
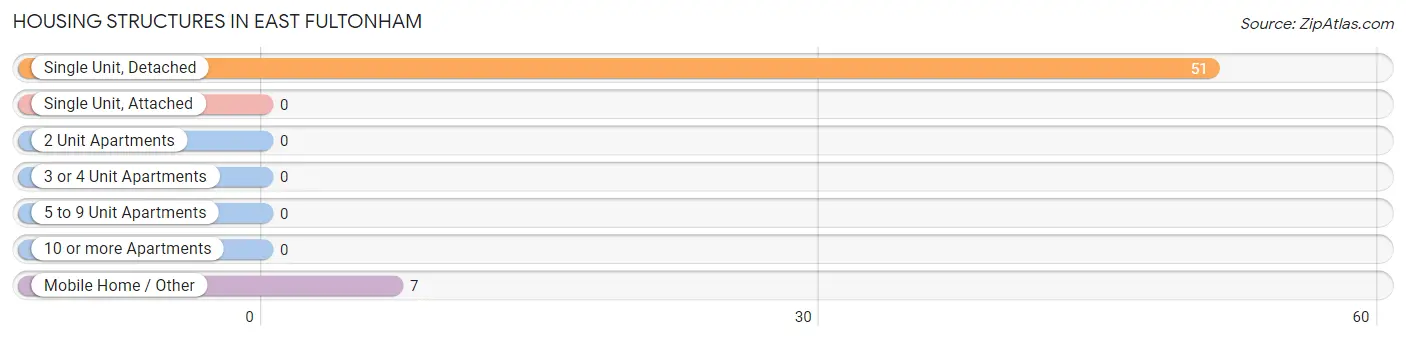
| Structure Type | # Housing Units | % Housing Units |
| Single Unit, Detached | 51 | 87.9% |
| Single Unit, Attached | 0 | 0.0% |
| 2 Unit Apartments | 0 | 0.0% |
| 3 or 4 Unit Apartments | 0 | 0.0% |
| 5 to 9 Unit Apartments | 0 | 0.0% |
| 10 or more Apartments | 0 | 0.0% |
| Mobile Home / Other | 7 | 12.1% |
| Total | 58 | 100.0% |
Housing Structures by Occupancy in East Fultonham
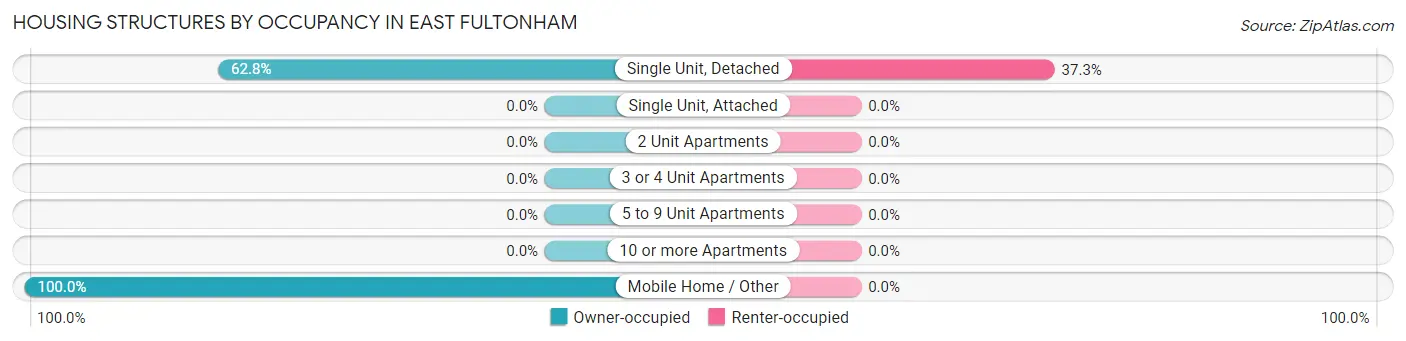
| Structure Type | Owner-occupied | Renter-occupied |
| Single Unit, Detached | 32 (62.7%) | 19 (37.2%) |
| Single Unit, Attached | 0 (0.0%) | 0 (0.0%) |
| 2 Unit Apartments | 0 (0.0%) | 0 (0.0%) |
| 3 or 4 Unit Apartments | 0 (0.0%) | 0 (0.0%) |
| 5 to 9 Unit Apartments | 0 (0.0%) | 0 (0.0%) |
| 10 or more Apartments | 0 (0.0%) | 0 (0.0%) |
| Mobile Home / Other | 7 (100.0%) | 0 (0.0%) |
| Total | 39 (67.2%) | 19 (32.8%) |
Housing Structures by Number of Rooms in East Fultonham
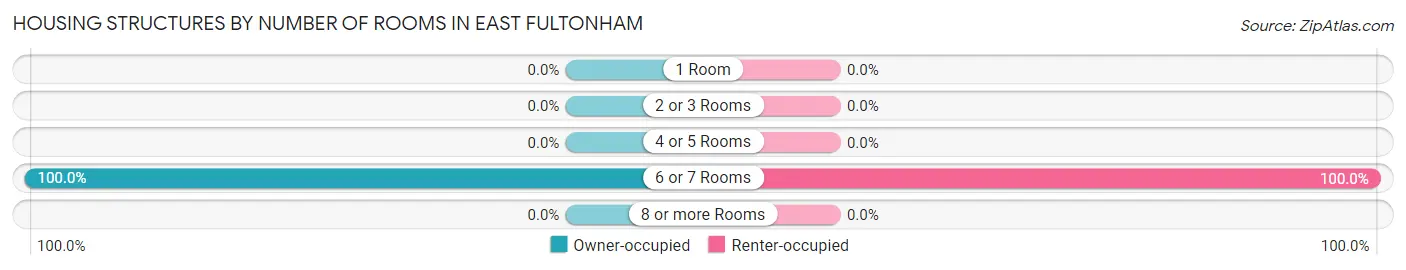
| Number of Rooms | Owner-occupied | Renter-occupied |
| 1 Room | 0 (0.0%) | 0 (0.0%) |
| 2 or 3 Rooms | 0 (0.0%) | 0 (0.0%) |
| 4 or 5 Rooms | 0 (0.0%) | 0 (0.0%) |
| 6 or 7 Rooms | 39 (100.0%) | 19 (100.0%) |
| 8 or more Rooms | 0 (0.0%) | 0 (0.0%) |
| Total | 39 (100.0%) | 19 (100.0%) |
Housing Structure by Heating Type in East Fultonham
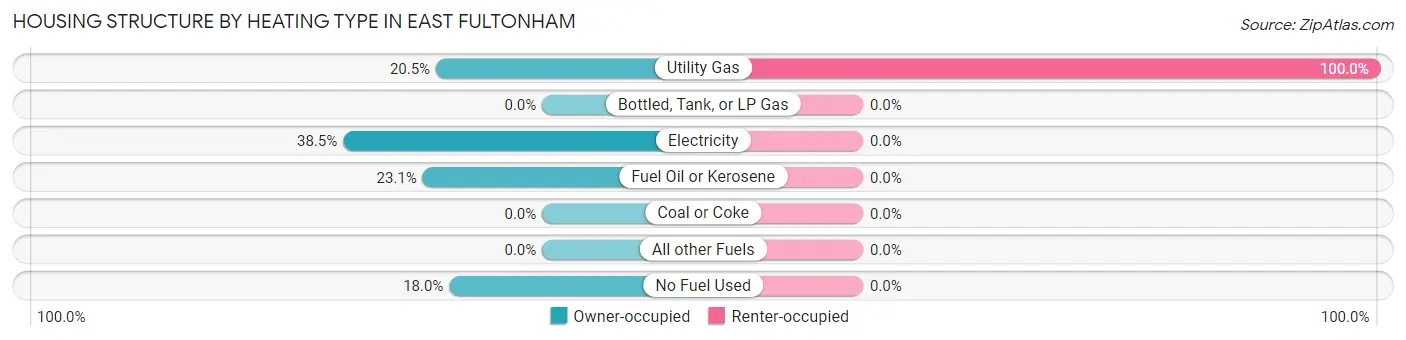
| Heating Type | Owner-occupied | Renter-occupied |
| Utility Gas | 8 (20.5%) | 19 (100.0%) |
| Bottled, Tank, or LP Gas | 0 (0.0%) | 0 (0.0%) |
| Electricity | 15 (38.5%) | 0 (0.0%) |
| Fuel Oil or Kerosene | 9 (23.1%) | 0 (0.0%) |
| Coal or Coke | 0 (0.0%) | 0 (0.0%) |
| All other Fuels | 0 (0.0%) | 0 (0.0%) |
| No Fuel Used | 7 (17.9%) | 0 (0.0%) |
| Total | 39 (100.0%) | 19 (100.0%) |
Household Vehicle Usage in East Fultonham
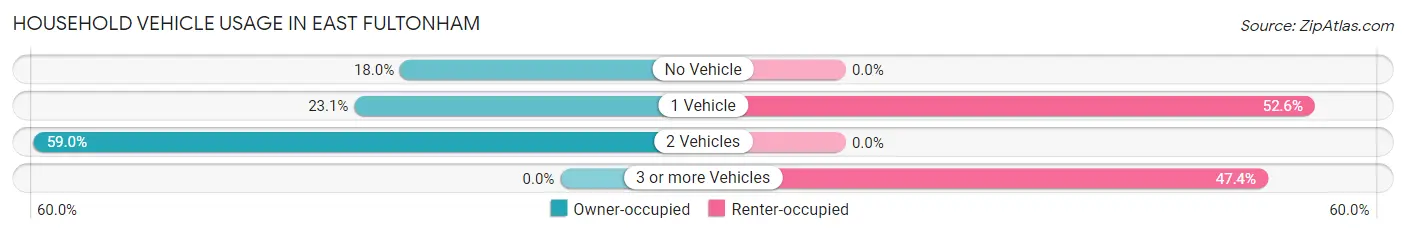
| Vehicles per Household | Owner-occupied | Renter-occupied |
| No Vehicle | 7 (17.9%) | 0 (0.0%) |
| 1 Vehicle | 9 (23.1%) | 10 (52.6%) |
| 2 Vehicles | 23 (59.0%) | 0 (0.0%) |
| 3 or more Vehicles | 0 (0.0%) | 9 (47.4%) |
| Total | 39 (100.0%) | 19 (100.0%) |
Real Estate & Mortgages in East Fultonham
Real Estate and Mortgage Overview in East Fultonham
| Characteristic | Without Mortgage | With Mortgage |
| Housing Units | 16 | 23 |
| Median Property Value | - | - |
| Median Household Income | - | - |
| Monthly Housing Costs | - | - |
| Real Estate Taxes | - | - |
Property Value by Mortgage Status in East Fultonham
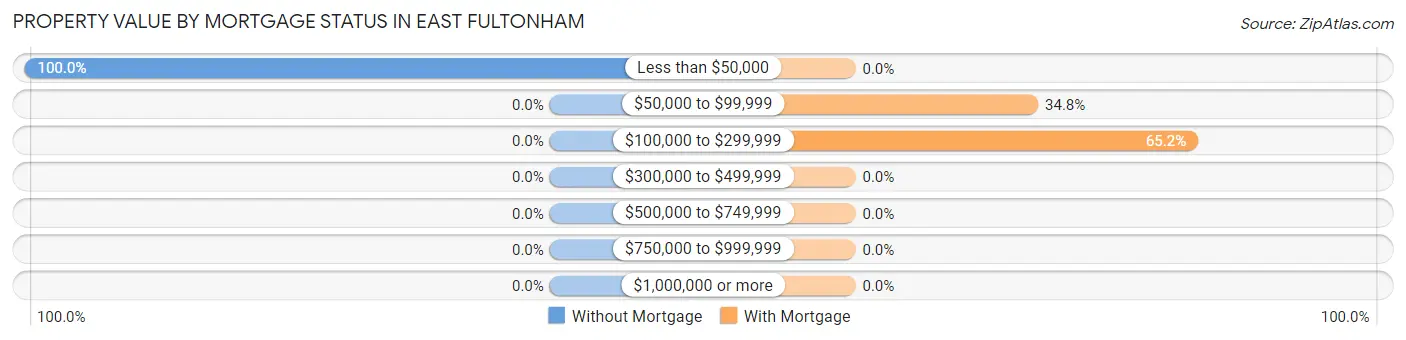
| Property Value | Without Mortgage | With Mortgage |
| Less than $50,000 | 16 (100.0%) | 0 (0.0%) |
| $50,000 to $99,999 | 0 (0.0%) | 8 (34.8%) |
| $100,000 to $299,999 | 0 (0.0%) | 15 (65.2%) |
| $300,000 to $499,999 | 0 (0.0%) | 0 (0.0%) |
| $500,000 to $749,999 | 0 (0.0%) | 0 (0.0%) |
| $750,000 to $999,999 | 0 (0.0%) | 0 (0.0%) |
| $1,000,000 or more | 0 (0.0%) | 0 (0.0%) |
| Total | 16 (100.0%) | 23 (100.0%) |
Household Income by Mortgage Status in East Fultonham
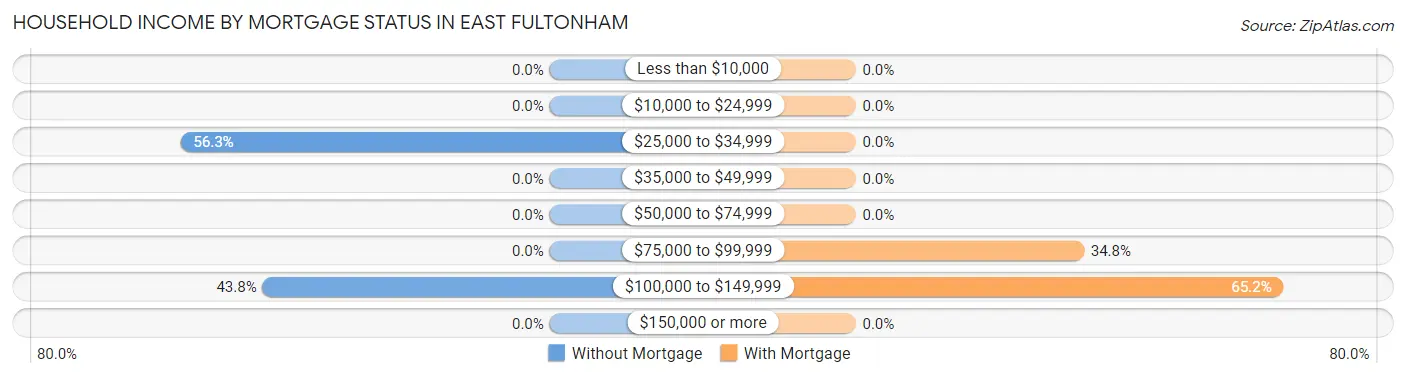
| Household Income | Without Mortgage | With Mortgage |
| Less than $10,000 | 0 (0.0%) | 0 (0.0%) |
| $10,000 to $24,999 | 0 (0.0%) | 0 (0.0%) |
| $25,000 to $34,999 | 9 (56.2%) | 0 (0.0%) |
| $35,000 to $49,999 | 0 (0.0%) | 0 (0.0%) |
| $50,000 to $74,999 | 0 (0.0%) | 0 (0.0%) |
| $75,000 to $99,999 | 0 (0.0%) | 8 (34.8%) |
| $100,000 to $149,999 | 7 (43.8%) | 15 (65.2%) |
| $150,000 or more | 0 (0.0%) | 0 (0.0%) |
| Total | 16 (100.0%) | 23 (100.0%) |
Property Value to Household Income Ratio in East Fultonham
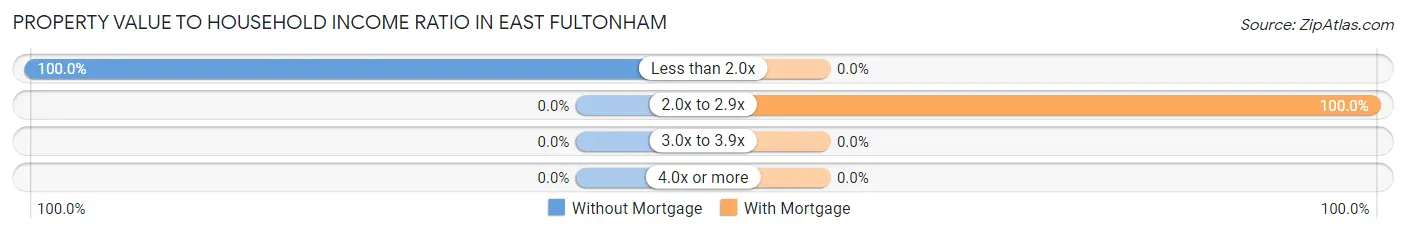
| Value-to-Income Ratio | Without Mortgage | With Mortgage |
| Less than 2.0x | 16 (100.0%) | 0 (0.0%) |
| 2.0x to 2.9x | 0 (0.0%) | 23 (100.0%) |
| 3.0x to 3.9x | 0 (0.0%) | 0 (0.0%) |
| 4.0x or more | 0 (0.0%) | 0 (0.0%) |
| Total | 16 (100.0%) | 23 (100.0%) |
Real Estate Taxes by Mortgage Status in East Fultonham
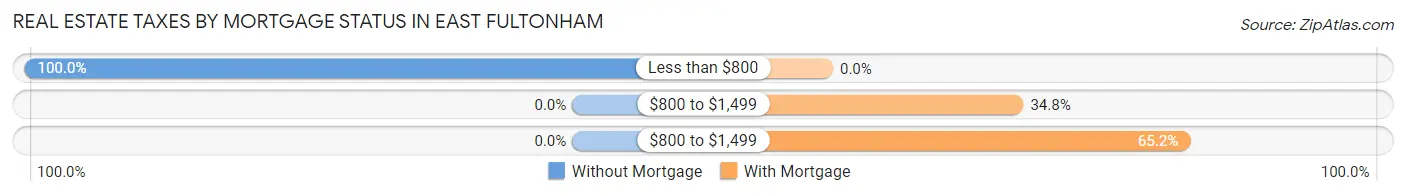
| Property Taxes | Without Mortgage | With Mortgage |
| Less than $800 | 16 (100.0%) | 0 (0.0%) |
| $800 to $1,499 | 0 (0.0%) | 8 (34.8%) |
| $800 to $1,499 | 0 (0.0%) | 15 (65.2%) |
| Total | 16 (100.0%) | 23 (100.0%) |
Health & Disability in East Fultonham
Health Insurance Coverage by Age in East Fultonham
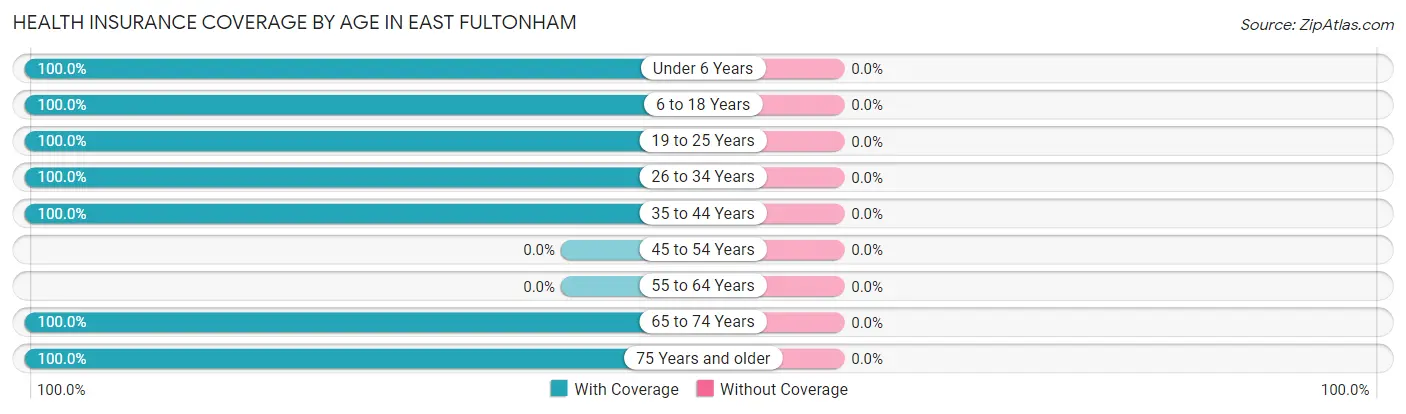
| Age Bracket | With Coverage | Without Coverage |
| Under 6 Years | 9 (100.0%) | 0 (0.0%) |
| 6 to 18 Years | 25 (100.0%) | 0 (0.0%) |
| 19 to 25 Years | 24 (100.0%) | 0 (0.0%) |
| 26 to 34 Years | 10 (100.0%) | 0 (0.0%) |
| 35 to 44 Years | 27 (100.0%) | 0 (0.0%) |
| 45 to 54 Years | 0 (0.0%) | 0 (0.0%) |
| 55 to 64 Years | 0 (0.0%) | 0 (0.0%) |
| 65 to 74 Years | 39 (100.0%) | 0 (0.0%) |
| 75 Years and older | 9 (100.0%) | 0 (0.0%) |
| Total | 143 (100.0%) | 0 (0.0%) |
Health Insurance Coverage by Citizenship Status in East Fultonham
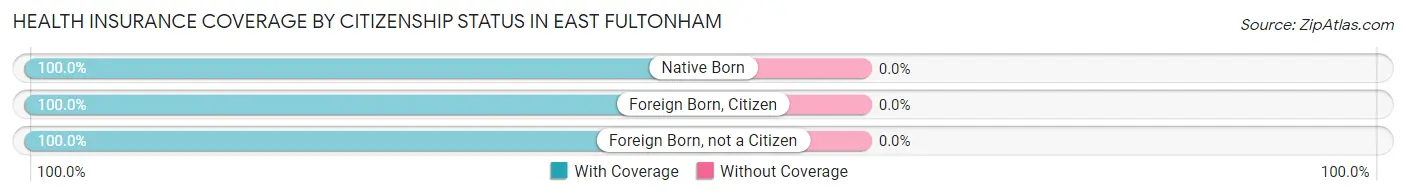
| Citizenship Status | With Coverage | Without Coverage |
| Native Born | 9 (100.0%) | 0 (0.0%) |
| Foreign Born, Citizen | 25 (100.0%) | 0 (0.0%) |
| Foreign Born, not a Citizen | 24 (100.0%) | 0 (0.0%) |
Health Insurance Coverage by Household Income in East Fultonham
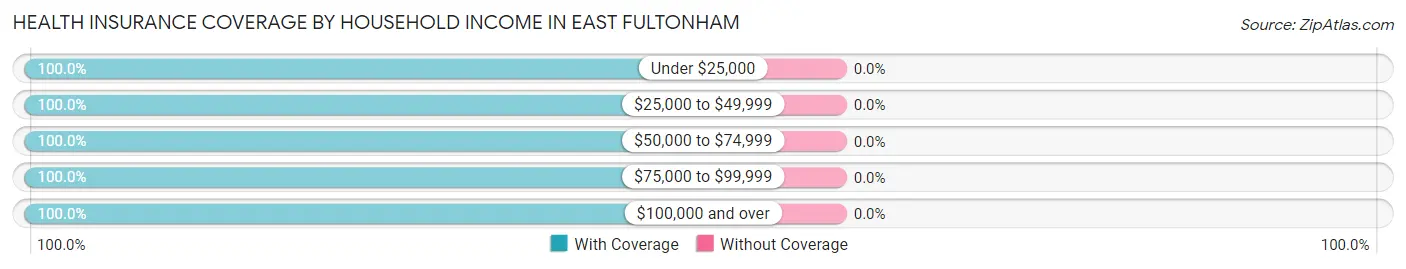
| Household Income | With Coverage | Without Coverage |
| Under $25,000 | 38 (100.0%) | 0 (0.0%) |
| $25,000 to $49,999 | 52 (100.0%) | 0 (0.0%) |
| $50,000 to $74,999 | 15 (100.0%) | 0 (0.0%) |
| $75,000 to $99,999 | 24 (100.0%) | 0 (0.0%) |
| $100,000 and over | 14 (100.0%) | 0 (0.0%) |
Public vs Private Health Insurance Coverage by Age in East Fultonham
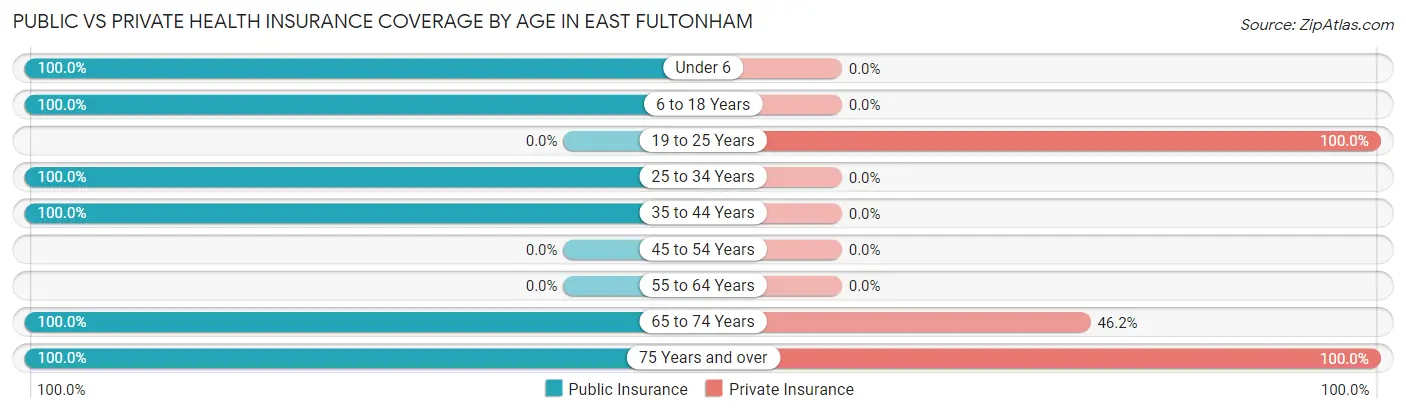
| Age Bracket | Public Insurance | Private Insurance |
| Under 6 | 9 (100.0%) | 0 (0.0%) |
| 6 to 18 Years | 25 (100.0%) | 0 (0.0%) |
| 19 to 25 Years | 0 (0.0%) | 24 (100.0%) |
| 25 to 34 Years | 10 (100.0%) | 0 (0.0%) |
| 35 to 44 Years | 27 (100.0%) | 0 (0.0%) |
| 45 to 54 Years | 0 (0.0%) | 0 (0.0%) |
| 55 to 64 Years | 0 (0.0%) | 0 (0.0%) |
| 65 to 74 Years | 39 (100.0%) | 18 (46.2%) |
| 75 Years and over | 9 (100.0%) | 9 (100.0%) |
| Total | 119 (83.2%) | 51 (35.7%) |
Disability Status by Sex by Age in East Fultonham
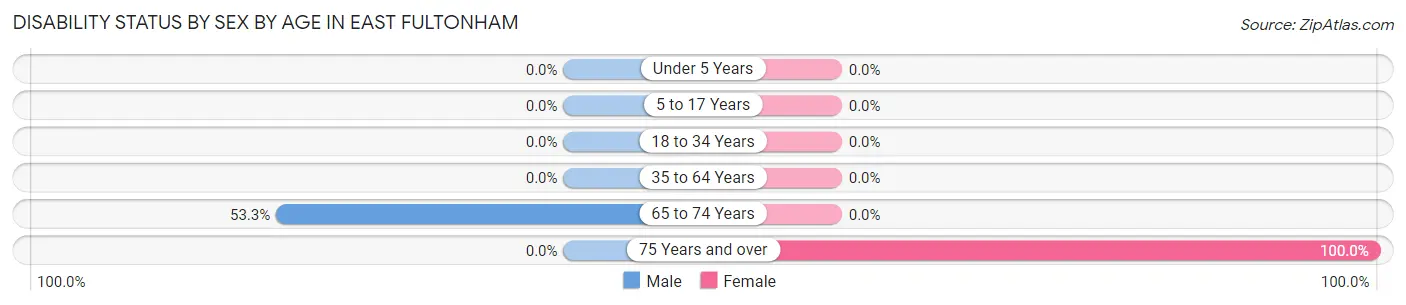
| Age Bracket | Male | Female |
| Under 5 Years | 0 (0.0%) | 0 (0.0%) |
| 5 to 17 Years | 0 (0.0%) | 0 (0.0%) |
| 18 to 34 Years | 0 (0.0%) | 0 (0.0%) |
| 35 to 64 Years | 0 (0.0%) | 0 (0.0%) |
| 65 to 74 Years | 8 (53.3%) | 0 (0.0%) |
| 75 Years and over | 0 (0.0%) | 9 (100.0%) |
Disability Class by Sex by Age in East Fultonham
Disability Class: Hearing Difficulty
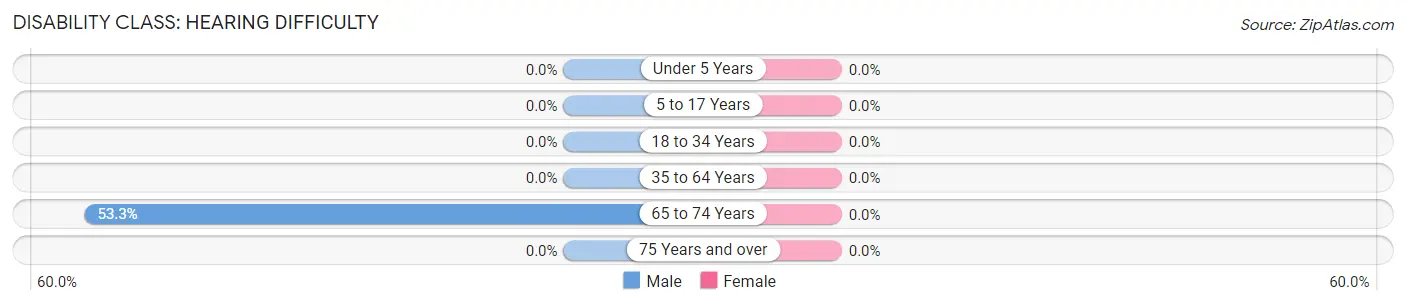
| Age Bracket | Male | Female |
| Under 5 Years | 0 (0.0%) | 0 (0.0%) |
| 5 to 17 Years | 0 (0.0%) | 0 (0.0%) |
| 18 to 34 Years | 0 (0.0%) | 0 (0.0%) |
| 35 to 64 Years | 0 (0.0%) | 0 (0.0%) |
| 65 to 74 Years | 8 (53.3%) | 0 (0.0%) |
| 75 Years and over | 0 (0.0%) | 0 (0.0%) |
Disability Class: Vision Difficulty
| Age Bracket | Male | Female |
| Under 5 Years | 0 (0.0%) | 0 (0.0%) |
| 5 to 17 Years | 0 (0.0%) | 0 (0.0%) |
| 18 to 34 Years | 0 (0.0%) | 0 (0.0%) |
| 35 to 64 Years | 0 (0.0%) | 0 (0.0%) |
| 65 to 74 Years | 0 (0.0%) | 0 (0.0%) |
| 75 Years and over | 0 (0.0%) | 0 (0.0%) |
Disability Class: Cognitive Difficulty
| Age Bracket | Male | Female |
| 5 to 17 Years | 0 (0.0%) | 0 (0.0%) |
| 18 to 34 Years | 0 (0.0%) | 0 (0.0%) |
| 35 to 64 Years | 0 (0.0%) | 0 (0.0%) |
| 65 to 74 Years | 0 (0.0%) | 0 (0.0%) |
| 75 Years and over | 0 (0.0%) | 0 (0.0%) |
Disability Class: Ambulatory Difficulty
| Age Bracket | Male | Female |
| 5 to 17 Years | 0 (0.0%) | 0 (0.0%) |
| 18 to 34 Years | 0 (0.0%) | 0 (0.0%) |
| 35 to 64 Years | 0 (0.0%) | 0 (0.0%) |
| 65 to 74 Years | 0 (0.0%) | 0 (0.0%) |
| 75 Years and over | 0 (0.0%) | 0 (0.0%) |
Disability Class: Self-Care Difficulty
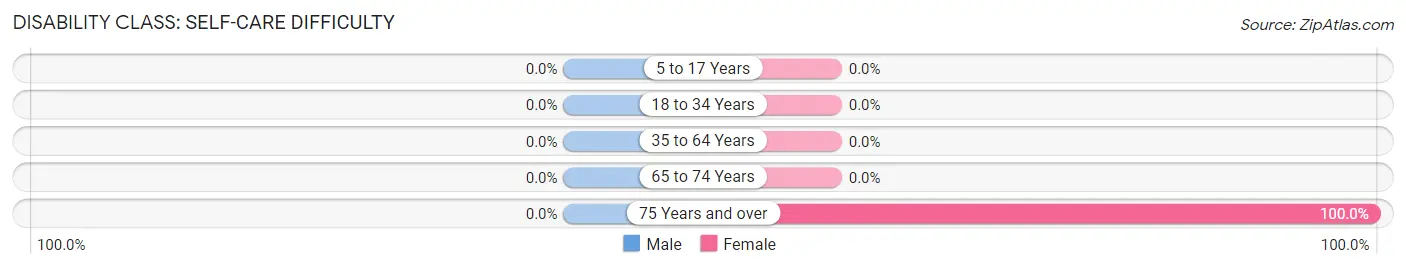
| Age Bracket | Male | Female |
| 5 to 17 Years | 0 (0.0%) | 0 (0.0%) |
| 18 to 34 Years | 0 (0.0%) | 0 (0.0%) |
| 35 to 64 Years | 0 (0.0%) | 0 (0.0%) |
| 65 to 74 Years | 0 (0.0%) | 0 (0.0%) |
| 75 Years and over | 0 (0.0%) | 9 (100.0%) |
Technology Access in East Fultonham
Computing Device Access in East Fultonham
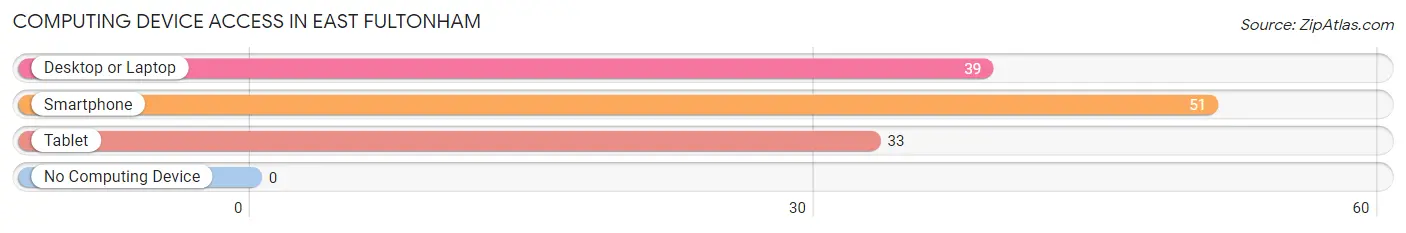
| Device Type | # Households | % Households |
| Desktop or Laptop | 39 | 67.2% |
| Smartphone | 51 | 87.9% |
| Tablet | 33 | 56.9% |
| No Computing Device | 0 | 0.0% |
| Total | 58 | 100.0% |
Internet Access in East Fultonham
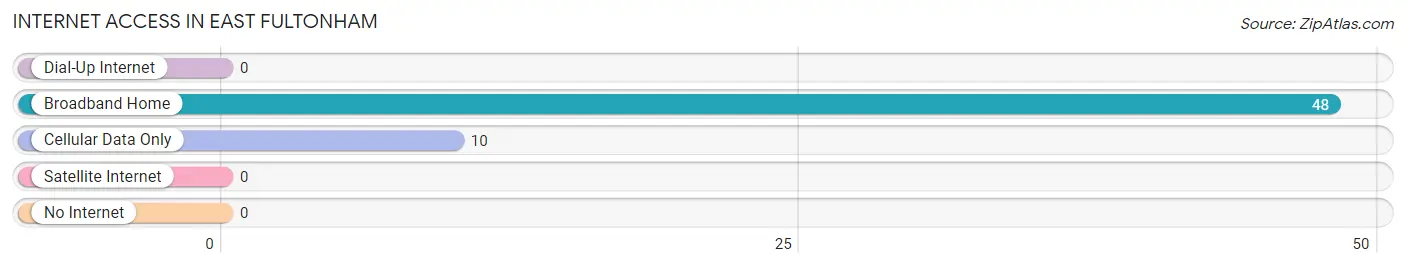
| Internet Type | # Households | % Households |
| Dial-Up Internet | 0 | 0.0% |
| Broadband Home | 48 | 82.8% |
| Cellular Data Only | 10 | 17.2% |
| Satellite Internet | 0 | 0.0% |
| No Internet | 0 | 0.0% |
| Total | 58 | 100.0% |
East Fultonham Summary
History
East Fultonham is a small unincorporated community located in Muskingum County, Ohio. It is situated along the Muskingum River, approximately five miles east of Zanesville. The area was first settled in 1805 by a group of settlers from Pennsylvania, led by John Fulton. The settlement was originally known as Fultonham, but the name was changed to East Fultonham in 1837 to distinguish it from the nearby village of West Fultonham.
The area was primarily agricultural in its early years, with the main crops being corn, wheat, and oats. In the late 19th century, the area began to develop into a small industrial center, with several factories and mills being established. The most notable of these was the East Fultonham Woolen Mill, which was established in 1891 and operated until the early 20th century.
Geography
East Fultonham is located in Muskingum County, Ohio, approximately five miles east of Zanesville. The area is situated along the Muskingum River, and is surrounded by rolling hills and farmland. The climate is generally mild, with hot summers and cold winters.
The area is served by several major highways, including Interstate 70, State Route 60, and State Route 83. The nearest airport is the Zanesville Municipal Airport, located approximately five miles to the west.
Economy
East Fultonham is a small, rural community with a limited economy. The primary industries in the area are agriculture and tourism. The area is home to several farms, which produce a variety of crops, including corn, wheat, and oats. The area is also popular with tourists, who come to enjoy the area’s natural beauty and outdoor activities.
The area is also home to several small businesses, including a grocery store, a hardware store, and a few restaurants. There are also several churches in the area, as well as a post office.
Demographics
As of the 2010 census, the population of East Fultonham was 1,093. The racial makeup of the area was 97.3% White, 0.7% African American, 0.2% Native American, 0.2% Asian, and 1.6% from other races. The median household income was $37,917, and the median family income was $45,625. The per capita income was $18,945.
Conclusion
East Fultonham is a small, rural community located in Muskingum County, Ohio. The area was first settled in 1805, and has since developed into a small industrial center. The primary industries in the area are agriculture and tourism, and the area is home to several small businesses. The population of East Fultonham is 1,093, and the median household income is $37,917.
Common Questions
What is Per Capita Income in East Fultonham?
Per Capita income in East Fultonham is $22,555.
What is Inequality or Gini Index in East Fultonham?
Inequality or Gini Index in East Fultonham is 0.38.
What is the Total Population of East Fultonham?
Total Population of East Fultonham is 143.
What is the Total Male Population of East Fultonham?
Total Male Population of East Fultonham is 60.
What is the Total Female Population of East Fultonham?
Total Female Population of East Fultonham is 83.
What is the Ratio of Males per 100 Females in East Fultonham?
There are 72.29 Males per 100 Females in East Fultonham.
What is the Ratio of Females per 100 Males in East Fultonham?
There are 138.33 Females per 100 Males in East Fultonham.
What is the Median Population Age in East Fultonham?
Median Population Age in East Fultonham is 37.4 Years.
What is the Average Family Size in East Fultonham
Average Family Size in East Fultonham is 2.8 People.
What is the Average Household Size in East Fultonham
Average Household Size in East Fultonham is 2.5 People.
How Large is the Labor Force in East Fultonham?
There are 56 People in the Labor Forcein in East Fultonham.
What is the Percentage of People in the Labor Force in East Fultonham?
47.9% of People are in the Labor Force in East Fultonham.