Dresden, OH Map & Demographics
Dresden Map
Dresden Overview
$24,418
PER CAPITA INCOME
$64,904
AVG FAMILY INCOME
$44,531
AVG HOUSEHOLD INCOME
42.3%
WAGE / INCOME GAP [ % ]
57.7¢/ $1
WAGE / INCOME GAP [ $ ]
0.41
INEQUALITY / GINI INDEX
1,709
TOTAL POPULATION
822
MALE POPULATION
887
FEMALE POPULATION
92.67
MALES / 100 FEMALES
107.91
FEMALES / 100 MALES
40.8
MEDIAN AGE
3.1
AVG FAMILY SIZE
2.5
AVG HOUSEHOLD SIZE
760
LABOR FORCE [ PEOPLE ]
55.9%
PERCENT IN LABOR FORCE
3.1%
UNEMPLOYMENT RATE
Dresden Zip Codes
Dresden Area Codes
Income in Dresden
Income Overview in Dresden
Per Capita Income in Dresden is $24,418, while median incomes of families and households are $64,904 and $44,531 respectively.
| Characteristic | Number | Measure |
| Per Capita Income | 1,709 | $24,418 |
| Median Family Income | 435 | $64,904 |
| Mean Family Income | 435 | $73,873 |
| Median Household Income | 693 | $44,531 |
| Mean Household Income | 693 | $57,100 |
| Income Deficit | 435 | $0 |
| Wage / Income Gap (%) | 1,709 | 42.28% |
| Wage / Income Gap ($) | 1,709 | 57.72¢ per $1 |
| Gini / Inequality Index | 1,709 | 0.41 |
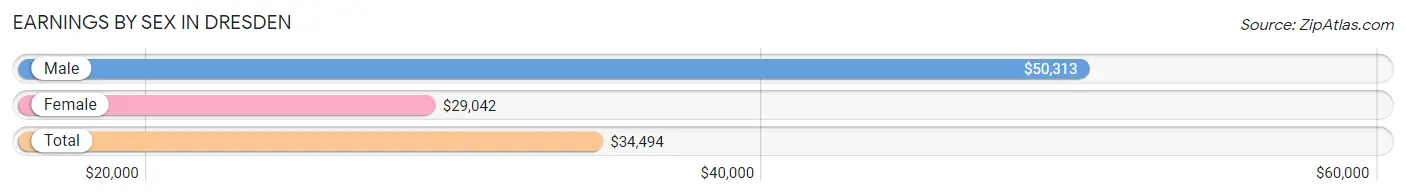
Earnings by Sex in Dresden
Average Earnings in Dresden are $34,494, $50,313 for men and $29,042 for women, a difference of 42.3%.
| Sex | Number | Average Earnings |
| Male | 384 (49.0%) | $50,313 |
| Female | 399 (51.0%) | $29,042 |
| Total | 783 (100.0%) | $34,494 |
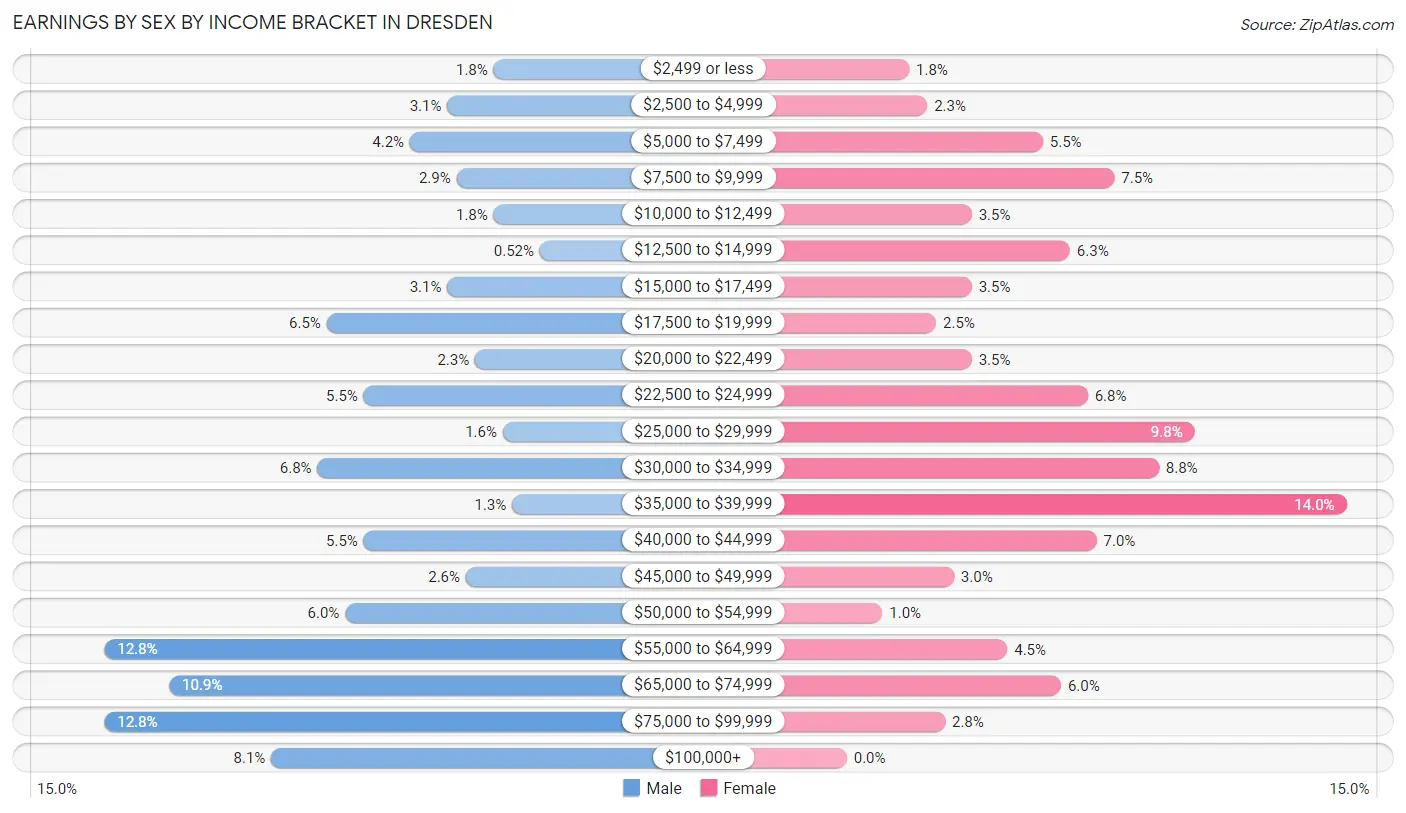
Earnings by Sex by Income Bracket in Dresden
The most common earnings brackets in Dresden are $55,000 to $64,999 for men (49 | 12.8%) and $35,000 to $39,999 for women (56 | 14.0%).
| Income | Male | Female |
| $2,499 or less | 7 (1.8%) | 7 (1.8%) |
| $2,500 to $4,999 | 12 (3.1%) | 9 (2.3%) |
| $5,000 to $7,499 | 16 (4.2%) | 22 (5.5%) |
| $7,500 to $9,999 | 11 (2.9%) | 30 (7.5%) |
| $10,000 to $12,499 | 7 (1.8%) | 14 (3.5%) |
| $12,500 to $14,999 | 2 (0.5%) | 25 (6.3%) |
| $15,000 to $17,499 | 12 (3.1%) | 14 (3.5%) |
| $17,500 to $19,999 | 25 (6.5%) | 10 (2.5%) |
| $20,000 to $22,499 | 9 (2.3%) | 14 (3.5%) |
| $22,500 to $24,999 | 21 (5.5%) | 27 (6.8%) |
| $25,000 to $29,999 | 6 (1.6%) | 39 (9.8%) |
| $30,000 to $34,999 | 26 (6.8%) | 35 (8.8%) |
| $35,000 to $39,999 | 5 (1.3%) | 56 (14.0%) |
| $40,000 to $44,999 | 21 (5.5%) | 28 (7.0%) |
| $45,000 to $49,999 | 10 (2.6%) | 12 (3.0%) |
| $50,000 to $54,999 | 23 (6.0%) | 4 (1.0%) |
| $55,000 to $64,999 | 49 (12.8%) | 18 (4.5%) |
| $65,000 to $74,999 | 42 (10.9%) | 24 (6.0%) |
| $75,000 to $99,999 | 49 (12.8%) | 11 (2.8%) |
| $100,000+ | 31 (8.1%) | 0 (0.0%) |
| Total | 384 (100.0%) | 399 (100.0%) |
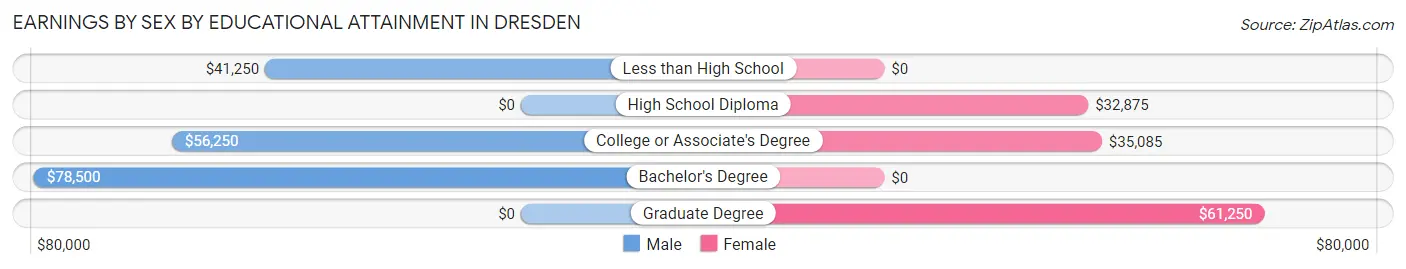
Earnings by Sex by Educational Attainment in Dresden
Average earnings in Dresden are $53,929 for men and $33,750 for women, a difference of 37.4%. Men with an educational attainment of bachelor's degree enjoy the highest average annual earnings of $78,500, while those with less than high school education earn the least with $41,250. Women with an educational attainment of graduate degree earn the most with the average annual earnings of $61,250, while those with high school diploma education have the smallest earnings of $32,875.
| Educational Attainment | Male Income | Female Income |
| Less than High School | $41,250 | $0 |
| High School Diploma | - | - |
| College or Associate's Degree | $56,250 | $35,085 |
| Bachelor's Degree | $78,500 | $0 |
| Graduate Degree | - | - |
| Total | $53,929 | $33,750 |
Family Income in Dresden
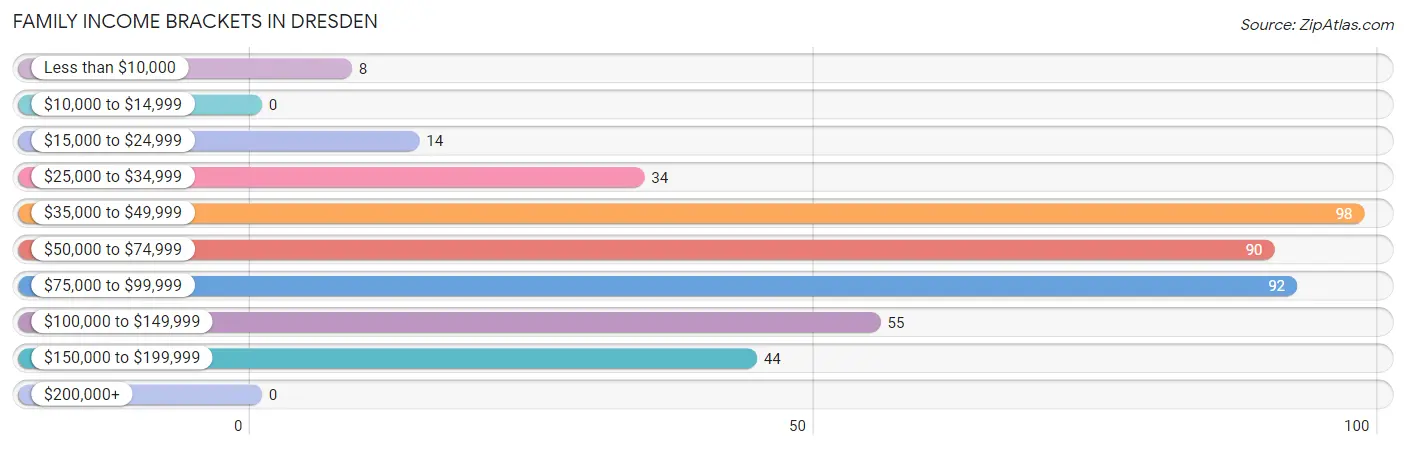
Family Income Brackets in Dresden
According to the Dresden family income data, there are 98 families falling into the $35,000 to $49,999 income range, which is the most common income bracket and makes up 22.5% of all families.
| Income Bracket | # Families | % Families |
| Less than $10,000 | 8 | 1.8% |
| $10,000 to $14,999 | 0 | 0.0% |
| $15,000 to $24,999 | 14 | 3.2% |
| $25,000 to $34,999 | 34 | 7.8% |
| $35,000 to $49,999 | 98 | 22.5% |
| $50,000 to $74,999 | 90 | 20.7% |
| $75,000 to $99,999 | 92 | 21.1% |
| $100,000 to $149,999 | 55 | 12.6% |
| $150,000 to $199,999 | 44 | 10.1% |
| $200,000+ | 0 | 0.0% |
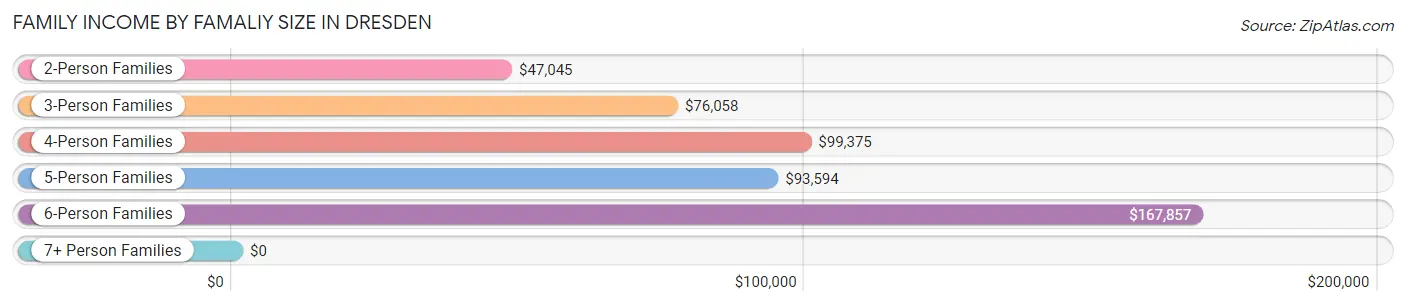
Family Income by Famaliy Size in Dresden
6-person families (12 | 2.8%) account for the highest median family income in Dresden with $167,857 per family, while 6-person families (12 | 2.8%) have the highest median income of $27,976 per family member.
| Income Bracket | # Families | Median Income |
| 2-Person Families | 210 (48.3%) | $47,045 |
| 3-Person Families | 91 (20.9%) | $76,058 |
| 4-Person Families | 97 (22.3%) | $99,375 |
| 5-Person Families | 25 (5.8%) | $93,594 |
| 6-Person Families | 12 (2.8%) | $167,857 |
| 7+ Person Families | 0 (0.0%) | $0 |
| Total | 435 (100.0%) | $64,904 |
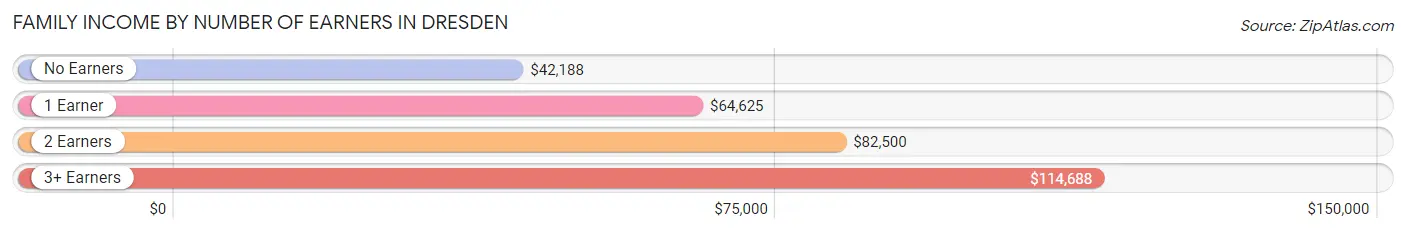
Family Income by Number of Earners in Dresden
The median family income in Dresden is $64,904, with families comprising 3+ earners (33) having the highest median family income of $114,688, while families with no earners (99) have the lowest median family income of $42,188, accounting for 7.6% and 22.8% of families, respectively.
| Number of Earners | # Families | Median Income |
| No Earners | 99 (22.8%) | $42,188 |
| 1 Earner | 117 (26.9%) | $64,625 |
| 2 Earners | 186 (42.8%) | $82,500 |
| 3+ Earners | 33 (7.6%) | $114,688 |
| Total | 435 (100.0%) | $64,904 |
Household Income in Dresden
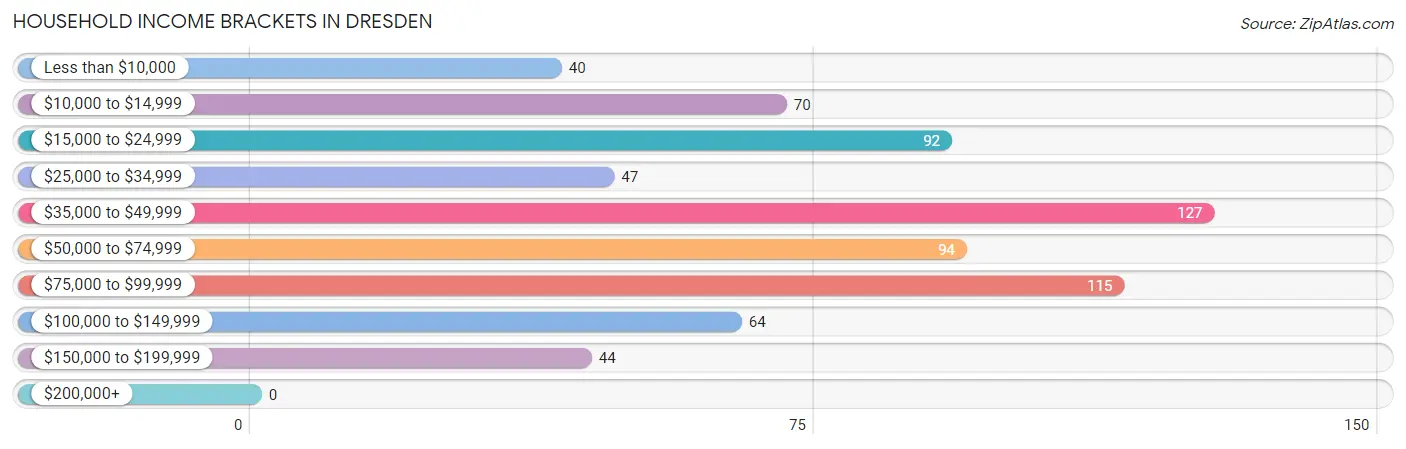
Household Income Brackets in Dresden
With 127 households falling in the category, the $35,000 to $49,999 income range is the most frequent in Dresden, accounting for 18.3% of all households.
| Income Bracket | # Households | % Households |
| Less than $10,000 | 40 | 5.8% |
| $10,000 to $14,999 | 70 | 10.1% |
| $15,000 to $24,999 | 92 | 13.3% |
| $25,000 to $34,999 | 47 | 6.8% |
| $35,000 to $49,999 | 127 | 18.3% |
| $50,000 to $74,999 | 94 | 13.6% |
| $75,000 to $99,999 | 115 | 16.6% |
| $100,000 to $149,999 | 64 | 9.2% |
| $150,000 to $199,999 | 44 | 6.3% |
| $200,000+ | 0 | 0.0% |
Household Income by Householder Age in Dresden
The median household income in Dresden is $44,531, with the highest median household income of $62,813 found in the 25 to 44 years age bracket for the primary householder. A total of 215 households (31.0%) fall into this category. Meanwhile, the 15 to 24 years age bracket for the primary householder has the lowest median household income of $0, with 26 households (3.7%) in this group.
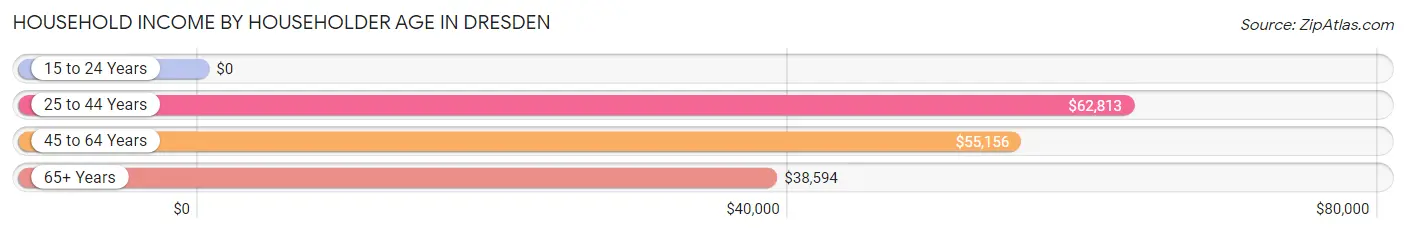
| Income Bracket | # Households | Median Income |
| 15 to 24 Years | 26 (3.7%) | $0 |
| 25 to 44 Years | 215 (31.0%) | $62,813 |
| 45 to 64 Years | 237 (34.2%) | $55,156 |
| 65+ Years | 215 (31.0%) | $38,594 |
| Total | 693 (100.0%) | $44,531 |
Poverty in Dresden
Income Below Poverty by Sex and Age in Dresden
With 12.2% poverty level for males and 15.7% for females among the residents of Dresden, 65 to 74 year old males and 15 year old females are the most vulnerable to poverty, with 14 males (23.0%) and 3 females (100.0%) in their respective age groups living below the poverty level.
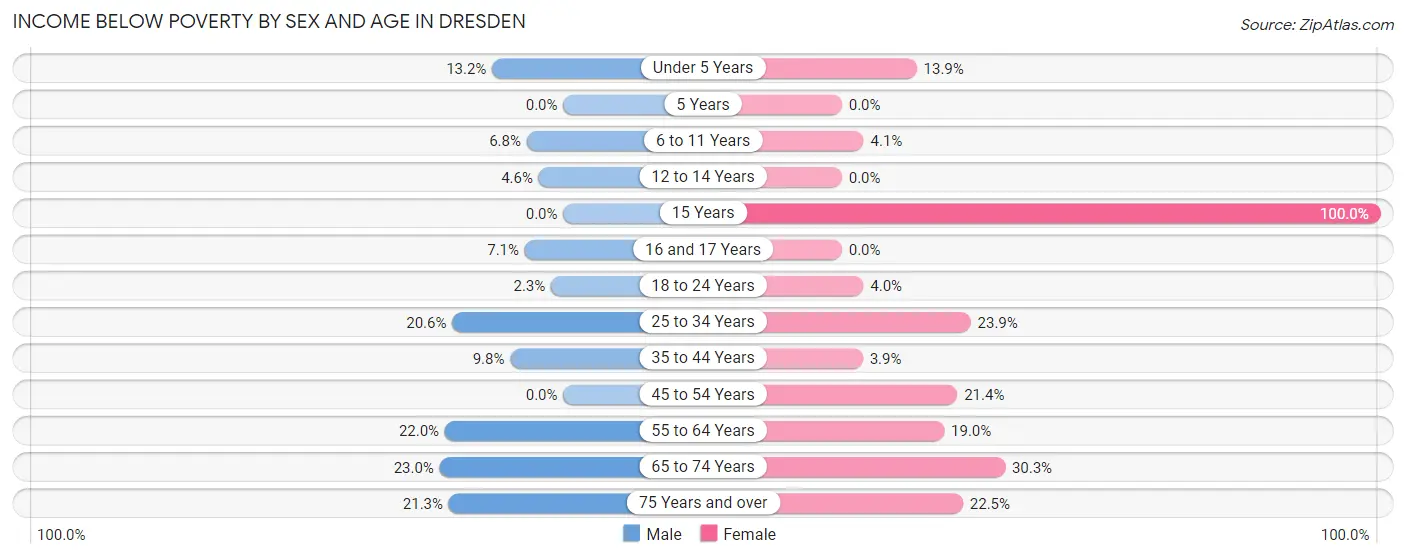
| Age Bracket | Male | Female |
| Under 5 Years | 7 (13.2%) | 5 (13.9%) |
| 5 Years | 0 (0.0%) | 0 (0.0%) |
| 6 to 11 Years | 4 (6.8%) | 3 (4.1%) |
| 12 to 14 Years | 3 (4.5%) | 0 (0.0%) |
| 15 Years | 0 (0.0%) | 3 (100.0%) |
| 16 and 17 Years | 2 (7.1%) | 0 (0.0%) |
| 18 to 24 Years | 1 (2.3%) | 4 (4.0%) |
| 25 to 34 Years | 20 (20.6%) | 22 (23.9%) |
| 35 to 44 Years | 12 (9.8%) | 4 (3.9%) |
| 45 to 54 Years | 0 (0.0%) | 15 (21.4%) |
| 55 to 64 Years | 20 (22.0%) | 30 (19.0%) |
| 65 to 74 Years | 14 (23.0%) | 33 (30.3%) |
| 75 Years and over | 17 (21.2%) | 20 (22.5%) |
| Total | 100 (12.2%) | 139 (15.7%) |
Income Above Poverty by Sex and Age in Dresden
According to the poverty statistics in Dresden, males aged 5 years and females aged 5 years are the age groups that are most secure financially, with 100.0% of males and 100.0% of females in these age groups living above the poverty line.
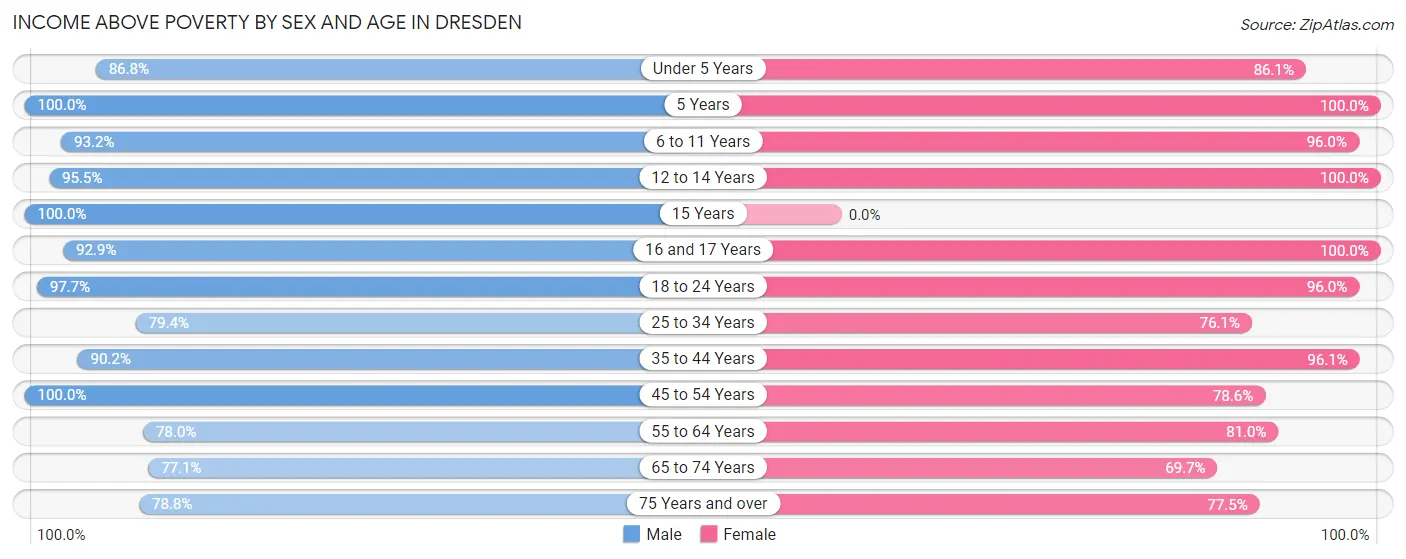
| Age Bracket | Male | Female |
| Under 5 Years | 46 (86.8%) | 31 (86.1%) |
| 5 Years | 1 (100.0%) | 22 (100.0%) |
| 6 to 11 Years | 55 (93.2%) | 71 (96.0%) |
| 12 to 14 Years | 63 (95.5%) | 16 (100.0%) |
| 15 Years | 15 (100.0%) | 0 (0.0%) |
| 16 and 17 Years | 26 (92.9%) | 11 (100.0%) |
| 18 to 24 Years | 43 (97.7%) | 96 (96.0%) |
| 25 to 34 Years | 77 (79.4%) | 70 (76.1%) |
| 35 to 44 Years | 110 (90.2%) | 99 (96.1%) |
| 45 to 54 Years | 105 (100.0%) | 55 (78.6%) |
| 55 to 64 Years | 71 (78.0%) | 128 (81.0%) |
| 65 to 74 Years | 47 (77.0%) | 76 (69.7%) |
| 75 Years and over | 63 (78.7%) | 69 (77.5%) |
| Total | 722 (87.8%) | 744 (84.3%) |
Income Below Poverty Among Married-Couple Families in Dresden
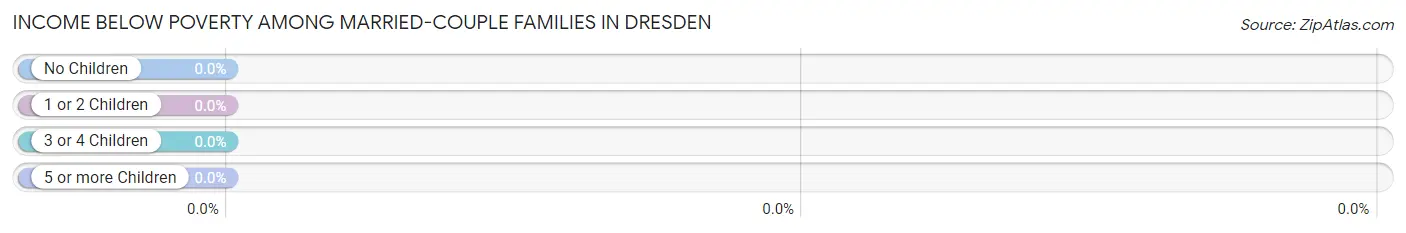
| Children | Above Poverty | Below Poverty |
| No Children | 154 (100.0%) | 0 (0.0%) |
| 1 or 2 Children | 117 (100.0%) | 0 (0.0%) |
| 3 or 4 Children | 15 (100.0%) | 0 (0.0%) |
| 5 or more Children | 0 (0.0%) | 0 (0.0%) |
| Total | 286 (100.0%) | 0 (0.0%) |
Income Below Poverty Among Single-Parent Households in Dresden
According to the poverty data in Dresden, 6.7% or 4 single-father households and 14.6% or 13 single-mother households are living below the poverty line. Among single-father households, those with 1 or 2 children have the highest poverty rate, with 4 households (16.7%) experiencing poverty. Likewise, among single-mother households, those with 1 or 2 children have the highest poverty rate, with 13 households (23.6%) falling below the poverty line.
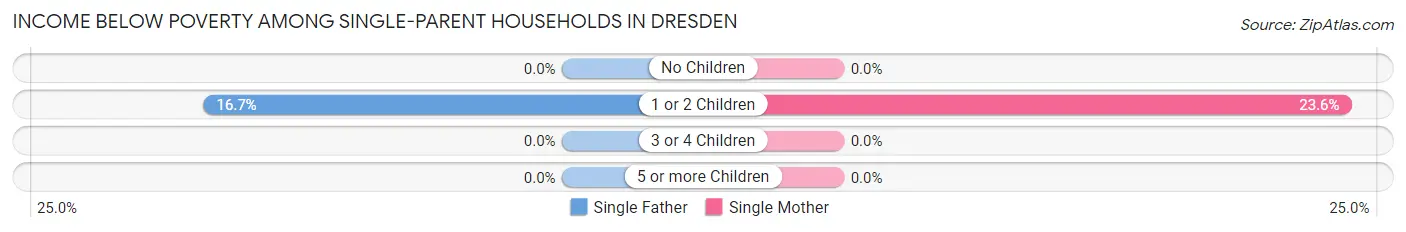
| Children | Single Father | Single Mother |
| No Children | 0 (0.0%) | 0 (0.0%) |
| 1 or 2 Children | 4 (16.7%) | 13 (23.6%) |
| 3 or 4 Children | 0 (0.0%) | 0 (0.0%) |
| 5 or more Children | 0 (0.0%) | 0 (0.0%) |
| Total | 4 (6.7%) | 13 (14.6%) |
Income Below Poverty Among Married-Couple vs Single-Parent Households in Dresden
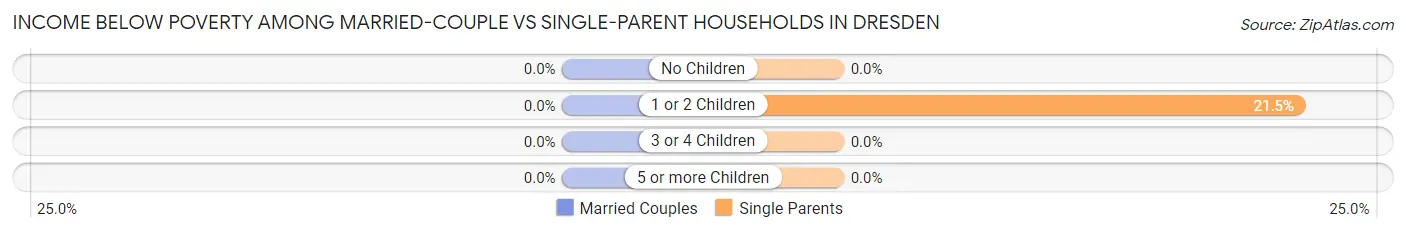
| Children | Married-Couple Families | Single-Parent Households |
| No Children | 0 (0.0%) | 0 (0.0%) |
| 1 or 2 Children | 0 (0.0%) | 17 (21.5%) |
| 3 or 4 Children | 0 (0.0%) | 0 (0.0%) |
| 5 or more Children | 0 (0.0%) | 0 (0.0%) |
| Total | 0 (0.0%) | 17 (11.4%) |
Race in Dresden
The most populous races in Dresden are White / Caucasian (1,631 | 95.4%), Two or more Races (47 | 2.8%), and Black / African American (23 | 1.3%).
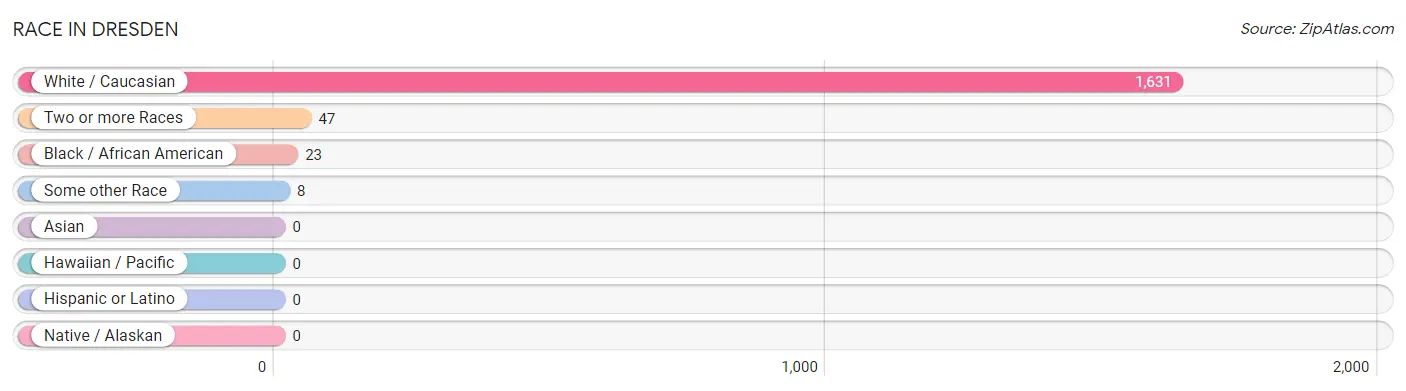
| Race | # Population | % Population |
| Asian | 0 | 0.0% |
| Black / African American | 23 | 1.3% |
| Hawaiian / Pacific | 0 | 0.0% |
| Hispanic or Latino | 0 | 0.0% |
| Native / Alaskan | 0 | 0.0% |
| White / Caucasian | 1,631 | 95.4% |
| Two or more Races | 47 | 2.8% |
| Some other Race | 8 | 0.5% |
| Total | 1,709 | 100.0% |
Ancestry in Dresden
The most populous ancestries reported in Dresden are German (486 | 28.4%), Irish (301 | 17.6%), English (189 | 11.1%), American (154 | 9.0%), and Polish (74 | 4.3%), together accounting for 70.5% of all Dresden residents.
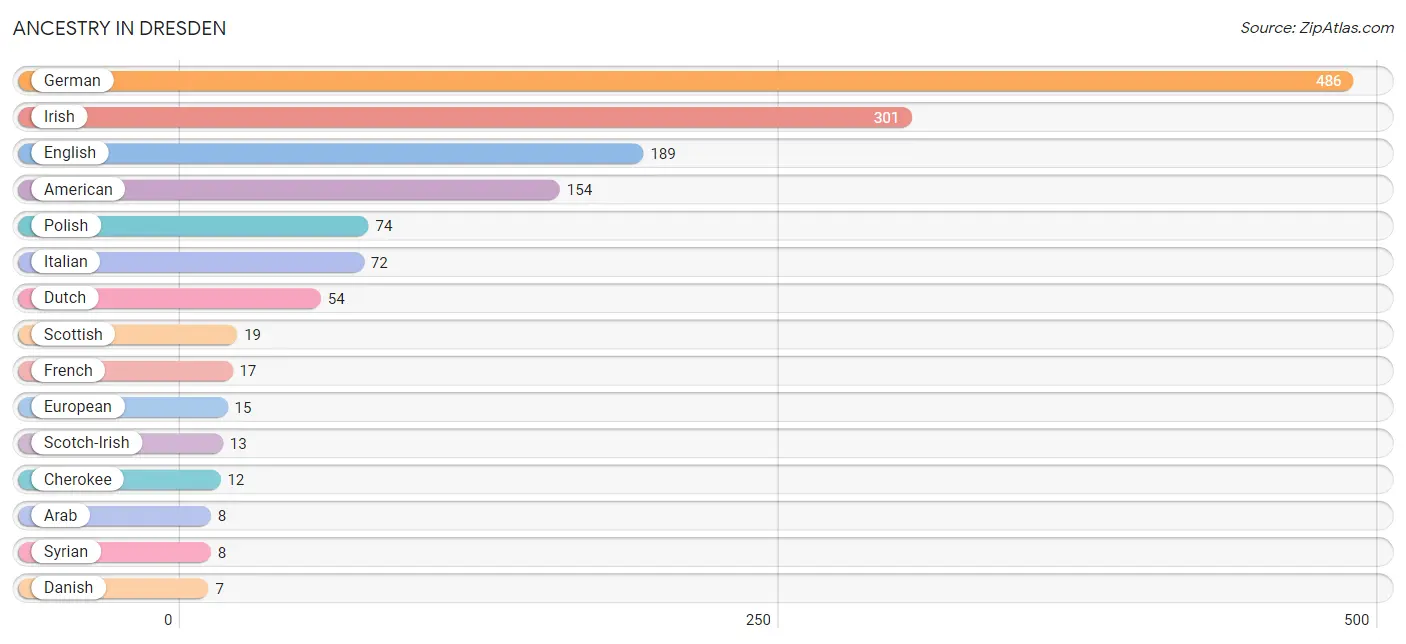
| Ancestry | # Population | % Population |
| American | 154 | 9.0% |
| Arab | 8 | 0.5% |
| Cherokee | 12 | 0.7% |
| Czech | 3 | 0.2% |
| Danish | 7 | 0.4% |
| Dutch | 54 | 3.2% |
| English | 189 | 11.1% |
| European | 15 | 0.9% |
| French | 17 | 1.0% |
| French Canadian | 2 | 0.1% |
| German | 486 | 28.4% |
| Irish | 301 | 17.6% |
| Italian | 72 | 4.2% |
| Lumbee | 4 | 0.2% |
| Norwegian | 4 | 0.2% |
| Polish | 74 | 4.3% |
| Scandinavian | 2 | 0.1% |
| Scotch-Irish | 13 | 0.8% |
| Scottish | 19 | 1.1% |
| Sioux | 2 | 0.1% |
| Slovak | 3 | 0.2% |
| Swedish | 3 | 0.2% |
| Syrian | 8 | 0.5% |
| Ukrainian | 3 | 0.2% |
| Welsh | 7 | 0.4% | View All 25 Rows |
Immigrants in Dresden
The most numerous immigrant groups reported in Dresden came from Asia (10 | 0.6%), India (5 | 0.3%), Philippines (5 | 0.3%), South Central Asia (5 | 0.3%), and South Eastern Asia (5 | 0.3%), together accounting for 1.7% of all Dresden residents.
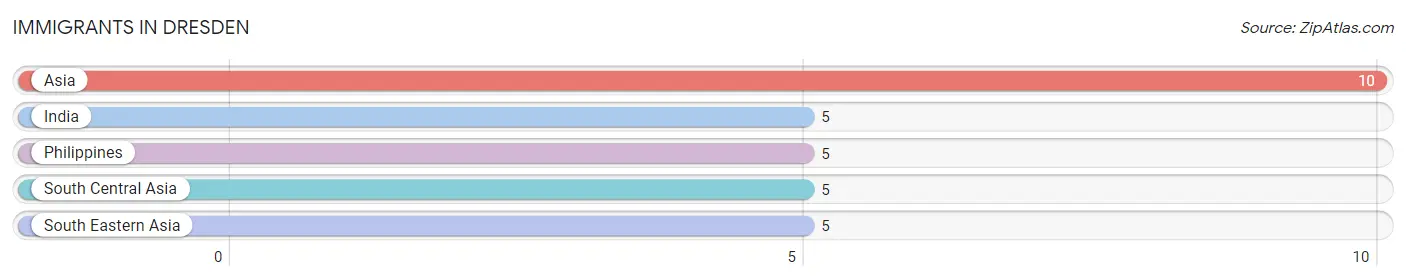
| Immigration Origin | # Population | % Population |
| Asia | 10 | 0.6% |
| India | 5 | 0.3% |
| Philippines | 5 | 0.3% |
| South Central Asia | 5 | 0.3% |
| South Eastern Asia | 5 | 0.3% | View All 5 Rows |
Sex and Age in Dresden
Sex and Age in Dresden
The most populous age groups in Dresden are 10 to 14 Years (85 | 10.3%) for men and 20 to 24 Years (87 | 9.8%) for women.
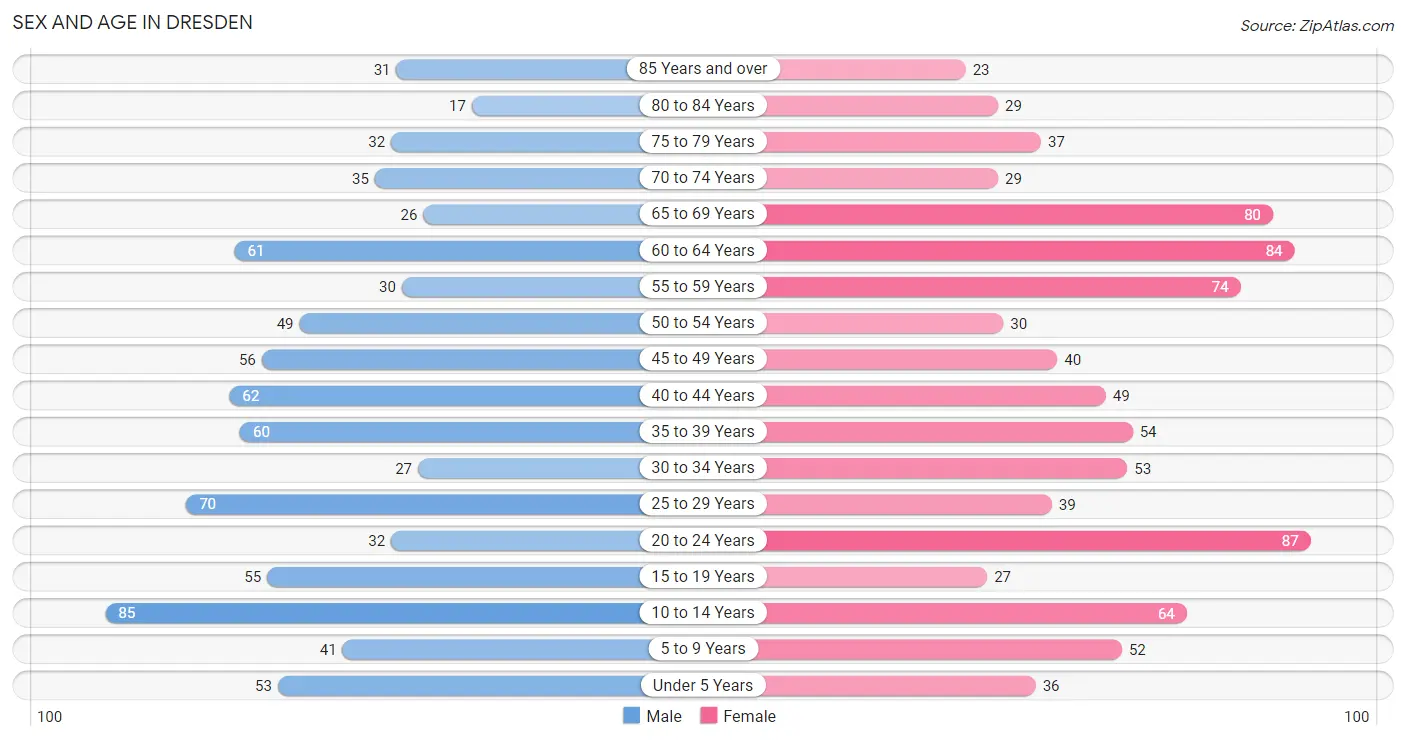
| Age Bracket | Male | Female |
| Under 5 Years | 53 (6.5%) | 36 (4.1%) |
| 5 to 9 Years | 41 (5.0%) | 52 (5.9%) |
| 10 to 14 Years | 85 (10.3%) | 64 (7.2%) |
| 15 to 19 Years | 55 (6.7%) | 27 (3.0%) |
| 20 to 24 Years | 32 (3.9%) | 87 (9.8%) |
| 25 to 29 Years | 70 (8.5%) | 39 (4.4%) |
| 30 to 34 Years | 27 (3.3%) | 53 (6.0%) |
| 35 to 39 Years | 60 (7.3%) | 54 (6.1%) |
| 40 to 44 Years | 62 (7.5%) | 49 (5.5%) |
| 45 to 49 Years | 56 (6.8%) | 40 (4.5%) |
| 50 to 54 Years | 49 (6.0%) | 30 (3.4%) |
| 55 to 59 Years | 30 (3.6%) | 74 (8.3%) |
| 60 to 64 Years | 61 (7.4%) | 84 (9.5%) |
| 65 to 69 Years | 26 (3.2%) | 80 (9.0%) |
| 70 to 74 Years | 35 (4.3%) | 29 (3.3%) |
| 75 to 79 Years | 32 (3.9%) | 37 (4.2%) |
| 80 to 84 Years | 17 (2.1%) | 29 (3.3%) |
| 85 Years and over | 31 (3.8%) | 23 (2.6%) |
| Total | 822 (100.0%) | 887 (100.0%) |
Families and Households in Dresden
Median Family Size in Dresden
The median family size in Dresden is 3.08 persons per family, with married-couple families (286 | 65.7%) accounting for the largest median family size of 3.21 persons per family. On the other hand, single male/father families (60 | 13.8%) represent the smallest median family size with 2.48 persons per family.
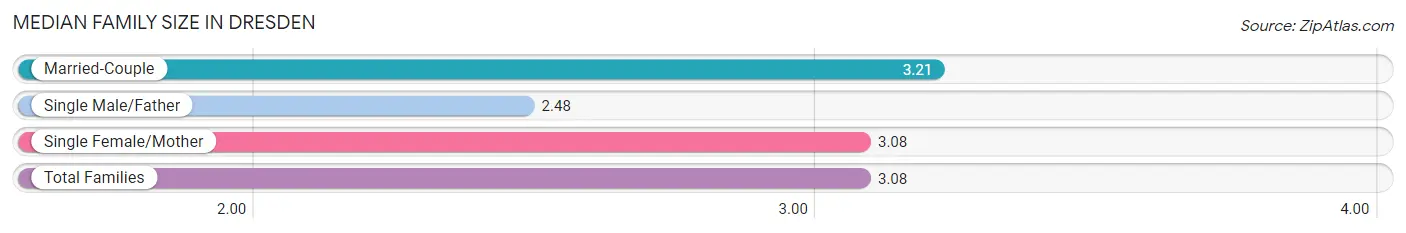
| Family Type | # Families | Family Size |
| Married-Couple | 286 (65.7%) | 3.21 |
| Single Male/Father | 60 (13.8%) | 2.48 |
| Single Female/Mother | 89 (20.5%) | 3.08 |
| Total Families | 435 (100.0%) | 3.08 |
Median Household Size in Dresden
The median household size in Dresden is 2.46 persons per household, with married-couple households (286 | 41.3%) accounting for the largest median household size of 3.23 persons per household. non-family households (258 | 37.2%) represent the smallest median household size with 1.32 persons per household.
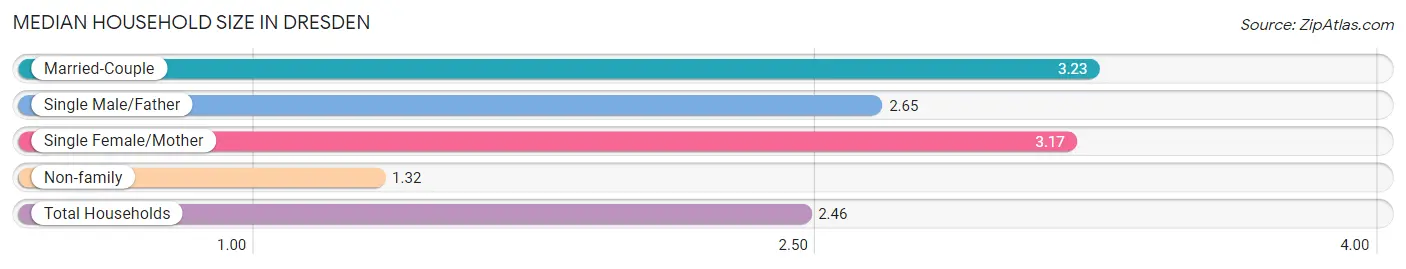
| Household Type | # Households | Household Size |
| Married-Couple | 286 (41.3%) | 3.23 |
| Single Male/Father | 60 (8.7%) | 2.65 |
| Single Female/Mother | 89 (12.8%) | 3.17 |
| Non-family | 258 (37.2%) | 1.32 |
| Total Households | 693 (100.0%) | 2.46 |
Household Size by Marriage Status in Dresden
Out of a total of 693 households in Dresden, 435 (62.8%) are family households, while 258 (37.2%) are nonfamily households. The most numerous type of family households are 2-person households, comprising 196, and the most common type of nonfamily households are 1-person households, comprising 204.
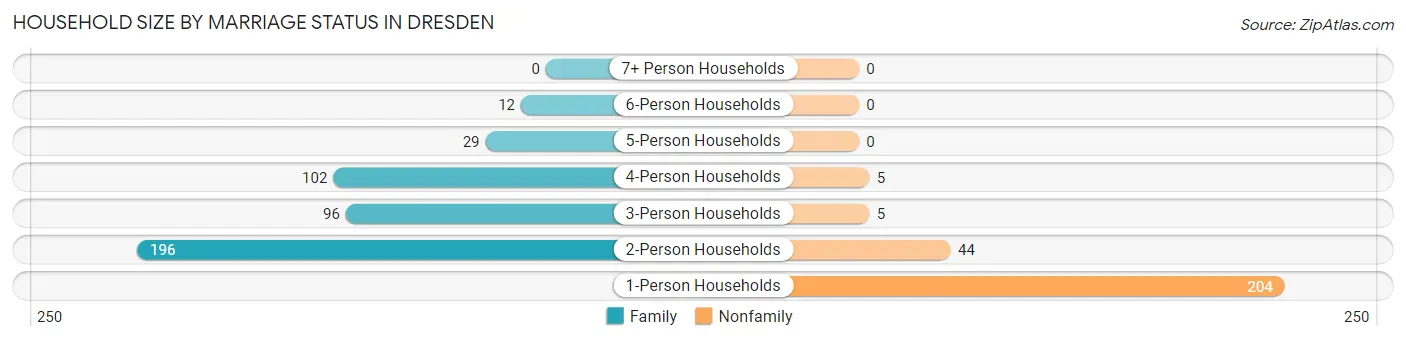
| Household Size | Family Households | Nonfamily Households |
| 1-Person Households | - | 204 (29.4%) |
| 2-Person Households | 196 (28.3%) | 44 (6.4%) |
| 3-Person Households | 96 (13.9%) | 5 (0.7%) |
| 4-Person Households | 102 (14.7%) | 5 (0.7%) |
| 5-Person Households | 29 (4.2%) | 0 (0.0%) |
| 6-Person Households | 12 (1.7%) | 0 (0.0%) |
| 7+ Person Households | 0 (0.0%) | 0 (0.0%) |
| Total | 435 (62.8%) | 258 (37.2%) |
Female Fertility in Dresden
Fertility by Age in Dresden
Average fertility rate in Dresden is 59.0 births per 1,000 women. Women in the age bracket of 20 to 34 years have the highest fertility rate with 117.0 births per 1,000 women. Women in the age bracket of 20 to 34 years acount for 100.0% of all women with births.
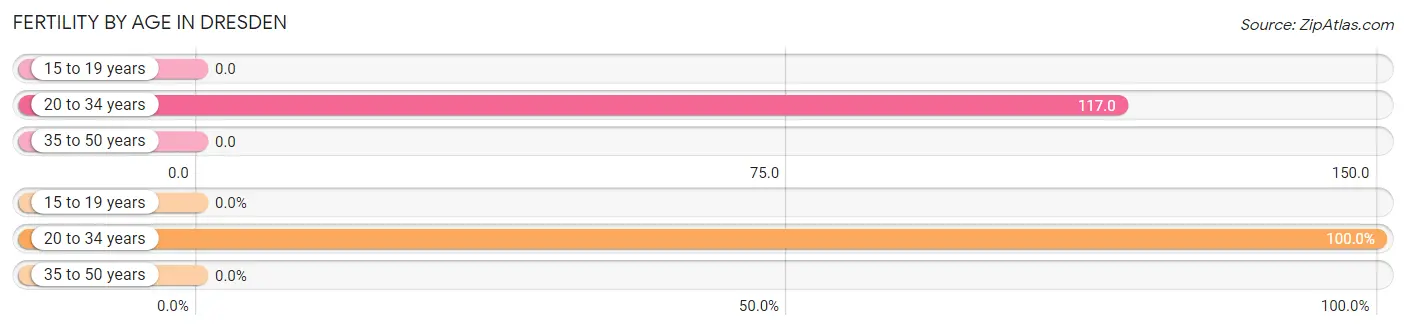
| Age Bracket | Women with Births | Births / 1,000 Women |
| 15 to 19 years | 0 (0.0%) | 0.0 |
| 20 to 34 years | 21 (100.0%) | 117.0 |
| 35 to 50 years | 0 (0.0%) | 0.0 |
| Total | 21 (100.0%) | 59.0 |
Fertility by Age by Marriage Status in Dresden
28.6% of women with births (21) in Dresden are married. The highest percentage of unmarried women with births falls into 20 to 34 years age bracket with 71.4% of them unmarried at the time of birth, while the lowest percentage of unmarried women with births belong to 20 to 34 years age bracket with 71.4% of them unmarried.
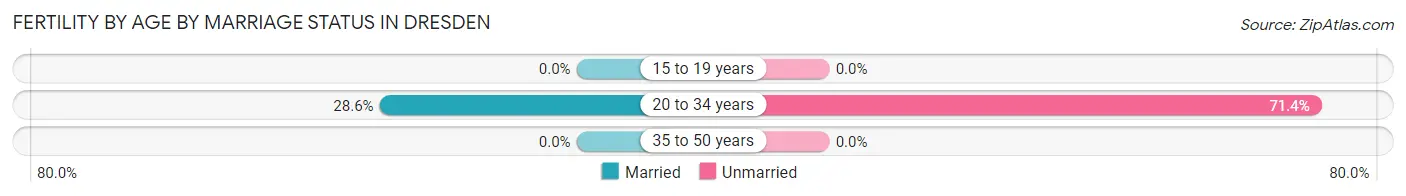
| Age Bracket | Married | Unmarried |
| 15 to 19 years | 0 (0.0%) | 0 (0.0%) |
| 20 to 34 years | 6 (28.6%) | 15 (71.4%) |
| 35 to 50 years | 0 (0.0%) | 0 (0.0%) |
| Total | 6 (28.6%) | 15 (71.4%) |
Fertility by Education in Dresden
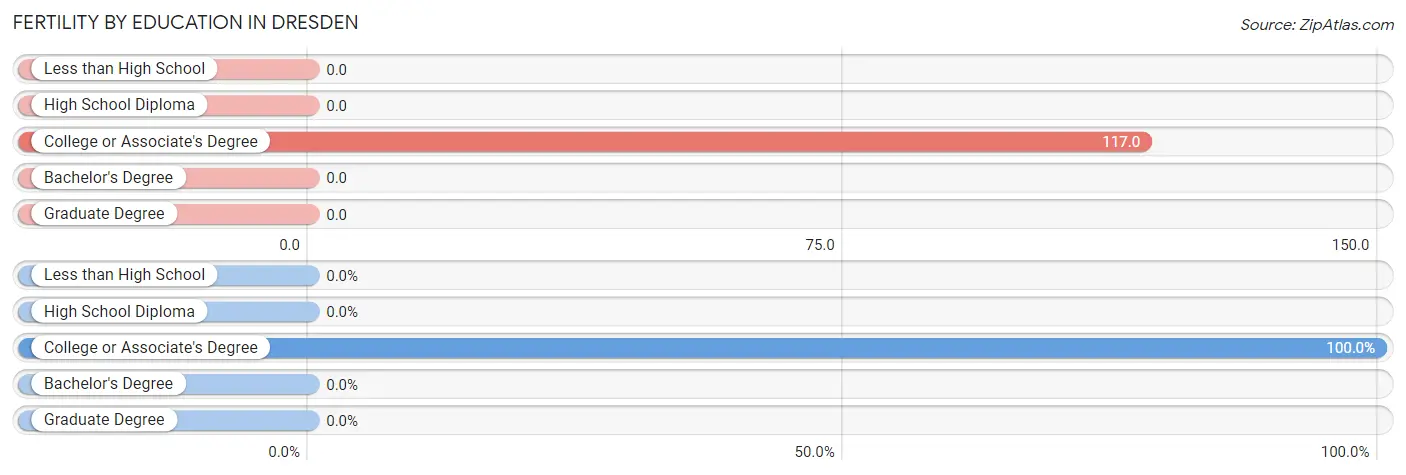
| Educational Attainment | Women with Births | Births / 1,000 Women |
| Less than High School | 0 (0.0%) | 0.0 |
| High School Diploma | 0 (0.0%) | 0.0 |
| College or Associate's Degree | 21 (100.0%) | 117.0 |
| Bachelor's Degree | 0 (0.0%) | 0.0 |
| Graduate Degree | 0 (0.0%) | 0.0 |
| Total | 21 (100.0%) | 59.0 |
Fertility by Education by Marriage Status in Dresden
71.4% of women with births in Dresden are unmarried. Women with the educational attainment of college or associate's degree are most likely to be married with 28.6% of them married at childbirth, while women with the educational attainment of college or associate's degree are least likely to be married with 71.4% of them unmarried at childbirth.
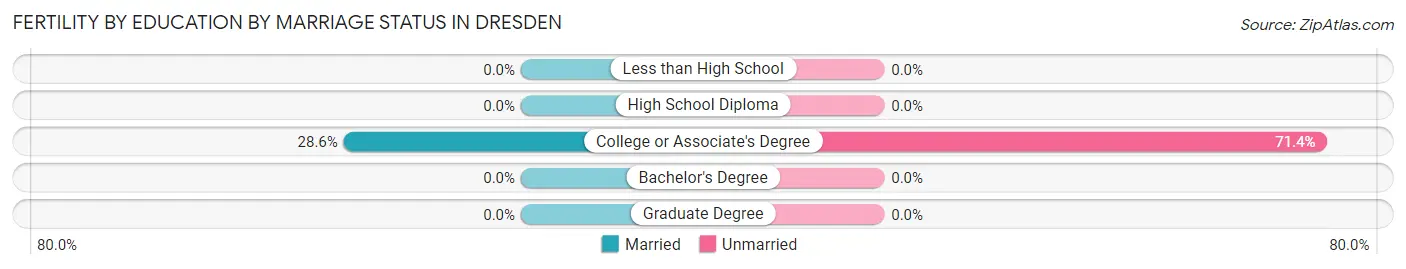
| Educational Attainment | Married | Unmarried |
| Less than High School | 0 (0.0%) | 0 (0.0%) |
| High School Diploma | 0 (0.0%) | 0 (0.0%) |
| College or Associate's Degree | 6 (28.6%) | 15 (71.4%) |
| Bachelor's Degree | 0 (0.0%) | 0 (0.0%) |
| Graduate Degree | 0 (0.0%) | 0 (0.0%) |
| Total | 6 (28.6%) | 15 (71.4%) |
Employment Characteristics in Dresden
Employment by Class of Employer in Dresden
Among the 734 employed individuals in Dresden, private company employees (541 | 73.7%), local government employees (55 | 7.5%), and not-for-profit organizations (52 | 7.1%) make up the most common classes of employment.
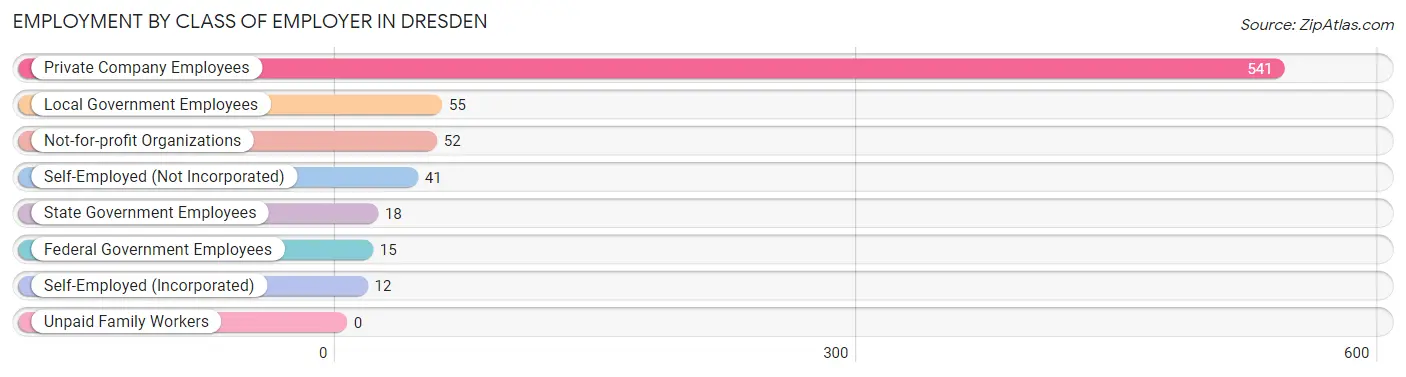
| Employer Class | # Employees | % Employees |
| Private Company Employees | 541 | 73.7% |
| Self-Employed (Incorporated) | 12 | 1.6% |
| Self-Employed (Not Incorporated) | 41 | 5.6% |
| Not-for-profit Organizations | 52 | 7.1% |
| Local Government Employees | 55 | 7.5% |
| State Government Employees | 18 | 2.5% |
| Federal Government Employees | 15 | 2.0% |
| Unpaid Family Workers | 0 | 0.0% |
| Total | 734 | 100.0% |
Employment Status by Age in Dresden
According to the labor force statistics for Dresden, out of the total population over 16 years of age (1,360), 55.9% or 760 individuals are in the labor force, with 3.1% or 24 of them unemployed. The age group with the highest labor force participation rate is 25 to 29 years, with 96.3% or 105 individuals in the labor force. Within the labor force, the 35 to 44 years age range has the highest percentage of unemployed individuals, with 7.9% or 16 of them being unemployed.
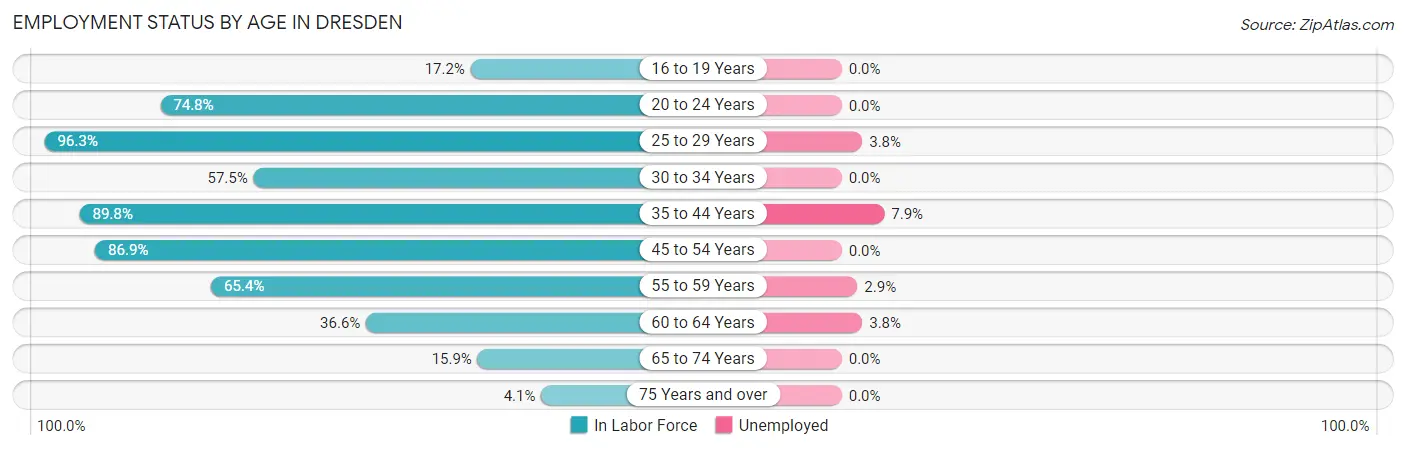
| Age Bracket | In Labor Force | Unemployed |
| 16 to 19 Years | 11 (17.2%) | 0 (0.0%) |
| 20 to 24 Years | 89 (74.8%) | 0 (0.0%) |
| 25 to 29 Years | 105 (96.3%) | 4 (3.8%) |
| 30 to 34 Years | 46 (57.5%) | 0 (0.0%) |
| 35 to 44 Years | 202 (89.8%) | 16 (7.9%) |
| 45 to 54 Years | 152 (86.9%) | 0 (0.0%) |
| 55 to 59 Years | 68 (65.4%) | 2 (2.9%) |
| 60 to 64 Years | 53 (36.6%) | 2 (3.8%) |
| 65 to 74 Years | 27 (15.9%) | 0 (0.0%) |
| 75 Years and over | 7 (4.1%) | 0 (0.0%) |
| Total | 760 (55.9%) | 24 (3.1%) |
Employment Status by Educational Attainment in Dresden
According to labor force statistics for Dresden, 74.7% of individuals (626) out of the total population between 25 and 64 years of age (838) are in the labor force, with 3.8% or 24 of them being unemployed. The group with the highest labor force participation rate are those with the educational attainment of bachelor's degree or higher, with 98.1% or 101 individuals in the labor force. Within the labor force, individuals with college / associate degree education have the highest percentage of unemployment, with 4.6% or 13 of them being unemployed.
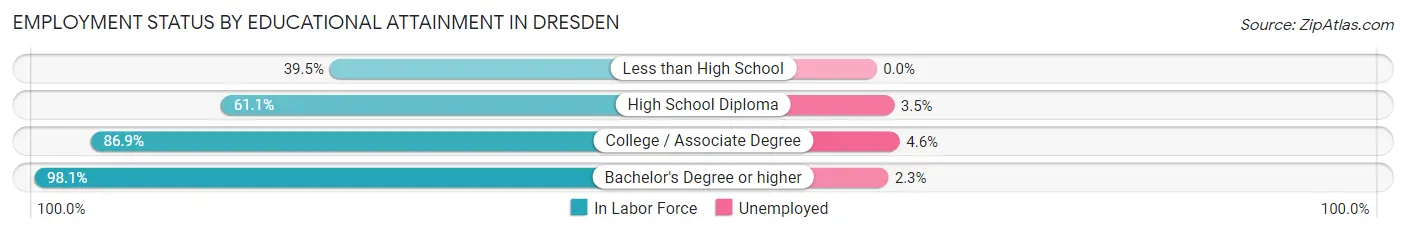
| Educational Attainment | In Labor Force | Unemployed |
| Less than High School | 15 (39.5%) | 0 (0.0%) |
| High School Diploma | 226 (61.1%) | 13 (3.5%) |
| College / Associate Degree | 284 (86.9%) | 15 (4.6%) |
| Bachelor's Degree or higher | 101 (98.1%) | 2 (2.3%) |
| Total | 626 (74.7%) | 32 (3.8%) |
Employment Occupations by Sex in Dresden
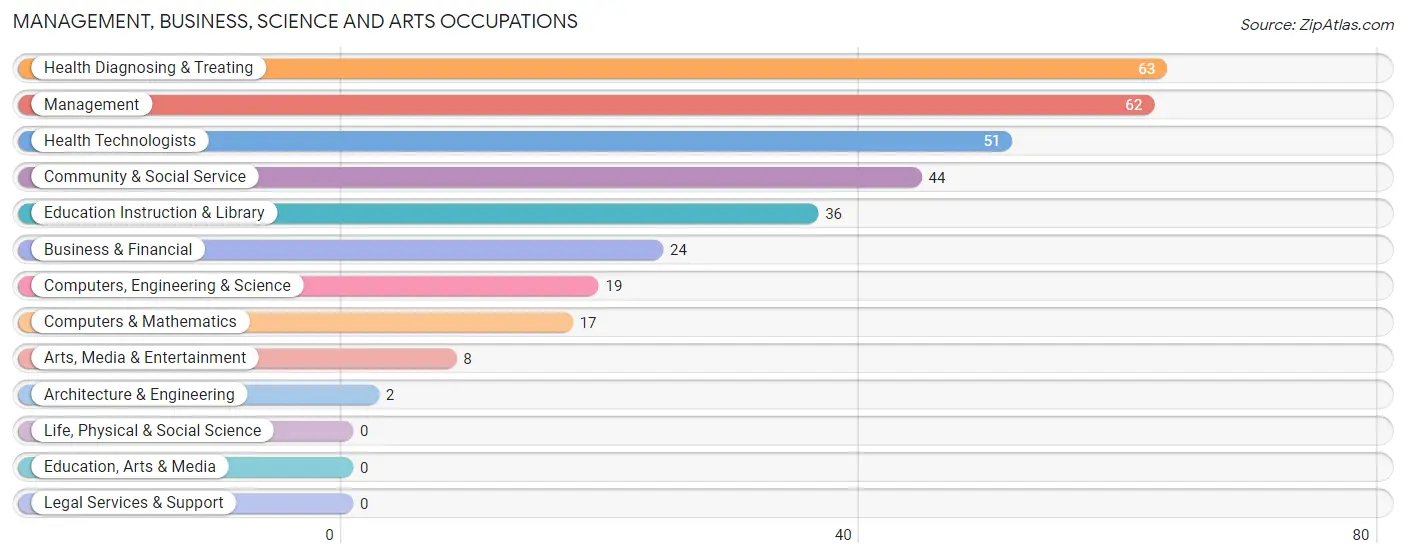
Management, Business, Science and Arts Occupations
The most common Management, Business, Science and Arts occupations in Dresden are Health Diagnosing & Treating (63 | 8.7%), Management (62 | 8.6%), Health Technologists (51 | 7.0%), Community & Social Service (44 | 6.1%), and Education Instruction & Library (36 | 5.0%).
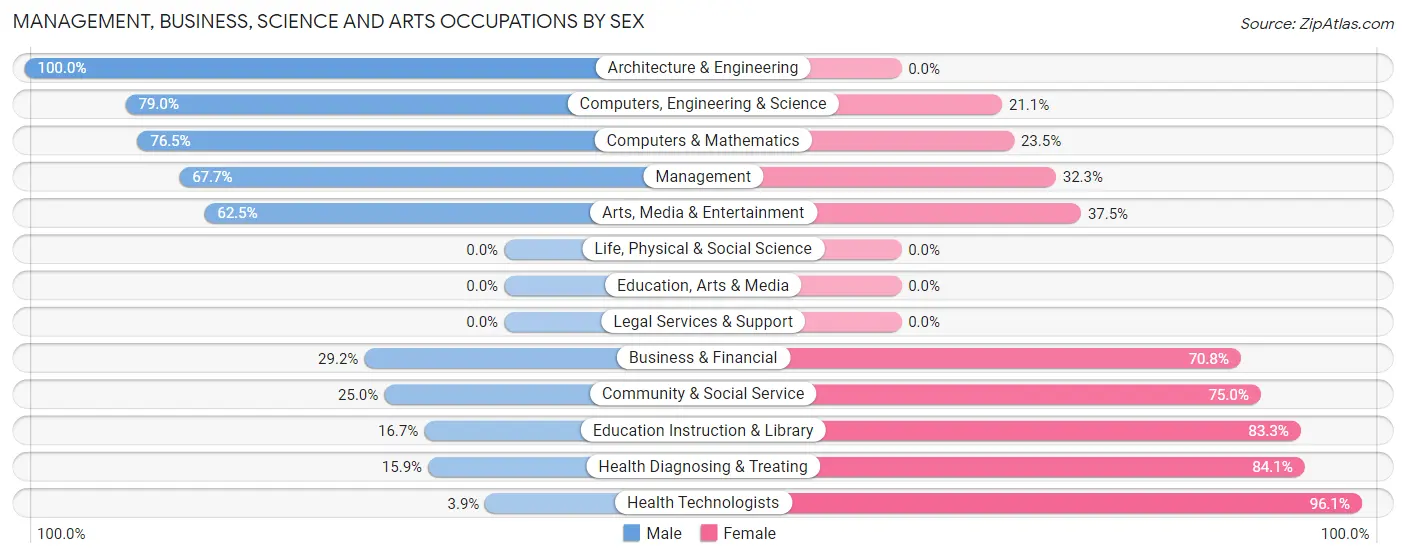
Management, Business, Science and Arts Occupations by Sex
Within the Management, Business, Science and Arts occupations in Dresden, the most male-oriented occupations are Architecture & Engineering (100.0%), Computers, Engineering & Science (78.9%), and Computers & Mathematics (76.5%), while the most female-oriented occupations are Health Technologists (96.1%), Health Diagnosing & Treating (84.1%), and Education Instruction & Library (83.3%).
| Occupation | Male | Female |
| Management | 42 (67.7%) | 20 (32.3%) |
| Business & Financial | 7 (29.2%) | 17 (70.8%) |
| Computers, Engineering & Science | 15 (78.9%) | 4 (21.0%) |
| Computers & Mathematics | 13 (76.5%) | 4 (23.5%) |
| Architecture & Engineering | 2 (100.0%) | 0 (0.0%) |
| Life, Physical & Social Science | 0 (0.0%) | 0 (0.0%) |
| Community & Social Service | 11 (25.0%) | 33 (75.0%) |
| Education, Arts & Media | 0 (0.0%) | 0 (0.0%) |
| Legal Services & Support | 0 (0.0%) | 0 (0.0%) |
| Education Instruction & Library | 6 (16.7%) | 30 (83.3%) |
| Arts, Media & Entertainment | 5 (62.5%) | 3 (37.5%) |
| Health Diagnosing & Treating | 10 (15.9%) | 53 (84.1%) |
| Health Technologists | 2 (3.9%) | 49 (96.1%) |
| Total (Category) | 85 (40.1%) | 127 (59.9%) |
| Total (Overall) | 351 (48.5%) | 373 (51.5%) |
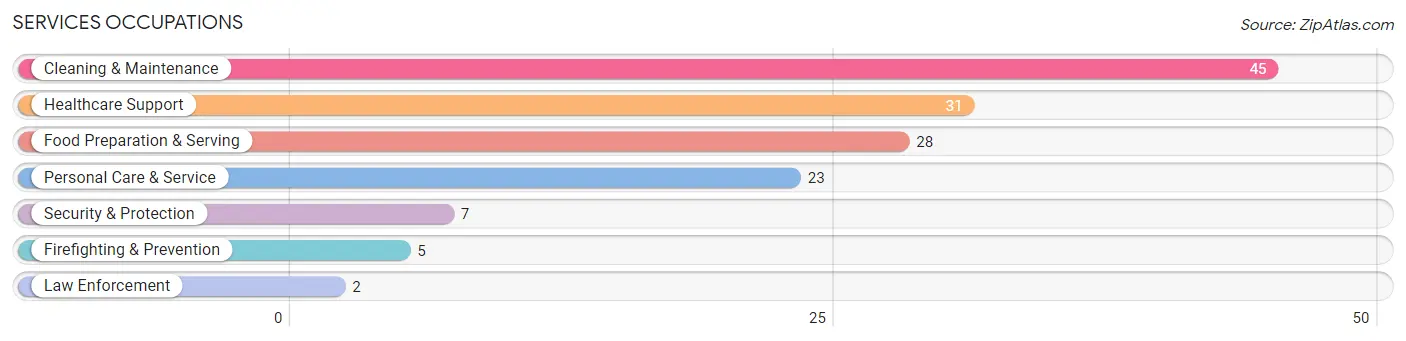
Services Occupations
The most common Services occupations in Dresden are Cleaning & Maintenance (45 | 6.2%), Healthcare Support (31 | 4.3%), Food Preparation & Serving (28 | 3.9%), Personal Care & Service (23 | 3.2%), and Security & Protection (7 | 1.0%).
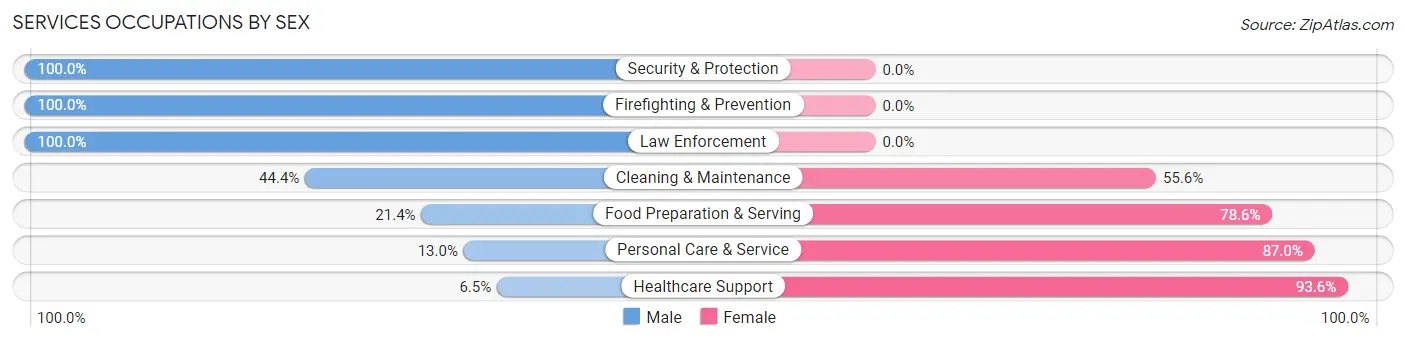
Services Occupations by Sex
Within the Services occupations in Dresden, the most male-oriented occupations are Security & Protection (100.0%), Firefighting & Prevention (100.0%), and Law Enforcement (100.0%), while the most female-oriented occupations are Healthcare Support (93.5%), Personal Care & Service (87.0%), and Food Preparation & Serving (78.6%).
| Occupation | Male | Female |
| Healthcare Support | 2 (6.5%) | 29 (93.5%) |
| Security & Protection | 7 (100.0%) | 0 (0.0%) |
| Firefighting & Prevention | 5 (100.0%) | 0 (0.0%) |
| Law Enforcement | 2 (100.0%) | 0 (0.0%) |
| Food Preparation & Serving | 6 (21.4%) | 22 (78.6%) |
| Cleaning & Maintenance | 20 (44.4%) | 25 (55.6%) |
| Personal Care & Service | 3 (13.0%) | 20 (87.0%) |
| Total (Category) | 38 (28.4%) | 96 (71.6%) |
| Total (Overall) | 351 (48.5%) | 373 (51.5%) |
Sales and Office Occupations
The most common Sales and Office occupations in Dresden are Office & Administration (99 | 13.7%), and Sales & Related (54 | 7.5%).
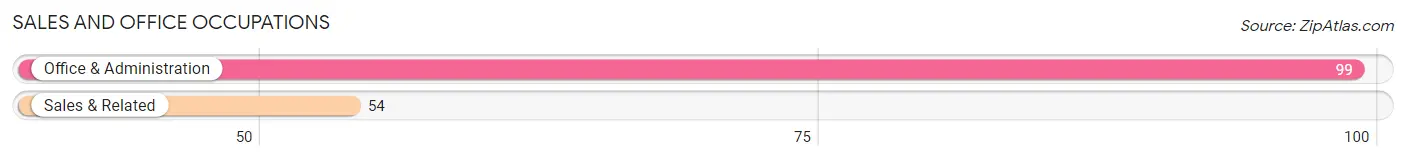
Sales and Office Occupations by Sex
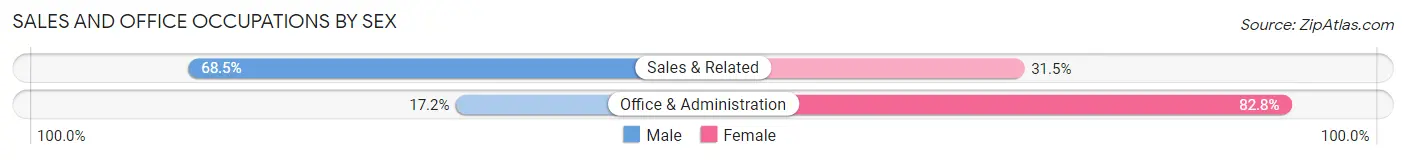
| Occupation | Male | Female |
| Sales & Related | 37 (68.5%) | 17 (31.5%) |
| Office & Administration | 17 (17.2%) | 82 (82.8%) |
| Total (Category) | 54 (35.3%) | 99 (64.7%) |
| Total (Overall) | 351 (48.5%) | 373 (51.5%) |
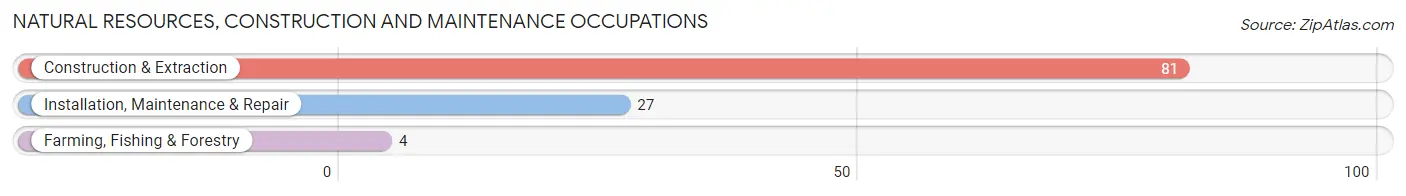
Natural Resources, Construction and Maintenance Occupations
The most common Natural Resources, Construction and Maintenance occupations in Dresden are Construction & Extraction (81 | 11.2%), Installation, Maintenance & Repair (27 | 3.7%), and Farming, Fishing & Forestry (4 | 0.5%).
Natural Resources, Construction and Maintenance Occupations by Sex
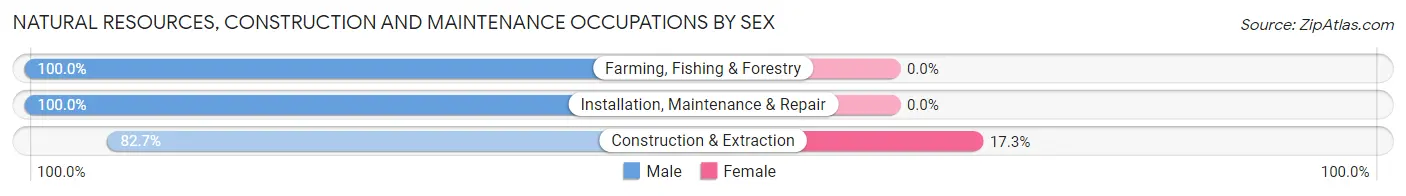
| Occupation | Male | Female |
| Farming, Fishing & Forestry | 4 (100.0%) | 0 (0.0%) |
| Construction & Extraction | 67 (82.7%) | 14 (17.3%) |
| Installation, Maintenance & Repair | 27 (100.0%) | 0 (0.0%) |
| Total (Category) | 98 (87.5%) | 14 (12.5%) |
| Total (Overall) | 351 (48.5%) | 373 (51.5%) |
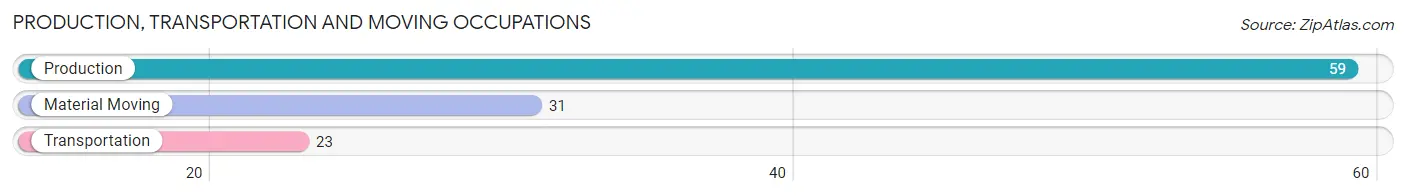
Production, Transportation and Moving Occupations
The most common Production, Transportation and Moving occupations in Dresden are Production (59 | 8.2%), Material Moving (31 | 4.3%), and Transportation (23 | 3.2%).
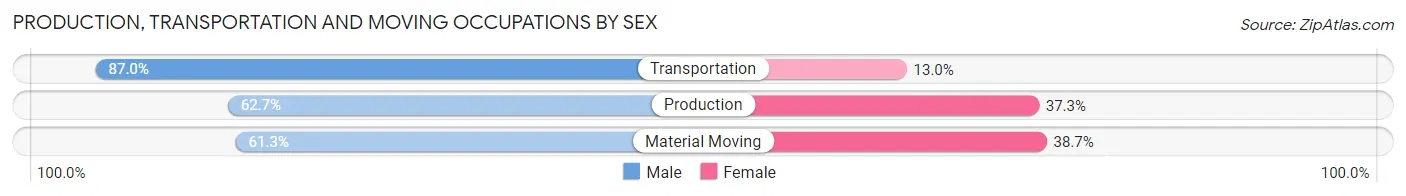
Production, Transportation and Moving Occupations by Sex
| Occupation | Male | Female |
| Production | 37 (62.7%) | 22 (37.3%) |
| Transportation | 20 (87.0%) | 3 (13.0%) |
| Material Moving | 19 (61.3%) | 12 (38.7%) |
| Total (Category) | 76 (67.3%) | 37 (32.7%) |
| Total (Overall) | 351 (48.5%) | 373 (51.5%) |
Employment Industries by Sex in Dresden
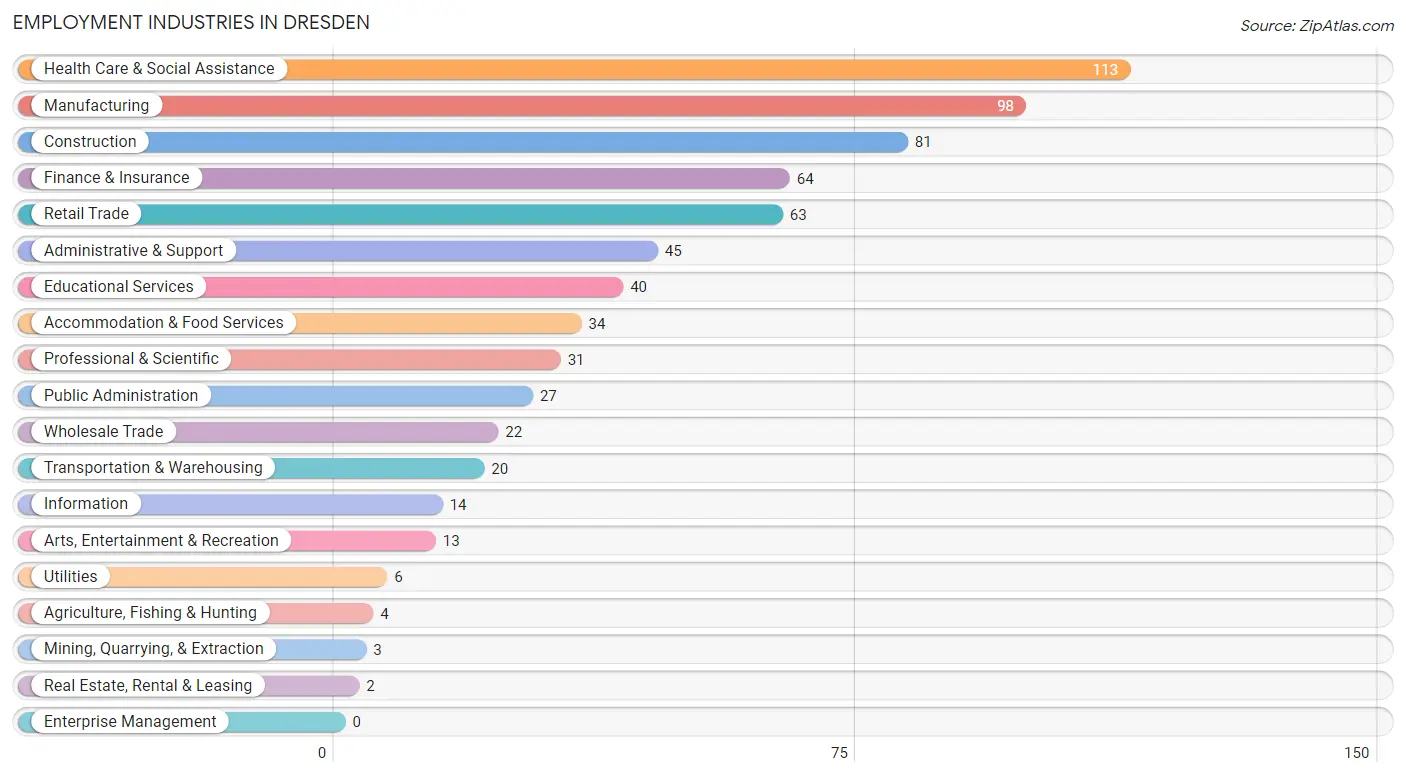
Employment Industries in Dresden
The major employment industries in Dresden include Health Care & Social Assistance (113 | 15.6%), Manufacturing (98 | 13.5%), Construction (81 | 11.2%), Finance & Insurance (64 | 8.8%), and Retail Trade (63 | 8.7%).
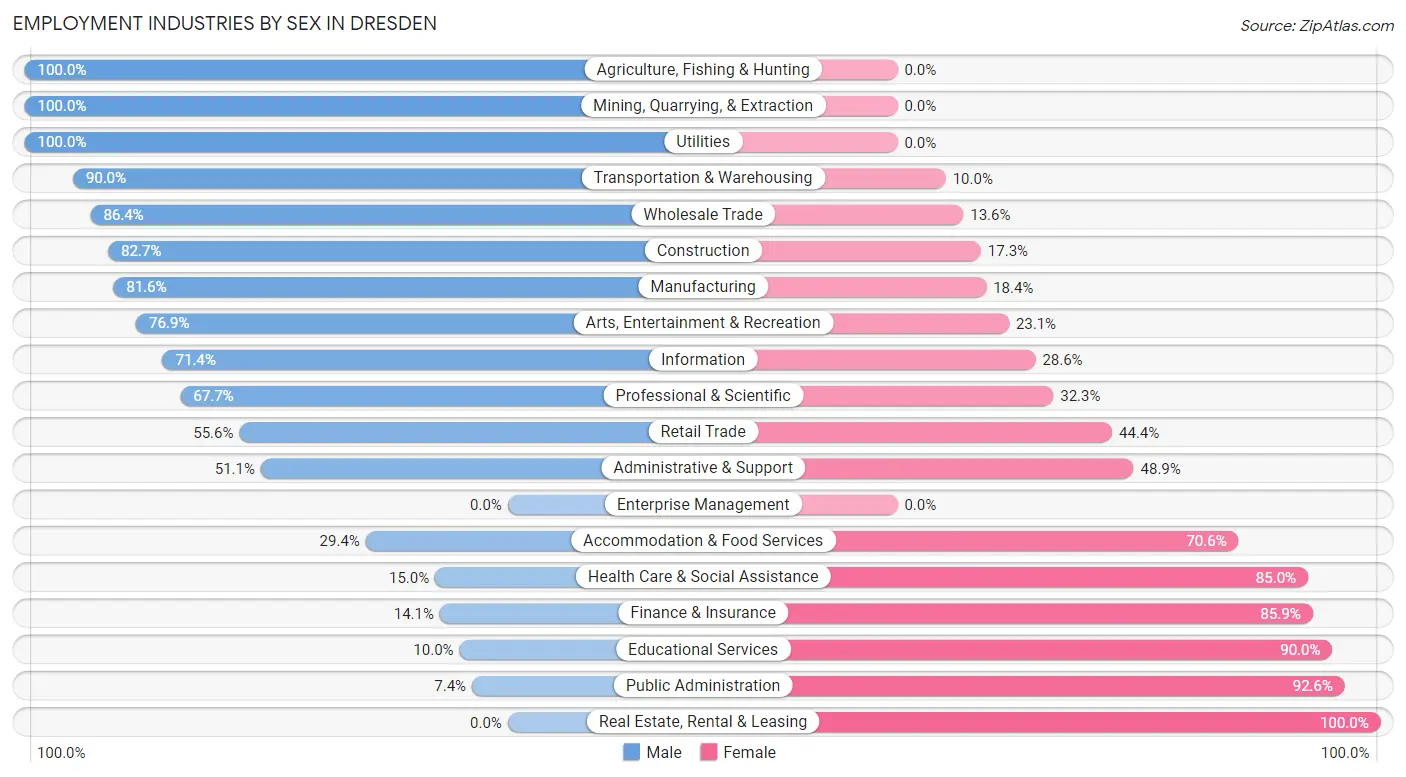
Employment Industries by Sex in Dresden
The Dresden industries that see more men than women are Agriculture, Fishing & Hunting (100.0%), Mining, Quarrying, & Extraction (100.0%), and Utilities (100.0%), whereas the industries that tend to have a higher number of women are Real Estate, Rental & Leasing (100.0%), Public Administration (92.6%), and Educational Services (90.0%).
| Industry | Male | Female |
| Agriculture, Fishing & Hunting | 4 (100.0%) | 0 (0.0%) |
| Mining, Quarrying, & Extraction | 3 (100.0%) | 0 (0.0%) |
| Construction | 67 (82.7%) | 14 (17.3%) |
| Manufacturing | 80 (81.6%) | 18 (18.4%) |
| Wholesale Trade | 19 (86.4%) | 3 (13.6%) |
| Retail Trade | 35 (55.6%) | 28 (44.4%) |
| Transportation & Warehousing | 18 (90.0%) | 2 (10.0%) |
| Utilities | 6 (100.0%) | 0 (0.0%) |
| Information | 10 (71.4%) | 4 (28.6%) |
| Finance & Insurance | 9 (14.1%) | 55 (85.9%) |
| Real Estate, Rental & Leasing | 0 (0.0%) | 2 (100.0%) |
| Professional & Scientific | 21 (67.7%) | 10 (32.3%) |
| Enterprise Management | 0 (0.0%) | 0 (0.0%) |
| Administrative & Support | 23 (51.1%) | 22 (48.9%) |
| Educational Services | 4 (10.0%) | 36 (90.0%) |
| Health Care & Social Assistance | 17 (15.0%) | 96 (85.0%) |
| Arts, Entertainment & Recreation | 10 (76.9%) | 3 (23.1%) |
| Accommodation & Food Services | 10 (29.4%) | 24 (70.6%) |
| Public Administration | 2 (7.4%) | 25 (92.6%) |
| Total | 351 (48.5%) | 373 (51.5%) |
Education in Dresden
School Enrollment in Dresden
The most common levels of schooling among the 393 students in Dresden are middle school (143 | 36.4%), high school (65 | 16.5%), and college / undergraduate (62 | 15.8%).
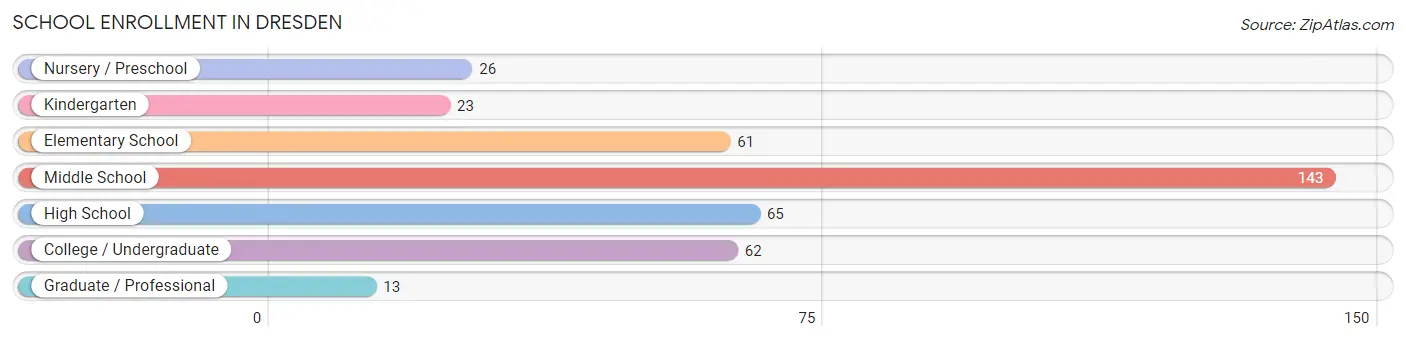
| School Level | # Students | % Students |
| Nursery / Preschool | 26 | 6.6% |
| Kindergarten | 23 | 5.9% |
| Elementary School | 61 | 15.5% |
| Middle School | 143 | 36.4% |
| High School | 65 | 16.5% |
| College / Undergraduate | 62 | 15.8% |
| Graduate / Professional | 13 | 3.3% |
| Total | 393 | 100.0% |
School Enrollment by Age by Funding Source in Dresden
Out of a total of 393 students who are enrolled in schools in Dresden, 28 (7.1%) attend a private institution, while the remaining 365 (92.9%) are enrolled in public schools. The age group of 3 to 4 year olds has the highest likelihood of being enrolled in private schools, with 4 (100.0% in the age bracket) enrolled. Conversely, the age group of 15 to 17 year olds has the lowest likelihood of being enrolled in a private school, with 57 (100.0% in the age bracket) attending a public institution.
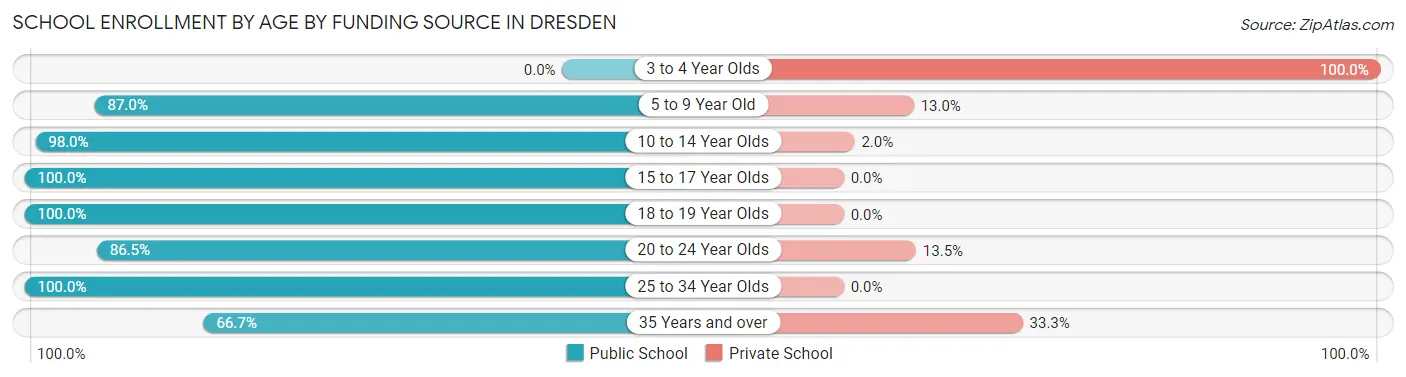
| Age Bracket | Public School | Private School |
| 3 to 4 Year Olds | 0 (0.0%) | 4 (100.0%) |
| 5 to 9 Year Old | 80 (87.0%) | 12 (13.0%) |
| 10 to 14 Year Olds | 146 (98.0%) | 3 (2.0%) |
| 15 to 17 Year Olds | 57 (100.0%) | 0 (0.0%) |
| 18 to 19 Year Olds | 21 (100.0%) | 0 (0.0%) |
| 20 to 24 Year Olds | 45 (86.5%) | 7 (13.5%) |
| 25 to 34 Year Olds | 12 (100.0%) | 0 (0.0%) |
| 35 Years and over | 4 (66.7%) | 2 (33.3%) |
| Total | 365 (92.9%) | 28 (7.1%) |
Educational Attainment by Field of Study in Dresden
Business (49 | 39.2%), education (22 | 17.6%), science & technology (17 | 13.6%), computers & mathematics (16 | 12.8%), and arts & humanities (7 | 5.6%) are the most common fields of study among 125 individuals in Dresden who have obtained a bachelor's degree or higher.
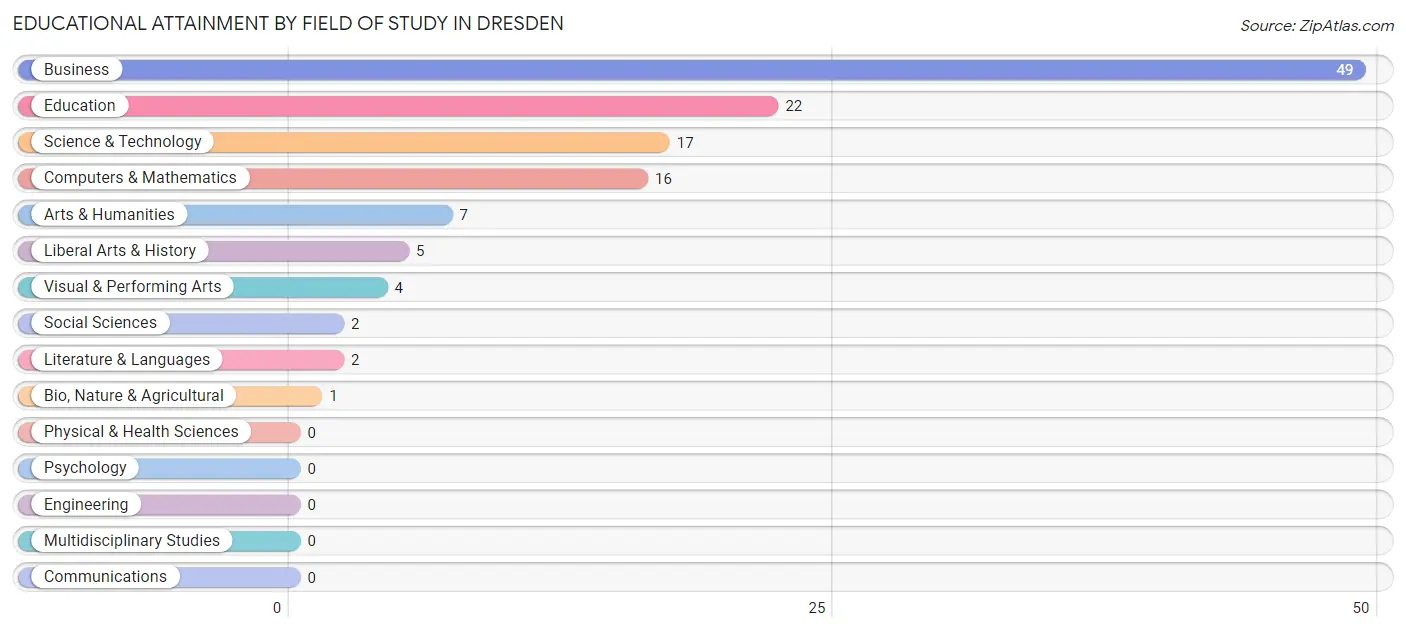
| Field of Study | # Graduates | % Graduates |
| Computers & Mathematics | 16 | 12.8% |
| Bio, Nature & Agricultural | 1 | 0.8% |
| Physical & Health Sciences | 0 | 0.0% |
| Psychology | 0 | 0.0% |
| Social Sciences | 2 | 1.6% |
| Engineering | 0 | 0.0% |
| Multidisciplinary Studies | 0 | 0.0% |
| Science & Technology | 17 | 13.6% |
| Business | 49 | 39.2% |
| Education | 22 | 17.6% |
| Literature & Languages | 2 | 1.6% |
| Liberal Arts & History | 5 | 4.0% |
| Visual & Performing Arts | 4 | 3.2% |
| Communications | 0 | 0.0% |
| Arts & Humanities | 7 | 5.6% |
| Total | 125 | 100.0% |
Transportation & Commute in Dresden
Vehicle Availability by Sex in Dresden
The most prevalent vehicle ownership categories in Dresden are males with 2 vehicles (141, accounting for 39.1%) and females with 2 vehicles (161, making up 37.8%).
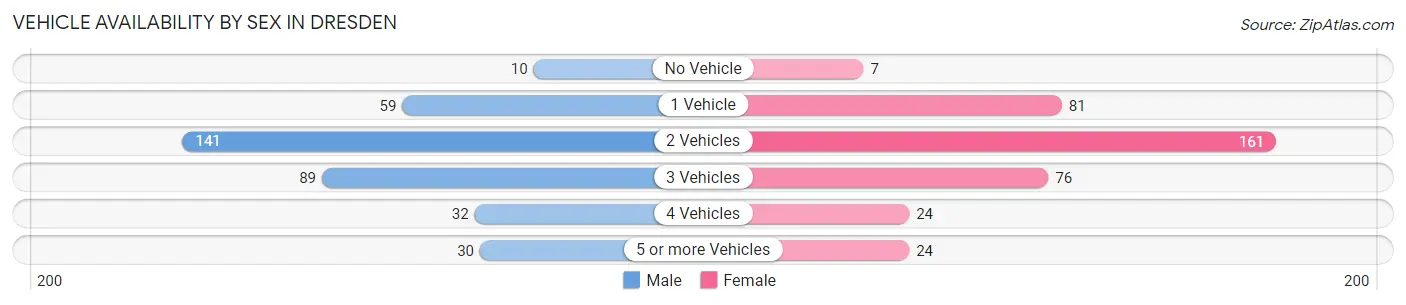
| Vehicles Available | Male | Female |
| No Vehicle | 10 (2.8%) | 7 (1.9%) |
| 1 Vehicle | 59 (16.3%) | 81 (21.7%) |
| 2 Vehicles | 141 (39.1%) | 161 (43.2%) |
| 3 Vehicles | 89 (24.6%) | 76 (20.4%) |
| 4 Vehicles | 32 (8.9%) | 24 (6.4%) |
| 5 or more Vehicles | 30 (8.3%) | 24 (6.4%) |
| Total | 361 (100.0%) | 373 (100.0%) |
Commute Time in Dresden
The most frequently occuring commute durations in Dresden are 20 to 24 minutes (131 commuters, 18.9%), 5 to 9 minutes (89 commuters, 12.8%), and 15 to 19 minutes (74 commuters, 10.6%).
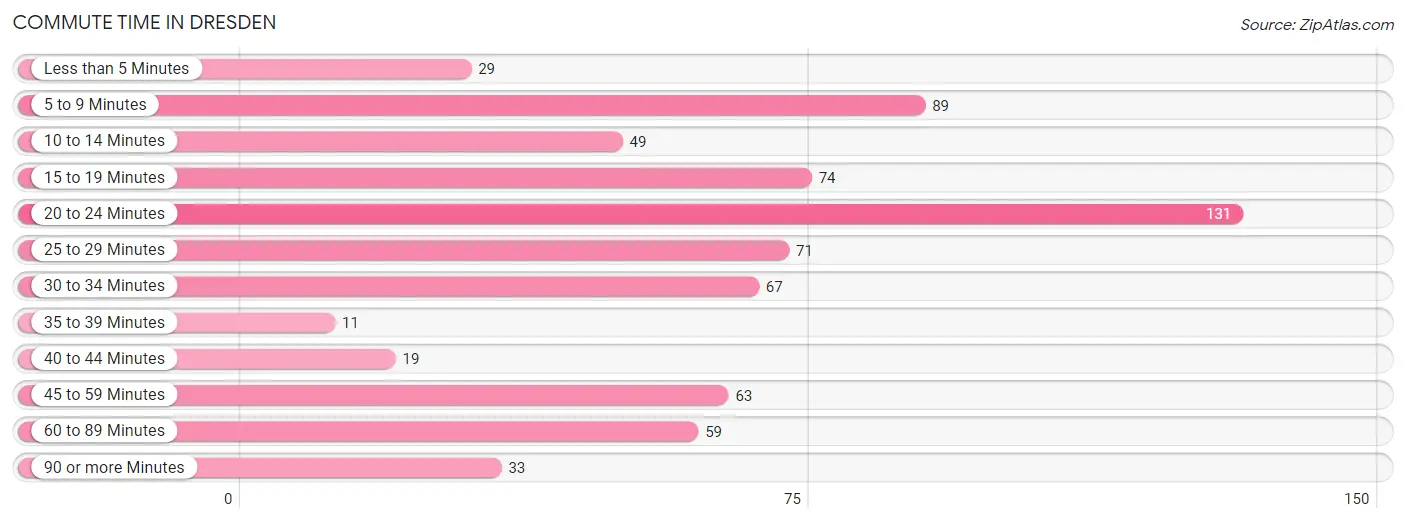
| Commute Time | # Commuters | % Commuters |
| Less than 5 Minutes | 29 | 4.2% |
| 5 to 9 Minutes | 89 | 12.8% |
| 10 to 14 Minutes | 49 | 7.0% |
| 15 to 19 Minutes | 74 | 10.6% |
| 20 to 24 Minutes | 131 | 18.9% |
| 25 to 29 Minutes | 71 | 10.2% |
| 30 to 34 Minutes | 67 | 9.6% |
| 35 to 39 Minutes | 11 | 1.6% |
| 40 to 44 Minutes | 19 | 2.7% |
| 45 to 59 Minutes | 63 | 9.1% |
| 60 to 89 Minutes | 59 | 8.5% |
| 90 or more Minutes | 33 | 4.8% |
Commute Time by Sex in Dresden
The most common commute times in Dresden are 20 to 24 minutes (52 commuters, 15.1%) for males and 20 to 24 minutes (79 commuters, 22.6%) for females.
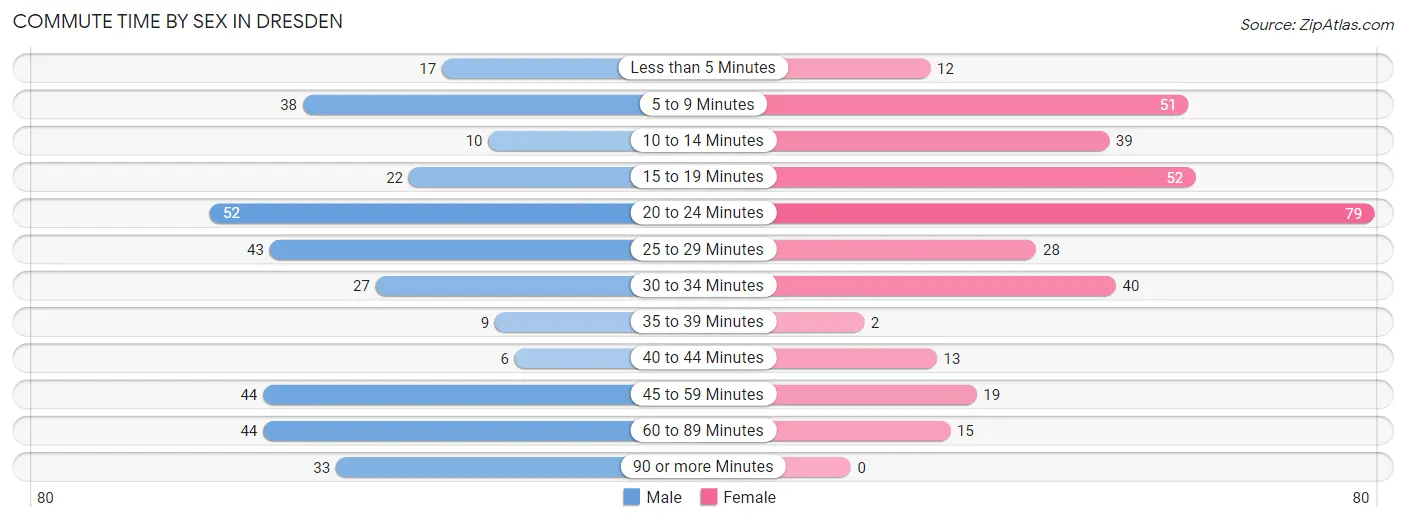
| Commute Time | Male | Female |
| Less than 5 Minutes | 17 (4.9%) | 12 (3.4%) |
| 5 to 9 Minutes | 38 (11.0%) | 51 (14.6%) |
| 10 to 14 Minutes | 10 (2.9%) | 39 (11.1%) |
| 15 to 19 Minutes | 22 (6.4%) | 52 (14.9%) |
| 20 to 24 Minutes | 52 (15.1%) | 79 (22.6%) |
| 25 to 29 Minutes | 43 (12.5%) | 28 (8.0%) |
| 30 to 34 Minutes | 27 (7.8%) | 40 (11.4%) |
| 35 to 39 Minutes | 9 (2.6%) | 2 (0.6%) |
| 40 to 44 Minutes | 6 (1.7%) | 13 (3.7%) |
| 45 to 59 Minutes | 44 (12.8%) | 19 (5.4%) |
| 60 to 89 Minutes | 44 (12.8%) | 15 (4.3%) |
| 90 or more Minutes | 33 (9.6%) | 0 (0.0%) |
Time of Departure to Work by Sex in Dresden
The most frequent times of departure to work in Dresden are 12:00 AM to 4:59 AM (56, 16.2%) for males and 8:00 AM to 8:29 AM (65, 18.6%) for females.
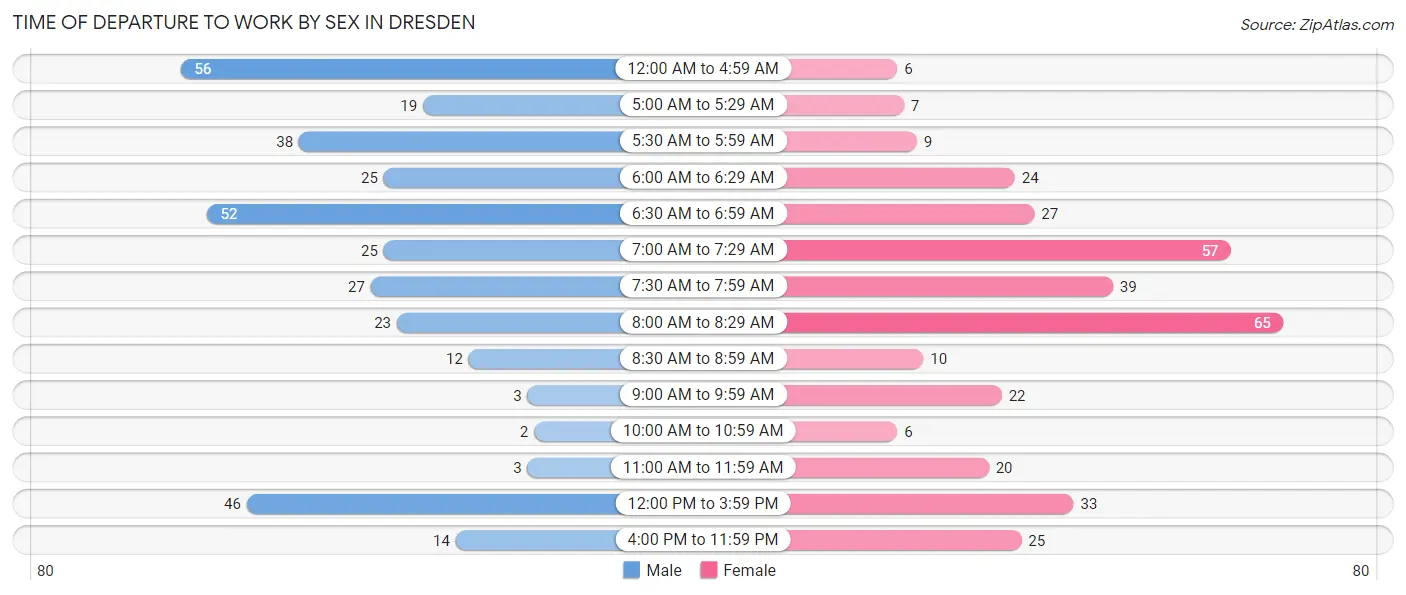
| Time of Departure | Male | Female |
| 12:00 AM to 4:59 AM | 56 (16.2%) | 6 (1.7%) |
| 5:00 AM to 5:29 AM | 19 (5.5%) | 7 (2.0%) |
| 5:30 AM to 5:59 AM | 38 (11.0%) | 9 (2.6%) |
| 6:00 AM to 6:29 AM | 25 (7.2%) | 24 (6.9%) |
| 6:30 AM to 6:59 AM | 52 (15.1%) | 27 (7.7%) |
| 7:00 AM to 7:29 AM | 25 (7.2%) | 57 (16.3%) |
| 7:30 AM to 7:59 AM | 27 (7.8%) | 39 (11.1%) |
| 8:00 AM to 8:29 AM | 23 (6.7%) | 65 (18.6%) |
| 8:30 AM to 8:59 AM | 12 (3.5%) | 10 (2.9%) |
| 9:00 AM to 9:59 AM | 3 (0.9%) | 22 (6.3%) |
| 10:00 AM to 10:59 AM | 2 (0.6%) | 6 (1.7%) |
| 11:00 AM to 11:59 AM | 3 (0.9%) | 20 (5.7%) |
| 12:00 PM to 3:59 PM | 46 (13.3%) | 33 (9.4%) |
| 4:00 PM to 11:59 PM | 14 (4.1%) | 25 (7.1%) |
| Total | 345 (100.0%) | 350 (100.0%) |
Housing Occupancy in Dresden
Occupancy by Ownership in Dresden
Of the total 693 dwellings in Dresden, owner-occupied units account for 445 (64.2%), while renter-occupied units make up 248 (35.8%).
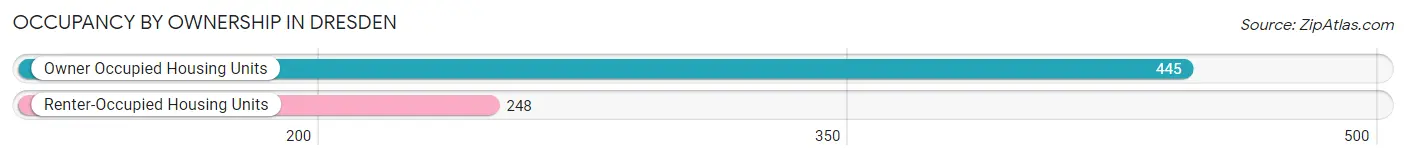
| Occupancy | # Housing Units | % Housing Units |
| Owner Occupied Housing Units | 445 | 64.2% |
| Renter-Occupied Housing Units | 248 | 35.8% |
| Total Occupied Housing Units | 693 | 100.0% |
Occupancy by Household Size in Dresden
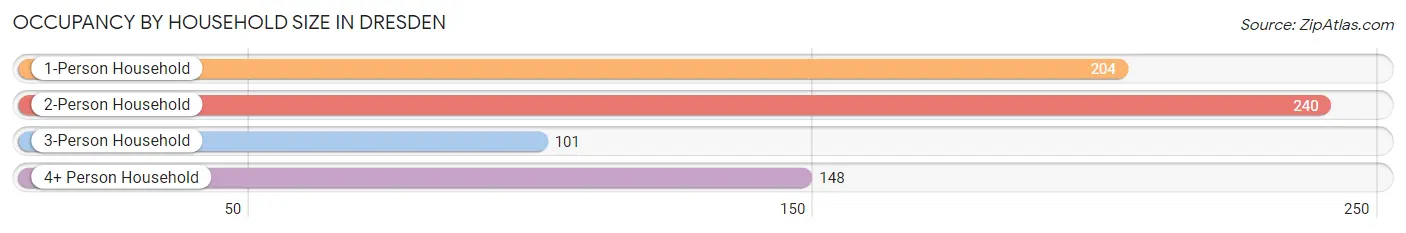
| Household Size | # Housing Units | % Housing Units |
| 1-Person Household | 204 | 29.4% |
| 2-Person Household | 240 | 34.6% |
| 3-Person Household | 101 | 14.6% |
| 4+ Person Household | 148 | 21.4% |
| Total Housing Units | 693 | 100.0% |
Occupancy by Ownership by Household Size in Dresden
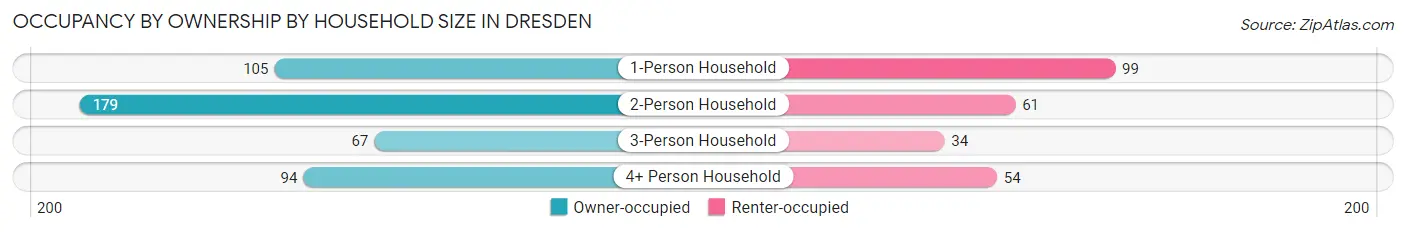
| Household Size | Owner-occupied | Renter-occupied |
| 1-Person Household | 105 (51.5%) | 99 (48.5%) |
| 2-Person Household | 179 (74.6%) | 61 (25.4%) |
| 3-Person Household | 67 (66.3%) | 34 (33.7%) |
| 4+ Person Household | 94 (63.5%) | 54 (36.5%) |
| Total Housing Units | 445 (64.2%) | 248 (35.8%) |
Occupancy by Educational Attainment in Dresden
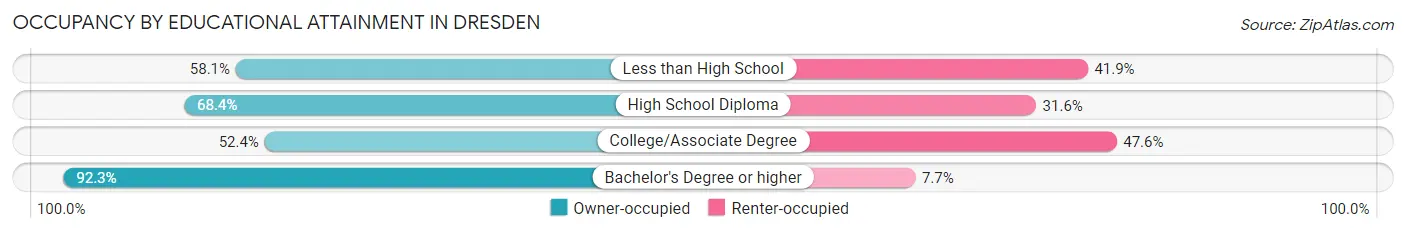
| Household Size | Owner-occupied | Renter-occupied |
| Less than High School | 43 (58.1%) | 31 (41.9%) |
| High School Diploma | 199 (68.4%) | 92 (31.6%) |
| College/Associate Degree | 131 (52.4%) | 119 (47.6%) |
| Bachelor's Degree or higher | 72 (92.3%) | 6 (7.7%) |
Occupancy by Age of Householder in Dresden
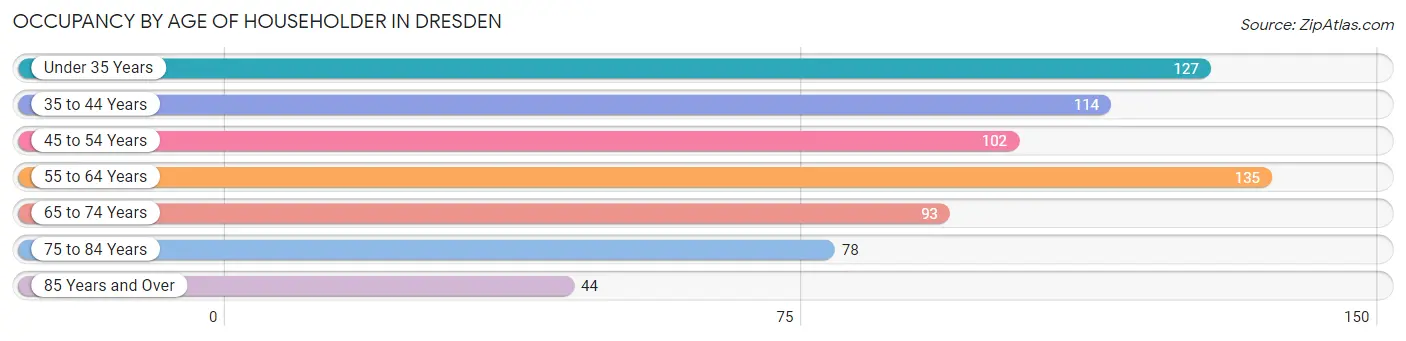
| Age Bracket | # Households | % Households |
| Under 35 Years | 127 | 18.3% |
| 35 to 44 Years | 114 | 16.5% |
| 45 to 54 Years | 102 | 14.7% |
| 55 to 64 Years | 135 | 19.5% |
| 65 to 74 Years | 93 | 13.4% |
| 75 to 84 Years | 78 | 11.3% |
| 85 Years and Over | 44 | 6.4% |
| Total | 693 | 100.0% |
Housing Finances in Dresden
Median Income by Occupancy in Dresden
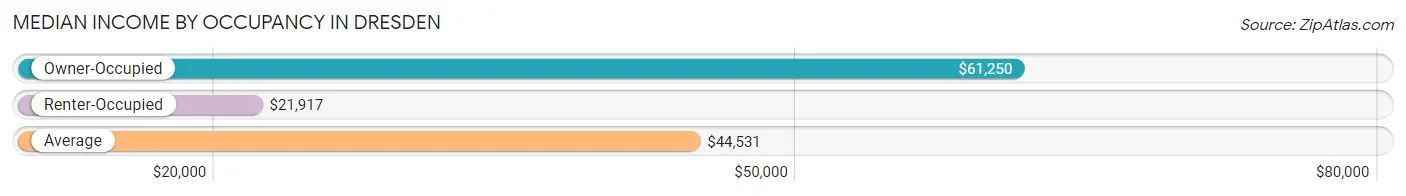
| Occupancy Type | # Households | Median Income |
| Owner-Occupied | 445 (64.2%) | $61,250 |
| Renter-Occupied | 248 (35.8%) | $21,917 |
| Average | 693 (100.0%) | $44,531 |
Occupancy by Householder Income Bracket in Dresden
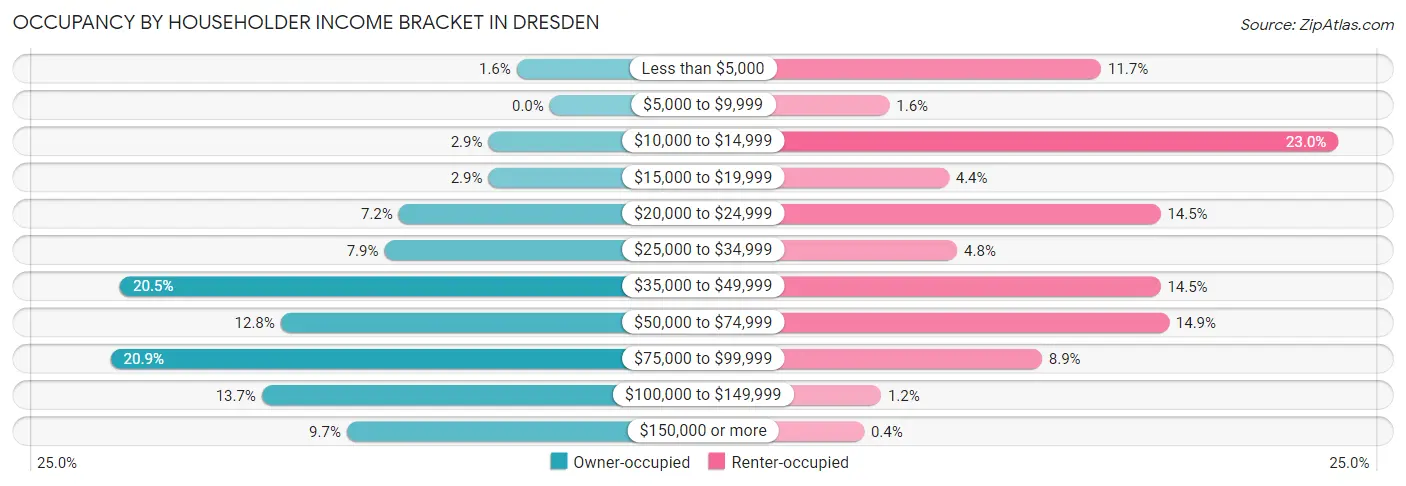
| Income Bracket | Owner-occupied | Renter-occupied |
| Less than $5,000 | 7 (1.6%) | 29 (11.7%) |
| $5,000 to $9,999 | 0 (0.0%) | 4 (1.6%) |
| $10,000 to $14,999 | 13 (2.9%) | 57 (23.0%) |
| $15,000 to $19,999 | 13 (2.9%) | 11 (4.4%) |
| $20,000 to $24,999 | 32 (7.2%) | 36 (14.5%) |
| $25,000 to $34,999 | 35 (7.9%) | 12 (4.8%) |
| $35,000 to $49,999 | 91 (20.4%) | 36 (14.5%) |
| $50,000 to $74,999 | 57 (12.8%) | 37 (14.9%) |
| $75,000 to $99,999 | 93 (20.9%) | 22 (8.9%) |
| $100,000 to $149,999 | 61 (13.7%) | 3 (1.2%) |
| $150,000 or more | 43 (9.7%) | 1 (0.4%) |
| Total | 445 (100.0%) | 248 (100.0%) |
Monthly Housing Cost Tiers in Dresden
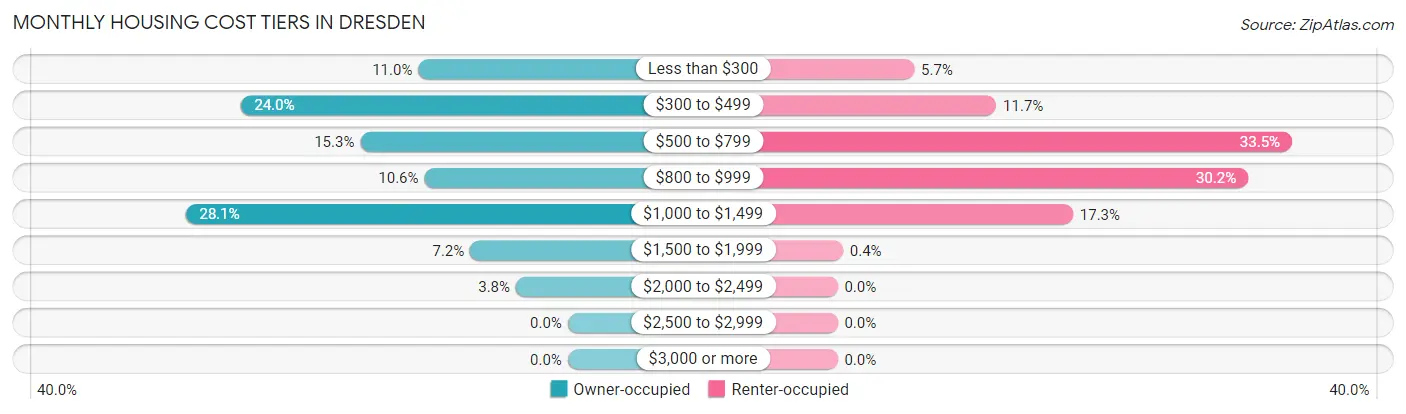
| Monthly Cost | Owner-occupied | Renter-occupied |
| Less than $300 | 49 (11.0%) | 14 (5.7%) |
| $300 to $499 | 107 (24.0%) | 29 (11.7%) |
| $500 to $799 | 68 (15.3%) | 83 (33.5%) |
| $800 to $999 | 47 (10.6%) | 75 (30.2%) |
| $1,000 to $1,499 | 125 (28.1%) | 43 (17.3%) |
| $1,500 to $1,999 | 32 (7.2%) | 1 (0.4%) |
| $2,000 to $2,499 | 17 (3.8%) | 0 (0.0%) |
| $2,500 to $2,999 | 0 (0.0%) | 0 (0.0%) |
| $3,000 or more | 0 (0.0%) | 0 (0.0%) |
| Total | 445 (100.0%) | 248 (100.0%) |
Physical Housing Characteristics in Dresden
Housing Structures in Dresden
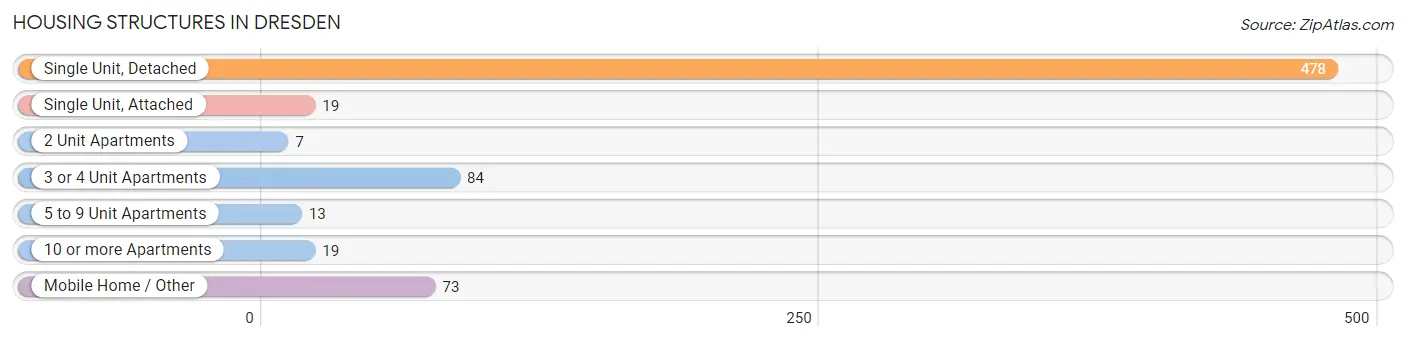
| Structure Type | # Housing Units | % Housing Units |
| Single Unit, Detached | 478 | 69.0% |
| Single Unit, Attached | 19 | 2.7% |
| 2 Unit Apartments | 7 | 1.0% |
| 3 or 4 Unit Apartments | 84 | 12.1% |
| 5 to 9 Unit Apartments | 13 | 1.9% |
| 10 or more Apartments | 19 | 2.7% |
| Mobile Home / Other | 73 | 10.5% |
| Total | 693 | 100.0% |
Housing Structures by Occupancy in Dresden
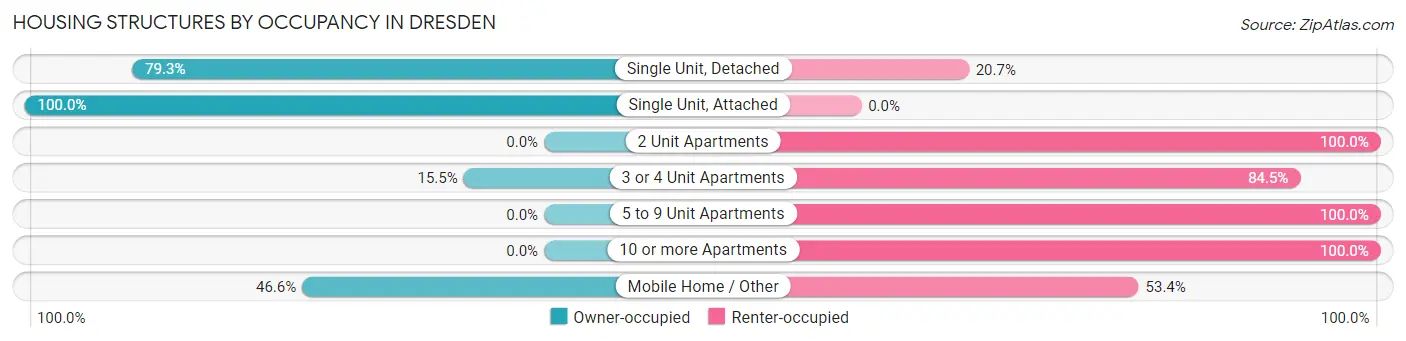
| Structure Type | Owner-occupied | Renter-occupied |
| Single Unit, Detached | 379 (79.3%) | 99 (20.7%) |
| Single Unit, Attached | 19 (100.0%) | 0 (0.0%) |
| 2 Unit Apartments | 0 (0.0%) | 7 (100.0%) |
| 3 or 4 Unit Apartments | 13 (15.5%) | 71 (84.5%) |
| 5 to 9 Unit Apartments | 0 (0.0%) | 13 (100.0%) |
| 10 or more Apartments | 0 (0.0%) | 19 (100.0%) |
| Mobile Home / Other | 34 (46.6%) | 39 (53.4%) |
| Total | 445 (64.2%) | 248 (35.8%) |
Housing Structures by Number of Rooms in Dresden
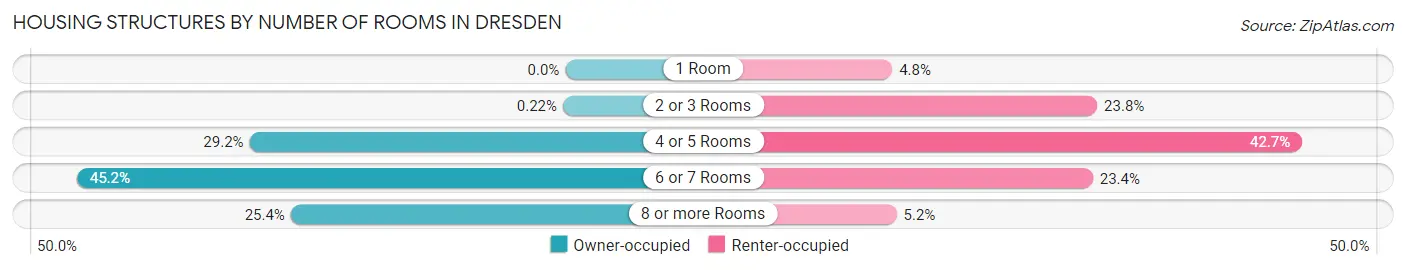
| Number of Rooms | Owner-occupied | Renter-occupied |
| 1 Room | 0 (0.0%) | 12 (4.8%) |
| 2 or 3 Rooms | 1 (0.2%) | 59 (23.8%) |
| 4 or 5 Rooms | 130 (29.2%) | 106 (42.7%) |
| 6 or 7 Rooms | 201 (45.2%) | 58 (23.4%) |
| 8 or more Rooms | 113 (25.4%) | 13 (5.2%) |
| Total | 445 (100.0%) | 248 (100.0%) |
Housing Structure by Heating Type in Dresden
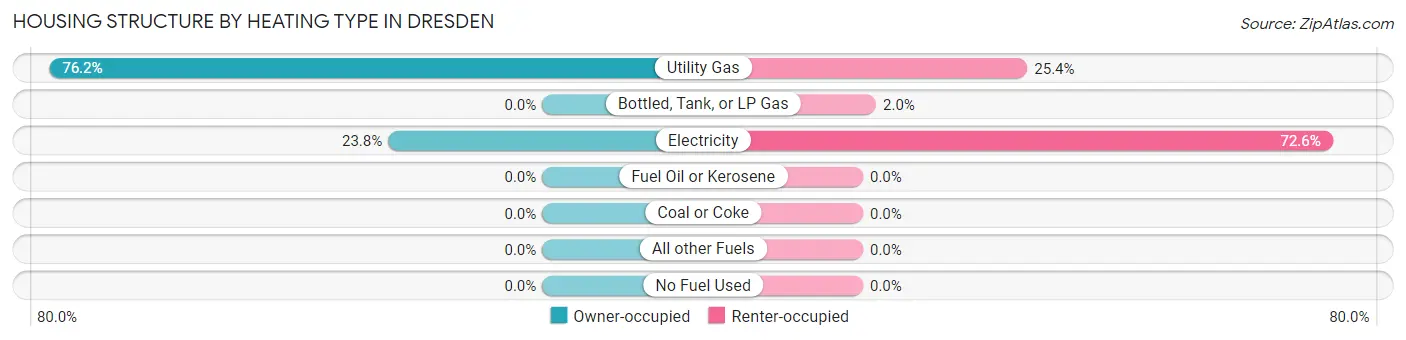
| Heating Type | Owner-occupied | Renter-occupied |
| Utility Gas | 339 (76.2%) | 63 (25.4%) |
| Bottled, Tank, or LP Gas | 0 (0.0%) | 5 (2.0%) |
| Electricity | 106 (23.8%) | 180 (72.6%) |
| Fuel Oil or Kerosene | 0 (0.0%) | 0 (0.0%) |
| Coal or Coke | 0 (0.0%) | 0 (0.0%) |
| All other Fuels | 0 (0.0%) | 0 (0.0%) |
| No Fuel Used | 0 (0.0%) | 0 (0.0%) |
| Total | 445 (100.0%) | 248 (100.0%) |
Household Vehicle Usage in Dresden
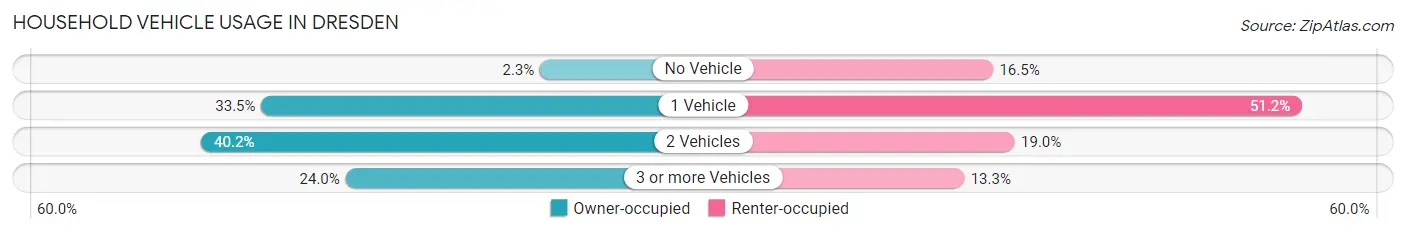
| Vehicles per Household | Owner-occupied | Renter-occupied |
| No Vehicle | 10 (2.2%) | 41 (16.5%) |
| 1 Vehicle | 149 (33.5%) | 127 (51.2%) |
| 2 Vehicles | 179 (40.2%) | 47 (19.0%) |
| 3 or more Vehicles | 107 (24.0%) | 33 (13.3%) |
| Total | 445 (100.0%) | 248 (100.0%) |
Real Estate & Mortgages in Dresden
Real Estate and Mortgage Overview in Dresden
| Characteristic | Without Mortgage | With Mortgage |
| Housing Units | 184 | 261 |
| Median Property Value | $102,500 | $132,900 |
| Median Household Income | $44,125 | $41 |
| Monthly Housing Costs | $398 | $0 |
| Real Estate Taxes | $1,133 | $8 |
Property Value by Mortgage Status in Dresden
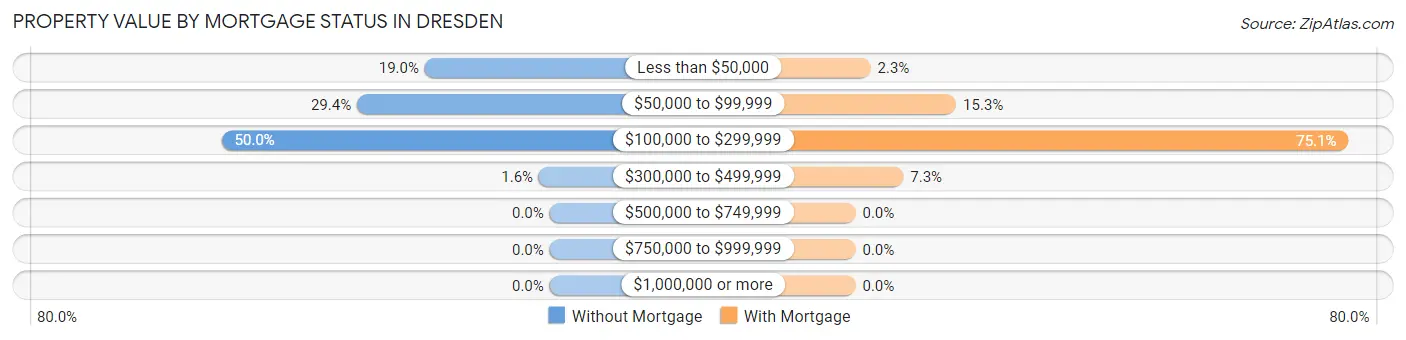
| Property Value | Without Mortgage | With Mortgage |
| Less than $50,000 | 35 (19.0%) | 6 (2.3%) |
| $50,000 to $99,999 | 54 (29.3%) | 40 (15.3%) |
| $100,000 to $299,999 | 92 (50.0%) | 196 (75.1%) |
| $300,000 to $499,999 | 3 (1.6%) | 19 (7.3%) |
| $500,000 to $749,999 | 0 (0.0%) | 0 (0.0%) |
| $750,000 to $999,999 | 0 (0.0%) | 0 (0.0%) |
| $1,000,000 or more | 0 (0.0%) | 0 (0.0%) |
| Total | 184 (100.0%) | 261 (100.0%) |
Household Income by Mortgage Status in Dresden
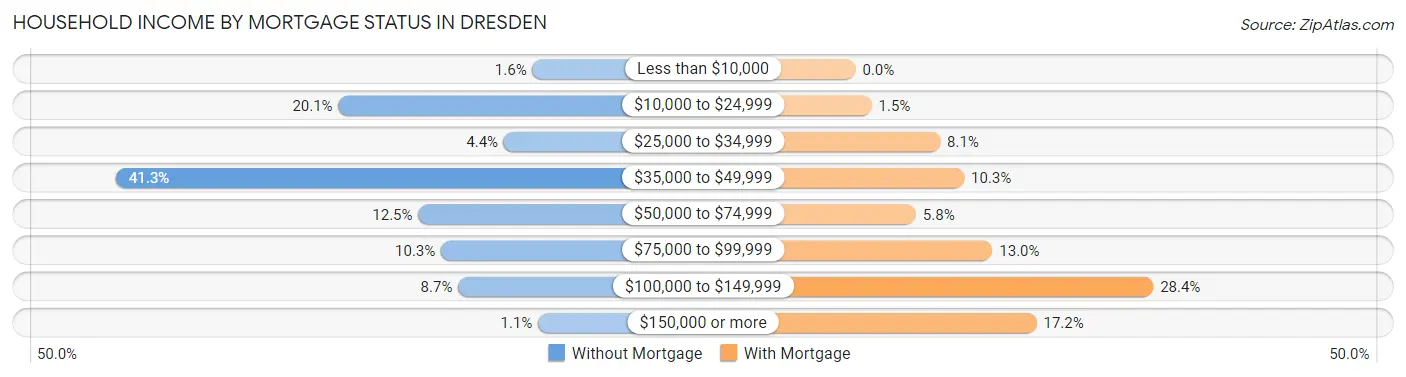
| Household Income | Without Mortgage | With Mortgage |
| Less than $10,000 | 3 (1.6%) | 0 (0.0%) |
| $10,000 to $24,999 | 37 (20.1%) | 4 (1.5%) |
| $25,000 to $34,999 | 8 (4.3%) | 21 (8.1%) |
| $35,000 to $49,999 | 76 (41.3%) | 27 (10.3%) |
| $50,000 to $74,999 | 23 (12.5%) | 15 (5.8%) |
| $75,000 to $99,999 | 19 (10.3%) | 34 (13.0%) |
| $100,000 to $149,999 | 16 (8.7%) | 74 (28.3%) |
| $150,000 or more | 2 (1.1%) | 45 (17.2%) |
| Total | 184 (100.0%) | 261 (100.0%) |
Property Value to Household Income Ratio in Dresden
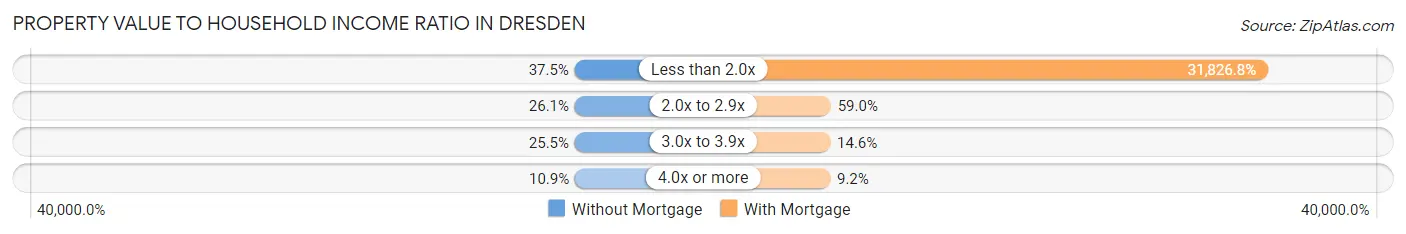
| Value-to-Income Ratio | Without Mortgage | With Mortgage |
| Less than 2.0x | 69 (37.5%) | 83,068 (31,826.8%) |
| 2.0x to 2.9x | 48 (26.1%) | 154 (59.0%) |
| 3.0x to 3.9x | 47 (25.5%) | 38 (14.6%) |
| 4.0x or more | 20 (10.9%) | 24 (9.2%) |
| Total | 184 (100.0%) | 261 (100.0%) |
Real Estate Taxes by Mortgage Status in Dresden
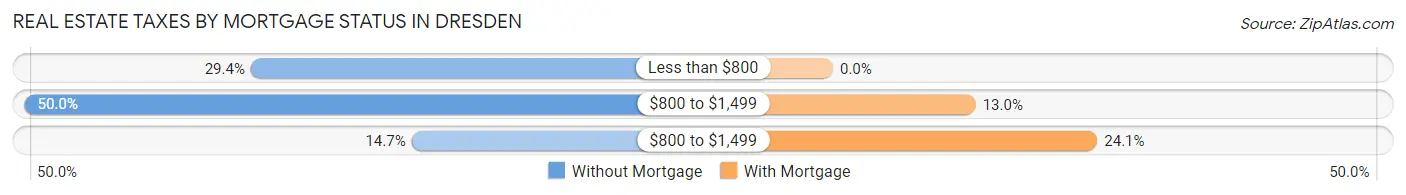
| Property Taxes | Without Mortgage | With Mortgage |
| Less than $800 | 54 (29.3%) | 0 (0.0%) |
| $800 to $1,499 | 92 (50.0%) | 34 (13.0%) |
| $800 to $1,499 | 27 (14.7%) | 63 (24.1%) |
| Total | 184 (100.0%) | 261 (100.0%) |
Health & Disability in Dresden
Health Insurance Coverage by Age in Dresden
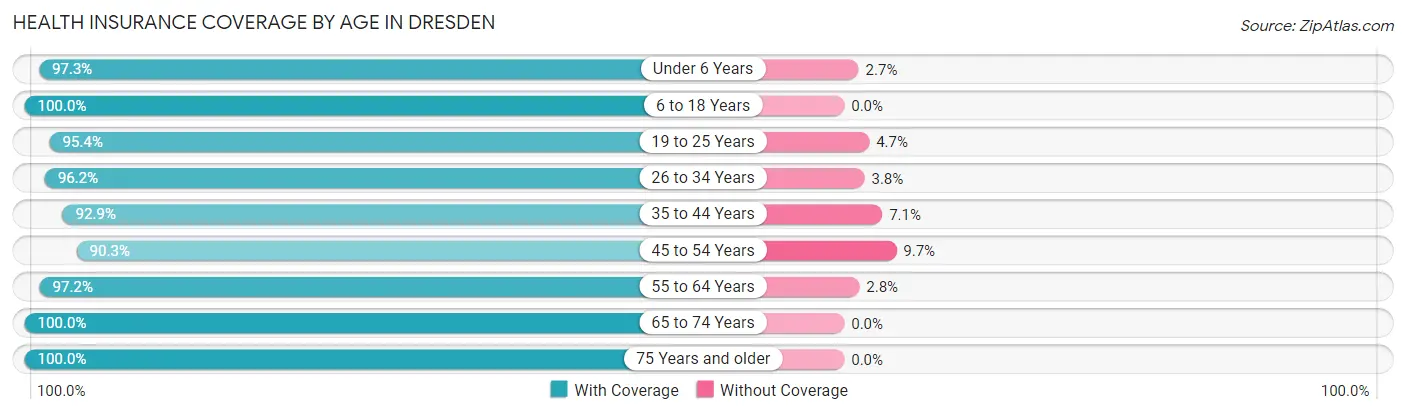
| Age Bracket | With Coverage | Without Coverage |
| Under 6 Years | 109 (97.3%) | 3 (2.7%) |
| 6 to 18 Years | 295 (100.0%) | 0 (0.0%) |
| 19 to 25 Years | 123 (95.4%) | 6 (4.6%) |
| 26 to 34 Years | 178 (96.2%) | 7 (3.8%) |
| 35 to 44 Years | 197 (92.9%) | 15 (7.1%) |
| 45 to 54 Years | 158 (90.3%) | 17 (9.7%) |
| 55 to 64 Years | 242 (97.2%) | 7 (2.8%) |
| 65 to 74 Years | 170 (100.0%) | 0 (0.0%) |
| 75 Years and older | 169 (100.0%) | 0 (0.0%) |
| Total | 1,641 (96.8%) | 55 (3.2%) |
Health Insurance Coverage by Citizenship Status in Dresden
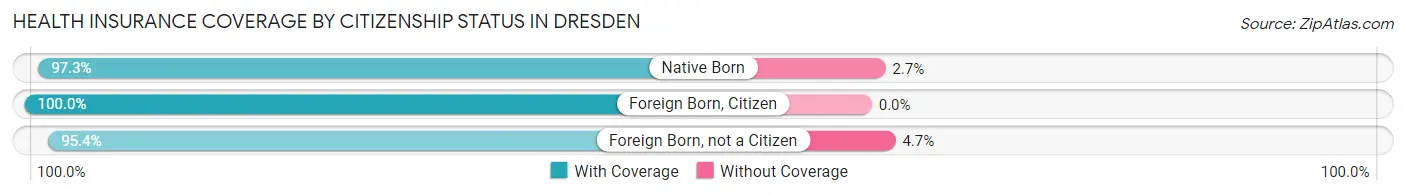
| Citizenship Status | With Coverage | Without Coverage |
| Native Born | 109 (97.3%) | 3 (2.7%) |
| Foreign Born, Citizen | 295 (100.0%) | 0 (0.0%) |
| Foreign Born, not a Citizen | 123 (95.4%) | 6 (4.6%) |
Health Insurance Coverage by Household Income in Dresden
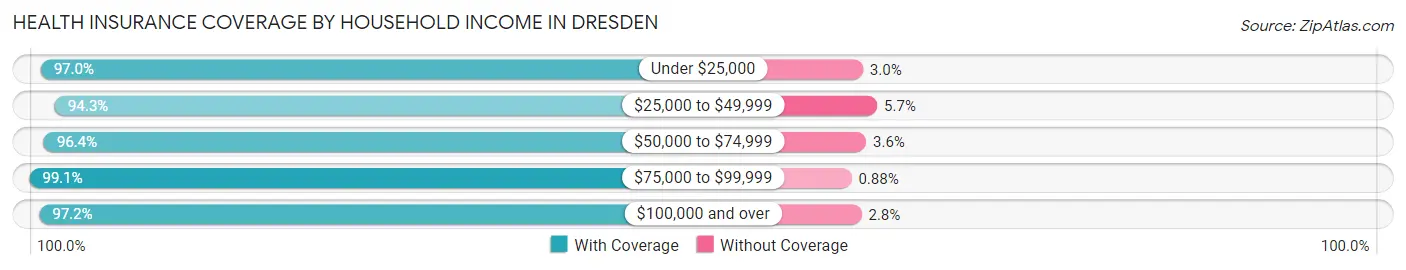
| Household Income | With Coverage | Without Coverage |
| Under $25,000 | 257 (97.0%) | 8 (3.0%) |
| $25,000 to $49,999 | 381 (94.3%) | 23 (5.7%) |
| $50,000 to $74,999 | 240 (96.4%) | 9 (3.6%) |
| $75,000 to $99,999 | 336 (99.1%) | 3 (0.9%) |
| $100,000 and over | 423 (97.2%) | 12 (2.8%) |
Public vs Private Health Insurance Coverage by Age in Dresden
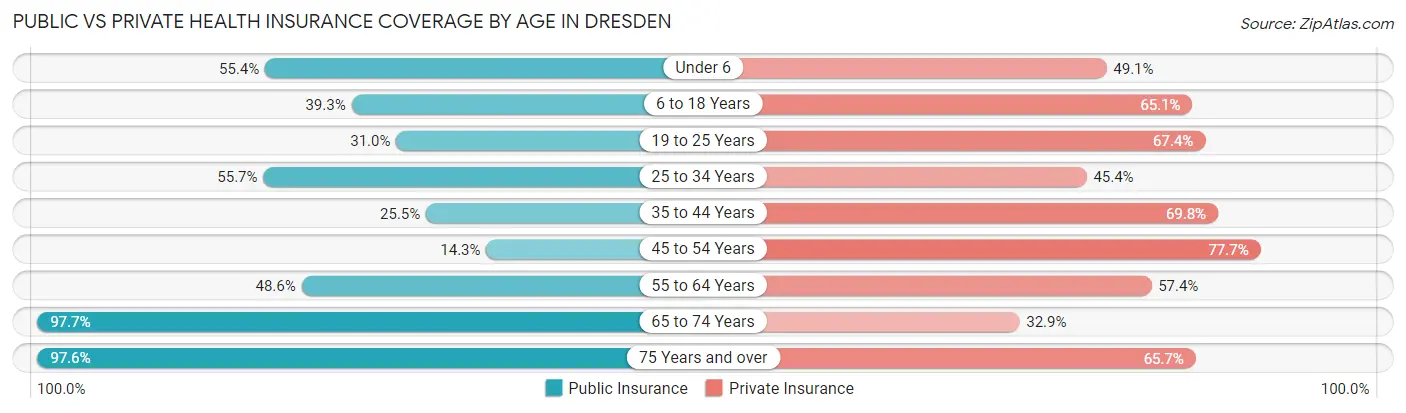
| Age Bracket | Public Insurance | Private Insurance |
| Under 6 | 62 (55.4%) | 55 (49.1%) |
| 6 to 18 Years | 116 (39.3%) | 192 (65.1%) |
| 19 to 25 Years | 40 (31.0%) | 87 (67.4%) |
| 25 to 34 Years | 103 (55.7%) | 84 (45.4%) |
| 35 to 44 Years | 54 (25.5%) | 148 (69.8%) |
| 45 to 54 Years | 25 (14.3%) | 136 (77.7%) |
| 55 to 64 Years | 121 (48.6%) | 143 (57.4%) |
| 65 to 74 Years | 166 (97.7%) | 56 (32.9%) |
| 75 Years and over | 165 (97.6%) | 111 (65.7%) |
| Total | 852 (50.2%) | 1,012 (59.7%) |
Disability Status by Sex by Age in Dresden
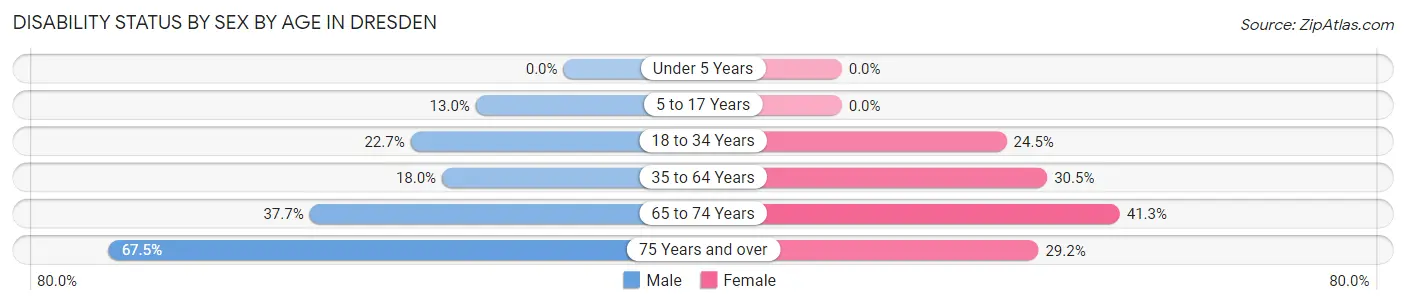
| Age Bracket | Male | Female |
| Under 5 Years | 0 (0.0%) | 0 (0.0%) |
| 5 to 17 Years | 22 (13.0%) | 0 (0.0%) |
| 18 to 34 Years | 32 (22.7%) | 47 (24.5%) |
| 35 to 64 Years | 55 (18.0%) | 101 (30.5%) |
| 65 to 74 Years | 23 (37.7%) | 45 (41.3%) |
| 75 Years and over | 54 (67.5%) | 26 (29.2%) |
Disability Class by Sex by Age in Dresden
Disability Class: Hearing Difficulty
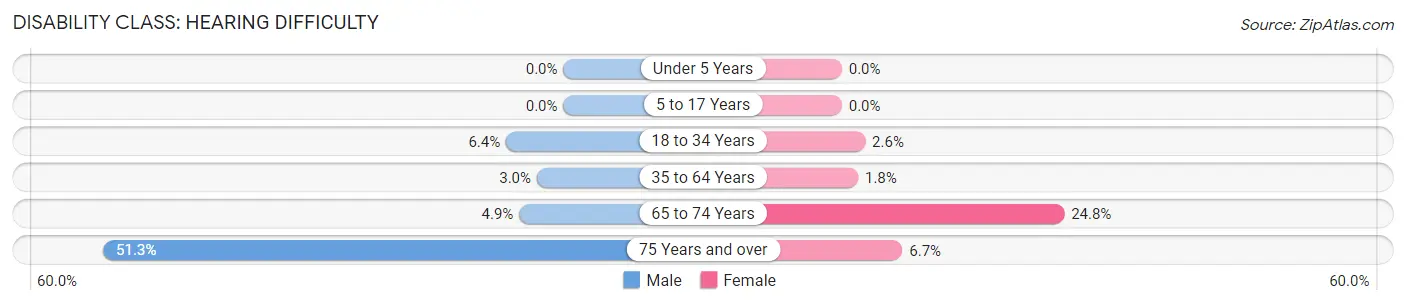
| Age Bracket | Male | Female |
| Under 5 Years | 0 (0.0%) | 0 (0.0%) |
| 5 to 17 Years | 0 (0.0%) | 0 (0.0%) |
| 18 to 34 Years | 9 (6.4%) | 5 (2.6%) |
| 35 to 64 Years | 9 (2.9%) | 6 (1.8%) |
| 65 to 74 Years | 3 (4.9%) | 27 (24.8%) |
| 75 Years and over | 41 (51.2%) | 6 (6.7%) |
Disability Class: Vision Difficulty
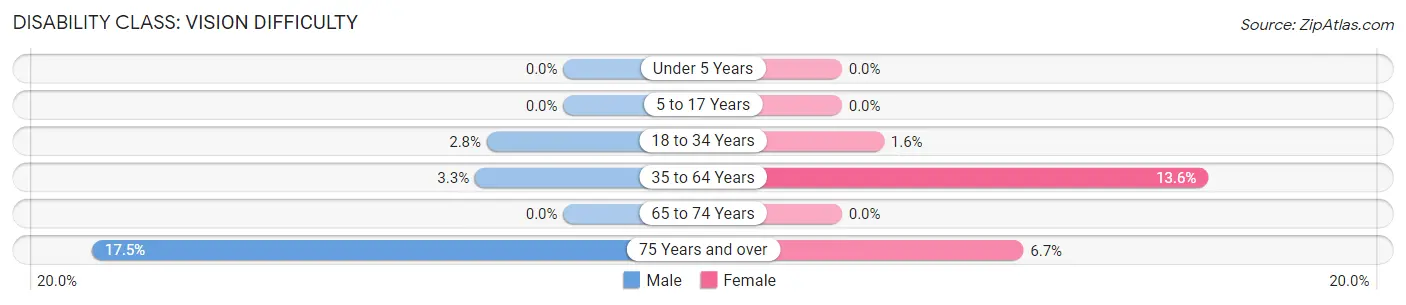
| Age Bracket | Male | Female |
| Under 5 Years | 0 (0.0%) | 0 (0.0%) |
| 5 to 17 Years | 0 (0.0%) | 0 (0.0%) |
| 18 to 34 Years | 4 (2.8%) | 3 (1.6%) |
| 35 to 64 Years | 10 (3.3%) | 45 (13.6%) |
| 65 to 74 Years | 0 (0.0%) | 0 (0.0%) |
| 75 Years and over | 14 (17.5%) | 6 (6.7%) |
Disability Class: Cognitive Difficulty
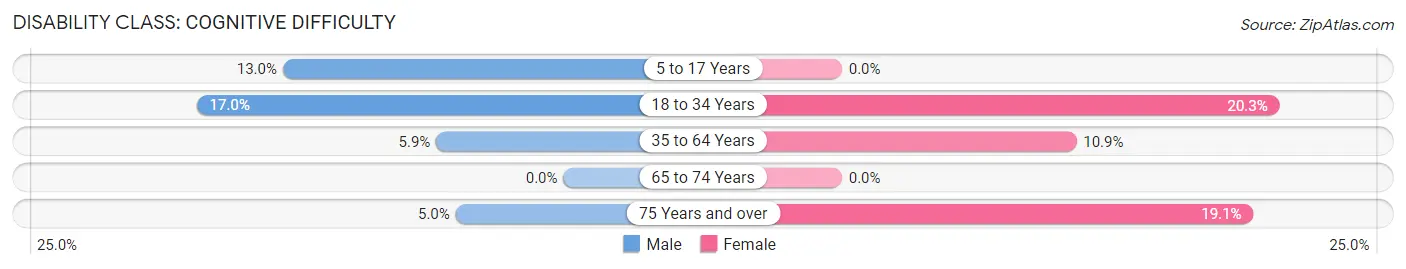
| Age Bracket | Male | Female |
| 5 to 17 Years | 22 (13.0%) | 0 (0.0%) |
| 18 to 34 Years | 24 (17.0%) | 39 (20.3%) |
| 35 to 64 Years | 18 (5.9%) | 36 (10.9%) |
| 65 to 74 Years | 0 (0.0%) | 0 (0.0%) |
| 75 Years and over | 4 (5.0%) | 17 (19.1%) |
Disability Class: Ambulatory Difficulty
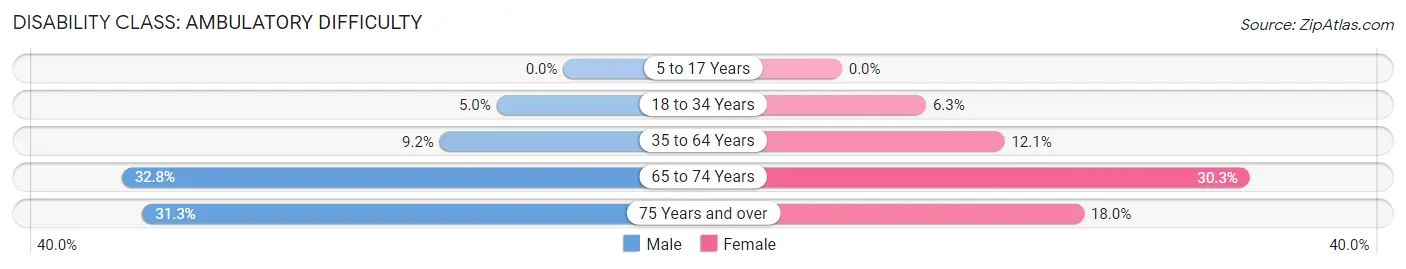
| Age Bracket | Male | Female |
| 5 to 17 Years | 0 (0.0%) | 0 (0.0%) |
| 18 to 34 Years | 7 (5.0%) | 12 (6.2%) |
| 35 to 64 Years | 28 (9.2%) | 40 (12.1%) |
| 65 to 74 Years | 20 (32.8%) | 33 (30.3%) |
| 75 Years and over | 25 (31.2%) | 16 (18.0%) |
Disability Class: Self-Care Difficulty
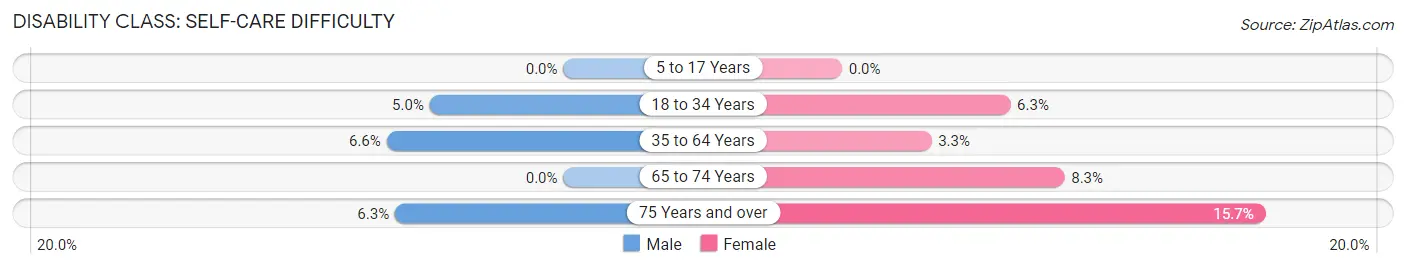
| Age Bracket | Male | Female |
| 5 to 17 Years | 0 (0.0%) | 0 (0.0%) |
| 18 to 34 Years | 7 (5.0%) | 12 (6.2%) |
| 35 to 64 Years | 20 (6.6%) | 11 (3.3%) |
| 65 to 74 Years | 0 (0.0%) | 9 (8.3%) |
| 75 Years and over | 5 (6.2%) | 14 (15.7%) |
Technology Access in Dresden
Computing Device Access in Dresden
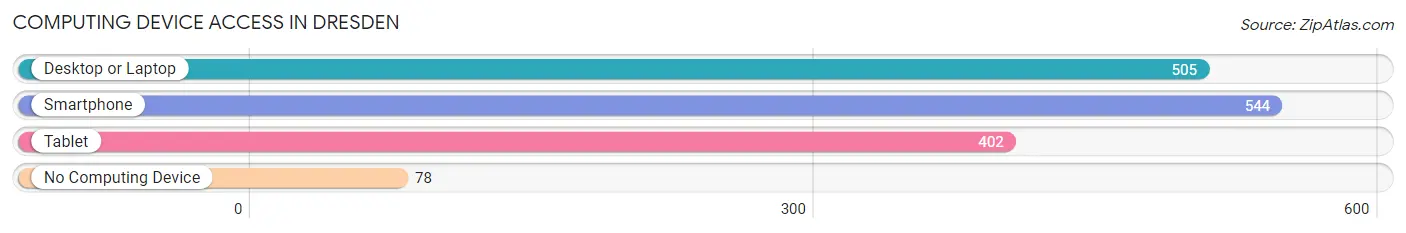
| Device Type | # Households | % Households |
| Desktop or Laptop | 505 | 72.9% |
| Smartphone | 544 | 78.5% |
| Tablet | 402 | 58.0% |
| No Computing Device | 78 | 11.3% |
| Total | 693 | 100.0% |
Internet Access in Dresden
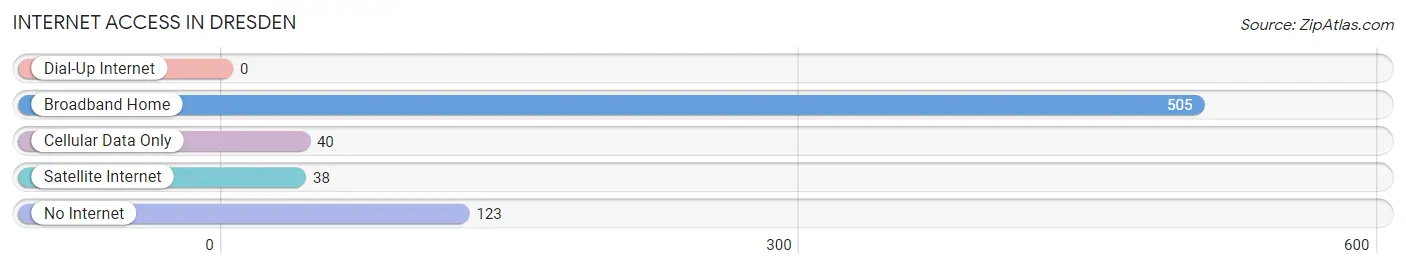
| Internet Type | # Households | % Households |
| Dial-Up Internet | 0 | 0.0% |
| Broadband Home | 505 | 72.9% |
| Cellular Data Only | 40 | 5.8% |
| Satellite Internet | 38 | 5.5% |
| No Internet | 123 | 17.7% |
| Total | 693 | 100.0% |
Dresden Summary
Dresden is a village located in Muskingum County, Ohio, United States. The population was 1,845 at the 2010 census. It is part of the Zanesville, OH Metropolitan Statistical Area.
History
Dresden was founded in 1815 by John and Mary Ann (McClure) Smith. The Smiths had moved to the area from Pennsylvania in 1810 and purchased a large tract of land. The village was named after Dresden, Germany, which was the hometown of a friend of the Smiths.
The village was incorporated in 1837 and was the first village in Muskingum County to be incorporated. The first post office was established in 1837 and the first school was built in 1838.
In 1845, the Dresden Academy was established. The academy was a private school that offered classes in the sciences, mathematics, and literature. It was the first school in the county to offer a college preparatory curriculum.
The village was a major stop on the Underground Railroad. It was a safe haven for escaped slaves and a place where they could find shelter and food.
Geography
Dresden is located at 39 55 25 North 82 0 25 West 39 923750 82 006944
According to the United States Census Bureau, the village has a total area of 0.9 square miles (2.3 km2), all land.
Demographics
As of the census of 2000, there were 1,845 people, 745 households, and 517 families residing in the village. The population density was 2,039.2 people per square mile (788.2/km2). There were 809 housing units at an average density of 893.2 per square mile (345.2/km2). The racial makeup of the village was 97.9% White, 0.3% African American, 0.2% Native American, 0.2% Asian, 0.1% Pacific Islander, 0.2% from other races, and 1.1% from two or more races. Hispanic or Latino of any race were 0.7% of the population.
There were 745 households, out of which 32.2% had children under the age of 18 living with them, 51.7% were married couples living together, 12.3% had a female householder with no husband present, and 31.7% were non-families. 28.2% of all households were made up of individuals, and 14.2% had someone living alone who was 65 years of age or older. The average household size was 2.47 and the average family size was 3.01.
In the village, the population was spread out, with 26.2% under the age of 18, 8.2% from 18 to 24, 28.2% from 25 to 44, 21.2% from 45 to 64, and 16.2% who were 65 years of age or older. The median age was 36 years. For every 100 females, there were 91.2 males. For every 100 females age 18 and over, there were 86.2 males.
The median income for a household in the village was $31,250, and the median income for a family was $37,500. Males had a median income of $30,000 versus $20,000 for females. The per capita income for the village was $15,945. About 8.2% of families and 11.2% of the population were below the poverty line, including 14.2% of those under age 18 and 8.2% of those age 65 or over.
Economy
Dresden is a small village with a limited economy. The village is home to several small businesses, including a grocery store, a hardware store, a restaurant, and a few other small shops. The village also has a few manufacturing companies, including a plastics manufacturer and a metal fabrication company.
The village is also home to a few small farms, which produce corn, soybeans, and hay. The village also has a few small wineries, which produce wine from locally grown grapes.
The village is served by the Muskingum County Public Library, which is located in nearby Zanesville. The library offers a variety of services, including books, magazines, newspapers, and internet access.
Conclusion
Dresden is a small village located in Muskingum County, Ohio. The village was founded in 1815 and was the first village in the county to be incorporated. The village was a major stop on the Underground Railroad and is home to several small businesses, farms, and wineries. The village is served by the Muskingum County Public Library and has a population of 1,845 as of the 2010 census.
Common Questions
What is Per Capita Income in Dresden?
Per Capita income in Dresden is $24,418.
What is the Median Family Income in Dresden?
Median Family Income in Dresden is $64,904.
What is the Median Household income in Dresden?
Median Household Income in Dresden is $44,531.
What is Income or Wage Gap in Dresden?
Income or Wage Gap in Dresden is 42.3%.
Women in Dresden earn 57.7 cents for every dollar earned by a man.
What is Inequality or Gini Index in Dresden?
Inequality or Gini Index in Dresden is 0.41.
What is the Total Population of Dresden?
Total Population of Dresden is 1,709.
What is the Total Male Population of Dresden?
Total Male Population of Dresden is 822.
What is the Total Female Population of Dresden?
Total Female Population of Dresden is 887.
What is the Ratio of Males per 100 Females in Dresden?
There are 92.67 Males per 100 Females in Dresden.
What is the Ratio of Females per 100 Males in Dresden?
There are 107.91 Females per 100 Males in Dresden.
What is the Median Population Age in Dresden?
Median Population Age in Dresden is 40.8 Years.
What is the Average Family Size in Dresden
Average Family Size in Dresden is 3.1 People.
What is the Average Household Size in Dresden
Average Household Size in Dresden is 2.5 People.
How Large is the Labor Force in Dresden?
There are 760 People in the Labor Forcein in Dresden.
What is the Percentage of People in the Labor Force in Dresden?
55.9% of People are in the Labor Force in Dresden.
What is the Unemployment Rate in Dresden?
Unemployment Rate in Dresden is 3.1%.