Delta, OH Map & Demographics
Delta Map
Delta Overview
$29,280
PER CAPITA INCOME
$78,958
AVG FAMILY INCOME
$67,100
AVG HOUSEHOLD INCOME
4.0%
WAGE / INCOME GAP [ % ]
96.0¢/ $1
WAGE / INCOME GAP [ $ ]
0.39
INEQUALITY / GINI INDEX
2,813
TOTAL POPULATION
1,288
MALE POPULATION
1,525
FEMALE POPULATION
84.46
MALES / 100 FEMALES
118.40
FEMALES / 100 MALES
35.7
MEDIAN AGE
3.2
AVG FAMILY SIZE
2.5
AVG HOUSEHOLD SIZE
1,279
LABOR FORCE [ PEOPLE ]
61.5%
PERCENT IN LABOR FORCE
3.7%
UNEMPLOYMENT RATE
Delta Zip Codes
Income in Delta
Income Overview in Delta
Per Capita Income in Delta is $29,280, while median incomes of families and households are $78,958 and $67,100 respectively.
| Characteristic | Number | Measure |
| Per Capita Income | 2,813 | $29,280 |
| Median Family Income | 724 | $78,958 |
| Mean Family Income | 724 | $90,509 |
| Median Household Income | 1,098 | $67,100 |
| Mean Household Income | 1,098 | $75,380 |
| Income Deficit | 724 | $0 |
| Wage / Income Gap (%) | 2,813 | 4.01% |
| Wage / Income Gap ($) | 2,813 | 95.99¢ per $1 |
| Gini / Inequality Index | 2,813 | 0.39 |
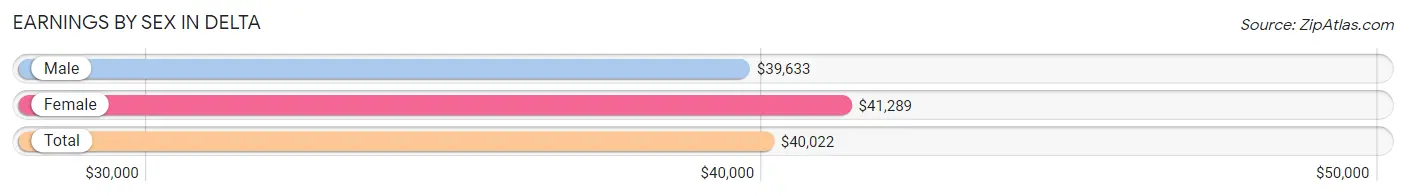
Earnings by Sex in Delta
Average Earnings in Delta are $40,022, $39,633 for men and $41,289 for women, a difference of 4.0%.
| Sex | Number | Average Earnings |
| Male | 732 (52.5%) | $39,633 |
| Female | 661 (47.4%) | $41,289 |
| Total | 1,393 (100.0%) | $40,022 |
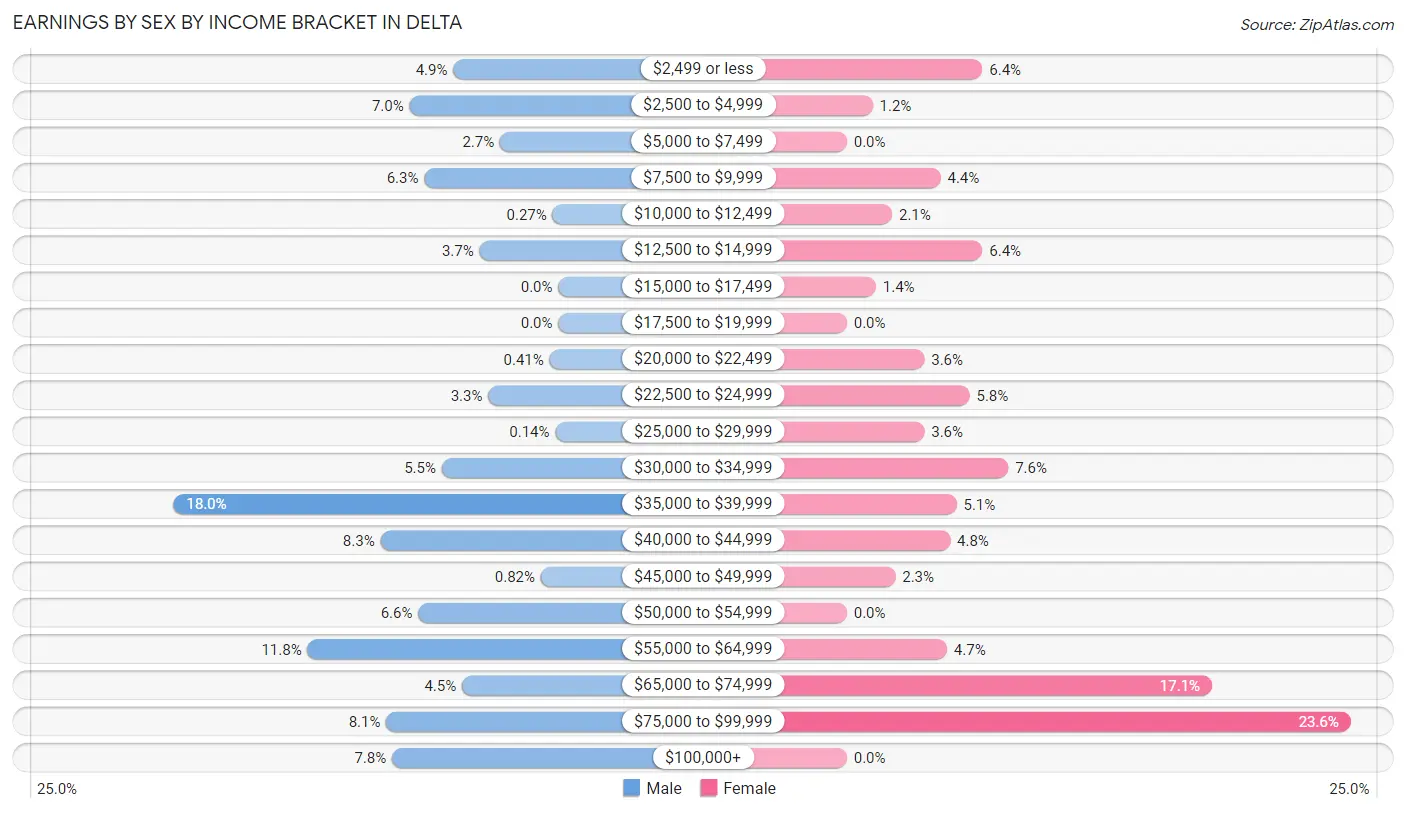
Earnings by Sex by Income Bracket in Delta
The most common earnings brackets in Delta are $35,000 to $39,999 for men (132 | 18.0%) and $75,000 to $99,999 for women (156 | 23.6%).
| Income | Male | Female |
| $2,499 or less | 36 (4.9%) | 42 (6.4%) |
| $2,500 to $4,999 | 51 (7.0%) | 8 (1.2%) |
| $5,000 to $7,499 | 20 (2.7%) | 0 (0.0%) |
| $7,500 to $9,999 | 46 (6.3%) | 29 (4.4%) |
| $10,000 to $12,499 | 2 (0.3%) | 14 (2.1%) |
| $12,500 to $14,999 | 27 (3.7%) | 42 (6.4%) |
| $15,000 to $17,499 | 0 (0.0%) | 9 (1.4%) |
| $17,500 to $19,999 | 0 (0.0%) | 0 (0.0%) |
| $20,000 to $22,499 | 3 (0.4%) | 24 (3.6%) |
| $22,500 to $24,999 | 24 (3.3%) | 38 (5.8%) |
| $25,000 to $29,999 | 1 (0.1%) | 24 (3.6%) |
| $30,000 to $34,999 | 40 (5.5%) | 50 (7.6%) |
| $35,000 to $39,999 | 132 (18.0%) | 34 (5.1%) |
| $40,000 to $44,999 | 61 (8.3%) | 32 (4.8%) |
| $45,000 to $49,999 | 6 (0.8%) | 15 (2.3%) |
| $50,000 to $54,999 | 48 (6.6%) | 0 (0.0%) |
| $55,000 to $64,999 | 86 (11.7%) | 31 (4.7%) |
| $65,000 to $74,999 | 33 (4.5%) | 113 (17.1%) |
| $75,000 to $99,999 | 59 (8.1%) | 156 (23.6%) |
| $100,000+ | 57 (7.8%) | 0 (0.0%) |
| Total | 732 (100.0%) | 661 (100.0%) |
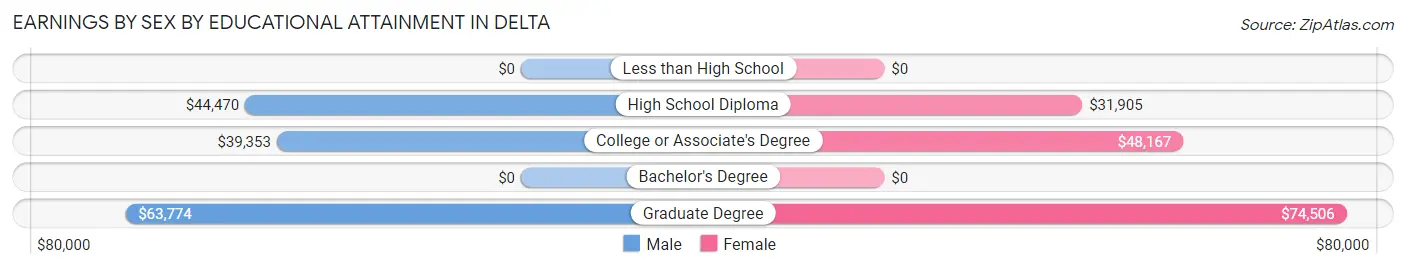
Earnings by Sex by Educational Attainment in Delta
Average earnings in Delta are $44,340 for men and $49,750 for women, a difference of 10.9%. Men with an educational attainment of graduate degree enjoy the highest average annual earnings of $63,774, while those with college or associate's degree education earn the least with $39,353. Women with an educational attainment of graduate degree earn the most with the average annual earnings of $74,506, while those with high school diploma education have the smallest earnings of $31,905.
| Educational Attainment | Male Income | Female Income |
| Less than High School | - | - |
| High School Diploma | $44,470 | $31,905 |
| College or Associate's Degree | $39,353 | $48,167 |
| Bachelor's Degree | - | - |
| Graduate Degree | $63,774 | $74,506 |
| Total | $44,340 | $49,750 |
Family Income in Delta
Family Income Brackets in Delta
According to the Delta family income data, there are 201 families falling into the $100,000 to $149,999 income range, which is the most common income bracket and makes up 27.8% of all families. Conversely, the $25,000 to $34,999 income bracket is the least frequent group with only 6 families (0.8%) belonging to this category.
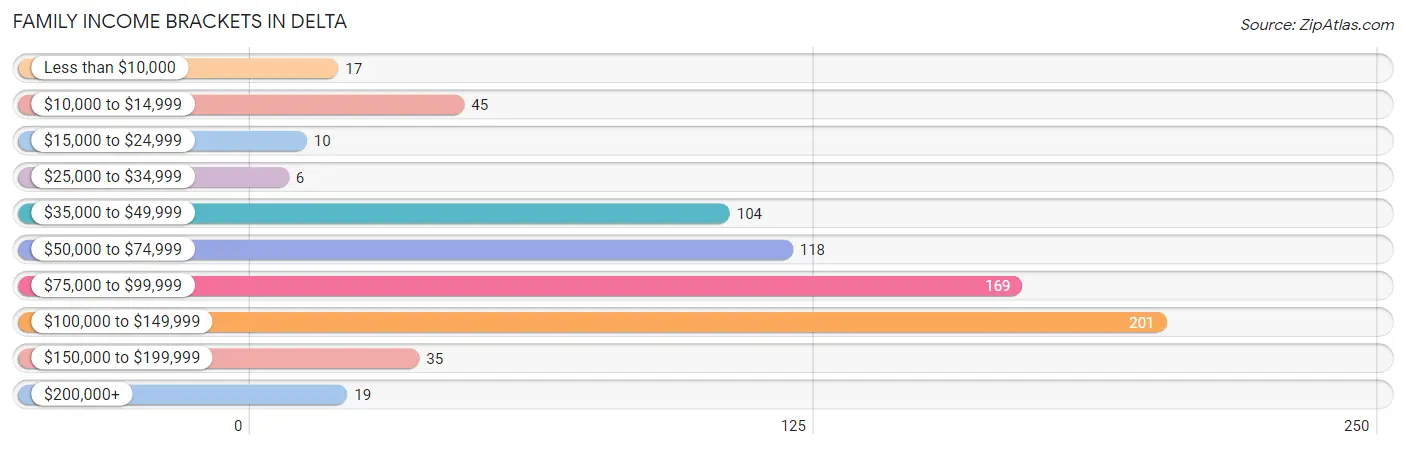
| Income Bracket | # Families | % Families |
| Less than $10,000 | 17 | 2.3% |
| $10,000 to $14,999 | 45 | 6.2% |
| $15,000 to $24,999 | 10 | 1.4% |
| $25,000 to $34,999 | 6 | 0.8% |
| $35,000 to $49,999 | 104 | 14.4% |
| $50,000 to $74,999 | 118 | 16.3% |
| $75,000 to $99,999 | 169 | 23.3% |
| $100,000 to $149,999 | 201 | 27.8% |
| $150,000 to $199,999 | 35 | 4.8% |
| $200,000+ | 19 | 2.6% |
Family Income by Famaliy Size in Delta
7+ person families (24 | 3.3%) account for the highest median family income in Delta with $113,750 per family, while 2-person families (295 | 40.7%) have the highest median income of $35,156 per family member.
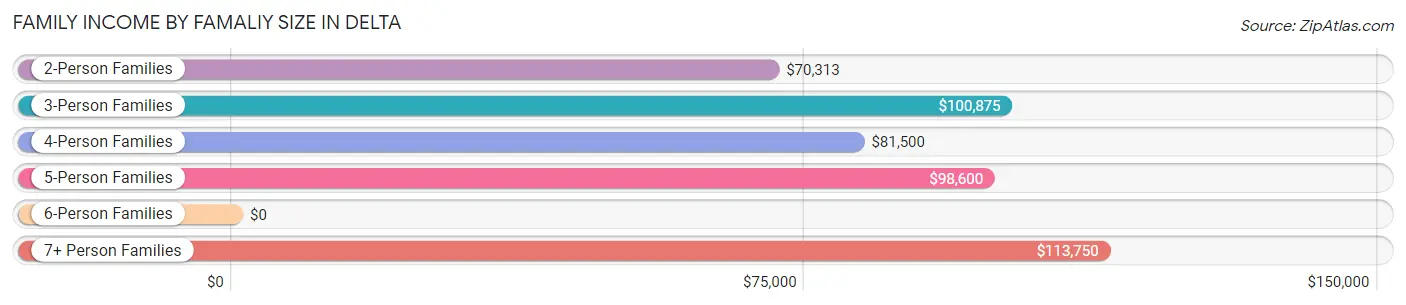
| Income Bracket | # Families | Median Income |
| 2-Person Families | 295 (40.7%) | $70,313 |
| 3-Person Families | 173 (23.9%) | $100,875 |
| 4-Person Families | 172 (23.8%) | $81,500 |
| 5-Person Families | 52 (7.2%) | $98,600 |
| 6-Person Families | 8 (1.1%) | $0 |
| 7+ Person Families | 24 (3.3%) | $113,750 |
| Total | 724 (100.0%) | $78,958 |
Family Income by Number of Earners in Delta
The median family income in Delta is $78,958, with families comprising 3+ earners (130) having the highest median family income of $146,208, while families with no earners (51) have the lowest median family income of $36,094, accounting for 18.0% and 7.0% of families, respectively.
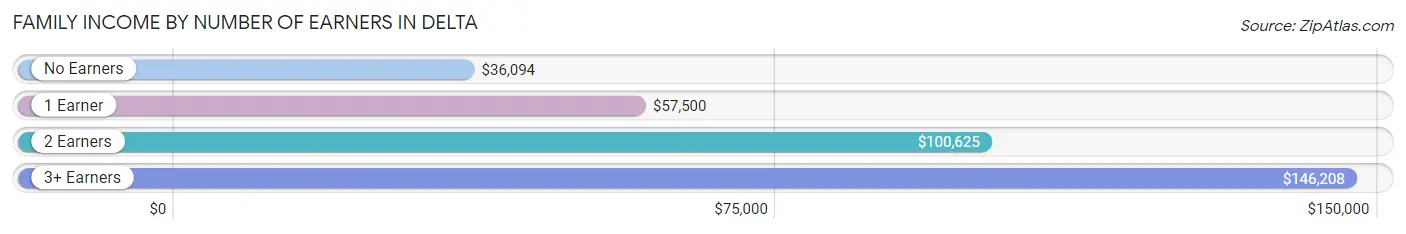
| Number of Earners | # Families | Median Income |
| No Earners | 51 (7.0%) | $36,094 |
| 1 Earner | 278 (38.4%) | $57,500 |
| 2 Earners | 265 (36.6%) | $100,625 |
| 3+ Earners | 130 (18.0%) | $146,208 |
| Total | 724 (100.0%) | $78,958 |
Household Income in Delta
Household Income Brackets in Delta
With 216 households falling in the category, the $100,000 to $149,999 income range is the most frequent in Delta, accounting for 19.7% of all households. In contrast, only 19 households (1.7%) fall into the $200,000+ income bracket, making it the least populous group.
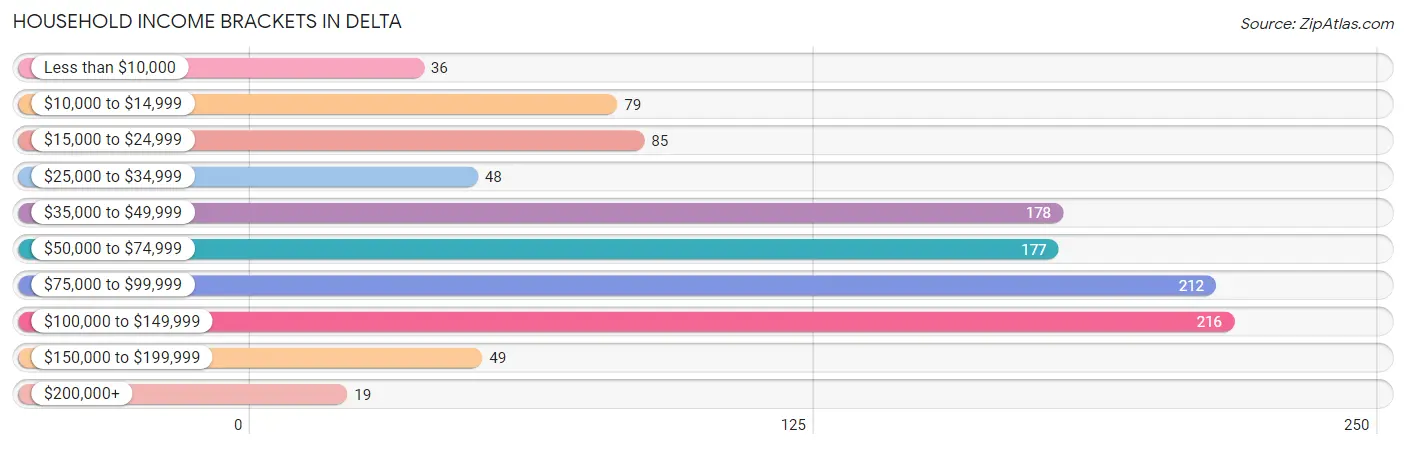
| Income Bracket | # Households | % Households |
| Less than $10,000 | 36 | 3.3% |
| $10,000 to $14,999 | 79 | 7.2% |
| $15,000 to $24,999 | 85 | 7.7% |
| $25,000 to $34,999 | 48 | 4.4% |
| $35,000 to $49,999 | 178 | 16.2% |
| $50,000 to $74,999 | 177 | 16.1% |
| $75,000 to $99,999 | 212 | 19.3% |
| $100,000 to $149,999 | 216 | 19.7% |
| $150,000 to $199,999 | 49 | 4.5% |
| $200,000+ | 19 | 1.7% |
Household Income by Householder Age in Delta
The median household income in Delta is $67,100, with the highest median household income of $85,040 found in the 25 to 44 years age bracket for the primary householder. A total of 365 households (33.2%) fall into this category. Meanwhile, the 15 to 24 years age bracket for the primary householder has the lowest median household income of $0, with 114 households (10.4%) in this group.
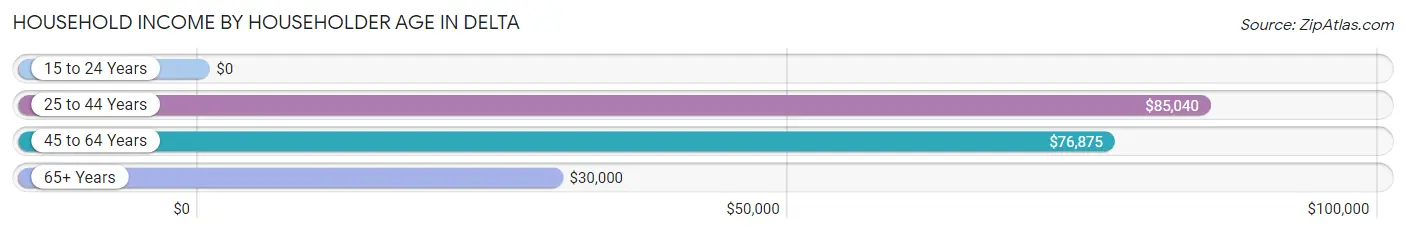
| Income Bracket | # Households | Median Income |
| 15 to 24 Years | 114 (10.4%) | $0 |
| 25 to 44 Years | 365 (33.2%) | $85,040 |
| 45 to 64 Years | 377 (34.3%) | $76,875 |
| 65+ Years | 242 (22.0%) | $30,000 |
| Total | 1,098 (100.0%) | $67,100 |
Poverty in Delta
Income Below Poverty by Sex and Age in Delta
With 7.5% poverty level for males and 22.9% for females among the residents of Delta, 75 year old and over males and under 5 year old females are the most vulnerable to poverty, with 11 males (26.8%) and 64 females (65.3%) in their respective age groups living below the poverty level.
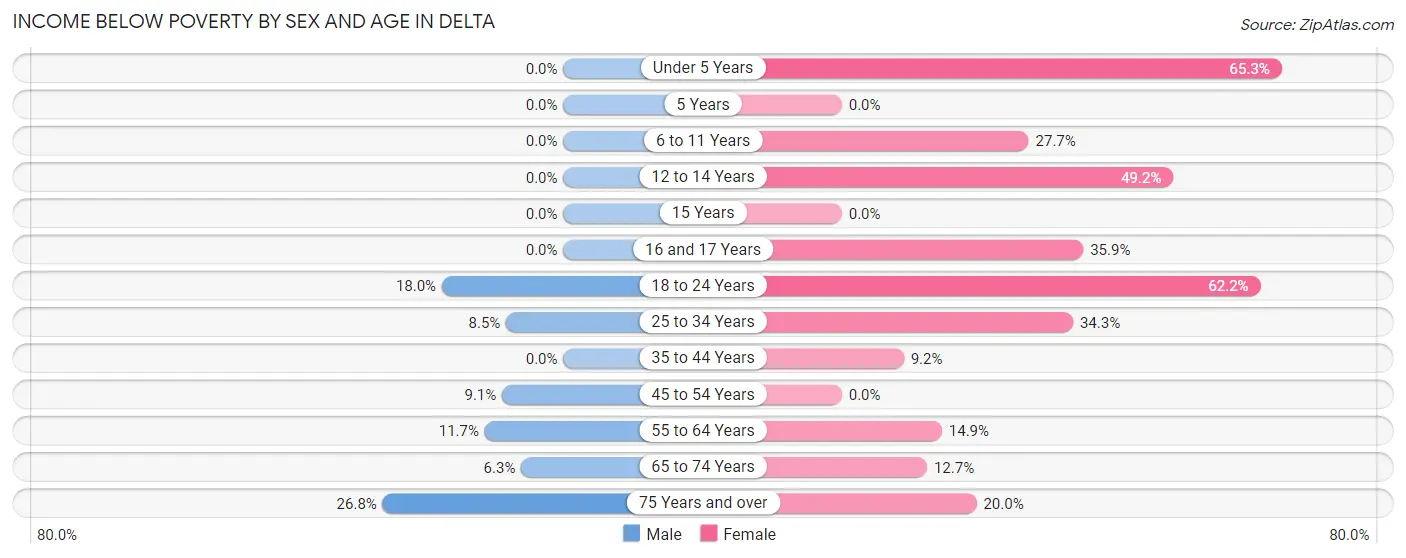
| Age Bracket | Male | Female |
| Under 5 Years | 0 (0.0%) | 64 (65.3%) |
| 5 Years | 0 (0.0%) | 0 (0.0%) |
| 6 to 11 Years | 0 (0.0%) | 43 (27.7%) |
| 12 to 14 Years | 0 (0.0%) | 62 (49.2%) |
| 15 Years | 0 (0.0%) | 0 (0.0%) |
| 16 and 17 Years | 0 (0.0%) | 19 (35.8%) |
| 18 to 24 Years | 44 (18.0%) | 46 (62.2%) |
| 25 to 34 Years | 9 (8.5%) | 23 (34.3%) |
| 35 to 44 Years | 0 (0.0%) | 25 (9.2%) |
| 45 to 54 Years | 13 (9.1%) | 0 (0.0%) |
| 55 to 64 Years | 14 (11.7%) | 26 (14.9%) |
| 65 to 74 Years | 6 (6.2%) | 21 (12.7%) |
| 75 Years and over | 11 (26.8%) | 17 (20.0%) |
| Total | 97 (7.5%) | 346 (22.9%) |
Income Above Poverty by Sex and Age in Delta
According to the poverty statistics in Delta, males aged under 5 years and females aged 5 years are the age groups that are most secure financially, with 100.0% of males and 100.0% of females in these age groups living above the poverty line.
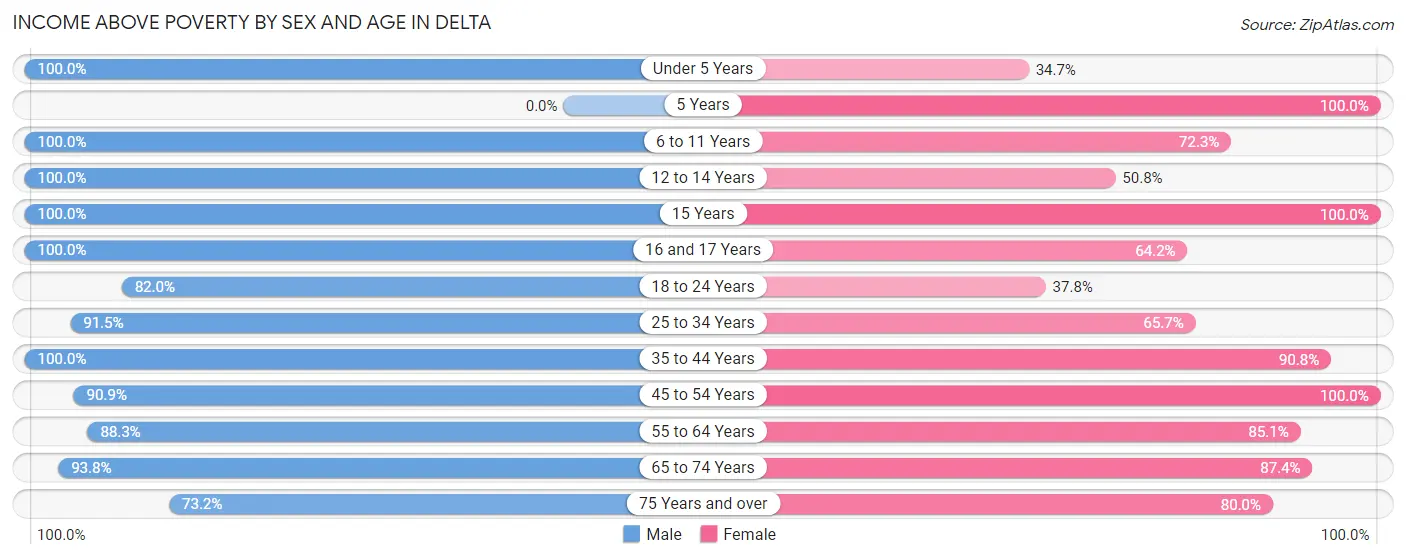
| Age Bracket | Male | Female |
| Under 5 Years | 83 (100.0%) | 34 (34.7%) |
| 5 Years | 0 (0.0%) | 11 (100.0%) |
| 6 to 11 Years | 126 (100.0%) | 112 (72.3%) |
| 12 to 14 Years | 63 (100.0%) | 64 (50.8%) |
| 15 Years | 20 (100.0%) | 38 (100.0%) |
| 16 and 17 Years | 91 (100.0%) | 34 (64.1%) |
| 18 to 24 Years | 200 (82.0%) | 28 (37.8%) |
| 25 to 34 Years | 97 (91.5%) | 44 (65.7%) |
| 35 to 44 Years | 155 (100.0%) | 247 (90.8%) |
| 45 to 54 Years | 130 (90.9%) | 191 (100.0%) |
| 55 to 64 Years | 106 (88.3%) | 149 (85.1%) |
| 65 to 74 Years | 90 (93.8%) | 145 (87.4%) |
| 75 Years and over | 30 (73.2%) | 68 (80.0%) |
| Total | 1,191 (92.5%) | 1,165 (77.1%) |
Income Below Poverty Among Married-Couple Families in Delta
The poverty statistics for married-couple families in Delta show that 9.0% or 49 of the total 542 families live below the poverty line. Families with 5 or more children have the highest poverty rate of 33.3%, comprising of 8 families. On the other hand, families with 3 or 4 children have the lowest poverty rate of 0.0%, which includes 0 families.
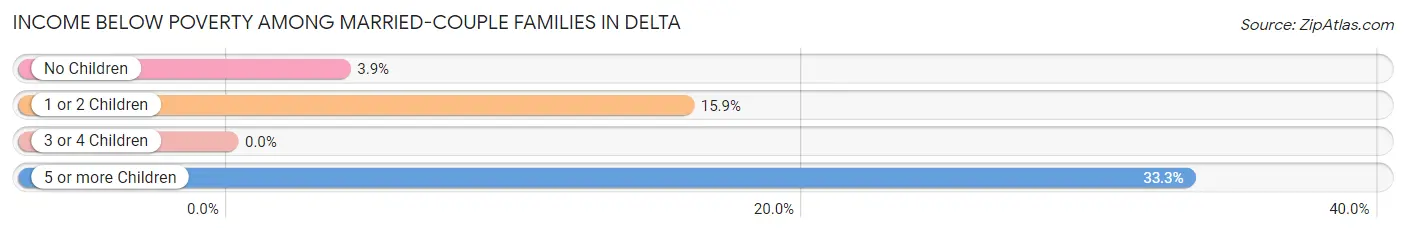
| Children | Above Poverty | Below Poverty |
| No Children | 270 (96.1%) | 11 (3.9%) |
| 1 or 2 Children | 159 (84.1%) | 30 (15.9%) |
| 3 or 4 Children | 48 (100.0%) | 0 (0.0%) |
| 5 or more Children | 16 (66.7%) | 8 (33.3%) |
| Total | 493 (91.0%) | 49 (9.0%) |
Income Below Poverty Among Single-Parent Households in Delta
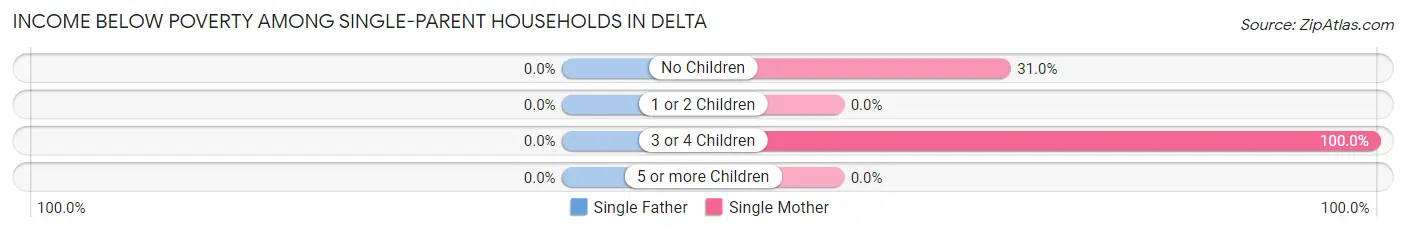
| Children | Single Father | Single Mother |
| No Children | 0 (0.0%) | 9 (31.0%) |
| 1 or 2 Children | 0 (0.0%) | 0 (0.0%) |
| 3 or 4 Children | 0 (0.0%) | 17 (100.0%) |
| 5 or more Children | 0 (0.0%) | 0 (0.0%) |
| Total | 0 (0.0%) | 26 (21.7%) |
Income Below Poverty Among Married-Couple vs Single-Parent Households in Delta
The poverty data for Delta shows that 49 of the married-couple family households (9.0%) and 26 of the single-parent households (14.3%) are living below the poverty level. Within the married-couple family households, those with 5 or more children have the highest poverty rate, with 8 households (33.3%) falling below the poverty line. Among the single-parent households, those with 3 or 4 children have the highest poverty rate, with 17 household (100.0%) living below poverty.
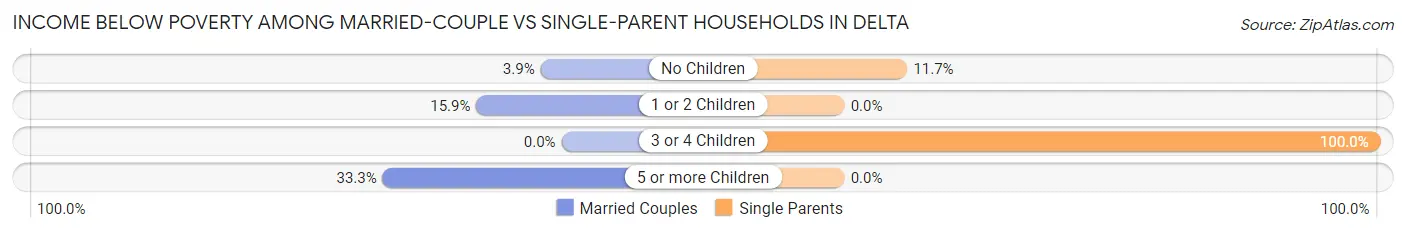
| Children | Married-Couple Families | Single-Parent Households |
| No Children | 11 (3.9%) | 9 (11.7%) |
| 1 or 2 Children | 30 (15.9%) | 0 (0.0%) |
| 3 or 4 Children | 0 (0.0%) | 17 (100.0%) |
| 5 or more Children | 8 (33.3%) | 0 (0.0%) |
| Total | 49 (9.0%) | 26 (14.3%) |
Race in Delta
The most populous races in Delta are White / Caucasian (2,340 | 83.2%), Hispanic or Latino (526 | 18.7%), and Two or more Races (218 | 7.7%).
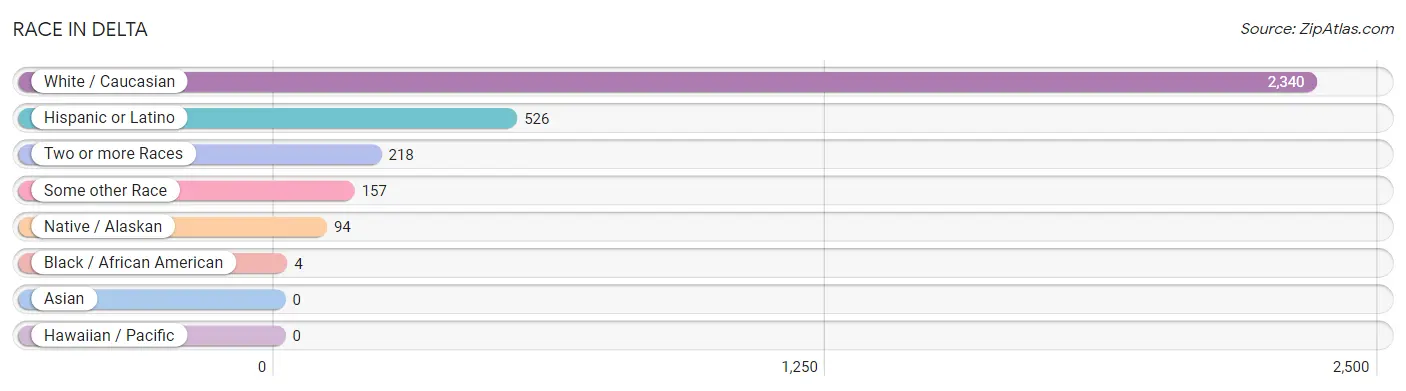
| Race | # Population | % Population |
| Asian | 0 | 0.0% |
| Black / African American | 4 | 0.1% |
| Hawaiian / Pacific | 0 | 0.0% |
| Hispanic or Latino | 526 | 18.7% |
| Native / Alaskan | 94 | 3.3% |
| White / Caucasian | 2,340 | 83.2% |
| Two or more Races | 218 | 7.7% |
| Some other Race | 157 | 5.6% |
| Total | 2,813 | 100.0% |
Ancestry in Delta
The most populous ancestries reported in Delta are German (931 | 33.1%), Mexican (417 | 14.8%), Irish (269 | 9.6%), English (202 | 7.2%), and Italian (199 | 7.1%), together accounting for 71.7% of all Delta residents.
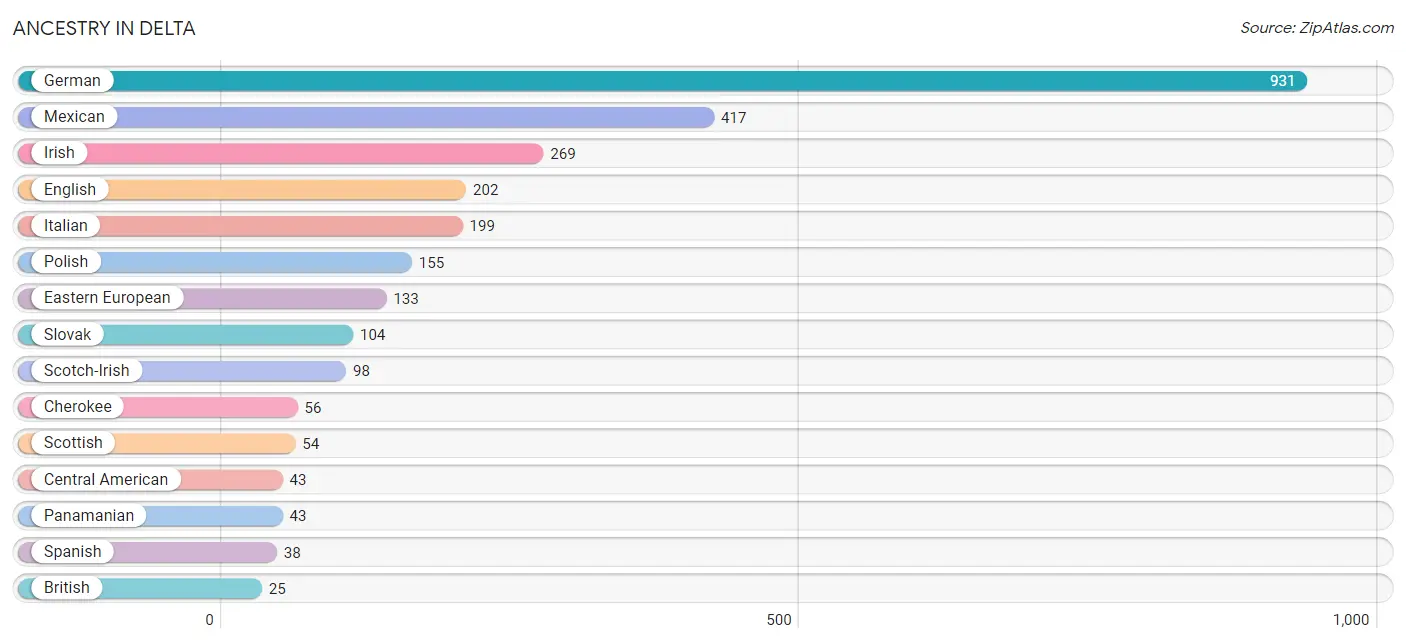
| Ancestry | # Population | % Population |
| American | 17 | 0.6% |
| British | 25 | 0.9% |
| Central American | 43 | 1.5% |
| Cherokee | 56 | 2.0% |
| Chippewa | 7 | 0.3% |
| Czech | 1 | 0.0% |
| Dutch | 19 | 0.7% |
| Eastern European | 133 | 4.7% |
| English | 202 | 7.2% |
| French | 22 | 0.8% |
| French Canadian | 24 | 0.9% |
| German | 931 | 33.1% |
| Greek | 1 | 0.0% |
| Hungarian | 9 | 0.3% |
| Irish | 269 | 9.6% |
| Italian | 199 | 7.1% |
| Jamaican | 1 | 0.0% |
| Mexican | 417 | 14.8% |
| Panamanian | 43 | 1.5% |
| Pennsylvania German | 15 | 0.5% |
| Polish | 155 | 5.5% |
| Portuguese | 6 | 0.2% |
| Puerto Rican | 8 | 0.3% |
| Scotch-Irish | 98 | 3.5% |
| Scottish | 54 | 1.9% |
| Slovak | 104 | 3.7% |
| Spanish | 38 | 1.3% |
| Swiss | 21 | 0.7% |
| Welsh | 19 | 0.7% | View All 29 Rows |
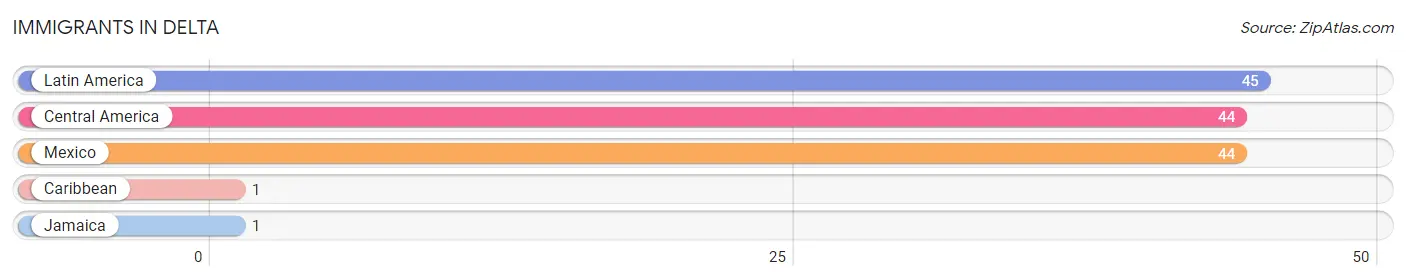
Immigrants in Delta
The most numerous immigrant groups reported in Delta came from Latin America (45 | 1.6%), Central America (44 | 1.6%), Mexico (44 | 1.6%), Caribbean (1 | 0.0%), and Jamaica (1 | 0.0%), together accounting for 4.8% of all Delta residents.
| Immigration Origin | # Population | % Population |
| Caribbean | 1 | 0.0% |
| Central America | 44 | 1.6% |
| Jamaica | 1 | 0.0% |
| Latin America | 45 | 1.6% |
| Mexico | 44 | 1.6% | View All 5 Rows |
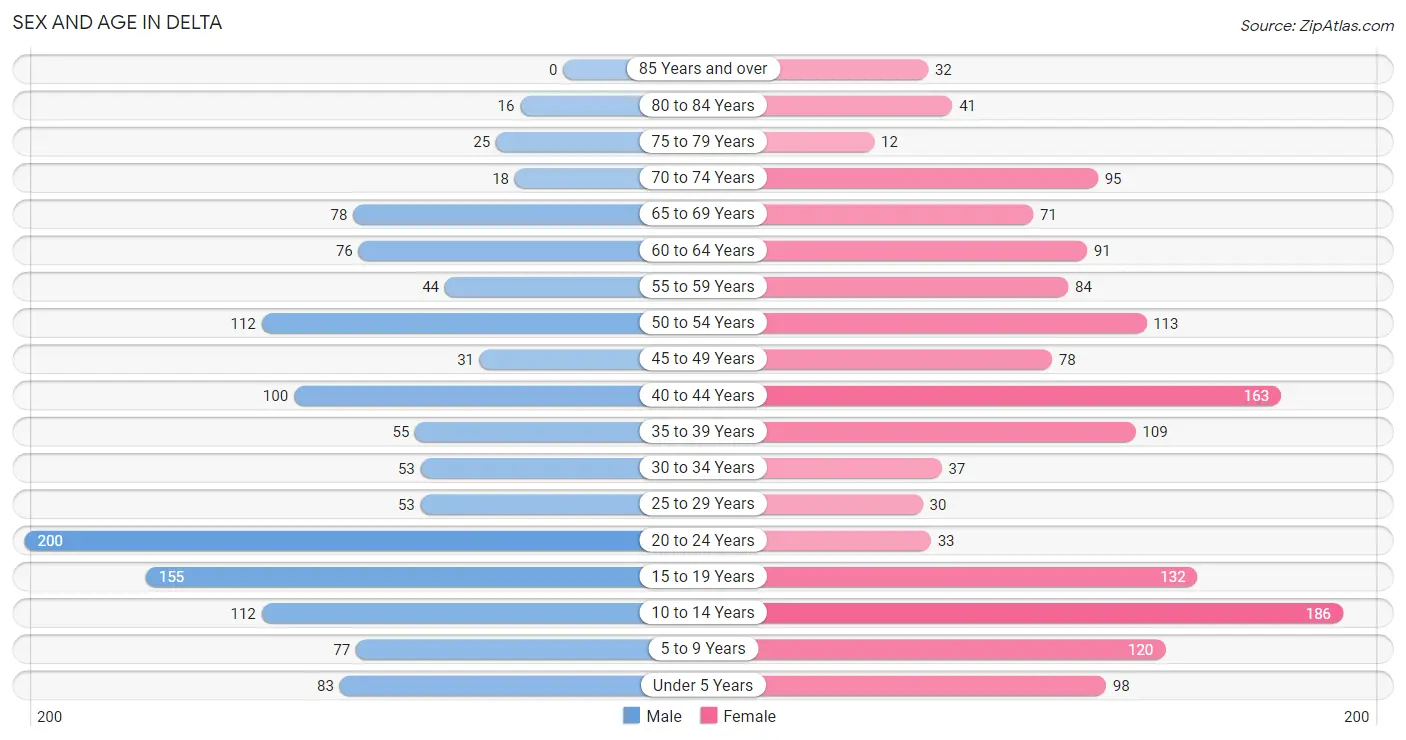
Sex and Age in Delta
Sex and Age in Delta
The most populous age groups in Delta are 20 to 24 Years (200 | 15.5%) for men and 10 to 14 Years (186 | 12.2%) for women.
| Age Bracket | Male | Female |
| Under 5 Years | 83 (6.4%) | 98 (6.4%) |
| 5 to 9 Years | 77 (6.0%) | 120 (7.9%) |
| 10 to 14 Years | 112 (8.7%) | 186 (12.2%) |
| 15 to 19 Years | 155 (12.0%) | 132 (8.7%) |
| 20 to 24 Years | 200 (15.5%) | 33 (2.2%) |
| 25 to 29 Years | 53 (4.1%) | 30 (2.0%) |
| 30 to 34 Years | 53 (4.1%) | 37 (2.4%) |
| 35 to 39 Years | 55 (4.3%) | 109 (7.1%) |
| 40 to 44 Years | 100 (7.8%) | 163 (10.7%) |
| 45 to 49 Years | 31 (2.4%) | 78 (5.1%) |
| 50 to 54 Years | 112 (8.7%) | 113 (7.4%) |
| 55 to 59 Years | 44 (3.4%) | 84 (5.5%) |
| 60 to 64 Years | 76 (5.9%) | 91 (6.0%) |
| 65 to 69 Years | 78 (6.1%) | 71 (4.7%) |
| 70 to 74 Years | 18 (1.4%) | 95 (6.2%) |
| 75 to 79 Years | 25 (1.9%) | 12 (0.8%) |
| 80 to 84 Years | 16 (1.2%) | 41 (2.7%) |
| 85 Years and over | 0 (0.0%) | 32 (2.1%) |
| Total | 1,288 (100.0%) | 1,525 (100.0%) |
Families and Households in Delta
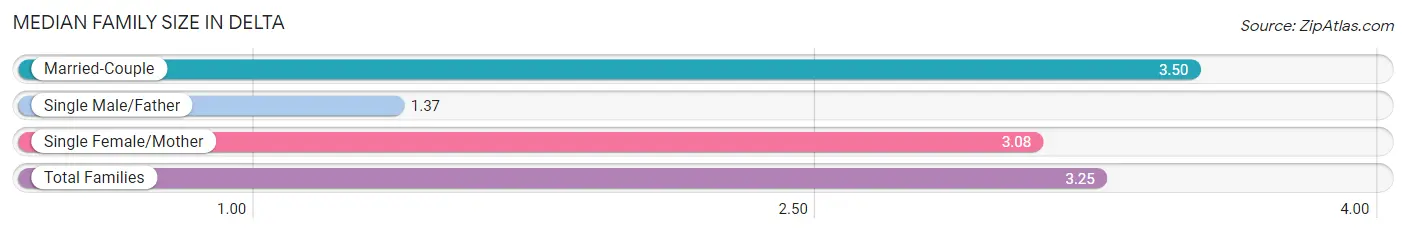
Median Family Size in Delta
The median family size in Delta is 3.25 persons per family, with married-couple families (542 | 74.9%) accounting for the largest median family size of 3.5 persons per family. On the other hand, single male/father families (62 | 8.6%) represent the smallest median family size with 1.37 persons per family.
| Family Type | # Families | Family Size |
| Married-Couple | 542 (74.9%) | 3.50 |
| Single Male/Father | 62 (8.6%) | 1.37 |
| Single Female/Mother | 120 (16.6%) | 3.08 |
| Total Families | 724 (100.0%) | 3.25 |
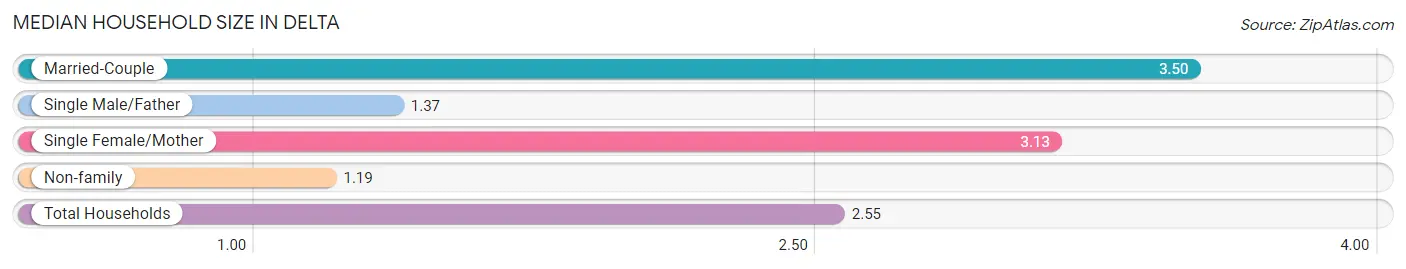
Median Household Size in Delta
The median household size in Delta is 2.55 persons per household, with married-couple households (542 | 49.4%) accounting for the largest median household size of 3.5 persons per household. non-family households (374 | 34.1%) represent the smallest median household size with 1.19 persons per household.
| Household Type | # Households | Household Size |
| Married-Couple | 542 (49.4%) | 3.50 |
| Single Male/Father | 62 (5.7%) | 1.37 |
| Single Female/Mother | 120 (10.9%) | 3.13 |
| Non-family | 374 (34.1%) | 1.19 |
| Total Households | 1,098 (100.0%) | 2.55 |
Household Size by Marriage Status in Delta
Out of a total of 1,098 households in Delta, 724 (65.9%) are family households, while 374 (34.1%) are nonfamily households. The most numerous type of family households are 2-person households, comprising 295, and the most common type of nonfamily households are 1-person households, comprising 329.
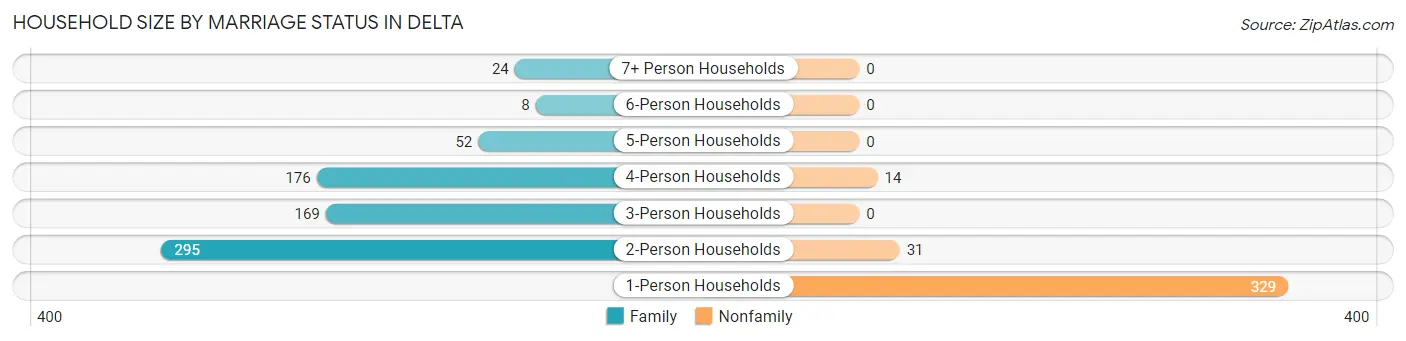
| Household Size | Family Households | Nonfamily Households |
| 1-Person Households | - | 329 (30.0%) |
| 2-Person Households | 295 (26.9%) | 31 (2.8%) |
| 3-Person Households | 169 (15.4%) | 0 (0.0%) |
| 4-Person Households | 176 (16.0%) | 14 (1.3%) |
| 5-Person Households | 52 (4.7%) | 0 (0.0%) |
| 6-Person Households | 8 (0.7%) | 0 (0.0%) |
| 7+ Person Households | 24 (2.2%) | 0 (0.0%) |
| Total | 724 (65.9%) | 374 (34.1%) |
Female Fertility in Delta
Fertility by Age in Delta
Average fertility rate in Delta is 18.0 births per 1,000 women. Women in the age bracket of 15 to 19 years have the highest fertility rate with 83.0 births per 1,000 women. Women in the age bracket of 15 to 19 years acount for 100.0% of all women with births.
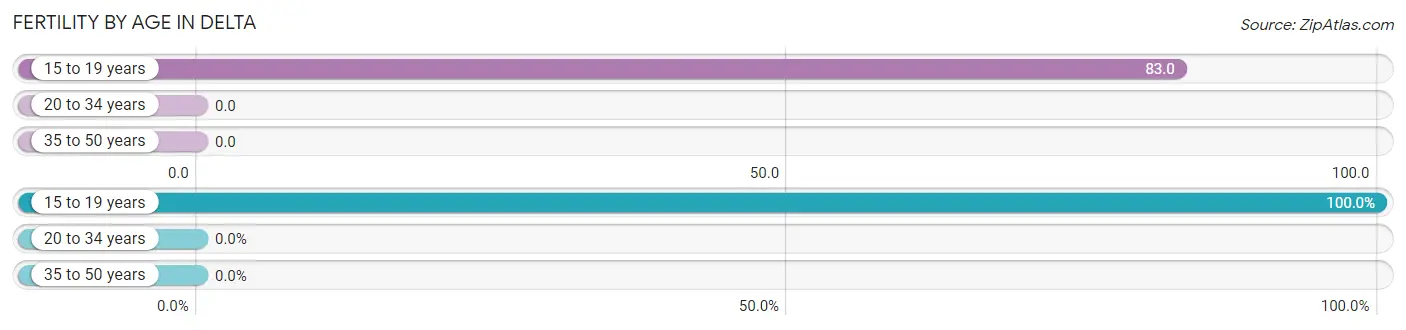
| Age Bracket | Women with Births | Births / 1,000 Women |
| 15 to 19 years | 11 (100.0%) | 83.0 |
| 20 to 34 years | 0 (0.0%) | 0.0 |
| 35 to 50 years | 0 (0.0%) | 0.0 |
| Total | 11 (100.0%) | 18.0 |
Fertility by Age by Marriage Status in Delta
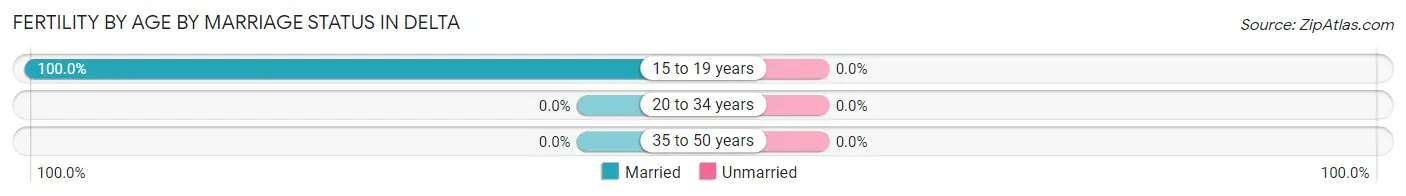
| Age Bracket | Married | Unmarried |
| 15 to 19 years | 11 (100.0%) | 0 (0.0%) |
| 20 to 34 years | 0 (0.0%) | 0 (0.0%) |
| 35 to 50 years | 0 (0.0%) | 0 (0.0%) |
| Total | 11 (100.0%) | 0 (0.0%) |
Fertility by Education in Delta
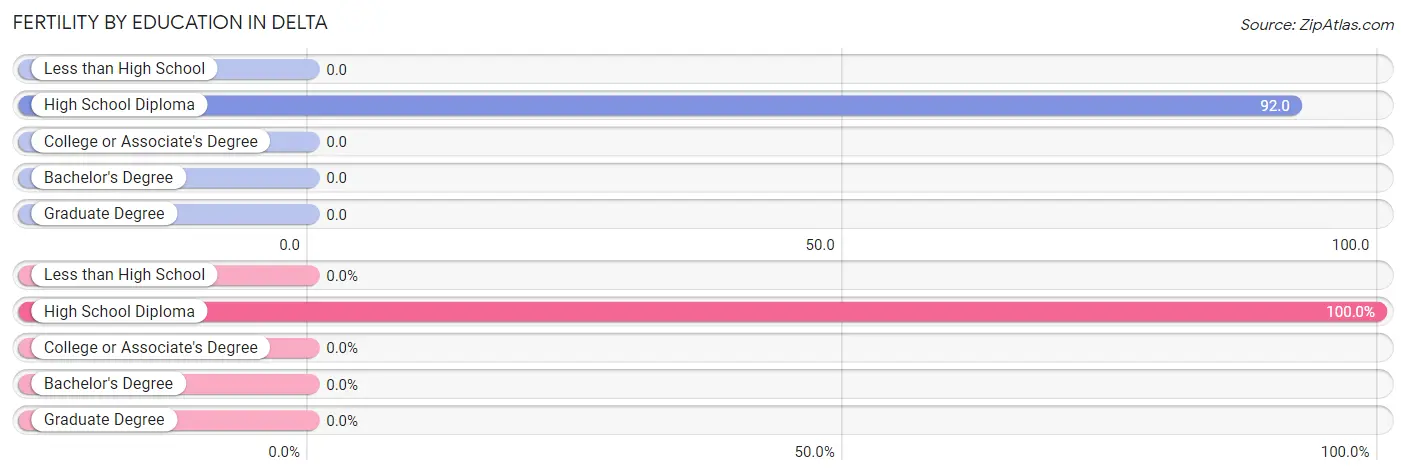
| Educational Attainment | Women with Births | Births / 1,000 Women |
| Less than High School | 0 (0.0%) | 0.0 |
| High School Diploma | 11 (100.0%) | 92.0 |
| College or Associate's Degree | 0 (0.0%) | 0.0 |
| Bachelor's Degree | 0 (0.0%) | 0.0 |
| Graduate Degree | 0 (0.0%) | 0.0 |
| Total | 11 (100.0%) | 18.0 |
Fertility by Education by Marriage Status in Delta
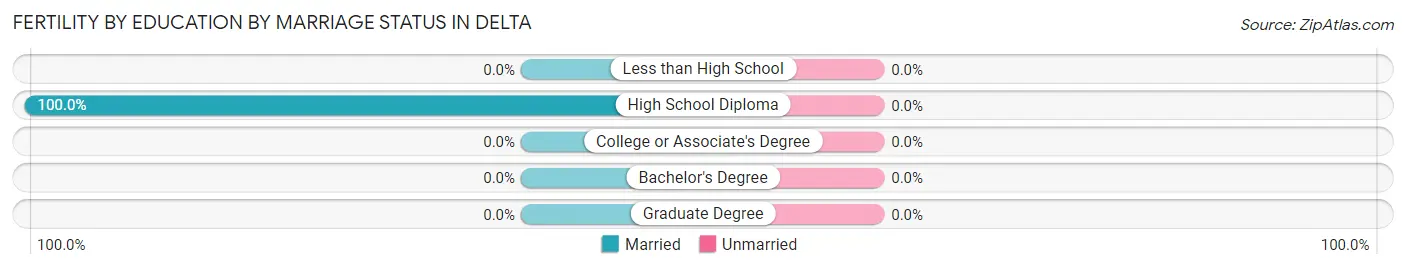
| Educational Attainment | Married | Unmarried |
| Less than High School | 0 (0.0%) | 0 (0.0%) |
| High School Diploma | 11 (100.0%) | 0 (0.0%) |
| College or Associate's Degree | 0 (0.0%) | 0 (0.0%) |
| Bachelor's Degree | 0 (0.0%) | 0 (0.0%) |
| Graduate Degree | 0 (0.0%) | 0 (0.0%) |
| Total | 11 (100.0%) | 0 (0.0%) |
Employment Characteristics in Delta
Employment by Class of Employer in Delta
Among the 1,224 employed individuals in Delta, private company employees (709 | 57.9%), local government employees (174 | 14.2%), and not-for-profit organizations (139 | 11.4%) make up the most common classes of employment.
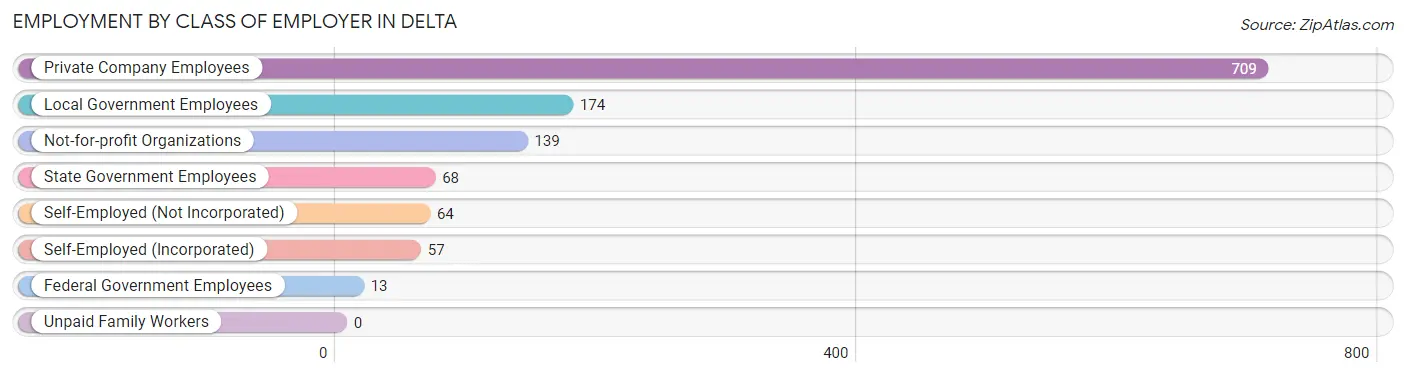
| Employer Class | # Employees | % Employees |
| Private Company Employees | 709 | 57.9% |
| Self-Employed (Incorporated) | 57 | 4.7% |
| Self-Employed (Not Incorporated) | 64 | 5.2% |
| Not-for-profit Organizations | 139 | 11.4% |
| Local Government Employees | 174 | 14.2% |
| State Government Employees | 68 | 5.6% |
| Federal Government Employees | 13 | 1.1% |
| Unpaid Family Workers | 0 | 0.0% |
| Total | 1,224 | 100.0% |
Employment Status by Age in Delta
According to the labor force statistics for Delta, out of the total population over 16 years of age (2,079), 61.5% or 1,279 individuals are in the labor force, with 3.7% or 47 of them unemployed. The age group with the highest labor force participation rate is 45 to 54 years, with 92.8% or 310 individuals in the labor force. Within the labor force, the 16 to 19 years age range has the highest percentage of unemployed individuals, with 23.1% or 25 of them being unemployed.
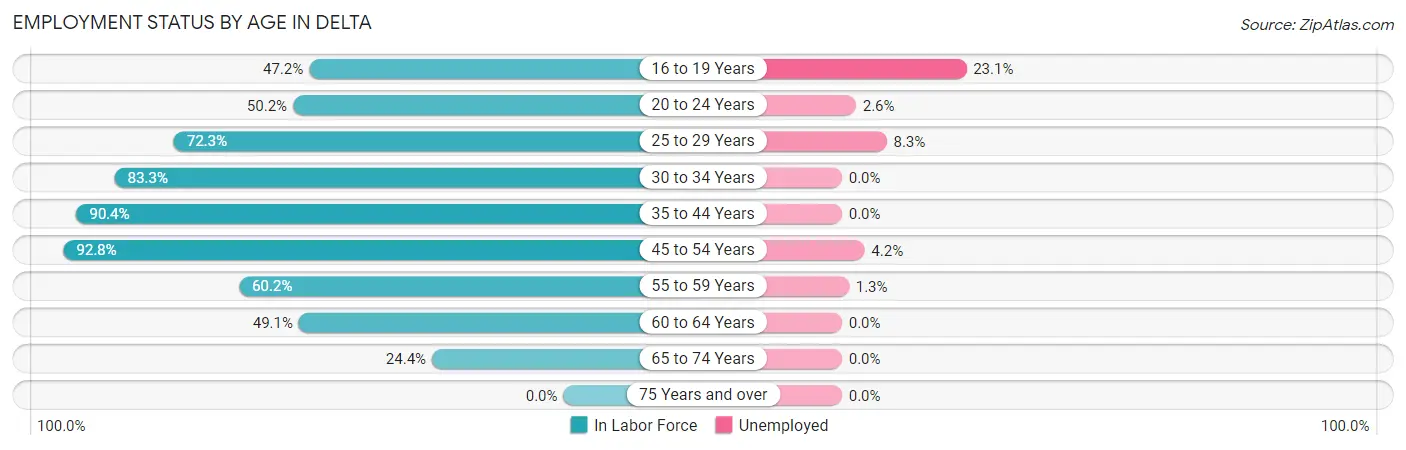
| Age Bracket | In Labor Force | Unemployed |
| 16 to 19 Years | 108 (47.2%) | 25 (23.1%) |
| 20 to 24 Years | 117 (50.2%) | 3 (2.6%) |
| 25 to 29 Years | 60 (72.3%) | 5 (8.3%) |
| 30 to 34 Years | 75 (83.3%) | 0 (0.0%) |
| 35 to 44 Years | 386 (90.4%) | 0 (0.0%) |
| 45 to 54 Years | 310 (92.8%) | 13 (4.2%) |
| 55 to 59 Years | 77 (60.2%) | 1 (1.3%) |
| 60 to 64 Years | 82 (49.1%) | 0 (0.0%) |
| 65 to 74 Years | 64 (24.4%) | 0 (0.0%) |
| 75 Years and over | 0 (0.0%) | 0 (0.0%) |
| Total | 1,279 (61.5%) | 47 (3.7%) |
Employment Status by Educational Attainment in Delta
According to labor force statistics for Delta, 80.6% of individuals (991) out of the total population between 25 and 64 years of age (1,229) are in the labor force, with 1.9% or 19 of them being unemployed. The group with the highest labor force participation rate are those with the educational attainment of bachelor's degree or higher, with 90.8% or 307 individuals in the labor force. Within the labor force, individuals with high school diploma education have the highest percentage of unemployment, with 5.3% or 17 of them being unemployed.
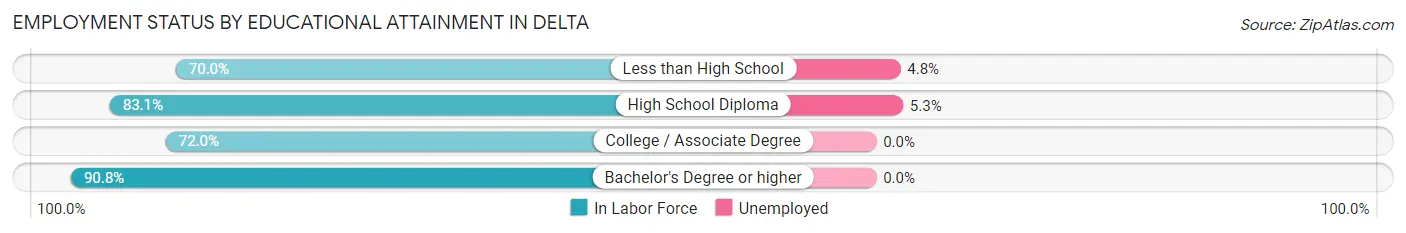
| Educational Attainment | In Labor Force | Unemployed |
| Less than High School | 42 (70.0%) | 3 (4.8%) |
| High School Diploma | 320 (83.1%) | 20 (5.3%) |
| College / Associate Degree | 321 (72.0%) | 0 (0.0%) |
| Bachelor's Degree or higher | 307 (90.8%) | 0 (0.0%) |
| Total | 991 (80.6%) | 23 (1.9%) |
Employment Occupations by Sex in Delta
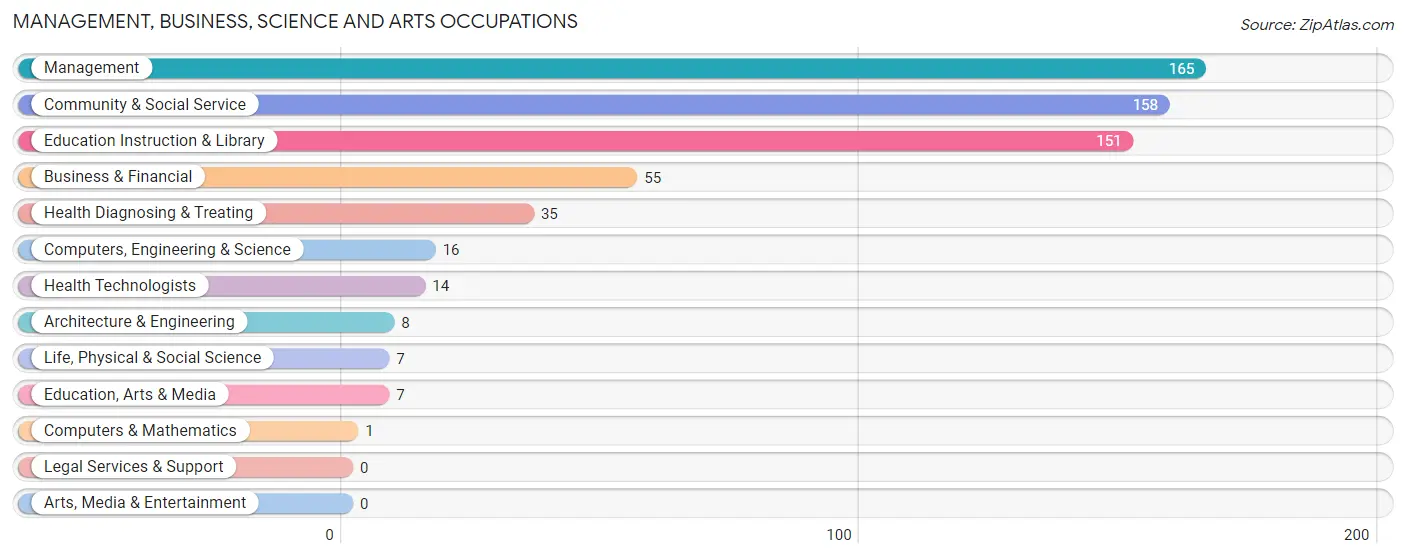
Management, Business, Science and Arts Occupations
The most common Management, Business, Science and Arts occupations in Delta are Management (165 | 13.4%), Community & Social Service (158 | 12.8%), Education Instruction & Library (151 | 12.3%), Business & Financial (55 | 4.5%), and Health Diagnosing & Treating (35 | 2.8%).
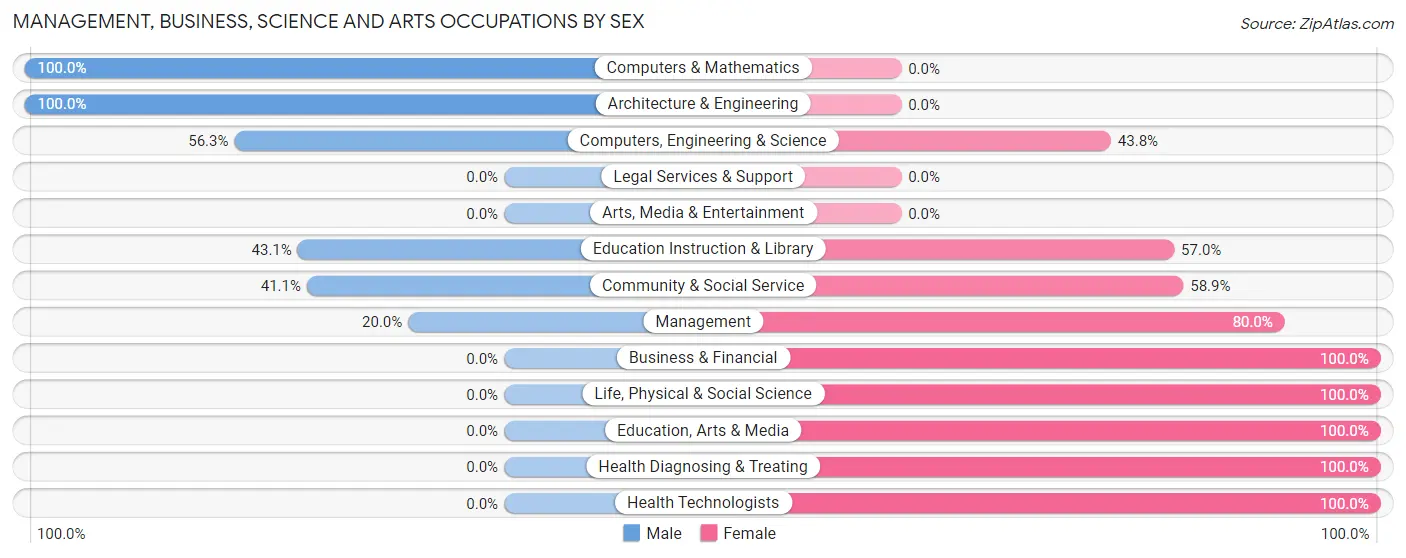
Management, Business, Science and Arts Occupations by Sex
Within the Management, Business, Science and Arts occupations in Delta, the most male-oriented occupations are Computers & Mathematics (100.0%), Architecture & Engineering (100.0%), and Computers, Engineering & Science (56.2%), while the most female-oriented occupations are Business & Financial (100.0%), Life, Physical & Social Science (100.0%), and Education, Arts & Media (100.0%).
| Occupation | Male | Female |
| Management | 33 (20.0%) | 132 (80.0%) |
| Business & Financial | 0 (0.0%) | 55 (100.0%) |
| Computers, Engineering & Science | 9 (56.2%) | 7 (43.8%) |
| Computers & Mathematics | 1 (100.0%) | 0 (0.0%) |
| Architecture & Engineering | 8 (100.0%) | 0 (0.0%) |
| Life, Physical & Social Science | 0 (0.0%) | 7 (100.0%) |
| Community & Social Service | 65 (41.1%) | 93 (58.9%) |
| Education, Arts & Media | 0 (0.0%) | 7 (100.0%) |
| Legal Services & Support | 0 (0.0%) | 0 (0.0%) |
| Education Instruction & Library | 65 (43.0%) | 86 (57.0%) |
| Arts, Media & Entertainment | 0 (0.0%) | 0 (0.0%) |
| Health Diagnosing & Treating | 0 (0.0%) | 35 (100.0%) |
| Health Technologists | 0 (0.0%) | 14 (100.0%) |
| Total (Category) | 107 (24.9%) | 322 (75.1%) |
| Total (Overall) | 627 (50.9%) | 605 (49.1%) |
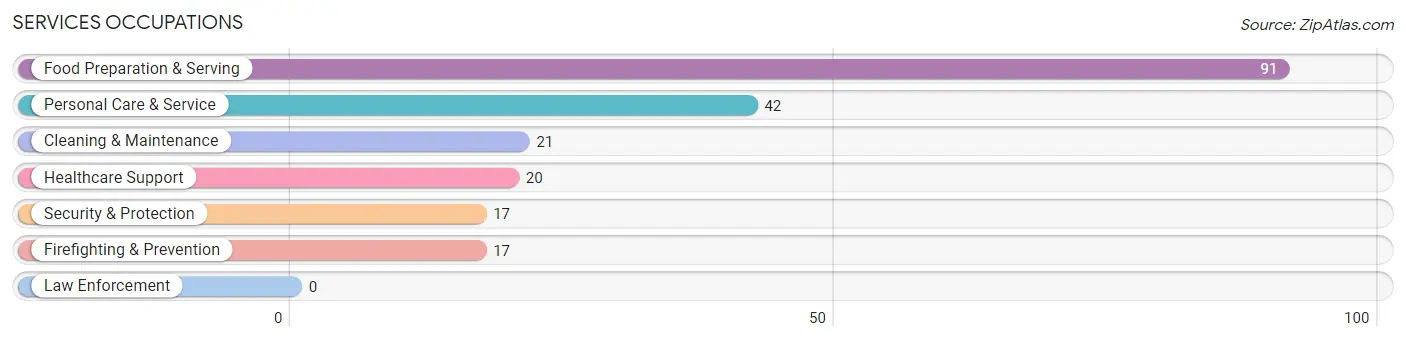
Services Occupations
The most common Services occupations in Delta are Food Preparation & Serving (91 | 7.4%), Personal Care & Service (42 | 3.4%), Cleaning & Maintenance (21 | 1.7%), Healthcare Support (20 | 1.6%), and Security & Protection (17 | 1.4%).
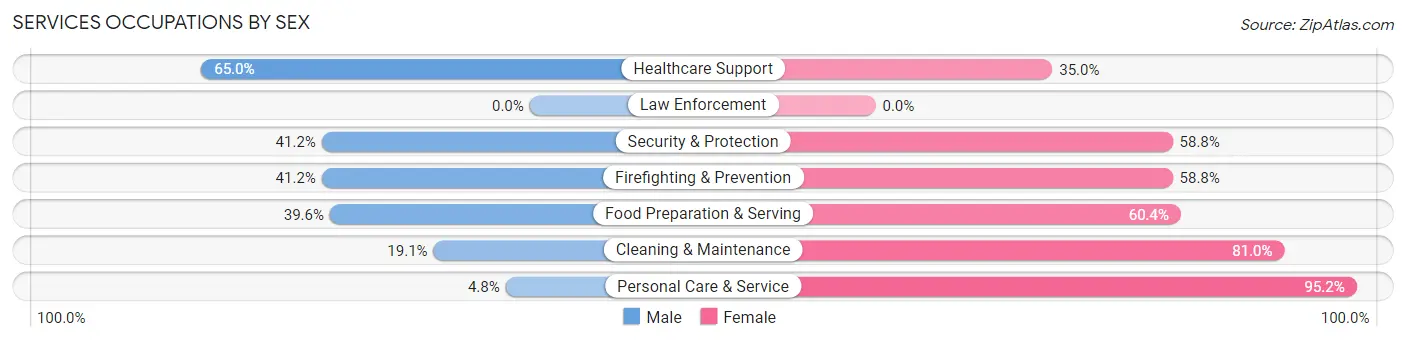
Services Occupations by Sex
Within the Services occupations in Delta, the most male-oriented occupations are Healthcare Support (65.0%), Security & Protection (41.2%), and Firefighting & Prevention (41.2%), while the most female-oriented occupations are Personal Care & Service (95.2%), Cleaning & Maintenance (80.9%), and Food Preparation & Serving (60.4%).
| Occupation | Male | Female |
| Healthcare Support | 13 (65.0%) | 7 (35.0%) |
| Security & Protection | 7 (41.2%) | 10 (58.8%) |
| Firefighting & Prevention | 7 (41.2%) | 10 (58.8%) |
| Law Enforcement | 0 (0.0%) | 0 (0.0%) |
| Food Preparation & Serving | 36 (39.6%) | 55 (60.4%) |
| Cleaning & Maintenance | 4 (19.1%) | 17 (80.9%) |
| Personal Care & Service | 2 (4.8%) | 40 (95.2%) |
| Total (Category) | 62 (32.5%) | 129 (67.5%) |
| Total (Overall) | 627 (50.9%) | 605 (49.1%) |
Sales and Office Occupations
The most common Sales and Office occupations in Delta are Office & Administration (138 | 11.2%), and Sales & Related (81 | 6.6%).

Sales and Office Occupations by Sex
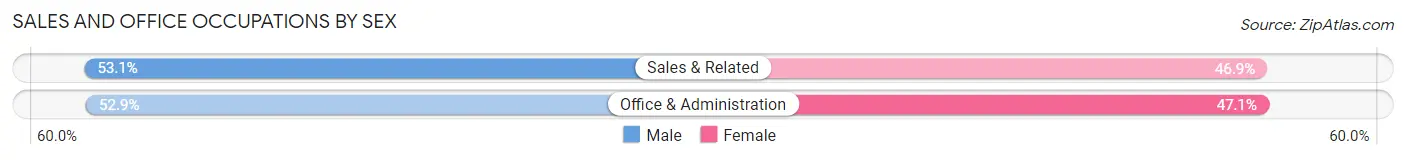
| Occupation | Male | Female |
| Sales & Related | 43 (53.1%) | 38 (46.9%) |
| Office & Administration | 73 (52.9%) | 65 (47.1%) |
| Total (Category) | 116 (53.0%) | 103 (47.0%) |
| Total (Overall) | 627 (50.9%) | 605 (49.1%) |
Natural Resources, Construction and Maintenance Occupations
The most common Natural Resources, Construction and Maintenance occupations in Delta are Installation, Maintenance & Repair (94 | 7.6%), and Construction & Extraction (70 | 5.7%).
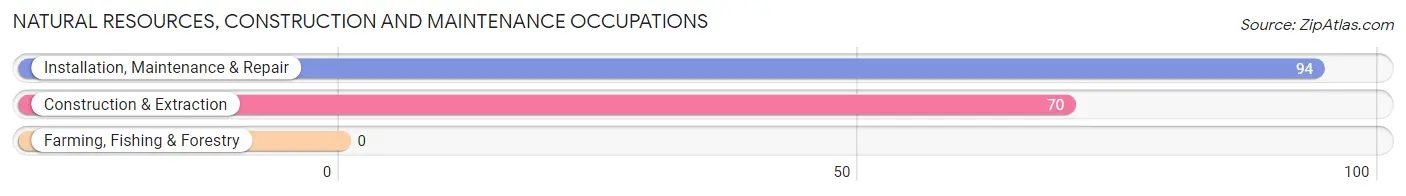
Natural Resources, Construction and Maintenance Occupations by Sex

| Occupation | Male | Female |
| Farming, Fishing & Forestry | 0 (0.0%) | 0 (0.0%) |
| Construction & Extraction | 70 (100.0%) | 0 (0.0%) |
| Installation, Maintenance & Repair | 94 (100.0%) | 0 (0.0%) |
| Total (Category) | 164 (100.0%) | 0 (0.0%) |
| Total (Overall) | 627 (50.9%) | 605 (49.1%) |
Production, Transportation and Moving Occupations
The most common Production, Transportation and Moving occupations in Delta are Production (145 | 11.8%), Transportation (57 | 4.6%), and Material Moving (27 | 2.2%).
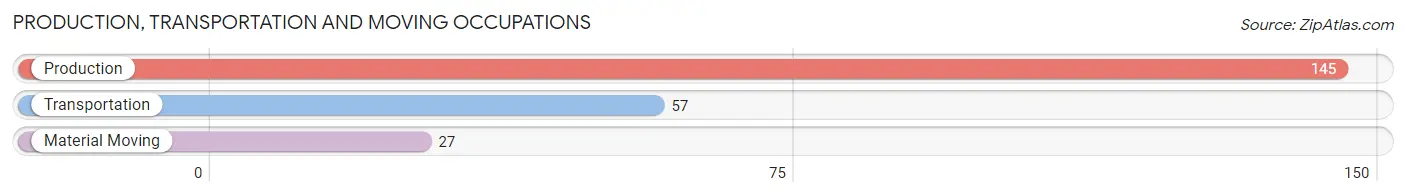
Production, Transportation and Moving Occupations by Sex
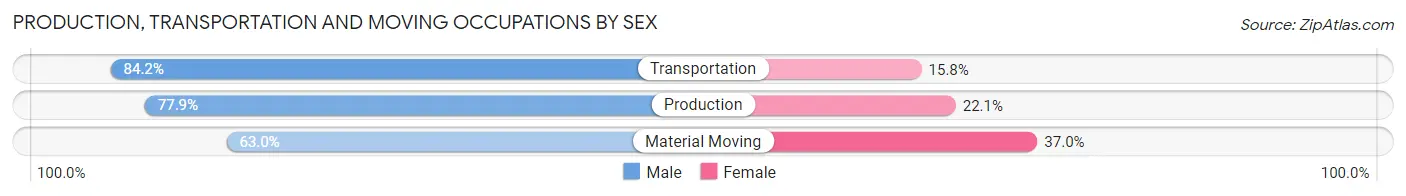
| Occupation | Male | Female |
| Production | 113 (77.9%) | 32 (22.1%) |
| Transportation | 48 (84.2%) | 9 (15.8%) |
| Material Moving | 17 (63.0%) | 10 (37.0%) |
| Total (Category) | 178 (77.7%) | 51 (22.3%) |
| Total (Overall) | 627 (50.9%) | 605 (49.1%) |
Employment Industries by Sex in Delta
Employment Industries in Delta
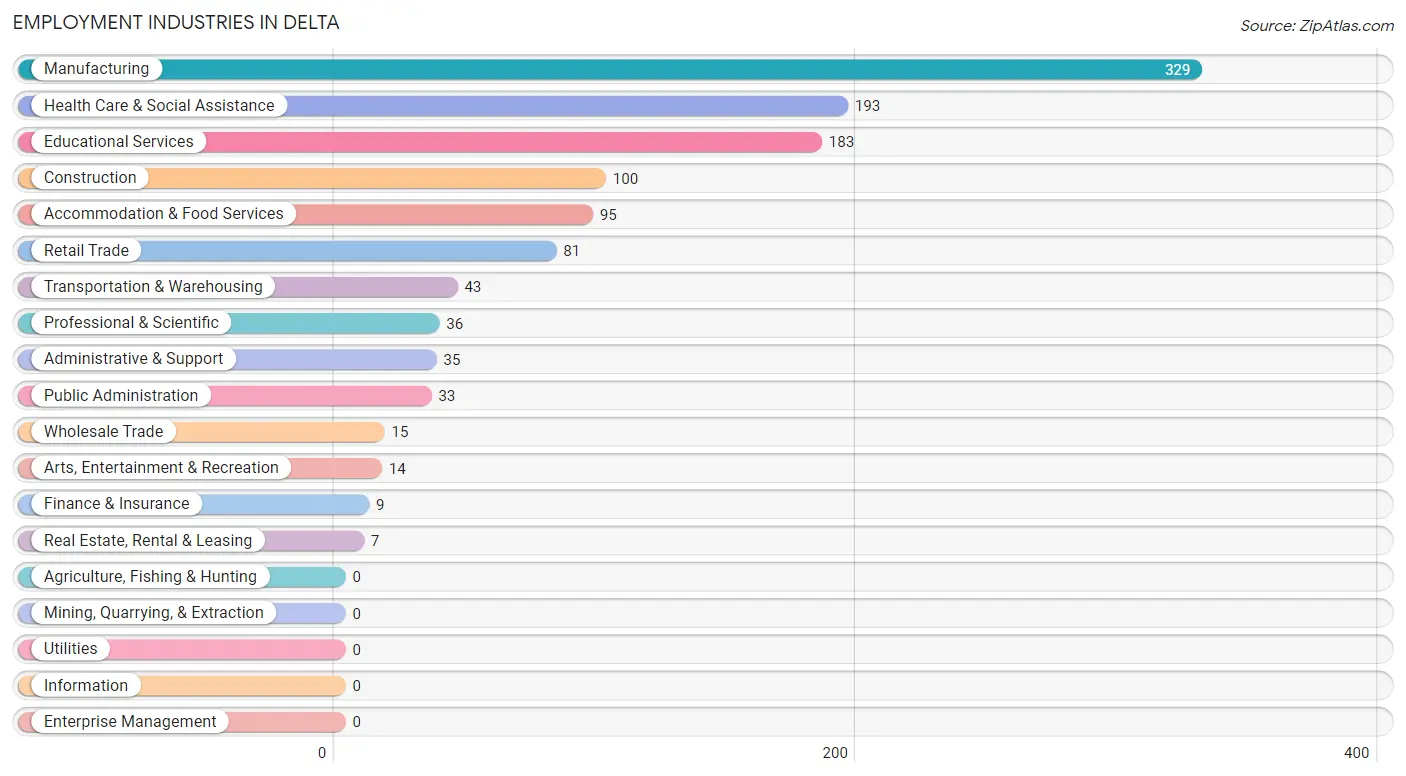
The major employment industries in Delta include Manufacturing (329 | 26.7%), Health Care & Social Assistance (193 | 15.7%), Educational Services (183 | 14.8%), Construction (100 | 8.1%), and Accommodation & Food Services (95 | 7.7%).
Employment Industries by Sex in Delta
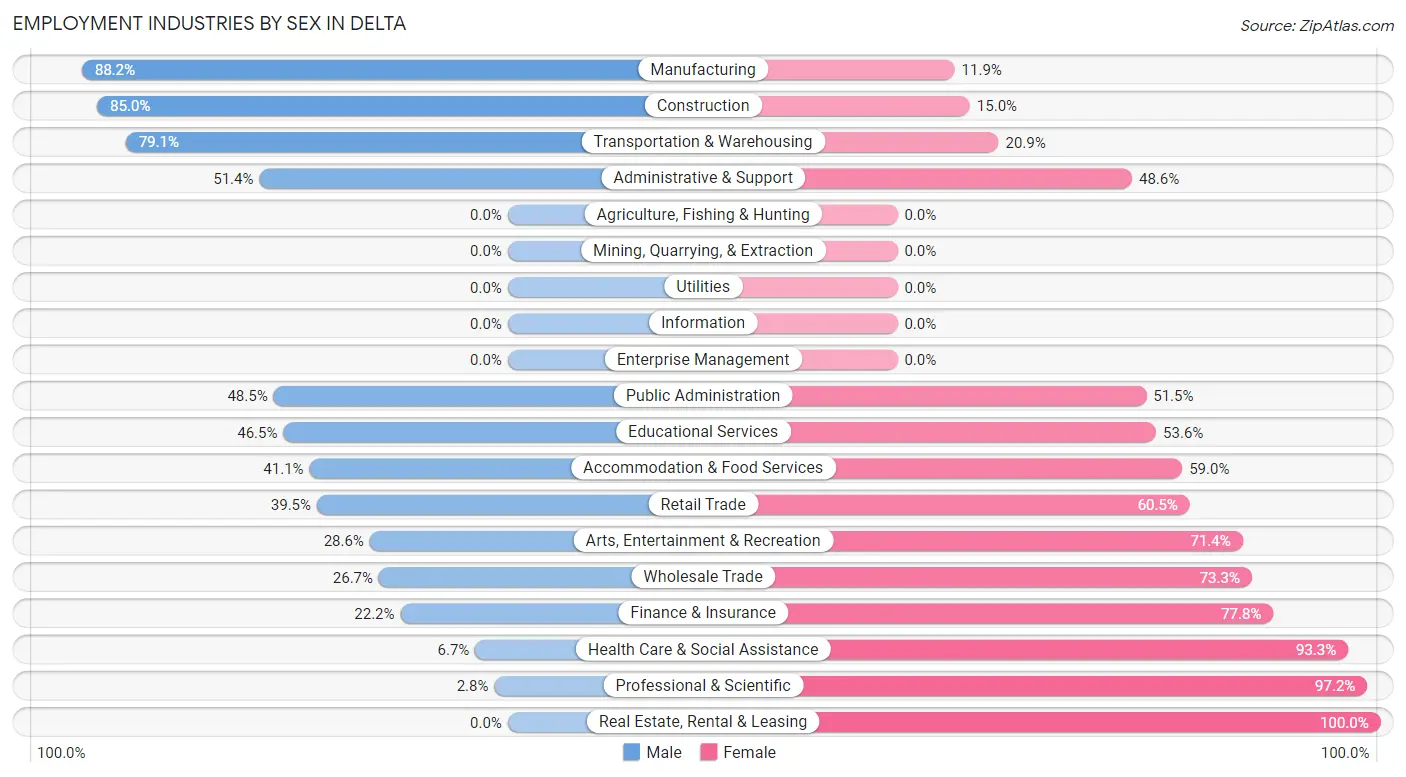
The Delta industries that see more men than women are Manufacturing (88.1%), Construction (85.0%), and Transportation & Warehousing (79.1%), whereas the industries that tend to have a higher number of women are Real Estate, Rental & Leasing (100.0%), Professional & Scientific (97.2%), and Health Care & Social Assistance (93.3%).
| Industry | Male | Female |
| Agriculture, Fishing & Hunting | 0 (0.0%) | 0 (0.0%) |
| Mining, Quarrying, & Extraction | 0 (0.0%) | 0 (0.0%) |
| Construction | 85 (85.0%) | 15 (15.0%) |
| Manufacturing | 290 (88.1%) | 39 (11.8%) |
| Wholesale Trade | 4 (26.7%) | 11 (73.3%) |
| Retail Trade | 32 (39.5%) | 49 (60.5%) |
| Transportation & Warehousing | 34 (79.1%) | 9 (20.9%) |
| Utilities | 0 (0.0%) | 0 (0.0%) |
| Information | 0 (0.0%) | 0 (0.0%) |
| Finance & Insurance | 2 (22.2%) | 7 (77.8%) |
| Real Estate, Rental & Leasing | 0 (0.0%) | 7 (100.0%) |
| Professional & Scientific | 1 (2.8%) | 35 (97.2%) |
| Enterprise Management | 0 (0.0%) | 0 (0.0%) |
| Administrative & Support | 18 (51.4%) | 17 (48.6%) |
| Educational Services | 85 (46.5%) | 98 (53.5%) |
| Health Care & Social Assistance | 13 (6.7%) | 180 (93.3%) |
| Arts, Entertainment & Recreation | 4 (28.6%) | 10 (71.4%) |
| Accommodation & Food Services | 39 (41.0%) | 56 (59.0%) |
| Public Administration | 16 (48.5%) | 17 (51.5%) |
| Total | 627 (50.9%) | 605 (49.1%) |
Education in Delta
School Enrollment in Delta
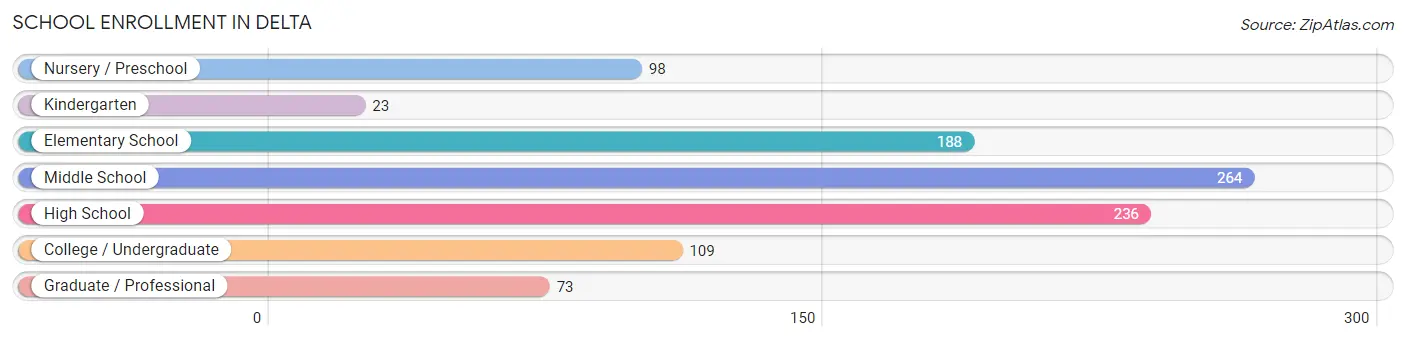
The most common levels of schooling among the 991 students in Delta are middle school (264 | 26.6%), high school (236 | 23.8%), and elementary school (188 | 19.0%).
| School Level | # Students | % Students |
| Nursery / Preschool | 98 | 9.9% |
| Kindergarten | 23 | 2.3% |
| Elementary School | 188 | 19.0% |
| Middle School | 264 | 26.6% |
| High School | 236 | 23.8% |
| College / Undergraduate | 109 | 11.0% |
| Graduate / Professional | 73 | 7.4% |
| Total | 991 | 100.0% |
School Enrollment by Age by Funding Source in Delta
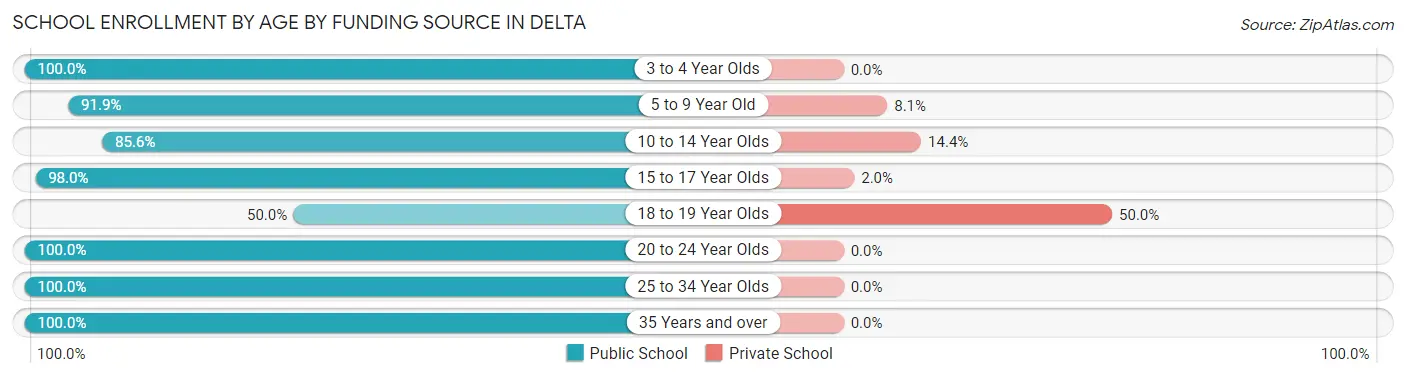
Out of a total of 991 students who are enrolled in schools in Delta, 80 (8.1%) attend a private institution, while the remaining 911 (91.9%) are enrolled in public schools. The age group of 18 to 19 year olds has the highest likelihood of being enrolled in private schools, with 17 (50.0% in the age bracket) enrolled. Conversely, the age group of 3 to 4 year olds has the lowest likelihood of being enrolled in a private school, with 87 (100.0% in the age bracket) attending a public institution.
| Age Bracket | Public School | Private School |
| 3 to 4 Year Olds | 87 (100.0%) | 0 (0.0%) |
| 5 to 9 Year Old | 181 (91.9%) | 16 (8.1%) |
| 10 to 14 Year Olds | 255 (85.6%) | 43 (14.4%) |
| 15 to 17 Year Olds | 198 (98.0%) | 4 (2.0%) |
| 18 to 19 Year Olds | 17 (50.0%) | 17 (50.0%) |
| 20 to 24 Year Olds | 51 (100.0%) | 0 (0.0%) |
| 25 to 34 Year Olds | 35 (100.0%) | 0 (0.0%) |
| 35 Years and over | 87 (100.0%) | 0 (0.0%) |
| Total | 911 (91.9%) | 80 (8.1%) |
Educational Attainment by Field of Study in Delta
Education (219 | 57.2%), business (76 | 19.8%), science & technology (39 | 10.2%), arts & humanities (22 | 5.7%), and literature & languages (10 | 2.6%) are the most common fields of study among 383 individuals in Delta who have obtained a bachelor's degree or higher.
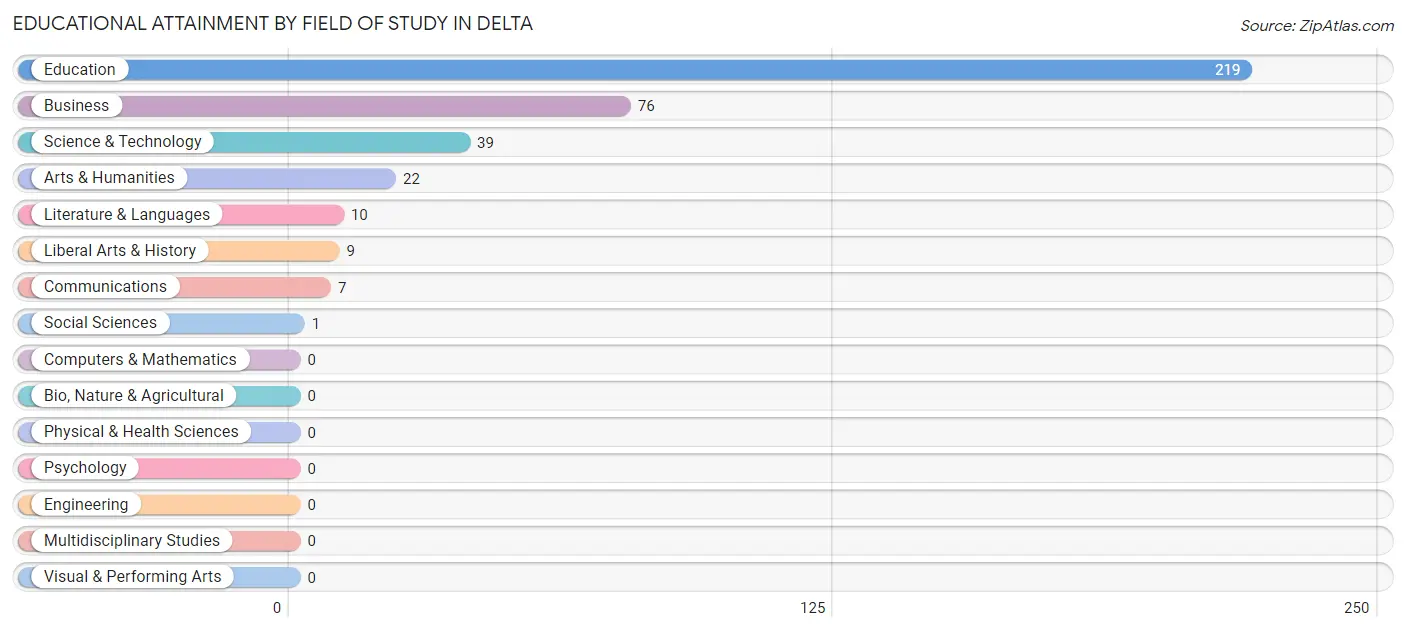
| Field of Study | # Graduates | % Graduates |
| Computers & Mathematics | 0 | 0.0% |
| Bio, Nature & Agricultural | 0 | 0.0% |
| Physical & Health Sciences | 0 | 0.0% |
| Psychology | 0 | 0.0% |
| Social Sciences | 1 | 0.3% |
| Engineering | 0 | 0.0% |
| Multidisciplinary Studies | 0 | 0.0% |
| Science & Technology | 39 | 10.2% |
| Business | 76 | 19.8% |
| Education | 219 | 57.2% |
| Literature & Languages | 10 | 2.6% |
| Liberal Arts & History | 9 | 2.4% |
| Visual & Performing Arts | 0 | 0.0% |
| Communications | 7 | 1.8% |
| Arts & Humanities | 22 | 5.7% |
| Total | 383 | 100.0% |
Transportation & Commute in Delta
Vehicle Availability by Sex in Delta
The most prevalent vehicle ownership categories in Delta are males with 2 vehicles (256, accounting for 41.6%) and females with 2 vehicles (232, making up 42.3%).
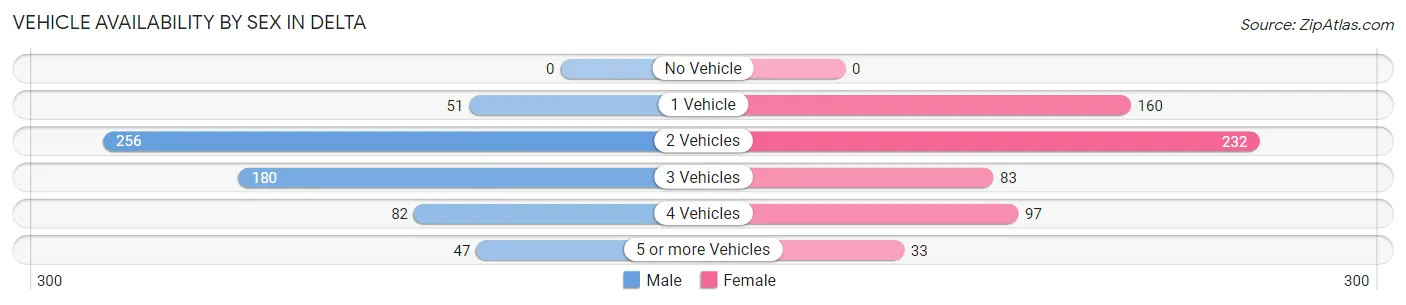
| Vehicles Available | Male | Female |
| No Vehicle | 0 (0.0%) | 0 (0.0%) |
| 1 Vehicle | 51 (8.3%) | 160 (26.5%) |
| 2 Vehicles | 256 (41.6%) | 232 (38.4%) |
| 3 Vehicles | 180 (29.2%) | 83 (13.7%) |
| 4 Vehicles | 82 (13.3%) | 97 (16.0%) |
| 5 or more Vehicles | 47 (7.6%) | 33 (5.4%) |
| Total | 616 (100.0%) | 605 (100.0%) |
Commute Time in Delta
The most frequently occuring commute durations in Delta are 5 to 9 minutes (204 commuters, 17.7%), 15 to 19 minutes (202 commuters, 17.5%), and 20 to 24 minutes (169 commuters, 14.7%).
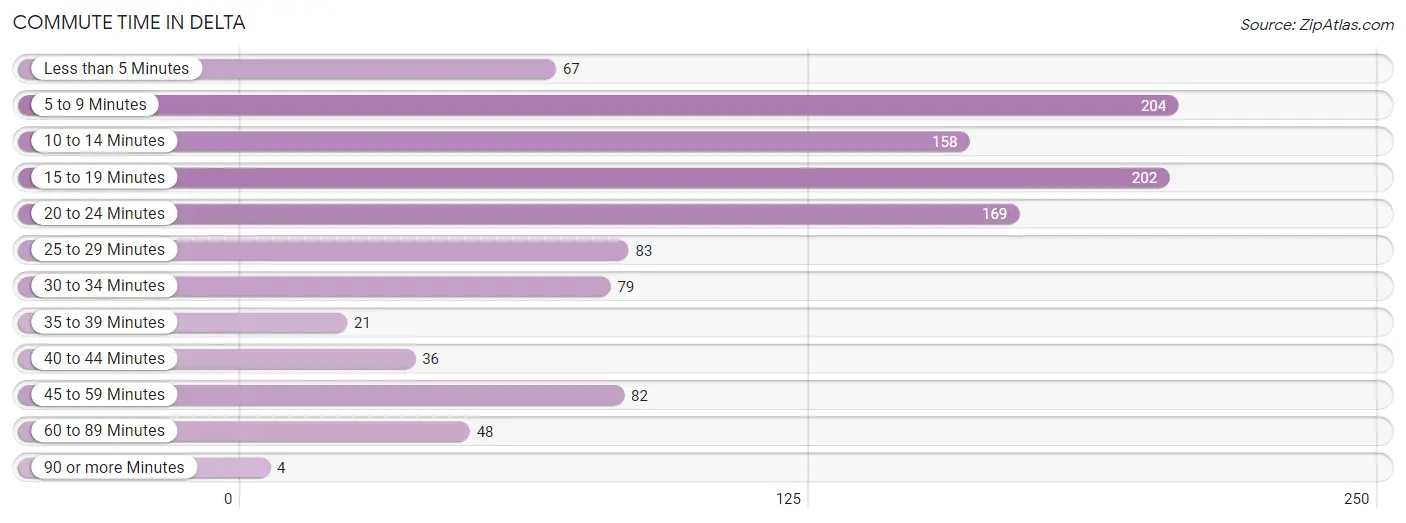
| Commute Time | # Commuters | % Commuters |
| Less than 5 Minutes | 67 | 5.8% |
| 5 to 9 Minutes | 204 | 17.7% |
| 10 to 14 Minutes | 158 | 13.7% |
| 15 to 19 Minutes | 202 | 17.5% |
| 20 to 24 Minutes | 169 | 14.7% |
| 25 to 29 Minutes | 83 | 7.2% |
| 30 to 34 Minutes | 79 | 6.9% |
| 35 to 39 Minutes | 21 | 1.8% |
| 40 to 44 Minutes | 36 | 3.1% |
| 45 to 59 Minutes | 82 | 7.1% |
| 60 to 89 Minutes | 48 | 4.2% |
| 90 or more Minutes | 4 | 0.4% |
Commute Time by Sex in Delta
The most common commute times in Delta are 5 to 9 minutes (156 commuters, 27.6%) for males and 15 to 19 minutes (113 commuters, 19.2%) for females.
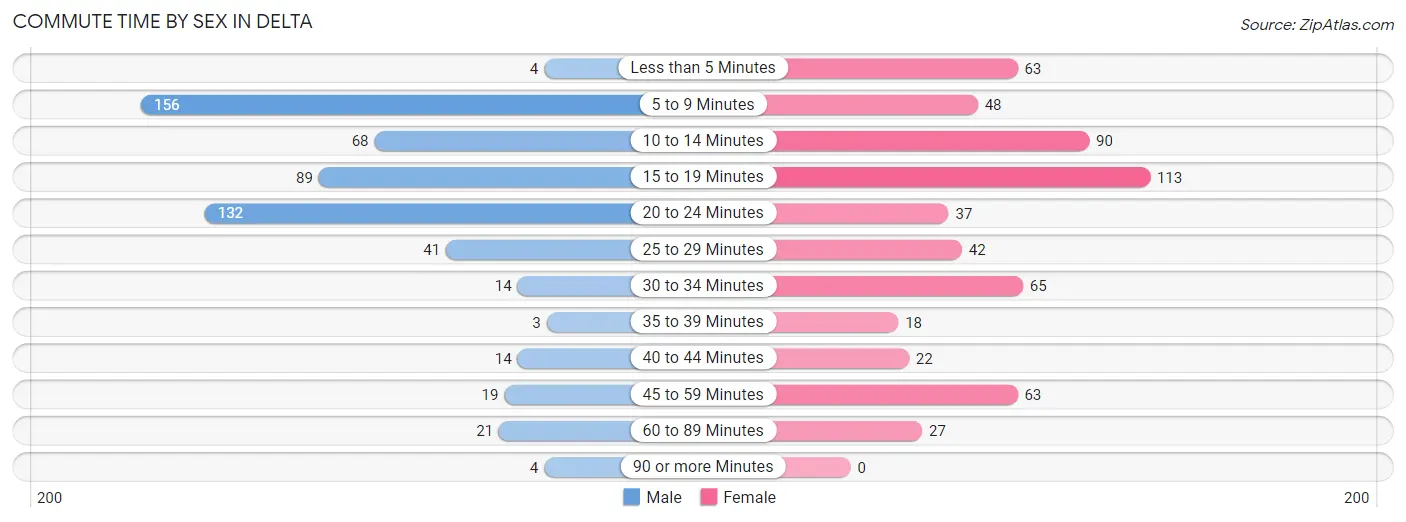
| Commute Time | Male | Female |
| Less than 5 Minutes | 4 (0.7%) | 63 (10.7%) |
| 5 to 9 Minutes | 156 (27.6%) | 48 (8.2%) |
| 10 to 14 Minutes | 68 (12.0%) | 90 (15.3%) |
| 15 to 19 Minutes | 89 (15.8%) | 113 (19.2%) |
| 20 to 24 Minutes | 132 (23.4%) | 37 (6.3%) |
| 25 to 29 Minutes | 41 (7.3%) | 42 (7.1%) |
| 30 to 34 Minutes | 14 (2.5%) | 65 (11.1%) |
| 35 to 39 Minutes | 3 (0.5%) | 18 (3.1%) |
| 40 to 44 Minutes | 14 (2.5%) | 22 (3.7%) |
| 45 to 59 Minutes | 19 (3.4%) | 63 (10.7%) |
| 60 to 89 Minutes | 21 (3.7%) | 27 (4.6%) |
| 90 or more Minutes | 4 (0.7%) | 0 (0.0%) |
Time of Departure to Work by Sex in Delta
The most frequent times of departure to work in Delta are 6:00 AM to 6:29 AM (151, 26.7%) for males and 6:30 AM to 6:59 AM (100, 17.0%) for females.
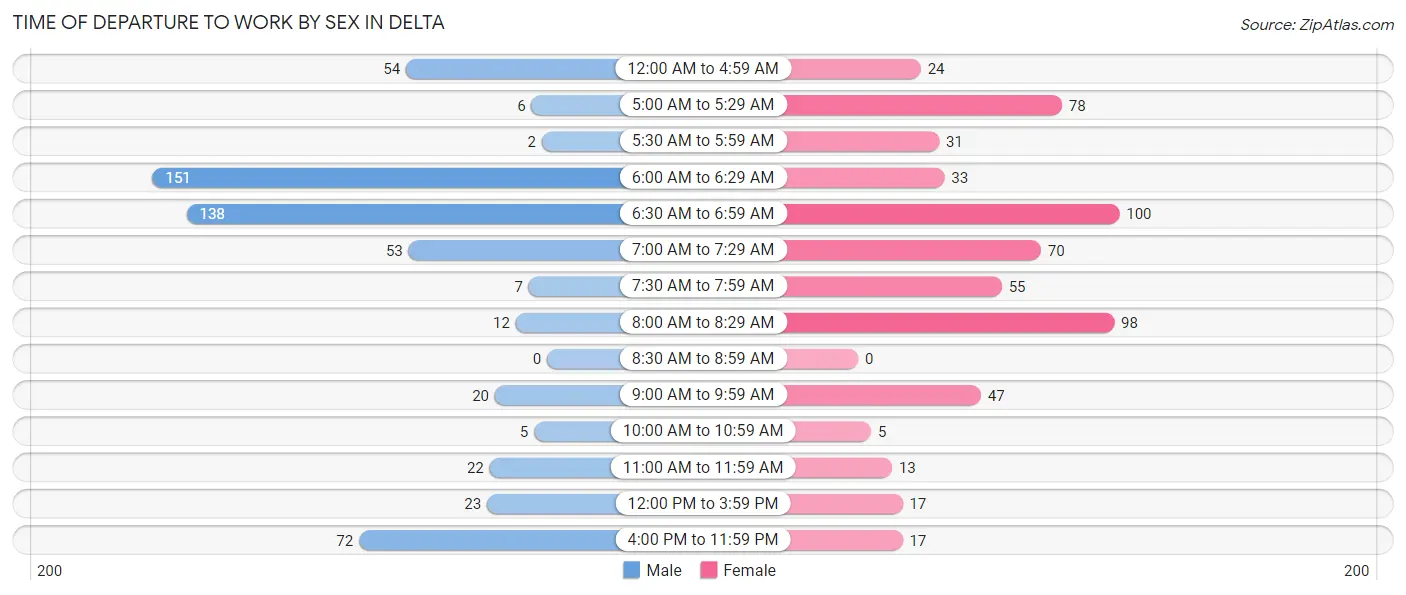
| Time of Departure | Male | Female |
| 12:00 AM to 4:59 AM | 54 (9.6%) | 24 (4.1%) |
| 5:00 AM to 5:29 AM | 6 (1.1%) | 78 (13.3%) |
| 5:30 AM to 5:59 AM | 2 (0.4%) | 31 (5.3%) |
| 6:00 AM to 6:29 AM | 151 (26.7%) | 33 (5.6%) |
| 6:30 AM to 6:59 AM | 138 (24.4%) | 100 (17.0%) |
| 7:00 AM to 7:29 AM | 53 (9.4%) | 70 (11.9%) |
| 7:30 AM to 7:59 AM | 7 (1.2%) | 55 (9.3%) |
| 8:00 AM to 8:29 AM | 12 (2.1%) | 98 (16.7%) |
| 8:30 AM to 8:59 AM | 0 (0.0%) | 0 (0.0%) |
| 9:00 AM to 9:59 AM | 20 (3.5%) | 47 (8.0%) |
| 10:00 AM to 10:59 AM | 5 (0.9%) | 5 (0.9%) |
| 11:00 AM to 11:59 AM | 22 (3.9%) | 13 (2.2%) |
| 12:00 PM to 3:59 PM | 23 (4.1%) | 17 (2.9%) |
| 4:00 PM to 11:59 PM | 72 (12.7%) | 17 (2.9%) |
| Total | 565 (100.0%) | 588 (100.0%) |
Housing Occupancy in Delta
Occupancy by Ownership in Delta
Of the total 1,098 dwellings in Delta, owner-occupied units account for 830 (75.6%), while renter-occupied units make up 268 (24.4%).
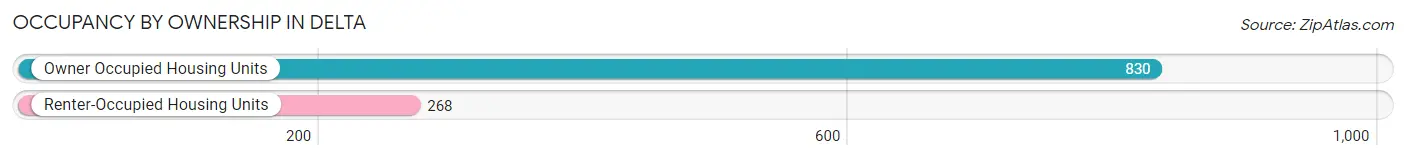
| Occupancy | # Housing Units | % Housing Units |
| Owner Occupied Housing Units | 830 | 75.6% |
| Renter-Occupied Housing Units | 268 | 24.4% |
| Total Occupied Housing Units | 1,098 | 100.0% |
Occupancy by Household Size in Delta
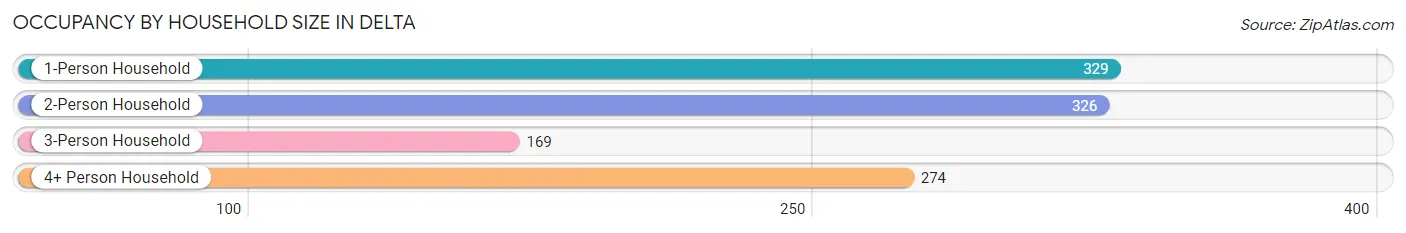
| Household Size | # Housing Units | % Housing Units |
| 1-Person Household | 329 | 30.0% |
| 2-Person Household | 326 | 29.7% |
| 3-Person Household | 169 | 15.4% |
| 4+ Person Household | 274 | 24.9% |
| Total Housing Units | 1,098 | 100.0% |
Occupancy by Ownership by Household Size in Delta
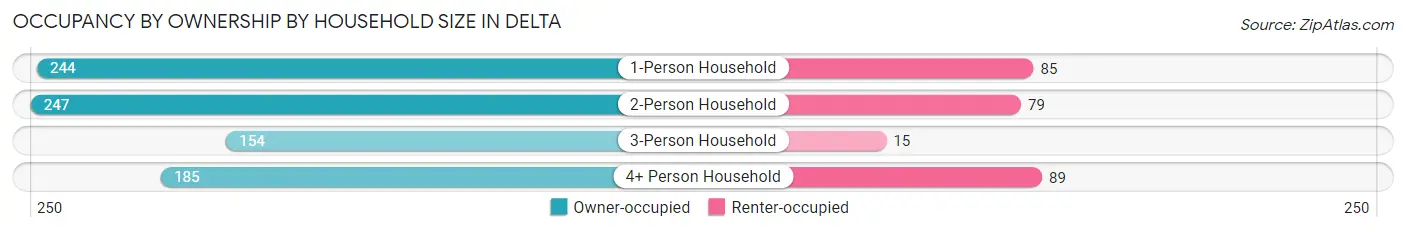
| Household Size | Owner-occupied | Renter-occupied |
| 1-Person Household | 244 (74.2%) | 85 (25.8%) |
| 2-Person Household | 247 (75.8%) | 79 (24.2%) |
| 3-Person Household | 154 (91.1%) | 15 (8.9%) |
| 4+ Person Household | 185 (67.5%) | 89 (32.5%) |
| Total Housing Units | 830 (75.6%) | 268 (24.4%) |
Occupancy by Educational Attainment in Delta
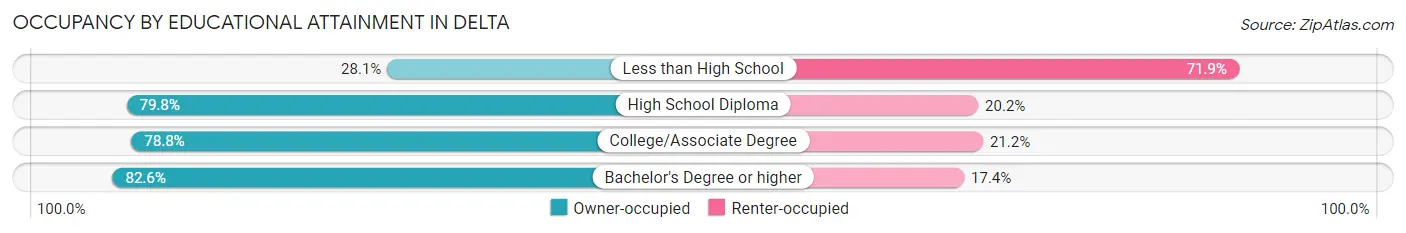
| Household Size | Owner-occupied | Renter-occupied |
| Less than High School | 27 (28.1%) | 69 (71.9%) |
| High School Diploma | 296 (79.8%) | 75 (20.2%) |
| College/Associate Degree | 294 (78.8%) | 79 (21.2%) |
| Bachelor's Degree or higher | 213 (82.6%) | 45 (17.4%) |
Occupancy by Age of Householder in Delta
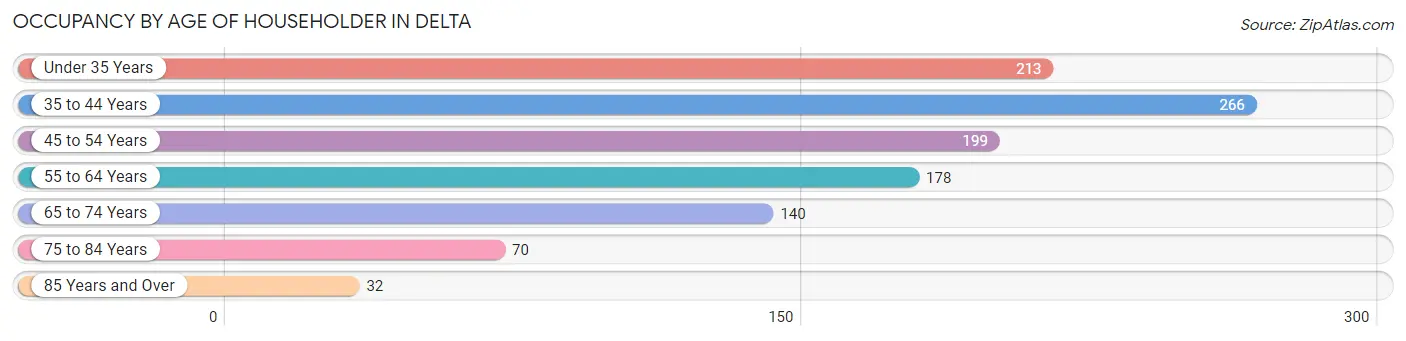
| Age Bracket | # Households | % Households |
| Under 35 Years | 213 | 19.4% |
| 35 to 44 Years | 266 | 24.2% |
| 45 to 54 Years | 199 | 18.1% |
| 55 to 64 Years | 178 | 16.2% |
| 65 to 74 Years | 140 | 12.8% |
| 75 to 84 Years | 70 | 6.4% |
| 85 Years and Over | 32 | 2.9% |
| Total | 1,098 | 100.0% |
Housing Finances in Delta
Median Income by Occupancy in Delta
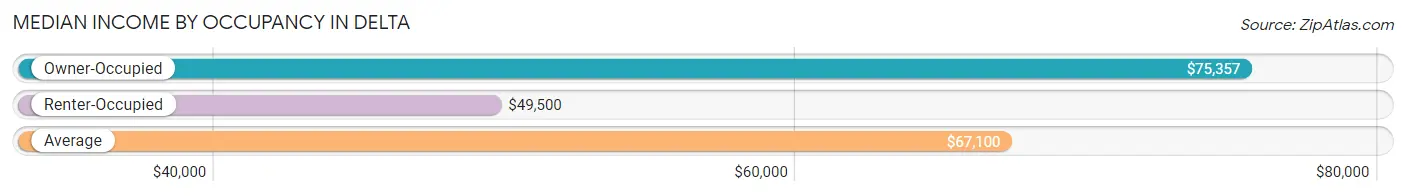
| Occupancy Type | # Households | Median Income |
| Owner-Occupied | 830 (75.6%) | $75,357 |
| Renter-Occupied | 268 (24.4%) | $49,500 |
| Average | 1,098 (100.0%) | $67,100 |
Occupancy by Householder Income Bracket in Delta
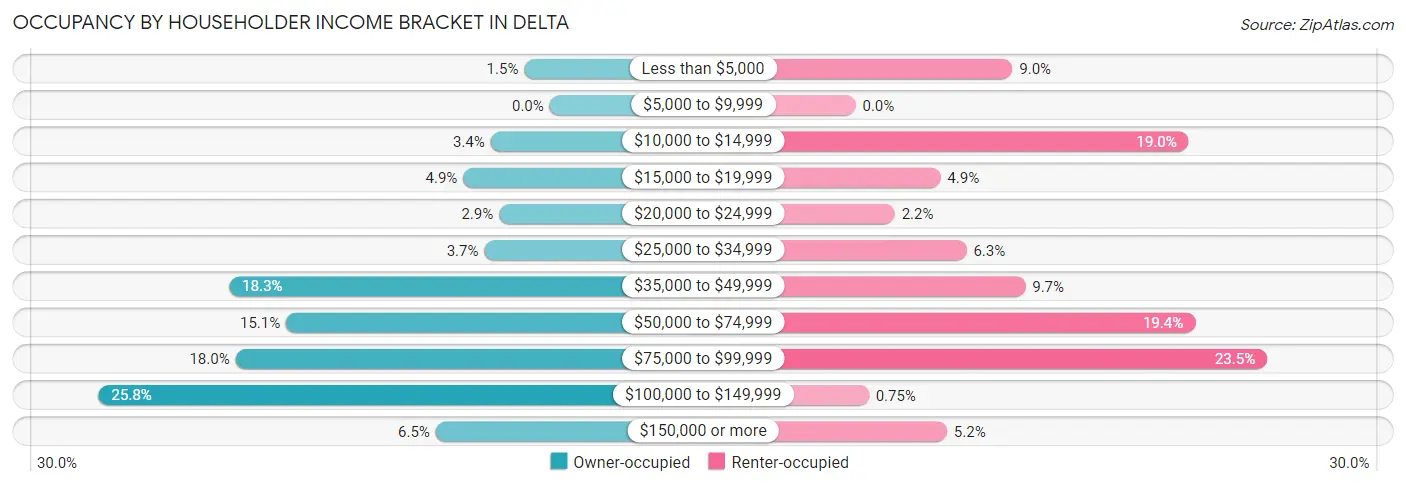
| Income Bracket | Owner-occupied | Renter-occupied |
| Less than $5,000 | 12 (1.5%) | 24 (9.0%) |
| $5,000 to $9,999 | 0 (0.0%) | 0 (0.0%) |
| $10,000 to $14,999 | 28 (3.4%) | 51 (19.0%) |
| $15,000 to $19,999 | 41 (4.9%) | 13 (4.9%) |
| $20,000 to $24,999 | 24 (2.9%) | 6 (2.2%) |
| $25,000 to $34,999 | 31 (3.7%) | 17 (6.3%) |
| $35,000 to $49,999 | 152 (18.3%) | 26 (9.7%) |
| $50,000 to $74,999 | 125 (15.1%) | 52 (19.4%) |
| $75,000 to $99,999 | 149 (17.9%) | 63 (23.5%) |
| $100,000 to $149,999 | 214 (25.8%) | 2 (0.7%) |
| $150,000 or more | 54 (6.5%) | 14 (5.2%) |
| Total | 830 (100.0%) | 268 (100.0%) |
Monthly Housing Cost Tiers in Delta
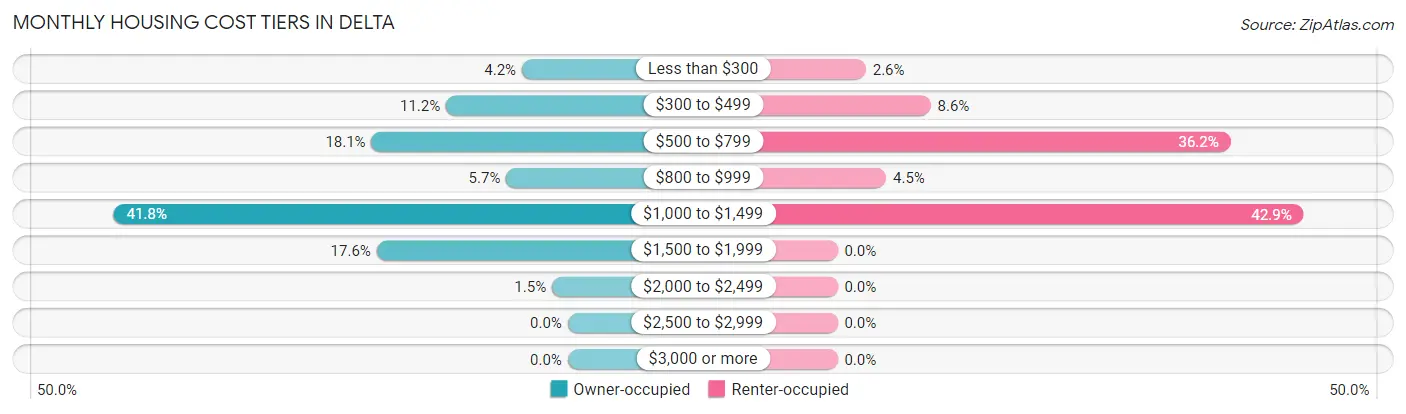
| Monthly Cost | Owner-occupied | Renter-occupied |
| Less than $300 | 35 (4.2%) | 7 (2.6%) |
| $300 to $499 | 93 (11.2%) | 23 (8.6%) |
| $500 to $799 | 150 (18.1%) | 97 (36.2%) |
| $800 to $999 | 47 (5.7%) | 12 (4.5%) |
| $1,000 to $1,499 | 347 (41.8%) | 115 (42.9%) |
| $1,500 to $1,999 | 146 (17.6%) | 0 (0.0%) |
| $2,000 to $2,499 | 12 (1.5%) | 0 (0.0%) |
| $2,500 to $2,999 | 0 (0.0%) | 0 (0.0%) |
| $3,000 or more | 0 (0.0%) | 0 (0.0%) |
| Total | 830 (100.0%) | 268 (100.0%) |
Physical Housing Characteristics in Delta
Housing Structures in Delta
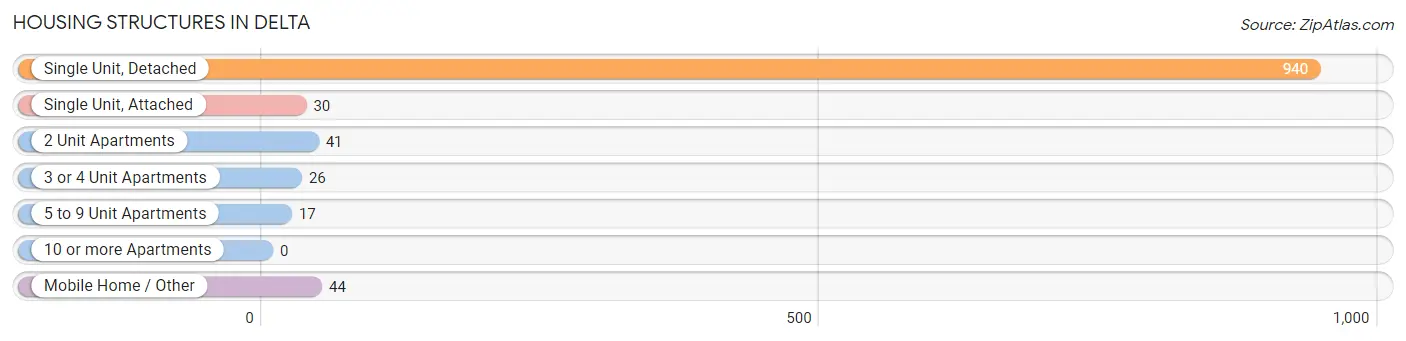
| Structure Type | # Housing Units | % Housing Units |
| Single Unit, Detached | 940 | 85.6% |
| Single Unit, Attached | 30 | 2.7% |
| 2 Unit Apartments | 41 | 3.7% |
| 3 or 4 Unit Apartments | 26 | 2.4% |
| 5 to 9 Unit Apartments | 17 | 1.5% |
| 10 or more Apartments | 0 | 0.0% |
| Mobile Home / Other | 44 | 4.0% |
| Total | 1,098 | 100.0% |
Housing Structures by Occupancy in Delta
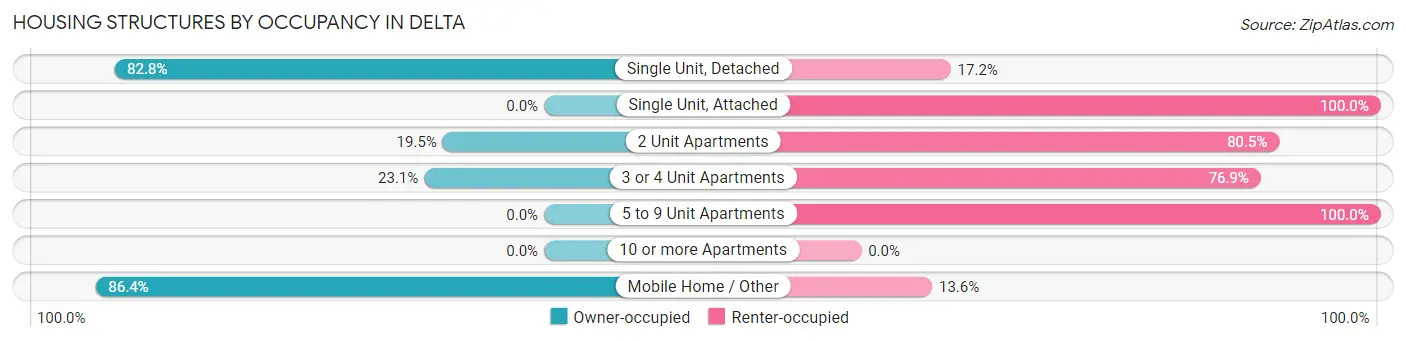
| Structure Type | Owner-occupied | Renter-occupied |
| Single Unit, Detached | 778 (82.8%) | 162 (17.2%) |
| Single Unit, Attached | 0 (0.0%) | 30 (100.0%) |
| 2 Unit Apartments | 8 (19.5%) | 33 (80.5%) |
| 3 or 4 Unit Apartments | 6 (23.1%) | 20 (76.9%) |
| 5 to 9 Unit Apartments | 0 (0.0%) | 17 (100.0%) |
| 10 or more Apartments | 0 (0.0%) | 0 (0.0%) |
| Mobile Home / Other | 38 (86.4%) | 6 (13.6%) |
| Total | 830 (75.6%) | 268 (24.4%) |
Housing Structures by Number of Rooms in Delta
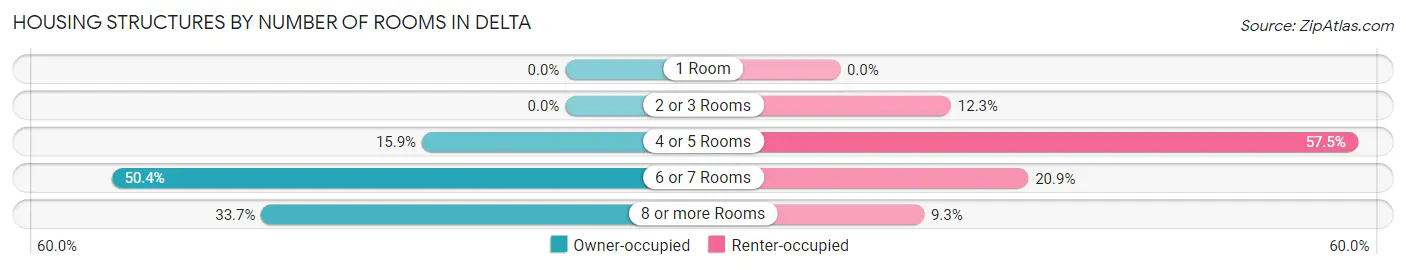
| Number of Rooms | Owner-occupied | Renter-occupied |
| 1 Room | 0 (0.0%) | 0 (0.0%) |
| 2 or 3 Rooms | 0 (0.0%) | 33 (12.3%) |
| 4 or 5 Rooms | 132 (15.9%) | 154 (57.5%) |
| 6 or 7 Rooms | 418 (50.4%) | 56 (20.9%) |
| 8 or more Rooms | 280 (33.7%) | 25 (9.3%) |
| Total | 830 (100.0%) | 268 (100.0%) |
Housing Structure by Heating Type in Delta
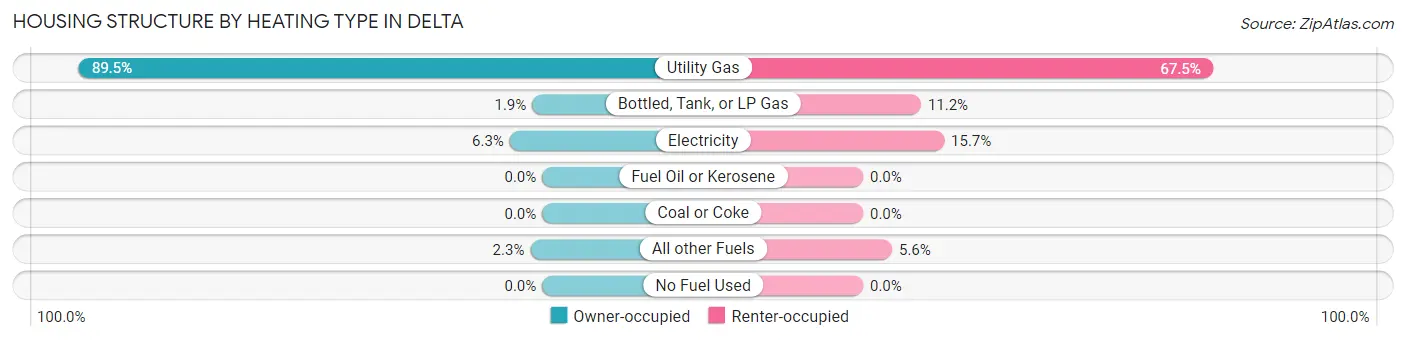
| Heating Type | Owner-occupied | Renter-occupied |
| Utility Gas | 743 (89.5%) | 181 (67.5%) |
| Bottled, Tank, or LP Gas | 16 (1.9%) | 30 (11.2%) |
| Electricity | 52 (6.3%) | 42 (15.7%) |
| Fuel Oil or Kerosene | 0 (0.0%) | 0 (0.0%) |
| Coal or Coke | 0 (0.0%) | 0 (0.0%) |
| All other Fuels | 19 (2.3%) | 15 (5.6%) |
| No Fuel Used | 0 (0.0%) | 0 (0.0%) |
| Total | 830 (100.0%) | 268 (100.0%) |
Household Vehicle Usage in Delta
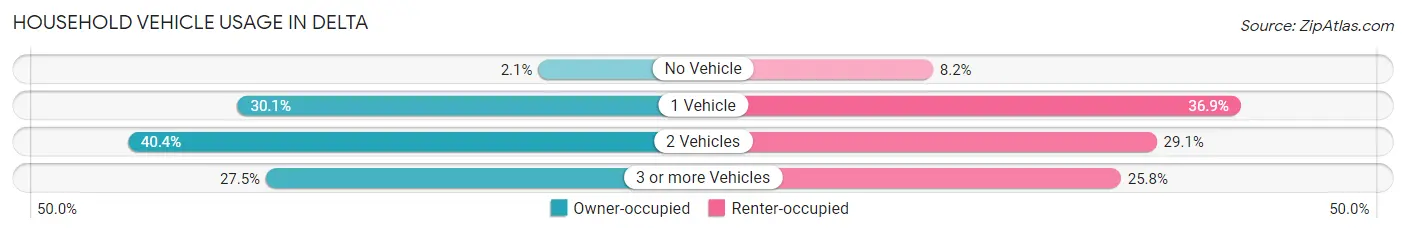
| Vehicles per Household | Owner-occupied | Renter-occupied |
| No Vehicle | 17 (2.1%) | 22 (8.2%) |
| 1 Vehicle | 250 (30.1%) | 99 (36.9%) |
| 2 Vehicles | 335 (40.4%) | 78 (29.1%) |
| 3 or more Vehicles | 228 (27.5%) | 69 (25.8%) |
| Total | 830 (100.0%) | 268 (100.0%) |
Real Estate & Mortgages in Delta
Real Estate and Mortgage Overview in Delta
| Characteristic | Without Mortgage | With Mortgage |
| Housing Units | 224 | 606 |
| Median Property Value | $143,200 | $148,600 |
| Median Household Income | $45,667 | $52 |
| Monthly Housing Costs | $477 | $0 |
| Real Estate Taxes | $2,284 | $6 |
Property Value by Mortgage Status in Delta
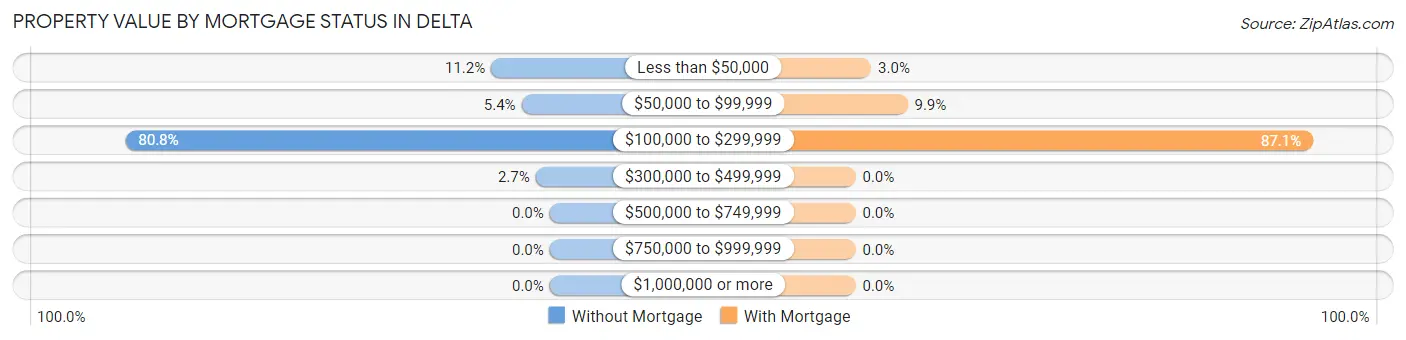
| Property Value | Without Mortgage | With Mortgage |
| Less than $50,000 | 25 (11.2%) | 18 (3.0%) |
| $50,000 to $99,999 | 12 (5.4%) | 60 (9.9%) |
| $100,000 to $299,999 | 181 (80.8%) | 528 (87.1%) |
| $300,000 to $499,999 | 6 (2.7%) | 0 (0.0%) |
| $500,000 to $749,999 | 0 (0.0%) | 0 (0.0%) |
| $750,000 to $999,999 | 0 (0.0%) | 0 (0.0%) |
| $1,000,000 or more | 0 (0.0%) | 0 (0.0%) |
| Total | 224 (100.0%) | 606 (100.0%) |
Household Income by Mortgage Status in Delta
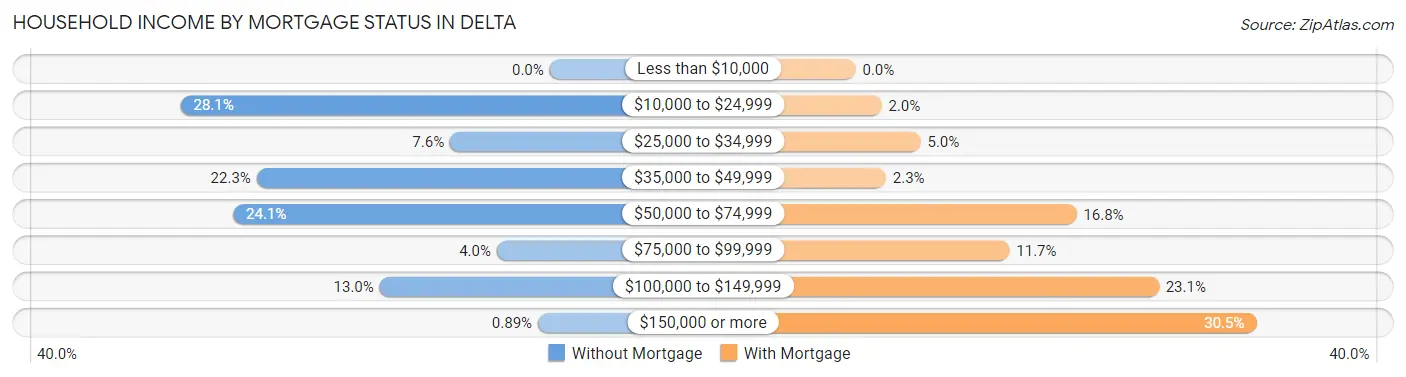
| Household Income | Without Mortgage | With Mortgage |
| Less than $10,000 | 0 (0.0%) | 0 (0.0%) |
| $10,000 to $24,999 | 63 (28.1%) | 12 (2.0%) |
| $25,000 to $34,999 | 17 (7.6%) | 30 (5.0%) |
| $35,000 to $49,999 | 50 (22.3%) | 14 (2.3%) |
| $50,000 to $74,999 | 54 (24.1%) | 102 (16.8%) |
| $75,000 to $99,999 | 9 (4.0%) | 71 (11.7%) |
| $100,000 to $149,999 | 29 (13.0%) | 140 (23.1%) |
| $150,000 or more | 2 (0.9%) | 185 (30.5%) |
| Total | 224 (100.0%) | 606 (100.0%) |
Property Value to Household Income Ratio in Delta
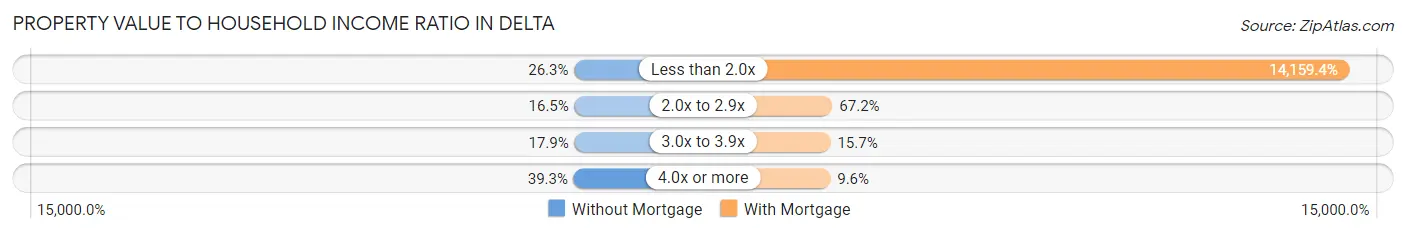
| Value-to-Income Ratio | Without Mortgage | With Mortgage |
| Less than 2.0x | 59 (26.3%) | 85,806 (14,159.4%) |
| 2.0x to 2.9x | 37 (16.5%) | 407 (67.2%) |
| 3.0x to 3.9x | 40 (17.9%) | 95 (15.7%) |
| 4.0x or more | 88 (39.3%) | 58 (9.6%) |
| Total | 224 (100.0%) | 606 (100.0%) |
Real Estate Taxes by Mortgage Status in Delta
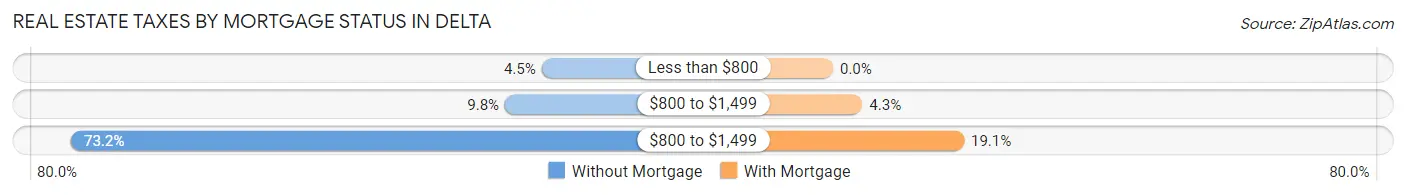
| Property Taxes | Without Mortgage | With Mortgage |
| Less than $800 | 10 (4.5%) | 0 (0.0%) |
| $800 to $1,499 | 22 (9.8%) | 26 (4.3%) |
| $800 to $1,499 | 164 (73.2%) | 116 (19.1%) |
| Total | 224 (100.0%) | 606 (100.0%) |
Health & Disability in Delta
Health Insurance Coverage by Age in Delta
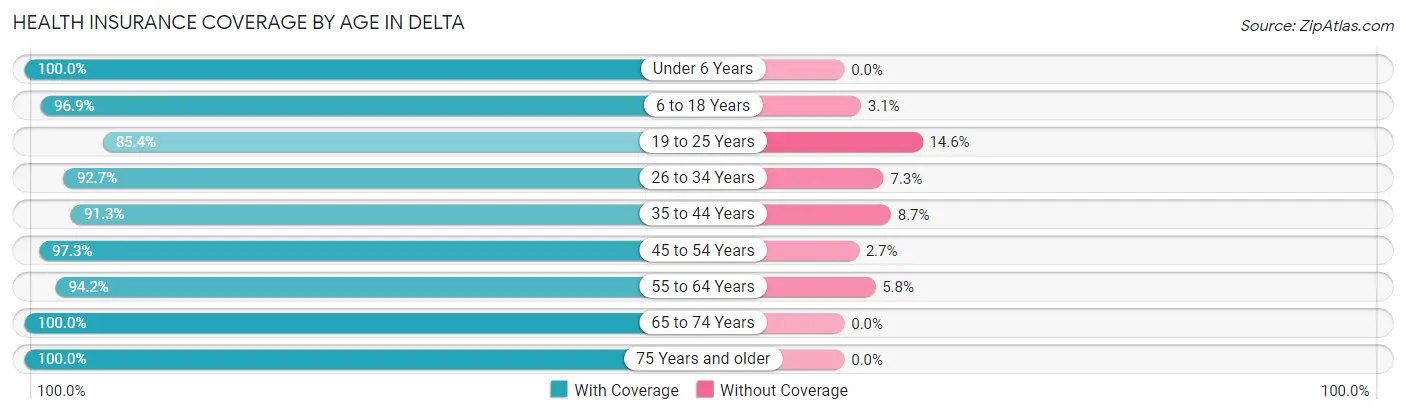
| Age Bracket | With Coverage | Without Coverage |
| Under 6 Years | 192 (100.0%) | 0 (0.0%) |
| 6 to 18 Years | 689 (96.9%) | 22 (3.1%) |
| 19 to 25 Years | 258 (85.4%) | 44 (14.6%) |
| 26 to 34 Years | 152 (92.7%) | 12 (7.3%) |
| 35 to 44 Years | 390 (91.3%) | 37 (8.7%) |
| 45 to 54 Years | 325 (97.3%) | 9 (2.7%) |
| 55 to 64 Years | 278 (94.2%) | 17 (5.8%) |
| 65 to 74 Years | 262 (100.0%) | 0 (0.0%) |
| 75 Years and older | 126 (100.0%) | 0 (0.0%) |
| Total | 2,672 (95.0%) | 141 (5.0%) |
Health Insurance Coverage by Citizenship Status in Delta
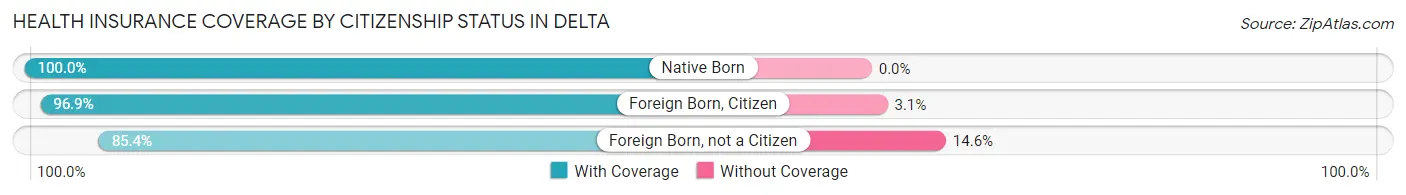
| Citizenship Status | With Coverage | Without Coverage |
| Native Born | 192 (100.0%) | 0 (0.0%) |
| Foreign Born, Citizen | 689 (96.9%) | 22 (3.1%) |
| Foreign Born, not a Citizen | 258 (85.4%) | 44 (14.6%) |
Health Insurance Coverage by Household Income in Delta
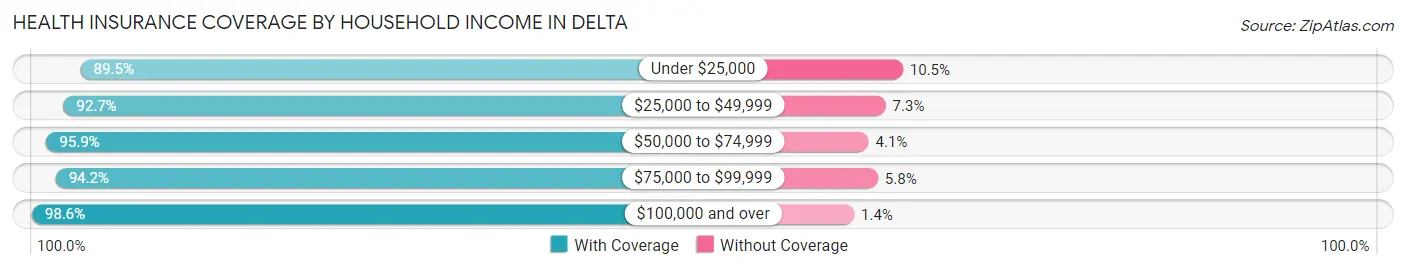
| Household Income | With Coverage | Without Coverage |
| Under $25,000 | 375 (89.5%) | 44 (10.5%) |
| $25,000 to $49,999 | 446 (92.7%) | 35 (7.3%) |
| $50,000 to $74,999 | 352 (95.9%) | 15 (4.1%) |
| $75,000 to $99,999 | 485 (94.2%) | 30 (5.8%) |
| $100,000 and over | 1,009 (98.6%) | 14 (1.4%) |
Public vs Private Health Insurance Coverage by Age in Delta
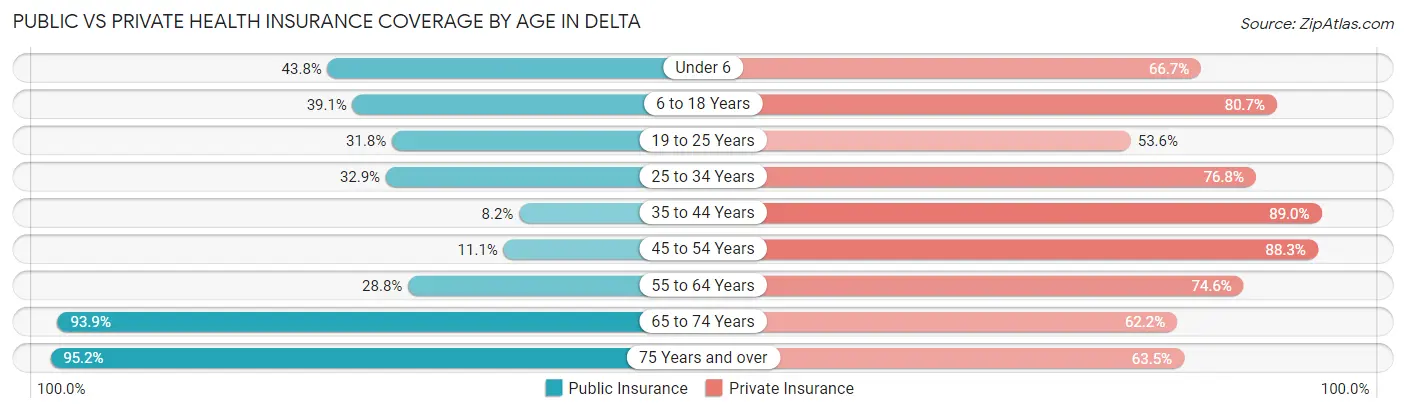
| Age Bracket | Public Insurance | Private Insurance |
| Under 6 | 84 (43.8%) | 128 (66.7%) |
| 6 to 18 Years | 278 (39.1%) | 574 (80.7%) |
| 19 to 25 Years | 96 (31.8%) | 162 (53.6%) |
| 25 to 34 Years | 54 (32.9%) | 126 (76.8%) |
| 35 to 44 Years | 35 (8.2%) | 380 (89.0%) |
| 45 to 54 Years | 37 (11.1%) | 295 (88.3%) |
| 55 to 64 Years | 85 (28.8%) | 220 (74.6%) |
| 65 to 74 Years | 246 (93.9%) | 163 (62.2%) |
| 75 Years and over | 120 (95.2%) | 80 (63.5%) |
| Total | 1,035 (36.8%) | 2,128 (75.6%) |
Disability Status by Sex by Age in Delta
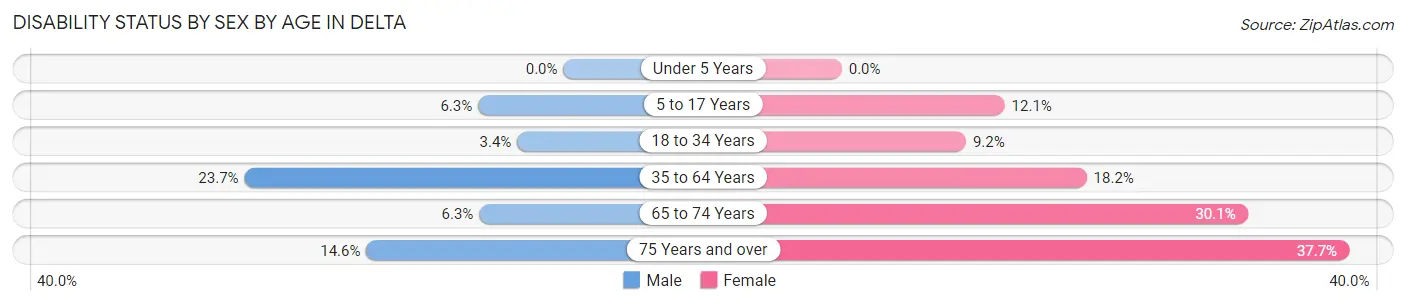
| Age Bracket | Male | Female |
| Under 5 Years | 0 (0.0%) | 0 (0.0%) |
| 5 to 17 Years | 19 (6.3%) | 48 (12.1%) |
| 18 to 34 Years | 12 (3.4%) | 13 (9.2%) |
| 35 to 64 Years | 99 (23.7%) | 116 (18.2%) |
| 65 to 74 Years | 6 (6.2%) | 50 (30.1%) |
| 75 Years and over | 6 (14.6%) | 32 (37.7%) |
Disability Class by Sex by Age in Delta
Disability Class: Hearing Difficulty
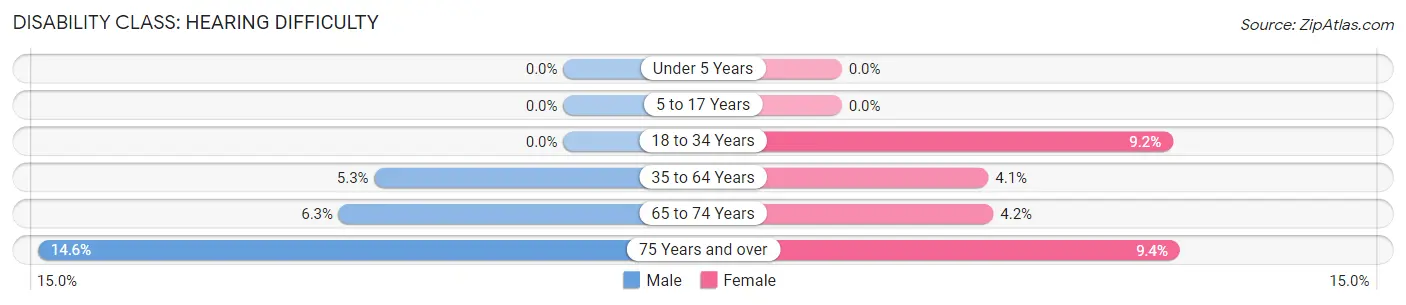
| Age Bracket | Male | Female |
| Under 5 Years | 0 (0.0%) | 0 (0.0%) |
| 5 to 17 Years | 0 (0.0%) | 0 (0.0%) |
| 18 to 34 Years | 0 (0.0%) | 13 (9.2%) |
| 35 to 64 Years | 22 (5.3%) | 26 (4.1%) |
| 65 to 74 Years | 6 (6.2%) | 7 (4.2%) |
| 75 Years and over | 6 (14.6%) | 8 (9.4%) |
Disability Class: Vision Difficulty
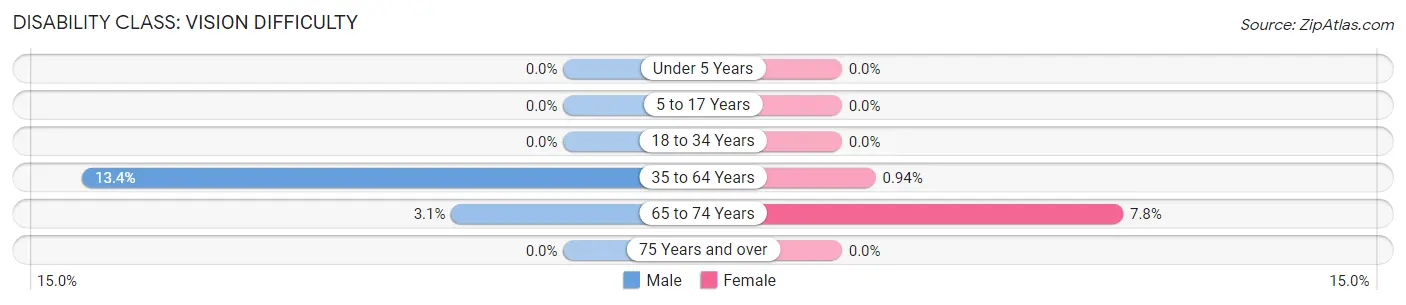
| Age Bracket | Male | Female |
| Under 5 Years | 0 (0.0%) | 0 (0.0%) |
| 5 to 17 Years | 0 (0.0%) | 0 (0.0%) |
| 18 to 34 Years | 0 (0.0%) | 0 (0.0%) |
| 35 to 64 Years | 56 (13.4%) | 6 (0.9%) |
| 65 to 74 Years | 3 (3.1%) | 13 (7.8%) |
| 75 Years and over | 0 (0.0%) | 0 (0.0%) |
Disability Class: Cognitive Difficulty
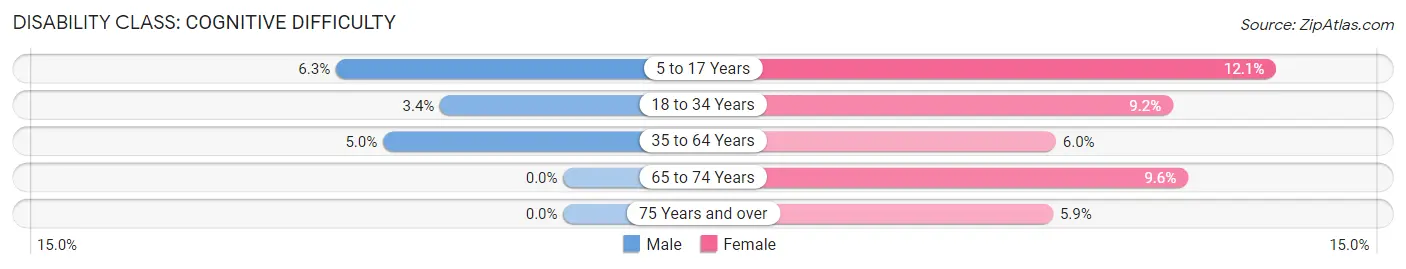
| Age Bracket | Male | Female |
| 5 to 17 Years | 19 (6.3%) | 48 (12.1%) |
| 18 to 34 Years | 12 (3.4%) | 13 (9.2%) |
| 35 to 64 Years | 21 (5.0%) | 38 (6.0%) |
| 65 to 74 Years | 0 (0.0%) | 16 (9.6%) |
| 75 Years and over | 0 (0.0%) | 5 (5.9%) |
Disability Class: Ambulatory Difficulty
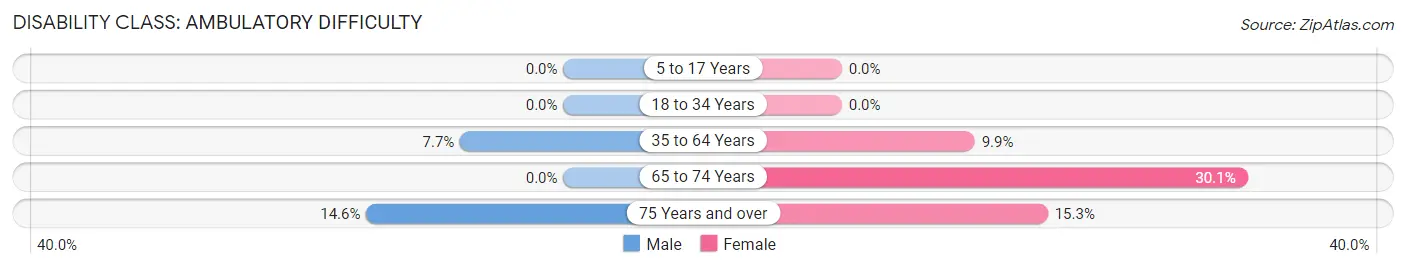
| Age Bracket | Male | Female |
| 5 to 17 Years | 0 (0.0%) | 0 (0.0%) |
| 18 to 34 Years | 0 (0.0%) | 0 (0.0%) |
| 35 to 64 Years | 32 (7.7%) | 63 (9.9%) |
| 65 to 74 Years | 0 (0.0%) | 50 (30.1%) |
| 75 Years and over | 6 (14.6%) | 13 (15.3%) |
Disability Class: Self-Care Difficulty
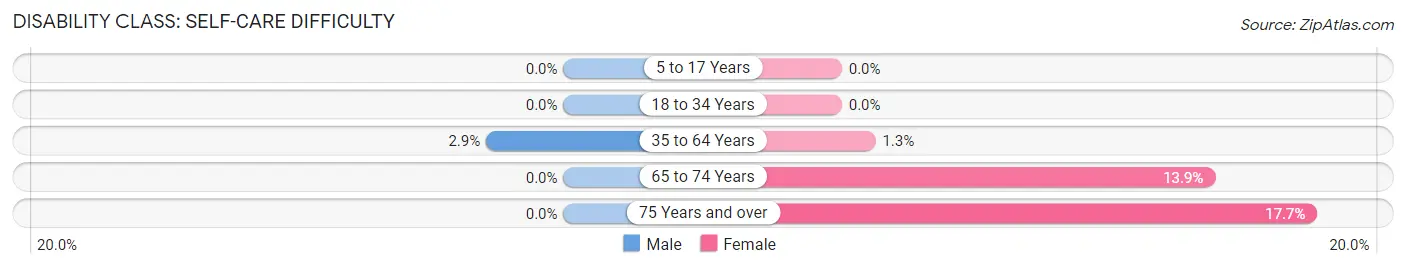
| Age Bracket | Male | Female |
| 5 to 17 Years | 0 (0.0%) | 0 (0.0%) |
| 18 to 34 Years | 0 (0.0%) | 0 (0.0%) |
| 35 to 64 Years | 12 (2.9%) | 8 (1.3%) |
| 65 to 74 Years | 0 (0.0%) | 23 (13.9%) |
| 75 Years and over | 0 (0.0%) | 15 (17.6%) |
Technology Access in Delta
Computing Device Access in Delta
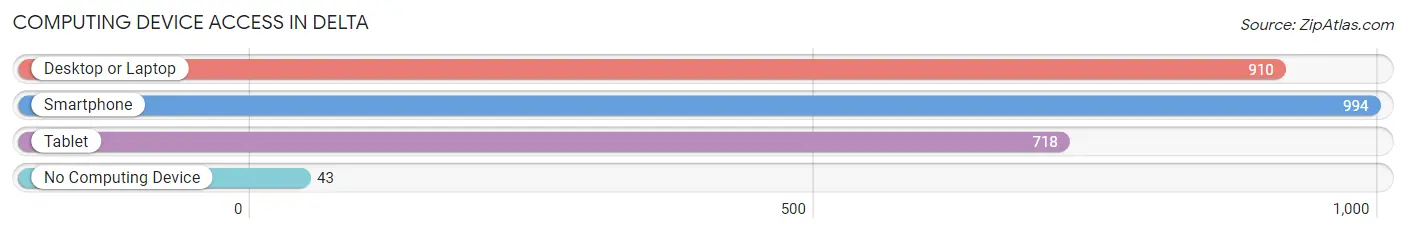
| Device Type | # Households | % Households |
| Desktop or Laptop | 910 | 82.9% |
| Smartphone | 994 | 90.5% |
| Tablet | 718 | 65.4% |
| No Computing Device | 43 | 3.9% |
| Total | 1,098 | 100.0% |
Internet Access in Delta
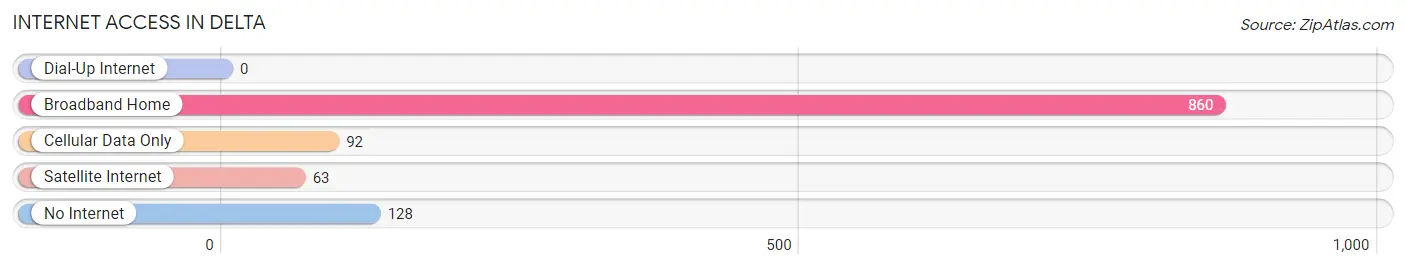
| Internet Type | # Households | % Households |
| Dial-Up Internet | 0 | 0.0% |
| Broadband Home | 860 | 78.3% |
| Cellular Data Only | 92 | 8.4% |
| Satellite Internet | 63 | 5.7% |
| No Internet | 128 | 11.7% |
| Total | 1,098 | 100.0% |
Delta Summary
Delta, Ohio is a small village located in Fulton County, Ohio. It is situated on the banks of the Maumee River, approximately 20 miles west of Toledo. The village has a population of approximately 3,000 people and is part of the Toledo Metropolitan Statistical Area.
History
Delta was founded in 1836 by a group of settlers from Pennsylvania. The village was named after the Greek letter Delta, which is the fourth letter of the Greek alphabet. The settlers chose this name because the village was located at the fourth bend of the Maumee River.
The village was incorporated in 1867 and was home to a variety of industries, including a flour mill, a sawmill, a grist mill, and a woolen mill. The village also had a number of stores, a hotel, and a post office.
In the late 19th century, Delta was a major stop on the Toledo and Ohio Central Railroad. The railroad brought in a number of new residents and businesses to the village.
Geography
Delta is located in northwestern Ohio, approximately 20 miles west of Toledo. The village is situated on the banks of the Maumee River, which is a major tributary of Lake Erie. The village is surrounded by farmland and is located in the Great Black Swamp region of Ohio.
The village has a total area of 1.2 square miles, all of which is land. The village is located at an elevation of 645 feet above sea level.
Economy
Delta’s economy is largely based on agriculture and manufacturing. The village is home to a number of small businesses, including a grocery store, a hardware store, and a restaurant.
The village is also home to a number of manufacturing companies, including Delta Manufacturing, which produces agricultural equipment, and Delta Plastics, which produces plastic products.
Demographics
As of the 2010 census, Delta had a population of 3,062 people. The racial makeup of the village was 97.2% White, 0.7% African American, 0.3% Native American, 0.2% Asian, 0.1% Pacific Islander, 0.3% from other races, and 1.2% from two or more races. Hispanic or Latino of any race were 1.2% of the population.
The median household income in Delta was $45,938, and the median family income was $51,250. The per capita income for the village was $20,945. About 8.2% of families and 10.2% of the population were below the poverty line, including 14.2% of those under age 18 and 5.2% of those age 65 or over.
Conclusion
Delta, Ohio is a small village located in Fulton County, Ohio. It is situated on the banks of the Maumee River, approximately 20 miles west of Toledo. The village has a population of approximately 3,000 people and is part of the Toledo Metropolitan Statistical Area. Delta’s economy is largely based on agriculture and manufacturing, and the village is home to a number of small businesses and manufacturing companies. As of the 2010 census, Delta had a population of 3,062 people, with a median household income of $45,938 and a median family income of $51,250.
Common Questions
What is Per Capita Income in Delta?
Per Capita income in Delta is $29,280.
What is the Median Family Income in Delta?
Median Family Income in Delta is $78,958.
What is the Median Household income in Delta?
Median Household Income in Delta is $67,100.
What is Income or Wage Gap in Delta?
Income or Wage Gap in Delta is 4.0%.
Women in Delta earn 96.0 cents for every dollar earned by a man.
What is Inequality or Gini Index in Delta?
Inequality or Gini Index in Delta is 0.39.
What is the Total Population of Delta?
Total Population of Delta is 2,813.
What is the Total Male Population of Delta?
Total Male Population of Delta is 1,288.
What is the Total Female Population of Delta?
Total Female Population of Delta is 1,525.
What is the Ratio of Males per 100 Females in Delta?
There are 84.46 Males per 100 Females in Delta.
What is the Ratio of Females per 100 Males in Delta?
There are 118.40 Females per 100 Males in Delta.
What is the Median Population Age in Delta?
Median Population Age in Delta is 35.7 Years.
What is the Average Family Size in Delta
Average Family Size in Delta is 3.2 People.
What is the Average Household Size in Delta
Average Household Size in Delta is 2.5 People.
How Large is the Labor Force in Delta?
There are 1,279 People in the Labor Forcein in Delta.
What is the Percentage of People in the Labor Force in Delta?
61.5% of People are in the Labor Force in Delta.
What is the Unemployment Rate in Delta?
Unemployment Rate in Delta is 3.7%.