Delphos, OH Map & Demographics
Delphos Map
Delphos Overview
$31,195
PER CAPITA INCOME
$75,516
AVG FAMILY INCOME
$59,000
AVG HOUSEHOLD INCOME
53.3%
WAGE / INCOME GAP [ % ]
46.7¢/ $1
WAGE / INCOME GAP [ $ ]
0.37
INEQUALITY / GINI INDEX
7,153
TOTAL POPULATION
3,582
MALE POPULATION
3,571
FEMALE POPULATION
100.31
MALES / 100 FEMALES
99.69
FEMALES / 100 MALES
38.9
MEDIAN AGE
2.9
AVG FAMILY SIZE
2.2
AVG HOUSEHOLD SIZE
3,597
LABOR FORCE [ PEOPLE ]
62.9%
PERCENT IN LABOR FORCE
6.8%
UNEMPLOYMENT RATE
Delphos Zip Codes
Income in Delphos
Income Overview in Delphos
Per Capita Income in Delphos is $31,195, while median incomes of families and households are $75,516 and $59,000 respectively.
| Characteristic | Number | Measure |
| Per Capita Income | 7,153 | $31,195 |
| Median Family Income | 1,855 | $75,516 |
| Mean Family Income | 1,855 | $77,250 |
| Median Household Income | 3,148 | $59,000 |
| Mean Household Income | 3,148 | $66,412 |
| Income Deficit | 1,855 | $0 |
| Wage / Income Gap (%) | 7,153 | 53.34% |
| Wage / Income Gap ($) | 7,153 | 46.66¢ per $1 |
| Gini / Inequality Index | 7,153 | 0.37 |
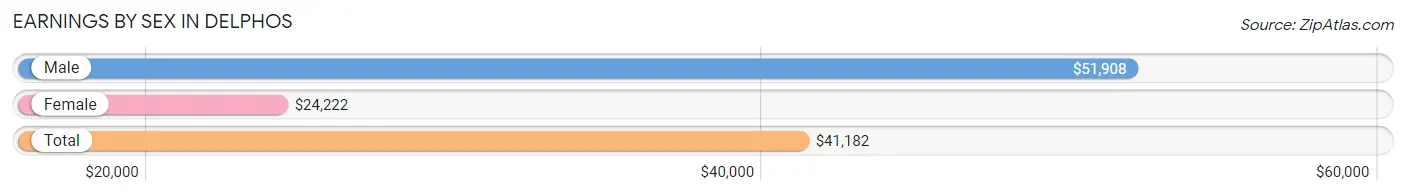
Earnings by Sex in Delphos
Average Earnings in Delphos are $41,182, $51,908 for men and $24,222 for women, a difference of 53.3%.
| Sex | Number | Average Earnings |
| Male | 2,036 (55.3%) | $51,908 |
| Female | 1,643 (44.7%) | $24,222 |
| Total | 3,679 (100.0%) | $41,182 |
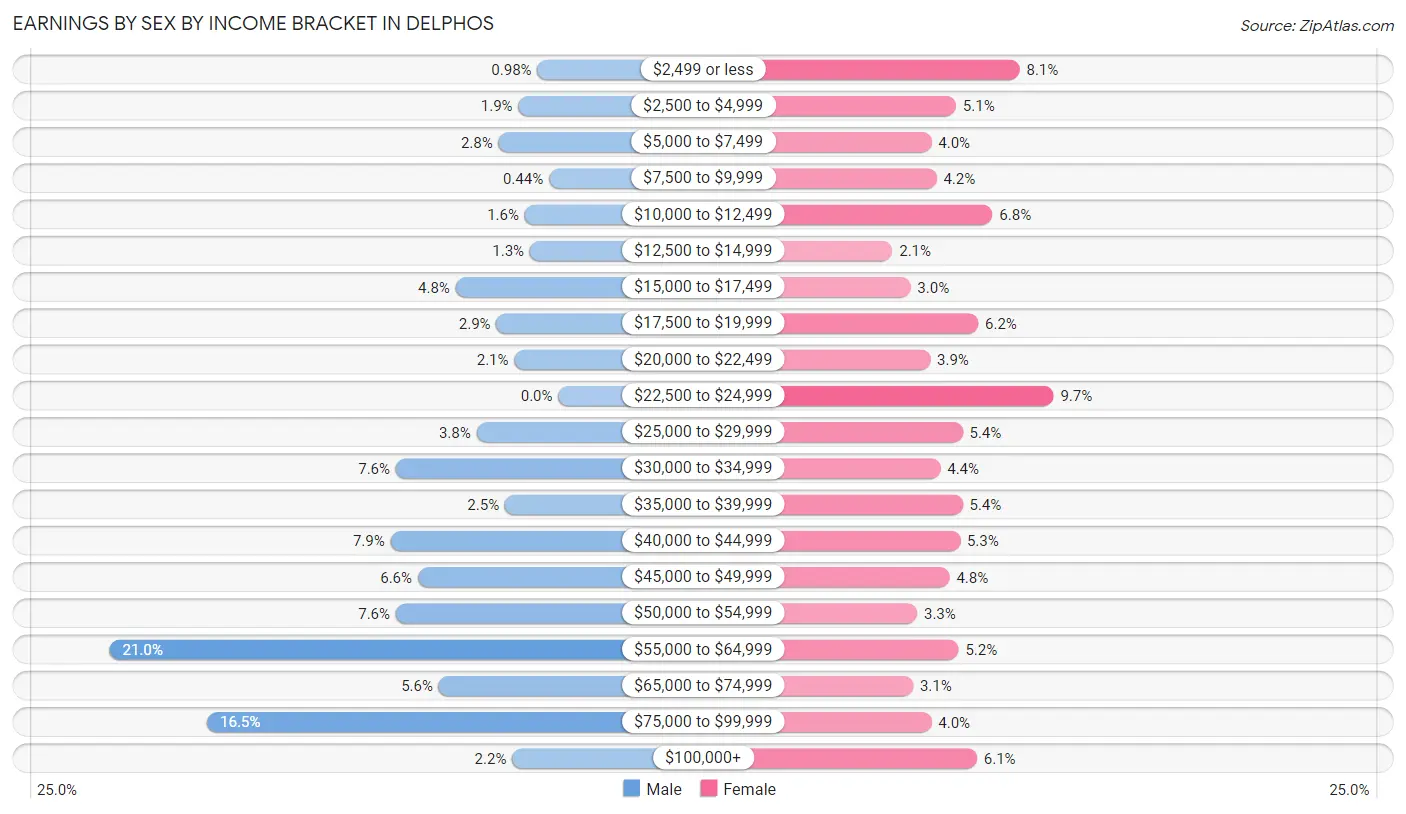
Earnings by Sex by Income Bracket in Delphos
The most common earnings brackets in Delphos are $55,000 to $64,999 for men (428 | 21.0%) and $22,500 to $24,999 for women (159 | 9.7%).
| Income | Male | Female |
| $2,499 or less | 20 (1.0%) | 133 (8.1%) |
| $2,500 to $4,999 | 38 (1.9%) | 84 (5.1%) |
| $5,000 to $7,499 | 57 (2.8%) | 65 (4.0%) |
| $7,500 to $9,999 | 9 (0.4%) | 69 (4.2%) |
| $10,000 to $12,499 | 32 (1.6%) | 112 (6.8%) |
| $12,500 to $14,999 | 27 (1.3%) | 35 (2.1%) |
| $15,000 to $17,499 | 98 (4.8%) | 49 (3.0%) |
| $17,500 to $19,999 | 59 (2.9%) | 101 (6.1%) |
| $20,000 to $22,499 | 42 (2.1%) | 64 (3.9%) |
| $22,500 to $24,999 | 0 (0.0%) | 159 (9.7%) |
| $25,000 to $29,999 | 78 (3.8%) | 89 (5.4%) |
| $30,000 to $34,999 | 155 (7.6%) | 72 (4.4%) |
| $35,000 to $39,999 | 51 (2.5%) | 89 (5.4%) |
| $40,000 to $44,999 | 160 (7.9%) | 87 (5.3%) |
| $45,000 to $49,999 | 134 (6.6%) | 79 (4.8%) |
| $50,000 to $54,999 | 155 (7.6%) | 54 (3.3%) |
| $55,000 to $64,999 | 428 (21.0%) | 86 (5.2%) |
| $65,000 to $74,999 | 114 (5.6%) | 51 (3.1%) |
| $75,000 to $99,999 | 335 (16.5%) | 65 (4.0%) |
| $100,000+ | 44 (2.2%) | 100 (6.1%) |
| Total | 2,036 (100.0%) | 1,643 (100.0%) |
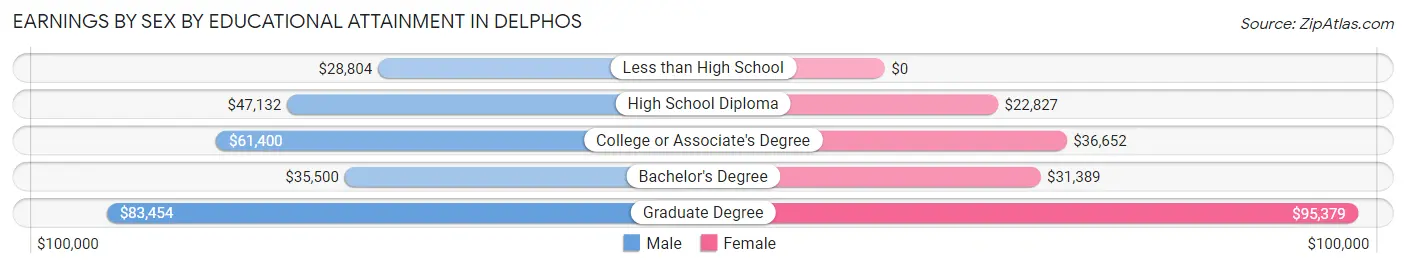
Earnings by Sex by Educational Attainment in Delphos
Average earnings in Delphos are $54,367 for men and $26,037 for women, a difference of 52.1%. Men with an educational attainment of graduate degree enjoy the highest average annual earnings of $83,454, while those with less than high school education earn the least with $28,804. Women with an educational attainment of graduate degree earn the most with the average annual earnings of $95,379, while those with high school diploma education have the smallest earnings of $22,827.
| Educational Attainment | Male Income | Female Income |
| Less than High School | $28,804 | $0 |
| High School Diploma | $47,132 | $22,827 |
| College or Associate's Degree | $61,400 | $36,652 |
| Bachelor's Degree | $35,500 | $31,389 |
| Graduate Degree | $83,454 | $95,379 |
| Total | $54,367 | $26,037 |
Family Income in Delphos
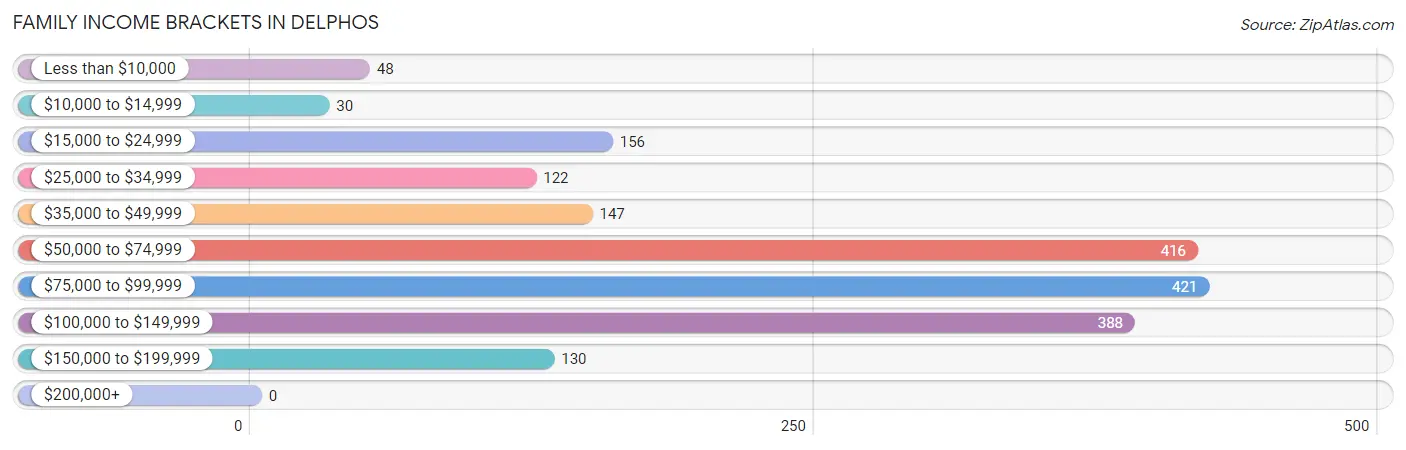
Family Income Brackets in Delphos
According to the Delphos family income data, there are 421 families falling into the $75,000 to $99,999 income range, which is the most common income bracket and makes up 22.7% of all families.
| Income Bracket | # Families | % Families |
| Less than $10,000 | 48 | 2.6% |
| $10,000 to $14,999 | 30 | 1.6% |
| $15,000 to $24,999 | 156 | 8.4% |
| $25,000 to $34,999 | 122 | 6.6% |
| $35,000 to $49,999 | 147 | 7.9% |
| $50,000 to $74,999 | 416 | 22.4% |
| $75,000 to $99,999 | 421 | 22.7% |
| $100,000 to $149,999 | 388 | 20.9% |
| $150,000 to $199,999 | 130 | 7.0% |
| $200,000+ | 0 | 0.0% |
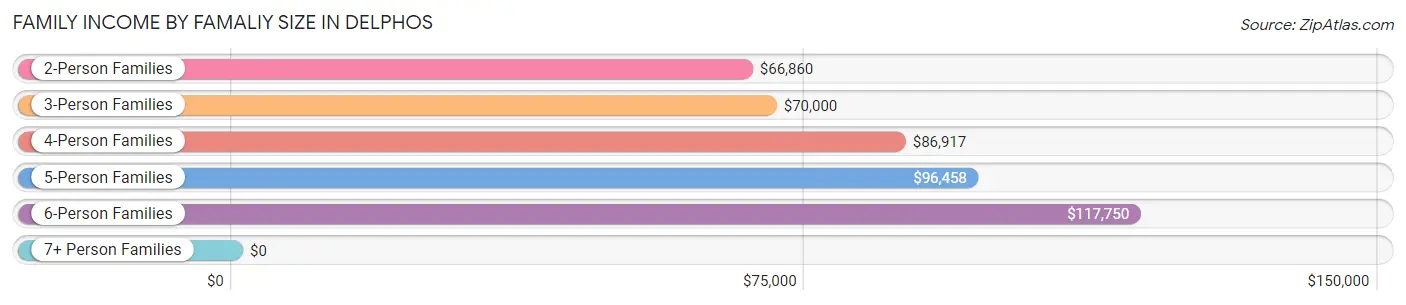
Family Income by Famaliy Size in Delphos
6-person families (64 | 3.5%) account for the highest median family income in Delphos with $117,750 per family, while 2-person families (990 | 53.4%) have the highest median income of $33,430 per family member.
| Income Bracket | # Families | Median Income |
| 2-Person Families | 990 (53.4%) | $66,860 |
| 3-Person Families | 438 (23.6%) | $70,000 |
| 4-Person Families | 250 (13.5%) | $86,917 |
| 5-Person Families | 113 (6.1%) | $96,458 |
| 6-Person Families | 64 (3.5%) | $117,750 |
| 7+ Person Families | 0 (0.0%) | $0 |
| Total | 1,855 (100.0%) | $75,516 |
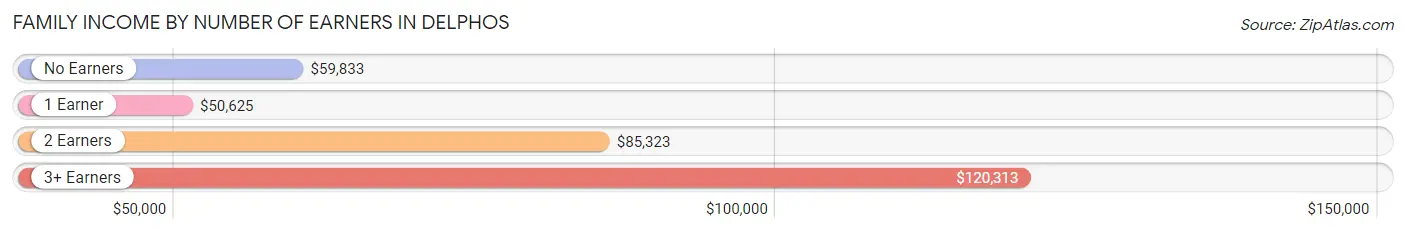
Family Income by Number of Earners in Delphos
The median family income in Delphos is $75,516, with families comprising 3+ earners (84) having the highest median family income of $120,313, while families with 1 earner (578) have the lowest median family income of $50,625, accounting for 4.5% and 31.2% of families, respectively.
| Number of Earners | # Families | Median Income |
| No Earners | 306 (16.5%) | $59,833 |
| 1 Earner | 578 (31.2%) | $50,625 |
| 2 Earners | 887 (47.8%) | $85,323 |
| 3+ Earners | 84 (4.5%) | $120,313 |
| Total | 1,855 (100.0%) | $75,516 |
Household Income in Delphos
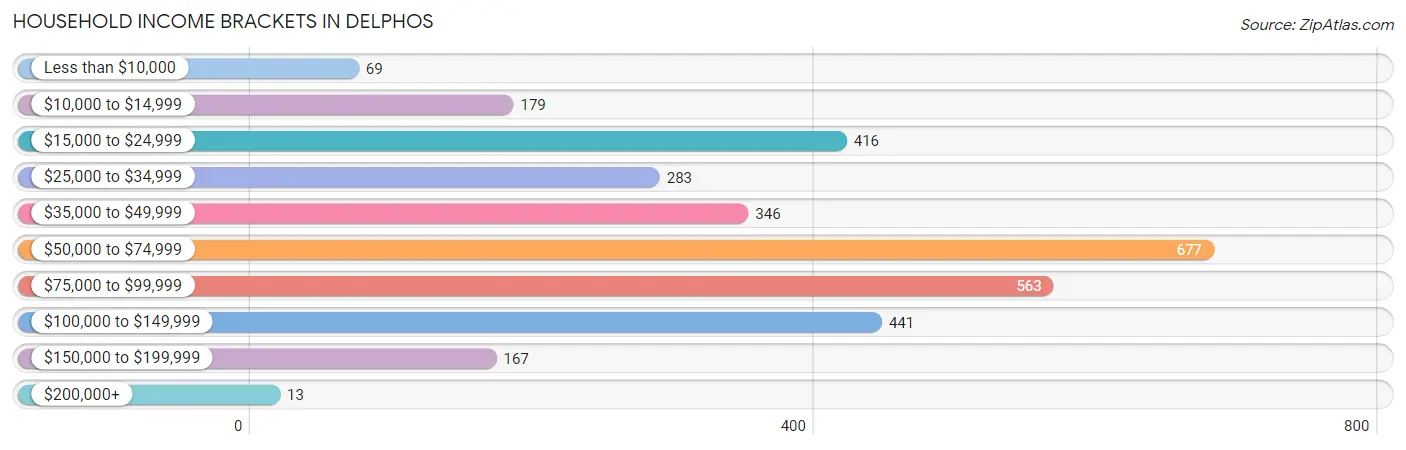
Household Income Brackets in Delphos
With 677 households falling in the category, the $50,000 to $74,999 income range is the most frequent in Delphos, accounting for 21.5% of all households. In contrast, only 13 households (0.4%) fall into the $200,000+ income bracket, making it the least populous group.
| Income Bracket | # Households | % Households |
| Less than $10,000 | 69 | 2.2% |
| $10,000 to $14,999 | 179 | 5.7% |
| $15,000 to $24,999 | 416 | 13.2% |
| $25,000 to $34,999 | 283 | 9.0% |
| $35,000 to $49,999 | 346 | 11.0% |
| $50,000 to $74,999 | 677 | 21.5% |
| $75,000 to $99,999 | 563 | 17.9% |
| $100,000 to $149,999 | 441 | 14.0% |
| $150,000 to $199,999 | 167 | 5.3% |
| $200,000+ | 13 | 0.4% |
Household Income by Householder Age in Delphos
The median household income in Delphos is $59,000, with the highest median household income of $82,560 found in the 25 to 44 years age bracket for the primary householder. A total of 981 households (31.2%) fall into this category. Meanwhile, the 65+ years age bracket for the primary householder has the lowest median household income of $39,917, with 1,071 households (34.0%) in this group.

| Income Bracket | # Households | Median Income |
| 15 to 24 Years | 235 (7.5%) | $49,271 |
| 25 to 44 Years | 981 (31.2%) | $82,560 |
| 45 to 64 Years | 861 (27.4%) | $61,938 |
| 65+ Years | 1,071 (34.0%) | $39,917 |
| Total | 3,148 (100.0%) | $59,000 |
Poverty in Delphos
Income Below Poverty by Sex and Age in Delphos
With 7.6% poverty level for males and 12.1% for females among the residents of Delphos, 15 year old males and 5 year old females are the most vulnerable to poverty, with 35 males (76.1%) and 21 females (30.4%) in their respective age groups living below the poverty level.
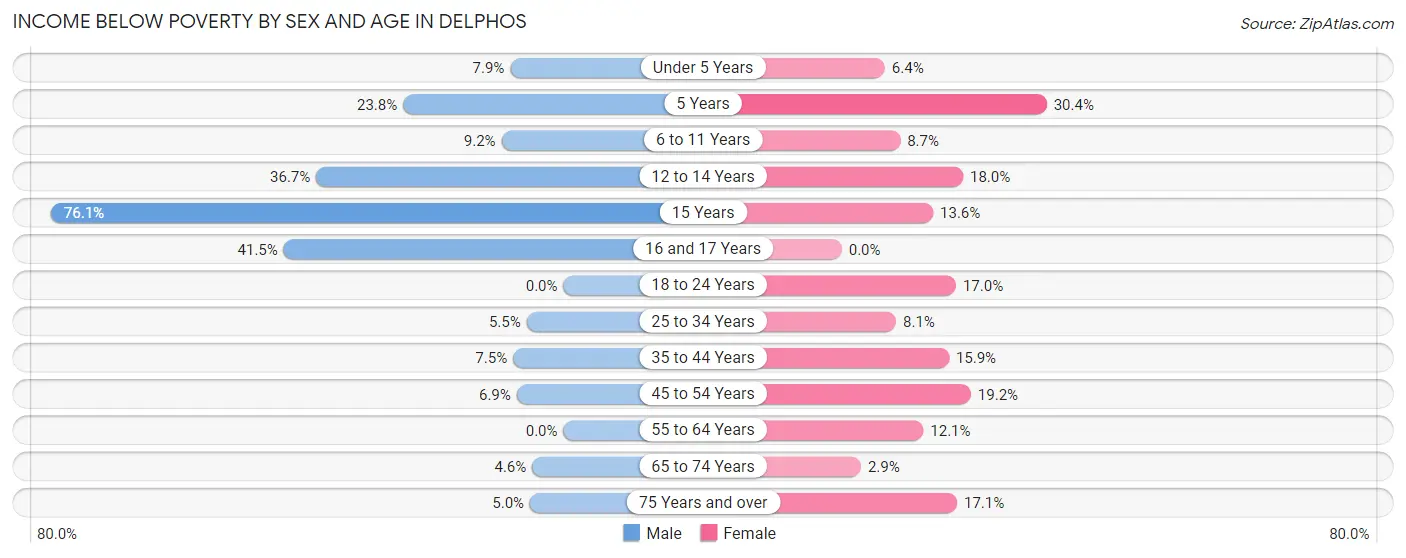
| Age Bracket | Male | Female |
| Under 5 Years | 22 (7.9%) | 19 (6.4%) |
| 5 Years | 10 (23.8%) | 21 (30.4%) |
| 6 to 11 Years | 17 (9.2%) | 23 (8.7%) |
| 12 to 14 Years | 29 (36.7%) | 18 (18.0%) |
| 15 Years | 35 (76.1%) | 8 (13.6%) |
| 16 and 17 Years | 27 (41.5%) | 0 (0.0%) |
| 18 to 24 Years | 0 (0.0%) | 29 (17.0%) |
| 25 to 34 Years | 35 (5.5%) | 42 (8.1%) |
| 35 to 44 Years | 32 (7.5%) | 56 (15.9%) |
| 45 to 54 Years | 25 (6.9%) | 65 (19.2%) |
| 55 to 64 Years | 0 (0.0%) | 46 (12.1%) |
| 65 to 74 Years | 17 (4.6%) | 10 (2.9%) |
| 75 Years and over | 17 (5.0%) | 88 (17.1%) |
| Total | 266 (7.6%) | 425 (12.1%) |
Income Above Poverty by Sex and Age in Delphos
According to the poverty statistics in Delphos, males aged 18 to 24 years and females aged 16 and 17 years are the age groups that are most secure financially, with 100.0% of males and 100.0% of females in these age groups living above the poverty line.
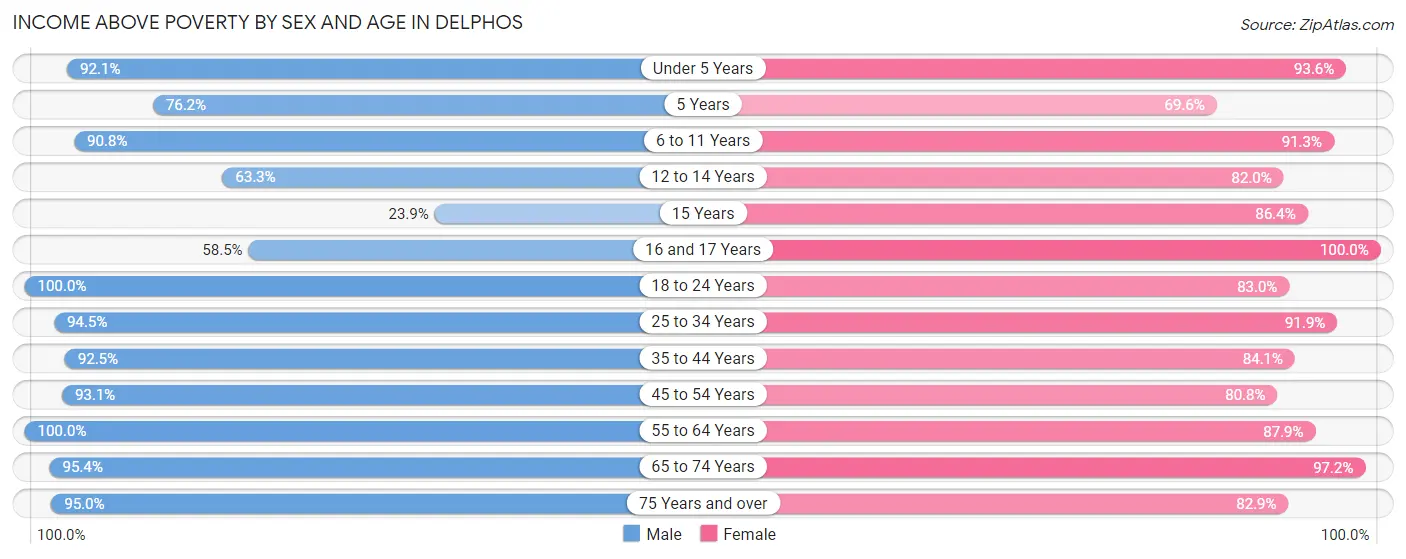
| Age Bracket | Male | Female |
| Under 5 Years | 257 (92.1%) | 278 (93.6%) |
| 5 Years | 32 (76.2%) | 48 (69.6%) |
| 6 to 11 Years | 168 (90.8%) | 242 (91.3%) |
| 12 to 14 Years | 50 (63.3%) | 82 (82.0%) |
| 15 Years | 11 (23.9%) | 51 (86.4%) |
| 16 and 17 Years | 38 (58.5%) | 84 (100.0%) |
| 18 to 24 Years | 343 (100.0%) | 142 (83.0%) |
| 25 to 34 Years | 606 (94.5%) | 479 (91.9%) |
| 35 to 44 Years | 396 (92.5%) | 296 (84.1%) |
| 45 to 54 Years | 335 (93.1%) | 274 (80.8%) |
| 55 to 64 Years | 322 (100.0%) | 334 (87.9%) |
| 65 to 74 Years | 349 (95.4%) | 341 (97.2%) |
| 75 Years and over | 326 (95.0%) | 426 (82.9%) |
| Total | 3,233 (92.4%) | 3,077 (87.9%) |
Income Below Poverty Among Married-Couple Families in Delphos
The poverty statistics for married-couple families in Delphos show that 4.7% or 61 of the total 1,309 families live below the poverty line. Families with 1 or 2 children have the highest poverty rate of 11.0%, comprising of 45 families. On the other hand, families with 3 or 4 children have the lowest poverty rate of 0.0%, which includes 0 families.
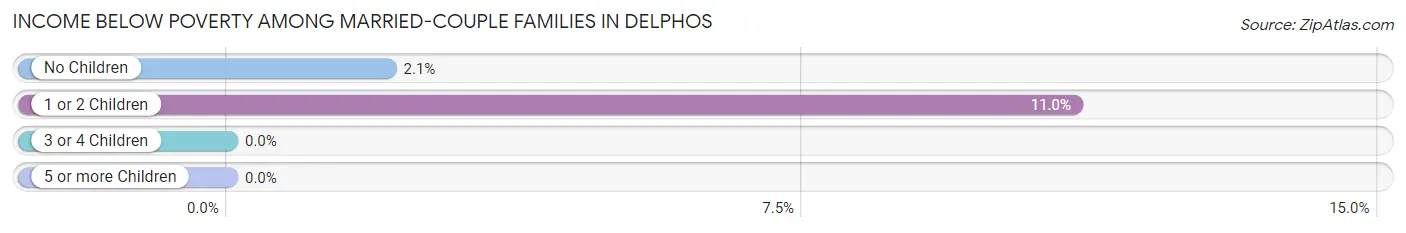
| Children | Above Poverty | Below Poverty |
| No Children | 757 (97.9%) | 16 (2.1%) |
| 1 or 2 Children | 363 (89.0%) | 45 (11.0%) |
| 3 or 4 Children | 128 (100.0%) | 0 (0.0%) |
| 5 or more Children | 0 (0.0%) | 0 (0.0%) |
| Total | 1,248 (95.3%) | 61 (4.7%) |
Income Below Poverty Among Single-Parent Households in Delphos
According to the poverty data in Delphos, 7.0% or 12 single-father households and 20.9% or 78 single-mother households are living below the poverty line. Among single-father households, those with 1 or 2 children have the highest poverty rate, with 12 households (10.9%) experiencing poverty. Likewise, among single-mother households, those with 3 or 4 children have the highest poverty rate, with 16 households (100.0%) falling below the poverty line.
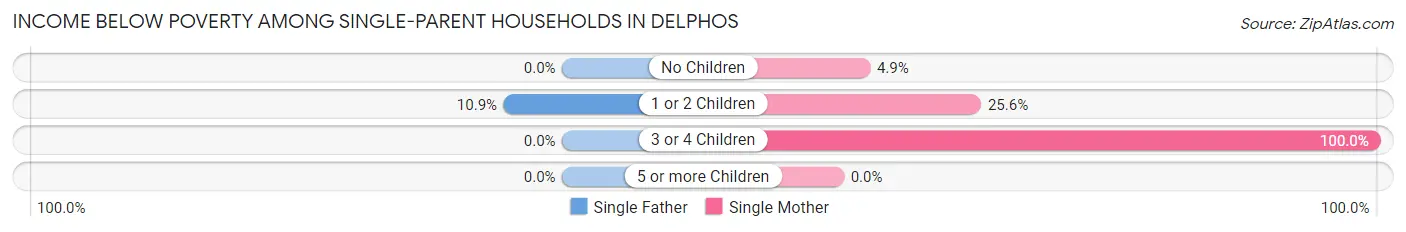
| Children | Single Father | Single Mother |
| No Children | 0 (0.0%) | 7 (4.9%) |
| 1 or 2 Children | 12 (10.9%) | 55 (25.6%) |
| 3 or 4 Children | 0 (0.0%) | 16 (100.0%) |
| 5 or more Children | 0 (0.0%) | 0 (0.0%) |
| Total | 12 (7.0%) | 78 (20.9%) |
Income Below Poverty Among Married-Couple vs Single-Parent Households in Delphos
The poverty data for Delphos shows that 61 of the married-couple family households (4.7%) and 90 of the single-parent households (16.5%) are living below the poverty level. Within the married-couple family households, those with 1 or 2 children have the highest poverty rate, with 45 households (11.0%) falling below the poverty line. Among the single-parent households, those with 3 or 4 children have the highest poverty rate, with 16 household (42.1%) living below poverty.
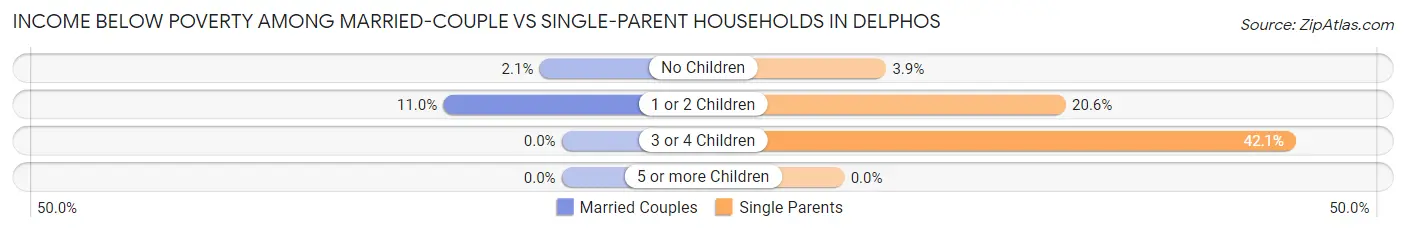
| Children | Married-Couple Families | Single-Parent Households |
| No Children | 16 (2.1%) | 7 (3.9%) |
| 1 or 2 Children | 45 (11.0%) | 67 (20.6%) |
| 3 or 4 Children | 0 (0.0%) | 16 (42.1%) |
| 5 or more Children | 0 (0.0%) | 0 (0.0%) |
| Total | 61 (4.7%) | 90 (16.5%) |
Race in Delphos
The most populous races in Delphos are White / Caucasian (6,649 | 92.9%), Black / African American (211 | 2.9%), and Two or more Races (208 | 2.9%).
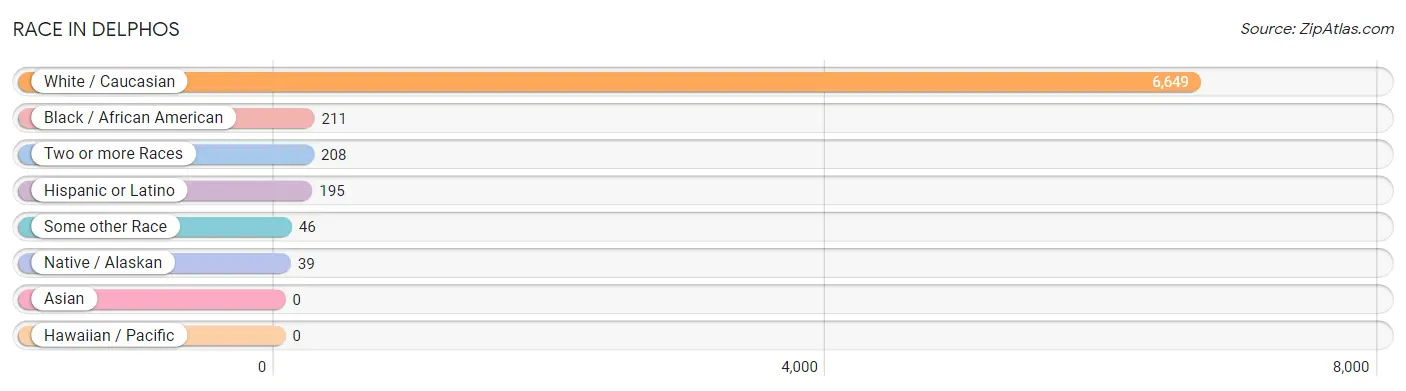
| Race | # Population | % Population |
| Asian | 0 | 0.0% |
| Black / African American | 211 | 2.9% |
| Hawaiian / Pacific | 0 | 0.0% |
| Hispanic or Latino | 195 | 2.7% |
| Native / Alaskan | 39 | 0.5% |
| White / Caucasian | 6,649 | 92.9% |
| Two or more Races | 208 | 2.9% |
| Some other Race | 46 | 0.6% |
| Total | 7,153 | 100.0% |
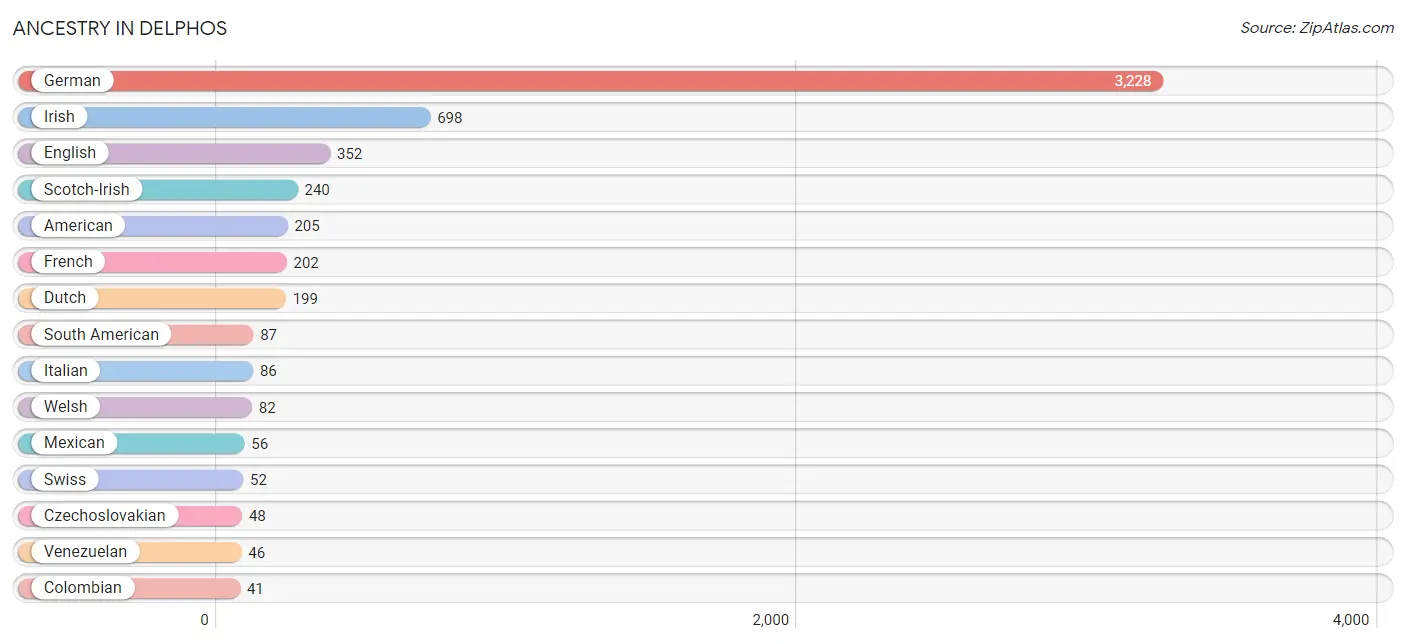
Ancestry in Delphos
The most populous ancestries reported in Delphos are German (3,228 | 45.1%), Irish (698 | 9.8%), English (352 | 4.9%), Scotch-Irish (240 | 3.4%), and American (205 | 2.9%), together accounting for 66.0% of all Delphos residents.
| Ancestry | # Population | % Population |
| American | 205 | 2.9% |
| British | 31 | 0.4% |
| Cherokee | 36 | 0.5% |
| Colombian | 41 | 0.6% |
| Cuban | 14 | 0.2% |
| Czechoslovakian | 48 | 0.7% |
| Dutch | 199 | 2.8% |
| English | 352 | 4.9% |
| European | 34 | 0.5% |
| French | 202 | 2.8% |
| German | 3,228 | 45.1% |
| Greek | 21 | 0.3% |
| Irish | 698 | 9.8% |
| Italian | 86 | 1.2% |
| Mexican | 56 | 0.8% |
| Mexican American Indian | 25 | 0.4% |
| Polish | 29 | 0.4% |
| Romanian | 6 | 0.1% |
| Russian | 18 | 0.3% |
| Scandinavian | 25 | 0.4% |
| Scotch-Irish | 240 | 3.4% |
| Scottish | 28 | 0.4% |
| Slovak | 7 | 0.1% |
| South American | 87 | 1.2% |
| Spaniard | 9 | 0.1% |
| Spanish | 11 | 0.2% |
| Swiss | 52 | 0.7% |
| Venezuelan | 46 | 0.6% |
| Welsh | 82 | 1.1% | View All 29 Rows |
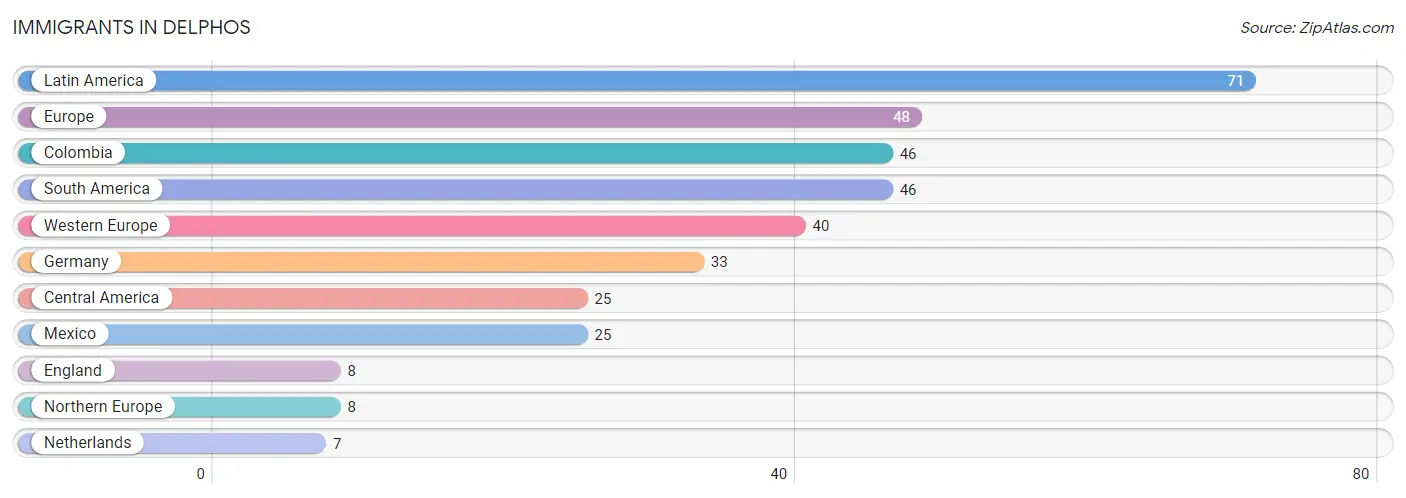
Immigrants in Delphos
The most numerous immigrant groups reported in Delphos came from Latin America (71 | 1.0%), Europe (48 | 0.7%), Colombia (46 | 0.6%), South America (46 | 0.6%), and Western Europe (40 | 0.6%), together accounting for 3.5% of all Delphos residents.
| Immigration Origin | # Population | % Population |
| Central America | 25 | 0.4% |
| Colombia | 46 | 0.6% |
| England | 8 | 0.1% |
| Europe | 48 | 0.7% |
| Germany | 33 | 0.5% |
| Latin America | 71 | 1.0% |
| Mexico | 25 | 0.4% |
| Netherlands | 7 | 0.1% |
| Northern Europe | 8 | 0.1% |
| South America | 46 | 0.6% |
| Western Europe | 40 | 0.6% | View All 11 Rows |
Sex and Age in Delphos
Sex and Age in Delphos
The most populous age groups in Delphos are 25 to 29 Years (374 | 10.4%) for men and 25 to 29 Years (316 | 8.8%) for women.
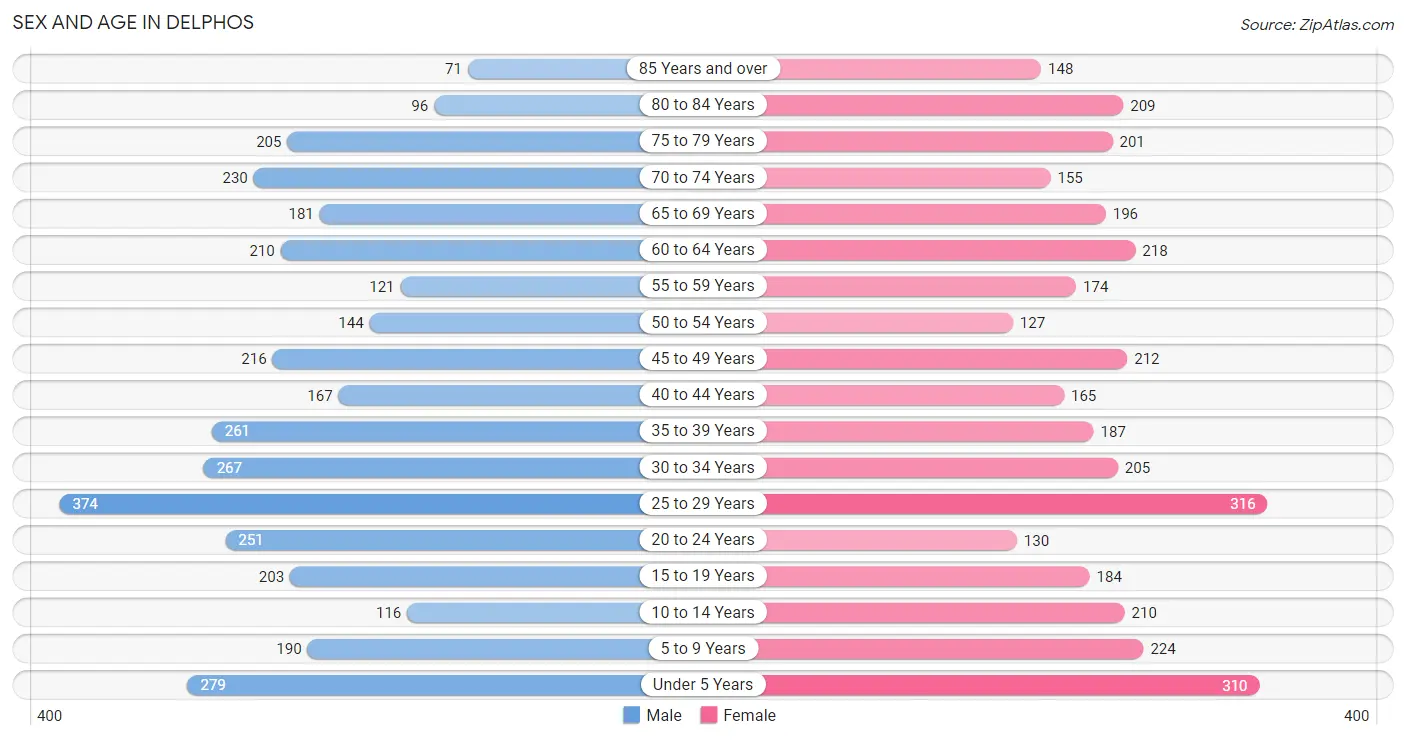
| Age Bracket | Male | Female |
| Under 5 Years | 279 (7.8%) | 310 (8.7%) |
| 5 to 9 Years | 190 (5.3%) | 224 (6.3%) |
| 10 to 14 Years | 116 (3.2%) | 210 (5.9%) |
| 15 to 19 Years | 203 (5.7%) | 184 (5.1%) |
| 20 to 24 Years | 251 (7.0%) | 130 (3.6%) |
| 25 to 29 Years | 374 (10.4%) | 316 (8.8%) |
| 30 to 34 Years | 267 (7.4%) | 205 (5.7%) |
| 35 to 39 Years | 261 (7.3%) | 187 (5.2%) |
| 40 to 44 Years | 167 (4.7%) | 165 (4.6%) |
| 45 to 49 Years | 216 (6.0%) | 212 (5.9%) |
| 50 to 54 Years | 144 (4.0%) | 127 (3.6%) |
| 55 to 59 Years | 121 (3.4%) | 174 (4.9%) |
| 60 to 64 Years | 210 (5.9%) | 218 (6.1%) |
| 65 to 69 Years | 181 (5.1%) | 196 (5.5%) |
| 70 to 74 Years | 230 (6.4%) | 155 (4.3%) |
| 75 to 79 Years | 205 (5.7%) | 201 (5.6%) |
| 80 to 84 Years | 96 (2.7%) | 209 (5.9%) |
| 85 Years and over | 71 (2.0%) | 148 (4.1%) |
| Total | 3,582 (100.0%) | 3,571 (100.0%) |
Families and Households in Delphos
Median Family Size in Delphos
The median family size in Delphos is 2.90 persons per family, with single male/father families (172 | 9.3%) accounting for the largest median family size of 3.17 persons per family. On the other hand, single female/mother families (374 | 20.2%) represent the smallest median family size with 2.71 persons per family.
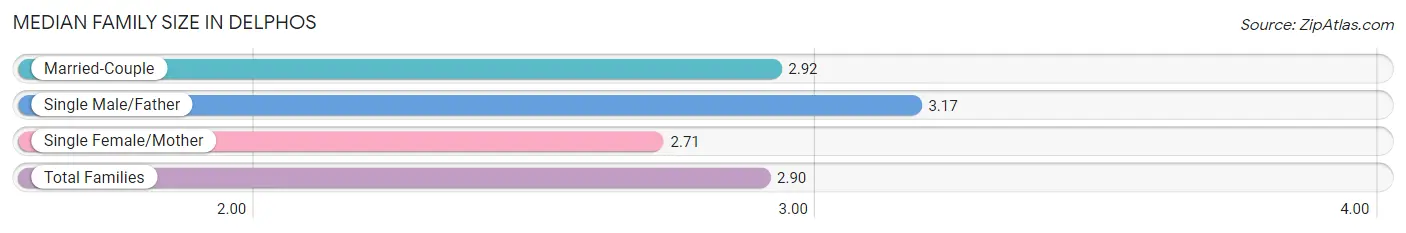
| Family Type | # Families | Family Size |
| Married-Couple | 1,309 (70.6%) | 2.92 |
| Single Male/Father | 172 (9.3%) | 3.17 |
| Single Female/Mother | 374 (20.2%) | 2.71 |
| Total Families | 1,855 (100.0%) | 2.90 |
Median Household Size in Delphos
The median household size in Delphos is 2.22 persons per household, with single male/father households (172 | 5.5%) accounting for the largest median household size of 3.76 persons per household. non-family households (1,293 | 41.1%) represent the smallest median household size with 1.07 persons per household.
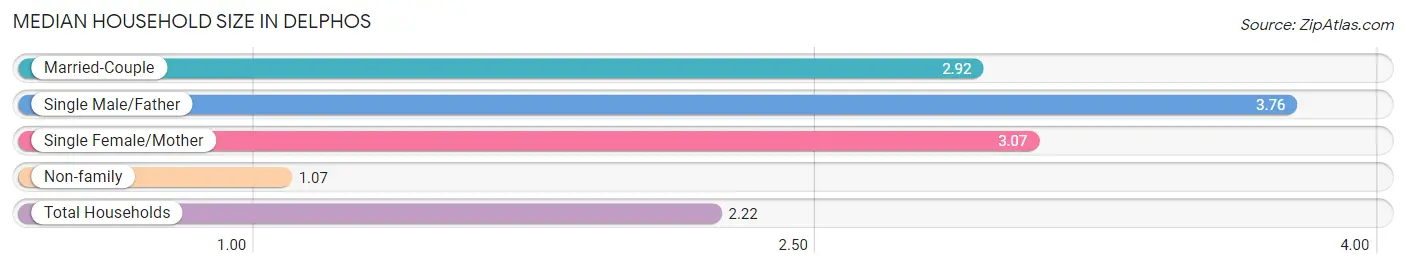
| Household Type | # Households | Household Size |
| Married-Couple | 1,309 (41.6%) | 2.92 |
| Single Male/Father | 172 (5.5%) | 3.76 |
| Single Female/Mother | 374 (11.9%) | 3.07 |
| Non-family | 1,293 (41.1%) | 1.07 |
| Total Households | 3,148 (100.0%) | 2.22 |
Household Size by Marriage Status in Delphos
Out of a total of 3,148 households in Delphos, 1,855 (58.9%) are family households, while 1,293 (41.1%) are nonfamily households. The most numerous type of family households are 2-person households, comprising 899, and the most common type of nonfamily households are 1-person households, comprising 1,232.
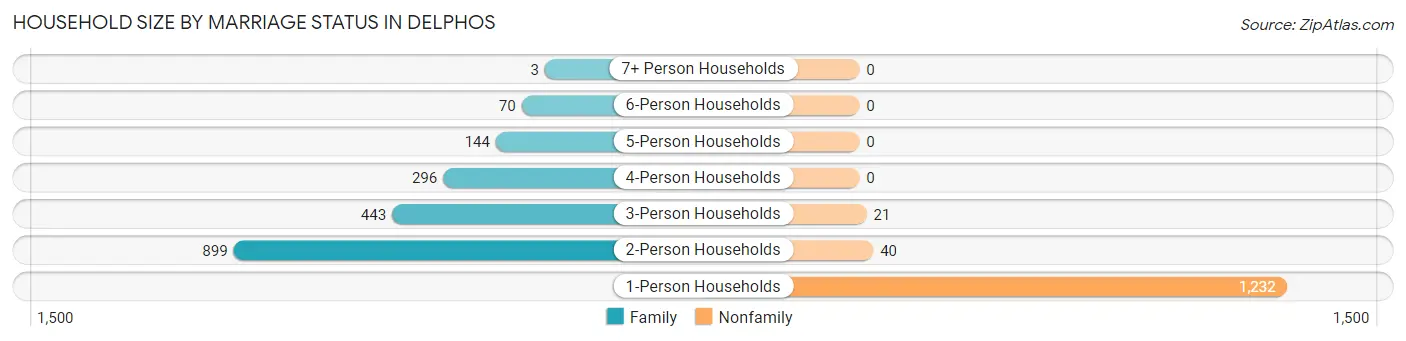
| Household Size | Family Households | Nonfamily Households |
| 1-Person Households | - | 1,232 (39.1%) |
| 2-Person Households | 899 (28.6%) | 40 (1.3%) |
| 3-Person Households | 443 (14.1%) | 21 (0.7%) |
| 4-Person Households | 296 (9.4%) | 0 (0.0%) |
| 5-Person Households | 144 (4.6%) | 0 (0.0%) |
| 6-Person Households | 70 (2.2%) | 0 (0.0%) |
| 7+ Person Households | 3 (0.1%) | 0 (0.0%) |
| Total | 1,855 (58.9%) | 1,293 (41.1%) |
Female Fertility in Delphos
Fertility by Age in Delphos
Average fertility rate in Delphos is 111.0 births per 1,000 women. Women in the age bracket of 20 to 34 years have the highest fertility rate with 230.0 births per 1,000 women. Women in the age bracket of 20 to 34 years acount for 95.5% of all women with births.
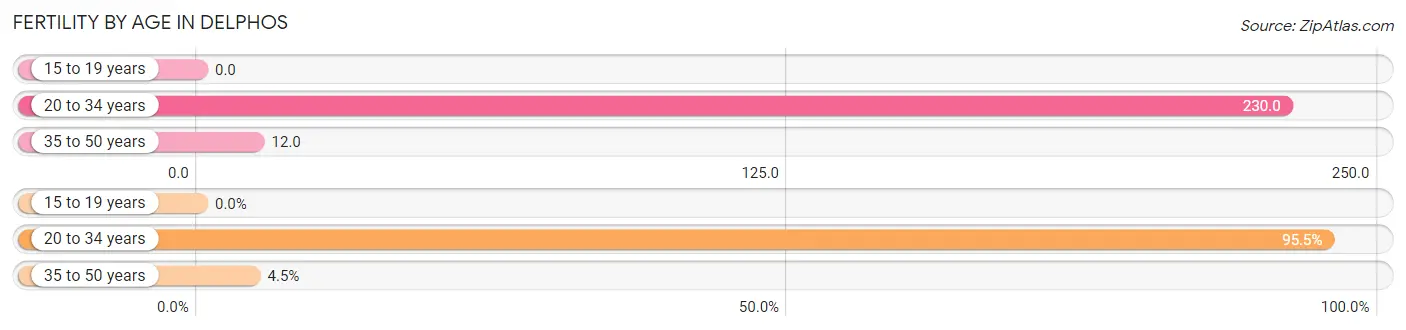
| Age Bracket | Women with Births | Births / 1,000 Women |
| 15 to 19 years | 0 (0.0%) | 0.0 |
| 20 to 34 years | 150 (95.5%) | 230.0 |
| 35 to 50 years | 7 (4.5%) | 12.0 |
| Total | 157 (100.0%) | 111.0 |
Fertility by Age by Marriage Status in Delphos
70.1% of women with births (157) in Delphos are married. The highest percentage of unmarried women with births falls into 20 to 34 years age bracket with 31.3% of them unmarried at the time of birth, while the lowest percentage of unmarried women with births belong to 35 to 50 years age bracket with 0.0% of them unmarried.
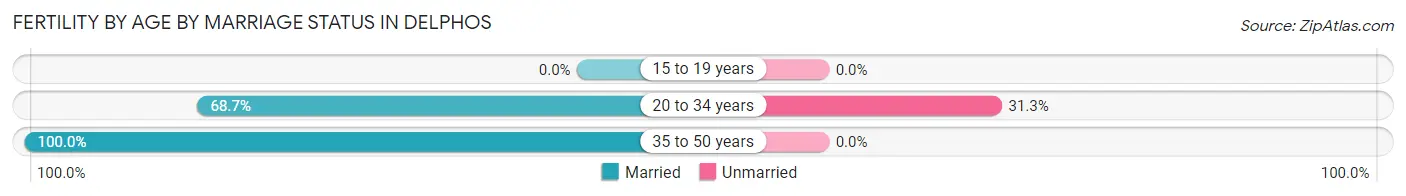
| Age Bracket | Married | Unmarried |
| 15 to 19 years | 0 (0.0%) | 0 (0.0%) |
| 20 to 34 years | 103 (68.7%) | 47 (31.3%) |
| 35 to 50 years | 7 (100.0%) | 0 (0.0%) |
| Total | 110 (70.1%) | 47 (29.9%) |
Fertility by Education in Delphos
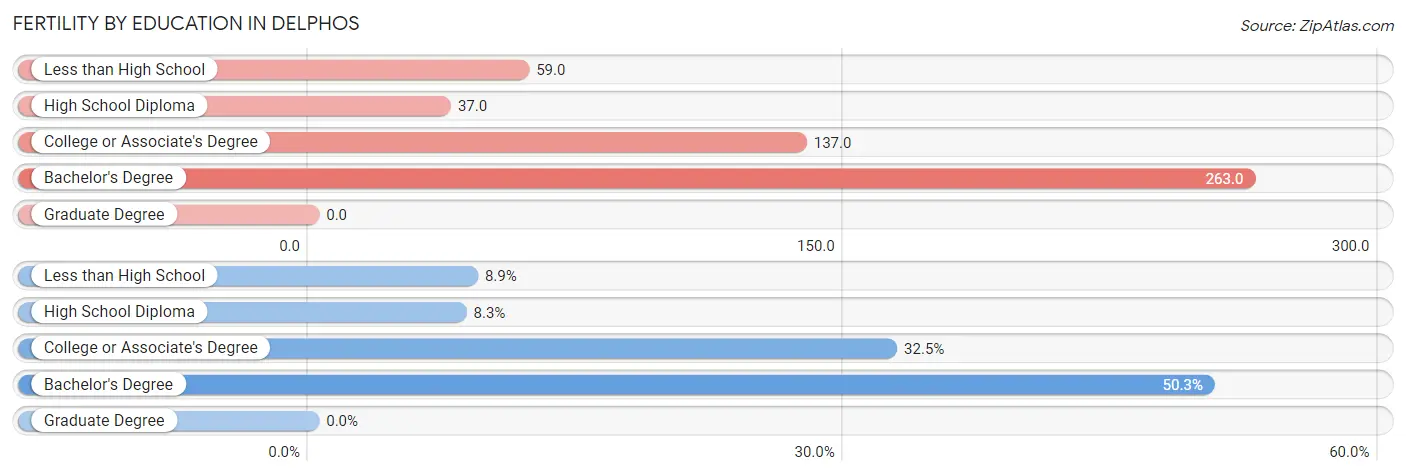
| Educational Attainment | Women with Births | Births / 1,000 Women |
| Less than High School | 14 (8.9%) | 59.0 |
| High School Diploma | 13 (8.3%) | 37.0 |
| College or Associate's Degree | 51 (32.5%) | 137.0 |
| Bachelor's Degree | 79 (50.3%) | 263.0 |
| Graduate Degree | 0 (0.0%) | 0.0 |
| Total | 157 (100.0%) | 111.0 |
Fertility by Education by Marriage Status in Delphos
29.9% of women with births in Delphos are unmarried. Women with the educational attainment of less than high school are most likely to be married with 100.0% of them married at childbirth, while women with the educational attainment of high school diploma are least likely to be married with 100.0% of them unmarried at childbirth.
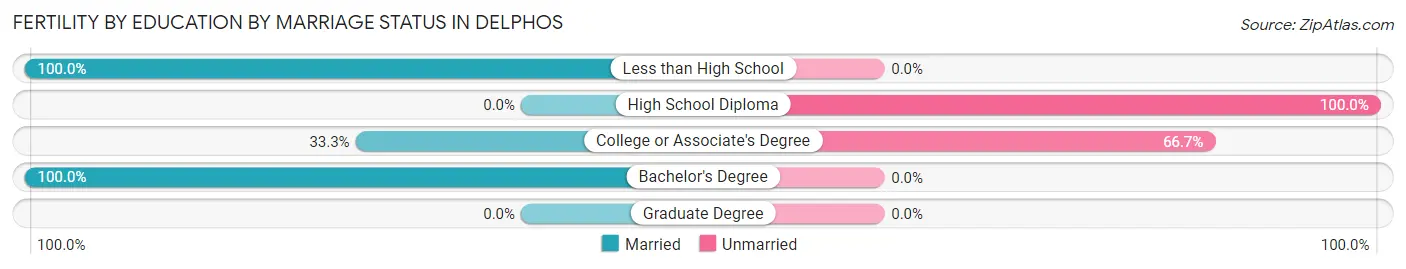
| Educational Attainment | Married | Unmarried |
| Less than High School | 14 (100.0%) | 0 (0.0%) |
| High School Diploma | 0 (0.0%) | 13 (100.0%) |
| College or Associate's Degree | 17 (33.3%) | 34 (66.7%) |
| Bachelor's Degree | 79 (100.0%) | 0 (0.0%) |
| Graduate Degree | 0 (0.0%) | 0 (0.0%) |
| Total | 110 (70.1%) | 47 (29.9%) |
Employment Characteristics in Delphos
Employment by Class of Employer in Delphos
Among the 3,271 employed individuals in Delphos, private company employees (2,748 | 84.0%), local government employees (238 | 7.3%), and not-for-profit organizations (145 | 4.4%) make up the most common classes of employment.
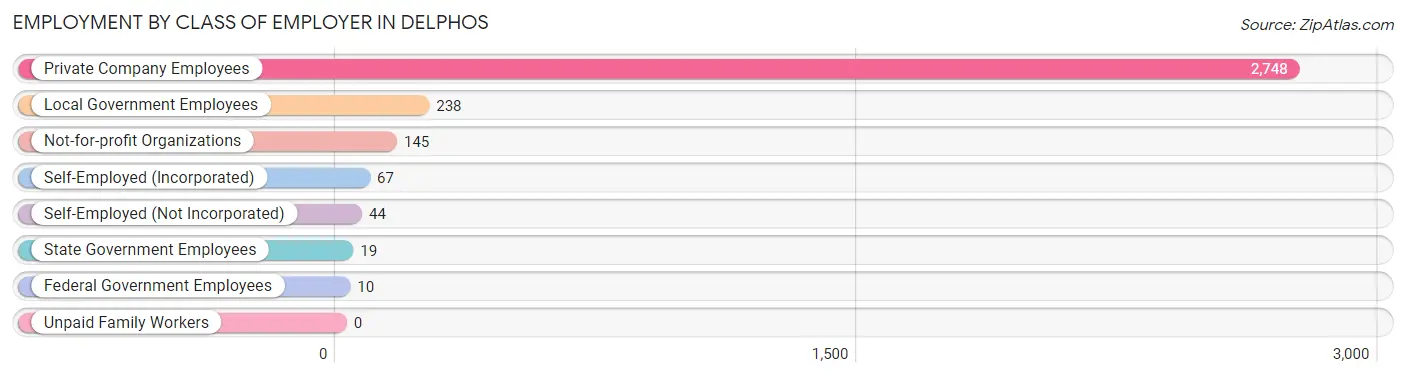
| Employer Class | # Employees | % Employees |
| Private Company Employees | 2,748 | 84.0% |
| Self-Employed (Incorporated) | 67 | 2.1% |
| Self-Employed (Not Incorporated) | 44 | 1.3% |
| Not-for-profit Organizations | 145 | 4.4% |
| Local Government Employees | 238 | 7.3% |
| State Government Employees | 19 | 0.6% |
| Federal Government Employees | 10 | 0.3% |
| Unpaid Family Workers | 0 | 0.0% |
| Total | 3,271 | 100.0% |
Employment Status by Age in Delphos
According to the labor force statistics for Delphos, out of the total population over 16 years of age (5,719), 62.9% or 3,597 individuals are in the labor force, with 6.8% or 245 of them unemployed. The age group with the highest labor force participation rate is 30 to 34 years, with 100.0% or 472 individuals in the labor force. Within the labor force, the 16 to 19 years age range has the highest percentage of unemployed individuals, with 31.5% or 57 of them being unemployed.
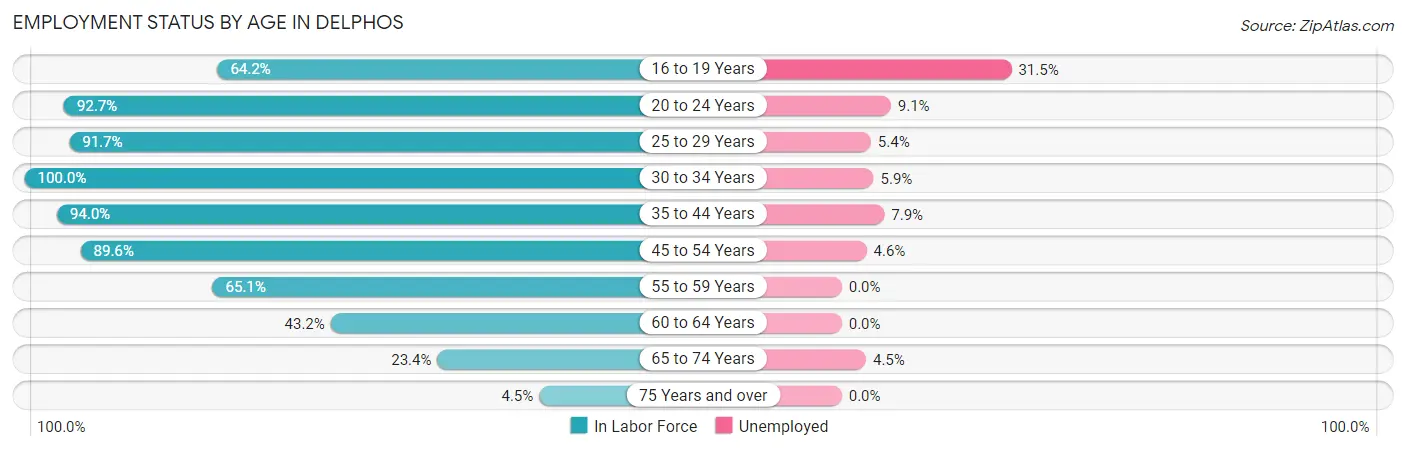
| Age Bracket | In Labor Force | Unemployed |
| 16 to 19 Years | 181 (64.2%) | 57 (31.5%) |
| 20 to 24 Years | 353 (92.7%) | 32 (9.1%) |
| 25 to 29 Years | 633 (91.7%) | 34 (5.4%) |
| 30 to 34 Years | 472 (100.0%) | 28 (5.9%) |
| 35 to 44 Years | 733 (94.0%) | 58 (7.9%) |
| 45 to 54 Years | 626 (89.6%) | 29 (4.6%) |
| 55 to 59 Years | 192 (65.1%) | 0 (0.0%) |
| 60 to 64 Years | 185 (43.2%) | 0 (0.0%) |
| 65 to 74 Years | 178 (23.4%) | 8 (4.5%) |
| 75 Years and over | 42 (4.5%) | 0 (0.0%) |
| Total | 3,597 (62.9%) | 245 (6.8%) |
Employment Status by Educational Attainment in Delphos
According to labor force statistics for Delphos, 84.5% of individuals (2,843) out of the total population between 25 and 64 years of age (3,364) are in the labor force, with 5.2% or 148 of them being unemployed. The group with the highest labor force participation rate are those with the educational attainment of bachelor's degree or higher, with 96.5% or 682 individuals in the labor force. Within the labor force, individuals with less than high school education have the highest percentage of unemployment, with 24.8% or 60 of them being unemployed.
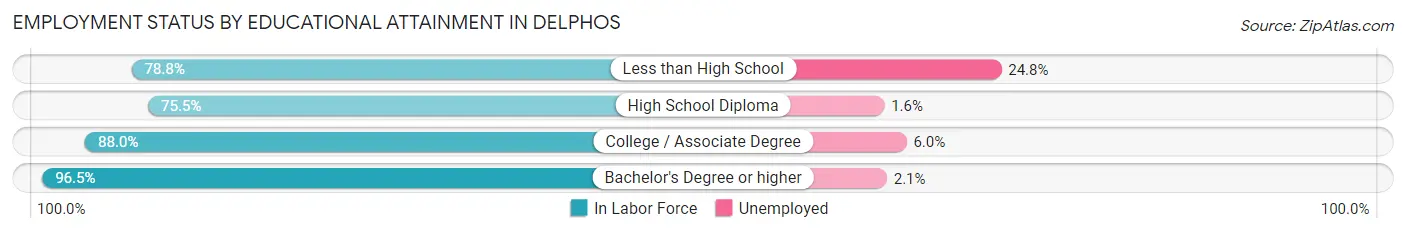
| Educational Attainment | In Labor Force | Unemployed |
| Less than High School | 242 (78.8%) | 76 (24.8%) |
| High School Diploma | 912 (75.5%) | 19 (1.6%) |
| College / Associate Degree | 1,005 (88.0%) | 69 (6.0%) |
| Bachelor's Degree or higher | 682 (96.5%) | 15 (2.1%) |
| Total | 2,843 (84.5%) | 175 (5.2%) |
Employment Occupations by Sex in Delphos
Management, Business, Science and Arts Occupations
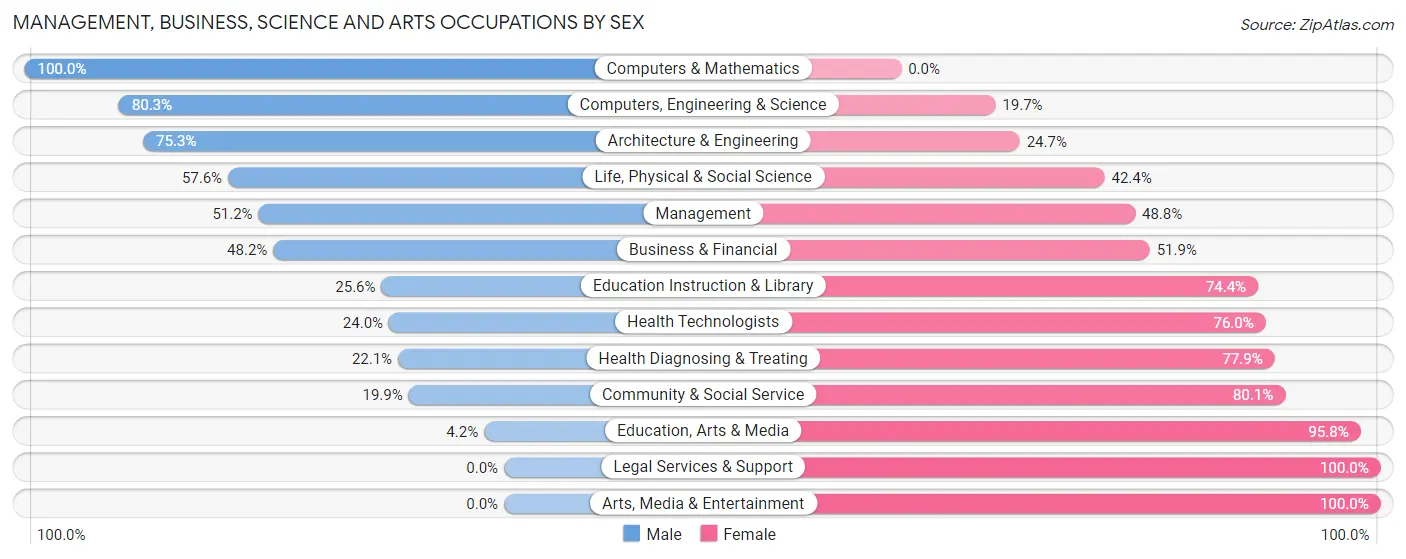
The most common Management, Business, Science and Arts occupations in Delphos are Health Diagnosing & Treating (312 | 9.3%), Computers, Engineering & Science (305 | 9.1%), Management (287 | 8.6%), Community & Social Service (226 | 6.8%), and Health Technologists (200 | 6.0%).
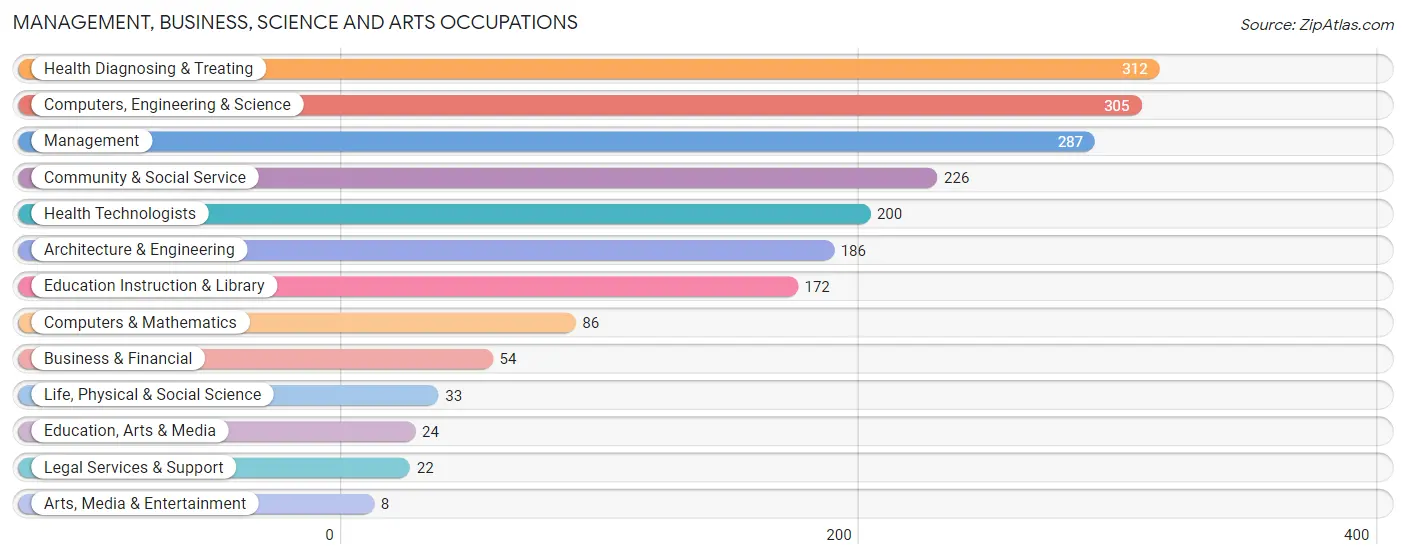
Management, Business, Science and Arts Occupations by Sex
Within the Management, Business, Science and Arts occupations in Delphos, the most male-oriented occupations are Computers & Mathematics (100.0%), Computers, Engineering & Science (80.3%), and Architecture & Engineering (75.3%), while the most female-oriented occupations are Legal Services & Support (100.0%), Arts, Media & Entertainment (100.0%), and Education, Arts & Media (95.8%).
| Occupation | Male | Female |
| Management | 147 (51.2%) | 140 (48.8%) |
| Business & Financial | 26 (48.1%) | 28 (51.8%) |
| Computers, Engineering & Science | 245 (80.3%) | 60 (19.7%) |
| Computers & Mathematics | 86 (100.0%) | 0 (0.0%) |
| Architecture & Engineering | 140 (75.3%) | 46 (24.7%) |
| Life, Physical & Social Science | 19 (57.6%) | 14 (42.4%) |
| Community & Social Service | 45 (19.9%) | 181 (80.1%) |
| Education, Arts & Media | 1 (4.2%) | 23 (95.8%) |
| Legal Services & Support | 0 (0.0%) | 22 (100.0%) |
| Education Instruction & Library | 44 (25.6%) | 128 (74.4%) |
| Arts, Media & Entertainment | 0 (0.0%) | 8 (100.0%) |
| Health Diagnosing & Treating | 69 (22.1%) | 243 (77.9%) |
| Health Technologists | 48 (24.0%) | 152 (76.0%) |
| Total (Category) | 532 (44.9%) | 652 (55.1%) |
| Total (Overall) | 1,879 (56.1%) | 1,470 (43.9%) |
Services Occupations
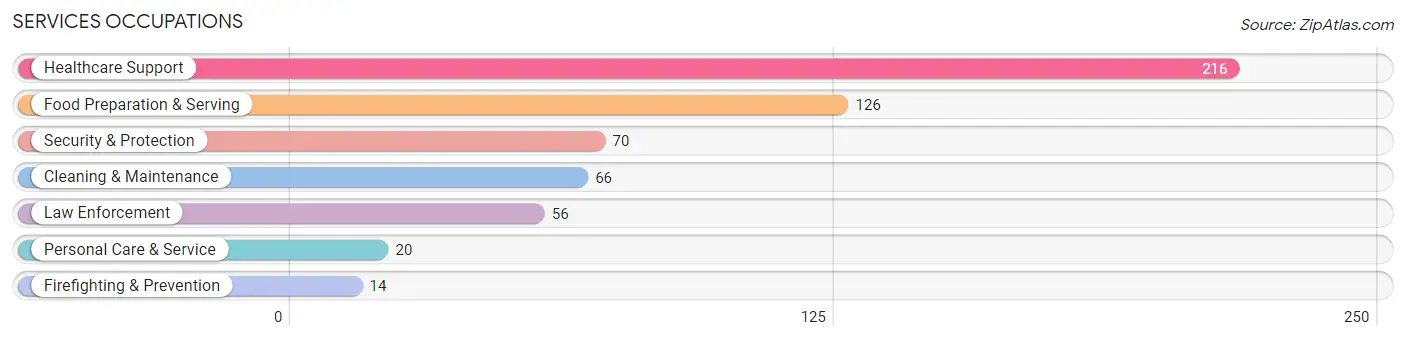
The most common Services occupations in Delphos are Healthcare Support (216 | 6.5%), Food Preparation & Serving (126 | 3.8%), Security & Protection (70 | 2.1%), Cleaning & Maintenance (66 | 2.0%), and Law Enforcement (56 | 1.7%).
Services Occupations by Sex
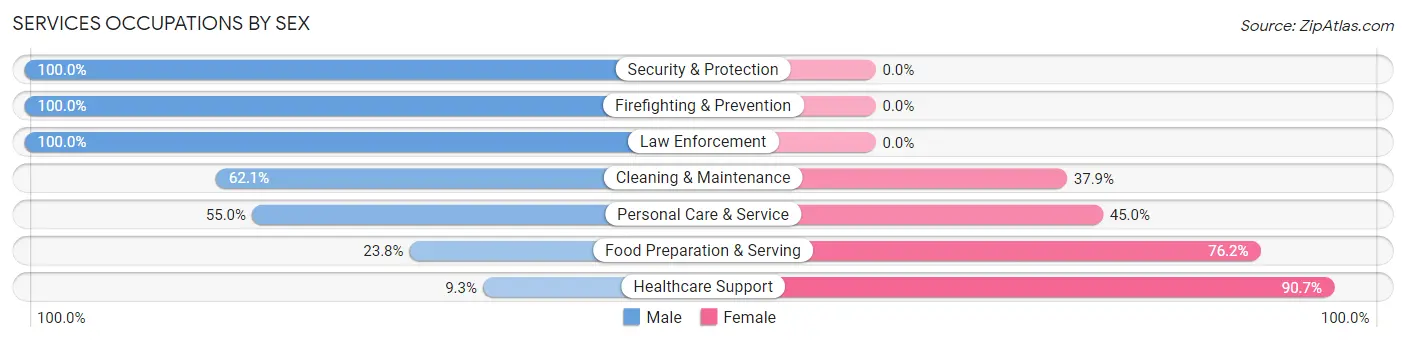
Within the Services occupations in Delphos, the most male-oriented occupations are Security & Protection (100.0%), Firefighting & Prevention (100.0%), and Law Enforcement (100.0%), while the most female-oriented occupations are Healthcare Support (90.7%), Food Preparation & Serving (76.2%), and Personal Care & Service (45.0%).
| Occupation | Male | Female |
| Healthcare Support | 20 (9.3%) | 196 (90.7%) |
| Security & Protection | 70 (100.0%) | 0 (0.0%) |
| Firefighting & Prevention | 14 (100.0%) | 0 (0.0%) |
| Law Enforcement | 56 (100.0%) | 0 (0.0%) |
| Food Preparation & Serving | 30 (23.8%) | 96 (76.2%) |
| Cleaning & Maintenance | 41 (62.1%) | 25 (37.9%) |
| Personal Care & Service | 11 (55.0%) | 9 (45.0%) |
| Total (Category) | 172 (34.5%) | 326 (65.5%) |
| Total (Overall) | 1,879 (56.1%) | 1,470 (43.9%) |
Sales and Office Occupations
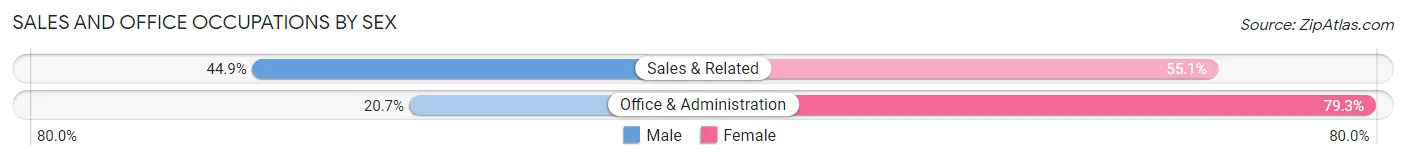
The most common Sales and Office occupations in Delphos are Office & Administration (275 | 8.2%), and Sales & Related (138 | 4.1%).

Sales and Office Occupations by Sex
| Occupation | Male | Female |
| Sales & Related | 62 (44.9%) | 76 (55.1%) |
| Office & Administration | 57 (20.7%) | 218 (79.3%) |
| Total (Category) | 119 (28.8%) | 294 (71.2%) |
| Total (Overall) | 1,879 (56.1%) | 1,470 (43.9%) |
Natural Resources, Construction and Maintenance Occupations
The most common Natural Resources, Construction and Maintenance occupations in Delphos are Installation, Maintenance & Repair (148 | 4.4%), Construction & Extraction (139 | 4.2%), and Farming, Fishing & Forestry (29 | 0.9%).
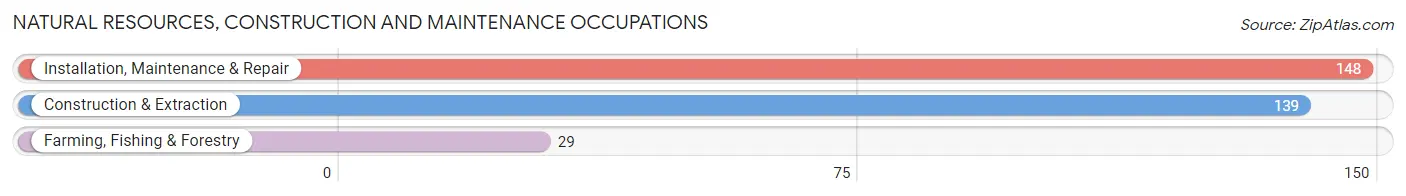
Natural Resources, Construction and Maintenance Occupations by Sex

| Occupation | Male | Female |
| Farming, Fishing & Forestry | 29 (100.0%) | 0 (0.0%) |
| Construction & Extraction | 122 (87.8%) | 17 (12.2%) |
| Installation, Maintenance & Repair | 148 (100.0%) | 0 (0.0%) |
| Total (Category) | 299 (94.6%) | 17 (5.4%) |
| Total (Overall) | 1,879 (56.1%) | 1,470 (43.9%) |
Production, Transportation and Moving Occupations
The most common Production, Transportation and Moving occupations in Delphos are Production (461 | 13.8%), Transportation (247 | 7.4%), and Material Moving (230 | 6.9%).
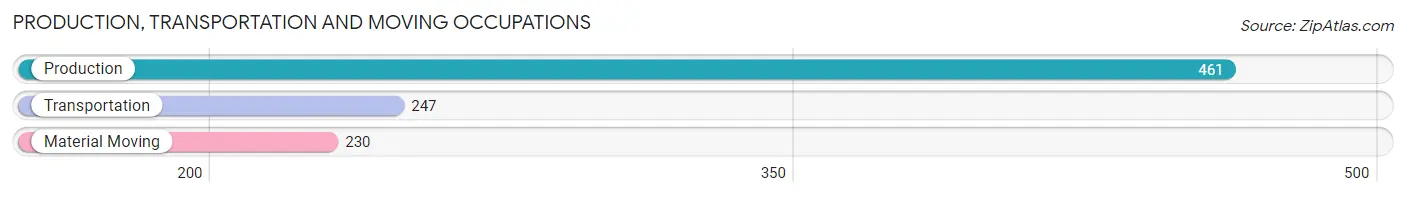
Production, Transportation and Moving Occupations by Sex
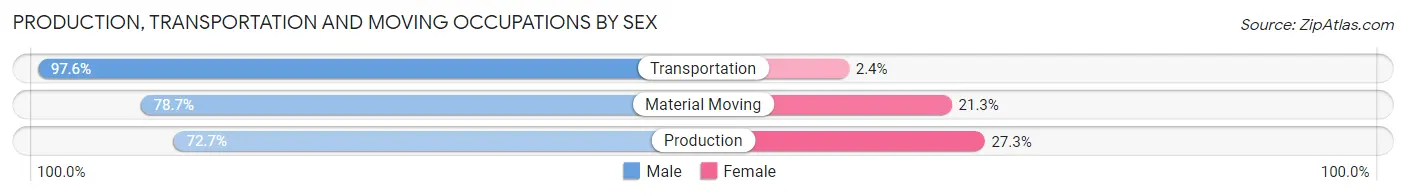
| Occupation | Male | Female |
| Production | 335 (72.7%) | 126 (27.3%) |
| Transportation | 241 (97.6%) | 6 (2.4%) |
| Material Moving | 181 (78.7%) | 49 (21.3%) |
| Total (Category) | 757 (80.7%) | 181 (19.3%) |
| Total (Overall) | 1,879 (56.1%) | 1,470 (43.9%) |
Employment Industries by Sex in Delphos
Employment Industries in Delphos
The major employment industries in Delphos include Manufacturing (840 | 25.1%), Health Care & Social Assistance (700 | 20.9%), Retail Trade (274 | 8.2%), Transportation & Warehousing (237 | 7.1%), and Professional & Scientific (226 | 6.8%).
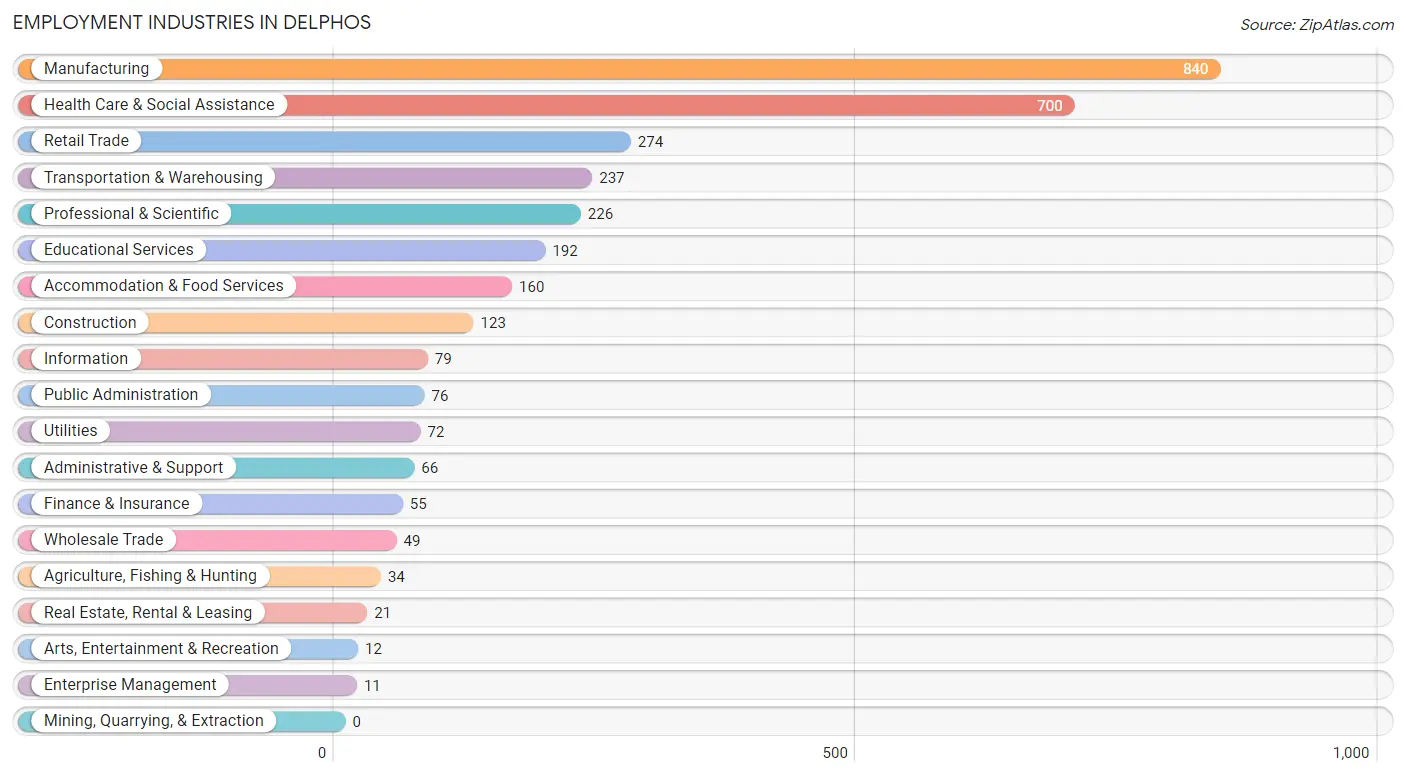
Employment Industries by Sex in Delphos
The Delphos industries that see more men than women are Agriculture, Fishing & Hunting (100.0%), Wholesale Trade (100.0%), and Arts, Entertainment & Recreation (100.0%), whereas the industries that tend to have a higher number of women are Enterprise Management (100.0%), Finance & Insurance (96.4%), and Health Care & Social Assistance (85.3%).
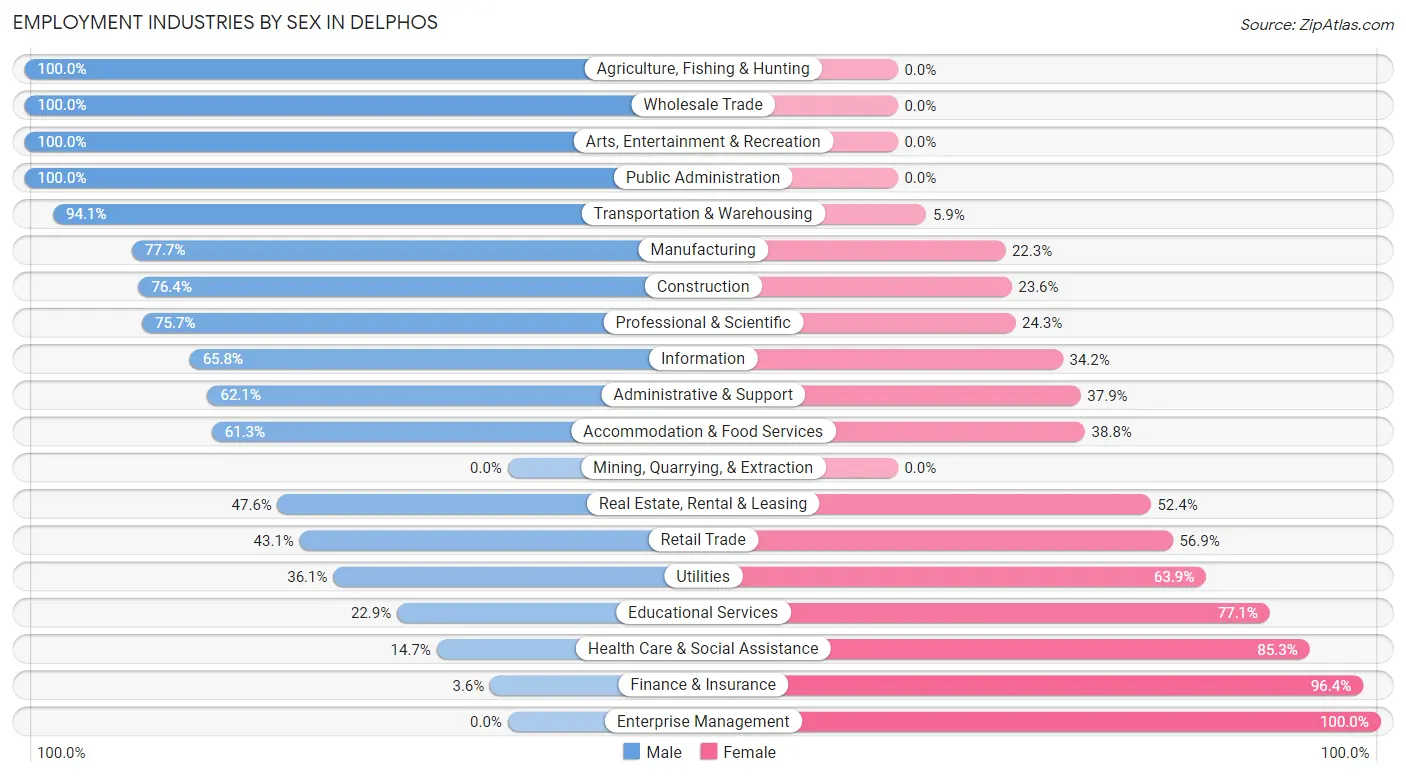
| Industry | Male | Female |
| Agriculture, Fishing & Hunting | 34 (100.0%) | 0 (0.0%) |
| Mining, Quarrying, & Extraction | 0 (0.0%) | 0 (0.0%) |
| Construction | 94 (76.4%) | 29 (23.6%) |
| Manufacturing | 653 (77.7%) | 187 (22.3%) |
| Wholesale Trade | 49 (100.0%) | 0 (0.0%) |
| Retail Trade | 118 (43.1%) | 156 (56.9%) |
| Transportation & Warehousing | 223 (94.1%) | 14 (5.9%) |
| Utilities | 26 (36.1%) | 46 (63.9%) |
| Information | 52 (65.8%) | 27 (34.2%) |
| Finance & Insurance | 2 (3.6%) | 53 (96.4%) |
| Real Estate, Rental & Leasing | 10 (47.6%) | 11 (52.4%) |
| Professional & Scientific | 171 (75.7%) | 55 (24.3%) |
| Enterprise Management | 0 (0.0%) | 11 (100.0%) |
| Administrative & Support | 41 (62.1%) | 25 (37.9%) |
| Educational Services | 44 (22.9%) | 148 (77.1%) |
| Health Care & Social Assistance | 103 (14.7%) | 597 (85.3%) |
| Arts, Entertainment & Recreation | 12 (100.0%) | 0 (0.0%) |
| Accommodation & Food Services | 98 (61.3%) | 62 (38.8%) |
| Public Administration | 76 (100.0%) | 0 (0.0%) |
| Total | 1,879 (56.1%) | 1,470 (43.9%) |
Education in Delphos
School Enrollment in Delphos
The most common levels of schooling among the 1,297 students in Delphos are high school (355 | 27.4%), elementary school (285 | 22.0%), and middle school (235 | 18.1%).
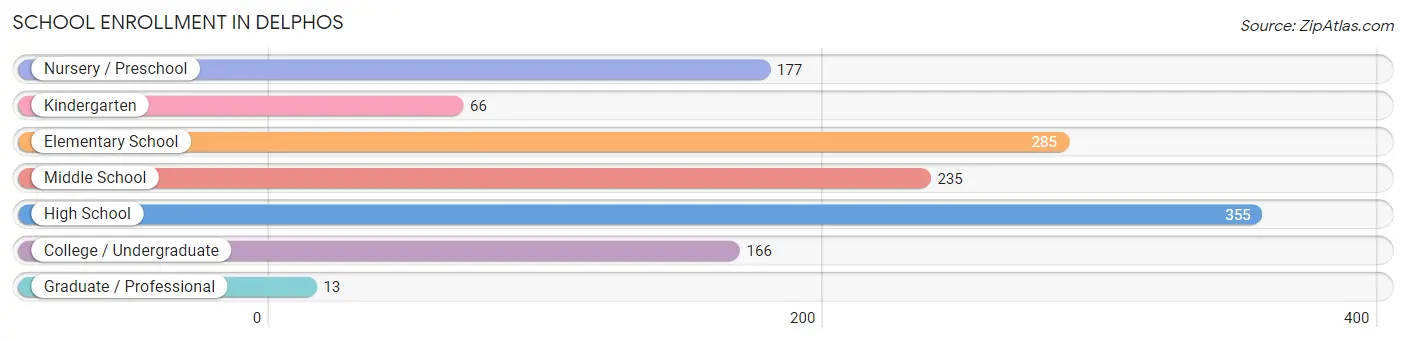
| School Level | # Students | % Students |
| Nursery / Preschool | 177 | 13.7% |
| Kindergarten | 66 | 5.1% |
| Elementary School | 285 | 22.0% |
| Middle School | 235 | 18.1% |
| High School | 355 | 27.4% |
| College / Undergraduate | 166 | 12.8% |
| Graduate / Professional | 13 | 1.0% |
| Total | 1,297 | 100.0% |
School Enrollment by Age by Funding Source in Delphos
Out of a total of 1,297 students who are enrolled in schools in Delphos, 252 (19.4%) attend a private institution, while the remaining 1,045 (80.6%) are enrolled in public schools. The age group of 35 years and over has the highest likelihood of being enrolled in private schools, with 32 (100.0% in the age bracket) enrolled. Conversely, the age group of 18 to 19 year olds has the lowest likelihood of being enrolled in a private school, with 96 (100.0% in the age bracket) attending a public institution.
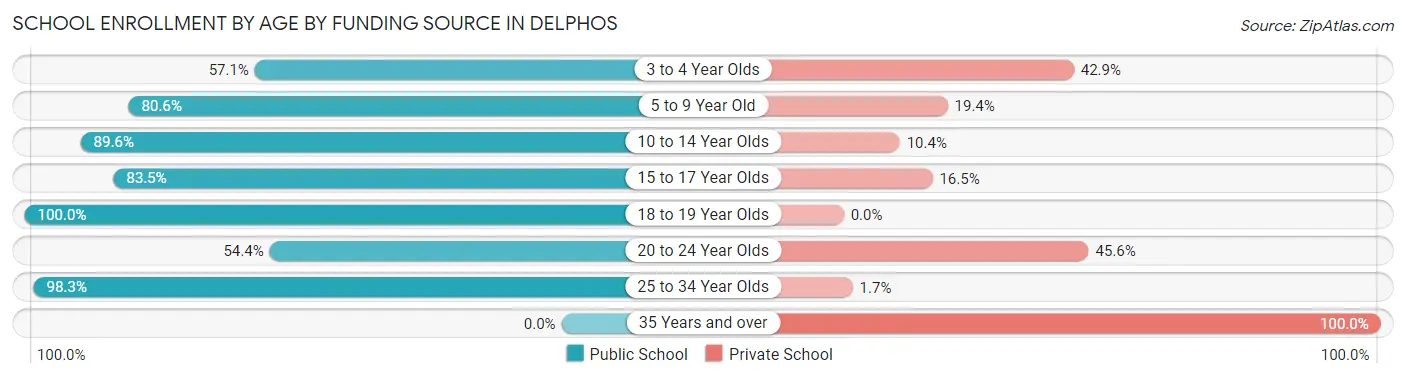
| Age Bracket | Public School | Private School |
| 3 to 4 Year Olds | 60 (57.1%) | 45 (42.9%) |
| 5 to 9 Year Old | 304 (80.6%) | 73 (19.4%) |
| 10 to 14 Year Olds | 283 (89.6%) | 33 (10.4%) |
| 15 to 17 Year Olds | 212 (83.5%) | 42 (16.5%) |
| 18 to 19 Year Olds | 96 (100.0%) | 0 (0.0%) |
| 20 to 24 Year Olds | 31 (54.4%) | 26 (45.6%) |
| 25 to 34 Year Olds | 59 (98.3%) | 1 (1.7%) |
| 35 Years and over | 0 (0.0%) | 32 (100.0%) |
| Total | 1,045 (80.6%) | 252 (19.4%) |
Educational Attainment by Field of Study in Delphos
Education (360 | 30.9%), science & technology (259 | 22.2%), business (159 | 13.6%), arts & humanities (146 | 12.5%), and engineering (60 | 5.1%) are the most common fields of study among 1,166 individuals in Delphos who have obtained a bachelor's degree or higher.
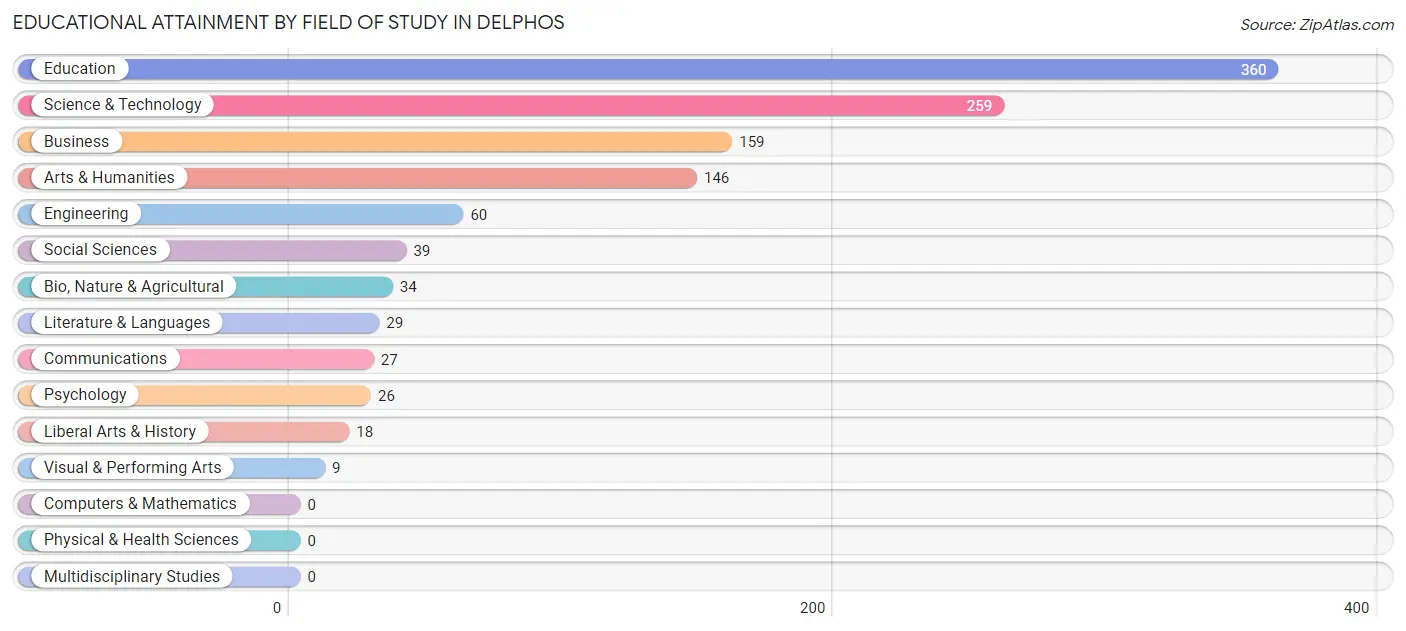
| Field of Study | # Graduates | % Graduates |
| Computers & Mathematics | 0 | 0.0% |
| Bio, Nature & Agricultural | 34 | 2.9% |
| Physical & Health Sciences | 0 | 0.0% |
| Psychology | 26 | 2.2% |
| Social Sciences | 39 | 3.3% |
| Engineering | 60 | 5.1% |
| Multidisciplinary Studies | 0 | 0.0% |
| Science & Technology | 259 | 22.2% |
| Business | 159 | 13.6% |
| Education | 360 | 30.9% |
| Literature & Languages | 29 | 2.5% |
| Liberal Arts & History | 18 | 1.5% |
| Visual & Performing Arts | 9 | 0.8% |
| Communications | 27 | 2.3% |
| Arts & Humanities | 146 | 12.5% |
| Total | 1,166 | 100.0% |
Transportation & Commute in Delphos
Vehicle Availability by Sex in Delphos
The most prevalent vehicle ownership categories in Delphos are males with 2 vehicles (947, accounting for 51.4%) and females with 2 vehicles (705, making up 66.5%).
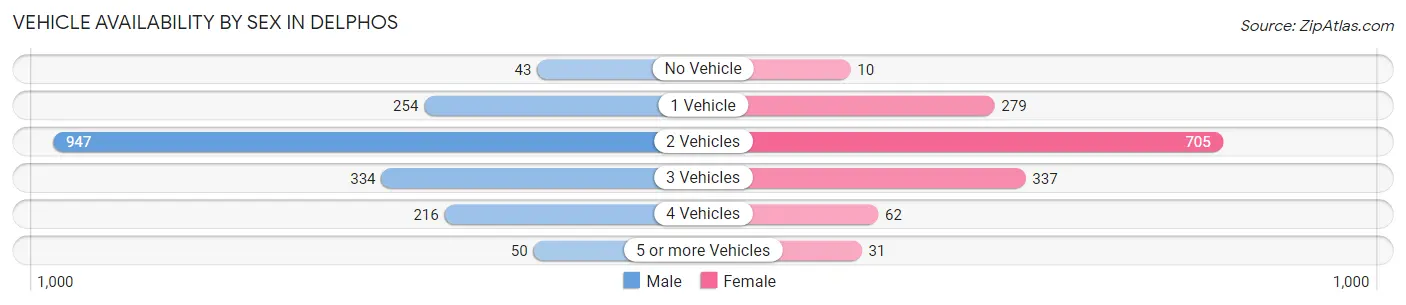
| Vehicles Available | Male | Female |
| No Vehicle | 43 (2.3%) | 10 (0.7%) |
| 1 Vehicle | 254 (13.8%) | 279 (19.6%) |
| 2 Vehicles | 947 (51.4%) | 705 (49.5%) |
| 3 Vehicles | 334 (18.1%) | 337 (23.7%) |
| 4 Vehicles | 216 (11.7%) | 62 (4.3%) |
| 5 or more Vehicles | 50 (2.7%) | 31 (2.2%) |
| Total | 1,844 (100.0%) | 1,424 (100.0%) |
Commute Time in Delphos
The most frequently occuring commute durations in Delphos are 5 to 9 minutes (801 commuters, 25.1%), 20 to 24 minutes (389 commuters, 12.2%), and 30 to 34 minutes (352 commuters, 11.0%).
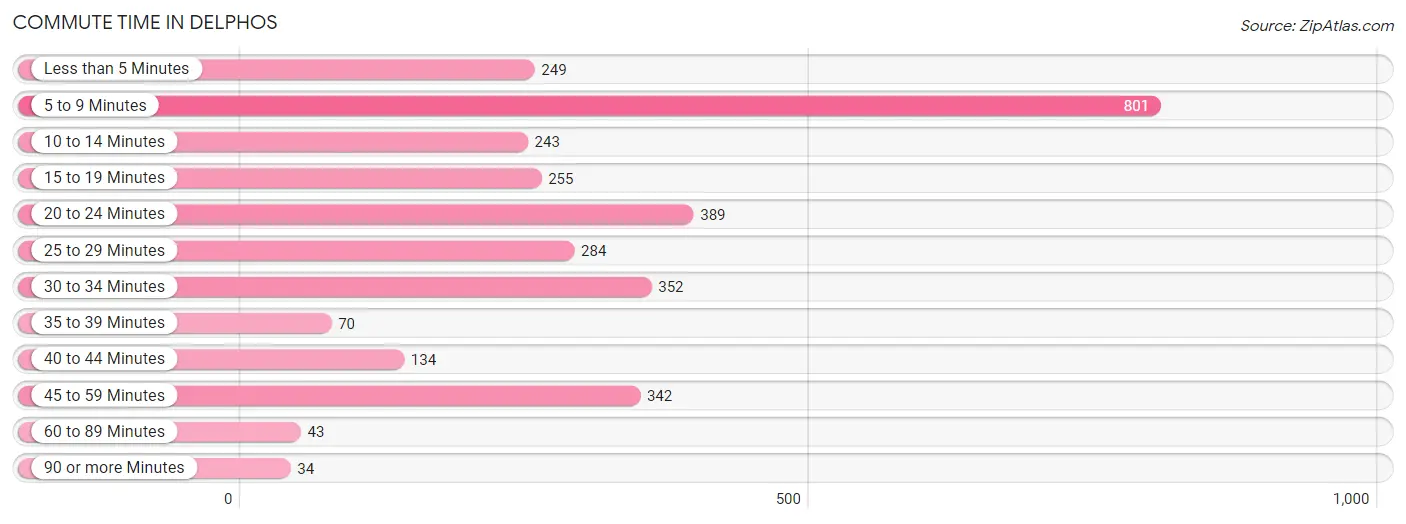
| Commute Time | # Commuters | % Commuters |
| Less than 5 Minutes | 249 | 7.8% |
| 5 to 9 Minutes | 801 | 25.1% |
| 10 to 14 Minutes | 243 | 7.6% |
| 15 to 19 Minutes | 255 | 8.0% |
| 20 to 24 Minutes | 389 | 12.2% |
| 25 to 29 Minutes | 284 | 8.9% |
| 30 to 34 Minutes | 352 | 11.0% |
| 35 to 39 Minutes | 70 | 2.2% |
| 40 to 44 Minutes | 134 | 4.2% |
| 45 to 59 Minutes | 342 | 10.7% |
| 60 to 89 Minutes | 43 | 1.3% |
| 90 or more Minutes | 34 | 1.1% |
Commute Time by Sex in Delphos
The most common commute times in Delphos are 5 to 9 minutes (422 commuters, 23.5%) for males and 5 to 9 minutes (379 commuters, 27.1%) for females.
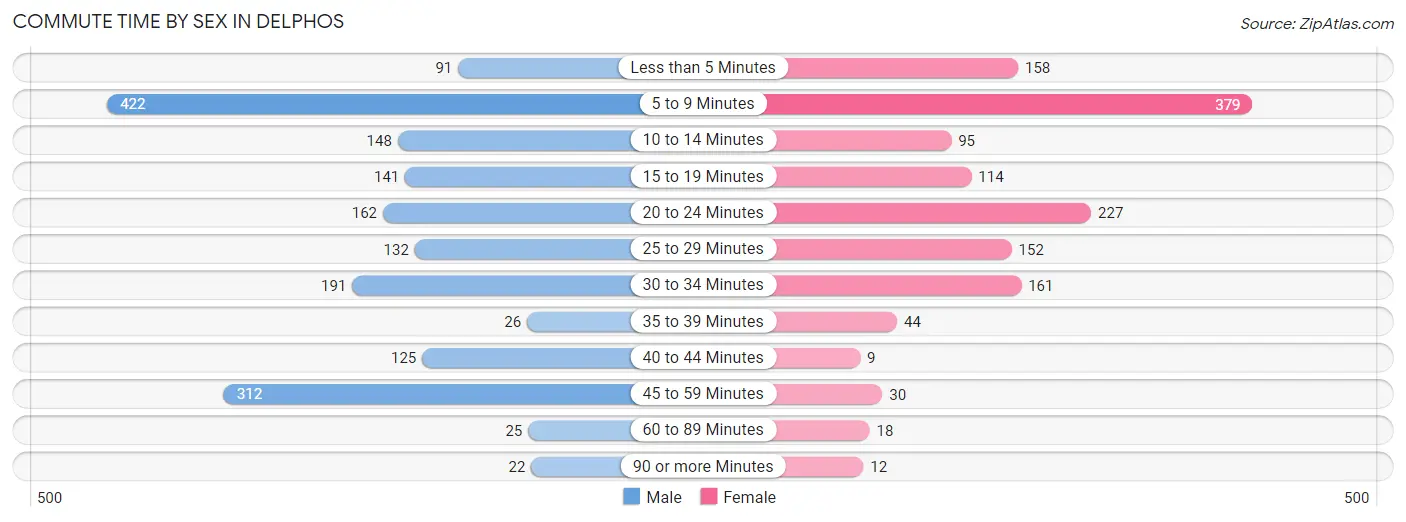
| Commute Time | Male | Female |
| Less than 5 Minutes | 91 (5.1%) | 158 (11.3%) |
| 5 to 9 Minutes | 422 (23.5%) | 379 (27.1%) |
| 10 to 14 Minutes | 148 (8.2%) | 95 (6.8%) |
| 15 to 19 Minutes | 141 (7.9%) | 114 (8.2%) |
| 20 to 24 Minutes | 162 (9.0%) | 227 (16.2%) |
| 25 to 29 Minutes | 132 (7.3%) | 152 (10.9%) |
| 30 to 34 Minutes | 191 (10.6%) | 161 (11.5%) |
| 35 to 39 Minutes | 26 (1.5%) | 44 (3.2%) |
| 40 to 44 Minutes | 125 (7.0%) | 9 (0.6%) |
| 45 to 59 Minutes | 312 (17.4%) | 30 (2.1%) |
| 60 to 89 Minutes | 25 (1.4%) | 18 (1.3%) |
| 90 or more Minutes | 22 (1.2%) | 12 (0.9%) |
Time of Departure to Work by Sex in Delphos
The most frequent times of departure to work in Delphos are 7:30 AM to 7:59 AM (259, 14.4%) for males and 7:30 AM to 7:59 AM (448, 32.0%) for females.
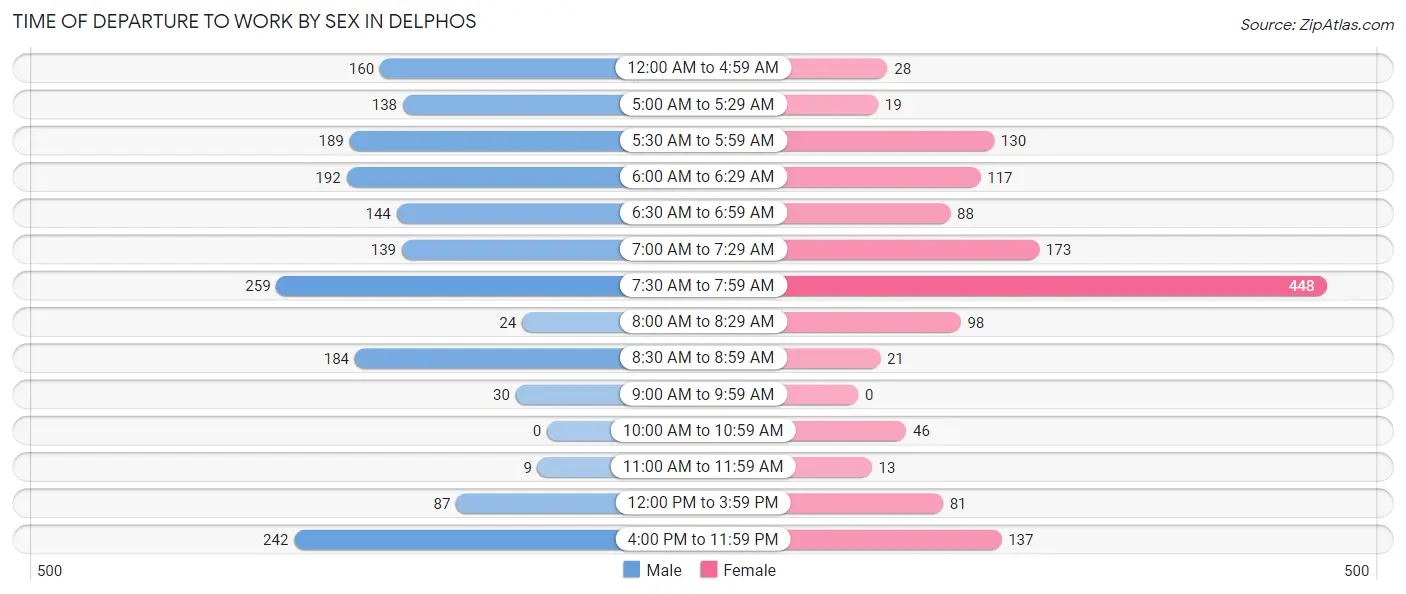
| Time of Departure | Male | Female |
| 12:00 AM to 4:59 AM | 160 (8.9%) | 28 (2.0%) |
| 5:00 AM to 5:29 AM | 138 (7.7%) | 19 (1.4%) |
| 5:30 AM to 5:59 AM | 189 (10.5%) | 130 (9.3%) |
| 6:00 AM to 6:29 AM | 192 (10.7%) | 117 (8.4%) |
| 6:30 AM to 6:59 AM | 144 (8.0%) | 88 (6.3%) |
| 7:00 AM to 7:29 AM | 139 (7.7%) | 173 (12.4%) |
| 7:30 AM to 7:59 AM | 259 (14.4%) | 448 (32.0%) |
| 8:00 AM to 8:29 AM | 24 (1.3%) | 98 (7.0%) |
| 8:30 AM to 8:59 AM | 184 (10.2%) | 21 (1.5%) |
| 9:00 AM to 9:59 AM | 30 (1.7%) | 0 (0.0%) |
| 10:00 AM to 10:59 AM | 0 (0.0%) | 46 (3.3%) |
| 11:00 AM to 11:59 AM | 9 (0.5%) | 13 (0.9%) |
| 12:00 PM to 3:59 PM | 87 (4.8%) | 81 (5.8%) |
| 4:00 PM to 11:59 PM | 242 (13.5%) | 137 (9.8%) |
| Total | 1,797 (100.0%) | 1,399 (100.0%) |
Housing Occupancy in Delphos
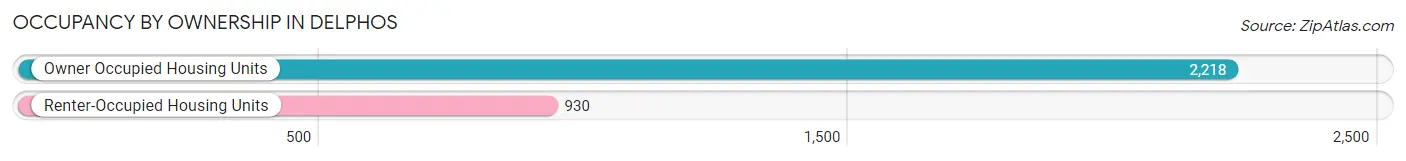
Occupancy by Ownership in Delphos
Of the total 3,148 dwellings in Delphos, owner-occupied units account for 2,218 (70.5%), while renter-occupied units make up 930 (29.5%).
| Occupancy | # Housing Units | % Housing Units |
| Owner Occupied Housing Units | 2,218 | 70.5% |
| Renter-Occupied Housing Units | 930 | 29.5% |
| Total Occupied Housing Units | 3,148 | 100.0% |
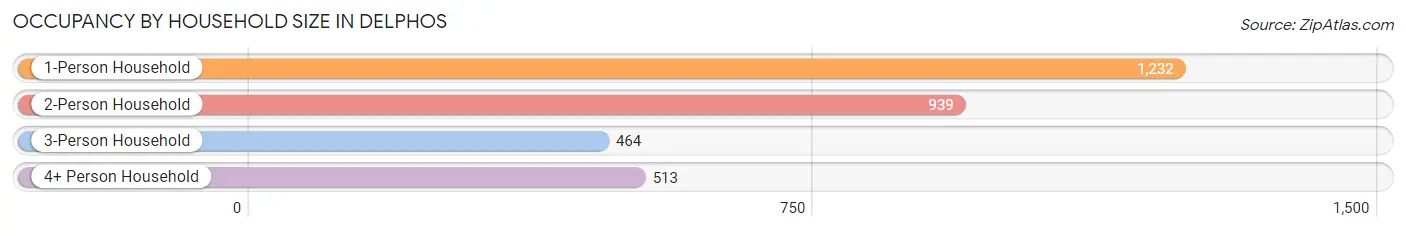
Occupancy by Household Size in Delphos
| Household Size | # Housing Units | % Housing Units |
| 1-Person Household | 1,232 | 39.1% |
| 2-Person Household | 939 | 29.8% |
| 3-Person Household | 464 | 14.7% |
| 4+ Person Household | 513 | 16.3% |
| Total Housing Units | 3,148 | 100.0% |
Occupancy by Ownership by Household Size in Delphos
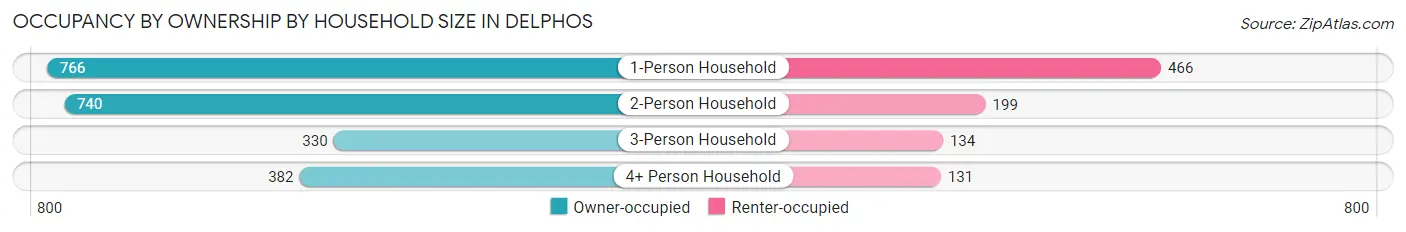
| Household Size | Owner-occupied | Renter-occupied |
| 1-Person Household | 766 (62.2%) | 466 (37.8%) |
| 2-Person Household | 740 (78.8%) | 199 (21.2%) |
| 3-Person Household | 330 (71.1%) | 134 (28.9%) |
| 4+ Person Household | 382 (74.5%) | 131 (25.5%) |
| Total Housing Units | 2,218 (70.5%) | 930 (29.5%) |
Occupancy by Educational Attainment in Delphos
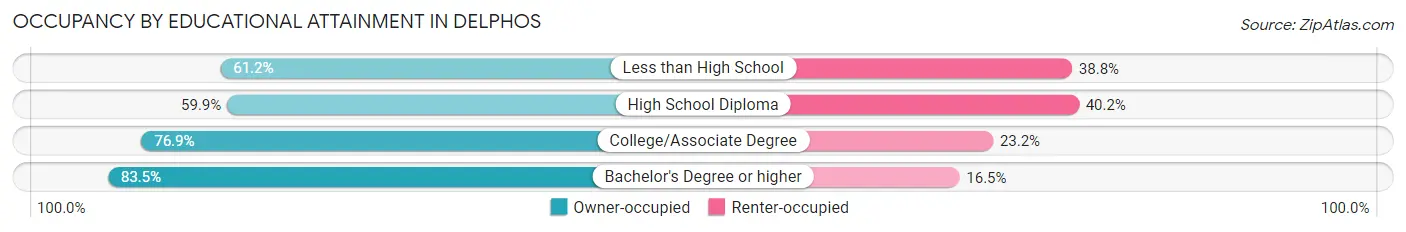
| Household Size | Owner-occupied | Renter-occupied |
| Less than High School | 216 (61.2%) | 137 (38.8%) |
| High School Diploma | 656 (59.9%) | 440 (40.2%) |
| College/Associate Degree | 840 (76.8%) | 253 (23.2%) |
| Bachelor's Degree or higher | 506 (83.5%) | 100 (16.5%) |
Occupancy by Age of Householder in Delphos
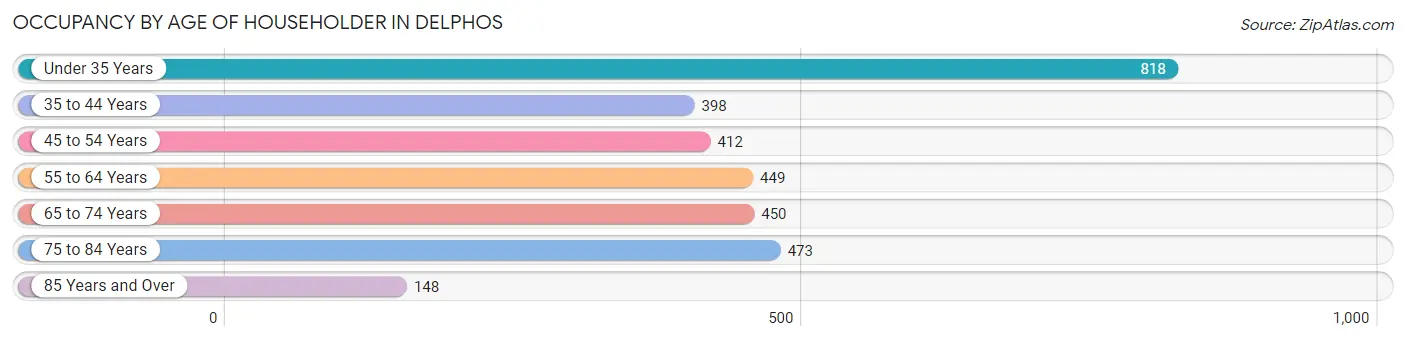
| Age Bracket | # Households | % Households |
| Under 35 Years | 818 | 26.0% |
| 35 to 44 Years | 398 | 12.6% |
| 45 to 54 Years | 412 | 13.1% |
| 55 to 64 Years | 449 | 14.3% |
| 65 to 74 Years | 450 | 14.3% |
| 75 to 84 Years | 473 | 15.0% |
| 85 Years and Over | 148 | 4.7% |
| Total | 3,148 | 100.0% |
Housing Finances in Delphos
Median Income by Occupancy in Delphos
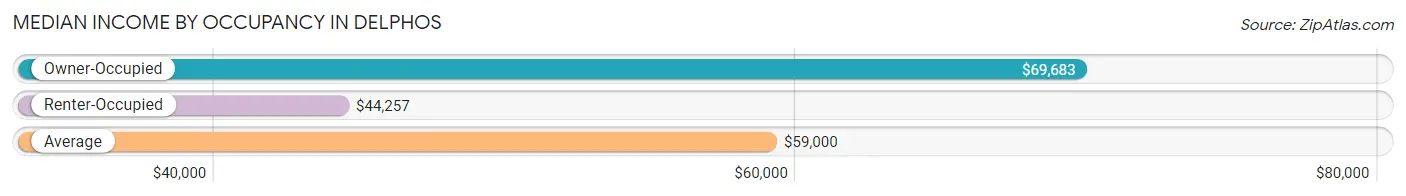
| Occupancy Type | # Households | Median Income |
| Owner-Occupied | 2,218 (70.5%) | $69,683 |
| Renter-Occupied | 930 (29.5%) | $44,257 |
| Average | 3,148 (100.0%) | $59,000 |
Occupancy by Householder Income Bracket in Delphos
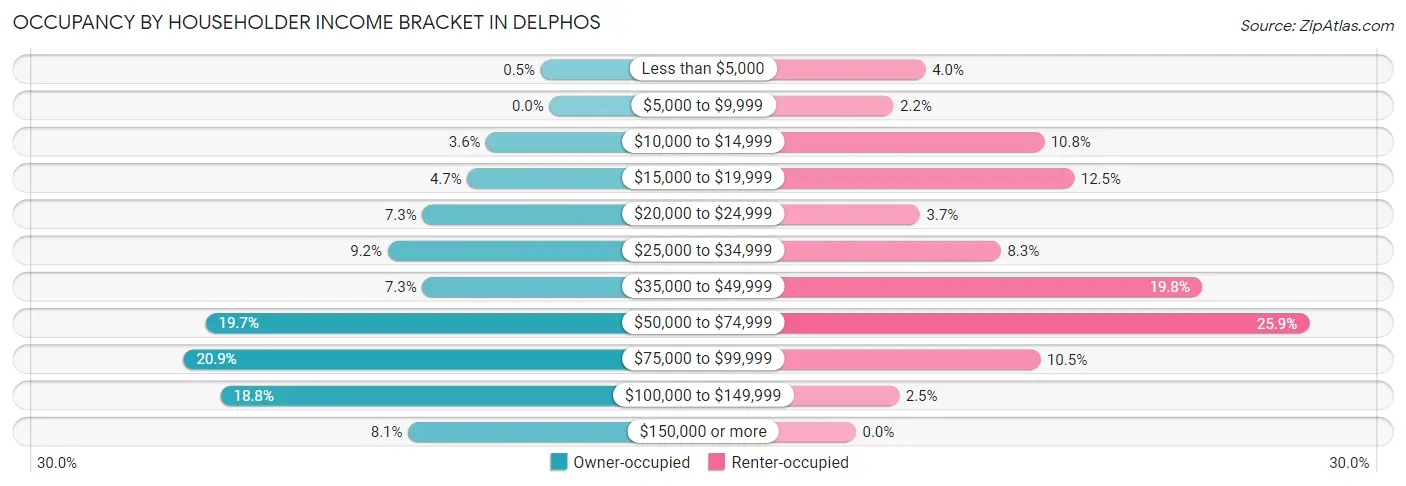
| Income Bracket | Owner-occupied | Renter-occupied |
| Less than $5,000 | 11 (0.5%) | 37 (4.0%) |
| $5,000 to $9,999 | 0 (0.0%) | 20 (2.1%) |
| $10,000 to $14,999 | 80 (3.6%) | 100 (10.7%) |
| $15,000 to $19,999 | 104 (4.7%) | 116 (12.5%) |
| $20,000 to $24,999 | 161 (7.3%) | 34 (3.7%) |
| $25,000 to $34,999 | 205 (9.2%) | 77 (8.3%) |
| $35,000 to $49,999 | 161 (7.3%) | 184 (19.8%) |
| $50,000 to $74,999 | 436 (19.7%) | 241 (25.9%) |
| $75,000 to $99,999 | 464 (20.9%) | 98 (10.5%) |
| $100,000 to $149,999 | 417 (18.8%) | 23 (2.5%) |
| $150,000 or more | 179 (8.1%) | 0 (0.0%) |
| Total | 2,218 (100.0%) | 930 (100.0%) |
Monthly Housing Cost Tiers in Delphos
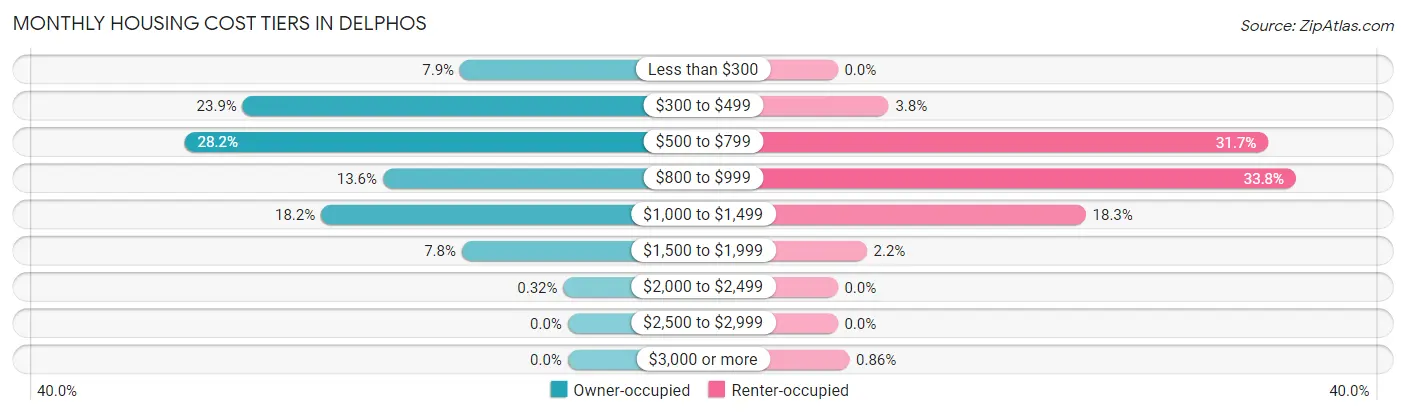
| Monthly Cost | Owner-occupied | Renter-occupied |
| Less than $300 | 176 (7.9%) | 0 (0.0%) |
| $300 to $499 | 531 (23.9%) | 35 (3.8%) |
| $500 to $799 | 626 (28.2%) | 295 (31.7%) |
| $800 to $999 | 302 (13.6%) | 314 (33.8%) |
| $1,000 to $1,499 | 403 (18.2%) | 170 (18.3%) |
| $1,500 to $1,999 | 173 (7.8%) | 20 (2.1%) |
| $2,000 to $2,499 | 7 (0.3%) | 0 (0.0%) |
| $2,500 to $2,999 | 0 (0.0%) | 0 (0.0%) |
| $3,000 or more | 0 (0.0%) | 8 (0.9%) |
| Total | 2,218 (100.0%) | 930 (100.0%) |
Physical Housing Characteristics in Delphos
Housing Structures in Delphos
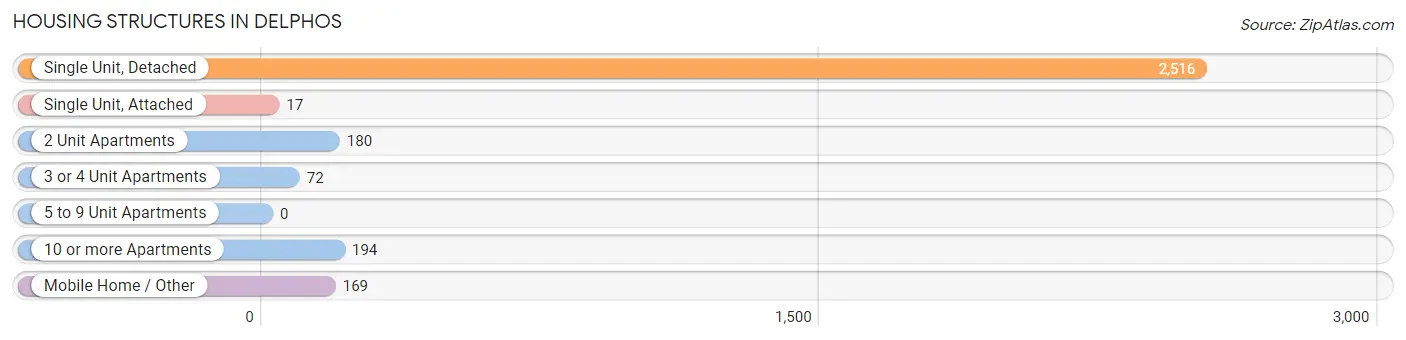
| Structure Type | # Housing Units | % Housing Units |
| Single Unit, Detached | 2,516 | 79.9% |
| Single Unit, Attached | 17 | 0.5% |
| 2 Unit Apartments | 180 | 5.7% |
| 3 or 4 Unit Apartments | 72 | 2.3% |
| 5 to 9 Unit Apartments | 0 | 0.0% |
| 10 or more Apartments | 194 | 6.2% |
| Mobile Home / Other | 169 | 5.4% |
| Total | 3,148 | 100.0% |
Housing Structures by Occupancy in Delphos
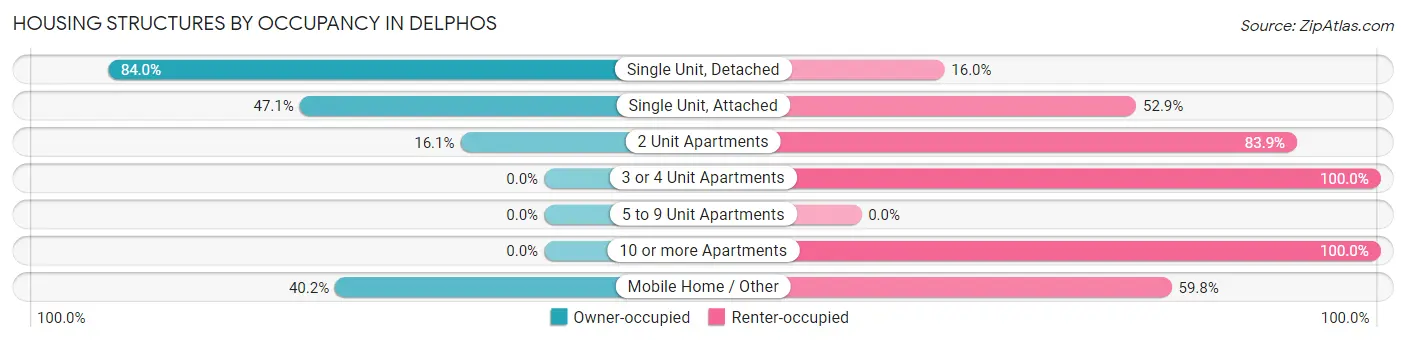
| Structure Type | Owner-occupied | Renter-occupied |
| Single Unit, Detached | 2,113 (84.0%) | 403 (16.0%) |
| Single Unit, Attached | 8 (47.1%) | 9 (52.9%) |
| 2 Unit Apartments | 29 (16.1%) | 151 (83.9%) |
| 3 or 4 Unit Apartments | 0 (0.0%) | 72 (100.0%) |
| 5 to 9 Unit Apartments | 0 (0.0%) | 0 (0.0%) |
| 10 or more Apartments | 0 (0.0%) | 194 (100.0%) |
| Mobile Home / Other | 68 (40.2%) | 101 (59.8%) |
| Total | 2,218 (70.5%) | 930 (29.5%) |
Housing Structures by Number of Rooms in Delphos
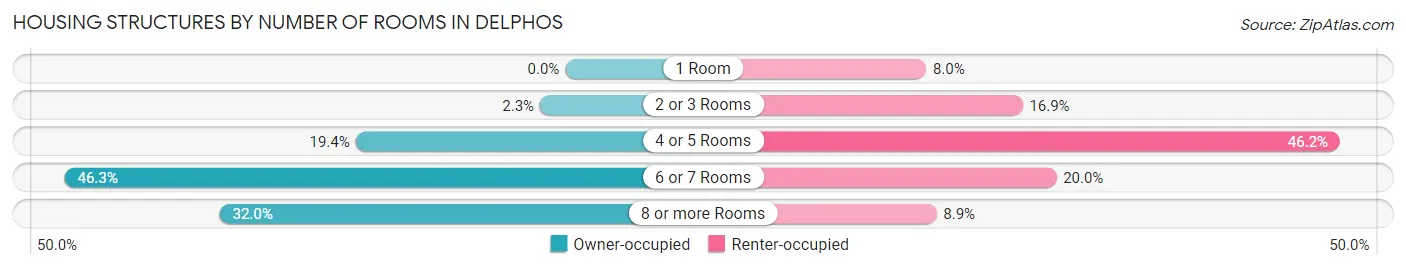
| Number of Rooms | Owner-occupied | Renter-occupied |
| 1 Room | 0 (0.0%) | 74 (8.0%) |
| 2 or 3 Rooms | 52 (2.3%) | 157 (16.9%) |
| 4 or 5 Rooms | 430 (19.4%) | 430 (46.2%) |
| 6 or 7 Rooms | 1,027 (46.3%) | 186 (20.0%) |
| 8 or more Rooms | 709 (32.0%) | 83 (8.9%) |
| Total | 2,218 (100.0%) | 930 (100.0%) |
Housing Structure by Heating Type in Delphos
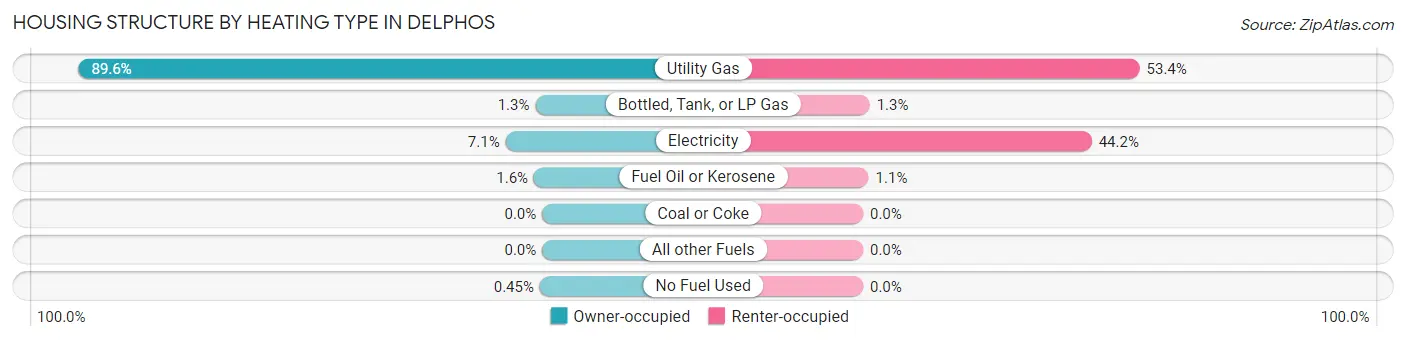
| Heating Type | Owner-occupied | Renter-occupied |
| Utility Gas | 1,987 (89.6%) | 497 (53.4%) |
| Bottled, Tank, or LP Gas | 29 (1.3%) | 12 (1.3%) |
| Electricity | 157 (7.1%) | 411 (44.2%) |
| Fuel Oil or Kerosene | 35 (1.6%) | 10 (1.1%) |
| Coal or Coke | 0 (0.0%) | 0 (0.0%) |
| All other Fuels | 0 (0.0%) | 0 (0.0%) |
| No Fuel Used | 10 (0.4%) | 0 (0.0%) |
| Total | 2,218 (100.0%) | 930 (100.0%) |
Household Vehicle Usage in Delphos
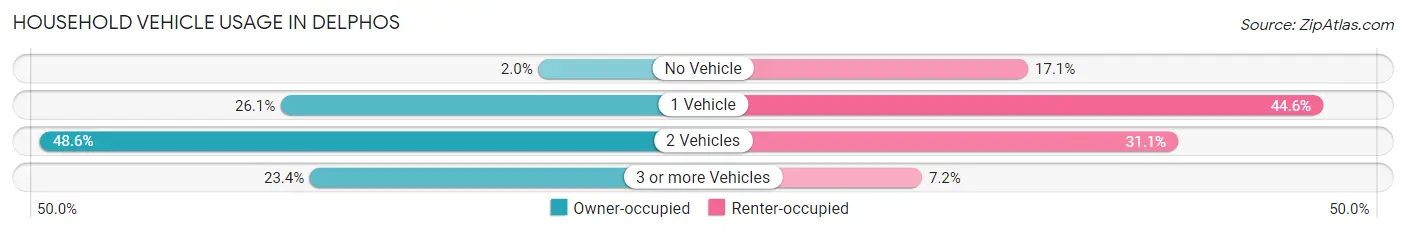
| Vehicles per Household | Owner-occupied | Renter-occupied |
| No Vehicle | 45 (2.0%) | 159 (17.1%) |
| 1 Vehicle | 578 (26.1%) | 415 (44.6%) |
| 2 Vehicles | 1,077 (48.6%) | 289 (31.1%) |
| 3 or more Vehicles | 518 (23.4%) | 67 (7.2%) |
| Total | 2,218 (100.0%) | 930 (100.0%) |
Real Estate & Mortgages in Delphos
Real Estate and Mortgage Overview in Delphos
| Characteristic | Without Mortgage | With Mortgage |
| Housing Units | 993 | 1,225 |
| Median Property Value | $111,800 | $112,200 |
| Median Household Income | $56,679 | $150 |
| Monthly Housing Costs | $435 | $0 |
| Real Estate Taxes | $995 | $253 |
Property Value by Mortgage Status in Delphos
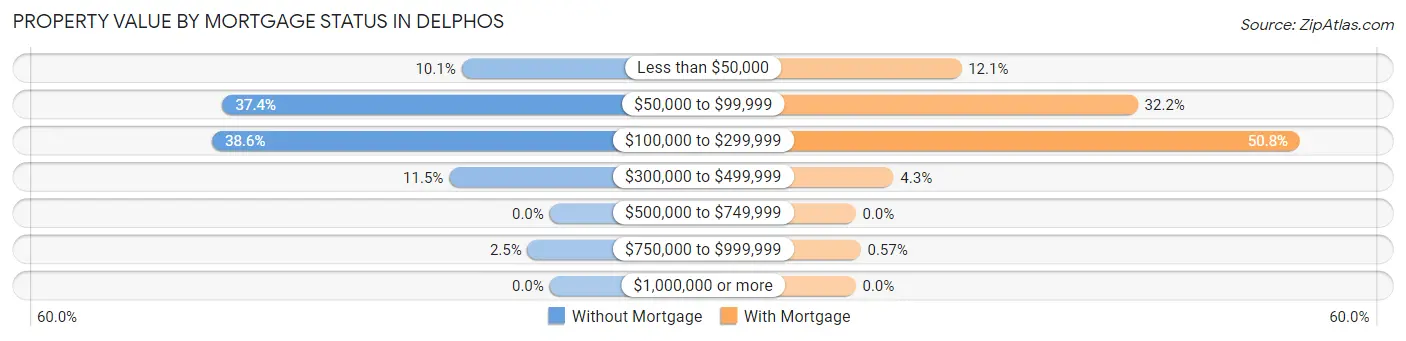
| Property Value | Without Mortgage | With Mortgage |
| Less than $50,000 | 100 (10.1%) | 148 (12.1%) |
| $50,000 to $99,999 | 371 (37.4%) | 395 (32.2%) |
| $100,000 to $299,999 | 383 (38.6%) | 622 (50.8%) |
| $300,000 to $499,999 | 114 (11.5%) | 53 (4.3%) |
| $500,000 to $749,999 | 0 (0.0%) | 0 (0.0%) |
| $750,000 to $999,999 | 25 (2.5%) | 7 (0.6%) |
| $1,000,000 or more | 0 (0.0%) | 0 (0.0%) |
| Total | 993 (100.0%) | 1,225 (100.0%) |
Household Income by Mortgage Status in Delphos
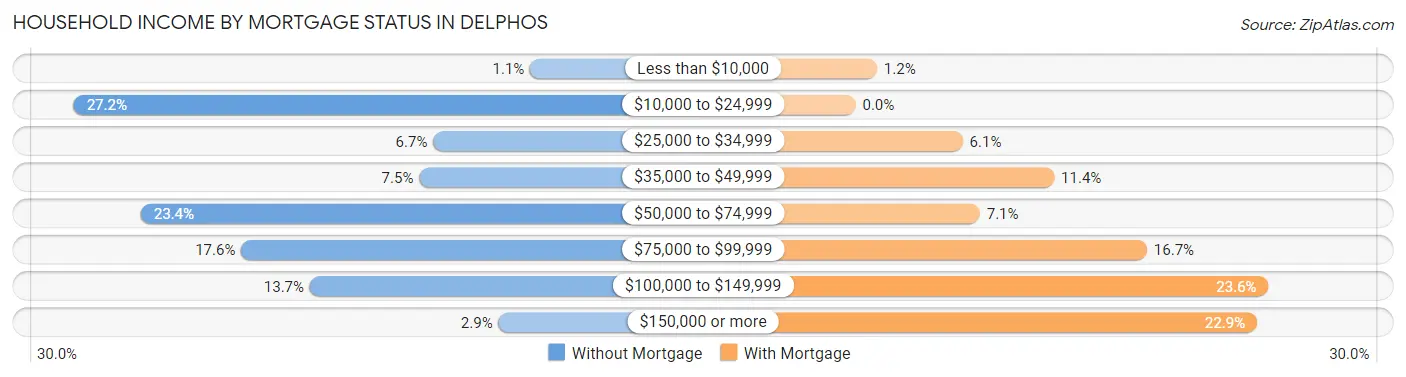
| Household Income | Without Mortgage | With Mortgage |
| Less than $10,000 | 11 (1.1%) | 15 (1.2%) |
| $10,000 to $24,999 | 270 (27.2%) | 0 (0.0%) |
| $25,000 to $34,999 | 66 (6.7%) | 75 (6.1%) |
| $35,000 to $49,999 | 74 (7.4%) | 139 (11.4%) |
| $50,000 to $74,999 | 232 (23.4%) | 87 (7.1%) |
| $75,000 to $99,999 | 175 (17.6%) | 204 (16.7%) |
| $100,000 to $149,999 | 136 (13.7%) | 289 (23.6%) |
| $150,000 or more | 29 (2.9%) | 281 (22.9%) |
| Total | 993 (100.0%) | 1,225 (100.0%) |
Property Value to Household Income Ratio in Delphos
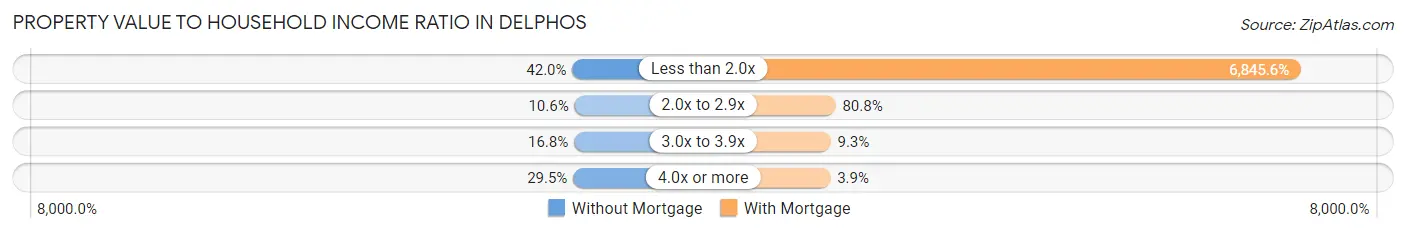
| Value-to-Income Ratio | Without Mortgage | With Mortgage |
| Less than 2.0x | 417 (42.0%) | 83,858 (6,845.6%) |
| 2.0x to 2.9x | 105 (10.6%) | 990 (80.8%) |
| 3.0x to 3.9x | 167 (16.8%) | 114 (9.3%) |
| 4.0x or more | 293 (29.5%) | 48 (3.9%) |
| Total | 993 (100.0%) | 1,225 (100.0%) |
Real Estate Taxes by Mortgage Status in Delphos
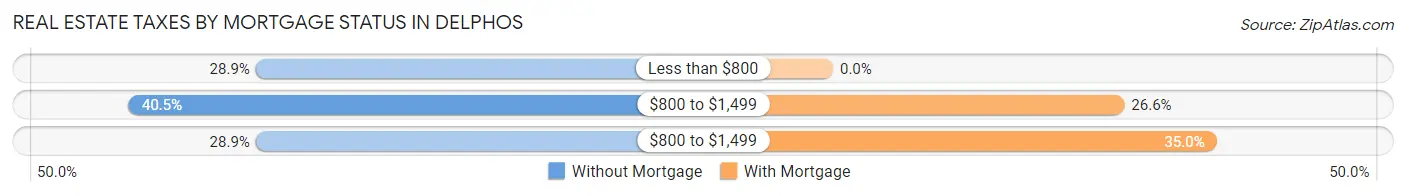
| Property Taxes | Without Mortgage | With Mortgage |
| Less than $800 | 287 (28.9%) | 0 (0.0%) |
| $800 to $1,499 | 402 (40.5%) | 326 (26.6%) |
| $800 to $1,499 | 287 (28.9%) | 429 (35.0%) |
| Total | 993 (100.0%) | 1,225 (100.0%) |
Health & Disability in Delphos
Health Insurance Coverage by Age in Delphos
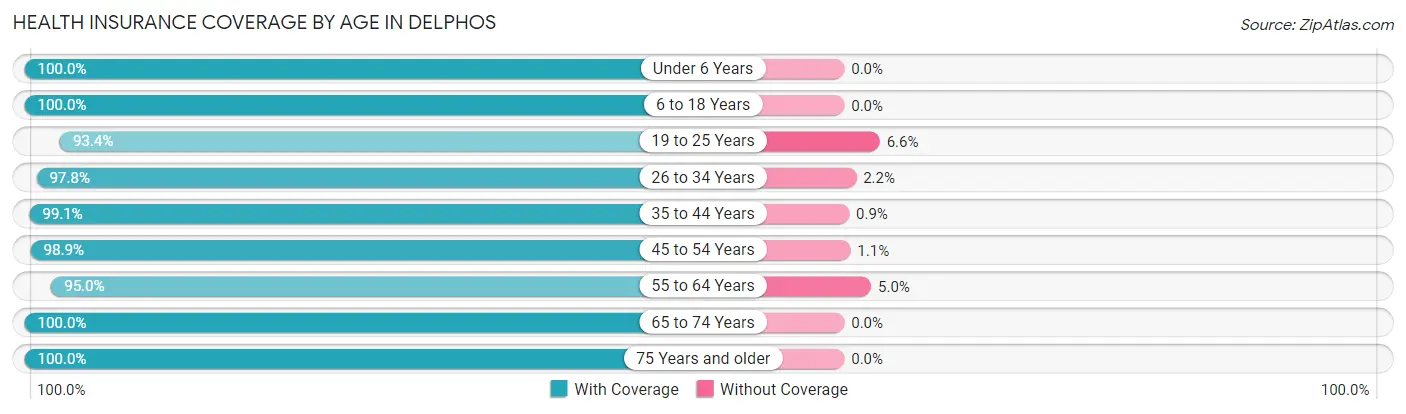
| Age Bracket | With Coverage | Without Coverage |
| Under 6 Years | 700 (100.0%) | 0 (0.0%) |
| 6 to 18 Years | 949 (100.0%) | 0 (0.0%) |
| 19 to 25 Years | 580 (93.4%) | 41 (6.6%) |
| 26 to 34 Years | 967 (97.8%) | 22 (2.2%) |
| 35 to 44 Years | 773 (99.1%) | 7 (0.9%) |
| 45 to 54 Years | 691 (98.9%) | 8 (1.1%) |
| 55 to 64 Years | 667 (95.0%) | 35 (5.0%) |
| 65 to 74 Years | 717 (100.0%) | 0 (0.0%) |
| 75 Years and older | 857 (100.0%) | 0 (0.0%) |
| Total | 6,901 (98.4%) | 113 (1.6%) |
Health Insurance Coverage by Citizenship Status in Delphos

| Citizenship Status | With Coverage | Without Coverage |
| Native Born | 700 (100.0%) | 0 (0.0%) |
| Foreign Born, Citizen | 949 (100.0%) | 0 (0.0%) |
| Foreign Born, not a Citizen | 580 (93.4%) | 41 (6.6%) |
Health Insurance Coverage by Household Income in Delphos
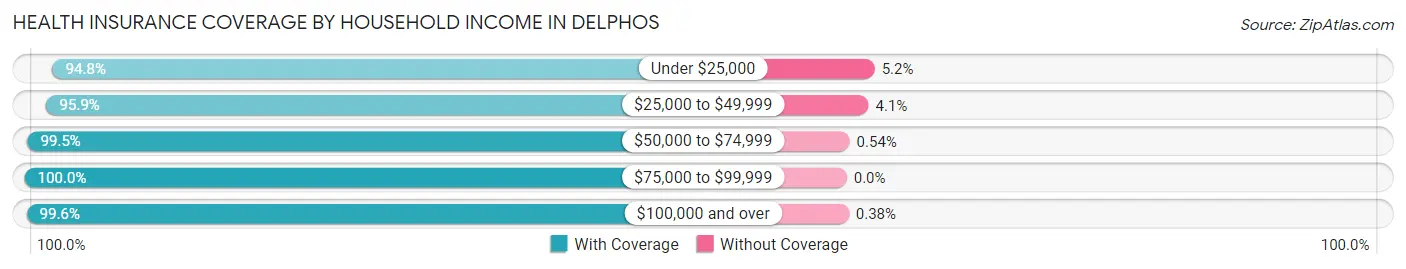
| Household Income | With Coverage | Without Coverage |
| Under $25,000 | 832 (94.8%) | 46 (5.2%) |
| $25,000 to $49,999 | 1,219 (95.9%) | 52 (4.1%) |
| $50,000 to $74,999 | 1,286 (99.5%) | 7 (0.5%) |
| $75,000 to $99,999 | 1,459 (100.0%) | 0 (0.0%) |
| $100,000 and over | 2,093 (99.6%) | 8 (0.4%) |
Public vs Private Health Insurance Coverage by Age in Delphos
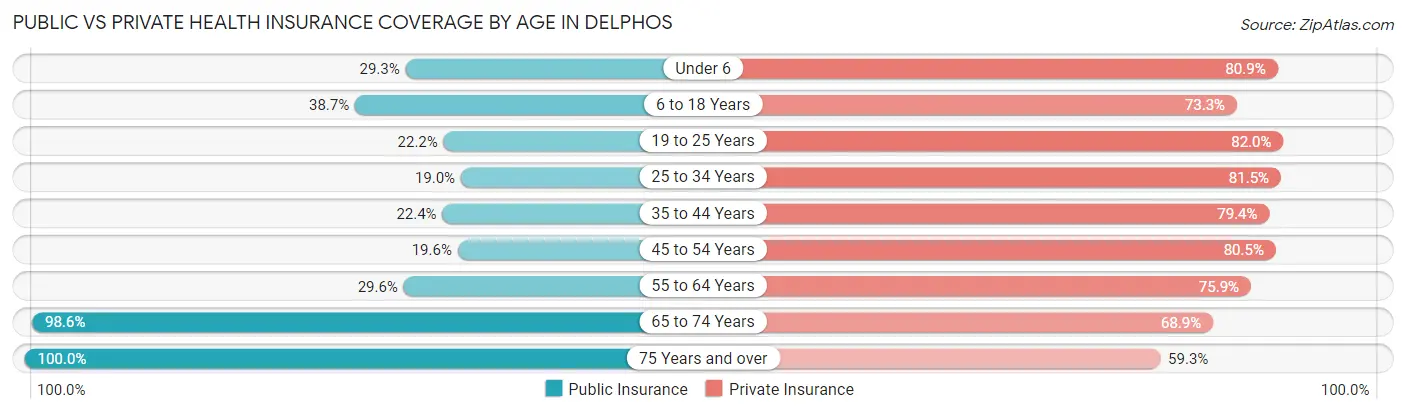
| Age Bracket | Public Insurance | Private Insurance |
| Under 6 | 205 (29.3%) | 566 (80.9%) |
| 6 to 18 Years | 367 (38.7%) | 696 (73.3%) |
| 19 to 25 Years | 138 (22.2%) | 509 (82.0%) |
| 25 to 34 Years | 188 (19.0%) | 806 (81.5%) |
| 35 to 44 Years | 175 (22.4%) | 619 (79.4%) |
| 45 to 54 Years | 137 (19.6%) | 563 (80.5%) |
| 55 to 64 Years | 208 (29.6%) | 533 (75.9%) |
| 65 to 74 Years | 707 (98.6%) | 494 (68.9%) |
| 75 Years and over | 857 (100.0%) | 508 (59.3%) |
| Total | 2,982 (42.5%) | 5,294 (75.5%) |
Disability Status by Sex by Age in Delphos
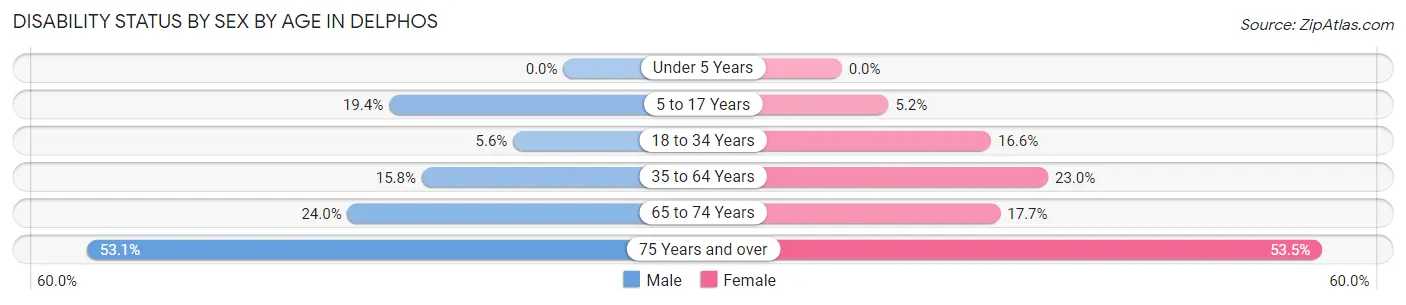
| Age Bracket | Male | Female |
| Under 5 Years | 0 (0.0%) | 0 (0.0%) |
| 5 to 17 Years | 81 (19.4%) | 30 (5.2%) |
| 18 to 34 Years | 55 (5.6%) | 115 (16.6%) |
| 35 to 64 Years | 175 (15.8%) | 246 (23.0%) |
| 65 to 74 Years | 88 (24.0%) | 62 (17.7%) |
| 75 Years and over | 182 (53.1%) | 275 (53.5%) |
Disability Class by Sex by Age in Delphos
Disability Class: Hearing Difficulty
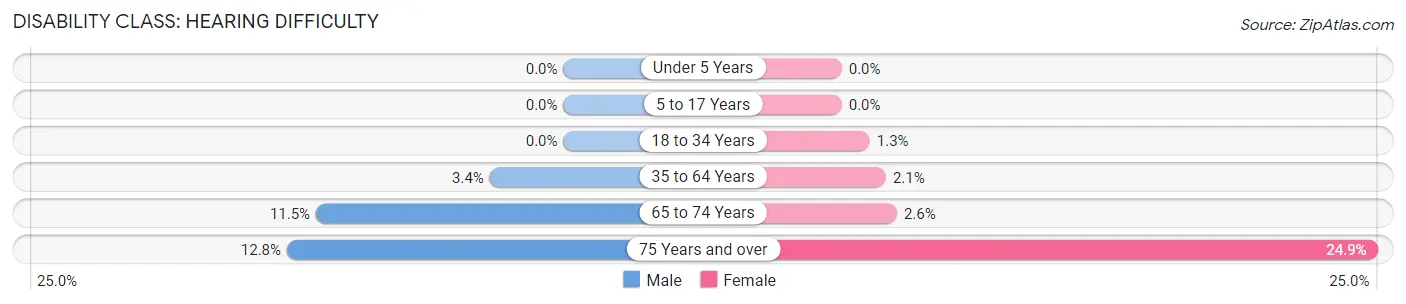
| Age Bracket | Male | Female |
| Under 5 Years | 0 (0.0%) | 0 (0.0%) |
| 5 to 17 Years | 0 (0.0%) | 0 (0.0%) |
| 18 to 34 Years | 0 (0.0%) | 9 (1.3%) |
| 35 to 64 Years | 38 (3.4%) | 22 (2.1%) |
| 65 to 74 Years | 42 (11.5%) | 9 (2.6%) |
| 75 Years and over | 44 (12.8%) | 128 (24.9%) |
Disability Class: Vision Difficulty
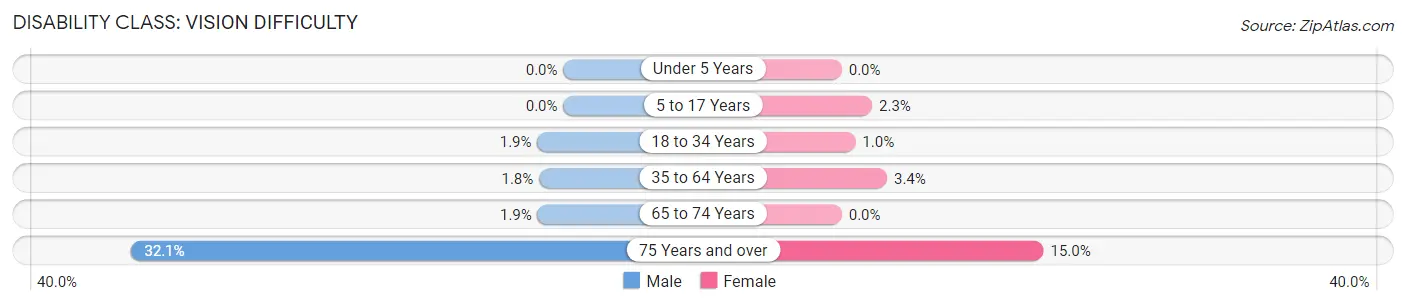
| Age Bracket | Male | Female |
| Under 5 Years | 0 (0.0%) | 0 (0.0%) |
| 5 to 17 Years | 0 (0.0%) | 13 (2.2%) |
| 18 to 34 Years | 19 (1.9%) | 7 (1.0%) |
| 35 to 64 Years | 20 (1.8%) | 36 (3.4%) |
| 65 to 74 Years | 7 (1.9%) | 0 (0.0%) |
| 75 Years and over | 110 (32.1%) | 77 (15.0%) |
Disability Class: Cognitive Difficulty
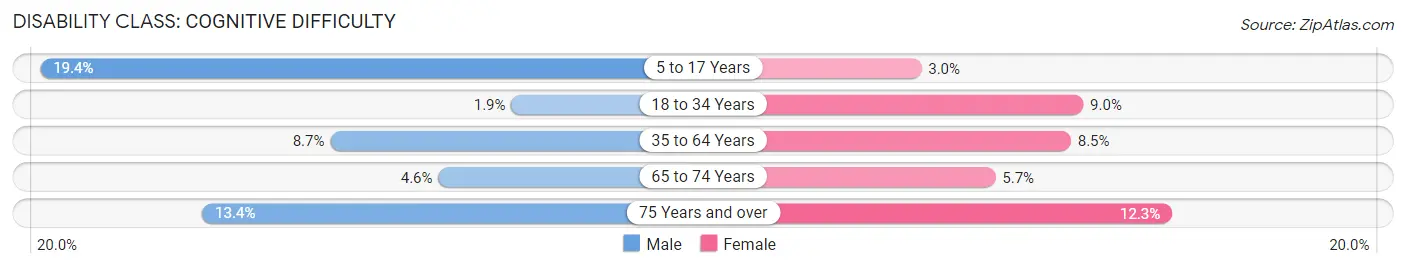
| Age Bracket | Male | Female |
| 5 to 17 Years | 81 (19.4%) | 17 (2.9%) |
| 18 to 34 Years | 19 (1.9%) | 62 (9.0%) |
| 35 to 64 Years | 96 (8.6%) | 91 (8.5%) |
| 65 to 74 Years | 17 (4.6%) | 20 (5.7%) |
| 75 Years and over | 46 (13.4%) | 63 (12.3%) |
Disability Class: Ambulatory Difficulty
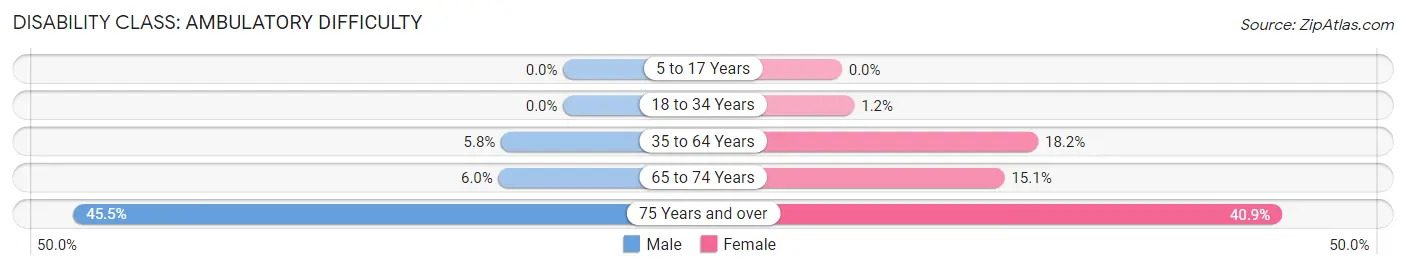
| Age Bracket | Male | Female |
| 5 to 17 Years | 0 (0.0%) | 0 (0.0%) |
| 18 to 34 Years | 0 (0.0%) | 8 (1.2%) |
| 35 to 64 Years | 64 (5.8%) | 195 (18.2%) |
| 65 to 74 Years | 22 (6.0%) | 53 (15.1%) |
| 75 Years and over | 156 (45.5%) | 210 (40.9%) |
Disability Class: Self-Care Difficulty

| Age Bracket | Male | Female |
| 5 to 17 Years | 0 (0.0%) | 0 (0.0%) |
| 18 to 34 Years | 0 (0.0%) | 22 (3.2%) |
| 35 to 64 Years | 40 (3.6%) | 37 (3.5%) |
| 65 to 74 Years | 13 (3.5%) | 20 (5.7%) |
| 75 Years and over | 35 (10.2%) | 49 (9.5%) |
Technology Access in Delphos
Computing Device Access in Delphos
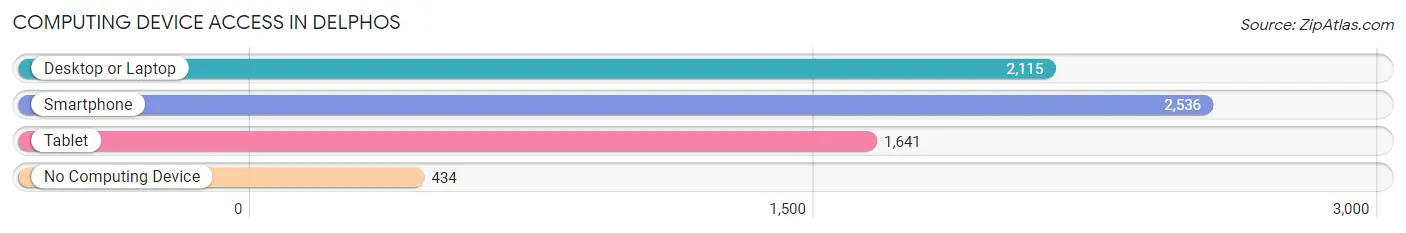
| Device Type | # Households | % Households |
| Desktop or Laptop | 2,115 | 67.2% |
| Smartphone | 2,536 | 80.6% |
| Tablet | 1,641 | 52.1% |
| No Computing Device | 434 | 13.8% |
| Total | 3,148 | 100.0% |
Internet Access in Delphos
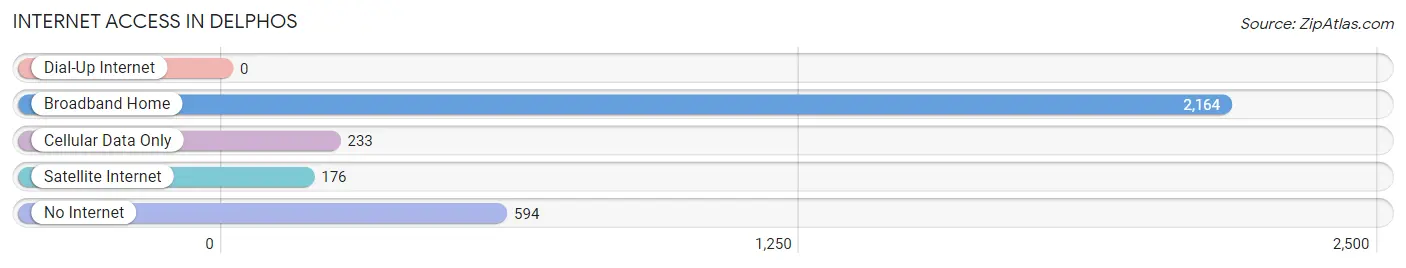
| Internet Type | # Households | % Households |
| Dial-Up Internet | 0 | 0.0% |
| Broadband Home | 2,164 | 68.7% |
| Cellular Data Only | 233 | 7.4% |
| Satellite Internet | 176 | 5.6% |
| No Internet | 594 | 18.9% |
| Total | 3,148 | 100.0% |
Delphos Summary
Delphos, Ohio is a small city located in Allen County, Ohio. It is situated along the banks of the Auglaize River, approximately 40 miles south of Toledo and 50 miles north of Dayton. The city has a population of approximately 7,000 people and is the county seat of Allen County.
Delphos was founded in 1845 by a group of settlers from Pennsylvania. The city was named after the Greek city of Delphi, which was known for its oracle. The city was incorporated in 1867 and has since grown to become a thriving community.
Geographically, Delphos is located in the western part of Allen County. It is situated on the banks of the Auglaize River, which flows through the city. The city is surrounded by farmland and is located near the intersection of Interstate 75 and State Route 309.
The economy of Delphos is largely based on agriculture and manufacturing. The city is home to several large manufacturing companies, including Delphos Manufacturing, which produces automotive parts, and Delphos Tool and Die, which produces industrial tools. The city also has a strong agricultural sector, with many local farmers growing corn, soybeans, and wheat.
The demographics of Delphos are largely white, with approximately 90% of the population being Caucasian. The median household income is approximately $45,000, and the median home value is around $90,000. The city has a low unemployment rate, with only 4.2% of the population being unemployed.
Delphos is a small city with a rich history and a strong economy. It is a great place to live and work, and it offers a variety of activities and attractions for residents and visitors alike. From its agricultural roots to its modern manufacturing industry, Delphos is a great place to call home.
Common Questions
What is Per Capita Income in Delphos?
Per Capita income in Delphos is $31,195.
What is the Median Family Income in Delphos?
Median Family Income in Delphos is $75,516.
What is the Median Household income in Delphos?
Median Household Income in Delphos is $59,000.
What is Income or Wage Gap in Delphos?
Income or Wage Gap in Delphos is 53.3%.
Women in Delphos earn 46.7 cents for every dollar earned by a man.
What is Inequality or Gini Index in Delphos?
Inequality or Gini Index in Delphos is 0.37.
What is the Total Population of Delphos?
Total Population of Delphos is 7,153.
What is the Total Male Population of Delphos?
Total Male Population of Delphos is 3,582.
What is the Total Female Population of Delphos?
Total Female Population of Delphos is 3,571.
What is the Ratio of Males per 100 Females in Delphos?
There are 100.31 Males per 100 Females in Delphos.
What is the Ratio of Females per 100 Males in Delphos?
There are 99.69 Females per 100 Males in Delphos.
What is the Median Population Age in Delphos?
Median Population Age in Delphos is 38.9 Years.
What is the Average Family Size in Delphos
Average Family Size in Delphos is 2.9 People.
What is the Average Household Size in Delphos
Average Household Size in Delphos is 2.2 People.
How Large is the Labor Force in Delphos?
There are 3,597 People in the Labor Forcein in Delphos.
What is the Percentage of People in the Labor Force in Delphos?
62.9% of People are in the Labor Force in Delphos.
What is the Unemployment Rate in Delphos?
Unemployment Rate in Delphos is 6.8%.