Crooksville, OH Map & Demographics
Crooksville Map
Crooksville Overview
$20,205
PER CAPITA INCOME
$62,946
AVG FAMILY INCOME
$42,348
AVG HOUSEHOLD INCOME
58.1%
WAGE / INCOME GAP [ % ]
41.9¢/ $1
WAGE / INCOME GAP [ $ ]
0.41
INEQUALITY / GINI INDEX
2,311
TOTAL POPULATION
1,060
MALE POPULATION
1,251
FEMALE POPULATION
84.73
MALES / 100 FEMALES
118.02
FEMALES / 100 MALES
36.7
MEDIAN AGE
3.0
AVG FAMILY SIZE
2.5
AVG HOUSEHOLD SIZE
871
LABOR FORCE [ PEOPLE ]
50.3%
PERCENT IN LABOR FORCE
4.8%
UNEMPLOYMENT RATE
Crooksville Zip Codes
Crooksville Area Codes
Income in Crooksville
Income Overview in Crooksville
Per Capita Income in Crooksville is $20,205, while median incomes of families and households are $62,946 and $42,348 respectively.
| Characteristic | Number | Measure |
| Per Capita Income | 2,311 | $20,205 |
| Median Family Income | 611 | $62,946 |
| Mean Family Income | 611 | $63,612 |
| Median Household Income | 908 | $42,348 |
| Mean Household Income | 908 | $53,271 |
| Income Deficit | 611 | $0 |
| Wage / Income Gap (%) | 2,311 | 58.06% |
| Wage / Income Gap ($) | 2,311 | 41.94¢ per $1 |
| Gini / Inequality Index | 2,311 | 0.41 |
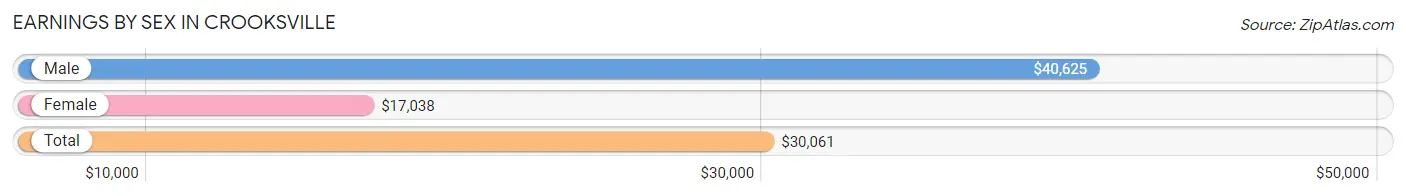
Earnings by Sex in Crooksville
Average Earnings in Crooksville are $30,061, $40,625 for men and $17,038 for women, a difference of 58.1%.
| Sex | Number | Average Earnings |
| Male | 547 (57.3%) | $40,625 |
| Female | 407 (42.7%) | $17,038 |
| Total | 954 (100.0%) | $30,061 |
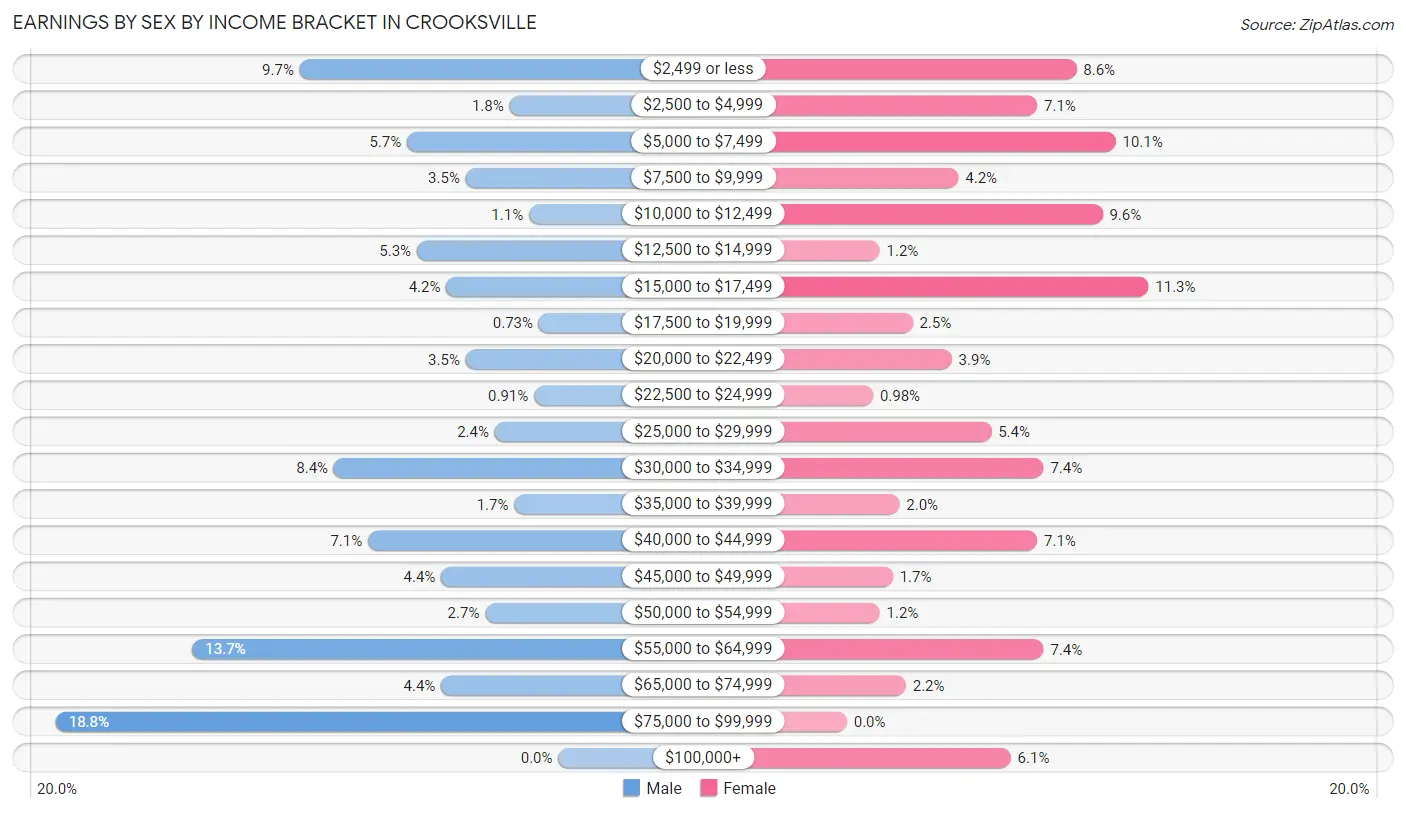
Earnings by Sex by Income Bracket in Crooksville
The most common earnings brackets in Crooksville are $75,000 to $99,999 for men (103 | 18.8%) and $15,000 to $17,499 for women (46 | 11.3%).
| Income | Male | Female |
| $2,499 or less | 53 (9.7%) | 35 (8.6%) |
| $2,500 to $4,999 | 10 (1.8%) | 29 (7.1%) |
| $5,000 to $7,499 | 31 (5.7%) | 41 (10.1%) |
| $7,500 to $9,999 | 19 (3.5%) | 17 (4.2%) |
| $10,000 to $12,499 | 6 (1.1%) | 39 (9.6%) |
| $12,500 to $14,999 | 29 (5.3%) | 5 (1.2%) |
| $15,000 to $17,499 | 23 (4.2%) | 46 (11.3%) |
| $17,500 to $19,999 | 4 (0.7%) | 10 (2.5%) |
| $20,000 to $22,499 | 19 (3.5%) | 16 (3.9%) |
| $22,500 to $24,999 | 5 (0.9%) | 4 (1.0%) |
| $25,000 to $29,999 | 13 (2.4%) | 22 (5.4%) |
| $30,000 to $34,999 | 46 (8.4%) | 30 (7.4%) |
| $35,000 to $39,999 | 9 (1.7%) | 8 (2.0%) |
| $40,000 to $44,999 | 39 (7.1%) | 29 (7.1%) |
| $45,000 to $49,999 | 24 (4.4%) | 7 (1.7%) |
| $50,000 to $54,999 | 15 (2.7%) | 5 (1.2%) |
| $55,000 to $64,999 | 75 (13.7%) | 30 (7.4%) |
| $65,000 to $74,999 | 24 (4.4%) | 9 (2.2%) |
| $75,000 to $99,999 | 103 (18.8%) | 0 (0.0%) |
| $100,000+ | 0 (0.0%) | 25 (6.1%) |
| Total | 547 (100.0%) | 407 (100.0%) |
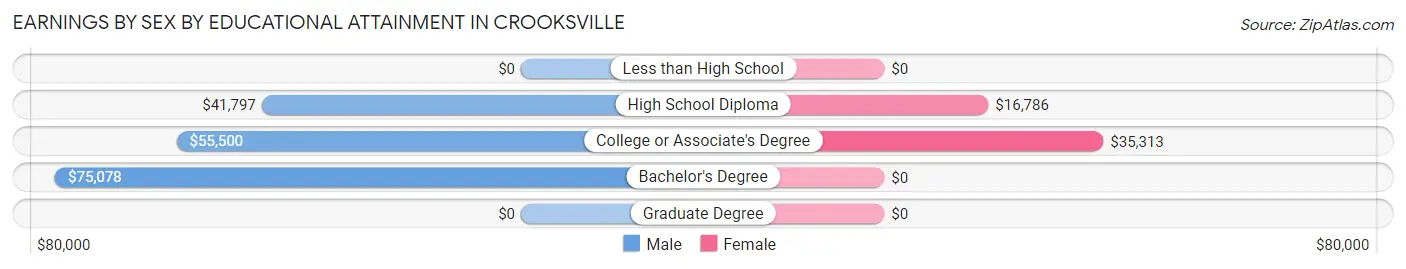
Earnings by Sex by Educational Attainment in Crooksville
Average earnings in Crooksville are $47,596 for men and $20,375 for women, a difference of 57.2%. Men with an educational attainment of bachelor's degree enjoy the highest average annual earnings of $75,078, while those with high school diploma education earn the least with $41,797. Women with an educational attainment of college or associate's degree earn the most with the average annual earnings of $35,313, while those with high school diploma education have the smallest earnings of $16,786.
| Educational Attainment | Male Income | Female Income |
| Less than High School | - | - |
| High School Diploma | $41,797 | $16,786 |
| College or Associate's Degree | $55,500 | $35,313 |
| Bachelor's Degree | $75,078 | $0 |
| Graduate Degree | - | - |
| Total | $47,596 | $20,375 |
Family Income in Crooksville
Family Income Brackets in Crooksville
According to the Crooksville family income data, there are 167 families falling into the $75,000 to $99,999 income range, which is the most common income bracket and makes up 27.3% of all families.
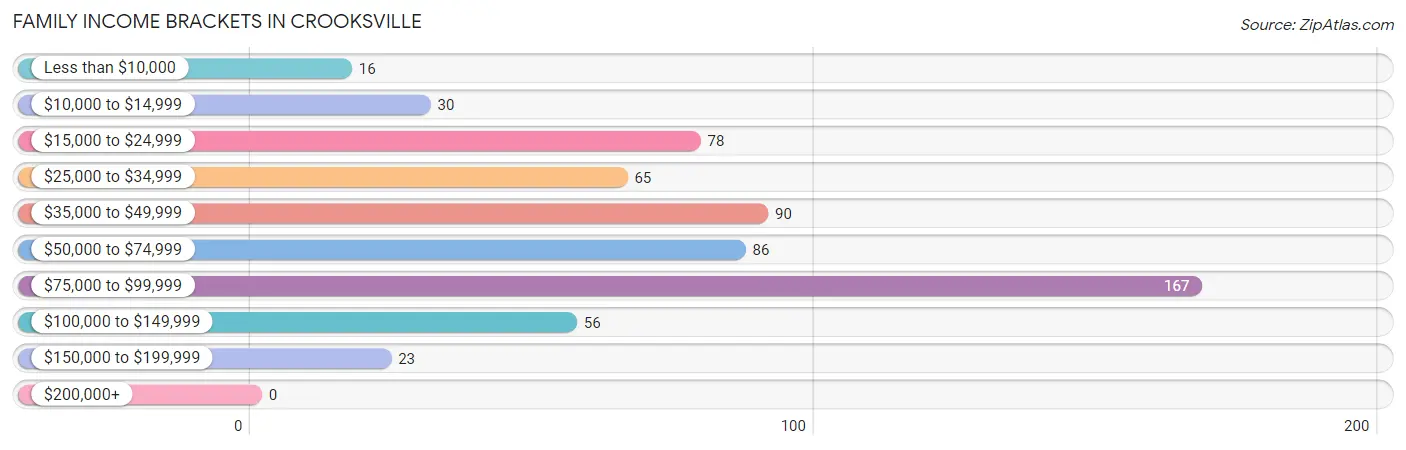
| Income Bracket | # Families | % Families |
| Less than $10,000 | 16 | 2.6% |
| $10,000 to $14,999 | 30 | 4.9% |
| $15,000 to $24,999 | 78 | 12.8% |
| $25,000 to $34,999 | 65 | 10.6% |
| $35,000 to $49,999 | 90 | 14.7% |
| $50,000 to $74,999 | 86 | 14.1% |
| $75,000 to $99,999 | 167 | 27.3% |
| $100,000 to $149,999 | 56 | 9.2% |
| $150,000 to $199,999 | 23 | 3.8% |
| $200,000+ | 0 | 0.0% |
Family Income by Famaliy Size in Crooksville
4-person families (70 | 11.5%) account for the highest median family income in Crooksville with $90,625 per family, while 2-person families (333 | 54.5%) have the highest median income of $22,890 per family member.
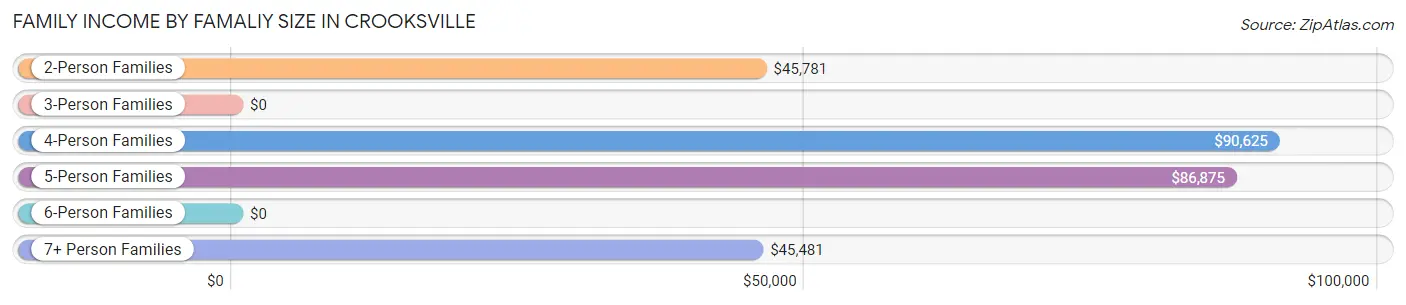
| Income Bracket | # Families | Median Income |
| 2-Person Families | 333 (54.5%) | $45,781 |
| 3-Person Families | 92 (15.1%) | $0 |
| 4-Person Families | 70 (11.5%) | $90,625 |
| 5-Person Families | 49 (8.0%) | $86,875 |
| 6-Person Families | 30 (4.9%) | $0 |
| 7+ Person Families | 37 (6.1%) | $45,481 |
| Total | 611 (100.0%) | $62,946 |
Family Income by Number of Earners in Crooksville
The median family income in Crooksville is $62,946, with families comprising 2 earners (224) having the highest median family income of $91,442, while families with no earners (124) have the lowest median family income of $27,647, accounting for 36.7% and 20.3% of families, respectively.
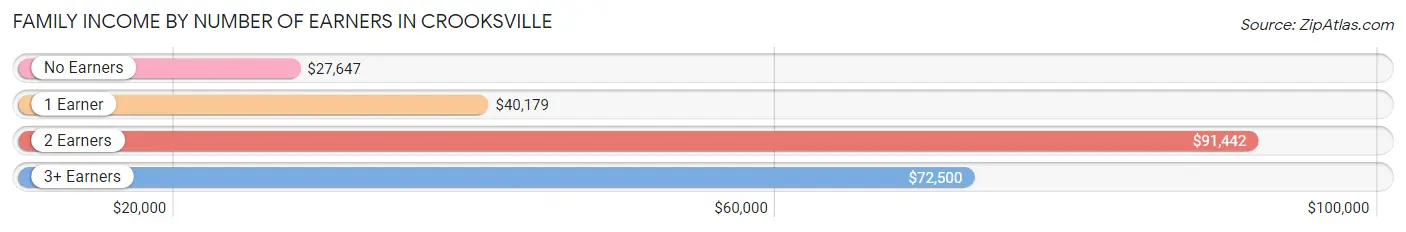
| Number of Earners | # Families | Median Income |
| No Earners | 124 (20.3%) | $27,647 |
| 1 Earner | 205 (33.6%) | $40,179 |
| 2 Earners | 224 (36.7%) | $91,442 |
| 3+ Earners | 58 (9.5%) | $72,500 |
| Total | 611 (100.0%) | $62,946 |
Household Income in Crooksville
Household Income Brackets in Crooksville
With 190 households falling in the category, the $75,000 to $99,999 income range is the most frequent in Crooksville, accounting for 20.9% of all households.
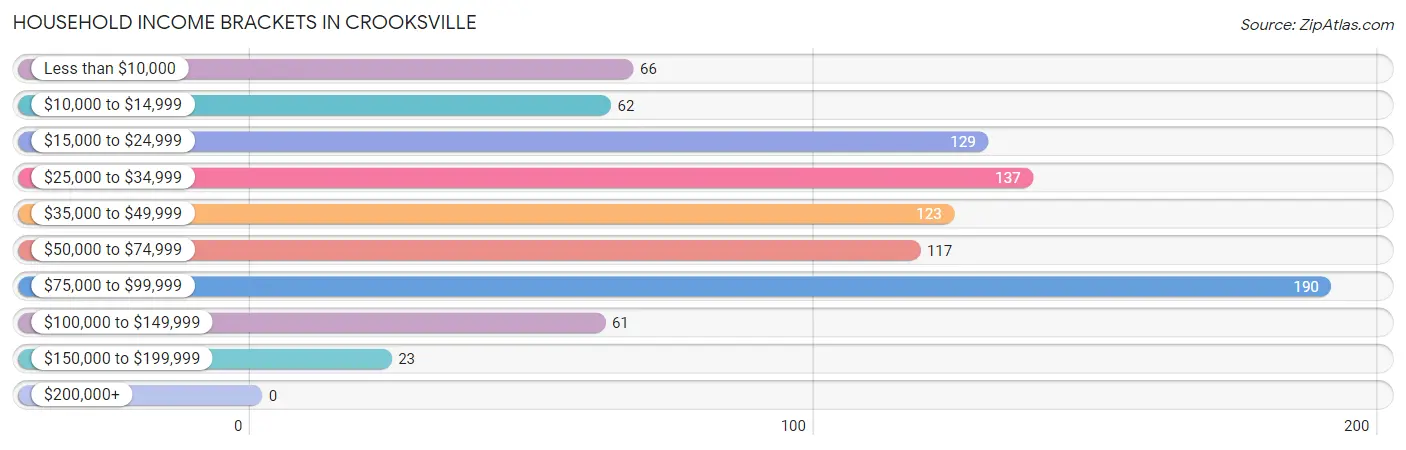
| Income Bracket | # Households | % Households |
| Less than $10,000 | 66 | 7.3% |
| $10,000 to $14,999 | 62 | 6.8% |
| $15,000 to $24,999 | 129 | 14.2% |
| $25,000 to $34,999 | 137 | 15.1% |
| $35,000 to $49,999 | 123 | 13.5% |
| $50,000 to $74,999 | 117 | 12.9% |
| $75,000 to $99,999 | 190 | 20.9% |
| $100,000 to $149,999 | 61 | 6.7% |
| $150,000 to $199,999 | 23 | 2.5% |
| $200,000+ | 0 | 0.0% |
Household Income by Householder Age in Crooksville
The median household income in Crooksville is $42,348, with the highest median household income of $62,697 found in the 25 to 44 years age bracket for the primary householder. A total of 335 households (36.9%) fall into this category. Meanwhile, the 15 to 24 years age bracket for the primary householder has the lowest median household income of $0, with 15 households (1.7%) in this group.
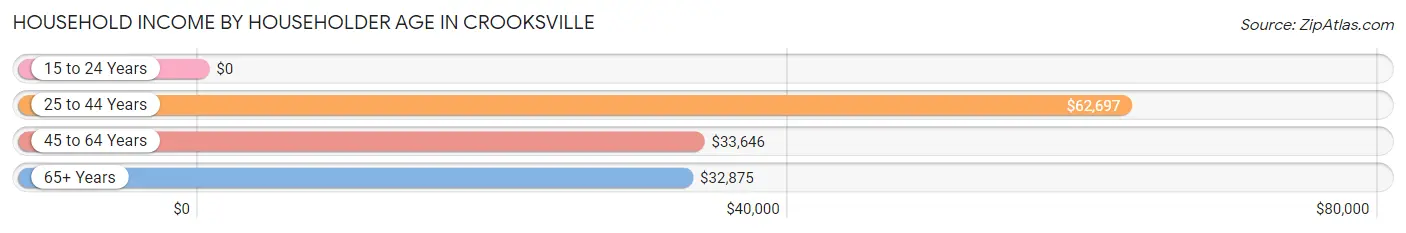
| Income Bracket | # Households | Median Income |
| 15 to 24 Years | 15 (1.7%) | $0 |
| 25 to 44 Years | 335 (36.9%) | $62,697 |
| 45 to 64 Years | 373 (41.1%) | $33,646 |
| 65+ Years | 185 (20.4%) | $32,875 |
| Total | 908 (100.0%) | $42,348 |
Poverty in Crooksville
Income Below Poverty by Sex and Age in Crooksville
With 27.6% poverty level for males and 38.5% for females among the residents of Crooksville, 16 and 17 year old males and 15 year old females are the most vulnerable to poverty, with 5 males (100.0%) and 15 females (75.0%) in their respective age groups living below the poverty level.
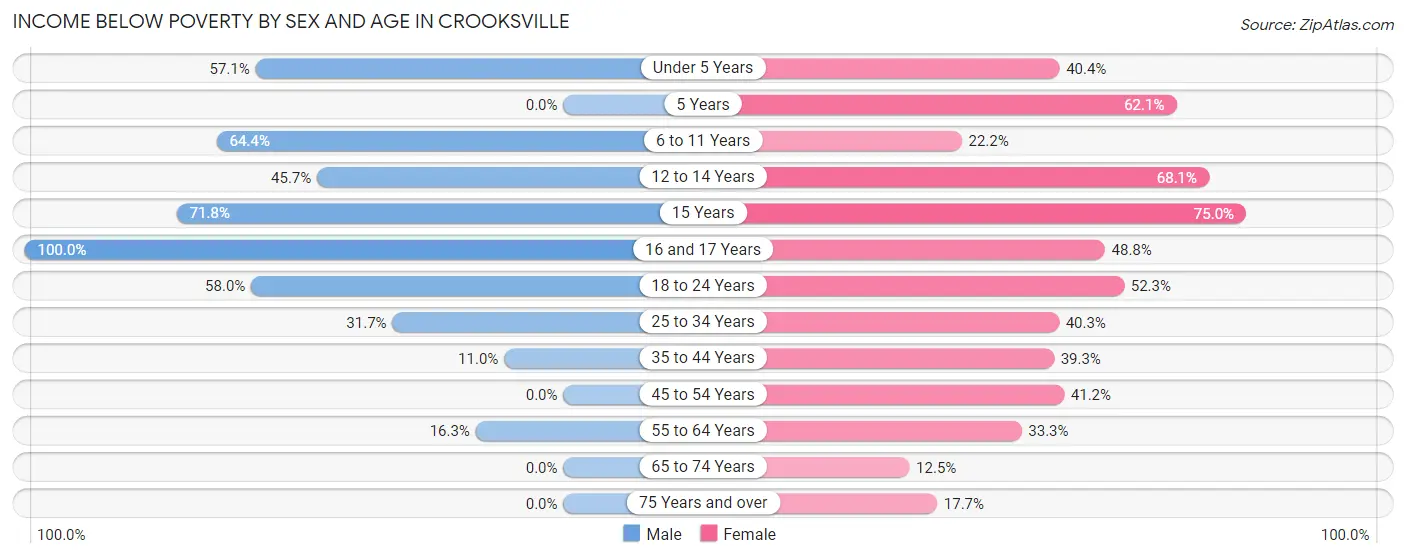
| Age Bracket | Male | Female |
| Under 5 Years | 40 (57.1%) | 23 (40.4%) |
| 5 Years | 0 (0.0%) | 18 (62.1%) |
| 6 to 11 Years | 56 (64.4%) | 26 (22.2%) |
| 12 to 14 Years | 32 (45.7%) | 62 (68.1%) |
| 15 Years | 28 (71.8%) | 15 (75.0%) |
| 16 and 17 Years | 5 (100.0%) | 20 (48.8%) |
| 18 to 24 Years | 51 (58.0%) | 56 (52.3%) |
| 25 to 34 Years | 33 (31.7%) | 62 (40.3%) |
| 35 to 44 Years | 21 (11.0%) | 59 (39.3%) |
| 45 to 54 Years | 0 (0.0%) | 61 (41.2%) |
| 55 to 64 Years | 27 (16.3%) | 55 (33.3%) |
| 65 to 74 Years | 0 (0.0%) | 13 (12.5%) |
| 75 Years and over | 0 (0.0%) | 12 (17.6%) |
| Total | 293 (27.6%) | 482 (38.5%) |
Income Above Poverty by Sex and Age in Crooksville
According to the poverty statistics in Crooksville, males aged 45 to 54 years and females aged 65 to 74 years are the age groups that are most secure financially, with 100.0% of males and 87.5% of females in these age groups living above the poverty line.
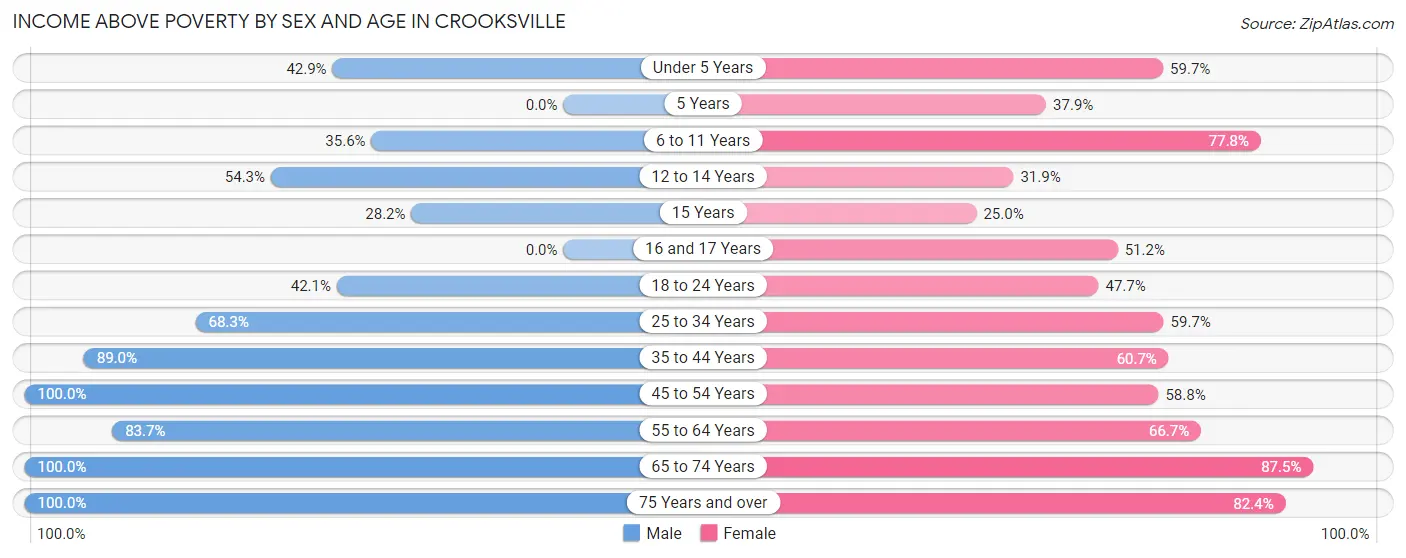
| Age Bracket | Male | Female |
| Under 5 Years | 30 (42.9%) | 34 (59.7%) |
| 5 Years | 0 (0.0%) | 11 (37.9%) |
| 6 to 11 Years | 31 (35.6%) | 91 (77.8%) |
| 12 to 14 Years | 38 (54.3%) | 29 (31.9%) |
| 15 Years | 11 (28.2%) | 5 (25.0%) |
| 16 and 17 Years | 0 (0.0%) | 21 (51.2%) |
| 18 to 24 Years | 37 (42.0%) | 51 (47.7%) |
| 25 to 34 Years | 71 (68.3%) | 92 (59.7%) |
| 35 to 44 Years | 170 (89.0%) | 91 (60.7%) |
| 45 to 54 Years | 116 (100.0%) | 87 (58.8%) |
| 55 to 64 Years | 139 (83.7%) | 110 (66.7%) |
| 65 to 74 Years | 77 (100.0%) | 91 (87.5%) |
| 75 Years and over | 47 (100.0%) | 56 (82.4%) |
| Total | 767 (72.4%) | 769 (61.5%) |
Income Below Poverty Among Married-Couple Families in Crooksville
The poverty statistics for married-couple families in Crooksville show that 5.7% or 25 of the total 441 families live below the poverty line. Families with 5 or more children have the highest poverty rate of 100.0%, comprising of 13 families. On the other hand, families with 1 or 2 children have the lowest poverty rate of 0.0%, which includes 0 families.
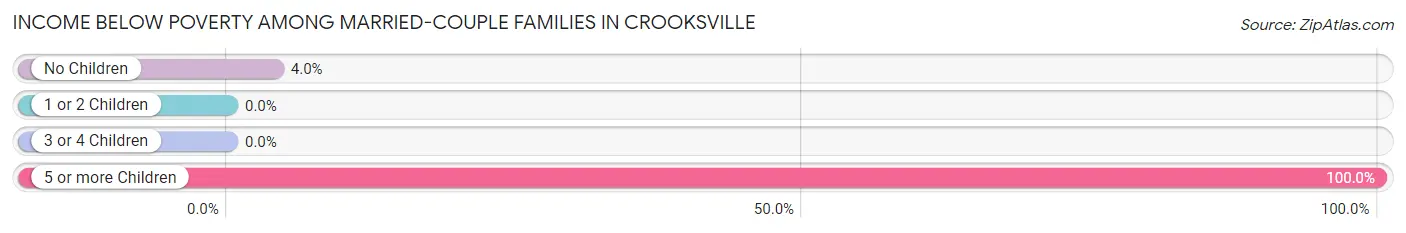
| Children | Above Poverty | Below Poverty |
| No Children | 289 (96.0%) | 12 (4.0%) |
| 1 or 2 Children | 82 (100.0%) | 0 (0.0%) |
| 3 or 4 Children | 45 (100.0%) | 0 (0.0%) |
| 5 or more Children | 0 (0.0%) | 13 (100.0%) |
| Total | 416 (94.3%) | 25 (5.7%) |
Income Below Poverty Among Single-Parent Households in Crooksville
According to the poverty data in Crooksville, 52.0% or 13 single-father households and 76.5% or 111 single-mother households are living below the poverty line. Among single-father households, those with 1 or 2 children have the highest poverty rate, with 13 households (100.0%) experiencing poverty. Likewise, among single-mother households, those with 5 or more children have the highest poverty rate, with 16 households (100.0%) falling below the poverty line.
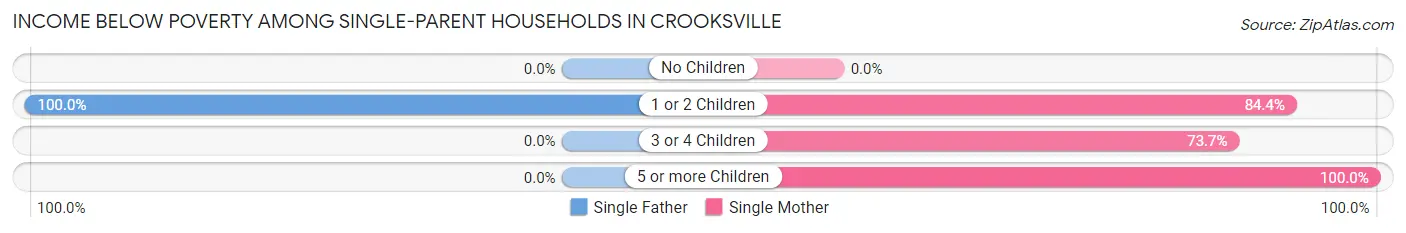
| Children | Single Father | Single Mother |
| No Children | 0 (0.0%) | 0 (0.0%) |
| 1 or 2 Children | 13 (100.0%) | 81 (84.4%) |
| 3 or 4 Children | 0 (0.0%) | 14 (73.7%) |
| 5 or more Children | 0 (0.0%) | 16 (100.0%) |
| Total | 13 (52.0%) | 111 (76.5%) |
Income Below Poverty Among Married-Couple vs Single-Parent Households in Crooksville
The poverty data for Crooksville shows that 25 of the married-couple family households (5.7%) and 124 of the single-parent households (72.9%) are living below the poverty level. Within the married-couple family households, those with 5 or more children have the highest poverty rate, with 13 households (100.0%) falling below the poverty line. Among the single-parent households, those with 5 or more children have the highest poverty rate, with 16 household (100.0%) living below poverty.
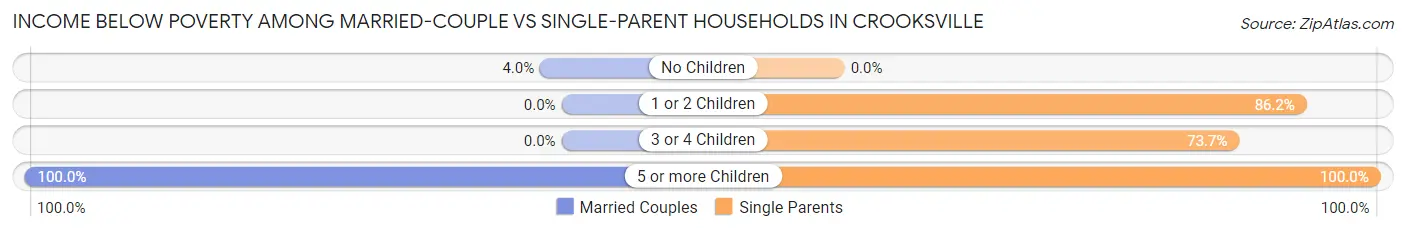
| Children | Married-Couple Families | Single-Parent Households |
| No Children | 12 (4.0%) | 0 (0.0%) |
| 1 or 2 Children | 0 (0.0%) | 94 (86.2%) |
| 3 or 4 Children | 0 (0.0%) | 14 (73.7%) |
| 5 or more Children | 13 (100.0%) | 16 (100.0%) |
| Total | 25 (5.7%) | 124 (72.9%) |
Race in Crooksville
The most populous races in Crooksville are White / Caucasian (2,171 | 93.9%), Two or more Races (133 | 5.8%), and Native / Alaskan (7 | 0.3%).
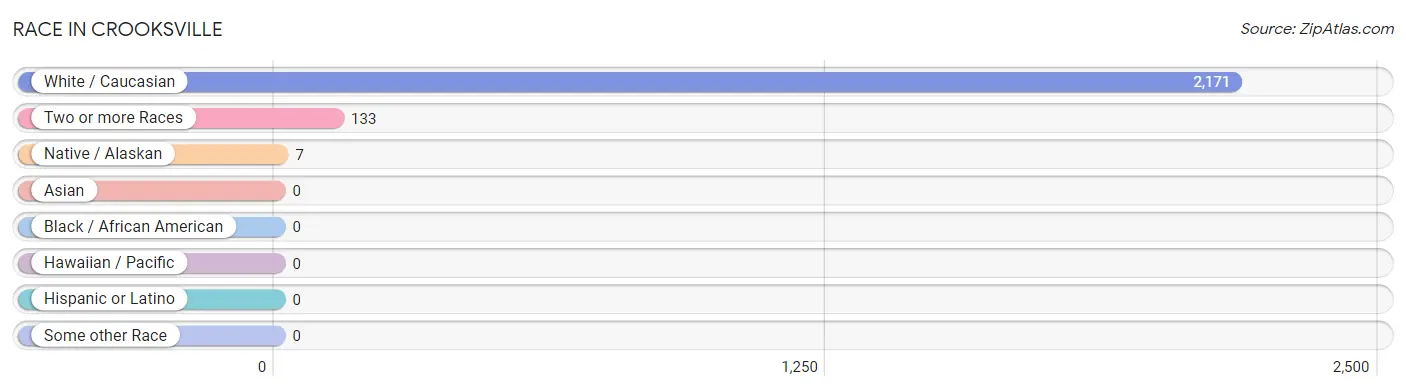
| Race | # Population | % Population |
| Asian | 0 | 0.0% |
| Black / African American | 0 | 0.0% |
| Hawaiian / Pacific | 0 | 0.0% |
| Hispanic or Latino | 0 | 0.0% |
| Native / Alaskan | 7 | 0.3% |
| White / Caucasian | 2,171 | 93.9% |
| Two or more Races | 133 | 5.8% |
| Some other Race | 0 | 0.0% |
| Total | 2,311 | 100.0% |
Ancestry in Crooksville
The most populous ancestries reported in Crooksville are German (467 | 20.2%), Irish (318 | 13.8%), English (171 | 7.4%), Cherokee (110 | 4.8%), and American (47 | 2.0%), together accounting for 48.2% of all Crooksville residents.
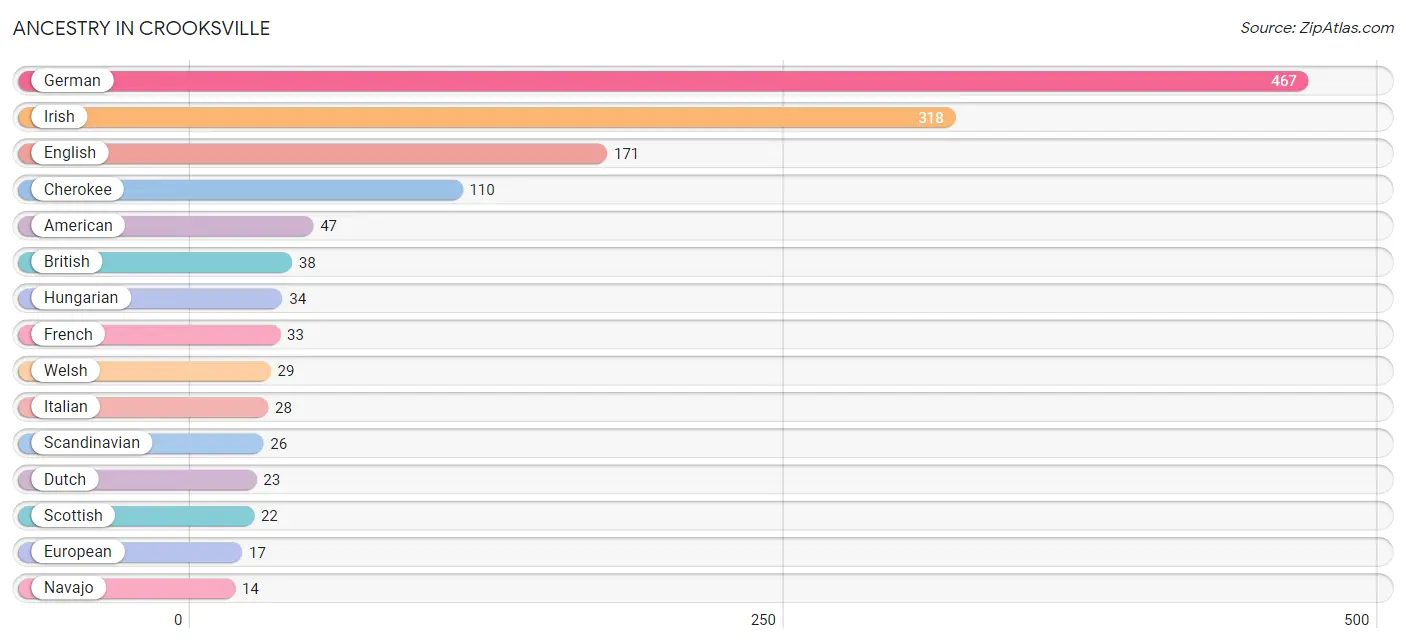
| Ancestry | # Population | % Population |
| American | 47 | 2.0% |
| Blackfeet | 3 | 0.1% |
| British | 38 | 1.6% |
| Cherokee | 110 | 4.8% |
| Dutch | 23 | 1.0% |
| English | 171 | 7.4% |
| European | 17 | 0.7% |
| French | 33 | 1.4% |
| German | 467 | 20.2% |
| Hungarian | 34 | 1.5% |
| Irish | 318 | 13.8% |
| Italian | 28 | 1.2% |
| Navajo | 14 | 0.6% |
| Pennsylvania German | 7 | 0.3% |
| Polish | 3 | 0.1% |
| Portuguese | 7 | 0.3% |
| Scandinavian | 26 | 1.1% |
| Scotch-Irish | 8 | 0.4% |
| Scottish | 22 | 0.9% |
| Welsh | 29 | 1.3% | View All 20 Rows |
Immigrants in Crooksville

| Immigration Origin | # Population | % Population | View All 0 Rows |
Sex and Age in Crooksville
Sex and Age in Crooksville
The most populous age groups in Crooksville are 35 to 39 Years (119 | 11.2%) for men and 10 to 14 Years (127 | 10.2%) for women.
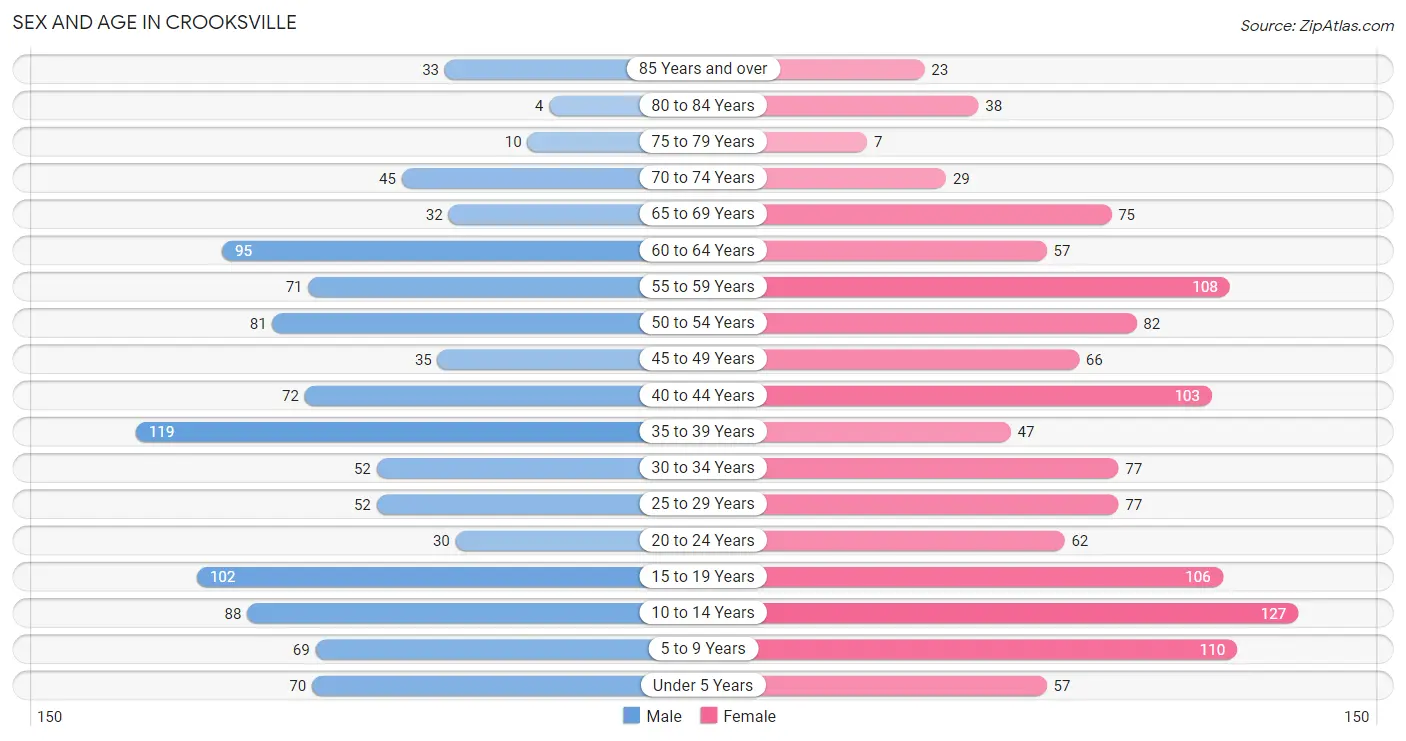
| Age Bracket | Male | Female |
| Under 5 Years | 70 (6.6%) | 57 (4.6%) |
| 5 to 9 Years | 69 (6.5%) | 110 (8.8%) |
| 10 to 14 Years | 88 (8.3%) | 127 (10.2%) |
| 15 to 19 Years | 102 (9.6%) | 106 (8.5%) |
| 20 to 24 Years | 30 (2.8%) | 62 (5.0%) |
| 25 to 29 Years | 52 (4.9%) | 77 (6.2%) |
| 30 to 34 Years | 52 (4.9%) | 77 (6.2%) |
| 35 to 39 Years | 119 (11.2%) | 47 (3.8%) |
| 40 to 44 Years | 72 (6.8%) | 103 (8.2%) |
| 45 to 49 Years | 35 (3.3%) | 66 (5.3%) |
| 50 to 54 Years | 81 (7.6%) | 82 (6.6%) |
| 55 to 59 Years | 71 (6.7%) | 108 (8.6%) |
| 60 to 64 Years | 95 (9.0%) | 57 (4.6%) |
| 65 to 69 Years | 32 (3.0%) | 75 (6.0%) |
| 70 to 74 Years | 45 (4.3%) | 29 (2.3%) |
| 75 to 79 Years | 10 (0.9%) | 7 (0.6%) |
| 80 to 84 Years | 4 (0.4%) | 38 (3.0%) |
| 85 Years and over | 33 (3.1%) | 23 (1.8%) |
| Total | 1,060 (100.0%) | 1,251 (100.0%) |
Families and Households in Crooksville
Median Family Size in Crooksville
The median family size in Crooksville is 3.05 persons per family, with single female/mother families (145 | 23.7%) accounting for the largest median family size of 3.7 persons per family. On the other hand, single male/father families (25 | 4.1%) represent the smallest median family size with 2.20 persons per family.
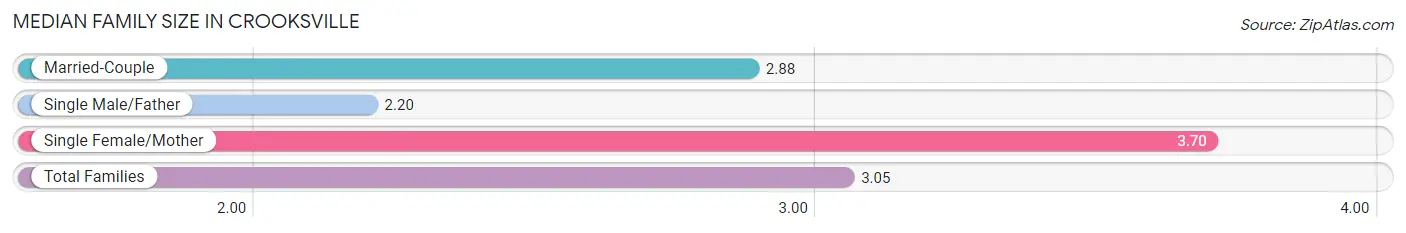
| Family Type | # Families | Family Size |
| Married-Couple | 441 (72.2%) | 2.88 |
| Single Male/Father | 25 (4.1%) | 2.20 |
| Single Female/Mother | 145 (23.7%) | 3.70 |
| Total Families | 611 (100.0%) | 3.05 |
Median Household Size in Crooksville
The median household size in Crooksville is 2.55 persons per household, with single male/father households (25 | 2.8%) accounting for the largest median household size of 4.44 persons per household. non-family households (297 | 32.7%) represent the smallest median household size with 1.06 persons per household.
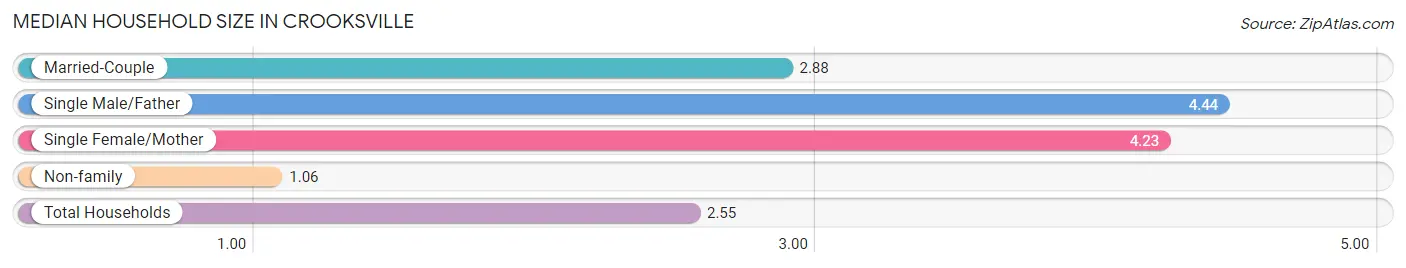
| Household Type | # Households | Household Size |
| Married-Couple | 441 (48.6%) | 2.88 |
| Single Male/Father | 25 (2.8%) | 4.44 |
| Single Female/Mother | 145 (16.0%) | 4.23 |
| Non-family | 297 (32.7%) | 1.06 |
| Total Households | 908 (100.0%) | 2.55 |
Household Size by Marriage Status in Crooksville
Out of a total of 908 households in Crooksville, 611 (67.3%) are family households, while 297 (32.7%) are nonfamily households. The most numerous type of family households are 2-person households, comprising 286, and the most common type of nonfamily households are 1-person households, comprising 274.
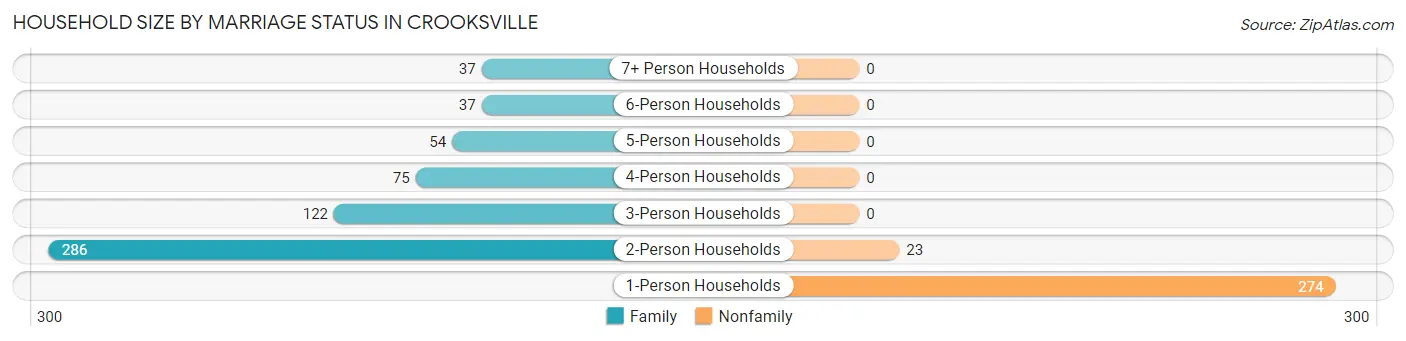
| Household Size | Family Households | Nonfamily Households |
| 1-Person Households | - | 274 (30.2%) |
| 2-Person Households | 286 (31.5%) | 23 (2.5%) |
| 3-Person Households | 122 (13.4%) | 0 (0.0%) |
| 4-Person Households | 75 (8.3%) | 0 (0.0%) |
| 5-Person Households | 54 (5.9%) | 0 (0.0%) |
| 6-Person Households | 37 (4.1%) | 0 (0.0%) |
| 7+ Person Households | 37 (4.1%) | 0 (0.0%) |
| Total | 611 (67.3%) | 297 (32.7%) |
Female Fertility in Crooksville
Fertility by Age in Crooksville
Average fertility rate in Crooksville is 30.0 births per 1,000 women. Women in the age bracket of 20 to 34 years have the highest fertility rate with 79.0 births per 1,000 women. Women in the age bracket of 20 to 34 years acount for 100.0% of all women with births.
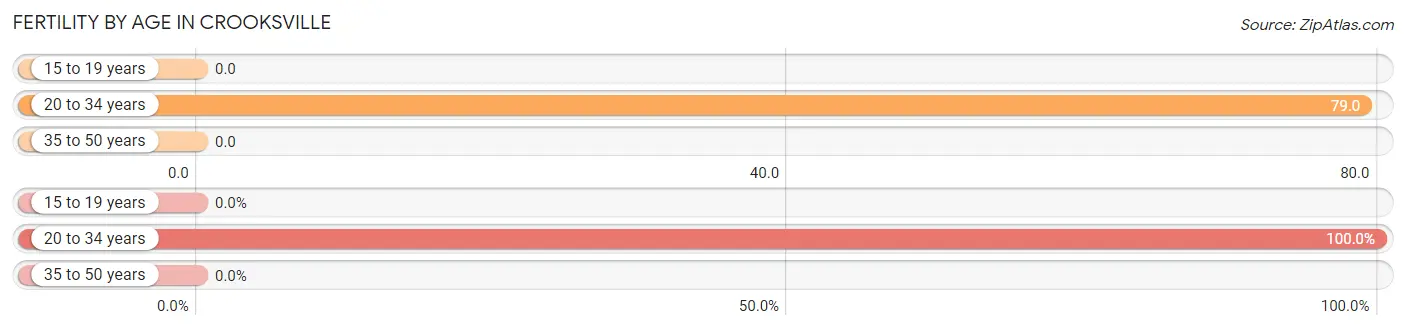
| Age Bracket | Women with Births | Births / 1,000 Women |
| 15 to 19 years | 0 (0.0%) | 0.0 |
| 20 to 34 years | 17 (100.0%) | 79.0 |
| 35 to 50 years | 0 (0.0%) | 0.0 |
| Total | 17 (100.0%) | 30.0 |
Fertility by Age by Marriage Status in Crooksville
70.6% of women with births (17) in Crooksville are married. The highest percentage of unmarried women with births falls into 20 to 34 years age bracket with 29.4% of them unmarried at the time of birth, while the lowest percentage of unmarried women with births belong to 20 to 34 years age bracket with 29.4% of them unmarried.
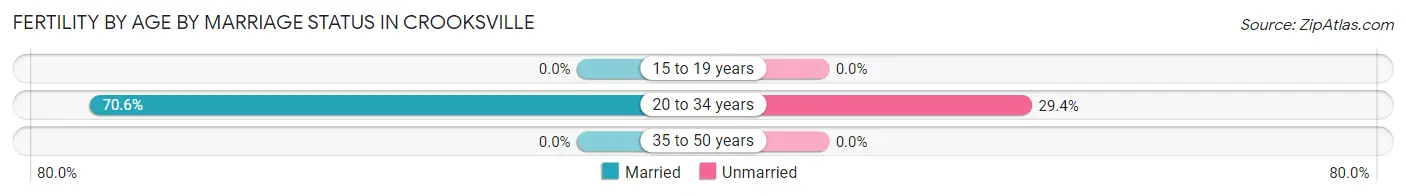
| Age Bracket | Married | Unmarried |
| 15 to 19 years | 0 (0.0%) | 0 (0.0%) |
| 20 to 34 years | 12 (70.6%) | 5 (29.4%) |
| 35 to 50 years | 0 (0.0%) | 0 (0.0%) |
| Total | 12 (70.6%) | 5 (29.4%) |
Fertility by Education in Crooksville
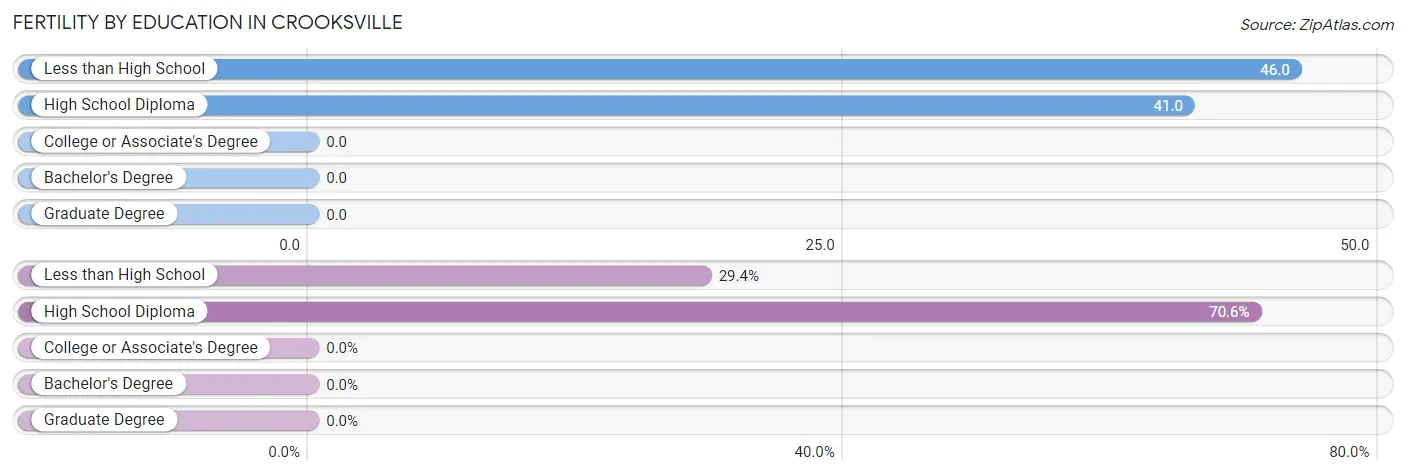
| Educational Attainment | Women with Births | Births / 1,000 Women |
| Less than High School | 5 (29.4%) | 46.0 |
| High School Diploma | 12 (70.6%) | 41.0 |
| College or Associate's Degree | 0 (0.0%) | 0.0 |
| Bachelor's Degree | 0 (0.0%) | 0.0 |
| Graduate Degree | 0 (0.0%) | 0.0 |
| Total | 17 (100.0%) | 30.0 |
Fertility by Education by Marriage Status in Crooksville
29.4% of women with births in Crooksville are unmarried. Women with the educational attainment of high school diploma are most likely to be married with 100.0% of them married at childbirth, while women with the educational attainment of less than high school are least likely to be married with 100.0% of them unmarried at childbirth.
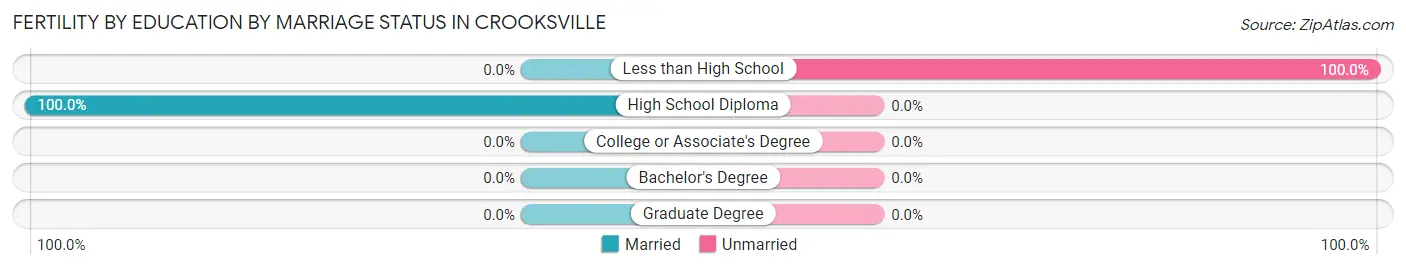
| Educational Attainment | Married | Unmarried |
| Less than High School | 0 (0.0%) | 5 (100.0%) |
| High School Diploma | 12 (100.0%) | 0 (0.0%) |
| College or Associate's Degree | 0 (0.0%) | 0 (0.0%) |
| Bachelor's Degree | 0 (0.0%) | 0 (0.0%) |
| Graduate Degree | 0 (0.0%) | 0 (0.0%) |
| Total | 12 (70.6%) | 5 (29.4%) |
Employment Characteristics in Crooksville
Employment by Class of Employer in Crooksville
Among the 815 employed individuals in Crooksville, private company employees (653 | 80.1%), local government employees (78 | 9.6%), and not-for-profit organizations (45 | 5.5%) make up the most common classes of employment.
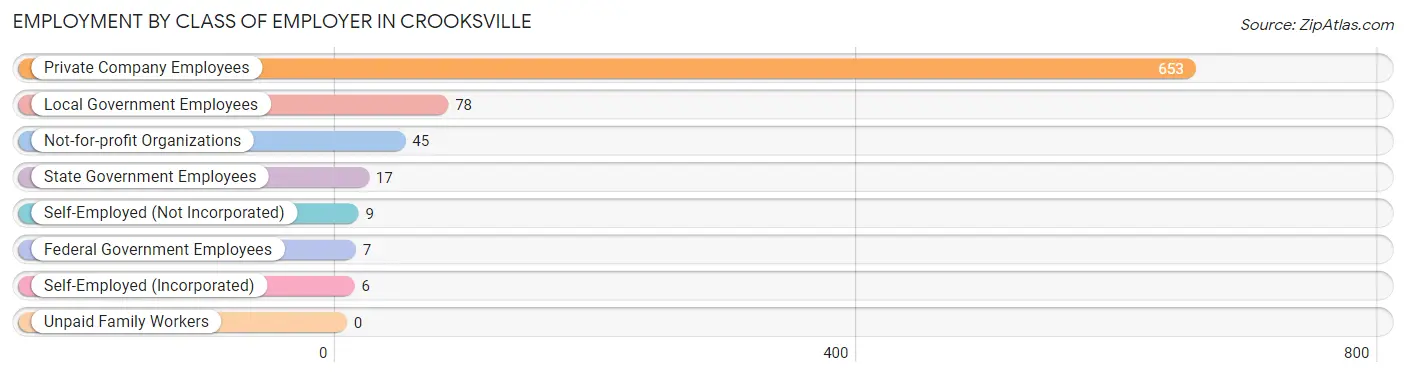
| Employer Class | # Employees | % Employees |
| Private Company Employees | 653 | 80.1% |
| Self-Employed (Incorporated) | 6 | 0.7% |
| Self-Employed (Not Incorporated) | 9 | 1.1% |
| Not-for-profit Organizations | 45 | 5.5% |
| Local Government Employees | 78 | 9.6% |
| State Government Employees | 17 | 2.1% |
| Federal Government Employees | 7 | 0.9% |
| Unpaid Family Workers | 0 | 0.0% |
| Total | 815 | 100.0% |
Employment Status by Age in Crooksville
According to the labor force statistics for Crooksville, out of the total population over 16 years of age (1,731), 50.3% or 871 individuals are in the labor force, with 4.8% or 42 of them unemployed. The age group with the highest labor force participation rate is 25 to 29 years, with 76.7% or 99 individuals in the labor force. Within the labor force, the 20 to 24 years age range has the highest percentage of unemployed individuals, with 27.8% or 10 of them being unemployed.
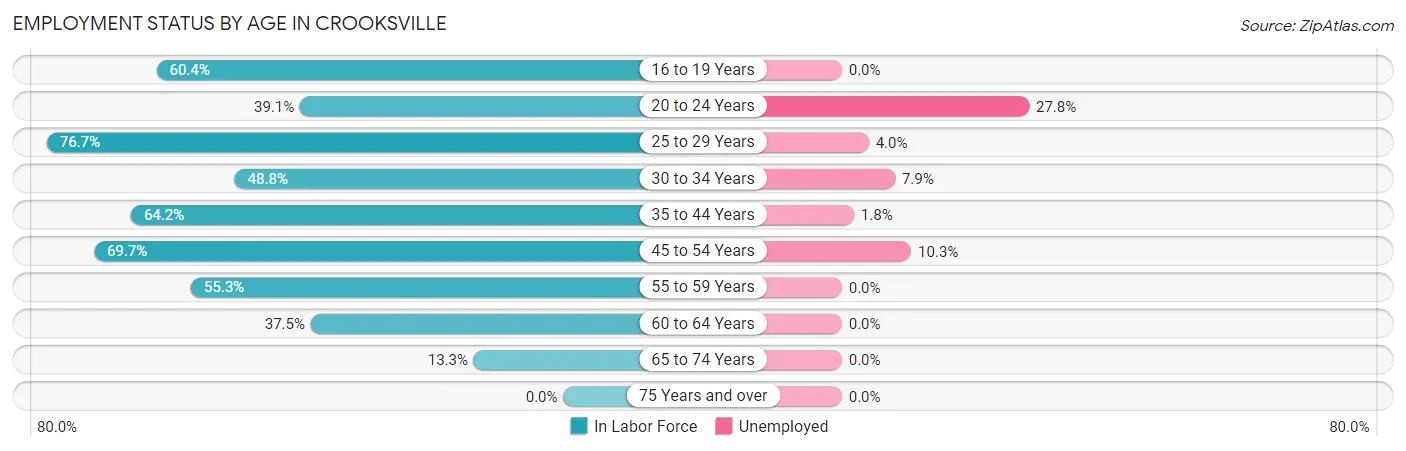
| Age Bracket | In Labor Force | Unemployed |
| 16 to 19 Years | 90 (60.4%) | 0 (0.0%) |
| 20 to 24 Years | 36 (39.1%) | 10 (27.8%) |
| 25 to 29 Years | 99 (76.7%) | 4 (4.0%) |
| 30 to 34 Years | 63 (48.8%) | 5 (7.9%) |
| 35 to 44 Years | 219 (64.2%) | 4 (1.8%) |
| 45 to 54 Years | 184 (69.7%) | 19 (10.3%) |
| 55 to 59 Years | 99 (55.3%) | 0 (0.0%) |
| 60 to 64 Years | 57 (37.5%) | 0 (0.0%) |
| 65 to 74 Years | 24 (13.3%) | 0 (0.0%) |
| 75 Years and over | 0 (0.0%) | 0 (0.0%) |
| Total | 871 (50.3%) | 42 (4.8%) |
Employment Status by Educational Attainment in Crooksville
According to labor force statistics for Crooksville, 60.4% of individuals (721) out of the total population between 25 and 64 years of age (1,194) are in the labor force, with 4.4% or 32 of them being unemployed. The group with the highest labor force participation rate are those with the educational attainment of bachelor's degree or higher, with 81.8% or 63 individuals in the labor force. Within the labor force, individuals with less than high school education have the highest percentage of unemployment, with 20.8% or 5 of them being unemployed.
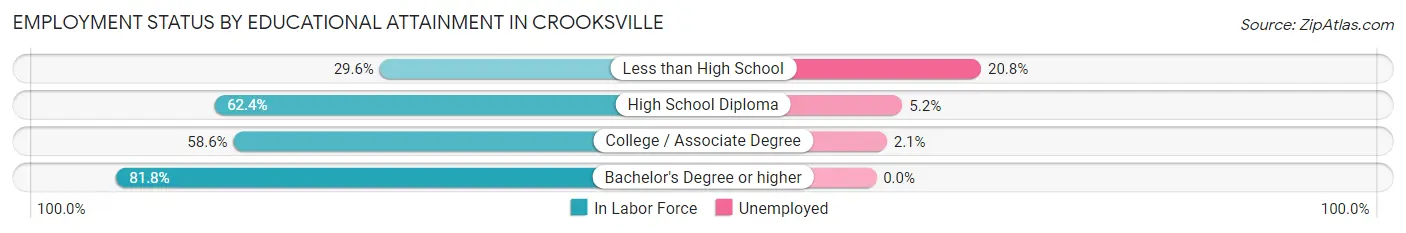
| Educational Attainment | In Labor Force | Unemployed |
| Less than High School | 24 (29.6%) | 17 (20.8%) |
| High School Diploma | 443 (62.4%) | 37 (5.2%) |
| College / Associate Degree | 191 (58.6%) | 7 (2.1%) |
| Bachelor's Degree or higher | 63 (81.8%) | 0 (0.0%) |
| Total | 721 (60.4%) | 53 (4.4%) |
Employment Occupations by Sex in Crooksville
Management, Business, Science and Arts Occupations
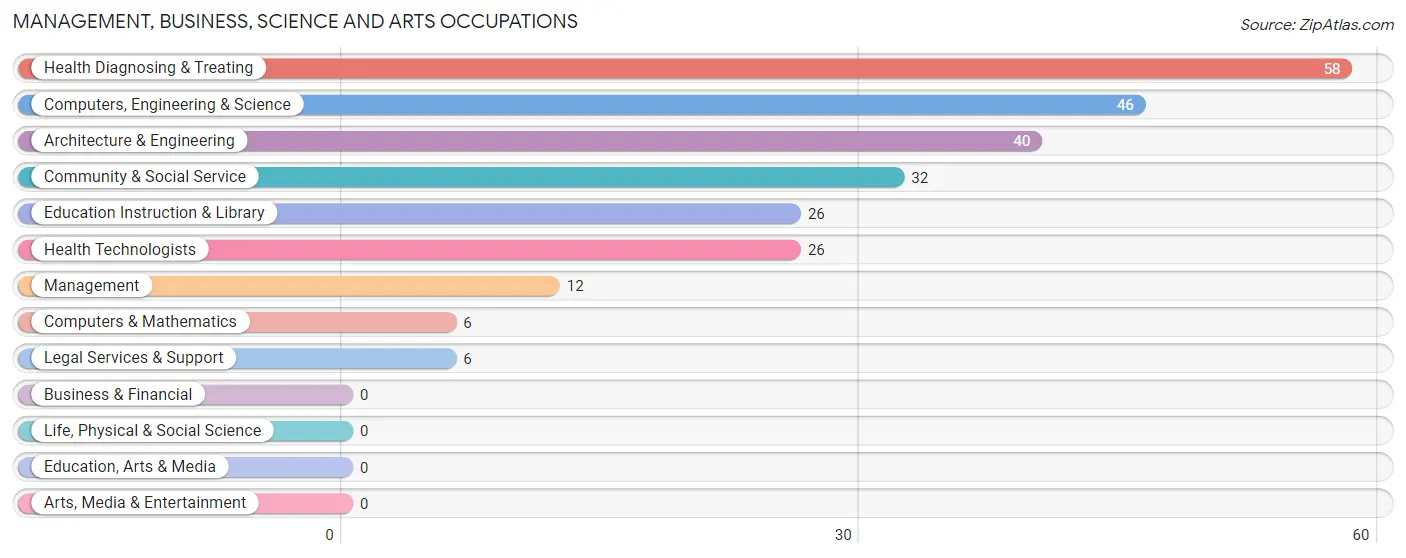
The most common Management, Business, Science and Arts occupations in Crooksville are Health Diagnosing & Treating (58 | 7.0%), Computers, Engineering & Science (46 | 5.6%), Architecture & Engineering (40 | 4.8%), Community & Social Service (32 | 3.9%), and Education Instruction & Library (26 | 3.1%).
Management, Business, Science and Arts Occupations by Sex
Within the Management, Business, Science and Arts occupations in Crooksville, the most male-oriented occupations are Architecture & Engineering (100.0%), Computers, Engineering & Science (87.0%), and Management (75.0%), while the most female-oriented occupations are Computers & Mathematics (100.0%), Legal Services & Support (100.0%), and Health Diagnosing & Treating (100.0%).
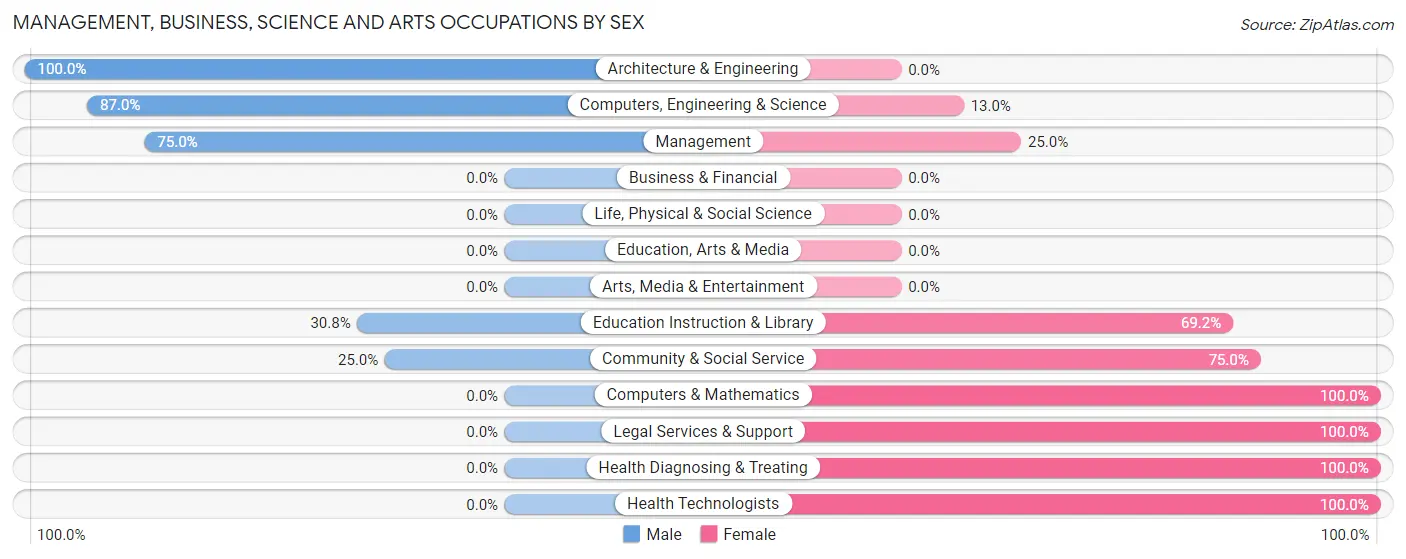
| Occupation | Male | Female |
| Management | 9 (75.0%) | 3 (25.0%) |
| Business & Financial | 0 (0.0%) | 0 (0.0%) |
| Computers, Engineering & Science | 40 (87.0%) | 6 (13.0%) |
| Computers & Mathematics | 0 (0.0%) | 6 (100.0%) |
| Architecture & Engineering | 40 (100.0%) | 0 (0.0%) |
| Life, Physical & Social Science | 0 (0.0%) | 0 (0.0%) |
| Community & Social Service | 8 (25.0%) | 24 (75.0%) |
| Education, Arts & Media | 0 (0.0%) | 0 (0.0%) |
| Legal Services & Support | 0 (0.0%) | 6 (100.0%) |
| Education Instruction & Library | 8 (30.8%) | 18 (69.2%) |
| Arts, Media & Entertainment | 0 (0.0%) | 0 (0.0%) |
| Health Diagnosing & Treating | 0 (0.0%) | 58 (100.0%) |
| Health Technologists | 0 (0.0%) | 26 (100.0%) |
| Total (Category) | 57 (38.5%) | 91 (61.5%) |
| Total (Overall) | 470 (56.7%) | 359 (43.3%) |
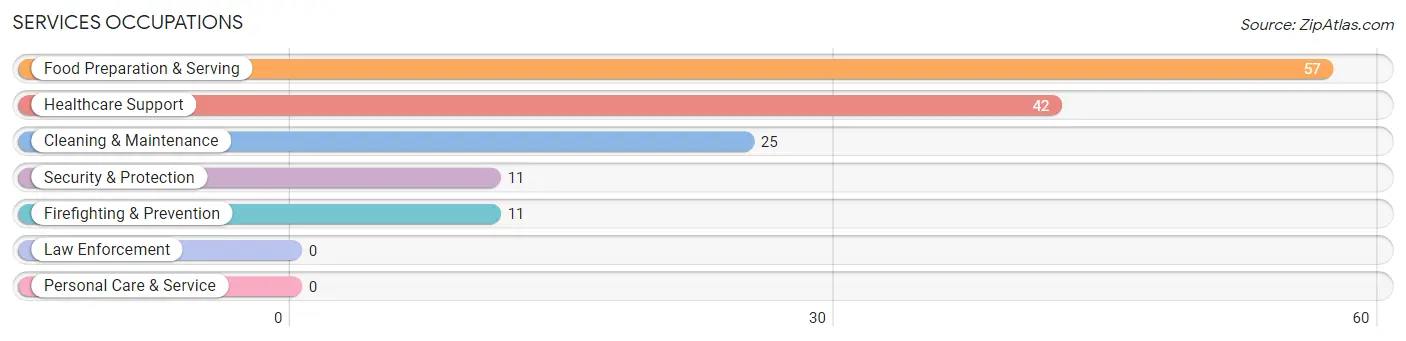
Services Occupations
The most common Services occupations in Crooksville are Food Preparation & Serving (57 | 6.9%), Healthcare Support (42 | 5.1%), Cleaning & Maintenance (25 | 3.0%), Security & Protection (11 | 1.3%), and Firefighting & Prevention (11 | 1.3%).
Services Occupations by Sex
Within the Services occupations in Crooksville, the most male-oriented occupations are Security & Protection (100.0%), Firefighting & Prevention (100.0%), and Cleaning & Maintenance (80.0%), while the most female-oriented occupations are Healthcare Support (100.0%), Food Preparation & Serving (68.4%), and Cleaning & Maintenance (20.0%).
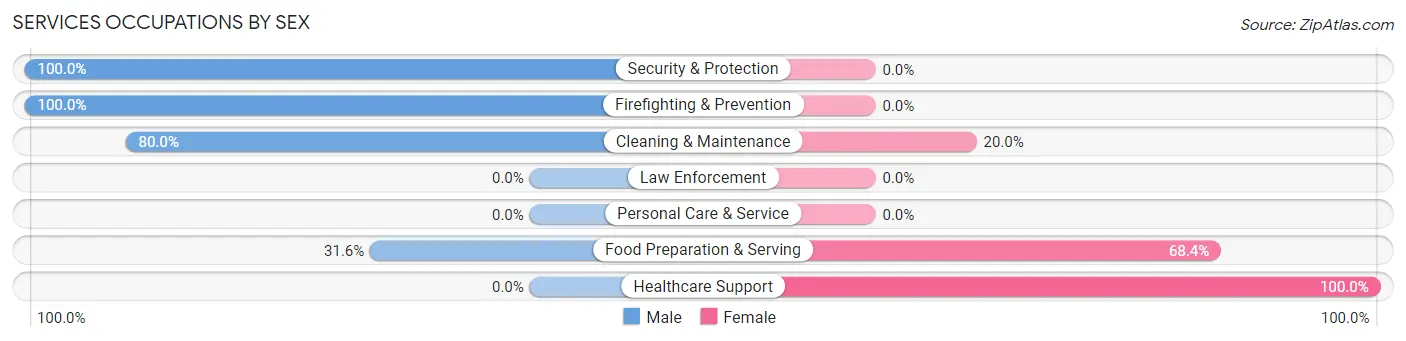
| Occupation | Male | Female |
| Healthcare Support | 0 (0.0%) | 42 (100.0%) |
| Security & Protection | 11 (100.0%) | 0 (0.0%) |
| Firefighting & Prevention | 11 (100.0%) | 0 (0.0%) |
| Law Enforcement | 0 (0.0%) | 0 (0.0%) |
| Food Preparation & Serving | 18 (31.6%) | 39 (68.4%) |
| Cleaning & Maintenance | 20 (80.0%) | 5 (20.0%) |
| Personal Care & Service | 0 (0.0%) | 0 (0.0%) |
| Total (Category) | 49 (36.3%) | 86 (63.7%) |
| Total (Overall) | 470 (56.7%) | 359 (43.3%) |
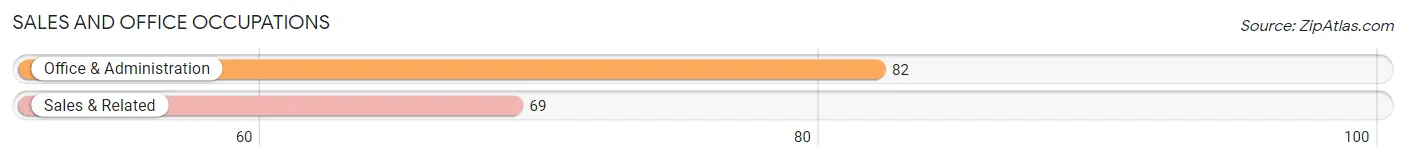
Sales and Office Occupations
The most common Sales and Office occupations in Crooksville are Office & Administration (82 | 9.9%), and Sales & Related (69 | 8.3%).
Sales and Office Occupations by Sex

| Occupation | Male | Female |
| Sales & Related | 38 (55.1%) | 31 (44.9%) |
| Office & Administration | 9 (11.0%) | 73 (89.0%) |
| Total (Category) | 47 (31.1%) | 104 (68.9%) |
| Total (Overall) | 470 (56.7%) | 359 (43.3%) |
Natural Resources, Construction and Maintenance Occupations
The most common Natural Resources, Construction and Maintenance occupations in Crooksville are Construction & Extraction (57 | 6.9%), and Installation, Maintenance & Repair (34 | 4.1%).
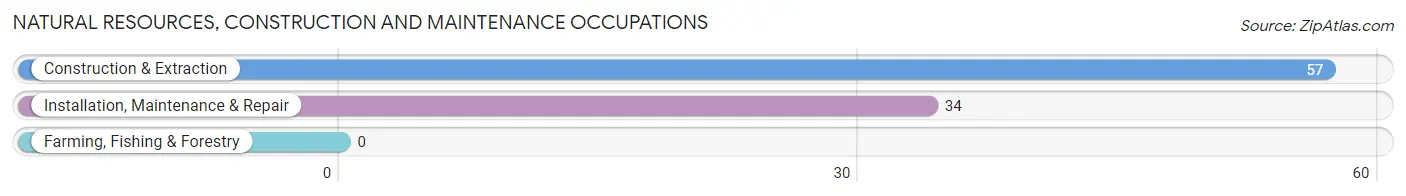
Natural Resources, Construction and Maintenance Occupations by Sex

| Occupation | Male | Female |
| Farming, Fishing & Forestry | 0 (0.0%) | 0 (0.0%) |
| Construction & Extraction | 57 (100.0%) | 0 (0.0%) |
| Installation, Maintenance & Repair | 34 (100.0%) | 0 (0.0%) |
| Total (Category) | 91 (100.0%) | 0 (0.0%) |
| Total (Overall) | 470 (56.7%) | 359 (43.3%) |
Production, Transportation and Moving Occupations
The most common Production, Transportation and Moving occupations in Crooksville are Material Moving (105 | 12.7%), Transportation (101 | 12.2%), and Production (98 | 11.8%).
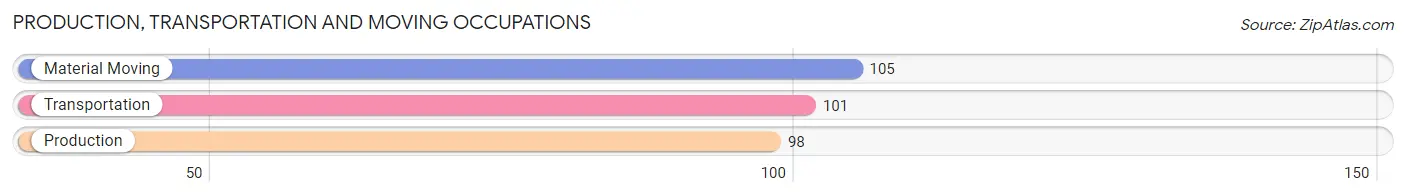
Production, Transportation and Moving Occupations by Sex
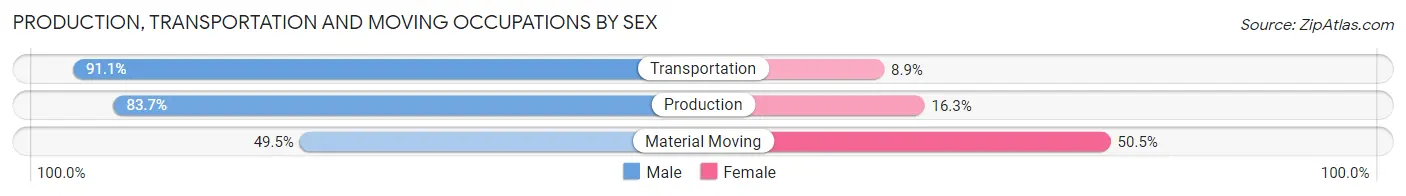
| Occupation | Male | Female |
| Production | 82 (83.7%) | 16 (16.3%) |
| Transportation | 92 (91.1%) | 9 (8.9%) |
| Material Moving | 52 (49.5%) | 53 (50.5%) |
| Total (Category) | 226 (74.3%) | 78 (25.7%) |
| Total (Overall) | 470 (56.7%) | 359 (43.3%) |
Employment Industries by Sex in Crooksville
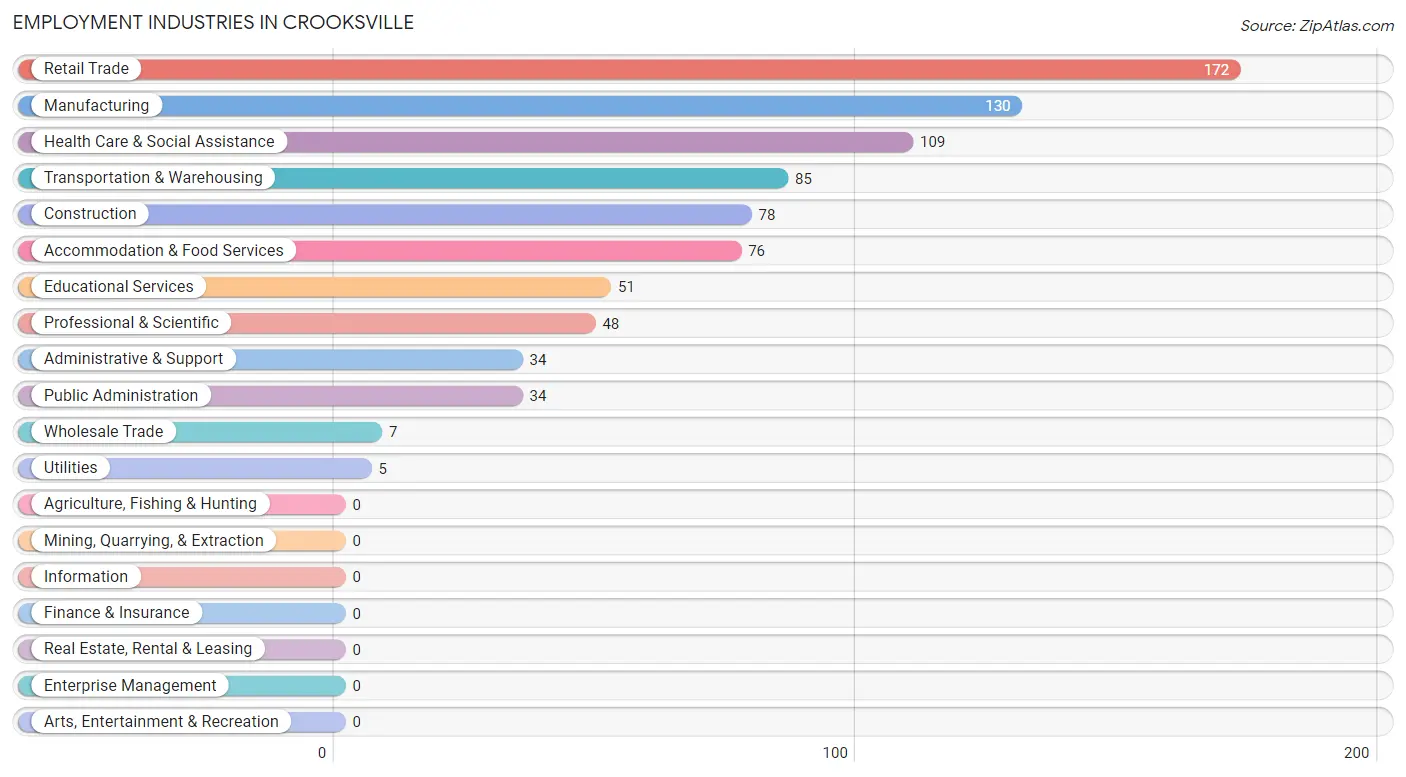
Employment Industries in Crooksville
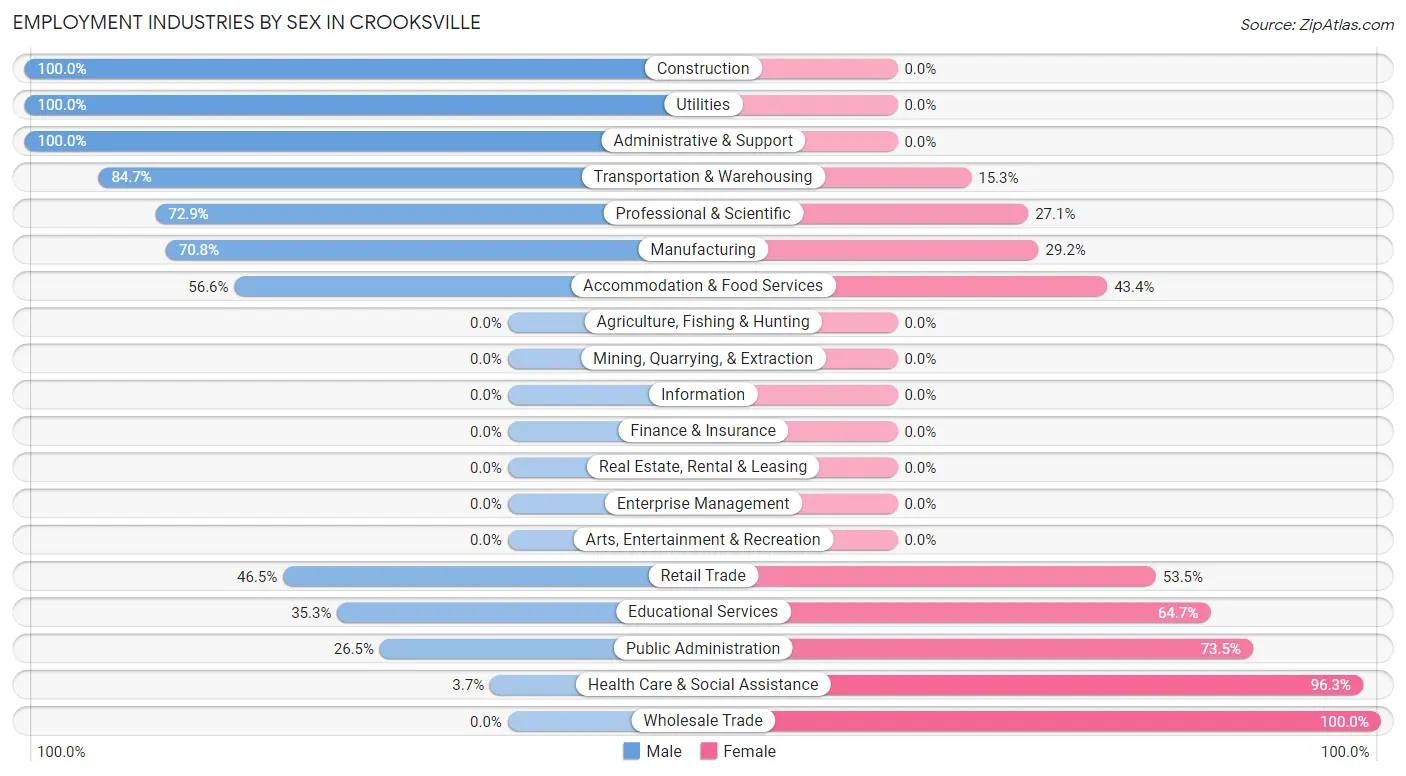
The major employment industries in Crooksville include Retail Trade (172 | 20.7%), Manufacturing (130 | 15.7%), Health Care & Social Assistance (109 | 13.2%), Transportation & Warehousing (85 | 10.2%), and Construction (78 | 9.4%).
Employment Industries by Sex in Crooksville
The Crooksville industries that see more men than women are Construction (100.0%), Utilities (100.0%), and Administrative & Support (100.0%), whereas the industries that tend to have a higher number of women are Wholesale Trade (100.0%), Health Care & Social Assistance (96.3%), and Public Administration (73.5%).
| Industry | Male | Female |
| Agriculture, Fishing & Hunting | 0 (0.0%) | 0 (0.0%) |
| Mining, Quarrying, & Extraction | 0 (0.0%) | 0 (0.0%) |
| Construction | 78 (100.0%) | 0 (0.0%) |
| Manufacturing | 92 (70.8%) | 38 (29.2%) |
| Wholesale Trade | 0 (0.0%) | 7 (100.0%) |
| Retail Trade | 80 (46.5%) | 92 (53.5%) |
| Transportation & Warehousing | 72 (84.7%) | 13 (15.3%) |
| Utilities | 5 (100.0%) | 0 (0.0%) |
| Information | 0 (0.0%) | 0 (0.0%) |
| Finance & Insurance | 0 (0.0%) | 0 (0.0%) |
| Real Estate, Rental & Leasing | 0 (0.0%) | 0 (0.0%) |
| Professional & Scientific | 35 (72.9%) | 13 (27.1%) |
| Enterprise Management | 0 (0.0%) | 0 (0.0%) |
| Administrative & Support | 34 (100.0%) | 0 (0.0%) |
| Educational Services | 18 (35.3%) | 33 (64.7%) |
| Health Care & Social Assistance | 4 (3.7%) | 105 (96.3%) |
| Arts, Entertainment & Recreation | 0 (0.0%) | 0 (0.0%) |
| Accommodation & Food Services | 43 (56.6%) | 33 (43.4%) |
| Public Administration | 9 (26.5%) | 25 (73.5%) |
| Total | 470 (56.7%) | 359 (43.3%) |
Education in Crooksville
School Enrollment in Crooksville
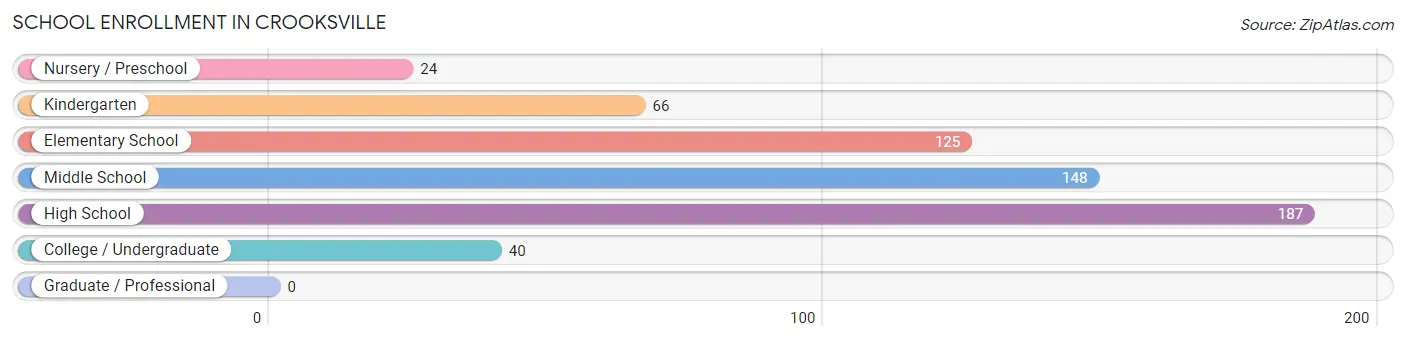
The most common levels of schooling among the 590 students in Crooksville are high school (187 | 31.7%), middle school (148 | 25.1%), and elementary school (125 | 21.2%).
| School Level | # Students | % Students |
| Nursery / Preschool | 24 | 4.1% |
| Kindergarten | 66 | 11.2% |
| Elementary School | 125 | 21.2% |
| Middle School | 148 | 25.1% |
| High School | 187 | 31.7% |
| College / Undergraduate | 40 | 6.8% |
| Graduate / Professional | 0 | 0.0% |
| Total | 590 | 100.0% |
School Enrollment by Age by Funding Source in Crooksville
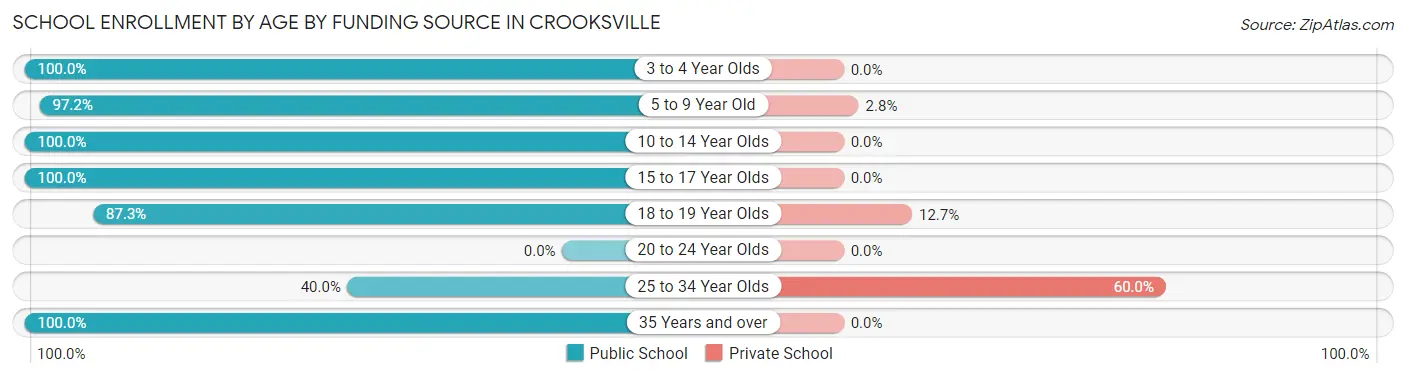
Out of a total of 590 students who are enrolled in schools in Crooksville, 27 (4.6%) attend a private institution, while the remaining 563 (95.4%) are enrolled in public schools. The age group of 25 to 34 year olds has the highest likelihood of being enrolled in private schools, with 15 (60.0% in the age bracket) enrolled. Conversely, the age group of 3 to 4 year olds has the lowest likelihood of being enrolled in a private school, with 18 (100.0% in the age bracket) attending a public institution.
| Age Bracket | Public School | Private School |
| 3 to 4 Year Olds | 18 (100.0%) | 0 (0.0%) |
| 5 to 9 Year Old | 174 (97.2%) | 5 (2.8%) |
| 10 to 14 Year Olds | 215 (100.0%) | 0 (0.0%) |
| 15 to 17 Year Olds | 90 (100.0%) | 0 (0.0%) |
| 18 to 19 Year Olds | 48 (87.3%) | 7 (12.7%) |
| 20 to 24 Year Olds | 0 (0.0%) | 0 (0.0%) |
| 25 to 34 Year Olds | 10 (40.0%) | 15 (60.0%) |
| 35 Years and over | 8 (100.0%) | 0 (0.0%) |
| Total | 563 (95.4%) | 27 (4.6%) |
Educational Attainment by Field of Study in Crooksville
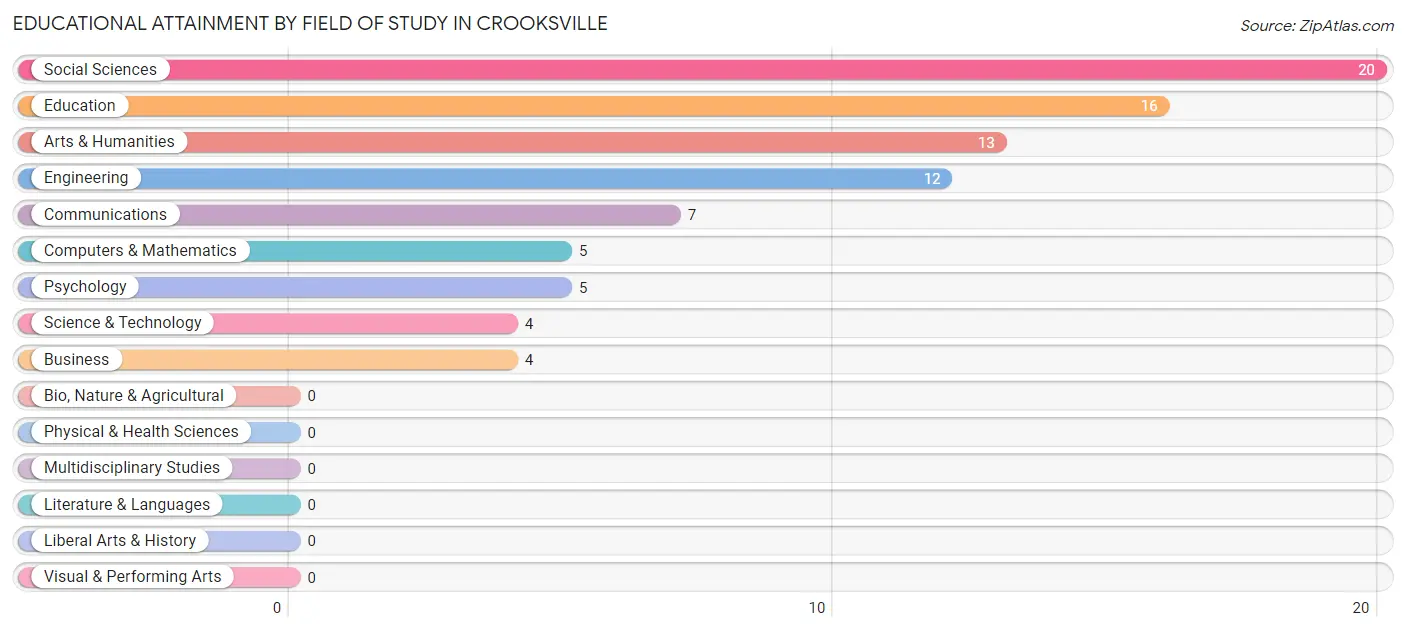
Social sciences (20 | 23.3%), education (16 | 18.6%), arts & humanities (13 | 15.1%), engineering (12 | 14.0%), and communications (7 | 8.1%) are the most common fields of study among 86 individuals in Crooksville who have obtained a bachelor's degree or higher.
| Field of Study | # Graduates | % Graduates |
| Computers & Mathematics | 5 | 5.8% |
| Bio, Nature & Agricultural | 0 | 0.0% |
| Physical & Health Sciences | 0 | 0.0% |
| Psychology | 5 | 5.8% |
| Social Sciences | 20 | 23.3% |
| Engineering | 12 | 14.0% |
| Multidisciplinary Studies | 0 | 0.0% |
| Science & Technology | 4 | 4.6% |
| Business | 4 | 4.6% |
| Education | 16 | 18.6% |
| Literature & Languages | 0 | 0.0% |
| Liberal Arts & History | 0 | 0.0% |
| Visual & Performing Arts | 0 | 0.0% |
| Communications | 7 | 8.1% |
| Arts & Humanities | 13 | 15.1% |
| Total | 86 | 100.0% |
Transportation & Commute in Crooksville
Vehicle Availability by Sex in Crooksville
The most prevalent vehicle ownership categories in Crooksville are males with 3 vehicles (168, accounting for 35.7%) and females with 3 vehicles (107, making up 48.7%).
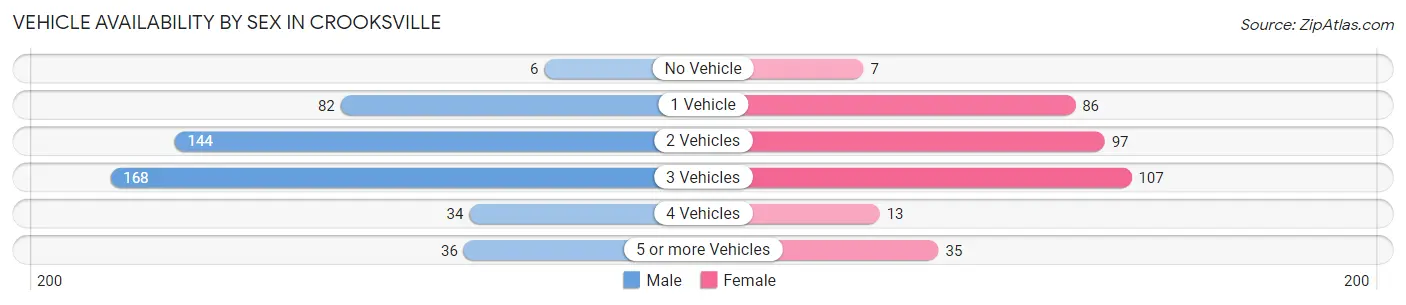
| Vehicles Available | Male | Female |
| No Vehicle | 6 (1.3%) | 7 (2.0%) |
| 1 Vehicle | 82 (17.4%) | 86 (24.9%) |
| 2 Vehicles | 144 (30.6%) | 97 (28.1%) |
| 3 Vehicles | 168 (35.7%) | 107 (31.0%) |
| 4 Vehicles | 34 (7.2%) | 13 (3.8%) |
| 5 or more Vehicles | 36 (7.7%) | 35 (10.1%) |
| Total | 470 (100.0%) | 345 (100.0%) |
Commute Time in Crooksville
The most frequently occuring commute durations in Crooksville are 15 to 19 minutes (144 commuters, 18.1%), 5 to 9 minutes (120 commuters, 15.1%), and 60 to 89 minutes (101 commuters, 12.7%).
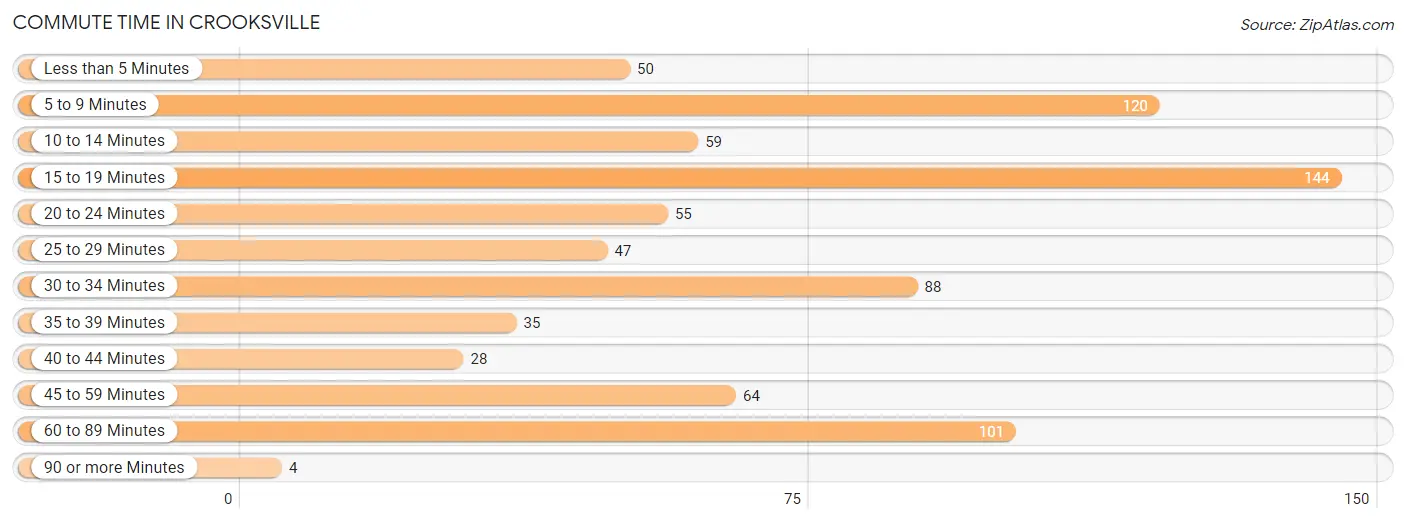
| Commute Time | # Commuters | % Commuters |
| Less than 5 Minutes | 50 | 6.3% |
| 5 to 9 Minutes | 120 | 15.1% |
| 10 to 14 Minutes | 59 | 7.4% |
| 15 to 19 Minutes | 144 | 18.1% |
| 20 to 24 Minutes | 55 | 6.9% |
| 25 to 29 Minutes | 47 | 5.9% |
| 30 to 34 Minutes | 88 | 11.1% |
| 35 to 39 Minutes | 35 | 4.4% |
| 40 to 44 Minutes | 28 | 3.5% |
| 45 to 59 Minutes | 64 | 8.1% |
| 60 to 89 Minutes | 101 | 12.7% |
| 90 or more Minutes | 4 | 0.5% |
Commute Time by Sex in Crooksville
The most common commute times in Crooksville are 15 to 19 minutes (89 commuters, 19.2%) for males and 15 to 19 minutes (55 commuters, 16.6%) for females.
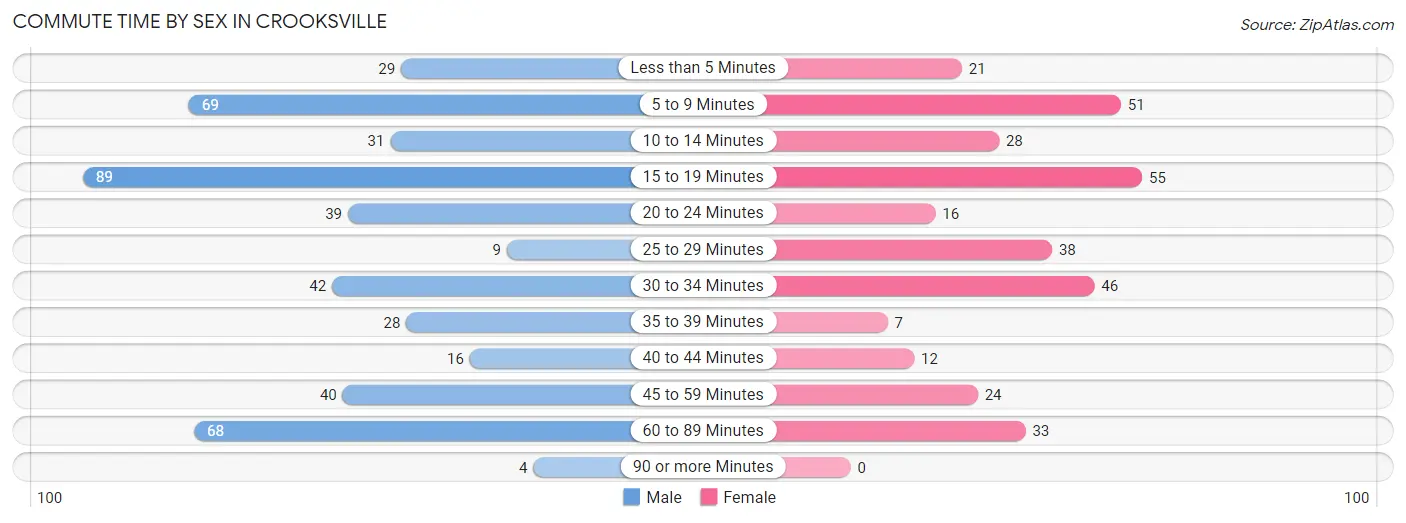
| Commute Time | Male | Female |
| Less than 5 Minutes | 29 (6.2%) | 21 (6.3%) |
| 5 to 9 Minutes | 69 (14.9%) | 51 (15.4%) |
| 10 to 14 Minutes | 31 (6.7%) | 28 (8.5%) |
| 15 to 19 Minutes | 89 (19.2%) | 55 (16.6%) |
| 20 to 24 Minutes | 39 (8.4%) | 16 (4.8%) |
| 25 to 29 Minutes | 9 (1.9%) | 38 (11.5%) |
| 30 to 34 Minutes | 42 (9.0%) | 46 (13.9%) |
| 35 to 39 Minutes | 28 (6.0%) | 7 (2.1%) |
| 40 to 44 Minutes | 16 (3.5%) | 12 (3.6%) |
| 45 to 59 Minutes | 40 (8.6%) | 24 (7.2%) |
| 60 to 89 Minutes | 68 (14.7%) | 33 (10.0%) |
| 90 or more Minutes | 4 (0.9%) | 0 (0.0%) |
Time of Departure to Work by Sex in Crooksville
The most frequent times of departure to work in Crooksville are 8:00 AM to 8:29 AM (91, 19.6%) for males and 8:00 AM to 8:29 AM (53, 16.0%) for females.
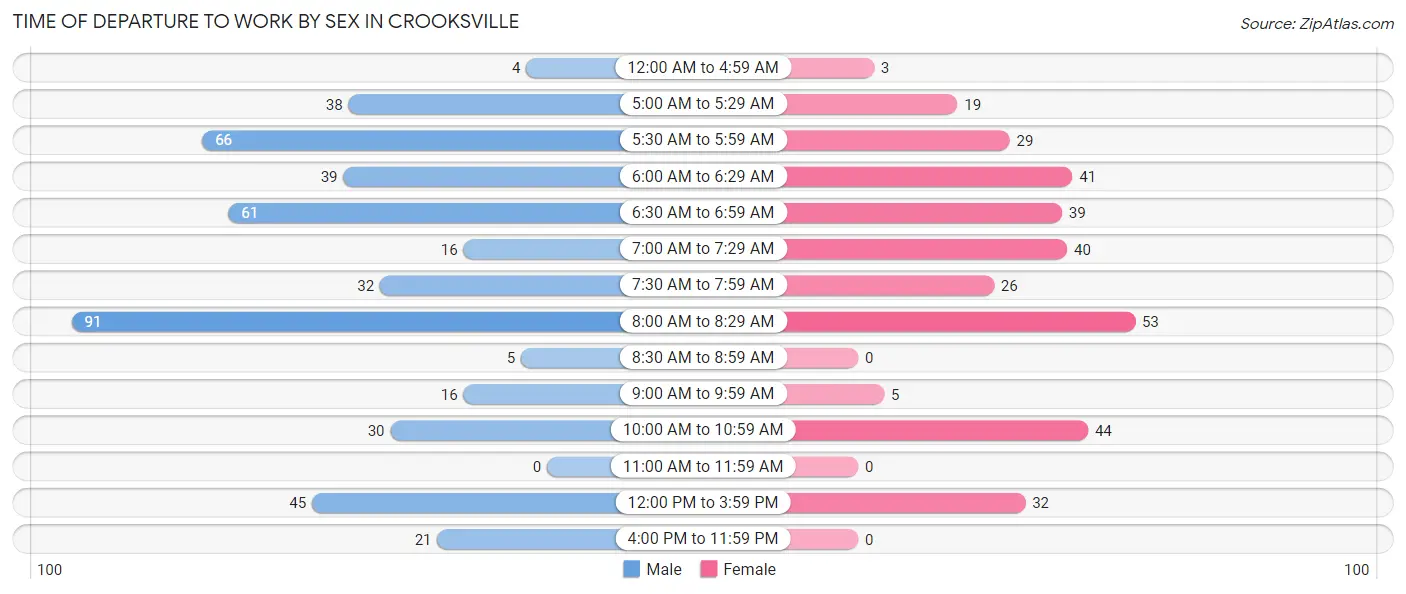
| Time of Departure | Male | Female |
| 12:00 AM to 4:59 AM | 4 (0.9%) | 3 (0.9%) |
| 5:00 AM to 5:29 AM | 38 (8.2%) | 19 (5.7%) |
| 5:30 AM to 5:59 AM | 66 (14.2%) | 29 (8.8%) |
| 6:00 AM to 6:29 AM | 39 (8.4%) | 41 (12.4%) |
| 6:30 AM to 6:59 AM | 61 (13.2%) | 39 (11.8%) |
| 7:00 AM to 7:29 AM | 16 (3.5%) | 40 (12.1%) |
| 7:30 AM to 7:59 AM | 32 (6.9%) | 26 (7.9%) |
| 8:00 AM to 8:29 AM | 91 (19.6%) | 53 (16.0%) |
| 8:30 AM to 8:59 AM | 5 (1.1%) | 0 (0.0%) |
| 9:00 AM to 9:59 AM | 16 (3.5%) | 5 (1.5%) |
| 10:00 AM to 10:59 AM | 30 (6.5%) | 44 (13.3%) |
| 11:00 AM to 11:59 AM | 0 (0.0%) | 0 (0.0%) |
| 12:00 PM to 3:59 PM | 45 (9.7%) | 32 (9.7%) |
| 4:00 PM to 11:59 PM | 21 (4.5%) | 0 (0.0%) |
| Total | 464 (100.0%) | 331 (100.0%) |
Housing Occupancy in Crooksville
Occupancy by Ownership in Crooksville
Of the total 908 dwellings in Crooksville, owner-occupied units account for 526 (57.9%), while renter-occupied units make up 382 (42.1%).
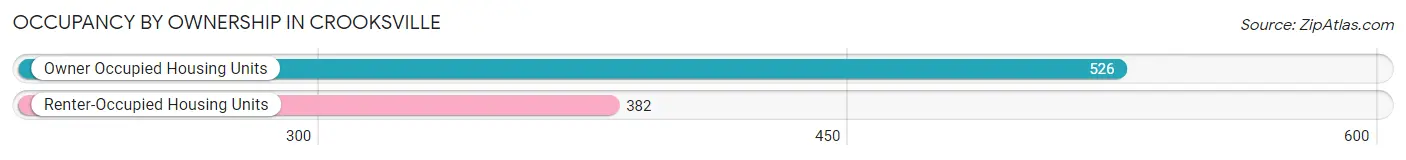
| Occupancy | # Housing Units | % Housing Units |
| Owner Occupied Housing Units | 526 | 57.9% |
| Renter-Occupied Housing Units | 382 | 42.1% |
| Total Occupied Housing Units | 908 | 100.0% |
Occupancy by Household Size in Crooksville
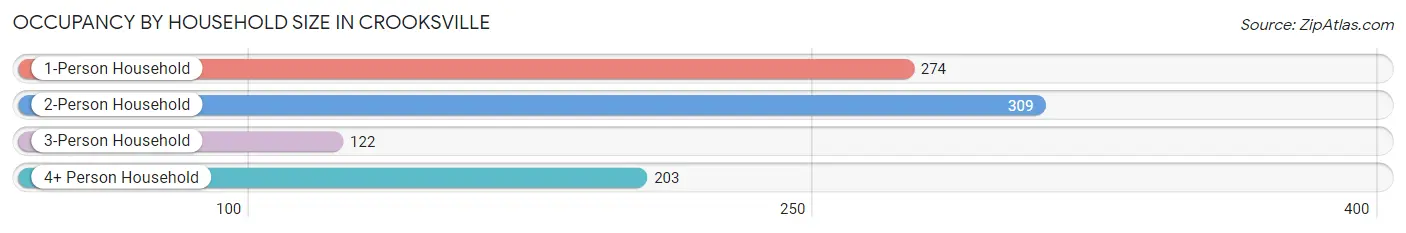
| Household Size | # Housing Units | % Housing Units |
| 1-Person Household | 274 | 30.2% |
| 2-Person Household | 309 | 34.0% |
| 3-Person Household | 122 | 13.4% |
| 4+ Person Household | 203 | 22.4% |
| Total Housing Units | 908 | 100.0% |
Occupancy by Ownership by Household Size in Crooksville
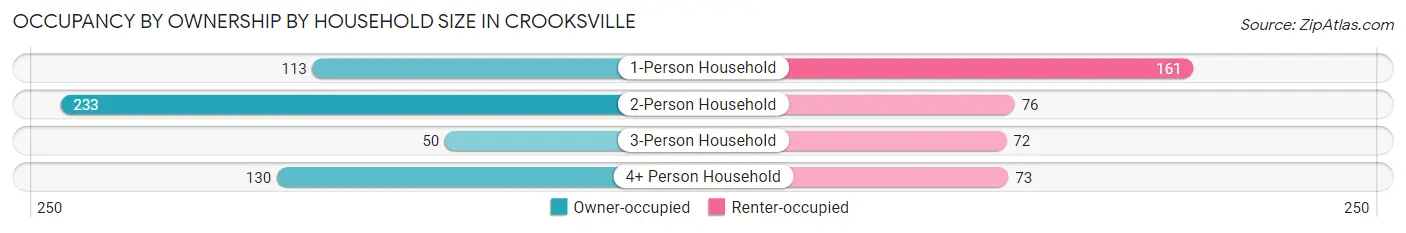
| Household Size | Owner-occupied | Renter-occupied |
| 1-Person Household | 113 (41.2%) | 161 (58.8%) |
| 2-Person Household | 233 (75.4%) | 76 (24.6%) |
| 3-Person Household | 50 (41.0%) | 72 (59.0%) |
| 4+ Person Household | 130 (64.0%) | 73 (36.0%) |
| Total Housing Units | 526 (57.9%) | 382 (42.1%) |
Occupancy by Educational Attainment in Crooksville
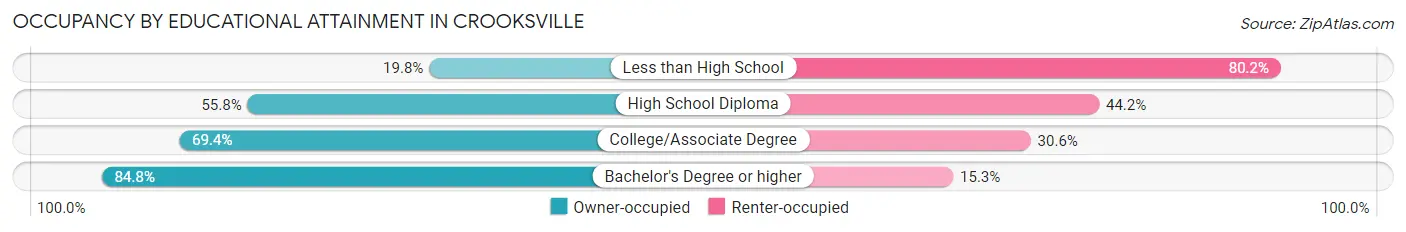
| Household Size | Owner-occupied | Renter-occupied |
| Less than High School | 19 (19.8%) | 77 (80.2%) |
| High School Diploma | 269 (55.8%) | 213 (44.2%) |
| College/Associate Degree | 188 (69.4%) | 83 (30.6%) |
| Bachelor's Degree or higher | 50 (84.8%) | 9 (15.2%) |
Occupancy by Age of Householder in Crooksville
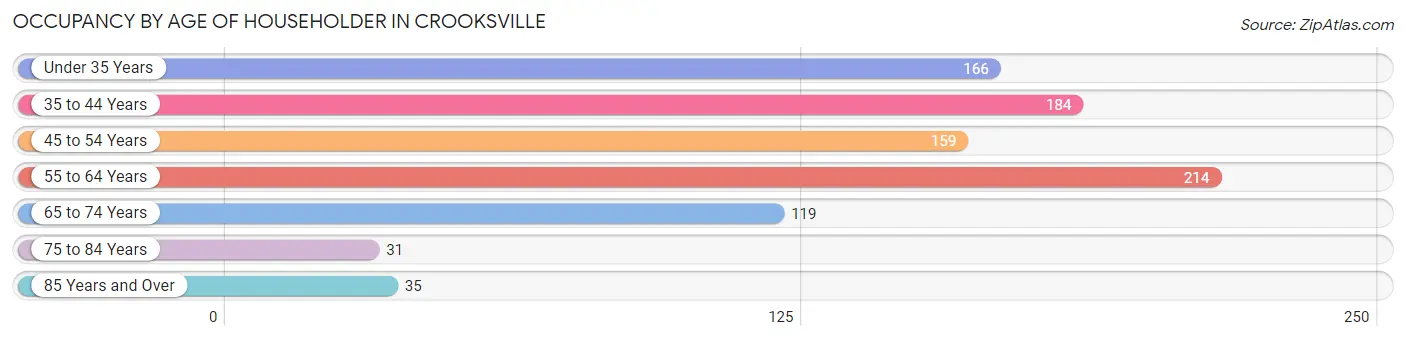
| Age Bracket | # Households | % Households |
| Under 35 Years | 166 | 18.3% |
| 35 to 44 Years | 184 | 20.3% |
| 45 to 54 Years | 159 | 17.5% |
| 55 to 64 Years | 214 | 23.6% |
| 65 to 74 Years | 119 | 13.1% |
| 75 to 84 Years | 31 | 3.4% |
| 85 Years and Over | 35 | 3.8% |
| Total | 908 | 100.0% |
Housing Finances in Crooksville
Median Income by Occupancy in Crooksville
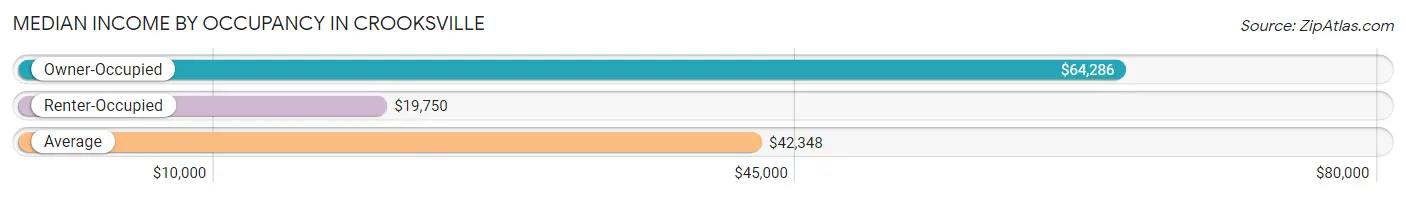
| Occupancy Type | # Households | Median Income |
| Owner-Occupied | 526 (57.9%) | $64,286 |
| Renter-Occupied | 382 (42.1%) | $19,750 |
| Average | 908 (100.0%) | $42,348 |
Occupancy by Householder Income Bracket in Crooksville
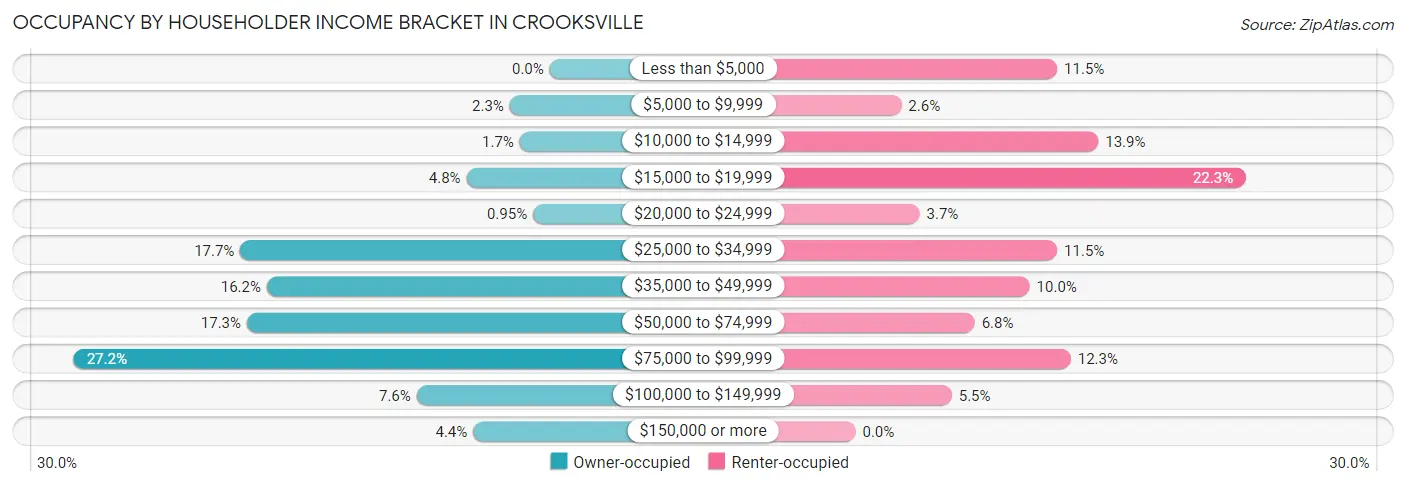
| Income Bracket | Owner-occupied | Renter-occupied |
| Less than $5,000 | 0 (0.0%) | 44 (11.5%) |
| $5,000 to $9,999 | 12 (2.3%) | 10 (2.6%) |
| $10,000 to $14,999 | 9 (1.7%) | 53 (13.9%) |
| $15,000 to $19,999 | 25 (4.8%) | 85 (22.3%) |
| $20,000 to $24,999 | 5 (0.9%) | 14 (3.7%) |
| $25,000 to $34,999 | 93 (17.7%) | 44 (11.5%) |
| $35,000 to $49,999 | 85 (16.2%) | 38 (10.0%) |
| $50,000 to $74,999 | 91 (17.3%) | 26 (6.8%) |
| $75,000 to $99,999 | 143 (27.2%) | 47 (12.3%) |
| $100,000 to $149,999 | 40 (7.6%) | 21 (5.5%) |
| $150,000 or more | 23 (4.4%) | 0 (0.0%) |
| Total | 526 (100.0%) | 382 (100.0%) |
Monthly Housing Cost Tiers in Crooksville
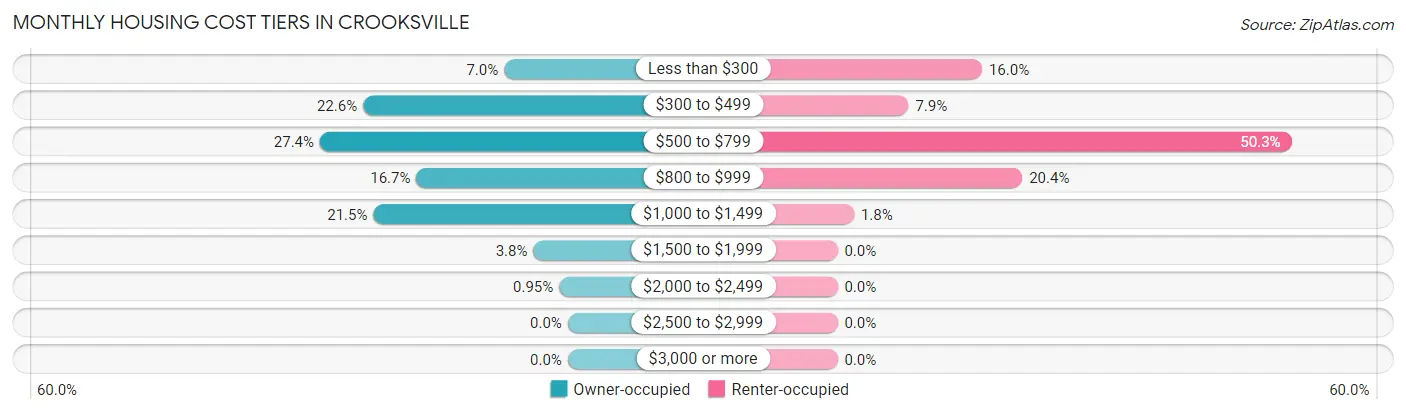
| Monthly Cost | Owner-occupied | Renter-occupied |
| Less than $300 | 37 (7.0%) | 61 (16.0%) |
| $300 to $499 | 119 (22.6%) | 30 (7.9%) |
| $500 to $799 | 144 (27.4%) | 192 (50.3%) |
| $800 to $999 | 88 (16.7%) | 78 (20.4%) |
| $1,000 to $1,499 | 113 (21.5%) | 7 (1.8%) |
| $1,500 to $1,999 | 20 (3.8%) | 0 (0.0%) |
| $2,000 to $2,499 | 5 (0.9%) | 0 (0.0%) |
| $2,500 to $2,999 | 0 (0.0%) | 0 (0.0%) |
| $3,000 or more | 0 (0.0%) | 0 (0.0%) |
| Total | 526 (100.0%) | 382 (100.0%) |
Physical Housing Characteristics in Crooksville
Housing Structures in Crooksville
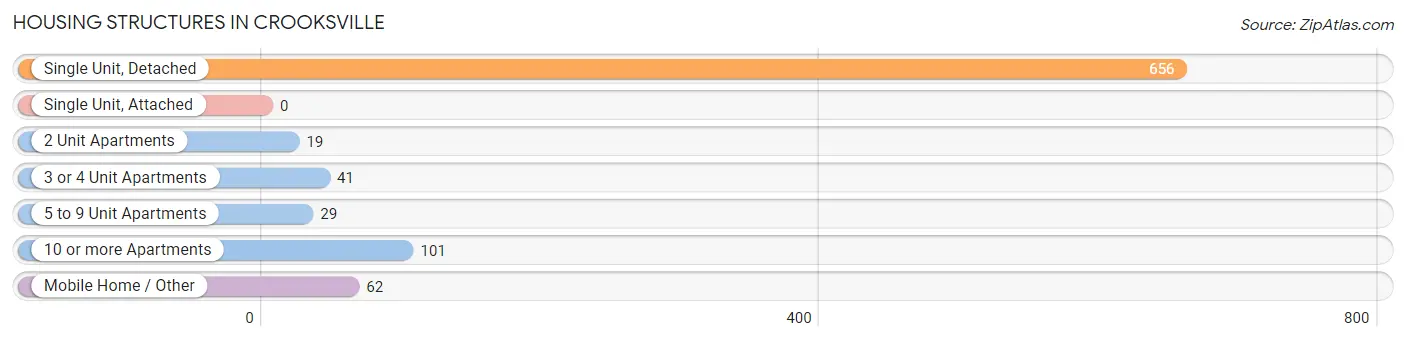
| Structure Type | # Housing Units | % Housing Units |
| Single Unit, Detached | 656 | 72.3% |
| Single Unit, Attached | 0 | 0.0% |
| 2 Unit Apartments | 19 | 2.1% |
| 3 or 4 Unit Apartments | 41 | 4.5% |
| 5 to 9 Unit Apartments | 29 | 3.2% |
| 10 or more Apartments | 101 | 11.1% |
| Mobile Home / Other | 62 | 6.8% |
| Total | 908 | 100.0% |
Housing Structures by Occupancy in Crooksville
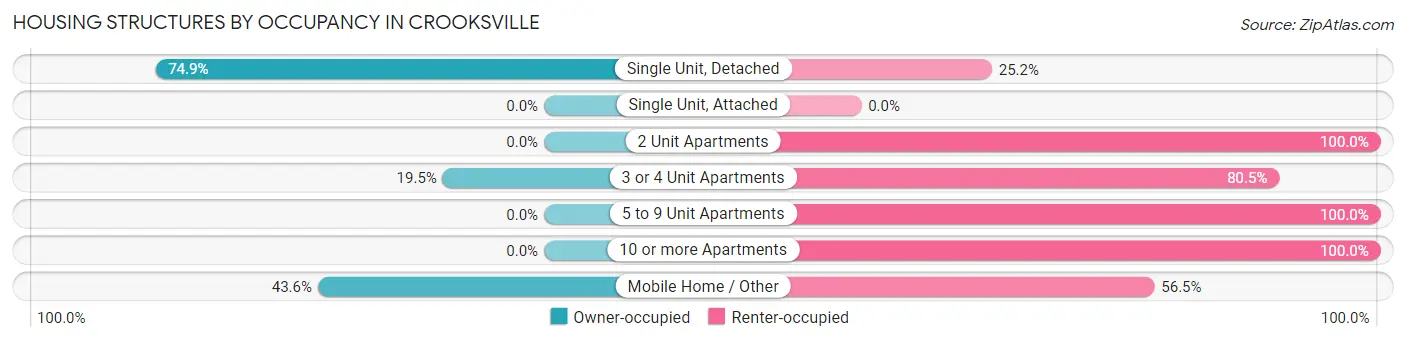
| Structure Type | Owner-occupied | Renter-occupied |
| Single Unit, Detached | 491 (74.9%) | 165 (25.2%) |
| Single Unit, Attached | 0 (0.0%) | 0 (0.0%) |
| 2 Unit Apartments | 0 (0.0%) | 19 (100.0%) |
| 3 or 4 Unit Apartments | 8 (19.5%) | 33 (80.5%) |
| 5 to 9 Unit Apartments | 0 (0.0%) | 29 (100.0%) |
| 10 or more Apartments | 0 (0.0%) | 101 (100.0%) |
| Mobile Home / Other | 27 (43.5%) | 35 (56.5%) |
| Total | 526 (57.9%) | 382 (42.1%) |
Housing Structures by Number of Rooms in Crooksville
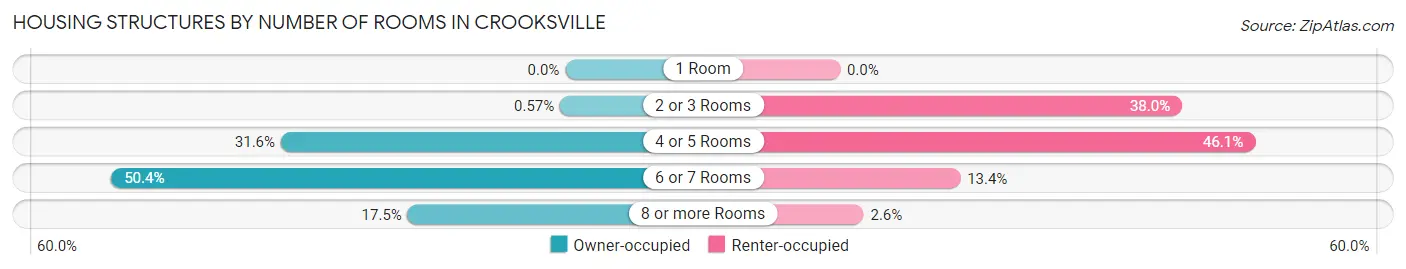
| Number of Rooms | Owner-occupied | Renter-occupied |
| 1 Room | 0 (0.0%) | 0 (0.0%) |
| 2 or 3 Rooms | 3 (0.6%) | 145 (38.0%) |
| 4 or 5 Rooms | 166 (31.6%) | 176 (46.1%) |
| 6 or 7 Rooms | 265 (50.4%) | 51 (13.4%) |
| 8 or more Rooms | 92 (17.5%) | 10 (2.6%) |
| Total | 526 (100.0%) | 382 (100.0%) |
Housing Structure by Heating Type in Crooksville
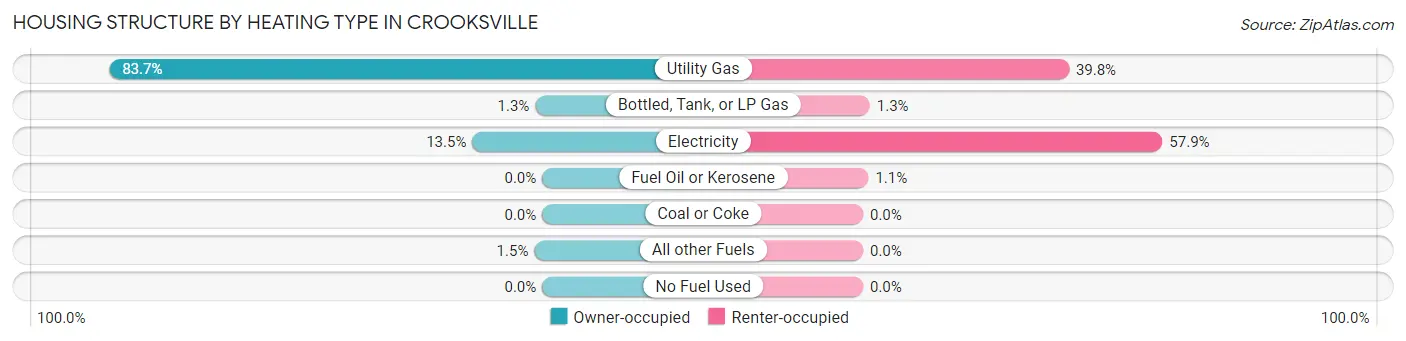
| Heating Type | Owner-occupied | Renter-occupied |
| Utility Gas | 440 (83.7%) | 152 (39.8%) |
| Bottled, Tank, or LP Gas | 7 (1.3%) | 5 (1.3%) |
| Electricity | 71 (13.5%) | 221 (57.9%) |
| Fuel Oil or Kerosene | 0 (0.0%) | 4 (1.1%) |
| Coal or Coke | 0 (0.0%) | 0 (0.0%) |
| All other Fuels | 8 (1.5%) | 0 (0.0%) |
| No Fuel Used | 0 (0.0%) | 0 (0.0%) |
| Total | 526 (100.0%) | 382 (100.0%) |
Household Vehicle Usage in Crooksville
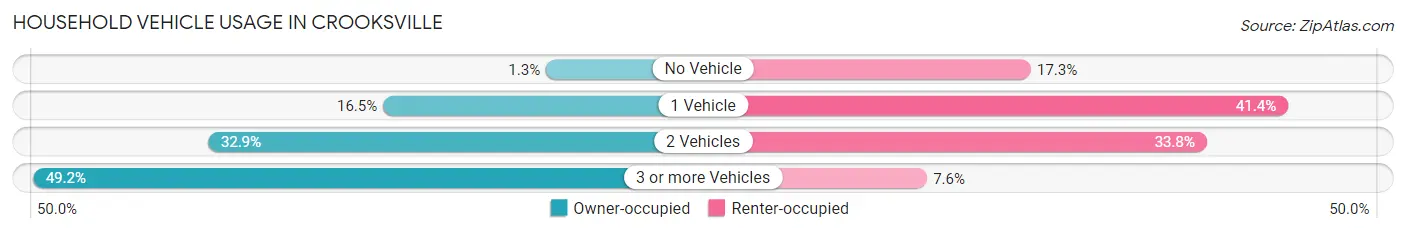
| Vehicles per Household | Owner-occupied | Renter-occupied |
| No Vehicle | 7 (1.3%) | 66 (17.3%) |
| 1 Vehicle | 87 (16.5%) | 158 (41.4%) |
| 2 Vehicles | 173 (32.9%) | 129 (33.8%) |
| 3 or more Vehicles | 259 (49.2%) | 29 (7.6%) |
| Total | 526 (100.0%) | 382 (100.0%) |
Real Estate & Mortgages in Crooksville
Real Estate and Mortgage Overview in Crooksville
| Characteristic | Without Mortgage | With Mortgage |
| Housing Units | 202 | 324 |
| Median Property Value | $70,600 | $93,600 |
| Median Household Income | $42,885 | $23 |
| Monthly Housing Costs | $387 | $0 |
| Real Estate Taxes | $737 | $21 |
Property Value by Mortgage Status in Crooksville
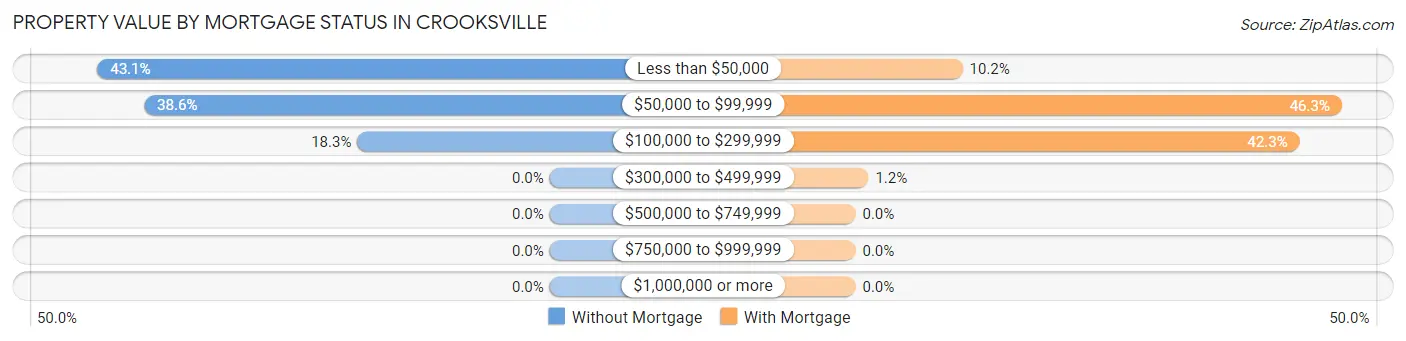
| Property Value | Without Mortgage | With Mortgage |
| Less than $50,000 | 87 (43.1%) | 33 (10.2%) |
| $50,000 to $99,999 | 78 (38.6%) | 150 (46.3%) |
| $100,000 to $299,999 | 37 (18.3%) | 137 (42.3%) |
| $300,000 to $499,999 | 0 (0.0%) | 4 (1.2%) |
| $500,000 to $749,999 | 0 (0.0%) | 0 (0.0%) |
| $750,000 to $999,999 | 0 (0.0%) | 0 (0.0%) |
| $1,000,000 or more | 0 (0.0%) | 0 (0.0%) |
| Total | 202 (100.0%) | 324 (100.0%) |
Household Income by Mortgage Status in Crooksville
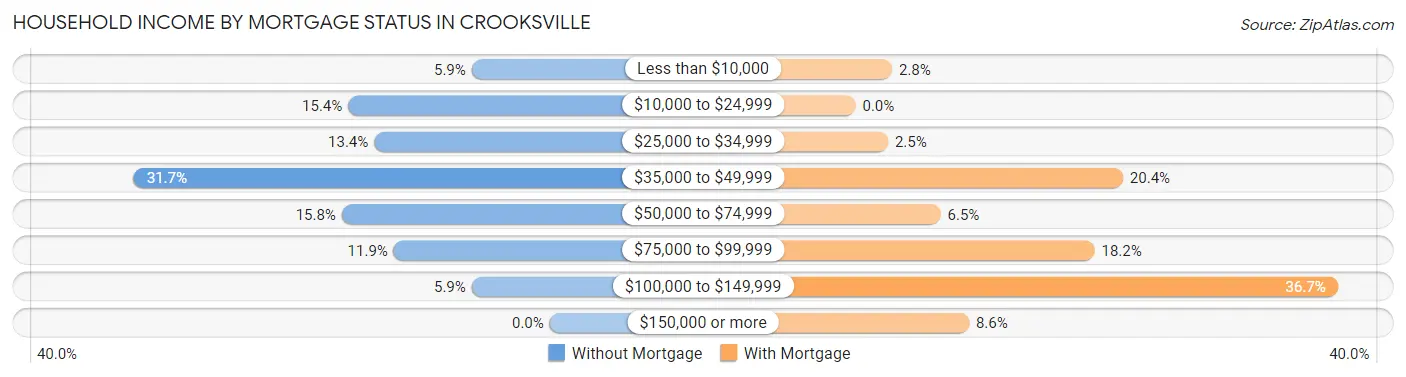
| Household Income | Without Mortgage | With Mortgage |
| Less than $10,000 | 12 (5.9%) | 9 (2.8%) |
| $10,000 to $24,999 | 31 (15.3%) | 0 (0.0%) |
| $25,000 to $34,999 | 27 (13.4%) | 8 (2.5%) |
| $35,000 to $49,999 | 64 (31.7%) | 66 (20.4%) |
| $50,000 to $74,999 | 32 (15.8%) | 21 (6.5%) |
| $75,000 to $99,999 | 24 (11.9%) | 59 (18.2%) |
| $100,000 to $149,999 | 12 (5.9%) | 119 (36.7%) |
| $150,000 or more | 0 (0.0%) | 28 (8.6%) |
| Total | 202 (100.0%) | 324 (100.0%) |
Property Value to Household Income Ratio in Crooksville
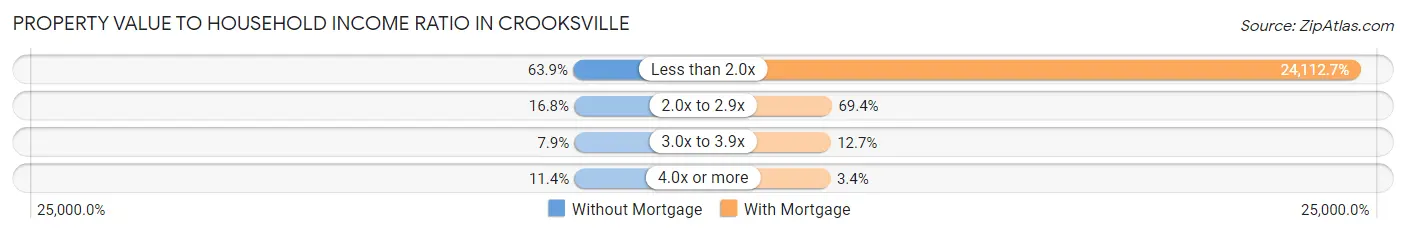
| Value-to-Income Ratio | Without Mortgage | With Mortgage |
| Less than 2.0x | 129 (63.9%) | 78,125 (24,112.6%) |
| 2.0x to 2.9x | 34 (16.8%) | 225 (69.4%) |
| 3.0x to 3.9x | 16 (7.9%) | 41 (12.7%) |
| 4.0x or more | 23 (11.4%) | 11 (3.4%) |
| Total | 202 (100.0%) | 324 (100.0%) |
Real Estate Taxes by Mortgage Status in Crooksville
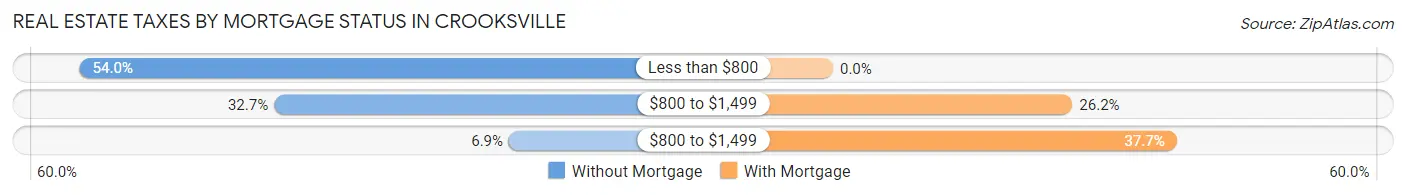
| Property Taxes | Without Mortgage | With Mortgage |
| Less than $800 | 109 (54.0%) | 0 (0.0%) |
| $800 to $1,499 | 66 (32.7%) | 85 (26.2%) |
| $800 to $1,499 | 14 (6.9%) | 122 (37.7%) |
| Total | 202 (100.0%) | 324 (100.0%) |
Health & Disability in Crooksville
Health Insurance Coverage by Age in Crooksville
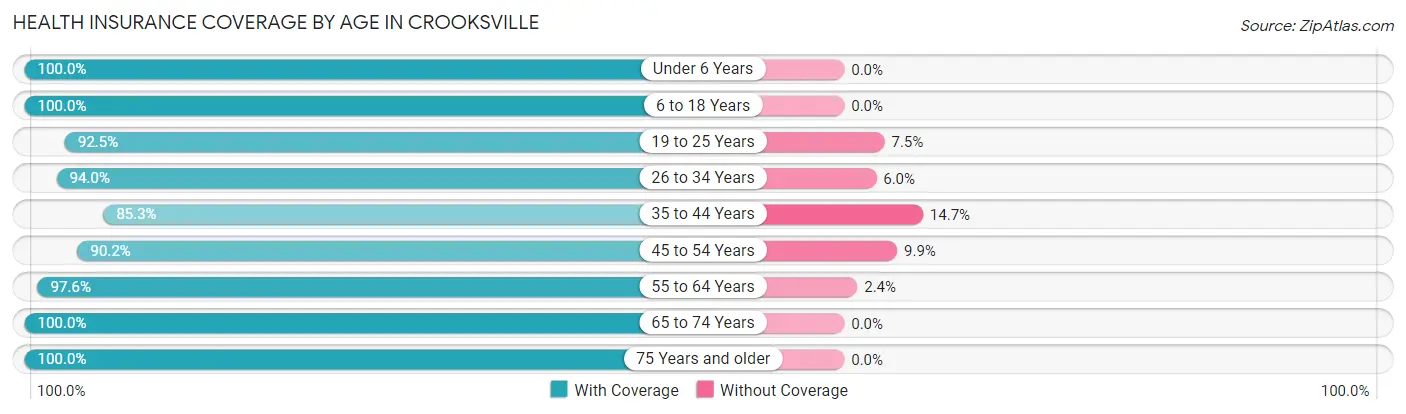
| Age Bracket | With Coverage | Without Coverage |
| Under 6 Years | 156 (100.0%) | 0 (0.0%) |
| 6 to 18 Years | 515 (100.0%) | 0 (0.0%) |
| 19 to 25 Years | 160 (92.5%) | 13 (7.5%) |
| 26 to 34 Years | 221 (94.0%) | 14 (6.0%) |
| 35 to 44 Years | 291 (85.3%) | 50 (14.7%) |
| 45 to 54 Years | 238 (90.1%) | 26 (9.9%) |
| 55 to 64 Years | 323 (97.6%) | 8 (2.4%) |
| 65 to 74 Years | 181 (100.0%) | 0 (0.0%) |
| 75 Years and older | 115 (100.0%) | 0 (0.0%) |
| Total | 2,200 (95.2%) | 111 (4.8%) |
Health Insurance Coverage by Citizenship Status in Crooksville
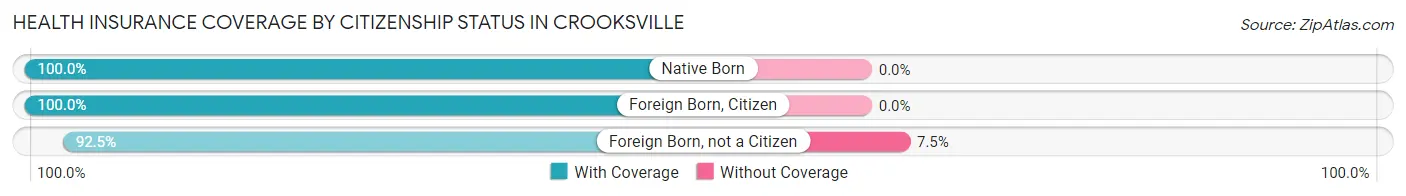
| Citizenship Status | With Coverage | Without Coverage |
| Native Born | 156 (100.0%) | 0 (0.0%) |
| Foreign Born, Citizen | 515 (100.0%) | 0 (0.0%) |
| Foreign Born, not a Citizen | 160 (92.5%) | 13 (7.5%) |
Health Insurance Coverage by Household Income in Crooksville
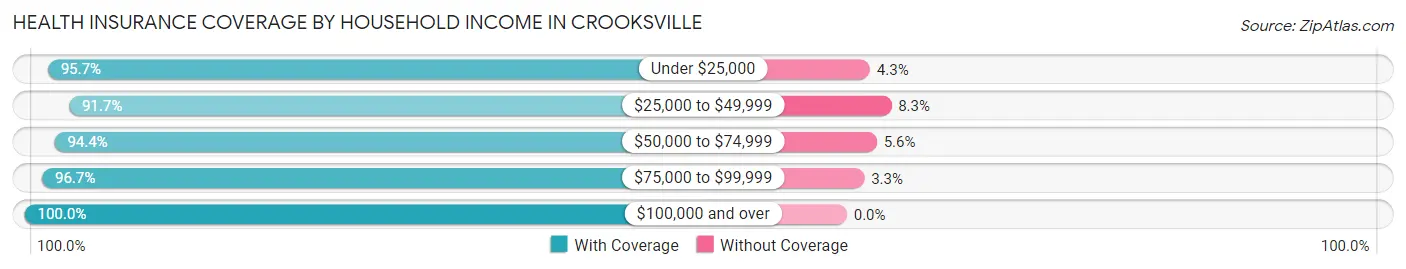
| Household Income | With Coverage | Without Coverage |
| Under $25,000 | 486 (95.7%) | 22 (4.3%) |
| $25,000 to $49,999 | 606 (91.7%) | 55 (8.3%) |
| $50,000 to $74,999 | 236 (94.4%) | 14 (5.6%) |
| $75,000 to $99,999 | 591 (96.7%) | 20 (3.3%) |
| $100,000 and over | 281 (100.0%) | 0 (0.0%) |
Public vs Private Health Insurance Coverage by Age in Crooksville
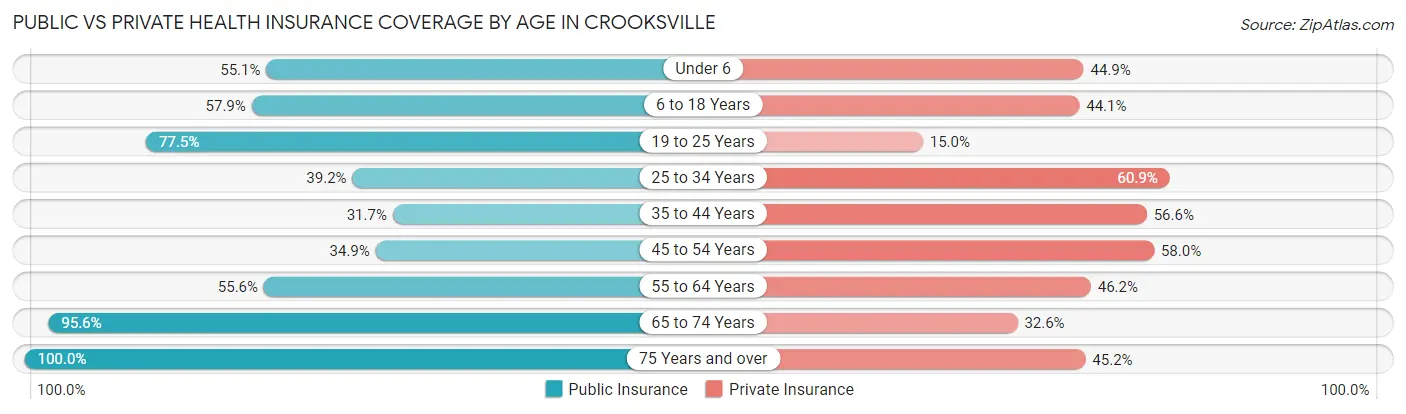
| Age Bracket | Public Insurance | Private Insurance |
| Under 6 | 86 (55.1%) | 70 (44.9%) |
| 6 to 18 Years | 298 (57.9%) | 227 (44.1%) |
| 19 to 25 Years | 134 (77.5%) | 26 (15.0%) |
| 25 to 34 Years | 92 (39.2%) | 143 (60.9%) |
| 35 to 44 Years | 108 (31.7%) | 193 (56.6%) |
| 45 to 54 Years | 92 (34.8%) | 153 (58.0%) |
| 55 to 64 Years | 184 (55.6%) | 153 (46.2%) |
| 65 to 74 Years | 173 (95.6%) | 59 (32.6%) |
| 75 Years and over | 115 (100.0%) | 52 (45.2%) |
| Total | 1,282 (55.5%) | 1,076 (46.6%) |
Disability Status by Sex by Age in Crooksville
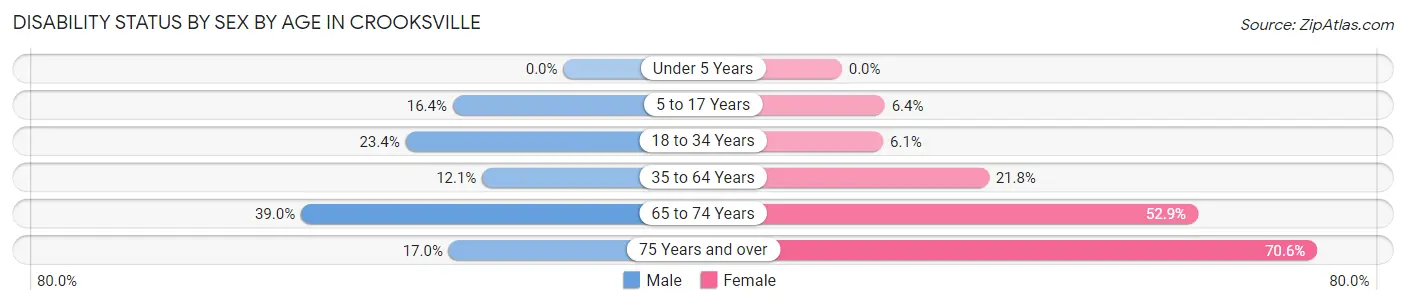
| Age Bracket | Male | Female |
| Under 5 Years | 0 (0.0%) | 0 (0.0%) |
| 5 to 17 Years | 33 (16.4%) | 19 (6.4%) |
| 18 to 34 Years | 45 (23.4%) | 16 (6.1%) |
| 35 to 64 Years | 57 (12.0%) | 101 (21.8%) |
| 65 to 74 Years | 30 (39.0%) | 55 (52.9%) |
| 75 Years and over | 8 (17.0%) | 48 (70.6%) |
Disability Class by Sex by Age in Crooksville
Disability Class: Hearing Difficulty
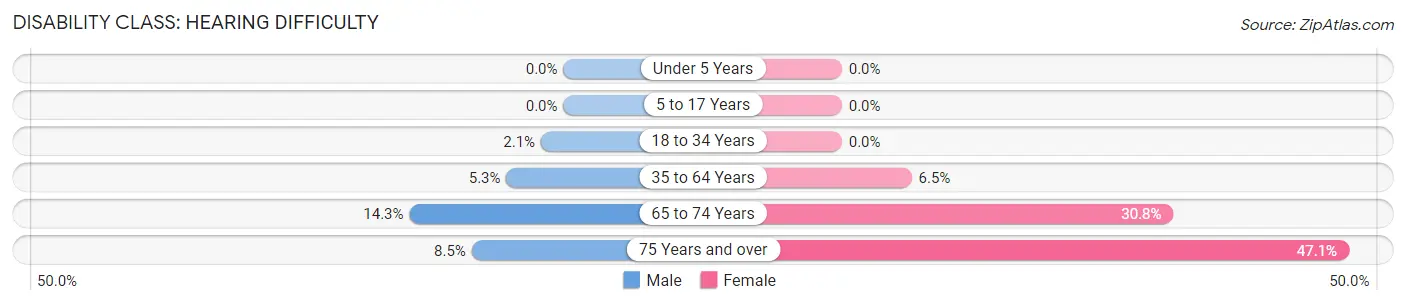
| Age Bracket | Male | Female |
| Under 5 Years | 0 (0.0%) | 0 (0.0%) |
| 5 to 17 Years | 0 (0.0%) | 0 (0.0%) |
| 18 to 34 Years | 4 (2.1%) | 0 (0.0%) |
| 35 to 64 Years | 25 (5.3%) | 30 (6.5%) |
| 65 to 74 Years | 11 (14.3%) | 32 (30.8%) |
| 75 Years and over | 4 (8.5%) | 32 (47.1%) |
Disability Class: Vision Difficulty
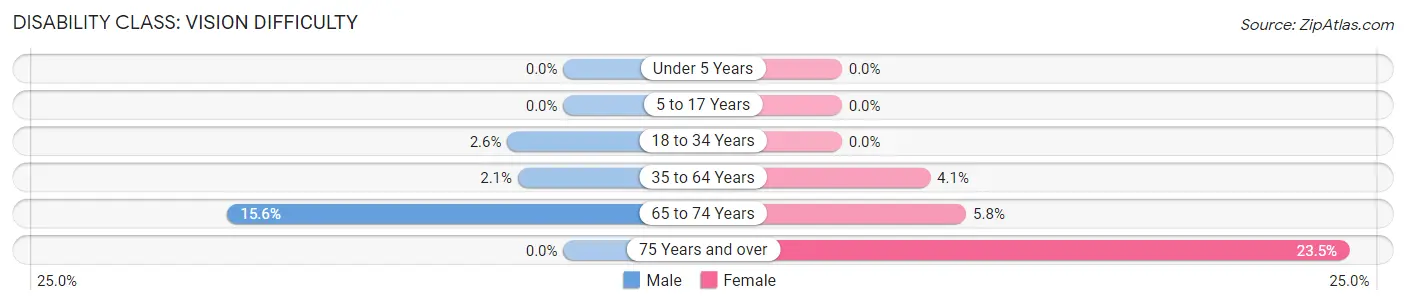
| Age Bracket | Male | Female |
| Under 5 Years | 0 (0.0%) | 0 (0.0%) |
| 5 to 17 Years | 0 (0.0%) | 0 (0.0%) |
| 18 to 34 Years | 5 (2.6%) | 0 (0.0%) |
| 35 to 64 Years | 10 (2.1%) | 19 (4.1%) |
| 65 to 74 Years | 12 (15.6%) | 6 (5.8%) |
| 75 Years and over | 0 (0.0%) | 16 (23.5%) |
Disability Class: Cognitive Difficulty
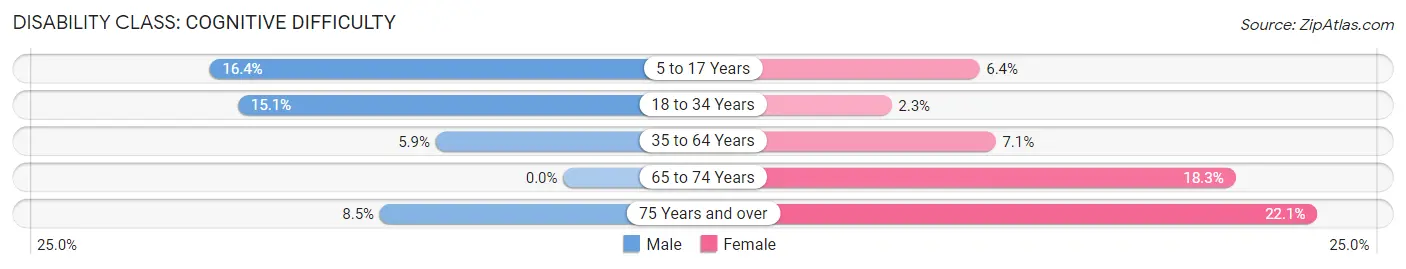
| Age Bracket | Male | Female |
| 5 to 17 Years | 33 (16.4%) | 19 (6.4%) |
| 18 to 34 Years | 29 (15.1%) | 6 (2.3%) |
| 35 to 64 Years | 28 (5.9%) | 33 (7.1%) |
| 65 to 74 Years | 0 (0.0%) | 19 (18.3%) |
| 75 Years and over | 4 (8.5%) | 15 (22.1%) |
Disability Class: Ambulatory Difficulty
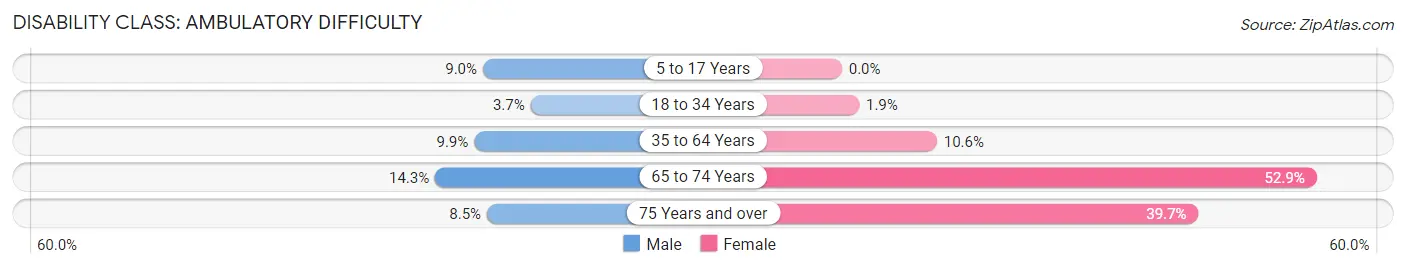
| Age Bracket | Male | Female |
| 5 to 17 Years | 18 (9.0%) | 0 (0.0%) |
| 18 to 34 Years | 7 (3.6%) | 5 (1.9%) |
| 35 to 64 Years | 47 (9.9%) | 49 (10.6%) |
| 65 to 74 Years | 11 (14.3%) | 55 (52.9%) |
| 75 Years and over | 4 (8.5%) | 27 (39.7%) |
Disability Class: Self-Care Difficulty
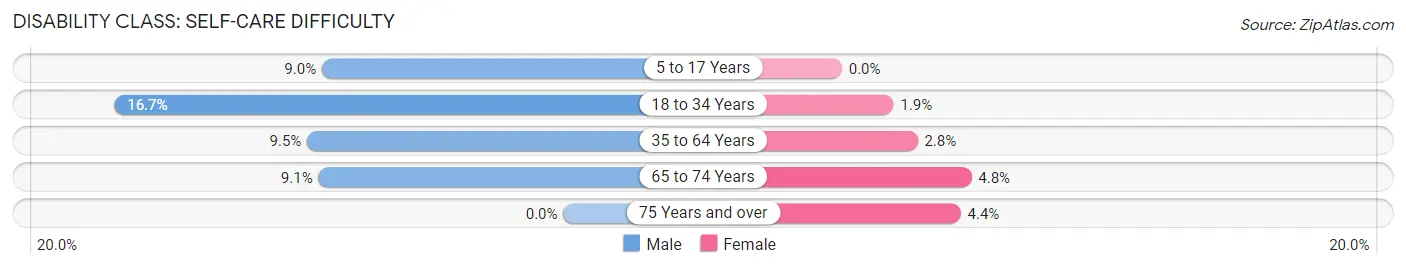
| Age Bracket | Male | Female |
| 5 to 17 Years | 18 (9.0%) | 0 (0.0%) |
| 18 to 34 Years | 32 (16.7%) | 5 (1.9%) |
| 35 to 64 Years | 45 (9.5%) | 13 (2.8%) |
| 65 to 74 Years | 7 (9.1%) | 5 (4.8%) |
| 75 Years and over | 0 (0.0%) | 3 (4.4%) |
Technology Access in Crooksville
Computing Device Access in Crooksville
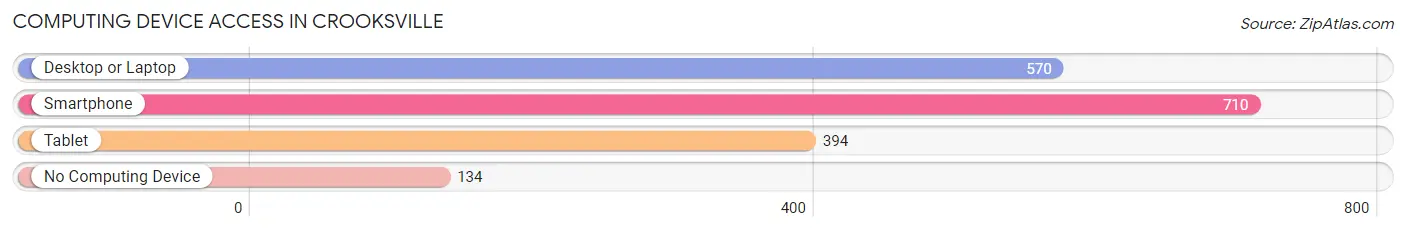
| Device Type | # Households | % Households |
| Desktop or Laptop | 570 | 62.8% |
| Smartphone | 710 | 78.2% |
| Tablet | 394 | 43.4% |
| No Computing Device | 134 | 14.8% |
| Total | 908 | 100.0% |
Internet Access in Crooksville
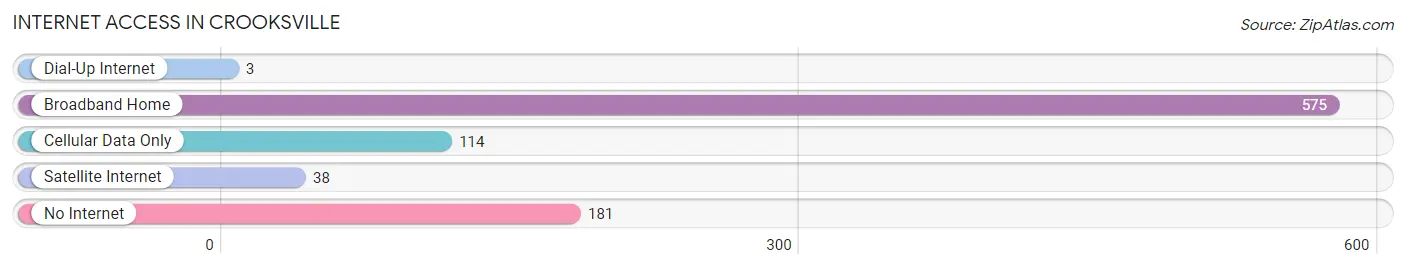
| Internet Type | # Households | % Households |
| Dial-Up Internet | 3 | 0.3% |
| Broadband Home | 575 | 63.3% |
| Cellular Data Only | 114 | 12.6% |
| Satellite Internet | 38 | 4.2% |
| No Internet | 181 | 19.9% |
| Total | 908 | 100.0% |
Crooksville Summary
Crooksville, Ohio is a small village located in Perry County, Ohio. It is situated along the Muskingum River, approximately 25 miles east of Zanesville. The village was founded in 1832 by William Crooks, who named it after himself. The population of Crooksville was 2,072 at the 2010 census.
History
Crooksville was founded in 1832 by William Crooks, who named it after himself. The village was originally known as Crooksville Station, as it was a stop on the Ohio and Erie Canal. The canal was completed in 1832 and provided a transportation route for goods and people between the Ohio River and Lake Erie.
The village was incorporated in 1867 and the first mayor was elected in 1868. The village grew slowly but steadily over the years, and by the early 1900s, it had become a thriving community. The village was home to several businesses, including a brickyard, a pottery factory, a sawmill, and a flour mill.
Geography
Crooksville is located in Perry County, Ohio, approximately 25 miles east of Zanesville. It is situated along the Muskingum River, which is a tributary of the Ohio River. The village is located in the Appalachian Plateau region of Ohio, and is surrounded by rolling hills and forests.
The village has a total area of 1.2 square miles, all of which is land. The climate is humid continental, with hot summers and cold winters. The average annual temperature is 52 degrees Fahrenheit, and the average annual precipitation is 40 inches.
Economy
Crooksville’s economy is largely based on agriculture and manufacturing. The village is home to several small businesses, including a brickyard, a pottery factory, a sawmill, and a flour mill. The village also has a few retail stores, restaurants, and other services.
The village is also home to several large employers, including the Crooksville Clay Company, which produces ceramic products, and the Crooksville Foundry, which produces cast iron products. The village is also home to several small manufacturing companies, including a plastics manufacturer and a metal fabricator.
Demographics
As of the 2010 census, the population of Crooksville was 2,072. The racial makeup of the village was 97.3% White, 0.7% African American, 0.2% Native American, 0.2% Asian, 0.2% from other races, and 1.6% from two or more races. Hispanic or Latino of any race were 0.7% of the population.
The median income for a household in the village was $31,250, and the median income for a family was $41,250. The per capita income for the village was $17,845. About 16.2% of families and 19.2% of the population were below the poverty line, including 28.3% of those under age 18 and 8.3% of those age 65 or over.
Conclusion
Crooksville, Ohio is a small village located in Perry County, Ohio. It was founded in 1832 by William Crooks and has a population of 2,072 as of the 2010 census. The village is situated along the Muskingum River and is surrounded by rolling hills and forests. The economy of Crooksville is largely based on agriculture and manufacturing, and the village is home to several small businesses, large employers, and other services. The racial makeup of the village is 97.3% White, 0.7% African American, 0.2% Native American, 0.2% Asian, 0.2% from other races, and 1.6% from two or more races. The median income for a household in the village was $31,250, and the median income for a family was $41,250.
Common Questions
What is Per Capita Income in Crooksville?
Per Capita income in Crooksville is $20,205.
What is the Median Family Income in Crooksville?
Median Family Income in Crooksville is $62,946.
What is the Median Household income in Crooksville?
Median Household Income in Crooksville is $42,348.
What is Income or Wage Gap in Crooksville?
Income or Wage Gap in Crooksville is 58.1%.
Women in Crooksville earn 41.9 cents for every dollar earned by a man.
What is Inequality or Gini Index in Crooksville?
Inequality or Gini Index in Crooksville is 0.41.
What is the Total Population of Crooksville?
Total Population of Crooksville is 2,311.
What is the Total Male Population of Crooksville?
Total Male Population of Crooksville is 1,060.
What is the Total Female Population of Crooksville?
Total Female Population of Crooksville is 1,251.
What is the Ratio of Males per 100 Females in Crooksville?
There are 84.73 Males per 100 Females in Crooksville.
What is the Ratio of Females per 100 Males in Crooksville?
There are 118.02 Females per 100 Males in Crooksville.
What is the Median Population Age in Crooksville?
Median Population Age in Crooksville is 36.7 Years.
What is the Average Family Size in Crooksville
Average Family Size in Crooksville is 3.0 People.
What is the Average Household Size in Crooksville
Average Household Size in Crooksville is 2.5 People.
How Large is the Labor Force in Crooksville?
There are 871 People in the Labor Forcein in Crooksville.
What is the Percentage of People in the Labor Force in Crooksville?
50.3% of People are in the Labor Force in Crooksville.
What is the Unemployment Rate in Crooksville?
Unemployment Rate in Crooksville is 4.8%.