Covington, OH Map & Demographics
Covington Map
Covington Overview
$29,953
PER CAPITA INCOME
$74,722
AVG FAMILY INCOME
$55,000
AVG HOUSEHOLD INCOME
56.4%
WAGE / INCOME GAP [ % ]
43.6¢/ $1
WAGE / INCOME GAP [ $ ]
0.39
INEQUALITY / GINI INDEX
2,561
TOTAL POPULATION
1,151
MALE POPULATION
1,410
FEMALE POPULATION
81.63
MALES / 100 FEMALES
122.50
FEMALES / 100 MALES
40.0
MEDIAN AGE
3.1
AVG FAMILY SIZE
2.3
AVG HOUSEHOLD SIZE
1,186
LABOR FORCE [ PEOPLE ]
58.9%
PERCENT IN LABOR FORCE
3.3%
UNEMPLOYMENT RATE
Covington Zip Codes
Covington Area Codes
Income in Covington
Income Overview in Covington
Per Capita Income in Covington is $29,953, while median incomes of families and households are $74,722 and $55,000 respectively.
| Characteristic | Number | Measure |
| Per Capita Income | 2,561 | $29,953 |
| Median Family Income | 610 | $74,722 |
| Mean Family Income | 610 | $84,140 |
| Median Household Income | 1,096 | $55,000 |
| Mean Household Income | 1,096 | $66,600 |
| Income Deficit | 610 | $0 |
| Wage / Income Gap (%) | 2,561 | 56.44% |
| Wage / Income Gap ($) | 2,561 | 43.56¢ per $1 |
| Gini / Inequality Index | 2,561 | 0.39 |
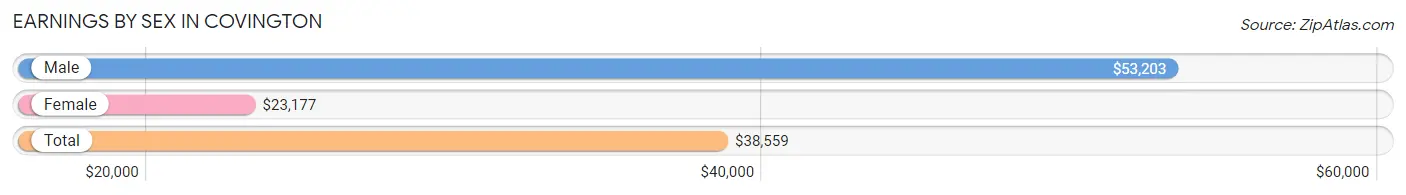
Earnings by Sex in Covington
Average Earnings in Covington are $38,559, $53,203 for men and $23,177 for women, a difference of 56.4%.
| Sex | Number | Average Earnings |
| Male | 609 (45.5%) | $53,203 |
| Female | 731 (54.5%) | $23,177 |
| Total | 1,340 (100.0%) | $38,559 |
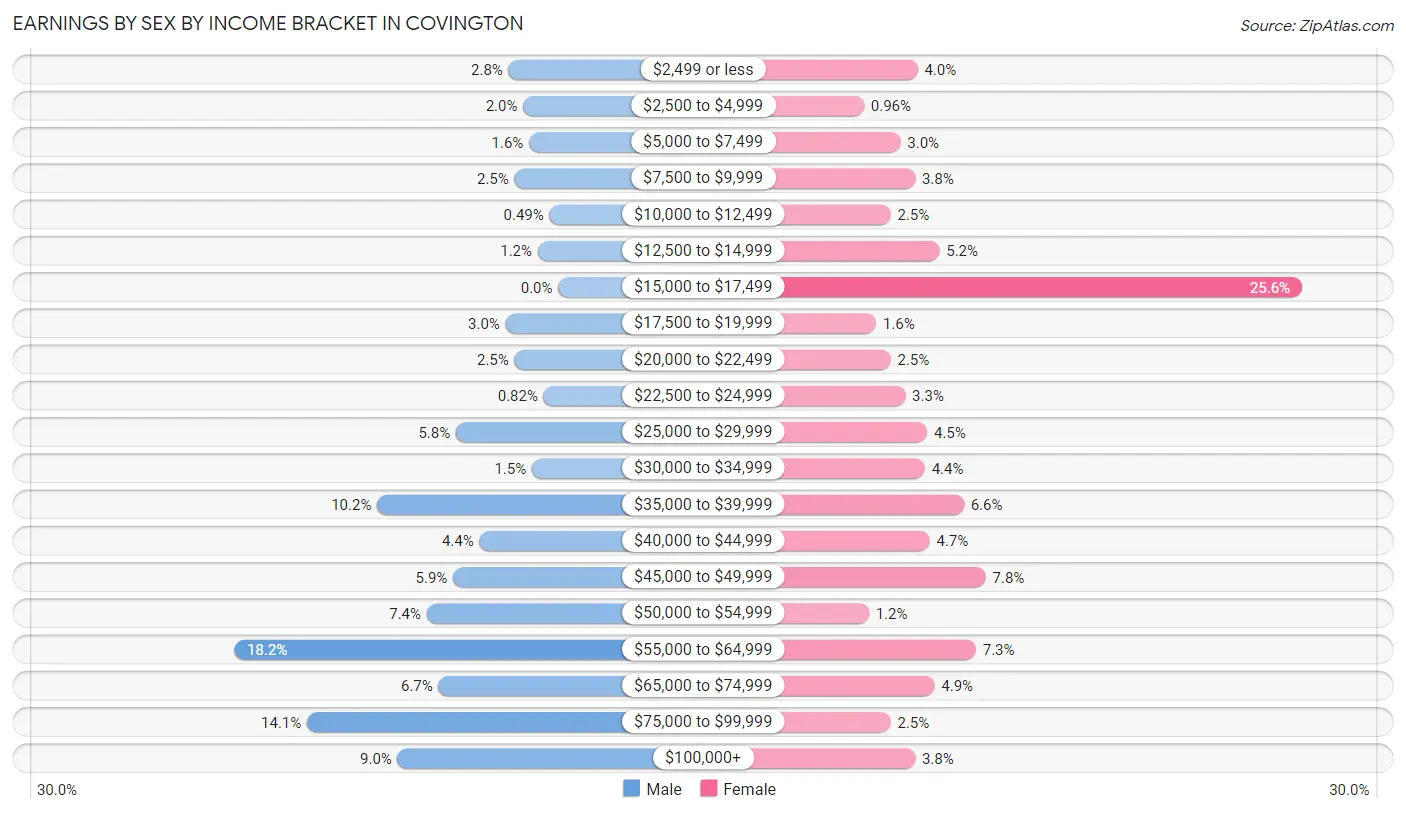
Earnings by Sex by Income Bracket in Covington
The most common earnings brackets in Covington are $55,000 to $64,999 for men (111 | 18.2%) and $15,000 to $17,499 for women (187 | 25.6%).
| Income | Male | Female |
| $2,499 or less | 17 (2.8%) | 29 (4.0%) |
| $2,500 to $4,999 | 12 (2.0%) | 7 (1.0%) |
| $5,000 to $7,499 | 10 (1.6%) | 22 (3.0%) |
| $7,500 to $9,999 | 15 (2.5%) | 28 (3.8%) |
| $10,000 to $12,499 | 3 (0.5%) | 18 (2.5%) |
| $12,500 to $14,999 | 7 (1.1%) | 38 (5.2%) |
| $15,000 to $17,499 | 0 (0.0%) | 187 (25.6%) |
| $17,500 to $19,999 | 18 (3.0%) | 12 (1.6%) |
| $20,000 to $22,499 | 15 (2.5%) | 18 (2.5%) |
| $22,500 to $24,999 | 5 (0.8%) | 24 (3.3%) |
| $25,000 to $29,999 | 35 (5.8%) | 33 (4.5%) |
| $30,000 to $34,999 | 9 (1.5%) | 32 (4.4%) |
| $35,000 to $39,999 | 62 (10.2%) | 48 (6.6%) |
| $40,000 to $44,999 | 27 (4.4%) | 34 (4.6%) |
| $45,000 to $49,999 | 36 (5.9%) | 57 (7.8%) |
| $50,000 to $54,999 | 45 (7.4%) | 9 (1.2%) |
| $55,000 to $64,999 | 111 (18.2%) | 53 (7.2%) |
| $65,000 to $74,999 | 41 (6.7%) | 36 (4.9%) |
| $75,000 to $99,999 | 86 (14.1%) | 18 (2.5%) |
| $100,000+ | 55 (9.0%) | 28 (3.8%) |
| Total | 609 (100.0%) | 731 (100.0%) |
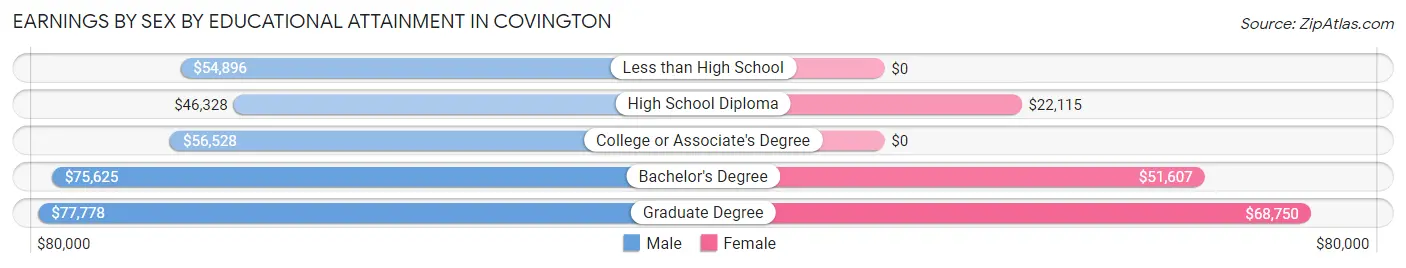
Earnings by Sex by Educational Attainment in Covington
Average earnings in Covington are $55,481 for men and $27,411 for women, a difference of 50.6%. Men with an educational attainment of graduate degree enjoy the highest average annual earnings of $77,778, while those with high school diploma education earn the least with $46,328. Women with an educational attainment of graduate degree earn the most with the average annual earnings of $68,750, while those with high school diploma education have the smallest earnings of $22,115.
| Educational Attainment | Male Income | Female Income |
| Less than High School | $54,896 | $0 |
| High School Diploma | $46,328 | $22,115 |
| College or Associate's Degree | $56,528 | $0 |
| Bachelor's Degree | $75,625 | $51,607 |
| Graduate Degree | $77,778 | $68,750 |
| Total | $55,481 | $27,411 |
Family Income in Covington
Family Income Brackets in Covington
According to the Covington family income data, there are 143 families falling into the $100,000 to $149,999 income range, which is the most common income bracket and makes up 23.4% of all families.
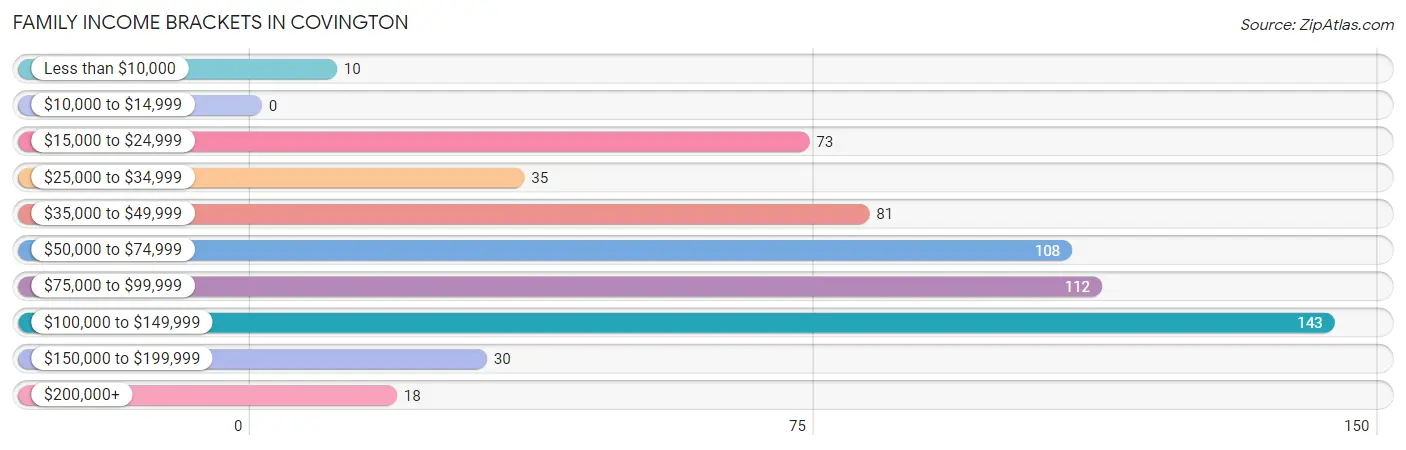
| Income Bracket | # Families | % Families |
| Less than $10,000 | 10 | 1.6% |
| $10,000 to $14,999 | 0 | 0.0% |
| $15,000 to $24,999 | 73 | 12.0% |
| $25,000 to $34,999 | 35 | 5.7% |
| $35,000 to $49,999 | 81 | 13.3% |
| $50,000 to $74,999 | 108 | 17.7% |
| $75,000 to $99,999 | 112 | 18.4% |
| $100,000 to $149,999 | 143 | 23.4% |
| $150,000 to $199,999 | 30 | 4.9% |
| $200,000+ | 18 | 3.0% |
Family Income by Famaliy Size in Covington
6-person families (16 | 2.6%) account for the highest median family income in Covington with $177,500 per family, while 6-person families (16 | 2.6%) have the highest median income of $29,583 per family member.
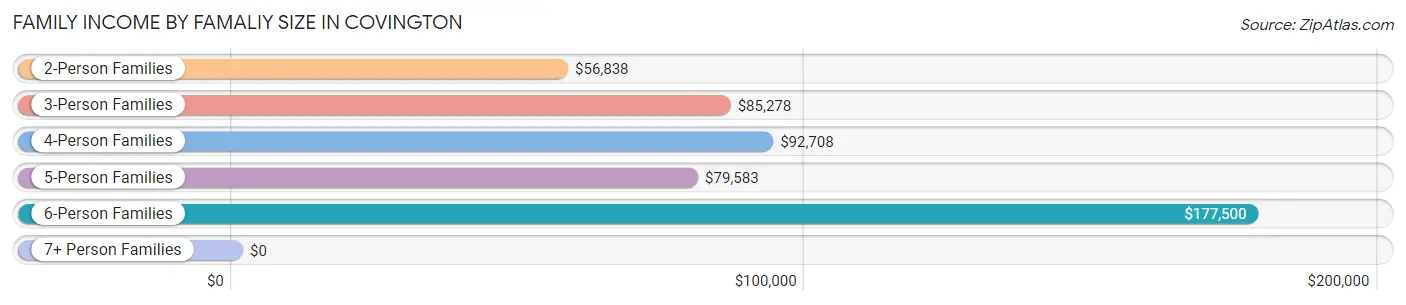
| Income Bracket | # Families | Median Income |
| 2-Person Families | 321 (52.6%) | $56,838 |
| 3-Person Families | 106 (17.4%) | $85,278 |
| 4-Person Families | 91 (14.9%) | $92,708 |
| 5-Person Families | 66 (10.8%) | $79,583 |
| 6-Person Families | 16 (2.6%) | $177,500 |
| 7+ Person Families | 10 (1.6%) | $0 |
| Total | 610 (100.0%) | $74,722 |
Family Income by Number of Earners in Covington
The median family income in Covington is $74,722, with families comprising 3+ earners (45) having the highest median family income of $148,393, while families with no earners (90) have the lowest median family income of $42,273, accounting for 7.4% and 14.7% of families, respectively.
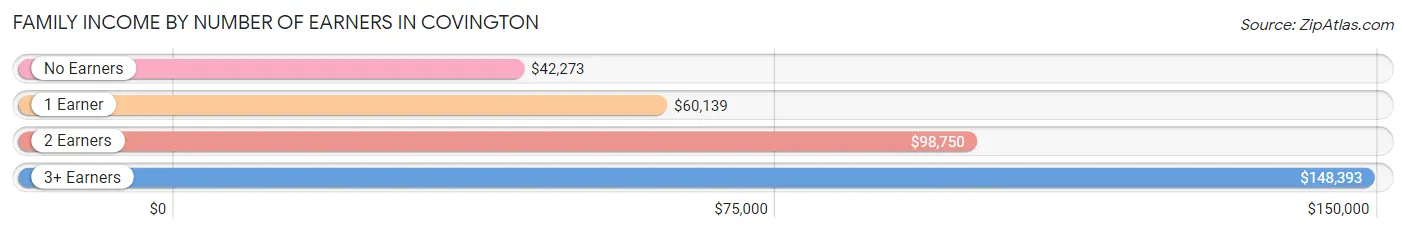
| Number of Earners | # Families | Median Income |
| No Earners | 90 (14.7%) | $42,273 |
| 1 Earner | 191 (31.3%) | $60,139 |
| 2 Earners | 284 (46.6%) | $98,750 |
| 3+ Earners | 45 (7.4%) | $148,393 |
| Total | 610 (100.0%) | $74,722 |
Household Income in Covington
Household Income Brackets in Covington
With 175 households falling in the category, the $100,000 to $149,999 income range is the most frequent in Covington, accounting for 16.0% of all households. In contrast, only 16 households (1.5%) fall into the $10,000 to $14,999 income bracket, making it the least populous group.
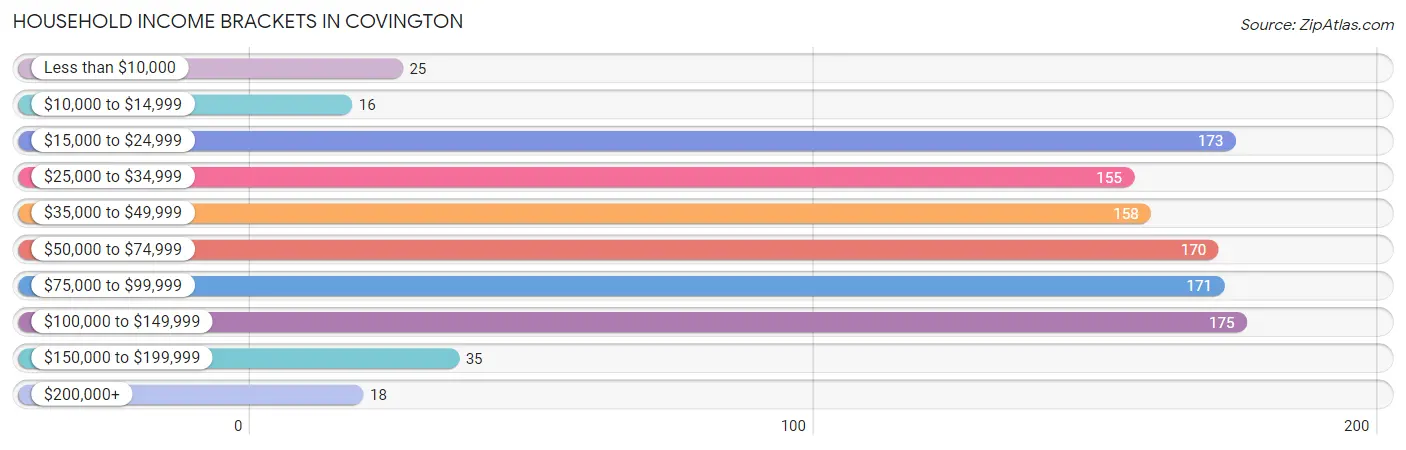
| Income Bracket | # Households | % Households |
| Less than $10,000 | 25 | 2.3% |
| $10,000 to $14,999 | 16 | 1.5% |
| $15,000 to $24,999 | 173 | 15.8% |
| $25,000 to $34,999 | 155 | 14.1% |
| $35,000 to $49,999 | 158 | 14.4% |
| $50,000 to $74,999 | 170 | 15.5% |
| $75,000 to $99,999 | 171 | 15.6% |
| $100,000 to $149,999 | 175 | 16.0% |
| $150,000 to $199,999 | 35 | 3.2% |
| $200,000+ | 18 | 1.6% |
Household Income by Householder Age in Covington
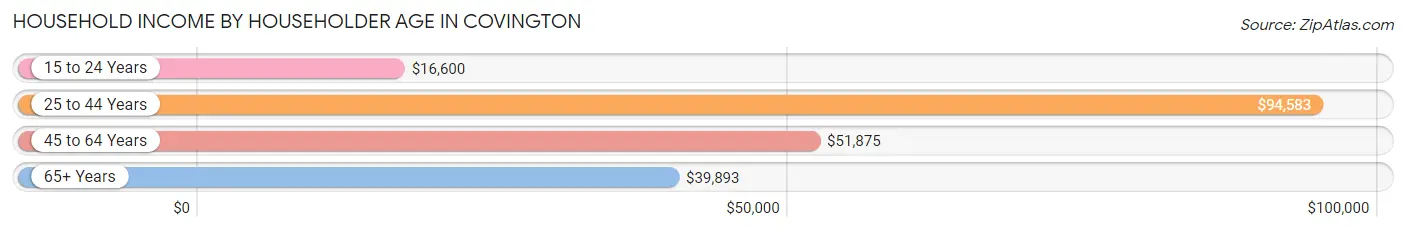
The median household income in Covington is $55,000, with the highest median household income of $94,583 found in the 25 to 44 years age bracket for the primary householder. A total of 314 households (28.6%) fall into this category. Meanwhile, the 15 to 24 years age bracket for the primary householder has the lowest median household income of $16,600, with 44 households (4.0%) in this group.
| Income Bracket | # Households | Median Income |
| 15 to 24 Years | 44 (4.0%) | $16,600 |
| 25 to 44 Years | 314 (28.6%) | $94,583 |
| 45 to 64 Years | 411 (37.5%) | $51,875 |
| 65+ Years | 327 (29.8%) | $39,893 |
| Total | 1,096 (100.0%) | $55,000 |
Poverty in Covington
Income Below Poverty by Sex and Age in Covington
With 8.3% poverty level for males and 9.6% for females among the residents of Covington, 12 to 14 year old males and 12 to 14 year old females are the most vulnerable to poverty, with 15 males (21.1%) and 13 females (34.2%) in their respective age groups living below the poverty level.
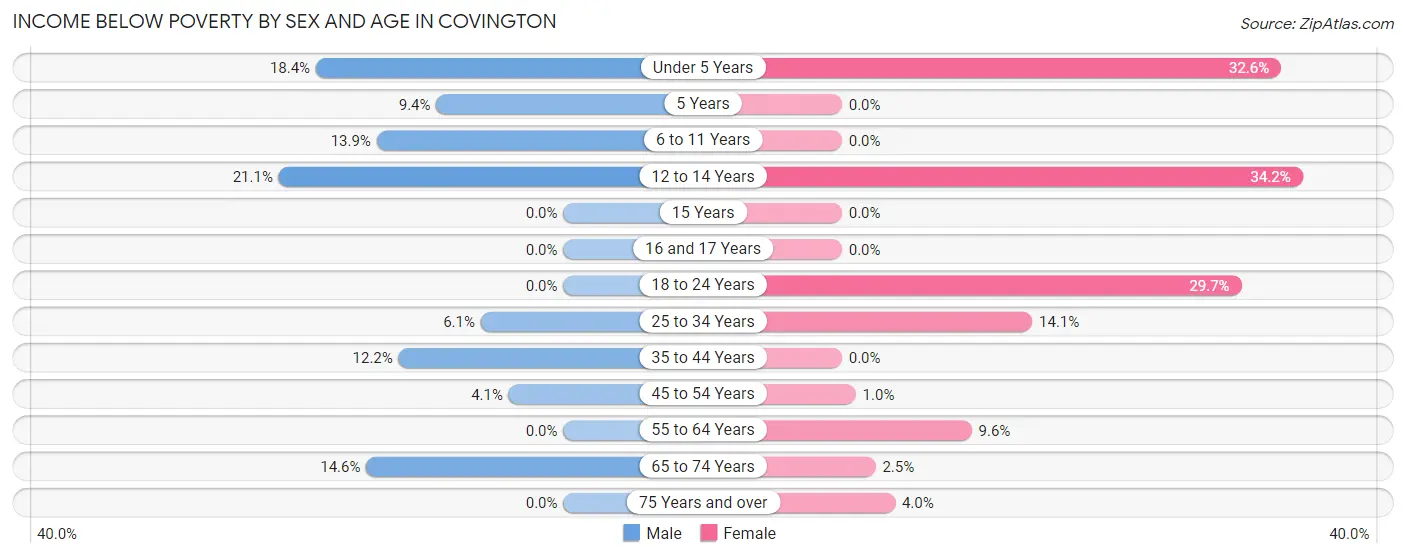
| Age Bracket | Male | Female |
| Under 5 Years | 9 (18.4%) | 45 (32.6%) |
| 5 Years | 5 (9.4%) | 0 (0.0%) |
| 6 to 11 Years | 14 (13.9%) | 0 (0.0%) |
| 12 to 14 Years | 15 (21.1%) | 13 (34.2%) |
| 15 Years | 0 (0.0%) | 0 (0.0%) |
| 16 and 17 Years | 0 (0.0%) | 0 (0.0%) |
| 18 to 24 Years | 0 (0.0%) | 27 (29.7%) |
| 25 to 34 Years | 13 (6.1%) | 26 (14.1%) |
| 35 to 44 Years | 17 (12.2%) | 0 (0.0%) |
| 45 to 54 Years | 6 (4.1%) | 3 (1.0%) |
| 55 to 64 Years | 0 (0.0%) | 8 (9.6%) |
| 65 to 74 Years | 12 (14.6%) | 4 (2.5%) |
| 75 Years and over | 0 (0.0%) | 6 (4.0%) |
| Total | 91 (8.3%) | 132 (9.6%) |
Income Above Poverty by Sex and Age in Covington
According to the poverty statistics in Covington, males aged 16 and 17 years and females aged 6 to 11 years are the age groups that are most secure financially, with 100.0% of males and 100.0% of females in these age groups living above the poverty line.
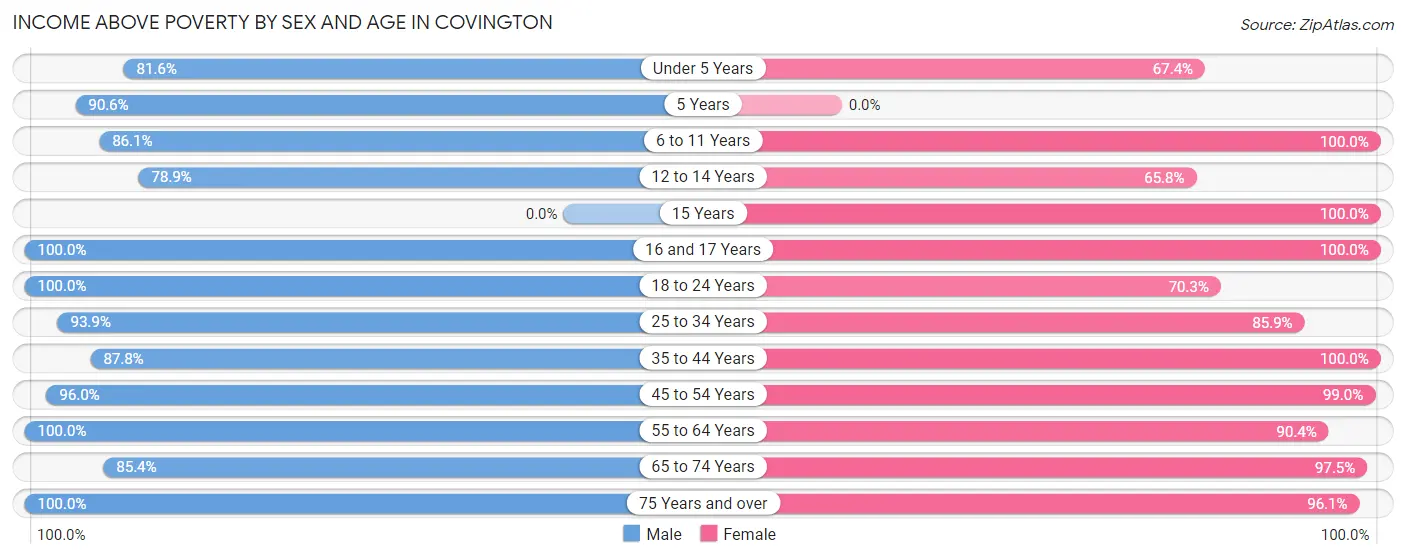
| Age Bracket | Male | Female |
| Under 5 Years | 40 (81.6%) | 93 (67.4%) |
| 5 Years | 48 (90.6%) | 0 (0.0%) |
| 6 to 11 Years | 87 (86.1%) | 78 (100.0%) |
| 12 to 14 Years | 56 (78.9%) | 25 (65.8%) |
| 15 Years | 0 (0.0%) | 7 (100.0%) |
| 16 and 17 Years | 37 (100.0%) | 11 (100.0%) |
| 18 to 24 Years | 32 (100.0%) | 64 (70.3%) |
| 25 to 34 Years | 199 (93.9%) | 158 (85.9%) |
| 35 to 44 Years | 122 (87.8%) | 144 (100.0%) |
| 45 to 54 Years | 142 (96.0%) | 287 (99.0%) |
| 55 to 64 Years | 124 (100.0%) | 75 (90.4%) |
| 65 to 74 Years | 70 (85.4%) | 156 (97.5%) |
| 75 Years and over | 52 (100.0%) | 146 (96.1%) |
| Total | 1,009 (91.7%) | 1,244 (90.4%) |
Income Below Poverty Among Married-Couple Families in Covington
The poverty statistics for married-couple families in Covington show that 4.7% or 21 of the total 447 families live below the poverty line. Families with 5 or more children have the highest poverty rate of 100.0%, comprising of 10 families. On the other hand, families with no children have the lowest poverty rate of 0.0%, which includes 0 families.
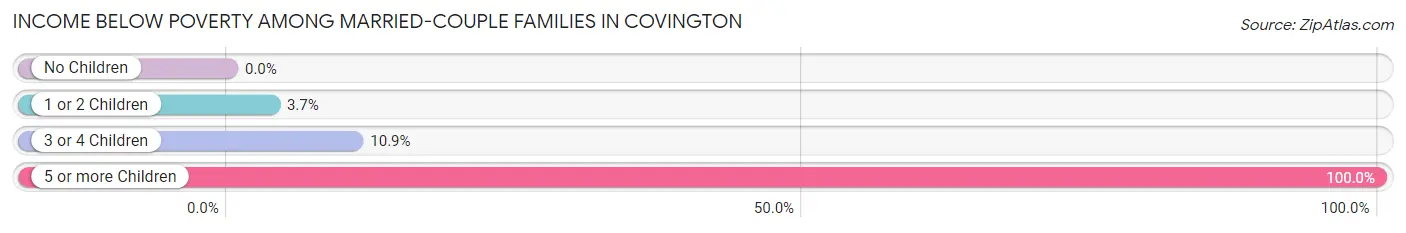
| Children | Above Poverty | Below Poverty |
| No Children | 245 (100.0%) | 0 (0.0%) |
| 1 or 2 Children | 132 (96.4%) | 5 (3.6%) |
| 3 or 4 Children | 49 (89.1%) | 6 (10.9%) |
| 5 or more Children | 0 (0.0%) | 10 (100.0%) |
| Total | 426 (95.3%) | 21 (4.7%) |
Income Below Poverty Among Single-Parent Households in Covington
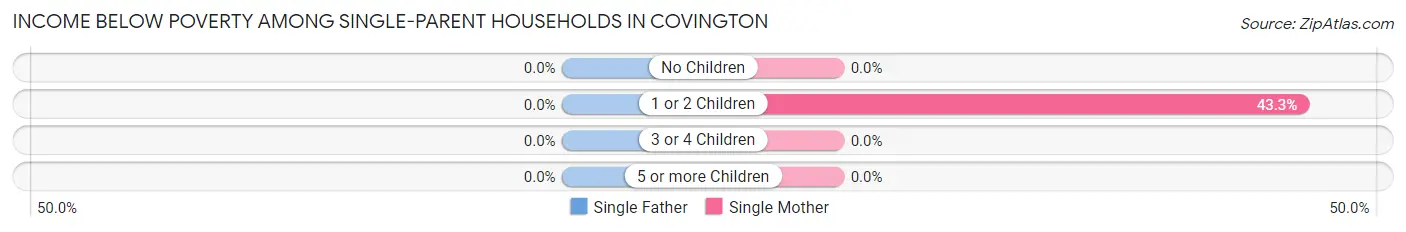
| Children | Single Father | Single Mother |
| No Children | 0 (0.0%) | 0 (0.0%) |
| 1 or 2 Children | 0 (0.0%) | 26 (43.3%) |
| 3 or 4 Children | 0 (0.0%) | 0 (0.0%) |
| 5 or more Children | 0 (0.0%) | 0 (0.0%) |
| Total | 0 (0.0%) | 26 (17.4%) |
Income Below Poverty Among Married-Couple vs Single-Parent Households in Covington
The poverty data for Covington shows that 21 of the married-couple family households (4.7%) and 26 of the single-parent households (16.0%) are living below the poverty level. Within the married-couple family households, those with 5 or more children have the highest poverty rate, with 10 households (100.0%) falling below the poverty line. Among the single-parent households, those with 1 or 2 children have the highest poverty rate, with 26 household (37.7%) living below poverty.
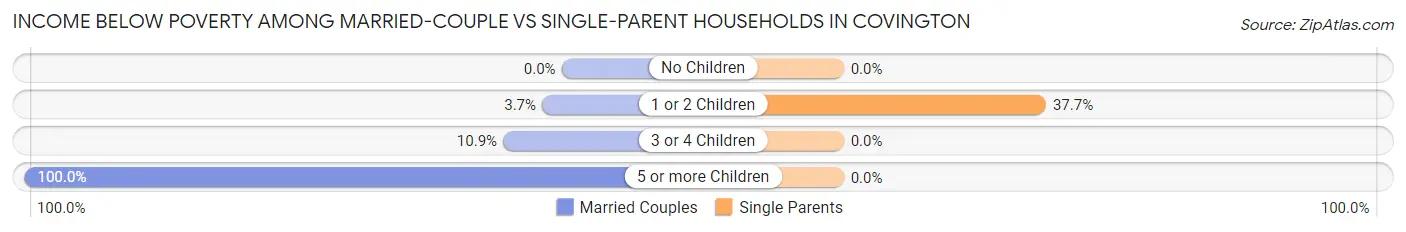
| Children | Married-Couple Families | Single-Parent Households |
| No Children | 0 (0.0%) | 0 (0.0%) |
| 1 or 2 Children | 5 (3.6%) | 26 (37.7%) |
| 3 or 4 Children | 6 (10.9%) | 0 (0.0%) |
| 5 or more Children | 10 (100.0%) | 0 (0.0%) |
| Total | 21 (4.7%) | 26 (16.0%) |
Race in Covington
The most populous races in Covington are White / Caucasian (2,502 | 97.7%), Two or more Races (31 | 1.2%), and Black / African American (28 | 1.1%).
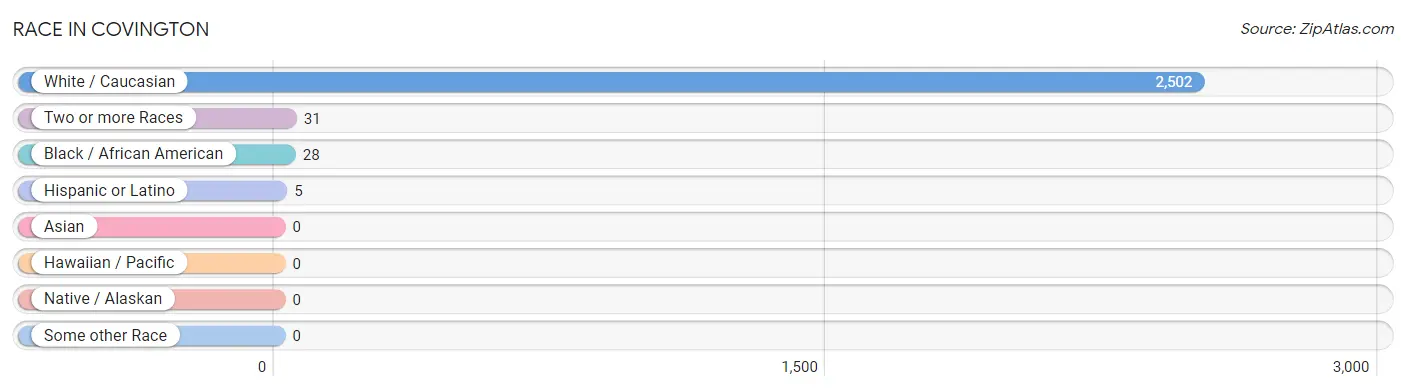
| Race | # Population | % Population |
| Asian | 0 | 0.0% |
| Black / African American | 28 | 1.1% |
| Hawaiian / Pacific | 0 | 0.0% |
| Hispanic or Latino | 5 | 0.2% |
| Native / Alaskan | 0 | 0.0% |
| White / Caucasian | 2,502 | 97.7% |
| Two or more Races | 31 | 1.2% |
| Some other Race | 0 | 0.0% |
| Total | 2,561 | 100.0% |
Ancestry in Covington
The most populous ancestries reported in Covington are German (646 | 25.2%), Irish (340 | 13.3%), American (244 | 9.5%), English (149 | 5.8%), and Polish (55 | 2.1%), together accounting for 56.0% of all Covington residents.
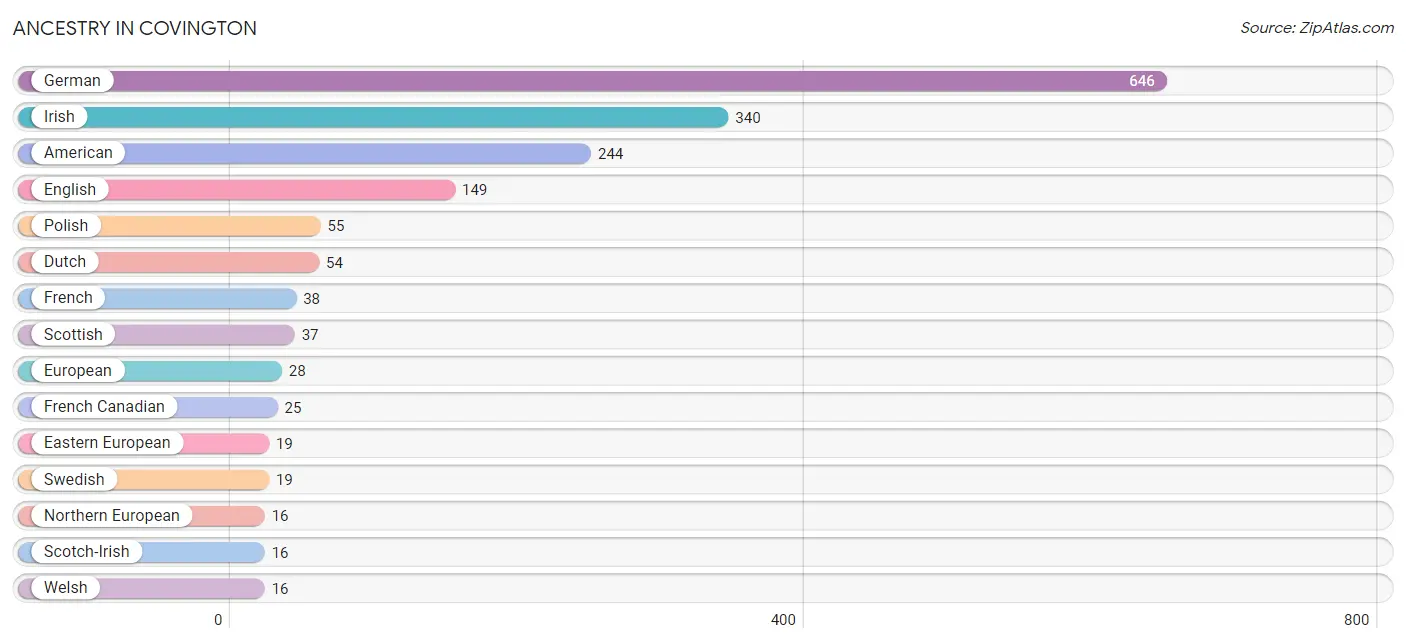
| Ancestry | # Population | % Population |
| American | 244 | 9.5% |
| British | 10 | 0.4% |
| Canadian | 2 | 0.1% |
| Cuban | 5 | 0.2% |
| Dutch | 54 | 2.1% |
| Eastern European | 19 | 0.7% |
| English | 149 | 5.8% |
| European | 28 | 1.1% |
| French | 38 | 1.5% |
| French Canadian | 25 | 1.0% |
| German | 646 | 25.2% |
| Hungarian | 3 | 0.1% |
| Irish | 340 | 13.3% |
| Italian | 6 | 0.2% |
| Lumbee | 7 | 0.3% |
| Northern European | 16 | 0.6% |
| Polish | 55 | 2.1% |
| Scotch-Irish | 16 | 0.6% |
| Scottish | 37 | 1.4% |
| Swedish | 19 | 0.7% |
| Swiss | 7 | 0.3% |
| Welsh | 16 | 0.6% | View All 22 Rows |
Immigrants in Covington
The most numerous immigrant groups reported in Covington came from Eastern Europe (7 | 0.3%), Europe (7 | 0.3%), and Poland (7 | 0.3%), together accounting for 0.8% of all Covington residents.
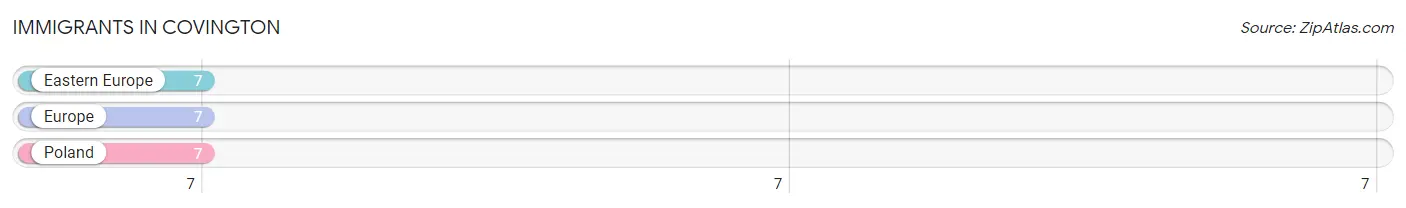
| Immigration Origin | # Population | % Population |
| Eastern Europe | 7 | 0.3% |
| Europe | 7 | 0.3% |
| Poland | 7 | 0.3% | View All 3 Rows |
Sex and Age in Covington
Sex and Age in Covington
The most populous age groups in Covington are 30 to 34 Years (127 | 11.0%) for men and 50 to 54 Years (201 | 14.3%) for women.
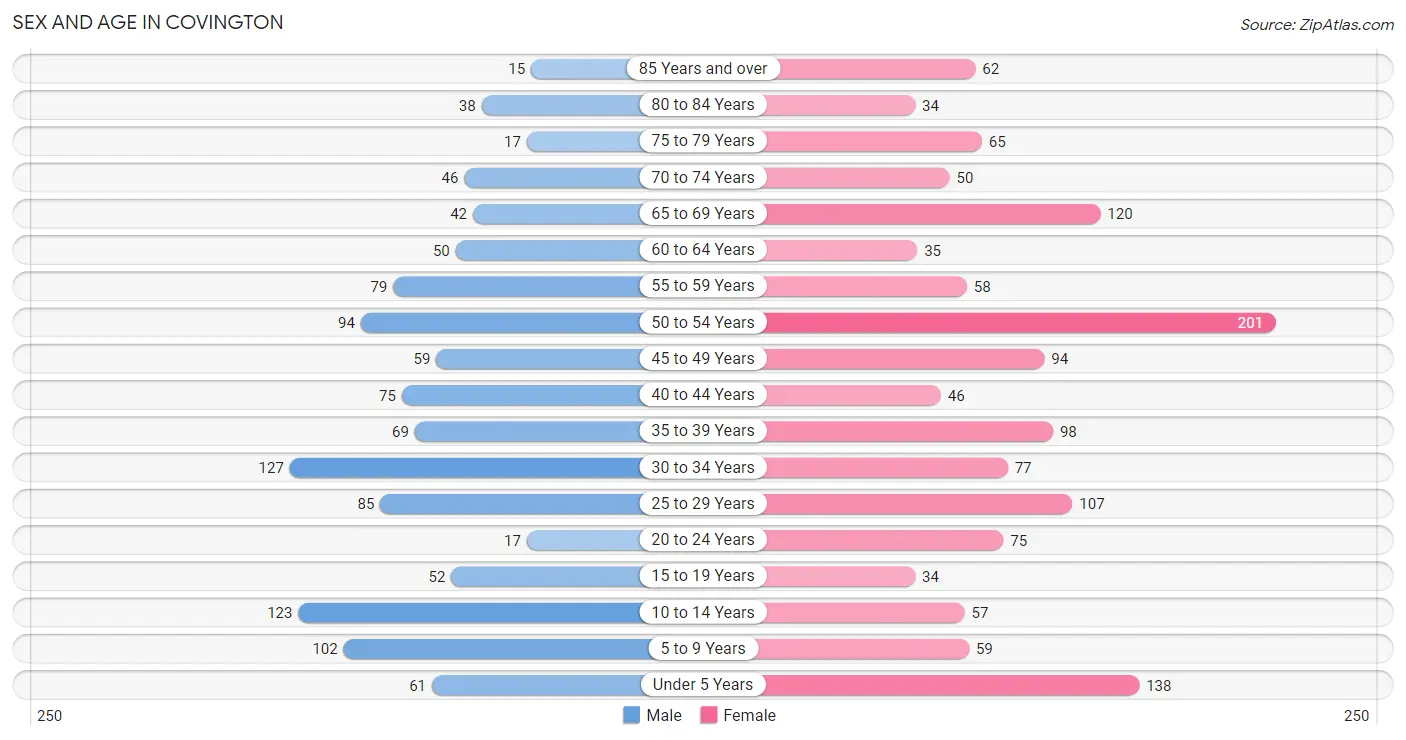
| Age Bracket | Male | Female |
| Under 5 Years | 61 (5.3%) | 138 (9.8%) |
| 5 to 9 Years | 102 (8.9%) | 59 (4.2%) |
| 10 to 14 Years | 123 (10.7%) | 57 (4.0%) |
| 15 to 19 Years | 52 (4.5%) | 34 (2.4%) |
| 20 to 24 Years | 17 (1.5%) | 75 (5.3%) |
| 25 to 29 Years | 85 (7.4%) | 107 (7.6%) |
| 30 to 34 Years | 127 (11.0%) | 77 (5.5%) |
| 35 to 39 Years | 69 (6.0%) | 98 (7.0%) |
| 40 to 44 Years | 75 (6.5%) | 46 (3.3%) |
| 45 to 49 Years | 59 (5.1%) | 94 (6.7%) |
| 50 to 54 Years | 94 (8.2%) | 201 (14.3%) |
| 55 to 59 Years | 79 (6.9%) | 58 (4.1%) |
| 60 to 64 Years | 50 (4.3%) | 35 (2.5%) |
| 65 to 69 Years | 42 (3.6%) | 120 (8.5%) |
| 70 to 74 Years | 46 (4.0%) | 50 (3.5%) |
| 75 to 79 Years | 17 (1.5%) | 65 (4.6%) |
| 80 to 84 Years | 38 (3.3%) | 34 (2.4%) |
| 85 Years and over | 15 (1.3%) | 62 (4.4%) |
| Total | 1,151 (100.0%) | 1,410 (100.0%) |
Families and Households in Covington
Median Family Size in Covington
The median family size in Covington is 3.09 persons per family, with single male/father families (14 | 2.3%) accounting for the largest median family size of 3.5 persons per family. On the other hand, single female/mother families (149 | 24.4%) represent the smallest median family size with 2.64 persons per family.
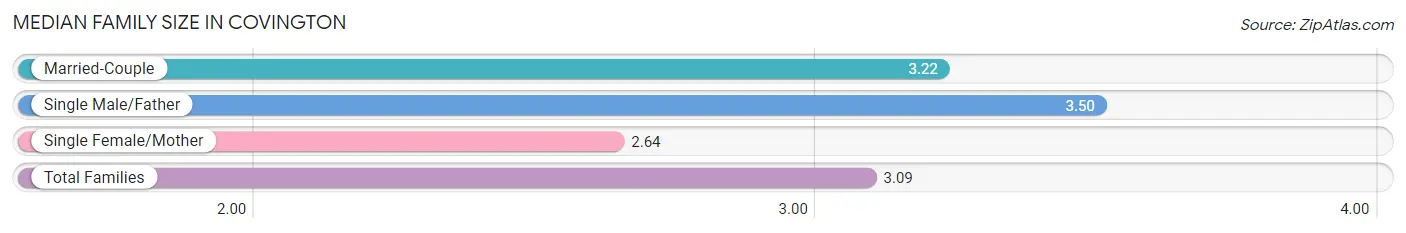
| Family Type | # Families | Family Size |
| Married-Couple | 447 (73.3%) | 3.22 |
| Single Male/Father | 14 (2.3%) | 3.50 |
| Single Female/Mother | 149 (24.4%) | 2.64 |
| Total Families | 610 (100.0%) | 3.09 |
Median Household Size in Covington
The median household size in Covington is 2.27 persons per household, with single male/father households (14 | 1.3%) accounting for the largest median household size of 3.93 persons per household. non-family households (486 | 44.3%) represent the smallest median household size with 1.20 persons per household.
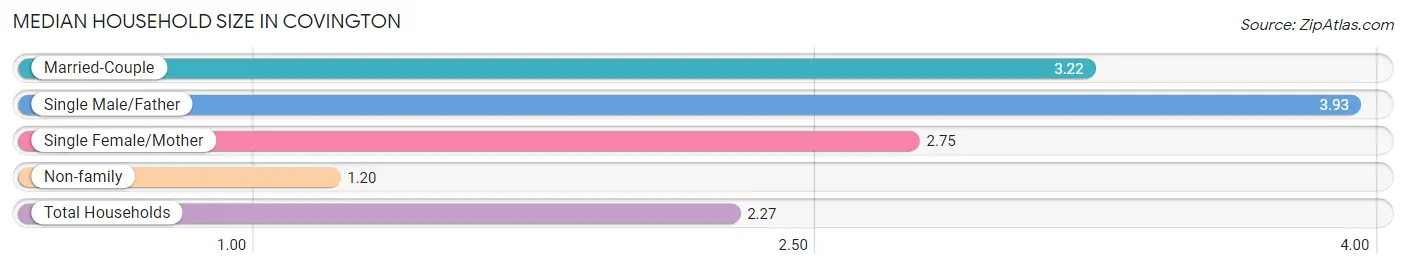
| Household Type | # Households | Household Size |
| Married-Couple | 447 (40.8%) | 3.22 |
| Single Male/Father | 14 (1.3%) | 3.93 |
| Single Female/Mother | 149 (13.6%) | 2.75 |
| Non-family | 486 (44.3%) | 1.20 |
| Total Households | 1,096 (100.0%) | 2.27 |
Household Size by Marriage Status in Covington
Out of a total of 1,096 households in Covington, 610 (55.7%) are family households, while 486 (44.3%) are nonfamily households. The most numerous type of family households are 2-person households, comprising 306, and the most common type of nonfamily households are 1-person households, comprising 417.
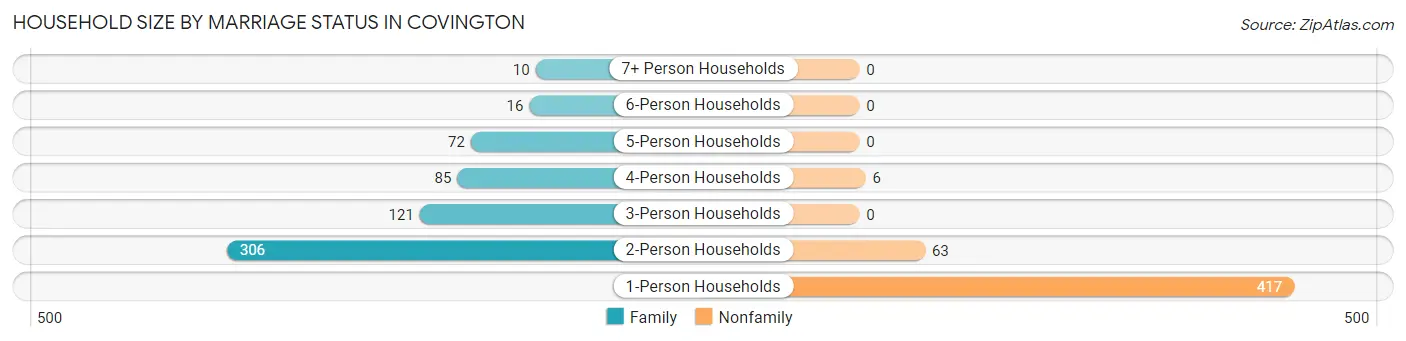
| Household Size | Family Households | Nonfamily Households |
| 1-Person Households | - | 417 (38.1%) |
| 2-Person Households | 306 (27.9%) | 63 (5.8%) |
| 3-Person Households | 121 (11.0%) | 0 (0.0%) |
| 4-Person Households | 85 (7.8%) | 6 (0.5%) |
| 5-Person Households | 72 (6.6%) | 0 (0.0%) |
| 6-Person Households | 16 (1.5%) | 0 (0.0%) |
| 7+ Person Households | 10 (0.9%) | 0 (0.0%) |
| Total | 610 (55.7%) | 486 (44.3%) |
Female Fertility in Covington
Fertility by Age in Covington
Average fertility rate in Covington is 53.0 births per 1,000 women. Women in the age bracket of 20 to 34 years have the highest fertility rate with 89.0 births per 1,000 women. Women in the age bracket of 20 to 34 years acount for 67.6% of all women with births.
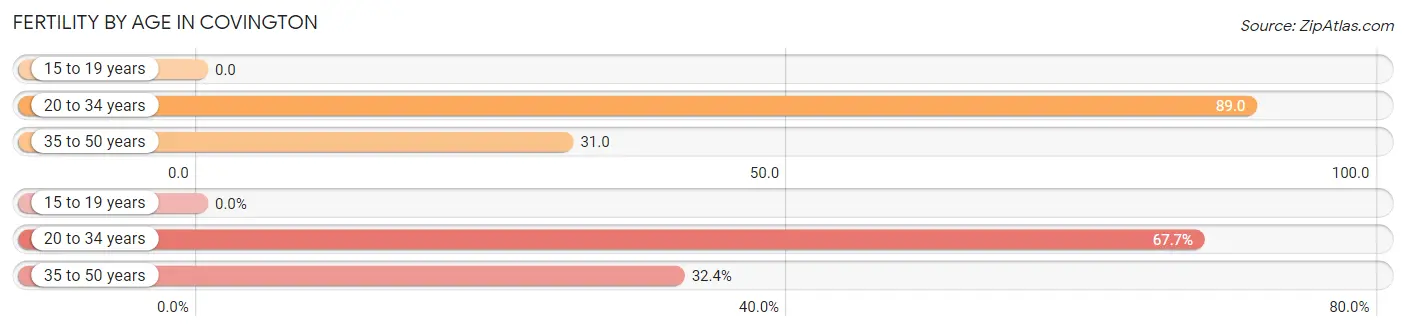
| Age Bracket | Women with Births | Births / 1,000 Women |
| 15 to 19 years | 0 (0.0%) | 0.0 |
| 20 to 34 years | 23 (67.6%) | 89.0 |
| 35 to 50 years | 11 (32.4%) | 31.0 |
| Total | 34 (100.0%) | 53.0 |
Fertility by Age by Marriage Status in Covington
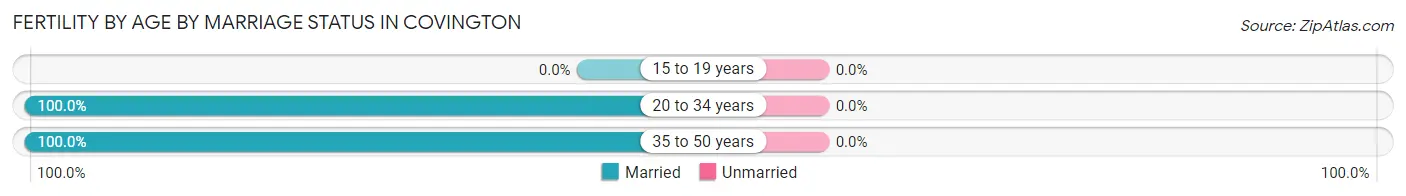
| Age Bracket | Married | Unmarried |
| 15 to 19 years | 0 (0.0%) | 0 (0.0%) |
| 20 to 34 years | 23 (100.0%) | 0 (0.0%) |
| 35 to 50 years | 11 (100.0%) | 0 (0.0%) |
| Total | 34 (100.0%) | 0 (0.0%) |
Fertility by Education in Covington
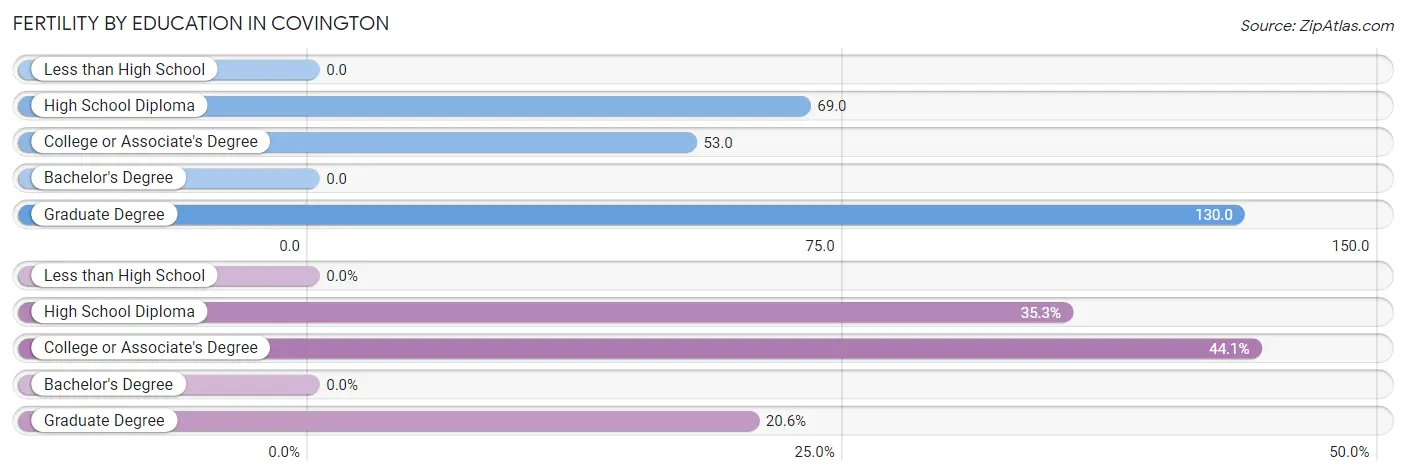
| Educational Attainment | Women with Births | Births / 1,000 Women |
| Less than High School | 0 (0.0%) | 0.0 |
| High School Diploma | 12 (35.3%) | 69.0 |
| College or Associate's Degree | 15 (44.1%) | 53.0 |
| Bachelor's Degree | 0 (0.0%) | 0.0 |
| Graduate Degree | 7 (20.6%) | 130.0 |
| Total | 34 (100.0%) | 53.0 |
Fertility by Education by Marriage Status in Covington
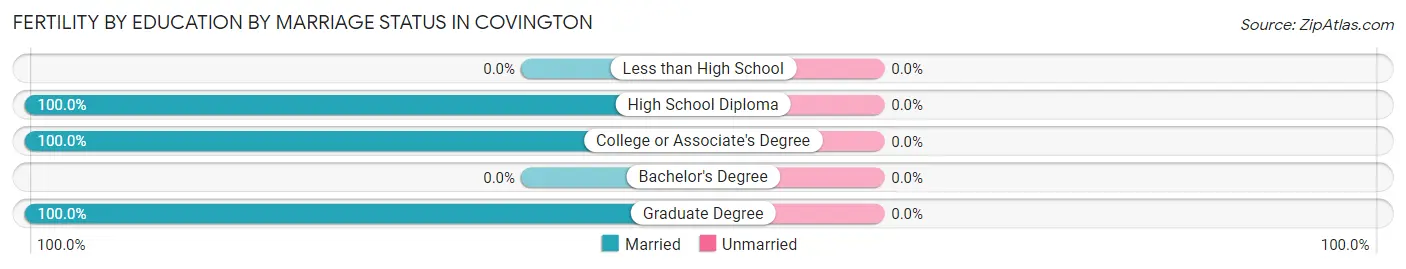
| Educational Attainment | Married | Unmarried |
| Less than High School | 0 (0.0%) | 0 (0.0%) |
| High School Diploma | 12 (100.0%) | 0 (0.0%) |
| College or Associate's Degree | 15 (100.0%) | 0 (0.0%) |
| Bachelor's Degree | 0 (0.0%) | 0 (0.0%) |
| Graduate Degree | 7 (100.0%) | 0 (0.0%) |
| Total | 34 (100.0%) | 0 (0.0%) |
Employment Characteristics in Covington
Employment by Class of Employer in Covington
Among the 1,148 employed individuals in Covington, private company employees (809 | 70.5%), local government employees (122 | 10.6%), and not-for-profit organizations (101 | 8.8%) make up the most common classes of employment.
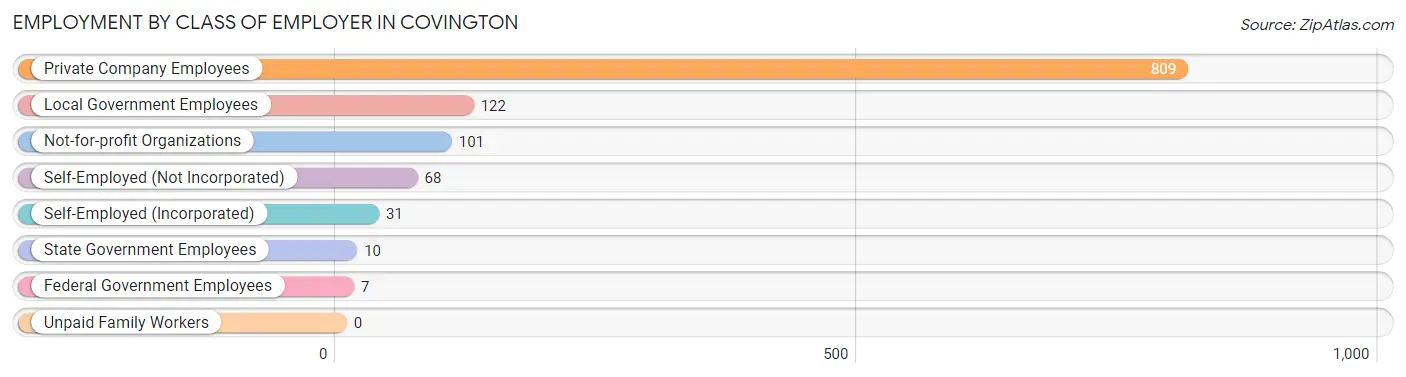
| Employer Class | # Employees | % Employees |
| Private Company Employees | 809 | 70.5% |
| Self-Employed (Incorporated) | 31 | 2.7% |
| Self-Employed (Not Incorporated) | 68 | 5.9% |
| Not-for-profit Organizations | 101 | 8.8% |
| Local Government Employees | 122 | 10.6% |
| State Government Employees | 10 | 0.9% |
| Federal Government Employees | 7 | 0.6% |
| Unpaid Family Workers | 0 | 0.0% |
| Total | 1,148 | 100.0% |
Employment Status by Age in Covington
According to the labor force statistics for Covington, out of the total population over 16 years of age (2,014), 58.9% or 1,186 individuals are in the labor force, with 3.3% or 39 of them unemployed. The age group with the highest labor force participation rate is 35 to 44 years, with 90.3% or 260 individuals in the labor force. Within the labor force, the 16 to 19 years age range has the highest percentage of unemployed individuals, with 44.4% or 16 of them being unemployed.
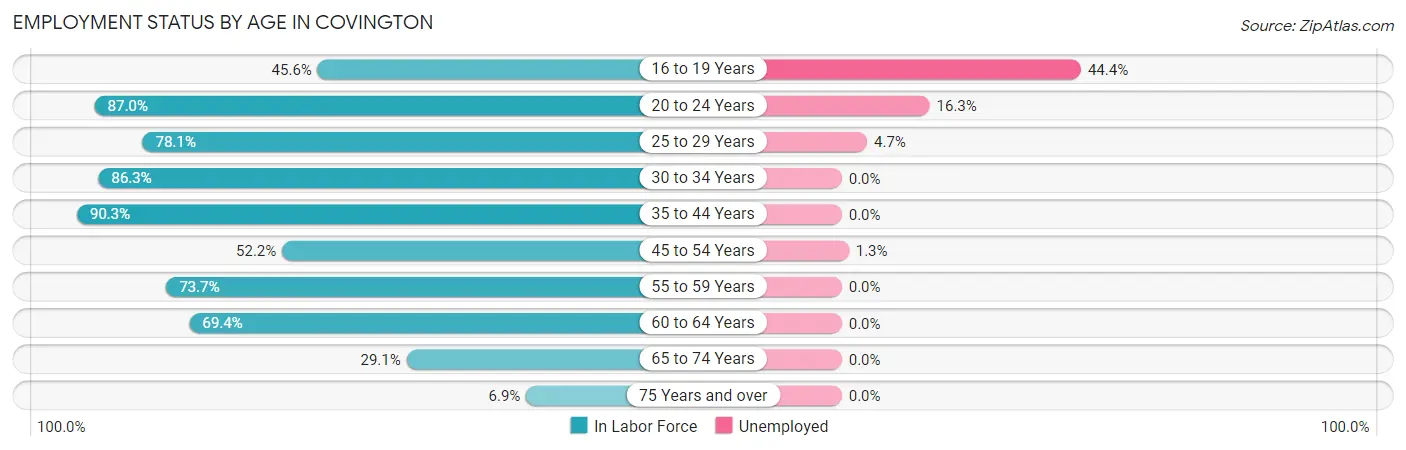
| Age Bracket | In Labor Force | Unemployed |
| 16 to 19 Years | 36 (45.6%) | 16 (44.4%) |
| 20 to 24 Years | 80 (87.0%) | 13 (16.3%) |
| 25 to 29 Years | 150 (78.1%) | 7 (4.7%) |
| 30 to 34 Years | 176 (86.3%) | 0 (0.0%) |
| 35 to 44 Years | 260 (90.3%) | 0 (0.0%) |
| 45 to 54 Years | 234 (52.2%) | 3 (1.3%) |
| 55 to 59 Years | 101 (73.7%) | 0 (0.0%) |
| 60 to 64 Years | 59 (69.4%) | 0 (0.0%) |
| 65 to 74 Years | 75 (29.1%) | 0 (0.0%) |
| 75 Years and over | 16 (6.9%) | 0 (0.0%) |
| Total | 1,186 (58.9%) | 39 (3.3%) |
Employment Status by Educational Attainment in Covington
According to labor force statistics for Covington, 72.4% of individuals (980) out of the total population between 25 and 64 years of age (1,354) are in the labor force, with 1.0% or 10 of them being unemployed. The group with the highest labor force participation rate are those with the educational attainment of bachelor's degree or higher, with 90.9% or 219 individuals in the labor force. Within the labor force, individuals with less than high school education have the highest percentage of unemployment, with 6.8% or 3 of them being unemployed.
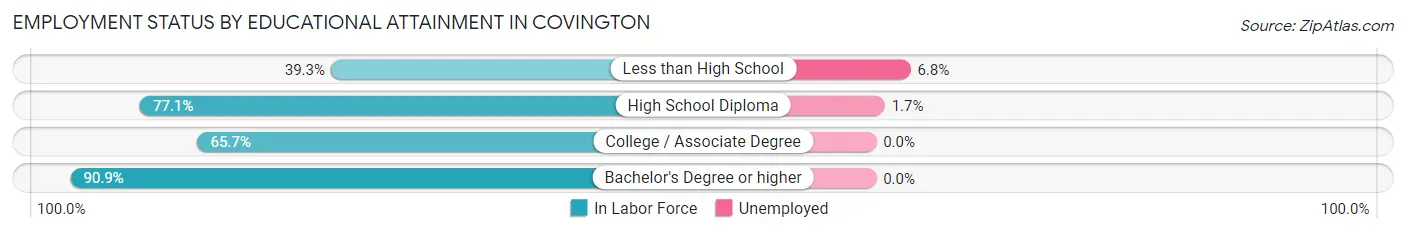
| Educational Attainment | In Labor Force | Unemployed |
| Less than High School | 44 (39.3%) | 8 (6.8%) |
| High School Diploma | 403 (77.1%) | 9 (1.7%) |
| College / Associate Degree | 314 (65.7%) | 0 (0.0%) |
| Bachelor's Degree or higher | 219 (90.9%) | 0 (0.0%) |
| Total | 980 (72.4%) | 14 (1.0%) |
Employment Occupations by Sex in Covington
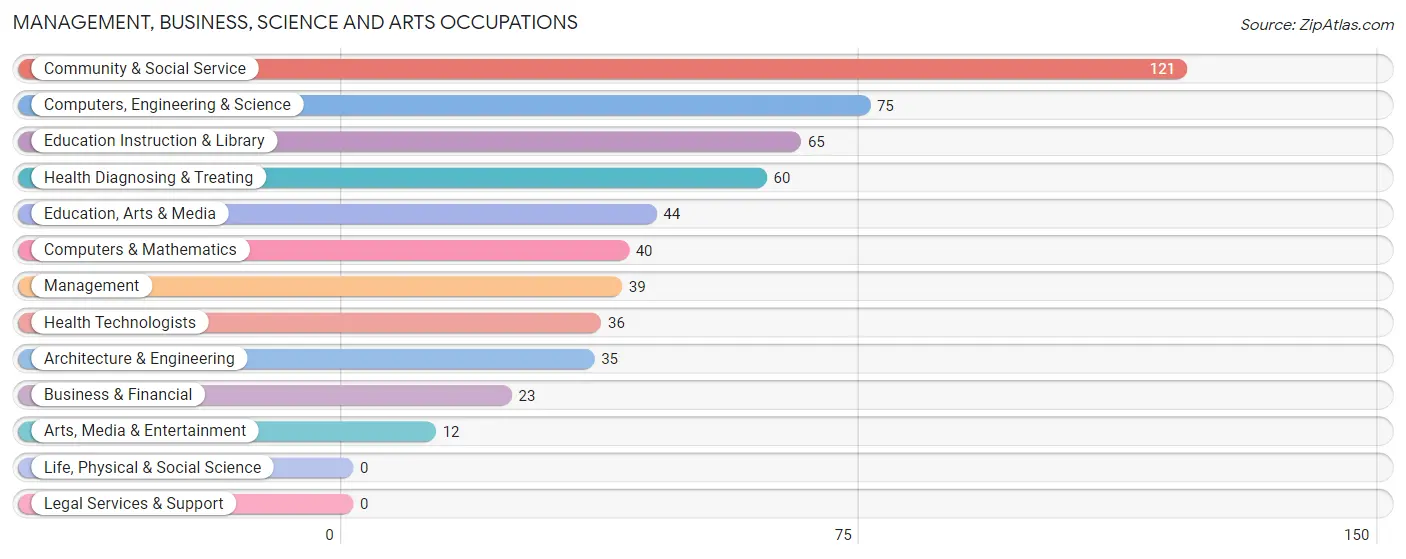
Management, Business, Science and Arts Occupations
The most common Management, Business, Science and Arts occupations in Covington are Community & Social Service (121 | 10.5%), Computers, Engineering & Science (75 | 6.5%), Education Instruction & Library (65 | 5.7%), Health Diagnosing & Treating (60 | 5.2%), and Education, Arts & Media (44 | 3.8%).
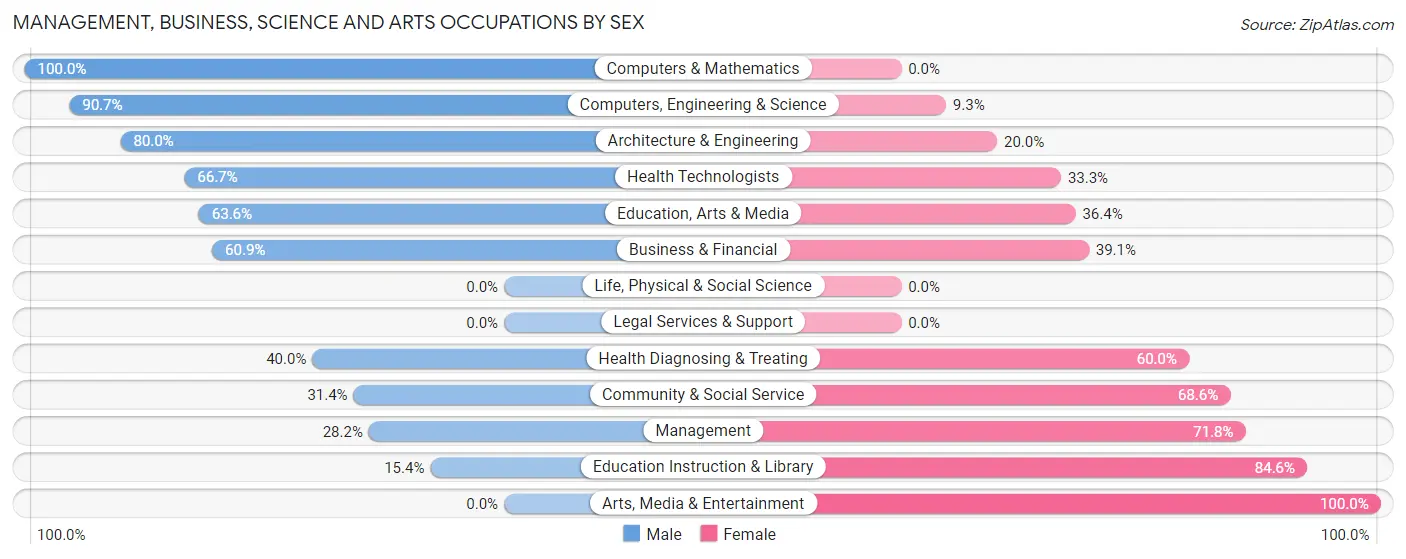
Management, Business, Science and Arts Occupations by Sex
Within the Management, Business, Science and Arts occupations in Covington, the most male-oriented occupations are Computers & Mathematics (100.0%), Computers, Engineering & Science (90.7%), and Architecture & Engineering (80.0%), while the most female-oriented occupations are Arts, Media & Entertainment (100.0%), Education Instruction & Library (84.6%), and Management (71.8%).
| Occupation | Male | Female |
| Management | 11 (28.2%) | 28 (71.8%) |
| Business & Financial | 14 (60.9%) | 9 (39.1%) |
| Computers, Engineering & Science | 68 (90.7%) | 7 (9.3%) |
| Computers & Mathematics | 40 (100.0%) | 0 (0.0%) |
| Architecture & Engineering | 28 (80.0%) | 7 (20.0%) |
| Life, Physical & Social Science | 0 (0.0%) | 0 (0.0%) |
| Community & Social Service | 38 (31.4%) | 83 (68.6%) |
| Education, Arts & Media | 28 (63.6%) | 16 (36.4%) |
| Legal Services & Support | 0 (0.0%) | 0 (0.0%) |
| Education Instruction & Library | 10 (15.4%) | 55 (84.6%) |
| Arts, Media & Entertainment | 0 (0.0%) | 12 (100.0%) |
| Health Diagnosing & Treating | 24 (40.0%) | 36 (60.0%) |
| Health Technologists | 24 (66.7%) | 12 (33.3%) |
| Total (Category) | 155 (48.7%) | 163 (51.3%) |
| Total (Overall) | 569 (49.6%) | 579 (50.4%) |
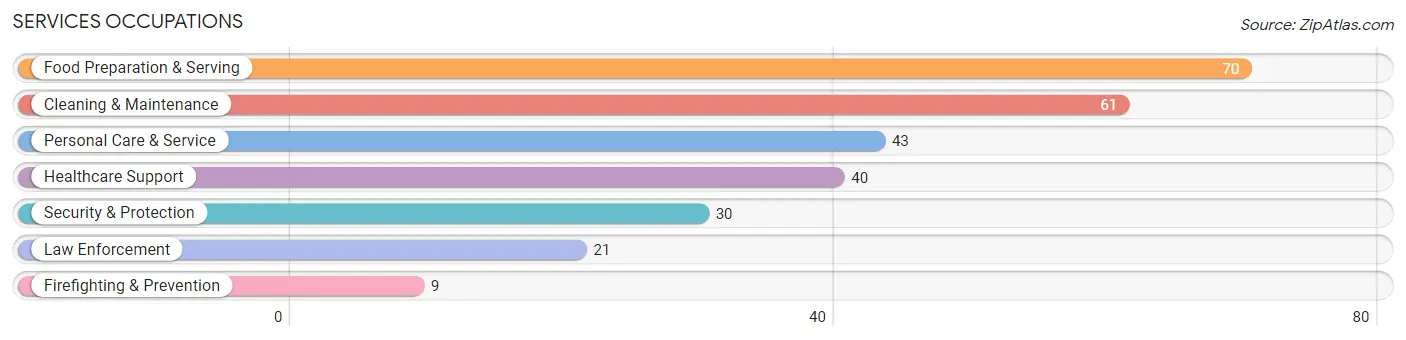
Services Occupations
The most common Services occupations in Covington are Food Preparation & Serving (70 | 6.1%), Cleaning & Maintenance (61 | 5.3%), Personal Care & Service (43 | 3.7%), Healthcare Support (40 | 3.5%), and Security & Protection (30 | 2.6%).
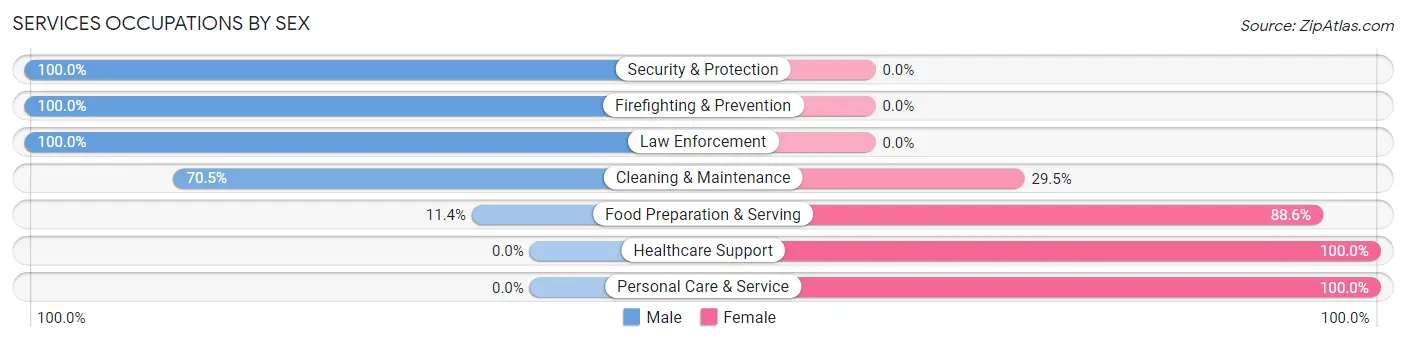
Services Occupations by Sex
Within the Services occupations in Covington, the most male-oriented occupations are Security & Protection (100.0%), Firefighting & Prevention (100.0%), and Law Enforcement (100.0%), while the most female-oriented occupations are Healthcare Support (100.0%), Personal Care & Service (100.0%), and Food Preparation & Serving (88.6%).
| Occupation | Male | Female |
| Healthcare Support | 0 (0.0%) | 40 (100.0%) |
| Security & Protection | 30 (100.0%) | 0 (0.0%) |
| Firefighting & Prevention | 9 (100.0%) | 0 (0.0%) |
| Law Enforcement | 21 (100.0%) | 0 (0.0%) |
| Food Preparation & Serving | 8 (11.4%) | 62 (88.6%) |
| Cleaning & Maintenance | 43 (70.5%) | 18 (29.5%) |
| Personal Care & Service | 0 (0.0%) | 43 (100.0%) |
| Total (Category) | 81 (33.2%) | 163 (66.8%) |
| Total (Overall) | 569 (49.6%) | 579 (50.4%) |
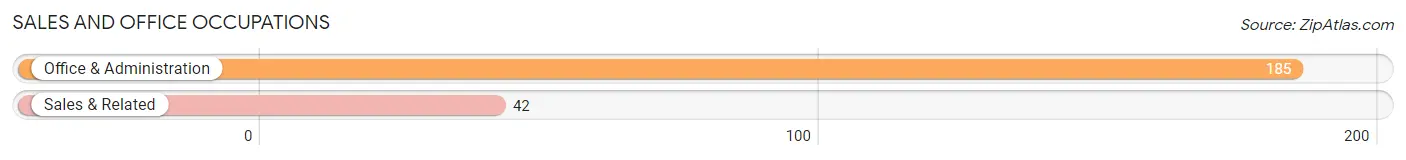
Sales and Office Occupations
The most common Sales and Office occupations in Covington are Office & Administration (185 | 16.1%), and Sales & Related (42 | 3.7%).
Sales and Office Occupations by Sex
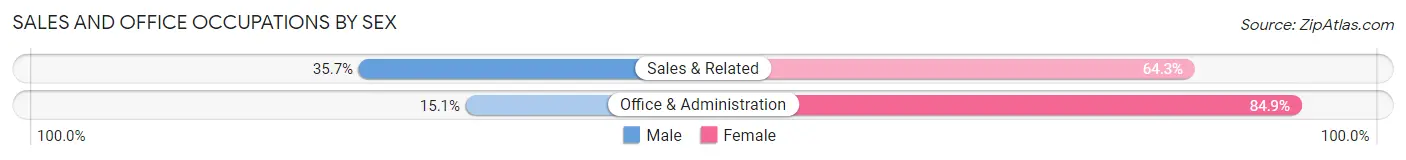
| Occupation | Male | Female |
| Sales & Related | 15 (35.7%) | 27 (64.3%) |
| Office & Administration | 28 (15.1%) | 157 (84.9%) |
| Total (Category) | 43 (18.9%) | 184 (81.1%) |
| Total (Overall) | 569 (49.6%) | 579 (50.4%) |
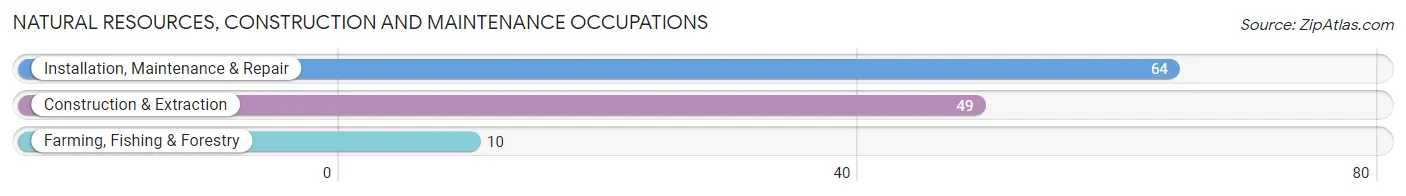
Natural Resources, Construction and Maintenance Occupations
The most common Natural Resources, Construction and Maintenance occupations in Covington are Installation, Maintenance & Repair (64 | 5.6%), Construction & Extraction (49 | 4.3%), and Farming, Fishing & Forestry (10 | 0.9%).
Natural Resources, Construction and Maintenance Occupations by Sex
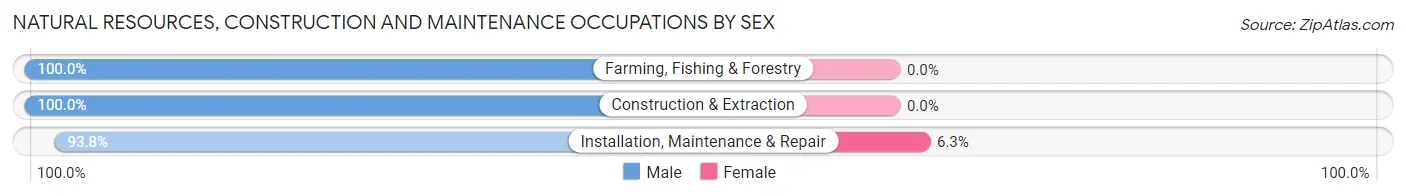
| Occupation | Male | Female |
| Farming, Fishing & Forestry | 10 (100.0%) | 0 (0.0%) |
| Construction & Extraction | 49 (100.0%) | 0 (0.0%) |
| Installation, Maintenance & Repair | 60 (93.8%) | 4 (6.2%) |
| Total (Category) | 119 (96.8%) | 4 (3.3%) |
| Total (Overall) | 569 (49.6%) | 579 (50.4%) |
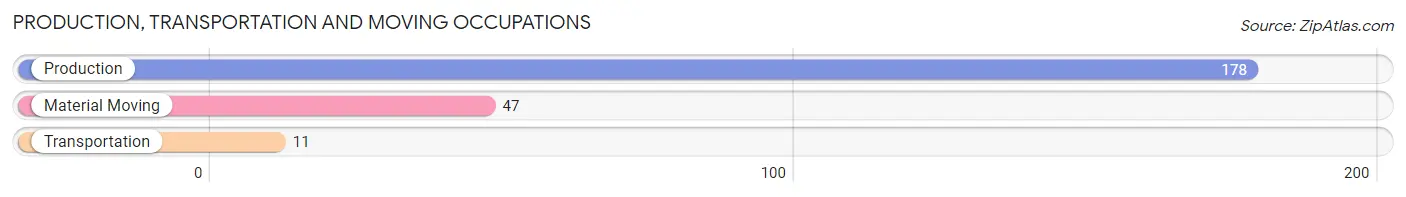
Production, Transportation and Moving Occupations
The most common Production, Transportation and Moving occupations in Covington are Production (178 | 15.5%), Material Moving (47 | 4.1%), and Transportation (11 | 1.0%).
Production, Transportation and Moving Occupations by Sex
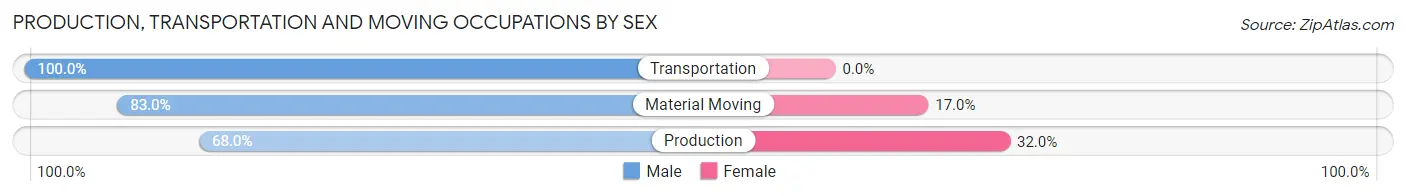
| Occupation | Male | Female |
| Production | 121 (68.0%) | 57 (32.0%) |
| Transportation | 11 (100.0%) | 0 (0.0%) |
| Material Moving | 39 (83.0%) | 8 (17.0%) |
| Total (Category) | 171 (72.5%) | 65 (27.5%) |
| Total (Overall) | 569 (49.6%) | 579 (50.4%) |
Employment Industries by Sex in Covington
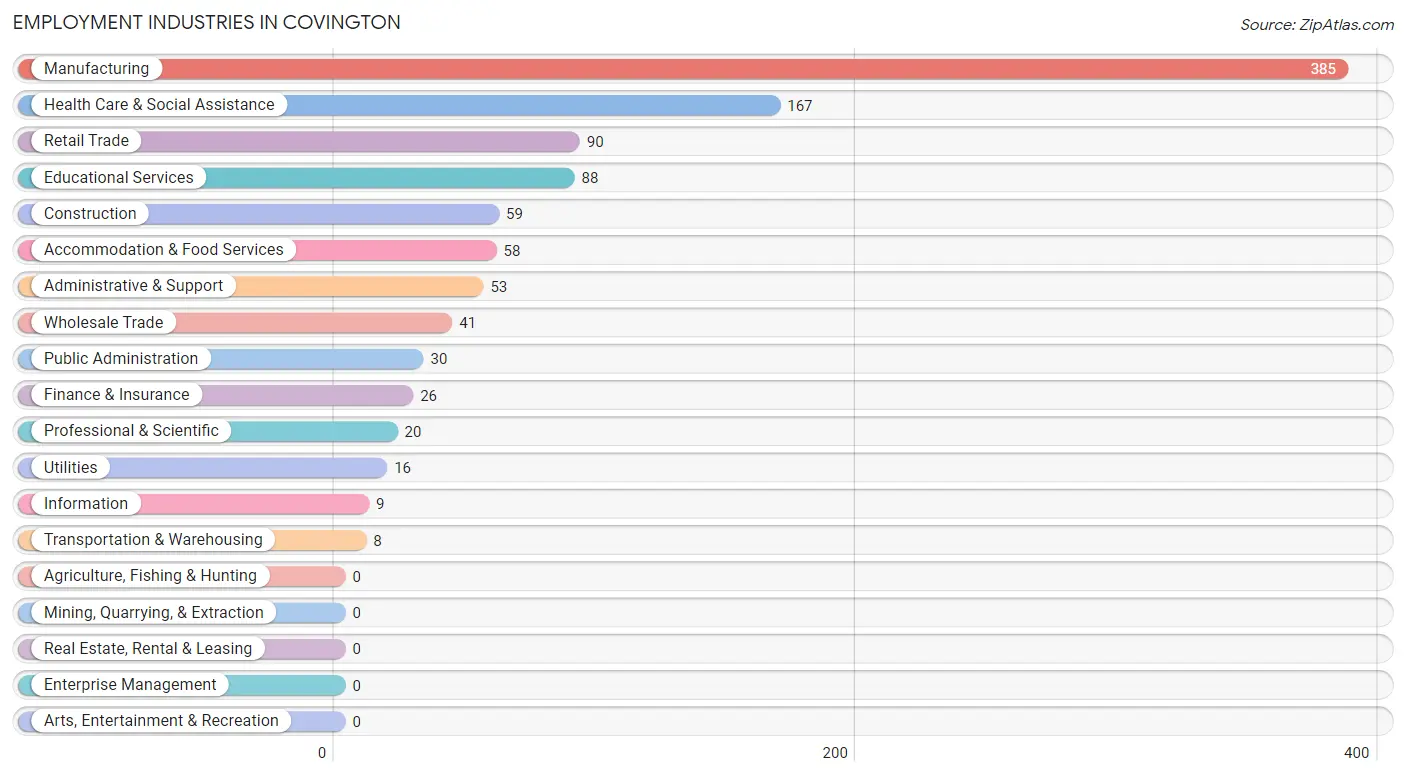
Employment Industries in Covington
The major employment industries in Covington include Manufacturing (385 | 33.5%), Health Care & Social Assistance (167 | 14.5%), Retail Trade (90 | 7.8%), Educational Services (88 | 7.7%), and Construction (59 | 5.1%).
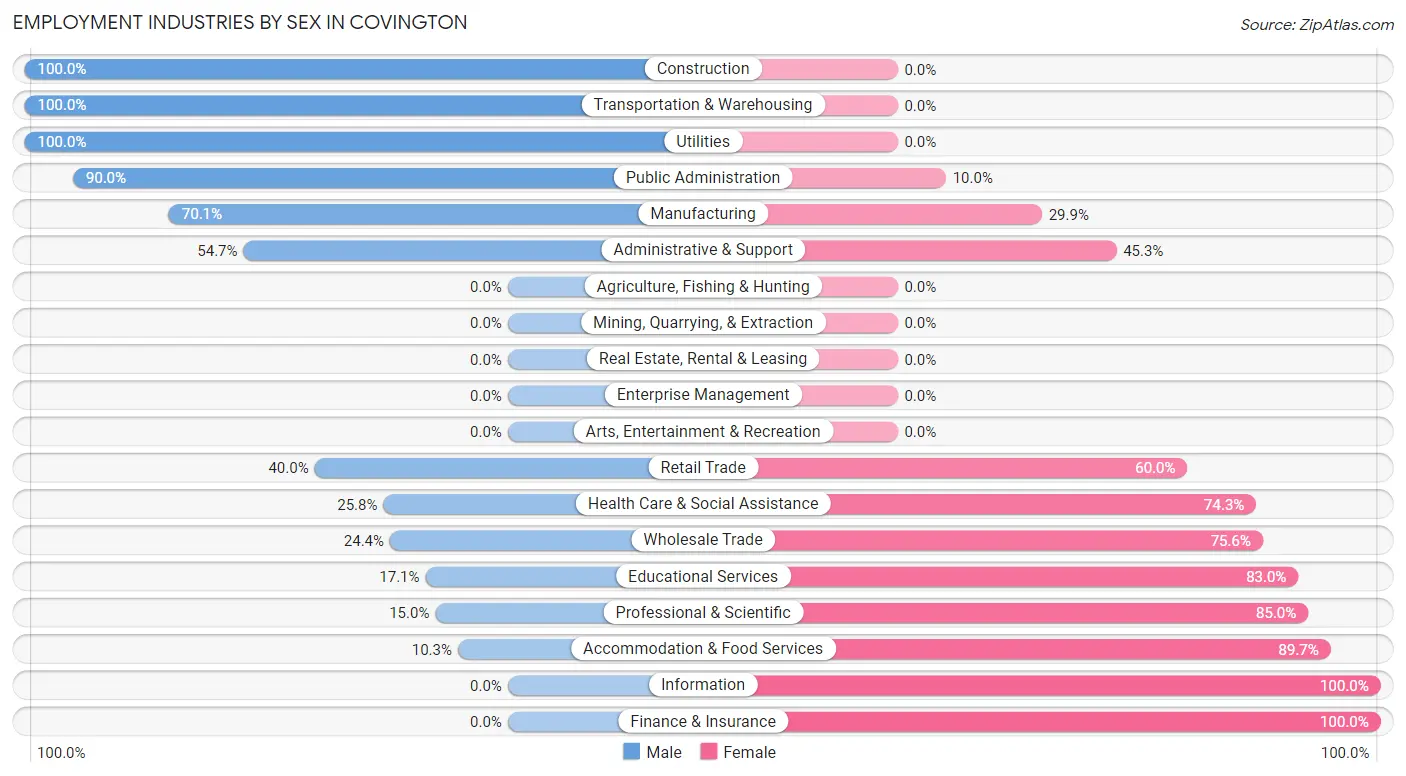
Employment Industries by Sex in Covington
The Covington industries that see more men than women are Construction (100.0%), Transportation & Warehousing (100.0%), and Utilities (100.0%), whereas the industries that tend to have a higher number of women are Information (100.0%), Finance & Insurance (100.0%), and Accommodation & Food Services (89.7%).
| Industry | Male | Female |
| Agriculture, Fishing & Hunting | 0 (0.0%) | 0 (0.0%) |
| Mining, Quarrying, & Extraction | 0 (0.0%) | 0 (0.0%) |
| Construction | 59 (100.0%) | 0 (0.0%) |
| Manufacturing | 270 (70.1%) | 115 (29.9%) |
| Wholesale Trade | 10 (24.4%) | 31 (75.6%) |
| Retail Trade | 36 (40.0%) | 54 (60.0%) |
| Transportation & Warehousing | 8 (100.0%) | 0 (0.0%) |
| Utilities | 16 (100.0%) | 0 (0.0%) |
| Information | 0 (0.0%) | 9 (100.0%) |
| Finance & Insurance | 0 (0.0%) | 26 (100.0%) |
| Real Estate, Rental & Leasing | 0 (0.0%) | 0 (0.0%) |
| Professional & Scientific | 3 (15.0%) | 17 (85.0%) |
| Enterprise Management | 0 (0.0%) | 0 (0.0%) |
| Administrative & Support | 29 (54.7%) | 24 (45.3%) |
| Educational Services | 15 (17.1%) | 73 (83.0%) |
| Health Care & Social Assistance | 43 (25.8%) | 124 (74.3%) |
| Arts, Entertainment & Recreation | 0 (0.0%) | 0 (0.0%) |
| Accommodation & Food Services | 6 (10.3%) | 52 (89.7%) |
| Public Administration | 27 (90.0%) | 3 (10.0%) |
| Total | 569 (49.6%) | 579 (50.4%) |
Education in Covington
School Enrollment in Covington
The most common levels of schooling among the 510 students in Covington are middle school (158 | 31.0%), elementary school (92 | 18.0%), and high school (81 | 15.9%).
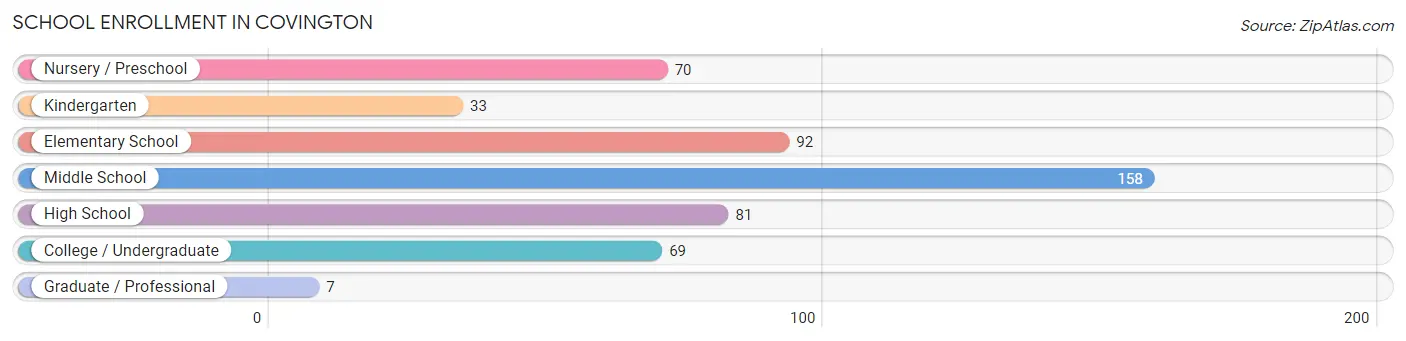
| School Level | # Students | % Students |
| Nursery / Preschool | 70 | 13.7% |
| Kindergarten | 33 | 6.5% |
| Elementary School | 92 | 18.0% |
| Middle School | 158 | 31.0% |
| High School | 81 | 15.9% |
| College / Undergraduate | 69 | 13.5% |
| Graduate / Professional | 7 | 1.4% |
| Total | 510 | 100.0% |
School Enrollment by Age by Funding Source in Covington
Out of a total of 510 students who are enrolled in schools in Covington, 37 (7.3%) attend a private institution, while the remaining 473 (92.7%) are enrolled in public schools. The age group of 25 to 34 year olds has the highest likelihood of being enrolled in private schools, with 22 (61.1% in the age bracket) enrolled. Conversely, the age group of 3 to 4 year olds has the lowest likelihood of being enrolled in a private school, with 44 (100.0% in the age bracket) attending a public institution.
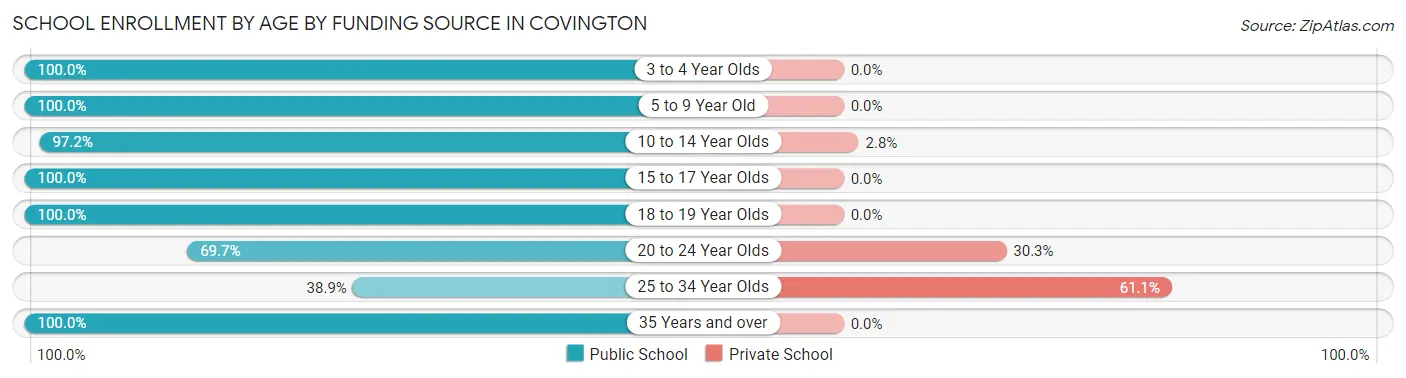
| Age Bracket | Public School | Private School |
| 3 to 4 Year Olds | 44 (100.0%) | 0 (0.0%) |
| 5 to 9 Year Old | 137 (100.0%) | 0 (0.0%) |
| 10 to 14 Year Olds | 175 (97.2%) | 5 (2.8%) |
| 15 to 17 Year Olds | 55 (100.0%) | 0 (0.0%) |
| 18 to 19 Year Olds | 18 (100.0%) | 0 (0.0%) |
| 20 to 24 Year Olds | 23 (69.7%) | 10 (30.3%) |
| 25 to 34 Year Olds | 14 (38.9%) | 22 (61.1%) |
| 35 Years and over | 7 (100.0%) | 0 (0.0%) |
| Total | 473 (92.7%) | 37 (7.3%) |
Educational Attainment by Field of Study in Covington
Science & technology (86 | 26.8%), education (83 | 25.9%), business (70 | 21.8%), bio, nature & agricultural (20 | 6.2%), and psychology (19 | 5.9%) are the most common fields of study among 321 individuals in Covington who have obtained a bachelor's degree or higher.
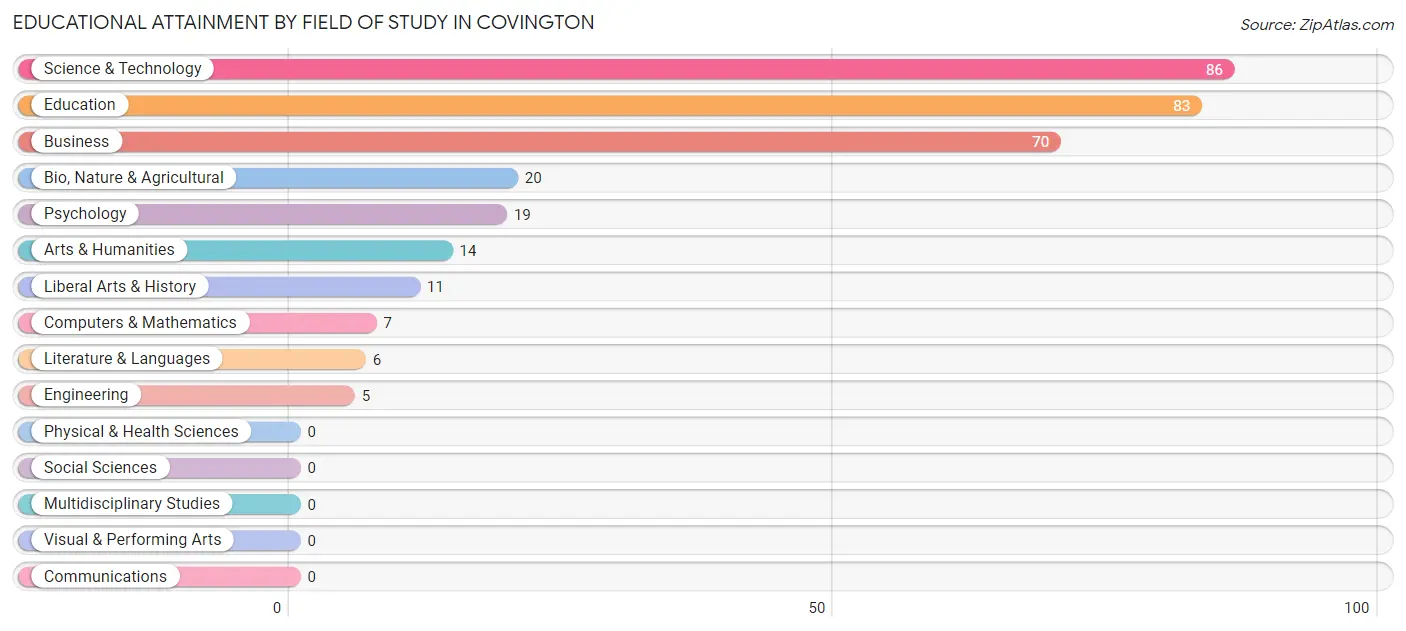
| Field of Study | # Graduates | % Graduates |
| Computers & Mathematics | 7 | 2.2% |
| Bio, Nature & Agricultural | 20 | 6.2% |
| Physical & Health Sciences | 0 | 0.0% |
| Psychology | 19 | 5.9% |
| Social Sciences | 0 | 0.0% |
| Engineering | 5 | 1.6% |
| Multidisciplinary Studies | 0 | 0.0% |
| Science & Technology | 86 | 26.8% |
| Business | 70 | 21.8% |
| Education | 83 | 25.9% |
| Literature & Languages | 6 | 1.9% |
| Liberal Arts & History | 11 | 3.4% |
| Visual & Performing Arts | 0 | 0.0% |
| Communications | 0 | 0.0% |
| Arts & Humanities | 14 | 4.4% |
| Total | 321 | 100.0% |
Transportation & Commute in Covington
Vehicle Availability by Sex in Covington
The most prevalent vehicle ownership categories in Covington are males with 2 vehicles (271, accounting for 47.6%) and females with 2 vehicles (299, making up 46.8%).
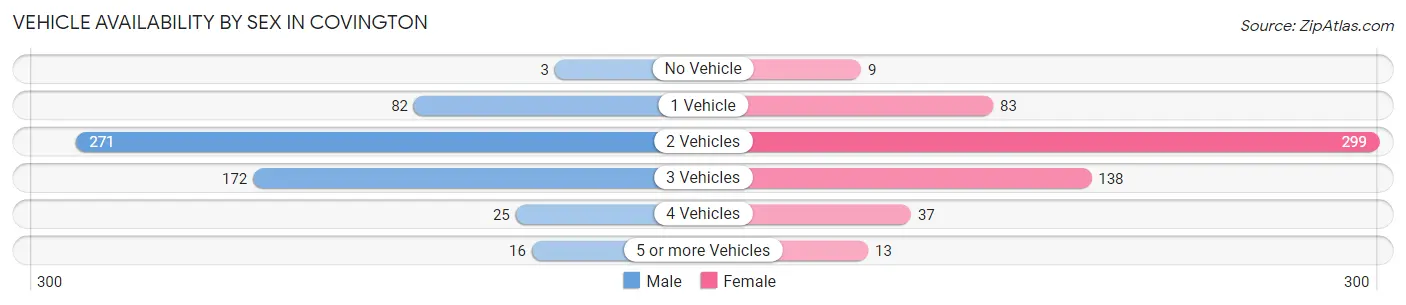
| Vehicles Available | Male | Female |
| No Vehicle | 3 (0.5%) | 9 (1.5%) |
| 1 Vehicle | 82 (14.4%) | 83 (14.3%) |
| 2 Vehicles | 271 (47.6%) | 299 (51.6%) |
| 3 Vehicles | 172 (30.2%) | 138 (23.8%) |
| 4 Vehicles | 25 (4.4%) | 37 (6.4%) |
| 5 or more Vehicles | 16 (2.8%) | 13 (2.2%) |
| Total | 569 (100.0%) | 579 (100.0%) |
Commute Time in Covington
The most frequently occuring commute durations in Covington are 15 to 19 minutes (241 commuters, 22.6%), 20 to 24 minutes (141 commuters, 13.2%), and 5 to 9 minutes (124 commuters, 11.6%).
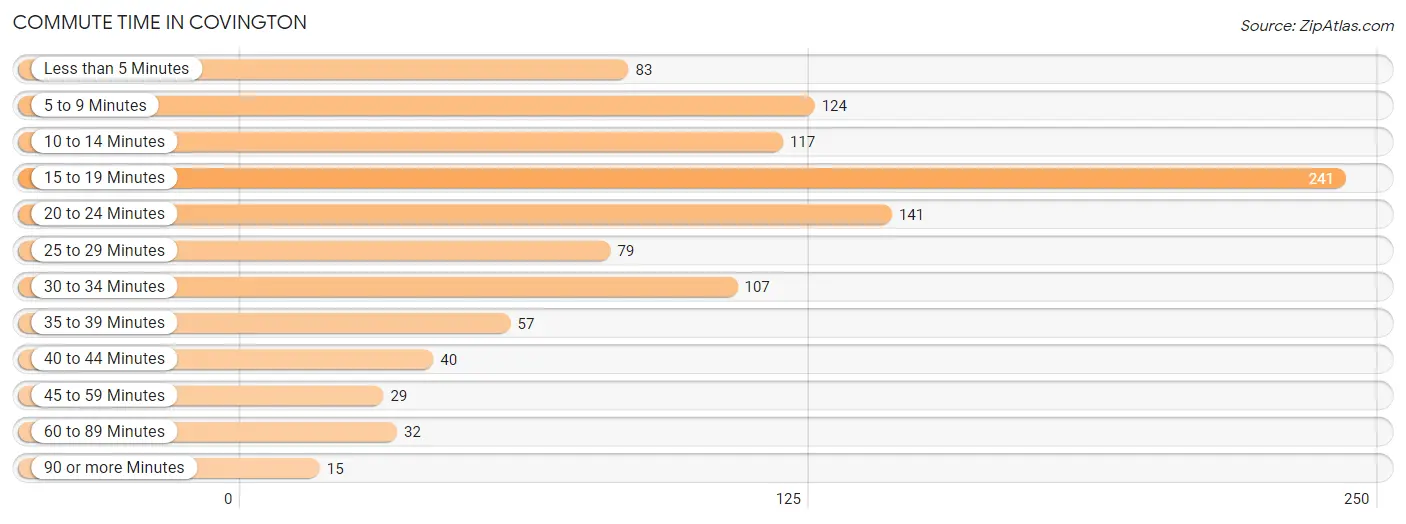
| Commute Time | # Commuters | % Commuters |
| Less than 5 Minutes | 83 | 7.8% |
| 5 to 9 Minutes | 124 | 11.6% |
| 10 to 14 Minutes | 117 | 11.0% |
| 15 to 19 Minutes | 241 | 22.6% |
| 20 to 24 Minutes | 141 | 13.2% |
| 25 to 29 Minutes | 79 | 7.4% |
| 30 to 34 Minutes | 107 | 10.1% |
| 35 to 39 Minutes | 57 | 5.3% |
| 40 to 44 Minutes | 40 | 3.8% |
| 45 to 59 Minutes | 29 | 2.7% |
| 60 to 89 Minutes | 32 | 3.0% |
| 90 or more Minutes | 15 | 1.4% |
Commute Time by Sex in Covington
The most common commute times in Covington are 15 to 19 minutes (108 commuters, 20.4%) for males and 15 to 19 minutes (133 commuters, 24.8%) for females.
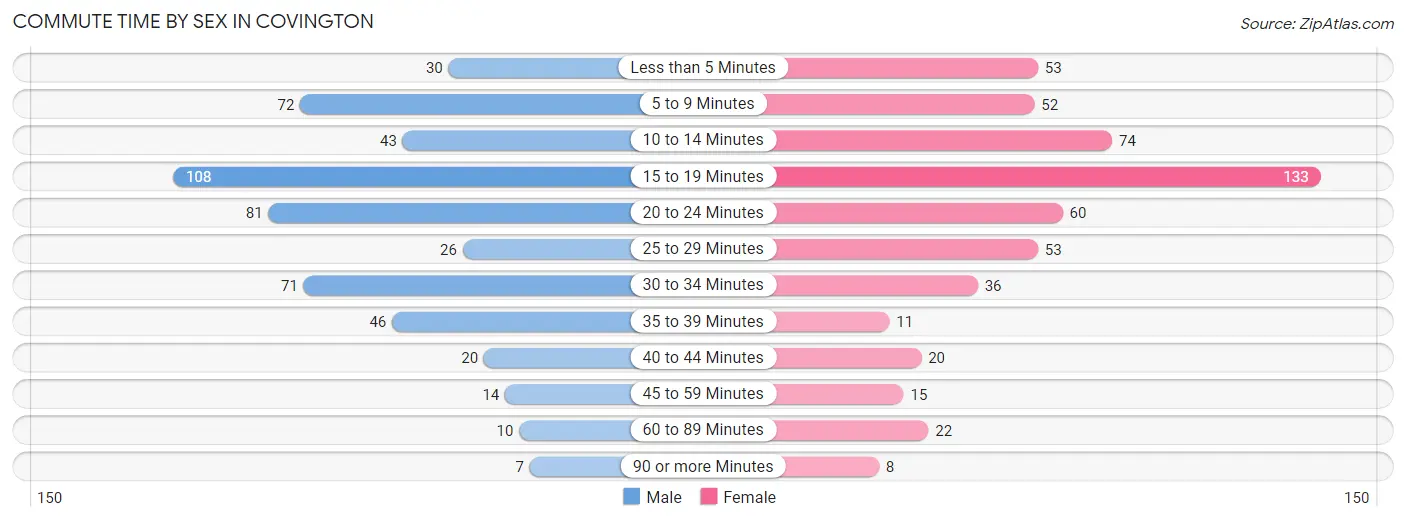
| Commute Time | Male | Female |
| Less than 5 Minutes | 30 (5.7%) | 53 (9.9%) |
| 5 to 9 Minutes | 72 (13.6%) | 52 (9.7%) |
| 10 to 14 Minutes | 43 (8.1%) | 74 (13.8%) |
| 15 to 19 Minutes | 108 (20.4%) | 133 (24.8%) |
| 20 to 24 Minutes | 81 (15.3%) | 60 (11.2%) |
| 25 to 29 Minutes | 26 (4.9%) | 53 (9.9%) |
| 30 to 34 Minutes | 71 (13.5%) | 36 (6.7%) |
| 35 to 39 Minutes | 46 (8.7%) | 11 (2.1%) |
| 40 to 44 Minutes | 20 (3.8%) | 20 (3.7%) |
| 45 to 59 Minutes | 14 (2.6%) | 15 (2.8%) |
| 60 to 89 Minutes | 10 (1.9%) | 22 (4.1%) |
| 90 or more Minutes | 7 (1.3%) | 8 (1.5%) |
Time of Departure to Work by Sex in Covington
The most frequent times of departure to work in Covington are 6:30 AM to 6:59 AM (90, 17.1%) for males and 6:30 AM to 6:59 AM (101, 18.8%) for females.
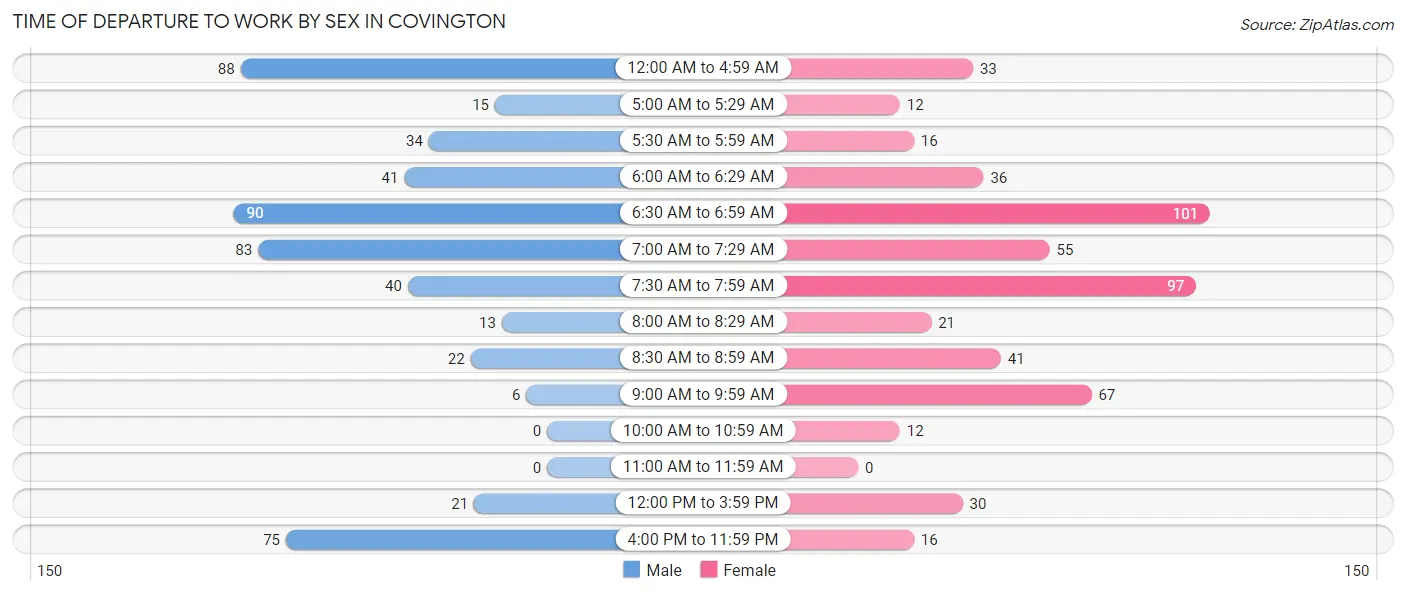
| Time of Departure | Male | Female |
| 12:00 AM to 4:59 AM | 88 (16.7%) | 33 (6.1%) |
| 5:00 AM to 5:29 AM | 15 (2.8%) | 12 (2.2%) |
| 5:30 AM to 5:59 AM | 34 (6.4%) | 16 (3.0%) |
| 6:00 AM to 6:29 AM | 41 (7.8%) | 36 (6.7%) |
| 6:30 AM to 6:59 AM | 90 (17.1%) | 101 (18.8%) |
| 7:00 AM to 7:29 AM | 83 (15.7%) | 55 (10.2%) |
| 7:30 AM to 7:59 AM | 40 (7.6%) | 97 (18.1%) |
| 8:00 AM to 8:29 AM | 13 (2.5%) | 21 (3.9%) |
| 8:30 AM to 8:59 AM | 22 (4.2%) | 41 (7.6%) |
| 9:00 AM to 9:59 AM | 6 (1.1%) | 67 (12.5%) |
| 10:00 AM to 10:59 AM | 0 (0.0%) | 12 (2.2%) |
| 11:00 AM to 11:59 AM | 0 (0.0%) | 0 (0.0%) |
| 12:00 PM to 3:59 PM | 21 (4.0%) | 30 (5.6%) |
| 4:00 PM to 11:59 PM | 75 (14.2%) | 16 (3.0%) |
| Total | 528 (100.0%) | 537 (100.0%) |
Housing Occupancy in Covington
Occupancy by Ownership in Covington
Of the total 1,096 dwellings in Covington, owner-occupied units account for 713 (65.0%), while renter-occupied units make up 383 (34.9%).
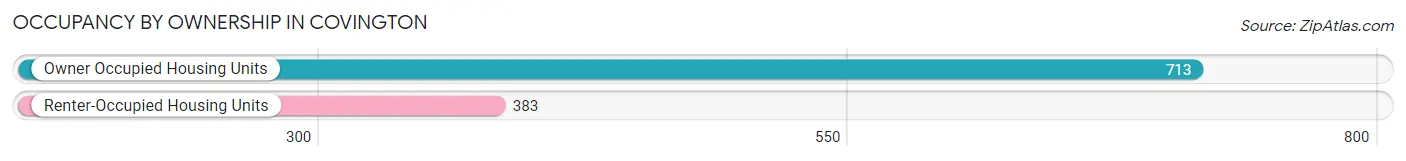
| Occupancy | # Housing Units | % Housing Units |
| Owner Occupied Housing Units | 713 | 65.0% |
| Renter-Occupied Housing Units | 383 | 34.9% |
| Total Occupied Housing Units | 1,096 | 100.0% |
Occupancy by Household Size in Covington
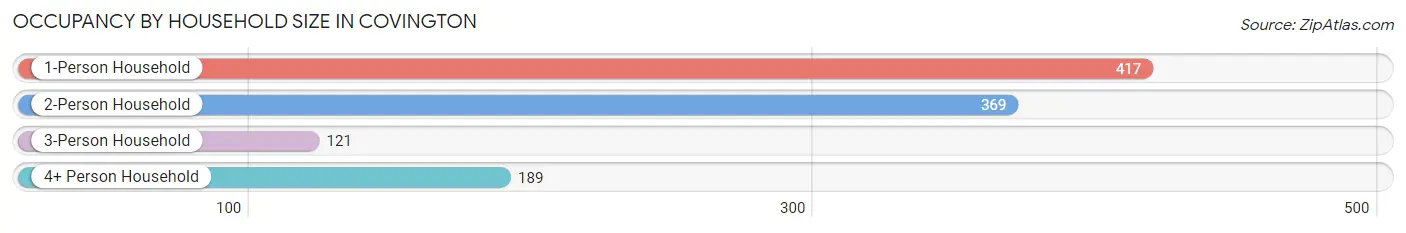
| Household Size | # Housing Units | % Housing Units |
| 1-Person Household | 417 | 38.1% |
| 2-Person Household | 369 | 33.7% |
| 3-Person Household | 121 | 11.0% |
| 4+ Person Household | 189 | 17.2% |
| Total Housing Units | 1,096 | 100.0% |
Occupancy by Ownership by Household Size in Covington
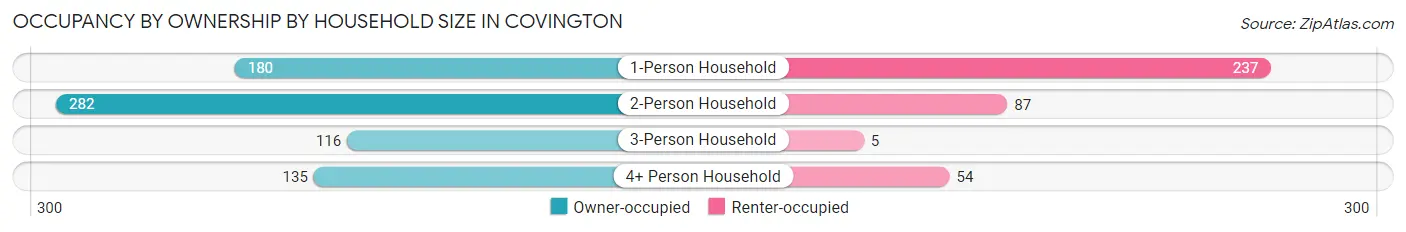
| Household Size | Owner-occupied | Renter-occupied |
| 1-Person Household | 180 (43.2%) | 237 (56.8%) |
| 2-Person Household | 282 (76.4%) | 87 (23.6%) |
| 3-Person Household | 116 (95.9%) | 5 (4.1%) |
| 4+ Person Household | 135 (71.4%) | 54 (28.6%) |
| Total Housing Units | 713 (65.0%) | 383 (34.9%) |
Occupancy by Educational Attainment in Covington
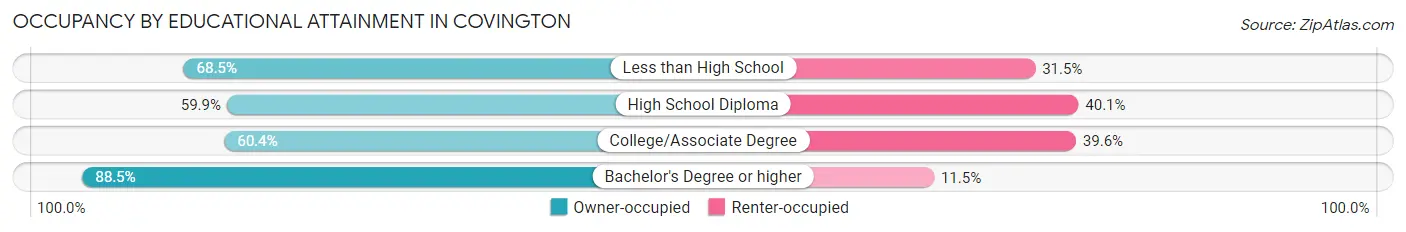
| Household Size | Owner-occupied | Renter-occupied |
| Less than High School | 76 (68.5%) | 35 (31.5%) |
| High School Diploma | 257 (59.9%) | 172 (40.1%) |
| College/Associate Degree | 241 (60.4%) | 158 (39.6%) |
| Bachelor's Degree or higher | 139 (88.5%) | 18 (11.5%) |
Occupancy by Age of Householder in Covington
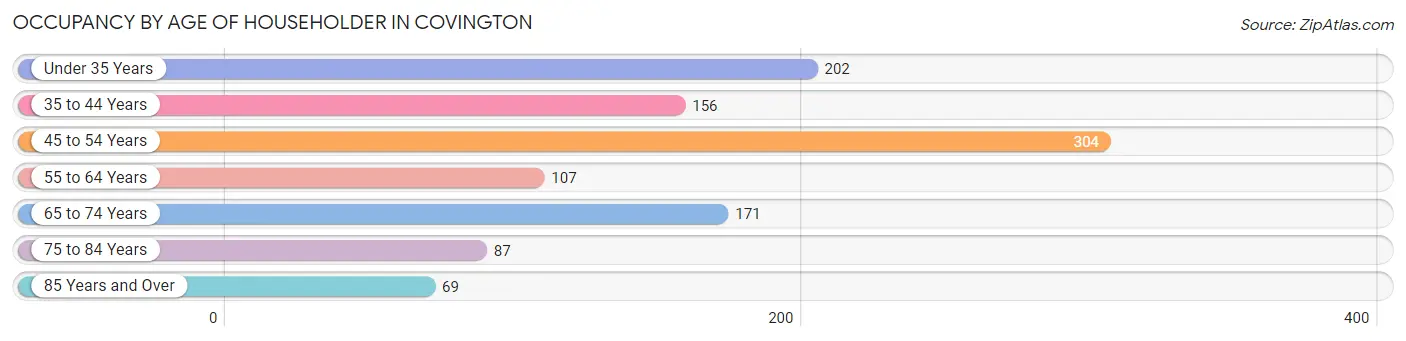
| Age Bracket | # Households | % Households |
| Under 35 Years | 202 | 18.4% |
| 35 to 44 Years | 156 | 14.2% |
| 45 to 54 Years | 304 | 27.7% |
| 55 to 64 Years | 107 | 9.8% |
| 65 to 74 Years | 171 | 15.6% |
| 75 to 84 Years | 87 | 7.9% |
| 85 Years and Over | 69 | 6.3% |
| Total | 1,096 | 100.0% |
Housing Finances in Covington
Median Income by Occupancy in Covington
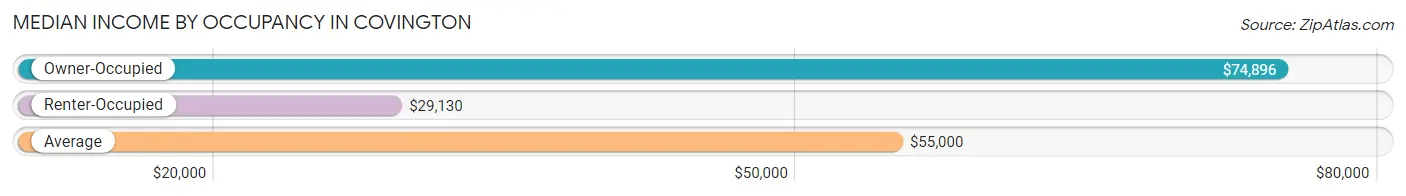
| Occupancy Type | # Households | Median Income |
| Owner-Occupied | 713 (65.0%) | $74,896 |
| Renter-Occupied | 383 (34.9%) | $29,130 |
| Average | 1,096 (100.0%) | $55,000 |
Occupancy by Householder Income Bracket in Covington
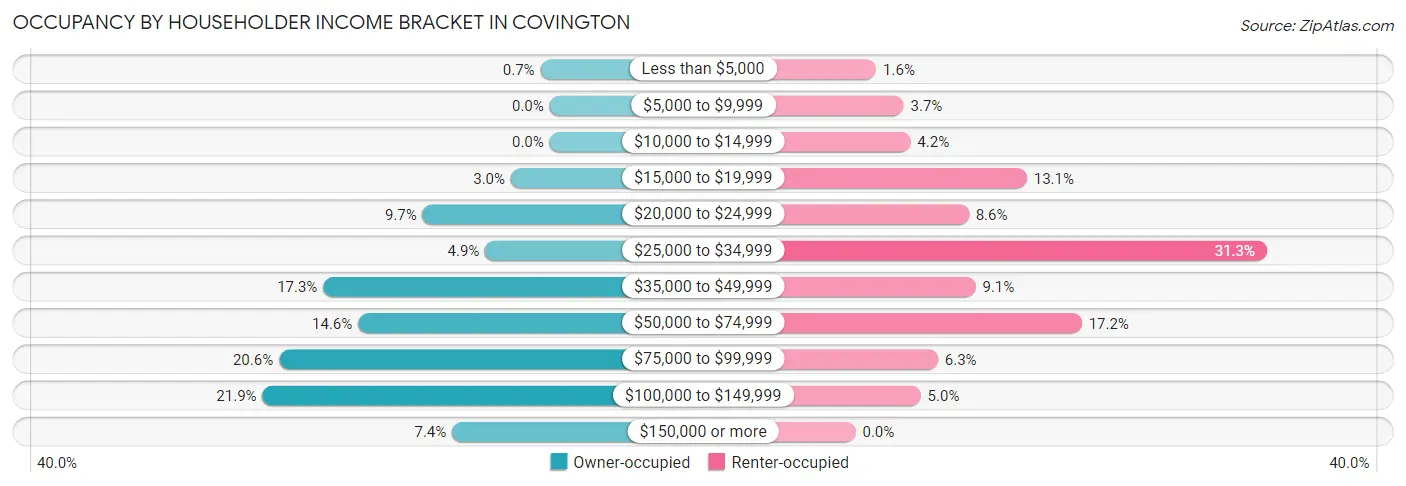
| Income Bracket | Owner-occupied | Renter-occupied |
| Less than $5,000 | 5 (0.7%) | 6 (1.6%) |
| $5,000 to $9,999 | 0 (0.0%) | 14 (3.7%) |
| $10,000 to $14,999 | 0 (0.0%) | 16 (4.2%) |
| $15,000 to $19,999 | 21 (2.9%) | 50 (13.1%) |
| $20,000 to $24,999 | 69 (9.7%) | 33 (8.6%) |
| $25,000 to $34,999 | 35 (4.9%) | 120 (31.3%) |
| $35,000 to $49,999 | 123 (17.2%) | 35 (9.1%) |
| $50,000 to $74,999 | 104 (14.6%) | 66 (17.2%) |
| $75,000 to $99,999 | 147 (20.6%) | 24 (6.3%) |
| $100,000 to $149,999 | 156 (21.9%) | 19 (5.0%) |
| $150,000 or more | 53 (7.4%) | 0 (0.0%) |
| Total | 713 (100.0%) | 383 (100.0%) |
Monthly Housing Cost Tiers in Covington
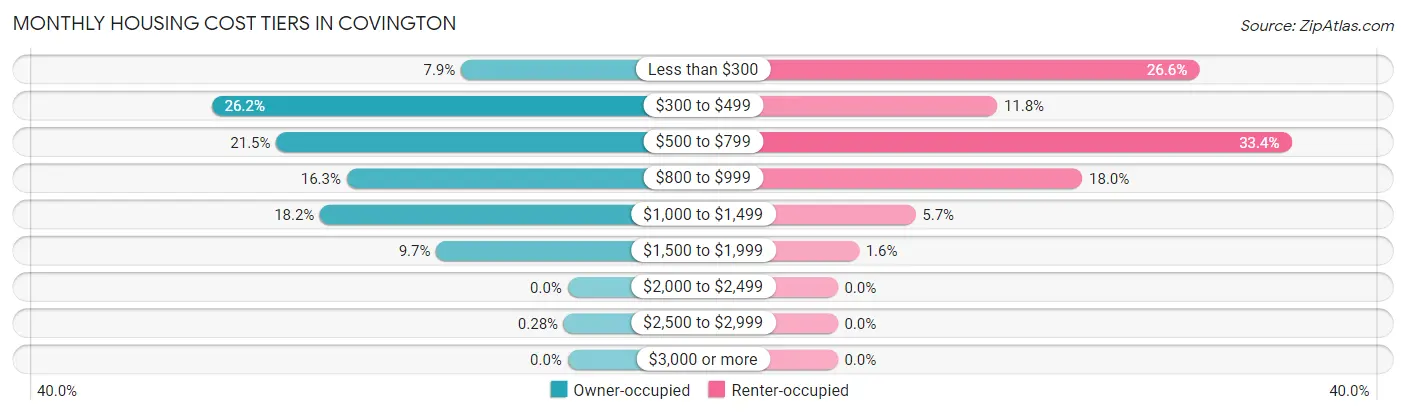
| Monthly Cost | Owner-occupied | Renter-occupied |
| Less than $300 | 56 (7.9%) | 102 (26.6%) |
| $300 to $499 | 187 (26.2%) | 45 (11.7%) |
| $500 to $799 | 153 (21.5%) | 128 (33.4%) |
| $800 to $999 | 116 (16.3%) | 69 (18.0%) |
| $1,000 to $1,499 | 130 (18.2%) | 22 (5.7%) |
| $1,500 to $1,999 | 69 (9.7%) | 6 (1.6%) |
| $2,000 to $2,499 | 0 (0.0%) | 0 (0.0%) |
| $2,500 to $2,999 | 2 (0.3%) | 0 (0.0%) |
| $3,000 or more | 0 (0.0%) | 0 (0.0%) |
| Total | 713 (100.0%) | 383 (100.0%) |
Physical Housing Characteristics in Covington
Housing Structures in Covington
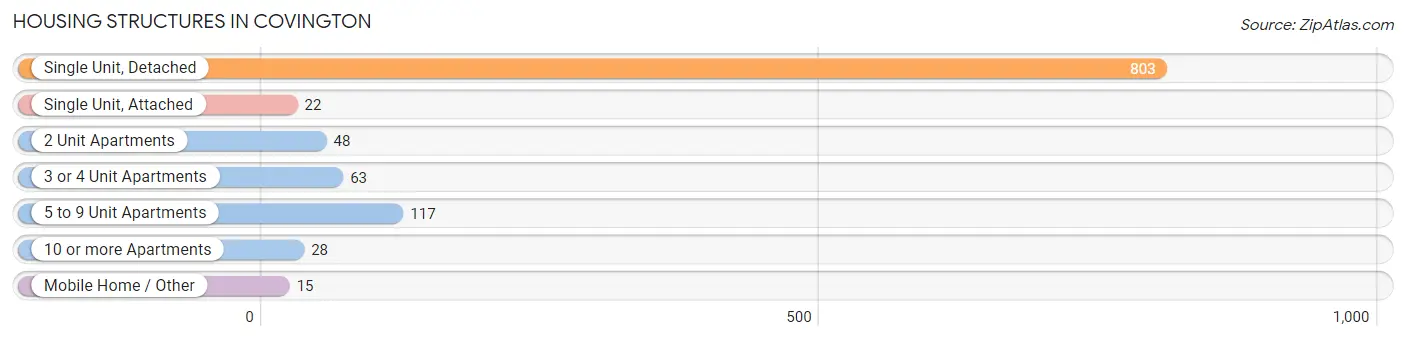
| Structure Type | # Housing Units | % Housing Units |
| Single Unit, Detached | 803 | 73.3% |
| Single Unit, Attached | 22 | 2.0% |
| 2 Unit Apartments | 48 | 4.4% |
| 3 or 4 Unit Apartments | 63 | 5.8% |
| 5 to 9 Unit Apartments | 117 | 10.7% |
| 10 or more Apartments | 28 | 2.5% |
| Mobile Home / Other | 15 | 1.4% |
| Total | 1,096 | 100.0% |
Housing Structures by Occupancy in Covington
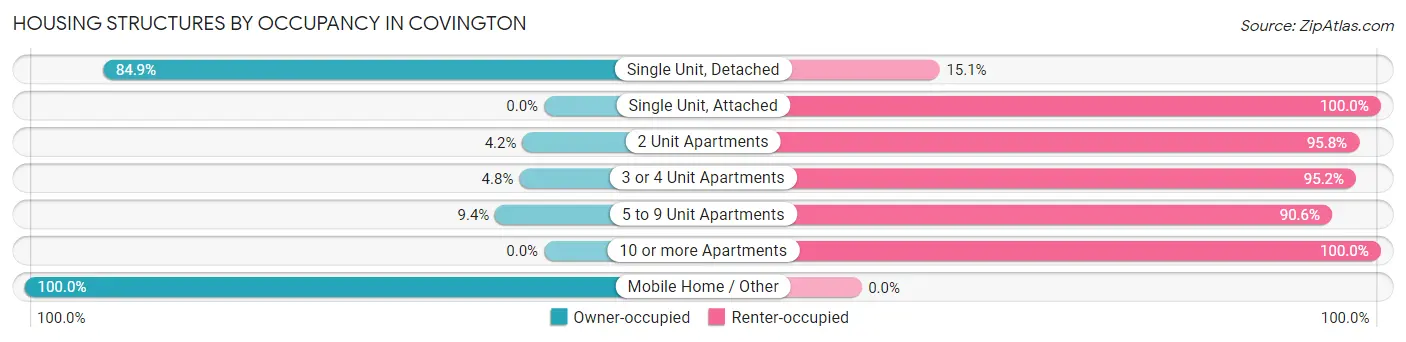
| Structure Type | Owner-occupied | Renter-occupied |
| Single Unit, Detached | 682 (84.9%) | 121 (15.1%) |
| Single Unit, Attached | 0 (0.0%) | 22 (100.0%) |
| 2 Unit Apartments | 2 (4.2%) | 46 (95.8%) |
| 3 or 4 Unit Apartments | 3 (4.8%) | 60 (95.2%) |
| 5 to 9 Unit Apartments | 11 (9.4%) | 106 (90.6%) |
| 10 or more Apartments | 0 (0.0%) | 28 (100.0%) |
| Mobile Home / Other | 15 (100.0%) | 0 (0.0%) |
| Total | 713 (65.0%) | 383 (34.9%) |
Housing Structures by Number of Rooms in Covington
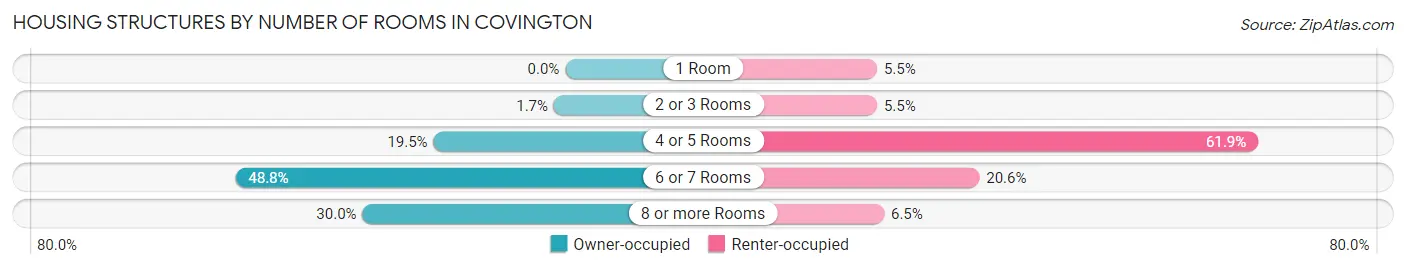
| Number of Rooms | Owner-occupied | Renter-occupied |
| 1 Room | 0 (0.0%) | 21 (5.5%) |
| 2 or 3 Rooms | 12 (1.7%) | 21 (5.5%) |
| 4 or 5 Rooms | 139 (19.5%) | 237 (61.9%) |
| 6 or 7 Rooms | 348 (48.8%) | 79 (20.6%) |
| 8 or more Rooms | 214 (30.0%) | 25 (6.5%) |
| Total | 713 (100.0%) | 383 (100.0%) |
Housing Structure by Heating Type in Covington
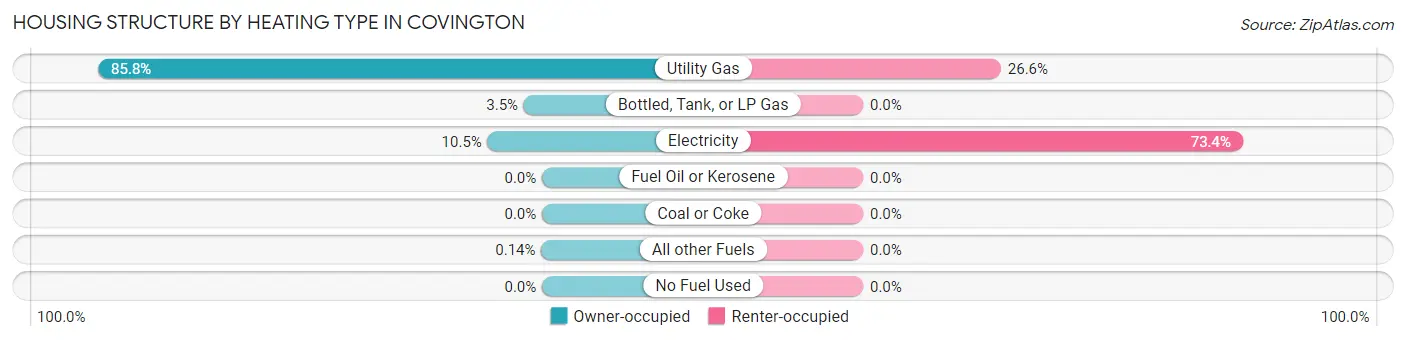
| Heating Type | Owner-occupied | Renter-occupied |
| Utility Gas | 612 (85.8%) | 102 (26.6%) |
| Bottled, Tank, or LP Gas | 25 (3.5%) | 0 (0.0%) |
| Electricity | 75 (10.5%) | 281 (73.4%) |
| Fuel Oil or Kerosene | 0 (0.0%) | 0 (0.0%) |
| Coal or Coke | 0 (0.0%) | 0 (0.0%) |
| All other Fuels | 1 (0.1%) | 0 (0.0%) |
| No Fuel Used | 0 (0.0%) | 0 (0.0%) |
| Total | 713 (100.0%) | 383 (100.0%) |
Household Vehicle Usage in Covington
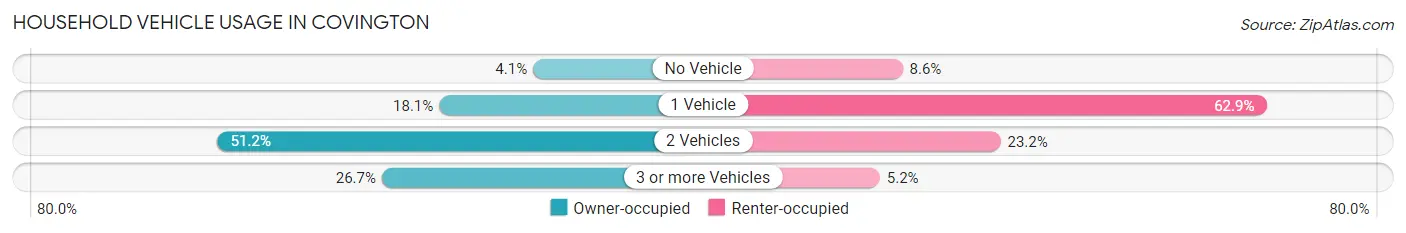
| Vehicles per Household | Owner-occupied | Renter-occupied |
| No Vehicle | 29 (4.1%) | 33 (8.6%) |
| 1 Vehicle | 129 (18.1%) | 241 (62.9%) |
| 2 Vehicles | 365 (51.2%) | 89 (23.2%) |
| 3 or more Vehicles | 190 (26.7%) | 20 (5.2%) |
| Total | 713 (100.0%) | 383 (100.0%) |
Real Estate & Mortgages in Covington
Real Estate and Mortgage Overview in Covington
| Characteristic | Without Mortgage | With Mortgage |
| Housing Units | 346 | 367 |
| Median Property Value | $148,200 | $141,000 |
| Median Household Income | $48,269 | $42 |
| Monthly Housing Costs | $437 | $0 |
| Real Estate Taxes | $1,349 | $0 |
Property Value by Mortgage Status in Covington
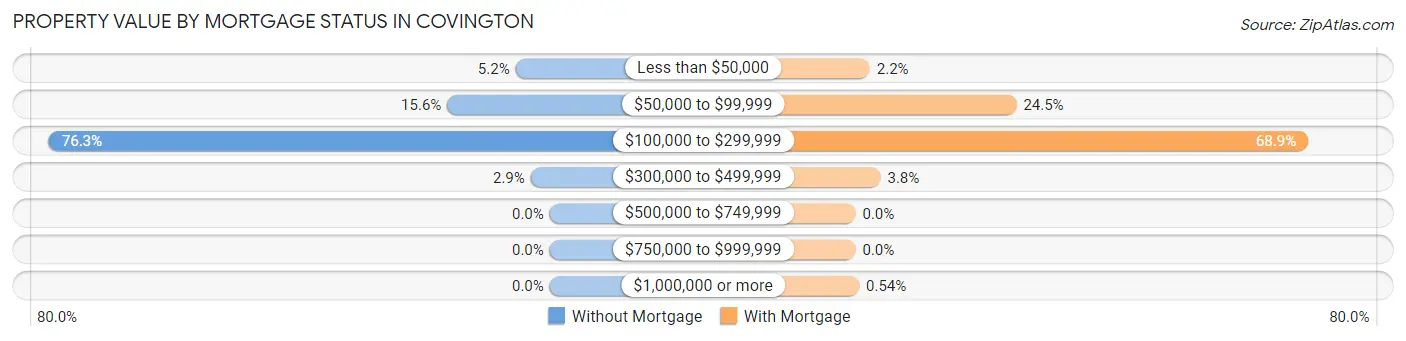
| Property Value | Without Mortgage | With Mortgage |
| Less than $50,000 | 18 (5.2%) | 8 (2.2%) |
| $50,000 to $99,999 | 54 (15.6%) | 90 (24.5%) |
| $100,000 to $299,999 | 264 (76.3%) | 253 (68.9%) |
| $300,000 to $499,999 | 10 (2.9%) | 14 (3.8%) |
| $500,000 to $749,999 | 0 (0.0%) | 0 (0.0%) |
| $750,000 to $999,999 | 0 (0.0%) | 0 (0.0%) |
| $1,000,000 or more | 0 (0.0%) | 2 (0.5%) |
| Total | 346 (100.0%) | 367 (100.0%) |
Household Income by Mortgage Status in Covington
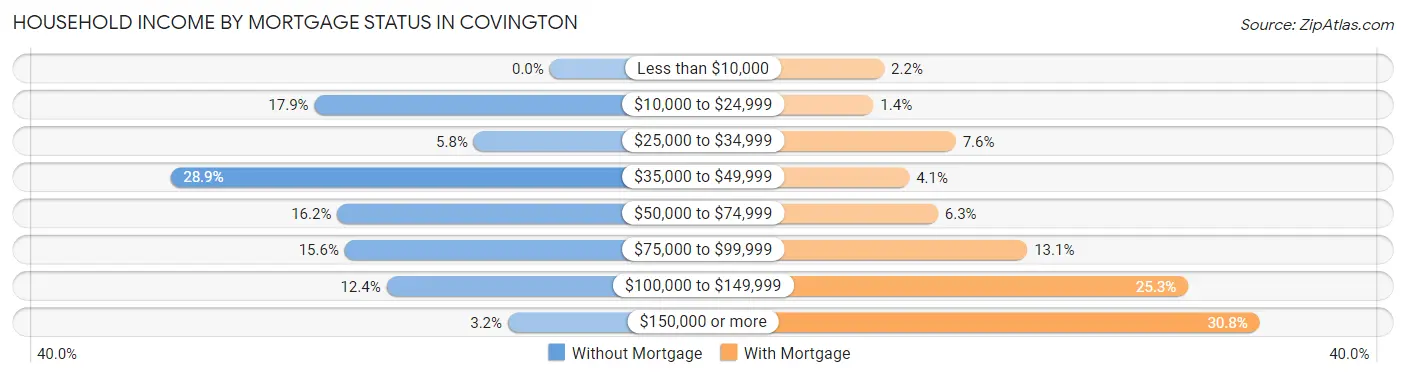
| Household Income | Without Mortgage | With Mortgage |
| Less than $10,000 | 0 (0.0%) | 8 (2.2%) |
| $10,000 to $24,999 | 62 (17.9%) | 5 (1.4%) |
| $25,000 to $34,999 | 20 (5.8%) | 28 (7.6%) |
| $35,000 to $49,999 | 100 (28.9%) | 15 (4.1%) |
| $50,000 to $74,999 | 56 (16.2%) | 23 (6.3%) |
| $75,000 to $99,999 | 54 (15.6%) | 48 (13.1%) |
| $100,000 to $149,999 | 43 (12.4%) | 93 (25.3%) |
| $150,000 or more | 11 (3.2%) | 113 (30.8%) |
| Total | 346 (100.0%) | 367 (100.0%) |
Property Value to Household Income Ratio in Covington
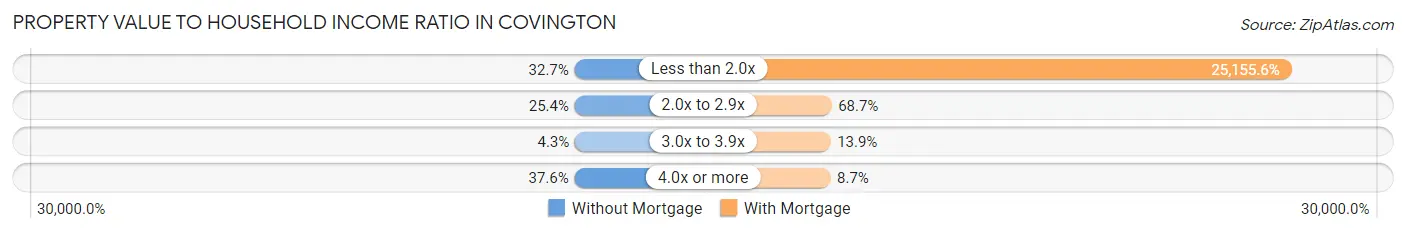
| Value-to-Income Ratio | Without Mortgage | With Mortgage |
| Less than 2.0x | 113 (32.7%) | 92,321 (25,155.6%) |
| 2.0x to 2.9x | 88 (25.4%) | 252 (68.7%) |
| 3.0x to 3.9x | 15 (4.3%) | 51 (13.9%) |
| 4.0x or more | 130 (37.6%) | 32 (8.7%) |
| Total | 346 (100.0%) | 367 (100.0%) |
Real Estate Taxes by Mortgage Status in Covington
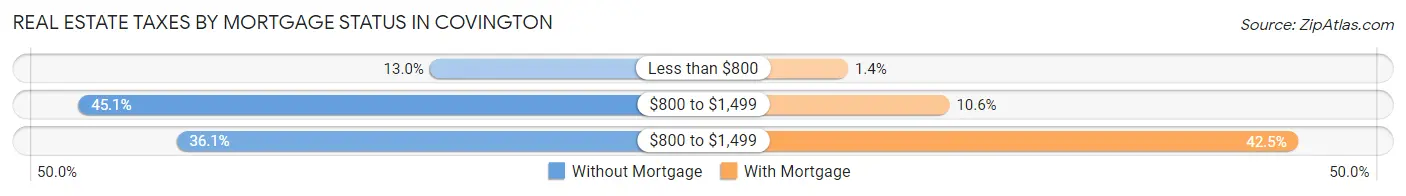
| Property Taxes | Without Mortgage | With Mortgage |
| Less than $800 | 45 (13.0%) | 5 (1.4%) |
| $800 to $1,499 | 156 (45.1%) | 39 (10.6%) |
| $800 to $1,499 | 125 (36.1%) | 156 (42.5%) |
| Total | 346 (100.0%) | 367 (100.0%) |
Health & Disability in Covington
Health Insurance Coverage by Age in Covington
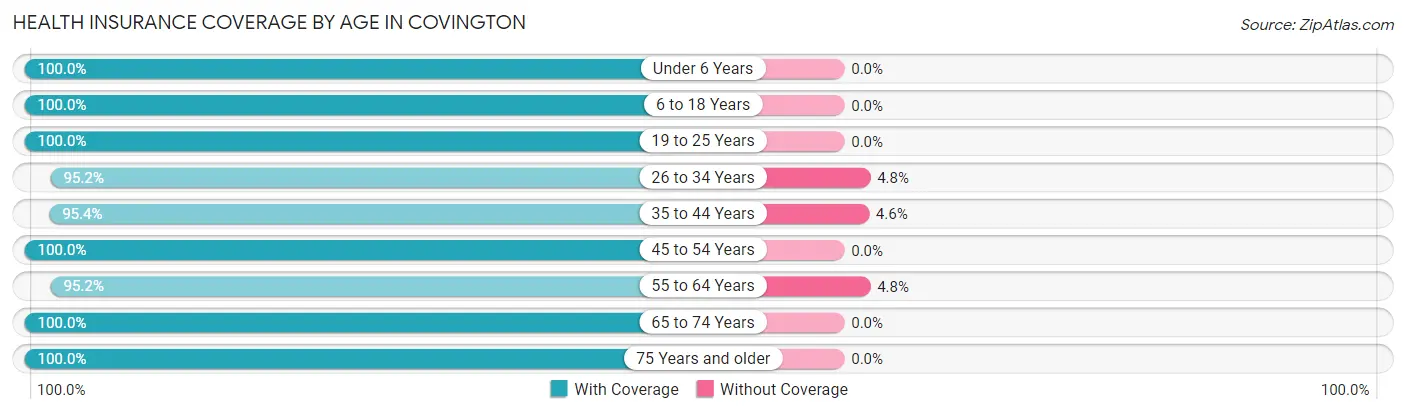
| Age Bracket | With Coverage | Without Coverage |
| Under 6 Years | 252 (100.0%) | 0 (0.0%) |
| 6 to 18 Years | 365 (100.0%) | 0 (0.0%) |
| 19 to 25 Years | 124 (100.0%) | 0 (0.0%) |
| 26 to 34 Years | 355 (95.2%) | 18 (4.8%) |
| 35 to 44 Years | 270 (95.4%) | 13 (4.6%) |
| 45 to 54 Years | 438 (100.0%) | 0 (0.0%) |
| 55 to 64 Years | 197 (95.2%) | 10 (4.8%) |
| 65 to 74 Years | 242 (100.0%) | 0 (0.0%) |
| 75 Years and older | 204 (100.0%) | 0 (0.0%) |
| Total | 2,447 (98.4%) | 41 (1.7%) |
Health Insurance Coverage by Citizenship Status in Covington
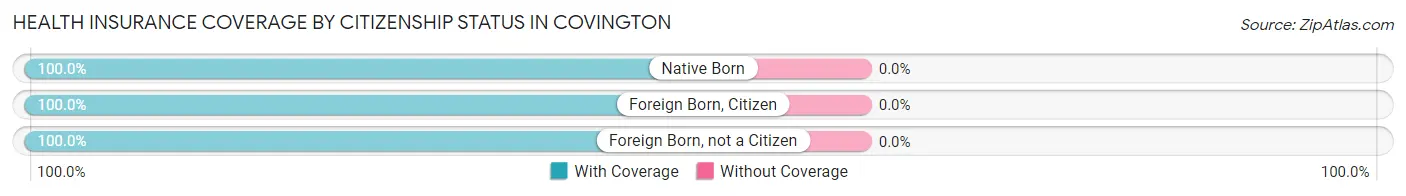
| Citizenship Status | With Coverage | Without Coverage |
| Native Born | 252 (100.0%) | 0 (0.0%) |
| Foreign Born, Citizen | 365 (100.0%) | 0 (0.0%) |
| Foreign Born, not a Citizen | 124 (100.0%) | 0 (0.0%) |
Health Insurance Coverage by Household Income in Covington
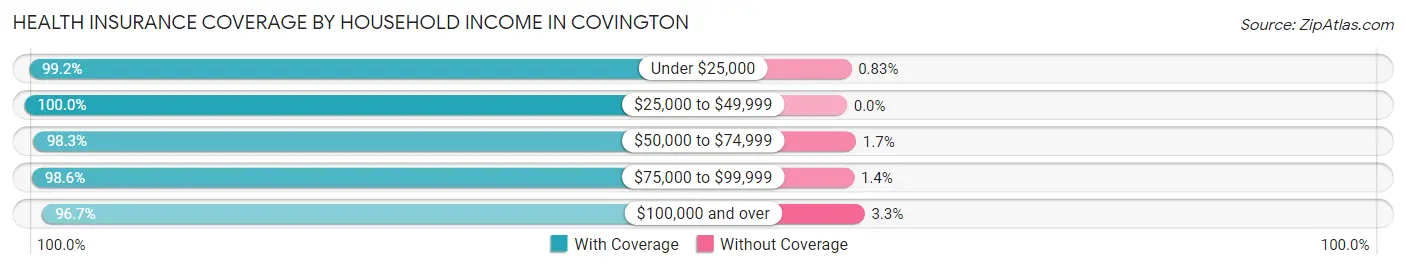
| Household Income | With Coverage | Without Coverage |
| Under $25,000 | 360 (99.2%) | 3 (0.8%) |
| $25,000 to $49,999 | 519 (100.0%) | 0 (0.0%) |
| $50,000 to $74,999 | 402 (98.3%) | 7 (1.7%) |
| $75,000 to $99,999 | 436 (98.6%) | 6 (1.4%) |
| $100,000 and over | 730 (96.7%) | 25 (3.3%) |
Public vs Private Health Insurance Coverage by Age in Covington
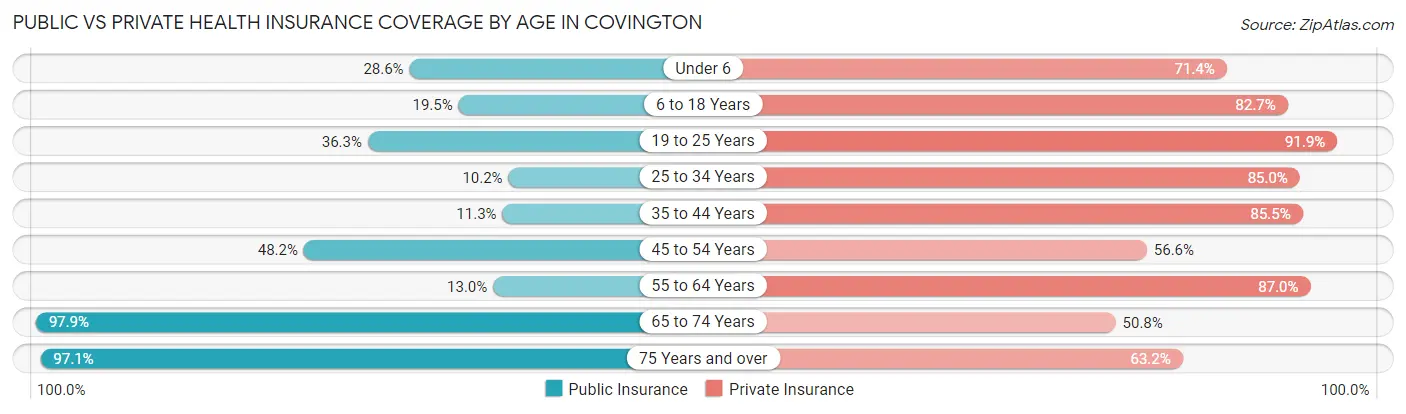
| Age Bracket | Public Insurance | Private Insurance |
| Under 6 | 72 (28.6%) | 180 (71.4%) |
| 6 to 18 Years | 71 (19.5%) | 302 (82.7%) |
| 19 to 25 Years | 45 (36.3%) | 114 (91.9%) |
| 25 to 34 Years | 38 (10.2%) | 317 (85.0%) |
| 35 to 44 Years | 32 (11.3%) | 242 (85.5%) |
| 45 to 54 Years | 211 (48.2%) | 248 (56.6%) |
| 55 to 64 Years | 27 (13.0%) | 180 (87.0%) |
| 65 to 74 Years | 237 (97.9%) | 123 (50.8%) |
| 75 Years and over | 198 (97.1%) | 129 (63.2%) |
| Total | 931 (37.4%) | 1,835 (73.8%) |
Disability Status by Sex by Age in Covington
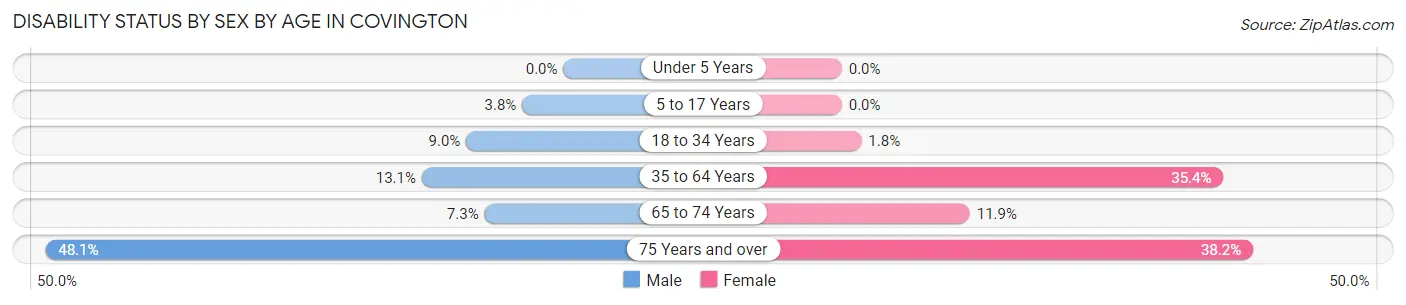
| Age Bracket | Male | Female |
| Under 5 Years | 0 (0.0%) | 0 (0.0%) |
| 5 to 17 Years | 10 (3.8%) | 0 (0.0%) |
| 18 to 34 Years | 22 (9.0%) | 5 (1.8%) |
| 35 to 64 Years | 54 (13.1%) | 183 (35.4%) |
| 65 to 74 Years | 6 (7.3%) | 19 (11.9%) |
| 75 Years and over | 25 (48.1%) | 58 (38.2%) |
Disability Class by Sex by Age in Covington
Disability Class: Hearing Difficulty
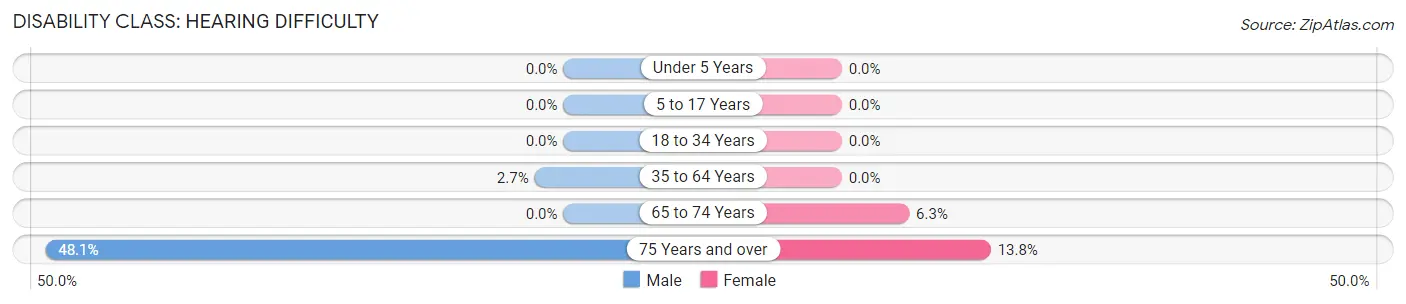
| Age Bracket | Male | Female |
| Under 5 Years | 0 (0.0%) | 0 (0.0%) |
| 5 to 17 Years | 0 (0.0%) | 0 (0.0%) |
| 18 to 34 Years | 0 (0.0%) | 0 (0.0%) |
| 35 to 64 Years | 11 (2.7%) | 0 (0.0%) |
| 65 to 74 Years | 0 (0.0%) | 10 (6.2%) |
| 75 Years and over | 25 (48.1%) | 21 (13.8%) |
Disability Class: Vision Difficulty
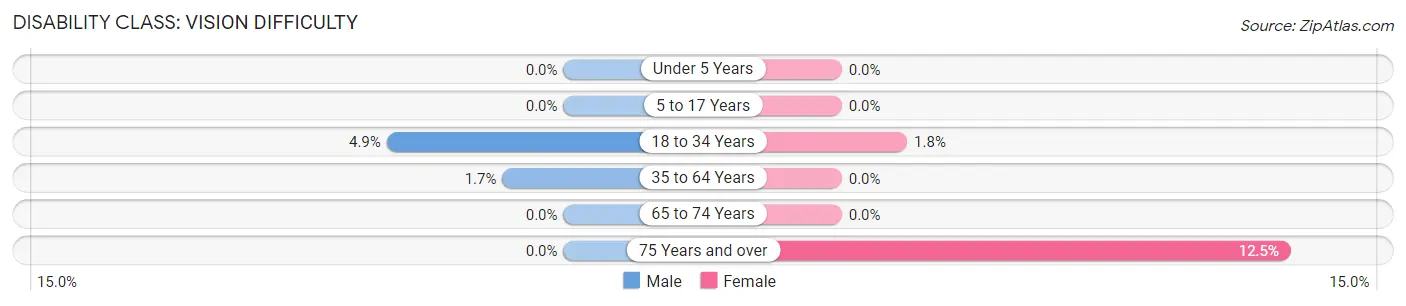
| Age Bracket | Male | Female |
| Under 5 Years | 0 (0.0%) | 0 (0.0%) |
| 5 to 17 Years | 0 (0.0%) | 0 (0.0%) |
| 18 to 34 Years | 12 (4.9%) | 5 (1.8%) |
| 35 to 64 Years | 7 (1.7%) | 0 (0.0%) |
| 65 to 74 Years | 0 (0.0%) | 0 (0.0%) |
| 75 Years and over | 0 (0.0%) | 19 (12.5%) |
Disability Class: Cognitive Difficulty
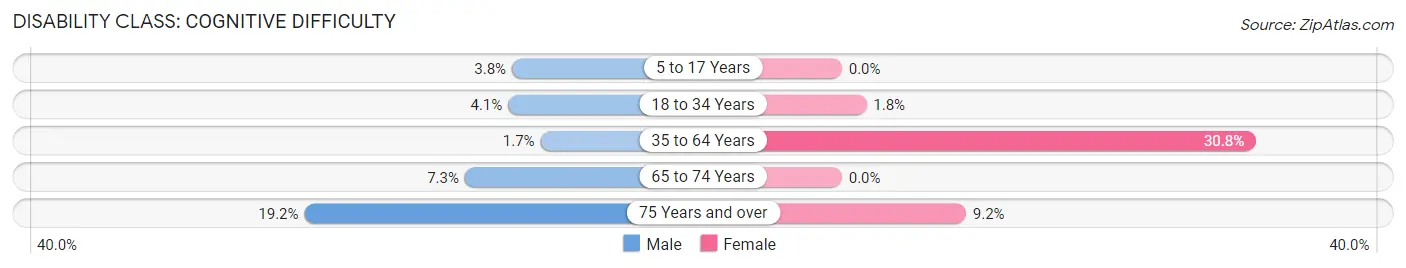
| Age Bracket | Male | Female |
| 5 to 17 Years | 10 (3.8%) | 0 (0.0%) |
| 18 to 34 Years | 10 (4.1%) | 5 (1.8%) |
| 35 to 64 Years | 7 (1.7%) | 159 (30.7%) |
| 65 to 74 Years | 6 (7.3%) | 0 (0.0%) |
| 75 Years and over | 10 (19.2%) | 14 (9.2%) |
Disability Class: Ambulatory Difficulty
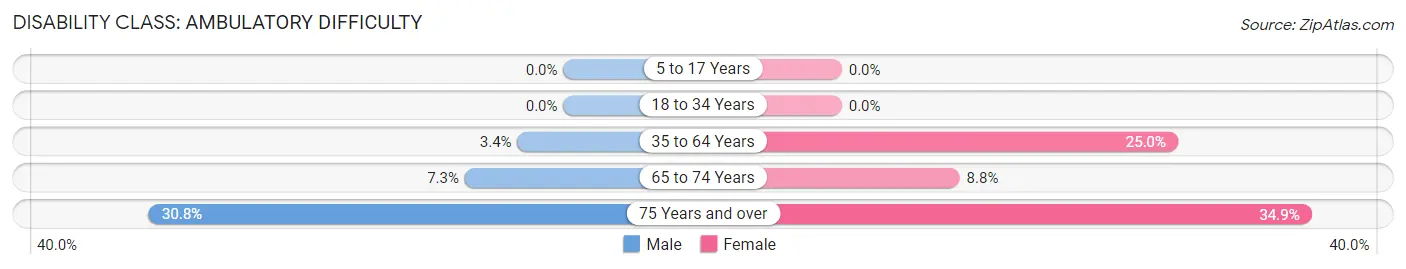
| Age Bracket | Male | Female |
| 5 to 17 Years | 0 (0.0%) | 0 (0.0%) |
| 18 to 34 Years | 0 (0.0%) | 0 (0.0%) |
| 35 to 64 Years | 14 (3.4%) | 129 (24.9%) |
| 65 to 74 Years | 6 (7.3%) | 14 (8.7%) |
| 75 Years and over | 16 (30.8%) | 53 (34.9%) |
Disability Class: Self-Care Difficulty
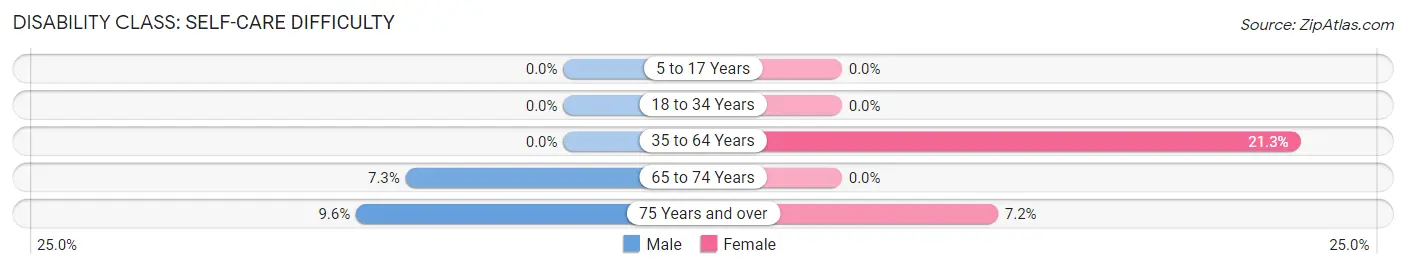
| Age Bracket | Male | Female |
| 5 to 17 Years | 0 (0.0%) | 0 (0.0%) |
| 18 to 34 Years | 0 (0.0%) | 0 (0.0%) |
| 35 to 64 Years | 0 (0.0%) | 110 (21.3%) |
| 65 to 74 Years | 6 (7.3%) | 0 (0.0%) |
| 75 Years and over | 5 (9.6%) | 11 (7.2%) |
Technology Access in Covington
Computing Device Access in Covington
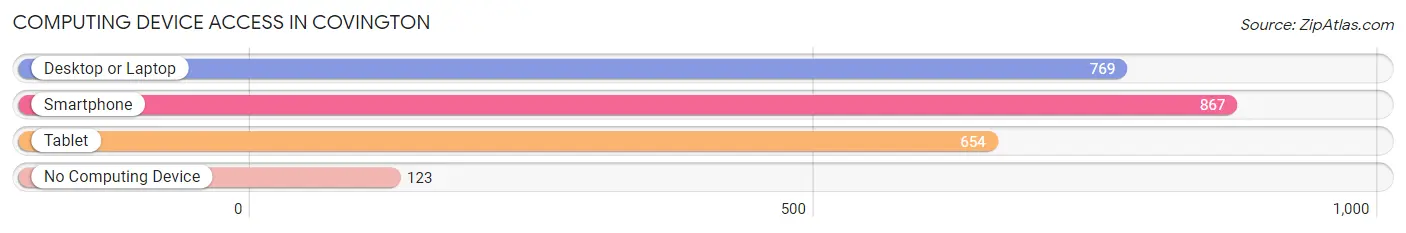
| Device Type | # Households | % Households |
| Desktop or Laptop | 769 | 70.2% |
| Smartphone | 867 | 79.1% |
| Tablet | 654 | 59.7% |
| No Computing Device | 123 | 11.2% |
| Total | 1,096 | 100.0% |
Internet Access in Covington
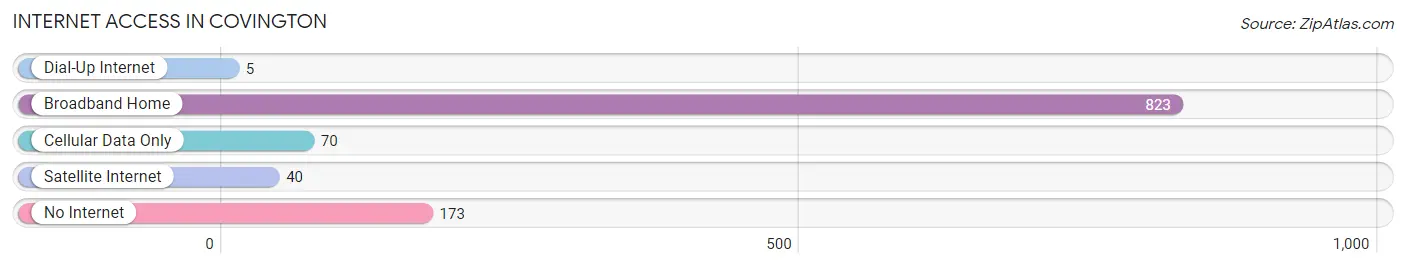
| Internet Type | # Households | % Households |
| Dial-Up Internet | 5 | 0.5% |
| Broadband Home | 823 | 75.1% |
| Cellular Data Only | 70 | 6.4% |
| Satellite Internet | 40 | 3.6% |
| No Internet | 173 | 15.8% |
| Total | 1,096 | 100.0% |
Covington Summary
Covington is a village located in Miami County, Ohio, United States. The population was 2,717 at the 2010 census. It is part of the Dayton Metropolitan Statistical Area.
History
Covington was founded in 1817 by John Covington, a Revolutionary War veteran. The village was originally known as Covington Station, as it was a stop on the Miami and Erie Canal. The canal was a major transportation route in the 19th century, and Covington was a major port for the shipment of goods. The village was incorporated in 1837.
In the late 19th century, Covington was a major center for the production of agricultural products, including wheat, corn, and hay. The village was also home to several manufacturing businesses, including a flour mill, a sawmill, and a brickyard.
Geography
Covington is located at 39°59'45"N 84°20'45"W (39.995833, -84.345833). According to the United States Census Bureau, the village has a total area of 1.2 square miles (3.1 km2), all land.
Demographics
As of the census of 2000, there were 2,845 people, 1,093 households, and 790 families residing in the village. The population density was 2,364.2 people per square mile (912.3/km2). There were 1,164 housing units at an average density of 962.2 per square mile (371.2/km2). The racial makeup of the village was 97.90% White, 0.53% African American, 0.21% Native American, 0.35% Asian, 0.07% Pacific Islander, 0.14% from other races, and 0.81% from two or more races. Hispanic or Latino of any race were 0.53% of the population.
Economy
Covington is a small village with a population of just over 2,700 people. The village is home to several small businesses, including a grocery store, a hardware store, a pharmacy, and a few restaurants. The village is also home to several manufacturing businesses, including a plastics manufacturer and a metal fabrication company.
The village is also home to several agricultural businesses, including a dairy farm, a grain elevator, and a hay and straw business. The village is also home to several small farms, which produce a variety of crops, including corn, soybeans, and wheat.
The village is served by the Miami County Airport, which is located just outside of town. The airport is used for general aviation and is home to several small businesses, including a flight school and a charter service.
Conclusion
Covington is a small village located in Miami County, Ohio. The village was founded in 1817 and was originally known as Covington Station. The village is home to several small businesses, manufacturing businesses, and agricultural businesses. The village is served by the Miami County Airport, which is used for general aviation. The population of Covington was 2,717 at the 2010 census.
Common Questions
What is Per Capita Income in Covington?
Per Capita income in Covington is $29,953.
What is the Median Family Income in Covington?
Median Family Income in Covington is $74,722.
What is the Median Household income in Covington?
Median Household Income in Covington is $55,000.
What is Income or Wage Gap in Covington?
Income or Wage Gap in Covington is 56.4%.
Women in Covington earn 43.6 cents for every dollar earned by a man.
What is Inequality or Gini Index in Covington?
Inequality or Gini Index in Covington is 0.39.
What is the Total Population of Covington?
Total Population of Covington is 2,561.
What is the Total Male Population of Covington?
Total Male Population of Covington is 1,151.
What is the Total Female Population of Covington?
Total Female Population of Covington is 1,410.
What is the Ratio of Males per 100 Females in Covington?
There are 81.63 Males per 100 Females in Covington.
What is the Ratio of Females per 100 Males in Covington?
There are 122.50 Females per 100 Males in Covington.
What is the Median Population Age in Covington?
Median Population Age in Covington is 40.0 Years.
What is the Average Family Size in Covington
Average Family Size in Covington is 3.1 People.
What is the Average Household Size in Covington
Average Household Size in Covington is 2.3 People.
How Large is the Labor Force in Covington?
There are 1,186 People in the Labor Forcein in Covington.
What is the Percentage of People in the Labor Force in Covington?
58.9% of People are in the Labor Force in Covington.
What is the Unemployment Rate in Covington?
Unemployment Rate in Covington is 3.3%.